The graph and the table do not reflect the deduction of taxes that a shareholder would pay on Fund distributions or the redemption of Fund shares. Investment performance reflects the waiver of certain fees. Without the waiver of fees, the Fund’s total return would have been lower.
The Lehman Brothers Municipal 1 Year Bond Index is the 1-year (1-2) component of the Municipal Bond Index. The Lehman Brothers Municipal Bond Index is a rules-based, market-value weighted index engineered for the long-term, tax-exempt bond market. Lipper Short Municipal Debt Funds Index is an unmanaged index that tracks funds that invest in municipal debt issues with dollar-weighted average maturities of less than three years. The Lehman Brothers Municipal 1 Year Bond Index and the Lipper Short Municipal Debt Funds Average are unmanaged and do not reflect the deduction of fees associated with a mutual fund, such as investment advisor fees. The performance for the Tax Optimized Income Fund reflects the deduction of fees for these value-added services. Investors cannot directly invest in an index.
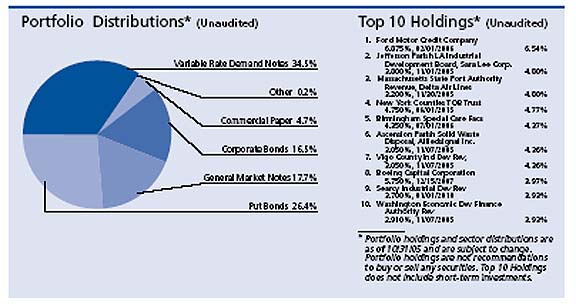
Alpine Municipal Money Market Fund / Alpine Tax Optimized Income Fund — Commentary
We are pleased to provide you with the commentary for the Alpine Income Trust for the period ending October 31, 2005. The Income Trust includes both the Alpine Municipal Money Market Fund and the Alpine Tax Optimized Income Fund.
Performance Summary
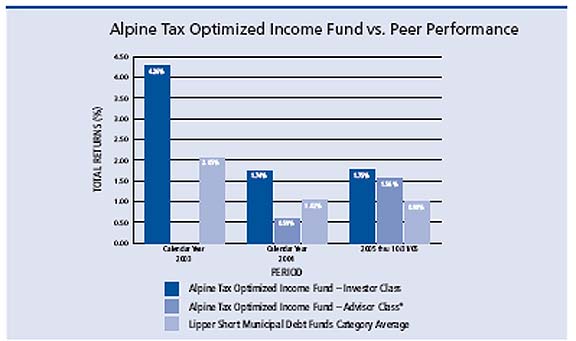
For the one-year period, each Fund continued to produce relative performance leadership when compared against its counterparts in their respective categories. Based on total returns, The Alpine Municipal Money Market Fund was ranked number one out of 118 Tax Exempt Money Market Funds according to Lipper Analytical. It had a total return for the period of 2.24%. Lipper ranked the Alpine Tax Optimized Income Fund number eight out of 63 funds in the Short Municipal Debt category and had a total return for the period of 1.84%. The Lipper Analytical peer average of the period was 1.49% and 1.06% for the Tax Exempt Money Market Fund and Short Municipal Debt peer groups, respectively.
Market Overview
Economic growth remained relatively strong during the course of your fund’s fiscal year. Consequently, the Federal Reserve Board continued increasing the federal funds rate in an effort to restrain inflation. In September, the Fed implemented its 11th increase in the federal funds rate since June 2004. In a typical cycle, the Fed tightens monetary conditions in an attempt to reduce rising inflationary pressure generated by an overheating economy, a condition that may cause long-term rates to rise. But these increases in short-term rates, according to the Fed have not been intended to forestall a major inflationary threat or cool economic overheating. Instead the Fed is gradually removing the extra stimulus it applied to support a recessionary, post-bubble economy. The Fed’s gradual approach to reining in economic growth may have helped allay investor fears of higher longer-term rates, as long-term bond yields at the end of our reporting period were lower then where they were at the start of the calendar year despite rising short-term rates. As shorter and longer-term interest rates began to converge, the yield curve flattened significantly.
Soon after our reporting period ended, the Fed raised the federal funds rate in early November for a 12th time to 4.00%. The continued rate increases indicate the Fed’s belief that the economy is strong enough to withstand the long-term effects and higher energy costs associated with Hurricane Katrina. Unless a disruptive event jars the U.S economy, we do not anticipate the Fed will stop lifting interest rates for the foreseeable future. We do, however, expect the impact of the Fed’s tightenings to become more pronounced in the first half of 2006.
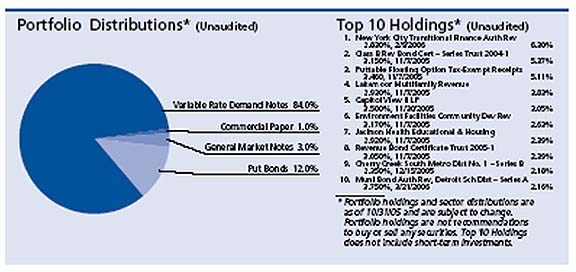
Alpine Tax Optimized Income Fund
Municipal issuance throughout the past six months been remained on pace to equal last year’s record. Despite the large issuance and lackluster demand by mutual funds, the ratio of AAA municipal versus US Treasury yields for the most part remained range-bound throughout the period. The one exception was in late August as Treasuries rallied and municipals underperformed in the wake of Hurricane Katrina. Credit spreads for areas damaged by the hurricane widened out, with insured bonds trading slightly wider in early September.
We have examined both portfolios in the wake of the hurricane and are pleased to report that we have no holdings with any direct exposure to issuers in the area. Though the Funds hold a very small portion of securities in the region, all of them are credit enhanced with a direct pay letter of credit from a major financial institution.
Alpine Tax Optimized Income Fund
Given our expectation for rising interest rates, your portfolio’s maturity was short at the start of the fiscal year and we continued to shorten it as the year progressed. We continued to move out of a laddered strategy by selling securities in the two to four year range that were most sensitive to the rise in short-term interest rates and developed more of a barbelled approach. It most be noted, that although we did make some select purchases on the long end of the curve, we remain committed to capital preservation and therefore will be very sensitive to maintaining a conservative posture in this interest rate environment.
While we continue to explore all areas of the fixed income market for attractive after-tax returns, we find ourselves with limited choices because of the attractive ratio of municipal securities relative to their taxable counterparts. One area of the corporate market that we chose to invest in again was short-term bonds issued by Ford Motor Credit. With the auto industry going through a very volatile period now, very attractive yields can be attained with minimum price fluctuation on this debt. Although we have explored other depressed areas of the corporate bond market, we have been hesitant to make investments as high demand from investors looking for greater returns has resulted in the narrowing of spreads for these securities.
The one area on the long end of the curve that we have invested in is tobacco settlement bonds. There has been strong interest from buyers in search of higher yields and we have chosen to pursue only maturities with short turbo call features. This type of call feature allows the issuer to redeem the bonds at an earlier date should surplus collections or partial lump sum payments occur. We are hoping that with continued favorable legal rulings, demand for these securities will increase and yields will fall.
The remainder of our investments have been in municipal securities with one year or less to maturity. With the two to ten year part of the yield curve so flat now, we have chosen step back for a moment until we see a reason to justify extending out on the curve. In addition, with short-term rates backing up so much the past year, attractive yields are now available justify staying short for the meantime.
Going forward, we will continue to search for the most attractive opportunities among fixed-income securities and work to balance the pursuit of current income with prudent risk management.
Alpine Municipal Money Market Fund
The Fed’s hikes impacted money market funds the most, pushing yields up as older, lower-yielding securities matured and new, higher-yielding securities took their place. In addition, municipal money market securities saw some seasonal volatility due to various supply and demand factors that affected municipal securities much more than taxable securities. For example, in early May, tax-time redemptions caused yields to reach levels of taxable securities while in July and August, yields fell as cash flooded into funds due to maturing securities and coupon payments. Yields then backed up again throughout September as investments in the short-term municipal market declined as corporations made quarterly tax payments and parents sold holdings to pay for college tuition.
We continued to pursue the fund’s objective, seeking preservation of principal and high current income that is exempt from federal income tax. Over the reporting period, we maintained a very defensive position by keeping the average maturity of the fund very short. On October 31, 2005, the fund’s average weighted maturity was 25 days which was shorter than the industry average of 30 days. We focused primarily on investing in variable rate demand notes in an attempt to maintain liquidity and keep funds available for higher yielding instruments as they became available. VRDNs, which comprised over 80% of our portfolio, have long-term maturities, but their coupons reset daily and weekly making them highly responsive to changes interest rates. Our other investments include short-term put bonds and a very small amount of commercial paper.
Alpine Tax Optimized Income Fund
With our expectations of continued moderate economic growth and gradual Fed tightenings, our investment decisions will continue to focus on keeping the portfolio responsive to rising interest rates. While we plan to maintain a defensive position for the fund, we will continue to search for fixed-rate opportunities in the market whose pricing incorporates our view of higher rates.
Thank you for your investment in the Alpine Mutual Funds.
Steven C. Shachat
Portfolio Manager
An investment in these Funds are neither insured nor guaranteed by the Federal Deposit Insurance Corporation or any other government agency. Although the Funds seek to preserve the value of your investment at $1.00 per share, it is possible to lose money by investing in the Funds.
Investing in these funds involves special risks, including but not limited to, investing in municipal obligations and derivative securities, mortgage-related and asset-backed investments. Please refer to the prospectus for further details. Investments in debt securities typically decrease in value when interest rates rise. This risk is usually greater for longer-term debt securities.
Please refer to the Schedule of Investments for fund holding information. Fund holdings and sector allocations are subject to change and should not be considered a recommendation to buy or sell any security.
Lipper Analytical Services, Inc. is an independent mutual fund research and rating service. Each Lipper average represents a universe of Funds with similar invest objectives. Rankings for the periods shown include dividends and distributions reinvested and do not reflect sales charges.
The federal government guarantees interest payments from government securities, such as U.S. Treasury bills, while dividend payments carry no such guarantee. Government securities, if held to maturity, guarantee the timely payment of principal and interest.
Alpine Mutual Funds - Dynamic Balance Fund
Schedule of Portfolio Investments
October 31, 2005
Shares/ | | Security | | |
Par Value | | Description | | Value |
| | | | | |
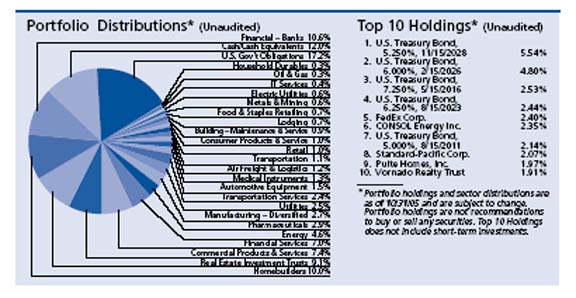
Common Stocks—70.8% | | |
| Commercial Products & Services—9.5% | | |
| 13,000 | | AMETEK, Inc. | $ | 529,490 |
| 35,000 | | Autoliv, Inc. | | 1,503,600 |
| 10,000 | | Certegy, Inc. | | 374,600 |
| 14,290 | | Eagle Materials, Inc.—Class B | | 1,421,712 |
| 5,443 | | Eagle Materials, Inc. | | 579,625 |
| 300 | | Hubbell, Incorporated — Class A | | 13,155 |
| 6,500 | | Hubbell, Incorporated — Class B | | 313,040 |
| 32,500 | | McGrath Rentcorp | | 927,875 |
| 15,500 | | PACCAR, Inc. | | 1,085,310 |
| 30,000 | | Ryder System, Inc. | | 1,190,100 |
| 20,000 | | W.W. Grainger, Inc. | | 1,339,600 |
| | | | | 9,278,107 |
| | | | | |
| Conglomerates—2.5% | | |
| 20,000 | | 3M Co. | | 1,519,600 |
| 25,000 | | Temple-Inland Inc. | | 920,750 |
| | | | | 2,440,350 |
| | | | | |
| Consumer Products & Services—3.2% | | |
| 18,000 | | The Black & Decker Corporation | | 1,478,340 |
| 20,000 | | Briggs & Stratton Corporation | | 639,600 |
| 18,000 | | The Procter & Gamble Company | | 1,007,820 |
| | | | | 3,125,760 |
| | | | | |
| Energy, Oil, & Gas—2.5% | |
| 2,000 | | Amerada Hess Corp. | | 250,200 |
| 15,000 | | Chevron Corporation | | 856,050 |
| 10,000 | | Murphy Oil Corporation | | 468,500 |
| 16,000 | | Penn Virginia Corporation | | 869,760 |
| | | | | 2,444,510 |
| | | | | |
| Financial—Banks—8.9% | | |
| 12,730 | | Arrow Financial Corporation | | 342,437 |
| 18,000 | | Bancorp Rhode Island, Inc. | | 648,000 |
| 6,000 | | Bancshares of Florida, Inc. (a) | | 136,500 |
| 8,000 | | Comerica Incorporated | | 462,240 |
| 45,000 | | Doral Financial Corp. (b) | | 385,200 |
| 20,000 | | Golden West Financial Corporation | | 1,174,600 |
| 10,000 | | Hudson United Bancorp | | 414,700 |
| 40,000 | | J.P. Morgan Chase & Co. | | 1,464,800 |
| 31,500 | | New York Community Bancorp, Inc. | | 509,355 |
| 25,500 | | North Fork Bancorporation, Inc. | | 646,170 |
| 2,200 | | Penns Woods Bancorp, Inc. | | 100,100 |
| 8,000 | | PNC Financial Services Group | | 485,680 |
| 5,500 | | Rurban Financial Corp. | | 70,400 |
| 5,871 | | Southside Bancshares, Inc. | | 114,895 |
| | | | | |
Shares/ | | Security | | |
Par Value | | Description | | Value |
| | | | | |
Common Stocks—continued | | |
| Financial—Banks—continued | | |
| 20,000 | | Sovereign Bancorp, Inc. | $ | 431,400 |
| 15,000 | | Susquehanna Bancshares, Inc. | | 346,350 |
| 20,000 | | Webster Financial Corporation | | 923,400 |
| | | | | 8,656,227 |
| | | | | |
| Financial Services—8.8% | | |
| 10,000 | | Ambac Financial Group, Inc. | | 708,900 |
| 26,000 | | American International Group, Inc. | | 1,684,800 |
| 4,000 | | The Chubb Corporation | | 371,880 |
| 10,000 | | Countrywide Financial Corporation | | 317,700 |
| 10,000 | | Fannie Mae | | 475,200 |
| 10,000 | | Fidelity National Financial, Inc. | | 374,600 |
| 1,750 | | Fidelity National Title Group, Inc. | | 38,063 |
| 13,000 | | The Goldman Sachs Group, Inc. | | 1,642,810 |
| 46,000 | | MBNA Corporation | | 1,176,220 |
| 8,000 | | The Student Loan Corporation | | 1,753,600 |
| | | | | 8,543,773 |
| | | | | |
| | | | | |
| Food & Staples Retailing—0.7% | | |
| 26,000 | | Albertson’s, Inc. | | 652,860 |
| | | | | |
| | | | | |
| Homebuilders — 10.0% | | |
| 30,000 | | Hovnanian Enterprises, Inc. — Class A (a) | | 1,349,700 |
| 28,000 | | Lennar Corporation—Class A | | 1,556,240 |
| 7,150 | | M.D.C. Holdings, Inc. | | 490,490 |
| 50,000 | | Pulte Homes, Inc. | | 1,889,500 |
| 17,000 | | The Ryland Group, Inc. | | 1,144,100 |
| 51,400 | | Standard-Pacific Corp. | | 1,983,012 |
| 35,000 | | Toll Brothers, Inc. (a) | | 1,291,850 |
| | | | | 9,704,892 |
| | | | | |
| Medical Instruments—1.3% | | |
| 12,200 | | Beckman Coulter, Inc. | | 600,972 |
| 10,000 | | Guidant Corporation | | 630,000 |
| | | | | 1,230,972 |
| | | | | |
| Metals & Mining—2.9% | | |
| 37,000 | | CONSOL Energy Inc. | | 2,253,300 |
| 5,000 | | Phelps Dodge Corp. | | 602,350 |
| | | | | 2,855,650 |
| | | | | |
| Pharmaceuticals—2.9% | | |
| 22,000 | | Johnson & Johnson | | 1,377,640 |
| 25,000 | | Pfizer Inc. | | 543,500 |
| 20,000 | | Wyeth | | 891,200 |
| | | | | 2,812,340 |
| | | | | |
See notes to financial statements.
Alpine Mutual Funds - Dynamic Balance Fund
Schedule of Portfolio Investments—Continued
October 31, 2005
Shares/ | | Security | | |
Par Value | | Description | | Value |
| | | | | |
Common Stocks—continued | | |
| | | Real Estate Investment Trusts—9.7% | | |
| 15,000 | | Boston Properties, Inc. | $ | 1,038,300 |
| 10,000 | | Developers Diversified Realty Corporation | | 436,800 |
| 60,000 | | DiamondRock Hospitality Company | | 669,000 |
| 20,000 | | General Growth Properties, Inc. | | 849,600 |
| 45,000 | | Impac Mortgage Holdings, Inc | | 451,800 |
| 10,000 | | Mack-Cali Realty Corporation | | 426,500 |
| 45,000 | | Origen Financial, Inc | | 322,650 |
| 23,000 | | Simon Property Group, Inc. | | 1,647,260 |
| 80,000 | | Sunstone Hotel Investors, Inc. | | 1,792,000 |
| 23,000 | | Vornado Realty Trust | | 1,863,000 |
| | | | | 9,496,910 |
| | | | | |
| Retail—1.4% | | |
| 10,000 | | Ethan Allen Interiors, Inc. | | 338,200 |
| 20,000 | | J.C. Penney Company, Inc. | | 1,024,000 |
| | | | | 1,362,200 |
| | | | | |
| Transportation—1.0% | | |
| 15,000 | | Union Pacific Corporation | | 1,037,700 |
| | | | | |
| Transportation Services—2.3% | | |
| 25,000 | | FedEx Corp. | | 2,298,250 |
| | | | | |
| Utilities—3.2% | | |
| 61,000 | | Allegheny Energy, Inc. (a) | | 1,723,860 |
| 21,500 | | ITC Holdings Corp. | | 591,250 |
| 15,600 | | SJW Corp. | | 763,152 |
| | | | | 3,078,262 |
| | | Total Common Stocks | | 69,018,763 |
| | | | | |
Shares/ | | Security | | |
Par Value | | Description | | Value |
| | | | | |
Bonds and Notes—17.2% | | |
| U.S. Government Obligations—17.2% | | |
| 2,000,000 | | 7.250%, 05/15/2016 | $ | 2,427,814 |
| 2,000,000 | | 6.250%, 08/15/2023 | | 2,334,766 |
| 4,000,000 | | 6.000%, 02/15/2026 | | 4,599,688 |
| 5,000,000 | | 5.250%, 11/15/2028 | | 5,303,910 |
| 2,000,000 | | 5.000%, 08/15/2011 | | 2,052,502 |
| | | Total Bonds and Notes | | 16,718,680 |
| | | | | |
| | | | | |
Short-Term Investments—10.3% | | |
| 10,059,019 | | Alpine Municipal Money Market Fund | $ | 10,059,019 |
| 558 | | Fidelity Institutional Government Portfolio | | 558 |
| 14 | | Milestone Funds Treasury | | |
| | | Obligations Portfolio | | 14 |
| | | Total Short-term Investments | | 10,059,591 |
| | | | | |
| | | Total Investments | | |
| | | (Cost $84,551,535)—98.3% | | 95,797,034 |
| | | Other Assets, less Liabilities—1.7% | | 1,673,628 |
| | | | | |
| | | TOTAL NET ASSETS—100.0% | $ | 97,470,662 |
| | | | | |
| (a) | Non-income producing securities |
| (b) | Foreign security which trades on U.S. exchange |
See notes to financial statements.
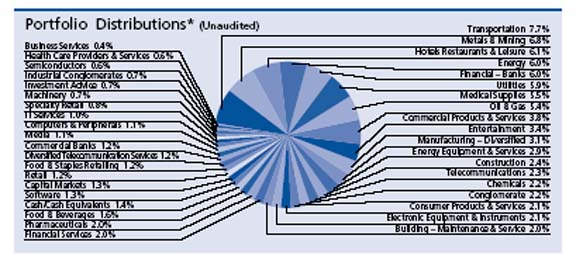
Alpine Mutual Funds - Dynamic Dividend Fund
Schedule of Portfolio Investments
October 31, 2005
Shares/ | | Security | | |
Par Value | | Description | | Value |
| | | | | |
Common Stocks—98.6% | | |
| Building—Maintenance & Service — 2.0% | | |
| 171,580 | | Healthcare Services Group, Inc. | $ | 3,198,251 |
| 101,626 | | McGrath Rentcorp | | 2,901,423 |
| | | | | 6,099,674 |
| | | | | |
| Business Services—0.4% | | |
| 79,500 | | Angelica Corporation . | | 1,128,105 |
| | | | | |
| Capital Markets—1.3% | | |
| 75,000 | | Morgan Stanley | | 4,080,750 |
| | | | | |
| Chemicals—2.2% | | |
| 146,500 | | The Dow Chemical Company. | | 6,718,490 |
| | | | | |
| Commercial Banks—1.2% | | |
| 90,000 | | Marshall & Ilsley Corp. | | 3,866,400 |
| | | | | |
| Commercial Products & Services —3.8% | | |
| 47,000 | | Hubbell, Incorporated—Class B. | | 2,263,520 |
| 117,700 | | MSC Industrial Direct Co., Inc.. | | 4,493,786 |
| 135,000 | | Temple-Inland Inc. | | 4,972,050 |
| | | | | 11,729,356 |
| | | | | |
| Computers & Peripherals—1.1% | | |
| 40,000 | | International Business Machines Corp | | 3,275,200 |
| | | | | |
| Conglomerate—2.2% | | |
| 199,000 | | General Electric Company | | 6,748,090 |
| | | | | |
| Construction—2.4% | | |
| 600,000 | | Dorbyl Limited (c) | | 1,059,849 |
| 35,000 | | KB HOME | | 2,287,250 |
| 75,000 | | Lennar Corporation—Class A | | 4,168,500 |
| | | | | 7,515,599 |
| | | | | |
| Consumer Products & Services—2.1% | | |
| 127,400 | | Aldila, Inc. | | 3,122,574 |
| 25,000 | | Altria Group, Inc. | | 1,876,250 |
| 90,358 | | Bassett Furniture Industries, Incorporated | | 1,691,502 |
| | | | | 6,690,326 |
| | | | | |
| Diversified Telecommunication Services — 1.2% | | |
| 208,000 | | Chunghwa Telecom Co., Ltd. — ADR | | 3,602,560 |
| | | | | |
| | | | | |
| Electronic Equipment & Instruments —2.1% | | |
| 180,000 | | Anixter International, Inc. | | 6,674,400 |
| | | | | |
| Energy—6.0% | | |
| 25,000 | | BP p.l.c.—ADR (b) | | 1,660,000 |
| 95,000 | | Diamond Offshore Drilling, Inc. | | 5,363,700 |
| 70,000 | | Exxon Mobil Corporation | | 3,929,800 |
| 57,000 | | GlobalSantaFe Corporation (b) | | 2,539,350 |
| 85,000 | | Marathon Oil Corporation | | 5,113,600 |
| | | | | 18,606,450 |
| | | | | |
| Energy Equipment & Services—2.9% | | |
| 62,400 | | Rowan Companies, Inc. | | 2,058,576 |
| 156,000 | | Todco | | 6,981,000 |
| | | | | 9,039,576 |
| | | | | |
| Entertainment—3.4% | | |
| 103,700 | | Harrah’s Entertainment, Inc. | | 6,271,776 |
Shares/ | | Security | | |
Par Value | | Description | | Value |
| | | | | |
Common Stocks—continued | | |
| Entertainment—continued | | |
| 238,700 | | Regal Entertainment Group— Class A | $ | 4,399,241 |
| | | | | 10,671,017 |
| | | | | |
| Financial—Banks—6.0% | | |
| 97,000 | | Bank of America Corporation | | 4,242,780 |
| 122,300 | | Citigroup Inc | | 5,598,894 |
| 56,700 | | J.P. Morgan Chase & Co | | 2,076,354 |
| 54,500 | | Wachovia Corporation | | 2,753,340 |
| 66,000 | | Wells Fargo & Company | | 3,973,200 |
| | | | | 18,644,568 |
| | | | | |
| Financial Services—2.0% | | |
| 300,000 | | Ameritrade Holding Corporation (a) | | 6,309,000 |
| | | | | |
| | | | | |
| Food & Beverages—1.6% | | |
| 56,000 | | PepsiCo, Inc. | | 3,308,480 |
| 113,516 | | Rocky Mountain Chocolate Factory, Inc. | | 1,800,364 |
| | | | | 5,108,844 |
| | | | | |
| Food & Staples Retailing—1.2% | | |
| 150,000 | | Albertson’s, Inc | | 3,766,500 |
| | | | | |
| Health Care Providers & Services— 0.6% | | |
| 48,500 | | Computer Programs & Systems, Inc. | | 1,789,650 |
| | | | | |
| | | | | |
| Hotels Restaurants & Leisure—6.1% | | |
| 60,000 | | Carnival Corporation | | 2,980,200 |
| 36,000 | | Enterprise Inns plc (c) | | 496,699 |
| 230,000 | | Hilton Hotels Corporation | | 4,473,500 |
| 200,000 | | Hilton Group plc (c) | | 1,200,949 |
| 111,000 | | Hyatt Regency SA (c) | | 1,359,547 |
| 203,733 | | Stanley Leisure PLC (a) | | 2,188,897 |
| 108,000 | | Starwood Hotels & Resorts Worldwide, Inc. | | 6,310,440 |
| | | | | 19,010,232 |
| | | | | |
| Industrial Conglomerates—0.7% | | |
| 30,000 | | Textron, Inc. | | 2,161,200 |
| | | | | |
| Investment Advice—0.7% | | |
| 105,000 | | CapitalSource, Inc. (a) | | 2,310,000 |
| | | | | |
| | | | | |
| IT Services—1.0% | | |
| 85,000 | | Certegy, Inc | | 3,184,100 |
| | | | | |
| | | | | |
| Machinery—0.7% | | |
| 40,000 | | Ingersoll-Rand Co. (b) | | 1,511,600 |
| 82,600 | | Metka S.A. (c) | | 736,501 |
| | | | | 2,248,101 |
| | | | | |
| Manufacturing—Diversified—3.1% | | |
| 55,000 | | 3M Co | | 4,178,900 |
| 105,000 | | American Power Conversion Corporation | | 2,245,950 |
| 145,000 | | Nam Tai Electronics, Inc | | 3,284,250 |
| | | | | 9,709,100 |
| | | | | |
| Media—1.1% | | |
| 75,000 | | Cablevision Systems | | |
| | | Corporation (a) | | 1,860,000 |
See notes to financial statements.
Alpine Mutual Funds - Dynamic Dividend Fund
Schedule of Portfolio Investments—Continued
October 31, 2005
Shares/ | | Security | | |
Par Value | | Description | | Value |
| | | | | |
Common Stocks—continued | | |
| Media—continued | | |
| 50,000 | | Viacom, Inc.—Class B | $ | 1,548,500 |
| | | | | 3,408,500 |
| | | | | |
| Medical Supplies—5.5% | | |
| 40,250 | | Chr. Hansen Holding A/S © | | 3,774,821 |
| 450,000 | | Gambro AB—Class A © | | 6,357,688 |
| 139,750 | | Meridian Bioscience, Inc. | | 2,926,365 |
| 121,500 | | PolyMedica Corporation | | 4,010,715 |
| | | | | 17,069,589 |
| | | | | |
| Metals & Mining—6.8% | | |
| 240,000 | | Algoma Steel, Inc. | | 4,680,000 |
| 80,000 | | BHP Billiton Limited — ADR (b) | | 2,484,000 |
| 82,500 | | Companhia Siderurgica Nacional S.A.—ADR | | 1,584,000 |
| 940,913 | | Gloucester Coal Ltd. © | | 2,040,339 |
| 75,500 | | Kumba Resources Ltd © | | 1,115,475 |
| 400,000 | | Macarthur Coal Limited © | | 1,749,729 |
| 80,000 | | Mittal Steel South Africa Ltd © | | 630,245 |
| 58,350 | | Phelps Dodge Corp. | | 7,029,424 |
| | | | | 21,313,212 |
| | | | | |
| Oil & Gas —5.4% | | |
| 147,500 | | Double Hull Tankers, Inc. (a) (b) | | 1,744,925 |
| 60,000 | | ConocoPhillips | | 3,922,800 |
| 800,000 | | New Hope Corporation Limited © | | 819,531 |
| 269,000 | | OMI Corp. | | 4,863,520 |
| 70,000 | | Overseas Shipholding Group | | 3,332,000 |
| 89,000 | | Woodside Petroleum Limited | | 2,102,965 |
| | | | | 16,785,741 |
| | | | | |
| Pharmaceuticals—2.0% | | |
| 75,000 | | Abbott Laboratories | | 3,228,750 |
| 49,000 | | Johnson & Johnson | | 3,068,380 |
| | | | | 6,297,130 |
| | | | | |
| Retail—1.2% | | |
| 50,000 | | Home Depot, Inc. | | 2,052,000 |
| 65,000 | | Sears Canada, Inc. © | | 1,763,822 |
| | | | | 3,815,822 |
| | | | | |
| Semiconductors—0.6% | | |
| 75,000 | | Intel Corporation | | 1,762,500 |
| | | | | |
| Software—1.3% | | |
| 160,000 | | Microsoft Corporation | | 4,112,000 |
| | | | | |
Shares/ | | Security | | |
Par Value | | Description | | Value |
| | | | | |
Common Stocks—continued | | |
| SpecialtyRetail—0.8% | | |
| 50,000 | | Abercrombie & Fitch Co.—Class A | $ | 2,599,500 |
| | | | | |
| | | | | |
| Telecommunications—2.3% | | |
| 287,500 | | Consolidated Communications Holdings, Inc. | | 3,812,250 |
| 195,700 | | Iowa Telecommunications Services Incorporated | | 3,229,050 |
| | | | | 7,041,300 |
| | | | | |
| Transportation—7.7% | | |
| 284,700 | | Aries Maritime Transport Ltd. (a) (b) | | 3,963,024 |
| 232,100 | | Diana Shipping Inc. (b) | | 3,632,365 |
| 238,000 | | Dryships Inc. (b) | | 3,581,900 |
| 43,500 | | Frontline Limited (b) | | 1,727,385 |
| 92,100 | | Genco Shipping & Trading Ltd (a) (b) | | 1,513,203 |
| 151,763 | | Ship Finance International Limited (b) | | 2,889,568 |
| 291,000 | | Quintana Maritime Ltd. (b) | | 3,148,620 |
| 103,600 | | Tsakos Energy Navigation Ltd (b) | | 3,556,588 |
| | | | | 24,012,653 |
| | | | | |
| Utilities—5.9% | | |
| 50,000 | | Exelon Corp. | | 2,601,500 |
| 3,800 | | ITC Holdings Corp. | | 104,500 |
| 207,300 | | Macquarie Infrastructure Company Trust | | 6,219,000 |
| 333,469 | | National Grid PLC (a) | | 3,048,600 |
| 60,000 | | PPL Corporation | | 1,880,400 |
| 44,000 | | TXU Corp. | | 4,433,000 |
| | | | | 18,287,000 |
| | | Total Common Stocks | | 307,192,235 |
| | | | | |
Short-Term Investments—0.4% | | |
| 1,000,000 | | Alpine Municipal Money Market Fund | $ | 1,000,000 |
| 148,574 | | Fidelity Institutional Government Portfolio | | 148,574 |
| | | Total Short-Term Investments | | 1,148,574 |
| | | Total Investments | | |
| | | (Cost $319,063,559)—99.0% | | 308,340,809 |
| | | Other Assets, less Liabilities—1.0% | | 3,000,083 |
| | | | | |
| | | TOTAL NET ASSETS—100.0% | | |
| | | | $ | 311,340,892 |
| | | | | |
Percentages are stated as a percent of net assets.ADR—American Depository Receipt
(a) Non-income producing securities
(b) Foreign Security which trades on U.S. exchange
(c) Foreign security
See notes to financial statements.
Alpine Mutual Funds - Municipal Money Market Fund
Schedule of Portfolio Investments
October 31, 2005
Principal | | Security | | |
Amount | | Description | | Value |
| | | | | |
Municipal Bonds —98.9% | | |
| Alabama—4.4% | | |
| 830,000 | | Butler County Industrial | | |
| | | Development Authority | | |
| | | Revenue—Series A | | |
| | | (LOC: Whitney National | | |
| | | Bank; SunTrust Bank) | | |
| | | 3.020%, 11/07/2005 (a) (b) | $ | 830,000 |
| 1,325,000 | | Forsyth Housing Authority | | |
| | | Multi-Family Revenue, Union | | |
| | | Hill Apartments Project | | |
| | | (LOC: Columbus | | |
| | | Bank & Trust) | | |
| | | 2.990%, 11/07/2005 (a) (b) | | 1,325,000 |
| 2,000,000 | | Mobile Industrial Development | | |
| | | Revenue, Hosea O Weaver & | | |
| | | Sons | | |
| | | (LOC: Regions Bank) | | |
| | | 2.920%, 11/07/2005 (a) (b) | | 2,000,000 |
| 280,000 | | Montgomery Industrial | | |
| | | Development Revenue, | | |
| | | Dev-Kinpak Inc. | | |
| | | (LOC: Regions Bank) | | |
| | | 2.970%, 11/07/2005 (a) (b) | | 280,000 |
| 1,260,000 | | Montgomery Industrial | | |
| | | Development Revenue, | | |
| | | Norment Industries Inc. | | |
| | | (LOC: LaSalle Bank N.A.) | | |
| | | 2.920%, 11/07/2005 (a) (b) | | 1,260,000 |
| 320,000 | | Pell City Industrial | | |
| | | Development Revenue, | | |
| | | Kinder Gorbel | | |
| | | (LOC: Key Bank of New York) | | |
| | | 2.970%, 11/01/2005 (a) | | 320,000 |
| 1,675,000 | | Tuscaloosa County Industrial | | |
| | | Development Revenue, | | |
| | | Automotive Corridor LLC | | |
| | | (LOC: Regions Bank) | | |
| | | 2.920%, 11/07/2005 (a) (b) | | 1,675,000 |
| 1,295,000 | | Tuscaloosa County Industrial | | |
| | | Development Revenue, | | |
| | | Automotive Corridor LLC | | |
| | | (LOC: Regions Bank) | | |
| | | 2.920%, 11/07/2005 (a) (b) | | 1,295,000 |
| | | | | 8,985,000 |
| | | | | |
| Alaska—0.9% | | |
| 930,000 | | Alaska Industrial Development | | |
| | | & Export Authority—Lot 6 | | |
| | | (LOC: Bank of America N.A.) | | |
| | | 3.150%, 11/07/2005 (a) (b) | | 930,000 |
| 940,000 | | Alaska Industrial Development | | |
| | | & Export Authority—Lot 12 | | |
| | | (LOC: Bank of America N.A.) | | |
| | | 3.150%, 11/07/2005 (a)(b) | | 940,000 |
| | | | | 1,870,000 |
| | | | | |
Principal | | Security | | |
Amount | | Description | | Value |
| | | | | |
Municipal Bonds—continued | | |
| California—0.5% | | |
| 1,000,000 | | Stockton Certificates, United | | |
| | | Christian Schools | | |
| | | (LOC: Pacific Capital Bank) | | |
| | | 3.050%, 11/07/2005 (a)(b) | $ | 1,000,000 |
| | | | | |
| Colorado—11.5% | | |
| 3,000,000 | | Bachelor Gulch Metropolitan | | |
| | | District General Obligation | | |
| | | (LOC: Compass Bank) | | |
| | | 2.350%, 12/01/2005 (a) | | 3,000,000 |
| 1,900,000 | | Broomfield Village | | |
| | | Metropolitan District 2, | | |
| | | Special Obligation Revenue | | |
| | | (LOC: Compass Bank) | | |
| | | 3.050%, 11/07/2005 (a)(b) | | 1,900,000 |
| 4,549,000 | | Cherry Creek South Metro | | |
| | | District No. 1—Series B | | |
| | | (LOC: Compass Bank) | | |
| | | 2.350%, 12/15/2005 (a)(b) | | 4,547,934 |
| 1,475,000 | | Colorado Housing & Finance | | |
| | | Authority Economic | | |
| | | Development Revenue, | | |
| | | Top Shop—Series A | | |
| | | (LOC: JP Morgan Chase Bank) | | |
| | | 2.910%, 11/07/2005 (a)(b) | | 1,475,000 |
| 1,000,000 | | Colorado Housing & Finance | | |
| | | Authority Economic Revenue, | | |
| | | Casarosa & Denver Gasket | | |
| | | 2.930%, 11/07/2005 (a)(b) | | 1,000,000 |
| 1,000,000 | | Four Mile Ranch Metro District | | |
| | | No 1 Ltd Tax | | |
| | | (LOC: Zions First National) | | |
| | | 2.800%, 12/01/2005 (a)(b) | | 1,000,000 |
| 2,177,000 | | Jefferson County Industrial | | |
| | | Development Revenue, | | |
| | | EPI-Center LLC | | |
| | | (LOC: JP Morgan Chase Bank) | | |
| | | 2.910%, 11/01/2005 (a)(b) | | 2,177,000 |
| | | Triview Metropolitan District— | | |
| | | Series A | | |
| | | (LOC: Compass Bank) | | |
| 1,000,000 | | 1.375%, 10/31/2005 (a)(b) | | 1,000,000 |
| 1,000,000 | | 2.100%, 11/01/2005 (a)(b) | | 1,000,000 |
| 3,000,000 | | Vail Multifamily Housing | | |
| | | Revenue, Middle Creek | | |
| | | Village Apartments—Series A | | |
| | | (LOC: California | | |
| | | Bank & Trust) | | |
| | | 2.950%, 11/07/2005 (a)(b) | | 3,000,000 |
| 3,500,000 | | Wildgrass Metro District | | |
| | | (LOC: Compass Bank) | | |
| | | 2.400%, 12/01/2005 | | 3,500,019 |
| | | | | 23,599,953 |
| | | | | |
See notes to financial statements.
Alpine Mutual Funds - Municipal Money Market Fund
Schedule of Portfolio Investments—Continued
October 31, 2005
Principal | | Security | | |
Amount | | Description | | Value |
| | | | | |
Municipal Bonds—continued | | |
| | | Delaware—0.4% | | |
| 800,000 | | Delaware St. Economic | | |
| | | Development Authority | | |
| | | Waste Disposal, CIBA | | |
| | | Specialty Chemicals—Series A | | |
| | | 2.980%, 11/01/2005 (a) (b) | $ | 800,000 |
| | | | | |
| Georgia—1.7% | | |
| 1,310,000 | | De Kalb County Housing | | |
| | | Authority Revenue, Stone | | |
| | | Mill Run Apartments | | |
| | | (LOC: First Tennessee Bank) | | |
| | | 2.950%, 11/07/2005 (a) (b) | | 1,310,000 |
| 1,605,000 | | Douglas County Development | | |
| | | Authority Revenue, Denyse Signs Inc. | | |
| | | (LOC: Bank of North Georgia) | | |
| | | 2.950%, 11/07/2005 (a) (b) | | 1,605,000 |
| 580,000 | | Franklin County Industrial | | |
| | | Building Authority Revenue, | | |
| | | Ross Operating Valve Co. | | |
| | | (LOC: Comerica Bank) | | |
| | | 2.970%, 11/07/2005 (a) (b) | | 580,000 |
| | | | | 3,495,000 |
| | | | | |
| Illinois—8.0% | | |
| 1,240,000 | | Carol Stream Industrial | | |
| | | Development Revenue, MI | | |
| | | Enterprises | | |
| | | (LOC: JP Morgan | | |
| | | Chase & Co) | | |
| | | 2.95%, 11/07/2005 (a)(b) | | 1,240,000 |
| 1,105,000 | | Clinton Industrial Development | | |
| | | Revenue | | |
| | | (LOC: AmSouth Bank) | | |
| | | 2.970%, 11/07/2005 (a)(b) | | 1,105,000 |
| 1,275,000 | | Harvard Health Care Facility | | |
| | | Revenue, Harvard Memorial | | |
| | | Hospital Inc. | | |
| | | (LOC: M&I Bank) | | |
| | | 2.910%, 11/07/2005 (a)(b) | | 1,275,000 |
| 800,000 | | Illinois Development Finance | | |
| | | Authority Multifamily | | |
| | | Revenue, Butterfield Creek | | |
| | | (LOC: LaSalle Bank N.A.) | | |
| | | 2.950%, 11/07/2005 (a)(b) | | 800,000 |
| 8,000,000 | | Lakemoor Multifamily Revenue | | |
| | | (CS: Bayerische) | | |
| | | 2.930%, 11/07/2005 (a)(b) | | 8,000,000 |
| 4,000,000 | | Phoenix Realty Special Account | | |
| | | -U LP Multifamily Revenue, | | |
| | | Brightons Mark | | |
| | | (LOC: Northern Trust Company) | | |
| | | 2.910%, 11/07/2005 (a)(b) | | 4,000,000 |
| | | | | 16,420,000 |
| | | | | |
Principal | | Security | | |
Amount | | Description | | Value |
| | | | | |
Municipal Bonds —continued | | |
| Indiana—2.1% | | |
| 980,000 | | Lawrence Industrial Economic | | |
| | | Development Revenue, | | |
| | | Southwark Metal | | |
| | | Manufacturing Co. | | |
| | | (LOC: Citizens Bank) | | |
| | | 2.900%, 11/07/2005 (a) (b) | $ | 980,000 |
| 1,000,000 | | Monroe County Industrial | | |
| | | Economic Development | | |
| | | Revenue | | |
| | | (LOC: Old National Bank) | | |
| | | 3.290%, 11/07/2005 (a) (b) | | 1,000,000 |
| 300,000 | | Princeton Industrial | | |
| | | Development Revenue, Orion | | |
| | | Denki American Inc. | | |
| | | (LOC: Bank of Tokyo | | |
| | | Mitsubishi) | | |
| | | 3.000%, 11/07/2005 (a) (b) | | 300,000 |
| 2,150,000 | | Shelbyville Industrial Economic | | |
| | | Development Revenue, AFR | | |
| | | Properties & American | | |
| | | Resources | | |
| | | (LOC: Associated Bank N.A.) | | |
| | | 3.000%, 11/07/2005 (a) (b) | | 2,150,000 |
| | | | | 4,430,000 |
| | | | | |
| Louisiana—3.2% | | |
| 1,050,000 | | Caddo-Bossier Parishes Port | | |
| | | Commission, Shreveport | | |
| | | Fabrications | | |
| | | (LOC: Hibernia | | |
| | | National Bank) | | |
| | | 3.170%, 11/07/2005 (a) (b) | | 1,050,000 |
| 5,500,000 | | Environment Facilities | | |
| | | Community Development | | |
| | | Authority Revenue, Caddo- | | |
| | | Bossier Parishes | | |
| | | (LOC: Hibernia | | |
| | | National Bank) | | |
| | | 3.170%, 11/07/2005 (a) (b) | | 5,500,000 |
| | | | | 6,550,000 |
| | | | | |
| Maine—2.5% | | |
| | | Dover & Foxcroft Revenue, | | |
| | | Pleasant River Lumber Co. | | |
| | | (LOC: CoBank ACB; Wachovia | | |
| | | Bank N.A.) | | |
| 3,000,000 | | 2.940%, 11/07/2005 (a) (b) | | 3,000,000 |
| 2,050,000 | | 2.940%, 11/07/2005 (a) (b) | | 2,050,000 |
| | | | | 5,050,000 |
| | | | | |
| Michigan—4.6% | | |
| 4,500,000 | | Municipal Bond Authority | | |
| | | Revenue, Detroit School | | |
| | | District—Series A | | |
| | | (LOC: JP Morgan Chase Bank) | | |
| | | 3.750%, 03/21/2006 | | 4,513,309 |
| | | | | |
See notes to financial statements.
Alpine Mutual Funds - Municipal Money Market Fund
Schedule of Portfolio Investments—Continued
October 31, 2005
Principal | | Security | | |
Amount | | Description | | Value |
| | | | | |
Municipal Bonds—continued | | |
| Michigan—continued | | |
| 1,000,000 | | Strategic Fund Ltd. Obligation | | |
| | | Revenue Series A, Waterland | | |
| | | Battle Creek Properties LLC | | |
| | | (LOC: Fifth Third Bank) | | |
| | | 3.050%, 11/07/2005 (a) (b) | $ | 1,000,000 |
| 4,000,000 | | Strategic Fund Ltd. Obligation | | |
| | | Revenue, Rudolph Etta | | |
| | | Dejong—1982 | | |
| | | (LOC: Farm Credit Services | | |
| | | America; Bank of the West) | | |
| | | 2.940%, 11/07/2005 (a) (b) | | 4,000,000 |
| | | | | 9,513,309 |
| | | | | |
| Minnesota—2.6% | | |
| 3,810,000 | | Ramsey Industrial Development | | |
| | | Revenue, Kilkenny Ltd.— | | |
| | | Series A | | |
| | | 2.900%, 11/07/2005 (a) (b) | | 3,810,000 |
| 1,580,000 | | St. Cloud Housing & | | |
| | | Redevelopment Authority | | |
| | | Industrial Development | | |
| | | Revenue, CMMB LLP | | |
| | | 3.250%, 11/07/2005 (a) (b) | | 1,580,000 |
| | | | | 5,390,000 |
| | | | | |
| Missouri—6.5% | | |
| 2,105,000 | | Springfield Industrial | | |
| | | Development Authority | | |
| | | Revenue, DMP Properties LLC | | |
| | | (LOC: U.S. Bank N.A.) | | |
| | | 2.950%, 11/07/2005 (a) (b) | | 2,105,000 |
| 1,700,000 | | Springfield Industrial | | |
| | | Development Authority | | |
| | | Revenue, DMP Properties LLC | | |
| | | (LOC: U.S. Bank N.A.) | | |
| | | 2.950%, 11/07/2005 (a) (b) | | 1,700,000 |
| 3,760,000 | | St. Charles County Industrial | | |
| | | Development Authority | | |
| | | Revenue, Dev-Craftsmen | | |
| | | Industries | | |
| | | 2.910%, 11/07/2005 (a) (b) | | 3,760,000 |
| 2,000,000 | | St. Joseph Industrial | | |
| | | Development Authority | | |
| | | Industrial Development | | |
| | | Revenue, Albaugh Inc.— | | |
| | | Series A | | |
| | | (LOC: Mercantile Bank N.A.) | | |
| | | 3.050%, 11/07/2005 (a) (b) | | 2,000,000 |
| 3,750,000 | | Washington Industrial | | |
| | | Development Authority | | |
| | | Industrial Revenue, Clemco | | |
| | | Industries | | |
| | | 2.980%, 11/07/2005 (a) (b) | | 3,750,000 |
| | | | | 13,315,000 |
| | | | | |
Principal | | Security | | |
Amount | | Description | | Value |
| | | | | |
Municipal Bonds—continued | | |
| New Mexico���1.4% | | |
| 1,300,000 | | New Mexico Housing Authority | | |
| | | Region III Multifamily | | |
| | | Revenue, El Pueblo | | |
| | | Apartments—Series A | | |
| | | (LOC: PNC Bank N.A.) | | |
| | | 2.950%, 11/07/2005 (a) (b) | $ | 1,300,000 |
| 1,500,000 | | New Mexico Housing Authority | | |
| | | Region III Multifamily | | |
| | | Revenue, Madeira Court | | |
| | | Apartments—Series B | | |
| | | (LOC: PNC Bank N.A.) | | |
| | | 2.950%, 11/07/2005 (a) (b) | | 1,500,000 |
| | | | | 2,800,000 |
| | | | | |
| New York—6.9% | | |
| 910,000 | | Erie County Industrial | | |
| | | Development Agency | | |
| | | Revenue, MMars—B&G | | |
| | | Properties—Class B | | |
| | | 3.250%, 11/07/2005 (a) (b) | | 910,000 |
| 13,160,000 | | New York City Transitional | | |
| | | Finance Authority Revenue — PT 406 | | |
| | | (SPA: Merrill Lynch) | | |
| | | 2.830%, 02/09/2006 (a) | | 13,160,000 |
| 145,000 | | Niagara County Industrial | | |
| | | Development Agency | | |
| | | Revenue, MMars Second | | |
| | | Program—Series A | | |
| | | 3.250%, 11/07/2005 (a) (b) | | 145,000 |
| | | | | 14,215,000 |
| | | | | |
| Ohio—1.1% | | |
| 800,000 | | Cuyahoga County Industrial | | |
| | | Development Revenue, Edge | | |
| | | Seal Technologies | | |
| | | (LOC: FirstMerit Bank) | | |
| | | 2.950%, 11/07/2005 (a) (b) | | 800,000 |
| 1,400,000 | | Hamilton County Economic | | |
| | | Development Revenue, | | |
| | | Union Institute | | |
| | | (LOC: Huntington National | | |
| | | Bank) | | |
| | | 2.930%, 11/07/2005 (a) (b) | | 1,400,000 |
| | | | | 2,200,000 |
| | | | | |
| South Carolina—1.7% | | |
| 3,500,000 | | Dorchester County School | | |
| | | District—No. 002 | | |
| | | 4.000%, 06/01/2006 | | 3,519,544 |
| | | | | |
| | | | | |
| South Dakota —1.2% | | |
| 1,500,000 | | Brookings Industrial | | |
| | | Development Revenue, | | |
| | | Lormar Development Co. | | |
| | | (LOC: U.S. Bank N.A.) | | |
| | | 2.850%, 11/07/2005 (a) (b) | | 1,500,000 |
| | | | | |
See notes to financial statements.
Alpine Mutual Funds - Municipal Money Market Fund
Schedule of Portfolio Investments—Continued
October 31, 2005
Principal | | Security | | |
Amount | | Description | | Value |
| | | | | |
| | | | | |
Municipal Bonds—continued | | |
| South Dakota —continued | | |
| 985,000 | | South Dakota Economic | | |
| | | Development Finance | | |
| | | Authority Economic Revenue, | | |
| | | Vicom Ltd. | | |
| | | (LOC: Associated Bank N.A.) | | |
| | | 2.980%, 11/07/2005 (a)(b) | $ | 985,000 |
| | | | | 2,485,000 |
| | | | | |
| Tennessee—6.3% | | |
| 6,380,000 | | Capitol View II Limited | | |
| | | Partnership Grantor Trust | | |
| | | 3.500, 11/30/2005 (a) (b) | | 6,380,000 |
| 1,300,000 | | Hamilton County Industrial | | |
| | | Development Revenue, | | |
| | | Hamilton Plastics Inc. | | |
| | | (LOC: First American | | |
| | | National Bank) | | |
| | | 2.970%, 11/07/2005 (a)(b) | | 1,300,000 |
| 355,000 | | Jackson Health Educational & | | |
| | | Housing Facility Board | | |
| | | Revenue, Creekside | | |
| | | Apartments | | |
| | | (LOC: First Tennessee Bank) | | |
| | | 3.000%, 12/01/2005 (a) | | 355,000 |
| 5,000,000 | | Jackson Health Educational & | | |
| | | Housing Facility Board | | |
| | | Revenue, Park Ridge | | |
| | | Apartments | | |
| | | (LOC: First Tennessee Bank) | | |
| | | 2.920%, 11/07/2005 (a)(b) | | 5,000,000 |
| | | | | 13,035,000 |
| | | | | |
| Texas—3.9% | | |
| 2,000,000 | | Gulf Coast Waste Disposal | | |
| | | Authority, Republic Waste | | |
| | | Services | | |
| | | 3.050%, 11/07/2005 (a)(b) | | 2,000,000 |
| 2,000,000 | | Montgomery County Industrial | | |
| | | Development Revenue, | | |
| | | Medical Manufacturing | | |
| | | Partners | | |
| | | (LOC: Bank One Texas N.A.) | | |
| | | 2.830%, 11/07/2005 (a)(b) | | 2,000,000 |
| 1,500,000 | | Port Corpus Christi Authority | | |
| | | Nueces County Waste | | |
| | | Disposal, Flint Hills | | |
| | | Resources LP | | |
| | | 3.000%, 11/07/2005 (a)(b) | | 1,500,000 |
| 1,500,000 | | Port Corpus Christi Authority | | |
| | | Nueces County Waste | | |
| | | Disposal, Flint Hills | | |
| | | Resources LP | | |
| | | 3.000%, 11/07/2005 (a)(b) | | 1,500,000 |
| 1,000,000 | | Travis County Health Facilities | | |
| | | Development Corporation | | |
| | | Revenue, Ascension Health | | |
| | | Credit—Series A | | |
| | | 5.000%, 11/15/2005 | | 1,000,770 |
| | | | | 8,000,770 |
| | | | | |
Principal | | Security | | |
Amount | | Description | | Value |
| | | | | |
| | | | | |
Municipal Bonds—continued | | |
| Utah—1.2% | | |
| 2,500,000 | | Utah Housing Corporation | | |
| | | Multifamily Revenue, Todd | | |
| | | Hollow Apartments—A | | |
| | | (CS: AIG) | | |
| | | 3.150%, 11/07/2005 (a)(b) | $ | 2,500,000 |
| | | | | |
| Washington—1.5% | | |
| 1,985,000 | | Washington Economic | | |
| | | Development Finance | | |
| | | Authority Revenue, B&H | | |
| | | Dental Laboratory | | |
| | | 3.100%, 11/07/2005 (a)(b) | | 1,985,000 |
| 1,110,000 | | Washington Economic | | |
| | | Development Finance | | |
| | | Authority Revenue, Belina | | |
| | | Interiors Inc.—Series F | | |
| | | (LOC: Keybank N.A.) | | |
| | | 2.910%, 11/07/2005 (a)(b) | | 1,110,000 |
| | | | | 3,095,000 |
| | | | | |
| Wisconsin—8.2% | | |
| 635,000 | | Fox Lake Redevelopment | | |
| | | Authority Revenue, Karavan | | |
| | | Trailers Inc. | | |
| | | (LOC: Associated Bank N.A.) | | |
| | | 2.980%, 11/07/2005 (a)(b) | | 635,000 |
| 2,750,000 | | Fox Lake Redevelopment | | |
| | | Authority Revenue, Karavan | | |
| | | Trailers Inc. | | |
| | | (LOC: Associated Bank N.A.) | | |
| | | 2.980%, 11/07/2005 (a)(b) | | 2,750,000 |
| 1,380,000 | | Franklin Industrial | | |
| | | Development Revenue, | | |
| | | Howard Henz Co. Inc. | | |
| | | (LOC: Associated Bank N.A.) | | |
| | | 3.000%, 11/07/2005 (a)(b) | | 1,380,000 |
| 1,750,000 | | Franklin Industrial | | |
| | | Development Revenue, | | |
| | | Smyczek/ECS | | |
| | | (LOC: Wells Fargo Bank N.A.) | | |
| | | 2.970%, 11/07/2005 (a)(b) | | 1,750,000 |
| 4,500,000 | | Hull Industrial Development | | |
| | | Revenue, Welcome Dairy Inc. | | |
| | | (LOC: Associated Bank N.A.) | | |
| | | 2.950%, 11/07/2005 (a)(b) | | 4,500,000 |
| 560,000 | | Neenah Industrial Development | | |
| | | Revenue, Galloway Co. | | |
| | | (LOC: Bank One Wisconsin) | | |
| | | 2.940%, 11/07/2005 (a)(b) | | 560,000 |
| 1,980,000 | | Reedsburg Industrial | | |
| | | Development Revenue, | | |
| | | Cellox LLC | | |
| | | (LOC: Associated Bank N.A.) | | |
| | | 3.000%, 11/07/2005 (a)(b) | | 1,980,000 |
| | | | | |
See notes to financial statements
Alpine Mutual Funds - Municipal Money Market Fund
Schedule of Portfolio Investments—Continued
October 31, 2005
Principal | | Security | | |
Amount | | Description | | Value |
| | | | | |
Municipal Bonds—continued | | |
| Wisconsin—continued | | |
| 1,700,000 | | Rhinelander Industrial | | |
| | | Development Revenue, | | |
| | | Superior Diesel/SDI Properties | | |
| | | (LOC: Associated Bank N.A.) | | |
| | | 3.000%, 11/07/2005 (a)(b) | $ | 1,700,000 |
| 1,300,000 | | Sheboygan Industrial | | |
| | | Development Revenue, | | |
| | | Polyfab & Gill-Janssen | | |
| | | (LOC: Associated Bank | | |
| | | Lakeshore) | | |
| | | 2.980%, 11/07/2005 (a)(b) | | 1,300,000 |
| 200,000 | | Sturgeon Bay Industrial | | |
| | | Development Revenue, | | |
| | | Midwest Wire Realty | | |
| | | (LOC: Associated Bank | | |
| | | Milwaukee) | | |
| | | 3.000%, 11/07/2005 (a)(b) | | 200,000 |
| | | | | 16,755,000 |
| | | | | |
| Multistate—16.6% | | |
| 11,220,000 | | Class B Revenue Bond | | |
| | | Certificates—Series Trust | | |
| | | 2004-1 | | |
| | | (SPA: AIG Retirement | | |
| | | Services) | | |
| | | 3.150%, 11/07/2005 (a)(b) | | 11,220,000 |
| 10,685,000 | | Puttable Floating Option | | |
| | | Tax-Exempt Receipts, Regular | | |
| | | Floats Mode A PPT-38 | | |
| | | (LOC: Lloyds TSB Bank Plc) | | |
| | | 3.460, 11/07/2005 (a)(b) | | 10,685,000 |
| 5,000,000 | | Revenue Bond Certificate Trust | | |
| | | 2005-1 | | |
| | | (CS: AIG) | | |
| | | 3.050%, 11/07/2005 (a)(b) | | 5,000,000 |
| | | | | |
Principal | | Security | | |
Amount | | Description | | Value |
| | | | | |
Municipal Bonds—continued | | |
| Multistate—continued | | |
| 2,000,000 | | Revenue Bond Certificate Series | | |
| | | Trust 2004-1, Castlegate 1 | | |
| | | (CS: AIG Retirement Services, Inc.) | | |
| | | 3.150%, 11/07/2005 (a)(b) | $ | 2,000,000 |
| 2,000,000 | | Revenue Bond Certificate Series | | |
| | | Trust 2004-1, Castlegate 2 | | |
| | | (CS: AIG Retirement Services, Inc.) | | |
| | | 3.150%, 11/07/2005 (a)(b) | | 2,000,000 |
| 3,100,000 | | Revenue Bond Certificate Series | | |
| | | Trust 2004-13, Centennial | | |
| | | (CS: AIG) | | |
| | | 3.150%, 11/07/2005 (a)(b) | | 3,100,000 |
| | | | | 34,005,000 |
| | | Total Municipal Bonds | | 203,028,576 |
| | | | | |
| | | | | |
Money Market Funds—0.0% | | |
| 92,393 | | Federated Government | | |
| | | Obligations Fund | | 92,393 |
| | | Total Money Market Funds | | 92,393 |
| | | | | |
Variable RateDemand Notes—1.3% | | |
| 2,600,000 | | Puerto Rico GDB | | 2,600,000 |
| | | Total Variable Rate Demand | | |
| | | Notes | | 2,600,000 |
| | | Total Investments | | |
| | | (Cost $205,720,969)—100.2% | | 205,720,969 |
| | | Liabilities, less Other Assets—(0.2)% | | (415,688) |
| | | | | |
| | | TOTAL NET ASSETS—100.0% | $ | 205,305,281 |
| | | | | |
(a) Variable Rate Security—The rate reported is the rate in effect as of October 31, 2005. The date shown is the next reset date.(b) Maturity date represents first available put date.
CS—Credit Support
LOC—Letter of Credit
SPA—Stand by Purchase Agreement
GDB—Government Development Bank
See notes to financial statements.
Alpine Mutual Funds - Tax Optimized Income Fund
Schedule of Portfolio Investments
October 31, 2005
Principal | | Security | | |
Amount | | Description | | Value |
| | | | | |
Corporate Bonds—16.3% | | |
| 1,000,000 | | AOL Time Warner Inc | | |
| | | 6.150%, 05/01/2007 | $ | 1,017,641 |
| 1,800,000 | | Boeing Capital Corporation | | |
| | | 5.750%, 02/15/2007 | | 1,821,317 |
| | | CIT Group Inc. | | |
| 500,000 | | 4.000%, 05/08/2008 | | 489,954 |
| 1,150,000 | | 5.910%, 11/23/2005 | | 1,150,978 |
| 3,000,000 | | Ford Motor Credit Company | | |
| | | 6.875%, 02/01/2006 | | 2,998,641 |
| | | Total Corporate Bonds | | 7,478,531 |
| | | | | |
| | | | | |
Municipal Bonds—77.9% | | |
| Alabama—4.4% | | |
| 2,000,000 | | Birmingham Special Care | | |
| | | Facilities Financing Authority | | |
| | | Revenue, Baptist Medical | | |
| | | Centers | | |
| | | 4.350%, 07/01/2006 | | 2,004,300 |
| | | Arizona—1.0% | | |
| 445,000 | | Maricopa County Industrial | | |
| | | Development Authority | | |
| | | Multifamily Revenue, San | | |
| | | Fernando Apartments LP— | | |
| | | Series A (Fannie Mae) | | |
| | | 3.010%, 11/07/2005 (a) (b) | | 445,000 |
| | | | | |
| Arkansas—4.1% | | |
| 100,000 | | Magnolia Industrial | | |
| | | Development Revenue, | | |
| | | American Fuel Cell | | |
| | | (LOC: HSBC Bank USA N.A.) | | |
| | | 3.050%, 11/07/2005 (a) (b) | | 100,000 |
| 1,800,000 | | Searcy Industrial Development | | |
| | | Revenue, Yarnell Ice Cream | | |
| | | Co. (SPA: AmSouth Bank of | | |
| | | Alabama) | | |
| | | 3.700%, 01/01/2010 . | | 1,800,000 |
| | | | | 1,900,000 |
| | | | | |
| California—4.3% | | |
| 1,000,000 | | California Pollution Control | | |
| | | Financing Authority Solid | | |
| | | Waste Disposal Revenue, | | |
| | | Republic Services Inc. | | |
| | | 2.850%, 12/01/2005 . | | 999,340 |
| 1,000,000 | | California Statewide | | |
| | | Communities Development | | |
| | | Authority Solid Waste | | |
| | | Facilities Revenue, Waste | | |
| | | Management Inc. (CS: Waste | | |
| | | Management) | | |
| | | 2.900%, 04/01/2007 (a) (b) | | 987,590 |
| | | | | 1,986,930 |
| | | | | |
| Indiana—4.4% | | |
| 2,000,000 | | Vigo County Industrial | | |
| | | Development Revenue | | |
| | | Republic Services Inc. | | |
| | | 3.050%, 11/07/2005 (a) (b) | | 2,000,000 |
| | | | | |
Principal | | Security | | |
Amount | | Description | | Value |
| | | | | |
Municipal Bonds—continued | | |
| Kentucky—1.7% | | |
| 785,000 | | Shelby County Industrial | | |
| | | Building Revenue, Roll | | |
| | | Forming Corp. | | |
| | | (LOC: Bayerishe) | | |
| | | 3.100%, 11/07/2005 (a)(b) | $ | 785,000 |
| | | | | |
| | | | | |
| Louisiana—9.2% | | |
| 2,000,000 | | Ascension Parish Solid Waste | | |
| | | Disposal, Alliedsignal Inc. | | |
| | | 3.050%, 11/07/2005 (a)(b) | | 2,000,000 |
| 2,200,000 | | Jefferson Parish LA Industrial | | |
| | | Development Board, Sara Lee | | |
| | | Corp. | | |
| | | 3.800%, 11/01/2005 (a)(b) | | 2,200,000 |
| | | | | 4,200,000 |
| | | | | |
| Massachusetts —7.3% | | |
| 1,150,000 | | Massachusetts State Industrial | | |
| | | Finance Agency Revenue, | | |
| | | Asahi/America Inc. | | |
| | | 3.125%, 03/01/2009 (a)(b) | | 1,124,505 |
| 2,200,000 | | Massachusetts State Port | | |
| | | Authority Revenue, Delta Air | | |
| | | Lines | | |
| | | 3.200%, 11/30/2005 (a)(b) | | 2,200,000 |
| | | | | 3,324,505 |
| | | | | |
| Michigan—4.4% | | |
| 1,000,000 | | Michigan Strategic Fund, Dow | | |
| | | Chemical Company | | |
| | | 3.800%, 06/01/2006 (a)(b) | | 1,002,760 |
| 1,000,000 | | Michigan Strategic Fund, Waste | | |
| | | Management Inc. | | |
| | | 3.150%, 02/01/2006 (a)b) | | 999,030 |
| | | | | 2,001,790 |
| | | | | |
| Missouri—3.7% | | |
| 1,700,000 | | St. Charles County Industrial | | |
| | | Development Authority | | |
| | | Revenue, Dev-Craftsmen | | |
| | | Industries | | |
| | | 2.910%, 11/07/2005 (a)(b) | | 1,700,000 |
| | | | | |
| | | | | |
| New Jersey—9.3% | | |
| 1,000,000 | | Bayonne BD Anticipation Notes | | |
| | | 4.500%, 06/29/2006 | | 1,003,350 |
| 1,000,000 | | Bayonne Tax Anticipation Notes, | | |
| | | Series B | | |
| | | 5.000%, 11/15/2005 | | 1,000,470 |
| 500,000 | | Bayonne Tax Anticipation Notes, | | |
| | | Series A | | |
| | | 5.000%, 10/13/2006 | | 504,440 |
| 515,000 | | New Jersey St Educational | | |
| | | Facilities Authority Revenue, | | |
| | | Stevens Institute of | | |
| | | Technology | | |
| | | 4.000%, 07/01/2006 | | 517,086 |
| 1,205,000 | | Tobacco Settlement Finance | | |
| | | Corporation | | |
| | | 5.750%, 06/01/2012 | | 1,251,657 |
| | | | | 4,277,003 |
| | | | | |
See notes to financial statements.
Alpine Mutual Funds - Tax Optimized Income Fund
Schedule of Portfolio Investments—Continued
October 31, 2005
Principal | | Security | | |
Amount | | Description | | Value |
| | | | | |
Municipal Bonds—continued | | |
| New Mexico—2.2% | | |
| 1,000,000 | | Sandoval County Incentive | | |
| | | Payment Revenue | | |
| | | 4.250%, 12/01/2006 | $ | 1,012,080 |
| | | | | |
| | | | | |
| New York—5.9% | | |
| 2,245,000 | | New York Counties TOB Trust | | |
| | | 4.750%, 06/01/2015 | | 2,185,665 |
| 500,000 | | Westchester Tobacco Asset | | |
| | | Securitization Corporation | | |
| | | 5.000%, 06/01/2015 | | 501,110 |
| | | | | 2,686,775 |
| | | | | |
| Ohio—3.9% | | |
| 1,500,000 | | Ohio Water Development | | |
| | | Authority Pollution Control | | |
| | | Facilities Revenue, Ohio Edison | | |
| | | Company | | |
| | | 3.350%, 12/01/2005 (a)(b) | | 1,499,745 |
| 310,000 | | Summit County Industrial | | |
| | | Development Revenue, LKL | | |
| | | Properties Inc. | | |
| | | (LOC: Firstmerit Bank N.A.) | | |
| | | 3.870%, 11/07/2005 (a)(b) | | 310,000 |
| | | | | 1,809,745 |
| | | | | |
| South Carolina—2.2% | | |
| 1,000,000 | | Charleston County Industrial | | |
| | | Revenue, Tandy Corporation | | |
| | | 4.050%, 11/07/2005 (a)(b) | | 1,000,000 |
| | | | | |
| | | | | |
| Texas—6.0% | | |
| 1,200,000 | | Cypress-Fairbanks Independent | | |
| | | School District—Series B | | |
| | | 5.000%, 08/15/2007 (a)(b) | | 1,234,992 |
| | | | | |
Principal | | Security | | |
Amount | | Description | | Value |
| | | | | |
Municipal Bonds—continued | | |
| Texas—continued | | |
| 1,500,000 | | Port Corpus Christi Authority | | |
| | | Nueces County Waste Disposal, | | |
| | | Flint Hills Resources LP | | |
| | | 3.000%, 11/07/2005 (a)(b) | $ | 1,500,000 |
| | | | | 2,734,992 |
Washington—3.9% | | |
| 1,800,000 | | Washington Economic | | |
| | | Development Finance | | |
| | | Authority Revenue, Hillstrom | | |
| | | Ventures LLC | | |
| | | 2.910%, 11/07/2005 (a)(b) | | 1,800,000 |
| | | Total Municipal Bonds | | 35,668,120 |
| | | | | |
| | | | | |
Short-Term Investments—4.8% | | |
| Money Market Funds—0.2% | | |
| 86,009 | | Federated Government | | |
| | | Obligations Fund | | 86,009 |
| | | Variable Rate Demand Notes—4.6% | | |
| | | Puerto Rico GDB | | |
| 1,136,000 | | 3.500%, 01/19/2006 | | 1,136,000 |
| 1,000,000 | | 3.500%, 01/21/2006 | | 1,000,000 |
| | | | | 2,136,000 |
| | | Total Short-Term Investments | | 2,222,009 |
| | | Total Investments | | |
| | | (Cost $45,377,771)—99.0% | | 45,368,660 |
| | | Other Assets, Less | | |
| | | Liabilities—1.0% . | | 435,221 |
| | | TOTAL NET ASSETS—100.0% | $ | 45,803,881 |
| | | | | |
| (a) | Variable Rate Security—The rate reported is the rate in effect as of October 31, 2005. The date shown is the next reset date. |
| (b) | Maturity date represents first available put date. |
CS—Credit Support
LOC—Letter of Credit
SPA—Stand by Purchase Agreement
GDB—Government Development Bank
See notes to financial statements.
Statements of Assets and Liabilities
October 31, 2005
| | | Dynamic Balance Fund | | Dynamic Dividend Fund | |
| | | | | | |
ASSETS: | | | | | |
Investments, at value (1) | | $ | 95,797,034 | | $ | 308,340,809 | |
Dividends receivable | | | 49,993 | | | 843,343 | |
Interest receivable | | | 314,966 | | | 14,418 | |
Receivable for capital shares issued | | | 67,067 | | | 1,116,635 | |
Receivable for investment securities sold | | | 1,490,569 | | | 9,557,245 | |
Prepaid expenses and other assets | | | 7,923 | | | 27,000 | |
Total assets | | | 97,727,552 | | | 319,899,450 | |
| | | | | | | | |
LIABILITIES: | | | | | | | |
Payable for investment securities purchased | | | — | | | 7,553,354 | |
Payable for capital shares redeemed | | | 115,234 | | | 568,400 | |
Accrued expenses and other liabilities: | | | | | | | |
Investment advisory fees | | | 83,365 | | | 261,125 | |
Other | | | 58,291 | | | 175,679 | |
Total liabilities | | | 256,890 | | | 8,558,558 | |
Net Assets | | $ | 97,470,662 | | $ | 311,340,892 | |
| | | | | | | | |
| | | | | | | | |
Net assets represented by | | | | | | | |
Capital Stock | | $ | 84,462,024 | | $ | 323,900,566 | |
Accumulated undistributed net investment income | | | 96,291 | | | 3,463,833 | |
Accumulated net realized gains/(losses) on investments sold and foreign currency related | | | | | | | |
transactions | | | 1,666,848 | | | (5,293,731 | ) |
Net unrealized appreciation/(depreciation) on: | | | | | | | |
investments | | | 11,245,499 | | | (10,722,750 | ) |
Foreign currency translation | | | — | | | (7,026 | ) |
Total Net Assets | | $ | 97,470,662 | | $ | 311,340,892 | |
| | | | | | | | |
| | | | | | | | |
Net asset value | | | | | | | |
Net assets | | $ | 97,470,662 | | $ | 311,340,892 | |
Shares of beneficial interest issued and outstanding | | | 7,693,028 | | | 25,980,128 | |
Net asset value, offering price and redemption price per share | | $ | 12.67 | | $ | 11.98 | |
| (1) Cost of Investments | | $ | 84,551,535 | | $ | 319,063,559 | |
| | | | | | | | |
See notes to financial statements.
Statements of Assets and Liabilities
October 31, 2005
| | | Municipal Money Market Fund | | Tax Optimized Income Fund | |
ASSETS: | | | | | |
Investments, at value for Tax Optimized Income Fund; at amortized cost for | | | | | |
Municipal Money Market Fund (1) | | $ | 205,720,969 | | $ | 45,368,660 | |
Interest receivable | | | 857,134 | | | 462,731 | |
Receivable for capital shares issued | | | 316,269 | | | 100 | |
Receivable for investment securities sold | | | 2,305,405 | | | — | |
Prepaid expenses and other assets | | | 72,881 | | | 20,248 | |
Total assets | | | 209,272,658 | | | 45,851,739 | |
| | | | | | | | |
| | | | | | | | |
LIABILITIES: | | | | | | | |
Payable for investment securities purchased | | | 3,000,167 | | | — | |
Payable for capital shares redeemed | | | 683,564 | | | 270 | |
Accrued expenses and other liabilities: | | | | | | | |
Investment advisory fees | | | 93,477 | | | 29,247 | |
Distribution fees | | | 596 | | | 167 | |
Payable to custodian | | | 6,795 | | | 1,153 | |
Other | | | 182,778 | | | 17,021 | |
Total liabilities | | | 3,967,377 | | | 47,858 | |
Net Assets | | $ | 205,305,281 | | $ | 45,803,881 | |
| | | | | | | | |
| | | | | | | | |
Net assets represented by | | | | | | | |
Capital Stock | | $ | 205,305,693 | | $ | 45,796,449 | |
Accumulated undistributed net investment income | | | — | | | 5,475 | |
Accumulated net realized gains from investments sold | | | (412 | ) | | 11,068 | |
Net unrealized (depreciation) on investments | | | — | | | (9,111 | ) |
Total Net Assets | | $ | 205,305,281 | | $ | 45,803,881 | |
| | | | | | | | |
| | | | | | | | |
Net asset value | | | | | | | |
Adviser Class Shares | | | | | | | |
Net assets | | $ | 616,521 | | $ | 112,454 | |
Shares of beneficial interest issued and outstanding | | | 616,595 | | | 11,209 | |
Net asset value, offering price and redemption price per share | | $ | 1.00 | | $ | 10.03 | |
Investor Class Shares | | | | | | | |
Net assets | | $ | 204,688,760 | | $ | 45,691,427 | |
Shares of beneficial interest issued and outstanding | | | 204,713,442 | | | 4,554,331 | |
Net asset value, offering price and redemption price per share | | $ | 1.00 | | $ | 10.03 | |
| (1) Cost of Investments | | $ | 205,720,969 | | $ | 45,377,771 | |
| | | | | | | | |
See notes to financial statements.
Statements of Operations
Year Ended October 31, 2005
| | | Dynamic Balance Fund | | Dynamic Dividend Fund | |
INVESTMENT INCOME: | | | | | |
Interest income | | $ | 939,444 | | $ | 270,068 | |
Dividend income* | | | 1,651,000 | | | 32,201,543 | |
Total investment income | | | 2,590,444 | | | 32,471,611 | |
| | | | | | | | |
| | | | | | | | |
EXPENSES: | | | | | | | |
Investment advisory fees | | | 889,124 | | | 2,102,039 | |
Administration fees | | | 38,856 | | | 89,241 | |
Fund accounting fees | | | 22,993 | | | 51,691 | |
Audit and tax fees | | | 19,395 | | | 21,976 | |
Custodian fees | | | 8,826 | | | 20,420 | |
Interest expense | | | 54 | | | — | |
Legal fees | | | 1,624 | | | 4,083 | |
Registration and filing fees | | | 26,501 | | | 77,445 | |
Printing fees | | | 15,268 | | | 47,760 | |
Transfer agent fees | | | 39,372 | | | 90,116 | |
Trustee fees | | | 3,732 | | | 3,632 | |
Other fees | | | 6,266 | | | 5,052 | |
| Total expenses before expense recovery by Adviser | | | 1,072,011 | | | 2,513,455 | |
Expense recovery by Adviser. | | | 91,794 | | | 76,518 | |
Net expenses | | | 1,163,805 | | | 2,589,973 | |
| Net investment income | | | 1,426,639 | | | 29,881,638 | |
| | | | | | | | |
| | | | | | | | |
REALIZED/UNREALIZED GAIN (LOSS) ON INVESTMENTS: | | | | | | | |
Net realized gain/(loss) on: | | | | | | | |
Investment transactions | | | 1,579,292 | | | (5,293,810 | ) |
Foreign currency translation | | | — | | | (285,088 | ) |
Net realized gain (loss) | | | 1,579,292 | | | (5,578,898 | ) |
Change in unrealized appreciation/(depreciation) on investments | | | | | | | |
Investments | | | 2,912,439 | | | (12,570,661 | ) |
Foreign currency translation | | | — | | | (6,945 | ) |
Net change in unrealized appreciation/(depreciation) | | | 2,912,439 | | | (12,577,606 | ) |
| Net realized/unrealized gain (loss) on investments | | | 4,491,731 | | | (18,156,504 | ) |
| Change in net assets resulting from operations | | $ | 5,918,370 | | $ | 11,725,134 | |
| | | | | | | | |
| * Net of foreign taxes withheld | | $ | — | | $ | 1,600,723 | |
| | | | | | | | |
See notes to financial statements.
Statements of Operations
Year Ended October 31, 2005
| | | Municipal Money Market Fund | | Tax Optimized Income Fund | |
| | | | | | |
INVESTMENT INCOME: | | | | | |
Interest income | | $ | 5,800,749 | | $ | 1,751,436 | |
Total investment income | | | 5,800,749 | | | 1,751,436 | |
| | | | | | | | |
EXPENSES: | | | | | | | |
Investment advisory fees | | | 1,029,823 | | | 366,768 | |
Administration fees | | | 23,143 | | | 5,029 | |
Distribution fees—Adviser Class | | | 569 | | | 167 | |
Fund accounting fees | | | 23,143 | | | 5,054 | |
Audit and tax fees | | | 15,176 | | | 15,450 | |
Custodian fees | | | 23,140 | | | 5,050 | |
Interest expense | | | 249 | | | 166 | |
Legal fees | | | 3,995 | | | 963 | |
Registration and filing fees | | | 54,662 | | | 28,293 | |
Printing fees | | | 3,881 | | | 946 | |
Transfer agent fees | | | 23,118 | | | 5,072 | |
Trustee fees | | | 3,924 | | | 3,782 | |
Other fees | | | 7,575 | | | 5,240 | |
| Total expenses before expense reimbursement by Adviser | | | 1,212,398 | | | 441,980 | |
Less: Reimbursement by Adviser | | | (574,245 | ) | | (148,232 | ) |
Net expenses | | | 638,153 | | | 293,748 | |
| Net investment income | | | 5,162,596 | | | 1,457,688 | |
| | | | | | | | |
REALIZED/UNREALIZED GAIN (LOSS) ON INVESTMENTS: | | | | | | | |
Net realized gain on investments | | | 2,815 | | | 46,520 | |
Change in unrealized appreciation (depreciation) on investments | | | — | | | (616,587 | ) |
| Net realized/unrealized loss on investments | | | 2,815 | | | (570,067 | ) |
| Change in net assets resulting from operations | | $ | 5,165,411 | | $ | 887,621 | |
| | | | | | | | |
See notes to financial statements.
Statements of Changes in Net Assets
| | | Dynamic Balance Fund | |
| | | Year Ended October 31, 2005 | | Year Ended October 31, 2004 | |
OPERATIONS: | | | | | |
Net investment income | | $ | 1,426,639 | | $ | 1,066,776 | |
Net realized gain on investments | | | 1,579,292 | | | 3,750,643 | |
Change in unrealized appreciation on investments | | | 2,912,439 | | | 3,043,286 | |
Change in net assets resulting from operations | | | 5,918,370 | | | 7,860,705 | |
| | | | | | | | |
| | | | | | | | |
DISTRIBUTIONS TO SHAREHOLDERS: | | | | | | | |
Distributions to Shareholders: | | | | | | | |
From net investment income | | | (1,322,306 | ) | | (1,016,661 | ) |
From net realized gain on investment | | | (3,659,345 | ) | | — | |
Change in net assets resulting from distributions to shareholders | | | (4,981,651 | ) | | (1,016,661 | ) |
| | | | | | | | |
| | | | | | | | |
CAPITAL SHARE TRANSACTIONS: | | | | | | | |
Proceeds from shares sold | | | 30,307,445 | | | 10,731,576 | |
Dividends reinvested | | | 4,421,872 | | | 898,869 | |
Cost of shares redeemed | | | (8,900,384 | ) | | (1,525,813 | ) |
Change in net assets from capital share transactions | | | 25,828,933 | | | 10,104,632 | |
Total change in net assets | | | 26,765,652 | | | 16,948,676 | |
| | | | | | | | |
| | | | | | | | |
NET ASSETS: | | | | | | | |
Beginning of period | | | 70,705,010 | | | 53,756,334 | |
End of period* | | $ | 97,470,662 | | $ | 70,705,010 | |
| | | | | | | | |
| | | | | | | | |
| * Including undistributed net investment income of | | $ | 96,291 | | $ | 79,511 | |
| | | | | | | | |
See notes to financial statements.
Statements of Changes in Net Assets
| | | Dynamic Dividend Fund | |
| | | Year Ended | | Year Ended | |
| | | | | | |
OPERATIONS: | | | | | |
Net investment income | | $ | 29,881,638 | | $ | 2,468,054 | |
Net realized gain (loss) on: | | | | | | | |
Long transactions | | | (5,293,810 | ) | | 1,483,063 | |
Foreign currency translation | | | (285,088 | ) | | (6,398 | ) |
Change in unrealized appreciation/(depreciation) on: | | | | | | | |
Investments | | | (12,570,661 | ) | | 1,067,523 | |
Foreign currency translation | | | (6,945 | ) | | (81 | ) |
| Change in net assets resulting from operations | | | 11,725,134 | | | 5,012,161 | |
| | | | | | | | |
DISTRIBUTIONS TO SHAREHOLDERS: | | | | | | | |
Distributions to Shareholders: | | | | | | | |
From net investment income. | | | (26,364,397 | ) | | (2,259,008 | ) |
From net realized gain on investment | | | (1,494,879 | ) | | — | |
Change in net assets resulting from distributions to shareholders | | | (27,859,276 | ) | | (2,259,008 | ) |
| | | | | | | | |
CAPITAL SHARE TRANSACTIONS: | | | | | | | |
Proceeds from shares sold | | | 328,736,945 | | | 29,533,128 | |
Dividends reinvested | | | 22,881,710 | | | 1,883,922 | |
Redemption fees | | | 80,834 | | | 7,373 | |
Cost of shares redeemed | | | (67,754,875 | ) | | (4,174,516 | ) |
Change in net assets from capital share transactions | | | 283,944,614 | | | 27,249,907 | |
Total change in net assets | | | 267,810,472 | | | 30,003,060 | |
| | | | | | | | |
NET ASSETS: | | | | | | | |
Beginning of period | | | 43,530,420 | | | 13,527,360 | |
End of period* | | $ | 311,340,892 | | $ | 43,530,420 | |
| | | | | | | | |
| * Including undistributed net investment income of: | | $ | 3,463,833 | | $ | 259,626 | |
| | | | | | | | |
See notes to financial statements.
Statements of Changes in Net Assets
| | | Municipal Money Market Fund | |
| | | Year Ended October 31, 2005 | | Year Ended October 31, 2004 | |
| | | | | | |
OPERATIONS: | | | | | |
Net investment income | | $ | 5,162,596 | | $ | 963,350 | |
Net realized gain on investments | | | 2,815 | | | — | |
Change in unrealized appreciation/depreciation on investments | | | — | | | — | |
Change in net assets resulting from operations | | | 5,165,411 | | | 963,350 | |
| | | | | | | | |
DISTRIBUTIONS TO SHAREHOLDERS: | | | | | | | |
Distributions to Adviser Class Shareholders: | | | | | | | |
From net investment income | | | (4,859 | ) | | (115 | ) |
Distributions to Investor Class Shareholders: | | | | | | | |
From net investment income | | | (5,185,308 | ) | | (963,235 | ) |
Change in net assets resulting from distributions to shareholders | | | (5,190,167 | ) | | (963,350 | ) |
| | | | | | | | |
CAPITAL SHARE TRANSACTIONS: | | | | | | | |
Proceeds from shares sold | | | 459,390,771 | | | 166,115,193 | |
Dividends reinvested | | | 2,955,883 | | | 866,133 | |
Cost of shares redeemed | | | (387,244,093 | ) | | (95,880,229 | ) |
Change in net assets from capital share transactions | | | 75,102,561 | | | 71,101,097 | |
Total change in net assets | | | 75,077,805 | | | 71,101,097 | |
| | | | | | | | |
NET ASSETS: | | | | | | | |
Beginning of period | | | 130,227,476 | | | 59,126,379 | |
End of period* | | $ | 205,305,281 | | $ | 130,227,476 | |
| | | | | | | | |
| * Including undistributed net investment income of | | $ | — | | $ | 2,815 | |
| | | | | | | | |
See notes to financial statements.
Statements of Changes in Net Assets
| | | Tax Optimized Income Fund | |
| | | Year Ended October 31, 2005 | | Year Ended October 31, 2004 | |
OPERATIONS: | | | | | |
Net investment income | | $ | 1,457,688 | | $ | 1,409,745 | |
Net realized gain/(loss) on investments | | | 46,520 | | | (35,452 | ) |
Change in unrealized/(depreciation) on investments | | | (616,587 | ) | | (60,107 | ) |
Change in net assets resulting from operations | | | 887,621 | | | 1,314,186 | |
| | | | | | | | |
DISTRIBUTIONS TO SHAREHOLDERS: | | | | | | | |
Distributions to Adviser Class Shareholders: | | | | | | | |
From net investment income | | | (1,966 | ) | | (197 | ) |
Distributions to Investor Class Shareholders: | | | | | | | |
From net investment income | | | (1,461,892 | ) | | (1,397,873 | ) |
From net realized gain on investments | | | — | | | (31,474 | ) |
| Change in net assets resulting from distributions to shareholders | | | (1,463,858 | ) | | (1,429,544 | ) |
| | | | | | | | |
SHARES OF CAPITAL SHARE TRANSACTIONS; | | | | | | | |
Proceeds from shares sold | | | 1,774,244 | | | 9,292,083 | |
Dividends reinvested | | | 1,450,040 | | | 1,412,683 | |
Redemption fees | | | 274 | | | — | |
Cost of shares redeemed | | | (8,168,307 | ) | | (14,856,164 | ) |
Change in net assets from capital share transactions | | | (4,943,749 | ) | | (4,151,398 | ) |
Total change in net assets | | | (5,519,986 | ) | | (4,266,756 | ) |
| | | | | | | | |
NET ASSETS: | | | | | | | |
Beginning of period | | | 51,323,867 | | | 55,590,623 | |
End of period* | | $ | 45,803,881 | | $ | 51,323,867 | |
| | | | | | | | |
| * Including undistributed net investment income of | | $ | 5,475 | | $ | 11,645 | |
| | | | | | | | |
| | | | | | | | |
| | | | | | | | |
| (1) | Commencement of Operations |
See notes to financial statements.
Alpine Mutual Funds - Dynamic Balance Fund
Financial Highlights
(For a share outstanding throughout each period)
| | | Year October 31, Ended | | Period Ended October 31, | |
| | | 2005 | | 2004 | | 2003 | | 2002 | | 2001 (a) | |
| | | | | | | | | | | | |
Per Share Data: | | | | | | | | | | | |
Net asset value per share, beginning of period | | $ | 12.44 | | $ | 11.08 | | $ | 9.17 | | $ | 10.10 | | $ | 10.00 | |
Income from investment operations: | | | | | | | | | | | | | | | | |
Net investment income | | | 0.19 | | | 0.19 | | | 0.22 | | | 0.24 | | | 0.09 | |
Net realized/unrealized gains/(losses) on investments | | | 0.85 | | | 1.37 | | | 1.91 | | | (0.91 | ) | | 0.07 | |
Total from investment operations | | | 1.04 | | | 1.56 | | | 2.13 | | | (0.67 | ) | | 0.16 | |
Less Distributions: | | | | | | | | | | | | | | | | |
Dividends from net investment income | | | (0.19 | ) | | (0.20 | ) | | (0.22 | ) | | (0.25 | ) | | (0.06 | ) |
Net realized gains on investments | | | (0.62 | ) | | — | | | — | | | (0.01 | ) | | — | |
Total distributions | | | (0.81 | ) | | (0.20 | ) | | (0.22 | ) | | (0.26 | ) | | (0.06 | ) |
Net asset value per share, end of period | | $ | 12.67 | | $ | 12.44 | | $ | 11.08 | | $ | 9.17 | | $ | 10.10 | |
| | | | | | | | | | | | | | | | | |
Total return | | | 8.46 | % | | 14.19 | % | | 23.50 | % | | -6.82 | % | | 1.64%(b | ) |
Ratios/Supplemental Data: | | | | | | | | | | | | | | | | |
Net Assets at end of period (000) | | $ | 97,471 | | $ | 70,705 | | $ | 53,756 | | $ | 43,027 | | $ | 38,203 | |
Ratio of expenses to average net assets: | | | | | | | | | | | | | | | | |
Before waivers, reimbursements, and recoveries | | | 1.21 | % | | 1.27 | % | | 1.51 | % | | 1.50 | % | | 1.40%(c | ) |
After waivers, reimbursements, and recoveries | | | 1.31 | % | | 1.35 | % | | 1.35 | % | | 1.35 | % | | 1.35%(c | ) |
Ratio of net investment income to average net assets | | | 1.60 | % | | 1.78 | % | | 2.26 | % | | 2.45 | % | | 2.55%(c | ) |
Portfolio turnover | | | 36 | % | | 56 | % | | 39 | % | | 42 | % | | 9 | % |
| (a) | For the Period from June 7, 2001 (inception of fund) to October 31, 2001. |
See notes to financial statements.
Alpine Mutual Funds - Dynamic Dividend Fund
Financial Highlights
(For a share outstanding throughout each period)
| | | Year Ended October 31, | | Period Ended October 31, | |
| | | 2005 | | 2004 | | 2003 (a) | |
| | | | | | | | |
Per Share Data: | | | | | | | |
Net asset value per share, beginning of period | | $ | 12.34 | | $ | 10.69 | | $ | 10.00 | |
Income from investment operations: | | | | | | | | | | |
Net investment income | | | 1.57 | | | 1.09(b | ) | | 0.06 | |
Net realized/unrealized gains/(losses) on investments | | | (0.14 | ) | | 1.51 | | | 0.63 | |
Total from investment operations | | | 1.43 | | | 2.60 | | | 0.69 | |
Less Distributions: | | | | | | | | | | |
Dividends from net investment income | | | (1.51 | ) | | (0.95 | ) | | — | |
Net realized gains on investments | | | (0.28 | ) | | — | | | — | |
Total distributions | | | (1.79 | ) | | (0.95 | ) | | — | |
Net asset value per share, end of period | | $ | 11.98 | | $ | 12.34 | | $ | 10.69 | |
| | | | | | | | | | | |
Total return | | | 11.85 | % | | 24.90 | % | | 6.90%(c | ) |
Ratios/Supplemental Data: | | | | | | | | | | |
Net Assets at end of period (000) | | $ | 311,335 | | $ | 43,530 | | $ | 13,527 | |
Ratio of expenses to average net assets: | | | | | | | | | | |
Before waivers, reimbursements, and recoveries | | | 1.20 | % | | 1.56 | % | | 3.11%(d | ) |
After waivers, reimbursements, and recoveries | | | 1.23 | % | | 1.35 | % | | 1.35%(d | ) |
Ratio of net investment income to average net assets | | | 14.22 | % | | 9.08 | % | | 5.69%(d | ) |
Portfolio turnover | | | 216 | % | | 194 | % | | 9 | % |
(a) For the period from September 22, 2003 (inception of fund) to October 31, 2003.
(b) Net investment income is calculated using average shares outstanding during the period.
(c) Not Annualized.
(d) Annualized.
See notes to financial statements.
Alpine Mutual Funds - Municipal Money Market Fund
Financial Highlights
(For a share outstanding throughout each period)
| | | Year Ended October 31, | | Period Ended October 31, | |
| | | | | | | | |
| | | 2005 | | 2004 | | 2003 (a) | |
| | | | | | | | |
Investor Class Shares: | | | | | | | |
| | | | | | | | |
Net asset value per share, beginningof period | | $ | 1.00 | | $ | 1.00 | | $ | 1.00 | |
| | | | | | | | | | | |
Income from investment operations: | | | | | | | | | | |
Net investment income. | | | 0.02 | | | 0.01 | | | 0.01 | |
Net realized/unrealized gains on investments | | | — | | | — | | | — | |
Total from investment operations. | | | 0.02 | | | 0.01 | | | 0.01 | |
| | | | | | | | | | | |
Less Distributions: | | | | | | | | | | |
Dividends from net investment income | | | (0.02 | ) | | (0.01 | ) | | (0.01 | ) |
Net realized gains on investments | | | — | | | — | | | — | |
Total distributions | | | (0.02 | ) | | (0.01 | ) | | (0.01 | ) |
| | | | | | | | | | | |
Net asset value per share, end of period | | $ | 1.00 | | $ | 1.00 | | $ | 1.00 | |
| | | | | | | | | | | |
Total return | | | 2.24 | % | | 1.09 | % | | 1.00%(b | ) |
| | | | | | | | | | | |
Ratios/Supplemental Data: | | | | | | | | | | |
Net Assets at end of period (000) | | $ | 204,689 | | $ | 130,147 | | $ | 59,126 | |
Ratio of expenses to average net assets: | | | | | | | | | | |
Before waivers and reimbursements. | | | 0.53 | % | | 0.70 | % | | 0.73%(c | ) |
After waivers and reimbursements | | | 0.27 | % | | 0.34 | % | | 0.32%(c | ) |
Ratio of net investment income to average net assets | | | 2.26 | % | | 1.10 | % | | 1.09%(c | ) |
| (a) | For the period from December 5, 2002 (inception of fund) to October 31, 2003. |
See notes to financial statements.
Alpine Mutual Funds - Municipal Money Market Fund
Financial Highlights
(For a share outstanding throughout each period)
| | | Year Ended October 31, 2005 | | Year Ended October 31, 2004 (a) | |
| | | | | | |
Advisor Class Shares: | | | | | |
| | | | | | |
Net asset value per share, beginning of period | | $ | 1.00 | | $ | 1.00 | |
| | | | | | | | |
Income from investment operations: | | | | | | | |
Net investment income | | | 0.02 | | | 0.01 | |
Net realized/unrealized gains on investments | | | — | | | — | |
Total from investment operations | | | 0.02 | | | 0.01 | |
| | | | | | | | |
Less Distributions: | | | | | | | |
Dividends from net investment income | | | (0.02 | ) | | (0.01 | ) |
Net realized gains on investments | | | — | | | — | |
Total distributions | | | (0.02 | ) | | (0.01 | ) |
| | | | | | | | |
Net asset value per share, end of period | | $ | 1.00 | | $ | 1.00 | |
| | | | | | | | |
Total return | | | 1.98 | % | | 0.89%(b | ) |
Ratios/Supplemental Data: | | | | | | | |
Net Assets at end of period | | $ | 616,521 | | $ | 80,114 | |
Ratio of expenses to average net assets: | | | | | | | |
Before waivers and reimbursements | | | 0.78 | % | | 0.93%(c | ) |
After waivers and reimbursements . | | | 0.53 | % | | 0.59%(c | ) |
Ratio of net investment income to average net assets | | | 2.01 | % | | 0.90%(c | ) |
| | | | | | | | |
| (a) | For the period from March 30, 2004 (inception of fund) to October 31, 2004. |
See notes to financial statements.
Alpine Mutual Funds - Tax Optimized Income Fund
Financial Highlights
(For a share outstanding throughout each period)
| | | Year Ended October 31, 2005 | | Year Ended October 31, 2004 (a) | |
| | | | | | |
Adviser Class Shares: | | | | | |
| | | | | | |
Net asset value per share, beginning of period | | $ | 10.15 | | $ | 10.26 | |
| | | | | | | | |
Income from investment operations: | | | | | | | |
Net investment income | | | 0.28 | | | 0.16 (b | ) |
Net realized/unrealized gains/(losses) on investments | | | (0.12 | ) | | (0.11 | ) |
Total from investment operations | | | 0.16 | | | 0.05 | |
| | | | | | | | |
Less Distributions: | | | | | | | |
Dividends from net investment income | | | (0.28 | ) | | (0.16 | ) |
Net realized gains on investments | | | — | | | — | |
Total distributions | | | (0.28 | ) | | (0.16 | ) |
Net asset value per share, end of period | | $ | 10.03 | | $ | 10.15 | |
| | | | | | | | |
Total return | | | 1.60 | % | | 0.55%(c | ) |
Ratios/Supplemental Data: | | | | | | | |
Net Assets at end of period | | $ | 112,454 | | $ | 22,159 | |
Ratio of expenses to average net assets: | | | | | | | |
Before waivers and reimbursements | | | 1.15 | % | | 1.25%(d | ) |
After waivers and reimbursements . | | | 0.85 | % | | 0.85%(d | ) |
Ratio of net investment income to average net assets | | | 2.73 | % | | 2.41%(d | ) |
Portfolio turnover | | | 97 | % | | 55%(e | ) |
| | | | | | | | |
| (a) | For the period from March 30, 2004 (inception of fund) to October 31, 2004. |
| (b) | Net investment income per share is calculated using ending balances prior to consideration of adjustment for permanent book and tax differences. |
| (e) | Portfolio turnover is calculated on the basis of the Fund as a whole, without distinguishing between classes of shares issued. |
See notes to financial statements.
Alpine Mutual Funds - Tax Optimized Income Fund
Financial Highlights
(For a share outstanding throughout each period)
| | | Year Ended October 31, 2005 | | Year Ended October 31, 2004 | | Year Ended October 31, 2003 (a) | |
| | | | | | | | |
Investor Class Shares: | | | | | | | |
| | | | | | | | |
Net asset value per share, beginning of Period | | $ | 10.15 | | $ | 10.18 | | $ | 10.00 | |
| | | | | | | | | | | |
Income from investment operations: | | | | | | | | | | |
Net investment income | | | 0.30 | | | 0.27 | | | 0.23 | |
Net realized/unrealized gains/(losses) on investments | | | (0.12 | ) | | (0.02 | ) | | 0.18 | |
Total from investment operations | | | 0.18 | | | 0.25 | | | 0.41 | |
| | | | | | | | | | | |
Less Distributions: | | | | | | | | | | |
Dividends from net investment income | | | (0.30 | ) | | (0.27 | ) | | (0.23 | ) |
Net realized gains on investments | | | — | | | (0.01 | ) | | — (d | ) |
Total distributions | | | (0.30 | ) | | (0.28 | ) | | (0.23 | ) |
Net asset value per share, end of period | | $ | 10.03 | | $ | 10.15 | | $ | 10.18 | |
| | | | | | | | | | | |
Total return | | | 1.84 | % | | 2.42 | % | | 4.12%(b | ) |
Ratios/Supplemental Data: | | | | | | | | | | |
Net Assets at end of period (000) | | $ | 45,691 | | $ | 51,302 | | $ | 55,591 | |
Ratio of expenses to average net assets: | | | | | | | | | | |
Before waivers and reimbursements | | | 0.90 | % | | 1.04 | % | | 1.02%(c | ) |
After waivers and reimbursements | | | 0.60 | % | | 0.60 | % | | 0.60%(c | ) |
Ratio of net investment income to average net assets | | | 2.98 | % | | 2.62 | % | | 2.48%(c | ) |
Portfolio Turnover(e) | | | 97 | % | | 55 | % | | 46 | % |
| | | | | | | | | | | |
| (a) | For the period from December 6, 2002 (inception of fund) to October 31, 2003. |
| (d) | Amount is less than $.0005. |
| (e) | Portfolio turnover is calculated on the basis of the Fund as a whole, without distinguishing between classes of shares issued. |
See notes to financial statements.
Notes to Financial Statements
October 31, 2005
Alpine Series Trust (the “Series Trust’’) was organized in 2001 as a Delaware Business Trust, and is registered under the Investment Company Act of 1940 , as amended (the “1940 Act’’), as an open-ended management investment company. Alpine Income Trust (the “Income Trust’’) was organized in 2002 as a Delaware Business Trust, and is registered under the 1940 Act, as open-ended management investment company. Alpine Dynamic Balance Fund and Alpine Dynamic Dividend Fund are two separate funds of the Series Trust and Alpine Municipal Money Market Fund and Alpine Tax Optimized Income Fund are two separate funds of the Income Trust. Alpine Dynamic Balance Fund, Alpine Dynamic Dividend Fund, Alpine Municipal Money Market Fund, and Alpine Tax Optimized Income Fund (individually referred to as a “Fund’’ and collectively, “the Funds’’) are diversified funds. Alpine Management & Research, LLC (the “Adviser’’) is a Delaware Corporation and serves as investment manager to the Funds. Effective March 30, 2004, the Alpine Municipal Money Market Fund and the Alpine Tax Optimized Income Fund began to offer both Investor Class and Adviser Class shares.
2. | Significant Accounting Policies: |
The following is a summary of significant accounting policies consistently followed by the Funds in the preparation of their financial statements. The policies are in conformity with accounting principles generally accepted in the United States of America (“GAAP’’), which require management to make estimates and assumptions that affect amounts reported herein. Actual results could differ from those estimates.
A. Valuation of Securities:
The Dynamic Balance, Dynamic Dividend, and Tax Optimized Income Funds value securities for which the primary market is on a domestic or foreign exchange and over-the-counter admitted to trading on the National Association of Securities Dealers Automated Quotation Market System (“NASDAQ’’) National List at the last quoted sale price at the end of each business day or, if no sale, at the mean of the closing bid and asked prices. Over-the-counter securities not included in the NASDAQ National List for which market quotations are readily available are valued at a price quoted by one or more brokers. Securities for which market quotations are not readily available or whose values have been materially affected by events occurring before the close of U.S. markets but after the close of the securities’ primary markets, are valued at fair value as determined in good faith according to procedures approved by the Board of Trustees. The valuation of certain debt securities for which market quotations are not readily available may be based upon current market prices of securities which are comparable in coupon, rating, and maturity or an appropriate matrix utilizing similar factors.
The Municipal Money Market Fund values its investments at amortized cost, which approximates market value. Pursuant to Rule 2a-7 of the Investment Company Act of 1940, amortized cost, as defined, is a method of valuing securities at acquisition cost, adjusted for amortization of premium or accretion of discount rather than at their value based on current market factors.
B. Security Transactions and Investment Income:
Securities transactions are recorded on the date a security is purchased or sold (i.e. on the trade date). Realized gains and losses are computed on the identified cost basis. Interest income is recorded on the accrual basis and includes accretion of discounts and amortization of premiums, where applicable. Dividend income is recorded on the ex-dividend date or in the case of some foreign securities, on the date thereafter when the Funds are made aware of the dividend. Foreign income may be subject to foreign withholding taxes, which are accrued as applicable. Capital gains realized on some foreign securities are subject to foreign taxes, which are accrued as applicable.
C. Short Sale Transactions:
The Dynamic Balance Fund and the Dynamic Dividend Fund are authorized to engage in short selling. Short sales are transactions in which a fund sells a security it does not own in anticipation of a decline in the market value of that security. To complete such a transaction, a fund must borrow the security to deliver to the buyer when affecting a short sale. The fund is then obligated to replace the security borrowed by purchasing it in the open market at some later date.
Alpine Mutual Funds
Notes to Financial Statements—Continued
October 31, 2005
When a fund sells a security short, an amount equal to the sales proceeds is included in the Statements of Assets and Liabilities as an asset and an equal amount as a liability. The amount of the liability is subsequently marked-to-market to reflect the current value of the short position. A fund will incur a loss, which could be substantial and potentially unlimited, if the market price of the security increases between the date of the short sale and the date on which the fund replaces the borrowed security. A fund will realize a gain if the security declines in value between those dates. A fund is also at risk of incurring dividend expense if the issuer of the security that has been sold short declares a dividend. A fund must pay the dividend to the lender of the security.
All short sales must be fully collateralized. Accordingly, the funds maintain collateral in a segregated account with their custodian, consisting of cash and/or liquid securities sufficient to collateralize their obligations on short positions.
D. Interest Expense:
The Funds are charged by U.S. Bank, N.A. for all cash overdrafts at the bank’s prime lending rate. The average prime lending rate was 5.92% for the year ended October 31, 2005. The Dynamic Balance Fund, Municipal Money Market Fund, and the Tax Optimized Fund incurred interest expense totaling $54, $249, and $167, respectively for the year ended October 31, 2005. Cash overdrafts at the balance sheet date are reported as payable to custodian.
E. Income Taxes:
It is each Fund’s policy to comply with the requirements of Subchapter M of the Internal Revenue Code applicable to regulated investment companies and to distribute timely, all of its investment company taxable income and net realized capital gains to shareholders. Therefore, no federal income tax provision is recorded.
Under applicable foreign tax laws, a withholding tax may be imposed on interest, dividends, and capital gains earned on foreign investments. Where available, the Funds will file for claims on foreign taxes withheld.
F. Dividends and Distributions:
The Dynamic Balance Fund, the Dynamic Dividend Fund, and the Tax Optimized Income Fund intend to distribute substantially all of their net investment income and net realized capital gains, if any, throughout the year to their shareholders in the form of dividends. The Municipal Money Market Fund declares and accrues dividends daily on each business day based upon the Fund’s net income, and pays dividends monthly. Distributions to shareholders are recorded at the close of business on the ex-dividend date. All dividends are automatically reinvested in full and fractional shares of a Fund at net asset value per share, unless otherwise requested.
The amounts of dividends from net investment income and of distributions from net realized gains are determined in accordance with federal income tax regulations, which may differ from GAAP. These differences are either considered temporary or permanent in nature. To the extent these differences are permanent in nature, such amounts are reclassified within the composition of net assets based on their federal tax-basis treatment.
G. Class Allocations:
Income, expenses (other than class specific expenses) and realized and unrealized gains and losses of the Tax Optimized Income Fund and Municipal Money Market Fund are allocated among the classes of each respective Fund based on the relative net assets of each class. Class specific expenses are allocated to the class to which they relate. Currently, class specific expenses are limited to those incurred under the Distribution Plan for Adviser Class shares.
H. Foreign Translation Transactions:
The Dynamic Balance and Dynamic Dividend Funds may invest up to 15% and 25%, respectively, of the value of their total assets in foreign securities. The books and records of the Funds are maintained in U.S. dollars.
Alpine Mutual Funds
Notes to Financial Statements—Continued
October 31, 2005
Non-U.S. denominated amounts are translated into U.S. dollars as follows, with the resultant translation gains and losses recorded in the Statements of Operations:
| | i) | market value of investment and other assets and liabilities at the exchange rate on the valuation date, |
| | ii) | purchases and sales of investment securities, income and expenses at the exchange rate prevailing on the respective date of such transactions. |
Dividends and interest from non-U.S. sources received by the Funds are generally subject to non-U.S. withholding taxes at rates ranging up to 30%. Such withholding taxes may be reduced or eliminated under the terms of applicable U.S. income tax treaties, and the Funds intend to undertake any procedural steps required to claim the benefits of such treaties.
I. Risk Associated With Foreign Securities and Currencies:
Investments in securities of foreign issuers carry certain risks not ordinarily associated with investments in securities of domestic issuers. Such risks include future political and economic developments and the possible imposition of exchange controls or other foreign governmental laws and restrictions. In addition, with respect to certain countries, there is a possibility of expropriation of assets, confiscatory taxation, political or social instability or diplomatic developments, which could adversely affect investments in those countries.
Certain countries may also impose substantial restrictions on investments in their capital markets by foreign entities, including restrictions on investments in issuers or industries deemed sensitive to relevant national interests. These factors may limit the investment opportunities available to the Funds or result in a lack of liquidity and high price volatility with respect to securities of issuers from developing countries.
3. | Capital Share Transactions |
The Funds have an unlimited number of shares of beneficial interest, with $0.0001 par value, authorized. Transactions in shares and dollars of the Funds were as follows:
Dynamic Balance Fund
| | Year Ended October 31, 2005 | | Year Ended October 31, 2004 |
| | Shares | | Amount | | Shares | | Amount |
| | | | | | | | |
Shares sold | 2,357,599 | $ | 30,307,445 | | 880,345 | $ | 10,731,576 |
Shares issued in reinvestment of dividends | 347,482 | | 4,421,872 | | 74,954 | | 898,869 |
Shares redeemed | (695,107) | | (8,900,384) | | (125,979) | | (1,525,813) |
Net change | 2,009,974 | $ | 25,828,933 | | 829,320 | $ | 10,104,632 |
| | | | | | | | |
Dynamic Dividend Fund
| | Year Ended October 31, 2005 | | Year Ended October 31, 2004 |
| | Shares | | Amount | | Shares | | Amount |
| | | | | | | | |
Shares sold | 26,088,374 | $ | 328,736,945 | | 2,450,382 | $ | 29,533,128 |
Shares issued in reinvestment of dividends | 1,851,414 | | 22,881,710 | | 156,598 | | 1,883,922 |
Redemption fees . | — | | 80,834 | | — | | 7,373 |
Shares redeemed | (5,487,954) | | (67,754,875) | | (344,339) | | (4,174,516) |
| Total net change. | 22,451,834 | $ | 283,944,614 | | 2,262,641 | $ | 27,249,907 |
| | | | | | | | |
Notes to Financial Statements—Continued
October 31, 2005
Municipal Money Market Fund
| | Year Ended October 31, 2005 | | Year Ended October 31, 2004 |
| | Shares | | Amount | | Shares | | Amount |
| | | | | | | | |
Investor Class | | | | | | | |
Shares sold | 458,637,794 | $ | 458,637,794 | | 166,030,693 | $ | 166,030,693 |
Shares issued in reinvestment of | | | | | | | |
dividends | 2,951,047 | | 2,951,047 | | 866,018 | | 866,018 |
Shares redeemed | (387,022,761) | | (387,022,761) | | (95,875,729) | | (95,875,729) |
Total net change | 74,566,080 | $ | 74,566,080 | | 71,020,982 | $ | 71,020,982 |
| | | | | | | | |
Adviser Class | | | | | | | |
Shares sold | 752,977 | $ | 752,977 | | 84,500 | $ | 84,500 |
Shares issued in reinvestment of | | | | | | | |
dividends | 4,836 | | 4,836 | | 115 | | 115 |
Shares redeemed | (221,332) | | (221,332) | | (4,500) | | (4,500) |
Total net change | 536,481 | $ | 536,481 | | 80,115 | $ | 80,115 |
| | | | | | | | |
Tax Optimized Income Fund
| | Year Ended October 31, 2005 | | Year Ended October 31, 2004 |
| | Shares | | Amount | | Shares | | Amount |
| | | | | | | | |
Investor Class | | | | | | | |
Shares sold | 166,813 | $ | 1,685,243 | | 910,320 | $ | 9,270,083 |
Shares issued in reinvestment of dividends | 143,767 | | 1,448,075 | | 138,854 | | 1,412,486 |
Redemption Fees | — | | 274 | | — | | — |
Shares redeemed | (810,106) | | (8,168,307) | | (1,455,861) | | (14,856,164) |
Total net change | (499,526) | $ | (5,034,715) | | (406,687) | $ | (4,173,595) |
| | | | | | | | |
Adviser Class | | | | | | | |
Shares sold | 8,831 | $ | 89,000 | | 2,164 | $ | 22,000 |
Shares issued in reinvestment of dividends | 195 | | 1,965 | | 20 | | 197 |
Shares redeemed | — | | — | | — | | — |
Total net change | 9,026 | $ | 90,965 | | 2,184 | $ | 22,197 |
| | | | | | | | |
4. | Purchases and Sales of Securities: |
Purchases and sales of securities (excluding short-term securities) for the year ended October 31, 2005 are as follows:
| | Non-U.S. Government | | U.S. Government |
| | Purchases | | Sales | | Purchases | | Sales |
| | | | | | | | |
Dynamic Balance Fund | $33,250,865 | | $19,118,201 | | $13,003,792 | | $8,926,776 |
| | | | | | | | |
Dynamic Dividend Fund | 710,582,096 | | 424,872,726 | | — | | — |
| | | | | | | | |
Tax Optimized Income Fund | 26,637,011 | | 38,024,760 | | — | | — |
Notes to Financial Statements—Continued
October 31, 2005
Quasar Distributors, LLC (“Quasar’’) serves as the Funds’ distributor. The Municipal Money Market Fund and the Tax Optimized Income Fund have each adopted a distribution and servicing plan (the “Plan’’) for its Adviser Class shares as allowed by Rule 12b-1 under the 1940 Act. The Plan authorizes payments by the Fund in connection with the distribution and servicing of its shares at an annual rate, as determined from time to time by the Board of Trustees, of up to 0.25% of the Fund’s average daily net assets. Amounts paid under the Plan by the Fund may be spent by the Fund on any activities or expenses primarily intended to result in the sale of shares of the Fund, including but not limited to advertising, compensation for sales and marketing activities of financial institutions and others such as dealers and distributors, shareholder account servicing, the printing and mailing of prospectuses to other than current shareholders and the printing and mailing of sales literature. The Municipal Money Market Fund incurred $569 and the Tax Optimized Income Fund incurred $167 pursuant to the Plan for the year ended October 31, 2005.
The Plan for the Municipal Money Market Fund and the Tax Optimized Income may be terminated at any time by vote of the Trustees of the Income Trust who are not “interested persons’’, as defined by the 1940 Act, of the Income Trust, or by vote of a majority of the outstanding voting shares of the respective class.
6. | Investment Advisory Agreement and Other Affiliated Transactions: |
Alpine Management & Research, LLC (“Alpine’’) provides investment advisory services to the Funds. Pursuant to the investment adviser’s agreement with the Funds, Alpine is entitled to an annual fee based on 1.00% of each Fund’s average daily net assets for the Dynamic Balance Fund and the Dynamic Dividend Fund. Alpine is entitled to an annual fee based on 0.45% of the Municipal Money Market Fund’s average daily net assets and an annual fee based on 0.75% of the Tax Optimized Income Fund’s average daily net assets.
The Adviser agreed to reimburse the Dynamic Balance Fund, Dynamic Dividend Fund and Tax Optimized Income Fund-Investor Class to the extent necessary to ensure that the Fund’s total operating expenses (excluding 12b-1 fees, interest, brokerage commissions and extraordinary expenses) did not exceed 1.35%, 1.35% and 0.60% of the Fund’s average daily net assets, respectively. For the year ended October 31, 2005, the Adviser agreed to reimburse the Municipal Money Market Fund-Investor Class to the extent necessary to ensure that the Fund’s total operating expenses (excluding 12b-1 fees, interest, brokerage commissions and extraordinary expenses) did not exceed certain limits. The limits ranged from 0.15% to 0.36% of the Fund’s average daily net assets during 2005. The expense caps for the Adviser Class Shares of the Municipal Money Market Fund and Tax Optimized Income Fund are 0.25% higher than the Investor Class shares. The Adviser may recover expenses paid in excess of the cap on expenses for the three previous years, as long as the recovery does not cause the Fund to exceed such cap on expenses. For the year ended October 31, 2005, the Adviser waived investment advisory fees totaling $574,245 and $148,232 for the Municipal Money Market Fund and Tax Optimized Income Fund, respectively. For the year ended October 31, 2005, the Adviser recovered previously reimbursed/absorbed expenses totaling $91,794 and $76,518 for the Dynamic Balance Fund and Dynamic Dividend Fund, respectively. The expense limitation will remain in effect unless and until the Board of Trustees of the Series and Income Trusts approve its modification or termination.
Reimbursed/absorbed expenses subject to potential recovery by year of expiration as follows:
Year of Expiration | Dynamic Dividend Fund | | Municipal Money Market Fund | | Tax Optimized Income Fund |
| | | | | | |
| 10/31/06 | $ — | | $175,958 | | $181,472 |
| 10/31/07 | $2,149 | | $311,122 | | $233,633 |
| 10/31/08 | $ — | | $574,245 | | $148,232 |
At October 31, 2005, the Dynamic Balance Fund and Dynamic Dividend had $10,059,019 and $1,000,000, respectively, invested in the Municipal Money Market Fund.
Notes to Financial Statements—Continued
October 31, 2005
7. | Federal Income Tax Information: |
At October 31, 2005, the components of accumulated earnings/(losses) on a tax basis were as follows:
| | | Dynamic Balance Fund | | Dynamic Dividend Fund | | Municipal Money Market Fund | | Tax Optimized Income Fund |
| | | | | | | | | |
Cost of Investments | $ | 84,455,244 | $ | 320,022,243 | $ | 205,720,969 | $ | 45,377,771 |
| | | | | | | | | |
Gross unrealized appreciation | $ | 14,777,839 | $ | 9,905,900 | $ | — | $ | 110,536 |
Gross unrealized depreciation | | (3,436,049) | | (21,587,334) | | — | | (119,647) |
Net unrealized appreciation/(depreciation) | $ | 11,341,790 | $ | (11,681,434) | $ | — | $ | (9,111) |
| | | | | | | | | |
Undistributed ordinary income | $ | — | $ | 3,463,833 | $ | — | $ | 5,475 |
Undistributed long-term capital gain | | 1,667,048 | | — | | — | | 11,068 |
Total distributable earnings | $ | 1,667,048 | $ | 3,463,833 | $ | — | $ | 16,543 |
| | | | | | | | | |
Other accumulated gains/(losses) | $ | (200) | $ | (4,342,073) | $ | (412) | $ | — |
Total accumulated earnings/(losses) | $ | 13,008,638 | $ | (12,559,674) | $ | (412) | $ | 7,432 |
| | | | | | | | | |
The tax basis of investments for tax and financial reporting purposes differs principally due to the deferral of losses on wash sales, REIT tax adjustments, and mark-to-market cost basis adjustments for investments in foreign passive investment companies (PFICs) for tax purposes.
The tax character of distributions paid during the years ended October 31, 2005 and 2004 were as follows:
| | | 2005 | | 2004 |
Dynamic Balance Fund | | | | |
| Ordinary Income | $ | 1,778,074 | $ | 1,016,661 |
| Long-term capital gain | | 3,203,577 | | — |
| | $ | 4,981,651 | $ | 1,016,661 |
| | | | | |
Dynamic Dividend Fund | | | | |
| Ordinary Income | $ | 27,647,226 | $ | 2,259,008 |
| Long-term capital gain | | 212,050 | | — |
| | $ | 27,859,276 | $ | 2,259,008 |
| | | | | |
Municipal Money Market Fund | | | | |
| Exempt interest dividend | $ | 5,190,167 | $ | 963,350 |
| Long-term capital gain | | — | | — |
| | $ | 5,190,167 | $ | 963,350 |
| | | | | |
Tax Optimized Income Fund | | | | |
| Ordinary Income | $ | 619,728 | $ | 758,470 |
| Exempt interest dividends | | 844,130 | | 671,074 |
| Long-term capital gain | | — | | — |
| | $ | 1,463,858 | $ | 1,429,544 |
| | | | | |
Capital loss carryovers as of October 31, 2005 are as follows:
| | | Net Capital Loss Carryover* | | Capital Loss Carryover Expiration |
| | | | | |
| Dynamic Dividend Fund | $ | 4,335,047 | | 10/31/2013 |
| Municipal Money Market Fund | $ | 412 | | 10/31/2012 |
| * | Capital gain distributions will resume in the future to the extent gains are realized in excess of the available gains. |
REPORT OF INDEPENDENT REGISTERED PUBLIC ACCOUNTING FIRM
To the Shareholders and the Boards of Trustees
of Alpine Series Trust and Alpine Income Trust:
We have audited the accompanying statements of assets and liabilities, including the schedules of portfolio investments of Alpine Series Trust, comprising the Alpine Dynamic Balance Fund and Alpine Dynamic Dividend Fund; and Alpine Income Trust, comprising the Alpine Municipal Money Market Fund and Alpine Tax Optimized Income Fund (collectively, the “Funds’’), as of October 31, 2005 and the related statements of operations for the year then ended, and the statements of changes in net assets and the financial highlights for the two years then ended. These financial statements and financial highlights are the responsibility of the Funds’ management. Our responsibility is to express an opinion on these financial statements and financial highlights based on our audits. The Funds’ financial highlights for the periods ended prior to October 31, 2004 were audited by other auditors whose report, dated December 19, 2003, expressed an unqualified opinion on those financial highlights.
We conducted our audits in accordance with the standards of the Public Company Accounting Oversight Board (United States). Those standards require that we plan and perform the audit to obtain reasonable assurance about whether the financial statements and financial highlights are free of material misstatement. The Funds are not required to have, nor were we engaged to perform, an audit of their internal control over financial reporting. Our audits included consideration of internal control over financial reporting as a basis for designing audit procedures that are appropriate in the circumstances, but not for the purpose of expressing an opinion on the effectiveness of the Funds’ internal control over financial reporting. Accordingly, we express no such opinion. An audit also includes examining, on a test basis, evidence supporting the amounts and disclosures in the financial statements, assessing the accounting principles used and significant estimates made by management, as well as evaluating the overall financial statement presentation. Our procedures included confirmation of securities owned as of October 31, 2005, by correspondence with the custodian and brokers; where replies were not received from brokers, we performed other auditing procedures. We believe that our audits provide a reasonable basis for our opinion.
In our opinion, the financial statements and financial highlights referred to above present fairly, in all material respects, the financial position of each of the Funds as of October 31, 2005, the results of their operations for the year then ended, and the changes in their net assets and the financial highlights for the two years then ended, in conformity with accounting principles generally accepted in the United States of America.
Milwaukee, WI
December 28, 2005
Additional Information (Unaudited)
Expense Examples
October 31, 2005
As a shareholder of the Dynamic Balance Fund and the Municipal Money Market Fund, Adviser and Investor Class, you will incur ongoing costs, including management fees; distribution and/or service fees; and other Fund expenses. As a shareholder of the Dynamic Dividend Fund and the Tax Optimized Income Fund, Adviser & Investor Class, you will incur two types of costs: (1) redemption fees and (2) ongoing costs. The examples below are intended to help you understand your ongoing costs (in dollars) of investing in the Funds and to compare these costs with the ongoing costs of investing in other mutual funds. The examples are based on in investment of $1,000 for the period 5/1/05-10/31/05.
The first line of the tables below provides information about actual account values and actual expenses. The Funds charge no sales load or transaction fees, but do assess shareholders for outgoing wire transfers, returned checks and stop payment orders at prevailing rates charged by U.S. Bancorp Fund Services, LLC, the Funds’ transfer agent. If you request a redemption by wire transfer, currently a $15.00 fee is charged by the Funds’ transfer agent. Shareholders in the Dynamic Dividend Fund will be charged a redemption fee equal to 1.00% of the net amount of the redemption if they redeem their shares less than 60 calendar days after purchase.
Shareholders in the Tax Optimized Income Fund, Adviser & Investor Class, will be charged a redemption fee equal to 0.25% of the net amount of the redemption if they redeem their shares less than 30 calendar days after purchase. IRA accounts will be charged a $15.00 annual maintenance fee. To the extent the Funds invest in shares of other investment companies as a part of their investment strategies, you will indirectly bear your proportionate share of any fees and expenses charged by the underlying funds in which the Funds invest in addition to the expenses of the Fund. These expenses are not included in the example below. The example below includes, but is not limited to, management fees, shareholder servicing fees, fund accounting, custody and transfer agent fees. However, the example below does not include portfolio trading commissions, related expenses and other extraordinary expenses as determined under GAAP. You may use the information in this line, together with the amount you invested, to estimate the expenses that you paid over the period. Simply divide your account value by $1,000 (for example, an $8,600 account value divided by $1,000 = 8.6), then multiply the result by the number in the first line under heading entitled “Expenses Paid During Period’’ to estimate the expenses you paid on your account during the period.
Hypothetical Example for Comparison Purposes
The second line of the table below provides information about hypothetical account values and hypothetical expenses based on the Funds’ actual expense ratios and an assumed rate of return of 5% per year before expenses, which does not represent the Funds’ actual returns. The hypothetical account values and expenses may not be used to estimate the actual ending account balance or expenses you paid for the period. You may use this information to compare the ongoing costs of investing in the Funds and other funds. To do so, compare this 5% hypothetical example with the 5% hypothetical examples that appear in the shareholder reports of other funds. Please note that the expenses shown in the table are meant to highlight your ongoing costs only and do not reflect any transactional costs, such as redemption fees. Therefore, the second line of the table is useful in comparing ongoing costs only, and will not help you determine the relative total costs of owning different funds. In addition, if these transactional costs were included, your costs would have been higher.
Alpine Dynamic Balance Fund
| | Beginning Account Value 5/01/2005 | | Ending Account Value 10/31/2005 | | Expenses Paid During Period 5/1/05-10/31/05 |
| | | | | | |
| Actual | $1,000.00 | | $1,039.50 | | $6.58 |
| Hypothetical | $1,000.00 | | $1,018.40 | | $6.51 |
| (1) | Ending account values and expenses paid during period based on a 3.95% return. The return is considered after expenses are deducted from the fund. |
| (2) | Ending account values and expenses paid during period based on a 5.00% annual return. The return is considered before expenses are deducted from the fund. |
Additional Information (Unaudited)—Continued
Expense Examples
October 31, 2005
Alpine Dynamic Dividend Fund
| | Beginning Account Value 5/01/2005 | | Ending Account Value 10/31/2005 | | Expenses Paid During Period 5/1/05-10/31/05 |
| | | | | | |
| Actual | $1,000.00 | | $1,060.80 | | $6.13 |
| Hypothetical | $1,000.00 | | $1,019.26 | | $6.01 |
| (1) | Ending account values and expenses paid during period based on a 6.08% return. The return is considered after expenses are deducted from the fund. |
| (2) | Ending account values and expenses paid during period based on a 5.00% annual return. The return is considered before expenses are deducted from the fund. |
Alpine Municipal Money Market Fund
Adviser Class Shares
| | Beginning Account Value 5/01/2005 | | Ending Account Value 10/31/2005 | | Expenses Paid During Period 5/1/05-10/31/05 |
| | | | | | |
| Actual | $1,000.00 | | $1,011.40 | | $2.74 |
| Hypothetical | $1,000.00 | | $1,022.48 | | $2.75 |
| (1) | Ending account values and expenses paid during period based on a 1.14% return. The return is considered after expenses are deducted from the fund. |
| (2) | Ending account values and expenses paid during period based on a 5.00% annual return. The return is considered before expenses are deducted from the fund. |
Alpine Municipal Money Market Fund
Investor Class Shares
| | Beginning Account Value 5/01/2005 | | Ending Account Value 10/31/2005 | | Expenses Paid During Period 5/1/05-10/31/05 |
| | | | | | |
| Actual | $1,000.00 | | $1,012.60 | | $1.47 |
| Hypothetical | $1,000.00 | | $1,023.74 | | $1.48 |
| (1) | Ending account values and expenses paid during period based on a 1.26% return. The return is considered after expenses are deducted from the fund. |
| (2) | Ending account values and expenses paid during period based on a 5.00% annual return. The return is considered before expenses are deducted from the fund. |
Alpine Tax Optimized Income Fund
Adviser Class Shares
| | Beginning Account Value 5/01/2005 | | Ending Account Value 10/31/2005 | | Expenses Paid During Period 5/1/05-10/31/05 |
| | | | | | |
| Actual | $1,000.00 | | $1,011.40 | | $4.31 |
| Hypothetical | $1,000.00 | | $1,020.92 | | $4.33 |
| (1) | Ending account values and expenses paid during period based on a 1.14% return. The return is considered after expenses are deducted from the fund. |
| (2) | Ending account values and expenses paid during period based on a 5.00% annual return. The return is considered before expenses are deducted from the fund. |
Additional Information (Unaudited)—Continued
Expense Examples
October 31, 2005
Alpine Tax Optimized Income Fund
Investor Class Shares
| | Beginning Account Value 5/01/2005 | | Ending Account Value 10/31/2005 | | Expenses Paid During Period 5/1/05-10/31/05 |
| | | | | | |
| Actual | $1,000.00 | | $1,012.60 | | $3.04 |
| Hypothetical | $1,000.00 | | $1,022.18 | | $3.06 |
| (1) | Ending account values and expenses paid during period based on a 1.26% return. The return is considered after expenses are deducted from the fund. |
| (2) | Ending account values and expenses paid during period based on a 5.00% annual return. The return is considered before expenses are deducted from the fund. |
Additional Information (Unaudited)—Continued
October 31, 2005
Investment Advisor and Advisory Contract
On December 20, 2004, at a meeting called for the purpose of voting on such approval, the Boards of Trustees, including all of the Trustees who are not parties to the Advisory Contracts or interested persons of any such party (the non-interested Trustees), approved the continuance of the Advisory Contracts for the Funds. In so doing, the Board Members studied materials specifically relating to the Advisory Contracts provided by the Adviser, the Funds’ counsel and the Funds’ administrator. The Board Members considered a variety of factors, including the following:
The Board Members considered the expected nature, quality and scope of the management and investment advisory services and personnel provided each Fund by the Adviser; the rate of investment advisory fees payable to the Adviser and a comparison of the fees paid by comparable funds; the compensation (in addition to the investment advisory fees) and other benefits received by the Adviser and its respective affiliates; the Adviser’s costs in providing services; the economies of scale realized by the Adviser; the annual operating expenses of each Fund; and the policies and practices of the Adviser with respect to portfolio transactions for each Fund.
The Board Members also evaluated the investment performance of the Funds relative to their respective benchmark indices over the last year, three years, five years, ten years and since inception (as applicable).
The Board Members also reviewed Lipper analytical data relating to average expenses and advisory fees for comparable funds. Based on the information provided, the Board Members determined that each Fund’s fee structure is competitive with funds having similar investment goals and strategies.
The Board Members considered the Funds’ total expense ratios and contractual investment advisory fees compared to their respective industry average by quartile, within the appropriate Lipper benchmark category and Lipper category range. The Board Members also considered the amount and nature of fees paid by shareholders. The Board Members considered the fact that the Adviser has contractually agreed to waive a portion of its fees for the Dynamic Balance Fund, the Dynamic Dividend Fund, the Municipal Money Market Fund and the Tax Optimized Income Fund for a period of one year, to be reviewed again at the next Advisory Contract renewal. It was noted that each Fund’s management fee and expense ratio are within the average range compared to its peer funds.
The Board Members considered the extent to which economies of scale would be realized with respect to operational costs as the Funds grow in their number of shareholders and assets under management, the existence of breakpoints previously established by the Adviser, and whether fee levels to be charged by the Adviser reflect these economies of scale for the benefit of Fund investors and are fair under the circumstances, which the Board Members, including all of the non-interested Trustees, believed to be the case.
Based on the Board Members’ review and consultation with the Funds’ independent counsel, of the material aspects of the Advisory Contracts, including the foregoing factors and such other information believed to be reasonably necessary to evaluate the terms of the Advisory Contracts, the Board Members, including all of the non-interested Trustees voting separately, concluded that the continuation of the Advisory Contracts would be in the best interest of the Funds’ shareholders, and determined that the compensation to the Adviser provided for in the Advisory Contracts is fair and equitable.
Additional Information (Unaudited)—Continued
October 31, 2005
Information about Trustees and Officers
The business and affairs of the Funds are managed under the direction of Funds’ Board of Trustees. Information pertaining to the Trustees and Officers of the Funds is set forth below. The SAI includes additional information about the Funds’ Trustees and Officers and is available, without charge, upon request by calling 1-888-785-5578.
Independent Trustees
Name, Address and Age | Position(s) Held with the Trust | Term of Office and Length of Time Served | Principal Occupation During Past Five Years | # of Portfolios in Fund Complex* | Other Directorships Held by Trustee |
| | | | | | |
Laurence B. Ashkin (76), 2500 Westchester Ave. Purchase, NY 10577 | Independent Trustee | Indefinite, Since the Trust’s inception | Real estate developer and construction consultant since 1980; Founder and President of Centrum Properties, Inc. since 1980. | 7 | Trustee of Alpine Equity and Alpine Series Trusts (formerly Evergreen Global Equity Trust). |
| | | | | | |
H. Guy Leibler (50), 2500 Westchester Ave. Purchase, NY 10577 | Independent Trustee | Indefinite, since the Trust’s inception. | Chief Operating Officer L&L Acquisitions, LLC since 2004; President, Skidmore, Owings & Merrill LLP, 2001-2003, Director of Brand Space Inc., a brand marketing/advertising company (1997-1999); | 7 | Director, White Plains Hospital Center; Founding Director, Stellaris Health Network, Trustee of Alpine Equity and Alpine Series Trusts |
| | | | | | |
Jeffrey E. Wacksman (44) 2500 Westchester Ave. Purchase, NY 10577 | Independent Trustee | Indefinite, since 2004 | Partner, Loeb, Block & Partners LLP, since 1994. | 7 | Director, Adair International Limited; Director, Cable Beach Properties, Inc.; Director, Bondi Icebergs Inc.; Trustee, Larchmont Manor Park Society; Trustee of Alpine Equity and Alpine Series Trusts |
* The term “Fund Complex’’ refers to the Funds in the Alpine Equity Trust, Alpine Series Trust and Alpine Income Trust.
Additional Information (Unaudited)—Continued October 31, 2005
Interested Trustees and Officers
Name, Address and Age | Position(s) Held with the Trust | Term of Office and Length of Time Served | Principal Occupation During Past Five Years | # of Portfolios in Fund Complex** | Other Directorships Held by Trustee |
| | | | | | |
Samuel A. Lieber* (48), 2500 Westchester Ave. Purchase, NY 10577 | Interested Trustee, Portfolio Manager, and President | Indefinite, since inception. | CEO of Alpine Management & Research, LLC since November 1997. Formerly Senior Portfolio Manager with Evergreen Asset Management Corp. (1985-1997) | 7 | Trustee of Alpine Equity and Alpine Series Trusts |
| | | | | | |
Stephen A. Lieber (79) 2500 Westchester Ave. Purchase, NY 10577 | Vice President | Indefinite, since inception | Chairman and Senior Portfolio Manager, Saxon Woods Advisors, LLC Since 1999. Formerly President, Evergreen Asset Management Corp. (1971-1999). Formerly, Chairman and Chief Executive Officer, Lieber & Company (1969-1999) | 7 | None |
| | | | | | |
Steven C. Shachat (44) 2500 Westchester Ave. Purchase, NY 10577 | Vice President and Portfolio Manager | Indefinite, since 2002 | Managing Director of Alpine Management and Research, LLC since September 2002. Formerly, Senior Portfolio Manager with Evergreen Investment Management Corp. (1989-2001) | 7 | None |
| | | | | | |
Sheldon R. Flamm (57) 2500 Westchester Ave. Purchase, NY 10577 | Treasurer and Chief Compliance Of ficer | Indefinite, since 2002 | Chief Financial Officer, Saxon Woods Advisors, LLC, 1999 - Present; Chief Financial Officer, Lieber & Co. a wholly-owned subsidiary of First Union National Bank), 1997-1999, Chief Financial Officer of Evergreen Asset Management Corp March 1987 to September 1999. | 7 | None |
| | | | | | |
Oliver Sun (40) 2500 Westchester Ave. Purchase, NY 10577 | Secretary | Indefinite, | Controller of Alpine Management since 2002 & Research, LLC, 1998 to present. | 7 | None |
| * | Denotes Trustees who | is an “interested | persons’’ | of the | Trust or Fund under the 1940 Act. |
| ** | The term “Fund Complex’’ refers to the Funds in the Alpine Equity Trust, Alpine Series Trust, and Alpine Income Trust. |
Additional Information (Unaudited)—Continued
October 31, 2005
Tax Information
The Funds designated the following percentages of dividends declared from net investment income for the fiscal year ended October 31, 2005 as qualified dividend income under the Jobs & Growth Tax Relief Reconciliation Act of 2003.
| Dynamic Balance Fund | 82.44% |
| Dynamic Dividend Fund | 98.54% |
The Funds designated the following percentages of dividends declared during the fiscal year ended October 31, 2005 as dividends qualifying for the dividends received deduction available to corporate shareholders.
| Alpine Dynamic Dividend Fund | 32.4% |
| Alpine Dynamic Balance Fund | 80.3% |
Availability of Proxy Voting Information
Information regarding how the Fund votes proxies relating to portfolio securities is available without charge upon request by calling toll-free at 1-888-785-5578 and on the SEC’s website at www.sec.gov. Information regarding how the Fund voted proxies relating to portfolio securities during the period ending June 30, 2005 is available on the SEC’s website at www.sec.gov or by calling the toll-free number listed above.
Availability of Quarterly Portfolio Schedule
Beginning with the Fund’s fiscal quarter ended July 31, 2004, the Funds filed their complete schedules of portfolio holdings on Form N-Q with the SEC. Going forward, the Funds will file Form N-Q for the first and third quarters of each fiscal year on Form N-Q. TheFund’s Form N-Q is available on the SEC’s website at www.sec.gov and may be reviewed and copied at the SEC’s Public Reference Room in Washington, DC. Information on the operation of the Public Reference Room may be obtained by calling 1-800-SEC-0330.
[THIS PAGE INTENTIONALLY LEFT BLANK]
[THIS PAGE INTENTIONALLY LEFT BLANK]

| TRUSTEES | | SUB-CUSTODIAN | | FUND COUNSEL |
| Samuel A. Lieber | | The Bank of New York | | Blank Rome LLP |
| Laurence B. Ashkin | | One Wall Street | | The Chrysler Building |
| H. Guy Leibler | | New York, NY 10286 | | 405 Lexington Avenue |
| Jeffrey W. Wacksman | | | | New York, NY 10174 |
| | | | | |
| | | INDEPENDENT REGISTERED | | |
| CUSTODIAN | | PUBLIC ACCOUNTING FIRM | | DISTRIBUTOR |
| U.S. Bank, N.A. | | Deloitte & Touche LLP | | Quasar Distributors, LLC |
| 425 Walnut Street | | 555 East Wells Street | | 615 East Michigan Street |
| Cincinnati, OH 45202 | | Milwaukee, WI 53202 | | Milwaukee, WI 53202 |
| | | | | |
INVESTMENT ADVISER | | TRANSFER AGENT & ADMINISTRATOR |
| Alpine Woods Capital Investors, LLC | | U.S. Bancorp Fund Services, LLC |
| 2500 Westchester Ave., Suite 215 | | 615 East Michigan Street |
| Purchase, NY 10577 | | Milwaukee, WI 53202 |
| | | |
SHAREHOLDER / INVESTOR INFORMATION
(888) 785-5578 |
www.alpinefunds.com
Item 2. Code of Ethics.
The registrant has adopted a code of ethics that applies to the registrant’s principal executive officer and principal financial officer. The registrant has not made any amendments to its code of ethics during the period covered by this report. The registrant has not granted any waivers from any provisions of the code of ethics during the period covered by this report.
A copy of the registrant’s Code of Ethics is filed herewith.
Item 3. Audit Committee Financial Expert.
The registrant’s board of [trustees/directors] has determined that there is at least one audit committee financial expert serving on its audit committee. Laurence Ashkin is the “audit committee financial expert” and is considered to be “independent” as each term is defined in Item 3 of Form N-CSR.
Item 4. Principal Accountant Fees and Services.
The registrant has engaged its principal accountant to perform audit services, audit-related services, tax services and other services during the past two fiscal years. “Audit services” refer to performing an audit of the registrant's annual financial statements or services that are normally provided by the accountant in connection with statutory and regulatory filings or engagements for those fiscal years. “Audit-related services” refer to the assurance and related services by the principal accountant that are reasonably related to the performance of the audit. “Tax services” refer to professional services rendered by the principal accountant for tax compliance, tax advice, and tax planning. “Other services” provided by the principal accountant were not applicable. The following table details the aggregate fees billed or expected to be billed for each of the last two fiscal years for audit fees, audit-related fees, tax fees and other fees by the principal accountant.
| | FYE 10/31/2005 | FYE 10/31/2004 |
| Audit Fees | $25,400 | $22,500 |
| Audit-Related Fees | 0 | 0 |
| Tax Fees | $6,000 | $5,500 |
| All Other Fees | 0 | 0 |
The audit committee has adopted pre-approval policies and procedures that require the audit committee to pre-approve all audit and non-audit services of the registrant, including services provided to any entity affiliated with the registrant. All of the principal accountant’s hours spent on auditing the registrant’s financial statements were attributed to work performed by full-time permanent employees of the principal accountant.
Item 5. Audit Committee of Listed Registrants.
Not applicable to open-end investment companies.
Item 6. Schedule of Investments.
Schedule of Investments is included as part of the report to shareholders filed under Item 1 of this Form.
Item 7. Disclosure of Proxy Voting Policies and Procedures for Closed-End Management Investment Companies.
Not applicable to open-end investment companies.
Item 8. Portfolio Managers of Closed-End Management Investment Companies.
Not applicable to open-end investment companies.
Item 9. Purchases of Equity Securities by Closed-End Management Investment Company and Affiliated Purchases.
Not applicable to open-end investment companies.
Item 10. Submission of Matters to a Vote of Security Holders.
Not Applicable.
Item 11. Controls and Procedures.
| (a) | The Registrant’s President and Treasurer have concluded that the Registrant's disclosure controls and procedures (as defined in Rule 30a-3(c) under the Investment Company Act of 1940 (the “1940 Act”)) are effective as of a date within 90 days of the filing date of the report that includes the disclosure required by this paragraph, based on the evaluation of these controls and procedures required by Rule 30a-3(b) under the 1940 Act and Rules 15d-15(b) under the Securities Exchange Act of 1934, as amended. |
| (b) | There were no significant changes in the Registrant's internal controls over financial reporting that occurred during the Registrant's last fiscal half-year that has materially affected, or is reasonably likely to materially affect, the Registrant's internal control over financial reporting. |
Item 12. Exhibits.
| (a) | (1) Any code of ethics or amendment thereto, that is subject of the disclosure required by Item 2, to the extent that the registrant intends to satisfy Item 2 requirements through filing an exhibit. Filed herewith. |
(2) Certifications pursuant to Section 302 of the Sarbanes-Oxley Act of 2002. Filed herewith.
| (b) | Certification pursuant to Section 906 of the Sarbanes-Oxley Act of 2002. Furnished herewith. |
| (c) | Certification pursuant to Section 906 of the Sarbanes-Oxley Act of 2002. Furnished herewith. |
SIGNATURES
Pursuant to the requirements of the Securities Exchange Act of 1934 and the Investment Company Act of 1940, the registrant has duly caused this report to be signed on its behalf by the undersigned, thereunto duly authorized.
(Registrant) Alpine Income Trust
By (Signature and Title) /s/ Samuel A. Lieber
Samuel A. Lieber, President
Date January 9, 2005
Pursuant to the requirements of the Securities Exchange Act of 1934 and the Investment Company Act of 1940, this report has been signed below by the following persons on behalf of the registrant and in the capacities and on the dates indicated.
By (Signature and Title)* /s/ Samuel A. Lieber
Samuel A. Lieber, President
Date January 9, 2005
By (Signature and Title)* /s/ Sheldon Flamm
Sheldon Flamm, Treasurer
Date January 9, 2005
* Print the name and title of each signing officer under his or her signature.