As filed with the Securities and Exchange Commission on July 10, 2006
UNITED STATES
SECURITIES AND EXCHANGE COMMISSION
Washington, D.C. 20549
FORM N-CSR
CERTIFIED SHAREHOLDER REPORT OF REGISTERED
MANAGEMENT INVESTMENT COMPANIES
Investment Company Act file number 811-21210
Alpine Income Trust
(Exact name of registrant as specified in charter)
615 East Michigan Street
3rd Floor
Milwaukee, WI 53202
(Address of principal executive offices) (Zip code)
Samuel A. Lieber
Alpine Woods Capital Investors, LLC
2500 Westchester Avenue, Suite 215
Purchase, NY 10577
(Name and address of agent for service)
1-888-785-5578
Registrant's telephone number, including area code
Date of fiscal year end: 10/31/2006
Date of reporting period: 4/30/2006
Item 1. Report to Stockholders.
Table of Contents
| Alpine’s Investment Outlook | 1 |
| Fund Manager Reports | |
Alpine Dynamic Balance Fund | 4 |
Alpine Dynamic Dividend Fund | 8 |
Alpine Dynamic Financial Services Fund | 14 |
Alpine Municipal Money Market Fund | 18 |
Alpine Tax Optimized Income Fund | 20 |
| Schedules of Portfolio Investments | 24 |
| Statements of Assets and Liabilities | 38 |
| Statements of Operations | 40 |
| Statements of Changes in Net Assets | 42 |
| Financial Highlights | 47 |
| Notes to Financial Statements | 54 |
| Additional Information | 61 |
Alpine’s Investment Outlook |

Dear Investor,
We are pleased to present the Alpine Mutual Funds Semi-Annual Report for the period ending April 30, 2006. We typically write these reports a month after the ending period. This year, it has given us a broad perspective on the significant global market sell-off which began on May 10th when newly elected Federal Reserve Chairman Bernanke chose to reemphasize his inflation-fighting commitment. This was followed later in the month by the expected Federal Reserve interest rate increase and then a globally coordinated 25 basis point increase by the European Central Bank, as well as South Korea and India. Other countries have also followed this lead. In turn, equity markets tumbled dramatically as risk premiums were considered too low if the central banks were to continue a coordinated pattern of rising interest rates, which might lead to an economic slow down and hence, reduced corporate profitability.
The equity markets were probably too buoyant in their rapid rise earlier this year and perhaps overly pessimistic in the recent contraction, as is often the case. Our view is that the capital markets are in the midst of a mid-cycle correction, similar to those experienced in 2004 and early 2005. This often occurs after the central banks have succeeded in elevating economic activity following a recession. They provide significant financial liquidity at low cost, and then gradually withdraw that liquidity in order to find a balance between growth and inflation. We judge that the Federal Reserve is nearing the end of this second phase in the mid-cycle correction, and that over the next year we will see the Federal Reserve again adjust rates when it reevaluates the long-term trajectory of the economy. We believe that the Federal Reserve will conclude its extended cycle of interest rate increases this summer, and may likely find it necessary to reverse course and reduce rates for 2007.
The recent equity market sell-off has been the market’s correction when global liquidity for equities become constrained. This reflects the short-term influences of a transient shift in investor sentiment less than the fundamental prospects for either the economy and the equity markets over the next few years. Currently, the equity markets are obsessed by Federal Reserve activity, although one or two more increases on top of 17 prior moves strike us as marginal adjustments rather than significant directional trends. However, the market is rightly concerned about the strength of consumer spending in light of declining consumer confidence expectations for the future and the progressive impact of rising interest rates on looming mortgage resets over the next 24 months. Any uncertainty is compounded by historically low confidence ratings for our government’s leadership or capacity to enact meaningful change. Obviously, this has been significantly eroded by both the war in Iraq and the post-Katrina rebuilding debacle.
Even though business hiring has been solid, corporate capital spending plans remain below expectations. From a global perspective, significant concerns include increased tendencies of Latin American governments to nationalize internationally controlled businesses, simmering wars and conflicts in Africa and Asia, ongoing stalemates between North Korea and Iran and their neighbors, as well as festering instability between Israel and its Palestinian neighbors. The threat of terrorism still looms in the background. On the positive side of the ledger, global growth should be supported by a number of developments. There is still the promise of increased long-term stability and growth in Latin America, and the gradual revival of both domestic demand and investment in exporting industries in Japan. Prospects are good for modestly improving business conditions in Europe, and the great potential of the world’s emerging juggernauts of China and India. Overall, the promise of continued economic growth throughout the world should translate into corporate earnings growth, both at home and abroad.
While this economic cycle shares many similarities in its broad outline with the prior one, a number of important factors may differentiate its shape and duration. During the period following the 1995 rate rise, corporate spending significantly increased through the year 2000 as significant capital expenditures on new technologies and the capacity to produce them was buoyed by the venture capital phenomenon of the late 90’s. In 2006, business capital expenditures have grown by low to mid teen percentages, but not nearly as dynamic as many expected. Businesses are still more inclined to maximize efficiency and profitability of existing operations than to invest in expanding their business model. As a result, most business balance sheets are flush with cash, bank borrowing tends to be less significant than in prior cycles and rising interest rates are having less impact on business decision making. It should be noted that globalization is also an important factor, particularly in terms of the relative cost restraints on production. This, too, influences business managers’ investment decisions.
1
Our overall assessment of the economy’s prospects and of the equity markets potential will in part be determined by whether we do see stable interest rates with perhaps a bit of a yield curve incorporated and modest growth in corporate cash flows and earnings. We suspect that the S&P 500 valuations are broadly fair at current levels, however, it is uneven and the market has, as always, underpriced certain business potential and paid too much for other companies’ growth potential.
With the economy in transition, it is fruitful to assess changes which may lie ahead. As we look out over the next few years, Alpine believes that the dollar could weaken, partly in response to the high current account deficits. High corporate cash flow should be reduced by rising dividend yields, continued capital expenditure and merger and acquisition (M&A) activity. Second quarter earnings projections are for about 121/2% growth in comparison to the 14% growth rate enjoyed by the S&P 500 in the first quarter. We believe that 2007 will feature corporate earnings growth rates reduced from current levels. Market valuation is already factoring this in and could react positively if renewed growth into 2006 is perceived. We believe that the Federal Reserve is fully aware of the potential impact that rolling mortgage payment resets will have in 2007 when hybrid and adjustable rate mortgages come up for adjustment to current interest rate levels. The resulting “sticker shock’’ could be significant for many households and might lead to both a reduction in net household income as well as a decline in domestic consumption. We believe the Federal Reserve is currently moving interest rates above the so called “neutral level’’ in order to, if needed, slow the economy down quickly enough so that they can actually reduce interest rates modestly as the economy enters the peak of this mortgage reset period in mid 2007. Even though the equity markets will no doubt be cautious as to the ultimate strength of the economy in 2007, lower interest rates would be a positive factor for the markets which could perform reasonably well over the next 18 to 24 months.
We look forward to reviewing our assumptions with you in our next letter to shareholders as we evaluate conditions at that time as well as investment prospects for the near future.
Thank you for your interest and support.
Sincerely,

Samuel A. Lieber
President, Alpine Mutual Funds
___________
The information provided herein represents the opinion of Samuel A. Lieber and is not intended to be a forecast of future events, a guarantee of future results, nor investment advice.
A basis point is a value equaling one one-hundredth of a percent (1/100 of 1%).
The S&P 500 Index is designed to measure performance of the broad domestic economy through changes in the aggregate market value of 500 stocks representing all major industries. You cannot invest directly in an index.
Cash flow measures the cash generating capability of a company by adding non-cash charges (e.g. depreciation) and interest expense to pretax income.
Quasar Distributors, LLC, Distributor (06/06)
2
EQUITY MANAGER REPORTS

Alpine Dynamic Balance Fund
Alpine Dynamic Dividend Fund
Alpine Dynamic Financial Services Fund
| Alpine Dynamic Balance Fund |
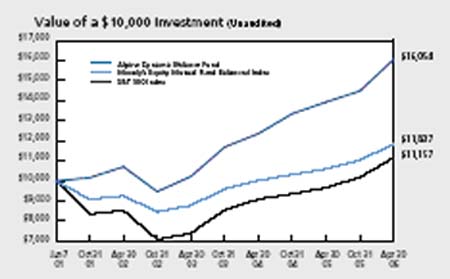
This chart represents a comparison of a hypothetical $10,000 investment in the Fund versus a similar investment in the Fund’s benchmark. The graph and the table do not reflect the deduction of taxes that a shareholder would pay on Fund distributions or the redemption of Fund shares. Investment performance reflects the waiver and recovery of certain fees. Without the waiver and recovery of fees, the Fund’s total return would have differed.
Performance data quoted represents past performance and is not predictive of future results. Investment return and principal value of the Fund fluctuate, so that the shares, when redeemed, may be worth more or less than their original cost. Performance current to the most recent month end may be lower or higher than performance quoted and may be obtained by calling 888-785-5578.
The Moody’s Equity Mutual Fund Balanced Index tracks a group of similar funds that typically correspond to standard classifications based on global funds. The S&P Index is designed to measure performance of the broad domestic economy through changes in the aggregate market value of 500 stocks representing all major industries. The Lipper Multi-Cap Core Funds Average is an average of funds whose primary objective is to invest in a variety of market capitalization ranges without concentrating 75% of their equity assets in any one market capitalization range over an extended period of time. The Moody’s Equity Mutual Fund Balanced Index, the S&P 500 Index and the Lipper Multi-Cap Core Funds Average are unmanaged and do not reflect fees associated with a mutual fund, such as investment adviser fees. The performance for the Dynamic Balance Fund reflects the deduction of fees for these value-added services. Investors cannot directly invest in an index.
Comparative Annualized Returns as of4/30/06 (Unaudited) | ||||
6 Months(1) | 1 Year | 3 Years | Since Inception (6/7/2001) | |
| Alpine Dynamic Balance Fund | 10.83% | 15.21% | 16.21% | 10.15% |
| Moody’s Equity Mutual Fund Balanced Index | 7.26% | 11.64% | 10.48% | 3.50% |
| S&P 500 Index | 9.64% | 15.42% | 14.68% | 2.26% |
| Lipper Multi Cap Core Funds Average | 11.46% | 19.16% | 16.19% | 3.27% |
| Lipper Multi-Cap Core Funds Ranking | N/A(1) | 648/834 | 287/588 | 11/415 |
___________
Not annualized. The NASD does not recognize rankings for less than one year.
4
Alpine Dynamic Balance Fund

Commentary
The Alpine Dynamic Balance Fund had a total return of 10.83% in the first half of the 2006 fiscal year to end October 31. This result compares with the 7.26% of the Moody’s Equity Mutual Fund Balanced Index and 9.64% of the Standard & Poor’s 500 (S&P 500) Index. The total return of the Fund since inception on June 7, 2001 was 60.54% as compared with 18.37% and 11.57% of the respective indices.
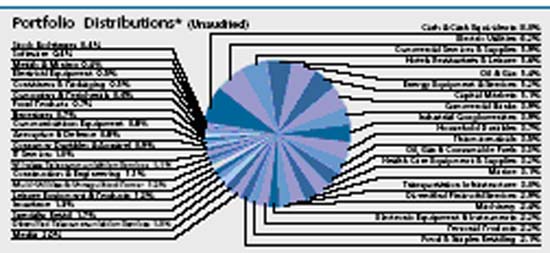
The half year covered by this report was one of considerable volatility in the equity and fixed income markets. The basic balance of the Fund’s portfolio was substantially unchanged, 74% in equities and 26% in fixed income or cash. The cash or cash equivalent position was historically high at 8.4% of the portfolio while the United States Treasury Bond obligations holdings was 17.5%. Bond positions were weighted toward longer maturities. Equity holdings became more concentrated, particularly through significant appreciation in major holdings.
The following are the top ten equity positions:
| Eagle Materials Inc. | 3.8% |
| Consolidated Energy Inc. | 3.1% |
| Fed Ex Corp. | 2.8% |
| Autoliv Inc. | 2.3% |
| Black & Decker Corp. | 2.3% |
| Sunstone Hotel Investors Inc. | 2.2% |
| 3M Company | 2.1% |
| Allegheny Energy Inc. | 2.1% |
| Goldman Sachs Group, Inc. | 2.0% |
| JPMorganChase & Company | 1.8% |
This diverse group of major holdings had an average gain of 32.3% during the first half of this fiscal year, and since purchase, have had an average gain of 61.8%. These holdings reported average earnings growth of 50% in 2005, and 41% in the first quarter of 2006.
Undervalued growth opportunities
The major investment strategy of the equity portion of the portfolio is the purchase of undervalued growth opportunities in well established companies. The nature of the growth opportunity of course varies with the industry, the sector in which the investment is made, and with individual management strategies. It often takes considerable time to eliminate the undervaluation and reflect growth achievement. The top ten performers since purchase in the portfolio illustrate that fact. They are:
5
Alpine Dynamic Balance Fund
Percent Gain | Earliest Purchase Date | ||
| PennVirginia Corp. | 258.6% | 03/28/03 | |
| ConsolEnergy Inc. | 219.2% | 12/31/01 | |
| Developers Diversified | |||
| Realty | 199.8% | 07/24/02 | |
| Allegheny Energy | 163.3% | 07/24/02 | |
| Pulte Homes Inc. | 141.1% | 12/04/01 | |
| Ryland Group | 110.9% | 12/17/02 | |
| Boston Properties Inc. | 108.4% | 06/21/01 | |
| Simon Property Group | 86.8% | 07/24/02 | |
| SJW Corp | 80.8% | 06/26/01 | |
| J.C. Penney Corp. | 72.1% | 08/02/04 |
To further illustrate portfolio results, the following are the listing of the top ten performers during the first half of the fiscal year:
| Eagle Materials Corp. | +87.6% |
| Phelps Dodge Corp. | +53.9% |
| ConsolEnergy | +40.4% |
| Ethan Allen Interiors | +34.0% |
| PennVirginia Corp. | +33.5% |
| Union Pacific Corp. | +32.8% |
| Ryder System Corp. | +32.5% |
| DiamondRock Holdings | +32.0% |
| Sunstone Hotel Investors | +31.1% |
| Autoliv, Inc. | +30.5% |
Portfolio position shifts continued on an ongoing basis, with net realized gains in the period totaling $2.6 million. Of these, the largest were in the shares of Vornado Realty Trust—over +90% gain since purchase, Guidant Corp.—a +45% gain since purchase, Ryland Group—+300% gain since purchase, W.W. Grainger—+30% gain since purchase, NorthFork Bank—+45% gain.
Holdings sold which reflected corporate acquisitions, were Guidant Corp. and NorthFork Bank Corp.
Two sectors of the portfolio were significantly challenged during this six month period. These were the residential construction—homebuilding sector, which comprised 8.8% of the overall portfolio at the end of the period, and the bank financial group, which accounted for 7.0%. A total of 17 holdings in the portfolio showed declines in value over the six months, ranging from a -0.64% decline in the shares of Lennar Corp., to -17.6% in the shares of Standard Pacific Corp. The majority of these declines were related to the pattern of rising interest rates as the Federal Reserve continued its effort to counter possible inflationary trends. While taking some sizeable profits, notably in part of the position of Ryland Group, we elected to hold the generally long-term positions in the homebuilding group. Our view was that with valuations of price earnings multiples of one-third to one-half of the general market, these industry leaders would prove profitable long-term investments because of favorable demographics and consumer earning power. Nonetheless, the shares weakened, as for the first time in the current cycle, declines were seen in the rate of new orders in many of the most rapidly growing sections of the country. We anticipate that an end to the trend of interest rate increases should positively focus investors on the sizeable earnings prospects and long-term growth characteristics of this potentially undervalued group.
The financial services and bank sectors of the portfolio, together accounting for 15.7% of assets, provided a mix of performance during the period. It ranged from the 27.3% gain in shares of Goldman Sachs and the 26% gain of JP MorganChase to the 15.7% decline of Origen Financial and the 5.9% decline of Doral Financial. The positives were accomplished by investment banking positioned institutions reflecting strength in the financial markets. The negatives were among those impacted by rising interest rates, particularly in the mortgage segment.
Undervalued assets and earning power
A key part of our long-term strategy remains the search for undervalued assets and earning power. A substantial number of such holdings received better recognition and valuation during this period. They ranged from Ethan Allen Industries (where profit enhancing results were delivered due to a change in merchandising to interior design assistance, from a primary concentration on furniture sales) to Temple Inland Corp. (where recognition of undervalued land holdings led to profits growth). Notable was PNC Financial’s 20% gain in the period reflecting the realization of asset values for its large Blackrock Corp. holdings. At the end of the period the merger of GoldenWest Financial into Wachovia was proposed; yet another realization of the potential of undervaluation. This transaction led to a 22.7% increase during this period.
Pharmaceutical industry shares in the portfolio began to make a comeback after an adverse period earlier in 2005. Shares of Pfizer Inc. gained 18.6%, Wyeth Inc. 10.4%, while our largest holding in the group, Johnson & Johnson remained under modest pressure declining 5.4%, evidently held back by its failed bid for Guidant Corp.
This half year has been an unusually complex period for investing. Pressures changing valuations came from a larger than normal number of directions. Primarily we saw the financial world awash in liquidity brought about by rising oil prices and trade deficits. Financial restraint continued to be imposed by the Federal Reserve effort to hold the line against inflation, while expansionary trends of economic growth were not slowing.
6
Alpine Dynamic Balance Fund
Our investment strategy responses to these complexities varied by sector. In the fixed income sector, we balanced the major assets between long term maturity bonds and cash equivalents, with a modest intermediate term position. The overall fixed income commitment remained in the range of 25-30% of the portfolio. In equities we gradually moved to increase holdings of larger capitalization, undervalued equities, while still focusing on the search for special situations where growth in value would prove independent of major economic swings. We continue to aim to appropriately run a balanced portfolio with the goals of being both risk averse and opportunity seeking.
We appreciate the continuing support of this Fund’s investors and the contribution of our growing research and portfolio management staff.
Sincerely,
Stephen A. Lieber
Samuel A. Lieber
Co-Portfolio Managers
________
Investments in debt securities typically decrease in value when interest rates rise. This risk is usually greater for longer-term debt securities.
Please refer to the schedule of portfolio investments for fund holding information. Fund holdings and/or sector allocations are subject to change at any time and are not recommendations to buy or sell any security.
The Price to Earnings Multiple is a measure of the value of a company’s stock determined by its current share price, divided by its current annual earnings per share. It shows how much investors are willing to pay per dollar of earnings.
7
| Alpine Dynamic Dividend Fund |

This chart represents a comparison of a hypothetical $10,000 investment in the Fund versus a similar investment in the Fund’s benchmark. The graph and the table do not reflect the deduction of taxes that a shareholder would pay on Fund distributions or the redemption of Fund shares. Investment performance reflects the waiver and recovery of certain fees. Without the waiver and recovery of fees, the Fund’s total return would have differed.
Performance data quoted represents past performance and is not predictive of future results. Investment return and principal value of the Fund fluctuate, so that the shares, when redeemed, may be worth more or less than their original cost. Performance current to the most recent month end may be lower or higher than performance quoted and may be obtained by calling 888-785-5578. The Fund charges a redemption fee equal to 1.00% of the net amount of the redemption if you redeem your shares less than 60 days after you purchase them.
The Moody’s Equity Mutual Fund Growth Income Index tracks a group of similar funds that typically correspond to standard classifications based on investment objectives and fundamental policies. The S&P 500 Index is designed to measure performance of the broad domestic economy through changes in the aggregate market value of 500 stocks representing all major industries. The Lipper Equity Income Funds Average is an average of funds that seek relatively high current income and income growth through investing 60% or more of their respective portfolios in equities. The Moody’s Equity Mutual Fund Growth Income Index, the S&P Index and the Lipper Equity Income Funds Average are unmanaged and do not reflect the deduction of fees associated with a mutual fund, such as advisor fees. The performance for the Dynamic Dividend Fund reflects fees for these value-added services. Investors cannot directly invest in an index.
Comparative Annualized Returns as of 4/30/06(Unaudited) | |||
6 Months(1) | 1 Year | Since Inception (9/22/2003) | |
| Alpine Dynamic Dividend Fund | 16.19% | 23.26% | 23.56% |
| Moody’s Equity Mutual Fund Growth Income Index | 8.98% | 15.40% | 10.42% |
| S&P 500 Index | 9.64% | 15.42% | 11.97% |
| Lipper Equity Income Fund Average | 10.80% | 15.94% | 14.29% |
| Lipper Equity Income Fund Ranking | N/A(1) | 25/227 | 2/182 |
________
| (1) | Not annualized. The NASD does not recognize rankings for less than one year. | |||
8
Alpine Dynamic Dividend Fund
Commentary
We are pleased to report that the Alpine Dynamic Dividend Fund is off to a strong start in 2006, providing a total return of 16.19% for the six-month period ended April 30, 2006. This compares to a 9.64% gain for the S&P 500 Stock Index and an 8.98% return for the Moody’s Equity Growth Income Index for the same time period. Since inception on September 22, 2003, ADVDX has produced an annual return of 23.56%, which compares favorably to a return of 11.97% for the S&P 500 Index and a 10.42% return for the Moody’s Equity Growth Income Index. The Fund ended the period on April 30, 2006 with total net assets of $451.3 million.
The Alpine Dynamic Dividend Fund offers a balanced approach to optimizing both tax-qualified dividend income and long-term growth of capital. We scan the globe looking for the best dividend opportunities for investors, employing a multi-cap, multi-sector, and multi-style investment approach.
ADVDX increased its dividend payment by 25.4% for the 12 months ended April 30, 2006, providing a dividend distribution of $1.56 per share
For the six months ended April 30, 2006, ADVDX paid $0.80 in ordinary dividend income, with nearly all of the distribution being qualified for the maximum taxable rate of 15%. For the 12 months ended April 30, 2006, the Fund paid a total of $1.56 in dividend income, representing a 25.4% increase versus the $1.25 paid in the 12 months ended April 30, 2005. Based on the Fund’s closing NAV per share of $13.06 on 4/29/06, the $1.56 distribution represents a high level of dividend income. For example, the dividend yield during the same time period for the S&P 500 Electric Utility Index was 3.5% and the yield for the IShares DJ Select Dividend Index Fund (DVY) was 3.3%.
| Top 10 Holdings* (Unaudited) | ||
| 1. | Macquarie Infrastructure | |
| Company Trust | 2.05% | |
| 2. | TXU Corp. | 1.84% |
| 3. | E.ON AG | 1.82% |
| 4. | Textron Inc. | 1.51% |
| 5. | Bank of America Corporation | 1.50% |
| 6. | General Electric Company | 1.47% |
| 7. | Regal Entertainment Group | 1.43% |
| 8. | Nam Tai Electronics, Inc. | 1.42% |
| 9. | Exelon Corporation | 1.39% |
| 10. | Oriflame Cosmetics SA-SDR | 1.39% |
| _______ | ||
* Portfolio holdings are as of 4/30/06 and are subject to change. Portfolio holdings are not recommendations to buy or sell any securities. Top 10 Holdings does not include short-term investments. | ||
Beginning in March 2006, ADVDX increased its regular monthly minimum dividend by $0.01, from $0.06 to $0.07 per share. In addition, in the third month of each quarter the Fund distributes excess dividend income that has accumulated during the quarter.
ADVDX was designed specifically to maximize the amount of distributed dividend income that is qualified for the new 15% tax rate, while also employing a research driven approach to identifying companies with the potential for dividend increases and capital appreciation. We combine three different research driven investment strategies—Dividend Capture, Value, and Growth—to maximize dividends and total returns for our shareholders. These strategies are reflected in both our top 10 holdings as well as our best performing stocks in first half 2006.
9
Alpine Dynamic Dividend Fund
Our “Dividend Capture Strategy’’ enhances the qualified dividend income generated by the Fund
First, we run a portion of our portfolio with a dividend capture strategy, where we invest in high yielding stocks or in special situations where large cash balances are being returned to shareholders as one-time special dividends. These actions reflect strong corporate balance sheets and management’s incentive to distribute excess retained cash as dividend income based on lower qualified tax rates. We enhance the return of this portfolio by electively rotating a portion of our high yielding holdings after the 61-day ownership period required to obtain the 15% dividend tax rate. Traditionally, investors buy a dividend paying security and hold it over the course of twelve months, “capturing’’ four quarterly dividends. Our dynamic approach to dividend investing allows us to capture up to six dividends per year with the same capital by “rotating’’ between two securities with similar characteristics throughout the same twelve months.
One facet of our dividend capture strategy is our search for core, long term holdings in companies that historically generate consistent strong free cash flow and regular large dividend distributions, usually above 5%. Three of our largest current holdings are in this category, including Macquarie Infrastructure Trust with a 7.1% current yield, Nam Tai Electronics with a 6.6% current yield, and Regal Entertainment with a 6.4% current yield.
Macquarie Infrastructure, our top holding, owns and operates infrastructure businesses in the U.S. including airport service, parking facilities, water utilities, and privately owned toll roads. These businesses have high barriers to entry, long-term contracts and strong cash flow, and are growing through acquisition. Nam Tai, based in Macau, China, is an electronics manufacturing and design services provider to OEMs in telecommunication and consumer electrics. The company is benefiting from strong demand for its wireless technology including cell phones and hand held PCs and is expanding into LCD modules for TV, computers, and automotive. Lastly, Regal is the largest theater owner in the U.S., generating 20% of total U.S. box office revenue. Regal is benefiting from a rebound in theater attendance in 2006 and is continuing to consolidate smaller operators and expanding into two new business areas—in-theater advertising and live digital satellite events like concerts, video game tournaments and lectures that increase theater utilization. We see Regal as a defensive 15% earnings grower with high inside ownership and significant free cash flow that is being returned to shareholders.
The Fund captured 35 special dividends and 65 dividend increases in the first six months of fiscal 2006
Another facet of strategy to maximize qualified dividend income is our capturing of special dividend situations, where strong operating companies are returning excess cash to shareholders in the form of one-time dividends due, for instance, to a restructuring or recent strong operating performance. Two of our largest holdings are companies that announced large special dividends payments in first half fiscal of 2006. E.ON AG, Europe’s second-largest utility and one of Germany’s largest companies, announced a special dividend yielding 5% in addition to its regular annual dividend distribution of 3% payable in May 2006 following the sale of its stake in the specialty chemical maker Degussa AG.
Another top international holding is Oriflame Cosmetics based in Stockholm, Sweden. The company paid an annual dividend of 3.5% in May and announced an expected return of additional cash yielding close to 10% in the second half of 2006 based on strong operating performance and an overcapitalized balance sheet. Oriflame is a global cosmetics direct sales company with over 1.5 million sales consultants in 55 countries primarily in emerging Europe with strong growth being achieved through expansion in the sales consultant base in existing markets as well as through entries in new markets and productivity improvements.
In the six months ended April 30, 2006, the Alpine Dynamic Dividend Fund owned 35 stocks that declared special dividends and 65 stocks that raised their dividends in that time period by an average exceeding 30%. Since inception on September 22, 2003, this growing trend has brought over 130 special dividend payments for the fund.
Our “Value/Restructuring Strategy’’ looks for attractively valued or restructuring dividend payers
Our second major strategy is what we call “value with a catalyst or restructuring strategy’’, where our internal research points to under-valued or mis-priced equity opportunities for companies with above average dividend yields. We also look for turnaround situations or depressed earnings where we believe there is a catalyst for an earnings recovery or a restructuring or major corporate action that is expected to add value. The key characteristic for this strategy is low valuations relative to historical averages and above average dividend yields for a combined objective of capital appreciation and high qualified dividend income.
We would categorize three of our top holdings in this strategy. Both TXU Corp. and Exelon Corp. are US utility companies currently yielding 2.8% and each experiencing a strong rebound in earnings. The companies are benefiting from the strength in their core energy businesses and from restructuring profitable businesses and shedding unprofitable businesses. Lastly, we believe Bank of America (BAC) offers attractive upside earnings potential following it’s acquisition of credit card issuer MBNA in June of 2005 and the strong outlook for its diversified financial services. Each of these bellwether stocks are trading at what we believe are very attractive valuations relative to historical valuation ranges and future earnings prospects for these industry leaders.
10
Alpine Dynamic Dividend Fund
Our “Growth and Income Strategy’’ targets capital appreciation in addition to yield
Our third strategy identifies core growth and income stocks that may have slightly lower but still attractive current dividend yields and predictable earnings streams plus a catalyst for capital appreciation and dividend increases. In our top 10 holdings, we would categorize General Electric (2.9% current yield) and Textron (1.8% current yield) in this group. These companies are estimated to grow earnings annually by 15-20% over the next several years and each has raised their dividend payments by over 10% in the past year.
We believe both GE and Textron offer excellent upside potential as diversified manufacturers and service providers with strong domestic and international growth prospects. GE is entering the sweet spot for its mid- to late-cycle businesses, which include Industrial Products, Power Generation, Water, Transportation, and Infrastructure plus it offers stability from its Financial, Medical, and Entertainment units. And Textron is benefiting from a multi-year recovery in two of its primary businesses, Cessna business jets and Bell helicopters. Cessna delivery slots are sold out for 2006 and 2007 and the company posted record margins in 2005 on volumes about 20% below prior records. Bell is seeing resurgence in commercial demand for its helicopters from industries such as mining, oil and gas exploration, and utilities. Plus, Bell is also seeing strong demand for its military aircraft based on the aging U.S. fleet and orders for its tilt-rotor V-22 that can take off like a helicopter and fly like an airplane. Both GE and Textron management have been exiting unattractive businesses, have a focus on operational excellence, have a disciplined use of capital, and are driving improvements in returns.
Our “multi-cap research approach’’ finds rewarding opportunities in the small cap dividend universe
Although several of our top 10 holdings are from the traditional higher yield, large capitalization segments of the dividend-paying universe, we believe we have taken a different approach relative to many other dividend funds in that a large portion of our holdings are in small and mid-cap stocks (less than $5 billion in market capitalization). As of 4/30/05, four of our top ten holdings had market capitalization of between $750 million and $3 billion (Regal, Oriflame, Nam Tai, and Macquarie).
The average market capitalization of the 111 holdings in our portfolio was $33.8 million at 4/30/06 and the median was $5.8 billion versus a median market capitalization of $4.7 billion at fiscal year end 2005 on 10/30/05. This reflected our view that the valuations on some of our small cap holdings looked stretched relative to our outlook for a slowdown in earnings growth in 2006. As interest rates rise and the economy shifts toward more moderate growth, we would expect larger, multinational companies to outperform smaller and more speculative stocks, in general. However, we still favor small and mid capitalization companies where our fundamental research points to strong earnings growth and where management is committed to returning cash to shareholders.
The Fund’s top performers in first half 2006 were international, small cap companies in niche markets
Capturing international dividend opportunities is an important component of our dividend strategy. Besides taking a multi-cap approach, we also invest approximately 25-30% of our assets in international holdings where we have found attractive growth opportunities and traditionally larger dividend payouts than we see in the U.S. In addition, we were positively impacted throughout the first half of fiscal 2006 by the decline in the U.S. dollar, particularly against the Euro, which increased 5.4% from 1.1992 on 10/31/05 to 1.2634 on 4/28/06. We currently do not hedge our currency exposure as we believe that the dollar is in a period of long term secular decline and that our international strategy and the opportunities we see overseas will continue to benefit our shareholders.
Every quarter since our inception, the majority of our top performers are small cap stocks. This includes first half fiscal 2006 where seven of our top performers had US dollar market capitalizations of less than $2 billion. However, interestingly, seven of our top ten performers in first half 2006 were also international companies based in six different countries in Scandinavia, Europe, and Australia. Our top 10 performers were all strong growth companies in niche markets and all produced internal rates of return for the Fund between 47% and 69% in first half fiscal 2006. We believe this strong performance reflects our bottoms-up fundamental research style and our ability to scan the globe to find attractive dividend paying investment opportunities for our shareholders.
Our top two performers are both companies based in Norway as that country has experienced a strong economic rebound associated with its energy and shipping sectors. Aker Yards AS, is a ship builder with a 4% yield and a market cap of about $1.5 billion. It is experiencing strong demand for its vessels used in offshore oil and gas exploration, production and service, as well as ships in the drybulk and container ship markets and cruise ship and ferry sectors. The stock provided close to a 70% return for the fund in first half 2006 and we decided to lock in our profit and sold the stock in mid April 2006.
11
Alpine Dynamic Dividend Fund
Our second best performer was a pan-Nordic investment bank called ABG Sundal Collier ASA, providing a 64% return for the Fund in first half 2006. The company experienced strong demand from its local Scandinavian markets for its financial services in areas like mergers and acquisitions, capital markets, research, and sales and trading. The company provided a dividend payment yielding about 15% of the current value of the stock in mid-May 2006. Two of our other top 10 performers were also diversified financial services providers in Scandinavia, including D. Carnegie & Co AB (61% return) based in Sweden with a current yield of over 7%, and Acta Holding ASA (47% return) based in Norway with a 10% current dividend yield.
Our other top international performers were Alk-Abello A/S (62% return), the Danish producer of pharmaceuticals for allergy vaccinations. The company recently received approval for a new oral allergy medication for grass and ragweed and paid out a large special dividend in October of 2005. Woodside Petroleum (53% return), with a 3.2% current yield, experienced strong demand for its exploration and production of oil and gas and LNG in Australia. And Euronext (52% return), the pan-European stock exchange, saw strong price appreciation based on growth and acquisitions in core earnings base and from takeover advances from the New York Stock Exchange and the Deutsche Boerse.
Our three best performing U.S. listed stocks were Diamond Offshore Drilling (61% internal rate of return in first half fiscal 2006), which experienced a strong rebound in demand and pricing for its deep water drilling rigs, and the company returned excess cash in the form of a $1.50 special dividend in February of 2006. Our last two top performing U.S. names were small cap Angelica Corp. (51% return), the provider of laundry services and uniform rentals to the healthcare and hospitality industry that saw its stock price rebound on some shareholder activism and a decline in its energy costs associated with the decline in natural gas prices. And West Pharmaceuticals (47% return), the medical products company that is growing earnings 20% with its design and manufacturing of packaging and drug delivery systems. As of April 30, 2006, we no longer held positions in D. Carnegie or Angelica as we achieved our price objectives.
Although small cap stocks can provide strong earnings growth and performance on the upside, they can also have large price swings to the downside when news flow or fundamentals unexpectedly turn negative. Our five worst performers in first half fiscal 2006 were also small cap stocks, but each position was relatively small and represented only a minor percentage of the portfolio (less than 1% each).
Our worst performer in first half fiscal 2006 was Pilgrim’s Pride Corp, the producer of prepared and fresh chicken products in the U.S. and Mexico. After reporting record earnings in fiscal 2005 (ended September) and announcing a $1 special dividend on December 1, 2005, the company subsequently lowered its earnings guidance for fiscal 2006 on January 3, 2006 due to weak results at its Mexican operations and a 35% decline is chicken pricing in just one quarter on concerns over avian influenza. The stock subsequently declined by over 35% during our holding period in first half fiscal 2006 and we sold our shares on the continuing negative pricing outlook.
Other worst performers were all small positions in companies that operate in the drybulk shipping sector, Dryships, Quintana Maritime, and Diana Shipping, and provide high current dividend yields ranging between 9 and 14%. These holdings declined between 17% and 27% in first half fiscal 2006 as pricing for shipping commodities like grain, iron ore, and coal declined due to above average inventory levels and excess shipping capacity that was exacerbated by a mild winter and few port delays. Lastly, international holding Tietoenator OYJ is based in Finland with a 3.9% current yield and a paid a 2% special dividend in November 2005. Our position declined 13% during our holding period in first half 2006 and its information technology consulting and services business experienced margin pressure as its cost based unexpectedly rose more than its revenue base. We no longer hold positions in any of these underperforming companies as we see better investment alternatives for our shareholders.
Outlook for 2006: Following Recent Market Weakness, We Believe Dividend Payers Will Outperform
Shortly after the close of our fiscal first half on April 30, 2006, the S&P 500 index reached a 52-week high on May 5 at 1,325.76. Subsequently, continuing high energy and commodity prices, commentary by U.S. Federal Reserve governors about inflationary pressures, and increases in interest rate internationally sparked a sell off in the global equity markets. The result was the S&P 500 Index declining to 1,223.69 on June 13th, a 7.7% drop from the May peak and erasing all gains for the year. The areas hardest hit by the global sell off were sectors or countries that had experienced the largest gains and were therefore subjected to profit taking and significant selling pressure. This hurt the areas in our portfolio where we had the most gains, like the oil services sector (OSX), which by May had appreciated by 28% in 2006 and subsequently declined by 18%. And International markets like the UK (UKX) and Sweden (OMX), which are traditionally large yielding markets and had appreciated by 8% and 13% through the May peak, and subsequently declined by 8% and 13%, respectively, and giving back all their gains.
12
Alpine Dynamic Dividend Fund
In addition, our portfolio which is about 30% invested in international stocks, was negatively impacted by the recent rise in the U.S. dollar, particularly against the Euro, which declined 3.1% to 1.253 on June 13th after peaking on May 12th at 1.293. We continue to believe that there exists substantial opportunity for our investors to benefit from higher yields and interesting growth opportunities overseas. We are committed to our fundamental research approach and look for companies both domestically and internationally with sustainable earnings growth and compelling valuations in a rising global interest rate environment, and we continue to find attractive investment prospects.
As we look into the second half of 2006, we continue to be optimistic about the outlook for dividend paying stocks. Some of our favorite sectors for dividend increases and capital appreciation continue to be in oil services, industrials, financial services, business services, healthcare, and commodities. The recent market sell-off provides opportunities to invest in many of these sectors at much more attractive levels. In a moderate growth environment, we believe investors will be drawn to high quality, internationally oriented, and more defensive stocks and that should bode well for dividend payers and our fundamental strategy of searching globally and in multi-caps and multi-sectors.
Based on our assumption of slowing, single-digit earnings growth for the S&P 500 over the next few years, we believe investors will continue to demand higher dividend yields. As dividends become a larger part of their total return expectations, investors will focus particularly on the lower 15% tax rate. The current yield on the S&P 500 is 1.9%, but historically the dividend component of total return was much higher. According to Ibbotson Associates data, the average annual total return on large company stocks from 1926 to 2005 was 10.4% per year, with dividends accounting for 41.2% of the total return, or 4.3% of the total 10.4%. During that same time period, bonds returned 5.9% and cash 3.7%. We believe investors will look to put more money in attractive tax-advantaged dividend payers to enhance returns.
With companies still sitting on record levels of cash, we expect strong merger and acquisition activity to continue on the record pace we have seen in first half 2006 as companies look to supplement slowing organic growth. However, we still expect a substantial amount of cash will be returned to shareholders as either share repurchases or increased dividend payouts. Alpine also looks for companies with high levels of inside ownership, as the 15% tax rate provides additional incentive for dividends. And this dividend tax benefit has recently been extended by Congress until December 2010.
Companies in the S&P 500 index ended 2005 paying out 30% of their earnings in the form of dividends versus a historical average of 48%. Given large cash positions, solid earnings potential, low payout ratios and lack of other uses of cash, we continue to believe that companies will continue to increase their dividends in 2006.
These positive fundamentals will be balanced with the risks of rising interest rates and oil prices, potentially slower global growth and continued geopolitical uncertainties. Our approach is to remain broadly diversified within the dividend-paying universe while actively looking for undervalued opportunities. The selection of stocks in our portfolio is based on our independent appraisal of each company’s potential for profits, dividend growth and market revaluation across a broad spectrum of stock market capitalizations, industries, and international borders. Our goal in 2006 is to continue to be able to distribute attractive dividend payouts to our shareholders by capitalizing on our research driven approach to identifying attractive situations as well as through our active management of the portfolio.
Thank you for your participation and we look forward to a prosperous year in 2006.
Sincerely,
Jill K. Evans
Kevin Shacknofsky
Co-Portfolio Managers
__________
Investing in small and mid cap stocks involves additional risks such as limited liquidity and greater volatility as compared to large cap stocks.
The Fund invests in foreign securities which involve greater volatility and political, economic and currency risks and differences in accounting methods.
Compared to bonds and cash, large cap stocks are generally considered more volatile, typically do not offer a fixed rate of current return and rank lower in the issuer’s capital structure in the event of bankruptcy or restructuring.
Please refer to the schedule of portfolio investments for fund holding information. Fund holdings and sector allocations are subject to change and should not be considered a recommendation to buy or sell any security.
Cash flow measures the cash generating capability of a company by adding non-cash charges (e.g. depreciation) and interest expense to pretax income. Neither the Fund nor any of its representatives may give tax advice. Investors should consult their tax advisor for information concerning their particular situation.
13
| Alpine Dynamic Financial Services Fund |

This chart represents a comparison of a hypothetical $10,000 investment in the Fund versus a similar investment in the Fund’s benchmark. The graph and the table do not reflect the deduction of taxes that a shareholder would pay on Fund distributions or the redemption of Fund shares. Investment performance reflects the waiver and recovery of certain fees. Without the waiver and recovery of fees, the Fund’s total return would have differed.
Performance data quoted represents past performance and is not predictive of future results. Investment return and principal value of the Fund fluctuate, so that the shares, when redeemed, may be worth more or less than their original cost. Performance current to the most recent month end may be lower or higher than performance quoted and may be obtained by calling 888-785-5578.
The NASDAQ 100 Financial Index is a capitalization-weighted index of the 100 largest financial companies, as well as foreign issues, including American Depositary Receipts (ADRs), traded on the NASDAQ National Market System (NASDAQ/NMS) and SmallCap Market. The PHLX/KBW Bank Index is a modified cap-weighted index consisting of 24 exchange-listed and National Market System stocks, representing national money center banks and leading regional institutions. The S&P Index is designed to measure performance of the broad domestic economy through changes in the aggregate market value of 500 stocks representing all major industries. The Lipper Financial Services Funds Average is an average of funds whose primary objective is to invest primarily in equity securities of companies engaged in providing financial services. The NASDAQ Financial 100 Index, PHLX Bank Index, the S&P 500 Index and the Lipper Financial Services Funds Average are unmanaged and do not reflect fees associated with a mutual fund, such as investment adviser fees. The performance for the Dynamic Financial Services Fund reflects the deduction of fees for these value-added services. Investors cannot directly invest in an index.
Comparative Annualized Returns as of 4/30/06(Unaudited) | |
Since Inception(1) (11/1/2005) | |
| Alpine Dynamic Financial Services Fund | 14.86% |
| NASDAQ 100 Financial Index | 5.94% |
| PHLX/KBW Bank Index | 13.37% |
| S&P 500 Index | 9.64% |
| Lipper Financial Services Funds Average | 15.19% |
| Lipper Financial Services Fund Ranking | N/A(1) |
________
| (1) | Not annualized. The NASD does not recognize rankings for less than one year. |
14
Alpine Dynamic Financial Services Fund
| Top 10 Holdings*(Unaudited) | ||
| 1. | Matrix Bancorp, Inc. | 6.04% |
| 2. | American Capital Strategies | 3.67% |
| 3. | AmCOMP, Inc. | 3.26% |
| 4. | The Allstate Corporation | 2.98% |
| 5. | Nasdaq Stock Market, Inc. | 2.96% |
| 6. | First Security Group Inc. | 2.95% |
| 7. | Wachovia Corporation | 2.81% |
| 8. | Berkshire Hills Bancorp, Inc. | 2.72% |
| 9. | SVB Financial Group | 2.68% |
| 10. | SunTrust Banks, Inc. | 2.50% |
| ________ | ||
* Portfolio holdings are as of 4/30/06 and are subject to change. Portfolio holdings are not recommendations to buy or sell any securities. Top 10 Holdings does not include short-term investments. | ||
Commentary
We would like to welcome all our shareholders with this first shareholder letter of the Alpine Dynamic Financial Services Fund. Since the inception on November 1, 2005 the Fund generated a total return of 14.86%. This compares favorably to returns of 5.94% for the NASDAQ 100 Financial Index and 13.37% for the KBW Bank Index.
The investment objective of the Fund is to seek long term growth of capital and consistent above average total returns as compared to those typical of investments made in public equities. In order to achieve this goal we have constructed an investment strategy of investing in companies that operate or serve the financial services industry. The Fund is actively managed in order to position the portfolio with companies which have the potential of outperforming the industry. This process includes both the allocation of funds along different business lines, as well as stock selection. In determining the composition of the portfolio along business lines, we first develop a macro overview of the financial services industry, then invest in areas we feel will outperform. In our stock selection we implement several different strategies. One of these include finding well managed, undiscovered companies which could experience a valuation expansion as the company grows and attracts the attention of Wall Street. Another strategy is to take advantage of industry consolidation by purchasing companies with attractive franchises which may be acquired or in companies that are creating shareholder value through acquisitions. Another approach is to search for companies with a special situation which can provide a catalyst for outperformance. Lastly, we look to take advantage of market volatility and investor misperception to purchase good companies at attractive prices.
Over the long term we anticipate that banks will compose the largest part of the investment portfolio. This is due in part by the fact that banks represent the greatest segment of the financial industry. We also like the group because the vast number of independent banks provides an opportunity for further consolidation. In the first six months of the Fund’s existence, three banks in our portfolio were acquired. Among the banks being taken over was Legacy Bank of Harrisburg, Pennsylvania. F.N.B. Corporation, which is a bank holding company headquartered on the western part of the state, is acquiring the bank at a deal priced 44% above our cost. The second bank which signed a merger agreement was Albemarle First Bank of Charlottesville, Virginia. This too is an in-state merger with Winchester based Premier Community Bankshares acquiring the bank at a purchase price which is 33% above our cost. The third company, a thrift currently in the process of being acquired, is Sound Federal Bancorp of White Plains, New York. Hudson City Bancorp of Paramus, New Jersey, which is flush with capital from their secondary offering, announced plans to purchase the thrift at 10% above our cost.
We view consolidation in the bank and thrift industries to be a long multi-decade event. When compared to other developed countries, the U.S. has an inordinate number of banks. We believe the drivers to further consolidation are the opportunity to grow revenue by leveraging a larger customer base and increase profitability through improved operating efficiency. We thus search for companies that should benefit from this expected consolidation as either being the good buyers or smart sellers.
15
Alpine Dynamic Financial Services Fund
Current business conditions may also prompt bankers to decide to sell their franchise. Monetary tightening by the Federal Reserve and a flattening yield curve have made a more challenging business environment for financial companies. Net interest margins at most companies have narrowed, and the gain from loan and security sales has lessened over the past six months. Looking ahead to the second half of the Fund’s fiscal year, we see only a modest decline in the net interest margin from current levels. Our assumption is based on the Federal Reserve ending their rate increases later this summer and the banks’ ability to lag increases in their deposit rates behind the rates charged on their loan products. Higher loan rates may cause the pace of consumer borrowing to slow but we anticipate commercial loan demand to remain strong and contribute to balance sheet growth. On the funding side of the balance sheet, higher interest rates and an improving stock market have caused customers to move their idle funds held in saving accounts to other investments. This has resulted in a competitive environment for attracting low cost deposits and increases the franchise value of banks which have a low cost of funds. We expect loan loss provisioning to remain modest due to a very good credit quality environment. Operating expenses should also remain in check as managements look for ways to improve productivity. Among the fee based businesses, mortgage banking operations should remain under pressure as the refinancing boom wanes. Growth is expected in asset management, insurance and annuity sales, capital markets activity, and investment advisory businesses. Based on our outlook, we expect companies that focus on commercial customers and have capital markets exposure to outperform those with a dependence on consumer and mortgage banking for the remainder of the fiscal year.
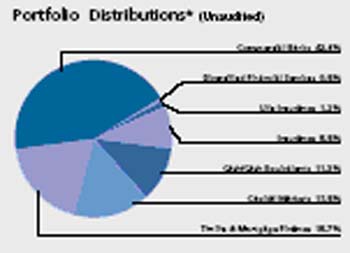
Looking at the current composition of the investment portfolio, Commercial Banks are the largest component accounting for 43% of net assets. This investment is diversified into thirty-three bank holdings. The vast majority of these holdings are in small-cap banks. The reason for this is that we either find better value, special situations, or takeover candidates in the small-cap area versus large-cap companies. A good example is our largest bank position, First Security Group. This is a young bank located in Chattanooga, Tennessee, that has good growth trends but trades at a discount to peers. We diversify our holdings geographically to avoid the risk of any regional recessions. We also look internationally for ideas, but the primary focus will be the U.S. market.
The next largest component is Thrifts and Mortgage Finance at 19% of the portfolio. There are twelve holdings with an investment approach that is similar to commercial banks, e.g., small-cap, and geographically diversified. Our largest holding is Matrix Bancorp. The Denver based company is a turnaround story with a new management team, new business model which should create shareholder value, and is trading at a discount to peers.
The third largest component is Capital Markets at 16% of net assets. There are eight holdings with the largest holding being NASDAQ Stock Market, Inc. We expect to take advantage of the recent sell-off in this sector to add new positions. As previously mentioned, we have a positive outlook on this group for the remainder of the fiscal year.
The General and Life Insurance account for 10% of the portfolio. The largest holding is the Florida based AmCOMP, Inc. which we purchased in their equity offering earlier this year.
A key component of our outlook is the action of the Federal Reserve. As Fed policy and economic trends change, we will adjust our outlook accordingly, and if necessary, reposition the investment portfolio to achieve our goal of above average results. Again, we would like to thank you for your commitment to this new fund and look forward to updating you on our progress at year end.
Sincerely,
Peter J. Kovalski
Portfolio Manager
________
The fund primarily invests in equity securities of financial services companies and will be affected by risk factors particular to this industry such as regulation, monetary and fiscal policies and interest rates, as well as general market risks.
The fund invests in smaller companies, which involve additional risks such as liquidity and greater volatility. The fund invests in foreign securities which involve greater volatility and political, economic and currency risks and differences in accounting methods.
There is no assurance the fund will achieve its investment objective.
Please refer to the schedule of portfolio investments for fund holding information. Fund holdings and/or sector allocations are subject to change at any time and are not recommendations to buy or sell any security.
16
FIXED INCOME MANAGER REPORTS

Alpine Municipal Money Market Fund
Alpine Tax Optimized Income Fund
| Alpine Municipal Money Market Fund |

| * | The Advisor return for 2004 is from 3/30/04 (inception)-12/31/04. |
The graph and the table do not reflect the deduction of taxes that a shareholder would pay on Fund distributions or the redemption of Fund shares. Investment performance reflects the waiver of certain fees. Without the waiver of fees, the Fund’s total return would have been lower.
| Top 10 Holdings* (Unaudited) | ||
| 1. | Class B Revenue Bond Certificates - Series Trust | |
| 2004-1 4.250%, 05/05/2006 | 4.24% | |
| 2. | Puttable Floating Option Tax-Exempt Receipts, | |
| Regular Floats Mode A PPT-38, | ||
| 4.010%, 05/05/2006 | 4.04% | |
| 3. | Lakemoor Multifamily Revenue | |
| 4.030%, 05/05/2006 | 3.02% | |
| 4. | Prentiss County Industrial Development Revenue, | |
| Heidelberg Eastern, 3.700%, 05/28/2006 | 2.55% | |
| 5. | Houston Community College System Revenue, | |
| P-Floats - PT-2741, 3.500%, 06/08/2006 | 2.40% | |
| 6. | Finance Authority Single Family Revenue - | |
| Series C 3.500%, 09/01/2006 | 2.27% | |
| 7. | Archer City Growth & Development, Pork | |
| Products II 3.990%, 05/05/2006 | 1.89% | |
| 8. | Beaver County Industrial Development Authority, | |
| BASF Corp. 3.870%, 04/29/2006 | 1.89% | |
| 9. | Jackson Health Educational & Housing Facility | |
| Board Revenue, Park Ridge Apartments, | ||
| 4.000%, 05/05/2006 | 1.89% | |
| 10. | Port Corpus Christi Authority Nueces County | |
| Waste Disposal, Flint Hills Resources LP, | ||
| 4.100%, 05/05/2006 | 1.89% | |
| _______ | ||
* Portfolio holdings are as of 4/30/06 and are subject to change. Portfolio holdings are not recommendations to buy or sell any securities. Top 10 Holdings does not include short-term investments. | ||
18
Alpine Municipal Money Market Fund
Equivalent Taxable Yields as of 4/30/06(Unaudited) |
Joint return | Single return | Marginal tax rate | Your tax-exempt effective yield of 3.69% is equivalent to a taxable yield of: | ||
| $ | 59,401-119,950 | $ | 29,701-71,950 | 25% | 4.92% |
| $ | 119,951-182,800 | $ | 71,951-150,150 | 28% | 5.13% |
| $ | 182,801-326,450 | $ | 150,151-326,450 | 33% | 5.51% |
| Over $326,450 | Over $326,450 | 35% | 5.68% |
The chart reflects projected 2005 marginal federal tax rates before limitations and phaseouts. Individuals with adjusted gross income in excess of $142,700 should consult a tax professional to determine their actual 2005 marginal tax rate.
Performance data quoted represents past performance and is not predictive of future results. Investment return and principal value of the Fund fluctuate, so that the shares, when redeemed, may be worth more or less than their original cost. Performance current to the most recent month end may be lower or higher than the performance quoted and may be obtained by calling 888-785-5578.
The Lipper Tax-Exempt Money Funds Average is an average of funds that invest in high quality municipal obligations with dollar-weighted average maturities of less than 90 days. The Lipper Tax-Exempt Money Market Funds Average is unmanaged and does not reflect the deduction of fees associated with a mutual fund, such as investment advisor fees. The performance for the Municipal Money Market Fund reflects the deduction of fees for these value-added services. Investors cannot directly invest in an index.
Comparative Annualized Returns as of 4/30/06(Unaudited) | ||||
6 Months(2) | 1 Year | 3 Years | Since Inception(1) | |
| Alpine Municipal Money Market Fund—Investor Class | 1.53% | 2.82% | 1.80% | 1.73% |
| Alpine Municipal Money Market Fund—Advisor Class | 1.41% | 2.56% | N/A | 1.88% |
| Lipper Tax-Exempt Money Market Funds Average | 1.18% | 2.10% | 1.12% | 1.07% |
| Lipper Tax-Exempt Money Market Fund Rank—Investor Class | N/A(2) | 1/114 | 1/104 | 1/94 |
| Alpine Municipal Money Market Fund—Investor Class, 7-day effective yield (as of 04/28/2006): 3.69% | ||||
| Alpine Municipal Money Market Fund—Advisor Class, 7-day effective yield (as of 04/28/2006): 3.43% | ||||
_________
| (1) | Advisor Class shares commenced on March 30, 2004 and Investor Class shares commenced on December 5, 2002. Returns for indices are since December 5, 2002. |
| (2) | Not annualized. The NASD does not recognize rankings for less than one year. |
19
| Alpine Tax Optimized Income Fund |
* The Advisor return for 2004 is from 3/30/04 (inception)-12/31/04.
The graph and the table do not reflect the deduction of taxes that a shareholder would pay on Fund distributions or the redemption of Fund shares. Investment performance reflects the waiver of certain fees. Without the waiver of fees, the Fund’s total return would have been lower.
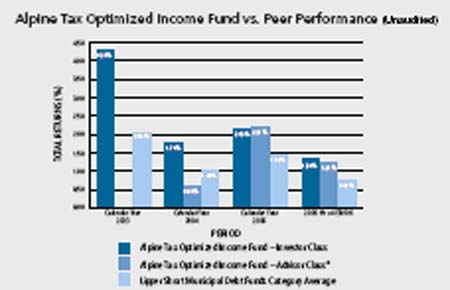
Performance data quoted represents past performance and is not predictive of future results. Investment return and principal value of the Fund fluctuate, so that the shares, when redeemed, may be worth more or less than their original cost. Performance current to the most recent month end may be lower or higher than performance quoted and may be obtained by calling 888-785-5578. The Fund charges a redemption fee equal to 0.25% of the net amount of the redemption if you redeem your shares lees than 30 days after you purchase them.
The Lehman Brothers Municipal 1 Year Bond Index is the 1-year (1-2) component of the Municipal Bond Index. The Lehman Brothers Municipal Bond Index is a rules-based, market-value weighted index engineered for the long-term, tax-exempt bond market. Lipper Short Municipal Debt Funds Index is an unmanaged index that tracks funds that invest in municipal debt issues with dollar-weighted average maturities of less than three years. The Lehman Brothers Municipal 1 Year Bond Index and the Lipper Short Municipal Debt Funds Average are unmanaged and do not reflect the deduction of fees associated with a mutual fund, such as investment advisor fees. The performance for the Tax Optimized Income Fund reflects the deduction of fees for these value-added services. Investors cannot directly invest in an index.
Comparative Annualized Returns as of 4/30/06(Unaudited) | ||||
6 Months(2) | 1 Year | 3 Year | Since Inception(1) | |
| Alpine Tax Optimized Income Fund—Investor Class | 1.70% | 2.98% | 2.58% | 2.97% |
| Alpine Tax Optimized Income Fund—Investor Class (Pre-liquidation, After-tax) | 1.55% | 2.63% | 2.14% | 2.51% |
| Alpine Tax Optimized Income Fund—Investor Class (Post-liquidation, After-tax) | 1.55% | 2.73% | 2.19% | 2.50% |
| Alpine Tax Optimized Income Fund—Advisor Class | 1.86% | 3.02% | N/A | 1.93% |
| Alpine Tax Optimized Income Fund—Advisor Class (Pre-liquidation, After-tax) | 1.74% | 2.71% | N/A | 3.23% |
| Alpine Tax Optimized Income Fund—Advisor Class (Post-liquidation, After-tax) | 1.60% | 2.68% | N/A | 3.51% |
| Lehman Brothers Municipal 1 Year Bond Index | 0.98% | 1.97% | 1.44% | 1.59% |
| Lipper Short Municipal Debt Funds Average | 1.16% | 2.08% | 1.45% | 1.70% |
| Lipper Short Municipal Debt Fund Rank—Investor Class | N/A(2) | 11/64 | 2/53 | 2/48 |
___________
| (1) | Advisor Class shares commenced on March 30, 2004 and Investor shares commenced on December 5, 2002. Returns for indices are since December 5, 2002. |
| (2) | Not annualized. The NASD does not recognize rankings for less than one year. |
20
Alpine Tax Optimized Income Fund
| Top 10 Holdings* (Unaudited) | ||
| 1. | Local Government Environment | |
| Facilities Community Development | ||
| Authority Revenue Caddo-Bossier | ||
| Parishes, 4.810%, 05/05/2006 | 7.59% | |
| 2. | Tulsa County Industrial Authority | |
| Multifamily Revenue, Affordable | ||
| Housing Series B 5.250%, 05/28/2006 | 7.16% | |
| 3. | Maricopa County Industrial Development | |
| Authority Multifamily Housing Revenue | ||
| Affordable Housing - Series B, | ||
| 5.250%, 05/28/2006 | 6.72% | |
| 4. | Education Loan Asset Backed Trust | |
| Student Loan Revenue, | ||
| 5.050%, 05/28/2006 | 4.77% | |
| 5. | Jefferson Parish Industrial Development | |
| Board, 4.880%, 04/29/2006 | 4.77% | |
| 6. | State Port Authority Revenue Bonds, | |
| Delta Air Lines - Series B | ||
| 4.200%, 05/28/2006 | 4.77% | |
| 7. | Ascension Parish Waste Disposal, | |
| Alliedsignal Inc. 4.150%, 05/05/2006 | 4.34% | |
| 8. | Vigo County Industrial Development | |
| Revenue Republic Services Inc. | ||
| 4.150%, 05/05/2006 | 4.34% | |
| 9. | Revenue Bond Certificates Series Trust, | |
| Heather Lane - Taxable | ||
| 5.400%, 05/05/2006 | 4.25% | |
| 10. | Searcy Industrial Development Revenue, | |
| Yarnell Ice Cream Co. | ||
| 4.800%, 01/01/2010 | 3.69% | |
| __________ | ||
* Portfolio holdings are as of 4/30/06 and are subject to change. Portfolio holdings are not recommendations to to buy or sell any securities. Top 10 Holdings does not include short-term investments. | ||
Alpine Municipal Money Market Fund / Alpine Tax Optimized Income Fund — Commentary
We are pleased to provide you with the semi-annual report for the Alpine Income Trust for the period ending April 30, 2006. The Income Trust includes both the Alpine Tax Optimized Fund and the Alpine Municipal Money Market Fund.
We are happy to report that for the six-month period, both funds continued to produce returns that far outpaced its counterparts in their respected categories. According to Lipper Analytical Services, the total return for the Alpine Tax Optimized Income Fund was 1.70% and 1.53% for the Alpine Municipal Money Market Fund. The Lipper average was 1.16% and 1.18% for the Short Municipal Debt and Tax Exempt Money Market Peer group.
Strong economic growth and stock market gains occurred worldwide in the first four months of 2006, helping trigger rising interest rates and bond yields. In the wake of U.S. economic weakness in the fourth quarter of 2005, it seemed that the Federal Reserve would stop raising rates in early 2006. But subsequent data and Fed comments made it clear that the long series of rate hikes that began in June 2004 would continue beyond April, when fed funds had reached 4.75%. Soon after our reporting ended, the Fed had voted unanimously to increase the fed funds target rate to 5%, the 16th rate increase since the current monetary tightening policy began in June 2004. In the accompanying statement, the Fed indicated further monetary decisions will be determined by future economic data.
The U.S. Economy appears to be slowing down, but Federal Reserve policymakers are still concerned about the risk of inflation. With the next Fed meeting scheduled for the end of June, we anticipate that they will stay the course and increase rates one more time to insure that economy remains healthy without overheating. Beyond that, we will have to wait for further economic data to determine which direction they decide to take.
Municipal bonds outperformed most taxable bonds, including mortgage-backed securities, government-related debt, corporate fixed-income securities and Treasurys, with most of those categories posting negative returns for the first three months of 2006. Quantifying that performance, the broad, investment grade Lehman Brothers Municipal Bond Index rose +0.25% compared with -0.65% retreat for the broad, taxable, investment-grade Lehman U.S. Aggregate Index. And while the Treasury yield curve (a graphic representation of the relationship between bond yields and maturities) rose from 40-49 basis points (0.40-0.49%) in nearly parallel fashion, the municipal bond yield curve flattened somewhat, with yields on municipals maturing in 15 years finishing out the end of April only slightly higher from where they started the year and short-term municipal bond yields rising by as much as 35 basis points. In addition, the Treasury yield curve became inverted for certain periods of 2006 as 10-year yields slipped below two-year yields. Such inversions, which are rare because long-term rates are usually higher than short-term rates to compensate investors for lending money for longer period, sometimes precede a period of slower growth.
21
Alpine Tax Optimized Income Fund
New municipal borrowing in 2005 totaled a record of more than $400 million. Nearly half of new issuance was refunding debt, as issuers refinanced older, higher coupon debt to lower their overall interest costs. With rates higher in 2006, the new issue market has slowed down considerably with volume down 20% over the same period last year. The one thing that has remained constant is heavy demand for tax-free securities, thanks in large part to institutional investors, hedge funds, and various non-traditional buyers of municipals. We attribute this heavy demand coupled with less supply for the strong performance of municipals during our reporting period.
Alpine Tax Optimized Income Fund
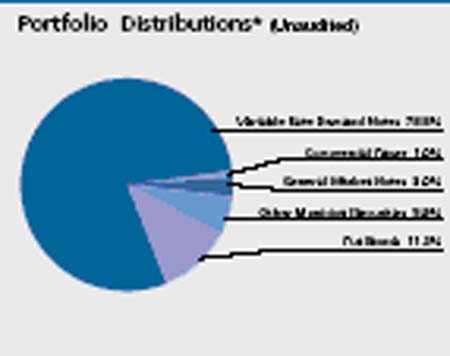
As we just discussed, the market for all fixed-income securities was fairly volatile through much of the past six months. As a result, we continued to shorten the maturity on the fund and reposition the portfolio in light of a changing interest and credit environment. The average maturity of the fund at the end of this reporting period was 237 days which is significantly shorter than what our normal maturity target would be. But as our objective is to provide the best total return possible, we felt is was more prudent to focus on capital preservation rather than maximizing the yield by extending out on the yield curve. Furthermore, with such a flat yield curve in the one to five year range, investors were not getting rewarded to take on the additional risk.
While the fund has the ability to invest in a combination of taxable and tax-exempt securities, we continued to sell our holdings in corporate bonds and focus our attention on municipal securities. The reason for this was that the municipal market offered greater price stability and provided higher after-tax returns when compared to their taxable counterparts. We continue to hold a very small portion of the fund in corporate bonds but have presently lost our desire to participate in that market as price volatility and the tightening of spreads have made these securities less desirable.
In the municipal sector, we mainly focused on purchasing securities maturing in 12 months or less. The one area of the long-end of the curve that we have maintained is our holdings in tobacco bonds. They provide the fund with an attractive revenue stream and offer greater stability due to their turbo calls features. These securities continue to outperform other sectors of the market as favorable rulings for the tobacco companies have created greater demand among yield-hungry investors.
We also found value in the municipal auction rate market. For example, we purchased Massachusetts Port Authority Special Facility Revenue Bonds for Delta Airlines. While the airline sector has experienced financial trouble for the past several years, these bonds are insured by Ambac Insurance and are, therefore, rated triple A by all three rating agencies. The yield pickup over similarly rated securities was at least 50 basis points.
Other purchases included housing bonds in Tulsa, Oklahoma and Maricopa, Arizona that are backed by the American Housing Foundation. This issuer’s rating was temporarily downgraded in December from A-rated to BBB-rated and as a result traded significantly cheaper in the marketplace. As we anticipated, in May, the securities were upgraded back to their original rating after further review by the rating agency.
In addition to the above examples, and in keeping with our objective of staying short, we also purchased select variable rate demand notes that are either backed by a letter of credit from a major financial institution or are corporate backed that provided the fund a very attractive return.
Although we analyze bond market trends, we believe our value lies not in our ability to forecast the market, but rather in our ability to exploit the fixed income market inefficiencies. In any environment we will continue to apply a relative value, bottom-up security selection process that seeks attractive after-tax yields, without sacrificing credit quality.
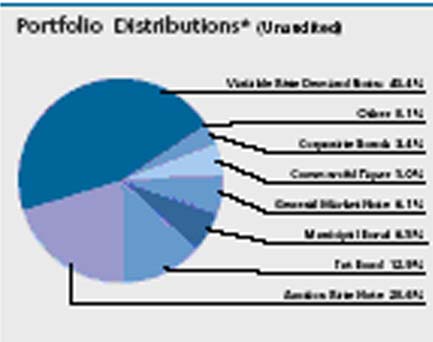
Alpine Municipal Money Market Fund
Yields of tax-exempt money market instruments generally rose along with the federal funds rate, reaching their highest levels in more than four years. However, yields of shorter-dated money market securities tended to rise more sharply than longer-dated securities, and by the end of the reporting period, there was little difference in the yields provided by tax-exempt securities in the yields with maturities between six months and three years.
Although there was less need among municipalities for short-term borrowing to cover budget shortfalls in the recovering economy, the conversion of longer-term municipal notes and bonds into their component parts caused the supply of newly issued municipal money market securities to rise to record levels. However, this increase in the supply of tax-exempt money market instruments was readily absorbed by robust investor demand. In fact, because of narrow yield differences in the six-month to three-year range, many investors who typically focus on municipal notes and bonds with longer maturities turned to tax-exempt money market instruments maturing within one year.
22
Alpine Tax Optimized Income Fund
In this environment, we continued to purchase mainly variable rate demand notes as they offered the fund liquidity and the greatest opportunity to take advantage of rising interest rates. In addition, we also found what we believed to be relatively attractive income opportunities from put bonds in the one-year range. We made those extended purchases to protect the fund’s yield during periods where variable rate demands were seasonably rich. Other than that, we stayed clear of municipal notes and commercial paper as we found those securities offered little value to the funds performance. As of the close of our reporting period, the average weighted maturity of the fund was 20 days which was shorter than that of our peer group.
With the market pricing in at least one more quarter-point rate increase by the Federal Reserve, we continue to maintain the investment posture that has served us well over the past six months. Some early signs of economic slowing in the housing market suggest that the Fed’s monetary restraint may finally be having an impact. We will remain attuned to further signs of economic slowing, which could indicate that the Fed is nearing the end of its rate hike program.
Thank you for your investment in the Alpine Income Funds.5
Sincerely,
Steven C. Shachat
Portfolio Manager
__________
An investment in these Funds are neither insured nor guaranteed by the Federal Deposit Insurance Corporation or any other government agency. Although the Funds seek to preserve the value of your investment at $1.00 per share, it is possible to lose money by investing in the Funds.
Investing in these funds involves special risks, including but not limited to, investing in municipal obligations and derivative securities, mortgage-related and asset-backed investments. Please refer to the prospectus for further details.
Investments in debt securities typically decrease in value when interest rates rise. This risk is usually greater for longer-term debt securities.
Please refer to the schedule of portfolio investments for fund holding information. Fund holdings and sector allocations are subject to change and should not be considered a recommendation to buy or sell any security.
Any tax or legal information provided is merely a summary of our understanding and interpretation of the current income tax income tax regulations and is not exhaustive. Investors must consult their tax advisor or legal counsel for advice and information concerning their particular situation. Neither the Fund nor any of its representatives may give legal or tax advice.
The federal government guarantees interest payments from government securities, such as U.S Treasury bills, while dividend payments carry no such guarantee. Government securities, if held to maturity, guarantee the timely payment of principal and interest. A basis point is a value equaling one one-hundredth of a percent (1/100 of 1%).
Investment Grade (IG) Ratings | ||||||
Moodys | S&P | Fitch | ||||
| Aaa | AAA | AAA | Obligations deemed to be of the highest quality, with | |||
| minimal credit risk | ||||||
| Aa | AA | AA | ||||
| A1 | A+ | A+ | Obligations deemed to be of the high quality, with low | |||
| credit risk | ||||||
| A2 | A | A | ||||
| A3 | A- | A- | ||||
| Baa1 | BBB+ | BBB+ | ||||
| Baa2 | BBB | BBB | Obligations subject to moderate credit risks | |||
| Baa3 | BBB- | BBB- |
23
Alpine Mutual Funds - Dynamic Balance Fund
Schedule of Portfolio Investments
April 30, 2006 (Unaudited)
Shares/ Par Value | Security Description | Value | |||
Common Stocks—73.9% | |||||
| Commercial Products & Services—11.1% | |||||
| 26,000 | AMETEK, Inc. | $ | 1,281,020 43,000 | ||
| 43,000 | Autoliv, Inc. | 2,377,900 | |||
| 59,199 | Eagle Materials, Inc. | 3,921,934 | |||
| 300 | Hubbell, Incorporated—Class A | 14,376 | |||
| 6,500 | Hubbell, Incorporated—Class B | 335,725 | |||
| 32,500 | McGrath Rentcorp | 873,925 | |||
| 15,500 | PACCAR Inc. | 1,114,915 | |||
| 30,000 | Ryder System, Inc. | 1,564,500 | |||
| 11,484,295 | |||||
| Conglomerates—3.4% | |||||
| 25,000 | 3M Co | 2,135,750 | |||
| 30,000 | Temple-Inland Inc. | 1,393,200 | |||
| 3,528,950 | |||||
| Consumer Products & Services—4.0% | |||||
| 25,000 | The Black & Decker | ||||
| Corporation | 2,340,250 | ||||
| 15,000 | Briggs & Stratton Corporation | 506,100 | |||
| 23,000 | The Procter & Gamble Company | 1,338,830 | |||
| 4,185,180 | |||||
| Energy, Oil, & Gas—2.6% | |||||
| 4,000 | Amerada Hess Corp. | 573,080 | |||
| 15,000 | Chevron Corporation | 915,300 | |||
| 16,000 | Penn Virginia Corporation | 1,156,480 | |||
| 2,644,860 | |||||
| Financial—Banks—5.3% | |||||
| 18,000 | Bancorp Rhode Island, Inc. | 630,000 | |||
| 6,000 | Bancshares of Florida, Inc. (a) | 120,000 | |||
| 23,041 | Bank of America Corporation | 1,150,207 | |||
| 45,000 | Doral Financial Corp. (b) | 355,950 | |||
| 10,000 | Golden West Financial | ||||
| Corporation | 718,700 | ||||
| 31,500 | New York Community Bancorp, | ||||
| Inc. | 542,115 | ||||
| 8,000 | PNC Financial Services Group, | ||||
| Inc. | 571,760 | ||||
| 5,500 | Rurban Financial Corp. | 66,825 | |||
| 6,165 | Southside Bancshares, Inc. | 123,485 | |||
| 10,000 | Sovereign Bancorp, Inc. | 221,700 | |||
| 20,000 | Webster Financial Corporation | 939,000 | |||
| 5,439,742 | |||||
| Financial Services—9.7% | |||||
| 10,000 | Ambac Financial Group, Inc. | 823,600 | |||
| 26,000 | American International Group, | ||||
| Inc. | 1,696,500 | ||||
| 10,000 | The Chubb Corporation | 515,400 | |||
| 10,000 | Countrywide Financial | ||||
| Corporation | 406,600 | ||||
| 10,000 | Fannie Mae | 506,000 | |||
| 10,000 | Fidelity National Financial, Inc. | 419,800 | |||
| 1,750 | Fidelity National Title Group, | ||||
| Inc.—Class A | 37,905 | ||||
| 13,000 | The Goldman Sachs Group, Inc. | 2,083,770 | |||
Shares/ Par Value | Security Description | Value | |||
Common Stocks—continued | |||||
| Financial Services—continued | |||||
| 40,000 | JP Morgan Chase & Co. | $ | 1,815,200 | ||
| 8,000 | The Student Loan Corporation | 1,666,000 | |||
| 9,970,775 | |||||
| Food & Staples Retailing—2.1% | |||||
| 40,000 | Albertson’s, Inc. | 1,013,200 | |||
| 40,000 | CVS Corporation | 1,188,800 | |||
| 2,202,000 | |||||
| Homebuilders—8.8% | |||||
| 10,000 | Centex Corporation | 556,000 | |||
| 30,000 | Hovnanian Enterprises, Inc.— | ||||
| Class A (a) | 1,193,100 | ||||
| 28,000 | Lennar Corporation—Class A | 1,538,040 | |||
| 7,150 | M.D.C. Holdings, Inc. | 413,127 | |||
| 50,000 | Pulte Homes, Inc. | 1,867,500 | |||
| 12,000 | The Ryland Group, Inc. | 757,320 | |||
| 51,400 | Standard Pacific Corp. | 1,629,894 | |||
35,000 | Toll Brothers, Inc. (a) | 1,125,250 | |||
| 9,080,231 | |||||
| IT Services—1.1% | |||||
| 10,000 | Fidelity National Information | ||||
| Services | 380,000 | ||||
| 15,000 | First Data Corporation | 715,350 | |||
| 1,095,350 | |||||
| Leisure Equipment & Products—0.4% | |||||
| 10,000 | Brunswick Corporation | 392,200 | |||
| Metals & Mining—4.2% | |||||
| 37,000 | CONSOL Energy Inc. | 3,150,920 | |||
| 14,000 | Phelps Dodge Corporation | 1,206,660 | |||
| 4,357,580 | |||||
| Personal Products—0.4% | |||||
| 0,000 | Alberto-Culver Company | 449,700 | |||
| Pharmaceuticals—3.1% | |||||
| 27,000 | Johnson & Johnson | 1,582,470 | |||
| 25,000 | Pfizer Inc. | 633,250 | |||
| 20,000 | Wyeth | 973,400 | |||
| 3,189,120 | |||||
| Real Estate Investment Trusts—8.8% | |||||
| 15,000 | Boston Properties, Inc. | 1,324,050 | |||
| 10,000 | Developers Diversified Realty | ||||
| Corporation | 532,000 | ||||
| 60,000 | DiamondRock Hospitality | ||||
| Company | 858,600 | ||||
| 20,000 | General Growth Properties, Inc. | 939,000 | |||
| 55,000 | Impac Mortgage Holdings, Inc. | 522,500 | |||
| 10,000 | Mack-Cali Realty Corporation | 452,200 | |||
| 45,000 | Origen Financial, Inc. | 272,700 | |||
| 23,000 | Simon Property Group, Inc. | 1,883,240 | |||
| 80,000 | Sunstone Hotel Investors, Inc. | 2,299,200 | |||
| 9,083,490 | |||||
See notes to financial statements.
24
Alpine Mutual Funds - Dynamic Balance Fund
Schedule of Portfolio Investments—Continued
April 30, 2006 (Unaudited)
Shares/ Par Value | Security Description | Value | |||
Common Stocks—continued | |||||
| Retail—1.9% | |||||
| 15,000 | Ethan Allen Interiors, Inc. | $ | 673,350 | ||
| 20,000 | J.C. Penney Company, Inc. | 1,309,200 | |||
| 1,982,550 | |||||
| Transportation—1.3% | |||||
| 15,000 | Union Pacific Corporation | 1,368,150 | |||
| Transportation Services—2.8% | |||||
| 25,000 | FedEx Corp. | 2,878,250 | |||
| Utilities—2.9% | |||||
| 61,000 | Allegheny Energy, Inc. (a) | 2,173,430 | |||
| 31,200 | SJW Corp. | 794,976 | |||
| 2,968,406 | |||||
| Total Common Stocks | 76,300,829 |
Shares/ Par Value | Security Description | Value | |||
Bonds and Notes—17.4% | |||||
| U.S. Government Obligations—17.4% | |||||
| 2,000,000 | 7.250%, 05/15/2016 | $ | 2,331,564 | ||
| 2,000,000 | 6.250%, 08/15/2023 | 2,210,938 | |||
| 6,000,000 | 6.000%, 02/15/2026 | 6,501,096 | |||
| 5,000,000 | 5.250%, 11/15/2028 | 4,966,410 | |||
| 2,000,000 | 5.000%, 08/15/2011 | 2,008,438 | |||
| Total U.S. Treasury Obligations | 18,018,446 | ||||
Short-Term Investments—7.1% | |||||
| 5,750,019 | Alpine Municipal Money | ||||
| Market | 5,750,019 | ||||
| 1,540,568 | Fidelity Institutional | ||||
| Government Portfolio | 1,540,568 | ||||
| Total Short Term Investments | 7,290,587 | ||||
| Total Investments | |||||
| (Cost $83,490,433)—98.4% | 101,609,862 | ||||
| Other Assets, less | |||||
| Liabilities—1.6% | 1,622,096 | ||||
| TOTAL NET ASSETS—100.0% | $ | 103,231,958 | |||
_________
(a) Non-income producing securities
(b) Foreign security which trades on U.S. exchange
See notes to financial statements.
25
Alpine Mutual Funds - Dynamic Dividend Fund
Schedule of Portfolio Investments
April 30, 2006 (Unaudited)
Shares/ Par Value | Security Description | Value | |||
Common Stocks—93.4% | |||||
| Aerospace & Defense—0.8% | |||||
| 5,000 | Todd Shipyards Corporation | $ | 154,200 | ||
| 55,000 | United Technologies Corporation | 3,454,550 | |||
| 3,608,750 | |||||
| Beverages—0.7% | |||||
| 56,000 | PepsiCo, Inc. | 3,261,440 | |||
| Capital Markets—5.2% | |||||
| 1,400,000 | ABG Sundal Collier ASA(c) | 3,179,134 | |||
| 295,500 | Acta Holding ASA (c) | 1,332,463 | |||
| 136,862 | AWD Holding AG (c) | 4,851,915 | |||
| 28,000 | The Goldman Sachs Group, Inc. | 4,488,120 | |||
| 90,000 | Macquarie Bank Ltd. (c) | 4,882,163 | |||
| 75,000 | Morgan Stanley | 4,822,500 | |||
| 23,556,295 | |||||
| Commercial Banks—4.0% | |||||
| 134,000 | Bank of America Corporation | 6,689,280 | |||
| 98,000 | Marshall & Ilsley Corporation | 4,480,560 | |||
| 54,500 | Wachovia Corporation | 3,261,825 | |||
| 51,000 | Wells Fargo & Company | 3,503,190 | |||
| 17,934,855 | |||||
| Commercial Services & Supplies—5.9% | |||||
| 20,000 | Avery Dennison Corporation | 1,250,000 | |||
| 30,000 | Briggs & Stratton Corporation | 1,012,200 | |||
| 285,000 | Cendant Corporation | 4,967,550 | |||
| 171,580 | Healthcare Services Group, Inc. | 3,663,233 | |||
| 120,000 | Intrum Justitia AB (c) | 1,133,291 | |||
| 126,626 | McGrath Rentcorp | 3,404,973 | |||
| 25,000 | Monsanto Company | 2,085,000 | |||
| 190,000 | PagesJaunes SA (a) | 5,491,648 | |||
| 3,900 | SGS SA (c) | 3,858,491 | |||
| 26,866,386 | |||||
| Communications Equipment—0.8% | |||||
| 243,507 | Ascom Holding AG (c) | 3,750,188 | |||
| Computers & Peripherals—0.6% | |||||
| 32,000 | International Business Machines | ||||
| Corp. | 2,634,880 | ||||
| Construction & Engineering—1.1% | |||||
| 205,600 | Chicago Bridge & Iron Company | ||||
| N.V. (b) | 4,928,232 | ||||
| Consumer Durables & Apparel—0.9% | |||||
| 505,000 | KappAhl Holding AB (c) | 3,962,951 | |||
| Containers & Packaging—0.5% | |||||
| 45,500 | Temple-Inland Inc. | 2,113,020 | |||
| Diversified Financial Services—3.0% | |||||
| 107,300 | Citigroup Inc. | 5,359,635 | |||
| 50,000 | Euronext NV (c) | 4,469,242 | |||
| 56,700 | JP Morgan Chase & Co. | 2,573,046 | |||
| 54,000 | OMX AB (c) | 1,038,306 | |||
| 13,440,229 | |||||
Shares/ Par Value | Security Description | Value | |||
Common Stocks—continued | |||||
| Diversified Telecommunication Services—1.9% | |||||
| 317,500 | Consolidated Communications | ||||
| Holdings, Inc. | $ | 4,826,000 | |||
| 600,000 | TeliaSonera AB (c) | 3,725,999 | |||
| 8,551,999 | |||||
| Electric Utilities—6.3% | |||||
| 66,000 | E.ON AG (c) | 8,089,297 | |||
| 115,000 | Exelon Corporation | 6,210,000 | |||
| 223,100 | ITC Holdings Corp. | 5,762,673 | |||
| 165,000 | TXU Corp. | 8,188,950 | |||
| 28,250,920 | |||||
| Electrical Equipment—0.5% | |||||
| 105,000 | American Power Conversion | ||||
| Corporation | 2,335,200 | ||||
| Electronic Equipment & Instruments—2.2% | |||||
| 71,000 | Anixter International, Inc. | 3,609,640 | |||
| 280,500 | Nam Tai Electronics, Inc. (b) | 6,333,690 | |||
| 9,943,330 | |||||
| Energy Equipment & Services—5.3% | |||||
| 51,700 | Diamond Offshore Drilling, Inc. | 4,692,809 | |||
| 58,000 | GlobalSantaFe Corporation (b) | 3,550,180 | |||
| 100,000 | Precision Drilling Trust (b) | 3,554,000 | |||
| 40,600 | Rowan Companies, Inc. | 1,799,798 | |||
| 227,000 | SeaDrill Ltd. (a)(c) | 3,847,645 | |||
| 37,000 | Todco—Class A (a) | 1,697,190 | |||
| 60,000 | Transocean, Inc. (a)(b) | 4,864,200 | |||
| 24,005,822 | |||||
| Food & Staples Retailing—2.1% | |||||
| 75,000 | Altria Group, Inc. | 5,487,000 | |||
| 135,000 | CVS Corporation | 4,012,200 | |||
| 9,499,200 | |||||
| Food Products—0.7% | |||||
| 30,000 | East Asiatic Company Ltd. A/S (c) | 1,278,463 | |||
| 124,012 | Rocky Mountain Chocolate | ||||
| Factory, Inc. | 1,915,986 | ||||
| 3,194,449 | |||||
| Health Care Equipment & Supplies—3.3% | |||||
| 176,750 | Meridian Bioscience, Inc. | 4,588,430 | |||
| 119,500 | PolyMedica Corporation | 4,936,545 | |||
| 147,400 | West Pharmaceutical Services, Inc. | 5,250,388 | |||
| 14,775,363 | |||||
| Hotels Restaurants & Leisure—5.7% | |||||
| 80,000 | Carnival Corporation | 3,745,600 | |||
| 66,700 | Harrah’s Entertainment, Inc. | 5,445,388 | |||
| 160,000 | Hilton Hotels Corporation | 4,310,400 | |||
| 300,000 | Intercontinental Hotels Group (a) | 5,290,127 | |||
| 352,941 | Ladbrokes PLC (c) | 2,699,931 | |||
| 75,000 | Starwood Hotels & Resorts | ||||
| Worldwide, Inc. | 4,303,500 | ||||
| 25,794,946 | |||||
See notes to financial statements.
26
Alpine Mutual Funds - Dynamic Dividend Fund
Schedule of Portfolio Investments—Continued
April 30, 2006 (Unaudited)
Shares/ Par Value | Security Description | Value | |||
Common Stocks—continued | |||||
| Household Durables—3.8% | |||||
| 125,658 | Bassett Furniture Industries, Inc. | $ | 2,317,134 | ||
| 111,000 | D.R. Horton, Inc. | 3,332,220 | |||
| 30,000 | JM AB (c) | 1,928,225 | |||
| 74,250 | KB HOME | 4,571,572 | |||
| 88,000 | Lennar Corporation—Class A | 4,833,840 | |||
| 16,982,991 | |||||
| Industrial Conglomerates—4.0% | |||||
| 55,000 | 3M Co. | 4,698,650 | |||
| 189,000 | General Electric Company | 6,537,510 | |||
| 75,000 | Textron, Inc. | 6,746,250 | |||
| 17,982,410 | |||||
| Insurance—1.3% | |||||
| 250,000 | Insurance Australia Group | ||||
| Limited (c) | 1,073,149 | ||||
| 400,000 | Storebrand ASA (c) | 4,736,262 | |||
| 5,809,411 |
| IT Services—1.0% | |||||
| 463,000 | HiQ International AB (c) | 2,799,731 | |||
| 3,500,000 | Telecom Itala Media S.p.A. (c) | 1,660,275 | |||
| 4,460,006 | |||||
| Leisure Equipment & Products—1.2% | |||||
| 167,400 | Aldila, Inc. | 5,505,786 | |||
| Machinery—2.4% | |||||
| 80,000 | Metso Corporation (c) | 3,179,249 | |||
| 30,000 | Saurer AG (c) | 2,503,628 | |||
| 35,000 | Stork N.V. (c) | 2,074,460 | |||
| 73,000 | Wartsila Oyj—Class B (c) | 3,111,047 | |||
| 10,868,384 | |||||
| Marine—3.2% | |||||
| 84,000 | Alexander & Baldwin, Inc. | 4,189,080 | |||
| 259,700 | Aries Maritime Transport Ltd. (b) | 3,441,025 | |||
| 170,000 | Attica Holdings S.A. (c) | 1,020,892 | |||
| 350,000 | Omega Navigation Enterprises— | ||||
| Class A (a)(b) | 5,617,500 | ||||
| 14,268,497 | |||||
| Media—2.0% | |||||
| 105,000 | CBS Corporation—Class B | 2,674,350 | |||
| 303,700 | Regal Entertainment Group— | ||||
| Class A | 6,383,774 | ||||
| 9,058,124 |
| Metals & Mining—0.4% | |||||
| 470,000 | Macarthur Coal Limited (c) | 1,956,816 | |||
| Multi-Utilities & Unregulated Power—1.2% | |||||
| 75,000 | Dominion Resources, Inc. | 5,615,250 | |||
| Oil & Gas—5.6% | |||||
| 50,000 | Exxon Mobil Corporation | 3,154,000 | |||
| 44,000 | Kinder Morgan, Inc. | 3,872,880 | |||
| 47,000 | Marathon Oil Corporation | 3,729,920 | |||
| 75,000 | Teekay LNG Partners LP (b) | 2,325,000 | |||
| 66,000 | Tesoro Corporation | 4,614,720 |
Shares/ Par Value | Security Description | Value | |||
Common Stocks—continued | |||||
| Oil & Gas—continued | |||||
| 65,000 | Valero Energy Corporation | $ | 4,208,100 | ||
| 89,000 | Woodside Petroleum Limitied (c) | 3,164,517 | |||
| 25,069,137 | |||||
| Oil, Gas & Consumable Fuels—3.3% | |||||
| 31,000 | Amerada Hess Corp. | 4,441,370 | |||
| 165,000 | Motor Oil Corinth Refineries | ||||
| S.A. (c) | 4,808,614 | ||||
| 135,163 | Ship Finance International | ||||
| Limited (b) | 2,301,826 | ||||
| 105,000 | Statoil ASA (c) | 3,457,309 | |||
| 15,009,119 | |||||
| Personal Products—2.2% | |||||
| 84,000 | Alberto-Culver Company | 3,777,480 | |||
| 163,000 | Oriflame Cosmetics SA-SDR (c) | 6,168,621 | |||
| 9,946,101 | |||||
| Pharmaceuticals—3.6% | |||||
| 40,250 | Alk-Abello A/S (a)(c) | 6,105,549 | |||
| 30,000 | Novartis AG—ADR | 1,725,300 | |||
| 120,000 | Teva Pharmaceutical Industries, | ||||
| Ltd.—ADR | 4,860,000 | ||||
| 70,000 | Wyeth | 3,406,900 | |||
| 16,097,749 | |||||
| Software—0.4% | |||||
| 70,000 | Microsoft Corporation | 1,690,500 |
| Specialty Retail—1.7% | |||||
| 175,735 | Hellenic Duty Free Shops S.A. (c) | 3,307,890 | |||
| 90,000 | Hennes & Mauritz AB—Class B | ||||
| (c) | 3,418,217 | ||||
| 72,000 | Stein Mart, Inc. | 1,137,600 | |||
| 7,863,707 | |||||
| Stock Exchanges—0.4% | |||||
| 80,000 | London Stock Exchange Group | ||||
| Plc (c) | 1,804,588 | ||||
| Transportation Infrastructure—3.0% | |||||
| 312,300 | Macquarie Infrastructure | ||||
| Company Trust | 9,119,160 | ||||
| 50,500 | Smit Internationale NV (c) | 4,485,264 | |||
| 13,604,424 | |||||
| Wireless Telecommunication Services—1.2% | |||||
| 25,000 | Vodafone Group Plc—ADR | 592,500 | |||
| 2,000,000 | Vodafone Group Plc | 4,723,002 | |||
| 5,315,502 | |||||
| Total Common Stocks | 421,316,957 | ||||
Rights—0.0% | |||||
| 30,000 | JM AB (c) | 103,273 | |||
| Total Rights | 103,273 |
Short-Term Investments—8.2% | |||||
| 12,242,090 | Federated Government | ||||
| Obligations Fund | 12,242,090 | ||||
See notes to financial statements.
27
Alpine Mutual Funds - Dynamic Dividend Fund
Schedule of Portfolio Investments—Continued
April 30, 2006 (Unaudited)
Shares/ Par Value | Security Description | Value | |||
Short-Term Investments—continued | |||||
| 10,335,998 | Federated Prime Obligations | ||||
| Fund | $ | 10,335,998 | |||
| 12,386,230 | Fidelity Institutional Government | ||||
| Portfolio | 12,386,230 | ||||
| 1,925,000 | Alpine Municipal Money Market | 1,925,000 | |||
| Total Short-Term Investments | 36,889,318 | ||||
| Total Investments (Cost | |||||
| $432,547,625)—101.6% | 458,309,548 | ||||
| Liabilities, less Other | |||||
| Assets—(1.6)% | (7,001,585) | ||||
| TOTAL NET ASSETS—100.0% | $ | 451,307,963 | |||
________
(a) Non-income producing securities
(b) Foreign security which trades on U.S. exchange
(c) Foreign security
ADR—American Depository Receipt
SDR—Special Drawing Rights
See notes to financial statements.
28
Alpine Mutual Funds - Dynamic Financial Services Fund
Schedule of Portfolio Investments
April 30, 2006 (Unaudited)
Shares/ Par Value | Security Description | Value | |||
Common Stocks—93.2% | |||||
| Capital Markets—16.6% | |||||
| 4,000 | American Capital Strategies, Ltd. | $ | 139,280 | ||
| 600 | Franklin Resources, Inc. | 55,872 | |||
| 1,200 | International Securities | ||||
| Exchange, Inc. | 52,740 | ||||
| 1,000 | Investment Technology | ||||
| Group, Inc. (a) | 52,990 | ||||
| 2,500 | Janus Capital Group, Inc. | 48,650 | |||
| 3,000 | NASDAQ Stock Market, Inc. (a) | 112,260 | |||
| 2,000 | optionsXpress Holdings, Inc. | 63,000 | |||
| 3,000 | TD Ameritrade Holding | ||||
| Corporation | 55,680 | ||||
| 580,472 | |||||
| Commercial Banks—45.5% | |||||
| 1,400 | Albemarle First Bank (a) | 21,490 | |||
| 3,023 | Banco Macro Bansud | ||||
| SA—ADR (a) | 70,043 | ||||
| 1,000 | Bancorp Rhode Island, Inc. | 35,000 | |||
| 300 | Bancshares of Florida, Inc. (a) | 6,000 | |||
| 800 | BancTrust Financial Group, Inc. | 16,528 | |||
| 500 | BWC Financial Corp. | 17,450 | |||
| 3,000 | Cardinal Financial Corporation | 35,460 | |||
| 572 | Centennial Bank Holdings Inc. (a) | 6,555 | |||
| 1,000 | City National Corporation | 72,960 | |||
| 1,000 | CoBiz Inc. | 19,720 | |||
| 1,500 | Dearborn Bancorp, Inc. (a) | 33,375 | |||
| 4,000 | First Business Financial | ||||
| Services, Inc. | 94,400 | ||||
| 1,200 | First Community Bank | ||||
| Corporation of America (a) | 23,706 | ||||
| 900 | First Oak Brook Bancshares, Inc. | 24,390 | |||
| 10,000 | First Security Group Inc. | 112,000 | |||
| 1,500 | FirstMerit Corporation | 36,885 | |||
| 1,000 | FLAG Financial Corporation | 18,980 | |||
| 4,290 | The Legacy Bank (a) | 72,930 | |||
| 523 | Middleburg Financial | ||||
| 6,000 | Corporation (a) | 17,782 | |||
| Nexity Financial Corporation (a) | 75,300 | ||||
| 1,900 | Old Point Financial Corporation | 55,260 | |||
| 1,100 | Placer Sierra Bancshares | 29,205 | |||
| 2,388 | The South Financial Group, Inc. | 64,786 | |||
| 3,000 | State Bancorp, Inc. | 47,550 | |||
| 2,500 | Sterling Bancorp | 52,250 | |||
| 5,000 | Sterling Bancshares, Inc. | 82,800 | |||
| 2,000 | Summit Bancshares, Inc. | 37,020 | |||
| 1,223 | SunTrust Banks, Inc. | 94,575 | |||
| 2,000 | SVB Financial Group (a) | 101,540 | |||
| 750 | TowneBank | 15,990 | |||
Shares/ Par Value | Security Description | Value | |||
Common Stocks—continued | |||||
| Commercial Banks—continued | |||||
| 2,100 | Valley Commerce Bancorp (a) | $ | 42,367 | ||
| 1,780 | Wachovia Corporation | 106,533 | |||
| 1,000 | Wintrust Financial Corporation | 51,750 | |||
| 1,592,580 | |||||
| Diversified Financial Services—0.9% | |||||
| 2,000 | Encore Capital Group, Inc. (a) | 29,540 | |||
| 100 | Franklin Credit Management | 770 | |||
| Corporation (a) | 30,310 | ||||
| Insurance—9.2% | |||||
| 2,000 | The Allstate Corporation | 112,980 | |||
| 13,000 | AmCOMP, Inc. (a) | 123,500 | |||
| 8,000 | CRM Holdings, Ltd. (a)(b) | 84,880 | |||
| 321,360 |
| Life Insurance—1.3% | |||||
| 5,000 | KMG America Corporation (a) | 45,300 | |||
| Thrifts & Mortgage Finance—19.7% | |||||
| 2,500 | BankAtlantic Bancorp, Inc. | 37,300 | |||
| 3,000 | Berkshire Hills Bancorp, Inc. | 103,020 | |||
| 5,000 | Central Federal Corporation | 37,400 | |||
| 1,520 | Cooperative Bankshares, Inc. | 35,751 | |||
| 3,000 | Dime Community Bancshares | 42,510 | |||
| 4,000 | Firstbank NW Corp. | 74,400 | |||
| 2,000 | Franklin Bank Corporation (a) | 38,820 | |||
| 500 | Freddie Mac | 30,530 | |||
| 10,000 | Matrix Bancorp, Inc. (a) | 229,000 | |||
| 100 | Pamrapo Bancorp, Inc. (a) | 1,957 | |||
| 897 | Provident Financial Holdings, Inc. | 25,789 | |||
| 1,500 | Sound Federal Bancorp, Inc. | 30,930 | |||
| 687,407 | |||||
| Total Common Stocks | 3,257,429 | ||||
Shares/ Par Value | |||||
Short-Term Investments—11.9% | |||||
| 417,002 | Fidelity Government Portfolio | 417,002 | |||
| Total Short-Term Investments | 417,002 | ||||
| Total Investments | |||||
| (Cost $3,534,931)—105.1% | 3,674,431 | ||||
| Liabilities, less Other Assets— | |||||
| (5.1)% | (178,024) | ||||
| TOTAL NET ASSETS—100.00% | $ | 3,496,407 | |||
_________
(a) Non income producing securities
(b) Foreign security which trades on U.S. exchange
ADR—American Depository Receipt
See notes to financial statements.
29
Alpine Mutual Funds - Municipal Money Market Fund
Schedule of Portfolio Investments
April 30, 2006 (Unaudited)
Shares/ Par Value | Security Description | Value | |||
Municipal Bonds—101.0% | |||||
| Alabama—2.4% | |||||
| 775,000 | Butler County Industrial | ||||
| Development Authority | |||||
| Revenue—Series A (LOC: | |||||
| Whitney National Bank, | |||||
| Suntrust Bank) 4.100%, | |||||
| 05/05/2006 (a)(b) | $ | 775,000 | |||
| 1,325,000 | Forsyth Housing Authority | ||||
| Multi-Family Revenue, Union | |||||
| Hill Apartments LP (LOC: | |||||
| Columbus Bank & Trust) | |||||
| 4.070%, 05/05/2006 (a)(b) | 1,325,000 | ||||
| 1,000,000 | Mcintosh Industrial | ||||
| Development Board | |||||
| Environmental Revenue, CIBC | |||||
| Specialty 4.070%, 04/29/2006 | |||||
| (a)(b) | 1,000,000 | ||||
| 1,500,000 | Mobile Industrial Development | ||||
| Revenue, Hosea O Weaver & | |||||
| Sons (LOC: Regions Bank) | |||||
| 4.000%, 05/05/2006 (a)(b) | 1,500,000 | ||||
| 280,000 | Montgomery Industrial | ||||
| Development Revenue, Dev- | |||||
| Kinpak Inc. (LOC: Regions | |||||
| Bank) 4.050%, 05/05/2006 | |||||
| (a)(b) | 280,000 | ||||
| 1,260,000 | Montgomery Industrial | ||||
| Development Revenue, | |||||
| Norment Industries Inc. (LOC: | |||||
| LaSalle Bank N.A.) 4.000%, | |||||
| 05/05/2006 (a)(b) | 1,260,000 | ||||
| 6,140,000 | |||||
| Alaska—1.5% | |||||
| 930,000 | Alaska Industrial Development | ||||
| & Export Authority—Lot 12 | |||||
| (LOC: Bank of America N.A.) | |||||
| 4.330%, 05/05/2006 (a)(b) | 930,000 | ||||
| 940,000 | Alaska Industrial Develpoment | ||||
| & Export Authority—Lot 6 | |||||
| (LOC: Bank of America N.A.) | |||||
| 4.330%, 05/05/2006 (a)(b) | 940,000 | ||||
| 2,000,000 | North Slope Boro General | ||||
| Obligation Bond (CS: MBIA) | |||||
| 0.000%, 06/30/2006 | 1,988,694 | ||||
| 3,858,694 |
| California—0.4% | |||||
| 1,000,000 | Stockton Certificates, United | ||||
| Christian Schools (LOC: Pacific | |||||
| Capital Bank) 4.250%, | |||||
| 05/05/2006 (a)(b) | 1,000,000 |
| Colorado—11.0% | |||||
| 2,500,000 | Agriculture Development | ||||
| Authority, Rocky Mountain | |||||
| Milling, LLC 3.990%, | |||||
| 05/05/2006 (a)(b) | 2,500,000 | ||||
Shares/ Par Value | Security Description | Value | |||
Municipal Bonds—continued | |||||
| 3,000,000 | Bachelor Gulch Metropolition | ||||
| Dist (LOC:Compass Bank) | |||||
| 3.600%, 12/01/2006 (a)(b)(d) | $ | 3,000,000 | |||
| 1,900,000 | Broomfield Village | ||||
| Metropolitan District 2, | |||||
| Special Obligation Revenue | |||||
| (LOC: Compass Bank) 4.050%, | |||||
| 05/05/2006 (a)(b) | 1,900,000 | ||||
| 2,100,000 | Educational & Cultural Facilities | ||||
| Authority Revenue, Regis | |||||
| Jesuit High School 3.810%, | |||||
| 05/05/2006 (a)(b) | 2,100,000 | ||||
| 1,000,000 | Four Mile Ranch Metropolitian | ||||
| District No. 1 (LOC: Zions | |||||
| First National Bank) 3.500%, | |||||
| 12/01/2006 (a)(b)(d) | 1,000,000 | ||||
| 1,475,000 | Housing & Finance Authority | ||||
| Economic Development | |||||
| Revenue, Top Shop—Series A | |||||
| (LOC: JP Morgan Chase Bank) | |||||
| 3.960%, 05/05/2006 (a)(b) | 1,475,000 | ||||
| 1,000,000 | Housing & Finance Authority | ||||
| Economic Revenue, Casarosa | |||||
| & Denver Gasket (LOC: | |||||
| Keybank N.A.) 3.970%, | |||||
| 05/05/2006 (a)(b) | 1,000,000 | ||||
| 2,000,000 | Housing & Finance Authority, | ||||
| Mutlifamily Housing Grant A | |||||
| (LOC: Wells Fargo Bank N.A.) | |||||
| 3.810%, 05/05/2006 (a)(b) | 2,000,000 | ||||
| 2,177,000 | Jefferson County Industrial | ||||
| Development Revenue, EPI- | |||||
| Center LLC (LOC: JP Morgan | |||||
| Chase Bank) 3.960%, | |||||
| 05/05/2006 (a)(b) | 2,177,000 | ||||
| 2,000,000 | Revenue Bond Certificate Series | ||||
| Trust 2004-1, Castlegate 1 | |||||
| (CS: AIG Retirement Services, | |||||
| Inc.) 4.250%, 05/05/2006 | |||||
| (a)(b) | 2,000,000 | ||||
| 2,000,000 | Revenue Bond Certificate Series | ||||
| Trust 2004-1, Castlegate 2 | |||||
| (CS: AIG Retirement Services, | |||||
| Inc.) 4.250%, 05/05/2006 | |||||
| (a)(b) | 2,000,000 | ||||
| 3,100,000 | Revenue Bond Certificate Series | ||||
| Trust 2004-13, Centennial (CS: | |||||
| AIG) 4.250%, 05/05/2006 | |||||
| (a)(b) | 3,100,000 | ||||
| 1,000,000 | Triview Metropolitan District— | ||||
| Series A (LOC: Compass | |||||
| Bank) 3.375%, 11/01/2006 | |||||
| (a)(b)(d) | 1,000,000 | ||||
| 3,500,000 | Wildgrass Metropolitan District | ||||
| (LOC: Compass Bank) 3.600%, | |||||
| 12/01/2006 (a)(b)(d) | 3,500,000 | ||||
| 28,752,000 | |||||
See notes to financial statements.
30
Alpine Mutual Funds - Municipal Money Market Fund
Schedule of Portfolio Investments—Continued
April 30, 2006 (Unaudited)
Principal Amount | Security Description | Value | |||
Municipal Bonds—continued | |||||
| Delaware—0.6% | |||||
| 1,550,000 | Delaware St. Economic | ||||
| Development Authority | |||||
| Waste Disposal, CIBA | |||||
| Specialty Chemicals—Series A | |||||
| 4.100%, 04/29/2006 (a)(b) | $ | 1,550,000 | |||
| Florida—0.8% | |||||
| 2,000,000 | Brevard County Industrial | ||||
| Development Revenue, | |||||
| Designers Choice Cabinetry | |||||
| (LOC: Amsouth Bank) | |||||
| 4.020%, 05/05/2006 (a)(b) | 2,000,000 |
| Georgia—2.1% | |||||
| 1,310,000 | De Kalb County Housing | ||||
| Authority Revenue, Stone | |||||
| Mill Run Apartments (LOC: | |||||
| First Tennessee Bank) | |||||
| 4.050%, 05/05/2006 (a)(b) | 1,310,000 | ||||
| 1,510,000 | Douglas County Development | ||||
| Authority Revenue, Denyse | |||||
| Signs Inc. (LOC: Bank of | |||||
| North Georgia) 4.050%, | |||||
| 05/05/2006 (a)(b) | 1,510,000 | ||||
| 290,000 | Franklin County Industrial | ||||
| Building Authority Revenue, | |||||
| Ross Operating Valve Co. | |||||
| (LOC: Comerica Bank) | |||||
| 4.050%, 05/05/2006 (a)(b) | 290,000 | ||||
| 2,300,000 | Walton County Industrial | ||||
| Building Authority Revenue, | |||||
| Leggett & Platt Inc. (LOC: | |||||
| Wachovia Bank N.A.) 4.000%, | |||||
| 05/05/2006 (a)(b) | 2,300,000 | ||||
| 5,410,000 |
| Illinois—11.4% | |||||
| 1,030,000 | Carol Stream Industrial | ||||
| Development Revenue, MI | |||||
| Enterprises (LOC: JP Morgan | |||||
| Chase Bank) 4.050%, | |||||
| 05/05/2006 (a)(b) | 1,030,000 | ||||
| 1,420,000 | Chicago Single Family | ||||
| Certificates—Series N (LIQ | |||||
| FAC: Bank of America N.A.) | |||||
| 3.950%, 05/05/2006 (a)(b) | 1,420,000 | ||||
| 965,000 | Clinton Industrial Development | ||||
| Revenue, McElroy Metal Mill | |||||
| Inc. (LOC: Amsouth Bank) | |||||
| 4.070%, 05/05/2006 (a)(b) | 965,000 | ||||
| 1,340,000 | Development Finance Authority | ||||
| Industrial Development, | |||||
| Haskris Co. (LOC: Bank One | |||||
| N.A.) 3.950%, 05/05/2006 | |||||
| (a)(b) | 1,340,000 | ||||
| 1,625,000 | Development Finance Authority | ||||
| Industrial Development, | |||||
| Maclean-Fogg Co. (LOC: Bank | |||||
| of America N.A.) 3.950%, | |||||
| 05/05/2006 (a)(b) | 1,625,000 |
Principal Amount | Security Description | Value | |||
Municipal Bonds—continued | |||||
| Illinois—continued | |||||
| 800,000 | Development Finance Authority | ||||
| Multifamily Revenue, | |||||
| Butterfield Creek (LOC: | |||||
| LaSalle Bank N.A.) 4.050%, | |||||
| 05/05/2006 (a)(b) | $ | 800,000 | |||
| 1,625,000 | Finance Authority Industrial | ||||
| Development Revenue, E | |||||
| Kinast—Series A (LOC: JP | |||||
| Morgan Chase Bank) 3.950%, | |||||
| 05/05/2006 (a)(b) | 1,625,000 | ||||
| 1,275,000 | Harvard Health Care Facility | ||||
| Revenue, Harvard Memorial | |||||
| Hospital Inc. (LOC: M&I Bank) | |||||
| 3.980%, 05/05/2006 (a)(b) | 1,275,000 | ||||
| 8,000,000 | Lakemoor Multifamily Revenue | ||||
| (CS: Bayerische Landesbank) | |||||
| 4.030%, 05/05/2006 (a)(b) | 8,000,000 | ||||
| 4,000,000 | Phoenix Realty Special | ||||
| Account-U LP Multifamily | |||||
| Revenue, Brightons Mark | |||||
| (LOC: Northern Trust | |||||
| Company) 4.010%, | |||||
| 05/05/2006 (a)(b) | 4,000,000 | ||||
| 4,700,000 | Romeoville Revenue, Lewis | ||||
| University (LOC: JP Morgan | |||||
| Chase Bank) 3.810%, | |||||
| 04/29/2006 (a)(b) | 4,700,000 | ||||
| 3,080,000 | Southwestern Illinois | ||||
| Development Authority, | |||||
| Mattingly Lumber—Series A | |||||
| (LOC: First Bank, U.S. Bank | |||||
| N.A.) 4.000%, 05/05/2006 (a)(b) | 3,080,000 | ||||
| 29,860,000 | |||||
| Indiana—1.8% | |||||
| 980,000 | Lawrence Industrial Economic | ||||
| Development Revenue, | |||||
| Southwark Metal | |||||
| Manufacturing Co. (LOC: | |||||
| Citizens Bank) 4.100%, | |||||
| 05/05/2006 (a)(b) | 980,000 | ||||
| 1,000,000 | Monroe County Industrial | ||||
| Economic Development | |||||
| Revenue, Textillery Weavers | |||||
| (LOC: Old National Bank) | |||||
| 4.400%, 05/05/2006 (a)(b) | 1,000,000 | ||||
| 455,000 | Princeton Industrial | ||||
| Development Revenue, Orion | |||||
| Denki American Inc. (LOC: | |||||
| Bank of Mitsubishi Tokyo) | |||||
| 4.110%, 05/05/2006 (a)(b) | 455,000 | ||||
| 2,150,000 | Shelbyville Industrial Economic | ||||
| Development Revenue, AFR | |||||
| Properties & American | |||||
| Resources (LOC: Associated | |||||
| Bank N.A.) 4.110%, | |||||
| 05/05/2006 (a)(b) | 2,150,000 | ||||
| 4,585,000 |
See notes to financial statements.
31
Alpine Mutual Funds - Municipal Money Market Fund
Schedule of Portfolio Investments—Continued
April 30, 2006 (Unaudited)
Principal Amount | Security Description | Value | |||
Municipal Bonds—continued | |||||
| Iowa—4.7% | |||||
| 1,345,000 | Eldridge Industrial | ||||
| Development Revenue, | |||||
| American Finishing Resources, | |||||
| Inc. 4.110%, 05/05/2006 (a)(b) | $ | 1,345,000 | |||
| 6,000,000 | Finance Authority Single Family | ||||
| Revenue—Series C (SPA: | |||||
| State Street B&T Co.) | |||||
| 3.500%, 09/01/2006 (a)(b)(d) | 6,000,000 | ||||
| 4,800,000 | Finance Authority Solid Waste | ||||
| Disposal, Jacksonville Farms, | |||||
| LLP (LOC: Bank of Oklahoma | |||||
| N.A., Suntrust Bank) 3.990%, | |||||
| 05/05/2006 (a)(b) | 4,800,000 | ||||
| 12,145,000 | |||||
| Kentucky—0.1% | |||||
| 400,000 | Bardstown Industrial | ||||
| Development Corp., JAV LLC | |||||
| (LOC: Bank of Michigan) | |||||
| 3.950%, 05/05/2006 (a)(b) | 400,000 |
| Louisiana—0.8% | |||||
| 2,000,000 | Local Government Environment | ||||
| Facilities Community | |||||
| Development Authority | |||||
| Revenue, Caddo-Bossier | |||||
| Parishes (LOC: Hibernia | |||||
| National Bank) 4.810%, | |||||
| 05/05/2006 (a)(b) | 2,000,000 |
| Maine—1.9% | |||||
| Dover & Foxcroft Revenue, | |||||
| Pleasant River Lumber Co. | |||||
| (LOC: CoBank ACB, Wachovia | |||||
| Bank N.A.) | |||||
| 3,000,000 | 3.990%, 05/05/2006 (a)(b) | 3,000,000 | |||
| 1,900,000 | 3.990%, 05/05/2006 (a)(b) | 1,900,000 | |||
| 4,900,000 |
| Michigan—1.9% | |||||
| 1,000,000 | Strategic Fund Ltd. Obligation | ||||
| Revenue—Series A (LOC: | |||||
| Fifth Third Bank) 4.150%, | |||||
| 05/05/2006 (a)(b) | 1,000,000 | ||||
| 4,000,000 | Strategic Fund Ltd. Obligation | ||||
| Revenue, Rudolph Etta | |||||
| Dejong—1982 (LOC: Farm | |||||
| Credit Services of America, | |||||
| Bank of the West) 3.990%, | |||||
| 05/05/2006 (a)(b) | 4,000,000 | ||||
| 5,000,000 |
| Minnesota—3.7% | |||||
| 4,500,000 | East Grand Forks Solid Waste | ||||
| Disposal Revenue, American | |||||
| Crystal Sugar Co. 3.990%, | |||||
| 05/05/2006 (a)(b) | 4,500,000 | ||||
| 3,810,000 | Ramsey Industrial Development | ||||
| Revenue, Kilkenny LLC— | |||||
| Series A 4.000%, 05/05/2006 | |||||
| (a)(b) | 3,810,000 |
Principal Amount | Security Description | Value | |||
Municipal Bonds—continued | |||||
| Minnesota—continued | |||||
| 1,480,000 | St. Cloud Housing & | ||||
| Redevelopment Authority | |||||
| Industrial Development | |||||
| Revenue, CMMB LLP (LOC: | |||||
| Bremer Bank N.A.) 4.350%, | |||||
| 05/05/2006 (a)(b) | $ | 1,480,000 | |||
| 9,790,000 | |||||
| Mississippi—2.6% | |||||
| 6,750,000 | Prentiss County Industrial | ||||
| Development Revenue, | |||||
| Heidelberg Eastern (LOC: | |||||
| UniBank Savings) 3.700%, | |||||
| 05/28/2006 (a)(b) | 6,750,000 |
| Missouri—4.6% | |||||
| 2,600,000 | Cabool Industrial Development | ||||
| Authority Revenue, | |||||
| Ameriduct Worldwide Inc. | |||||
| (LOC: Harris Trust & Savings | |||||
| Bank) 4.030%, 05/05/2006 | |||||
| (a)(b) | 2,600,000 | ||||
| Springfield Industrial | |||||
| Development Authority | |||||
| Revenue, DMP Properties LLC | |||||
| (LOC: U.S. Bank N.A.) | |||||
| 2,105,000 | 4.050%, 05/05/2006 (a)(b) | 2,105,000 | |||
| 1,700,000 | 4.050%, 05/05/2006 (a)(b) | 1,700,000 | |||
| 2,000,000 | St. Joseph Industrial | ||||
| Development Authority | |||||
| Industrial Development | |||||
| Revenue, Albaugh Inc.— | |||||
| Series A (LOC: U.S. Bank | |||||
| N.A.) 4.150%, 05/05/2006 | |||||
| (a)(b) | 2,000,000 | ||||
| 3,490,000 | Washington Industrial | ||||
| Development Authority | |||||
| Industrial Revenue, Clemco | |||||
| Industries 4.080%, 05/05/2006 | |||||
| (a)(b) | 3,490,000 | ||||
| 11,895,000 |
| New Mexico—1.8% | |||||
| 1,360,000 | Albuquerque Industrial | ||||
| Development Revenue, | |||||
| Karsten Company 4.000%, | |||||
| 05/05/2006 (a)(b) | 1,360,000 | ||||
| 455,000 | Las Cruces Industrial | ||||
| Development Revenue, | |||||
| Parkview Metal Products | |||||
| 3.950%, 05/05/2006 (a)(b) | 455,000 | ||||
| 1,300,000 | New Mexico Housing Authority | ||||
| Region III Multifamily | |||||
| Revenue, El Pueblo | |||||
| Apartments—Series A (LOC: | |||||
| PNC Bank N.A.) 4.050%, | |||||
| 05/05/2006 (a)(b) | 1,300,000 |
See notes to financial statements.
32
Alpine Mutual Funds - Municipal Money Market Fund
Schedule of Portfolio Investments—Continued
April 30, 2006 (Unaudited)
Principal Amount | Security Description | Value | |||
Municipal Bonds—continued | |||||
| New Mexico—continued | |||||
| 1,500,000 | New Mexico Housing Authority | ||||
| Region III Multifamily | |||||
| Revenue, Madeira Court | |||||
| Apartments—Series B (LOC: | |||||
| PNC Bank N.A.) 4.050%, | |||||
| 05/05/2006 (a)(b) | $ | 1,500,000 | |||
| 4,615,000 | |||||
| New York—1.3% | |||||
| 500,000 | Dormitory Authority Revenue, | ||||
| State University Educational | |||||
| Facilities—Series A 6.500%, | |||||
| 05/15/2006 | 500,566 | ||||
| 725,000 | Erie County Industrial | ||||
| Development Agency | |||||
| Revenue, MMars 3rd Pg— | |||||
| B&G Properties—Class B | |||||
| 4.000%, 05/05/2006 (a)(b) | 725,000 | ||||
| 650,000 | New York City General | ||||
| Obligation Bond—Series P | |||||
| 4.000%, 08/01/2006 | 650,692 | ||||
| 145,000 | Niagara County Industrial | ||||
| Development Agency | |||||
| Revenue, MMars Second | |||||
| Program—Series A 4.050%, | |||||
| 05/05/2006 (a)(b) | 145,000 | ||||
| 1,500,000 | Riverhead Industrial | ||||
| Development Authority, | |||||
| Altaire Pharmaceuticals (LOC: | |||||
| Mellon Bank N.A.) 4.050%, | |||||
| 05/05/2006 (a)(b) | 1,500,000 | ||||
| 3,521,258 |
| North Dakota—0.2% | |||||
| 640,000 | Fargo Comercial Development | ||||
| Revenue, Cass Oil Co. (LOC: | |||||
| U.S. Bank N.A.) 3.950%, | |||||
| 05/05/2006 (a)(b) | 640,000 |
| Ohio—4.4% | |||||
| 800,000 | Cuyahoga County Industrial | ||||
| Development Revenue, Edge | |||||
| Seal Technologies (LOC: | |||||
| Firstmerit Bank) 4.050%, | |||||
| 05/05/2006 (a)(b) | 800,000 | ||||
| 1,400,000 | Hamilton County Economic | ||||
| Development Revenue, Union | |||||
| Institute (LOC: Huntington | |||||
| National Bank) 4.030%, | |||||
| 05/05/2006 (a)(b) | 1,400,000 | ||||
| 2,510,000 | Portage County Industrial | ||||
| Development Revenue, NCSP | |||||
| Limited Partnership (LOC: | |||||
| Huntington National Bank) | |||||
| 3.950%, 05/05/2006 (a)(b) | 2,510,000 |
Principal Amount | Security Description | Value | |||
Municipal Bonds—continued | |||||
| Ohio—continued | |||||
| 2,250,000 | Richland County Industrial | ||||
| Development Revenue, | |||||
| Mansfield Motel Partnership | |||||
| (LOC: Huntington National | |||||
| Bank) 3.950%, 05/05/2006 | |||||
| (a)(b) | $ | 2,250,000 | |||
| 2,500,000 | Summit County Port Authority | ||||
| Revenue, KB Compost | |||||
| Services (LOC: Keybank N.A.) | |||||
| 3.930%, 05/05/2006 (a)(b) | 2,500,000 | ||||
| 2,000,000 | Trumbull County Industrial | ||||
| Development Revenue, | |||||
| McDonald Steel (LOC: | |||||
| Keybank N.A.) 3.930%, | |||||
| 05/05/2006 (a)(b) | 2,000,000 | ||||
| 11,460,000 | |||||
| Pennsylvania—1.9% | |||||
| 5,000,000 | Beaver County Industrial | ||||
| Development Authority, BASF | |||||
| Corp. 3.870%, 04/29/2006 | |||||
| (a)(b) | 5,000,000 |
| Puerto Rico—1.9% | |||||
| 2,500,000 | Puerto Rico GDB, 4.150%, | ||||
| 05/04/2006 (c) | 2,500,000 | ||||
| 2,500,000 | Puerto Rico GDB Custodial | ||||
| Receipts (d) (LOC: Societe | |||||
| Generale) 3.250%, 07/24/2006 | |||||
| (a)(b)(d) | 2,500,000 | ||||
| 5,000,000 |
| Rhode Island—0.6% | |||||
| 1,600,000 | Industrial Facilities Corporate | ||||
| Development Revenue, | |||||
| Greystone of Lincoln (LOC: | |||||
| Citizens Bank NA) 4.100%, | |||||
| 05/05/2006 (a)(b) | 1,600,000 |
| South Carolina—1.3% | |||||
| 3,500,000 | Dorchester County School | ||||
| District—No. 002 (CS: South | |||||
| Carolina State Department of | |||||
| Education) 4.000%, | |||||
| 06/01/2006 | 3,502,858 | ||||
| South Dakota—0.9% | |||||
| 1,400,000 | Brookings Industrial | ||||
| Development Revenue, | |||||
| Lormar Development Co. | |||||
| (LOC: U.S. Bank N.A.) | |||||
| 4.050%, 05/05/2006 (a)(b) | 1,400,000 | ||||
| 840,000 | South Dakota Economic | ||||
| Development Finance | |||||
| Authority Economic Revenue, | |||||
| Vicom Ltd. (LOC: Associated | |||||
| Bank N.A.) 4.080%, | |||||
| 05/05/2006 (a)(b) | 840,000 | ||||
| 2,240,000 |
See notes to financial statements.
33
Alpine Mutual Funds - Municipal Money Market Fund
Schedule of Portfolio Investments—Continued
April 30, 2006 (Unaudited)
Principal Amount | Security Description | Value | |||
Municipal Bonds—continued | |||||
| Tennessee—2.5% | |||||
| 1,100,000 | Hamilton County Industrial | ||||
| Development Revenue, | |||||
| Hamilton Plastics Inc. (LOC: | |||||
| First American National | |||||
| Bank) 4.070%, 05/05/2006 | |||||
| (a)(b) | $ | 1,100,000 | |||
| 340,000 | Jackson Health Educational & | ||||
| Housing Facility Board | |||||
| Revenue, Creekside | |||||
| Apartments (LOC: First | |||||
| Tennessee Bank) 4.000%, | |||||
| 12/01/2006 (a)(b)(d) | 340,000 | ||||
| 5,000,000 | Jackson Health Educational & | ||||
| Housing Facility Board | |||||
| Revenue, Park Ridge | |||||
| Apartments (LOC: First | |||||
| Tennessee Bank) 4.000%, | |||||
| 05/05/2006 (a)(b) | 5,000,000 | ||||
| 6,440,000 | |||||
| Texas—11.8% | |||||
| 5,000,000 | Archer City Growth & | ||||
| Development, Pork Products | |||||
| II (LOC: Bank of Oklahoma | |||||
| N.A., Suntrust Bank) 3.990%, | |||||
| 05/05/2006 (a)(b) | 5,000,000 | ||||
| 2,000,000 | Gulf Coast Waste Disposal | ||||
| Authority, Republic Waste | |||||
| Services 4.080%, 05/05/2006 | |||||
| (a)(b) | 2,000,000 | ||||
| 6,355,000 | Houston Comunity College | ||||
| System Revenue, P-Floats— | |||||
| PT-2741 (SPA: Merrill Lynch | |||||
| Capital Services) 3.500%, | |||||
| 06/08/2006 (a)(b) | 6,355,000 | ||||
| 2,000,000 | Montgomery County Industrial | ||||
| Development Revenue, | |||||
| Medical Manufacturing | |||||
| Partners (LOC: Bank One | |||||
| Texas N.A.) 3.950%, | |||||
| 05/05/2006 (a)(b) | 2,000,000 | ||||
| Port Corpus Christi Authority | |||||
| Nueces County Waste | |||||
| Disposal, Flint Hills Resources | |||||
| LP (CS: Flint Hills Resources) | |||||
| 1,500,000 | 4.100%, 05/05/2006 (a)(b) | 1,500,000 | |||
| 3,000,000 | 4.100%, 05/05/2006 (a)(b) | 3,000,000 | |||
| 5,000,000 | 4.100%, 05/05/2006 (a)(b) | 5,000,000 | |||
| 3,850,000 | Port Arthur Naval District | ||||
| Revenue (CS: Total FINA Elf | |||||
| S.A. 4.000%, 05/05/2006 | |||||
| (a)(b) | 3,850,000 | ||||
| 315,000 | Saginaw Industrial | ||||
| Development Authority, Glad | |||||
| Investing (LOC: Bank One | |||||
| Texas N.A.) 4.100%, | |||||
| 05/05/2006 (a)(b) | 315,000 |
Principal Amount | Security Description | Value | |||
Municipal Bonds—continued | |||||
| Texas—continued | |||||
| 1,650,000 | West Side Calhoun County | ||||
| Naval District Environmental | |||||
| Facilities Revenue, BP | |||||
| Chemicals Inc. 3.860%, | |||||
| 04/29/2006 (a)(b) | $ | 1,650,000 | |||
| 30,670,000 | |||||
| Utah—1.0% | |||||
| 2,500,000 | Utah Housing Corporation | ||||
| Multifamily Revenue, Todd | |||||
| Hollow Apartments—A (CS: | |||||
| AIG) 4.250%, 05/05/2006 | |||||
| (a)(b)(d) | 2,500,000 |
| Virginia—0.7% | |||||
| 1,860,000 | Louisa County Industrial | ||||
| Development Authority | |||||
| Revenue, University of | |||||
| Virginia Health Services | |||||
| Foundation (LOC: Wachovia | |||||
| Bank N.A.) 3.830%, | |||||
| 05/05/2006 (a)(b) | 1,860,000 |
| Washington—1.8% | |||||
| 1,985,000 | Washington Economic | ||||
| Development Finance | |||||
| Authority Revenue, B&H | |||||
| Dental Laboratory—Series B | |||||
| (LOC: U.S. Bank N.A.) | |||||
| 4.040%, 05/05/2006 (a)(b) | 1,985,000 | ||||
| 1,110,000 | Washington Economic | ||||
| Development Finance | |||||
| Authority Revenue, Belina | |||||
| Interiors Inc.—Series F (LOC: | |||||
| Keybank N.A.) 3.970%, | |||||
| 05/05/2006 (a)(b) | 1,110,000 | ||||
| 1,700,000 | Washington Economic | ||||
| Development Finance | |||||
| Authority Revenue, Hillstrom | |||||
| Ventures LLC (LOC: U.S. Bank | |||||
| N.A.) 4.040%, 05/05/2006 | |||||
| (a)(b) | 1,700,000 | ||||
| 4,795,000 |
| Wisconsin—6.3% | |||||
| Fox Lake Redevelopment | |||||
| Authority Revenue, Karavan | |||||
| Trailers Inc. (LOC: Associated | |||||
| Bank N.A.) | |||||
| 635,000 | 4.080%, 05/05/2006 (a)(b) | 635,000 | |||
| 2,750,000 | 4.080%, 05/05/2006 (a)(b) | 2,750,000 | |||
| 1,380,000 | Franklin Industrial | ||||
| Development Revenue, | |||||
| Howard Henz Co. Inc. (LOC: | |||||
| Associated Bank N.A.) | |||||
| 4.110%, 05/05/2006 (a)(b) | 1,380,000 | ||||
| 1,750,000 | Franklin Industrial | ||||
| Development Revenue, | |||||
| Smyczek/ECS (LOC: Wells | |||||
| Fargo Bank N.A.) 3.950%, | |||||
| 05/05/2006 (a)(b) | 1,750,000 |
See notes to financial statements.
34
Alpine Mutual Funds - Municipal Money Market Fund
Schedule of Portfolio Investments—Continued
April 30, 2006 (Unaudited)
Principal Amount | Security Description | Value | |||
Municipal Bonds—continued | |||||
| Wisconsin—continued | |||||
| 4,310,000 | Hull Industrial Development | ||||
| Revenue, Welcome Dairy Inc. | |||||
| (LOC: Associated Bank N.A.) | |||||
| 4.050%, 05/05/2006 (a)(b) | $ | 4,310,000 | |||
| 560,000 | Neenah Industrial Development | ||||
| Revenue, Galloway Co. (LOC: | |||||
| Bank One Wisconsin) 4.100%, | |||||
| 05/05/2006 (a)(b) | 560,000 | ||||
| 1,940,000 | Reedsburg Industrial | ||||
| Development Revenue, Cellox | |||||
| LLC (LOC: Associated Bank | |||||
| N.A.) 4.110%, 05/05/2006 | |||||
| (a)(b) | 1,940,000 | ||||
| 1,700,000 | Rhinelander Industrial | ||||
| Development Revenue, | |||||
| Superior Diesel/SDI Properites | |||||
| (LOC: Associated Bank N.A.) | |||||
| 4.110%, 05/05/2006 (a)(b) | 1,700,000 | ||||
| 1,300,000 | Sheboygan Industrial | ||||
| Development Revenue, | |||||
| Polyfab & Gill-Janssen (LOC: | |||||
| Associated Bank Lakeshore) | |||||
| 4.080%, 05/05/2006 (a)(b) | 1,300,000 | ||||
| 200,000 | Sturgeon Bay Industrial | ||||
| Development Revenue, | |||||
| Midwest Wire Realty (LOC: | |||||
| Associated Bank Milwaukee) | |||||
| 4.100%, 05/05/2006 (a)(b) | 200,000 | ||||
| 16,525,000 | |||||
Principal Amount | Security Description | Value | |||
Municipal Bonds—continued | |||||
| Multistate—10.3% | |||||
| 11,220,000 | Class B Revenue Bond | ||||
| Certificates—Series Trust | |||||
| 2004-1 (SPA: AIG Retirement | |||||
| Services) 4.250%, 05/05/2006 | |||||
| (a)(b) | $ | 11,220,000 | |||
| 10,685,000 | Puttable Floating Option Tax- | ||||
| Exempt Receipts, Regular | |||||
| Floats Mode A PPT-38 (LOC: | |||||
| Lloyds TSB Bank) 4.010%, | |||||
| 05/05/2006 (a)(b) | 10,685,000 | ||||
| 5,000,000 | Revenue Bond Certificate Series | ||||
| Trust 2005 B-1 (CS: AIG) | |||||
| 4.130%, 05/05/2006 (a)(b) | 5,000,000 | ||||
| 26,905,000 | |||||
| Total Municipal Bonds | |||||
| (Cost $263,309,810) | 263,309,810 | ||||
Money Market Funds—0.0% | |||||
| 69,625 | Federated Government | ||||
| Obligations Fund | 69,625 | ||||
| Total Money Market Funds | |||||
| (Cost $69,625) | 69,625 | ||||
| Total Investments | |||||
| (Cost $263,379,435)—101.0% | 263,379,435 | ||||
| Liabilities, Less Other | |||||
| Assets—(1.0)% | (2,554,081) | ||||
| TOTAL NET ASSETS—100.0% | $ | 260,825,354 | |||
________
(a) Variable Rate Security—The rate reported is the rate in effect as of April 30, 2006. The date shown is the next reset date.
(b) Maturity date represents first available put date.
(c) Commercial Paper
(d) Put Bond
CS—Credit Support
LOC—Letter of Credit
SPA—Standby Purchase Agreement
GDB—Government Development Bank
See notes to financial statements.
35
Alpine Mutual Funds - Tax Optimized Income Fund
Schedule of Portfolio Investments April 30, 2006 (Unaudited)
Principal Amount | Security Description | Value | |||
Corporate Bonds—3.2% | |||||
| 1,000,000 | AOL Time Warner Inc | ||||
| 6.150%, 05/01/2007 | $ | 1,007,308 | |||
| 500,000 | CIT Group Inc. | ||||
| 4.000%, 05/08/2008 | 487,049 | ||||
| Total Corporate Bonds | 1,494,357 | ||||
Municipal Bonds—92.9% | |||||
| Alabama—1.7% | |||||
| 800,000 | Mcintosh Industrial Development | ||||
| Board Environmental Revenue, | |||||
| CIBC Specialty | |||||
| 4.070%, 04/29/2006 (a)(b) | 800,000 | ||||
| Arkansas—3.9% | |||||
| 100,000 | Magnolia Industrial | ||||
| Development Revenue, | |||||
| American Fuel Cell | |||||
| (LOC: HSBC Bank USA N.A.) | |||||
| 4.150%, 05/05/2006 (a)(b) | 100,000 | ||||
| 1,700,000 | Searcy Industrial Development | ||||
| Revenue, Yarnell Ice Cream | |||||
| Co. (CS: ADFA GTD) | |||||
| 4.800%, 01/01/2010 (a)(b) | 1,700,000 | ||||
| 1,800,000 |
| Arizona—7.7% | |||||
| 3,100,000 | Maricopa County Industrial | ||||
| Development Authority | |||||
| Multifamily Housing Revenue, | |||||
| AHF Affordable Housing, | |||||
| Series B | |||||
| 5.250%, 05/28/2006 (e) | 3,100,000 | ||||
| 445,000 | Maricopa County Industrial | ||||
| Development Authority | |||||
| Multifamily Housing Revenue, | |||||
| San Fernando Apartments | |||||
| LP—Series A (CS: Fannie Mae) | |||||
| 4.140%, 05/05/2006 (a)(b)(e) | 445,000 | ||||
| 3,545,000 |
| California—5.4% | |||||
| 1,500,000 | Statewide Communities | ||||
| Development Authority | |||||
| Multifamily Revenue, | |||||
| Oakwood Apartments (CS: | |||||
| Citigroup Global Markets) | |||||
| 3.470%, 06/15/2006 (a)(b)(d) | 1,500,000 | ||||
| 1,000,000 | Statewide Communities | ||||
| Development Authority Solid | |||||
| Waste Facilities Revenue, | |||||
| Waste Management (CS: | |||||
| Waste Management Inc.) | |||||
| 2.900%, 04/01/2007 (a)(b)(d) | 989,700 | ||||
| 2,489,700 |
| Delaware—4.8% | |||||
| 2,200,000 | Education Loan Asset Backed | ||||
| Trust Student Loan Revenue | |||||
| 5.050%, 05/28/2006 (e) | 2,200,000 |
Principal Amount | Security Description | Value | |||
Municipal Bonds—continued | |||||
| Indiana—4.3% | |||||
| 2,000,000 | Vigo County Industrial | ||||
| Development Revenue, | |||||
| Republic Services Inc. | |||||
| 4.150%, 05/05/2006 (a)(b) | $ | 2,000,000 | |||
| Kentucky—1.4% | |||||
| 650,000 | Shelby County Industrial | ||||
| Building Revenue, Roll | |||||
| Forming Corp. | |||||
| (LOC: Bayerische) | |||||
| 4.100%, 05/05/2006 (a)(b) | 650,000 |
| Louisiana—18.7% | |||||
| 2,000,000 | Ascension Parish Waste Disposal, | ||||
| Alliedsignal Inc. | |||||
| 4.150%, 05/05/2006 (a)(b) | 2,000,000 | ||||
| 900,000 | Caddo-Bossier Parishes Port | ||||
| Commission, Shreveport | |||||
| Fabricators (LOC: Hibernia | |||||
| National Bank) | |||||
| 4.810%, 05/05/2006 (a)(b) | 900,000 | ||||
| 2,200,000 | Jefferson Parish Industrial | ||||
| Development Board | |||||
| 4.880%, 04/29/2006 (a)(b) | 2,200,000 | ||||
| 3,500,000 | Local Government Environment | ||||
| Facilities Comunity | |||||
| Development Authority | |||||
| Revenue, Caddo-Bossier | |||||
| Parishes (LOC: Hibernia | |||||
| National Bank) | |||||
| 4.810%, 05/05/2006 (a)(b) | 3,500,000 | ||||
| 8,600,000 |
| Maryland—2.2% | |||||
| 1,000,000 | State Health & Higher Education | ||||
| Facilities Authority Revenue, | |||||
| Loyola College—Series B | |||||
| 3.450%, 10/03/2006 (e) | 1,000,000 |
| Massachusetts—7.0% | |||||
| 1,045,000 | State Industrial Finance Agency | ||||
| Revenue, Asahi/America Inc. | |||||
| 3.125%, 03/01/2009 (a)(b)(d) | 1,020,202 | ||||
| 2,200,000 | State Port Authority Revenue | ||||
| Bonds, Delta Air Lines— | |||||
| Series B | |||||
| 4.200%, 05/28/2006 (a)(b)(e) | 2,200,000 | ||||
| 3,220,202 | |||||
| Michigan—2.2% | |||||
| 1,000,000 | Strategic Fund Revenue, Dow | ||||
| Chemical Company | |||||
| 3.800%, 06/01/2006 (a)(b)(d) | 999,810 | ||||
| New Jersey—8.1% | |||||
| 1,000,000 | Bayonne BD Anticipation Notes | ||||
| 4.500%, 06/29/2006 | 999,650 | ||||
| 500,000 | Bayonne Tax Anticipation Notes | ||||
| Series A | |||||
| 5.000%, 10/13/2006 | 500,810 |
See notes to financial statements.
36
Alpine Mutual Funds - Tax Optimized Income Fund
Schedule of Portfolio Investments—Continued
April 30, 2006 (Unaudited)
Principal Amount | Security Description | Value | |||
Municipal Bonds—continued | |||||
| New Jersey— continued | |||||
| 500,000 | Bayonne Tax Anticipation Notes | ||||
| Series B | |||||
| 5.000%, 12/11/2006 | $ | 501,200 | |||
| 515,000 | State Educational Facilities | ||||
| Authority Revenue, Stevens | |||||
| Instutute of Technology — | |||||
| Series C | |||||
| 4.000%, 07/01/2006 | 514,984 | ||||
| 1,195,000 | Tobacco Settlement Finance | ||||
| Corporation | |||||
| 5.750%, 06/01/2012 | 1,241,426 | ||||
| 3,758,070 | |||||
| New York—2.4% | |||||
| 600,000 | Monroe County Industrial | ||||
| Development Agency Revenue, | |||||
| Turbine Parts | |||||
| 8.000%, 12/01/2006 | 632,208 | ||||
| 500,000 | Westchester Tobacco Asset | ||||
| Securitization Corporation | |||||
| 5.000%, 06/01/2015 | 493,740 | ||||
| 1,125,948 |
| Ohio—0.5% | |||||
| 215,000 | Summit County Industrial | ||||
| Development Revenue, LKL | |||||
| Properties Inc. | |||||
| (LOC: Firstmerit Bank N.A.) | |||||
| 4.400%, 05/05/2006 (a)(b) | 215,000 |
| Oklahoma—7.2% | |||||
| 3,300,000 | Tulsa County Industrial Authority | ||||
| Multifamily Revenue, AHF | |||||
| Affordable Housing Series B | |||||
| 5.250%, 05/28/2006 (e) | 3,300,000 |
Principal Amount | Security Description | Value | |||
Municipal Bonds—continued | |||||
| Puerto Rico—4.8% | |||||
| Puerto Rico GDB | |||||
| 1,000,000 | 4.150%, 05/03/2006 (c) | $ | 1,000,000 | ||
| 1,200,000 | 3.850%, 10/02/2006 (c) | 1,200,000 | |||
| 2,200,000 | |||||
| South Carolina—2.2% | |||||
| 1,000,000 | Charleston County Industrial | ||||
| Revenue, Tandy Corporation | |||||
| 4.650%, 05/05/2006 (a)(b) | 1,000,000 | ||||
| Texas—6.9% | |||||
| 1,200,000 | Cypress-Fairbanks Independent | ||||
| School District—Series B | |||||
| 5.000%, 08/15/2007 (a)(b)(d) | 1,219,008 | ||||
| 1,960,000 | Revenue Bond Certificates Series | ||||
| Trust, Heather Lane—Taxable | |||||
| (CS: AIG) | |||||
| 5.400%, 05/05/2006 (a)(b) | 1,960,000 | ||||
| 3,179,008 |
| Wisconsin—1.5% | |||||
| 700,000 | Oconomowoc Area School | ||||
| District Aniticipation Notes— | |||||
| Taxable | |||||
| 4.950%, 08/01/2006 | 700,000 | ||||
| Total Municipal Bonds | 42,782,738 | ||||
Short-Term Investments—0.1% | |||||
| 47,838 | Federated Government | ||||
| Obligations Fund | 47,838 | ||||
| Total Short-Term Investments | 47,838 | ||||
| Total Investments | |||||
| (Cost $44,299,792)—96.2% | 44,324,933 | ||||
| Other Assets, less | |||||
| Liabilities—3.8% | 1,737,713 | ||||
| TOTAL NET ASSETS—100.0% | $ | 46,062,646 | |||
________
(a) Variable Rate Security—The rate reported is the rate in effect as of April 30, 2006. The date shown is the next reset date.
(b) Maturity date represents first available put date.
(c) Commercial Paper
(d) Put Bond
(e) Auction Rate Note
CS—Credit Support
LOC—Letter of Credit
SPA—Stand by Purchase Agreement
GDB—Government Development Bank
See notes to financial statements.
37
Alpine Mutual Funds
Statements of Assets and Liabilities
April 30, 2006 (Unaudited)
Dynamic Balance Fund | Dynamic Dividend Fund | Dynamic Financial Services Fund | ||||
ASSETS: | ||||||
| Investments, at value (1) | $ | 101,609,862 | $ | 458,309,548 | $ | 3,674,431 |
| Cash | 360 | — | — | |||
| Dividends receivable | 48,270 | 1,235,087 | 1,148 | |||
| Interest receivable | 333,570 | 70,134 | 2,277 | |||
| Receivable for capital shares issued | 25 | 3,605,337 | 26,298 | |||
| Receivable for investment securities sold | 1,410,012 | 7,419,909 | 111,866 | |||
| Prepaid expenses and other assets | 16,933 | 22,568 | 27,136 | |||
| Total asset | 103,419,032 | 470,662,583 | 3,843,156 | |||
LIABILITIES: | ||||||
| Payable for investment securities purchased | — | 18,736,766 | 322,151 | |||
| Payable for capital shares redeemed | 42,080 | 78,186 | — | |||
| Accrued expenses and other liabilities: | ||||||
| Investment advisory fees | 85,111 | 352,593 | 2,772 | |||
| Other | 59,883 | 187,075 | 21,826 | |||
| Total liabilities | 187,074 | 19,354,620 | 346,749 | |||
Net Assets | $ | 103,231,958 | $ | 451,307,963 | $ | 3,496,407 |
Net assets represented by | ||||||
| Capital Stock | $ | 82,249,482 | $ | 432,034,326 | $ | 3,267,530 |
| Accumulated undistributed net investment income | 108,957 | 4,695,433 | 2,481 | |||
| Accumulated net realized gains on investments sold and foreign currency | ||||||
| related transactions | 2,754,090 | (11,162,275) | 86,896 | |||
| Net unrealized appreciation/depreciation on: | ||||||
| Investments | 18,119,429 | 25,761,923 | 139,500 | |||
| Foreign currency translation | — | (21,444) | — | |||
Total Net Assets | $ | 103,231,958 | $ | 451,307,963 | $ | 3,496,407 |
Net asset value | ||||||
| Net assets | $ | 103,231,958 | $ | 451,307,963 | $ | 3,496,407 |
| Shares of beneficial interest issued and outstanding | 7,530,762 | 34,552,638 | 304,840 | |||
| Net asset value, offering price and redemption price per share | $ | 13.71 | $ | 13.06 | $ | 11.47 |
| (1) Cost of Investments | $ | 83,490,433 | $ | 432,547,625 | $ | 3,534,931 |
See notes to financial statements.
38
Alpine Mutual Funds
Statements of Assets and Liabilities
April 30, 2006 (Unaudited)
Municipal Money Market Fund | Tax Optimized Income Fund | |||
ASSETS: | ||||
| Investments, at value (1) | $ | 263,379,435 | $ | 44,324,933 |
| Cash | — | 2,593 | ||
| Interest receivable | 1,075,190 | 366,347 | ||
| Receivable for capital shares issued | 425,734 | — | ||
| Receivable for investment securities sold | — | 1,382,829 | ||
| Prepaid expenses and other assets | 82,012 | 32,436 | ||
| Total assets | 264,962,371 | 46,109,138 | ||
LIABILITIES: | ||||
| Payable for invetment securities purchased | 3,549,203 | — | ||
| Payable for capital shares redeemed | 245,407 | — | ||
| Accrued expenses and other liabilities: | ||||
| Investment advisory fees | 96,485 | 28,335 | ||
| Distribution fees | 1,330 | 196 | ||
| Payable to custodian | 5,659 | 1,148 | ||
| Other | 238,933 | 16,813 | ||
| Total liabilities | 4,137,017 | 46,492 | ||
Net Assets | $ | 260,825,354 | $ | 46,062,646 |
Net assets represented by | ||||
| Capital Stock | $ | 260,825,354 | $ | 46,066,356 |
| Accumulated undistributed net investment income | — | 14,510 | ||
| Accumulated net realized gains from investments sold | — | (43,361) | ||
| Net unrealized appreciation on investments | — | 25,141 | ||
Total Net Assets | $ | 260,825,354 | $ | 46,062,646 |
Net asset value | ||||
| Adviser Class Shares | ||||
| Net assets | $ | 828,258 | $ | 5,196 |
| Shares of beneficial interest issued and outstanding | 828,286 | 516 | ||
| Net asset value, offering price and redemption price per share | $ | 1.00 | $ | 10.07 |
| Investor Class Shares | ||||
| Net assets | $ | 259,997,096 | $ | 46,057,450 |
| Shares of beneficial interest issued and outstanding | 260,005,701 | 4,591,934 | ||
| Net asset value, offering price and redemption price per share | $ | 1.00 | $ | 10.03 |
| (1) Cost of Investments | $ | 263,379,435 | $ | 44,299,792 |
See notes to financial statements.
39
Alpine Mutual Funds
Statements of Operations
Six Months Ended April 30, 2006 (Unaudited)
Dynamic Balance Fund | Dynamic Dividend Fund | Dynamic Financial Services Fund | ||||||||
INVESTMENT INCOME: | ||||||||||
Interest income | $ | 541,229 | $ | 145,974 | $ | 7,879 | ||||
Dividend income* | 846,881 | 27,532,951 | 7,372 | |||||||
Total investment income | 1,388,110 | 27,678,925 | 15,251 | |||||||
EXPENSES: | ||||||||||
Investment advisory fees | 506,660 | 1,837,600 | 8,838 | |||||||
Administration fees | 22,780 | 76,554 | 296 | |||||||
Fund accounting fees | 13,085 | 43,678 | 162 | |||||||
Audit fees | 10,043 | 11,206 | 8,860 | |||||||
Custodian fees | 5,217 | 17,001 | 63 | |||||||
Interest expense | — | 3,756 | — | |||||||
Legal fees | 1,584 | 4,822 | 2,020 | |||||||
Registration and filing fees | 10,355 | 31,860 | 13,415 | |||||||
Printing fees | 7,062 | 33,956 | 3,595 | |||||||
Transfer agent fees | 23,013 | 77,174 | 304 | |||||||
Trustee fees | 1,935 | 1,860 | 1,850 | |||||||
Other fees | 1,705 | 4,922 | 1,789 | |||||||
| Total expenses before expense recovery by Adviser | 603,439 | 2,144,389 | 41,192 | |||||||
Expense waiver by Adviser | — | — | (29,262 | ) | ||||||
Net expenses | 603,439 | 2,144,389 | 11,930 | |||||||
| Net investment income | 784,671 | 25,534,536 | 3,321 | |||||||
REALIZED/UNREALIZED GAIN (LOSS) ON INVESTMENTS: | ||||||||||
Net realized gain (loss) on: | ||||||||||
Long transactions | 2,754,291 | (5,580,673 | ) | 86,896 | ||||||
Foreign currencies | — | (572,959 | ) | — | ||||||
Net realized gain (loss) | 2,754,291 | (6,153,632 | ) | 86,896 | ||||||
Change in unrealized appreciation/depreciation on investments | ||||||||||
Investments | 6,873,930 | 36,484,673 | 139,500 | |||||||
Foreign currency translation | — | (14,418 | ) | — | ||||||
Net change in unrealized appreciation/depreciation | 6,873,930 | 36,470,255 | 139,500 | |||||||
| Net realized/unrealized gain (loss) on investments | 9,628,221 | 30,316,623 | 226,396 | |||||||
| Change in net assets resulting from operations | $ | 10,412,892 | $ | 55,851,159 | $ | 229,717 | ||||
| * Net of foreign taxes withheld | $ | — | $ | 1,649,639 | $ | — | ||||
See notes to financial statements.
40
Alpine Mutual Funds
Statements of Operations
Six Months Ending April 30, 2006 (Unaudited)
Municipal Money Market Fund | Tax Optimized Income Fund | ||||||
INVESTMENT INCOME: | |||||||
Interest income | $ | 3,944,782 | $ | 899,488 | |||
Total investment income | 3,944,782 | 899,488 | |||||
EXPENSES: | |||||||
Investment advisory fees | 524,776 | 169,309 | |||||
Administration fees | 10,587 | 2,307 | |||||
Distribution fees—Adviser Class | 733 | 33 | |||||
Fund accounting fees | 10,562 | 2,307 | |||||
Audit fees | 7,096 | 7,671 | |||||
Custodian fees | 10,562 | 2,307 | |||||
Interest expense | 363 | 7 | |||||
Legal fees | 2,881 | 708 | |||||
Registration and filing fees | 29,245 | 14,337 | |||||
Printing fees . | 3,210 | 867 | |||||
Transfer agent fees | 10,587 | 2,308 | |||||
Trustee fees | 1,751 | 1,660 | |||||
Other fees | 3,856 | 1,981 | |||||
| Total expenses before expense reimbursement by Adviser | 616,209 | 205,802 | |||||
Less: Reimbursement by Adviser | (278,198 | ) | (69,347 | ) | |||
Net expenses | 338,011 | 136,455 | |||||
| Net investment income | 3,606,771 | 763,033 | |||||
REALIZED/UNREALIZED GAIN (LOSS) ON INVESTMENTS: | |||||||
Net realized loss on investments | — | (43,354 | ) | ||||
Change in unrealized appreciation/depreciation on investments | — | 34,252 | |||||
| Net realized/unrealized loss on investments | — | (9,102 | ) | ||||
| Change in net assets resulting from operations | $ | 3,606,771 | $ | 753,931 | |||
See notes to financial statements.
41
Alpine Mutual Funds
Statements of Changes in Net Assets
Dynamic Balance Fund | |||||||
Six Months Ended April 30, 2006 | Year Ended October 31, 2005 | ||||||
(Unaudited) | |||||||
OPERATIONS: | |||||||
| Net investment income | $ | 784,671 | $ | 1,426,639 | |||
| Net realized gain long transactions | 2,754,291 | 1,579,292 | |||||
| Change in unrealized appreciation/depreciation on investments | 6,873,930 | 2,912,439 | |||||
| Change in net assets resulting from operations | 10,412,892 | 5,918,370 | |||||
DISTRIBUTIONS TO SHAREHOLDERS: | |||||||
| Distributions to Shareholders: | |||||||
| From net investment income | (772,005 | ) | (1,322,306 | ) | |||
| From net realized gain on investment | (1,667,049 | ) | (3,659,345 | ) | |||
| Change in net assets resulting from distributions to shareholders | (2,439,054 | ) | (4,981,651 | ) | |||
CAPITAL SHARE TRANSACTIONS: | |||||||
| Proceeds from shares sold | 3,605,450 | 30,307,445 | |||||
| Dividends reinvested | 2,252,615 | 4,421,872 | |||||
| Cost of shares redeemed | (8,070,607 | ) | (8,900,384 | ) | |||
| Change in net assets from capital share transactions | (2,212,542 | ) | 25,828,933 | ||||
| Total change in net assets | 5,761,296 | 26,765,652 | |||||
NET ASSETS: | |||||||
| Beginning of period | 97,470,662 | 70,705,010 | |||||
| End of period* | $ | 103,231,958 | $ | 97,470,662 | |||
| * Including undistributed net investment income of: | $ | 168,957 | $ | 96,291 | |||
See notes to financial statements.
42
Alpine Mutual Funds
Statements of Changes in Net Assets
Dynamic Dividend Fund | |||||||
Six Months Ended April 30, 2006 | Year Ended October 31, 2005 | ||||||
(Unaudited) | |||||||
OPERATIONS: | |||||||
Net investment income | $ | 25,534,536 | $ | 29,881,638 | |||
Net realized gain (loss) on: | |||||||
Long transactions | (5,580,673 | ) | (5,293,810 | ) | |||
Foreign currencies | (572,959 | ) | (285,088 | ) | |||
Change in unrealized appreciation/depreciation on: | |||||||
Investments | 36,484,673 | (12,570,661 | ) | ||||
Foreign currency translation | (14,418 | ) | (6,945 | ) | |||
Change in net assets resulting from operations | 55,851,159 | 11,725,134 | |||||
DISTRIBUTIONS TO SHAREHOLDERS: | |||||||
Distributions to Shareholders: | |||||||
From net investment income | (24,017,848 | ) | (26,364,397 | ) | |||
From net realized gain on investment | — | (1,494,879 | ) | ||||
Change in net assets resulting from distributions to shareholders | (24,017,848 | ) | (27,859,276 | ) | |||
CAPTIAL SHARE TRANSACTIONS: | |||||||
Proceeds from shares sold | 133,532,062 | 328,736,945 | |||||
Dividends reinvested | 18,802,998 | 22,881,710 | |||||
Redemption fees | 23,020 | 80,834 | |||||
Cost of shares redeemed | (44,224,320 | ) | (67,754,875 | ) | |||
Change in net assets from capital share transactions | 108,133,760 | 283,944,614 | |||||
Total change in net assets | 139,967,071 | 267,810,472 | |||||
NET ASSETS: | |||||||
Beginning of period | 311,340,892 | 43,530,420 | |||||
End of period* | $ | 451,307,963 | $ | 311,340,892 | |||
| * Including undistributed net investment income of: | $ | 4,695,433 | $ | 3,463,833 | |||
See notes to financial statements.
43
Alpine Mutual Funds
Statements of Changes in Net Assets
Dynamic Financial Services Fund | ||||
For the Period November, 1 2005 (1) through April 30, 2006 | ||||
(Unaudited) | ||||
OPERATIONS: | ||||
Net investment income | $ | 3,321 | ||
Net realized gain (loss) on: long transactions | 86,896 | |||
Change in unrealized appreciation/depreciation on: Investments | 139,500 | |||
Change in net assets resulting from operations | 229,717 | |||
DISTRIBUTIONS TO SHAREHOLDERS: | ||||
Distributions to Shareholders: | ||||
From net investment income | (840 | ) | ||
Change in net assets resulting from distributions to shareholders | (840 | ) | ||
CAPTIAL SHARE TRANSACTIONS: | ||||
Proceeds from shares sold | 3,286,932 | |||
Dividends reinvested | 840 | |||
Cost of shares redeemed . | (20,242 | ) | ||
Change in net assets from capital share transactions | 3,267,530 | |||
Total change in net assets | 3,496,407 | |||
NET ASSETS: | ||||
| Beginning of period | — | |||
End of period* | $ | 3,496,407 | ||
| * Including undistributed net investment income of: | $ | 2,481 | ||
| (1) Commencement of Operations | ||||
See notes to financial statements.
44
Alpine Mutual Funds
Statements of Changes in Net Assets
Municipal Money Market Fund | |||||||
Six Months Ended April 30, 2006 | Year Ended October 31, 2005 | ||||||
(Unaudited) | |||||||
OPERATIONS: | |||||||
| Net investment income | $ | 3,606,771 | $ | 5,162,596 | |||
| Net realized gain on investments | — | 2,815 | |||||
| Change in net assets resulting from operations | 3,606,771 | 5,165,411 | |||||
DISTRIBUTIONS TO SHAREHOLDERS: | |||||||
| Distributions to Adviser Class Shareholders: | |||||||
| From net investment income | (8,388 | ) | (4,859 | ) | |||
| Distributions to Investor Class Shareholders: | |||||||
| From net investment income | (3,582,372 | ) | (5,185,308 | ) | |||
| Change in net assets resulting from distributions to shareholders | (3,590,760 | ) | (5,190,167 | ) | |||
CAPTIAL SHARE TRANSACTIONS: | |||||||
| Proceeds from shares sold | 202,569,309 | 459,390,771 | |||||
| Dividends reinvested | 2,686,905 | 2,955,883 | |||||
| Cost of shares redeemed | (149,752,152 | ) | (387,244,093 | ) | |||
| Change in net assets from shares of beneficial interest transactions | 55,504,062 | 75,102,561 | |||||
| Total change in net assets | 55,520,073 | 75,077,805 | |||||
NET ASSETS: | |||||||
| Beginning of period | 205,305,281 | 130,227,476 | |||||
| End of period* | $ | 260,825,354 | $ | 205,305,281 | |||
See notes to financial statements.
45
Alpine Mutual Funds
Statements of Changes in Net Assets
| Tax Optimized Income Fund | |||||||
Six Months Ended April 30, 2006 | Year Ended October 31, 2005 | ||||||
(Unaudited) | |||||||
OPERATIONS: | |||||||
Net investment income | $ | 763,033 | $ | 1,457,688 | |||
Net realized gain (loss) on investments | (43,354 | ) | 46,520 | ||||
Change in unrealized depreciation on investments | 34,252 | (616,587 | ) | ||||
Change in net assets resulting from operations | 753,931 | 887,621 | |||||
DISTRIBUTIONS TO SHAREHOLDERS: | |||||||
Distributions to Adviser Class Shareholders | |||||||
From net investment income | (352 | ) | (1,966 | ) | |||
From net realized gain on investments | (1 | ) | — | ||||
Distributions to Investor Class Shareholders: | |||||||
From net investment income | (753,646 | ) | (1,461,892 | ) | |||
From net realized gain on investments | (11,073 | ) | — | ||||
| Change in net assets resulting from distributions to shareholders | (765,072 | ) | (1,463,858 | ) | |||
CAPTIAL SHARE TRANSACTIONS: | |||||||
Proceeds from shares sold | 807,957 | 1,774,244 | |||||
Dividends reinvested | 755,884 | 1,450,040 | |||||
Redemption fees | 37 | 274 | |||||
Cost of shares redeemed | (1,293,972 | ) | (8,168,307 | ) | |||
Change in net assets from shares of beneficial interest transactions | 269,906 | (4,943,749 | ) | ||||
Total change in net assets | 258,765 | (5,519,986 | ) | ||||
NET ASSETS: | |||||||
Beginning of period | 45,803,881 | 51,323,867 | |||||
End of period* | $ | 46,062,646 | $ | 45,803,881 | |||
| * Including undistributed net investment income of: | $ | 14,510 | $ | 5,475 | |||
See notes to financial statements.
46
Alpine Mutual Funds - Dynamic Balance Fund
Financial Highlights
(For a share outstanding throughout each period)
Year Ended | |||||||||||||||||||
Six Months | October 31, | Period Ended | |||||||||||||||||
Ended | October 31, | ||||||||||||||||||
April30, 2006 | 2005 | 2004 | 2003 | 2002 | 2001 (a) | ||||||||||||||
(Unaudited) | |||||||||||||||||||
Per Share Data: | |||||||||||||||||||
Net asset value per share, beginning of period | $ | 12.67 | $ | 12.44 | $ | 11.08 | $ | 9.17 | $ | 10.10 | $ | 10.00 | |||||||
Income from investment operations: | |||||||||||||||||||
Net investment income | 0.10 | 0.19 | 0.19 | 0.22 | 0.24 | 0.09 | |||||||||||||
Net realized/unrealized gains/(losses) on investments | 1.26 | 0.85 | 1.37 | 1.91 | (0.91 | ) | 0.07 | ||||||||||||
Total from investment operations | 1.36 | 1.04 | 1.56 | 2.13 | (0.67 | ) | 0.16 | ||||||||||||
Less Distributions: | |||||||||||||||||||
Dividends from net investment income | (0.10 | ) | (0.19 | ) | (0.20 | ) | (0.22 | ) | (0.25 | ) | (0.06 | ) | |||||||
Net realized gains on investments | (0.22 | ) | (0.62 | ) | — | — | (0.01 | ) | — | ||||||||||
Total distributions | (0.32 | ) | (0.81 | ) | (0.20 | ) | (0.22 | ) | (0.26 | ) | (0.06 | ) | |||||||
Net asset value per share, end of period | $ | 13.71 | $ | 12.67 | $ | 12.44 | $ | 11.08 | $ | 9.17 | $ | 10.10 | |||||||
Total return | 10.83%(b | ) | 8.46 | % | 14.19 | % | 23.50 | % | -6.82 | % | 1.64%(b | ) | |||||||
Ratios/Supplemental Data: | |||||||||||||||||||
Net Assets at end of period (000) | $ | 103,232 | $ | 97,471 | $ | 70,705 | $ | 53,756 | $ | 43,027 | $ | 38,203 | |||||||
Ratio of expenses to average net assets: | |||||||||||||||||||
Before waivers, reimbursements, and recoveries | 1.19%(c | ) | 1.21 | % | 1.27 | % | 1.51 | % | 1.50 | % | 1.40%(c | ) | |||||||
After waivers, reimbursements, and recoveries | 1.19%(c | ) | 1.31 | % | 1.35 | % | 1.35 | % | 1.35 | % | 1.35%(c | ) | |||||||
Ratio of net investment income to average net assets | 1.55%(c | ) | 1.60 | % | 1.78 | % | 2.26 | % | 2.45 | % | 2.55%(c | ) | |||||||
Portfolio turnover | 13 | % | 36 | % | 56 | % | 39 | % | 42 | % | 9 | % | |||||||
| (a) | For the Period from June 7, 2001 (inception of fund) to October 31, 2001. |
| (b) | Not Annualized. |
| (c) | Annualized. |
See notes to financial statements.
47
Alpine Mutual Funds - Dynamic Dividend Fund
Financial Highlights
(For a share outstanding throughout each period)
Year Ended | |||||||||||||
Six Months | October 31, | Period Ended | |||||||||||
Ended | October 31, | ||||||||||||
April30, 2006 | 2005 | 2004 | 2003 (a) | ||||||||||
(Unaudited) | |||||||||||||
Per Share Data: | |||||||||||||
Net asset value per share, beginning of period | $ | 11.98 | $ | 12.34 | $ | 10.69 | $ | 10.00 | |||||
Income from investment operations: | |||||||||||||
Net investment income | 0.44 | 1.57 | 1.09(b | ) | 0.06 | ||||||||
Net realized/unrealized gains/(losses) on investments | 1.08 | (0.14 | ) | 1.51 | 0.63 | ||||||||
Total from investment operations | 1.52 | 1.43 | 2.60 | 0.69 | |||||||||
Less Distributions: | |||||||||||||
Dividends from net investment income | (0.44 | ) | (1.51 | ) | (0.95 | ) | — | ||||||
Net realized gains on investments | — | (0.28 | ) | — | — | ||||||||
Total distributions | (0.44 | ) | (1.79 | ) | (0.95 | ) | — | ||||||
Net asset value per share, end of period | $ | 13.06 | $ | 11.98 | $ | 12.34 | $ | 10.69 | |||||
Total return | 16.19 | %(c) | 11.85 | % | 24.90 | % | 6.90 | %(c) | |||||
Ratios/Supplemental Data: | |||||||||||||
Net Assets at end of period (000) | $ | 451,308 | $ | 311,335 | $ | 43,530 | $ | 13,527 | |||||
Ratio of expenses to average net assets: | |||||||||||||
Before waivers, reimbursements, and recoveries | 1.17 | %(d) | 1.20 | % | 1.56 | % | 3.11 | %(d) | |||||
After waivers, reimbursements, and recoveries | 1.17 | %(d) | 1.23 | % | 1.35 | % | 1.35 | %(d) | |||||
Ratio of net investment income to average net assets | 13.90 | %(d) | 14.22 | % | 9.08 | % | 5.69 | %(d) | |||||
Portfolio turnover | 100 | % | 216 | % | 194 | % | 9 | % | |||||
| (a) | For the period from September 22, 2003 (inception of fund) to October 31, 2003. |
| (b) | Net investment income is calculated using average shares outstanding during the period. |
| (c) | Not Annualized. |
| (d) | Annualized. |
See notes to financial statements.
48
Alpine Mutual Funds - Dynamic Financial Services Fund
Financial Highlights
(For a share outstanding throughout each period)
Period Ended | |||
April 30, | |||
2006 (a) | |||
(Unaudited) | |||
Per Share Data: | |||
Net asset value per share, beginning of period | $ | 10.00 | |
Income from investment operations: | |||
| Net investment income | 0.02 | ||
| Net realized/unrealized gains/(losses) on investments | 1.46 | ||
| Total from investment operations | 1.48 | ||
Less Distributions: | |||
| Dividends from net investment income | (0.01) | ||
| Net realized gains on investments | — | ||
| Total distributions | (0.01) | ||
Net asset value per share, end of period | $ | 11.47 | |
Total return | 14.86%(b) | ||
Ratios/Supplemental Data: | |||
| Net Assets at end of period (000) | $ | 3,496 | |
| Ratio of expenses to average net assets: | |||
| Before waivers, reimbursements, and recoveries | 4.66%(c) | ||
| After waivers, reimbursements, and recoveries | 1.35%(c) | ||
| Ratio of net investment income to average net assets | 0.38%(c) | ||
| Portfolio turnover | 53% | ||
_________________
| (a) | For the period from November 1, 2005 (inception of fund) to April 30, 2006. | ||||
| (b) | Not Annualized. | ||||
| (c) | Annualized. |
See notes to financial statements.
49
Alpine Mutual Funds - Municipal Money Market Fund
Financial Highlights
(For a share outstanding throughout each period)
Six Months | Year Ended | Period Ended | |||||||
Ended | October 31, | October 31, | |||||||
April 30, 2006 | 2005 | 2004 | 2003 (a) | ||||||
(Unaudited) | |||||||||
Investor Class Shares: | |||||||||
Net asset value per share, beginning of period | $ | 1.00 | $ | 1.00 | $ | 1.00 | $ | 1.00 | |
Income from investment operations: | |||||||||
| Net investment income | 0.02 | 0.02 | 0.01 | 0.01 | |||||
| Net realized/unrealized gains on investments | — | — | — | — | |||||
| Total from investment operations | 0.02 | 0.02 | 0.01 | 0.01 | |||||
Less Distributions: | |||||||||
| Dividends from net investment income | (0.02) | (0.02) | (0.01) | (0.01) | |||||
| Net realized gains on investments | — | — | — | — | |||||
| Total distributions | (0.02) | (0.02) | (0.01) | (0.01) | |||||
Net asset value per share, end of period | $ | 1.00 | $ | 1.00 | $ | 1.00 | $ | 1.00 | |
Total return | 1.53%(b) | 2.24% | 1.09% | 1.00%(b) | |||||
Ratios/Supplemental Data: | |||||||||
| Net Assets at end of period (000) | $ | 259,997 | $ | 204,689 | $ | 130,147 | $ | 59,126 | |
| Ratio of expenses to average net assets: | |||||||||
| Before waivers and reimbursements | 0.53%(c) | 0.53% | 0.70% | 0.73%(c) | |||||
| After waivers and reimbursements | 0.29%(c) | 0.27% | 0.34% | 0.32%(c) | |||||
| Ratio of net investment income to average net assets | 3.09%(c) | 2.26% | 1.10% | 1.09%(c) | |||||
| _______________ | |||||||||
| (a) For the period from December 5, 2002 (inception of fund) to October 31, 2003. | |||||||||
| (b) Not Annualized. | |||||||||
| (c) Annualized. | |||||||||
See notes to financial statements.
50
Alpine Mutual Funds - Municipal Money Market Fund
Financial Highlights
(For a share outstanding throughout each period)
Six Months | ||||||||
Ended | Year Ended | Year Ended | ||||||
April 30, 2006 | October 31, 2005 | October 31, 2004(a) | ||||||
(Unaudited) | ||||||||
Advisor Class Shares: | ||||||||
Net asset value per share, beginning of period | $ | 1.00 | $ | 1.00 | $ | 1.00 | ||
Income from investment operations: | ||||||||
| Net investment income | 0.01 | 0.02 | 0.01 | |||||
| Net realized/unrealized gains on investments | — | — | — | |||||
| Total from investment operations | 0.01 | 0.02 | 0.01 | |||||
Less Distributions: | ||||||||
| Dividends from net investment income | (0.01) | (0.02) | (0.01) | |||||
| Net realized gains on investments | — | — | — | |||||
| Total distributions | (0.01) | (0.02) | (0.01) | |||||
Net asset value per share, end of period | $ | 1.00 | $ | 1.00 | $ | 1.00 | ||
Total return | 1.41%(b) | 1.98% | 0.89%(b) | |||||
Ratios/Supplemental Data: | ||||||||
| Net Assets at end of period | $ | 828,258 | $ | 616,521 | $ | 80,114 | ||
| Ratio of expenses to average net assets: | ||||||||
| Before waivers and reimbursements | 0.78%(c) | 0.78% | 0.93%(c) | |||||
| After waivers and reimbursements | 0.54%(c) | 0.53% | 0.59%(c) | |||||
| Ratio of net investment income to average net assets | 2.84%(c) | 2.01% | 0.90%(c) | |||||
| _____________ | ||||||||
| (a) For the period from March 30, 2004 (inception of fund) to October 31, 2004. | ||||||||
| (b) Not Annualized. | ||||||||
| (c) Annualized. |
See notes to financial statements.
51
Alpine Mutual Funds - Tax Optimized Income Fund
Financial Highlights
(For a share outstanding throughout each period)
Six Months | ||||||||
Ended | Year Ended | Year Ended | ||||||
April 30, 2006 | October 31, 2005 | October 31, 2004 (a) | ||||||
(Unaudited) | ||||||||
Advisor Class Shares: | ||||||||
Net asset value per share, beginning of period | $ | 10.03 | $ | 10.15 | $ | 10.26 | ||
Income from investment operations: | ||||||||
| Net investment income | 0.27 | 0.28 | 0.16 (b) | |||||
| Net realized/unrealized gains/(losses) on investments | (0.09) | (0.12) | (0.11) | |||||
| Total from investment operations | 0.18 | 0.16 | 0.05 | |||||
Less Distributions: | ||||||||
| Dividends from net investment income | (0.14) | (0.28) | (0.16) | |||||
| Net realized gains on investments | — (f) | — | — | |||||
| Total distributions | (0.14) | (0.28) | (0.16) | |||||
Net asset value per share, end of period | $ | 10.07 | $ | 10.03 | $ | 10.15 | ||
Total return | 1.86%(c) | 1.60% | 0.55%(c) | |||||
Ratios/Supplemental Data: | ||||||||
| Net Assets at end of period | $ | 5,196 | $ | 112,454 | $ | 22,159 | ||
| Ratio of expenses to average net assets: | ||||||||
| Before waivers and reimbursements | 1.17%(d) | 1.15% | 1.25%(d) | |||||
| After waivers and reimbursements | 0.85%(d) | 0.85% | 0.85%(d) | |||||
| Ratio of net investment income to average net assets | 3.13%(d) | 2.73% | 2.41%(d) | |||||
| Portfolio turnover(e) | 74% | 97% | 55% | |||||
| ____________ | ||||||||
| (a) For the period from March 30, 2004 (inception of fund) to October 31, 2004. | ||||||||
| (b) Net investment income per share is calculated using ending balances prior to consideration of adjustment for permanent book and tax differences. | ||||||||
| (c) Not Annualized. | ||||||||
| (d) Annualized. | ||||||||
| (e) Portfolio turnover is calculated on the basis of the Fund as a whole, without distinguishing between classes of shares issued. | ||||||||
| (f) Amount is less than $.0005. | ||||||||
See notes to financial statements.
52
Alpine Mutual Funds - Tax Optimized Income Fund
Financial Highlights
(For a share outstanding throughout each period)
Six Months | |||||||||
Ended | Year Ended | Year Ended | Year Ended | ||||||
April 30, 2006 | October 31, 2005 | October 31, 2004 | October 31, 2003 (a) | ||||||
(Unaudited) | |||||||||
Investor Class Shares: | |||||||||
Net asset value per share, beginning of period | $ | 10.03 | $ | 10.15 | $ | 10.18 | $ | 10.00 | |
Income from investment operations: | |||||||||
| Net investment income | 0.17 | 0.30 | 0.27 | 0.23 | |||||
| Net realized/unrealized gains/(losses) on | |||||||||
| investments | — (d) | (0.12) | (0.02) | 0.18 | |||||
| Total from investment operations | 0.17 | 0.18 | 0.25 | 0.41 | |||||
Less Distributions: | |||||||||
| Dividends from net investment income | (0.17) | (0.30) | (0.27) | (0.23) | |||||
| Net realized gains on investments | — (d) | — | (0.01) | — (d) | |||||
| Total distributions | (0.17) | (0.30) | (0.28) | (0.23) | |||||
Net asset value per share, end of period | $ | 10.03 | $ | 10.03 | $ | 10.15 | $ | 10.18 | |
Total return | 1.70(b) | 1.84% | 2.42% | 4.12%(b) | |||||
Ratios/Supplemental Data: | |||||||||
| Net Assets at end of period (000) | $ | 46,057 | $ | 45,691 | $ | 51,302 | $ | 55,591 | |
| Ratio of expenses to average net assets: | |||||||||
| Before waivers and reimbursements | 0.91%(c) | 0.90% | 1.04% | 1.02%(c) | |||||
| After waivers and reimbursements | 0.60%(c) | 0.60% | 0.60% | 0.60%(c) | |||||
| Ratio of net investment income to average | |||||||||
| net assets | 3.38%(c) | 2.98% | 2.62% | 2.48%(c) | |||||
| Portfolio Turnover(e) | 74% | 97% | 55% | 46% | |||||
| _____________ | |||||||||
| (a) For the period from December 6, 2002 (inception of fund) to October 31, 2003. | |||||||||
| (b) Not Annualized. | |||||||||
| (c) Annualized. | |||||||||
| (d) Amount is less than $.0005. | |||||||||
| (e) Portfolio turnover is calculated on the basis of the Fund as a whole, without distinguishing between classes of shares issued. | |||||||||
See notes to financial statements.
53
Alpine Mutual Funds
Notes to Financial Statements
April 30, 2006 (Unaudited)
| 1. | Organization: |
Alpine Series Trust (the “Series Trust’’) was organized in 2001 as a Delaware Business Trust, and is registered under the Investment Company Act of 1940 , as amended (the “1940 Act’’), as an open-ended management investment company. Alpine Income Trust (the “Income Trust’’) was organized in 2002 as a Delaware Business Trust, and is registered under the 1940 Act, as open-ended management investment company. Alpine Dynamic Balance Fund, Alpine Dynamic Dividend Fund, and Alpine Dynamic Financial Services Fund are three separate funds of the Series Trust and Alpine Municipal Money Market Fund and Alpine Tax Optimized Income Fund are two separate funds of the Income Trust. Alpine Dynamic Balance Fund, Alpine Dynamic Dividend Fund, Alpine Dynamic Financial Services Fund, Alpine Municipal Money Market Fund, and Alpine Tax Optimized Income Fund (individually referred to as a “Fund’’ and collectively, “the Funds’’) are diversified funds. Alpine Management & Research, LLC (the “Adviser’’) is a Delaware Corporation and serves as investment manager to the Funds. Effective March 30, 2004, the Alpine Municipal Money Market Fund and the Alpine Tax Optimized Income Fund began to offer both Investor Class and Adviser Class shares. |
| 2. | Significant Accounting Policies: |
The following is a summary of significant accounting policies consistently followed by the Funds in the preparation of their financial statements. The policies are in conformity with accounting principles generally accepted in the United States of America (“GAAP’’), which require management to make estimates and assumptions that affect amounts reported herein. Actual results could differ from those estimates. |
| A. | Valuation of Securities: |
The Dynamic Balance, Dynamic Dividend, Dynamic Financial Services, and Tax Optimized Income Funds value securities for which the primary market is on a domestic or foreign exchange and over-the-counter admitted to trading on the National Association of Securities Dealers Automated Quotation Market System (“NASDAQ’’) National List at the last quoted sale price at the end of each business day or, if no sale, at the mean of the closing bid and asked prices. Over-the-counter securities not included in the NASDAQ National List for which market quotations are readily available are valued at a price quoted by one or more brokers. Securities for which market quotations are not readily available or whose values have been materially affected by events occurring before the close of U.S. markets but after the close of the securities’ primary markets, are valued at fair value as determined in good faith according to procedures approved by the Board of Trustees. The valuation of certain debt securities for which market quotations are not readily available may be based upon current market prices of securities which are comparable in coupon, rating, and maturity or an appropriate matrix utilizing similar factors. |
The Municipal Money Market Fund values its investments at amortized cost, which approximates market value. Pursuant to Rule 2a-7 of the Investment Company Act of 1940, amortized cost, as defined, is a method of valuing securities at acquisition cost, adjusted for amortization of premium or accretion of discount rather than at their value based on current market factors. |
| B. | Security Transactions and Investment Income: |
Securities transactions are recorded on the date a security is purchased or sold (i.e. on the trade date). Realized gains and losses are computed on the identified cost basis. Interest income is recorded on the accrual basis and includes accretion of discounts and amortization of premiums, where applicable. Dividend income is recorded on the ex-dividend date or in the case of some foreign securities, on the date thereafter when the Funds are made aware of the dividend. Foreign income may be subject to foreign withholding taxes, which are accrued as applicable. Capital gains realized on some foreign securities are subject to foreign taxes, which are accrued as applicable. |
| C. | Short Sale Transactions: |
| The Dynamic Balance Fund, Dynamic Dividend Fund, and Dynamic Financial Services Fund are authorized to engage in short selling. Short sales are transactions in which a fund sells a security it does not own in anticipation of a decline in the market value of that security. To complete such a transaction, a fund must borrow the security to deliver to the buyer when affecting a short sale. |
54
Alpine Mutual Funds
Notes to Financial Statements—Continued
April 30, 2006 (Unaudited)
The fund is then obligated to replace the security borrowed by purchasing it in the open market at some later date. When a fund sells a security short, an amount equal to the sales proceeds is included in the Statements of Assets and Liabilities as an asset and an equal amount as a liability. The amount of the liability is subsequently marked-to-market to reflect the current value of the short position. A fund will incur a loss, which could be substantial and potentially unlimited, if the market price of the security increases between the date of the short sale and the date on which the fund replaces the borrowed security. A fund will realize a gain if the security declines in value between those dates. A fund is also at risk of incurring dividend expense if the issuer of the security that has been sold short declares a dividend. A fund must pay the dividend to the lender of the security. |
All short sales must be fully collateralized. Accordingly, the funds maintain collateral in a segregated account with their custodian, consisting of cash and/or liquid securities sufficient to collateralize their obligations on short positions. |
| D. | Line of Credit: |
Each Fund has a line of credit with Custodial Trust Company (“CTC’’). Loans in aggregate, whether to cover overdrafts or for investment purposes, may not exceed the maximum amount that is permitted under the Investment Company Act of 1940, as amended. Interest expense incurred in connection with such loans during the six months ended April 30, 2006 was not material. The average interest rate paid on outstanding borrowings was 5.57% for the six months ended April 30, 2006. |
| E. | Income Taxes: |
It is each Fund’s policy to comply with the requirements of Subchapter M of the Internal Revenue Code applicable to regulated investment companies and to distribute timely, all of its investment company taxable income and net realized capital gains to shareholders. Therefore, no federal income tax provision is recorded. Under applicable foreign tax laws, a withholding tax may be imposed on interest, dividends, and capital gains earned on foreign investments. Where available, the Funds will file for claims on foreign taxes withheld. |
| F. | Dividends and Distributions: |
The Dynamic Balance Fund, the Dynamic Dividend Fund, Dynamic Financial Services Fund, and the Tax Optimized Income Fund intend to distribute substantially all of their net investment income and net realized capital gains, if any, throughout the year to their shareholders in the form of dividends. The Municipal Money Market Fund declares and accrues dividends daily on each business day based upon the Fund’s net income, and pays dividends monthly. Distributions to shareholders are recorded at the close of business on the ex-dividend date. All dividends are automatically reinvested in full and fractional shares of a Fund at net asset value per share, unless otherwise requested. |
The amounts of dividends from net investment income and of distributions from net realized gains are determined in accordance with federal income tax regulations, which may differ from GAAP. These differences are either considered temporary or permanent in nature. To the extent these differences are permanent in nature, such amounts are reclassified within the composition of net assets based on their federal tax-basis treatment. |
| G. | Class Allocations: |
Income, expenses (other than class specific expenses) and realized and unrealized gains and losses of the Tax Optimized Income Fund and Municipal Money Market Fund are allocated among the classes of each respective Fund based on the relative net assets of each class. Class specific expenses are allocated to the class to which they relate. Currently, class specific expenses are limited to those incurred under the Distribution Plan for Adviser Class shares. |
| H. | Foreign Translation Transactions: |
| The Dynamic Balance and Dynamic Financial Services Funds may invest up to 15% of the value of their total assets in foreign securities. The Dynamic Dividend Fund is not limited in the amount of assets it may invest in foreign securities. |
55
Alpine Mutual Funds
Notes to Financial Statements—Continued
April 30, 2006 (Unaudited)
| The books and records of the Funds are maintained in U.S. dollars. Non-U.S. denominated amounts are translated into U.S. dollars as follows, with the resultant translation gains and losses recorded in the Statements of Operations: |
| i) | market value of investment and other assets and liabilities at the exchange rate on the valuation date, |
| ii) | purchases and sales of investment securities, income and expenses at the exchange rate prevailing on the respective date of such transactions. |
Dividends and interest from non-U.S. sources received by the Funds are generally subject to non-U.S. withholding taxes at rates ranging up to 30%. Such withholding taxes may be reduced or eliminated under the terms of applicable U.S. income tax treaties, and the Funds intend to undertake any procedural steps required to claim the benefits of such treaties. |
| I. | Risk Associated With Foreign Securities and Currencies: |
Investments in securities of foreign issuers carry certain risks not ordinarily associated with investments in securities of domestic issuers. Such risks include future political and economic developments and the possible imposition of exchange controls or other foreign governmental laws and restrictions. In addition, with respect to certain countries, there is a possibility of expropriation of assets, confiscatory taxation, political or social instability or diplomatic developments, which could adversely affect investments in those countries. |
Certain countries may also impose substantial restrictions on investments in their capital markets by foreign entities, including restrictions on investments in issuers or industries deemed sensitive to relevant national interests. These factors may limit the investment opportunities available to the Funds or result in a lack of liquidity and high price volatility with respect to securities of issuers from developing countries. |
| 3. | Capital Share Transactions |
| The Funds have an unlimited number of shares of beneficial interest, with $0.0001 par value, authorized. Transactions in shares and dollars of the Funds were as follows: |
Dynamic Balance Fund
Six Months Ended | Year Ended | |||||
April 30, 2006 | October 31, 2005 | |||||
Shares | Amount | Shares | Amount | |||
| Shares sold | 272,444 | $ 3,605,450 | 2,357,599 | $30,307,445 | ||
| Shares issued in reinvestment of dividends | 170,432 | 2,252,615 | 347,482 | 4,421,872 | ||
| Shares redeemed | (605,142) | (8,070,607) | (695,107) | (8,900,384) | ||
| Total net change | (162,266) | $(2,212,542) | 2,009,974 | $25,828,933 | ||
Dynamic Dividend Fund
Six Months Ended | Year Ended | |||||
April 30, 2006 | October 31, 2005 | |||||
Shares | Amount | Shares | Amount | |||
| Shares sold | 10,613,639 | $133,532,062 | 26,088,374 | $328,736,945 | ||
| Shares issued in reinvestment of dividends | 1,501,149 | 18,802,998 | 1,851,414 | 22,881,710 | ||
| Redemption fees | — | 23,020 | — | 80,834 | ||
| Shares redeemed | (3,542,278) | (44,224,320) | (5,487,954) | (67,754,875) | ||
| Total net change | 8,572,510 | $108,133,760 | 22,451,834 | $283,944,614 | ||
56
Alpine Mutual Funds
Notes to Financial Statements—Continued
April 30, 2006 (Unaudited)
Dynamic Financial Services Fund (1)
Period Ended | |||
April 30, 2006 | |||
Shares | Amount | ||
| Shares sold | 306,586 | $3,286,932 | |
| Shares issued in reinvestment of | |||
| dividends | 81 | 840 | |
| Redemption fees | — | — | |
| Shares redeemed | (1,827) | (20,242) | |
| Total net change | 304,840 | $3,267,530 | |
Municipal Money Market Fund
Six Months Ended | Year Ended | ||||||
April 30, 2006 | October 31, 2005 | ||||||
Shares | Amount | Shares | Amount | ||||
Investor Class | |||||||
| Shares sold | 201,633,253 | $ | 201,633,253 | 458,637,794 | $ | 458,637,794 | |
| Shares issued in reinvestment of | |||||||
| dividends | 2,678,561 | 2,678,561 | 2,951,047 | 2,951,047 | |||
| Shares redeemed | (149,019,554) | (149,019,554) | (387,022,761) | (387,022,761) | |||
| Total net change | 55,292,260 | $ | 55,292,260 | 74,566,080 | $ | 74,566,080 | |
Adviser Class | |||||||
| Shares sold | 936,056 | $ | 936,056 | 752,977 | $ | 752,977 | |
| Shares issued in reinvestment of | |||||||
| dividends | 8,344 | 8,344 | 4,836 | 4,836 | |||
| Shares redeemed | (732,710) | (732,710) | (221,332) | (221,332) | |||
| Total net change | 211,690 | $ | 211,690 | 536,481 | $ | 536,481 | |
Tax Optimized Income Fund
Six Months Ended | Year Ended | ||||||
April 30, 2006 | October 31, 2005 | ||||||
Shares | Amount | Shares | Amount | ||||
Investor Class | |||||||
| Shares sold | 79,009 | $ | 792,942 | 166,813 | $ | 1,685,243 | |
| Shares issued in reinvestment of dividends | 75,391 | 755,531 | 143,767 | 1,448,075 | |||
| Redemption fees | — | 37 | — | 274 | |||
| Shares redeemed | (116,797) | (1,171,702) | (810,106) | (8,168,307) | |||
| Total net change | 37,603 | $ | 376,808 | (499,526) | $ | (5,034,715) | |
Adviser Class | |||||||
| Shares sold | 1,498 | $ | 15,015 | 8,831 | $ | 89,000 | |
| Shares issued in reinvestment of dividends | 35 | 353 | 195 | 1,965 | |||
| Shares redeemed | (12,226) | (122,270) | — | — | |||
| Total net change | (10,693) | $ | (106,902) | 9,026 | $ | 90,965 | |
| __________ | |||||||
| (1) Fund commenced operations on November 1, 2005. | |||||||
57
Alpine Mutual Funds
Notes to Financial Statements—Continued
April 30, 2006 (Unaudited)
4. Purchases and Sales of Securities:
Purchases and sales of securities (excluding short-term securities) for the six months ended April 30, 2006 are as follows:
Non-U.S. Government | U.S. Government | |||||||||
Purchases | Sales | Purchases | Sales | |||||||
| Dynamic Balance Fund | $ | 9,974,780 | $ | 13,231,666 | $ | 2,266,006 | — | |||
| Dynamic Dividend Fund | 445,038,848 | 361,060,219 | — | — | ||||||
| Dynamic Financial Services | 3,804,565 | 777,532 | ||||||||
| Tax Optimized Income Fund | 13,403,585 | 19,632,430 | — | — | ||||||
5. Distribution Plans:
Quasar Distributors, LLC (“Quasar’’) serves as the Funds’ distributor. The Municipal Money Market Fund and the Tax Optimized Income Fund have each adopted a distribution and servicing plan (the “Plan’’) for its Adviser Class shares as allowed by Rule 12b-1 under the 1940 Act. The Plan authorizes payments by the Fund in connection with the distribution and servicing of its shares at an annual rate, as determined from time to time by the Board of Trustees, of up to 0.25% of the Fund’s average daily net assets. Amounts paid under the Plan by the Fund may be spent by the Fund on any activities or expenses primarily intended to result in the sale of shares of the Fund, including but not limited to advertising, compensation for sales and marketing activities of financial institutions and others such as dealers and distributors, shareholder account servicing, the printing and mailing of prospectuses to other than current shareholders and the printing and mailing of sales literature. The Municipal Money Market Fund incurred $733 and the Tax Optimized Income Fund incurred $33 pursuant to the Plan for the six months ended April 30, 2006.
The Plan for the Municipal Money Market Fund and the Tax Optimized Income may be terminated at any time by vote of the Trustees of the Income Trust who are not “interested persons’’, as defined by the 1940 Act, of the Income Trust, or by vote of a majority of the outstanding voting shares of the respective class.
6. Investment Advisory Agreement and Other Affiliated Transactions:
Alpine Management & Research, LLC (“Alpine’’) provides investment advisory services to the Funds. Pursuant to the investment adviser’s agreement with the Funds, Alpine is entitled to an annual fee based on 1.00% of each Fund’s average daily net assets for the Dynamic Balance Fund, Dynamic Dividend Fund, and Dynamic Financial Services Fund. Alpine is entitled to an annual fee based on 0.45% of the Municipal Money Market Fund’s average daily net assets and an annual fee based on 0.75% of the Tax Optimized Income Fund’s average daily net assets.
The Adviser agreed to reimburse the Dynamic Balance Fund, Dynamic Dividend Fund, Dynamic Financial
Services Fund and Tax Optimized Income Fund-Investor Class to the extent necessary to ensure that the Fund’s total operating expenses (excluding 12b-1 fees, interest, brokerage commissions and extraordinary expenses) did not exceed 1.35%, 1.35%, 1.35%, and 0.60% of the Fund’s average daily net assets, respectively. For the six months ended April 30, 2006, the Adviser agreed to reimburse the Municipal Money Market Fund-Investor Class to the extent necessary to ensure that the Fund’s total operating expenses (excluding 12b-1 fees, interest, brokerage commissions and extraordinary expenses) did not exceed certain limits. The limits ranged from 0.25% to 0.30% of the Fund’s average daily net assets during six months ended April 30, 2006. The expense caps for the Adviser Class Shares of the Municipal Money Market Fund and Tax Optimized Income Fund are 0.25% higher than the Investor Class shares. The Adviser may recover expenses paid in excess of the cap on expenses for the three previous years, as long as the recovery does not cause the Fund to exceed such cap on expenses. For the six months ended April 30, 2006, the Adviser waived investment advisory fees totaling $278,198, $69,347 and $29,262 for the Municipal Money Market Fund, Tax Optimized Income Fund, and Dynamic Financial Services Fund respectively. The expense limitation will remain in effect unless and until the Board of Trustees of the Series and Income Trusts approve its modification or termination.
58
Alpine Mutual Funds
Notes to Financial Statements—Continued
April 30, 2006 (Unaudited)
Reimbursed/absorbed expenses subject to potential recovery by year of expiration as follows:
| Year of Expiration | Dynamic Dividend Fund | Dynamic FinancialServices Fund | Municipal Money Market Fund | Tax Optimized Income Fund | |||||||
| 10/31/06 | $ | — | — | $ | 175,958 | $ | 181,472 | ||||
| 10/31/07 | $ | 2,149 | — | $ | 311,122 | $ | 233,633 | ||||
| 10/31/08 | $ | — | — | $ | 574,245 | $ | 148,232 | ||||
| 10/31/09 | $ | — | $ | 29,262 | $ | 278,198 | $ | 69,347 |
At April 30, 2006, the Dynamic Balance Fund and Dynamic Dividend Fund had $5,250,019 and $1,925,000, respectively, invested in the Municipal Money Market Fund.
7. Federal Income Tax Information:
At October 31, 2005, the components of accumulated earnings/(losses) on a tax basis were as follows:
Dynamic Balance Fund | Dynamic Dividend Fund | Municipal Money Market Fund | Tax Optimized Income Fund | ||||||||||
| Cost of Investments | $ | 84,455,244 | $ | 320,022,243 | $ | 205,720,969 | $ | 45,377,771 | |||||
| Gross unrealized appreciation | $ | 14,777,839 | $ | 9,905,900 | $ | — | $ | 110,536 | |||||
| Gross unrealized depreciation | (3,436,049 | ) | (21,587,334 | ) | — | (119,647 | ) | ||||||
| Net unrealized appreciation/(depreciation) | $ | 11,341,790 | $ | (11,681,434 | ) | $ | — | $ | (9,111 | ) | |||
| Undistributed ordinary income | $ | — | $ | 3,463,833 | $ | — | $ | 5,475 | |||||
| Undistributed long-term capital gain | 1,667,048 | — | — | 11,068 | |||||||||
| Total distributable earnings | $ | 1,667,048 | $ | 3,463,833 | $ | — | $ | 16,543 | |||||
| Other accumulated gains/(losses) | $ | (200 | ) | $ | (4,342,073 | ) | $ | (412 | ) | $ | — | ||
| Total accumulated earnings/(losses) | $ | 13,008,638 | $ | (12,559,674 | ) | $ | (412 | ) | $ | 7,432 | |||
The tax basis of investments for tax and financial reporting purposes differs principally due to the deferral of losses on wash sales, REIT tax adjustments, and mark-to-market cost basis adjustments for investments in foreign passive investment companies (PFICs) for tax purposes.
59
Alpine Mutual Funds
Notes to Financial Statements—Continued
April 30, 2006 (Unaudited)
The tax character of distributions paid during the years ended October 31, 2005 and 2004 were as follows:
2005 | 2004 | ||||||
Dynamic Balance Fund | |||||||
| Ordinary Income | $ | 1,778,074 | $ | 1,016,661 | |||
| Long-term capital gain | 3,203,577 | — | |||||
| $ | 4,981,651 | $ | 1,016,661 | ||||
Dynamic Dividend Fund | |||||||
| Ordinary Income | $ | 27,647,226 | $ | 2,259,008 | |||
| Long-term capital gain | 212,050 | — | |||||
| $ | 27,859,276 | $ | 2,259,008 | ||||
Municipal Money Market Fund | |||||||
| Exempt interest dividend | $ | 5,190,167 | $ | 963,350 | |||
| Long-term capital gain | — | — | |||||
| $ | 5,190,167 | $ | 963,350 | ||||
Tax Optimized Income Fund | |||||||
| Ordinary Income | $ | 619,728 | $ | 758,470 | |||
| Exempt interest dividends | 844,130 | 671,074 | |||||
| Long-term capital gain | — | — | |||||
| $ | 1,463,858 | $ | 1,429,544 | ||||
Capital loss carryovers as of October 31, 2005 are as follows:
Net Capital Loss Carryover* | Capital Loss Carryover Expiration | ||||||
| Dynamic Dividend Fund | $ | 4,335,047 | 10/31/2013 | ||||
| Municipal Money Market Fund | $ | 412 | 10/31/2012 |
*Capital gain distributions will resume in the future to the extent gains are realized in excess of the available gains.
60
Alpine Mutual Funds
Additional Information (Unaudited)
Expense Examples
April 30, 2006
As a shareholder of the Dynamic Balance Fund and the Municipal Money Market Fund, Adviser and Investor Class, you will incur ongoing costs, including management fees; distribution and/or service fees; and other Fund expenses. As a shareholder of the Dynamic Dividend Fund and the Tax Optimized Income Fund, Adviser & Investor
Class, you will incur two types of costs: (1) redemption fees and (2) ongoing costs. The examples below are intended to help you understand your ongoing costs (in dollars) of investing in the Funds and to compare these costs with the ongoing costs of investing in other mutual funds. The examples are based on in investment of $1,000 for the period
11/1/05-4/30/06. The first line of the tables below provides information about actual account values and actual expenses. The Funds charge no sales load or transaction fees, but do assess shareholders for outgoing wire transfers, returned checks and stop payment orders at prevailing rates charged by U.S. Bancorp Fund Services, LLC, the Funds’ transfer agent. If you request a redemption by wire transfer, currently a $15.00 fee is charged by the Funds’ transfer agent. Shareholders in the Dynamic Dividend Fund will be charged a redemption fee equal to 1.00% of the net amount of the redemption if they redeem their shares less than 60 calendar days after purchase. Shareholders in the Tax Optimized Income Fund, Adviser & Investor Class, will be charged a redemption fee equal to 0.25% of the net amount of the redemption if they redeem their shares less than 30 calendar days after purchase. IRA accounts will be charged a $15.00 annual maintenance fee. To the extent the Funds invest in shares of other investment companies as a part of their investment strategies, you will indirectly bear your proportionate share of any fees and expenses charged by the underlying funds in which the Funds invest in addition to the expenses of the Fund. These expenses are not included in the example below. The example below includes, but is not limited to, management fees, shareholder servicing fees, fund accounting, custody and transfer agent fees. However, the example below does not include portfolio trading commissions, related expenses and other extraordinary expenses as determined under GAAP. You may use the information in this line, together with the amount you invested, to estimate the expenses that you paid over the period. Simply divide your account value by $1,000 (for example, an $8,600 account value divided by $1,000 = 8.6), then multiply the result by the number in the first line under heading entitled “Expenses Paid During Period’’ to estimate the expenses you paid on your account during the period.
Hypothetical Example for Comparison Purposes
The second line of the table below provides information about hypothetical account values and hypothetical expenses based on the Funds’ actual expense ratios and an assumed rate of return of 5% per year before expenses, which does not represent the Funds’ actual returns. The hypothetical account values and expenses may not be used to estimate the actual ending account balance or expenses you paid for the period. You may use this information to compare the ongoing costs of investing in the Funds and other funds. To do so, compare this 5% hypothetical example with the 5% hypothetical examples that appear in the shareholder reports of other funds. Please note that the expenses shown in the table are meant to highlight your ongoing costs only and do not reflect any transactional costs, such as redemption fees. Therefore, the second line of the table is useful in comparing ongoing costs only, and will not help you determine the relative total costs of owning different funds. In addition, if these transactional costs were included, your costs would have been higher.
Alpine Dynamic Balance Fund
Beginning Account Value | Ending Account Value | Expenses Paid During Period | |||
| Actual (1) | $1,000.00 | $1,108.30 | $6.22 | ||
| Hypothetical (2) | $1,000.00 | $1,018.89 | $5.96 |
(1) Ending account values and expenses paid during period based on a 10.83% return. The return is considered after expenses are deducted from the fund.
(2) Ending account values and expenses paid during period based on a 5.00% annual return. The return is considered before expenses are deducted from the fund.
61
Alpine Mutual Funds
Additional Information (Unaudited)—Continued
Expense Examples
April 30, 2006
* Expenses are equal to Fund’s annualized expense ratio of 1.19%, multiplied by the average account value over the period, multiplied by 181/365 (to reflect the one-half year period).
Alpine Dynamic Dividend Fund
Beginning Account Value | Ending Account Value | Expenses Paid During Period | |||
| Actual (1) | $1,000.00 | $1,161.90 | $6.27 | ||
| Hypothetical (2) | $1,000.00 | $1,018.99 | $5.86 |
(1) Ending account values and expenses paid during period based on a 16.19% return. The return is considered after expenses are deducted from the fund.
(2) Ending account values and expenses paid during period based on a 5.00% annual return. The return is considered before expenses are deducted from the fund.
* Expenses are equal to Fund’s annualized expense ratio of 1.17%, multiplied by the average account value over the period, multiplied by 181/365 (to reflect the one-half year period).
Alpine Dynamic Financial Services Fund
Beginning Account Value | Ending Account Value | Expenses Paid During Period | |||
| Actual (1) | $1,000.00 | $1,148.60 | $7.19 | ||
| Hypothetical (2) | $1,000.00 | $1,018.10 | $6.76 |
(1) Ending account values and expenses paid during period based on a 14.86% return. The return is considered after expenses are deducted from the fund.
(2) Ending account values and expenses paid during period based on a 5.00% annual return. The return is considered before expenses are deducted from the fund.
* Expenses are equal to Fund’s annualized expense ratio of 1.35%, multiplied by the average account value over the period, multiplied by 181/365 (to reflect the one-half year period).
Alpine Municipal Money Market Fund Adviser Class Shares
Beginning Account Value | Ending Account Value | Expenses Paid During Period | |||
| Actual | $1,000.00 | $1,014.10 | $2.70 | ||
| Hypothetical | $1,000.00 | $1,022.12 | $2.71 |
(1) Ending account values and expenses paid during period based on a 1.41% return. The return is considered after expenses are deducted from the fund.
(2) Ending account values and expenses paid during period based on a 5.00% annual return. The return is considered before expenses are deducted from the fund.
* Expenses are equal to Fund’s annualized expense ratio of 0.54%, multiplied by the average account value the period, multiplied by 181/365 (to reflect the one-half year period).
62
Alpine Mutual Funds
Additional Information (Unaudited)—Continued
Expense Examples
April 30, 2006
Alpine Municipal Money Market Fund Investor Class Shares
Beginning Account Value | Ending Account Value | Expenses Paid During Period | |||
| Actual | $1,000.00 | $1,015.30 | $1.45 | ||
| Hypothetical | $1,000.00 | $1,023.36 | $1.45 |
(1) Ending account values and expenses paid during period based on a 1.53% return. The return is considered after expenses are deducted from the fund.
(2) Ending account values and expenses paid during period based on a 5.00% annual return. The return is considered before expenses are deducted from the fund.
* Expenses are equal to Fund’s annualized expense ratio of 0.29%, multiplied by the average account value over the period, multiplied by 181/365 (to reflect the one-half year period).
Alpine Tax Optimized Income Fund
Adviser Class Shares
Beginning Account Value | Ending Account Value | Expenses Paid During Period | |||
| Actual | $1,000.00 | $1,018.60 | $4.25 | ||
| Hypothetical | $1,000.00 | $1,020.58 | $4.26 |
(1) Ending account values and expenses paid during period based on a 1.86% return. The return is considered after expenses are deducted from the fund.
(2) Ending account values and expenses paid during period based on a 5.00% annual return. The return is considered before expenses are deducted from the fund.
* Expenses are equal to Fund’s annualized expense ratio of 0.85%, multiplied by the average account value over the period, multiplied by 181/365 (to reflect the one-half year period).
Alpine Tax Optimized Income Fund
Investor Class Shares
Beginning Account Value | Ending Account Value | Expenses Paid During Period | |||
| Actual | $1,000.00 | $1,017.00 | $3.00 | ||
| Hypothetical | $1,000.00 | $1,021.82 | $3.01 |
| (1) | Ending account values and expenses paid during period based on a 1.70% return. The return is considered after expenses are deducted from the fund. |
| (2) | Ending account values and expenses paid during period based on a 5.00% annual return. The return is considered before expenses are deducted from the fund. |
| * | Expenses are equal to Fund’s annualized expense ratio of 0.60%, multiplied by the average account value over the period, multiplied by 181/365 (to reflect the one-half year period). |
63
Alpine Mutual Funds
Additional Information (Unaudited)—Continued
April 30, 2006
Investment Advisor and Advisory Contract
On December 13, 2005, at a meeting called for the purpose of voting on such approval, the Boards of Trustees, including all of the Trustees who are not parties to the Advisory Contracts or interested persons of any such party (the non-interested Trustees), approved the continuance of the Advisory Contracts for the Funds. In so doing, the Board Members studied materials specifically relating to the Advisory Contracts provided by the Adviser, the Funds’ counsel and the Funds’ administrator. The Board Members considered a variety of factors, including the following:
The Board Members considered the expected nature, quality and scope of the management and investment advisory services and personnel provided each Fund by the Adviser; the rate of investment advisory fees payable to the Adviser and a comparison of the fees paid by comparable funds; the compensation (in addition to the investment advisory fees) and other benefits received by the Adviser and its respective affiliates; the Adviser’s costs in providing services; the economies of scale realized by the Adviser; the annual operating expenses of each Fund; and the policies and practices of the Adviser with respect to portfolio transactions for each Fund.
The Board Members also evaluated the investment performance of the Funds relative to their respective benchmark indices over the last year, three years, five years, ten years and since inception (as applicable).
The Board Members also reviewed Lipper analytical data relating to average expenses and advisory fees for comparable funds. Based on the information provided, the Board Members determined that each Fund’s fee structure is competitive with funds having similar investment goals and strategies.
The Board Members considered the Funds’ total expense ratios and contractual investment advisory fees compared to their respective industry average by quartile, within the appropriate Lipper benchmark category and Lipper category range. The Board Members also considered the amount and nature of fees paid by shareholders. The Board Members considered the fact that the Adviser has contractually agreed to waive a portion of its fees for the Dynamic Balance Fund, the Dynamic Dividend Fund, the Dynamic Financial Services Fund, the Municipal Money Market Fund and the Tax Optimized Income Fund for a period of one year, to be reviewed again at the next Advisory Contract renewal. It was noted that each Fund’s management fee and expense ratio are within the average range compared to its peer funds.
The Board Members considered the extent to which economies of scale would be realized with respect to operational costs as the Funds grow in their number of shareholders and assets under management, the existence of breakpoints previously established by the Adviser, and whether fee levels to be charged by the Adviser reflect these economies of scale for the benefit of Fund investors and are fair under the circumstances, which the Board Members, including all of the non-interested Trustees, believed to be the case.
Based on the Board Members’ review and consultation with the Funds’ independent counsel, of the material aspects of the Advisory Contracts, including the foregoing factors and such other information believed to be reasonably necessary to evaluate the terms of the Advisory Contracts, the Board Members, including all of the non-interested Trustees voting separately, concluded that the continuation of the Advisory Contracts would be in the best interest of the Funds’ shareholders, and determined that the compensation to the Adviser provided for in the Advisory Contracts is fair and equitable.
64
Alpine Mutual Funds
Additional Information (Unaudited)—Continued
April 30, 2006
Tax Information
The Funds designated the following percentages of dividends declared from net investment income for the fiscal year ended October 31, 2005 as qualified dividend income under the Jobs & Growth Tax Relief Reconciliation Act of 2003.
| Dynamic Balance Fund | 82.44% |
| Dynamic Dividend Fund | 98.54% |
The Funds designated the following percentages of dividends declared during the fiscal year ended October 31, 2005 as dividends qualifying for the dividends received deduction available to corporate shareholders.
| Alpine Dynamic Dividend Fund | 32.40% |
| Alpine Dynamic Balance Fund | 80.30% |
Availability of Proxy Voting Information
Information regarding how the Fund votes proxies relating to portfolio securities is available without charge upon request by calling toll-free at 1-888-785-5578 and on the SEC’s website at www.sec.gov. Information regarding how the Fund voted proxies relating to portfolio securities during the period ending June 30, 2005 is available on the SEC’s website at www.sec.gov or by calling the toll-free number listed above.
Availability of Quarterly Portfolio Schedule
Beginning with the Fund’s fiscal quarter ended July 31, 2004, the Funds filed their complete schedules of portfolio holdings on Form N-Q with the SEC. Going forward, the Funds will file Form N-Q for the first and third quarters of each fiscal year on Form N-Q. TheFund’s Form N-Q is available on the SEC’s website at www.sec.gov and may be reviewed and copied at the SEC’s Public Reference Room in Washington, DC. Information on the operation of the Public Reference Room may be obtained by calling 1-800-SEC-0330.
65
[THIS PAGE INTENTIONALLY LEFT BLANK]
[THIS PAGE INTENTIONALLY LEFT BLANK]
[THIS PAGE INTENTIONALLY LEFT BLANK]
Item 2. Code of Ethics.
Not applicable for semi-annual reports.
Item 3. Audit Committee Financial Expert.
Not applicable for semi-annual reports.
Item 4. Principal Accountant Fees and Services.
Not applicable for semi-annual reports.
Item 5. Audit Committee of Listed Registrants.
Not applicable to registrants who are not listed issuers (as defined in Rule 10A-3 under the Securities Exchange Act of 1934).
Item 6. Schedule of Investments.
Schedule of Investments is included as part of the report to shareholders filed under Item 1 of this Form.
Item 7. Disclosure of Proxy Voting Policies and Procedures for Closed-End Management Investment Companies.
Not applicable to open-end investment companies.
Item 8. Portfolio Managers of Closed-End Management Investment Companies.
Not applicable to open-end investment companies.
Item 9. Purchases of Equity Securities by Closed-End Management Investment Company and Affiliated Purchasers.
Not applicable to open-end investment companies.
Item 10. Submission of Matters to a Vote of Security Holders.
There have been no material changes to the procedures by which shareholders may recommend nominees to the registrant’s board of directors/trustees.
Item 11. Controls and Procedures.
| (a) | The Registrant’s President and Treasurer have reviewed the Registrant's disclosure controls and procedures (as defined in Rule 30a-3(c) under the Investment Company Act of 1940 (the “Act”)) as of a date within 90 days of the filing of this report, as required by Rule 30a-3(b) under the Act and Rules 13a-15(b) or 15d-15(b) under the Securities Exchange Act of 1934. Based on their review, such officers have concluded that the disclosure controls and procedures are effective in ensuring that information required to be disclosed in this report is appropriately recorded, processed, summarized and reported and made known to them by others within the Registrant and by the Registrant’s service provider. |
| (b) | There were no changes in the Registrant's internal control over financial reporting (as defined in Rule 30a-3(d) under the Act) that occurred during the second fiscal quarter of the period covered by this report that has materially affected, or is reasonably likely to materially affect, the Registrant's internal control over financial reporting. |
Item 12. Exhibits.
| (a) | (1) Any code of ethics or amendment thereto, that is subject of the disclosure required by Item 2, to the extent that the registrant intends to satisfy Item 2 requirements through filing an exhibit. Not Applicable |
(2) Certifications pursuant to Section 302 of the Sarbanes-Oxley Act of 2002. Filed herewith.
(3) Any written solicitation to purchase securities under Rule 23c-1 under the Act sent or given during the period covered by the report by or on behalf of the registrant to 10 or more persons. Not applicable to open-end investment companies.
| (b) | Certification pursuant to Section 906 of the Sarbanes-Oxley Act of 2002. Furnished herewith. |
SIGNATURES
Pursuant to the requirements of the Securities Exchange Act of 1934 and the Investment Company Act of 1940, the registrant has duly caused this report to be signed on its behalf by the undersigned, thereunto duly authorized.
(Registrant) Alpine Income Trust
By (Signature and Title)* /s/ Samuel A. Lieber
Samuel A. Lieber, President
Date 06/30/2006
Pursuant to the requirements of the Securities Exchange Act of 1934 and the Investment Company Act of 1940, this report has been signed below by the following persons on behalf of the registrant and in the capacities and on the dates indicated.
By (Signature and Title)* /s/ Samuel A. Lieber
Samuel A. Lieber, President
Date 06/30/2006
By (Signature and Title)* /s/ Sheldon Flamm
Sheldon Flamm, Treasurer
Date 06/30/2006
* Print the name and title of each signing officer under his or her signature.