As filed with the Securities and Exchange Commission on July 9, 2008
UNITED STATES
SECURITIES AND EXCHANGE COMMISSION
Washington, D.C. 20549
FORM N-CSR
CERTIFIED SHAREHOLDER REPORT OF REGISTERED
MANAGEMENT INVESTMENT COMPANIES
Investment Company Act file number 811-21210
Alpine Income Trust
(Exact name of registrant as specified in charter)
615 East Michigan Street
3rd Floor
Milwaukee, WI 53202
(Address of principal executive offices) (Zip code)
Samuel A. Lieber
Alpine Woods Capital Investors, LLC
2500 Westchester Avenue, Suite 215
Purchase, NY 10577
(Name and address of agent for service)
1-888-785-5578
Registrant's telephone number, including area code
Date of fiscal year end: 10/31/2008
Date of reporting period: 04/30/2008
Item 1. Report to Stockholders.

Semi-Annual Report
April 30, 2008
April Dynamic Balance Fund
April Dynamic Dividend Fund
Alpine Dynamic Financial Services Fund
Alpine Dynamic Innovators Fund
Alpine Dynamic Transformations Fund
Alpine Municipal Money Market Fund
Alpine Ultra Short Tax Optimized Income Fund
TABLE OF CONTENTS |
EQUITY MANAGER REPORTS |
|
|
4 |
| |
7 |
| |
13 |
| |
16 |
| |
19 |
| |
FIXED INCOME MANAGER REPORTS |
|
|
24 |
| |
26 |
| |
30 |
| |
49 |
| |
51 |
| |
53 |
| |
60 |
| |
68 |
| |
78 |
| |
|
|
|
|
|
|
|
|
| Alpine’s Investment Outlook |
|
|
|
|
|
|
|
|
|
|
|
|
|
|

Dear Investor:
The financial crisis which began unfolding last year has moderated somewhat over the six months ending April 30, 2008. The turning point was the Federal Reserve intervention in JPMorgan’s absorption of Bear Stearns on March 17. However, in its place broad economic concerns have spread, exacerbated by rapid rises of the cost of food and fuel. The American Presidential election cycle is now well underway, which in our opinion contributes not only uncertainty over the direction of future economic policies, but also a greater probability that additional government sponsored initiatives to stabilize the economy will not be forthcoming for the balance of the calendar year. Inflation, deflation and stagflation are features of a marketplace where the trends are myriad and weak.
The credit crisis which had engulfed the markets since last July was not a result of subprime loans, although they proved to be the stick which broke the proverbial camel’s back. We believe the culprit was the methods employed by Wall Street to package and sell a broad array of investible financial assets in a securitized format. We feel that the rating agencies’ models were deficient and permitted investment banks to ‘game the system’ creating excessively high proportions of AAA rated securities. The resultant lack of credibility which has descended upon once venerated investment rating companies, such as S&P, Moody’s and Fitch, appears to have virtually immobilized not only investment banking but also many bond trading functions which are critical to corporate and municipal activity. Over time, ‘the Street’ will hopefully create a new regime in which investment cash flows are more transparent, the structures simpler, and the cost of capital somewhat higher. We feel the credit delivery system is broken. The net result is that a significant portion of financial liquidity has been removed from the marketplace for the foreseeable future. This withdrawal of liquidity, combined with forced deleveraging of many financial service companies and banks, has made mortgage and corporate debt more expensive. It appears it is having the greatest effect in the U.S. where complex
securitizations were a dominant feature of the capital markets and to a lesser degree in the U.K. and Australia.
Even though consumer confidence in the U.S. is approaching historic low levels not seen since 1981(!), economic data remains mixed. The cost of living has been dramatically impacted by rising food and fuel costs which are continuing to ripple throughout the global economy. Unemployment has remained reasonably stable in most countries until the month of May; however, it is a lagging indicator, which could be affected by a weakening business climate. While incomes have remained reasonably stable and the level of consumer expenditures has also shown surprising sustainability, we suspect that falling employment levels and inflating prices could seriously squeeze households in both the U.S. and U.K. The impact of potentially declining consumption could further exacerbate the outlook for retail sales, which in turn may exacerbate the outlook for jobs and ultimately economic growth.
The traditional home sales season this spring in the U.S. is amongst the worst in recent memory and new home sales are currently running at levels not seen since 1991. Even though builders have managed to control the size of their inventories of homes for sale, it appears it is having no impact on the rising backlog of existing homes on the market. It should be noted that the owners of many of these homes for sale will not sell below a certain price unless they are forced to do so, either as a result of relocation or personal financial pressures. Thus, the actual downward pressure on home prices comes primarily from homes which have been foreclosed upon and are currently vacant, as opposed to new homes coming on to the market or existing homes where the owner/occupier seeks to relocate or buy another home.
Despite the negative economic backdrop, corporate earnings during the first quarter showed solid growth with the exception of the financial services sector. While the government’s economic stimulus program providing $100 billion worth of rebates will come through during
1
|
|
the second and third quarters, perhaps less than 40% of these funds will be reinserted into the economy, as many recipients either save or pay down previously established debt. Similarly, the continued benefit from low interest rates should start to benefit the economy now that risk premiums have improved and moderated somewhat. That said, credit conditions are somewhat tighter with loan to value ratios and debt coverage ratios returning to historic levels. On the other hand, government sponsored entities such as Fannie Mae and Freddie Mac have been permitted to raise the size of mortgages they can make, perhaps up to $625,000, so the trend of conforming fixed rate mortgages, once again the most established form of consumer debt, should continue.
While the Federal Reserve has done much to ameliorate the credit crisis, preventing a potential banking crisis and providing considerable liquidity for the credit markets, the Fed may not have many alternatives without effective government leadership. The global implications of a potential protracted downturn in the U.S. would have been far reaching 10 years ago. Today, however, the breadth of the global economy has created a more diverse array of users and producers of goods and services. While the U.S. represents roughly 4.6% of the world’s population, we still constitute 24% of Gross Domestic Product (GDP). Europe is virtually identical in both population and GDP contribution, thus, the balance of 53% of global GDP is produced by 91% of the population. As disproportionate as these comparative statistics are today, they are in fact less so than a decade ago. This reflects significant economic growth which has underpinned the so called “BRIC” countries (Brazil, Russia, India, China), in which 11% of global GDP is produced by 42% of the world’s population. As demographic drivers of demand such as population growth, expanding middle classes, increased mobility and leisure travel continue to expand, so does the rate of domestic consumption. These countries are no longer models of how cheap labor fuels an export
machine. Rather, they are continuing the transition from agrarian self-sufficiency to urban production which has entered a phase where enhanced productivity, sophistication, and internal focus are becoming more important. In a similar fashion, government monetary authorities as well as capital markets have become more sophisticated and more effective in regulating economic activity. The net result is that these economies are beginning to decouple from the U.S., Europe and Japan, and thus are somewhat less dependent upon them for growth. This trend should continue at a pace that reflects the growth disparity between countries over the next generation. If one assumes that the BRIC countries continue to grow at 6% per annum while Europe and the U.S. grow at 2%, then the respective GDP contribution will equal in nineteen years!
Despite this rather sober outlook, it has been Alpine’s experience that the greatest opportunities are derived from challenging investment environments. We believe there are pockets of growth as well as compelling valuations throughout the global capital markets. There also exists considerable risk. Our managers must approach the portfolio as a continuum of future potential outcomes and prepare multiple strategies to best protect and exploit the broad range of these outcomes. We hope this semi-annual report is helpful for you in understanding recent events and the manner in which we adapt to the investment challenges of today, and seek opportunities for tomorrow. This is Alpine’s approach to managing not only your investment dollars, but our personal investments in the funds we run.
Thank you for your interest.
Sincerely,

Samuel A. Lieber
Mutual fund investing involves risk. Principal loss is possible.
The letter and those that follow represent the opinions of Alpine Funds management and are subject to change, are not guaranteed and should not be considered recommendations to buy or sell any security.
Please refer to the schedules of portfolio investments for fund holding information. Fund holdings and sector allocations are subject to change and should not be considered a recommendation to buy or sell any security.
2
EQUITY MANAGER REPORTS

Alpine Dynamic Balance Fund | |
Alpine Dynamic Dividend Fund | |
Alpine Dynamic Financial Services Fund | |
Alpine Dynamic Innovators Fund | |
Alpine Dynamic Transformations Fund |


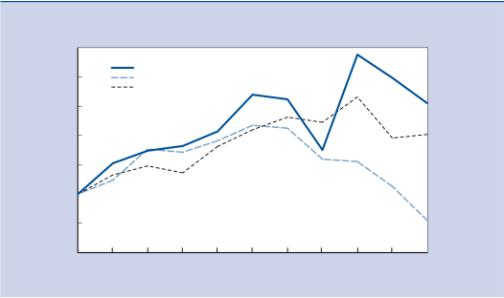
Value of a $10,000 Investment
$18,000
$17,000
$16,000
$15,000
$14,000
$13,000
$12,000
$11,000
$10,000
$9,000
$8,000
$7,000
Jun 7
Oct 31
Apr 30
Oct 31
Apr 30
Oct 31
Apr 30
Oct 31
Apr 30
Oct 31
Apr 30
Oct 31
Apr 30
Oct 31
Apr 30
01
01
02
02
03
03
04
04
05
05
06
06
07
07
08
$15,930
$12,256
Alpine Dynamic Balance Fund
S&P 500 Index
This chart represents a comparison of a hypothetical $10,000 investment in the Fund versus a similar investment in the Fund’s benchmark. The graph and the table do not reflect the deduction of taxes that a shareholder would pay on Fund distributions or the redemption of Fund shares. Investment performance reflects the waiver and recovery of certain fees. Without the waiver and recovery of fees, the Fund’s total return would have differed.
Performance data quoted represents past performance and is not predictive of future results. Investment return and principal value of the Fund fluctuate, so that the shares, when redeemed, may be worth more or less than their original cost. Performance current to the most recent month end may be lower or higher than performance quoted and may be obtained by calling 1-888-785-5578. Performance data shown does not reflect the 1.00% redemption fee imposed on shares held for fewer than 2 months. If it did, total returns would be reduced.
The S&P 500 Index is designed to measure performance of the broad domestic economy through changes in the aggregate market value of 500 stocks representing all major industries. The Lipper Mixed-Asset Target Allocation Growth Funds Average is an average of Funds that, by portfolio practice, maintain a mix of between 60%–80% equity securities, with the remainder invested in bonds, cash, and cash equivalents. Lipper Rankings for the periods shown are based on Fund total returns with dividends and distributions reinvested and do not reflect sales charges. The S&P 500 Index and the Lipper Mixed-Asset Target Allocation Growth Funds Average are unmanaged and do not reflect the deduction of fees associated with a mutual fund, such as investment adviser fees. The performance for the Dynamic Balance Fund reflects the deduction of fees for these value-added services. Investors cannot directly invest in an index.
Comparative Annualized Returns as of 4/30/08 | |||||||||||
|
| 6 Months (1) |
| 1 Year |
| 3 Years |
| 5 Years |
| Since Inception |
|
Alpine Dynamic Balance Fund |
| -5.44% |
| -7.04% |
| 4.56% |
| 9.27% |
| 6.98% |
|
S&P 500 Index |
| -9.64% |
| -4.68% |
| 8.23% |
| 10.62% |
| 2.99% |
|
Lipper Mixed-Asset Target Allocation Growth Funds Average |
| -6.80% |
| -1.63% |
| 7.68% |
| 9.18% |
| 4.06% |
|
Lipper Mixed-Asset Target Allocation Growth Fund Ranking |
| N/A |
| 629/669 |
| 513/555 |
| 185/425 |
| 22/324 |
|
(1) Not annualized. FINRA does not recognize rankings for less than one year.
To the extent that the Fund’s historical performance resulted from gains derived from participation in initial public offerings (“IPOs”), there is no guarantee that these results can be replicated in future periods or that the Fund will be able to participate to the same degree in IPO allocations in the future.
4
Alpine Dynamic Balance Fund |
|

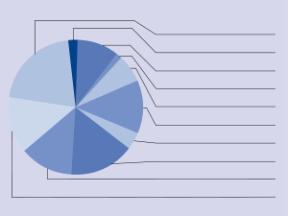
Portfolio Distributions* (Unaudited)
Financial/Banks 25.4% Information Technology 0.3% Cash & Cash Equivalents 0.8% Consumer Staples 2.5% Health Care 3.2% Energy 3.8% Utilities 4.7% Materials 10.3% Industrials 12.4% Consumer Discretionary 12.1% U.S. Gov't Obligations 24.4% Purchased Options 0.4% |
| Top 10 Holdings* (Unaudited) | |||||
| 1. |
| U.S. Treasury Bond, 5.250%, 11/15/2028 | 11.10% |
| ||
2. |
| U.S. Treasury Bond, 6.000%, 2/15/2026 | 7.47% |
| |||
3. |
| CONSOL Energy, Inc. | 5.53% |
| |||
4. |
| Allegheny Energy, Inc. | 3.47% |
| |||
5. |
| U.S. Treasury Bond, 6.250%, 8/15/2023 | 3.04% |
| |||
6. |
| Boston Properties, Inc. | 2.95% |
| |||
7. |
| Simon Property Group, Inc. | 2.74% |
| |||
8. |
| U.S. Treasury Note, 5.000%, 8/15/2011 | 2.73% |
| |||
9. |
| Eagle Materials, Inc. | 2.72% |
| |||
| 10. |
| Fannie Mae | 2.55% |
| ||
| ______________ * Portfolio holdings and sector distributions are as of 4/30/08 and are subject to change. Portfolio holdings are not recommendations to buy or sell any securities. Top 10 Holdings do not include short-term investments. Portfolio Distributions percentages are based on total investments and Top 10 Holdings percentages are based on total net assets. | ||||||

Commentary
Dear Investor:
The Alpine Dynamic Balance Fund had a -5.44% total return in the first half of fiscal year 2008, ending April 30th. This compares with -9.64% for the Standard & Poor’s 500 Index and -6.80% for the Lipper Mixed-Asset Target Allocation Growth Funds Average. The portfolio composition adhered to its basic balance, with 24% of assets in United States Treasury obligations and 1% in cash equivalent obligations. The equity portfolio reflected the extremely mixed trends of the stock market during this period of shifting valuations. We believe that the balanced approach of this Fund should enable us to provide both capital protection and growth opportunities.
The mixed market trends are strikingly clear when comparing the portfolio performance of the top five holdings in terms of gain during this period, with those of the bottom five. The following were the top five holdings performance: Mosaic Company +75.5%, Hess Corp. +48.6%, CONSOL Energy +43.7%, Southside Bancshares +15.9%, Diamond Offshore Drilling +13.3%.
Three of these holdings are energy related; Hess, a diversified oil producer and refiner, CONSOL Energy, a coal and natural gas producer and Diamond Offshore Drilling, an oil and gas well drilling company. Mosaic is a fertilizer company, benefiting by the rising demand for agricultural products. Southside Bancshares is a banking holding company located in eastern Texas.
The extraordinary negative volatility was shown by two homebuilders, Lennar Corp. and Standard Pacific Corp., and three companies in the financial or mortgage servicing business, Ambac Financial, MBIA Inc. and IndyMac Bancorp. Their average decline was over 70%.
The largest holding among the foregoing is CONSOL Energy, originally purchased in 2004 at a cost of $745,000 and valued at $4,371,840 on April 30 (at this writing, on June 16, 2008, the value is $5.76 million). The largest loss was in IndyMac Bancorp, purchased in 2006 and 2007 at a cost of $1,139,000 and valued at $78,975 on April 30th.
Large segments of the portfolio showed consistent earnings, dividends, and price improvement, as illustrated in our real estate investment trusts (10.1% of the portfolio), and commercial products and services (14.7%). Both are sectors based on comparatively long-term strategies, expected to yield significant growth and income from an undervalued base. There were sizeable appreciations since purchase of a number of these holdings; Boston Properties, up 76.6%, Simon Property Group, up 48%, Developers Diversified Realty, up 43.8%. In the commercial and industrial side, AMETEK Inc. has gained 63.8% since purchase, Honeywell International, 26.6%, and Autoliv Inc., 22.9%.
Financial services and banking holdings clearly produced mixed results. Notwithstanding the volatility in the financial industry, our two largest holdings in the field, JPMorgan Chase and Goldman Sachs, both produced modest positive returns in this period.
The portfolio was actively managed, yielding long-term gains of $2,321,000, and short-term gains of $757,000.
In equities we sought to take advantage of favorable short-term price swings both on the sell-side and on the buy-side. The largest single gains, in excess of $700,000 each, were recorded in the sale of shares of Simon Property Group and Union Pacific Corp. Pared back
5
Alpine Dynamic Balance Fund |
|
positions included Allegheny Energy, yielding gains of $485,000, and Goldman Sachs, yielding gains of $296,000, as well as in Chevron Corp. yielding $277,000. Larger shorter-term gains were from reduction of our position in Lennar Corp., resulting in a gain of $250,000 and elimination of Redecard S.A., with a gain of $172,000. Portfolio sector composition largely remained constant, although in November substantial profits were taken in long-term U.S. Treasury bonds due in 2028 and 2026, with monies subsequently reinvested.
We undoubtedly exhibited too much patience with financial institutions impacted by the mortgage crisis. In some situations, where we saw opportunities for what we perceived were long-term undervaluation, we experienced major falls. To this point there have been few signs of recovery in this segment of the financial markets. We have anticipated a quicker and greater response from Congressional and Administration legislation to alleviate challenges to both mortgage borrowers and lenders. These have not yet developed in any significant way. Based on historical parallels of the early 1990’s, and going back into the 1930’s, it should be possible to have Federal programs of meaningful assistance to both challenged borrowers and lenders. In our opinion, the forthcoming federal and congressional elections have surely been an excuse for inaction.
New portfolio commitments focused on companies we believed were undervalued due to inadequate recognition of their sustainable earning power even in a slowed economy. Examples include McGraw Hill Companies, whose shares we feel were sharply devalued as a result of market concerns over their ownership of Standard & Poor’s Corporation, a prominent bond rating agency. Another example of what we believe was temporary undervaluation was in the shares of PACCAR Inc., the largest manufacturer of heavy trucks. This company suffered a decline in its share price due to a change in regulation on diesel motors which accelerated purchases into late 2007 and presumably reduced demand for 2008.
The market apprehensions in our view did not adequately take account of the company’s strong international position, particularly manufacturing in Europe. Pediatrix Inc. was another acquisition where we believe the market had yet to recognize major new growth opportunities. The company, which had built a strong position in neonatal treatment facilities through a series of acquisitions, had entered the field of anesthesiology, a growth opportunity similar to its historical achievement. Darden Restaurants, Inc. experienced an adverse quarter of sales and we thought the market had reacted too negatively to the company just as it was about to enter a period of significant new growth.
Looking ahead, we recognize the challenges of a difficult phase of the overall economic environment. We are carefully taking advantage of cyclical trends, such as in the energy field where in fact our largest holding, CONSOL Energy, has been a long-term commitment with a 486% gain during the period of 2004 through April 30, 2008. We are also carefully taking advantage of a selection of temporary undervaluations caused by transient issues.
Our fixed income position remains the use of U.S. Treasury obligations because we think they provide the greatest clarity in participating in interest rate trends and flexibility for moving as they shift.
In closing we should note that we have enhanced income modestly through a selective use of option sales. This reflects our aim to maximize opportunity within the fundamentally conservative structure of this Fund.
We thank our investors for their sustained interest.
Sincerely,
Stephen A. Lieber
Samuel A. Lieber
Co-Portfolio Managers
This letter and those that follow represent the opinions of Alpine Funds management and are subject to change, are not guaranteed and should not be considered recommendations to buy or sell any security.
Please refer to the schedule of portfolio investments for fund holdings information. Fund holdings and sector allocations are subject to change and should not be considered a recommendation to buy or sell any security.
Investing in this fund involves special risks, including but not limited to, options and futures transactions. Please refer to the prospectus for further details. Investments in debt securities typically decrease in value when interest rates rise. This risk is usually greater for longer-term debt securities.
Lipper Analytical Services, Inc. is an independent mutual fund research and rating service. Each Lipper average presents a universe of Funds with similar invest objectives. Rankings for the periods shown include dividends and distributions reinvested and do not reflect sales charges.
6

Value of a $10,000 Investment
$22,000
$21,000
Alpine Dynamic Dividend Fund
$20,000
S&P 500 Index
$19,000
$18,614
$14,747
Sep 22
Oct 31
Apr 30
Oct 31
Apr 30
Oct 31
Apr 30
Oct 31
Apr 30
Oct 31
Apr 30
03
03
04
04
05
05
06
06
07
07
08
$18,000
$17,000
$16,000
$15,000
$14,000
$13,000
$12,000
$11,000
$10,000
This chart represents a comparison of a hypothetical $10,000 investment in the Fund versus a similar investment in the Fund’s benchmark. The graph and the table do not reflect the deduction of taxes that a shareholder would pay on Fund distributions or the redemption of Fund shares. Investment performance reflects the waiver and recovery of certain fees. Without the waiver and recovery of fees, the Fund’s total return would have differed.
Performance data quoted represents past performance and is not predictive of future results. Investment return and principal value of the Fund fluctuate, so that the shares, when redeemed, may be worth more or less than their original cost. Performance current to the most recent month end may be lower or higher than performance quoted and may be obtained by calling 1-888-785-5578. Performance data shown does not reflect the 1.00% redemption fee imposed on shares held for fewer than 2 months. If it did, total returns would be reduced.
The S&P 500 Index is designed to measure performance of the broad domestic economy through changes in the aggregate market value of 500 stocks representing all major industries. The Lipper Equity Income Funds Average is an average of funds that seek relatively high current income and income growth through investing 60% or more of their respective portfolios in equities. Lipper Rankings for the periods shown are based on Fund total returns with dividends and distributions reinvested and do not reflect sales charges. The S&P 500 Index and the Lipper Equity Income Funds Average are unmanaged and do not reflect the deduction of fees associated with a mutual fund, such as investment adviser fees. The performance for the Dynamic Dividend Fund reflects the deduction of fees for these value-added services. Investors cannot directly invest in an index.
Comparative Annualized Returns as of 4/30/08 | |||||||||
| |||||||||
|
| 6 Months (1) |
| 1 Year |
| 3 Years |
| Since Inception |
|
Alpine Dynamic Dividend Fund |
| -13.67% |
| -10.26% |
| 9.75% |
| 14.44% |
|
S&P 500 Index |
| -9.64% |
| -4.68% |
| 8.23% |
| 8.80% |
|
Lipper Equity Income Funds Average |
| -8.82% |
| -5.54% |
| 8.20% |
| 10.29% |
|
Lipper Equity Income Fund Ranking |
| N/A |
| 237/275 |
| 50/217 |
| 8/172 |
|
(1) Not annualized. FINRA does not recognize rankings for less than one year.
To the extent that the Fund’s historical performance resulted from gains derived from participation in initial public offerings (“IPOs”), there is no guarantee that these results can be replicated in future periods or that the Fund will be able to participate to the same degree in IPO allocations in the future.
7
Alpine Dynamic Dividend Fund |
|
|
|
| ||||
Portfolio Distributions* (Unaudited) |
| Top 10 Holdings* (Unaudited) | ||||
Industrials 21.0% Utilities 2.2% Telecommunication 10.1% Information Technology 1.3% Health Care 6.6% Consumer Staples 12.7% Materials 4.2% Energy 15.6% Financial - Banks 12.8% Consumer Discretionary 13.5% |
| 1. |
| Tele2 AB | 2.51% | |
2. |
| StatoilHydroASA | 2.48% | |||
3. |
| PepsiCo, Inc. | 2.14% | |||
4. |
| Genco Shipping & Trading Ltd | 2.04% | |||
5. |
| The Procter & Gamble Co. | 2.04% | |||
6. |
| Sampo Oyj | 2.01% | |||
7. |
| Diamond Offshore Drilling, Inc. | 2.01% | |||
8. |
| Regal Entertainment Group - Class A | 2.01% | |||
9. |
| Ship Finance International, Ltd. | 2.00% | |||
| 10. |
| Raytheon Co. | 1.99% | ||
| ______________ * Portfolio holdings and sector distributions areas of4/30/08 and are subject to change.Portfolio holdings are not recommendationsto buy or sell any securities. PortfolioDistributions and Top 10 Holdings do notinclude short-term investments. PortfolioDistributions percentages are based on totalinvestments and Top 10 Holdings percentagesare based on total net assets. | |||||
Commentary |
|
Dear Investor:
The Alpine Dynamic Dividend Fund (ADVDX) completed a difficult first half fiscal 2008 by achieving its objective of optimizing its tax-qualified dividend income distribution, but falling short of our objective of strong capital appreciation and total return. However, historically ADVDX has outperformed the major averages and equity income peer group and it is our goal to again provide this outperformance for our investors.
ADVDX declined by 13.67% including dividend reinvestments for the six months ended April 30, 2008 versus a 9.64% decline for the S&P 500 Stock Index and an 8.82% decline for the Lipper Equity Income Funds average for the same time period. Since inception on September 22, 2003, ADVDX has produced an annualized return of 14.44%, which compares favorably to a return of 8.80% for the S&P 500 Index and a 10.29% annualized return for the Lipper Equity Income Funds average. ADVDX ranks #8 based on total return out of 172 funds in the equity income category according to Lipper since inception on 9/22/03 through 4/30/08.
The global equity markets have been roiled over the past six months by a severe credit crisis that was spurred by the collapse of the U.S. residential housing market. While ADVDX did not have any direct exposure to the subprime mortgage industry that was the genesis of the credit problems, we did have investments in diversified global financial institutions and other non-financial businesses that relied on open credit markets to support growth and acquisitions. It is these businesses that have taken a substantial hit to their equity values, and we have been reducing our investments in these areas. This is illustrated in the decline in our financial sector exposure in ADVDX from 16.9% on 10/31/07 to 12.8% on 4/30/08.
Global equity markets have also been hit by a surge in commodity and energy costs which have negatively impacted corporate margins and have raised fears of global inflation, higher interest rates, and subsequently a slowdown in economic activity. We continue to be bullish on commodity and energy stocks based on supply constraints and increasing worldwide demand and have added to our positions in the equities in these sectors. However, ADVDX was hit by a sell off in the global industrial stocks on the fears of an impending economic slowdown. We have steadily repositioned the portfolio to where we believe are the best opportunities, and right now that is more toward hard assets versus financial assets. For example, we have taken our energy sector exposure up from 11.7% on 10/31/07 to 15.6% on 4/30/08. We have also added to our more defensive positions in consumer staples and telecom while decreasing our exp osure to consumer discretionary.
Also impacting the performance of ADVDX relative to the S&P 500 and our equity income peers has been our relatively large exposure to overseas markets, which have significantly underperformed the U.S. over the past six months. In addition to our multi-strategy and multi-cap approach, we also invest approximately 30-40% of our assets in international equities where we have found what we feel are attractive growth opportunities and larger dividend payouts than we see in the U.S. We do not actively manage our country weightings – we pick our holdings on a stock by stock basis based on dividend potential and total return. This bottoms up approach had taken a large portion of our international holdings to the Euro region which has been particularly hard hit as interest rates remain much higher there than in the US.
8
Alpine Dynamic Dividend Fund |
|
ADVDX is currently invested in equities based in 15 different countries, the majority of which would be considered mature countries. However we do have a small exposure to some emerging market economies and we continue to look for interesting dividend and capital appreciation opportunities in countries like Brazil, Mexico, and Russia. Following the United States, our current top countries are Sweden, Norway, Finland, Italy, and France. The average dividend yield for the major indices in these five countries is currently 4.63% which is more than double the yield on the S&P 500 Index of 2.27%.
The US has been one of the best performing major equity markets over the past six months largely due to the aggressive rate cuts by our Fed versus the European countries facing raising rates and the concern that a US slowdown will drag down Europe. For example, the Dow Jones STOXX Index, which is a broad representation of 600 companies in the European region, has declined by 27.61% from its high in mid-July 2007 through its low on March 17, 2008 versus a 20.25% decline for the S&P 500 Index from its high in mid-October 2007 through its low on 3/17/08.
We meet and talk with European management teams and analysts on a regular basis and the message continues to be that certain sectors of the economy like infrastructure and emerging consumer are strong, with many of our companies benefiting from growth in Asia and emerging markets. However, we are continuously doing our homework and we have lightened up on our European positions where we see increasing earnings risk from a potentially slowing global economy. In many cases, we believe that the market has oversold some great companies and we will ride out the near term turbulence and take a long term view for our investors.
ADVDX provides a strong dividend yield with a high level of qualified dividend income for investors
For the six months ended April 30, 2008, ADVDX paid $0.86 in dividend income, with nearly all of the distribution estimated to be qualified for the maximum taxable rate of 15%. For the twelve-months ended April 30, 2008 the Fund paid a total of $1.641 in dividend income. Based on a closing NAV price of $10.66 on 4/30/08, the $0.86 dividend payout represents a trailing six-month dividend yield of 8.08% for the Fund. This high level of dividend income is unique among equity oriented funds.
As of April 30, 2008 ADVDX paid a regular monthly minimum dividend of $0.07 per share. In addition, in the third month of each quarter the Fund has distributed excess dividend income that had been earned and accumulated during the quarter.
Our unique investment approach combines three sub-strategies: Dividend Capture, Value, and Growth
ADVDX combines three research-driven investment strategies – Dividend Capture, Value, and Growth – to maximize the amount of distributed dividend income that is qualified for reduced Federal income tax rates and to identify companies with the potential for dividend increases and capital appreciation. The Fund also offers some global diversification since a portion of the portfolio is invested in international dividend-paying equities. We scan the globe looking for what we feel are the best dividend opportunities for our investors, employing a multi-cap, multi-sector, and multi-style investment approach.
Our “Dividend Capture Strategy” enhances the qualified dividend income generated by the Fund
We run a portion of our portfolio with a dividend capture strategy, where we invest in typically high dividend yielding stocks or in special situations where large cash balances are being returned to shareholders as one-time special dividends. We seek to enhance the dividend return of this portfolio by electively rotating a portion of our high yielding holdings after the 61-day ownership period required to obtain the maximum 15% dividend tax rate.
Another facet of our dividend capture strategy is our search for core, long term holdings in companies that historically have generated consistent strong free cash flow and regular large dividend distributions, usually above 5%. Two of our largest holdings, Regal Entertainment with a 7.3% current yield and Ship Finance with a 7.8% dividend yield, are examples of this strategy.
Regal (RGC) is the largest theater owner in the U.S., generating 20% of total U.S. box office revenue. It is currently enjoying a rebound in theater attendance based on what has been perceived as higher quality movie selections. We expect the large-scale rollout of enhanced 3-D technology to theaters beginning in 2009 to act as a catalyst for an additional increase in movie attendance and an enhanced margin opportunity for Regal as 3-D movies command premium ticket prices.
Ship Finance (SFL) is one of the world’s largest ship owners with assets including crude oil tankers, dry bulk carriers, containerships, offshore supply vessels, and drilling rigs. The company’s fleet operates on long-term charters plus profit sharing agreements which has allowed SFL to benefit from strong growth in global shipping and commodity demand. In addition, the company returns most of its free cash flow to its investors with a current 7.8% dividend yield. SFL is continuing to expand its fleet of diversified assets which should support further earnings growth and dividend increases in the future.
9
Alpine Dynamic Dividend Fund |
|
Several of our top holdings as of April 30, 2008 were companies that announced special dividend payments associated with restructurings and/or excess cash, and we believe there is additional upside value to be realized following their dividend payments. Tele2 AB (TEL2B SS), based in Sweden, is an operator of mobile wireless networks throughout Europe with exposure to emerging market growth in Russia. The company has committed to returning excess cash to shareholders, with ADVDX receiving an annual and special dividend payment in May 2008 of 6.6%. And StatoilHydro ASA (STL NO), based in Norway, is well positioned as an integrated oil and gas company that operates drilling rigs in the North Sea, refineries in northern Europe, and retails gasoline in Scandinavia. We believe that Statoil offers attractive valuations relative to its future earnings outlook. In addition, the company provides an annual dividend yield of about 2.2% and also has returned excess cash to shareholders as special dividends in each of the past few years.
Our “Growth and Income Strategy” targets capital appreciation in addition to yield
Our second strategy identifies core growth and income stocks that may have slightly lower but still attractive current dividend yields and predictable earnings streams plus a catalyst for capital appreciation and dividend increases.
In our top 10 holdings, we would group Pepsi, Procter and Gamble, and Raytheon in this category. These companies are estimated to grow earnings annually by 10-15% over the next several years and each raised their dividends by 10-15% in 2008. We believe, in 2009, additional dividend increases may match earnings growth.
Two of our top growth and income holdings are considered more defensive consumer staple stocks with attractive earnings outlooks that are less tied to economic growth. PepsiCo (PEP) is a diversified beverage and snack company that is well positioned for double digit EPS growth through international expansion and the strength of its domestic portfolio of businesses. Pepsi has consistently increased its dividend and recently raised its annual payout by 13.3% to $1.70 per share, providing a current dividend yield of 2.6%. And Procter and Gamble (PG) is one of the world’s largest diversified consumer products company that is also benefiting from international expansion and strength in its core domestic brands. PG is also committed to dividend increases and recently raised its annual dividend by 14.3% to $1.60 per share.
Raytheon is an industry leader in aerospace, defense and government electronics. The company is benefiting from increasing worldwide demand for its systems such as missile defense, precision strike, radar, and intelligence gathering. Raytheon recently reported bookings up 23% year of year and a new record backlog. We believe the stock has been oversold based
on overblown concerns about cuts to future defense spending and we anticipate strong double digit earnings growth. Plus, the company recently increased its dividend payout by 10%.
Lastly, we would include Diamond Offshore Drilling (DO) as an attractive growth and income story in our top 10 holdings, growing earnings an estimated 20% in 2008 and 2009 and yielding a trailing twelve-month dividend yield of 3.15%. Diamond Offshore, based in Houston, Texas, is one of the largest operators of mid-deepwater rigs and it is seeing strong demand for its services as oil is getting harder to find and exploration is moving further out to sea. This is resulting in substantial increases on rates for its long term contracts and the expectation of possibly a doubling of earnings in the next two-three years. DO is generating significant free cash flows and has been returning it to shareholders as regular annual special dividends and has recently moved to quarterly special dividends of $1.25. We would expect the continuation of large cash returns in 2008 and 2009 as the company is committed to paying out about 80% of earnings as dividends.
Our “Value/Restructuring Strategy” looks for attractively valued or restructuring dividend payers
Our third major strategy is what we call “value with a catalyst or restructuring strategy”, where our internal research points to under-valued or mis-priced equity opportunities for companies with attractive dividend yields. We also look for turnaround situations or depressed earnings where we believe there is a catalyst for an earnings recovery or a restructuring or major corporate action that is expected to add value. The key characteristic for this strategy is low valuations relative to historical averages and above average dividend yields for a combined objective of capital appreciation and high qualified dividend income. We would categorize two of our top holdings in this strategy; Genco Shipping & Trading, and Sampo Oyj.
Genco Shipping & Trading (GNK) is one of the largest publicly traded dry bulk shipping companies that transports iron ore, coal, grain, steel products, and other minor dry bulk commodities along worldwide shipping routes. The company is benefiting from strong global demand for these commodities as well as increases in lengths of haul as the sourcing for many of the commodities are in countries that are far from the users. For example, China is now sourcing iron ore from Brazil which is double the length of haul from its traditional suppliers in Australia. In addition, Genco has been growing aggressively through acquisitions and is returning excess cash to shareholders with a current dividend yield of 6.3%, yet the company trades at very low multiples to future forward growth.
Sampo Oyj (SAMAS FH), based in Finland, is a comprehensive provider of insurance products in Scandinavia. Having exited its banking business at the
10
Alpine Dynamic Dividend Fund |
|
top of the market in 2007, they are looking to opportunistically deploy their excess capital and promote consolidation in the Scandinavian financial sector. The company is forecasted for solid 10% earnings growth and provides an attractive 7.2% annual dividend yield.
Outlook for 2008: We remain opportunistic and are focused on growth in NAV
The volatility over the past several months in global equity markets has provided challenges and opportunities. While our short term performance has been challenged, as fundamental investors we also see longer term opportunities. Particularly, within our value strategy, we are looking to take advantage of the recent declines in the equity markets to invest in still very strong companies with attractive dividend yields at more attractive valuations. While we do expect additional headline risks particularly in the financial sector for the remainder of 2008, we still believe that global economic growth will remain solid, albeit slower than in the previous several years, driven by demand from Asia and the emerging market economies. We continue to seek attractive global growth companies that are committed to returning cash to shareholders.
We continue to concentrate on global secular investment themes that we believe will outperform over the long term.
We remain bullish on global infrastructure and engineering companies as the rest of the world tries to catch up with the industrialized countries with regards to power plants, phones, roads, electricity, water treatment, sewage, and airports. In addition, the industrialized nations of the world have neglected their aging infrastructure and are now rebuilding and reinvesting. Some of the companies in our portfolio have been hit on concerns about rising capital costs and the need to finance these costly projects. However, while credit spreads have increased, the Fed’s actions to cut rates has offset some of this negative impact and our portfolio companies are confident in their ability to access capital markets. In addition, many of these projects are supported by governments that are long term in focus and less sensitive to short term economic swings. Some of our favorite stocks are the companies that may supply this growth for what we believe may be many years to come and at much higher prices than achieved in the past.
We also still like the long term secular story for the basic materials and energy sectors based also on constrained supply and growing global demand. For example, we like the long term secular outlook for deepwater drillers as oil is getting harder to find and exploration is moving further out to sea. We plan to continue to be nimble in these volatile yet potentially highly profitable sectors and we would look for attractive entry and exit points and we are aware of the impact of shorter term seasonal trading pattern. In addition, many of these
companies are producing record amounts of free cash flow and we expect continued increases in regular and special dividend payouts.
We also remain overweight in energy stocks as many of these companies have not reflected the recent spike in oil prices and we believe there will be upside earnings revisions. We also remain bullish on companies involved with corn, coal, and copper commodities.
We also participate in a variation on investing in commodity companies, and that is through increasing global trade. We look to participate in the increasing need for the movement of commodities globally through producers, financers, and operators in the shipping industry. Commodities such as oil, grain, iron ore, and coal are moving longer distances than ever and with higher volumes and frequencies. These companies tend to benefit from the overall growth in the world economies regardless of the price of the underlying commodity with many committed to returning cash as large dividends.
We also favor the industrial and machinery companies that are supplying global growth and are also benefiting from aerospace and defense spending. Our favorites are companies that have the majority of their revenue generated overseas and have booked strong backlogs with visibility on this revenue for several years out. However, we have recently lowered our overall exposure to the industrial sector as we look to take profits where we have had strong growth and where there may be a risk in earnings from a slowing global economy.
While the aging demographics of many of the industrialized countries may result in great long term growth opportunities in the healthcare sectors, we remain cautious on the large pharmaceutical companies where there are legislative and generic drug risks. We prefer to look for interesting opportunities in smaller cap niche healthcare which is being stimulated by demographic trends and advances in biotechnology and yet there is more limited generic risk.
While we remain positive on the outlook for sustainable global economic growth in 2008, we also believe that a slowing US economy and financial market turmoil makes it prudent to also have a meaningful exposure in the telecom, utilities and consumer staples sectors. These sectors tend to be large dividend payers and more defensive in nature. Within these groups, we continue to be selective and pick our holdings on a stock by stock basis where we see the best combination of earnings growth, valuation, and dividend opportunity.
At this time, we continue to remain cautious on the financial sector, as we believe there is still more write-downs on mortgage-related assets and downward earnings revisions. In addition, we believe the need to recapitalize balance sheets and the outlook for a reduction in high margin business opportunities will continue to dampen earnings outlooks beyond more
11
Alpine Dynamic Dividend Fund |
|
write-downs. Our strategy during the financial markets turmoil has been to add to the higher quality financial stocks on dips where we believe valuation have become very attractive. But overall we would not look to increase our weightings substantially until we believe that the downside risk is quantifiable and that the upside reward is meaningful.
Another sector that we remain cautious on at this time is consumer discretionary. General consumer spending is being impacted by the declining housing market and high energy prices, but this is balanced by overall employment levels which have remained resilient. And similar to the financial sector, we are consistently looking at opportunities within the global consumer sector where stocks may have been oversold and could offer long term value at current prices. If the housing and equity market volatility do spill over to the ever-resilient U.S. consumer or it start to impact employment levels, then we believe there is a higher risk of a general economic slowdown and we need to monitor this as investors could become more defensive.
In summary, in a slowing economic growth environment and financial market uncertainty, we believe investors will be drawn to high quality, internationally oriented,
and potentially more defensive stocks. That may bode well for dividend payers and our fundamental strategy of searching globally and in multi-caps and multi-sectors for investment opportunities. It is our plan to balance positive fundamentals in many of our secular growth themes with the risks of financial market turmoil, high oil prices, a potential economic slowdown in the U.S., and continued geopolitical uncertainties.
Our approach is to remain broadly diversified within the dividend-paying universe while actively looking for undervalued opportunities. It is our belief we will be able to continue to distribute our current dividend payouts to our shareholders by capitalizing on our research driven approach to identifying attractive situations as well as through our active management of the portfolio.
Thank you for your participation and we look forward to a prosperous year in 2008 and beyond.
Sincerely,
Jill K. Evans and Kevin Shacknofsky
Co-Portfolio Managers
______________
Please refer to the schedule of portfolio investments for fund holding information. Fund holdings and sector allocations are subject to change and should not be considered a recommendation to buy or sell any security.
Investing in small and mid cap stocks involves additional risks such as limited liquidity and greater volatility as compared to large cap stocks.
Investing in foreign securities tends to involve greater volatility and political, economic and currency risks and differences in accounting methods.
Neither the Fund nor any of its representatives may give tax advice. Investors should consult their tax advisor for information concerning their particular situation.
Free cash flow: Cash not required for operations or for reinvestment. Often defined as earnings before interest (often obtained from the operating income line on the income statement) less capital expenditures less the change in working capital.
Earnings per share (EPS): Calculated by taking the total earnings divided by the number of shares outstanding.
Dividend Yield: The yield a company pays out to its shareholders in the form of dividends. It is calculated by taking the amount of dividends paid per share over a specific period of time and dividing by the stock’s price.
S&P 500 Electric Utility Index: Standard and Poor’s 500 Electric Utilities Index is a capitalization-weighted index. The index was developed with a base level of 10 for the 1941-43 base period.
DJ Select Dividend Index: The selection of stocks to the Dow Jones Select Dividend Index is based almost entirely on dividend yield and dividend history. Stocks are also required to have an annual average daily dollar trading volume of more than $1.5 million. These criteria help to ensure that the index represents the most widely traded of the market’s highest-yielding stocks.
12
Value of a $10,000 Investment
$15,000
Alpine Dynamic Financial Services Fund
$14,000
PHLX/KBW Bank Index
S&P 500 Index
$13,112
$13,000
$12,000
$12,044
$11,000
$10,000
$9,000
$9,102
$8,000
Nov 1
Jan 31
Apr 30
Jul 31
Oct 31
Jan 31
Apr 30
Jul 31
Oct 31
Jan 31
Apr 30
05
06
06
06
06
07
07
07
07
08
08
This chart represents a comparison of a hypothetical $10,000 investment in the Fund versus a similar investment in the Fund’s benchmark. The graph and the table do not reflect the deduction of taxes that a shareholder would pay on Fund distributions or the redemption of Fund shares. Investment performance reflects the waiver and recovery of certain fees. Without the waiver and recovery of fees, the Fund’s total return would have differed.
Performance data quoted represents past performance and is not predictive of future results. Investment return and principal value of the Fund fluctuate, so that the shares, when redeemed, may be worth more or less than their original cost. Performance current to the most recent month end may be lower or higher than performance quoted and may be obtained by calling 1-888-785-5578. Performance data shown does not reflect the 1.00% redemption fee imposed on shares held for fewer than 2 months. If it did, total returns would be reduced.
The NASDAQ 100 Financial Index is a capitalization-weighted index of the 100 largest financial companies, as well as foreign issues, including American Depository Receipts (ADRs), traded on the NASDAQ National Market System (NASDAQ/NMS) and SmallCap Market. The PHLX/KBW Bank Index is a modified cap-weighted index consisting of 24 exchange-listed and National Market System stocks, representing national money center banks and leading regional institutions. The S&P 500 Index is designed to measure performance of the broad domestic economy through changes in the aggregate market value of 500 stocks representing all major industries. The Lipper Financial Services Funds Average is an average of funds whose primary objective is to invest primarily in equity securities of companies engaged in providing financial services. Lipper Rankings for the periods shown are based on Fund total returns with dividends and distributions reinvested and do not reflect sales charges. The NASDAQ 100 Financial Index, the PHLX/KBW Bank Index, the S&P 500 Index and the Lipper Financial Services Funds Average are unmanaged and do not reflect the deduction of fees associated with a mutual fund, such as investment adviser fees. The performance for the Dynamic Financial Services Fund reflects the deduction of fees for these value-added services. Investors cannot directly invest in an index.
Comparative Annualized Returns as of 4/30/08 | ||||||||||
|
|
|
|
|
| Since Inception | ||||
|
| 6 Months (1) |
| 1 Year |
| (11/1/2005) | ||||
Alpine Dynamic Financial Services Fund |
| -11.27% |
| -1.01% |
| 11.48% | ||||
NASDAQ 100 Financial Index |
| -11.84% |
| -12.29% |
| 0.04% | ||||
PHLX/KBW Bank Index |
| -18.10% |
| -25.74% |
| -3.51% | ||||
S&P 500 Index |
| -9.64% |
| -4.68% |
| 7.90% | ||||
Lipper Financial Services Funds Average |
| -17.20% |
| -21.14% |
| 2.42% | ||||
Lipper Financial Services Fund Ranking |
| N/A |
| 1/131 |
| 18/140 | ||||
(1) Not annualized. FINRA does not recognize rankings for less than one year.
To the extent that the Fund’s historical performance resulted from gains derived from participation in initial public offerings (“IPOs”), there is no guarantee that these results can be replicated in future periods or that the Fund will be able to participate to the same degree in IPO allocations in the future.
13
Alpine Dynamic Financial Services Fund |
|
|
|
| ||||
Portfolio Distributions* (Unaudited) |
| Top 10 Holdings* (Unaudited) | ||||
|
| 1. |
| Intercontinental Exchange, Inc. |
| 5.54% |
Capital Markets 38.7% Consumer Finance 0.2% Transportation IT Services 3.1% Diversified Financial Services 4.6% Insurance 5.6% Thrifts & Mortgage Finance 14.2% Commerical Banks 31.8% |
| 2. |
| Ultra Short Financials ProShares Trust |
| 4.83% |
3. |
| Banco Estado Rio Grande Sul SA |
| 3.91% | ||
4. |
| Banco Panamericano SA |
| 3.76% | ||
5. |
| Alliance Bancorp, Inc. |
| 3.46% | ||
6. |
| Blackstone Group L P |
| 3.24% | ||
7. |
| Nymex Holdings Inc. |
| 3.21% | ||
8. |
| Sanders Morris Harris Group, Inc. |
| 3.11% | ||
9. |
| Fortress Investment Group LLC – Class A |
| 2.79% | ||
10. |
| Interactive Brokers Group, Inc. |
| 2.74% | ||
______________ | ||||||
* Portfolio holdings and sector distributions are as of 4/30/08 and are subject to change. Portfolio holdings are not recommendations to buy or sell any securities. Portfolio Distributions and Top 10 Holdings do not include short-term investments. Portfolio Distributions percentages are based on total investments and Top 10 Holdings percentages are based on total net assets. | ||||||
|
|
|
|
|
|
|

Commentary |
|
Dear Investor:
Alpine Dynamic Financial Services Fund reported a –11.27% total return during the six months ended April 30, 2008. This compares favorably to returns for the NASDAQ 100 Financial Index of -11.84% and the PHLX/KBW Bank Index of -18.10% during the same period.
The first half of fiscal 2008 was a difficult period for financial stocks with the nadir hit on the day the Bear Stearns bailout was announced. The actions taken by the Federal Reserve in the Bear Stearns transaction infused some investor confidence in the stability of the industry. It appears this renewed investor confidence has allowed many large institutions to raise billions of dollars in much needed capital. These recapitalization transactions should permit banks to more aggressively write-down the problems in their security and loan portfolios and de-lever their balance sheets. In our opinion this process of strengthening bank balance sheets is needed in order for financial stocks to mount an extended advance. We expect the early stages of a long term advance will be choppy with headline news driving both short-term rallies and declines. But with the sector still underweighted by institutional investors and heavily shorted by speculators, we believe future demand for financial stocks may be great. We also feel the recent decline in bank stocks provides a rare buying opportunity for long term oriented investors. The last
time bank valuations were this low was during the savings and loan crisis of the early 1990’s.
We anticipate the operating environment for the financial industry will remain challenging for the remainder of the year. From a macro-economic prospective, the weakening labor market combined with rising energy and food prices, declining home prices, and tighter credit is beginning to hamper consumer spending. This is causing economists to lower their growth projections for 2008. There is a concern that a prolonged decline in consumer spending could negatively affect the corporate sector which would cause further weakness in the labor market. Currently, banks are reporting that their commercial loan portfolios are performing well and that there is still demand for credit.
The area that is causing most of the problems for banks is the housing market. In speaking to bankers from around the country, the general opinion is for increases in delinquencies and charge-offs in construction, mortgage, and home equity loans for at least the next few quarters. Stabilization in the housing market is needed before trends improve. While an individual’s desire to own a home has not changed, their ability to afford a home has lessened. This should change if home prices readjust downward thus providing an opportunity for first-time homebuyers to enter the market. From the
14
Alpine Dynamic Financial Services Fund |
|
supply side, both builders and banks have been aggressive in selling excess inventory and home starts have declined meaningfully.
Most banks we have spoken to are being cautious and don’t expect balance sheet growth this year. Planned reductions in the residential construction loans may offset growth in other loan categories. Banks plan to grow their loan loss reserves this year and we expect more banks will announce capital raises and dividend cuts. On the positive side, we anticipate that the net interest margin will improve in the second half of the year. The rapid decline in the Fed funds rate hindered the margin as the rate charged on prime-based loans declines immediately while the rollover of CDs is spread over time. As the Federal Reserve holds rates steady, this should allow the repricing of CD rates to catch up with the decline in the prime rate. Competition for deposits is tough as troubled institutions are paying high rates to attach much needed funding. This is being offset on the loan side as risk is being priced into loan deals. Also helping the margin is a steeper yield curve.
We believe industry consolidation will slow during 2008 as acquirers wait until the real estate market stabilizes and they can better assess the risk of the balance sheets they are buying. When that time arrives, we anticipate a substantial increase in mergers. After a stressful period, we expect the boards of many banks are going to be willing sellers while the acquiring banks will want to take advantage of low deal valuations. We also expect to see small community banks doing merger of equal transactions with similar size banks in order to get scale, improve efficiency, and increase franchise value.
Although the immediate business climate is challenging for banks, longer term, we believe bank and thrift stocks offer the best potential return among the financial services sub-sectors coming out of this downturn. The stocks are starting at valuations not seen in over a decade. We expect the initial rally to begin when credit problems stabilize and banks start letting their loan loss reserves to flow back into earnings. Additional interest in the group should materialize
when the pace of industry consolidation increases. As fundamentals improve, we estimate that there will be a multi-year period of improving return on equity for the group which should help sustain investor interest in the sub-sector. Our holdings among banks and thrift stocks are primary in stocks we feel are attractively priced, in markets we believe will outperform in the next economic expansion, and are potential consolidation candidates.
In the short term, we believe companies with little or no credit exposure will outperform the overall financial sector. These include the owners of equity and derivative exchanges, brokers which only provide execution services, corporate financial advisors, and asset managers. Each of these groups has recently declined due to various investor concerns. While the concerns vary from group to group, they originate from the current weak capital market environment and lack of liquidity for leveraging and financing. As the capital markets improve and money flows increase, we anticipate that these companies, which have no over-hanging credit issues, will be the initial beneficiaries. Since our last report, we have increased our exposure to these groups.
In an effort to reduce the overall risk of the fund, we have diversified our holdings among the different sub-sectors of the financial industry. Some of these investments we believe will outperform in the short term while others we feel potentially offer the best long term return. We monitor industry trends for improvement or deterioration and direct our investments into or out of sub-sectors that are affected by these trends. We also actively search for attractively priced, oversold investment opportunities. While financial stocks have been under stress, we believe that once credit concerns subside the group offers attractive long term prospects. We wish to thank our investors for your continued support.
Sincerely,
Peter J. Kovalski
Portfolio Manager
The fund primarily invests in equity securities of financial services companies and will be affected by risk factors particular to this industry such as regulation, monetary and fiscal policies and interest rates, as well as general market risks. The fund invests in smaller companies, which involve additional risks such as liquidity and greater volatility. The fund invests in foreign securities which involve greater volatility and political, economic and currency risks and differences in accounting methods.
There is no assurance the fund will achieve its investment objective.
Please refer to the schedule of portfolio investments for fund holding information. Fund holdings and/or sector allocations are subject to change at any time and are not recommendations to buy or sell any security.
15

Value of a $10,000 Investment
$15,000
Alpine Dynamic Innovators Fund Russell
2000 Total Return Growth Index
$13,000
$12,972
$11,000
$10,739
$9,000
Jul 11
Aug 31
Oct 31
Dec 31
Feb 28
Apr 30
Jun 30
Aug 31
Oct 31
Dec 31
Feb 29
Apr 30
06
06
06
06
07
07
07
07
07
07
08
08
This chart represents a comparison of a hypothetical $10,000 investment in the Fund versus a similar investment in the Fund’s benchmark. The graph and the table do not reflect the deduction of taxes that a shareholder would pay on Fund distributions or the redemption of Fund shares. Investment performance reflects the waiver and recovery of certain fees. Without the waiver and recovery of fees, the Fund’s total return would have differed.
Performance data quoted represents past performance and is not predictive of future results. Investment return and principal value of the Fund fluctuate, so that the shares, when redeemed, may be worth more or less than their original cost. Performance current to the most recent month end may be lower or higher than performance quoted and may be obtained by calling 1-888-785-5578. Performance data shown does not reflect the 1.00% redemption fee imposed on shares held for fewer than 2 months. If it did, total returns would be reduced.
The Russell 2000 Total Return Growth Index is constructed to provide a comprehensive and unbiased barometer of the small-cap growth market. Based on ongoing empirical research of investment manager behavior, the methodology used to determine growth probability approximates the aggregate small-cap growth manager’s opportunity set. The Lipper Small-Cap Growth Funds Average is an average of Funds that, by portfolio practice, invest at least 75% of their equity assets in companies with market capitalizations (on a three year weighted basis) less than 250% of the dollar-weighted median of the smallest 500 of the middle 1,000 securities of the S&P SuperComposite 1500 Index. Lipper Rankings for the periods shown are based on Fund total returns with dividends and distributions reinvested and do not reflect sales charges. The Russell 2000 Total Return Growth Index and the Lipper Small-Cap Growth Funds Average are unmanaged and do not reflect the deduction of fees associated with a mutual fund, such as investment adviser fees. The performance for the Dynamic Innovators Fund reflects the deduction of fees for these value-added services. Investors cannot directly invest in an index.
Comparative Annualized Returns as of 4/30/08 |
|
|
|
|
|
|
| |||
|
| 6 Months (1) |
| 1 Year |
| Since Inception |
| |||
Alpine Dynamic Innovators Fund |
| -9.79 | % |
| 13.21 | % |
| 15.53 | % |
|
Russell 2000 Total Return Growth Index |
| -14.14 | % |
| -6.71 | % |
| 4.03 | % |
|
Lipper Small-Cap Growth Funds Average |
| -16.55 | % |
| -7.94 | % |
| 5.00 | % |
|
Lipper Small-Cap Growth Fund Ranking |
| N/A |
|
| 1/598 |
|
| 12/543 |
|
|
(1) | Not annualized. FINRA does not recognize rankings for less than one year. |
To the extent that the Fund’s historical performance resulted from gains derived from participation in initial public offerings (“IPOs”), there is no guarantee that these results can be replicated in future periods or that the Fund will be able to participate to the same degree in IPO allocations in the future.
16
Alpine Dynamic Innovators Fund |
|
|
|
| |||
Portfolio Distributions* (Unaudited) |
| Top 10 Holdings* (Unaudited) | |||
Financials 6.4% Energy 6.2% Consumer Discretionary 4.2% Materials 6.3% Cash & Cash Equivalents 12.2% Information Technology 19.4% Telecommunications 1.8% Industrials 14.1% Health Care 29.4% |
| 1. |
| Invitrogen Corp. | 3.31% |
2. |
| Itron, Inc. | 2.86% | ||
3. |
| Charles River Laboratories International, Inc. | 2.74% | ||
4. |
| Priceline.com, Inc. | 2.71% | ||
5. |
| Portfolio Recovery Associates, Inc. | 2.60% | ||
6. |
| MEMC Electronic Materials, Inc. | 2.53% | ||
7. |
| Logitech International S.A. | 2.35% | ||
8. |
| Air Products & Chemicals, Inc. | 2.32% | ||
9. |
| CME Group, Inc. | 2.16% | ||
| 10. |
| Inventiv Health, Inc. | 1.97% | |
| ______________ * Portfolio holdings and sector distributions are as of 4/30/08 and are subject to change. Portfolio holdings are not recommendations to buy or sell any securities. Top 10 Holdings do not include short-term investments. Portfolio Distributions percentages are based on total investments and Top 10 Holdings percentages are based on total net assets. | ||||

Commentary |
|
Dear Investor:
The performance of the Alpine Dynamic Innovators Fund for the first half of the fiscal year ended April 30, 2008 was -9.79%. This compares with -9.64% of the S&P 500 Index, and -14.14% for the Russell 2000 Total Return Growth Index. Since inception of the Fund on July 11, 2006, the cumulative performance is 29.72%, comparing with 12.68% for the S&P 500 Index and 7.39% for the Russell 2000 Total Return Growth Index.
After the 35% gain for the calendar year 2007, the Fund results were negatively impacted by the recessionary concerns building in 2007, notably in the technology sector. On occasion market volatility has obscured strong underlying trends in innovative companies. Illustratively, a dramatic change in valuation recently occurred for one of the Fund’s holdings, Sequenom, Inc. Originally purchased at $7.33 per share, its value at April 30th was $6.32, and by June 9th it closed at $12.83 per share. The reason for the sudden shift in valuation is that the company has announced its success in developing a genetic test to determine whether a child will be born with Downs Syndrome. The concept of innovation, as in this case, involves understanding the potentials for new developments and judging the timing for their impact. The largest single gain in the Fund to date had to do with an unexpected impact of a highly creative innovative data management source. We purchased shares of VMare, Inc. for its unique technology in high density data storage. Within a few months a bid was made for the company at a price which on April 30th, provided a 129.8% gain for the Fund.
Innovative opportunities can be accelerated by changing economic circumstances. One such example, in our opinion, is our holdings in Priceline.com, which has appreciated 44.7% since acquisition. This company offers travelers the opportunity to search out and negotiate extraordinary discounts, and it appears they have been favorably impacted by a slowing economy.
While anticipating innovative opportunities predominantly in the small to mid capitalization company environment, we believe the Fund is also benefiting identifying similar potential in larger capitalized companies. For example, Monsanto Company is already achieving, and anticipating even greater growth from its developments of high yield agricultural seeds. Large companies likely to be on the threshold of accelerating their growth through innovative products include such portfolio holdings as Air Products and Chemicals, Medtronic Inc., Merck & Company, CME Group, Inc., and Apple, Inc.
The search for innovative opportunity has led to medical technology and pharmaceutical products as the largest single grouping of holdings, with 26 companies. Next in number is electronic systems and instruments with 11 companies, followed by sectors as diverse as oil and gas exploration and development products, and energy efficiency systems. The size range of these companies is as extensive as from FMC Technologies $9.6 billion market value in oil and gas exploration, to Westport Innovations, a $446 million Canadian Dollar market value specialist in engine development for hydrogen vehicle power. With 30% of the portfolio invested in medical technology, healthcare and biotechnology, 19%
17
Alpine Dynamic Innovators Fund |
|
in electronic systems and communication, and 6% in energy systems, our present portfolio policy makes the statement as to where we think the greatest areas of innovation are likely to be in the period ahead.
Numerous portfolio changes during the fiscal half year reflected the volatile markets. A policy of risk avoidance involved short-term losses, as illustrated, in our opinion, by our largest losses in two stocks of electronic based companies, Formfactor Inc., and Garmin, Ltd., each with losses over 40%. We took significant profits on sharp run-ups as in the case of Google, Inc., paring back our position, and in the sale of Illumina, Inc., after an advance which more than doubled our investment and seemed, in our judgment, as discounting near term gains.
In its first 16 months of operation we feel that the Fund has established its strategy of focus on innovation, and demonstrated its leadership as a growth fund. In the
recent half year we have gone through a challenging period where many volatile stocks showed sharp moves over limited time cycles. We are adapting our strategies to evolving market environment and believe that the fundamental emphasis on innovative companies will allow the investment performance to move ahead, notwithstanding a slowing economy and uncertain equity markets.
We thank our initial and newly joining investors for their confidence in the potential of this Fund. We view it as an early stage growth vehicle and are dedicating resources to bring it to the next level.
Sincerely,
Stephen A. Lieber
Samuel A. Lieber
Co-Portfolio Managers
The Fund may invest in smaller and medium size companies, which involve additional risks such as limited liquidity and greater volatility. The Fund may also invest in micro-cap company stocks which are more volatile than those of larger companies and tend to perform poorly during times of economic stress.
The Fund may invest in foreign securities which involve greater volatility and political, economic and currency risks and differences in accounting methods.
The Fund may invest in debt securities which typically decrease in value when interest rates rise. This risk is usually greater for longer-term debt securities.
The Fund portfolio will involve short positions, which involves unlimited risk including the possibility that losses may exceed the original amount invested. The fund may also use options and future contracts, which have risks associated with unlimited losses in the underlying holdings due to unanticipated market movements and failure to correctly predict the direction of securities prices, interest rates and currency exchange rates. However, a mutual fund investor’s risk is limited to one’s amount of investment in a mutual fund.
The S&P 500 Index is designed to measure performance of the broad domestic economy through changes in the aggregate market value of 500 stocks representing all major industries.
Please refer to the schedule of portfolio investments for fund holding information. Fund holdings and sector allocations are subject to change and should not be considered a recommendation to buy or sell any security.
18

Value of a $10,000 Investment
$11,000
Alpine Dynamic Transformations Fund
S&P 500 Index
$10,090
$10,000
$9,497
$9,000
$8,000
Dec 31
Jan 31
Feb 29
Mar 31
Apr 30
07
08
08
08
0
This chart represents a comparison of a hypothetical $10,000 investment in the Fund versus a similar investment in the Fund’s benchmark. The graph and the table do not reflect the deduction of taxes that a shareholder would pay on Fund distributions or the redemption of Fund shares. Investment performance reflects the waiver and recovery of certain fees. Without the waiver and recovery of fees, the Fund’s total return would have differed.
Performance data quoted represents past performance and is not predictive of future results. Investment return and principal value of the Fund fluctuate, so that the shares, when redeemed, may be worth more or less than their original cost. Performance current to the most recent month end may be lower or higher than performance quoted and may be obtained by calling 1-888-785-5578. Performance data shown does not reflect the 1.00% redemption fee imposed on shares held for fewer than 2 months. If it did, total returns would be reduced.
The S&P 500 Index is designed to measure performance of the broad domestic economy through changes in the aggregate market value of 500 stocks representing all major industries. The S&P 500 Index is unmanaged and does not reflect the deduction of fees associated with a mutual fund, such as investment adviser fees. The performance for the Dynamic Transformations Fund reflects the deduction of fees for these value-added services. Investors cannot directly invest in an index.
Comparative Annualized Returns as of 4/30/08 |
|
|
|
| Since Inception(1) |
Alpine Dynamic Transformations Fund |
| 0.90% |
S&P 500 Index |
| -5.03% |
(1) | Not annualized. |
To the extent that the Fund’s historical performance resulted from gains derived from participation in initial public offerings (“IPOs”), there is no guarantee that these results can be replicated in future periods or that the Fund will be able to participate to the same degree in IPO allocations in the future.
19
Alpine Dynamic Transformations Fund |
|
Portfolio Distributions* (Unaudited)
Information Technology 6.5% Industrials 26.8% Consumer Discretionary 20.3% Energy 12.3% Financials 14.4% Health Care 3.4% Materials 6.9% Cash & Cash Equivalents 9.4% |
| Top 10 Holdings* (Unaudited) | |||||
1. |
| Autoliv, Inc. |
| 11.36% |
| ||
2. |
| Tidewater, Inc. |
| 7.56% |
| ||
3. |
| BE Aerospace, Inc. |
| 6.55% |
| ||
4. |
| SLM Corp. |
| 6.45% |
| ||
5. |
| Ingersoll-Rand Co. |
| 6.18% |
| ||
6. |
| Fastenal Co. |
| 5.66% |
| ||
7. |
| Lincoln Electric Holdings, Inc. |
| 5.31% |
| ||
8. |
| Helix Energy Solutions Group, Inc. |
| 4.81% |
| ||
9. |
| Priceline.com, Inc. |
| 4.44% |
| ||
10. |
| JP Morgan Chase & Co. |
| 4.42% |
| ||
______________ * Portfolio holdings and sector distributions are as of 4/30/08 and are subject to change. Portfolio holdings are not recommendations to buy or sell any securities. Top 10 Holdings do not include short-term investments. Portfolio Distributions percentages are based on total investments and Top 10 Holdings percentages are based on total net assets. | |||||||
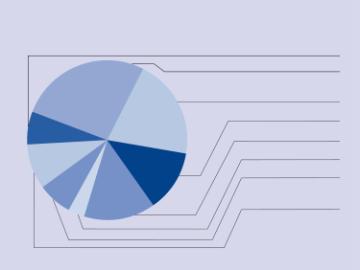
Commentary |
Dear Investor:
This is the first report of the Alpine Dynamic Transformations Fund, covering a period of just four months since its inception on December 31, 2007. For the four months ending April 30, 2008, the Fund produced a 0.90% gain in net asset value while the market as measured by the Standard & Poor’s 500 Index declined -5.03%.
The concept of Dynamic Transformations is to take advantage of investment growth opportunities with companies we feel are enhancing their basic position through transformational activity. This can include introductions of new products, eliminations of old or unprofitable products, development of new management strategies, hiring of new officers and many other forms of transforming a business. We think it is particularly relevant to initiate this strategy at a slowing or recessionary phase of the economy. Our reasoning is that pressures of a slowed, more competitive economy force managements to reexamine their positions and act to improve them.
To be very specific, we will illustrate with one holding in the portfolio, Starbucks Corp. Starbucks shares were bought at under half of their high price of 2007. Our motivation was that the company’s founder announced that he thought the company had lost its momentum and therefore decided to return from semi-retirement to active leadership. He indicated he looked forward to new policies, new products and more focused expansion
of company stores. We believe the prospects for his success are good, with the company’s unique national and growing international position in its specialty coffee shop structure. Another example of the transformational concept is in the shares of Abiomed Inc., a specialist manufacturer of heart assist devices. An early protagonist of the use of artificial hearts, the company expected to introduce a highly miniaturized heart assist device to be used in vascular surgery operations. Based on its successful introduction of this product in European markets, we anticipated that Food and Drug Administration approval may begin a program to achieve widespread use of the product and develop important earning power for the company.
Turning to quite a different concept, we bought the shares of well established industrial company, Ingersoll Rand, because of both a proposed division sale and acquisition. On the one hand, Ingersoll Rand was selling its highly successful golf cart business, and on the other hand acquiring Trane Company, a leading manufacturer of air conditioning and ventilating systems. Ingersoll Rand has expressed its desire to position itself as a major participant in the building environment market. This we believe is a significant growth transformation. In the financial field we would note JPMorganChase and Company, which we purchased after the shares had been highly depressed and when they made the decision to buy Bear Stearns and Company. We see this as a beginning of possibly a further enhancement of the JPMorganChase business, initiating moves which will
20
Alpine Dynamic Transformations Fund |
|
expand its coverage of the investment market opportunities.
In our opinion, each of the holdings in this Fund has a rationale recognizing a transformational development. Some will prove more successful than others, but in each case we believe it is demonstrable that the company is in the process of enhancing the basic opportunities for investors through these transformational moves. This will be the ongoing strategy of the Fund. It reflects the abilities and insights of our securities analysis research group and portfolio management capabilities. We will note, in closing, the transformational opportunity in our two largest holdings, Autoliv Inc. and Tidewater Inc. Autoliv is a Swedish-American company which has
pioneered in automotive safety equipment, seatbelts and airbags, and is now entering the era of night vision protective systems. Tidewater Inc. is an operator of service boats for the offshore oil drilling activity business, now entering a period of large scale expansion of its fleet.
We look forward to reporting to our investors on these and other transformative holdings as the Fund develops size and experience. We particularly appreciate those who joined us at the inception of this new Fund.
Sincerely,
Stephen A. Lieber
Samuel A. Lieber
Co-Portfolio Managers
______________
The Fund may invest in smaller and medium size companies, which involve additional risks such as limited liquidity and greater volatility. The Fund may also invest in micro-cap company stocks which are more volatile than those of larger companies and tend to perform poorly during times of economic stress.
The Fund may invest in foreign securities which involve greater volatility and political, economic and currency risks and differences in accounting methods. The Fund may invest in debt securities which typically decrease in value when interest rates rise. This risk is usually greater for longer-term debt securities.
Please refer to the schedule of portfolio investments for fund holding information. Fund holdings and sector allocations are subject to change and should not be considered a recommendation to buy or sell any security.
21
[THIS PAGE INTENTIONALLY LEFT BLANK]
FIXED INCOME MANAGER REPORTS

| Alpine Municipal Money Market Fund | |
| Alpine Ultra Short Tax Optimized Income Fund |
23

Alpine Municipal Money Market Fund vs. Peer Performance (Unaudited)
3.80
3.60
3.65%
3.40
3.39%
3.20
3.14%
3.14%
3.00
3.00%
2.80
2.60
2.76%
2.40
2.44%
2.20
2.18%
2.00
1.80
1.60
1.72%
1.40
1.20
1.19%
1.00
1.10%
0.80
0.93%
0.77%
0.60
0.56%
0.65%
0.40
0.45%
0.20
0.00
Calendar Year
Calendar Year
Calendar Year
Calendar Year
Calendar Year
2008 thru 4/30/2008
2003
2004*
2005
2006
2007**
PERIOD
Alpine Municipal Money Market Fund - Investor Class
Alpine Municipal Money Market Fund - Adviser Class
Lipper Tax-Exempt Money Market Funds Average
* | The Adviser Class return for 2004 is from 3/30/04 (inception)–12/31/04. |
** | The Adviser Class return for 2007 is from 1/01/07–12/05/07 (class ceased operations) |
The graph and the table do not reflect the deduction of taxes that a shareholder would pay on Fund distributions or the redemption of Fund shares. Investment performance reflects the waiver of certain fees. Without the waiver of fees, the Fund’s total return would have been lower.
Portfolio Distributions* (Unaudited) |
| Top 10 Holdings*(Unaudited) | ||||
Cash and Other Assets(1) 0.0% Put Bond 0.7% Municipal Bond 1.5% Variable Rate Demand Notes 97.8% (1) Less than 0.1% |
| 1. |
| Sunshine State Governmental Finance Commission, 6.732%, 5/01/2008 |
| 4.56% |
| 2. |
| DFA Municipal Trust Various States, 2.822%, 5/07/2008 |
| 4.38% | |
| 3. |
| Sunamerica Trust Variable Revenue Bonds, 2.673%, 5/07/2008 |
| 3.00% | |
| 4. |
| Port Corpus Christi Authority Nueces County Solid Waste Disposal, 3.092%, 5/07/2008 |
| 2.72% | |
| 5. |
| Kansas City Industrial Development Revenue, 6.083%, 5/07/2008 |
| 2.31% | |
| 6. |
| Clark County Passenger Facility Various Rate Revenue Refunding, 4.488%, 5/07/2008 |
| 2.28% | |
| 7. |
| Port Corpus Christi Authority Nueces County Solid Waste Disposal - Series A, 2.723%, 5/07/2008 |
| 2.03% | |
| 8. |
| Class B Revenue Bond Certificates -Series Trust 2004-1, 2.822%, 5/07/2008 |
| 1.97% | |
| 9. |
| Revenue Bond Certificate Series Trust Variable State Revenue Bonds, 2.673%, 5/07/2008 |
| 1.88% | |
| 10. |
| Public Facilities Authority Variable Revenue, Equipment & Cap Facilities, 2.723%, 5/07/2008 |
| 1.75% | |
| ______________ * Portfolio holdings and sector distributions are as of 4/30/08 and are subject to change. Portfolio holdings are not recommendations to buy or sell any securities. Portfolio Distributions percentages are based on total investments and Top 10 Holdings percentages are based on total net assets.
| |||||

24
Alpine Municipal Money Market Fund |
|
Comparative Annualized Returns as of 4/30/08 |
|
|
|
| |||
Joint Return |
| Single Return |
| Marginal |
| Your Tax-Exempt Effective Yield | |
$ 63,701 - 128,500 |
| $ 31,851 - 77,100 |
| 25% |
| 4.07% | |
$128,501 - 195,850 |
| $ 77,101 - 160,850 |
| 28% |
| 4.24% | |
$195,851 - 349,700 |
| $160,851 - 349,700 |
| 33% |
| 4.55% | |
Over $349,701 |
| Over $349,701 |
| 35% |
| 4.69% | |
The chart reflects projected 2007 marginal federal tax rates before limitations and phaseouts. Individuals with adjusted gross income in excess of $142,700 should consult a tax professional to determine their actual 2007 marginal tax rate.
Performance data quoted represents past performance and is not predictive of future results. Investment return and principal value of the Fund fluctuate, so that the shares, when redeemed, may be worth more or less than their original cost. Performance current to the most recent month end may be lower or higher than the performance quoted and may be obtained by calling 1-888-785-5578.
The Lipper Tax-Exempt Money Market Funds Average is an average of funds that invest in high quality municipal obligations with dollar-weighted average maturities of less than 90 days. The Lipper Tax-Exempt Money Market Funds Average is unmanaged and does not reflect the deduction of fees associated with a mutual fund, such as investment adviser fees. Lipper Rankings for the periods shown are based on Fund total returns with dividends and distributions reinvested and do not reflect sales charges. The performance for the Municipal Money Market Fund reflects the deduction of fees for these value-added services. Investors cannot directly invest in an index.
Comparative Annualized Returns as of 4/30/08 |
|
|
|
|
|
|
|
|
| ||
|
| 6 Months (1) |
| 1 Year |
| 3 Years |
| 5 Years |
| Since Inception |
|
Alpine Municipal Money Market |
| 1.50% |
| 3.39% |
| 3.27% |
| 2.47% |
| 2.38% |
|
Lipper Tax-Exempt Money Market Funds Average |
| 1.12% |
| 2.68% |
| 2.60% |
| 1.82% |
| 1.76% |
|
Lipper Tax-Exempt Money Market Fund |
| N/A |
| 1/109 |
| 1/94 |
| 1/85 |
| 1/80 |
|
Alpine Municipal Money Market Fund—Investor Class, 7-day effective yield (as of 4/30/08): 3.05% |
| ||||||||||
(1) | Not annualized. FINRA does not recognize rankings for less than one year. |
25
Alpine Ultra Short Tax Optimized Income Fund |
|

Alpine Ultra Short Tax Optimized Income Fund vs. Peer Performance (Unaudited)
4.50
4.26%
4.00
4.08%
4.14%
4.01%
3.87%
3.50
3.27%
3.00
3.11%
2.50
2.21%
2.00
2.15%
2.05%
1.74%
1.50
1.42%
1.00
1.02%
0.96%
0.79%
0.75%
0.50
0.59%
0.00
Calendar Year
Calendar Year
Calendar Year
Calendar Year
Calendar Year
2008 thru 4/30/2008
2003
2004*
2005
2006
2007
Alpine Ultra Short Tax Optimized Income Fund - Investor Class
Alpine Ultra Short Tax Optimized Income Fund - Adviser Class
Lipper Short Municipal Debt Funds Average
* The Adviser Class return for 2004 is from 3/30/04 (inception)–12/31/04.
The graph and the table do not reflect the deduction of taxes that a shareholder would pay on Fund distributions or the redemption of Fund shares. Investment performance reflects the waiver of certain fees. Without the waiver of fees, the Fund’s total return would have been lower.
Performance data quoted represents past performance and is not predictive of future results. Investment return and principal value of the Fund fluctuate, so that the shares, when redeemed, may be worth more or less than their original cost. Performance current to the most recent month end may be lower or higher than performance quoted and may be obtained by calling 1-888-785-5578. Performance data shown does not reflect the 0.25% redemption fee imposed on shares held for fewer than one month. If it did, total returns would be reduced. Effective 10/12/07, Alpine Ultra Short Tax Optimized Fund Adviser Class began imposing a maximum sales charge of 0.50% on purchases. Performance data shown for time period beginning with dates after 10/12/07 reflect the sales charge.
The Lehman Brothers Municipal 1 Year Bond Index is the 1-year (1-2) component of the Municipal Bond Index. The Lehman Brothers Municipal Bond Index is a rules-based, market-value weighted index engineered for the long-term, tax-exempt bond market. Lipper Short Municipal Debt Funds Average is an unmanaged index that tracks funds that invest in municipal debt issues with dollar-weighted average maturities of less than three years. Lipper Rankings for the periods shown are based on Fund total returns with dividends and distributions reinvested and do not reflect sales charges. The Lehman Brothers Municipal 1 Year Bond Index and the Lipper Short Municipal Debt Funds Average are unmanaged and do not reflect the deduction of fees associated with a mutual fund, such as investment adviser fees. The performance for the Ultra Short Tax Optimized Income Fund reflects the deduction of fees for these value-added services. Investors cannot directly invest in an index.
Comparative Annualized Returns as of 4/30/08 | |||||||||||||||||||||
|
| 6 Months (1) |
| 1 Year |
| 3 Years |
| 5 Years |
| Since |
| ||||||||||
Alpine Ultra Short Tax Optimized Income Fund—Investor Class |
|
| 1.71% |
|
|
| 3.75% |
|
|
| 3.62% |
|
|
| 3.12% |
|
|
| 3.32% |
|
|
Alpine Ultra Short Tax Optimized Income Fund—Investor Class |
|
| 1.59% |
|
|
| 3.39% |
|
|
| 3.28% |
|
|
| 2.72% |
|
|
| 2.92% |
|
|
Alpine Ultra Short Tax Optimized Income Fund—Investor Class |
|
| 1.70% |
|
|
| 3.53% |
|
|
| 3.30% |
|
|
| 2.76% |
|
|
| 2.92% |
|
|
Alpine Ultra Short Tax Optimized Income Fund—Adviser Class |
|
| 1.49% |
|
|
| 3.49% |
|
|
| 3.49% |
|
|
| N/A% |
|
|
| 2.80% |
|
|
Alpine Ultra Short Optimized Income Fund—Adviser Class |
|
| 1.27% |
|
|
| 3.04% |
|
|
| 3.15% |
|
|
| N/A |
|
|
| 2.43% |
|
|
Alpine Ultra Short Tax Optimized Income Fund—Adviser Class |
|
| 1.41% |
|
|
| 3.18% |
|
|
| 3.15% |
|
|
| N/A |
|
|
| 2.50% |
|
|
Lehman Brothers Municipal 1 Year Bond Index |
|
| 2.78% |
|
|
| 5.01% |
|
|
| 3.55% |
|
|
| 2.59% |
|
|
| 2.60% |
|
|
Lipper Short Municipal Debt Funds Average |
|
| 1.34% |
|
|
| 2.89% |
|
|
| 2.74% |
|
|
| 2.14% |
|
|
| 2.20% |
|
|
Lipper Short Municipal Debt Fund Rank—Investor Class |
|
| N/A |
|
|
| 25/59 |
|
|
| 2/54 |
|
|
| 2/48 |
|
|
| 2/43 |
|
|
(1) | Not annualized. FINRA does not recognize rankings for less than one year. |
(2) | Adviser Class shares commenced on March 30, 2004 and Investor shares commenced on December 5, 2002. Returns for indices are since December 5, 2002. |
26
|
|
| ||||
Portfolio Distributions* (Unaudited) |
| Top 10 Holdings* (Unaudited) | ||||
|
| 1. |
| West Virginia State Hospital Financial |
| 4.32% |
Put Bond 11.3% Cash/Cash Equivalents 0.1% Auction Rate Notes 8.0% Variable Rate General Market Note 4.8% Municipal Bond 5.9% |
| 2. |
| Vallejo Certicficates Participation, |
| 4.21% |
3. |
| Lebanon County Health Facilities |
| 4.11% | ||
4. |
| Pennsylvania Economic Development |
| 3.76% | ||
5. |
| Franklin County Ohio Hospital Revenue, |
| 3.96% | ||
6. |
| Gulf Coast Industrial Development |
| 3.96% | ||
7. |
| Scottsdale Industrial Development |
| 3.96% | ||
8. |
| Dallas Fort Worth International |
| 3.75% | ||
9. |
| Lehigh County General Purpose |
| 3.60% | ||
10. |
| Shelby County Tennessee Health |
| 3.46% | ||
______________ | ||||||
* Portfolio holdings and sector distributions are as of 4/30/08 and are subject to change. Portfolio holdings are not recommendations to buy or sell any securities. Portfolio Distributions percentages are based on total investments and Top 10 Holdings percentages are based on total net assets. | ||||||
|
|
|
|
|
|
|

Alpine Municipal Money Market Fund / Alpine Ultra Short Tax Optimized Income Fund—Commentary |
We are pleased to bring you the semi-annual report for the Alpine Income Trust for the period ending April 30, 2008. The Income Trust includes both the Alpine Ultra Short Tax Optimized Income Fund and the Alpine Municipal Money Market Fund.
Performance Summary
We are pleased to report that for the six-month period, both funds continued to produce returns that far outpace the average of its counterparts in their respected categories. According to Lipper Analytical Services, the total return for the Alpine Ultra Short Tax Optimized Income Fund was 1.71% and 1.50% for the Alpine Municipal Money Market Fund. The Lipper average was 1.34% and 1.12% for the Short Municipal Debt Funds and Tax Exempt Money Market Funds Peers Group.
Market Overview
The past six months proved to be one of the more challenging periods for fixed-income investors in recent memory as economic growth slowed dramatically during the first half of our fiscal year. With the housing market continuing to deteriorate, the manufacturing and services sectors beginning to show signs of contraction, inflation pushing higher, and recent job growth sluggish, it appears that the economy may be teetering on the edge of a recession.
As subprime mortgage losses mounted in the last six months and banks significantly curtailed their lending
activities in an attempt to avoid additional losses, the Federal Reserve took several actions to encourage lending, increase liquidity, and keep credit market turmoil from toppling the economy. Perhaps the most far-reaching of these actions was a substantial, multistep reduction in the fed funds target rate—an interbank lending rate that banks use as a benchmark for their prime lending rates to customers—from 4.50% to 2.00%. Presently, with inflation currently higher than monetary officials would prefer, the central bank might be forced into a position of raising rates should commodity prices continue to soar.
New municipal issuance in 2007 reached a record $427 billion, according to The Bond Buyer, eclipsing the previous record of $408 billion in 2005. While demand from retail investors has been strong given the adjustment in tax-free interest rates, overall demand from nontraditional investors, such as hedge funds and foreign entities, has slowed down, which contributed to municipal market weakness. Although conventional new supply is down thus far this year, there has been an increase in secondary supply—stemming in part from the unwinding of structured transactions that create floating-rate securities from pools of long-term municipal bonds.
The failure of the auction-rate securities (ARS) in February is a relatively new concern for municipal investors. ARS typically have long-term maturities, but because they are structured with interest rates that are reset every seven, 28, or 35 days through an auction
27
Alpine Ultra Short Tax Optimized Income Fund |
|
process, many have invested in these securities with the view that they could be treated as cash equivalents. Auctions have been failing because broker-dealers who typically support this market are either unable or unwilling to do so in the current environment. At this time, we believe that failures within the ARS market represent a liquidity issue, rather than a credit issue, and that the short-term credit implications for ARS will be contained. However, we are of the opinion that an extended dislocation or a permanent end to this market in conjunction with the inability of certain ARS issuers to refinance their debts could have a material impact on certain ARS issuers, particularly those with weaker financial situations.
Yet another factor affecting the municipal market is the lingering uncertainty regarding monoline insurers that guarantee the timely repayment of bond principal and interest when an issuer defaults. Monoline insurers, which insure about half of the $2.5 trillion municipal bond market and are typically AAA rated by the major credit rating agencies, have come under substantial pressure due to apparently high exposure to structured financial products that house significant subprime mortgage risk. Downgrades of monoline insurance companies could compromise the related guarantees that they provide to a large portion of the municipal market and theref[ore lead to subsequent downgrades of the bonds they insure. On a positive note, we have recently seen new companies with the highest ratings either entering or about to enter the municipal insurance business as the fundamentals for insuring municipal securities has been historically very strong.
Although we realize this negative environment may linger, we have a positive long-term outlook for the municipal asset class. We feel current valuations across all maturities, as compared to Treasury yields present an attractive option for taxable investors in any tax bracket. Furthermore, it appears that many of the concerns regarding the financial health of monoline insurers seem to already have been discounted by the municipal bond market.
Alpine Ultra Short Tax Optimized Income Fund
During the past six months, we maintained the same strategy that we had adopted in the fall of 2007. Our goal was to keep the portfolio’s duration, a measure of a fund’s sensitivity to interest rates, shorter than that of the benchmark. We maintained this strategy as the fixed income markets were experiencing an unusually turbulent environment and preservation of capital was a top priority. Furthermore, we remained committed to purchasing only tax exempt securities as they continued to provide the highest after-tax yields among the different fixed income products.
Most of our new investments were in fairly high-quality variable rate demand notes (VRDN’s) as our goal was to
maintain an attractive income stream and avoid credit-quality risk. This is the first time since the fund started that we have had such a large concentration in VRDN’s and this has dramatically changed the composition of the portfolio. While there were a few bumps in the road, i.e. February, when rates on these securities were abnormally low in yield, we believe this group of securities has for the most part provided the fund with a greater income stream and more stability than if we invested in longer maturities in the one to five-year part of the yield curve. Furthermore, we now have greater flexibility to take advantage of new opportunities should rates increase later in the year.
Other purchases that were made late in the reporting period included investments in select seven-day auction rate securities. While we talked briefly about the turmoil in the ARS market earlier in the report, our investments were only in high quality securities that were functioning in an orderly manner. This is due to not only the quality of the security but more importantly the high maximum rate that the security would pay should the auction fail to attract enough bidders. While this select group of securities has provided the fund with an attractive return, they have also had a recent resurgence of demand and the yields have fallen several hundred basis points in some cases. As a result, we will continue to monitor this market closely and make any adjustments should this class of securities prove to be expensive.
We rounded out the above mentioned purchases with select investments in one and two-year put bonds. We believe these fixed rate securities should provide a balance to our large position of VRDN’s.
Although we mentioned this in our last report, we would like to once again reiterate that although the fund can invest a portion of its assets in taxable securities, it has never held an asset backed, mortgage backed security or structured investment vehicle. These securities have never met the objective of the fund.
Alpine Municipal Money Market Fund
As expected, tax-exempt money market yields declined along with the federal funds rate although not as much. In addition, a record level of assets flowed into municipal money market funds from risk-adverse investors. For the most part, rising demand was met with ample supply, as investment banks continued to create a substantial volume of short-term variable rate demand notes and tender option bonds. Consequently, yields of floating rate instruments were higher at times than those of longer dated municipal notes.
As experienced in the taxable money market during the fall, the municipal money market suffered similar dislocations, with investors quickly moving away from tainted monoline-insured debt in favor of investments
28
Alpine Ultra Short Tax Optimized Income Fund |
|
deemed less prone to ratings downgrades. We maintained our strategy of overweighting the portfolio in variable rate demand notes while keeping our average weighted maturity between eight and ten days. We also reduced our exposure to insured bonds and instead looked for investments with a bank letter of credit as credit support. In our opinion this strategy proved to be very rewarding during most of our reporting period except for several weeks in February where short-term rates dropped unexpectedly due to a supply and demand imbalance.
At this time we do not anticipate altering our investment strategy as we want to maintain a higher than normal amount of liquidity in the fund. With some states beginning to experience renewed budget pressures as a result of a weak housing market, we will continue to purchase credit enhanced paper and reduce our exposure to the monoline insurance companies as necessary.
Outlook
Since last October, the Federal Reserve has slashed the fed funds target rate and introduced a series of measures to prevent ongoing financial market disruptions from spilling over into the broader economy. Nevertheless, the housing sector continues to weaken and commodity prices continue to rise creating an uncomfortable environment for the Federal Reserve.
Looking ahead, we will focus our attention on both the direction of interest rates and the credit markets and look to identify the best opportunities to invest in securities with an attractive yield and a good risk/reward tradeoff. Before investing, we will continue to evaluate the fundamental merits of each security under consideration.
Steven C. Shachat
Portfolio Manager
______________
An investment in the Alpine Municipal Money Market Fund is neither insured nor guaranteed by the Federal Deposit Insurance Corporation or any other government agency. Although the Funds seek to preserve the value of your investment at $1.00 per share, it is possible to lose money by investing in the Fund.
Investing in these funds involves special risks, including but not limited to, investing in municipal obligations and derivative securities, mortgage-related and asset-backed investments. Please refer to the prospectus for further details. Investments in debt securities typically decrease in value when interest rates rise. This risk is usually greater for longer-term debt securities. Income from tax-exempt funds may be subject to state and local taxes and a portion of income may be subject to the federal alternative minimum tax for certain investors.
Please refer to the schedule of portfolio investments for fund holding information. Fund holdings and sector allocations are subject to change and should not be considered a recommendation to buy or sell any security.
Lipper Analytical Services, Inc, is an independent mutual fund research and rating service. Each Lipper average represents a universe of Funds with similar invest objectives. Rankings for the periods shown include dividends and distributions reinvested and do not reflect sales charges.
The federal government guarantees interest payments from government securities, such as U.S. Treasury bills, while dividend payments carry no such guarantee. Government securities, if held to maturity, guarantee the timely payment of principal and interest.
29
Alpine Dynamic Balance Fund |
|
Schedule of Portfolio Investments
April 30, 2008 (Unaudited)
Shares |
| Security |
| Value |
| |
|
|
| ||||
Common Stocks—74.5% |
|
|
|
| ||
Agricultural/Chemicals—1.7% |
|
|
|
| ||
11,000 |
| Mosaic Co. (a) |
| $ | 1,347,610 |
|
|
|
|
|
| ||
Commercial Products & Services—14.7% |
|
|
|
| ||
30,000 |
| AMETEK, Inc. |
|
| 1,455,600 |
|
30,500 |
| Autoliv, Inc. |
|
| 1,867,820 |
|
25,000 |
| Black & Decker Corp. |
|
| 1,640,750 |
|
10,000 |
| Caterpillar, Inc. |
|
| 818,800 |
|
59,199 |
| Eagle Materials, Inc. |
|
| 2,147,740 |
|
14,800 |
| Lincoln Electric Holdings, Inc. |
|
| 1,129,240 |
|
32,500 |
| McGrath Rentcorp |
|
| 839,475 |
|
12,000 |
| PACCAR Inc. |
|
| 567,840 |
|
15,000 |
| WESCO International, Inc. (a) |
|
| 558,150 |
|
8,000 |
| Whirlpool Corp. |
|
| 582,240 |
|
|
|
|
|
| ||
|
|
|
|
| 11,607,655 |
|
|
|
|
|
| ||
Commercial Services & Supplies—1.3% |
|
|
|
| ||
15,000 |
| Manpower, Inc. |
|
| 1,006,950 |
|
|
|
|
|
| ||
Construction Residential—1.7% |
|
|
|
| ||
20,000 |
| Hovnanian Enterprises, Inc.— Class A (a) |
|
| 236,400 |
|
28,000 |
| Lennar Corp.—Class A |
|
| 515,760 |
|
30,000 |
| Pulte Homes, Inc. |
|
| 391,200 |
|
47,400 |
| Standard Pacific Corp. |
|
| 239,844 |
|
|
|
|
|
| ||
|
|
|
|
| 1,383,204 |
|
|
|
|
|
| ||
Consumer Products & Services—2.2% |
|
|
|
| ||
49,700 |
| Darden Restaurants, Inc. |
|
| 1,768,326 |
|
|
|
|
|
| ||
Energy Equipment & Services—0.5% |
|
|
|
| ||
3,000 |
| Diamond Offshore Drilling, Inc. |
|
| 376,230 |
|
|
|
|
|
| ||
Energy Production & Equipment—8.8% |
|
|
|
| ||
5,000 |
| Chevron Corp. |
|
| 480,750 |
|
54,000 |
| CONSOL Energy, Inc. |
|
| 4,371,840 |
|
10,000 |
| Hess Corp. |
|
| 1,062,000 |
|
20,000 |
| Penn Virginia Corp. |
|
| 1,050,000 |
|
|
|
|
|
| ||
|
|
|
|
| 6,964,590 |
|
|
|
|
|
| ||
Finance/Banks—8.5% |
|
|
|
| ||
18,000 |
| Bancorp Rhode Island, Inc. |
|
| 603,180 |
|
43,041 |
| Bank of America Corp. |
|
| 1,615,759 |
|
6,000 |
| Bank of Florida Corp. (a) |
|
| 66,540 |
|
2,250 |
| Doral Financial Corp. (a) |
|
| 40,095 |
|
24,300 |
| IndyMac Bancorp, Inc. |
|
| 78,975 |
|
40,000 |
| JP Morgan Chase & Co. |
|
| 1,906,000 |
|
31,500 |
| New York Community Bancorp, Inc. |
|
| 588,105 |
|
6,798 |
| Southside Bancshares, Inc. |
|
| 164,036 |
|
39,900 |
| Wachovia Corp. |
|
| 1,163,085 |
|
17,500 |
| Webster Financial Corp. |
|
| 455,875 |
|
|
|
|
|
| ||
|
|
|
|
| 6,681,650 |
|
|
|
|
|
| ||
Financial Services—6.5% |
|
|
|
| ||
30,000 |
| Ambac Financial Group, Inc. |
|
| 138,900 |
|
71,200 |
| Fannie Mae |
|
| 2,014,960 |
|
12,227 |
| Fidelity National Title Group, Inc.—Class A |
|
| 195,510 |
|
9,000 |
| The Goldman Sachs Group, Inc. |
|
| 1,722,330 |
|
55,000 |
| Impac Mortgage Holdings, Inc. (a) |
|
| 64,900 |
|
23,100 |
| MBIA, Inc. |
|
| 240,240 |
|
5,800 |
| The Student Loan Corp. |
|
| 737,644 |
|
|
|
|
|
| ||
|
|
|
|
| 5,114,484 |
|
|
|
|
|
| ||
Health Care Providers & Services—0.9% |
|
|
|
| ||
11,000 |
| Pediatrix Medical Group, Inc. (a) |
|
| 748,220 |
|
|
|
|
|
| ||
Shares |
| Security |
| Value |
| |
|
|
| ||||
Common Stocks—continued |
|
|
|
| ||
Household Durables—0.1% |
|
|
|
| ||
1,000 |
| Mohawk Industries, Inc. (a) |
| $ | 76,190 |
|
|
|
|
|
| ||
Industrial Conglomerates—4.9% |
|
|
|
| ||
10,000 |
| 3M Co. |
|
| 769,000 |
|
59,600 |
| General Electric Co. |
|
| 1,948,920 |
|
15,000 |
| Honeywell International, Inc. |
|
| 891,000 |
|
25,300 |
| Temple-Inland, Inc. |
|
| 295,251 |
|
|
|
|
|
| ||
|
|
|
|
| 3,904,171 |
|
|
|
|
|
| ||
Information Technology—0.2% |
|
|
|
| ||
5,374 |
| Fidelity National Information Services, Inc. |
|
| 193,786 |
|
|
|
|
|
|
| |
|
|
|
|
| ||
Machinery—0.4% |
|
|
|
| ||
8,000 |
| Ingersoll-Rand Co. |
|
| 355,040 |
|
|
|
|
|
| ||
Media—0.8% |
|
|
|
| ||
15,000 |
| The McGraw-Hill Companies, Inc. |
|
| 614,850 |
|
|
|
|
|
| ||
Pharmaceuticals—2.3% |
|
|
|
| ||
27,000 |
| Johnson & Johnson |
|
| 1,811,430 |
|
|
|
|
|
| ||
Real Estate Investment Trusts—10.1% |
|
|
|
| ||
23,200 |
| Boston Properties, Inc. |
|
| 2,331,368 |
|
29,100 |
| Developers Diversified Realty Corp. |
|
| 1,249,845 |
|
45,000 |
| DiamondRock Hospitality Co. |
|
| 573,750 |
|
10,000 |
| Mack-Cali Realty Corp. |
|
| 390,200 |
|
21,700 |
| Simon Property Group, Inc. |
|
| 2,166,962 |
|
68,600 |
| Sunstone Hotel Investors, Inc. |
|
| 1,281,448 |
|
|
|
|
|
| ||
|
|
|
|
| 7,993,573 |
|
|
|
|
|
| ||
Real Estate Management & Development—0.3% |
|
|
|
| ||
8,433 |
| Forestar Real Estate Group, Inc. (a) |
|
| 209,982 |
|
|
|
|
|
| ||
Retail—1.8% |
|
|
|
| ||
25,000 |
| J.C. Penney Company, Inc. |
|
| 1,062,500 |
|
10,000 |
| Walgreen Co. |
|
| 348,500 |
|
|
|
|
|
| ||
|
|
|
|
| 1,411,000 |
|
|
|
|
|
| ||
Retailing—2.0% |
|
|
|
| ||
40,000 |
| CVS Corp. |
|
| 1,614,800 |
|
|
|
|
|
| ||
Thrifts & Mortgage Finance—0.1% |
|
|
|
| ||
8,433 |
| Guaranty Financial Group, Inc. (a) |
|
| 64,512 |
|
|
|
|
|
| ||
Utilities—4.7% |
|
|
|
| ||
51,000 |
| Allegheny Energy, Inc. |
|
| 2,743,800 |
|
31,200 |
| SJW Corp. |
|
| 938,184 |
|
|
|
|
|
| ||
|
|
|
|
| 3,681,984 |
|
|
|
|
|
| ||
|
| Total Common Stocks |
|
| 58,930,237 |
|
|
|
|
|
| ||
Principal |
|
|
|
|
|
| |
|
|
|
|
|
| ||
Bonds and Notes—24.3% |
|
|
|
| |||
U.S. Treasury Bonds—21.6% |
|
|
|
| |||
$ | 2,000,000 |
| 6.250%, 08/15/2023 |
|
| 2,407,658 |
|
| 5,000,000 |
| 6.000%, 02/15/2026 |
|
| 5,908,205 |
|
| 8,000,000 |
| 5.250%, 11/15/2028 |
|
| 8,776,256 |
|
|
|
|
|
|
| ||
|
|
|
|
|
| 17,092,119 |
|
|
|
|
|
|
| ||
U.S. Treasury Note—2.7% |
|
|
|
| |||
| 2,000,000 |
| 5.000%, 08/15/2011 |
|
| 2,155,314 |
|
|
|
|
|
|
| ||
|
|
| Total Bonds and Notes |
|
| 19,247,433 |
|
|
|
|
|
|
| ||
The accompanying notes are an integral part of the financial statements.
30
Alpine Dynamic Balance Fund |
|
Schedule of Portfolio Investments—Continued
April 30, 2008 (Unaudited)
Contracts |
| Security |
| Value |
| |
|
|
| ||||
Purchased Put Options—0.2% |
|
|
|
| ||
200 |
| Bank of America Corp. |
| $ | 31,000 |
|
200 |
| General Electric Co. |
|
| 47,400 |
|
100 |
| 3M Co. |
|
| 38,000 |
|
|
|
|
| |||
|
| Total Purchased Put Options |
|
| 116,400 |
|
|
|
|
| |||
Short-Term Investments—0.8% |
|
|
|
| ||
648,446 |
| Fidelity Institutional Government Portfolio |
|
| 648,446 |
|
|
|
|
| |||
|
| Total Short-Term Investments |
|
| 648,446 |
|
|
|
|
| |||
|
| Total Investments |
|
| 78,942,516 |
|
|
| Other Assets in Excess of Liabilities—0.2% |
|
| 134,745 |
|
|
|
|
| |||
|
| TOTAL NET ASSETS—100.0% |
| $ | 79,077,261 |
|
|
|
|
| |||
Schedule of Options Written
April 30, 2008 (Unaudited)
Contracts |
|
|
|
Value |
| |
|
|
| ||||
Call Options |
|
|
|
|
|
|
200 |
| Bank of America Corporation |
| $ | 19,200 |
|
82 |
| Boston Properties, Inc. |
|
| 149,240 |
|
191 |
| Developers Diversified Reality Co. |
|
| 159,485 |
|
297 |
| Darden Restaurants, Inc. |
|
| 403,920 |
|
87 |
| Simon Property Group, Inc. |
|
| 185,745 |
|
|
|
|
| |||
|
|
|
|
| 917,590 |
|
|
|
|
| |||
|
| Total Options Written |
| $ | 917,590 |
|
|
|
|
| |||
Percentages are stated as a percent of net assets.
ADR—American Depository Receipt
(a) Non Income Producing
The accompanying notes are an integral part of the financial statements.
31
Alpine Dynamic Dividend Fund |
|
Schedule of Portfolio Investments
April 30, 2008 (Unaudited)
Shares |
| Security Description |
| Value |
| |
|
|
| ||||
Common Stocks—90.5% |
|
|
|
| ||
Aerospace & Defense—3.4% |
|
|
|
| ||
225,000 |
| Honeywell International, Inc. |
| $ | 13,365,000 |
|
50,000 |
| Lockheed Martin Corporation |
|
| 5,302,000 |
|
410,000 |
| Raytheon Co. |
|
| 26,227,700 |
|
|
|
|
|
| ||
|
|
|
|
| 44,894,700 |
|
|
|
|
|
| ||
Building Products—0.3% |
|
|
|
| ||
124,000 |
| Armstrong World Industries Inc. (a) |
|
| 4,413,160 |
|
|
|
|
|
| ||
Capital Goods—1.4% |
|
|
|
| ||
1,055,100 |
| Aircastle Ltd |
|
| 14,750,298 |
|
50,000 |
| United Technologies Corp. |
|
| 3,623,500 |
|
|
|
|
|
| ||
|
|
|
|
| 18,373,798 |
|
|
|
|
|
| ||
Capital Markets—2.6% |
|
|
|
| ||
3,700,000 |
| Acta Holding ASA |
|
| 13,377,742 |
|
840,000 |
| Blackstone Group LP |
|
| 15,682,800 |
|
331,500 |
| Fortress Investment Group LLC |
|
| 4,839,900 |
|
|
|
|
|
| ||
|
|
|
|
| 33,900,442 |
|
|
|
|
|
| ||
Chemicals—0.7% |
|
|
|
| ||
85,000 |
| Monsanto Company |
|
| 9,691,700 |
|
|
|
|
|
| ||
Commercial Services & Supplies—1.2% |
|
|
|
| ||
1,052,870 |
| Healthcare Services Group, Inc. |
|
| 16,066,796 |
|
|
|
|
|
| ||
Construction & Engineering—0.9% |
|
|
|
| ||
223,400 |
| Chicago Bridge & Iron Co. N.V. |
|
| 8,900,256 |
|
48,957 |
| Outotec Oyj (a) |
|
| 3,072,282 |
|
|
|
|
|
| ||
|
|
|
|
| 11,972,538 |
|
|
|
|
|
| ||
Consumer Durables & Apparel—0.2% |
|
|
|
| ||
34,629 |
| VF Corp. |
|
| 2,575,705 |
|
|
|
|
|
| ||
Consumer Services—0.9% |
|
|
|
| ||
434,425 |
| Unibet Group PLC—SDR |
|
| 11,972,828 |
|
|
|
|
|
| ||
Diversified Financials—3.0% |
|
|
|
| ||
2,965,000 |
| ABG Sundal Collier ASA |
|
| 4,713,424 |
|
1,100,000 |
| Absolute Capital Management Holdings (a) |
|
| 787,370 |
|
36,600 |
| Alliancebernstein Holding LP |
|
| 2,269,932 |
|
1,300,000 |
| Anglo Irish Bank Corp PLC (a) |
|
| 18,268,976 |
|
80,000 |
| JP Morgan Chase & Co. |
|
| 3,812,000 |
|
200,000 |
| Morgan Stanley |
|
| 9,720,000 |
|
|
|
|
|
| ||
|
|
|
|
| 39,571,702 |
|
|
|
|
|
| ||
Diversified Telecommunication Services—6.3% |
|
|
|
| ||
500,000 |
| Deutsche Telekom AG |
|
| 9,009,572 |
|
770,000 |
| Elisa Corporation |
|
| 17,385,507 |
|
750,000 |
| France Telecom SA |
|
| 23,609,137 |
|
1,480,000 |
| Tele2 AB |
|
| 33,002,054 |
|
|
|
|
|
| ||
|
|
|
|
| 83,006,270 |
|
|
|
|
|
| ||
Electric Utilities—0.3% |
|
|
|
| ||
100,000 |
| PG&E Corp. |
|
| 4,000,000 |
|
|
|
|
|
| ||
Energy—2.5% |
|
|
|
| ||
900,000 |
| Statoil Hydro ASA |
|
| 32,628,880 |
|
|
|
|
|
| ||
Energy Equipment & Services—4.9% |
|
|
|
| ||
210,700 |
| Diamond Offshore Drilling, Inc. |
|
| 26,423,887 |
|
244,000 |
| Fred Olsen Energy |
|
| 15,510,557 |
|
827,200 |
| Prosafe ASA |
|
| 14,385,239 |
|
80,000 |
| Schlumberger Ltd. |
|
| 8,044,000 |
|
|
|
|
|
| ||
|
|
|
|
| 64,363,683 |
|
|
|
|
|
| ||
Shares |
| Security Description |
| Value |
| |
|
|
| ||||
Common Stocks—continued |
|
|
|
| ||
Financial Services—0.5% |
|
|
|
| ||
250,000 |
| Fannie Mae |
| $ | 7,075,000 |
|
|
|
|
|
| ||
Food & Beverages—0.5% |
|
|
|
| ||
130,000 |
| H.J. Heinz Company |
|
| 6,113,900 |
|
|
|
|
|
| ||
Food & Staples Retailing—0.6% |
|
|
|
| ||
367,500 |
| Altria Group, Inc. |
|
| 7,350,000 |
|
|
|
|
|
| ||
Food Products—3.5% |
|
|
|
| ||
1,398,600 |
| B & G Foods Inc. |
|
| 11,300,688 |
|
500,000 |
| ConAgra Foods, Inc. |
|
| 11,780,000 |
|
6,500,000 |
| Parmalat Spa |
|
| 22,303,374 |
|
|
|
|
|
| ||
|
|
|
|
| 45,384,062 |
|
|
|
|
|
| ||
Food, Beverage, and Tobacco—2.1% |
|
|
|
| ||
411,000 |
| PepsiCo, Inc. |
|
| 28,165,830 |
|
|
|
|
|
| ||
Health Care Equipment & Services—1.1% |
|
|
|
| ||
514,125 |
| Meridian Bioscience, Inc. |
|
| 13,845,386 |
|
|
|
|
|
| ||
Health Care Providers & Services—1.4% |
|
|
|
| ||
727,000 |
| Brookdale Senior Living, Inc. |
|
| 19,032,860 |
|
|
|
|
|
| ||
Hotels Restaurants & Leisure—1.6% |
|
|
|
| ||
500,000 |
| Burger King Holdings, Inc. |
|
| 13,950,000 |
|
128,000 |
| McDonald’s Corp. |
|
| 7,626,240 |
|
|
|
|
|
| ||
|
|
|
|
| 21,576,240 |
|
|
|
|
|
| ||
Household & Personal Products—2.0% |
|
|
|
| ||
400,000 |
| The Procter & Gamble Co. |
|
| 26,820,000 |
|
|
|
|
|
| ||
Household Durables—0.4% |
|
|
|
| ||
1,025,973 |
| AGA Rangemaster Group PLC |
|
| 5,813,861 |
|
|
|
|
|
| ||
Industrial Conglomerates—0.7% |
|
|
|
| ||
4,777,209 |
| Pirelli & Co. |
|
| 3,916,173 |
|
82,000 |
| Textron, Inc. |
|
| 5,002,820 |
|
|
|
|
|
| ||
|
|
|
|
| 8,918,993 |
|
|
|
|
|
| ||
Insurance—4.7% |
|
|
|
| ||
321,300 |
| Principal Financial Group, Inc. |
|
| 17,240,958 |
|
933,000 |
| Sampo Oyj |
|
| 26,441,532 |
|
5,228,487 |
| Unipol Gruppo Finanziaro S.P.A. |
|
| 17,164,864 |
|
|
|
|
|
| ||
|
|
|
|
| 60,847,354 |
|
|
|
|
|
| ||
Machinery—7.2% |
|
|
|
| ||
578,275 |
| Metso Corporation |
|
| 25,101,955 |
|
1,270,700 |
| Scania AB—B Shares |
|
| 26,159,411 |
|
1,290,000 |
| SKF AB—B Shares |
|
| 23,701,749 |
|
750,000 |
| Volvo AB—B Shares |
|
| 11,462,526 |
|
113,000 |
| Wartsila Oyj—Class B |
|
| 7,763,534 |
|
|
|
|
|
| ||
|
|
|
|
| 94,189,175 |
|
|
|
|
|
| ||
Marine—4.1% |
|
|
|
| ||
604,350 |
| Diana Shipping, Inc. |
|
| 18,348,066 |
|
122,000 |
| Eagle Bulk Shipping, Inc. |
|
| 3,590,460 |
|
680,000 |
| Freeseas, Inc. |
|
| 4,671,600 |
|
396,800 |
| Genco Shipping & Trading Ltd. |
|
| 26,843,520 |
|
|
|
|
|
| ||
|
|
|
|
| 53,453,646 |
|
|
|
|
|
| ||
Media—9.4% |
|
|
|
| ||
2,634,778 |
| Eniro AB |
|
| 17,251,549 |
|
1,900,400 |
| Gatehouse Media, Inc. |
|
| 10,072,120 |
|
655,800 |
| National Cinemedia, Inc. |
|
| 12,565,128 |
|
1,207,905 |
| PagesJaunes SA |
|
| 24,236,184 |
|
1,393,700 |
| Regal Entertainment Group—Class A |
|
| 26,373,252 |
|
The accompanying notes are an integral part of the financial statements.
32
Alpine Dynamic Dividend Fund |
|
Schedule of Portfolio Investments—Continued
April 30, 2008 (Unaudited)
Shares |
| Security Description |
| Value |
| |
|
|
| ||||
Common Stocks—continued |
|
|
|
| ||
Media—continued |
|
|
|
| ||
600,000 |
| Sinclair Broadcast Group, Inc. |
| $ | 5,274,000 |
|
200,000 |
| Time Warner Cable, Inc.— Class A (a) |
|
| 5,600,000 |
|
1,500,000 |
| Time Warner, Inc. |
|
| 22,275,000 |
|
|
|
|
|
| ||
|
|
|
|
| 123,647,233 |
|
|
|
|
|
| ||
Metals & Mining—3.3% |
|
|
|
| ||
228,500 |
| Allegheny Technologies, Inc. |
|
| 15,727,655 |
|
107,050 |
| Cleveland-Cliffs, Inc. |
|
| 17,170,820 |
|
134,950 |
| Nucor Corp. |
|
| 10,188,725 |
|
|
|
|
|
| ||
|
|
|
|
| 43,087,200 |
|
|
|
|
|
| ||
Oil, Gas & Consumable Fuels—8.1% |
|
|
|
| ||
114,200 |
| Frontline, Ltd. |
|
| 6,402,052 |
|
71,000 |
| Hess Corp. |
|
| 7,540,200 |
|
308,100 |
| Marathon Oil Corporation |
|
| 14,040,117 |
|
246,400 |
| Overseas Shipholding Group, Inc. |
|
| 18,544,064 |
|
867,820 |
| Ship Finance International, Ltd. |
|
| 26,312,302 |
|
159,100 |
| Teekay Shipping Corporation |
|
| 7,261,324 |
|
445,000 |
| Teekay Tankers Ltd. |
|
| 8,980,100 |
|
355,000 |
| Valero Energy Corporation |
|
| 17,341,750 |
|
|
|
|
|
| ||
|
|
|
|
| 106,421,909 |
|
|
|
|
|
| ||
Pharmaceuticals—0.8% |
|
|
|
| ||
150,000 |
| Abbott Laboratories |
|
| 7,912,500 |
|
125,000 |
| Bristol-Myers Squibb Co. |
|
| 2,746,250 |
|
|
|
|
|
| ||
|
|
|
|
| 10,658,750 |
|
|
|
|
|
| ||
Software—1.3% |
|
|
|
| ||
30,100 |
| Nintendo Co. Ltd. |
|
| 16,528,442 |
|
|
|
|
|
| ||
Telecommunications—1.6% |
|
|
|
| ||
95,000 |
| America Movil SA de CV—ADR |
|
| 5,506,200 |
|
200,000 |
| Mobile Telesystems—ADR (a) |
|
| 15,516,000 |
|
|
|
|
|
| ||
|
|
|
|
| 21,022,200 |
|
|
|
|
|
| ||
Thrifts & Mortgage Finance—0.2% |
|
|
|
| ||
261,066 |
| Guaranty Financial Group, Inc. (a) |
|
| 1,997,155 |
|
|
|
|
|
| ||
Tobacco—1.4% |
|
|
|
| ||
367,500 |
| Philip Morris International, Inc. (a) |
|
| 18,753,525 |
|
|
|
|
|
| ||
Shares |
| Security Description |
| Value |
| |
|
|
| ||||
Common Stocks—continued |
|
|
|
| ||
Transportation—3.2% |
|
|
|
| ||
198,700 |
| Dryships Inc. |
| $ | 16,392,750 |
|
884,600 |
| Macquarie Infrastructure Co. LLC |
|
| 26,184,160 |
|
|
|
|
|
| ||
|
|
|
| 42,576,910 |
| |
|
|
|
|
| ||
Utilities—1.8% |
|
|
|
| ||
75,000 |
| FPL Group, Inc. |
|
| 4,971,750 |
|
323,100 |
| ITC Holdings Corp. |
|
| 18,022,518 |
|
|
|
|
|
| ||
|
|
|
|
| 22,994,268 |
|
|
|
|
|
| ||
Wireless Telecommunication Services—0.4% |
|
|
|
| ||
160,000 |
| Cellcom Israel Ltd |
|
| 5,289,600 |
|
|
|
|
|
| ||
|
| Total Common Stocks |
|
| 1,188,995,701 |
|
|
|
|
|
| ||
Preferred Stocks—2.2% |
|
|
|
| ||
Textiles, Apparel & Luxury Goods—2.2% |
|
|
|
| ||
387,763 |
| Hugo Boss AG |
|
| 20,204,630 |
|
3,050,000 |
| Unipol Gruppo Finanziaro S.P.A. |
|
| 8,939,072 |
|
|
|
|
|
| ||
|
| Total Preferred Stocks |
|
| 29,143,702 |
|
|
|
|
|
| ||
Equity-Linked Structured Notes—2.3% |
|
|
|
| ||
521,600 |
| Morgan Stanley & Co., Inc—Fortress Investment Group LLC—Class A 09/10/2008 |
|
| 7,615,360 |
|
1,750,000 |
| Morgan Stanley & Co., Inc—PDL Biopharma, Inc. (a) |
|
| 23,205,000 |
|
|
|
|
|
| ||
|
| Total Equity-Linked Structured Notes |
|
| 30,820,360 |
|
|
|
|
|
| ||
Short-Term Investments—0.4% |
|
|
|
| ||
2,400,984 |
| Alpine Municipal Money Market Fund |
|
| 2,400,984 |
|
3,113,956 |
| Fidelity Institutional Government Portfolio |
|
| 3,113,956 |
|
|
|
|
|
| ||
|
| Total Short-Term Investments |
|
| 5,514,940 |
|
|
|
|
|
| ||
|
| Total Investments |
|
| 1,254,474,703 |
|
|
| Other Assets in Excess of Liabilities—4.6% |
|
| 60,250,554 |
|
|
|
|
|
| ||
|
| TOTAL NET ASSETS—100.0% |
| $ | 1,314,725,257 |
|
|
|
|
|
| ||
Percentages are stated as a percent of net assets.
ADR—American Depository Receipt
SDR—Special Drawing Rights
(a) Non Income Producing
The accompanying notes are an integral part of the financial statements.
33
Alpine Dynamic Financial Services Fund |
Schedule of Portfolio Investments
April 30, 2008 (Unaudited)
Shares |
| Security |
|
| Value |
|
|
| |||||
Exchange-Traded Funds—6.7% |
|
|
|
| ||
6,400 |
| Ultra Financials ProShares Trust |
| $ | 212,032 |
|
5,500 |
| Ultra Short Financials ProShares Trust |
|
| 556,930 |
|
|
|
|
| |||
|
| Total Exchange-Traded Funds |
|
| 768,962 |
|
|
|
|
| |||
Common Stocks—93.2% |
|
|
|
| ||
Capital Markets—42.0% |
|
|
|
| ||
20,000 |
| Blackstone Group LP |
|
| 373,400 |
|
10,000 |
| Bovespa Holding SA |
|
| 149,801 |
|
1,200 |
| Climate Exchange PLC (a) |
|
| 43,186 |
|
400 |
| CME Group, Inc. |
|
| 182,980 |
|
19,700 |
| Cowen Group, Inc. (a) |
|
| 131,005 |
|
4,300 |
| Evercore Partners, Inc. |
|
| 72,498 |
|
4,000 |
| FC Stone Group, Inc. (a) |
|
| 165,680 |
|
7,500 |
| GFI Group, Inc. |
|
| 88,125 |
|
2,000 |
| Greenhill & Co, Inc. |
|
| 130,100 |
|
3,000 |
| Hong Kong Exchanges and Clearing Ltd. |
|
| 61,285 |
|
10,000 |
| Interactive Brokers Group, Inc. (a) |
|
| 315,700 |
|
4,115 |
| Intercontinental Exchange, Inc. (a) |
|
| 638,442 |
|
41,500 |
| JMP Group, Inc. |
|
| 290,500 |
|
3,000 |
| Lazard, Ltd. |
|
| 117,420 |
|
1,500 |
| Merrill Lynch & Co., Inc. |
|
| 74,745 |
|
15,000 |
| MF Global Ltd (a) |
|
| 197,550 |
|
7,000 |
| Nasdaq Stock Market, Inc. (a) |
|
| 255,150 |
|
4,000 |
| Nymex Holdings Inc. |
|
| 370,400 |
|
4,000 |
| NYSE Euronext |
|
| 264,400 |
|
2,000 |
| Och Ziff Capital Management Group |
|
| 38,820 |
|
7,500 |
| OptionsXpress Holdings, Inc. |
|
| 161,025 |
|
2,500 |
| Penson Worldwide, Inc. (a) |
|
| 27,200 |
|
3,573 |
| Piper Jaffray Companies, Inc. (a) |
|
| 133,130 |
|
1,000 |
| Raymond James Financial, Inc. |
|
| 28,770 |
|
43,600 |
| Sanders Morris Harris Group, Inc. |
|
| 358,828 |
|
5,000 |
| TD Ameritrade Holding Corp. (a) |
|
| 90,500 |
|
6,900 |
| Thomas Weisel Partners Group, Inc. (a) |
|
| 45,471 |
|
4,000 |
| TradeStation Group, Inc. (a) |
|
| 37,320 |
|
|
|
|
| |||
|
|
|
|
| 4,843,431 |
|
|
|
|
| |||
Commercial Banks—27.8% |
|
|
|
| ||
3,100 |
| American Community Bancshares, Inc. |
|
| 25,110 |
|
2,702 |
| AmericanWest Bancorp |
|
| 9,862 |
|
50,000 |
| Aozora Bank Ltd. |
|
| 153,868 |
|
75,000 |
| Banco Estado Rio Grande Sul SA (a) |
|
| 451,209 |
|
80,000 |
| Banco Panamericano SA (a) |
|
| 433,161 |
|
1,000 |
| Bancorp Rhode Island, Inc. |
|
| 33,510 |
|
5,593 |
| BancTrust Financial Group, Inc. |
|
| 60,348 |
|
12,400 |
| Bank Florida Corp Naples (a) |
|
| 137,516 |
|
2,000 |
| Barclays PLC |
|
| 18,153 |
|
5,800 |
| Capital Corp of The West |
|
| 39,730 |
|
4,000 |
| Cardinal Financial Corp. |
|
| 30,800 |
|
4,572 |
| Centennial Bank Holdings, Inc. (a) |
|
| 28,621 |
|
1,500 |
| Citigroup, Inc. |
|
| 37,905 |
|
21,194 |
| Citizens First Corp. |
|
| 196,045 |
|
Shares |
| Security |
|
| Value |
|
|
| |||||
Common Stocks—continued |
|
|
|
| ||
Commercial Banks—continued |
|
|
|
| ||
1,000 |
| CoBiz, Inc. |
| $ | 11,110 |
|
10,000 |
| The Colonial BancGroup Inc. |
|
| 81,400 |
|
4,700 |
| Community National Bank of the Lakeway Area (a) |
|
| 34,075 |
|
4,000 |
| First Business Financial Services, Inc. |
|
| 70,000 |
|
2,400 |
| First Community Bancorp, Inc. |
|
| 51,576 |
|
1,260 |
| First Community Bank Corp. of America (a) |
|
| 13,892 |
|
7,826 |
| First Security Group, Inc. |
|
| 71,764 |
|
1,500 |
| ICICI Bank Ltd. - ADR |
|
| 66,885 |
|
1,100 |
| International Bancshares Corp. |
|
| 27,489 |
|
1,800 |
| Intervest Bancshares Corp. |
|
| 18,612 |
|
930 |
| MB Financial Corp. |
|
| 26,691 |
|
10,200 |
| New Centry Bancorp, Inc. (a) |
|
| 77,775 |
|
6,000 |
| Nexity Financial Corp. (a) |
|
| 34,140 |
|
2,000 |
| North Valley Bancorp |
|
| 19,140 |
|
2,375 |
| Old Point Financial Corp. |
|
| 43,653 |
|
12,042 |
| Pacific Mercantile Bancorp (a) |
|
| 108,739 |
|
1,000 |
| Patriot National Bancorp, Inc. |
|
| 14,500 |
|
1,400 |
| Prosperity Bancshares, Inc. |
|
| 43,358 |
|
3,120 |
| Rurban Financial Corp. |
|
| 31,637 |
|
2,388 |
| The South Financial Group, Inc. |
|
| 14,424 |
|
13,750 |
| Southern National Bank of Virginia |
|
| 114,881 |
|
5,000 |
| State Bancorp, Inc. |
|
| 65,000 |
|
2,500 |
| Sterling Bancorp |
|
| 41,025 |
|
7,500 |
| Sterling Bancshares, Inc. |
|
| 77,925 |
|
6,000 |
| Summit State Bank |
|
| 43,500 |
|
500 |
| Superior Bancorp (a) |
|
| 8,875 |
|
1,500 |
| TCF Financial Corp. |
|
| 26,100 |
|
1,300 |
| Texas Capital Bancshares, Inc. (a) |
|
| 23,985 |
|
15,000 |
| Tidelands Bancshares, Inc. (a) |
|
| 143,700 |
|
750 |
| TowneBank |
|
| 12,308 |
|
2,205 |
| Valley Community Bancorp |
|
| 29,106 |
|
1,050 |
| Valley National Bancorp |
|
| 20,149 |
|
1,780 |
| Wachovia Corp. |
|
| 51,887 |
|
1,000 |
| Wintrust Financial Corp. |
|
| 31,720 |
|
|
|
|
| |||
|
|
|
|
| 3,206,859 |
|
|
|
|
| |||
Commercial Services & Supplies—3.0% |
|
|
|
| ||
19,000 |
| CAI International Inc. (a) |
|
| 278,350 |
|
2,000 |
| Deluxe Corp. |
|
| 42,520 |
|
3,500 |
| Experian Group, Ltd. |
|
| 26,479 |
|
|
|
|
| |||
|
|
|
|
| 347,349 |
|
|
|
|
| |||
Diversified Financial Services—0.5% |
|
|
|
| ||
3,000 |
| SLM Corp. (a) |
|
| 55,590 |
|
|
|
|
| |||
Insurance—4.3% |
|
|
|
| ||
17,000 |
| AMBAC Financial Group, Inc. |
|
| 78,710 |
|
20,000 |
| Castlepoint Holdings, Ltd. |
|
| 184,000 |
|
1,500 |
| China Life Insurance Co Ltd - ADR |
|
| 98,400 |
|
2,000 |
| CNinsure, Inc. - ADR (a) |
|
| 28,100 |
|
10,000 |
| Crawford & Co. (a) |
|
| 51,900 |
|
8,000 |
| CRM Holdings, Ltd. (a) |
|
| 24,960 |
|
3,000 |
| MBIA, Inc. |
|
| 31,200 |
|
|
|
|
| |||
|
|
|
|
| 497,270 |
|
|
|
|
| |||
The accompanying notes are an integral part of the financial statements.
34
Alpine Dynamic Financial Services Fund |
Schedule of Portfolio Investments—Continued
April 30, 2008 (Unaudited)
Shares |
| Security |
|
| Value |
|
|
| |||||
Common Stocks—continued |
|
|
|
| ||
IT Services—3.4% |
|
|
|
| ||
2,500 |
| Alliance Data Systems Corp. (a) |
| $ | 143,525 |
|
59,000 |
| Goldleaf Financial Solutions (a) |
|
| 94,400 |
|
15,000 |
| Online Resources Corp. (a) |
|
| 151,650 |
|
|
|
|
| |||
|
|
|
|
| 389,575 |
|
|
|
|
| |||
Thrifts & Mortgage Finance—12.2% |
|
|
|
| ||
42,500 |
| Alliance Bancorp, Inc. |
|
| 399,075 |
|
1,700 |
| Astoria Financial Corp. |
|
| 40,290 |
|
6,202 |
| Atlantic Coast Federal Corp. |
|
| 56,252 |
|
1,000 |
| Bank Mutual Corp. |
|
| 11,190 |
|
3,000 |
| Berkshire Hills Bancorp, Inc. |
|
| 76,770 |
|
5,000 |
| Central Federal Corp. |
|
| 23,750 |
|
2,280 |
| Cooperative Bankshares, Inc. |
|
| 21,045 |
|
2,000 |
| Downey Financial Corp. |
|
| 28,280 |
|
2,144 |
| Fidelity Bancorp, Inc. |
|
| 30,016 |
|
10,000 |
| First Keystone Financial, Inc. (a) |
|
| 91,600 |
|
5,895 |
| First Pactrust Bancorp, Inc. |
|
| 96,796 |
|
2,000 |
| Franklin Bank Corp. (a) |
|
| 3,100 |
|
1,900 |
| Heritage Financial Corp. |
|
| 35,644 |
|
10,000 |
| Magyar Bancorp, Inc. (a) |
|
| 100,000 |
|
1,100 |
| Parkvale Financial Corp. |
|
| 28,600 |
|
10,000 |
| Peoples United Financial, Inc. |
|
| 169,700 |
|
Shares |
| Security |
|
| Value |
|
|
| |||||
Common Stocks—continued |
|
|
|
| ||
Thrifts & Mortgage Finance—continued |
|
|
|
| ||
1,500 |
| Rainier Pacific Financial Group, Inc. |
| $ | 20,265 |
|
10,000 |
| United Western Bancorp, Inc. |
|
| 172,000 |
|
|
|
|
| |||
|
|
|
|
| 1,404,373 |
|
|
|
|
| |||
|
| Total Common Stocks |
|
| 10,744,447 |
|
|
|
|
| |||
Equity-Linked Structured Notes—2.8% |
|
|
|
| ||
22,000 |
| Morgan Stanley & Co., Inc.— Fortress Investment Group LLC—Class A 9/10/08 |
|
| 326,371 |
|
|
|
|
| |||
|
| Total Equity-Linked Structured Notes |
|
| 326,371 |
|
|
|
|
| |||
Short-Term Investments—0.0% |
|
|
|
| ||
426 |
| Fidelity Institutional Government Portfolio |
|
| 426 |
|
|
|
|
| |||
|
| Total Short-Term Investments |
|
| 426 |
|
|
|
|
| |||
| Total Investments (Cost $15,409,971)—102.7% |
|
| 11,840,206 |
| |
|
| Liabilities in Excess of Other Assets—(2.7)% |
|
| (313,313 | ) |
|
|
|
|
|
| |
|
|
|
| |||
|
| TOTAL NET ASSETS—100.0% |
| $ | 11,526,893 |
|
|
|
|
| |||
Percentages are stated as a percent of net assets.
ADR—American Depository Receipt
(a) Non Income Producing
The accompanying notes are an integral part of the financial statements.
35
Alpine Dynamic Innovators Fund |
Schedule of Portfolio Investments
April 30, 2008 (Unaudited)
Shares |
| Security |
|
| Value |
|
|
|
| ||||
Common Stocks—87.7% |
|
|
|
| ||
Aerospace & Defense—2.0% |
|
|
|
| ||
15,000 |
| BE Aerospace, Inc. (a) |
| $ | 605,400 |
|
12,000 |
| Hexcel Corpo. (a) |
|
| 268,560 |
|
|
|
|
|
| ||
|
|
|
|
| 873,960 |
|
|
|
|
|
| ||
Biotechnology—5.0% |
|
|
|
| ||
60,000 |
| Acadia Pharmaceuticals, Inc. (a) |
|
| 480,000 |
|
20,000 |
| Charles River Laboratories International, Inc. (a) |
|
| 1,161,000 |
|
3,000 |
| Gilead Sciences, Inc. (a) |
|
| 155,280 |
|
15,000 |
| Savient Pharmaceuticals, Inc. (a) |
|
| 327,600 |
|
|
|
|
|
| ||
|
|
|
|
| 2,123,880 |
|
|
|
|
|
| ||
Chemicals—3.4% |
|
|
|
| ||
20,000 |
| Flotek Industrials, Inc. (a) |
|
| 374,400 |
|
7,000 |
| Monsanto Co. |
|
| 798,140 |
|
5,000 |
| Sigma-Aldrich Corp. |
|
| 285,100 |
|
|
|
|
|
| ||
|
|
|
|
| 1,457,640 |
|
|
|
|
|
| ||
Commercial Products & Services—7.0% |
|
|
|
| ||
10,000 |
| Air Products & Chemicals, Inc. |
|
| 984,300 |
|
4,500 |
| Enernoc, Inc. (a) |
|
| 69,390 |
|
5,000 |
| Graco, Inc. |
|
| 207,050 |
|
35,000 |
| LSI Industries, Inc. |
|
| 383,600 |
|
5,391 |
| Middleby Corp. (a) |
|
| 338,285 |
|
40,000 |
| Powersecure International Inc. (a) |
|
| 486,400 |
|
7,000 |
| VSE Corp. |
|
| 234,010 |
|
85,000 |
| Westport Innovations,Inc. - ADR (a) |
|
| 244,762 |
|
|
|
|
|
| ||
|
|
|
|
| 2,947,797 |
|
|
|
|
|
| ||
Commercial Services & Supplies—1.8% |
|
|
|
| ||
8,000 |
| FTI Consulting, Inc. (a) |
|
| 512,000 |
|
3,000 |
| ITT Educational Services, Inc. (a) |
|
| 229,980 |
|
|
|
|
|
| ||
|
|
|
|
| 741,980 |
|
|
|
|
|
| ||
Communications—5.4% |
|
|
|
| ||
50,000 |
| Alvarion, Ltd. (a) |
|
| 326,000 |
|
14,000 |
| Comtech Telecommunications (a) |
|
| 542,220 |
|
7,000 |
| Millicom International Cellular S A (a) |
|
| 756,070 |
|
20,000 |
| Polycom, Inc. (a) |
|
| 448,000 |
|
25,000 |
| Sonic Solutions, Inc. (a) |
|
| 229,750 |
|
|
|
|
|
| ||
|
|
|
|
| 2,302,040 |
|
|
|
|
|
| ||
Consumer Products & Services—2.7% |
|
|
|
| ||
9,000 |
| Priceline.com, Inc. (a) |
|
| 1,148,760 |
|
|
|
|
|
| ||
Electronic Systems & Equipment—13.9% |
|
|
|
| ||
9,000 |
| American Science & Engineering, Inc. |
|
| 438,570 |
|
21,000 |
| Flir Systems, Inc. (a) |
|
| 720,930 |
|
15,000 |
| IPG Photonics Corp. (a) |
|
| 250,950 |
|
13,000 |
| Itron, Inc. (a) |
|
| 1,210,040 |
|
33,000 |
| Logitech International S.A. (a) |
|
| 995,610 |
|
17,000 |
| MEMC Electronic Materials, Inc. (a) |
|
| 1,070,490 |
|
12,975 |
| Mocon, Inc. |
|
| 142,336 |
|
4,000 |
| NAVTEQ Corp. (a) |
|
| 296,840 |
|
4,000 |
| Netlogic Microsystems, Inc. (a) |
|
| 131,160 |
|
4,000 |
| Nokia OYJ - ADR |
|
| 120,280 |
|
26,000 |
| Stratasys, Inc. (a) |
|
| 505,440 |
|
|
|
|
|
| ||
|
|
|
|
| 5,882,646 |
|
|
|
|
|
| ||
Shares |
| Security |
|
| Value |
|
|
|
| ||||
Common Stocks—continued |
|
|
|
| ||
Energy Equipment & Services—1.6% |
|
|
|
| ||
10,000 |
| Oceaneering International, Inc. (a) |
| $ | 667,800 |
|
|
|
|
|
| ||
Energy Production Equipment—4.7% |
|
|
|
| ||
24,000 |
| Bolt Technology Corp. (a) |
|
| 435,840 |
|
11,000 |
| FMC Technologies, Inc. (a) |
|
| 739,200 |
|
15,000 |
| Ion Geophysical Corp. (a) |
|
| 238,950 |
|
7,000 |
| Weatherford International Ltd. (a) |
|
| 564,690 |
|
|
|
|
|
| ||
|
|
|
|
| 1,978,680 |
|
|
|
|
|
| ||
Financial Services—5.5% |
|
|
|
| ||
20,000 |
| AMBAC Financial Group, Inc. |
|
| 92,600 |
|
2,000 |
| CME Group, Inc. |
|
| 914,900 |
|
25,000 |
| Portfolio Recovery Associates, Inc. |
|
| 1,100,250 |
|
5,000 |
| Redecard S A - ADR (b) |
|
| 183,183 |
|
5,000 |
| TradeStation Group, Inc. (a) |
|
| 46,650 |
|
|
|
|
|
| ||
|
|
|
|
| 2,337,583 |
|
|
|
|
|
| ||
Health Care Equipment & Supplies—4.9% |
|
|
|
| ||
15,000 |
| Abiomed, Inc. (a) |
|
| 218,850 |
|
10,000 |
| Beckman Coulter, Inc. |
|
| 683,000 |
|
16,000 |
| Hologic, Inc. (a) |
|
| 467,040 |
|
8,000 |
| Immucor, Inc. (a) |
|
| 215,840 |
|
10,000 |
| Medtronic, Inc. |
|
| 486,800 |
|
|
|
|
|
| ||
|
|
|
|
| 2,071,530 |
|
|
|
|
|
| ||
Healthcare—6.0% |
|
|
|
| ||
4,000 |
| Alcon, Inc. |
|
| 632,000 |
|
28,000 |
| Inventiv Health, Inc. (a) |
|
| 832,440 |
|
11,000 |
| Pediatrix Medical Group, Inc. (a) |
|
| 748,220 |
|
10,000 |
| Psychiatric Solutions, Inc. (a) |
|
| 347,100 |
|
|
|
|
|
| ||
|
|
|
|
| 2,559,760 |
|
|
|
|
|
| ||
Hotels Restaurants & Leisure—0.9% |
|
|
|
| ||
10,000 |
| Life Time Fitness, Inc. (a) |
|
| 363,500 |
|
|
|
|
|
| ||
Industrial Capital Goods—2.1% |
|
|
|
| ||
12,000 |
| Dynamic Materials Corp. |
|
| 564,360 |
|
15,000 |
| Titanium Metals Corp. |
|
| 228,600 |
|
12,588 |
| Sutron Corp. (a) |
|
| 89,752 |
|
|
|
|
|
| ||
|
|
|
|
| 882,712 |
|
|
|
|
|
| ||
Information Technology—1.8% |
|
|
|
| ||
16,400 |
| Ansys, Inc. (a) |
|
| 659,772 |
|
5,000 |
| Synchronoss Technologies, Inc. (a) |
|
| 104,350 |
|
|
|
|
|
| ||
|
|
|
|
| 764,122 |
|
|
|
|
|
| ||
Life Sciences Tools & Services—0.1% |
|
|
|
| ||
800 |
| Millipore Corp. (a) |
|
| 56,080 |
|
|
|
|
|
| ||
Machinery—0.9% |
|
|
|
| ||
3,000 |
| Flowserve Corp. |
|
| 372,270 |
|
|
|
|
|
| ||
Medical Technology & Equipment—11.4% |
|
|
|
| ||
10,335 |
| Abaxis, Inc. (a) |
|
| 263,336 |
|
12,000 |
| Angiodynamics, Inc. (a) |
|
| 177,360 |
|
16,000 |
| Arthrocare Corp. (a) |
|
| 720,960 |
|
4,000 |
| Bio-Reference Labs, Inc. (a) |
|
| 100,720 |
|
3,000 |
| Given Imaging Ltd (a) |
|
| 50,970 |
|
2,400 |
| Intuitive Surgical, Inc. (a) |
|
| 694,224 |
|
15,000 |
| Invitrogen Corp. (a) |
|
| 1,403,550 |
|
10,000 |
| Kinetic Concepts, Inc. (a) |
|
| 396,600 |
|
The accompanying notes are an integral part of the financial statements.
36
Alpine Dynamic Innovators Fund |
Schedule of Portfolio Investments—Continued
April 30, 2008 (Unaudited)
Shares |
| Security |
|
| Value |
|
|
| |||||
Common Stocks—continued |
|
|
|
| ||
Medical Technology & Equipment—continued |
|
|
|
| ||
10,000 |
| Nighthawk Radiology Holdings, Inc. (a) |
| $ | 75,000 |
|
5,000 |
| Onyx Pharmaceuticals, Inc. (a) |
|
| 175,800 |
|
8,000 |
| Orchid Cellmark, Inc. (a) |
|
| 20,480 |
|
50,216 |
| Sequenom, Inc. (a) |
|
| 317,365 |
|
25,000 |
| Synovis Life Technologies, Inc. (a) |
|
| 421,500 |
|
|
|
|
|
| ||
|
|
|
|
| 4,817,865 |
|
|
|
|
|
| ||
Pharma Development—0.4% |
|
|
|
| ||
45,000 |
| Cell Genesys, Inc. (a) |
|
| 172,800 |
|
|
|
|
|
| ||
Pharmaceuticals—1.5% |
|
|
|
| ||
3,000 |
| Biogen IDEC, Inc. (a) |
|
| 182,070 |
|
12,000 |
| Merck & Co., Inc. |
|
| 456,480 |
|
|
|
|
|
| ||
|
|
|
|
| 638,550 |
|
|
|
|
|
| ||
Real Estate Investment Trusts—1.7% |
|
|
|
| ||
8,000 |
| Vornado Realty Trust |
|
| 744,720 |
|
|
|
|
|
| ||
Software—0.2% |
|
|
|
| ||
12,000 |
| Software Learning Corp. (a) |
|
| 64,220 |
|
|
|
|
|
| ||
Shares |
| Security |
|
| Value |
|
|
| |||||
Common Stocks—continued |
|
|
|
| ||
Technology—0.5% |
|
|
|
| ||
8,000 |
| Sigma Designs, Inc. (a) |
| $ | 143,040 |
|
1,250 |
| VMware, Inc. (a) |
|
| 83,300 |
|
|
|
|
|
| ||
|
|
|
|
| 226,340 |
|
|
|
|
|
| ||
Thrifts & Mortgage Finance—1.7% |
|
|
|
| ||
26,000 |
| Fannie Mae |
|
| 735,800 |
|
|
|
|
|
| ||
Trading Companies & Distributors—0.6% |
|
|
|
| ||
5,000 |
| Fastenal Co. |
|
| 244,050 |
|
|
|
|
|
| ||
|
| Total Common Stocks |
|
| 37,177,085 |
|
|
|
|
|
| ||
Short-Term Investments—12.2% |
|
|
|
| ||
5,000,000 |
| Alpine Municipal Money Market Fund |
|
| 5,000,000 |
|
151,340 |
| Fidelity Institutional Government Portfolio |
|
| 151,340 |
|
|
|
|
|
| ||
|
|
|
|
| 5,151,340 |
|
|
|
|
|
| ||
|
| Total Short-Term Investments |
|
| 5,151,340 |
|
|
|
|
|
| ||
|
| Total Investments |
|
|
|
|
|
| (Cost $45,561,733)—99.9% |
|
| 42,328,425 |
|
|
| Other Assets in Excess of Liabilities—0.1% |
|
| 30,328 |
|
|
|
|
|
| ||
|
| TOTAL NET ASSETS—100.0% |
| $ | 42,358,753 |
|
|
|
|
|
| ||
Percentages are stated as a percent of net assets.
ADR—American Depository Receipt
(a) | Non Income Producing |
(b) | Restricted under Rule 144A of the Securities Act of 1933. These securities may be resold in transactions from registration, normally to qualified institutional buyers. These securities have been determined to be liquid under guidelines established by the Board of Trustees. Securities restricted under Rule 144A comprised 0.4% of the Fund’s net assets. |
The accompanying notes are an integral part of the financial statements.
37
Alpine Dynamic Transformations Fund |
Schedule of Portfolio Investments
April 30, 2008 (unaudited)
Shares |
| Security Description |
| Value |
| |
|
|
| ||||
Common Stocks—91.4% |
|
|
|
| ||
Aerospace & Defense—6.5% |
|
|
|
| ||
7,000 |
| BE Aerospace, Inc. (a) |
| $ | 282,520 |
|
|
|
|
|
| ||
Auto Components—11.4% |
|
|
|
| ||
8,000 |
| Autoliv, Inc. |
|
| 489,920 |
|
|
|
|
|
| ||
Chemicals—7.0% |
|
|
|
| ||
10,000 |
| Flotek Industries, Inc Del (a) |
|
| 187,200 |
|
2,000 |
| Sigma-Aldrich Corp. |
|
| 114,040 |
|
|
|
|
|
| ||
|
|
|
|
| 301,240 |
|
|
|
|
|
| ||
Commercial Products & Services—5.3% |
|
|
|
| ||
3,000 |
| Lincoln Electric Holdings, Inc. |
|
| 228,900 |
|
|
|
|
|
| ||
Commercial Services & Supplies—3.3% |
|
|
|
| ||
3,000 |
| Avery Dennison Corp. |
|
| 144,570 |
|
|
|
|
|
| ||
Computers & Peripherals—2.2% |
|
|
|
| ||
5,000 |
| Stratasys, Inc. (a) |
|
| 97,200 |
|
|
|
|
|
| ||
Consumer Finance—6.4% |
|
|
|
| ||
15,000 |
| SLM Corp. (a) |
|
| 277,950 |
|
|
|
|
|
| ||
Diversified Financials—4.4% |
|
|
|
| ||
4,000 |
| JP Morgan Chase & Co. |
|
| 190,600 |
|
|
|
|
|
| ||
Energy Equipment & Services—12.4% |
|
|
|
| ||
6,000 |
| Helix Energy Solutions Group, Inc. (a) |
|
| 207,300 |
|
5,000 |
| Tidewater, Inc. |
|
| 326,100 |
|
|
|
|
|
| ||
|
|
|
|
| 533,400 |
|
|
|
|
|
| ||
Financial Services—2.0% |
|
|
|
| ||
3,000 |
| Fannie Mae |
|
| 84,900 |
|
|
|
|
|
| ||
Health Care Equipment & Supplies—3.4% |
|
|
|
| ||
10,000 |
| Abiomed, Inc. (a) |
|
| 145,900 |
|
|
|
|
|
| ||
Shares |
| Security Description |
| Value |
| |
|
|
| ||||
Common Stocks—continued |
|
|
|
| ||
Hotels Restaurants & Leisure—3.0% |
|
|
|
| ||
8,000 |
| Starbucks Corp. (a) |
| $ | 129,840 |
|
|
|
|
|
| ||
Household Durables—1.7% |
|
|
|
| ||
1,000 |
| Whirlpool Corp. |
|
| 72,780 |
|
|
|
|
|
| ||
Insurance—1.0% |
|
|
|
| ||
9,000 |
| Ambac Financial Group, Inc. |
|
| 41,670 |
|
|
|
|
|
| ||
Internet & Catalog Retail—4.4% |
|
|
|
| ||
1,500 |
| Priceline.com, Inc. (a) |
|
| 191,460 |
|
|
|
|
|
| ||
Machinery—6.2% |
|
|
|
| ||
6,000 |
| Ingersoll-Rand Co. |
|
| 266,280 |
|
|
|
|
|
| ||
Semiconductor & Semiconductor Equipment—4.3% |
|
|
|
| ||
10,000 |
| Applied Materials, Inc. |
|
| 186,600 |
|
|
|
|
|
| ||
Thrifts & Mortgage Finance—0.8% |
|
|
|
| ||
10,000 |
| IndyMac Bancorp, Inc. |
|
| 32,500 |
|
|
|
|
|
| ||
Trading Companies & Distributors—5.7% |
|
|
|
| ||
5,000 |
| Fastenal Co. |
|
| 244,050 |
|
|
|
|
|
| ||
|
| Total Common Stocks |
|
| 3,942,280 |
|
|
|
|
|
| ||
Short-Term Investments—9.5% |
|
|
|
| ||
408,047 |
| Fidelity Institutional Government Portfolio |
|
| 408,047 |
|
|
|
|
|
| ||
|
| Total Short-Term Investments |
|
| 408,047 |
|
|
|
|
|
| ||
|
| Total Investments |
|
|
|
|
|
| (Cost $4,286,932)—100.9% |
|
| 4,350,327 |
|
|
| Liabilities in Excess of Other Assets—(0.9)% |
|
| (39,322 | ) |
|
|
|
|
| ||
|
| TOTAL NET ASSETS—100.0% |
| $ | 4,311,005 |
|
|
|
|
|
| ||
Percentages are stated as a percent of net assets.
(a) | Non Income Producing |
The accompanying notes are an integral part of the financial statements.
38
Alpine Municipal Money Market Fund |
Schedule of Portfolio Investments
April 30, 2008 (Unaudited)
Principal |
| Security |
|
| Value |
| ||
|
| |||||||
Municipal Bonds—95.5% |
|
|
|
| ||||
Alabama—1.2% |
|
|
|
| ||||
$ | 1,325,000 |
| Forsyth Housing Authority Multi-Family Revenue, Union Hill Apartments LP (LOC: Columbus Bank & Trust) 2.942%, 05/07/2008 (a)(b) |
| $ | 1,325,000 |
| |
| 500,000 |
| Mobile Industrial Development Board Industrial Revenue, Hosea O Weaver & Sons (LOC: Regions Bank) 2.792%, 05/07/2008 (a)(b) |
|
| 500,000 |
| |
| 4,115,000 |
| Mobile Industrial Development Board Industrial Revenue, Newark Group Industries Inc. (LOC: Wachovia Bank N.A.) 2.942%, 05/07/2008 (a)(b) |
|
| 4,115,000 |
| |
| 195,000 |
| Montgomery Industrial Development Revenue, Dev-Kinpak, Inc. (LOC: Regions Bank) 2.792%, 05/07/2008 (a)(b) |
|
| 195,000 |
| |
| 980,000 |
| Montgomery Industrial Development Revenue, Norment Industries, Inc. (LOC: LaSalle Bank N.A.) 2.792%, 05/07/2008 (a)(b) |
|
| 980,000 |
| |
|
|
|
|
|
| |||
|
|
|
|
|
| 7,115,000 |
| |
|
|
|
|
|
| |||
Alaska—0.1% |
|
|
|
| ||||
| 770,000 |
| Alaska Industrial Development & Export Authority—Lot 12 (LOC: Bank of America N.A.) 3.141%, 05/07/2008 (a)(b) |
|
| 770,000 |
| |
|
|
|
|
|
| |||
California—2.5% |
|
|
|
| ||||
| 6,935,000 |
| Municipal Finance Authority Variable Revenue Bonds, San Francisco Planning (LOC: Pacific Capital Bank N.A.) 2.752%, 05/07/2008 (a)(b) |
|
| 6,935,000 |
| |
| 4,600,000 |
| Riverside County Industrial Development Authority Revenue, TRM Manufacturing, Inc. (LOC: California Bank & Trust) 3.042%, 05/07/2008 (a)(b) |
|
| 4,600,000 |
| |
| 2,910,000 |
| Vallejo Certificates Participation 4.687%, 05/07/2008 (a)(b) |
|
| 2,910,000 |
| |
|
|
|
|
|
| |||
|
|
|
|
|
| 14,445,000 |
| |
|
|
|
|
|
| |||
Colorado—4.1% |
|
|
|
| ||||
| 2,450,000 |
| Agriculture Development Authority Variable Revenue Bonds, Larry & Margaret Dehaan (LOC: Bank of Oklahoma N.A.) 2.673%, 05/07/2008 (a)(b) |
|
| 2,450,000 |
| |
| 3,000,000 |
| Bachelor Gulch Metropolitan District (LOC: Compass Bank) 3.600%, 12/01/2008 (c) |
|
| 3,000,000 |
| |
| 1,800,000 |
| Broomfield Village Metropolitan District 2, Special Obligation Revenue (LOC: Compass Bank) 2.673%, 05/07/2008 (a)(b) |
|
| 1,800,000 |
| |
| 900,000 |
| Housing & Finance Authority Economic Development Revenue, Casarosa & Denver Gasket (LOC: Keybank N.A.) 2.673%, 05/07/2008 |
|
| 900,000 |
| |
Principal |
| Security |
|
| Value |
| ||
|
| |||||||
Municipal Bonds—continued |
|
|
|
| ||||
Colorado—continued |
|
|
|
| ||||
$ | 2,490,000 |
| Housing & Finance Authority Economic Development Revenue, Cytoskeleton Inc. (LOC: Compass Bank) 2.673%, 05/07/2008 (a)(b) |
| $ | 2,490,000 |
| |
| 6,500,000 |
| Housing & Finance Authority Economic Development Revenue, Holden Properties (LOC: Associated Bank N.A.) 2.673%, 05/07/2008 (a)(b) |
|
| 6,500,000 |
| |
| 1,850,000 |
| Housing & Finance Authority Economic Development Revenue, Stoneage Inc.—Series A (LOC: California Bank & Trust) 2.772%, 05/07/2008 (a)(b) |
|
| 1,850,000 |
| |
| 1,475,000 |
| Housing & Finance Authority Economic Development Revenue, Top Shop—Series A (LOC: JP Morgan Chase Bank) 2.673%, 05/07/2008 (a)(b) |
|
| 1,475,000 |
| |
| 1,957,000 |
| Jefferson County Industrial Development Revenue, EPI-Center LLC (LOC: JP Morgan Chase Bank) 2.673%, 05/07/2008 (a)(b) |
|
| 1,957,000 |
| |
| 1,000,000 |
| Triview Colorado Metropolitan District (LOC: Compass Bank) 3.600%, 11/01/2008 (c) |
|
| 1,000,000 |
| |
|
|
|
|
|
| |||
|
|
|
|
|
| 23,422,000 |
| |
|
|
|
|
|
| |||
Florida—5.9% |
|
|
|
| ||||
| 1,200,000 |
| St. Johns County Industrial Development Authority Health Facilities Revenue, Coastal Health Care Investor (LOC: Suntrust Bank NA) 2.693%, 02/07/2008 (a)(b) |
|
| 1,200,000 |
| |
| 6,705,000 |
| St. Johns County Industrial Development Authority Revenue 2.772%, 05/07/2008 (a)(b) |
|
| 6,705,000 |
| |
| 26,000,000 |
| Sunshine State Governmental Finance Commission, Lehman (CS: AMBAC) 6.732%, 05/01/2008 (a)(b) |
|
| 26,000,000 |
| |
|
|
|
|
|
| |||
|
|
|
|
|
| 33,905,000 |
| |
|
|
|
|
|
| |||
Georgia—2.3% |
|
|
|
| ||||
| 6,200,000 |
| Bartow County Development Authority Multifamily Housing Revenue 2.992%, 05/07/2008 (a)(b) |
|
| 6,200,000 |
| |
| 1,305,000 |
| Douglas County Development Authority Revenue, Denyse Signs Inc. (LOC: Bank of North Georgia) 2.772%, 05/07/2008 (a)(b) |
|
| 1,305,000 |
| |
| 1,490,000 |
| Lowndes County Development Authority Revenue (LOC: First State Bank & Trust ) 2.772%, 05/07/2008 (a)(b) |
|
| 1,490,000 |
| |
| 2,000,000 |
| Turner County Development Authority Industrial Revenue (LOC: AmSouth Bank) 2.673%, 05/07/2008 (a)(b) |
|
| 2,000,000 |
| |
The accompanying notes are an integral part of the financial statements.
39
Alpine Municipal Money Market Fund |
|
Schedule of Portfolio Investments—Continued
April 30, 2008 (Unaudited)
Principal |
| Security |
| Value |
| ||
|
|
| |||||
Municipal Bonds—continued |
| ||||||
Georgia—continued |
| ||||||
$ | 2,300,000 |
| Walton County Industrial Building Authority Revenue, Leggett & Platt, Inc. (LOC: Wachovia Bank N.A.) 3.191%, 02/07/2008 (a)(b) |
| $ | 2,300,000 |
|
|
|
|
|
|
| ||
|
|
|
|
|
| 13,295,000 |
|
|
|
|
|
|
| ||
Illinois—7.5% |
| ||||||
| 630,000 |
| Carol Stream Industrial Development Revenue Bonds, MI Enterprises (LOC: JP Morgan Chase Bank) 2.673%, 05/07/2008 (a)(b) |
|
| 630,000 |
|
| 8,840,000 |
| Chicago O’Hare International Airport Putters—Series 845-Z (CS: AMBAC) 3.271%, 05/07/2008 (a)(b) |
|
| 8,840,000 |
|
| 825,000 |
| Clinton Industrial Development Revenue, McElroy Metal Mill, Inc. (LOC: Amsouth Bank) 2.772%, 05/07/2008 (a)(b) |
|
| 825,000 |
|
| 655,000 |
| Finance Authority Industiral Development Revenue, Church Road Partnership (LOC: Bank One NA) 8.477%, 05/07/2008 (a)(b) |
|
| 655,000 |
|
| 440,000 |
| Finance Authority Industiral Development Revenue, Fine Points LLC (LOC: Bank One NA) 3.092%, 05/07/2008 (a)(b) |
|
| 440,000 |
|
| 1,625,000 |
| Finance Authority Industrial Development Revenue, E Kinast—Series A (LOC: JP Morgan Chase Bank) 8.477%, 05/07/2008 (a)(b) |
|
| 1,625,000 |
|
| 550,000 |
| Finance Authority Industrial Development Revenue, Florence Corp. (LOC: Bank One NA) 8.477%, 05/07/2008 (a)(b) |
|
| 550,000 |
|
| 2,600,000 |
| Finance Authority Industrial Development Revenue, Flying Food Fare Inc. (LOC: Harris Bank NA) 2.613%, 05/07/2008 (a)(b) |
|
| 2,600,000 |
|
| 1,140,000 |
| Finance Authority Industrial Development Revenue, Haskris Co. (LOC: Bank One NA) 3.092%, 05/07/2008 (a)(b) |
|
| 1,140,000 |
|
| 3,000,000 |
| Finance Authority Industrial Development Revenue, John Hofmeister & Son (LOC: Harris Bank NA) 2.613%, 05/07/2008 (a)(b) |
|
| 3,000,000 |
|
| 2,800,000 |
| Finance Authority Industrial Development Revenue, Maclean-Fogg Co. (LOC: Bank of America N.A.) 3.989%, 05/07/2008 (a)(b) |
|
| 2,800,000 |
|
Principal |
| Security |
| Value |
| ||
|
|
| |||||
Municipal Bonds—continued | |||||||
Illinois—continued | |||||||
$ | 1,250,000 |
| Finance Authority Industrial Development Revenue, Metform Corporation (LOC: Bank of America N.A.) 8.477%, 05/07/2008 (a)(b) |
| $ | 1,250,000 |
|
| 400,000 |
| Finance Authority Multi-family Revenue, Butterfield Creek (LOC: LaSalle Bank N.A.) 2.752%, 05/07/2008 (a)(b) |
|
| 400,000 |
|
| 1,100,000 |
| Harvard Health Care Facility Revenue, Harvard Memorial Hospital, Inc. (LOC: M&I Bank) 2.742%, 05/07/2008 (a)(b) |
|
| 1,100,000 |
|
| 1,625,000 |
| Illinois Development Financial Authority Solid Waste Revenue (LOC: Bank One NA) 3.092%, 05/07/2008 (a)(b) |
|
| 1,625,000 |
|
| 6,340,000 |
| Lakemoor Multifamily Revenue, Jupiter Realty Corp. (CS: Bayerische Landesbank) 2.733%, 05/07/2008 (a)(b) |
|
| 6,340,000 |
|
| 4,000,000 |
| Phoenix Realty Special Account-U LP Multifamily Revenue, Brightons Mark (LOC: Northern Trust) 2.713%, 05/07/2008 (a)(b) |
|
| 4,000,000 |
|
| 1,800,000 |
| Richton Park Industrial Development Revenue, Equinox Group (LOC: National City Bank) 3.211%, 05/07/2008 (a)(b) |
|
| 1,800,000 |
|
| 3,060,000 |
| Woodridge Du Page Will & C Variable Revenue 2.992%, 05/07/2008 (a)(b) |
|
| 3,060,000 |
|
|
|
|
|
|
| ||
|
|
|
|
| 42,680,000 |
| |
|
|
|
|
|
| ||
Indiana—2.5% | |||||||
| 5,000,000 |
| Daviess County Industrial & Economic Development Variable Revenue 7.978%, 05/07/2008 (a)(b) |
|
| 5,000,000 |
|
| 3,385,000 |
| Hobart Industrial Economic Development Revenue, Jefferson LLC (LOC: Harris N.A.) 2.613%, 05/07/2008 (a)(b) |
|
| 3,385,000 |
|
| 5,500,000 |
| Indiana Health & Educational Facility Financing Revenue (LOC: National City Bank) 3.490%, 05/01/2008 (a)(b) |
|
| 5,500,000 |
|
| 640,000 |
| Lawrence Industrial Economic Development Revenue, Southwark Metal Manufacturing Co. (LOC: Citizens Bank) 2.693%, 05/07/2008 (a)(b) |
|
| 640,000 |
|
|
|
|
|
|
| ||
|
|
|
|
|
| 14,525,000 |
|
|
|
|
|
|
| ||
The accompanying notes are an integral part of the financial statements.
40
Alpine Municipal Money Market Fund |
|
Schedule of Portfolio Investments—Continued
April 30, 2008 (Unaudited)
Principal |
| Security |
| Value |
| ||
|
|
| |||||
Municipal Bonds—continued | |||||||
Iowa—4.0% | |||||||
$ | 4,240,000 |
| Finance Authority Solid Waste Disposal Revenue, Natural Pork Production 2.673%, 05/07/2008 (a)(b) |
| $ | 4,240,000 |
|
| 6,000,000 |
| Finance Authority Solid Waste Disposal Revenue, Roorda Dairy LLC (LOC: Farm Credit Services of America) 2.623%, 05/07/2008 (a)(b) |
|
| 6,000,000 |
|
| 9,135,000 |
| Lakes Trust Various State (LOC: LaSalle Bank N.A.) 2.623%, 05/07/2008 (a)(b) |
|
| 9,135,000 |
|
| 3,370,000 |
| Sergeant Bluff Industrial Development Revenue, Sioux City Brick & Tile 2.992%, 05/07/2008 (a)(b) |
|
| 3,370,000 |
|
|
|
|
|
|
| ||
|
|
|
|
|
| 22,745,000 |
|
|
|
|
|
|
| ||
Kansas—0.2% | |||||||
| 1,110,000 |
| State Development Finance Authority, Four Seasons Apartments Project (LOC: U.S. Bank N.A.) 2.723%, 05/07/2008 (a)(b) |
|
| 1,110,000 |
|
|
|
|
|
|
| ||
Kentucky—0.3% | |||||||
| 300,000 |
| Bardstown Industrial Revenue, JAV Investment LLC (LOC: Bank of Michigan) 8.477%, 05/07/2008 (a)(b) |
|
| 300,000 |
|
| 755,000 |
| Hancock County Industrial Development Revenue, Precision Roll Grinders (LOC: Chase Manhattan Bank) 3.092%, 05/07/2008 (a)(b) |
|
| 755,000 |
|
| 380,000 |
| Shelby County Industrial Building Revenue, Roll Forming Corp. 3.989%, 05/07/2008 (a)(b) |
|
| 380,000 |
|
|
|
|
|
|
| ||
|
|
|
|
|
| 1,435,000 |
|
|
|
|
|
|
| ||
Louisiana—2.7% | |||||||
| 2,000,000 |
| Ascension Parish Waste Disposal, Alliedsignal, Inc. 2.772%, 05/07/2008 (a)(b) |
|
| 2,000,000 |
|
| 3,285,000 |
| Caddo-Bossier Parishes Port Common Variable Revenue Bonds, Oakley Louisiana Inc. 2.792%, 05/07/2008 (a)(b) |
|
| 3,285,000 |
|
| 10,010,000 |
| Public Facilities Authority Variable Revenue, Equipment & Cap Facilities 2.723%, 05/07/2008 (a)(b) |
|
| 10,010,000 |
|
|
|
|
|
|
| ||
|
|
|
|
|
| 15,295,000 |
|
|
|
|
|
|
| ||
Maryland— 0.9% | |||||||
| 5,000,000 |
| Carroll County Revenue 7.978%, 05/07/2008 (a)(b) |
|
| 5,000,000 |
|
|
|
|
|
|
| ||
Michigan—1.0% | |||||||
| 1,200,000 |
| Michigan State Strategic Fund Ltd Variable Revenue (LOC: Bank One Michigan) 3.092%, 05/07/2008 (a)(b) |
|
| 1,200,000 |
|
Principal |
| Security |
| Value |
| ||
|
|
| |||||
Municipal Bonds—continued | |||||||
Michigan—continued | |||||||
$ | 1,000,000 |
| Strategic Fund Limited Obligation Revenue Series A, Waterland Battle Creek Properties LLC (LOC: Fifth Third Bank) 2.872%, 05/07/2008 (a)(b) |
| $ | 1,000,000 |
|
| 1,705,000 |
| Strategic Fund Limited Obligation Revenue, Kaja Enterprises, LLC (LOC: National City Bank Midwest) 2.942%, 05/07/2008 (a)(b) |
|
| 1,705,000 |
|
| 900,000 |
| Strategic Fund Limited Obligation Revenue, Quality Assured Plastics (LOC: State Bank of Caledonia) 4.587%, 05/07/2008 (a)(b) |
|
| 900,000 |
|
| 600,000 |
| Strategic Fund Limited Obligation Revenue, Richwood Industries Inc. (LOC: Bank One Michigan) 4.587%, 05/07/2008 (a)(b) |
|
| 600,000 |
|
|
|
|
|
|
| ||
|
|
|
|
|
| 5,405,000 |
|
|
|
|
|
|
| ||
Minnesota—0.9% | |||||||
| 1,630,000 |
| Blooming Prairie Industrial Development Revenue, Metal Services (LOC: U.S. Bank N.A.) 2.673%, 05/07/2008 (a)(b) |
|
| 1,630,000 |
|
| 3,605,000 |
| Ramsey Industrial Development Revenue, Kilkenny LLC—Series A (LOC: U.S. Bank N.A.) 2.723%, 05/07/2008 (a)(b) |
|
| 3,605,000 |
|
|
|
|
|
|
| ||
|
|
|
|
|
| 5,235,000 |
|
|
|
|
|
|
| ||
Mississippi—1.4% | |||||||
| 5,000,000 |
| Biloxi Housing Authority Multifamily Housing Revenue Bonds, Bayview Place Estates (CS: Transamerica Bank N.A.) 4.650%, 08/01/2008 (a)(b) |
|
| 5,000,000 |
|
| 2,250,000 |
| Business Financial Corp Industrial Development Revenue Bonds, Epco Carbon Dioxide Products 2.792%, 05/07/2008 (a)(b) |
|
| 2,250,000 |
|
| 695,000 |
| Business Financial Corp Industrial Development Revenue Bonds, Howard Industries (LOC: AmSouth Bank) 2.792%, 05/07/2008 (a)(b) |
|
| 695,000 |
|
|
|
|
|
|
| ||
|
|
|
|
|
| 7,945,000 |
|
|
|
|
|
|
| ||
Missouri—5.7% | |||||||
| 3,100,000 |
| Cabool Industrial Development Authority, Ameriduct Worldwide, Inc. (LOC: Harris Trust & Savings Bank) 2.623%, 05/07/2008 (a)(b) |
|
| 3,100,000 |
|
| 4,000,000 |
| Carthage Industrial Development Revenue Bonds, Schreiber Foods (LOC: JP Morgan Chase Bank) 3.590%, 05/07/2008 (a)(b) |
|
| 4,000,000 |
|
|
|
|
|
|
|
|
|
| 13,200,000 |
| Kansas City Industrial Development Revenue 6.083%, 05/07/2008 (a)(b) |
|
| 13,200,000 |
|
| 2,450,000 |
| Missouri Development Financial Board Cultural Variable Revenue 3.241%, 05/07/2008 (a)(b) |
|
| 2,450,000 |
|
The accompanying notes are an integral part of the financial statements.
41
Alpine Municipal Money Market Fund |
|
Schedule of Portfolio Investments—Continued
April 30, 2008 (Unaudited)
Principal |
| Security |
| Value |
| ||
|
|
| |||||
Municipal Bonds—continued |
|
|
|
| |||
Missouri—continued |
|
|
|
| |||
$ | 3,230,000 |
| Missouri Industrial Development Authority Industrial Revenue, Clemco Industries 2.782%, 05/07/2008 (a)(b) |
| $ | 3,230,000 |
|
| 800,000 |
| Missouri State Environmental Improvement Revenue 4.587%, 05/07/2008 (a)(b) |
|
| 800,000 |
|
| 3,510,000 |
| Springfield Industrial Development Authority Revenue, DMP Properties LLC (LOC: U.S. Bank N.A.) 2.752%, 05/07/2008 (a)(b) |
|
| 3,510,000 |
|
| 2,000,000 |
| St. Joseph Industrial Development Authority Industrial Development Revenue, Albaugh Inc.—Series A (LOC: U.S. Bank N.A.) 2.852%, 05/07/2008 (a)(b) |
|
| 2,000,000 |
|
|
|
|
|
|
| ||
|
|
|
|
|
| 32,290,000 |
|
|
|
|
|
|
| ||
Multistate—14.0% |
|
|
|
| |||
| 11,220,000 |
| Class B Revenue Bond Certificates—Series Trust 2004-1 (CS: AIG Retirement Services) 2.822%, 05/07/2008 (a)(b) |
|
| 11,220,000 |
|
| 9,745,000 |
| Class B Revenue Bond Certificates —Series Trust 2006-1 (CS: AIG) 2.822%, 05/07/2008 (a)(b) |
|
| 9,745,000 |
|
| 3,100,000 |
| Revenue Bond Certificate Series Trust 2004-13, Centennial 2.822%, 05/07/2008 (a)(b) |
|
| 3,100,000 |
|
| 5,000,000 |
| Revenue Bond Certificate Series Trust 2005-1 (CS: AIG) 2.822%, 05/07/2008 (a)(b) |
|
| 5,000,000 |
|
| 5,000,000 |
| Revenue Bond Certificate Series Trust 2006-2, Meridian Apartments (CS: AIG) 2.822%, 05/07/2008 (a)(b) |
|
| 5,000,000 |
|
| 2,000,000 |
| Revenue Bond Certificate Series Trust 2006-4, Wildwood Branch (CS: AIG) 2.822%, 05/07/2008 (a)(b) |
|
| 2,000,000 |
|
| 4,825,000 |
| Revenue Bond Certificate Series Trust Revenue Bond (CS: AIG) 2.822%, 05/07/2008 (a)(b) |
|
| 4,825,000 |
|
| 10,700,000 |
| Revenue Bond Certificate Series Trust Variable State Revenue Bonds (LOC: California Bank and Trust) 2.673%, 05/07/2008 (a)(b) |
|
| 10,700,000 |
|
| 6,820,000 |
| Revenue Bond Certificate Series Trust Variable, Bent Tree Town (CS: AIG) 2.822%, 05/07/2008 (a)(b) |
|
| 6,820,000 |
|
| 4,317,000 |
| Revenue Bond Certificate Series Trust Variable, North Oak (CS: AIG Retirement Services) 2.822%, 05/07/2008 (a)(b) |
|
| 4,317,000 |
|
| 17,100,000 |
| Sunamerica Trust Variable Revenue Bonds (CS: Freddie Mac) 2.673%, 05/07/2008 (a)(b) |
|
| 17,100,000 |
|
|
|
|
|
|
| ||
|
|
|
|
|
| 79,827,000 |
|
|
|
|
|
|
| ||
Principal |
| Security |
| Value |
| ||
|
|
| |||||
|
|
|
|
|
|
|
|
Municipal Bonds—continued |
|
|
|
| |||
Nevada—3.2% |
|
|
|
| |||
$ | 5,275,000 |
| Clark Country Airport Revenue (CS: AMBAC) 3.520%, 05/07/2008 (a)(b) |
| $ | 5,275,000 |
|
| 13,000,000 |
| Clark County Passenger Facility Various Rate Revenue Refunding 4.488%, 05/07/2008 (a)(b) |
|
| 13,000,000 |
|
|
|
|
|
|
| ||
|
|
|
|
|
| 18,275,000 |
|
|
|
|
|
|
| ||
New Hampshire—0.5% |
|
|
|
| |||
| 3,000,000 |
| New Hampshire Health & Education Facilities Revenue 3.490%, 04/22/2009 (b) |
|
| 3,014,172 |
|
|
|
|
|
|
| ||
New Mexico—0.4% |
|
|
|
| |||
| 2,050,000 |
| Las Cruces Industrial Development Revenue, Parkview Metal Products (LOC: American National Bank & Trust) 2.992%, 05/07/2008 (a)(b) |
|
| 2,050,000 |
|
|
|
|
|
|
| ||
New York—0.2% |
|
|
|
| |||
| 225,000 |
| Erie County Industrial Development Agency Revenue, B&G Properties and Diversified Control Inc.—Class B (LOC: HSBC) 2.742%, 05/07/2008 (a)(b) |
|
| 225,000 |
|
| 630,000 |
| New York City Industrial Development Agency Civic Revenue, Peninsula Hospital Center (LOC: JP Morgan Chase Bank) 2.992%, 05/07/2008 (a)(b) |
|
| 630,000 |
|
| 340,200 |
| New York City Industrial Development Revenue, Abigail Press Inc. (LOC: JP Morgan Chase Bank) 3.490%, 05/07/2008 (a)(b) |
|
| 340,200 |
|
|
|
|
|
|
| ||
|
|
|
|
|
| 1,195,200 |
|
|
|
|
|
|
| ||
Ohio—7.8% |
|
|
|
| |||
| 640,000 |
| Cuyahoga County Industrial Development Revenue, Edge Seal Technologies (LOC: Firstmerit Bank) 2.673%, 05/07/2008 (a)(b) |
|
| 640,000 |
|
| 925,000 |
| Eastlake Ohio Industrial Development Revenue 2.992%, 05/07/2008 (a)(b) |
|
| 925,000 |
|
| 10,000,000 |
| Franklin County Ohio Health Care Refund Improvement (LOC: National City Bank) 2.723%, 05/07/2008 (a)(b) |
|
| 10,000,000 |
|
| 775,000 |
| Franklin County Ohio Industrial Development Refund Revenue (LOC: National City Bank) 3.989%, 05/07/2008 (a)(b) |
|
| 775,000 |
|
| 7,800,000 |
| Huron County Hospital Facilities Revenue Bonds 4.986%, 05/07/2008 (a)(b) |
|
| 7,800,000 |
|
| 6,000,000 |
| Louisville Healthcare Variable Bonds, St. Joseph Care Center (LOC: First Merit Bank) 2.673%, 05/07/2008 (a)(b) |
|
| 6,000,000 |
|
The accompanying notes are an integral part of the financial statements.
42
Alpine Municipal Money Market Fund |
|
Schedule of Portfolio Investments—Continued
April 30, 2008 (Unaudited)
Principal |
| Security |
| Value |
| ||
|
|
| |||||
Municipal Bonds—continued |
|
|
|
| |||
Ohio—continued |
|
|
|
| |||
$ | 5,750,000 |
| Mahoning County Hospital Facilities Variable Revenue, Mohoning Valley Hospital, Inc. (LOC: Huntington National Bank) 2.942%, 05/07/2008 (a)(b) |
| $ | 5,750,000 |
|
| 1,730,000 |
| Portage County Health Care Facilities Revenue, Hattie Larlham Center (LOC: National City Bank) 2.992%, 05/07/2008 (a)(b) |
|
| 1,730,000 |
|
| 1,235,000 |
| Portage County Industrial Development Revenue, Allen Aircraft Products (LOC: National City Bank) 2.942%, 05/07/2008 (a)(b) |
|
| 1,235,000 |
|
| 585,000 |
| Portage County Industrial Development Revenue, NCSP LP (LOC: Huntington National Bank) 3.191%, 05/07/2008 (a)(b) |
|
| 585,000 |
|
| 2,210,000 |
| Portage County Industrial Development Revenue, NCSP LP (LOC: Huntington National Bank) 4.587%, 05/07/2008 (a)(b) |
|
| 2,210,000 |
|
| 1,950,000 |
| Richland County Industrial Development Revenue, Mansfield Motel Partnership (LOC: Huntington National Bank) 3.092%, 05/07/2008 (a)(b) |
|
| 1,950,000 |
|
| 5,130,000 |
| Summit County Port Authority, American Original Building (LOC: First Merit Bank) 2.762%, 05/07/2008 (a)(b) |
|
| 5,130,000 |
|
|
|
|
|
|
| ||
|
|
|
|
|
| 44,730,000 |
|
|
|
|
|
|
| ||
Oklahoma—4.4% |
|
|
|
| |||
| 25,000,000 |
| DFA Municipal Trust Various States (CS: MBIA) (LOC: Depfa Bank PLC) 2.822%, 05/07/2008 (a)(b) |
|
| 25,000,000 |
|
|
|
|
|
|
| ||
Oregon—0.1% |
|
|
|
| |||
| 500,000 |
| Economic Development Variable Revenue, Patrick Industries Inc. (LOC: Bank One N.A.) 3.191%, 05/07/2008 (a)(b) |
|
| 500,000 |
|
|
|
|
|
|
| ||
Pennsylvania—2.8% |
|
|
|
| |||
| 3,975,000 |
| Allegheny Country Industrial Development Authority Health & Housing Facility, Longwood, Senior Series 2.842%, 05/01/2008 (a)(b) |
|
| 3,975,000 |
|
| 1,400,000 |
| Allegheny Country Industrial Development Revenue 2.842%, 05/01/2008 (a)(b) |
|
| 1,400,000 |
|
| 1,000,000 |
| Erie County Industrial Development Authority Revenue, Snap-Tite Inc. (LOC: National City Bank) 2.942%, 05/07/2008 (a)(b) |
|
| 1,000,000 |
|
| 600,000 |
| Lebanon County Health Facilities Revenue 4.986%, 05/07/2008 (a)(b) |
|
| 600,000 |
|
Principal |
| Security |
| Value |
| ||
|
|
| |||||
Municipal Bonds—continued |
|
|
|
| |||
Pennsylvania—continued |
|
|
|
| |||
$ | 1,950,000 |
| Lehigh County General Purpose Revenue 5.335%, 05/01/2008 (a)(b) |
| $ | 1,950,000 |
|
| 3,100,000 |
| Lehigh County General Purpose Variable Rate Revenue 4.139%, 05/01/2008 (a)(b) |
|
| 3,100,000 |
|
| 3,855,000 |
| Somerset County Hospital Authority Revenue 4.488%, 05/07/2008 (a)(b) |
|
| 3,855,000 |
|
|
|
|
|
|
| ||
|
|
|
|
|
| 15,880,000 |
|
|
|
|
|
|
| ||
Rhode Island—0.2% |
|
|
|
| |||
| 900,000 |
| Industrial Facilities Corporation Development Revenue, Greystone of Lincoln Project (LOC: Citizens Bank NA) 2.693%, 05/07/2008 (a)(b) |
|
| 900,000 |
|
|
|
|
|
|
| ||
South Carolina—0.0% |
|
|
|
| |||
| 155,000 |
| Hampton County Industrial Development Revenue Bonds, Carolina Soya LLC (LOC: AGSOUTH Farm Credit ACA) 2.723%, 05/07/2008 (a)(b) |
|
| 155,000 |
|
|
|
|
|
|
| ||
Tennessee—1.7% |
|
|
|
| |||
| 1,600,000 |
| Huntingdon Industrial Development Board Revenue, Associates Rubber Co. (LOC: Suntrust Bank) 2.882%, 05/07/2008 (a)(b) |
|
| 1,600,000 |
|
| 4,365,000 |
| Metropolitan Government Nashville and Davidson Variable Revenue (LOC: Regions Bank) 2.762%, 05/07/2008 (a)(b) |
|
| 4,365,000 |
|
| 400,000 |
| Rutherford County Industrial Development Board, Square D Company (LOC: Societe Generale) 4.587%, 05/07/2008 (a)(b) |
|
| 400,000 |
|
| 3,345,000 |
| Sevier County Public Building Authority Government Public Improvement Series IV 4.238%, 05/01/2008 (a)(b) |
|
| 3,345,000 |
|
|
|
|
|
|
| ||
|
|
|
|
|
| 9,710,000 |
|
|
|
|
|
|
| ||
Texas—10.2% |
|
|
|
| |||
| 1,925,000 |
| Archer City Growth & Development, Pork Products II (LOC: Bank of Oklahoma N.A.)2.673%, 05/07/2008 (a)(b) |
|
| 1,925,000 |
|
| 4,500,000 |
| Brazos River Harbor Navigation District Variable Revenue Bonds 3.042%, 05/07/2008 (a)(b) |
|
| 4,500,000 |
|
| 2,800,000 |
| North Central Texas Health Facilities Development Hospital Revenue 3.640%, 05/01/2008 (a)(b) |
|
| 2,800,000 |
|
| 4,970,000 |
| North Central Texas Health Facilities Development Variable Rate Hospital Revenue 2.992%, 05/30/2008 (a)(b) |
|
| 4,970,000 |
|
The accompanying notes are an integral part of the financial statements.
43
Alpine Municipal Money Market Fund |
|
Schedule of Portfolio Investments—Continued
April 30, 2008 (Unaudited)
Principal |
| Security |
|
| Value |
| |
|
| ||||||
Municipal Bonds—continued |
|
|
|
| |||
Texas—continued |
|
|
|
| |||
$ | 32,500,000 |
| Port Corpus Christi Authority Nueces County Solid Waste Disposal, Flint Hills Resources LP (CS: Flint Hills Resources) 3.092%, 05/07/2008 (a)(b) |
| $ | 32,500,000 |
|
| 11,600,000 |
| Port Corpus Christi Authority Nueces County Solid Waste Disposal, Flint Hills Resources LP —Series A (CS: Flint Hills Resources) 2.722%, 05/07/2008 (a)(b) |
|
| 11,600,000 |
|
|
|
|
|
|
| ||
|
|
|
|
|
| 58,295,000 |
|
|
|
|
|
|
| ||
Utah—0.4% |
|
|
|
| |||
| 2,500,000 |
| Housing Corporation Multifamily Revenue, Todd Hollow Apartments—A (CS: AIG Retirement Services) 2.822%, 05/07/2008 (a)(b) |
|
| 2,500,000 |
|
|
|
|
|
|
| ||
Virginia—0.5% |
|
|
|
| |||
| 1,000,000 |
| Brunswick County Industrial Development Authority, Aegis Waste Solutions Inc. (LOC: Credit Suisse First Boston) 3.092%, 05/07/2008 (a)(b) |
|
| 1,000,000 |
|
| 2,000,000 |
| Campbell County Various Industrial Development Authority Solid Waste Disposal Facilities 3.092%, 05/07/2008 (a)(b) |
|
| 2,000,000 |
|
|
|
|
|
|
| ||
|
|
|
|
|
| 3,000,000 |
|
|
|
|
|
|
| ||
Washington—1.8% |
|
|
|
| |||
| 1,110,000 |
| Economic Development Finance Authority Revenue, Belina Interiors Inc.—Series F (LOC: Keybank N.A.) 2.673%, 05/07/2008 (a)(b) |
|
| 1,110,000 |
|
| 2,745,000 |
| Economic Development Finance Authority Revenue, Wesmar Co. Inc., Project—Series F (LOC: U.S. Bank N.A.) 2.673%, 05/07/2008 (a)(b) |
|
| 2,745,000 |
|
| 6,125,000 |
| Port Bellingham Industrial Development Variable Revenue, Hempler Foods Group (LOC: Bank of Montreal) 2.613%, 05/07/2008 (a)(b) |
|
| 6,125,000 |
|
|
|
|
|
|
| ||
|
|
|
|
|
| 9,980,000 |
|
|
|
|
|
|
| ||
Wisconsin—4.1% |
|
|
|
| |||
| 400,000 |
| Elkhorn Industrial Development Adjustable Revenue Bonds, Lanco Precision Plus 3.590%, 05/07/2008 (a)(b) |
|
| 400,000 |
|
| 2,825,000 |
| Fox Lake Redevelopment Authority Revenue, Karavan Trailers Inc. (LOC: Associated Bank N.A.) 2.782%, 05/07/2008 (a)(b) |
|
| 2,825,000 |
|
Principal |
| Security |
|
| Value |
| |
|
|
| |||||
Municipal Bonds—continued |
|
|
|
| |||
Wisconsin—continued |
|
|
|
| |||
$ | 980,000 |
| Franklin Industrial Development Revenue, Howard Henz Co., Inc. (LOC: Associated Bank N.A.) 3.241%, 05/07/2008 (a)(b) |
| $ | 980,000 |
|
| 1,750,000 |
| Franklin Industrial Development Revenue, Smyczek/ECS Project (LOC: Wells Fargo Bank N.A.) 3.092%, 05/07/2008 (a)(b) |
|
| 1,750,000 |
|
| 3,900,000 |
| Hull Industrial Development Revenue, Welcome Dairy, Inc. (LOC: Associated Bank N.A.) 2.752%, 05/07/2008 (a)(b) |
|
| 3,900,000 |
|
1,000,000 |
| Mequon Industrial Development Revenue (LOC: Bank One Wisconsin) 3.092%, 05/07/2008 (a)(b) |
|
| 1,000,000 |
| |
| 3,000,000 |
| Red Cedar Industrial Development Revenue (LOC: National City Bank) 3.750%, 05/07/2008 (a)(b) |
|
| 3,000,000 |
|
| 1,730,000 |
| Reedsburg Industrial Development Revenue, Cellox LLC (LOC: Associated Bank N.A.) 3.241%, 05/07/2008 (a)(b) |
|
| 1,730,000 |
|
| 1,550,000 |
| Rhinelander Industrial Development Revenue, Superior Diesel/ SDI Properites (LOC: Associated Bank N.A.) 3.241%, 05/07/2008 (a)(b) |
|
| 1,550,000 |
|
| 1,690,000 |
| Sheboygan Industrial Development Revenue, Polyfab & Gill-Janssen (LOC: Associated Bank N.A.) 2.782%, 05/07/2008 (a)(b) |
|
| 1,690,000 |
|
| 1,535,000 |
| Sturtevant Industrial Development Variable Revenue, Andis Company 2.673%, 05/07/2008 (a)(b) |
|
| 1,535,000 |
|
| 3,000,000 |
| Wisconsin State Health & Educational Facilities Revenue 7.978%, 05/07/2008 (a)(b) |
|
| 3,000,000 |
|
|
|
|
|
|
| ||
|
|
|
|
|
| 23,360,000 |
|
|
|
|
|
|
| ||
|
|
| Total Municipal Bonds |
|
| 544,988,372 |
|
|
|
|
|
|
| ||
Money Market Funds—0.9% |
|
|
|
| |||
| 82,343 |
| SEI Tax Exempt Trust—Institutional Tax Free Portfolio—A |
|
| 82,343 |
|
| 4,775,450 |
| Midwest Tax Exempt Bond Trust |
|
| 4,775,450 |
|
|
|
|
|
|
| ||
|
|
| Total Money Market Funds |
|
| 4,857,793 |
|
|
|
|
|
|
| ||
|
|
| Total Investments |
|
|
|
|
|
|
| (Cost $549,846,165)—96.4% |
|
| 549,846,165 |
|
|
|
| Other Assets in Excess of Liabilities—3.6% |
|
| 20,689,178 |
|
|
|
|
|
|
| ||
|
|
| TOTAL NET ASSETS—100.0% |
| $ | 570,535,343 |
|
|
|
|
|
|
| ||
The accompanying notes are an integral part of the financial statements.
44
Alpine Municipal Money Market Fund |
|
Schedule of Portfolio Investments—Continued
April 30, 2008 (Unaudited)
______________Percentages are stated as a percent of net assets.
(a) | Variable Rate Security—The rate reported is the rate in effect as of April 30, 2008. The date shown is the next reset date. |
(b) | Maturity date represents first available put date. |
(c) | Put Bond |
CS—Credit Support Guarantor
LOC—Letter of Credit
The accompanying notes are an integral part of the financial statements.
45
Alpine Ultra Short Tax Optimized Income Fund |
|
Schedule of Portfolio Investments
April 30, 2008 (Unaudited)
Principal |
| Security |
|
| Value |
| |
|
| ||||||
Municipal Bonds—102.0% |
|
|
|
| |||
Alabama—7.5% |
|
|
|
| |||
$ | 3,215,000 |
| Housing Financial Authority Multi Family Housing Revenue, Park Towne Villas (LOC: Colonial Bank) 5.300%, 09/01/2008 (c) |
| $ | 3,215,000 |
|
|
|
| Mcintosh Industrial Development Board Environmental Impact Revenue, Ciba Specialty Chemicals |
|
|
|
|
| 3,000,000 |
| 5.984%, 05/01/2008 |
|
| 3,000,000 |
|
| 3,200,000 |
| 6.083%, 05/01/2008 |
|
| 3,200,000 |
|
| 1,000,000 |
| Tuscaloosa Alaska Educational Building Authority, Sillman College Project, Series—A 5.000%, 06/01/2008 |
|
| 1,000,170 |
|
|
|
|
|
|
| ||
|
|
|
|
|
| 10,415,170 |
|
|
|
|
|
|
| ||
Arizona—4.7% |
|
|
|
| |||
| 1,000,000 |
| Phoenix Industrial Development Revenue (LOC: Deutsche Bank Trust Services) 4.000%, 10/01/2008 (a) (b) |
|
| 1,000,000 |
|
| 5,500,000 |
| Scottsdale Industrial Development Authority Variable Hospital Revenue 4.890%, 05/07/2008 (a) (b) |
|
| 5,500,000 |
|
|
|
|
|
|
| ||
|
|
|
|
|
| 6,500,000 |
|
|
|
|
|
|
| ||
California—4.2% |
|
|
|
| |||
| 5,850,000 |
| Vallejo Certicficates Participation 4.687%, 05/07/2008 (a) (b) |
|
| 5,850,000 |
|
|
|
|
|
|
| ||
Colorado—0.3% |
|
|
|
| |||
| 500,000 |
| Walker Field Public Airport Authority Airport Revenue 4.100%, 12/01/2008 |
|
| 498,870 |
|
|
|
|
|
|
| ||
Florida—2.3% |
|
|
|
| |||
| 3,250,000 |
| Volusia County Housing Finance Authority Multifamily Housing Revenue, Cape Morris Cove Partners (LOC: Washington Mutual Bank) 3.989%, 05/07/2008 (a) (b) |
|
| 3,250,000 |
|
|
|
|
|
|
| ||
Georgia—1.8% |
|
|
|
| |||
| 2,000,000 |
| Burke County Development Authority Pollution Revenue 4.375%, 04/01/2010 (a) (b) |
|
| 1,995,580 |
|
| 500,000 |
| Douglas County Development Authority Industrial Revenue 3.989%, 05/07/2008 (a) (b) |
|
| 500,000 |
|
|
|
|
|
|
| ||
|
|
|
|
|
| 2,495,580 |
|
|
|
|
|
|
| ||
Illinois—4.5% |
|
|
|
| |||
| 700,000 |
| Des Plaines Industrial Development Revenue 3.490%, 05/07/2008 (a) (b) |
|
| 700,000 |
|
| 3,820,000 |
| Granite City Solid Waste Revenue 4.875%, 05/03/2010 |
|
| 3,820,000 |
|
| 500,000 |
| Illinois Development Financial Authority Industrial Revenue 3.989%, 05/07/2008 (a) (b) |
|
| 500,000 |
|
| 1,220,000 |
| Salem Industrial Development Revenue (LOC: Regions Bank) 7.978%, 05/07/2008 (a) (b) |
|
| 1,220,000 |
|
|
|
|
|
|
| ||
|
|
|
|
|
| 6,240,000 |
|
|
|
|
|
|
| ||
| Principal |
| Security |
|
| Value |
|
|
| ||||||
Municipal Bonds—continued |
|
|
|
| |||
Kansas—0.5% |
|
|
|
| |||
$ | 680,000 |
| Lenexa Kansas Health Care Facility Revenue, Lakeview Village Inc. 5.000%, 05/15/2008 |
| $ | 680,102 |
|
|
|
|
|
|
| ||
Kentucky—3.4% |
|
|
|
| |||
| 900,000 |
| Bardstown Industrial Revenue (LOC: Bank One Michigan) 8.477%, 05/07/2008 (a) (b) |
|
| 900,000 |
|
| 850,000 |
| Florence Industrial Building Revenue Adjustable Rate, Turfway Pro Center LP 4.100%, 10/01/2008 |
|
| 853,468 |
|
| 3,035,000 |
| Meade County Industrial Building Revenue 4.218%, 05/07/2008 (a) (b) |
|
| 3,035,000 |
|
|
|
|
|
|
| ||
|
|
|
|
|
| 4,788,468 |
|
|
|
|
|
|
| ||
Louisiana—3.7% |
|
|
|
| |||
| 600,000 |
| Caddo-Bossier Parishes Port Commission, Shreveport Fabrications (LOC: Hibernia National Bank) 3.540%, 05/07/2008 (a) (b) |
|
| 600,000 |
|
| 4,600,000 |
| Jefferson Parish Industrial Development Board Industrial Revenue Bonds, Sara Lee Corp. 7.878%, 05/01/2008 (a) (b) |
|
| 4,600,000 |
|
|
|
|
|
|
| ||
|
|
|
|
|
| 5,200,000 |
|
|
|
|
|
|
| ||
Massachusetts—0.6% |
|
|
|
| |||
| 820,000 |
| State Industrial Finance Agency Revenue, Asahi/America, Inc. (LOC: Citizens Bank of Massachusetts) 3.125%, 03/01/2009 |
|
| 819,680 |
|
|
|
|
|
|
| ||
Michigan—0.7% |
|
|
|
| |||
| 900,000 |
| Oakland County Economic Development Limited Obligation Revenue (LOC: Bank One Michigan) 8.477%, 05/07/2008 (a) (b) |
|
| 900,000 |
|
|
|
|
|
|
| ||
Minnesota—1.5% |
|
|
|
| |||
| 2,100,000 |
| St. Paul Housing & Redevelopment Authority Revenue, Sholom Home East Inc. (LOC: Bremer Bank) 4.238%, 05/07/2008 (a) (b) |
|
| 2,100,000 |
|
|
|
|
|
|
| ||
Missouri—0.6% |
|
|
|
| |||
| 900,000 |
| Kansas City Industrial Development Revenue 6.083%, 05/07/2008 (a) (b) |
|
| 900,000 |
|
|
|
|
|
|
| ||
Multistate—3.0% |
|
|
|
| |||
| 4,900,000 |
| Theop LLC (Acquired 7/25/2007, Cost $4,900,000) 4.687%, 01/01/2039 (a) (b) (d) (e) |
|
| 4,248,300 |
|
|
|
|
|
|
| ||
Nevada—0.5% |
|
|
|
| |||
| 700,000 |
| Nevada Housing Division (LOC: U.S. Bank N.A.) 3.900%, 04/01/2009 |
|
| 704,361 |
|
|
|
|
|
|
| ||
The accompanying notes are an integral part of the financial statements.
46
Alpine Ultra Short Tax Optimized Income Fund |
Schedule of Portfolio Investments—Continued
April 30, 2008 (Unaudited)
Principal |
| Security |
| Value |
| ||
|
| ||||||
Municipal Bonds—continued |
|
|
|
| |||
New Jersey—3.7% |
|
|
|
| |||
|
|
| Bayonne General Obligations Notes |
|
|
|
|
$ | 1,500,000 |
| 5.000%, 09/18/2008 |
| $ | 1,512,990 |
|
| 1,300,000 |
| 5.000%, 10/24/2008 |
|
| 1,314,014 |
|
| 230,000 |
| Health Care Facility, Trinitas Hospital, Series—B, Taxable 6.500%, 07/01/2012 |
|
| 233,045 |
|
| 1,035,000 |
| Tobacco Settlement Finance Corporation 5.750%, 06/01/2012 |
|
| 1,113,722 |
|
| 1,000,000 |
| Wanaque Valley Regional Sewage Authority Temp Fund Notes 5.000%, 09/26/2008 |
|
| 1,008,640 |
|
|
|
|
|
| |||
|
|
|
|
|
| 5,182,411 |
|
|
|
|
|
| |||
New Mexico—0.7% |
|
|
|
| |||
| 940,000 |
| Las Cruces Industrial Development Revenue, Parkview Metal Products 2.992%, 05/07/2008 (a) (b) |
|
| 940,000 |
|
|
|
|
|
| |||
New York—1.0% |
|
|
|
| |||
| 310,000 |
| Erie County Industrial Development Agency, Rosina Foods Products (LOC: HSBC Bank N.A.) 5.086%, 05/07/2008 (a) (b) |
|
| 310,000 |
|
| 590,000 |
| Seneca County Industrial Development Agency Civic Facility Revenue, Chiropratic College 5.000%, 10/01/2009 |
|
| 601,204 |
|
| 500,000 |
| Westchester Tobacco Asset Securitization Corporation 5.000%, 06/01/2015 |
|
| 477,635 |
|
|
|
|
|
| |||
|
|
|
|
|
| 1,388,839 |
|
|
|
|
|
| |||
North Carolina—1.4% |
|
|
|
| |||
| 675,000 |
| Medical Care Commission Health Care Facilities Revenue, Salemtowne 4.250%, 10/01/2008 |
|
| 673,576 |
|
| 1,300,000 |
| North Carolina State Education Assistance Student Loan Revenue (CS: AMBAC) 4.488%, 05/07/2008 (a) (b) |
|
| 1,300,000 |
|
|
|
|
|
| |||
|
|
|
|
|
| 1,973,576 |
|
|
|
|
|
| |||
Ohio—7.6% |
|
|
|
| |||
| 5,500,000 |
| Franklin County Ohio Hospital Revenue 7.978%, 05/07/2008 (a) (b) |
|
| 5,500,000 |
|
| 500,000 |
| Summit County Industrial Development Revenue (LOC: First Merit Bank N.A.) 8.477%, 05/07/2008 (a) (b) |
|
| 500,000 |
|
| 4,600,000 |
| Trumbull County Health Care Facilities Revenue, Shepherd of the Valley Lutheran (CS: Radian) 5.984%, 05/01/2008 (a) (b) |
|
| 4,600,000 |
|
|
|
|
|
| |||
|
|
|
|
|
| 10,600,000 |
|
|
|
|
|
| |||
Principal |
| Security |
| Value |
| ||
|
| ||||||
Municipal Bonds—continued |
|
|
|
| |||
Oklahoma—0.5% |
|
|
|
| |||
$ | 800,000 |
| Cherokee Nation Of Oklahoma National Healthcare System (CS: ACA) 4.100%, 12/01/2011 (e) |
| $ | 783,248 |
|
|
|
|
|
| |||
Pennsylvania—19.0% |
|
|
|
| |||
| 4,560,000 |
| Berks County Industrial Development Authority Revenue3.989%, 05/07/2008 (a) (b) |
|
| 4,560,000 |
|
| 2,000,000 |
| Economic Development Financing Authority Exempt Facilities Revenue, PSEG Power LLC 4.000%, 01/15/2009 |
|
| 2,003,460 |
|
| 2,380,000 |
| Lancaster Industrial Development Revenue 3.989%, 05/07/2008 (a) (b) |
|
| 2,380,000 |
|
| 5,700,000 |
| Lebanon County Health Facilities Revenue 4.986%, 05/07/2008 (a) (b) |
|
| 5,700,000 |
|
| 5,000,000 |
| Lehigh County General Purpose Revenue 5.335%, 05/01/2008 (a) (b) |
|
| 5,000,000 |
|
| 530,000 |
| Montgomery County Industrial Development Variable Revenue 5.984%, 05/01/2008 (a) (b) |
|
| 530,000 |
|
| 5,700,000 |
| Pennsylvania Economic Development Financing Revenue 4.189%, 05/07/2008 (a) (b) |
|
| 5,700,000 |
|
|
|
|
|
| |||
|
|
|
|
|
| 25,873,460 |
|
|
|
|
|
| |||
Puerto Rico—1.3% |
|
|
|
| |||
|
|
| Puerto Rico Commonwealth |
|
|
|
|
| 870,000 |
| 5.000%, 07/01/2008 |
|
| 870,951 |
|
| 1,000,000 |
| 6.000%, 07/01/2008 |
|
| 1,003,800 |
|
|
|
|
|
| |||
|
|
|
|
|
| 1,874,751 |
|
|
|
|
|
| |||
Tennessee—6.4% |
|
|
|
| |||
| 4,050,000 |
| Knox County Health Educational & Housing Hospital Revenue Refunding and Improvement 4.490%, 05/07/2008 (a) (b) |
|
| 4,050,000 |
|
| 4,800,000 |
| Shelby County Tennessee Health Educational and Housing Facilities Revenue 4.500%, 09/01/2016 (a) (b) |
|
| 4,800,000 |
|
|
|
|
|
| |||
|
|
|
|
|
| 8,850,000 |
|
|
|
|
|
| |||
Texas—11.1% |
|
|
|
| |||
| 5,200,000 |
| Dallas Fort Worth International Airport Putters—Series 350 (CS: MBIA) 3.271%, 05/07/2008 (a) (b) |
|
| 5,200,000 |
|
| 5,500,000 |
| Gulf Coast Industrial Development Authority Revenue Bonds, CST Green Power LP 6.831%, 05/07/2008 (a) (b) |
|
| 5,500,000 |
|
| 1,700,000 |
| North Central Texas Health Facilities Development Variable Rate Hospital Revenue 2.992%, 05/30/2008 (a) (b) |
|
| 1,700,000 |
|
The accompanying notes are an integral part of the financial statements.
47
Alpine Ultra Short Tax Optimized Income Fund |
Schedule of Portfolio Investments—Continued
April 30, 2008 (Unaudited)
Shares/ |
| Security |
| Value |
| ||
|
| ||||||
Municipal Bonds—continued |
|
|
|
| |||
Texas—continued |
|
|
|
| |||
$ | 3,000,000 |
| North Texas Tollway Authority Revenue Board 4.125%, 11/19/2008 |
| $ | 3,003,420 |
|
|
|
|
|
| |||
|
|
|
|
|
| 15,403,420 |
|
|
|
|
|
| |||
West Virginia—4.3% |
|
|
|
| |||
| 6,000,000 |
| West Virginia State Hospital Financial Authority Revenue4.986%, 05/07/2008 (a) (b) |
|
| 6,000,000 |
|
|
|
|
|
| |||
Wisconsin—3.1% |
|
|
|
| |||
| 585,000 |
| Appleton Industrial Development Revenue 3.989%, 05/07/2008 (a) (b) |
|
| 585,000 |
|
| 3,700,000 |
| Wisconsin State Health & Education 5.485%, 05/01/2008 (a) (b) |
|
| 3,700,000 |
|
|
|
|
|
| |||
|
|
|
|
|
| 4,285,000 |
|
|
|
|
|
| |||
Shares/ |
| Security |
|
| Value |
| |
|
| ||||||
|
|
|
|
|
|
| |
Municipal Bonds—continued |
|
|
|
| |||
Wyoming—2.1% |
|
|
|
| |||
$ | 2,855,000 |
| Gillette Environmental Improvement Revenue 4.587%, 05/07/2008 (a) (b) |
| $ | 2,855,000 |
|
|
|
|
|
| |||
|
|
| Total Municipal Bonds |
|
| 141,600,236 |
|
|
|
|
|
| |||
Short-Term Investments—0.1% |
|
|
|
| |||
| 104,365 |
| SEI Tax Exempt Trust—Institutional Tax Free Portfolio—A |
|
| 104,365 |
|
|
|
|
|
| |||
|
|
| Total Short-Term Investments |
|
| 104,365 |
|
|
|
|
|
| |||
|
|
| Total Investments (Cost $142,229,839)—102.1% |
|
| 141,704,601 |
|
|
|
| Liabilities in Excess of Other Assets—(2.1)% |
|
| (2,853,800 | ) |
|
|
|
|
| |||
|
|
| TOTAL NET ASSETS—100.0% |
| $ | 138,850,801 |
|
|
|
|
|
| |||
Percentages are stated as a percent of net assets.
(a) | Variable Rate Security- The rate reported is the rate in effect as of April 30, 2008. The date shown is the next reset date. |
(b) | Maturity date represents first put date. |
(c) | Put Bond |
(d) | Auction Rate Note |
(e) | Restricted under Rule 144A of the Securities Act of 1933. These securities may be resold in transactions from registration, normally to qualified institutional buyers. These securities have been determined to be liquid under guidelines established by the Board of Trustees. Securities restricted under Rule 144A comprised 3.6% of the Fund’s net assets. |
CS—Credit Support
LOC—Letter of Credit
The accompanying notes are an integral part of the financial statements.
48
Alpine Mutual Funds |
|
Statements of Assets and Liabilities
April 30, 2008 (Unaudited)
|
| Dynamic |
| Dynamic |
| Dynamic |
| Dynamic |
| Dynamic |
| |||||
|
|
|
|
|
|
| ||||||||||
ASSETS: |
|
|
|
|
|
|
|
|
|
|
|
|
|
|
|
|
Investments, at value (1) |
| $ | 78,942,516 |
| $ | 1,254,474,703 |
| $ | 11,840,206 |
| $ | 42,328,425 |
| $ | 4,350,327 |
|
Cash |
|
| — |
|
| — |
|
| 600 |
|
| — |
|
| — |
|
Dividends and interest receivable |
|
| 355,656 |
|
| 21,592,800 |
|
| 8,945 |
|
| 26,266 |
|
| 2,028 |
|
Receivable for capital shares issued |
|
| 800 |
|
| 4,774,431 |
|
| 1,050 |
|
| 16,602 |
|
| 150 |
|
Receivable for investment securities sold |
|
| 1,187,947 |
|
| 74,638,019 |
|
| 2,235,670 |
|
| 591,732 |
|
| — |
|
Due from Adviser |
|
| — |
|
| — |
|
| — |
|
| — |
|
| 29,955 |
|
Prepaid expenses and other assets |
|
| 14,059 |
|
| 50,079 |
|
| 10,238 |
|
| 8,973 |
|
| 3,345 |
|
|
|
|
|
|
|
| ||||||||||
Total assets |
|
| 80,500,978 |
|
| 1,355,530,032 |
|
| 14,096,709 |
|
| 42,971,998 |
|
| 4,385,805 |
|
|
|
|
|
|
|
| ||||||||||
LIABILITIES: |
|
|
|
|
|
|
|
|
|
|
|
|
|
|
|
|
Options written, at value (2) |
|
| 917,590 |
|
| — |
|
| — |
|
| — |
|
| — |
|
Payable for options written |
|
| 226,044 |
|
| — |
|
| — |
|
| — |
|
| — |
|
Payable to custodian |
|
| — |
|
| 1,142,566 |
|
| — |
|
| — |
|
| — |
|
Payable for investment securities purchased |
|
| 133,844 |
|
| 36,801,626 |
|
| 1,808,370 |
|
| 510,413 |
|
| 63,345 |
|
Payable for capital shares redeemed |
|
| — |
|
| 1,183,080 |
|
| 50,166 |
|
| 49,781 |
|
| — |
|
Accrued expenses and other liabilities: |
|
|
|
|
|
|
|
|
|
|
|
|
|
|
|
|
Investment advisory fees |
|
| 65,723 |
|
| 1,072,505 |
|
| 7,278 |
|
| 34,639 |
|
| — |
|
Line of credit |
|
| — |
|
| — |
|
| 682,000 |
|
| — |
|
| — |
|
Other |
|
| 80,516 |
|
| 604,998 |
|
| 22,002 |
|
| 18,412 |
|
| 11,455 |
|
|
|
|
|
|
|
| ||||||||||
Total liabilities |
|
| 1,423,717 |
|
| 40,804,775 |
|
| 2,569,816 |
|
| 613,245 |
|
| 74,800 |
|
|
|
|
|
|
|
| ||||||||||
Net Assets |
| $ | 79,077,261 |
| $ | 1,314,725,257 |
| $ | 11,526,893 |
| $ | 42,358,753 |
| $ | 4,311,005 |
|
|
|
|
|
|
|
| ||||||||||
Net assets represented by |
|
|
|
|
|
|
|
|
|
|
|
|
|
|
|
|
Capital stock |
| $ | 71,781,640 |
| $ | 1,578,104,479 |
| $ | 14,370,704 |
| $ | 46,375,778 |
| $ | 4,270,648 |
|
Accumulated undistributed net investment income (loss) |
|
| (71,939 | ) |
| 31,975,253 |
|
| 36,884 |
|
| 19,817 |
|
| 13,893 |
|
Accumulated net realized gains (losses) on investments, options contracts expired or closed, foreign currency translation, forward currency contracts and swaps |
|
| 3,149,485 |
|
| (207,474,328 | ) |
| 689,010 |
|
| (803,534 | ) |
| (36,931 | ) |
Net unrealized appreciation / depreciation on: |
|
|
|
|
|
|
|
|
|
|
|
|
|
|
|
|
Investments |
|
| 4,776,011 |
|
| (87,920,464 | ) |
| (3,569,765 | ) |
| (3,233,308 | ) |
| 63,395 |
|
Written options |
|
| (557,936 | ) |
| — |
|
| — |
|
| — |
|
| — |
|
Foreign currency translation |
|
| — |
|
| 40,317 |
|
| 60 |
|
| — |
|
| — |
|
|
|
|
|
|
|
| ||||||||||
Total Net Assets |
| $ | 79,077,261 |
| $ | 1,314,725,257 |
| $ | 11,526,893 |
| $ | 42,358,753 |
| $ | 4,311,005 |
|
|
|
|
|
|
|
| ||||||||||
Net asset value |
|
|
|
|
|
|
|
|
|
|
|
|
|
|
|
|
Net assets |
| $ | 79,077,261 |
| $ | 1,314,725,257 |
| $ | 11,526,893 |
| $ | 42,358,753 |
| $ | 4,311,005 |
|
Shares of beneficial interest issued and outstanding |
|
| 6,756,006 |
|
| 123,333,910 |
|
| 1,231,452 |
|
| 3,440,345 |
|
| 427,092 |
|
Net asset value, offering price and redemption price per share |
| $ | 11.70 |
| $ | 10.66 |
| $ | 9.36 |
| $ | 12.31 |
| $ | 10.09 |
|
|
|
|
|
|
|
| ||||||||||
(1) Cost of investments |
| $ | 74,166,505 |
| $ | 1,342,395,167 |
| $ | 15,409,971 |
| $ | 45,561,733 |
| $ | 4,286,932 |
|
(2) Premiums received |
| $ | 359,654 |
| $ | — |
| $ | — |
| $ | — |
| $ | — |
|
The accompanying notes are an integral part of the financial statements.
49
Alpine Mutual Funds |
|
Statements of Assets and Liabilities—Continued
April 30, 2008 (Unaudited)
|
| Municipal |
| Ultra Short |
| ||
|
|
|
| ||||
ASSETS: |
|
|
|
|
|
|
|
Investments, at value (1) |
| $ | 549,846,165 |
| $ | 141,704,601 |
|
Cash |
|
| 5,450 |
|
| — |
|
Interest receivable |
|
| 2,184,568 |
|
| 861,728 |
|
Receivable for capital shares issued |
|
| 41,849,226 |
|
| 3,892,906 |
|
Receivable for investment securities sold |
|
| — |
|
| 2,008,281 |
|
Prepaid expenses and other assets |
|
| 42,908 |
|
| 28,887 |
|
|
|
|
| ||||
Total assets |
|
| 593,928,317 |
|
| 148,496,403 |
|
|
|
|
| ||||
LIABILITIES: |
|
|
|
|
|
|
|
Payable for investment securities purchased |
|
| 7,800,000 |
|
| 9,052,378 |
|
Payable for capital shares redeemed |
|
| 14,353,687 |
|
| 81,894 |
|
Payable to custodian |
|
| — |
|
| 5,151 |
|
Accrued expenses and other liabilities: |
|
|
|
|
|
|
|
Investment advisory fees |
|
| 154,791 |
|
| 50,343 |
|
Distribution fees |
|
| 1,628 |
|
| 1,137 |
|
Distributions to shareholders |
|
| 1,040,849 |
|
| 439,871 |
|
Other |
|
| 42,019 |
|
| 14,828 |
|
|
|
|
| ||||
Total liabilities |
|
| 23,392,974 |
|
| 9,645,602 |
|
|
|
|
| ||||
Net Assets |
| $ | 570,535,343 |
| $ | 138,850,801 |
|
|
|
|
| ||||
Net assets represented by |
|
|
|
|
|
|
|
Capital stock |
| $ | 570,535,343 |
| $ | 139,417,181 |
|
Accumulated undistributed net investment income |
|
| — |
|
| 16,429 |
|
Accumulated net realized losses on investments |
|
| — |
|
| (57,571 | ) |
Net unrealized depreciation on investments |
|
| — |
|
| (525,238 | ) |
|
|
|
| ||||
Total Net Assets |
| $ | 570,535,343 |
| $ | 138,850,801 |
|
|
|
|
| ||||
Net asset value |
|
|
|
|
|
|
|
Adviser Class Shares |
|
|
|
|
|
|
|
Net assets |
|
|
|
| $ | 5,538,065 |
|
Shares of beneficial interest issued and outstanding |
|
|
|
|
| 550,354 |
|
Net asset value, offering price and redemption price per share |
|
|
|
| $ | 10.06 |
|
Investor Class Shares |
|
|
|
|
|
|
|
Net assets |
| $ | 570,535,343 |
| $ | 133,312,736 |
|
Shares of beneficial interest issued and outstanding |
|
| 570,535,231 |
|
| 13,323,752 |
|
Net asset value, offering price and redemption price per share |
| $ | 1.00 |
| $ | 10.00 |
|
|
|
|
| ||||
(1) Cost of investments |
| $ | 549,846,165 |
| $ | 142,229,839 |
|
The accompanying notes are an integral part of the financial statements.
50
Alpine Mutual Funds |
|
For the six months ended April 30, 2008 (Unaudited)
|
| Dynamic |
| Dynamic |
| Dynamic |
| Dynamic |
| Dynamic Transformations Fund (1) |
| |||||
|
|
|
|
|
|
| ||||||||||
INVESTMENT INCOME: |
|
|
|
|
|
|
|
|
|
|
|
|
|
|
|
|
Interest income |
| $ | 479,900 |
| $ | 207,212 |
| $ | 10 |
| $ | 285,941 |
| $ | 23,070 |
|
Dividend income* |
|
| 1,135,242 |
|
| 112,046,800 |
|
| 109,374 |
|
| 79,082 |
|
| 9,059 |
|
|
|
|
|
|
|
| ||||||||||
Total investment income |
|
| 1,615,142 |
|
| 112,254,012 |
|
| 109,384 |
|
| 365,023 |
|
| 32,129 |
|
|
|
|
|
|
|
| ||||||||||
EXPENSES: |
|
|
|
|
|
|
|
|
|
|
|
|
|
|
|
|
Investment advisory fees |
|
| 401,721 |
|
| 6,614,752 |
|
| 53,552 |
|
| 260,657 |
|
| 13,700 |
|
Administration fees |
|
| 11,140 |
|
| 230,612 |
|
| 1,699 |
|
| 7,223 |
|
| 1,475 |
|
Fund accounting fees |
|
| 5,734 |
|
| 116,991 |
|
| 885 |
|
| 3,806 |
|
| 779 |
|
Audit and tax fees |
|
| 6,595 |
|
| 12,787 |
|
| 6,705 |
|
| 5,600 |
|
| 27,950 |
|
Custodian fees |
|
| 2,542 |
|
| 50,586 |
|
| 386 |
|
| 1,557 |
|
| 312 |
|
Interest expense |
|
| 63,330 |
|
| 173,832 |
|
| 21,993 |
|
| — |
|
| — |
|
Legal fees |
|
| 1,303 |
|
| 19,129 |
|
| 655 |
|
| 2,897 |
|
| 1,710 |
|
Registration and filing fees |
|
| 8,171 |
|
| 51,322 |
|
| 9,404 |
|
| 12,186 |
|
| 13,410 |
|
Printing fees |
|
| 4,811 |
|
| 196,363 |
|
| 2,494 |
|
| 2,760 |
|
| 2,990 |
|
Transfer agent fees |
|
| 11,765 |
|
| 247,341 |
|
| 1,803 |
|
| 7,908 |
|
| 1,589 |
|
Trustee fees |
|
| 276 |
|
| 5,830 |
|
| 158 |
|
| 211 |
|
| 55 |
|
Other fees |
|
| 1,261 |
|
| 21,561 |
|
| 164 |
|
| 614 |
|
| 322 |
|
|
|
|
|
|
| |||||||||||
Total expenses before expense waiver by Adviser |
|
| 518,649 |
|
| 7,741,106 |
|
| 99,898 |
|
| 305,419 |
|
| 64,292 |
|
Expense (waiver) / recovery by Adviser (Note 6) |
|
| — |
|
| — |
|
| (27,398 | ) |
| 39,755 |
|
| (46,056 | ) |
|
|
|
|
|
|
| ||||||||||
Net expenses |
|
| 518,649 |
|
| 7,741,106 |
|
| 72,500 |
|
| 345,174 |
|
| 18,236 |
|
|
|
|
|
|
|
| ||||||||||
Net investment income |
|
| 1,096,493 |
|
| 104,512,906 |
|
| 36,884 |
|
| 19,849 |
|
| 13,893 |
|
|
|
|
|
|
|
| ||||||||||
REALIZED AND UNREALIZED GAIN (LOSS) ON INVESTMENTS: |
|
|
|
|
|
|
|
|
|
|
|
|
|
|
|
|
Net realized gain (loss) on: |
|
|
|
|
|
|
|
|
|
|
|
|
|
|
|
|
Investments |
|
| 2,912,809 |
|
| (121,347,151 | ) |
| 894,351 |
|
| (732,420 | ) |
| (36,931 | ) |
Options contracts expired or closed |
|
| 236,863 |
|
| — |
|
| — |
|
| — |
|
| — |
|
Foreign currency translation |
|
| — |
|
| (5,216,354 | ) |
| (48,080 | ) |
| (65,380 | ) |
| — |
|
Forward currency contracts |
|
| — |
|
| (19,122,269 | ) |
| — |
|
| — |
|
| — |
|
Swaps |
|
| — |
|
| — |
|
| 929 |
|
| 113 |
|
| — |
|
|
|
|
|
|
|
| ||||||||||
Net realized gain (loss) |
|
| 3,149,672 |
|
| (145,685,774 | ) |
| 847,200 |
|
| (797,687 | ) |
| (36,931 | ) |
|
|
|
|
|
|
| ||||||||||
Change in unrealized appreciation (depreciation) on: |
|
|
|
|
|
|
|
|
|
|
|
|
|
|
|
|
Investments |
|
| (8,917,379 | ) |
| (167,886,275 | ) |
| (2,135,556 | ) |
| (6,207,525 | ) |
| 63,395 |
|
Foreign currency translation |
|
| — |
|
| (354,321 | ) |
| (64,367 | ) |
| — |
|
| — |
|
Options written |
|
| (557,936 | ) |
| — |
|
| — |
|
| — |
|
| — |
|
|
|
|
|
|
|
| ||||||||||
Net change in unrealized appreciation (depreciation) |
|
| (9,475,315 | ) |
| (168,240,596 | ) |
| (2,199,923 | ) |
| (6,207,525 | ) |
| 63,395 |
|
|
|
|
|
|
|
| ||||||||||
Net realized and unrealized gain (loss) on investments |
|
| (6,325,643 | ) |
| (313,926,370 | ) |
| (1,352,723 | ) |
| (7,005,212 | ) |
| 26,464 |
|
|
|
|
|
|
|
| ||||||||||
Change in net assets resulting from operations |
| $ | (5,229,150 | ) | $ | (209,413,464 | ) | $ | (1,315,839 | ) | $ | (6,985,363 | ) | $ | 40,357 |
|
|
|
|
|
|
|
| ||||||||||
* Net of foreign taxes withheld |
| $ | 2,020 |
| $ | 3,549,901 |
| $ | 135 |
| $ | — |
| $ | — |
|
|
|
|
|
|
|
| ||||||||||
(1) | Fund commenced operations on December 31, 2007. |
The accompanying notes are an integral part of the financial statements.
51
Alpine Mutual Funds |
|
Statements of Operations—Continued
For the six months ended April 30, 2008 (Unaudited)
|
| Municipal |
| Ultra Short |
| ||
|
|
|
| ||||
INVESTMENT INCOME: |
|
|
|
|
|
|
|
Interest income |
| $ | 13,481,901 |
| $ | 2,320,188 |
|
|
|
| |||||
Total investment income |
|
| 13,481,901 |
|
| 2,320,188 |
|
|
|
|
| ||||
EXPENSES: |
|
|
|
|
|
|
|
Investment advisory fees |
|
| 1,803,183 |
|
| 351,863 |
|
Administration fees |
|
| 13,771 |
|
| 1,357 |
|
Distribution fees - Adviser Class (1) |
|
| 90 |
|
| 2,172 |
|
Fund accounting fees |
|
| 11,468 |
|
| 1,123 |
|
Audit and tax fees |
|
| 8,767 |
|
| 6,167 |
|
Custodian fees |
|
| 6,886 |
|
| 679 |
|
Legal fees |
|
| 6,931 |
|
| 1,776 |
|
Registration and filing fees |
|
| 32,611 |
|
| 21,519 |
|
Printing fees |
|
| 11,347 |
|
| 2,629 |
|
Transfer agent fees |
|
| 13,446 |
|
| 1,357 |
|
Trustee fees |
|
| 802 |
|
| 243 |
|
Other fees |
|
| 8,490 |
|
| 1,918 |
|
|
|
|
| ||||
Total expenses before expense reimbursement by Adviser |
|
| 1,917,792 |
|
| 392,803 |
|
Less: Expense waiver by Adviser (Note 6) |
|
| (756,456 | ) |
| (109,141 | ) |
|
|
|
| ||||
Net expenses |
|
| 1,161,336 |
|
| 283,662 |
|
|
|
|
| ||||
Net investment income |
|
| 12,320,565 |
|
| 2,036,526 |
|
|
|
|
| ||||
REALIZED AND UNREALIZED GAIN (LOSS) ON INVESTMENTS: |
|
|
|
|
|
|
|
Net realized loss on investments |
|
| — |
|
| (98 | ) |
Change in unrealized depreciation on investments |
|
| — |
|
| (616,316 | ) |
|
|
|
| ||||
Net realized and unrealized loss on investments |
|
| — |
|
| (616,414 | ) |
|
|
|
| ||||
Change in net assets resulting from operations |
| $ | 12,320,565 |
| $ | 1,420,112 |
|
|
|
|
| ||||
(1) | The Municipal Money Market Fund – Adviser Class ceased operations on December 5, 2007. |
The accompanying notes are an integral part of the financial statements.
52
Alpine Mutual Funds |
|
Statements of Changes in Net Assets
|
| Dynamic Balance Fund |
| ||||
|
|
| |||||
|
| Six Months Ended |
| Year Ended |
| ||
|
|
|
| ||||
|
| (Unaudited) |
|
|
| ||
OPERATIONS: |
|
|
|
|
|
|
|
Net investment income |
| $ | 1,096,493 |
| $ | 1,790,901 |
|
Net realized gain on: |
|
|
|
|
|
|
|
Investments |
|
| 2,912,809 |
|
| 5,978,903 |
|
Options contracts expired or closed |
|
| 236,863 |
|
| — |
|
Change in unrealized depreciation on: |
|
|
|
|
|
|
|
Investments |
|
| (8,917,379 | ) |
| (3,900,340 | ) |
Options written |
|
| (557,936 | ) |
| — |
|
|
|
|
| ||||
Change in net assets resulting from operations |
|
| (5,229,150 | ) |
| 3,869,464 |
|
|
|
|
| ||||
DISTRIBUTIONS TO SHAREHOLDERS: |
|
|
|
|
|
|
|
From net investment income |
|
| (1,141,720 | ) |
| (1,657,490 | ) |
From net realized gain on investments |
|
| (6,112,340 | ) |
| (3,303,924 | ) |
|
|
|
| ||||
Change in net assets resulting from distributions to shareholders |
|
| (7,254,060 | ) |
| (4,961,414 | ) |
|
|
|
| ||||
CAPITAL SHARE TRANSACTIONS: |
|
|
|
|
|
|
|
Proceeds from shares sold |
|
| 146,327 |
|
| 1,455,693 |
|
Dividends reinvested |
|
| 6,677,006 |
|
| 4,556,609 |
|
Redemption fees |
|
| 9 |
|
| 471 |
|
Cost of shares redeemed |
|
| (7,622,622 | ) |
| (10,723,292 | ) |
|
|
|
| ||||
Change in net assets from capital share transactions |
|
| (799,280 | ) |
| (4,710,519 | ) |
|
|
|
| ||||
Total change in net assets |
|
| (13,282,490 | ) |
| (5,802,469 | ) |
|
|
|
| ||||
NET ASSETS: |
|
|
|
|
|
|
|
Beginning of period |
|
| 92,359,751 |
|
| 98,162,220 |
|
|
|
|
| ||||
End of period* |
| $ | 79,077,261 |
| $ | 92,359,751 |
|
|
|
|
| ||||
* Including accumulated undistributed net investment loss of: |
| $ | (71,939 | ) | $ | (26,712 | ) |
|
|
|
| ||||
The accompanying notes are an integral part of the financial statements.
53
Alpine Mutual Funds |
|
Statements of Changes in Net Assets—Continued
|
| Dynamic Dividend Fund |
| ||||
|
|
| |||||
|
| Six Months Ended |
| Year Ended |
| ||
|
|
|
| ||||
|
| (Unaudited) |
|
|
| ||
OPERATIONS: |
|
|
|
|
|
|
|
Net investment income |
| $ | 104,512,906 |
| $ | 180,226,241 |
|
Net realized gain (loss) on: |
|
|
|
|
|
|
|
Investments |
|
| (121,347,151 | ) |
| (39,881,300 | ) |
Options contracts expired or closed |
|
| — |
|
| 401,898 |
|
Foreign currency translation |
|
| (5,216,354 | ) |
| (6,542,403 | ) |
Forward currency contracts |
|
| (19,122,269 | ) |
| — |
|
Swaps |
|
| — |
|
| (1,492,792 | ) |
Change in unrealized appreciation (depreciation) on: |
|
|
|
|
|
|
|
Investments |
|
| (167,886,275 | ) |
| 63,257,867 |
|
Foreign currency translation |
|
| (354,321 | ) |
| 355,462 |
|
|
|
|
| ||||
Change in net assets resulting from operations |
|
| (209,413,464 | ) |
| 196,324,973 |
|
|
|
|
| ||||
DISTRIBUTIONS TO SHAREHOLDERS: |
|
|
|
|
|
|
|
From net investment income |
|
| (101,067,921 | ) |
| (151,334,543 | ) |
|
|
|
| ||||
Change in net assets resulting from distributions to shareholders |
|
| (101,067,921 | ) |
| (151,334,543 | ) |
|
|
|
| ||||
CAPITAL SHARE TRANSACTIONS: |
|
|
|
|
|
|
|
Proceeds from shares sold |
|
| 372,442,993 |
|
| 1,071,958,520 |
|
Dividends reinvested |
|
| 73,582,592 |
|
| 115,362,111 |
|
Redemption fees |
|
| 318,572 |
|
| 331,271 |
|
Cost of shares redeemed |
|
| (321,209,701 | ) |
| (365,833,646 | ) |
|
|
|
| ||||
Change in net assets from capital share transactions |
|
| 125,134,456 |
|
| 821,818,256 |
|
|
|
|
| ||||
Total change in net assets |
|
| (185,346,929 | ) |
| 866,808,686 |
|
|
|
|
| ||||
NET ASSETS: |
|
|
|
|
|
|
|
Beginning of period |
|
| 1,500,072,186 |
|
| 633,263,500 |
|
|
|
|
| ||||
End of period* |
| $ | 1,314,725,257 |
| $ | 1,500,072,186 |
|
|
|
|
| ||||
* Including accumulated undistributed net investment income of: |
| $ | 31,975,253 |
| $ | 28,530,268 |
|
|
|
|
| ||||
The accompanying notes are an integral part of the financial statements.
54
Alpine Mutual Funds |
|
Statements of Changes in Net Assets—Continued
|
| Dynamic Financial Services Fund |
| ||||
|
|
| |||||
|
| Six Months Ended |
| Year Ended |
| ||
|
|
|
| ||||
|
| (Unaudited) |
|
|
| ||
OPERATIONS: |
|
|
|
|
|
|
|
Net investment income (loss) |
| $ | 36,884 |
| $ | (17,523 | ) |
Net realized gain (loss) on: |
|
|
|
|
|
|
|
Investments |
|
| 894,351 |
|
| 3,241,026 |
|
Foreign currency translation |
|
| (48,080 | ) |
| (35,852 | ) |
Swaps |
|
| 929 |
|
| (114,108 | ) |
Change in unrealized appreciation (depreciation) on: |
|
|
|
|
|
|
|
Investments |
|
| (2,135,556 | ) |
| (1,492,423 | ) |
Foreign currency translation |
|
| (64,367 | ) |
| 64,427 |
|
|
|
|
| ||||
Change in net assets resulting from operations |
|
| (1,315,839 | ) |
| 1,645,547 |
|
|
|
|
| ||||
DISTRIBUTIONS TO SHAREHOLDERS: |
|
|
|
|
|
|
|
From net investment income |
|
| — |
|
| (10,031 | ) |
From net realized gain on investments |
|
| (2,663,086 | ) |
| (530,690 | ) |
|
|
|
| ||||
Change in net assets resulting from distributions to shareholders |
|
| (2,663,086 | ) |
| (540,721 | ) |
|
|
|
| ||||
CAPITAL SHARE TRANSACTIONS: |
|
|
|
|
|
|
|
Proceeds from shares sold |
|
| 4,613,570 |
|
| 9,859,139 |
|
Dividends reinvested |
|
| 2,103,627 |
|
| 434,665 |
|
Redemption fees |
|
| 5,006 |
|
| 4,434 |
|
Cost of shares redeemed |
|
| (2,036,400 | ) |
| (8,127,045 | ) |
|
|
|
| ||||
Change in net assets from capital share transactions |
|
| 4,685,803 |
|
| 2,171,193 |
|
|
|
|
| ||||
Total change in net assets |
|
| 706,878 |
|
| 3,276,019 |
|
|
|
|
| ||||
NET ASSETS: |
|
|
|
|
|
|
|
Beginning of period |
|
| 10,820,015 |
|
| 7,543,996 |
|
|
|
|
| ||||
End of period* |
| $ | 11,526,893 |
| $ | 10,820,015 |
|
|
|
|
| ||||
* Including accumulated undistributed net investment income of: |
| $ | 36,884 |
| $ | — |
|
|
|
|
| ||||
The accompanying notes are an integral part of the financial statements.
55
Alpine Mutual Funds |
|
Statements of Changes in Net Assets—Continued
|
| Dynamic Innovators Fund |
| ||||
|
|
| |||||
|
| Six Months Ended |
| Year Ended |
| ||
|
|
|
| ||||
|
| (Unaudited) |
|
|
| ||
OPERATIONS: |
|
|
|
|
|
|
|
Net investment income |
| $ | 19,849 |
| $ | 123,309 |
|
Net realized gain (loss) on: |
|
|
|
|
|
|
|
Investments |
|
| (732,420 | ) |
| 1,889,483 |
|
Foreign currency translation |
|
| (65,380 | ) |
| (563 | ) |
Swaps |
|
| 113 |
|
| 9,260 |
|
Change in unrealized appreciation (depreciation) on: |
|
|
|
|
|
|
|
Investments |
|
| (6,207,525 | ) |
| 2,909,947 |
|
|
|
|
| ||||
Change in net assets resulting from operations |
|
| (6,985,363 | ) |
| 4,931,436 |
|
|
|
|
| ||||
DISTRIBUTIONS TO SHAREHOLDERS: |
|
|
|
|
|
|
|
From net investment income |
|
| (99,263 | ) |
| (68,794 | ) |
From net realized gain on investments |
|
| (1,905,602 | ) |
| (41,166 | ) |
|
|
|
| ||||
Change in net assets resulting from distributions to shareholders |
|
| (2,004,865 | ) |
| (109,960 | ) |
|
|
|
| ||||
CAPITAL SHARE TRANSACTIONS: |
|
|
|
|
|
|
|
Proceeds from shares sold |
|
| 40,312,823 |
|
| 39,547,376 |
|
Dividends reinvested |
|
| 1,654,158 |
|
| 108,857 |
|
Redemption fees |
|
| 113,973 |
|
| 8,144 |
|
Cost of shares redeemed |
|
| (39,086,702 | ) |
| (1,204,553 | ) |
|
|
|
| ||||
Change in net assets from capital share transactions |
|
| 2,994,252 |
|
| 38,459,824 |
|
|
|
|
| ||||
Total change in net assets |
|
| (5,995,976 | ) |
| 43,281,300 |
|
|
|
|
| ||||
NET ASSETS: |
|
|
|
|
|
|
|
Beginning of period |
|
| 48,354,729 |
|
| 5,073,429 |
|
|
|
|
| ||||
End of period* |
| $ | 42,358,753 |
| $ | 48,354,729 |
|
|
|
|
| ||||
* Including accumulated undistributed net investment income of: |
| $ | 19,817 |
| $ | 99,231 |
|
|
|
|
| ||||
The accompanying notes are an integral part of the financial statements.
56
Alpine Mutual Funds |
|
Statements of Changes in Net Assets—Continued
|
| Dynamic Transformations Fund |
| |
|
|
| ||
|
| Period Ended |
| |
|
|
| ||
|
| (Unaudited) |
| |
OPERATIONS: |
|
|
|
|
Net investment income |
| $ | 13,893 |
|
Net realized loss on: |
|
|
|
|
Investments |
|
| (36,931 | ) |
Change in unrealized appreciation on: |
|
|
|
|
Investments |
|
| 63,395 |
|
|
| |||
Change in net assets resulting from operations |
|
| 40,357 |
|
|
| |||
DISTRIBUTIONS TO SHAREHOLDERS: |
|
|
|
|
From net investment income |
|
| — |
|
From net realized gain on investments |
|
| — |
|
|
| |||
Change in net assets resulting from distributions to shareholders |
|
| — |
|
|
| |||
CAPITAL SHARE TRANSACTIONS: |
|
|
|
|
Proceeds from shares sold |
|
| 4,271,835 |
|
Dividends reinvested |
|
| — |
|
Redemption fees |
|
| 10 |
|
Cost of shares redeemed |
|
| (1,197 | ) |
|
| |||
Change in net assets from capital share transactions |
|
| 4,270,648 |
|
|
| |||
Total change in net assets |
|
| 4,311,005 |
|
|
| |||
NET ASSETS: |
|
|
|
|
Beginning of period (1) |
|
| — |
|
|
| |||
End of period* |
| $ | 4,311,005 |
|
|
| |||
* Including accumulated undistributed net investment income of: |
| $ | 13,893 |
|
|
| |||
(1) | Fund commenced operations on December 31, 2007. |
The accompanying notes are an integral part of the financial statements.
57
Alpine Mutual Funds |
|
Statements of Changes in Net Assets—Continued
|
| Municipal Money Market Fund |
| ||||
|
|
| |||||
|
| Six Months Ended |
| Year Ended |
| ||
|
|
|
| ||||
|
| (Unaudited) |
|
|
| ||
OPERATIONS: |
|
|
|
|
|
|
|
Net investment income |
| $ | 12,320,565 |
| $ | 27,398,823 |
|
|
|
|
| ||||
Change in net assets resulting from operations |
|
| 12,320,565 |
|
| 27,398,823 |
|
|
|
|
| ||||
DISTRIBUTIONS TO SHAREHOLDERS: |
|
|
|
|
|
|
|
Distributions to Adviser Class Shareholders (1): |
|
|
|
|
|
|
|
From net investment income |
|
| (1,159 | ) |
| (33,794 | ) |
Distributions to Investor Class Shareholders: |
|
|
|
|
|
|
|
From net investment income |
|
| (12,319,406 | ) |
| (27,365,029 | ) |
|
|
|
| ||||
Change in net assets resulting from distributions to shareholders |
|
| (12,320,565 | ) |
| (27,398,823 | ) |
|
|
|
| ||||
CAPTIAL SHARE TRANSACTIONS: |
|
|
|
|
|
|
|
Proceeds from shares sold |
|
| 3,740,961,161 |
|
| 6,947,019,443 |
|
Dividends reinvested |
|
| 9,603,995 |
|
| 21,176,938 |
|
Cost of shares redeemed |
|
| (4,295,559,964 | ) |
| (6,221,110,364 | ) |
|
|
|
| ||||
Change in net assets from capital share transactions |
|
| (544,994,808 | ) |
| 747,086,017 |
|
|
|
|
| ||||
Total change in net assets |
|
| (544,994,808 | ) |
| 747,086,017 |
|
|
|
|
| ||||
NET ASSETS: |
|
|
|
|
|
|
|
Beginning of period |
|
| 1,115,530,151 |
|
| 368,444,134 |
|
|
|
|
| ||||
End of period |
| $ | 570,535,343 |
| $ | 1,115,530,151 |
|
|
|
|
| ||||
(1) | The Municipal Money Market Fund – Adviser Class ceased operations on December 5, 2007. |
The accompanying notes are an integral part of the financial statements.
58
Alpine Mutual Funds |
|
Statements of Changes in Net Assets—Continued
|
| Ultra Short |
| ||||
|
|
| |||||
|
| Six Months Ended |
| Year Ended |
| ||
|
|
|
| ||||
|
| (Unaudited) |
|
|
| ||
OPERATIONS: |
|
|
|
|
|
|
|
Net investment income |
| $ | 2,036,526 |
| $ | 2,091,398 |
|
Net realized loss on investments |
|
| (98 | ) |
| (2,112 | ) |
Change in unrealized depreciation on investments |
|
| (616,316 | ) |
| (26,650 | ) |
|
| ||||||
Change in net assets resulting from operations |
|
| 1,420,112 |
|
| 2,062,636 |
|
|
| ||||||
DISTRIBUTIONS TO SHAREHOLDERS: |
|
|
|
|
|
|
|
Distributions to Adviser Class Shareholders: |
|
|
|
|
|
|
|
From net investment income |
|
| (41,073 | ) |
| (26,129 | ) |
Distributions to Investor Class Shareholders: |
|
|
|
|
|
|
|
From net investment income |
|
| (1,987,003 | ) |
| (2,061,503 | ) |
|
| ||||||
Change in net assets resulting from distributions to shareholders |
|
| (2,028,076 | ) |
| (2,087,632 | ) |
|
| ||||||
CAPTIAL SHARE TRANSACTIONS: |
|
|
|
|
|
|
|
Proceeds from shares sold |
|
| 92,858,227 |
|
| 19,962,121 |
|
Dividends reinvested |
|
| 1,913,809 |
|
| 2,032,302 |
|
Redemption fees |
|
| 2,214 |
|
| 508 |
|
Cost of shares redeemed |
|
| (15,595,719 | ) |
| (7,358,590 | ) |
|
| ||||||
Change in net assets from capital share transactions |
|
| 79,178,531 |
|
| 14,636,341 |
|
|
| ||||||
Total change in net assets |
|
| 78,570,567 |
|
| 14,611,345 |
|
|
| ||||||
NET ASSETS: |
|
|
|
|
|
|
|
Beginning of period |
|
| 60,280,234 |
|
| 45,668,889 |
|
|
| ||||||
End of period* |
| $ | 138,850,801 |
| $ | 60,280,234 |
|
|
| ||||||
* Including accumulated undistributed net investment income of: |
| $ | 16,429 |
| $ | 7,979 |
|
|
| ||||||
The accompanying notes are an integral part of the financial statements.
59
Alpine Mutual Funds |
|
(For a share outstanding throughout each period)
|
| Dynamic Balance Fund |
| ||||||||||||||||
|
|
| |||||||||||||||||
|
| Six Months |
| Year Ended |
| ||||||||||||||
|
|
|
| ||||||||||||||||
|
|
| 2007 |
| 2006 |
| 2005 |
| 2004 |
| 2003 |
| |||||||
|
|
|
|
|
|
|
| ||||||||||||
|
|
| (Unaudited) |
|
|
|
|
|
|
|
|
|
|
|
|
|
|
|
|
Per Share Data: |
|
|
|
|
|
|
|
|
|
|
|
|
|
|
|
|
|
|
|
Net asset value per share, beginning of period |
| $ | 13.55 |
| $ | 13.72 |
| $ | 12.67 |
| $ | 12.44 |
| $ | 11.08 |
| $ | 9.17 |
|
|
|
|
|
|
|
|
| ||||||||||||
Income from investment operations: |
| �� |
|
|
|
|
|
|
|
|
|
|
|
|
|
|
|
|
|
Net investment income |
|
| 0.15 |
|
| 0.26 |
|
| 0.21 |
|
| 0.19 |
|
| 0.19 |
|
| 0.22 |
|
Net realized and unrealized gains (losses) on investments |
|
| (0.90 | ) |
| 0.28 |
|
| 1.26 |
|
| 0.85 |
|
| 1.37 |
|
| 1.91 |
|
|
|
|
|
|
|
|
| ||||||||||||
Total from investment operations |
|
| (0.75 | ) |
| 0.54 |
|
| 1.47 |
|
| 1.04 |
|
| 1.56 |
|
| 2.13 |
|
|
|
|
|
|
|
|
| ||||||||||||
Redemption fees |
|
| 0.00 | (a) |
| 0.00 | (a) |
| 0.00 | (a) |
| — |
|
| — |
|
| — |
|
Less Distributions: |
|
|
|
|
|
|
|
|
|
|
|
|
|
|
|
|
|
|
|
From net investment income |
|
| (0.17 | ) |
| (0.24 | ) |
| (0.20 | ) |
| (0.19 | ) |
| (0.20 | ) |
| (0.22 | ) |
From net realized gains on investments |
|
| (0.93 | ) |
| (0.47 | ) |
| (0.22 | ) |
| (0.62 | ) |
| — |
|
| — |
|
|
|
|
|
|
|
|
| ||||||||||||
Total distributions |
|
| (1.10 | ) |
| (0.71 | ) |
| (0.42 | ) |
| (0.81 | ) |
| (0.20 | ) |
| (0.22 | ) |
|
|
|
|
|
|
|
| ||||||||||||
Net asset value per share, end of period |
| $ | 11.70 |
| $ | 13.55 |
| $ | 13.72 |
| $ | 12.67 |
| $ | 12.44 |
| $ | 11.08 |
|
|
|
|
|
|
|
|
| ||||||||||||
Total return |
|
| (5.44 | )%(b) |
| 4.03 | % |
| 11.79 | % |
| 8.46 | % |
| 14.19 | % |
| 23.50 | % |
Ratios/Supplemental Data: |
|
|
|
|
|
|
|
|
|
|
|
|
|
|
|
|
|
|
|
Net Assets at end of period (000) |
| $ | 79,077 |
| $ | 92,360 |
| $ | 98,162 |
| $ | 97,471 |
| $ | 70,705 |
| $ | 53,756 |
|
Ratio of expenses to average net assets: |
|
|
|
|
|
|
|
|
|
|
|
|
|
|
|
|
|
|
|
Before waivers, reimbursements, and recoveries |
|
| 1.29 | %(c) |
| 1.16 | % |
| 1.19 | % |
| 1.21 | % |
| 1.27 | % |
| 1.51 | % |
After waivers, reimbursements, and recoveries |
|
| 1.29 | %(c) |
| 1.16 | % |
| 1.19 | % |
| 1.31 | % |
| 1.35 | % |
| 1.35 | % |
Ratio of net investment income to average net assets |
|
| 2.75 | %(c) |
| 1.87 | % |
| 1.60 | % |
| 1.60 | % |
| 1.78 | % |
| 2.26 | % |
Portfolio turnover |
|
| 21 | % |
| 28 | % |
| 22 | % |
| 36 | % |
| 56 | % |
| 39 | % |
(a) | The amount is less than $0.005 per share. |
(b) | Not Annualized. |
(c) | Annualized. |
The accompanying notes are an integral part of the financial statements.
60
Alpine Mutual Funds |
|
Financial Highlights—Continued
(For a share outstanding throughout each period)
|
| Dynamic Dividend Fund |
| ||||||||||||||||
|
|
| |||||||||||||||||
|
| Six Months |
| Year Ended |
| Period Ended |
| ||||||||||||
|
|
|
|
| |||||||||||||||
|
|
| 2007 |
| 2006 |
| 2005 |
| 2004 |
|
| ||||||||
|
|
|
|
|
|
|
| ||||||||||||
|
| (Unaudited) |
|
|
|
|
|
|
|
|
|
|
| ||||||
Per Share Data: |
|
|
|
|
|
|
|
|
|
|
|
|
|
|
|
|
|
|
|
Net asset value per share, beginning of period |
| $ | 13.32 |
| $ | 12.52 |
| $ | 11.98 |
| $ | 12.34 |
| $ | 10.69 |
| $ | 10.00 |
|
|
|
|
|
|
|
|
| ||||||||||||
Income from investment operations: |
|
|
|
|
|
|
|
|
|
|
|
|
|
|
|
|
|
|
|
Net investment income |
|
| 0.89 |
|
| 1.95 |
|
| 1.61 |
|
| 1.57 |
|
| 1.09 | (b) |
| 0.06 |
|
Net realized and unrealized gains (losses) on investments |
|
| (2.69 | ) |
| 0.61 |
|
| 0.51 |
|
| (0.14 | ) |
| 1.51 |
|
| 0.63 |
|
|
|
|
|
|
|
|
| ||||||||||||
Total from investment operations |
|
| (1.80 | ) |
| 2.56 |
|
| 2.12 |
|
| 1.43 |
|
| 2.60 |
|
| 0.69 |
|
|
|
|
|
|
|
|
| ||||||||||||
Redemption fees |
|
| 0.00 | (c) |
| 0.00 | (c) |
| 0.00 | (c) |
| 0.00 | (c) |
| — |
|
| — |
|
Less Distributions: |
|
|
|
|
|
|
|
|
|
|
|
|
|
|
|
|
|
|
|
From net investment income |
|
| (0.86 | ) |
| (1.76 | ) |
| (1.58 | ) |
| (1.51 | ) |
| (0.95 | ) |
| — |
|
From net realized gains on investments |
|
| — |
|
| — |
|
| — |
|
| (0.28 | ) |
| — |
|
| — |
|
|
|
|
|
|
|
|
| ||||||||||||
Total distributions |
|
| (0.86 | ) |
| (1.76 | ) |
| (1.58 | ) |
| (1.79 | ) |
| (0.95 | ) |
| — |
|
|
|
|
|
|
|
|
| ||||||||||||
Net asset value per share, end of period |
| $ | 10.66 |
| $ | 13.32 |
| $ | 12.52 |
| $ | 11.98 |
| $ | 12.34 |
| $ | 10.69 |
|
|
|
|
|
|
|
|
| ||||||||||||
Total return |
|
| (13.67 | )%(d) |
| 21.66 | % |
| 18.68 | % |
| 11.85 | % |
| 24.90 | % |
| 6.90 | %(d) |
Ratios/Supplemental Data: |
|
|
|
|
|
|
|
|
|
|
|
|
|
|
|
|
|
|
|
Net Assets at end of period (000) |
| $ | 1,314,725 |
| $ | 1,500,072 |
| $ | 633,264 |
| $ | 311,335 |
| $ | 43,530 |
| $ | 13,527 |
|
Ratio of expenses to average net assets: |
|
|
|
|
|
|
|
|
|
|
|
|
|
|
|
|
|
|
|
Before waivers, reimbursements, and recoveries |
|
| 1.19 | %(e) |
| 1.15 | % |
| 1.18 | % |
| 1.20 | % |
| 1.56 | % |
| 3.11 | %(e) |
After waivers, reimbursements, and recoveries |
|
| 1.19 | %(e) |
| 1.15 | % |
| 1.18 | % |
| 1.23 | % |
| 1.35 | % |
| 1.35 | %(e) |
Ratio of net investment income to average net assets |
|
| 16.11 | %(e) |
| 15.65 | % |
| 14.04 | % |
| 14.22 | % |
| 9.08 | % |
| 5.69 | %(e) |
Portfolio turnover |
|
| 115 | % |
| 216 | % |
| 192 | % |
| 216 | % |
| 194 | % |
| 9 | % |
(a) | For the period from September 22, 2003 (inception of fund) to October 31, 2003. |
(b) | Net investment income is calculated using average shares outstanding during the period. |
(c) | The amount is less than $0.005 per share. |
(d) | Not Annualized. |
(e) | Annualized. |
The accompanying notes are an integral part of the financial statements.
61
Alpine Mutual Funds |
|
Financial Highlights—Continued
(For a share outstanding throughout each period)
|
| Dynamic Financial Services Fund |
| |||||||
|
|
| ||||||||
|
| Six Months |
| Year Ended |
| Period Ended |
| |||
|
|
|
|
| ||||||
|
| (Unaudited) |
|
|
|
|
| |||
Per Share Data: |
|
|
|
|
|
|
|
|
|
|
Net asset value per share, beginning of period |
| $ | 13.89 |
| $ | 12.13 |
| $ | 10.00 |
|
|
|
|
|
| ||||||
Income from investment operations: |
|
|
|
|
|
|
|
|
|
|
Net investment income (loss) |
|
| 0.03 |
|
| (0.02 | ) |
| 0.02 |
|
Net realized and unrealized gains (losses) on investments |
|
| (1.23 | ) |
| 2.54 |
|
| 2.12 |
|
|
|
|
|
| ||||||
Total from investment operations |
|
| (1.20 | ) |
| 2.52 |
|
| 2.14 |
|
|
|
|
|
| ||||||
Redemption fees |
|
| 0.00 | (b) |
| 0.00 | (b) |
| 0.00 | (b) |
Less Distributions: |
|
|
|
|
|
|
|
|
|
|
From net investment income |
|
| — |
|
| (0.01 | ) |
| (0.01 | ) |
From net realized gain on investments |
|
| (3.33 | ) |
| (0.75 | ) |
| — |
|
|
|
|
|
| ||||||
Total distributions |
|
| (3.33 | ) |
| (0.76 | ) |
| (0.01 | ) |
|
|
|
|
| ||||||
Net asset value per share, end of period |
| $ | 9.36 |
| $ | 13.89 |
| $ | 12.13 |
|
|
|
|
|
| ||||||
Total return |
|
| (11.27 | )%(c) |
| 21.64 | % |
| 21.47 | % |
Ratios/Supplemental Data: |
|
|
|
|
|
|
|
|
|
|
Net Assets at end of period (000) |
| $ | 11,527 |
| $ | 10,820 |
| $ | 7,544 |
|
Ratio of expenses to average net assets: |
|
|
|
|
|
|
|
|
|
|
Before waivers, reimbursements, and recoveries |
|
| 1.87 | %(d) |
| 2.61 | % |
| 2.53 | % |
After waivers, reimbursements, and recoveries |
|
| 1.35 | %(d) |
| 1.35 | % |
| 1.35 | % |
Ratio of net investment income (loss) to average net assets |
|
| 0.69 | %(d) |
| (0.16 | )% |
| 0.15 | % |
Portfolio turnover |
|
| 220 | % |
| 397 | % |
| 106 | % |
(a) | For the period from November 1, 2005 (inception of fund) to October 31, 2006. |
(b) | The amount is less than $0.005 per share. |
(c) | Not Annualized. |
(d) | Annualized. |
The accompanying notes are an integral part of the financial statements.
62
Alpine Mutual Funds |
|
Financial Highlights—Continued
(For a share outstanding throughout each period)
|
| Dynamic Innovators Fund |
| |||||||
|
|
| ||||||||
|
| Six Months |
| Year Ended |
| Period Ended |
| |||
|
|
|
|
| ||||||
|
| (Unaudited) |
|
|
|
|
| |||
Per Share Data: |
|
|
|
|
|
|
|
|
|
|
Net asset value per share, beginning of period |
| $ | 14.08 |
| $ | 10.31 |
| $ | 10.00 |
|
|
|
|
|
| ||||||
Income from investment operations: |
|
|
|
|
|
|
|
|
|
|
Net investment income (loss) |
|
| (0.00 | )(b) |
| 0.07 |
|
| 0.09 |
|
Net realized and unrealized gains (losses) on investments |
|
| (1.37 | ) |
| 3.91 |
|
| 0.22 |
|
|
|
|
|
| ||||||
Total from investment operations |
|
| (1.37 | ) |
| 3.98 |
|
| 0.31 |
|
|
|
|
|
| ||||||
Redemption fees |
|
| 0.03 |
|
| 0.01 |
|
| — |
|
Less Distributions: |
|
|
|
|
|
|
|
|
|
|
From net investment income |
|
| (0.02 | ) |
| (0.14 | ) |
| — |
|
From net realized gains on investments |
|
| (0.41 | ) |
| (0.08 | ) |
| — |
|
|
|
|
|
| ||||||
Total distributions |
|
| (0.43 | ) |
| (0.22 | ) |
| — |
|
|
|
|
|
| ||||||
Net asset value per share, end of period |
| $ | 12.31 |
| $ | 14.08 |
| $ | 10.31 |
|
|
|
|
|
| ||||||
Total return |
|
| (9.79 | )%(c) |
| 39.47 | % |
| 3.10 | %(c) |
Ratios/Supplemental Data: |
|
|
|
|
|
|
|
|
|
|
Net Assets at end of period (000) |
| $ | 42,359 |
| $ | 48,355 |
| $ | 5,073 |
|
Ratio of expenses to average net assets: |
|
|
|
|
|
|
|
|
|
|
Before waivers, reimbursements, and recoveries |
|
| 1.17 | %(d) |
| 1.53 | % |
| 4.25 | %(d) |
After waivers, reimbursements and recoveries |
|
| 1.33 | %(d) |
| 1.33 | % |
| 1.35 | %(d) |
Ratio of net investment income (loss) to average net assets |
|
| 0.08 | %(d) |
| 1.08 | % |
| 3.18 | %(d) |
Portfolio turnover |
|
| 37 | % |
| 135 | % |
| 3.25 | % |
(a) | For the period from July 11, 2006 (inception of fund) to October 31, 2006. |
(b) | The amount is less than $0.005 per share. |
(c) | Not Annualized. |
(d) | Annualized. |
The accompanying notes are an integral part of the financial statements.
63
Alpine Mutual Funds |
Financial Highlights—Continued
(For a share outstanding throughout each period)
|
| Dynamic Transformations Fund |
| |
|
|
| ||
|
| Period Ended |
| |
|
|
| ||
|
| Unaudited |
| |
Per Share Data: |
|
|
|
|
Net asset value per share, beginning of period |
| $ | 10.00 |
|
|
| |||
Income from investment operations: |
|
|
|
|
Net investment income |
|
| 0.03 |
|
Net realized and unrealized gains on investments |
|
| 0.06 |
|
|
| |||
Total from investment operations |
|
| 0.09 |
|
|
| |||
Redemption fees |
|
| 0.00 | (b) |
Less Distributions: |
|
|
|
|
From net investment income |
|
| — |
|
From net realized gains on investments |
|
| — |
|
|
| |||
Total distributions |
|
| — |
|
|
| |||
Net asset value per share, end of period |
| $ | 10.09 |
|
|
| |||
Total return |
|
| 0.90 | %(c) |
Ratios/Supplemental Data: |
|
|
|
|
Net Assets at end of period (000) |
| $ | 4,311 |
|
Ratio of expenses to average net assets: |
|
|
|
|
Before waivers, reimbursements, and recoveries |
|
| 4.69 | %(d) |
After waivers, reimbursements and recoveries |
|
| 1.33 | %(d) |
Ratio of net investment income to average net assets |
|
| 1.01 | %(d) |
Portfolio turnover |
|
| 22 | % |
(a) | For the period from January 1, 2008 (inception of fund) to April 30, 2008. |
(b) | The amount is less than $0.005 per share. |
(c) | Not Annualized. |
(d) | Annualized. |
The accompanying notes are an integral part of the financial statements.
64
Alpine Mutual Funds |
Financial Highlights—Continued
(For a share outstanding throughout each period)
|
| Municipal Money Market Fund |
| ||||||||||||||||
|
|
| |||||||||||||||||
|
| Six Months |
| Year Ended October 31, |
| Period Ended |
| ||||||||||||
|
|
|
|
| |||||||||||||||
|
|
| 2007 |
| 2006 |
| 2005 |
| 2004 |
|
| ||||||||
|
|
|
|
|
|
|
| ||||||||||||
|
| (Unaudited) |
|
|
|
|
|
|
|
|
|
|
|
|
|
|
|
| |
Investor Class Shares: |
|
|
|
|
|
|
|
|
|
|
|
|
|
|
|
|
|
|
|
Net asset value per share, beginning of period |
| $ | 1.00 |
| $ | 1.00 |
| $ | 1.00 |
| $ | 1.00 |
| $ | 1.00 |
| $ | 1.00 |
|
|
| ||||||||||||||||||
Income from investment operations: |
|
|
|
|
|
|
|
|
|
|
|
|
|
|
|
|
|
|
|
Net investment income |
|
| 0.01 |
|
| 0.04 |
|
| 0.03 |
|
| 0.02 |
|
| 0.01 |
|
| 0.01 |
|
|
| ||||||||||||||||||
Total from investment operations |
|
| 0.01 |
|
| 0.04 |
|
| 0.03 |
|
| 0.02 |
|
| 0.01 |
|
| 0.01 |
|
|
| ||||||||||||||||||
Less Distributions: |
|
|
|
|
|
|
|
|
|
|
|
|
|
|
|
|
|
|
|
From net investment income |
|
| (0.01 | ) |
| (0.04 | ) |
| (0.03 | ) |
| (0.02 | ) |
| (0.01 | ) |
| (0.01 | ) |
|
| ||||||||||||||||||
Total distributions |
|
| (0.01 | ) |
| (0.04 | ) |
| (0.03 | ) |
| (0.02 | ) |
| (0.01 | ) |
| (0.01 | ) |
|
| ||||||||||||||||||
Net asset value per share, end of period |
| $ | 1.00 |
| $ | 1.00 |
| $ | 1.00 |
| $ | 1.00 |
| $ | 1.00 |
| $ | 1.00 |
|
|
| ||||||||||||||||||
Total return |
|
| 1.50 | %(b) |
| 3.68 | % |
| 3.33 | % |
| 2.24 | % |
| 1.09 | % |
| 1.00 | %(b) |
Ratios/Supplemental Data: |
|
|
|
|
|
|
|
|
|
|
|
|
|
|
|
|
|
|
|
Net Assets at end of period (000) |
| $ | 570,535 |
| $ | 1,115,100 |
| $ | 365,840 |
| $ | 204,689 |
| $ | 130,147 |
| $ | 59,126 |
|
Ratio of expenses to average net assets: |
|
|
|
|
|
|
|
|
|
|
|
|
|
|
|
|
|
|
|
Before waivers and reimbursements |
|
| 0.50 | %(c) |
| 0.49 | % |
| 0.53 | % |
| 0.53 | % |
| 0.70 | % |
| 0.73 | %(c) |
After waivers and reimbursements |
|
| 0.30 | %(c) |
| 0.26 | % |
| 0.30 | % |
| 0.27 | % |
| 0.34 | % |
| 0.32 | %(c) |
Ratio of net investment income to average net assets |
|
| 3.20 | %(c) |
| 3.37 | % |
| 3.31 | % |
| 2.26 | % |
| 1.10 | % |
| 1.09 | %(c) |
(a) | For the period from December 5, 2002 (inception of fund) to October 31, 2003. |
(b) | Not Annualized. |
(c) | Annualized. |
The accompanying notes are an integral part of the financial statements.
65
Alpine Mutual Funds |
|
Financial Highlights—Continued
(For a share outstanding throughout each period)
|
| Ultra Short Tax Optimized Income Fund | ||||||||||||||
|
| |||||||||||||||
|
| Six Months |
| Year Ended |
| Period Ended |
| |||||||||
|
|
|
|
| ||||||||||||
|
|
| 2007 |
| 2006 |
| 2005 |
|
| |||||||
|
|
|
|
|
|
| ||||||||||
|
| (Unaudited) |
|
|
|
|
|
|
|
|
| |||||
Adviser Class Shares: |
|
|
|
|
|
|
|
|
|
|
|
|
|
|
|
|
Net asset value per share, beginning of period |
| $ | 10.10 |
| $ | 10.10 |
| $ | 10.03 |
| $ | 10.15 |
| $ | 10.26 |
|
|
|
|
|
|
|
| ||||||||||
Income from investment operations: |
|
|
|
|
|
|
|
|
|
|
|
|
|
|
|
|
Net investment income |
|
| 0.18 |
|
| 0.38 |
|
| 0.31 |
|
| 0.28 |
|
| 0.16 | (b) |
Net realized and unrealized gains (losses) on investments |
|
| (0.03 | ) |
| 0.00 | (c) |
| 0.09 |
|
| (0.12 | ) |
| (0.11 | ) |
|
|
|
|
|
|
| ||||||||||
Total from investment operations |
|
| 0.15 |
|
| 0.38 |
|
| 0.40 |
|
| 0.16 |
|
| 0.05 |
|
|
|
|
|
|
|
| ||||||||||
Less Distributions: |
|
|
|
|
|
|
|
|
|
|
|
|
|
|
|
|
From net investment income |
|
| (0.19 | ) |
| (0.38 | ) |
| (0.33 | ) |
| (0.28 | ) |
| (0.16 | ) |
From net realized gains on investments |
|
| — |
|
| — |
|
| (0.00 | )(c) |
| — |
|
| — |
|
|
|
|
|
|
|
| ||||||||||
Total distributions |
|
| (0.19 | ) |
| (0.38 | ) |
| (0.33 | ) |
| (0.28 | ) |
| (0.16 | ) |
|
|
|
|
|
|
| ||||||||||
Net asset value per share, end of period |
| $ | 10.06 |
| $ | 10.10 |
| $ | 10.10 |
| $ | 10.03 |
| $ | 10.15 |
|
|
|
|
|
|
|
| ||||||||||
Total return |
|
| 1.49 | %(d) |
| 3.82 | % |
| 4.01 | % |
| 1.60 | % |
| 0.55 | %(d) |
Ratios/Supplemental Data: |
|
|
|
|
|
|
|
|
|
|
|
|
|
|
|
|
Net Assets at end of period (000) |
| $ | 5,538 |
| $ | 872 |
| $ | 409 |
| $ | 112 |
| $ | 22 |
|
Ratio of expenses to average net assets: |
|
|
|
|
|
|
|
|
|
|
|
|
|
|
|
|
Before waivers and reimbursements |
|
| 1.08 | %(e) |
| 1.14 | % |
| 1.16 | % |
| 1.15 | % |
| 1.25 | %(e) |
After waivers and reimbursements |
|
| 0.85 | %(e) |
| 0.85 | % |
| 0.85 | % |
| 0.85 | % |
| 0.85 | %(e) |
Ratio of net investment income to average net assets |
|
| 4.11 | %(e) |
| 3.82 | % |
| 3.33 | % |
| 2.73 | % |
| 2.41 | %(e) |
Portfolio turnover (f) |
|
| 39 | % |
| 171 | % |
| 96 | % |
| 97 | % |
| 55 | % |
(a) | For the period from March 30, 2004 (inception of fund) to October 31, 2004. |
(b) | Net investment income per share is calculated using ending balances prior to consideration of adjustment for permanent book and tax differences. |
(c) | The amount is less than $0.005 per share. Not Annualized. |
(d) | Not Annualized. |
(e) | Annualized. |
(f) | Portfolio turnover is calculated on the basis of the Fund as a whole, without distinguishing between classes of shares issued. |
The accompanying notes are an integral part of the financial statements.
66
Alpine Mutual Funds |
Financial Highlights—Continued
(For a share outstanding throughout each period)
|
| ||||||||||||||||||
|
| Ultra Short Tax Optimized Income Fund | |||||||||||||||||
|
| ||||||||||||||||||
|
| Six Months |
| Year Ended |
| Period Ended |
| ||||||||||||
|
|
|
|
| |||||||||||||||
|
| 2008 |
| 2007 |
| 2006 |
| 2005 |
| 2004 |
| 2003 (a) |
| ||||||
|
|
|
|
|
|
|
| ||||||||||||
|
| (Unaudited) |
|
|
|
|
|
|
|
|
|
|
| ||||||
Investor Class Shares: |
|
|
|
|
|
|
|
|
|
|
|
|
|
|
|
|
|
|
|
Net asset value per share, beginning of period |
| $ | 10.04 |
| $ | 10.05 |
| $ | 10.03 |
| $ | 10.15 |
| $ | 10.18 |
| $ | 10.00 |
|
|
|
|
|
|
|
|
| ||||||||||||
Income from investment operations: |
|
|
|
|
|
|
|
|
|
|
|
|
|
|
|
|
|
|
|
Net investment income |
|
| 0.20 |
|
| 0.40 |
|
| 0.36 |
|
| 0.30 |
|
| 0.27 |
|
| 0.23 |
|
Net realized and unrealized gains (losses) on investments |
|
| (0.04 | ) |
| (0.01 | ) |
| 0.02 |
|
| (0.12 | ) |
| (0.02 | ) |
| 0.18 |
|
|
|
|
|
|
|
|
| ||||||||||||
Total from investment operations |
|
| 0.16 |
|
| 0.39 |
|
| 0.38 |
|
| 0.18 |
|
| 0.25 |
|
| 0.41 |
|
|
|
|
|
|
|
|
| ||||||||||||
Less Distributions: |
|
|
|
|
|
|
|
|
|
|
|
|
|
|
|
|
|
|
|
From net investment income |
|
| (0.20 | ) |
| (0.40 | ) |
| (0.36 | ) |
| (0.30 | ) |
| (0.27 | ) |
| (0.23 | ) |
From net realized gains on investments |
|
| — |
|
| — |
|
| (0.00 | )(b) |
| — |
|
| (0.01 | ) |
| (0.00 | )(b) |
|
|
|
|
|
|
|
| ||||||||||||
Total distributions |
|
| (0.20 | ) |
| (0.40 | ) |
| (0.36 | ) |
| (0.30 | ) |
| (0.28 | ) |
| (0.23 | ) |
|
|
|
|
|
|
|
| ||||||||||||
Net asset value per share, end of period |
| $ | 10.00 |
| $ | 10.04 |
| $ | 10.05 |
| $ | 10.03 |
| $ | 10.15 |
| $ | 10.18 |
|
|
|
|
|
|
|
| |||||||||||||
Total return |
|
| 1.71 | %(c) |
| 3.97 | % |
| 3.88 | % |
| 1.84 | % |
| 2.42 | % |
| 4.12 | %(c) |
Ratios/Supplemental Data: |
|
|
|
|
|
|
|
|
|
|
|
|
|
|
|
|
|
|
|
Net Assets at end of period (000) |
| $ | 133,313 |
| $ | 59,409 |
| $ | 45,260 |
| $ | 45,691 |
| $ | 51,302 |
| $ | 55,591 |
|
Ratio of expenses to average net assets: |
|
|
|
|
|
|
|
|
|
|
|
|
|
|
|
|
|
|
|
Before waivers and reimbursements |
|
| 0.83 | %(d) |
| 0.89 | % |
| 0.91 | % |
| 0.90 | % |
| 1.04 | % |
| 1.02 | %(d) |
After waivers and reimbursements |
|
| 0.60 | %(d) |
| 0.60 | % |
| 0.60 | % |
| 0.60 | % |
| 0.60 | % |
| 0.60 | %(d) |
Ratio of net investment income to average net assets |
|
| 4.36 | %(d) |
| 4.07 | % |
| 3.58 | % |
| 2.98 | % |
| 2.62 | % |
| 2.48 | %(d) |
Portfolio turnover(e) |
|
| 39 | % |
| 171 | % |
| 96 | % |
| 97 | % |
| 55 | % |
| 46 | % |
(a) | For the period from December 6, 2002 (inception of fund) to October 31, 2003. |
(b) | The amount is less than $0.005 per share. |
(c) | Not Annualized. |
(d) | Annualized. |
(e) | Portfolio turnover is calculated on the basis of the Fund as a whole, without distinguishing between classes of shares issued. |
The accompanying notes are an integral part of the financial statements.
67
Alpine Mutual Funds |
|
April 30, 2008 (Unaudited)
1. | Organization: |
Alpine Series Trust (the “Series Trust”) was organized in 2001 as a Delaware business trust, and is registered under the Investment Company Act of 1940, as amended (the “1940 Act”), as an open-ended management investment company. Alpine Income Trust (the “Income Trust”) was organized in 2002 as a Delaware business trust, and is registered under the 1940 Act, as open-ended management investment company. Alpine Dynamic Balance Fund, Alpine Dynamic Dividend Fund, Alpine Dynamic Financial Services Fund, Alpine Dynamic Innovators Fund, and Alpine Dynamic Transformations Fund are five separate funds of the Series Trust. Alpine Municipal Money Market Fund and Alpine Ultra Short Tax Optimized Income Fund are two separate funds of the Income Trust. Effective September 24, 2007, the Alpine Tax Optimized Fund changed its name to Alpine Ultra Short Tax Optimized Fund. Alpine Dynamic Balance Fund, Alpine Dynamic Dividend Fund, Alpine Dynamic Financial Services Fund, Alpine Dynamic Innovators Fund, Alpine Dynamic Transformations Fund, Alpine Municipal Money Market Fund, and Alpine Ultra Short Tax Optimized Income Fund (individually referred to as a “Fund” and collectively, “the Funds”) are diversified funds. Alpine Woods Capital Investors, LLC (the “Adviser”) is a Delaware limited liability company and serves as the investment manager to the Funds. The Board of Trustees approved the closing of the Adviser Class of the Municipal Money Market Fund on September 24, 2007. The final day of operation for this class was December 4, 2007. The Alpine Dynamic Transformations Fund commenced operations on December 31, 2007.
2. | Significant Accounting Policies: |
The following is a summary of significant accounting policies consistently followed by the Funds in the preparation of their financial statements. The policies are in conformity with accounting principles generally accepted in the United States of America (“GAAP”), which require management to make estimates and assumptions that affect amounts reported herein. Actual results could differ from those estimates.
A. Valuation of Securities:
The Dynamic Balance Fund, Dynamic Dividend Fund, Dynamic Financial Services Fund, Dynamic Innovators Fund, Dynamic Transformations Fund and Ultra Short Tax Optimized Income Fund value securities for which the primary market is on a domestic or foreign exchange and over-the-counter admitted to trading on the National Association of Securities Dealers Automated Quotation Market System (“NASDAQ”) National List at the last quoted sale price at the end of each business day or, if no sale, at the mean of the closing bid and asked prices. Over-the-counter securities not included in the NASDAQ National List for which market quotations are readily available are valued at a price quoted by one or more brokers. Securities for which market quotations are not readily available or whose values have been materially affected by events occurring before the close of U.S. markets but after the close of the securities‘ primary markets, are valued at fair value as determined in good faith according to procedures approved by the Board of Trustees.
For example, fair value pricing may be used where: (i) a security is illiquid (restricted securities and repurchase agreements maturing in more than seven days); (ii) the market or exchange for a security is closed on an ordinary trading day and no other market prices are available; (iii) the security is so thinly traded that there have been no transactions in the stock over an extended period; or (iv) the validity of a market quotation received is questionable. In addition, fair value pricing will be used if emergency or unusual situations have occurred, such as when trading of a security on an exchange is suspended; or when an event occurs after the close of the exchange on which the security is principally traded that is likely to have changed the value of the security before the NAV is calculated (applicable to foreign securities).
Among those factors that may be considered when fair valuing a security are: fundamental analytical data relating to the investment in the security; evaluation of the forces that influence the market in which the security is purchased and sold; type of security or asset; financial statements of issuer; special reports prepared by analysts or the Advisor; information as to any transactions or offers with respect to the security; and the historical tendency of the security‘s price to track or respond to general and specific market movements (in terms of indices, sectors, or other market measurements).
As of April 30, 2008, the Equity & Income Funds did not hold any securities that were fair valued in accordance with procedures approved by the Board of Trustees.
The valuation of certain debt securities for which market quotations are not readily available may be based upon current market prices of securities which are comparable in coupon, rating, and maturity or an appropriate matrix utilizing similar factors.
68
Alpine Mutual Funds |
|
Notes to Financial Statements—Continued
April 30, 2008 (Unaudited)
The Municipal Money Market Fund values its investments at amortized cost, which approximates market value. Pursuant to Rule 2a-7 of the 1940 Act, amortized cost, as defined, is a method of valuing securities at acquisition cost, adjusted for amortization of premium or accretion of discount rather than at their value based on current market factors.
B. Security Transactions and Investment Income:
Security transactions are recorded on the date a security is purchased or sold (i.e. on the trade date). Realized gains and losses are computed on the identified cost basis. Interest income is recorded on the accrual basis and includes accretion of discounts and amortization of premiums, where applicable. Dividend income is recorded on the ex-dividend date or in the case of some foreign securities, on the date thereafter when the Funds are made aware of the dividend. Foreign income may be subject to foreign withholding taxes, which are accrued as applicable. Capital gains realized on some foreign securities are subject to foreign taxes, which are accrued as applicable.
Dividends and interest from non-U.S. sources received by the Funds are generally subject to non-U.S. withholding taxes at rates ranging up to 30%. Such withholding taxes may be reduced or eliminated under the terms of applicable U.S. income tax treaties, and the Funds intend to undertake any procedural steps required to claim the benefits of such treaties.
C. Short Sale Transactions:
The Dynamic Balance Fund, Dynamic Dividend Fund, Dynamic Financial Services Fund, Dynamic Innovators Fund and Dynamic Transformations Fund are authorized to engage in short selling. Short sales are transactions in which a Fund sells a security it does not own in anticipation of a decline in the market value of that security. To complete such a transaction, a Fund must borrow the security to deliver to the buyer when affecting a short sale. The Fund is then obligated to replace the security borrowed by purchasing it in the open market at some later date. When a Fund sells a security short, an amount equal to the sales proceeds is included in the Statements of Assets and Liabilities as an asset and an equal amount as a liability. The amount of the liability is subsequently marked-to-market to reflect the current value of the short position. A Fund will incur a loss, which could be substantial and potentially unlimited, if the market price of the security increases between the date of the short sale and the date on which the Fund replaces the borrowed security. A Fund will realize a gain if the security declines in value between those dates. A Fund is also at risk of incurring dividend expense if the issuer of the security that has been sold short declares a dividend. A Fund must pay the dividend to the lender of the security. Dividends on short positions are recorded as an expense on the ex-dividend date.
All short sales must be fully collateralized. Accordingly, each Fund maintains collateral in a segregated account with its custodian, consisting of cash and/or liquid securities sufficient to collateralize its obligations on short positions.
D. Line of Credit:
Each of the Dynamic Balance, Dynamic Dividend, Dynamic Financial Services, Dynamic Innovators and Dynamic Transformations Funds have a line of credit with Custodial Trust Company (“CTC”). Loans in aggregate, whether to cover overdrafts or for investment purposes, may not exceed the maximum amount that is permitted under the 1940 Act, as amended. For the six months ended April 30, 2008, the average interest rate paid on outstanding borrowings was 4.37%, 5.04%, and 5.35% for the Dynamic Balance Fund, Dynamic Dividend Fund, and the Dynamic Financial Services Fund, respectively.
|
| Dynamic |
|
| Dynamic |
|
| Dynamic |
|
| Dynamic |
|
| Dynamic |
| |
|
|
|
|
|
|
|
|
|
|
|
| |||||
Total line of credit amount available |
| $ | 26,817,076 |
| $ | 451,843,299 |
| $ | 4,698,903 |
| $ | 14,323,999 |
| $ | 1,461,935 |
|
Line of credit outstanding at April 30, 2008 |
|
| — |
|
| — |
|
| 682,000 |
|
| — |
|
| — |
|
Line of credit amount unused at April 30, 2008 |
|
| 26,817,026 |
|
| 451,845,299 |
|
| 4,016,903 |
|
| 14,323,999 |
|
| 1,461,935 |
|
Average balance outstanding during the period |
|
| 2,866,522 |
|
| 6,819,956 |
|
| 813,674 |
|
| — |
|
| — |
|
Interest expense incurred during the period |
|
| 63,330 |
|
| 173,832 |
|
| 21,993 |
|
| — |
|
| — |
|
69
Alpine Mutual Funds |
|
Notes to Financial Statements—Continued
April 30, 2008 (Unaudited)
E. Income Taxes:
It is each Fund‘s policy to comply with the requirements of Subchapter M of the Internal Revenue Code applicable to regulated investment companies and to distribute timely, all of its investment company taxable income and net realized capital gains to shareholders. Therefore, no federal income tax provision is recorded.
Under applicable foreign tax laws, a withholding tax may be imposed on interest, dividends, and capital gains earned on foreign investments. Where available, the Funds will file for claims on foreign taxes withheld.
F. Dividends and Distributions:
Each of the Dynamic Balance, Dynamic Dividend, Dynamic Financial Services, Dynamic Innovators, Dynamic Transformations and the Ultra Short Tax Optimized Income Funds intends to distribute substantially all of its net investment income and net realized capital gains, if any, throughout the year to its shareholders in the form of dividends. The Municipal Money Market Fund declares and accrues dividends daily on each business day based upon the Fund‘s net income, and pays dividends monthly. Distributions to shareholders are recorded at the close of business on the ex-dividend date. All dividends are automatically reinvested in full and fractional shares of a Fund at net asset value per share, unless otherwise requested.
The amounts of dividends from net investment income and of distributions from net realized gains are determined in accordance with federal income tax regulations, which may differ from GAAP. These differences are either considered temporary or permanent in nature. To the extent these differences are permanent in nature, such amounts are reclassified within the composition of net assets based on their federal tax-basis treatment; temporary differences do not require reclassification.
G. Class Allocations:
Income, expenses (other than class specific expenses) and realized and unrealized gains and losses of the Ultra Short Tax Optimized Income Fund are allocated among the classes of the Fund based on the relative net assets of each class. Class specific expenses are allocated to the class to which they relate. Currently, class specific expenses are limited to those incurred under the Distribution Plan for Adviser Class shares.
H. Foreign Translation Transactions:
Each of the Dynamic Balance, Dynamic Dividend, Dynamic Financial Services, Dynamic Innovators and Dynamic Transformations Funds may invest up to 15%, 100%, 15%, 20%, and 100%, respectively, of the value of its total assets in foreign securities. The books and records of each Fund are maintained in U.S. dollars. Non-U.S. denominated amounts are translated into U.S. dollars as follows, with the resultant translation gains and losses recorded in the Statements of Operations:
| i) | market value of investment securities and other assets and liabilities at the exchange rate on the valuation date, |
| ii) | purchases and sales of investment securities, income and expenses at the exchange rate prevailing on the respective date of such transactions. |
I. Risk Associated With Foreign Securities and Currencies:
Investments in securities of foreign issuers carry certain risks not ordinarily associated with investments in securities of domestic issuers. Such risks include future political and economic developments and the possible imposition of exchange controls or other foreign governmental laws and restrictions. In addition, with respect to certain countries, there is a possibility of expropriation of assets, confiscatory taxation, political or social instability or diplomatic developments, which could adversely affect investments in those countries.
Certain countries may also impose substantial restrictions on investments in their capital markets by foreign entities, including restrictions on investments in issuers or industries deemed sensitive to relevant national interests. These factors may limit the investment opportunities available to the Funds or result in a lack of liquidity and high price volatility with respect to securities of issuers from developing countries.
J. Equity-Linked Structured Notes
Certain Funds may invest in equity-linked structured notes. Equity-linked structured notes are derivative securities which are specially designed to combine the characteristics of one or more underlying securities and their equity derivatives in a single note form. The return and/or yield or income component may be based on the performance of the underlying equity securities, and equity index, and/or option positions. Equity-linked structured notes are typically offered in limited transactions by financial institutions in either registered or non-registered form. An investment in equity-linked structured notes creates exposure to the credit risk of the issuing financial institution, as well as to the
70
Alpine Mutual Funds |
|
Notes to Financial Statements—Continued
April 30, 2008 (Unaudited)
market risk of the underlying securities. There is no guaranteed return of principal with these securities and the appreciation potential of these securities may be limited by a maximum payment or call right. In certain cases, equity-linked structured notes may be more volatile and less liquid than less complex securities or other types of fixed-income securities. Such securities may exhibit price behavior that does not correlate with other fixed-income securities.
K. Forward Currency Contracts:
A forward currency contract (“forward”) is an agreement between two parties to buy and sell a currency at a set price on a future date. The market value of the forward contract fluctuates with changes in forward currency exchange rates. The forward contract is marked-to-market daily and the change in market value is recorded by each Fund as unrealized appreciation or depreciation. When the forward contract is closed, a Fund records a realized gain or loss equal to the fluctuation in value during the period the forward contract was open. A Fund could be exposed to risk if a counterparty is unable to meet the terms of a forward or if the value of the currency changes unfavorably.
L. New Accounting Pronouncements:
In September 2006, the Financial Accounting Standards Board issued Statement of Financial Accounting Standards No. 157, “Fair Value Measurements” (“FAS 157”). The Statement defines fair value, establishes a framework for measuring fair value in generally accepted accounting principles (GAAP), and expands disclosures about fair value measurements. The Statement establishes a fair value hierarchy that distinguishes between (1) market participant assumptions developed based on market data obtained from sources independent of the reporting entity (observable inputs) and (2) the reporting entity‘s own assumptions about market participant assumptions developed based on the best information available in the circumstances (unobservable inputs). The Statement is effective for financial statements issued for fiscal years beginning after November 15, 2007, and is to be applied prospectively as of the beginning of the fiscal year in which this Statement is initially applied. At this time, management is evaluating the implications of FAS 157, and the impact, if any, of this standard on the Funds‘ financial statements has not yet been determined.
In March 2008, Statement of Financial Accounting Standards No. 161, “Disclosures about Derivative Instruments and Hedging Activities” (“SFAS 161”) was issued and is effective for fiscal years beginning after November 15, 2008. SFAS 161 is intended to improve financial reporting for derivative instruments by requiring enhanced disclosure that enables investors to understand how and why an entity uses derivatives, how derivatives are accounted for, and how derivative instruments affect an entity‘s results of operations and financial position. Management is currently evaluating the implications of SFAS 161. The impact of each Fund‘s financial statement disclosures, if any, is currently being assessed.
3. | Capital Share Transactions |
The Funds have an unlimited number of shares of beneficial interest, with $0.0001 par value, authorized. Transactions in shares and dollars of the Funds were as follows:
Dynamic Balance Fund
|
| Six Months Ended |
| Year Ended |
| ||||||
|
|
|
| ||||||||
|
| Shares |
|
| Amount |
| Shares |
|
| Amount |
|
|
|
|
|
|
| ||||||
Shares sold |
| 9,751 |
| $ | 146,327 |
| 105,507 |
| $ | 1,455,693 |
|
Shares issued in reinvestment of dividends |
| 570,320 |
|
| 6,677,006 |
| 338,493 |
|
| 4,556,609 |
|
Redemption fees |
| — |
|
| 9 |
| — |
|
| 471 |
|
Shares redeemed |
| (639,314 | ) |
| (7,622,622 | ) | (782,987 | ) |
| (10,723,292 | ) |
|
|
|
|
|
| ||||||
Total net change |
| (59,243 | ) | $ | (799,280 | ) | (338,987 | ) | $ | (4,710,519 | ) |
|
|
|
|
|
| ||||||
Dynamic Dividend Fund
|
| Six Months Ended |
| Year Ended |
| ||||||
|
|
|
| ||||||||
|
| Shares |
|
| Amount |
| Shares |
|
| Amount |
|
|
|
|
|
|
| ||||||
Shares sold |
| 32,813,174 |
| $ | 372,442,993 |
| 81,648,499 |
| $ | 1,071,958,520 |
|
Shares issued in reinvestment of dividends |
| 6,539,572 |
|
| 73,582,592 |
| 8,874,167 |
|
| 115,362,111 |
|
Redemption fees |
| — |
|
| 318,572 |
| — |
|
| 331,271 |
|
Shares redeemed |
| (28,627,244 | ) |
| (321,209,701 | ) | (28,518,733 | ) |
| (365,833,646 | ) |
|
|
|
|
|
| ||||||
Total net change |
| 10,725,502 |
| $ | 125,134,456 |
| 62,003,933 |
| $ | 821,818,256 |
|
|
|
|
|
|
| ||||||
71
Alpine Mutual Funds |
|
Notes to Financial Statements—Continued
April 30, 2008 (Unaudited)
Dynamic Financial Services Fund
|
| Six Months Ended |
| Year Ended |
| ||||||
|
|
|
| ||||||||
|
| Shares |
| Amount |
| Shares |
| Amount |
| ||
|
|
|
|
|
| ||||||
Shares sold |
| 460,528 |
| $ | 4,613,570 |
| 789,667 |
| $ | 9,859,139 |
|
Shares issued in reinvestment of dividends |
| 201,690 |
|
| 2,103,627 |
| 34,969 |
|
| 434,665 |
|
Redemption fees |
| — |
|
| 5,006 |
| — |
|
| 4,434 |
|
Shares redeemed |
| (209,822 | ) |
| (2,036,400 | ) | (667,395 | ) |
| (8,127,045 | ) |
|
|
|
|
|
| ||||||
Total net change |
| 452,396 |
| $ | 4,685,803 |
| 157,241 |
| $ | 2,171,193 |
|
|
|
|
|
|
| ||||||
Dynamic Innovators Fund
|
| Six Months Ended |
| Year Ended |
| ||||||
|
|
|
| ||||||||
|
| Shares |
| Amount |
| Shares |
| Amount |
| ||
|
|
|
|
|
| ||||||
Shares sold |
| 2,992,200 |
| $ | 40,312,823 |
| 3,025,024 |
| $ | 39,547,376 |
|
Shares issued in reinvestment of dividends |
| 121,184 |
|
| 1,654,158 |
| 10,487 |
|
| 108,857 |
|
Redemption fees |
| — |
|
| 113,973 |
| — |
|
| 8,144 |
|
Shares redeemed |
| (3,108,079 | ) |
| (39,086,702 | ) | (92,581 | ) |
| (1,204,553 | ) |
|
|
|
|
|
| ||||||
Total net change |
| 5,305 |
| $ | 2,994,252 |
| 2,942,930 |
| $ | 38,459,824 |
|
|
|
|
|
|
| ||||||
Dynamic Transformations Fund
|
| Period Ended |
| |||
|
|
| ||||
|
| Shares |
| Amount |
| |
|
|
|
| |||
Shares sold |
| 427,213 |
| $ | 4,271,835 |
|
Shares issued in reinvestment of dividends |
| — |
|
| — |
|
Redemption fees |
| — |
|
| 10 |
|
Shares redeemed |
| (121 | ) |
| (1,197 | ) |
|
|
|
| |||
Total net change |
| 427,092 |
| $ | 4,270,648 |
|
|
|
|
| |||
(1) | Fund commenced operations on December 31, 2007. |
Municipal Money Market Fund
|
| Six Months Ended |
| Year Ended |
| ||||||
|
|
|
| ||||||||
|
| Shares |
| Amount |
| Shares |
| Amount |
| ||
|
|
|
|
|
| ||||||
Adviser Class (1) |
|
|
|
|
|
|
|
|
|
|
|
Shares sold |
| — |
| $ | — |
| 521,785 |
| $ | 520,549 |
|
Shares issued in reinvestment of dividends |
| 1,124 |
|
| 1,124 |
| 27,091 |
|
| 28,327 |
|
Shares redeemed |
| (430,895 | ) |
| (430,894 | ) | (2,722,763 | ) |
| (2,722,763 | ) |
|
|
|
|
|
| ||||||
Total net change |
| (429,771 | ) | $ | (429,770 | ) | (2,173,887 | ) | $ | (2,173,887 | ) |
|
|
|
|
|
| ||||||
Investor Class |
|
|
|
|
|
|
|
|
|
|
|
Shares sold |
| 3,740,961,161 |
| $ | 3,740,961,161 |
| 6,946,498,894 |
| $ | 6,946,498,894 |
|
Shares issued in reinvestment of dividends |
| 9,602,872 |
|
| 9,602,871 |
| 21,148,612 |
|
| 21,148,611 |
|
Shares redeemed |
| (4,295,129,070 | ) |
| (4,295,129,070 | ) | (6,218,387,601 | ) |
| (6,218,387,601 | ) |
|
|
|
|
|
| ||||||
Total net change |
| (544,565,037 | ) | $ | (544,565,038 | ) | 749,259,905 |
| $ | 749,259,904 |
|
|
|
|
|
|
| ||||||
(1) | The Municipal Money Market Fund – Adviser Class ceased operations on December 5, 2007. |
72
Alpine Mutual Funds |
|
Notes to Financial Statements—Continued
April 30, 2008 (Unaudited)
Ultra Short Tax Optimized Income Fund
|
| Six Months Ended |
| Year Ended |
| ||||||
|
|
|
| ||||||||
|
| Shares |
| Amount |
| Shares |
| Amount |
| ||
|
|
|
|
|
| ||||||
Adviser Class |
|
|
|
|
|
|
|
|
|
|
|
Shares sold |
| 470,815 |
| $ | 4,751,587 |
| 89,889 |
| $ | 909,966 |
|
Shares issued in reinvestment of dividends |
| 3,680 |
|
| 37,096 |
| 2,499 |
|
| 25,241 |
|
Redemption fees |
| — |
|
| 62 |
| — |
|
| 17 |
|
Shares redeemed |
| (10,441 | ) |
| (105,393 | ) | (46,537 | ) |
| (470,517 | ) |
|
|
|
|
|
| ||||||
Total net change |
| 464,054 |
| $ | 4,683,352 |
| 45,851 |
| $ | 464,707 |
|
|
|
|
|
|
| ||||||
Investor Class |
|
|
|
|
|
|
|
|
|
|
|
Shares sold |
| 8,765,733 |
| $ | 88,106,640 |
| 1,893,951 |
| $ | 19,052,155 |
|
Shares issued in reinvestment of dividends |
| 187,004 |
|
| 1,876,713 |
| 199,835 |
|
| 2,007,061 |
|
Redemption fees |
| — |
|
| 2,152 |
| — |
|
| 491 |
|
Shares redeemed |
| (1,543,436 | ) |
| (15,490,326 | ) | (684,690 | ) |
| (6,888,073 | ) |
|
|
|
|
|
| ||||||
Total net change |
| 7,409,301 |
| $ | 74,495,179 |
| 1,409,096 |
| $ | 14,171,634 |
|
|
|
|
|
|
| ||||||
4. | Purchases and Sales of Securities: |
Purchases and sales of securities (excluding short-term securities) for the six months ended April 30, 2008 are as follows:
|
| Non-U.S. Government |
| U.S. Government |
| ||||||||
|
|
|
| ||||||||||
|
| Purchases |
| Sales |
| Purchases |
| Sales |
| ||||
|
|
|
|
|
| ||||||||
Dynamic Balance Fund |
| $ | 17,964,100 |
| $ | 16,184,319 |
| $ | — |
| $ | 3,456,671 |
|
Dynamic Dividend Fund |
|
| 1,587,956,340 |
|
| 1,536,691,794 |
|
| — |
|
| — |
|
Dynamic Financial Services Fund |
|
| 27,849,478 |
|
| 26,837,608 |
|
| — |
|
| — |
|
Dynamic Innovators Fund |
|
| 28,020,847 |
|
| 13,656,441 |
|
| — |
|
| — |
|
Dynamic Transformations Fund |
|
| 4,507,751 |
|
| 591,934 |
|
| — |
|
| — |
|
Ultra Short Tax Optimized Income Fund |
|
| 489,129,631 |
|
| 405,305,000 |
|
| — |
|
| — |
|
5. | Distribution Plans: |
Quasar Distributors, LLC (“Quasar”) serves as each Fund’s distributor. The Ultra Short Tax Optimized Income Fund has adopted a distribution and servicing plan (the “Plan”) for its Adviser Class shares as allowed by Rule 12b-1 under the 1940 Act. The Plan authorizes payments by the Fund in connection with the distribution and servicing of its shares at an annual rate, as determined from time to time by the Board of Trustees, of up to 0.25% of the Fund’s average daily net assets. Amounts paid under the Plan by the Fund may be spent by the Fund on any activities or expenses primarily intended to result in the sale of shares of the Fund, including but not limited to advertising, compensation for sales and marketing activities of financial institutions and others such as dealers and distributors, shareholder account servicing, the printing and mailing of prospectuses to other than current shareholders and the printing and mailing of sales literature. The Ultra Short Tax Optimized Income Fund incurred $2,172 pursuant to the Plan for the six months ended April 30, 2008. The Municipal Money Market Fund – Adviser Class, which ceased operations on December 5, 2007, incurred $90 pursuant to the Plan for the six months ended April 30, 2008.
The Plan for the Ultra Short Tax Optimized Income Fund may be terminated at any time by vote of the Trustees of the Income Trust who are not “interested persons”, as defined by the 1940 Act, of the Income Trust, or by vote of a majority of the outstanding voting shares of the respective class.
73
Alpine Mutual Funds |
|
Notes to Financial Statements—Continued
April 30, 2008 (Unaudited)
6. | Investment Advisory Agreement and Other Affiliated Transactions: |
Alpine Woods Capital Investors, LLC (“the Adviser”) provides investment advisory services to each of the Funds. Pursuant to the advisory agreements with the Funds, Alpine is entitled to an annual fee based on 1.00% of each Fund’s average daily net assets for the Dynamic Balance Fund, Dynamic Dividend Fund, Dynamic Financial Services Fund, Dynamic Innovators Fund and Dynamic Transformations Fund. Alpine is entitled to an annual fee based on 0.45% of the Municipal Money Market Fund’s average daily net assets and an annual fee based on 0.75% of the Ultra Short Tax Optimized Income Fund’s average daily net assets.
The Adviser agreed to reimburse the Dynamic Balance Fund, Dynamic Dividend Fund, Dynamic Financial Services Fund, Dynamic Innovators Fund, Dynamic Transformations Fund and Ultra Short Tax Optimized Income Fund-Investor Class to the extent necessary to ensure that each Fund’s total operating expenses (excluding 12b-1 fees, interest, brokerage commissions and extraordinary expenses) does not exceed 1.35%, 1.35%, 1.35%, 1.35%, 1.35%, and 0.60% of the Fund’s average daily net assets, respectively. For the six months ended April 30, 2008, the Adviser agreed to reimburse the Municipal Money Market Fund-Investor Class to the extent necessary to ensure that the Fund’s total operating expenses (excluding 12b-1 fees, interest, brokerage commissions and extraordinary expenses) did not exceed certain limits. The limits ranged from 0.24% to 0.40% of the Fund’s average daily net assets during the six months ended April 30, 2008. The expense caps for the Ultra Short Tax Optimized Income Fund – Adviser Class Shares is 0.25% higher than the Investor Class shares. The Adviser may recover expenses paid in excess of the cap on expenses for the three previous years, as long as the recovery does not cause the Fund to exceed such cap on expenses. For the six months ended April 30, 2008, the Adviser waived investment advisory fees totaling $27,398, $46,056, $756,456, and $109,141, for the Dynamic Financial Services Fund, Dynamic Transformations Fund, Municipal Money Market Fund, and Ultra Short Tax Optimized Income Fund, respectively. The expense limitations will remain in effect for each Fund unless and until the Board of Trustees of the Series and Income Trusts approve its modification or termination with respect to one or more Funds.
Reimbursed/absorbed expenses subject to potential recovery by year of expiration are as follows:
Year of Expiration |
| Dynamic |
| Dynamic |
| Dynamic |
| Dynamic |
| Municipal |
| Ultra Short |
| ||||||
10/31/09 |
| $ | — |
| $ | 42,892 |
| $ | 2,348 |
| $ | — |
| $ | — |
| $ | — |
|
10/31/10 |
|
| — |
|
| 139,356 |
|
| 22,424 |
|
| — |
|
| 1,718,243 |
|
| 148,724 |
|
10/31/11 |
|
| — |
|
| 27,398 |
|
| — |
|
| 46,056 |
|
| 756,456 |
|
| 109,141 |
|
At April 30, 2008, the Dynamic Dividend Fund and the Dynamic Innovators Fund had $2,400,984 and $5,000,000, respectively, invested in the Municipal Money Market Fund.
74
Alpine Mutual Funds |
|
Notes to Financial Statements—Continued
April 30, 2008 (Unaudited)
7. | Federal Income Tax Information: |
At October 31, 2007, the components of accumulated earnings/(losses) on a tax basis were as follows:
|
| Dynamic |
| Dynamic |
| Dynamic |
| Dynamic |
| Municipal |
| Ultra Short Tax |
| ||||||
|
|
|
|
|
|
|
| ||||||||||||
Cost of investments |
| $ | 73,107,575 |
| $ | 1,408,722,708 |
| $ | 13,412,769 |
| $ | 47,941,224 |
| $ | 1,101,729,031 |
| $ | 58,779,493 |
|
|
| ||||||||||||||||||
Gross unrealized appreciation |
| $ | 20,884,197 |
| $ | 148,036,313 |
| $ | 644,725 |
| $ | 3,749,563 |
| $ | — |
| $ | 118,588 |
|
Gross unrealized depreciation |
|
| (7,217,519 | ) |
| (73,239,648 | ) |
| (2,231,812 | ) |
| (775,777 | ) |
| — |
|
| (27,510 | ) |
|
| ||||||||||||||||||
Net unrealized appreciation/depreciation |
| $ | 13,666,678 |
| $ | 74,796,665 |
| $ | (1,587,087 | ) | $ | 2,973,786 |
| $ | — |
| $ | 91,078 |
|
|
| ||||||||||||||||||
Undistributed ordinary income |
| $ |
|
| $ | 28,530,268 |
| $ | 2,663,093 |
| $ | 1,950,071 |
| $ | — |
| $ | 7,979 |
|
Undistributed long-term capital gain |
|
| 5,543,410 |
|
| — |
|
| — |
|
| 54,842 |
|
| — |
|
| — |
|
|
| ||||||||||||||||||
Total distributable earnings |
| $ | 6,112,153 |
| $ | 28,530,268 |
| $ | 3,217,662 |
| $ | 2,004,913 |
| $ | — |
| $ | 7,979 |
|
|
| ||||||||||||||||||
Other accumulated gain/(losses) |
| $ | — |
| $ | (56,224,768 | ) | $ | 59,108 |
| $ | (5,496 | ) | $ | (412 | ) | $ | (57,473 | ) |
|
| ||||||||||||||||||
Total accumulated earnings/(losses) |
| $ | 19,778,831 |
| $ | 47,102,165 |
| $ | 1,695,250 |
| $ | 4,973,203 |
| $ | (412 | ) | $ | 41,584 |
|
|
| ||||||||||||||||||
The tax basis of investments for tax and financial reporting purposes differs principally due to the deferral of losses on wash sales, REIT tax adjustments, and mark-to-market cost basis adjustments for investments in foreign passive investment companies (PFICs) for tax purposes.
75
Alpine Mutual Funds |
|
Notes to Financial Statements—Continued
April 30, 2008 (Unaudited)
The tax character of distributions paid during the years ended October 31, 2007 and 2006 were as follows:
|
| 2007 |
| 2006 |
| ||
|
|
|
| ||||
|
|
|
|
|
|
|
|
Dynamic Balance Fund |
|
|
|
|
|
|
|
Ordinary income |
| $ | 2,193,895 |
| $ | 1,535,036 |
|
Long-term capital gain |
|
| 2,767,519 |
|
| 1,667,049 |
|
|
|
|
| ||||
|
|
| 4,961,414 |
| $ | 3,202,085 |
|
|
|
|
| ||||
Dynamic Dividend Fund |
|
|
|
|
|
|
|
Ordinary income |
| $ | 151,334,543 |
| $ | 57,422,280 |
|
Long-term capital gain |
|
| — |
|
| — |
|
|
|
|
| ||||
|
| $ | 151,334,543 |
| $ | 57,422,280 |
|
|
|
|
| ||||
Dynamic Financial Services Fund |
|
|
|
|
|
|
|
Ordinary income |
| $ | 540,721 |
| $ | 840 |
|
Long-term capital gain |
|
| — |
|
| — |
|
|
|
|
| ||||
|
| $ | 540,721 |
| $ | 840 |
|
|
|
|
| ||||
Dynamic Innovators Fund |
|
|
|
|
|
|
|
Ordinary income |
| $ | 109,960 |
| $ | — |
|
Long-term capital gain |
|
| — |
|
| — |
|
|
|
|
| ||||
|
| $ | 109,960 |
| $ | — |
|
|
|
|
| ||||
Municipal Money Market Fund |
|
|
|
|
|
|
|
Exempt interest dividend |
| $ | 27,398,638 |
| $ | 8,396,915 |
|
Ordinary income |
|
| 185 |
|
| 6,838 |
|
Long-term capital gain |
|
| — |
|
| — |
|
|
|
|
| ||||
|
| $ | 27,398,823 |
| $ | 8,403,753 |
|
|
|
|
| ||||
Ultra Short Tax Optimized Income Fund |
|
|
|
|
|
|
|
Ordinary income |
| $ | 674,305 |
| $ | 316,991 |
|
Exempt interest dividends |
|
| 1,413,327 |
|
| 1,309,437 |
|
Long-term capital gain |
|
| — |
|
| — |
|
|
|
|
| ||||
|
| $ | 2,087,632 |
| $ | 1,626,428 |
|
|
|
|
| ||||
Capital loss carryovers as of October 31, 2007 are as follows:
Expiration Date |
| Municipal |
| Dynamic |
| Ultra Short |
| |||
|
|
|
| |||||||
10/31/2012 |
| $ | 412 |
|
| — |
|
| — |
|
10/31/2013 |
|
| — |
| $ | 4,335,047 |
|
| — |
|
10/31/2014 |
|
| — |
| $ | 15,084,034 |
| $ | 55,361 |
|
10/31/2015 |
|
| — |
| $ | 37,200,325 |
| $ | 2,112 |
|
______________
* | Capital gain distributions will resume in the future to the extent gains are realized in excess of the available capital loss carryovers. |
Effective April 30, 2008, the Funds adopted Financial Accounting Standards Board (“FASB”) Interpretation No. 48, “Accounting for Uncertainty in Income Taxes” (“FIN 48”). FIN 48 requires the evaluation of tax positions taken on previously filed tax returns or expected to be taken on future returns. These positions must meet a “more-likely-
76
Alpine Mutual Funds |
|
Notes to Financial Statements—Continued
April 30, 2008 (Unaudited)
than-not” standard that, based on the technical merits, have a more than fifty percent likelihood of being sustained upon examination. In evaluating whether a tax position has met the recognition threshold, the Funds must presume that the position will be examined by the appropriate taxing authority that has full knowledge of all relevant information. Tax positions not deemed to meet the “more-likely-than-not” threshold are recorded as a tax expense in the current year.
FIN 48 requires the Funds to analyze all open tax years, as defined by the Statute of Limitations, for all major jurisdictions. Open tax years are those that are open for exam by taxing authorities. Major jurisdictions for the Funds included Federal and the state of New York. As of April 30, 2008, open Federal and New York tax years include the tax years ended October 31, 2004 through 2007. The Funds have no examination in progress.
The Funds have reviewed all open tax years and major jurisdictions and concluded that the adoption of FIN 48 resulted in no effect to any Fund’s financial position or results of operations. There is no tax liability resulting from unrecognized tax benefits relating to uncertain income tax positions taken or expected to be taken on the tax return for the fiscal year-end October 31, 2007. The Funds are also not aware of any tax positions for which it is reasonably possible that the total amounts of unrecognized tax benefits will significantly change in the next twelve months.
77
Alpine Mutual Funds |
|
Additional Information (Unaudited)
Expense Examples
April 30, 2008
As a shareholder of the Dynamic Balance Fund, Dynamic Dividend Fund, Dynamic Financial Services Fund, Dynamic Innovators Fund, Dynamic Transformations Fund and Ultra Short Tax Optimized Income Fund – Adviser and Investor Class, you will incur two types of costs: (1) redemption fees and (2) ongoing costs, including management fees; distribution and/or service fees; and other Fund expenses. As a shareholder of the Municipal Money Market Fund – Adviser and Investor Class, you will incur ongoing costs, including management fees; distribution and/or service fee; and other Fund expenses. The examples below are intended to help you understand your ongoing costs (in dollars) of investing in the Funds and to compare these costs with the ongoing costs of investing in other mutual funds. The examples are based on in investment of $1,000 for the period 11/1/2007-4/30/2008.
Actual Expenses
The first line of the tables below provides information about actual account values and actual expenses. The Funds charge no sales load or transaction fees, but do assess shareholders for outgoing wire transfers, returned checks and stop payment orders at prevailing rates charged by U.S. Bancorp Fund Services, LLC, the Fund’s transfer agent. If you request a redemption by wire transfer, currently a $15.00 fee is charged by the Fund’s transfer agent. Shareholders in the Dynamic Balance Fund, Dynamic Dividend Fund, Dynamic Financial Services Fund, Dynamic Innovators Fund and Dynamic Transformations Fund will be charged a redemption fee equal to 1.00% of the net amount of the redemption if they redeem their shares less than 2 months after purchase. Shareholders in the Ultra Short Tax Optimized Income Fund – Adviser and Investor Class will be charged a redemption fee equal to 0.25% of the net amount of the redemption if they redeem their shares less than one month after purchase. IRA accounts will be charged a $15.00 annual maintenance fee. To the extent the Funds invest in shares of other investment companies as a part of their investment strategies, you will indirectly bear your proportionate share of any fees and expenses charged by the underlying funds in which the Funds invest in addition to the expenses of the Fund. These expenses are not included in the example below. The example below includes, but is not limited to, management fees, shareholder servicing fees, fund accounting, custody and transfer agent fees. You may use the information in this line, together with the amount you invested, to estimate the expenses that you paid over the period. Simply divide your account value by $1,000 (for example, an $8,600 account value divided by $1,000 = 8.6), then multiply the result by the number in the first line under the heading entitled “Expenses Paid During Period” to estimate the expenses you paid on your account during the period.
Hypothetical Example for Comparison Purposes
The second line of the table below provides information about hypothetical account values and hypothetical expenses based on the Fund’s actual expense ratios and an assumed rate of return of 5% per year before expenses, which does not represent the Fund’s actual returns. The hypothetical account values and expenses may not be used to estimate the actual ending account balance or expenses you paid for the period. You may use this information to compare the ongoing costs of investing in the Funds and other funds. To do so, compare this 5% hypothetical example with the 5% hypothetical examples that appear in the shareholder reports of other funds. Please note that the expenses shown in the table are meant to highlight your ongoing costs only and do not reflect any transactional costs, such as redemption fees. Therefore, the second line of the table is useful in comparing ongoing costs only, and will not help you determine the relative total costs of owning different funds. In addition, if these transactional costs were included, your costs would have been higher.
Dynamic Balance Fund
|
| Beginning |
| Ending |
| Expenses Paid | |||
|
| Account Value |
| Account Value |
| During Period | |||
|
| 11/1/2007 |
| 4/30/2008 |
| 11/1/2007-4/30/2008* | |||
|
|
|
| ||||||
Actual (1) |
| $ 1,000.00 |
| $ | 945.60 |
|
| $ 6.24 |
|
Hypothetical (2) |
| $ 1,000.00 |
| $ | 1,018.45 |
|
| $ 6.47 |
|
(1) | Ending account values and expenses paid during period based on a (5.44)% return. The return is considered after expenses are deducted from the Fund. |
(2) | Ending account values and expenses paid during period based on a 5.00% annual return. The return is considered before expenses are deducted from the Fund. |
* | Expenses are equal to the Fund’s annualized expense ratio of 1.29%, multiplied by the average account value over the period, multiplied by 182/366 (to reflect the one-half year period). |
78
Alpine Mutual Funds |
|
Additional Information (Unaudited)—Continued
Expense Examples
April 30, 2008
Dynamic Dividend Fund
| Beginning |
| Ending |
| Expenses Paid | ||
| Account Value |
| Account Value |
| During Period | ||
| 11/1/2007 |
| 4/30/2008 |
| 11/1/2007-4/30/2008* | ||
|
|
| |||||
Actual (1) | $ 1,000.00 |
| $ | 863.30 |
|
| $ 5.51 |
Hypothetical (2) | $ 1,000.00 |
| $ | 1,018.95 |
|
| $ 5.97 |
______________
(1) | Ending account values and expenses paid during period based on a (13.67)% return. The return is considered after expenses are deducted from the Fund. |
(2) | Ending account values and expenses paid during period based on a 5.00% annual return. The return is considered before expenses are deducted from the Fund. |
* | Expenses are equal to the Fund’s annualized expense ratio of 1.19%, multiplied by the average account value over the period, multiplied by 182/366 (to reflect the one-half year period). |
Dynamic Financial Services Fund
| Beginning |
| Ending |
| Expenses Paid | ||
| Account Value |
| Account Value |
| During Period | ||
| 11/1/2007 |
| 4/30/2008 |
| 11/1/2007-4/30/2008* | ||
|
|
| |||||
Actual (1) | $ 1,000.00 |
| $ | 887.30 |
|
| $ 6.33 |
Hypothetical (2) | $ 1,000.00 |
| $ | 1,018.15 |
|
| $ 6.77 |
______________
(1) | Ending account values and expenses paid during period based on a (11.27)% return. The return is considered after expenses are deducted from the Fund. |
(2) | Ending account values and expenses paid during period based on a 5.00% annual return. The return is considered before expenses are deducted from the Fund. |
* | Expenses are equal to the Fund’s annualized expense ratio of 1.35%, multiplied by the average account value over the period, multiplied by 182/366 (to reflect the one-half year period). |
Dynamic Innovators Fund
| Beginning |
| Ending |
| Expenses Paid | ||
| Account Value |
| Account Value |
| During Period | ||
| 11/1/2007 |
| 4/30/2008 |
| 11/1/2007-4/30/2008* | ||
|
|
| |||||
Actual (1) | $ 1,000.00 |
| $ | 902.10 |
|
| $ 6.29 |
Hypothetical (2) | $ 1,000.00 |
| $ | 1,018.25 |
|
| $ 6.67 |
______________
(1) | Ending account values and expenses paid during period based on a (9.79)% return. The return is considered after expenses are deducted from the Fund. |
(2) | Ending account values and expenses paid during period based on a 5.00% annual return. The return is considered before expenses are deducted from the Fund. |
* | Expenses are equal to the Fund’s annualized expense ratio of 1.33%, multiplied by the average account value over the period, multiplied by 182/366 (to reflect the one-half year period). |
Dynamic Transformations Fund
| Beginning |
| Ending |
| Expenses Paid | ||
| Account Value |
| Account Value |
| During Period | ||
| 11/1/2007 |
| 4/30/2008 |
| 11/1/2007-4/30/2008* | ||
|
|
| |||||
Actual (1) | $ 1,000.00 |
| $ | 1,009.00 |
|
| $ 4.42 |
Hypothetical (2) | $ 1,000.00 |
| $ | 1,018.15 |
|
| $ 6.67 |
______________
(1) | Ending account values and expenses paid during period based on a 0.90% return. The return is considered after expenses are deducted from the Fund. |
(2) | Ending account values and expenses paid during period based on a 5.00% annual return. The return is considered before expenses are deducted from the Fund. |
* | Actual expenses are equal to the Fund’s annualized expense ratio of 1.33%, multiplied by the average account value over the period, multiplied by 121/366 (to reflect the period January 1, 2008–April 30, 2008, the Fund’s commencement of operations date to the end of the period). Hypothetical expenses are equal to the Fund’s annualized expense ratio of 1.29%, multiplied by the average account value over the period, multiplied by 182/366 (to reflect the one-half year period). |
79
Alpine Mutual Funds |
|
Additional Information (Unaudited)—Continued
Expense Examples
April 30, 2008
Municipal Money Market Fund
Investor Class Shares
| Beginning |
| Ending |
| Expenses Paid | ||
| Account Value |
| Account Value |
| During Period | ||
| 11/1/2007 |
| 4/30/2008 |
| 11/1/2007–4/30/2008* | ||
|
|
| |||||
Actual (1) | $ 1,000.00 |
| $ | 1,015.00 |
|
| $ 1.50 |
Hypothetical (2) | $ 1,000.00 |
| $ | 1,023.37 |
|
| $ 1.51 |
______________
(1) | Ending account values and expenses paid during period based on a 1.50% return. The return is considered after expenses are deducted from the Fund. |
(2) | Ending account values and expenses paid during period based on a 5.00% annual return. The return is considered before expenses are deducted from the Fund. |
* | Expenses are equal to the Fund’s annualized expense ratio of 0.30%, multiplied by the average account value over the period, multiplied by 182/366 (to reflect the one-half year period). |
Ultra Short Tax Optimized Income Fund
Adviser Class Shares
| Beginning |
| Ending |
| Expenses Paid | ||
| Account Value |
| Account Value |
| During Period | ||
| 11/1/2007 |
| 4/30/2008 |
| 11/1/2007-4/30/2008* | ||
|
|
| |||||
Actual (1) | $ 1,000.00 |
| $ | 1,014.90 |
|
| $ 4.26 |
Hypothetical (2) | $ 1,000.00 |
| $ | 1,020.64 |
|
| $ 4.27 |
______________
(1) | Ending account values and expenses paid during period based on a 1.49% return. The return is considered after expenses are deducted from the Fund. |
(2) | Ending account values and expenses paid during period based on a 5.00% annual return. The return is considered before expenses are deducted from the Fund. |
* | Expenses are equal to the Fund’s annualized expense ratio of 0.85%, multiplied by the average account value over the period, multiplied by 182/366 (to reflect the one-half year period). |
Ultra Short Tax Optimized Income Fund
Investor Class Shares
| Beginning |
| Ending |
| Expenses Paid | ||
| Account Value |
| Account Value |
| During Period | ||
| 11/1/2007 |
| 4/30/2008 |
| 11/1/2007-4/30/2008* | ||
|
|
| |||||
Actual (1) | $ 1,000.00 |
| $ | 1,017.10 |
|
| $ 3.01 |
Hypothetical (2) | $ 1,000.00 |
| $ | 1,021.88 |
|
| $ 3.02 |
______________
(1) | Ending account values and expenses paid during period based on a 1.71% return. The return is considered after expenses are deducted from the Fund. |
(2) | Ending account values and expenses paid during period based on a 5.00% annual return. The return is considered before expenses are deducted from the Fund. |
* | Expenses are equal to the Fund's annualized expense ratio of 0.60%, multiplied by the average account value over the period, multiplied by 182/366 (to reflect the one-half year period). |
80
Alpine Mutual Funds |
|
Additional Information (Unaudited)—Continued
April 30, 2008
Investment Advisor and Advisory Contract
On December 17, 2007, at a meeting called for the purpose of voting on such approval, the Boards of Trustees, including all of the Trustees who are not parties to the Advisory Contracts or interested persons of any such party (the non-interested Trustees), approved the continuance of the Advisory Contracts for the Funds. In so doing, the Board Members studied materials specifically relating to the Advisory Contracts provided by the Adviser, the Funds’ counsel and the Funds’ administrator (“USBFS”). The Board Members considered a variety of factors, including the following:
The Board Members considered the expected nature, quality and scope of the management and investment advisory services and personnel provided to each Fund by the Adviser; the rate of investment advisory fees payable to the Adviser and a comparison of the fees paid by comparable funds; the compensation (in addition to the investment advisory fees) and other benefits received by the Adviser and its respective affiliates; the Adviser’s costs in providing services; the economies of scale realized by the Adviser; the annual operating expenses of each Fund; and the policies and practices of the Adviser with respect to portfolio transactions for each Fund.
After reviewing the diligence materials provided by USBFS, the Adviser and Fund Counsel, the Board began a discussion to assess the overall quality of services. The Board considered the Adviser’s specific responsibilities in all aspects of day-to-day management of each Fund managed by the Adviser, as well as the qualifications, experience and responsibilities of the portfolio managers and other key personnel at the Advisor involved in the day-to-day activities of each Fund. The Board also considered, with regard to each Fund, the prior relationship between the Adviser and the Fund, as well as the Board’s knowledge of the Adviser’s operations. The Trustees also considered the Adviser’s marketing activity and commitment to Fund growth. The Trustees also considered the structure and effectiveness of the Adviser’s compliance procedures and the Adviser’s record of willingness to meet in person with the Trustees to discuss various performance, marketing and compliance issues. The Trustees also noted any services that extended beyond portfolio management, and they considered the trading capability of the Adviser.
The Board Members also evaluated the investment performance of the Funds on an absolute basis, relative to their respective benchmark indices over the last year, three years, five years, ten years and since inception (as applicable) and in comparison to their relative peer groups.
The Board Members also reviewed Lipper analytical data relating to average expenses and advisory fees for comparable funds. Based on the information provided, the Board Members determined that each Fund’s fee structure is competitive with funds having similar investment goals and strategies.
The Board Members considered each Fund’s total expense ratios and contractual investment advisory fees compared to its respective industry average by quartile, within the appropriate Lipper benchmark category and Lipper category range. The Board Members also considered the amount and nature of fees paid by shareholders.
The Trustees also considered the overall profitability of the Adviser, reviewing certain financial information and noting in particular whether the Adviser had subsidized a Fund’s operations in its early years and whether it had recouped the amount of these subsidies. The Trustees considered both the direct and indirect benefits to the Adviser from advising the Funds. The Trustees also examined the level of profits that could be expected to accrue to the Adviser fro m the fees payable under the Agreements and any expense subsidization undertaken by the Adviser, as well as each Fund’s brokerage and commissions. The Board Members considered the fact that the Adviser has contractually agreed to waive a portion of its fees for the Dynamic Balance Fund, the Dynamic Dividend Fund, the Dynamic Financial Services Fund, the Dynamic Innovators Fund, Dynamic Transformations Fund, the Municipal Money Market Fund and the Ultra Short Tax Optimized Income Fund for a period of one year, to be reviewed again at the next Advisory Contract renewal. It was noted that each Fund’s management fee and expense ratio are within the average range compared to its peer funds.
Based on the Board Members’ review and consultation with the Funds’ independent counsel, of the material aspects of the Advisory Contracts, including the foregoing factors and such other information believed to be reasonably necessary to evaluate the terms of the Advisory Contra cts, the Board Members, including all of the non-interested Trustees voting separately, concluded that the continuation of the Advisory Contracts would be in the best interest of the Funds’ shareholders, and determined that the compensation to the Adviser provided for in the Advisory Contracts is fair and equitable.
81
Alpine Mutual Funds |
|
Additional Information (Unaudited)—Continued
April 30, 2008
Information about Trustees and Officers
The business and affairs of the Funds are managed under the direction of Trusts’ Board of Trustees. Information pertaining to the Trustees and Officers of the Funds is set forth below. The SAI includes additional information about the Funds’ Trustees and Officers and is available, without charge, upon request by calling 1-888-785-5578.
Independent Trustees | ||||||||||
Name, Address and Age |
| Position(s) |
| Term of Office |
| Principal Occupation During |
| # of |
| Other Directorships |
|
|
|
|
| ||||||
Laurence B. Ashkin (79) |
| Independent Trustee |
| Indefinite, since the Trust’s inception |
| Real estate developer and construction consultant since 1980; Founder and President of Centrum Properties, Inc. since 1980. |
| 13 |
| Trustee of each of the Alpine Trusts. |
H. Guy Leibler (53) |
| Independent Trustee |
| Indefinite, since the Trust’s inception |
| Private investor, since 2007; Vice Chair & Chief Operating Officer of L&L Acquisitions, LLC (2004-2007); President, Skidmore, Owings & Merrill LLP (2001-2004). |
| 13 |
| Chairman Emeritus, White Plains Hospital Center; Trustee, each of the Alpine Trusts. |
Jeffrey E. Wacksman (47) |
| Independent Trustee |
| Indefinite, since 2004 |
| Partner, Loeb, Block & Partners LLP since 1994. |
| 13 |
| Director, International Succession Planning Association; Trustee, Larchmont Manor Park Society; Director, Bondi Icebergs Inc. (Women’s Sportswear); Director, MH Properties, Inc.; Trustee, each of the Alpine Trusts. |
* | The term “Fund Complex” refers to the Funds in the Alpine Equity Trust, Alpine Series Trust, Alpine Income Trust, the Alpine Global Dynamic Dividend Fund, Alpine Total Dynamic Dividend Fund, and the Alpine Global Premier Properties Fund. |
82
Alpine Mutual Funds |
|
Additional Information (Unaudited)—Continued
April 30, 2008
Interested Trustees & Officers | ||||||||||
Name, Address and Age |
| Position(s) |
| Term of Office |
| Principal Occupation During |
| # of |
| Other Directorships |
|
|
|
|
| ||||||
Samuel A. Lieber* (51) |
| Interested Trustee, President and Portfolio Manager |
| Indefinite, since the Trust’s inception |
| CEO of Alpine Woods Capital Investors, LLC since November 1997. Formerly Senior Portfolio Manager with Evergreen Asset Management Corp. (1985-1997). |
| 13 |
| Trustee, each of the Alpine Trusts. |
Stephen A. Lieber (82) |
| Vice President and Portfolio Manager |
| Indefinite, since the Trust’s inception |
| Chief Investment Officer, Alpine Woods Capital Investors, LLC since 2003; Chairman and Senior Portfolio Manager, Saxon Woods Advisors, LLC since 1999. |
| N/A |
| None |
Robert W. Gadsden (50), |
| Vice President and Portfolio Manager |
| Indefinite, since 1999 |
| Portfolio Manager and Senior Real Estate Analyst of Alpine Woods Capital Investors, LLC since 1999. Formerly Vice President, Prudential Realty Group (1990-1999). |
| N/A |
| None |
Sheldon R. Flamm (60) |
| Vice President, Treasurer and Chief Compliance Officer |
| Indefinite, since 2002 |
| Chief Financial Officer and Senior Managing Director, Alpine Woods Capital Investors, LLC, since 2001; Chief Financial Officer, Saxon Woods Advisors, LLC since 1999. |
| N/A |
| None |
Oliver Sun (43) |
| Secretary |
| Indefinite, since 2002 |
| Controller of Alpine Woods Capital Investors, LLC since 1998. |
| N/A |
| None |
* | Denotes Trustees who are “interested persons” of the Trust or Fund under the 1940 Act. |
** | The term “Fund Complex” refers to the Funds in the Alpine Equity Trust, Alpine Series Trust, Alpine Income Trust, and the Alpine Global Dynamic Dividend Fund, Alpine Total Dynamic Dividend Fund, and the Alpine Global Premier Properties Fund. |
83
Alpine Mutual Funds |
|
Additional Information (Unaudited)—Continued
April 30, 2008
Availability of Proxy Voting Information
Information regarding how each Fund votes proxies relating to portfolio securities is available without charge upon request by calling toll-free at 1-888-785-5578 and on the SEC’s website at www.sec.gov. Information regarding how each Fund voted proxies relating to portfolio securities during the most recent twelve month period ended June 30 is available on the SEC’s website at www.sec.gov or by calling the toll-free number listed above.
Availability of Quarterly Portfolio Schedule
Beginning with each Fund’s fiscal quarter ended July 31, 2004, each Fund filed its complete schedule of portfolio holdings on Form N-Q with the SEC. Going forward, each Fund will file Form N-Q for the first and third quarters of each fiscal year on Form N-Q. Each Fund’s Form N-Q is available on the SEC’s website at www.sec.gov and may be reviewed and copied at the SEC’s Public Reference Room in Washington, DC. Information on the operation of the Public Reference Room may be obtained by calling 1-202-551-8090.
84
TRUSTEES
Samuel A. Lieber
Laurence B. Ashkin
H. Guy Leibler
Jeffrey E. Wacksman
CUSTODIAN
U.S. Bank, N.A.
1555 North Rivercenter Drive, Suite 302
Milwaukee, WI 53212
SUB-CUSTODIAN
The Bank of New York Mellon
One Wall Street
New York, NY 10286
INDEPENDENT REGISTERED
PUBLIC ACCOUNTING FIRM
Deloitte & Touche LLP
555 East Wells Street
Milwaukee, WI 53202
FUND COUNSEL
Blank Rome LLP
The Chrysler Building
405 Lexington Avenue
New York, NY 10174
DISTRIBUTOR
Quasar Distributors, LLC
615 East Michigan Street
Milwaukee, WI 53202
INVESTMENT ADVISER
Alpine Woods Capital Investors, LLC
2500 Westchester Ave., Suite 215
Purchase, NY 10577
TRANSFER AGENT &
ADMINISTRATOR
U.S. Bancorp Fund Services, LLC
615 East Michigan Street
Milwaukee, WI 53202
|
SHAREHOLDER | INVESTOR INFORMATION |
1(888)785.5578 |

This material must be preceded or accompanied by a current prospectus.
Item 2. Code of Ethics.
Not Applicable
Item 3. Audit Committee Financial Expert.
Not Applicable
Item 4. Principal Accountant Fees and Services.
Not Applicable
Item 5. Audit Committee of Listed Registrants.
Not applicable to registrants who are not listed issuers (as defined in Rule 10A-3 under the Securities Exchange Act of 1934).
Item 6. Schedule of Investments.
Schedule of Investments is included as part of the report to shareholders filed under Item 1 of this Form.
Item 7. Disclosure of Proxy Voting Policies and Procedures for Closed-End Management Investment Companies.
Not applicable to open-end investment companies.
Item 8. Portfolio Managers of Closed-End Management Investment Companies.
Not applicable to open-end investment companies.
Item 9. Purchases of Equity Securities by Closed-End Management Investment Company and Affiliated Purchasers.
Not applicable to open-end investment companies.
Item 10. Submission of Matters to a Vote of Security Holders.
Not Applicable.
1
Item 11. Controls and Procedures.
(a) | The Registrant’s President and Treasurer have reviewed the Registrant's disclosure controls and procedures (as defined in Rule 30a-3(c) under the Investment Company Act of 1940 (the “Act”)) as of a date within 90 days of the filing of this report, as required by Rule 30a-3(b) under the Act and Rules 13a-15(b) or 15d-15(b) under the Securities Exchange Act of 1934. Based on their review, such officers have concluded that the disclosure controls and procedures are effective in ensuring that information required to be disclosed in this report is appropriately recorded, processed, summarized and reported and made known to them by others within the Registrant and by the Registrant’s service provider. |
(b) | There were no changes in the Registrant's internal control over financial reporting (as defined in Rule 30a-3(d) under the Act) that occurred during the second fiscal quarter of the period covered by this report that has materially affected, or is reasonably likely to materially affect, the Registrant's internal control over financial reporting. |
Item 12. Exhibits.
(a) | (1) Any code of ethics or amendment thereto, that is subject of the disclosure required by Item 2, to the extent that the registrant intends to satisfy Item 2 requirements through filing an exhibit. Not Applicable |
| (2) Certifications pursuant to Section 302 of the Sarbanes-Oxley Act of 2002. Filed herewith. |
(b) | Certification pursuant to Section 906 of the Sarbanes-Oxley Act of 2002. Furnished herewith. |
2
SIGNATURES
Pursuant to the requirements of the Securities Exchange Act of 1934 and the Investment Company Act of 1940, the registrant has duly caused this report to be signed on its behalf by the undersigned, thereunto duly authorized.
(Registrant) | Alpine Income Trust |
|
|
| |||
|
|
|
| ||||
|
|
|
| ||||
By (Signature and Title) | /s/ Samuel A. Lieber |
| |||||
|
| ||||||
| Samuel A. Lieber, President |
| |||||
|
|
|
| ||||
Date | July 8, 2008 |
|
|
| |||
|
|
|
| ||||
Pursuant to the requirements of the Securities Exchange Act of 1934 and the Investment Company Act of 1940, this report has been signed below by the following persons on behalf of the registrant and in the capacities and on the dates indicated.
By (Signature and Title)* | /s/ Samuel A. Lieber |
|
|
| |
| Samuel A. Lieber, President |
|
Date | July 8, 2008 |
|
|
|
By (Signature and Title)* | /s/ Sheldon Flamm |
|
|
| |
| Sheldon Flamm, Treasurer |
|
Date | July 8, 2008 |
|
|
|
* Print the name and title of each signing officer under his or her signature.
3