As filed with the Securities and Exchange Commission on July 9, 2010
UNITED STATES
SECURITIES AND EXCHANGE COMMISSION
Washington, D.C. 20549
FORM N-CSR
CERTIFIED SHAREHOLDER REPORT OF REGISTERED MANAGEMENT INVESTMENT COMPANIES
Investment Company Act file number 811-21210
Alpine Income Trust
(Exact name of registrant as specified in charter)
2500 Westchester Avenue, Suite 215
Purchase, NY 10577
(Address of principal executive offices) (Zip code)
Samuel A. Lieber
Alpine Woods Capital Investors, LLC
2500 Westchester Avenue, Suite 215
Purchase, NY 10577
(Name and address of agent for service)
Copy to:
Thomas R. Westle, Esq.
Attorney at Law
Blank Rome LLP
The Chrysler Building
405 Lexington Avenue
New York, NY 10174
1-888-785-5578
Registrant's telephone number, including area code
Date of fiscal year end: October 31, 2010
Date of reporting period: April 30, 2010
TABLE OF CONTENTS
| EQUITY MANAGER REPORTS | |
| | |
Alpine Dynamic Dividend Fund | 6 |
| | |
Alpine Accelerating Dividend Fund | 15 |
| | |
Alpine Dynamic Financial Services Fund | 20 |
| | |
Alpine Dynamic Innovators Fund | 25 |
| | |
Alpine Dynamic Transformations Fund | 29 |
| | |
Alpine Dynamic Balance Fund | 33 |
| | |
| FIXED INCOME MANAGER REPORTS | |
| | |
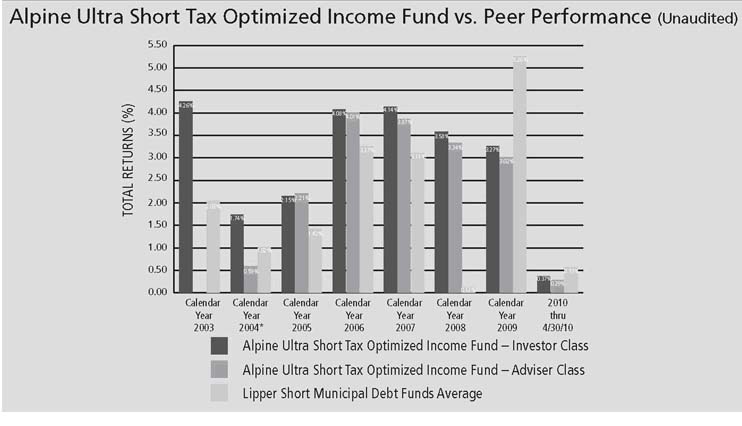
Alpine Ultra Short Tax Optimized Income Fund | 37 |
| | |
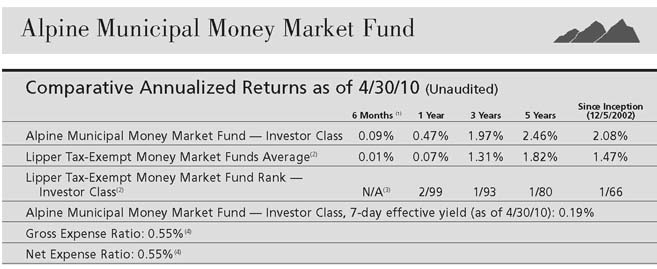
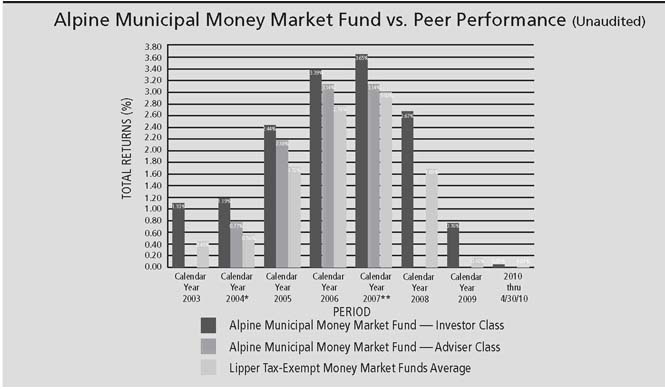
Alpine Municipal Money Market Fund | 40 |
| | |
| Schedules of Portfolio Investments | 45 |
| | |
| Statements of Assets and Liabilities | 74 |
| | |
| Statements of Operations | 77 |
| | |
| Statement of Cash Flows | 80 |
| | |
| Statements of Changes in Net Assets | 81 |
| | |
| Financial Highlights | 89 |
| | |
| Notes to Financial Statements | 98 |
| | |
| Additional Information | 112 |
Additional Alpine Funds are offered in the Alpine Equity Trust. These funds include:
Alpine International Real Estate Equity Fund
Alpine Realty Income & Growth Fund
Alpine Cyclical Advantage Property Fund
Alpine Emerging Markets Real Estate Fund
Alpine Global Infrastructure Fund
Alpine’s Real Estate Funds’ investment objectives, risks, charges and expenses must be considered carefully before investing in funds of the Alpine Equity Trust. The prospectus contains this and other important information about the investment company, and it may be obtained by calling 1-888-785-5578, or visiting www.alpinefunds.com. Read it carefully before investing.
Mutual fund investing involves risk. Principal loss is possible.

Dear Investor:
We concluded last fall’s annual letter to shareholders by stating that “. . .The U.S. and global economies will continue to transition in a positive fashion towards a multi year cycle of relatively directional positive returns. . ., but that is not to say that 2010 will be an easy year.” We expected market volatility and that is surely what we have experienced to date through the semi-annual period ending April 30, 2010 and into the May date of this letter writing. The market memory of the financial distress which precipitated the meltdown of Lehman Brothers in the Fall of 2008 and continued into early 2009 is still fresh in investors’ memories, yet the hopes for economic recovery and strong financial market returns have been growing. The forces of greed and fear remain powerfully present in the market today as witnessed by significant sector rotation over the past six months and a return to high levels on the VIX Index of market volatility. Capital market improvement, solid corporate earnings and signs of economic strength have been offset by the Euro debt crisis, BP’s Gulf oil spill, North Korean aggression, and China’s moderation of prior stimulus. In Alpine’s view, both exogenous events and economic fundamentals are continually incorporated into a natural progression towards a longer term trend, as the market alternates between dancing forward then taking a step backward before progressing further. We believe the markets will establish a stronger medium-term trend during 2011 in anticipation of improving economic prospects leading into 2012 and beyond, and long-term investors may once again replace traders as the dominant force in the market.
THE EURO AND INVESTMENT RISK
The current financial market instability brought about by the decline in the Euro versus the U.S. dollar, stems from the market’s inability to assess the ultimate impact of the Greek government’s eroded capacity to both service and stand behind its sovereign debt. The scope of the situation could be as minimal as Greece’s 2% contribution to Euro-zone Gross Domestic Product (GDP), or as significant as spawning a contagion of credit concerns which could undermine the cohesion of the European Union (EU) and the durability of its’ currency, the Euro. At their extreme, such fears of high exposure among banks and governments to potentially risky corporate and sovereign debt, suggests that even the creditworthiness of the United States of America could eventually be impaired. Thus, the range of imp lications to all financial markets could extend from insignificant to catastrophic. However, the reality is likely more benign. While disruptive to markets in the short term, the fears of contagion have forced the European Union (EU) and the European Central Bank (ECB) to provide greater safeguards than is probably warranted. In effect, the EU’s 750 billion Euro stabilization package is designed to provide adequate funding for not only Greece, but Portugal and Spain, for a period of approximately four years. This is designed as a temporary measure to enable these different countries to implement and execute austerity packages which would reduce their dependence upon debt financing of government activities. Unfortunately, for a few months market participants will likely remain unsure as to the future effectiveness of such plans or of the negative impact upon domestic or regional growth. Thus, pressure on the Euro may continue; initially to the benefit of the U.S. dollar. Devaluation of the Euro should h elp exporters, particularly in Germany, where unit labor costs rose by less than 10% over the previous decade. By comparison, Southern Europe experienced 30% to 40% increases, with Greece now the least competitive country in that region. Over the next few years, the EU will likely add institutional flexibility in order to adjust for financial inequalities amongst members. Otherwise, the membership will be forced to change for the EU to remain meaningful.
As Alpine sees it, debt funded excesses which perhaps provided a boost to prior year’s growth are being replaced by austerity measures in response to pressure from the financial markets, which remain focused on reducing risk. Governments, corporations and even individuals, are increasingly being required to live within their means, to fund debt obligations from cash flow and utilize resources productively to produce either collective, corporate or individual wealth. This emphasis on derisking has certainly entered into the equity markets where the mid-May sell-off was characterized by some observers as traders derisking exposure to stocks, taking risk off their portfolios in relation to currencies, or adjusting the amount of market risk that they were comfortable taking. This was a contrast to the strong Marc h rally which preceded this contagion conundrum, where financially leveraged cyclical stocks outperformed as some traders sought to add beta or market risk to their portfolios.
Risk aversion is evidenced by the astonishing low yields which investors are accepting for low risk. U.S. Treasury Bills are yielding 0.159% for the shortest duration risk of three months. ‘Safe Haven’ U.S. Treasury Bills are yielding 0.159% for the shortest duration risk of three months. With a yield curve that only rises above 3% after six years, investors either expect significant deflation of assets for several years or are so risk averse as to forsake opportunities to grow their net worth. The danger of a financial meltdown which was almost palpable in October of 2008 is not apparent from measures such as so-called ‘TED’ Spreads between Treasury notes and LIBOR (London Interbank Offering Rates are the cost at which banks d o business with each other) which ended May at roughly 0.21% versus a peak of over 4.53% on October 10, 2008. Further evidence comes from the U.S. Federal Reserve’s St Louis (Fed Branch) Financial Stress Index which peaked at 5.01% in that same week in 2008, yet ended May 2010 at 0.872%. Perhaps the current pattern of extreme caution could be expected after experiencing a hundred year flood as we did during the credit crisis of 2008. Thus, if important measures of financial risk are only flashing a yellow cautious and not a solid red for danger, then market psychology may be excessively cautious, with potentially significant, albeit, diverging implications for both equity and income investors.
ALPINE’S FOCUS ON FUNDING CORPORATE INVESTMENT
The market’s on again, off again reactions to a continuing stream of information and statistics reflect the powerful impact of short term trading strategies. While we must be responsive to short-term conditions, Alpine seeks to set its strategy based on larger fundamental trends and conditions. We believe that earnings growth can occur in a low or slow growth environment if market share gains are possible. In light of the recent downturn, many public companies, particularly in the real estate and banking sectors, sold new shares to investors over the past year in order to recapitalize balance sheets and position themselves to potentially expand market share. Selectively, Alpine funds have been active participants in many such offerings. Irrespective of economic conditions, companies with innovative products or processes or those which can achieve corporate transformation brought about by a change in product lines or business, may also experience increases in market share. Alpine has made these investment themes the primary focus of two different funds. However, for all of our funds, we endeavor to find such opportunities as well as emphasizing regions or sectors of growing demand. As a corollary, we are less inclined to invest in situations where growth in user demand is limited or declining. However, there are situations when such decline or such growth is more than priced in, and that creates both buying and selling opportunities, respectively. While this suggests that there will always be buying opportunities in different markets at different times, we nevertheless prefer to tilt the portfolios to the areas where we find longer term growth. Thus, Alpine’s focus on emerging market opportunities, most notably in Brazil and China where it is appropriate for the mandates of specific Funds, or for other Fu nds by investing in U.S. based companies which are seeking growth opportunities in emerging market economies.
CHINA SLOWING AND BRAZIL GROWING
Recently, China has embarked on a restrictive liquidity program bringing money supply growth down from a stimulus oriented peak of 35% after the Lehman Brothers bankruptcy, back to historic levels of 15% to18%. The government has also sought to constrain price inflation in the property sector, both of which we believe may take 2% to 4% off GDP, bringing the medium term rate of growth from 11% down to a 7% to 8% range. We believe that the major impact of this attempt to reign in price inflation will be achieved this summer, and that, to a great degree, it is already being priced into the stock market. Typically, command control economies such as China are often too blunt in their approach and methodology and, hence, the desired impact may not be as envisioned. That said, domestic income inequality between workers, their bosses, and even the growing middle class has been contentious, so the political aspect of this exercise may be as important as the economic.
A side result of this projected slowdown in China has been a decline in commodity prices around the world, impacting not only the major suppliers of such materials in natural resources, but also restraining a global source of potential inflation. With regard to Brazil, domestic demand is now growing to the point where the effect of China’s modest slowdown is not having a significant impact. There have even been a few economists who recently increased their growth prospects for Brazil from 6.5% to 7.5% GDP growth during the course of 2010, as the Central Bank may moderate ongoing plans to raise interest rates over the course of the year. It is worth noting that these interest rate increases are not tied to interest rates used for consumer mortgages. Rather they should have more impact on the commercial bor rowing than on domestic demand. We also expect to see a growing level of fixed asset investment in both infrastructure and industry in Brazil, including new roads, railroads, ports, steel mills and deep sea oil rigs. Many U.S., European, Japanese and Chinese companies are investing in Brazil to build industrial capacity from mines to factories, while others are focused on growing consumption patterns, notably including Unilever and Walmart. This is a classic pattern where countries which initially had a beneficial cost of production or abundant natural resources further enhanced productivity through modern industrialization and then created “added value” through downstream manufacturing or distribution.
INVESTING FOR FUTURE NEEDS
For the past eighty years, the U.S. has been at the head of the pack in our productivity gains, as witnessed by our economy’s 22% share of global GDP. However, we must increase the current level of investment in our infrastructure and technical capacity, with particular focus on education if we are to maintain this level of superiority. Unfortunately, it looks as if during the next few years we will share some of the burden of austerity measures which now afflict Europe and the U.K. Our municipal and state government budgets were directly stabilized by the stimulus package of 2009, yet drastic cuts to the 2010 through 2011 local budgets will be telling, both in their political and economic impact over the next year. We already see an historic excess of qualified teachers relative to job openings as class size s rise and curriculums shrink. Cuts in municipal and social services ranging from reduced waste pickup, more homeless on the streets and fewer services for the needy or house bound are already taking place. Fees, tolls and taxes will be increasing at the same time that public transit schedules are reduced. This makes the prospects for meaningful economic growth even less clear. Add to this the inevitable uncertainty over the impact of recent Federal government legislation bringing healthcare and financial reform, and the likely evolution of a revised tax regime starting next year. Thus, the ongoingpolitical debate regarding finances and priorities will take on greater significance for the next few years.
Countering such concerns for now are the benefits of a strong dollar at the expense of the Euro, and cheaper commodities which should help to sustain low interest rates for our import oriented economy. Low interest rates around the world could very well continue into the foreseeable future. With a few years of cheap money and a degree of ingenuity, the U.S. may be able to maintain the current trajectory of recovery. Europe and Japan have fewer tools with which to engage growth, so more time may be needed to rebalance their accounts. Progress could provide investors with greater economic clarity of future economic potentials as we continue to unwind the debt burden of the past decade and restructure our industrial and economic priorities. With clarity comes confidence, which reinforces action, suggesting that the ne xt two to three years may see a resurgence of long term investors in equity markets.
Where Greece was a shot across the bow of the European Union, we must make sure that it was not a ‘canary in the coal mine’ singing to the rest of us. Companies and countries which can continue to fund their finances should see their shares and currencies perform well over the near term. Those that cannot, may well be devalued or neglected by investors. Inevitably, strong players can take advantage of opportunities better than those with financial constraints. This suggests that merger and acquisition (M&A) activity, which has already resurfaced, may continue to grow in both volume and size over the next few years. The stock pickers at Alpine are looking forward to continued innovation and transformations which respond to the needs of today. . .and tomorrow!
In closing, we expect that the balance of 2010 could continue to be somewhat volatile; however, we would expect to see some measure of improvement by the time we next report to you after the end of the October fiscal year.
Thank you for your interest and support,
Samuel A. Lieber
_____________
Mutual fund investing involves risk. Principal loss is possible.
The letter and those that follow represent the opinion of Alpine Funds management and are subject to change, are not guaranteed, and should not be considered recommendations to buy or sell any security.
Past performance is not a guarantee of future results.
Please refer to the schedule of investments for fund holding information. Fund holdings and sector allocations are subject to change and should not be considered a recommendation to buy or sell any security. Current and future portfolio holdings are subject to risk.
VIX Index – Chicago Board Options Exchange SPX Volatility Index reflects a market estimate of future volatility, based on the weighted average of the implied volatilities for a wide range of strikes.
St. Louis Fed’s Financial Stress Index (STLFSI) is constructed using principal components analysis is a statistical method of extracting factors responsible for the comovement of a group of variables.
Cash flow measures the cash generating capability of a company by adding non-cash charges (e.g. depreciation) and interest expense to pretax income.
Beta measures the sensitivity of rates of return on a fund to general market movements.)
The TED spread is the difference between the interest rates on interbank loans and short-term U.S. government debt. The TED spread is an indicator of perceived credit risk in the general economy.
Yield Curve – is the relation between the interest rate (or cost of borrowing) and the time to maturity of the debt for a given borrower in a given currency.
EQUITY MANAGER REPORTS
Alpine Dynamic Dividend Fund
Alpine Accelerating Dividend Fund
Alpine Dynamic Financial Services Fund
Alpine Dynamic Innovators Fund
Alpine Dynamic Transformations Fund
Alpine Dynamic Balance Fund
Alpine Dynamic Dividend Fund |
Comparative Annualized Returns as of 4/30/10 (Unaudited) | | |
| | | | | | Since Inception |
| | 6 Months (1) | 1 Year | 3 Years | 5 Years | (9/22/2003) |
| | | | | | |
| Alpine Dynamic Dividend Fund | 12.39% | 32.66% | -14.06% | -1.33% | 4.25% |
| | | | | | |
| S&P 500 Index | 15.66% | 38.84% | -5.05% | 2.63% | 4.35% |
| | | | | | |
Lipper Equity Income Funds Average(2) | 13.89% | 36.54% | -5.14% | 2.83% | 5.42% |
| | | | | | |
Lipper Equity Income Funds Ranking(2) | N/A(3) | 228/298 | 246/247 | 185/197 | 117/158 |
| | | | | | |
| Alpine Dynamic Dividend Fund 30 Day SEC Yield (as of 4/30/10): 0.56% | | | |
| | | | | | |
Gross Expense Ratio: 1.21%(4) | | | | | |
| | | | | | |
Net Expense Ratio: 1.21%(4) | | | | | |
(1) Not annualized.
(2) The since inception return represents the annualized return for the period beginning 9/25/2003.
(3) FINRA does not recognize rankings for less than one year.
(4) As disclosed in the prospectus dated February 27, 2010.
Performance data quoted represents past performance and is not predictive of future results. Investment return and principal value of the Fund fluctuate, so that the shares, when redeemed, may be worth more or less than their original cost. Performance current to the most recent month end may be lower or higher than performance quoted and may be obtained by calling 1-888-785-5578. Performance data shown does not reflect the 1.00% redemption fee imposed on shares held for fewer than 2 months. If it did, total returns would be reduced.
The S&P 500 Index is designed to measure performance of the broad domestic economy through changes in the aggregate market value of 500 stocks representing all major industries. The Lipper Equity Income Funds Average is an average of funds that seek relatively high current income and income growth through investing 60% or more of their respective portfolios in equities. Lipper Rankings for the periods shown are based on Fund total returns with dividends and distributions reinvested and do not reflect sales charges. The S&P 500 Index and the Lipper Equity Income Funds Average are unmanaged and do not reflect the deduction of direct fees associated with a mutual fund, such as investment adviser fees; however, the Lipper Equity Income Funds Average reflects fees charged by the underlying funds. The performan ce for the Dynamic Dividend Fund reflects the deduction of fees for these value-added services. Investors cannot directly invest in an index.
To the extent that the Fund’s historical performance resulted from gains derived from participation in initial public offerings (“IPOs”) and/or secondary offerings, there is no guarantee that these results can be replicated in future periods or that the Fund will be able to participate to the same degree in IPO/Secondary allocations in the future.
Alpine Dynamic Dividend Fund 

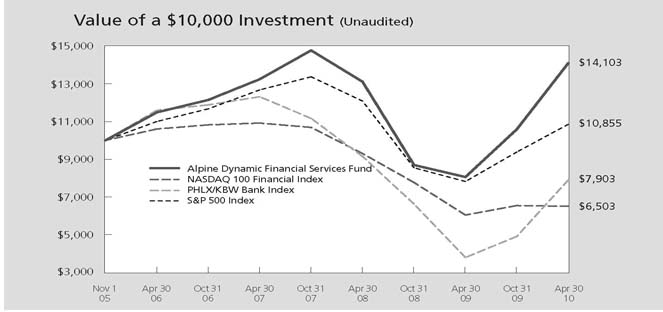
This chart represents a comparison of a hypothetical $10,000 investment in the Fund versus a similar investment in the Fund’s benchmark. The graph and the table do not reflect the deduction of taxes that a shareholder would pay on Fund distributions or the redemption of Fund shares. Investment performance reflects the waiver and recovery of certain fees. Without the waiver and recovery of fees, the Fund’s total return would have differed.
Commentary
The Alpine Dynamic Dividend Fund (ADVDX) completed its first half fiscal 2010 ended April 30, 2010 by distributing a high level of dividend income while also focusing on total return for long-term growth of capital.
For the six month period ending April 30, 2010, the Fund produced a total return of 12.39% including dividend reinvestment. This compares to a 15.66% increase in the S&P 500 Index and a 13.89% increase for the Lipper Equity Income Fund Average in the US. For the twelve months ended 4/30/10, the Fund provided a 32.66% total return including dividend reinvestment. This compares to a 38.84% increase in the S&P 500 Index and a 36.54% increase for the Lipper Equity Income Fund Average in the U.S.
ADVDX provided a high dividend yield in a very challenging dividend income environment
We have continued to provide our investors with a high level of equity income despite many companies cutting or eliminating dividends during the global recession of 2008 and 2009. The Fund paid a regular monthly minimum dividend of $0.07 per share. In addition, in the third month of each quarter the Fund distributed additional dividend income that had been earned or expected to be earned during the year. During fiscal first half 2010, the quarter-end dividend payments were $0.15 per share in December 2009 and $0.12 per share in March 2010. The Fund paid out total dividends of $0.55 per share in first half fiscal 2010 and $1.07 per share for the trailing twelve months ended April 30, 2010. Based on a closing price of ADVDX of $4.81 on 4/30/10, the $1.07 dividend payout represents a trailing twelve-month dividend yield of 22.3%. Whi le the Fund’s distributions exceeded its net investment income on 4/30/10, our annual peak dividend capture period occured from early April through early June. At the end of June 2010, the Fund estimates that it will have generated net investment income in excess of its year-to date-distributions. Since inception, ADVDX paid a total of $9.16 per share in earned dividend income.
Alpine Dynamic Dividend Fund
Following the global economic downturn and a threatened collapse of the world financial systems in 2008 and 2009, it is not surprising that a large number of dividends were cut as companies looked to conserve cash amidst declining earnings and tight capital markets. Internationally, there were even more severe dividend cuts than in the U.S. This has been particularly tough for us since Europe has become one of our primary dividend markets. The U.S. is one of the lowest yielding countries in the group of G20 nations with a 1.8% current dividend yield versus for example 3.7% for Australia, 3.2% in Britain, and 3.2% in Italy for the 12 month period ending 4/30/10.
A major headwind for our dividend capture program has been the decline in dividends paid globally as well as the decline in liquidity available for our dividend trades. One of our risk management disciplines we use for dividend capture is that we generally will not enter a position unless there is sufficient liquidity to allow the fund to exit the holding relatively quickly in the event of company specific or market specific news flow during our targeted holding period. According to a study done by Goldman Sachs, total dividends paid by companies in the European Stoxx 600 Index have declined by 39% since their peak in early 2008 through June 2010 while liquidity in the European Index has declined by 63% from the peak in mid-2007 through June 2010. In the U.S., dividends paid by companies in the S&P 500 Index ha ve declined 20% and liquidity decreased 42% from the peak in early 2008 through June 2010 according to Goldman Sachs. These two factors have combined to produce a meaningful decline in the amount of dividend dollars available for our dividend capture universe.
Due to these challenging market conditions, the Board of Directors of ADVDX decided on June 24, 2010 to reduce the regular monthly dividend distributions paid to shareholders. The Fund will distribute a monthly payment of $0.07 per share for June 2010 and $0.042 per share per month in July, August, and September 2010. Annualized, this new dividend rate of $0.504 per share represents a current dividend yield of 12.23% on ADVDX’s closing NAV of $4.12 per share on June 24, 2010. With a goal of sustainability the Board will continue to reevaluate dividend payments on a quarterly basis. The Fund intends to continue generating dividend payouts consisting of net investment income. The Fund’s management considered a number of factors before recommending to the Board that the Fund’s current distribution be decreased, including current market outlook, equity liquidity, volatility, level of assets in the Fund, and the dividend yield of the Fund.
The reduced dividend payment reflects in large measure the adverse impact on the portfolio’s net asset value and dividend earning power from the recent decline in the currency and asset values of our major international holdings. In 2010 to date, a decline in the Euro currency of 13.92% as of June 24, and weak equity markets impacted the portfolio’s net asset value. The combination of uncertain European equity prospects and reduced asset values with lower dividend income in U.S. dollars was a principal factor leading to this decision to change the dividend amount and reduce the dividend.
The Fund remains committed to providing a high level of dividend income and there is some encouraging news in that we have started to see companies raise their dividends in 2010 in the U.S. as the economic recovery has progressed. According to data from Standard and Poor’s, the number of companies in the S&P 500 Index that raised their dividends in 2010 is 128 with only 2 companies cutting their dividend. This is in comparison to 2009 when a total of 157 companies raised dividends and 78 cut. The challenge for our Fund is that the dollar amount of dividend payments is still well below previous levels.
Historically, a significant portion of the Fund’s dividends have been comprised of income benefiting from lower federal tax rates (called Qualified Dividend Income or QDI). ADVDX seeks to maintain its current high dividend level during these difficult market conditions, by utilizing a more rapid rotation of holdings in its dividend capture program. This is reflected in the substantial increase in our portfolio turnover for the Fund from over 300% in fiscal 2008 to over 600% in fiscal 2009. The result of our reduced holding period in our dividend capture portfolio has been a decline in the percentage of QDI distributable by the Fund.
Another affect from the escalation of our portfolio turnover is an increase in our transaction expenses, but due to a substantial amount of tax loss carry-forwards, we do not expect any material capital gains tax implications from our increased turnover. In addition, to gain efficiencies and reduce friction costs associated with the increased rotation in its international holdings, the Fund has utilized swap transactions. While the income from these swaps does not qualify for QDI, their use is limited to those transactions that are short term in nature and would not otherwise be eligible for QDI. We will not have an estimate of our QDI for fiscal 2010 until the end of the tax year. However at this time we would expect it to be less than the amount of ADVDX’s fiscal 2009 dividend that was classified as qualified dividend income at approximately 77%. The QDI tax benefits are set to expire on December 31, 2010 unless Congress changes its position.
Alpine Dynamic Dividend Fund
ADVDX produced a positive total return in first half 2010 despite declines in key international markets
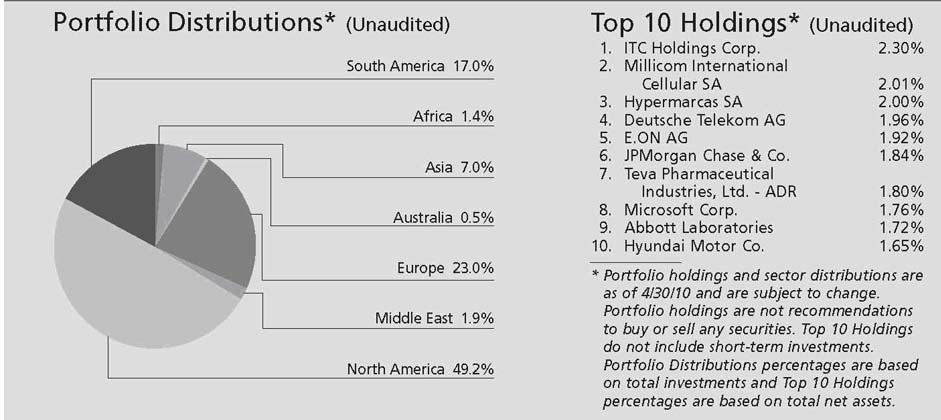
While we were encouraged by our total return performance in first half fiscal 2010, the Fund’s results lagged the broader U.S. indices, primarily due to its international exposure and specifically in our European equities. We have continued to find attractive growth opportunities and significantly larger dividend payouts overseas than we see in the U.S and therefore we have a larger exposure to overseas markets in comparison to the S&P 500 Index and many of our equity income peers. As of April 30, 2010, the Fund had invested 52.1% of net assets in international companies and 43.5% of its value in domestic U.S. based companies, with the 4.48% remaining 4.4% in cash and equivalents. ADVDX is currently invested in equities based in 25 different countries. On April 30, 2010 we had 17.2% of the portfolio inves ted in emerging market countries including Brazil, China, South Korea, Taiwan, and South Africa. Following the United States, our current top five countries are Brazil, Germany, France, Norway, Bermuda and Canada. The average dividend yield for the major indices in these five countries, for the 12 month period ending 4/30/10, is currently 3.46% versus the yield on the S&P 500 Index of 1.8%.
Unfortunately, the timing of the escalation of sovereign solvency concerns in Europe in April and May have occurred when we have our highest dividend capture opportunities in the region. We ended April 30 with approximately 23% of net assets invested in Europe so the Fund had been particularly hard hit at the end of fiscal first half 2010 and into May 2010. The STOXX Europe 600 Index has declined by 20.24% from April 1, 2010 through May 25, 2010 in US dollar terms. This is also reflected in the dramatic 21.4 percentage point difference in performance of the Dow Jones Industrial Average in the U.S. which increased 14.9% in first half fiscal 2010 and the 6.5% decline in the STOXX Euro 50 Index in US dollar terms.
In other international markets, the Brazil stock market as represented by the Brazil IBRX Index also lagged the S&P 500 Index, increasing 9.83% for six months ended 4/30/10 however global growth concerns and the unwinding of risk assets resulted in a decline in the Index of 15.5% in April and May in US dollar terms. The Chinese stock market as represented by the Shanghai Index declined 4.1% in fiscal first half 2010 and 16.3% in April and May in U.S. dollar terms versus a 7.2% decline for the S&P 500 Index in April and May on these same concerns of a global slowdown. The U.S. markets outperformed as investors looked for relative safety in the U.S. dollar and the U.S. economy.
Also impacting our performance has been the continuation of outperformance of lower yielding stocks since the March 2009 market lows. Three of the four industries that outperformed the S&P 500 Index in first half fiscal 2010 were the lowest yielding industries (Consumer Discretionary, Materials, Financials) while the top four yielding industries were the worst performing sectors (Telecom, Energy, Consumer Staples and Health Care).
Throughout first half fiscal 2010, it remained challenging to balance our portfolio to continue to provide a high level of current income while also investing our assets for capital appreciation. We will continue to work hard to find attractive dividend opportunities within these challenging markets. The Fund combines three research-driven investment strategies Dividend Capture, Growth and Income, and Value / Restructuring, in an effort to maximize the amount of our earned dividend income and to identify companies globally with the potential for dividend increases and capital appreciation.
Our “Dividend Capture Strategy” enhances the dividend income generated by the Fund
We run a portion of our portfolio with a dividend capture strategy, where we invest in high dividend stocks or in special situations where large cash balances are being returned to shareholders as one-time special dividends. We then look to enhance our dividend return by rotating a portion of our high yielding holdings after receiving the dividend. Our increased rotation strategy has, while increasing the available yield, also reduced the amount of dividend income to be eligible for the reduced 15% Federal dividend tax rate.
This qualified dividend income (QDI) tax benefit is set to expire on December 31, 2010, and there is uncertainty on what the tax level will be for dividends in 2011 and beyond. At this time, we do not believe that a change in the tax code will hinder our dividend capture efforts or materially change our strategy. If the QDI benefit is eliminated, we will not have the constraint of the 61 day holding period required to be eligible for the tax benefit. In addition, we could look to expand our dividend capture opportunities to different non-tax qualified equity markets (i.e. Hong Kong, Taiwan) and certain non-tax qualified equities like real estate investment trusts (REITs) or master limited partnerships (MLPs). There i s a risk that U.S. companies may be marginally less inclined to return cash to shareholders as dividends if tax requirements are increased, but we feel this risk is mitigated since we currently receive the majority of our dividends from foreign companies.
Alpine Dynamic Dividend Fund
One of our largest holdings at the end of first half 2010 was Millicom International Cellular (MICC) which announced an attractive special dividend payment associated with a return of excess cash on its balance sheet. Based in Luxembourg, MICC is an operator of wireless telephone systems in 13 emerging market countries in Latin America and Africa. MICC is experiencing strong growth by providing affordable prepaid cellular telephone services to more than 30 million current subscribers with a combined population under license of approximately 260 million people. In April 2010, MICC announced a special dividend payment of $4.60 per share in addition to its $1.40 annual dividend per share, representing a total dividend payment of 7.1% of its market value. However, Millicom provided a negative total return of 5.87% in f iscal first half 2010 which ended prior to receiving the special dividend in May although modest capital gains have since been achieved.
Our “Growth and Income Strategy” Targets Capital Appreciation in Addition to Yield
Our second strategy identifies core growth and income stocks that may have slightly lower but still attractive current dividend yields plus an outlook for strong and predictable earnings streams that should support additional future dividend increases. Several of our top ten holdings are industry leaders with strong growth in their categories and the potential for attractive and rising dividend payouts. These include ITC Holdings, Hypermarcas SA, Abbott Laboratories, Teva Pharmaceuticals, and Microsoft.
The largest holding on 4/30/10 in the Fund was ITC Holdings (ITC), based in Michigan. It is the largest U.S. independent electric transmission company with 15,000 miles of transmission lines that span 5 Midwestern states. It is also developing new transmission opportunities in Kansas and Oklahoma and has recently proposed the 3,000 mile Green Power Express project to bring wind resources from the Dakotas, Minnesota, and Iowa to the Midwest. As the only pure-play transmission company in the U.S., we believe that ITC is very well positioned to participate in the upgrade and build-out of the nation’s electric transmission grid, a key priority for the Obama administration. ITC generates a 2.4% dividend yield and is forecasted to possibly deliver 20% compound annual earnings per share growth in the next several ye ars thanks to favorable regulatory treatment of electric transmission and its ambitious capital spending plan. ITC provided a 26.15% total return for ADVDX in fiscal first half 2010.
Another top ten holding and top performer in the Fund was Hypermarcas SA (HYPE3 BZ), which as the largest independent consumer products company in Latin America offers an excellent way for investors to participate in the secular growth story of the emerging market consumer. Hypermarcas sells more than 200 brands of personal care and cosmetics, pharmaceutical, home care, and food products to wholesalers and retailers throughout Brazil. HYPE3 is estimated to produce a 25% compound annual growth in its earnings per share from 2010 through 2012. It is forecasted to initiate a 1% dividend yield this year which may grow strongly with the growth in earning and should supplement our expectations of capital appreciation potential. Hypermarcas was a top performer in the Fund with a 37.70% total return for the six months ended 4/30/10.
Two of our top growth and income holdings are considered more defensive stocks in the healthcare sector. These companies have attractive earnings outlooks that are less tied to economic growth and now have the benefit of the uncertainty of healthcare reform behind them. Abbott Laboratories (ABT), based in Illinios, is a diversified healthcare company with principal business lines in global pharmaceuticals, nutritional, and medical products. We believe that ABT’s five year growth outlook is attractive based on the strength of its new cholesterol products as well as its Humira arthritis and Xience drug stent franchises. We anticipate 10 – 12% sustainable EPS growth over the next several years supported by limited generic risk relative to its peer group, smart acquisitions including recently the largest pharmaceutical com pany in India, and solid earnings visibility. In addition, ABT raised its dividend by 10% in 2010 and now offers a 3.8% current dividend yield, after having raised its dividend every year including during the downturn in 2008 and 2009.
Teva Pharmaceuticals (TEVA) based in Israel is the largest generic drug manufacturer in the world in addition to its strong branded product portfolio. The generics business should benefit from the significant patent expirations in the pharmaceutical industry in 2011 and 2012 and their branded drugs for diseases like MS should continue to do well. Teva has one of the highest earnings growth rates in the pharmaceutical industry with a 14% long term growth and an estimated 30% growth in EPS in 2010. Teva has a current 1.4% dividend yield and has been growing its dividend by an annual rate of 25% over the past 5 years. ABT provided a 2.17% total return and TEVA provided a 16.21% total return for the Fund in fiscal first half of 2010.
Alpine Dynamic Dividend Fund
We have also found attractive total return opportunities for ADVDX in fiscal first half 2010 in the technology sector with bellwether Microsoft Corporation. Microsoft (MSFT), based in Washington, is the world’s largest software producer for a wide range of uses including operating systems, business applications, internet search, and entertainment. We see several positive drivers for MSFT in 2010 and 2011 including a strong desktop and server product upgrade cycle for its new Windows 7 operating system, a potentially significant corporate replacement cycle after several years of underinvestment, meaningful cost control efforts that should provide operating margin leverage, and accretion from its stock buyback program. Microsoft offers EPS growth estimates of 10-15% annually over the next several years plus a 2 .2% current dividend yield. MSFT provided ADVDX with a 9.17% total return in first half 2010.
Our “Value/Restructuring Strategy” looks for attractively valued or restructuring dividend payers
Our third major strategy is what we call “value with a catalyst or restructuring strategy”, where our research points to under-valued or mis-priced companies with, in our opinion, attractive dividend yields. We also look for turnaround situations or depressed earnings where we believe there is a catalyst for an earnings recovery or a restructuring or corporate action that is expected to add value. With many companies having responded to the global recession with significant corporate restructurings, it is not surprising to find several of our top 10 holdings at the end of first half fiscal 2010 in this strategy including Deutsche Telekom, E.On, Hyundai Motor, and JPMorgan Chase.
Two of our top holdings on 4/30/10 were German companies with large dividend payouts in early May in defensive industries that offered attractive valuations, however they unfortunately got hit with the recent European debt crisis. Deutsche Telekom (DTE GR) has a current 8.0% dividend yield and is the largest provider of telecommunications in Germany with leading market positions in both fixed-line and mobile services. It also has a broad international exposure with operations in the US, UK, Austria, Netherlands and the Czech Republic. E.On Ag (EOAN GR) is one of the largest electric utilities in Europe with a 6.7% current dividend yield. E.On has transformed itself from a domestic German conglomerate to one of Europe’s biggest energy utilities, with a portfolio of power and gas assets in the UK, US, Western a nd Central Europe, the Nordic Region, and Russia. With a solid Pan-European platform already in place, its strategic focus has shifted from mergers and acquisitions to cost controls and margin increases through integration and improving operational performance as well from its growth investments. DTE GR provided a 0.43% total return for the six month period ending 4/30/10 while E.On had a 4.89% loss for the same period before receiving the annual dividends in early May.
A major value holding in our portfolio and an outstanding performer in first half 2010, with a 29.76% total return, was Hyundai Motor Company. Based in Seoul, Hyundai is the largest auto maker in Korea. It also owns 38% of KIA Motors, the second-largest auto maker in Korea, which combined have over 80% of the domestic Korean market and are the world’s fifth-largest auto manufacturer. Hyundai has begun to reap the benefits of its global expansion strategy started in 2002, such as its movement toward greater penetration of its dealers into smaller China cities. Marketing efforts and quality improvements have helped Hyundai gain overall share, particularly from Toyota, in its key China, India and U.S. markets. Its new Genesis sedan received the 2009 North America Car of the Year award in the mid-luxury segment. Although auto subsidies from most countries have expired, demand is rebounding from the depressed levels of 2008/9 and secular growth is occurring in Asia and other emerging markets. Hyundai currently trades at less than 10 times forward earnings which is a deep discount to its Japanese and European peers and its historical peak multiple of 17x in 2009, yet analysts forecast pre-tax profits to more than double from 2008 to 2012.
We project that New York based JPMorgan Chase (JPM) has emerged from the recent financial crisis as one of the premier global financial services companies. We saw an extreme value opportunity in February 2009 when we began accumulating additional shares at less than $20. Although JPMorgan did reduce its dividend by 87% in February 2009 to $0.05 per share, we wanted to take advantage of what we saw as a mis-priced equity valuation and we were able to achieve an attractive capital appreciation, with the stock closing at $42.58 on 4/30/10. With JPMorgan succeeding in repaying its TARP (Troubled Asset Relief Program) loan from the government and writing down impaired assets, it is now forecasted to offer substantial earnings gr owth through 2011 with solid double digit growth in 2012-2013. In response to its improved earnings outlook, the bank is expected to raise its dividend, possibly in late 2010 or early 2011. JPMorgan provided a 3.77% negative return during the first half fiscal 2010 as the European debt concerns negatively impacted the stock.
Alpine Dynamic Dividend Fund
Outlook for Second Half 2010: Uncertainty and Volatility Likely to Remain. Soft Patch Watch
We do believe that a global economic recovery is still solidly in place following the great recession of 2008 and first half 2009, but we may be starting to see some signs of hitting a soft patch or slowdown of growth in the U.S. and globally. This has contributed to the volatility and uncertainty in equity markets and resulted in one of the worst May’s on record with an 8% decline in the S&P 500 Index. Decreases in unemployment claims in the U.S. have stalled, many leading economic indictors in the U.S., China and Europe have declined in April, credit spreads are widening, and several commodity prices have collapsed. We are also watching retail sales in the U.S. which have started to soften and monitoring how the end of housing tax credits in the U.S. in April will affect residential sales in the coming months. We have additional lack of clarity in the U.S. with financial reform regulation, mid-term elections in November, and the potential expiration of the Bush tax cuts in December.
One of the key data points to watch in the U.S. is employment. Weekly jobless claims have stopped declining in recent weeks as companies appear reluctant to hire in these uncertain economic times. In addition, structural unemployment, as measured by the 46% of unemployed that are out of work for more than six months, is at the highest point in postwar history. On the plus side, the monthly household survey which captures more small business hiring appears to be improving more strongly than the payroll survey which captures big business, so underlying employment may be a bit stronger than reported. However, we are also looking for negative headwinds in employment in the second half of 2010 from state and local governments that are facing severe budget deficit s. These budget holes will likely get balanced through large cuts in employment as we recently saw announced by the governor of NY State. There are 20 million people in the U.S. employed by state and local governments.
Dual Fronts of Global Growth Concerns: Europe and China
The two largest negatives for the global equity markets in recent weeks have been the sovereign debt crisis in Europe and the slowing of the global growth engine of the Chinese economy. The Euro has fallen from $1.51 per U.S. dollar on 11/25/09 to $1.20 on 6/4/10, a decline of 21%. This is a reflection of the tempered outlook for growth in the region as fiscal budgets throughout Europe are being reduced and austerity measures implemented in order to pay down bloated debt loads. Governments in Europe are reacting to the Greek crisis as a window of opportunity to pursue reforms, like raising retirement ages, that would be more politically difficult in the absence of a euro area crisis. This has led to a broad European effort to impose tighter fiscal restraints which JPMorgan estimates could take away about 1.2% of euro area econom ic growth in 2011 and 2012 and could push the region into recession.
In addition to Europe, fears about the outlook for Chinese growth have also impacted equity markets. We believe China is even more important than Europe for the equity markets in second half fiscal 2010 and 2011. It accounts for about a third of global economic growth. China has been orchestrating a slowdown in their economy in 2010 following the acute stimulus measures that were enacted in 2008 and 2009 to offset the great global recession but which resulted in a surge in housing prices and commodity inflation concerns. In particular, China has been tightening its bank lending in order to bring down its overheating property market. Sales of residential property in Beijing were down 80% from the Dec. 2009 high through the end of May 2010 and down over 50% from just April. This has contributed to a 28.6% fall in the Shangai stock m arket from its high on 8/4/09 through its low on 5/21/10.
We believe that the Chinese cooling process is healthy for both China and the developed world as unsustainable credit- and infrastructure-driven spending is curtained to reduce the risk of inflation. Longer term, the IMF continues to forecast China will grow far faster than the rest of the world for the next five years, with approximately 10% compound annual GDP growth on average through 2014 compared to 6% for all emerging nations and 2.5% for the developed markets.
Positives for the equities include valuations, still solid GDP growth and capital spending outlooks
On the positive side, currently equity valuations appear attractive on still solid economic growth outlooks and particularly on strong margin and productivity results in the U.S and emerging market. U.S. corporate profits were up over 30% year over year in first quarter 2010 and S&P 500 earnings are forecasted to grow 22% in 2010 and 15% in 2011. GDP growth in the U.S. is example, the U.S. in the 1930’s and Japan in the past 20 estimated to be a solid 3.5% increase in 2010 and 3.1% years have shown that when interest rates go close to in 2011 and emerging markets at 6.9% GDP growth in zero they can stay there for extended periods of time 2010 and 5.8% in 2011.
Alpine Dynamic Dividend Fund
In addition, while the recent volatility in weekly jobless claims has caused some concern, leading employment indicators such as the average work week and temporary employment levels have been consistently improving and personal income growth exhibited its largest monthly increase in April since late 2008. This should provide some support for consumer spending as the flow of fiscal stimulus fades later in 2010. Lastly, a recent survey complete by ISI research shows a 30% increase in the amount of capital spending that CFOs
anticipate spending in 2010 which should also support jobs and economic expansion.
Looking ahead, we see both catalysts and risks in second half 2010. We do remain optimistic that dividend stocks will continue to attract capital as investors around the world search for income. As global demographics point to an aging population in the industrialized world, these millions of savers are facing zero to low interest rates for quarters or potentially years to come. For example, the U.S. in the 1930’s and Japan in the past 20 years have shown that when interest rates go close to zero they can stay there for extended periods of time
until structural economic issues are resolved. We see dividend income as an attractive investment opportunity for this increasingly large population of retirees and we expect capital to flow to high dividend paying stocks over the long term.
Within the dividend-paying universe we are actively scanning the globe for undervalued opportunities and high quality cash flow generators. We are hopeful that we should be able to continue to distribute attractive dividend payouts to our shareholders by capitalizing on our research driven approach to identifying value opportunities as well as through our active management of the portfolio.
Thank you for your support of the Alpine Dynamic Dividend Fund and we look forward to more prosperous years in 2010 and beyond.
Sincerely,
Jill K. Evans and Kevin Shacknofsky
Co-Portfolio Managers
__________
Past performance is not a guarantee of future results.
Please refer to the schedule of portfolio investments for fund holding information. Fund holdings and sector allocations are subject to change and should not be considered a recommendation to buy or sell any security.
Current and future portfolio holdings are subject to risk.
Neither the Fund nor any of its representatives may give tax advice. Investors should consult their tax advisor for information concerning their particular situation.
Diversification does not assure a profit or protect against loss in a declining market. Investing in small and mid cap stocks involves additional risks such as limited liquidity and greater volatility as compared to large cap stocks. Investing in foreign securities tends to involve greater volatility and political, economic and currency risks and differences in accounting methods.
Stocks are subject to fluctuation. The stock or other security of a company may not perform as well as expected, and may decrease in value, because of factors related to the company or to the industry in which the company is engaged.
The information provided is not intended to be a forecast of future events a guarantee of future results or investment advice. Views expressed may vary from those of the firm as a whole.
All index performance reflects no deduction for direct fees, expenses or taxes. Please note that an investor cannot invest directly in an index.
Favorable tax treatment of Fund distributions may be adversely affected, changed or repealed by future changes in tax laws. Alpine may not be able to anticipate the level of dividends that companies will pay in any given timeframe.
The Fund may include equity-linked securities and various other derivative instruments, which can be illiquid, may disproportionately increase losses, and have a potentially large impact on Fund performance. Leverage may magnify gains or increase losses in the Fund’s portfolio.
Cash flow measures the cash generating capability of a company by adding non-cash charges (e.g. depreciation) and interest expense to pretax income.
Alpine Dynamic Dividend Fund
Earnings Growth is a measure of a company’s net income over a specific period, generally one year, is a key indicator for measuring a company’s success, and the driving force behind stock price appreciation.
Dividend Yield: The yield a company pays out to its shareholders in the form of dividends. It is calculated by taking the amount of dividends paid per share over a specific period of time and dividing by the stock’s price.
The S&P 500 Index is a broad based unmanaged index of 500 stocks, which is widely recognized as representative of the equity market in general.
Lipper Averages are compiled by Lipper, Inc., an independent mutual fund research and rating service. Each Lipper average represents a universe of funds with similar investment objectives.
Lipper rankings are based on total return and do not include the effect of a sales charge. Rankings are only for the classes listed. Rankings of other classes will vary.
The S&P 500 Financial Select Sector Index (IXM) is a modified cap-weighted index that is intended to track the movements of companies that are components of the S&P 500 and are involved in the development or production of financial products. This index serves as the benchmark for the Financial Select Sector SPDR Fund XLF.
Shanghai Stock Exchange Composite Index is a capitalization-weighted index. The index tracks the daily price performance of all A-shares and B-shares listed on the Shanghai Stock Exchange. The index was developed on December 19, 1990 with a base value of 100.
Dow Jones Industrial Average – is a price-weighted average of 30 blue-chip stocks that are generally the leaders in their industry.
STOXX Europe 600 Index is derived from the STOXX Europe Total Market Index (TMI) and is a subset of the STOXX Global 1800 Index. With a fixed number of 600 components, the STOXX Europe 600 Index represents large, mid and small capitalisation companies across 18 countries of the European region: Austria, Belgium, Denmark, Finland, France, Germany, Greece, Iceland, Ireland, Italy, Luxembourg, the Netherlands, Norway, Portugal, Spain, Sweden, Switzerland and the United Kingdom.
The Brazil Index – IBrX is an index which measures the return on a theoretical portfolio composed by 100 stocks selected among BOVESPA’s most actively traded securities, in terms of number of trades and financial value. The component stocks are weighted according to the outstanding shares’ market value.
Euro Stoxx 50: – The Dow Jones EURO STOXX 50 Index, Europe’s leading Blue-chip index for the Eurozone, provides a Blue-chip representation of supersector leaders in the Eurozone. The index covers 50 stocks from 12 Eurozone countries: Austria, Belgium, Finland, France, Germany, Greece, Ireland, Italy, Luxembourg, the Netherlands, Portugal and Spain.
The Dow Jones EURO STOXX 50 Index is licensed to financial institutions to serve as underlying for a wide range of investment products such as Exchange Traded Funds (ETF), Futures and Options, and structured products worldwide.
(1) Not annualized.
(2) The since inception return represents the annualized return for the period beginning 11/6/2008.
(3) FINRA does not recognize rankings for less than one year.
(4) As disclosed in the prospectus dated February 27, 2010.
Performance data quoted represents past performance and is not predictive of future results. Investment return and principal value of the Fund fluctuate, so that the shares, when redeemed, may be worth more or less than their original cost. Performance current to the most recent month end may be lower or higher than performance quoted and may be obtained by calling 1-888-785-5578. Performance data shown does not reflect the 1.00% redemption fee imposed on shares held for fewer than 2 months. If it did, total returns would be reduced.
The S&P 500 Index is designed to measure performance of the broad domestic economy through changes in the aggregate market value of 500 stocks representing all major industries. The Dow Jones Industrial Average is a price weighted average of 30 actively traded shares of large cap U.S. industrial corporations. The Lipper Equity Income Funds Average is an average of Funds that seek relatively high current income and income growth through investing 60% or more of their respective portfolios in equities. The S&P 500 Index, the Dow Jones Industrial Average, and the Lipper Equity Income Funds Average are unmanaged and do not reflect direct fees associated with a mutual fund, such as investment adviser fees; however, the Lipper Equity Income Funds Average reflects fees charged by the underlyi ng funds. The performance for the Accelerating Dividend Fund reflects the deduction of fees for these value-added services. Investors cannot directly invest in an index.
The adviser contractually agreed to waive a portion of its fees and to absorb certain fund expenses. This arrangement will remain in effect unless the Board of Trustees approves its modification or termination.
To the extent that the Fund’s historical performance resulted from gains derived from participation in initial public offerings (“IPOs”) and/or secondary offerings, there is no guarantee that these results can be replicated in future periods or that the Fund will be able to participate to the same degree in IPO/Secondary allocations in the future.
Alpine Accelerating Dividend Fund
This chart represents a comparison of a hypothetical $10,000 investment in the Fund versus a similar investment in the Fund’s benchmark. The graph and the table do not reflect the deduction of taxes that a shareholder would pay on Fund distributions or the redemption of Fund shares. Investment performance reflects the waiver and recovery of certain fees. Without the waiver and recovery of fees, the Fund’s total return would have differed.
Commentary
This is the second year of operation for the Alpine Accelerating Dividend Fund, initially launched on November 5, 2008. In the first half of fiscal 2010, ending on April 30, 2010, the Fund provided a total return of 12.50%. This compares with a total return of 15.66% for the Standard & Poor’s 500 Average and 14.87% for the Dow Jones Industrial Average for the same period. Since inception, the Accelerating Dividend Fund has generated an annualized total return of 18.84%. This compares with an annualized return of 18.78% for the Standard & Poor’s 500 Average and 16.96% for the Dow Jones Industrial Average.
The objective of the Accelerating Dividend Fund is to invest in dividend-paying companies which have the potential to accelerate their dividends in the future, based on our analysis of their growth prospects and cash flow generating capabilities. The Fund aims to achieve a sustainable and rising stream of dividend income as well as long-term capital appreciation. We believe that companies with strong franchises characterized by defensible margins and a solid balance sheet and liquidity profile are best positioned to increase, and even accelerate, their dividends over time. Illustrative of companies we deem capable of meeting these standards are the top performing holdings for the previous 6 months, ending April 30, 2010: Cliffs Natural Resources +65.81%, Banco Panamericano +62.07%, Comcast C orp +37.79%, Snap-On Inc. +33.88% and Burlington Northern +33.59% (acquired by Warren Buffett’s Berkshire Hathaway). These companies represent a broad cross-section of numerous industries including materials, financials, media and industrials. Furthermore, while four of these companies are domiciled in the US, Banco Panamericano is a mid-cap Brazilian bank. Given the current fiscal and monetary situation within the European Union, we have a clear preference for investments within the US and Brazil.
In contrast, some companies in our portfolio posted disappointing total returns. Among these companies are well-know corporations, including Monsanto, GDF Suez and CF Industries, as well as smaller companies including Protective Life, and Ocwen Financial. Monsanto (-20.61%) is the leading global seeds and agricultural protection products company with a strong record of dividend increases. The Company has consistently possessed the leading technology pipeline in this field and was first to develop many of the key products in use today. Monsanto has always used a value added pricing mechanism which enabled it to charge premium prices for its higher quality products. Recently, as farmers have become more price sensitive, they have been less willing to pay for Monsanto’s premium products and have shifted more of their business to cheaper alternatives from the competition. Monsanto was very late in recognizing this shift in customer demand and, as a result, forfeited market share to the competition. While we continue to favor the secular trends in the industry, we feel that management continues to struggle with its strategy and has not developed a clear path to recapture lost market share and defend its position. Thus, after April, we sold the Fund’s position.
Alpine Accelerating Dividend Fund GDF Suez (-18.15%) is a ~$70 billion market cap energy provider with global operations focused on electricity and natural gas with operations globally. The company is the top power producer in the world and is represented in the main international indices (e.g., DJ Euro Stoxx 50, CAC 40, etc.) Furthermore, GDF, as of 04/30/2010, yielded a very attractive dividend of over 5.5%. As a result of the European sovereign debt crisis, European equities have recently underperformed US equities significantly, especially when currency movement is taken into account. While our European exposure was never significant, we have further minimized our allocation to the Euro zone until we see signs of progress in the resolution of this fiscal and credit challenge.
CF Industries (-17.98%) is a leading fertilizer company which recently completed a large acquisition of Terra Industries. Three forces contributed to the recent declines in the stock: 1) concern that CF overpaid for Terra in a highly competitive bidding war, 2) weakness in nitrogen-based fertilizer pricing, and 3) weakness in corn prices contributing to lower margins for farmers. CF stock is partially correlated with spot prices for agricultural products such as corn and has exhibited a degree of volatility. However, we continue to like the growth potential in the industry as well as CF’s competitive position, and feel that the stock should recover from current levels. Although Protective Life (-17.92%) and Ocwen Financial (-15.46%) posted disappointing returns during this period, we had positive total return s for both investments over our holding period. Protective Life, a life insurance company headquartered in Birmingham, Alabama, generated a total return of 7.5% for our fund. Ocwen Financial, a company focused on servicing residential and commercial mortgage loans, generated a total return of 5.4% for our fund.
After the recent debt crisis, a number of companies have sought to recapitalize their balance sheets. As a result, during the Fund’s semi-annual reporting period, there have been a large number of what we consider to be attractively priced secondary offerings in which the Fund has participated. The Fund has realized substantial short term capital gains in these secondary offerings, which provided a meaningful contribution to the Fund’s total return during the Fund’s semi-annual reporting period. We cannot predict how long, if at all, these opportunities will continue to exist, but to the extent that we consider secondary offerings to be attractively priced and available the Fund may continue to participate in them.
Our 3 largest industry groups and corresponding percent of portfolio are Diversified Financial Services – 9.33%, Chemicals – 6.69% and Semiconductor and Semiconductor Equipment – 5.84%. Our holdings in financial services are balanced between exchanges and banks. We feel that given the uncertainty of the likely regulatory changes, the exchanges may provide a partial hedge of our bank investments if more revenues potentially move from the banks to exchanges. Despite the volatility in the sector, we believe that well-capitalized financial institutions that are unlikely to have an additional need for a capital raise should present attractive investment opportunities if credit costs decrease and profitability accelerates. As is evident from the percentage concentrations in our largest industry groups, shown above, we aim not to overly-concentrate our portfolio in any one particular industry group. It is our intention to continue to look for investments that meet our criteria without assuming excessive risk by maintaining a balanced and diversified portfolio.
While a limited universe of companies have provided increasing dividends for a sustained period of time, even fewer have demonstrated sustained dividend acceleration. We use a selective screening process to identify companies with the potential for future acceleration. We feel that in the long-run, these companies provide better risk-adjusted returns for investors while simultaneously providing a buffer against dramatic declines in the stock market and excessive volatility. It is important to recognize that these companies may not outperform the broader market in all environments. For example, when markets rebound off their troughs, more speculative, higher-beta stocks tend to outperform as companies with riskier financial profiles that possessed a higher probability of financial distress recover sizably off their dramatically low valuations. However, when viewed over a longer investment horizon and through a full economic cycle, we find that historically companies with more conservative balance sheets and credit profiles have ultimately outperformed, especially on a risk-adjusted basis. We believe that companies with more unencumbered balance sheets should retain flexibility in recessions which should enable them to avoid franchise-destroying actions, such as forced divestitures of strategic assets, that other companies need to pursue to reduce leverage and boost capital. In fact, companies with fortress balance sheets should be better positioned to take advantage of market opportunities and enhance their franchise at the expense of competitors by acquiring assets at the bottom, rather than the top, of the cycle.
Alpine Accelerating Dividend Fund Many companies with long histories of consistent dividend growth were forced to cut their dividends in the previous 2 years. Now, however, we are beginning to see signs of the re-emergence of dividend growth, and even dividend acceleration, as evidenced by portfolio holdings Guess Inc, Intel and Kimberly-Clark, which have all accelerated their dividends in 2010. Many US companies are currently holding record levels of cash and liquidity, and as a result we expect the pace of dividend increases to accelerate. However, tremendous uncertainty regarding the pace of the economic recovery, the sovereign debt situation globally and significant regulatory changes that continue to evolve may lead companies to maintain a conservative profile and delay dividend increases.
As we stated in our previous letter, despite the robust rebound in equity markets in 2009 we expected a tepid economic recovery with speed bumps along the way. This theme has so far played out in 2010. The sovereign debt crisis in Europe, massive regulatory changes in banking and financial services globally, and a stubbornly high unemployment rate in the US and Europe are all dampening economic recovery. The European crisis is unequivocally the biggest economic challenge the European Union (EU) has had to deal with in its decade long history, and the first real test for the resiliency of the Euro. European officials clearly recognized the potential risks of contagion from the fiscal situation in Greece and swiftly enacted a historical expansion of monetary powers for the European Central Bank (ECB), as well as new facilities to backstop any member of the EU. Despite these powerful actions, the austerity measures put in place are expected to be very difficult to execute and will likely have adverse consequences on economic growth. Credit markets globally will continue to be volatile until significant progress in reducing fiscal deficits is achieved. Left unchecked without a coordinated Euro wide fiscal response, this situation could lead to significant credit market deterioration similar to 2008. While we don’t expect this scenario to unfold, it is important not to underestimate the significance of this challenge, not just for the Euro zone but also for other developed economies such as the UK, Japan and even the US.
In the US, we are in the midst of the biggest changes to financial regulation in over a decade, which could limit the profitability of our banking system and, more importantly, have a mixed impact on our economic recovery. As we are writing this letter, the US Senate is considering a number of amendments which may decrease credit availability and limit the global competitiveness of US broker dealers. While a US consumer protection agency can provide a valuable check on suitability of financial products to consumers, other amendments such as the forced separation of derivatives trading and state or national caps on interest rates may have unintended negative consequences on the availability of credit and the competitiveness of US businesses. Furthermore, while the labor market has shown signs of improvement, i nitial unemployment claims have stubbornly held in the mid 400,000 level, which is ~20% higher than what is needed for a robust recovery in the labor market. Given our cautious macroeconomic stance, we remain optimistic that companies which meet the high standards of dividend growth and strong liquidity, basic to this fund’s strategy, should better withstand a protracted and difficult recovery phase.
We firmly believe that, in the long run, our strategy should provide investors with attractive risk-adjusted returns over the cycle, and thank our shareholders for their confidence in our management during these unprecedented and highly volatile market conditions.
Sincerely,
Stephen A. Lieber
David Burg
Co-Portfolio Managers
_________
Past performance is not a guarantee of future results.
Please refer to the schedule of portfolio investments for fund holding information. Fund holdings and/or sector allocations are subject to change at any time and are not recommendations to buy or sell any security. Current and future holdings are subject to risk.
Investing in small and mid cap stocks involves additional risks such as limited liquidity and greater volatility as compared to large cap stocks. Investing in foreign securities tends to involve greater volatility and political, economic and currency risks and differences in accounting methods. Diversification does not assure a profit or protect against loss in a declining market.
Alpine Accelerating Dividend Fund
Stocks are subject to fluctuation. The stock or other security of a company may not perform as well as expected, and may decrease in value, because of factors related to the company or to the industry in which the company is engaged.
The information provided is not intended to be a forecast of future events a guarantee of future results or investment advice. Views expressed may vary from those of the firm as a whole.
All index performance reflects no deduction for direct fees, expenses or taxes. Please note that an investor cannot invest directly in an index.
Favorable tax treatment of Fund distributions may be adversely affected, changed or repealed by future changes in tax laws. Alpine may not be able to anticipate the level of dividends that companies will pay in any given timeframe.
The Fund may include equity-linked securities and various other derivative instruments, which can be illiquid, may disproportionately increase losses, and have a potentially large impact on Fund performance. Leverage may magnify gains or increase losses in the Fund’s portfolio.
The Euro Stoxx 50 Index is Europe’s leading Blue-chip index for the Eurozone and provides a Blue-chip representation of supersector leaders in the Eurozone. The index covers 50 stocks from 12 Eurozone countries. The CAC 40 is a benchmark French stock market index. The index represents a capitalization-weighted measure of the 40 most significant values amoung the 100 highest market caps on the Paris Bourse (now Euronext Paris).
Cash flow measures the cash generating capability of a company by adding non-cash charges (e.g. depreciation) and interest expense to pretax income.
Beta measures the volatility of the fund, as compared to that of the overall market. The Market’s beta is set at 1.00; a beta higher than 1.00 is considered to be more volatile than the market, while a beta lower than 1.00 is considered to be less volatile.
Equity Securities Risk – The stock or other security of a company may not perform as well as expected, and may decrease in value, because of factors related to the company (such as poorer than expected earnings or certain management decisions) or to the industry in which the company is engaged (such as a reduction in the demand for products or services in a particular industry).
(1) Not annualized.
(2) The since inception return represents the annualized return for the period beginning 11/3/2005.
(3) FINRA does not recognize rankings for less than one year.
(4) As disclosed in the prospectus dated February 27, 2010.
Performance data quoted represents past performance and is not predictive of future results. Investment returnand principal value of the Fund fluctuate, so that the shares, when redeemed, may be worth more or less thantheir original cost. Performance current to the most recent month end may be lower or higher than performancequoted and may be obtained by calling 1-888-785-5578. Performance data shown does not reflect the 1.00%redemption fee imposed on shares held for fewer than 2 months. If it did, total returns would be reduced.
The NASDAQ 100 Financial Index is a capitalization-weighted index of the 100 largest financial companies, as well as foreign issues, including American Depository Receipts (ADRs), traded on the NASDAQ National Market System (NASDAQ/NMS) and SmallCap Market. The PHLX/KBW Bank Index is a modified cap-weighted index consisting of 24 exchange-listed and National Market System stocks, representing national money center banks and leading regional institutions. The S&P 500 Index is designed to measure performance of the broad domestic economy through changes in the aggregate market value of 500 stocks representing all major industries. The Lipper Financial Services Funds Average is an average of funds whose primary objective is to invest primarily in equity securities of companies engaged in prov iding financial services. Lipper Rankings for the periods shown are based on Fund total returns with dividends and distributions reinvested and do not reflect sales charges. The NASDAQ 100 Financial Index, the PHLX/KBW Bank Index, the S&P 500 Index and the Lipper Financial Services Funds Average are unmanaged and do not reflect the deduction of direct fees associated with a mutual fund, such as investment adviser fees; however, the Lipper Financial Services Fund Average reflects fees charged by the underlying funds. The performance for the Dynamic Financial Services Fund reflects the deduction of fees for these value-added services. Investors cannot directly invest in an index.
The adviser contractually agreed to waive a portion of its fees and to absorb certain fund expenses. This arrangement will remain in effect unless the Board of Trustees approves its modification or termination.
The Fund’s past performance benefitted significantly from initial public offerings (“IPOs”) of certain issuers, and there is no assurance that the Fund can replicate this performance in the future. To the extent that the Fund’s historical performance resulted from gains derived from participation in Secondary offerings, there is no guarantee that these results can be replicated or that the Fund will be able to participate to the same degree in IPO/Secondary allocations in the future.
Alpine Dynamic Financial Services Fund
This chart represents a comparison of a hypothetical $10,000 investment in the Fund versus a similar investment in the Fund’s benchmark. The graph and the table do not reflect the deduction of taxes that a shareholder would pay on Fund distributions or the redemption of Fund shares. Investment performance reflects the waiver and recovery of certain fees. Without the waiver and recovery of fees, the Fund’s total return would have differed.
Commentary
Alpine Dynamic Financial Services Fund achieved a 33.14% total return for the first six months ending April 30, 2010. This compares favorably to the Fund’s benchmarks which had total returns of 21.92% for the NASDAQ 100 Financial Index and the PHLX/KBW Bank Index of 32.57% during the same period.
INDUSTRY TRENDS
Financial stocks have become a proxy for investor expectations of future economic conditions. This positive correlation to economic forecasts has benefited the sector during the first half of fiscal 2010. Better than expected corporate profits and retail sales along with stabilization of the housing and labor markets led to a rebound in financial stocks. The rally, however, has not been linear. During the first quarter the bank indexes remained in a narrow trading range as investor sentiment kept swinging between optimism and pessimism. Performance during the second quarter was much improved as economic data being released more consistently pointed to a strengthening domestic economy. This brought a change in leadership among financial stocks as the companies with weak balance sheets outperformed the better q uality, more defensive companies. During the economic crisis, these stocks had declined the most as their survivability came into question. Now with the economy in an apparent turnaround investors have become more risk-tolerant and willing to invest in the lesser quality banks.
We have spent the last couple of months traveling around the country meeting with bank executives in order to assess current business conditions. We discovered that management sentiment is changing. As late as the fourth quarter of last year, there was uncertainty and apprehension of what 2010 will bring. Today, confidence is returning. Bankers admit that challenges remain. Finding quality loan growth is hard as qualified borrowers are not in need of additional credit. Also, problem assets and loan charge-offs are anticipated to remain at elevated levels as the credits work there way through the foreclosure process. But what has changed is that managements have a better grasp of the potential losses in their loan po rtfolios. The inflow of new delinquent loans is beginning to slowdown while buyer interest in the sale of their problem assets is growing. Every bank we spoke to also has an example or two of a local business that is reporting a pick-up in activity. We believe this could be an early indicator of a broader based economic rebound. Such a rebound may lead to lower loan losses and stronger loan demand.
Alpine Dynamic Financial Services Fund
Recapitalization of the bank industry is continuing this year. These capital raises are moving down the food chain to smaller and smaller institutions. We believe this recapitalization should complete the last phase of the banking industry’s downturn. All the pieces for a long term industry recovery are now falling into place. One of these pieces is for banks to realistically grade their loans, provide adequate reserves and to write-down problem assets to market prices. We believe this has been done by any bank that had a safety and soundness exam within the last twelve months, as we have heard this was the toughest exam any banker has experienced in their career. Another piece is market stability which should bring back liquidity. As stability is returning to the residential real estate market, banks are reporting an increase in inquiries about their foreclosed properties and nonperforming loans. Media reports of private equity partnerships raising money to invest in these distressed assets are becoming more prevalent. The improving economy is also important as this should lead to reduced loan delinquency and better asset growth. The increased pace of bank closings is a positive as the resolution of these problem banks should flush the industry of irrational competitors. Lastly, the recapitalization of the industry may create a stronger industry which can then grow organically or externally through acquisitions.
We believe there is potential for strong book value growth at the start of the cycle. If we use the early 1990’s as an example, when the economy improved, loan losses dropped significantly causing banks to be over-reserved. Depending on the severity of the over-reserved position banks either stopped reserving or reversed their loan loss provision. The rapid increase in earnings also allowed banks to realize their tax loss carry forward. This rapid growth in capital allowed banks to raise cash dividends, buyback stock, or make acquisitions. And with the number of bank closures declining dramatically in 1993, this left only healthy bank acquisitions to consider. We don’t know how quickly these conditions could happen this cycle but we did notice much improvement in just the last qu arter.
INDUSTRY CONSOLIDATION
The level of merger activity was low in the first six months of fiscal 2010 as acquiring banks focused instead on the auction of failed FDIC insured institutions. During this period Alpine Dynamic Financial Services Fund had three holdings announcing plans to be acquired. These included the acquisition of First Keystone Financial of Media, Pennsylvania by in-state rival Bryn Mawr Bank Corporation. Investment banker Thomas Weisel Partners, a fund holding, announced a merger agreement with the rapidly expanding Stifel Financial Corporation. Lastly, the London based Climate Exchange PLC signed a merger agreement with IntercontinentalExchange, Inc.
While the pace of healthy acquisitions has declined, what is becoming more prevalent are private equity groups taking large ownership positions in banks through an infusion of new capital. This is intended to allow these banks to survive until a better environment to sell their institution materializes
Banks continue to raise capital for the purpose of bidding on failed banks. In the first four months of calendar 2010, there have been 61 bank failures. We believe there may be over 200 failures this year. What we are hearing from the bidding banks is that the winning bids are getting more expensive. This is what happened in the early 1990’s. As the prices became comparable with healthy bank acquisitions a wave of merger activity began. We believe this will happen again. While we target 2011 for the pace of healthy acquisitions to accelerate, some bankers we talked to believe it could happen as soon as the fourth quarter of this year.
PORTFOLIO ADJUSTMENTS
Some of the Fund’s best performing holdings last year were Brazilian financial companies. A healthy Brazilian economy contributed to appreciation in stock prices and the currency relative to the US dollar. We decided to take a profit in most of these holdings and redeploy the proceeds into small-cap US financials which we believe have better total return potential. We noticed that investor interest in US financials is focused on the liquid traded stocks. Buyers have primarily been broad focused value funds and hedge funds which need this liquidity. Although the bank index has performed well relative to the broad market, new money has not flowed into the financial sector funds in any meaningful way. As the upward trend in bank stocks co ntinue, we expect the flow of funds to move into the sector. We believe this should benefit the small and micro-cap financials as the natural buyers of these stocks are the financial sector funds which perform their own in-house bank research and search for bargains. As mentioned above, we are witnessing in increasing amount of partnerships recapitalizing micro-cap banks. We are also seeing more small banks doing secondary equity offerings. We feel these trends may suggest that investor interest for small-cap financials is increasing. The Fund has been an active participant in these offerings and they have contributed to the Fund’s return during the period. We cannot predict how long these opportunities will continue to exist, but provided the market continues to offer what we believe to be attractively priced secondaries, the Fund will continue to participate in them. We have found the valuation of these offerings to be attractive relative to the large-cap financial companies. Among our top ten holdings, Bank of Commerce Holdings, Invesco mortgage Capital, Orrstown Financial Services, and Provident Financial Holdings were purchased through secondary offerings during the first half of fiscal 2010. CenterState Banks, 1st United Bancorp, and Southern National Bancorp of Virginia were purchased through secondary offering in fiscal 2009. Although the capital markets improvedduring 2010, the environment for Initial Public Offering (“IPO”s) is still soft. Most of the deals have been sponsored by private equity funds and the stock performance has been spotty. We have been very selective in investing in IPOs and as such they have not had a material affect on the return of the Fund during the past six months.
Alpine Dynamic Financial Services Fund
There was no significant change in the portfolio distribution among different subsectors during the first six months of fiscal 2010. We believe there was no common characteristic to the Fund’s best and worst performing holdings during the period. Small-cap banks and thrifts were among both the best and worst performing holdings. The total returns for Provident Financial Holdings, Community National Bank of the Lakeway Area, and First PacTrust Bancorp were 140.77%, 79.49%, and 74.74%, respectively. While the total losses for United Western Bancorp, Bank of Florida Corp., and Tidelands Bancshares were 50.14%, 38.92%, and 34.97%, respectively. There also was an investment bank on both the best and worst perfor ming list. Thomas Weisel Partners, which announced a merger agreement, advanced 73% while Cowen Group declined 23%.
We continue to actively manage the portfolio by searching for investment opportunities among all financial subsectors and globally. As previously mentioned, we dramatically reduced our exposure in Brazil as we found more attractive opportunities in small-cap US financial companies. We are currently monitoring the s overeign debt crisis in Europe and its affect on global financial companies. We believe every crisis eventually provides investment opportunities for patient investors. We appreciate your continued support as we strive to provide you with consistent above average returns during this challenging period.
Sincerely,
Peter J. Kovalski
Portfolio Manager
_________
Past performance is not a guarantee of future results.
The fund primarily invests in equity securities of financial services companies and will be affected by risk factors particular to this industry such as regulation, monetary and fiscal policies and interest rates, as well as general market risks. The fund invests in smaller companies, which involve additional risks such as liquidity and greater volatility. The fund invests in foreign securities which involve greater volatility and political, economic and currency risks and differences in accounting methods.
There is no assurance the fund will achieve its investment objective.
Stocks are subject to fluctuation. The stock or other security of a company may not perform as well as expected, and may decrease in value, because of factors related to the company or to the industry in which the company is engaged.
The information provided is not intended to be a forecast of future events a guarantee of future results or investment advice. Views expressed may vary from those of the firm as a whole.
All index performance reflects no deduction for direct fees, expenses or taxes. Please note that an investor cannot invest directly in an index.
Favorable tax treatment of Fund distributions may be adversely affected, changed or repealed by future changes in tax laws. Alpine may not be able to anticipate the level of dividends that companies will pay in any given timeframe.
The Fund may include equity-linked securities and various other derivative instruments, which can be illiquid, may disproportionately increase losses, and have a potentially large impact on Fund performance. Leverage may magnify gains or increase losses in the Fund’s portfolio.
Alpine Dynamic Financial Services Fund
Please refer to the schedule of portfolio investments for fund holding information. Fund holdings and/or sector allocations are subject to change at any time and are not recommendations to buy or sell any security. Current and future portfolio holdings are subject to risk.
Book value is the net asset value of a company, calculated by subtracting total liabilities from total assets.
Equity Securities Risk – The stock or other security of a company may not perform as well as expected, and may decrease in value, because of factors related to the company (such as poorer than expected earnings or certain management decisions) or to the industry in which the company is engaged (such as a reduction in the demand for products or services in a particular industry).
Financial Services Industry Concentration Risk – Financial institutions are subject to extensive government regulation which may limit both the amount and types of loans and other financial commitments a financial institution can make, and the interest rates and fees it can charge.
(1) Not annualized.
(2) The since inception return represents the annualized return for the period beginning 7/13/2006.
(3) FINRA does not recognize rankings for less than one year.
(4) As disclosed in the prospectus dated February 27, 2010.
Performance data quoted represents past performance and is not predictive of future results. Investment return and principal value of the Fund fluctuate, so that the shares, when redeemed, may be worth more or less than their original cost. Performance current to the most recent month end may be lower or higher than performance quoted and may be obtained by calling 1-888-785-5578. Performance data shown does not reflect the 1.00% redemption fee imposed on shares held for fewer than 2 months. If it did, total returns would be reduced.
The Russell 2000 Total Return Growth Index is constructed to provide a comprehensive and unbiased barometer of the small-cap growth market. Based on ongoing empirical research of investment manager behavior, the methodology used to determine growth probability approximates the aggregate small-cap growth manager’s opportunity set. The NASDAQ Composite Index is a stock market index of all of the common stocks and similar securities listed on the NASDAQ stock market, meaning that it has over 3,000 components. It is highly followed in the U.S. as an indicator of the performance of stocks of technololgy companies and growth companies. The S&P 500 Index is designed to measure performance of the broad domestic economy through changes in the aggregate market value of 500 stocks representing all major industries. The S&P 500 Index is unmanaged and does not reflect the deduction of fees associated with a mutual fund, such as investment advisory fees. The Lipper Small-Cap Growth Funds Average is an average of Funds that, by portfolio practice, invest at least 75% of their equity assets in companies with market capitalizations (on a three year weighted basis) less than 250% of the dollar-weighted median of the smallest 500 of the middle 1,000 securities of the S&P SuperComposite 1500 Index. Lipper Rankings for the periods shown are based on Fund total returns with dividends and distributions reinvested and do not reflect sales charges. The Russell 2000 Total Return Growth Index, S&P 500 Index and the Lipper Small-Cap Growth Funds Average are unmanaged and do not reflect the deduction of direct fees associated with a mutual fund, such as investment adviser fees; however, the Lipper Small-Cap Growth Funds Average reflects fees charged by the underlying funds. The performance for the Dynam ic Innovators Fund reflects the deduction of fees for these value-added services. Investors cannot directly invest in an index.
The adviser contractually agreed to waive a portion of its fees and to absorb certain fund expenses. This arrangement will remain in effect unless the Board of Trustees approves its modification or termination.
The Fund’s past performance benefitted significantly from initial public offerings (“IPOs”) of certain issuers, and there is no assurance that the Fund can replicate this performance in the future. To the extent that the Fund’s historical performance resulted from gains derived from participation in Secondary offerings, there is no guarantee that these results can be replicated or that the Fund will be able to participate to the same degree in IPO/Secondary allocations in the future.
Alpine Dynamic Innovators Fund
This chart represents a comparison of a hypothetical $10,000 investment in the Fund versus a similar investment in the Fund’s benchmark. The graph and the table do not reflect the deduction of taxes that a shareholder would pay on Fund distributions or the redemption of Fund shares. Investment performance reflects the waiver and recovery of certain fees. Without the waiver and recovery of fees, the Fund’s total return would have differed.
Commentary
The Alpine Dynamic Innovators Fund provided a 25.22% return for the semi-annual period ended April 30, 2010. This compares with the 15.66% return for the Standard & Poor’s 500 Average and 20.95% return for the NASDAQ Average for the same period. For the twelve month period ended April 30th, the Fund provided 78.28% return, comparing with 38.84% for the Standard & Poor’s 500 Average and 44.68% for the NASDAQ Average.
Nine of the Fund’s top ten performing investments maybe characterized as having made gains because of their innovative products or strategies. The exception was a bank holding company, Sun Trust Banks, Inc. whose 55.03% gain during this period reflected prospects for business recovery. The following are the top ten whose six months return ranged from 35.63% to 92.83%:
| Westport Innovations, Inc. | +92.83% |
| A leading innovator in gaseous power systems for automotive engines. | |
| | |
| Priceline.com, Inc. | +66.08% |
Innovator in internet based hotel reservation systems and travel packages allowing interactive reservation bidding by customers. | |
| | |
| Sun Trust Banks, Inc. | +55.03% |
| Supported by recovery prospects for this prominent Southeastern bank holding company. | |
| | |
| Ion Geophysical | +54.57% |
| Innovative seismic data processing programs and systems for oil and natural gas exploration. | |
| | |
| Stratasys, Inc. | +51.08% |
| Innovative developer of 3-D modeling systems for design engineering and development. | |
| | |
| Hexcel Corp. | +47.27% |
| Specialist in composite materials for air frame and other high stress, light weight purposes. | |
| | |
| Intuitive Surgical, Inc. | +46.36% |
| The world leader in robotic surgical systems. | |
Alpine Dynamic Innovators Fund
| Mocon, Inc. | +44.62% |
| Innovator in testing instruments for permeation and packaging. | |
| | |
| Portfolio Recovery Associates, Inc. | +43.87% |
| Specialists in defaulted and bankrupt consumer debt recovery strategies and operations. | |
| | |
| InVentiv Health, Inc. | +35.63% |
| Innovator in sales and marketing solutions for healthcare brands. | |
| | |
| The bottom ten performers in this portfolio have a record of innovative growth, but were viewed by investors during this period as unattractive over the near term. We obviously differ with this consensus, in holding these issues in anticipation of favorable future developments. The bottom ten were as follows: | |
| | |
| Aerovironment, Inc. | -1.80% |
| Developer and manufacturer of small scale drone | |
| aircraft for military and intelligence use. | |
| | |
| Google, Inc. | -1.94% |
| Acknowledged leader of internet based information resources. | |
| | |
| ISE Limited | -2.13% |
| Producer of hybrid electric drive systems for heavy-duty vehicles | |
| | |
| Alvarion | -2.80% |
| Limited Principal developer and producer of wireless local area cellular network. | |
| | |
| Redecard S.A. | -4.48% |
| Leading Brazilian credit and debit card processor. | |
| | |
| Telvent GIT S.A. | -4.94% |
| Spanish based global IT solutions and information services provider. | |
| | |
| Imdex Limited | -5.92% |
| Leading Australian oil and gas drilling system developer and manufacturer of energy reduction equipment. | |
| | |
| Charles River Laboratories | -8.32% |
| The leader in developing and breeding specialized laboratory animals for medical research. | |
| | |
| AboveNet, Inc. | -16.39% |
| Provider of optical network services and data center connectivity. | |
While pleased with the operating results of the top performers in the portfolio, we are also optimistic about the potential of those which have underperformed. For example, we believe that Google, Inc. remains a growth leader with a large portfolio of innovative new products and services. In our studies of companies with innovative capabilities, we find a remarkable range of products and services and an impressive management dedication. For example, Life Technologies, Inc., a company dedicated to molecular medicine, stated in their annual report “We are a company founded on innovation, and we focused on that core capability by launching over 1,000 new products throughout the year.” The Fund’s original position in Life Technologies shows a 12.68% gain from the peak period of the market in 200 7, and a 37.55% gain for further purchases made during the decline in June 2008. The single largest unrealized gain in the portfolio is 183.66% in the block of Intuitive Surgical stock purchased at the end of 2008.
In appraising the outlook for the balance of fiscal 2010, we are encouraged by what we feel is an increasingly supportive environment for innovative businesses. Emergence from recession is quite gradual for most businesses, and exports may be inhibited by the fall of the Euro. But companies with unique offerings should outperform. Stock values have generally been lifted with projections of normalizing earning power. We expect outstanding results from those not merely returning to normal, but generating new potential from their innovative activities.
In this world economy where competition increasingly comes from newly powered emerging markets, we see those markets as improved potential customers for those with innovative product or service leadership. The opportunities are great, whether it be an Alscripts Mysis Healthcare Solutions company with patient care information systems, Middleby Company with high speed ovens for restaurant pizza, or Westport Innovations with technology to convert dirty diesel engine trucks to clean fuel environment leaders. The investment results of recent months encourage our continued concentration on innovation as the means to drive growth and provide a stream of potential exceptional opportunities for investment.
Since our last report, our organization has again added to its research staff and capabilities. We anticipate bringing their wider knowledge to our search for innovative businesses. We again thank our shareholders for their continuing support.
Sincerely,
Stephen A. Lieber
Alpine Dynamic Innovators Fund ______
Past performance is not a guarantee of future results.
Please refer to the schedule of portfolio investments for Fund holding information. Fund holdings and sector allocations are subject to change and should not be considered a recommendation to buy or sell any security. Current and future portfolio holdings are subject to risk.
The Fund may invest in smaller and medium size companies, which involve additional risks such as limited liquidity and greater volatility. The Fund may also invest in micro-cap company stocks which are more volatile than those of larger companies and tend to perform poorly during times of economic stress. The Fund may invest in foreign securities which involve greater volatility and political, economic and currency risks and differences in accounting methods as well as other risks. The Fund may invest in debt securities which typically decrease in value when interest rates rise. This risk is usually greater for longer-term debt securities. The Fund’s portfolio will involve short positions, which involves unlimited risk including the possibility that losses may exceed t he original amount invested. The Fund may also use options and future contracts, which have risks associated with unlimited losses of the underlying holdings due to unanticipated market movements and failure to correctly predict the direction of securities prices, interest rates and currency exchange rates. However, a mutual fund investor’s risk is limited to one’s amount of investment in a mutual fund.
Stocks are subject to fluctuation. The stock or other security of a company may not perform as well as expected, and may decrease in value, because of factors related to the company or to the industry in which the company is engaged.
The information provided is not intended to be a forecast of future events a guarantee of future results or investment advice. Views expressed may vary from those of the firm as a whole.
All index performance reflects no deduction for direct fees, expenses or taxes. Please note that an investor cannot invest directly in an index.
Favorable tax treatment of Fund distributions may be adversely affected, changed or repealed by future changes in tax laws. Alpine may not be able to anticipate the level of dividends that companies will pay in any given timeframe.
The Fund may include equity-linked securities and various other derivative instruments, which can be illiquid, may disproportionately increase losses, and have a potentially large impact on Fund performance. Leverage may magnify gains or increase losses in the Fund’s portfolio.
Equity Securities Risk – The stock or other security of a company may not perform as well as expected, and may decrease in value, because of factors related to the company (such as poorer than expected earnings or certain management decisions) or to the industry in which the company is engaged (such as a reduction in the demand for products or services in a particular industry).
The NASDAQ Composite Index is a market capitalization-weighted index that is designed to represent the performance of the National Market System which includes over 5,000 stocks traded only over-the-counter and not on an exchange. You cannot invest directly in an index.
(1) Not annualized.
(2) FINRA does not recognize rankings for less than one year.
(3) As disclosed in the prospectus dated February 27, 2010.
Performance data quoted represents past performance and is not predictive of future results. Investment return and principal value of the Fund fluctuate, so that the shares, when redeemed, may be worth more or less than their original cost. Performance current to the most recent month end may be lower or higher than performance quoted and may be obtained by calling 1-888-785-5578. Performance data shown does not reflect the 1.00% redemption fee imposed on shares held for fewer than 2 months. If it did, total returns would be reduced.
The S&P 500 Index is designed to measure performance of the broad domestic economy through changes in the aggregate market value of 500 stocks representing all major industries. The NASDAQ Composite Index is a stock market index of all of the common stocks and similar securities listed on the NASDAQ stock market, meaning that it has over 3,000 components. It is highly followed in the U.S. as an indicator of the performance of stocks of technology companies and growth companies. The Lipper Mid-Cap Core Funds Average is an average of funds that invest at least 75% of their equity assets in companies with market capitalizations below Lipper’s USDE large cap floor. Lipper Rankings for the periods shown are based on Fund total returns with dividends and distributions reinvested and do not reflect sales charges. The S&P 500 Index, the NASDAQ Composite Index and the Lipper Mid-Cap Core Funds Average are unmanaged and do not reflect direct fees associated with a mutual fund, such as investment adviser fees; however, the Lipper Mid-Cap Core Funds Average reflects fees charged by the underlying funds. The performance for the Dynamic Transformations Fund reflects the deduction of fees for these value-added services. Investors cannot directly invest in an index.
The adviser contractually agreed to waive a portion of its fees and to absorb certain fund expenses. This arrangement will remain in effect unless the Board of Trustees approves its modification or termination.
To the extent that the Fund’s historical performance resulted from gains derived from participation in initial public offerings (“IPOs”) and/or secondary offerings, there is no guarantee that these results can be replicated in future periods or that the Fund will be able to participate to the same degree in IPO/Secondary allocations in the future.
Alpine Dynamic Transformation Fund
This chart represents a comparison of a hypothetical $10,000 investment in the Fund versus a similar investment in the Fund’s benchmark. The graph and the table do not reflect the deduction of taxes that a shareholder would pay on Fund distributions or the redemption of Fund shares. Investment performance reflects the waiver and recovery of certain fees. Without the waiver and recovery of fees, the Fund’s total return would have differed.
Commentary
The Alpine Dynamic Transformations Fund return for the semi annual period ending April 30, 2010 was 32.42%. This compared with the 15.66% for the Standard & Poor’s 500 Average and 20.95% for the NASDAQ Average. In the one year period from April 30, 2009 through April 30, 2010, the return was 74.14% comparing with 38.84% for the Standard & Poor’s 500 and 44.68% for the NASDAQ Average.
In our last report to you, for the Fund’s first fiscal year ended October 31, 2009, we characterized the Fund as in “incubation stage”, aimed at “proof of concept”. The results of the first half of this fiscal year encourage our positive view of the concept — that there should be exceptional growth opportunities through investment in companies which are in the process of enhancing their business through transforming strategies.
Each of the Fund’s ten top performing holdings through April 30, 2010 illustrates significant growth potential achieved through transformational operating policies:
Atlas Air Worldwide Holdings was the number one performer with a total return of 110.23%. This company has transformed itself from being a provider of charter freight aircraft to operating an integrated air freight delivery system.
Build-A-Bear Workshop, Inc. shares rose 87.82%. The transformation of this unique retail chain selling stuffed toy animals was achieved by broadening its line from just bears to other creatures and establishing an internet user experience for children.
Westport Innovations, Inc. gained 80.61%. It is in the commercialization stages of a major innovative program to power commercial vehicles with gaseous fuel based engine technology.
BE Aerospace, Inc., which gained 67.85%, has transformed its product offering from conventional aircraft seating and interiors to “Super First Class” luxurious seating intended to make long distance flying more competitive.
Priceline, Inc., up 66.08%, built a transformation in hotel bookings with its internet based opportunities for travelers to name their own bid for hotel accommodations and purchase discount travel packages.
Alpine Dynamic Transformation Fund
Each of the other top ten holdings, whose performance ranged from 63.04% for Autoliv, Inc. to 46.36% for Intuitive Surgical, Inc., was characterized as having products or services which provided transformative opportunities for customers or for corporate restructuring. One of the original holdings in th e Fund, Starbucks Corp., up 37.44% this half-year, demonstrated the transformational restructuring program which we originally anticipated in our purchase in January, 2008. It has closed underperforming stores, added new products and services in its stores and introduced a branded instant coffee. Profits have already begun to rise out of a stagnant b ase.
Even the weakest performer in the portfolio, HearUSA, Inc., down -24.71%, shows the promise of a significant transformation. HearUSA is a chain of hearing aid retail shops. It expects to shortly announce a venture with the American Association of Retired Persons (AARP) to promote the use of hearing aids in aging segments of the population. Google, Inc., one of our disappointing holdings, down -15.58%, is widely recognized as among the most transformative enterprises in the economy. Its price decline reflects a recent Chinese government
restriction on the use of Google information systems over competition. Other issues that did not perform to our expectations during this semi-annual period included: EnergySolutions, which provides technical services to the nuclear industry returned -15.82% during the period; Foster Wheeler AG which is an engineering/research & design company was -11.16%;
and Massey Energy was -8.17%. Massey Energy was unfortunately involved in the mine collapse in West Virginia on April 6, 2010 — the Fund had established a small position on March 24, 2010 but quickly exited after the incident.
In our first annual report, we stated “The essence of the transformation concept of investing is to recognize and select important and promising changes in corporate culture.” We see increasing evidence that there are certain corporate managements, when viewing the impact of the recent recession, who see that t ransformations are required for future growth. In this
Spring’s outpouring of annual reports, we see the word “transformation” coming up with great frequency. Some refer to internal operating policy, others to market strategy or to new products, and even to mergers or acquisitions. As businesses find themselves challenged by a difficult economy and yet with resources which can be better employed, they may find
that they are drawn to transformative opportunity. These trends encourage us to believe that the Fund is well positioned to continue to benefit by strong corporate management trends in a recovering economy.
We appreciate the continued support of our investors who share our conviction about this strategy.
Sincerely,
Stephen A. Lieber
__________
Past performance is not a guarantee of future results.
The Fund may invest in smaller and medium size companies, which involve additional risks such as limited liquidity and greater volatility. The fund may also invest in micro-cap company stocks which are more volatile than those of larger companies and tend to perform poorly during times of economic stress. The Fund may invest in foreign securities which involve greater volatility and political, economic and currency risks and differences in accounting methods, as well as other risks. The Fund may also use options and future contracts, which have risks associated with unlimited losses of the underlying holdings due to unanticipated market movements and failure to correctly predict the direction of securities prices, interest rates and currency exchange rates. The Fund may inve st in debt securities which typically decrease in value when interest rates rise. This risk is usually greater for longer-term debt securities.
Stocks are subject to fluctuation. The stock or other security of a company may not perform as well as expected, and may decrease in value, because of factors related to the company or to the industry in which the company is engaged.
The information provided is not intended to be a forecast of future events a guarantee of future results or investment advice. Views expressed may vary from those of the firm as a whole.
All index performance reflects no deduction for direct fees, expenses or taxes. Please note that an investor cannot invest directly in an index.
Favorable tax treatment of Fund distributions may be adversely affected, changed or repealed by future changes in tax laws. Alpine may not be able to anticipate the level of dividends that companies will pay in any given timeframe.
Alpine Dynamic Transformation Fund
The Fund may include equity-linked securities and various other derivative instruments, which can be illiquid, may disproportionately increase losses, and have a potentially large impact on Fund performance. Leverage may magnify gains or increase losses in the Fund’s portfolio.
Equity Securities Risk—The stock or other security of a company may not perform as well as expected, and may decrease in value, because of factors related to the company (such as poorer than expected earnings or certain managament decisions) or to the industry in which the company is engaged (such as a reduction in the demand for products or services in a particular industry).
Credit Risk – Credit risk is the risk of an issuer’s inability to meet its principal and interest payment obligations.
Please refer to the schedule of portfolio investments for Fund holding information. Fund holdings and sector allocations are subject to change and should not be considered a recommendation to buy or sell any security. Current and future portfolio holdings are subject to risk.
The NASDAQ Composite Index is a market capitalization-weighted index that is designed to represent the performance of the National Market System which includes over 5,000 stocks traded only over-the-counter and not on an exchange. You cannot invest directly in an index.
(1) Not annualized.
(2) FINRA does not recognize rankings for less than one year.
(3) As disclosed in the prospectus dated February 27, 2010.
Performance data quoted represents past performance and is not predictive of future results. Investment return and principal value of the Fund fluctuate, so that the shares, when redeemed, may be worth more or less than their original cost. Performance current to the most recent month end may be lower or higher than performance quoted and may be obtained by calling 1-888-785-5578. Performance data shown does not reflect the 1.00% redemption fee imposed on shares held for fewer than 2 months. If it did, total returns would be reduced.
The S&P 500 Index is designed to measure performance of the broad domestic economy through changes in the aggregate market value of 500 stocks representing all major industries. The Lipper Mixed-Asset Target Allocation Growth Funds Average is an average of Funds that, by portfolio practice, maintain a mix of between 60%–80% equity securities, with the remainder invested in bonds, cash, and cash equivalents. Lipper Rankings for the periods shown are based on Fund total returns with dividends and distributions reinvested and do not reflect sales charges. The S&P 500 Index and the Lipper Mixed-Asset Target Allocation Growth Funds Average are unmanaged and do not reflect the deduction of direct fees associated with a mutual fund, such as investment adviser fees; however, the Lippe r Mixed-Asset Target Allocation Growth Funds Average reflects fees charged by the underlying funds. The performance for the Dynamic Balance Fund reflects the deduction of fees for these value-added services. Investors cannot directly invest in an index.
To the extent that the Fund’s historical performance resulted from gains derived from participation in initial public offerings (“IPOs”) and/or secondary offerings, there is no guarantee that these results can be replicated in future periods or that the Fund will be able to participate to the same degree in IPO/Secondary allocations in the future.
Alpine Dynamic Balance Fund
This chart represents a comparison of a hypothetical $10,000 investment in the Fund versus a similar investment in the Fund’s benchmark. The graph and the table do not reflect the deduction of taxes that a shareholder would pay on Fund distributions or the redemption of Fund shares. Investment performance reflects the waiver and recovery of certain fees. Without the waiver and recovery of fees, the Fund’s total return would have differed.
Commentary
The Alpine Dynamic Balance Fund provided a 16.69% return for its semi-annual period ending April 30, 2010. This return compared with 15.66% from the Standard & Poor’s 500 Index and the 11.01% from the Lipper Mixed-Asset Target Allocation Growth Fund Index. Since inception on June 7, 2001, the Fund has provided a 4.25% average annual rate of return as compared with 1.09% for the Standard & Poor’s 500 Index and 2.69% for the Lipper Mixed-Asset Target Allocation Growth Fund Index.
The Dynamic Balance Fund investments include diverse strategies and types of investment vehicles. Central to the program is the continuing utilization of a substantial portion of the Fund holdings in United States Treasury obligations; which was 21% of assets at the end of the fiscal semi-annual period. This is an actively managed segment of the portfolio aimed to add to total return by taking advantage of cyclical trends in the markets for U.S. Treasury obligations while providing income.
A major component of the Fund’s strategy is investing in stocks of comparatively large capitalization companies which have demonstrated long term records of substantial dividend payment and increases. These holdings accounted for 40% of the portfolio at the end of the semi-annual period. Another segment is aimed at participating in cyclical opportunities for corporate profits growth. These stock holdings accounted for 31% of the portfolio at the end of the semi-annual period.
Within the different equity investment segments, sector commitments included real estate investment trusts and homebuilding companies (12%), diversified financial services (7%), and commercial banks (6%). These three sectors were the major drivers of the portfolios performance in the semi-annual period reflecting the growing confidence that the recovery was well underway. Among equities, the top performer was Standard Pacific, a homebuilding company whose shares provided a 113.67% total return. CBL Associates, a real estate investment trust (retail malls), produced a 82.37% return, while Hovnanian, a real estate builder of single-family homes, brought an 81.84% return. Among financials, the outstanding return was 83.41% in the shares of Webster Financial Corp., an eastern commercial bank, followed by Regions Financial Corp., a southern commercial bank with an 83.16% return. A variety of issues across a spectrum of sectors produced short term gains for the fund. In addition, we continued significant returns; with 26 different holdings providing to selectively choose various ETFs — for example, returns ranging from 30% to 113%. Illustratively, realizing a gain of 8.07% in the Direxion Daily Financial Cogdell Spencer, a healthcare REIT, total return was Bulls — again attempting to maximize market 73.36%, Autoliv, maker of automobile components movements by utilizing selective short term vehicles. (seatbelts, airbags, etc.), 63.04%, Wesco Int’l., 58.92%, Darden Restaurants, 49.52%, Honeywell, 34.32%, General Electric, 33.95%, and Emerson Radio, 40.50%.
Alpine Dynamic Balance Fund
The only major challenged area of the portfolio was in the U.S. Treasury obligations reflecting the continued low yields in this asset class. In addition, there was less than optimal performance in the following issues: Allegheny Energy, an electrical utility, -3.29%, Charles Schwab, financial services company, -4.80%; Walgreen Company, -6.38%; Arden Group, a supermarket operator in the Los Angeles, CA area, -9.54%. However, the small position size of these issues meant that the underperformance did not significantly impact the overall portfolio performance.
We participated in a small way in the secondary offering on 3/9/10 for Comerica making a modest gain in one day trading and also in the secondary offering of Sterling Bancorp (STL) on 3/16/10. Both actions yielded short term gains for the fund. In addition, we continued to selectively choose various ETFs — for example, realizing a gain of 8.07% in the Direxion Daily Financial Bulls — again attempting to maximize market movements by utilizing selective short term vehicles.
The semi-annual 2010 reflects the Fund’s portfolio structure in a group of strategies aimed at risk avoidance. Much of the strategy worked well in the semi-annual period. Looking ahead, for the balance of fiscal 2010, weanticipate a normalizing business environment for financial institutions and for corporate earning power. While we anticipate many companies will have a slow and often limited recovery, we will concentrate on the search for what, in our view, are the more vigorous, well financed, innovative and transformational companies to be the core of this portfolio. Our goal is strong results while continuing a defensive investment strategy.
We thank our shareholders for their continuing support.
Sincerely,
Stephen A. Lieber
____________
Past Performance is not a guarantee of future results.
Please refer to the schedule of portfolio investments for fund holdings information. Fund holdings and sector allocations are subject to change and should not be considered a recommendation to buy or sell any security. Current and future portfolio holdings are subject to risk.
Investing in this Fund involves special risks, including but not limited to, options and futures transactions. Please refer to the prospectus for further details. Investments in debt securities typically decrease in value when interest rates rise. This risk is usually greater for longer-term debt securities.
Stocks are subject to fluctuation. The stock or other security of a company may not perform as well as expected, and may decrease in value, because of factors related to the company or to the industry in which the company is engaged.
The information provided is not intended to be a forecast of future events a guarantee of future results or investment advice. Views expressed may vary from those of the firm as a whole.
All index performance reflects no deduction for direct fees, expenses or taxes. Please note that an investor cannot invest directly in an index.
Favorable tax treatment of Fund distributions may be adversely affected, changed or repealed by future changes in tax laws. Alpine may not be able to anticipate the level of dividends that companies will pay in any given timeframe.
The Fund may include equity-linked securities and various other derivative instruments, which can be illiquid, may disproportionately increase losses, and have a potentially large impact on Fund performance. Leverage may magnify gains or increase losses in the Fund’s portfolio.
Equity Securities Risk – The stock or other security of a company may not perform as well as expected, and may decrease in value, because of factors related to the company (such as poorer than expected earnings or certain management decisions) or to the industry in which the company is engaged (such as a reduction in the demand for products or services in a particular industry).
Credit Risk – Credit risk is the risk of an issuer’s inability to meet its principal and interest payment obligations.
Fixed Income Securities Risk – Fixed securities are subject to credit risk and market risk. Securities having longer maturities generally involve greater risk of fluctuations in value resulting from changes in interest rates.
Investment Company Risk – To the extent that the Fund invests in other investment companies, there will be some duplication of expenses because the Fund would bear its pro rata portion of such funds’ management fees and operational expenses.
FIXED INCOME MANAGER REPORTS
Alpine Ultra Short Tax Optimized Income Fund
Alpine Municipal Money Market Fund
The adviser contractually agreed to waive a portion of its fees and to absorb certain fund expenses. This arrangement will remain in effect unless the Board of Trustees approves its modification or termination.
(1) Not annualized.
(2) Investor Class shares commenced on December 5, 2002 and Adviser Class shares commenced on March 30, 2004. Returns for indices are since December 5, 2002.
(3) The since inception return represents the annualized return for the period beginning 12/31/2002.
(4) FINRA does not recognize rankings for less than one year.
(5) As disclosed in the prospectus dated February 27, 2010.
Performance data quoted represents past performance and is not predictive of future results. Investment return and principal value of the Fund fluctuate, so that the shares, when redeemed, may be worth more or less than their original cost. Performance current to the most recent month end may be lower or higher than performance quoted and may be obtained by calling 1-888-785-5578. Performance data shown does not reflect the 0.25% redemption fee imposed on shares held for fewer than one month. If it did, total returns would be reduced. Effective 10/12/07, Alpine Ultra Short Tax Optimized Fund — Adviser Class began imposing a maximum sales charge of 0.50% on purchases. Performance data shown for time period beginning with dates after 10/12/07 reflect the sales charge.
The Barclays Capital 1 Year Municipal Bond Index is the 1-year (1-2) component of the Municipal Bond Index. The Barclays Capital 1 Year Municipal Bond Index is a rules-based, market-value weighted index engineered for the long-term, tax-exempt bond market. The Lipper Short Municipal Debt Funds Average is an unmanaged index that tracks funds that invest in municipal debt issues with dollar-weighted average maturities of less than three years. Lipper Rankings for the periods shown are based on Fund total returns with dividends and distributions reinvested and do not reflect sales charges. The Barclays Capital 1 Year Municipal Bond Index and the Lipper Short Municipal Debt Funds Average are unmanaged and do not reflect the deduction of direct fees associated with a mutual fund, such as investme nt adviser fees; however, the Lipper Short Municipal Debt Funds Average reflects fees charged by the underlying funds. The performance for the Ultra Short Tax Optimized Income Fund reflects the deduction of fees for these value-added services. Investors cannot directly invest in an index.
Alpine Ultra Short Tax Optimized Income Fund
* The Adviser Class Return for 2004 is from 3/30/2004 (inception) – 12/31/2004.
Alpine Ultra Short Tax Optimized Income Fund
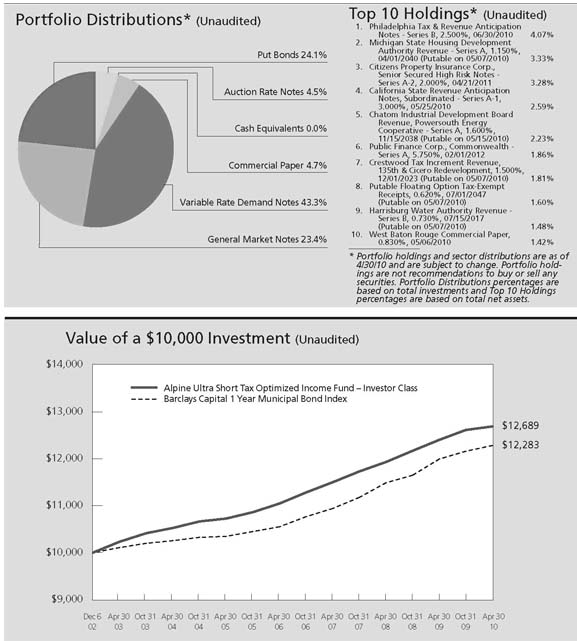
This chart represents a comparison of a hypothetical $10,000 investment in the Fund versus a similar investment in the Fund’s benchmark. The graph and the table do not reflect the deduction of taxes that a shareholder would pay on Fund distributions or the redemption of Fund shares. Investment performance reflects the waiver and recovery of certain fees. Without the waiver and recovery of fees, the Fund’s total return would have differed.
(1) Not annualized.
(2) The since inception return represents the annualized return for the period beginning 12/31/2002.
(3) FINRA does not recognize rankings for less than one year.
(4) As disclosed in the prospectus dated February 27, 2010.
Note, the yield more closely reflects the current earnings of the money market fund than the total return.
Performance data quoted represents past performance and is not predictive of future results. Performancecurrent to the most recent month end may be lower or higher than the performance quoted and may beobtained by calling 1-888-785-5578.
The Lipper Tax-Exempt Money Market Funds Average is an average of funds that invest in high quality municipal obligations with dollar-weighted average maturities of less than 90 days. The Lipper Tax-Exempt Money Market Funds Average is unmanaged and does not reflect the deduction of direct fees associated with a mutual fund, such as investment adviser fees; however, the Lipper Tax-Exempt Money Market Funds Average reflects fees charged by the underlying funds. Lipper Rankings for the periods shown are based on Fund total returns with dividends and distributions reinvested and do not reflect sales charges. The performance for the Municipal Money Market Fund reflects the deduction of fees for these value-added services. Investors cannot directly invest in an index.
* The Adviser Class return for 2004 is from 3/30/2004 (inception)–12/31/2004.
** The Adviser Class return for 2007 is from 1/01/2007–12/05/2007 (class ceased operations)
The graph and the table do not reflect the deduction of taxes that a shareholder would pay on Fund distributions or the redemption of Fund shares. Investment performance reflects the waiver of certain fees. Without the waiver of fees, the Fund’s total return would have been lower.
Alpine Municipal Money Market Fund
Taxable Equivalent Yield as of 04/30/10 (Unaudited) | |
| | | | Your Tax-Exempt Effective Yield |
| | | Marginal | of 0.19% is Equivalent to a |
| Joint Return | Single Return | Tax Rate | Taxable Yield of: |
| | | | |
| | 25% | 0.25% |
| | | | |
| $137,300 - 209,250 | | 28% | 0.26% |
| | | | |
| $209,250 - 373,650 | $171,850 - 373,650 | 33% | 0.28% |
| | | | |
| Over $373,650 | Over $373,650 | 35% | 0.29% |
The chart reflects projected 2010 marginal federal tax rates before limitations and phaseouts. Individuals with adjusted gross income in excess of $142,700 should consult a tax professional to determine their actual 2010 marginal tax rate.
Alpine Ultra Short Tax Optimized Income Fund/
Alpine Municipal Money Market Fund
We are pleased to bring you the semi-annual report for the Alpine Income Trust for the period ending April 30, 2010. The Income Trust includes both the Alpine Ultra Short Tax Optimized Income Fund and the Alpine Municipal Money Market Fund.
PERFORMANCE SUMMARY
According to Lipper Analytical Services, the total return for the Alpine Ultra Short Tax Optimized Income Fund was 0.60% and 0.09% for the Alpine Municipal Money Market Fund for the six month period ending April 30, 2010. The Lipper average was 1.26% and 0.01% for the Short Municipal Debt and Tax Exempt Money Market averages for the same period.
MARKET OVERVIEW
The longest and deepest U.S. recession since the Great Depression seems to be over. The economy, which shrank at an annualized rate of more than 5% in the fourth quarter of 2008 and in the first quarter of 2009, started to expand in the third quarter. Gross domestic product grew at a brisk 5.9% annualized rate in the last three months of 2009. Other encouraging signs include a decrease in the national unemployment rate, down from the 10.1% peak reached in October 2009; stabilizing residential real estate markets in some cities; and the significant rebound in equities over the last 12 months.
Although the economy is growing again and Treasury issuance is at record levels, Treasury yields have remained extremely low over the last 12 months. Benign inflation and economic weakness have allowed the Fed to keep the fed funds target in an all-time low range of 0.00% to 0.25% since the end of 2008. Short-term municipal yields gradually declined over the last year, but long-term yields bounced off historic lows in the autumn of 2009 as issuance picked up and municipal valuations approached historically rich levels versus Treasuries. Despite the remarkable rebound over the last year, tax free securities remain an attractive alternative to taxable bonds, particularly for investors in the highest tax brackets.
New municipal supply in 2009 totaled about $409 billion according to The Bond Buyer, slightly more than the $390 billion issued in 2008 but lower than the record $427 billion in 2007. Tax-exempt supply in 2009 was lower than it could have been, due in part to the Build America Bond program, which shifted $64 billion of last year’s total municipal issuance to the taxable market and helped alleviate the supply/demand imbalance that stressed the tax-free market in 2008. With some highly indebted states unwilling to borrow at high interest rates and with the possible expansion of the Build America Bond program, we believe aggregate new tax-exempt issuance in 2010 could be somewhat lower than in 2009.
Demand from retail investors for municipal securities was very strong throughout our reporting period and investor cash flows into municipal bonds continued at a rapid pace during the first four months of 2010. In the aftermath of 2008’s financial market turbulence, investors seeking more exposure to fixed income securities have embraced munis because of attractive after-tax yields and valuations relative to Treasuries and also because of their low-risk profile relative to higher yielding fixed income alternatives. Concerns about higher federal, state, and local taxes have also fueled interest in tax-free securities.
Many states continue to face fiscal difficulties and have been forced to take drastic actions to close budget deficits. California’s challenges show no signs of abating and there are many other states that are going to have to adjust taxes, fees, and spending to match the difficult economic realities they continue to face.
Most municipal sectors produced moderate gains in the last six months. Top performers included higher-yielding life-care and industrial revenue and pollution control revenue bonds, while prerefunded and escrowed-tomaturity (ETM) bonds, which are backed by U.S. Treasuries, underperformed. Tobacco bonds and hospital revenue bonds also outperformed other sectors which comes as no surprise as they were some of the hardest hit sectors in 2008. We are generally cautious on the higher-yielding sectors as we believe that they are close to or fully priced at this point but believe that there are still attractive investment opportunities with reasonable credit risks.
Lastly, in February 2010, the SEC released new rules to strengthen regulatory requirements for money market Funds. These rules provide additional measures to enhance the liquidity, credit quality and operational aspects of these funds.
The SEC’s rule changes are effective in May. In our view, the SEC did a good job of striking a balance between investor protection and the efficient management of money market funds.
ALPINE ULTRA SHORT TAX OPTIMIZED INCOME FUND
During the past six months, we continued the same strategy that we have been utilizing for the past year now. While our performance has trailed the Lipper Short Municipal Debt Funds Average it is primarily because we maintained a more conservative posture. As a result, we positioned the fund with the following goals in mind:
Alpine Ultra Short Tax Optimized Income Fund/
Alpine Municipal Money Market Fund 1) to keep volatility low while still providing a competitive return, 2) to take advantage of the current interest rate environment while being mindful that interest rates are likely to eventually rise and 3) to be defensive in the face of declining credit quality in the municipal sector-in light of a slowing economy-while seeking to take advantage of the inefficiencies in the municipal marketplace.
In this regard, the fund had an overweight in variable rate demand notes during our reporting period which provided the fund with a yield that approached, or exceeded the yield on municipal bonds farther out on the yield curve. While Variable Rate Demand Note’s still represent the largest segment of the portfolio we have gradually lowered this percentage as the reporting period came to a close.
We rounded out the portfolio with select investments in tax exempt commercial paper, short maturity bonds and tax exempt auction rate securities. Despite the past turmoil of the auction rate market, we have only focused our recent purchases on securities that have higher maximum rates thus making these securities more marketable.
During the past six months, our focus was on various revenue sectors which included health care, industrial revenue, and pollution control revenue bonds, where we felt the yield premiums offered attractive opportunities to capture income. Furthermore, we tried to favor bonds with predictable income streams while we remain leery of many general obligation credits because of ongoing budget deficits, which are likely to continue throughout the year. This situation could change as the economy strengthens, but at the moment we prefer to take a more cautious approach about our exposure to the sector.
As of this writing, the fund continues to maintain a tremendous amount of flexibility to reposition the portfolio should the markets change either because of interest rates or credit conditions. This has always been the hallmark of the fund and in this rapidly changing economic environment that we find ourselves in, we will not alter this strategy.
ALPINE MUNICIPAL MONEY MARKET FUND
The persistence of the Federal Reserve’s zero interest rate policy has successfully driven short-term borrowing costs to extreme lows. Such low borrowing costs will no doubt foster future economic recovery. Unfortunately, lenders-such as money market funds-have seen their interest income drop to nominal levels. Across the various money market sectors, rates are historically low. For example, for the period ending 04/29//2010 30-day Treasury bills as measured by the Bond Buyer yielded 0.15% while 90-day bills as measured by the Bond Buyer yielded 0.16%. Thus it is not surprising that municipal money market yields have compressed to similar levels. For the period ending 04/29/2010, seven-day national municipal issues as measured by the Bond Buyer ended the period with an annualized yield of 0.30%, 30-day muni cipal commercial paper as measured by the Bond Buyer yielded 0.30%, while one-year municipal notes as measured by the Bond Buyer yielded 0.39%.
Our management of the fund has not changed despite the extreme environment we operate in. Our primary focus for shareholders remains stability of principal and liquidity, while providing a level of income commensurate with those twin goals. Credit quality remains a significant driver of investment decisions. The ongoing recession has taken a toll on state and local governments and other municipal issuers. We therefore continue to focus on high quality issuers and credit enhancements.
The vast majority of the portfolio consisted of variable rate demand notes with a very small concentration invested in tax-exempt commercial paper and municipal bonds. As a result, the average maturity of the fund at the close of our reporting period was 13 days which was much lower than the 24-day average of all retail funds in the tax-exempt universe.
OUTLOOK
The credit environment for the municipal market could remain challenging for some time. Many issuers are trying to make difficult but necessary decisions as they adjust to high unemployment, slow economic growth, lower tax revenues and other tough conditions.
We believe the municipal market is still a high quality market and that many municipal securities offer good long-term value, especially since tax rates are likely to rise in the next few years. As always, we are on the outlook for attractively valued bonds issued by municipalities with good fundamentals or strong credit support. We think such investments should continue to help us generate excellent long-term relative returns for our shareholders.
Sincerely,
Steven C. Shachat Portfolio Manager
Alpine Ultra Short Tax Optimized Income Fund/
Alpine Municipal Money Market Fund Past performance is no guarantee of future results.
An investment in the Alpine Municipal Money Market Fund is neither insured nor guaranteed by the Federal Deposit Insurance Corporation or any other government agency. Although the Fund seeks to preserve the value of your investment at $1.00 per share, it is possible to lose money by investing in the Fund.
Investing in these Funds involves special risks, including but not limited to, investing in municipal obligations and derivative securities, mortgage-related and asset-backed investments. Please refer to the prospectus for further details. Investments in debt securities typically decrease in value when interest rates rise. This risk is usually greater for longer-term debt securities. Income from tax-exempt funds may be subject to state and local taxes and a portion of income may be subject to the federal alternative minimum tax for certain investors. The Alpine Ultra Short Tax Optimized Fund is permitted to invest in Asset Backed and Mortgage- Backed Securities. Investments in these securities include additional risks that investors should be aware of and are more fully described in the prospectu s. The Alpine Ultra Short Tax Optimized Fund has never invested in, does not currently hold, nor has any plans to invest in such securities.
The information provided is not intended to be a forecast of future events a guarantee of future results or investment advice. Views expressed may vary from those of the firm as a whole.
All index performance reflects no deduction for direct fees, expenses or taxes. Please note that an investor cannot invest directly in an index.
Favorable tax treatment of Fund distributions may be adversely affected, changed or repealed by future changes in tax laws.
Credit Risk – Credit risk is the risk of an issuer’s inability to meet its principal and interest payment obligations.
Please refer to the Schedule of Portfolio Investments for fund holding information. Fund holdings and sector allocations are subject to change and should not be considered a recommendation to buy or sell any security. Current and future portfolio holdings are subject to risk.
Lipper Analytical Services, Inc. is an independent mutual fund research and rating service. Each Lipper average represents a universe of Funds with similar investment objectives. Rankings for the periods shown include dividends and distributions reinvested and do not reflect sales charges.
The federal government guarantees interest payments from government securities, such as U.S. Treasury bills, while dividend payments carry no such guarantee. Government securities, if held to maturity, guarantee the timely payment of principal and interest.
Any tax or legal information provided is merely a summary of our understanding and interpretation of some of the current income tax regulations and is not exhaustive. Investors must consult their tax advisor or legal counsel for advice and information concerning their particular situation. Neither the Fund nor any of its representatives may give legal or tax advice.
Cash flow: measures the cash generating capability of a company by adding non-cash charges (e.g. depreciation) and interest expense to pretax income.
Variable Rate Demand Note (VRDN): A debt instrument that represents borrowed funds that are payable on demand and accrue interest based on a prevailing money market rate, such as the prime rate. The interest rate applicable to the borrowed funds is specified from the outset of the debt, and is typically equal to the specified money market rate plus an extra margin.
Item 1. Reports to Stockholders.
Alpine Dynamic Dividend Fund
Schedule of Portfolio Investments
April 30, 2010 (Unaudited)
| | | Security | | | |
| Shares | | Description | | Value | |
| Common Stocks—91.1% | | | |
| Automobiles & Components—1.7% | | | |
| | 102,200 | | Hyundai Motor Co. (b) . . . . . . . . . | | $ | 12,464,002 | |
| Capital Goods—10.2% | | | | |
| | 161,900 | | Albany International Corp. . . . . . | | | 4,123,593 | |
| | 250,800 | | Atlas Copco AB (b) . . . . . . . . . . . . | | | 4,033,890 | |
| | 1,664,930 | | Bombardier, Inc. . . . . . . . . . . . . . . | | | 8,686,876 | |
| | 149,000 | | Bouygues SA (b) . . . . . . . . . . . . . . | | | 7,382,930 | |
| | 15,526,103 | | China State Construction | | | | |
| | | | International Holdings, Ltd. (b) | | | 5,353,143 | |
| | 100,100 | | FLSmidth & Co. A/S (b) . . . . . . . . . | | | 7,542,388 | |
| | 78,062 | | Fluor Corp. . . . . . . . . . . . . . . . . . . | | | 4,124,796 | |
| | 1,465,000 | | Mills Estruturas e Servicos de | | | | |
| | | | Engenharia SA (a) . . . . . . . . . . . | | | 9,717,503 | |
| | 510,785 | | Mitsubishi Corp. (b) . . . . . . . . . . . | | | 12,099,422 | |
| | 50,000 | | Schneider Electric SA (b) . . . . . . . . | | | 5,676,431 | |
| | 47,900 | | United Technologies Corp. . . . . . . | | | 3,590,105 | |
| | 2,239,200 | | Zhuzhou CSR Times Electric Co., | | | | |
| | | | Ltd. (b) . . . . . . . . . . . . . . . . . . . . | | | 4,727,570 | |
| | | | | | | 77,058,647 | |
| Commercial & Professional Services—0.7% | | | | |
| | 225,070 | | Healthcare Services Group, Inc. . . | | | 4,836,755 | |
| | 2,199,178 | | Shengli Oil & Gas Pipe Holdings, | | | | |
| | | | Ltd. (b) . . . . . . . . . . . . . . . . . . . . | | | 492,851 | |
| | | | | | | 5,329,606 | |
| Consumer Durables & Apparel—5.2% | | | | |
| | 2,000,000 | | Anta Sports Products, Ltd. (b) . . . | | | 3,560,601 | |
| | 608,300 | | JM AB (b) . . . . . . . . . . . . . . . . . . . . | | | 9,799,668 | |
| | 945,900 | | MRV Engenharia . . . . . . . . . . . . . . | | | 6,622,524 | |
| | 932,284 | | PDG Realty SA . . . . . . . . . . . . . . . . | | | 8,474,090 | |
| | 887,600 | | Rossi Residencial SA . . . . . . . . . . . | | | 6,536,045 | |
| | 5,150,300 | | TCL Multimedia Technology | | | | |
| | | | Holdings, Ltd. (b) . . . . . . . . . . . . | | | 4,100,295 | |
| | | | | | | 39,093,223 | |
| Consumer Services—2.1% | | | | |
| | 478,686 | | Anhanguera Educacional | | | | |
| | | | Participacoes SA (a) . . . . . . . . . . | | | 7,319,703 | |
| | 76,100 | | McDonald’s Corp. . . . . . . . . . . . . . | | | 5,371,899 | |
| | 163,300 | | OPAP SA (b) . . . . . . . . . . . . . . . . . . | | | 3,316,811 | |
| | | | | | | 16,008,413 | |
| Diversified Financials—10.4% | | | | |
| | 1,500,000 | | Anglo Irish Bank Corp. PLC (a)(b) | | | 0 | |
| | 648,633 | | Bank of America Corp. . . . . . . . . . | | | 11,565,126 | |
| | 1,692,431 | | Citigroup, Inc. (a) . . . . . . . . . . . . . | | | 7,395,924 | |
| | 326,900 | | JPMorgan Chase & Co. . . . . . . . . . | | | 13,919,402 | |
| | 987,930 | | KKR & Co. Guernsey LP . . . . . . . . | | | 12,032,987 | |
| | 186,362 | | Morgan Stanley . . . . . . . . . . . . . . | | | 5,631,860 | |
| | 243,700 | | NYSE Euronext . . . . . . . . . . . . . . . | | | 7,951,931 | |
| | 493,813 | | Och-Ziff Capital Management | | | | |
| | | | Group, LLC . . . . . . . . . . . . . . . . . | | | 8,651,604 | |
| | 271,200 | | State Street Corp. . . . . . . . . . . . . . | | | 11,797,200 | |
| | | | | | | 78,946,034 | |
| | | Security | | | |
| Shares | | Description | | Value | |
| Common Stocks—continued | | | |
| Energy—10.9% | | | | | |
| | 70,000 | | Apache Corp. . . . . . . . . . . . . . . . . | | $ | 7,123,200 | |
| | 1,446,756 | | Coal of Africa, Ltd. (a)(b) . . . . . . . | | | 3,189,832 | |
| | 211,364 | | Frontline, Ltd. . . . . . . . . . . . . . . . . | | | 7,714,786 | |
| | 1,495,500 | | Heritage Oil PLC (a)(b) . . . . . . . . . | | | 10,410,856 | |
| | 117,913 | | Hess Corp. . . . . . . . . . . . . . . . . . . . | | | 7,493,371 | |
| | 229,300 | | Nordic American Tanker Shipping . | | | 7,163,332 | |
| | 207,700 | | Overseas Shipholding Group, Inc. . | | | 10,397,462 | |
| | 226,800 | | Petroleo Brasileiro SA — ADR . . . | | | 9,623,124 | |
| | 101,274 | | Schlumberger, Ltd. . . . . . . . . . . . . | | | 7,232,989 | |
| | 494,300 | | SeaDrill, Ltd. (b) . . . . . . . . . . . . . . | | | 12,450,726 | |
| | | | | | | 82,799,678 | |
| Food & Staples Retailing—1.9% | | | | |
| | 201,000 | | Cia Brasileira de Distribuicao | | | | |
| | | | Grupo Pao de Acucar . . . . . . . . | | | 6,840,880 | |
| | 204,900 | | CVS Caremark Corp. . . . . . . . . . . . | | | 7,566,957 | |
| | | | | | | 14,407,837 | |
| Food, Beverage & Tobacco—1.7% | | | | |
| | 96,000 | | Danone (b) . . . . . . . . . . . . . . . . . . | | | 5,656,357 | |
| | 8,151,500 | | Marine Harvest ASA (a)(b) . . . . . . | | | 7,563,682 | |
| | | | | | | 13,220,039 | |
| Health Care Equipment & Services—2.5% | | | | |
| | 138,100 | | Covidien PLC . . . . . . . . . . . . . . . . . | | | 6,627,419 | |
| | 256,400 | | Masimo Corp. . . . . . . . . . . . . . . . . | | | 6,002,324 | |
| | 238,425 | | Meridian Bioscience, Inc. . . . . . . . | | | 4,766,116 | |
| | 348,300 | | Sinopharm Group Co. (a)(b) . . . . . | | | 1,569,821 | |
| | | | | | | 18,965,680 | |
| Household & Personal Products—4.3% | | | | |
| | 324,046 | | Avon Products, Inc. . . . . . . . . . . . . | | | 10,476,407 | |
| | 78,200 | | Colgate-Palmolive Co. . . . . . . . . . | | | 6,576,620 | |
| | 1,105,072 | | Hypermarcas SA (a) . . . . . . . . . . . . | | | 15,136,928 | |
| | | | | | | 32,189,955 | |
| Materials—10.4% | | | | | | |
| | 122,000 | | BASF SE (b) . . . . . . . . . . . . . . . . . . | | | 7,092,917 | |
| | 168,000 | | Cliffs Natural Resources, Inc. . . . . | | | 10,505,040 | |
| | 1,628,200 | | Grande Cache Coal Corp. (a) . . . . | | | 10,707,202 | |
| | 16,046,000 | | Lumena Resources Corp. (a)(b) . . | | | 4,686,923 | |
| | 713,800 | | Mvelaphanda Resources, | | | | |
| | | | Ltd. (a)(b) . . . . . . . . . . . . . . . . . . | | | 4,934,507 | |
| | 757,900 | | Northam Platinum, Ltd. (b) . . . . . | | | 5,342,928 | |
| | 187,800 | | Teck Resources, Ltd. (a) . . . . . . . . | | | 7,365,516 | |
| | 349,900 | | Vale SA—ADR . . . . . . . . . . . . . . . . | | | 10,717,437 | |
| | 196,003 | | Vedanta Resources PLC (b) . . . . . . | | | 7,492,494 | |
| | 118,100 | | Walter Energy, Inc. . . . . . . . . . . . . | | | 9,543,661 | |
| | | | | | | 78,388,625 | |
| Media—2.2% | | | | | | |
| | 92,500 | | Lagardere SCA (b) . . . . . . . . . . . . . | | | 3,730,802 | |
| | 719,419 | | Multiplus SA (a) . . . . . . . . . . . . . . | | | 8,443,059 | |
| | 280,152 | | Regal Entertainment Group— | | | | |
| | | | Class A . . . . . . . . . . . . . . . . . . . . | | | 4,784,996 | |
| | | | | | | 16,958,857 | |
| Pharmaceuticals, Biotechnology & Life | | | | |
| Sciences—4.8% | | | | | | |
| | 254,900 | | Abbott Laboratories . . . . . . . . . . . | | | 13,040,684 | |
| | 271,117 | | Merck & Co., Inc. . . . . . . . . . . . . . . | | | 9,499,940 | |
| | 231,700 | | Teva Pharmaceutical Industries, | | | | |
| | | | Ltd.—ADR . . . . . . . . . . . . . . . . . | | | 13,607,741 | |
| | | | | | | 36,148,365 | |
The accompanying notes are an integral part of these financial statements.
Alpine Dynamic Dividend Fund
Schedule of Portfolio Investments—Continued
April 30, 2010 (Unaudited)
| | | Security | | | |
| Shares | | Description | | Value | |
| Common Stocks—continued | | | |
| Real Estate—0.6% | | | | |
| | 254,300 | | Starwood Property Trust, Inc. . . . | | $ | 4,818,985 | |
| Retailing—2.0% | | | | | | |
| | 172,200 | | Abercrombie & Fitch Co. . . . . . . . | | | 7,530,306 | |
| | 117,600 | | Hennes & Mauritz AB — | | | | |
| | | | Class B (b) . . . . . . . . . . . . . . . . . . | | | 7,503,877 | |
| | | | | | | 15,034,183 | |
| Semiconductors & Semiconductor | | | | |
| Equipment—3.8% | | | | | | |
| | 544,800 | | Applied Materials, Inc. . . . . . . . . . | | | 7,507,344 | |
| | 224,500 | | Intel Corp. . . . . . . . . . . . . . . . . . . . | | | 5,125,335 | |
| | 198,100 | | Linear Technology Corp. . . . . . . . | | | 5,954,886 | |
| | 357,500 | | Microchip Technology, Inc. . . . . . . | | | 10,442,575 | |
| | | | | | | 29,030,140 | |
| Software & Services—1.8% | | | | |
| | 437,400 | | Microsoft Corp. . . . . . . . . . . . . . . . | | | 13,358,196 | |
| Technology Hardware & Equipment—2.3% | | | | |
| | 90,500 | | Hewlett-Packard Co. . . . . . . . . . . . | | | 4,703,285 | |
| | 43,069 | | International Business Machines | | | | |
| | | | Corp. . . . . . . . . . . . . . . . . . . . . . . | | | 5,555,901 | |
| | 174,761 | | QUALCOMM, Inc. . . . . . . . . . . . . . | | | 6,770,241 | |
| | | | | | | 17,029,427 | |
| Telecommunication Services—4.6% | | | | |
| | | | | | | | |
| | 1,141,500 | | Deutsche Telekom AG (b) . . . . . . . | | | 14,862,635 | |
| | 172,436 | | Millicom International Cellular SA . | | | 15,222,650 | |
| | 10,800 | | Swisscom AG (b) . . . . . . . . . . . . . . | | | 3,665,117 | |
| | 69,047 | | Tele Norte Leste Participacoes | | | | |
| | | | SA—ADR . . . . . . . . . . . . . . . . . . | | | 1,026,038 | |
| | | | | | | 34,776,440 | |
| Transportation—1.9% | | | | |
| | 224,000 | | Deutsche Post AG (b) . . . . . . . . . . | | | 3,633,184 | |
| | 1,069,250 | | Julio Simoes Logistica SA (a) . . . . | | | 5,019,462 | |
| | 304,700 | | Navios Maritime Holdings, Inc. . . | | | 2,114,618 | |
| | 152,400 | | Werner Enterprises, Inc. . . . . . . . . | | | 3,416,808 | |
| | | | | | | 14,184,072 | |
| | | Security | | | |
| Shares | | Description | | Value | |
| Common Stocks—continued | | | |
| Utilities—5.1% | | | | | |
| | 393,300 | | E.ON AG (b) . . . . . . . . . . . . . . . . . . | | $ | 14,504,043 | |
| | 194,100 | | GDF Suez (b) . . . . . . . . . . . . . . . . . | | | 6,902,875 | |
| | 311,800 | | ITC Holdings Corp. . . . . . . . . . . . . | | | 17,407,794 | |
| | | | | | | 38,814,712 | |
| | | | Total Common Stocks | | | | |
| | | | (Cost $637,817,091) . . . . . . . . . . | | | 689,025,116 | |
| Convertible Preferred Stocks—0.0%* | | | | |
| Banks—0.0%* | | | | | | |
| | 1,866 | | Popular, Inc., Series D, 0.000% (a) . | | | 61,037 | |
| | | | Total Convertible Preferred Stocks | | | | |
| | | | (Cost $46,650) . . . . . . . . . . . . . . | | | 61,037 | |
| Equity-Linked Structured Notes—0.2% | | | | |
| Technology Hardware & Equipment 0.2% | | | | |
| | 1,223,685 | | Darfon Electronics Corp.— | | | | |
| | | | Macquarie Group, Ltd.— | | | | |
| | | | ADR (a) . . . . . . . . . . . . . . . . . . | | | 1,744,095 | |
| | | | Total Equity-Linked Structured | | | | |
| | | | Notes (Cost $1,790,251) . . . . . . | | | 1,744,095 | |
| Rights—0.0% | | | | | | |
| Food & Staples Retailing—0.0% | | | | |
| | 876 | | Companhia Brasileira de | | | | |
| | | | Distribuicao Grupo Pao de | | | | |
| | | | Acucar (a)(b) . . . . . . . . . . . . . . . | | | 0 | |
| | | | Total Rights (Cost $14,586) . . . . . . | | | 0 | |
| Short-Term Investments—4.3% | | | | |
| | 984 | | Alpine Municipal Money Market | | | | |
| | | | Fund, 0.19% . . . . . . . . . . . . . . . | | | 984 | |
| | 32,868,310 | | Federated Treasury Obligations | | | | |
| | | | Fund, 0.01% . . . . . . . . . . . . . . . | | | 32,868,310 | |
| | | | Total Short-Term Investments | | | | |
| | | | (Cost $32,869,294) . . . . . . . . . . . | | | 32,869,294 | |
| | | | Total Investments | | | | |
| | | | (Cost $672,537,872)—95.6% . . . | | | 723,699,542 | |
| | | | Other Assets in Excess of | | | | |
| | | | Liabilities—4.4% . . . . . . . . . . . . | | | 33,228,072 | |
| | | | TOTAL NET ASSETS—100.0% . . . . | | | | |
| | | | | | $ | 756,927,614 | |
Percentages are stated as a percent of net assets.
*Amount is less than 0.05%.
(a) Non-income producing security.
(b) Security fair valued in accordance with procedures approved by the Board of Trustees. These securities comprised 27.2% of the Fund’s net assets.
AB—Aktiebolag is the Swedish equivalent of the term corporation.
ADR—American Depositary Receipt
A/S—Aktieselskab is the Danish name for a stock-based corporation.
ASA—Allmennaksjeselskap is the Norwegian term for a public limited company.
AG—Aktiengesellschaft is a German term that refers to a corporation that is limited by shares, ie., owned by shareholders.
Co.—Company
Corp.—Corporation
Inc.—Incorporated
LLC—Limited Liability Company
LP—Limited Partnership
Ltd.—Limited
PLC—Public Limited Company
SA—Generally designates corporations in various countries, mostly those employing the civil law.
SCA—Societe en Commandite par actions is the French equivalent of a limited partnership.
SE—SE Regulation. A European Company which can operate on a Europe-wide basis and be governed by Community law directly applicable in all Member States.
The accompanying notes are an integral part of these financial statements.
Alpine Accelerating Dividend Fund
Schedule of Portfolio Investments
April 30, 2010 (Unaudited)
| | | Security | | | |
| Shares | | Description | | Value | |
| Common Stocks—91.2% | | | |
| Aerospace & Defense—1.6% | | | |
| | 500 | | United Technologies Corp. . . . . . . | | $ | 37,475 | |
| Capital Markets—4.0% | | | | |
| | 4,000 | | KKR & Co. Guernsey LP . . . . . . . . | | | 48,720 | |
| | 1,000 | | State Street Corp. . . . . . . . . . . . . . | | | 43,500 | |
| | | | | | | 92,220 | |
| Chemicals—6.7% | | | | | | |
| | 700 | | Air Products & Chemicals, Inc. . . . | | | 53,746 | |
| | 350 | | CF Industries Holdings, Inc. . . . . . | | | 29,284 | |
| | 400 | | Monsanto Co. . . . . . . . . . . . . . . . . | | | 25,224 | |
| | 575 | | Praxair, Inc. . . . . . . . . . . . . . . . . . . | | | 48,168 | |
| | | | | | | 156,422 | |
| Commercial Banks—3.1% | | | | |
| | 5,500 | | Banco Panamericano SA . . . . . . . . | | | 32,748 | |
| | 1,000 | | Banco do Brasil SA . . . . . . . . . . . . | | | 17,247 | |
| | 2,050 | | Sterling Bancorp . . . . . . . . . . . . . . | | | 21,956 | |
| | | | | | | 71,951 | |
| Construction & Engineering—2.6% | | | | |
| | 45,000 | | China State Construction | | | | |
| | | | International Holdings, Ltd. (b) | | | 15,515 | |
| | 800 | | Vinci SA (b) . . . . . . . . . . . . . . . . . . | | | 44,581 | |
| | | | | | | 60,096 | |
| Containers & Packaging—1.8% | | | | |
| | 1,250 | | Sonoco Products Co. . . . . . . . . . . . | | | 41,413 | |
| Diversified Financial Services—9.3% | | | | |
| | 2,850 | | Bank of America Corp. . . . . . . . . . | | | 50,816 | |
| | 8,289 | | Citigroup, Inc. (a) . . . . . . . . . . . . . | | | 36,223 | |
| | 120 | | CME Group, Inc. . . . . . . . . . . . . . . | | | 39,409 | |
| | 1,000 | | JPMorgan Chase & Co. . . . . . . . . . | | | 42,580 | |
| | 1,500 | | NYSE Euronext . . . . . . . . . . . . . . . | | | 48,945 | |
| | | | | | | 217,973 | |
| Diversified Telecommunication Services—1.4% | | | | |
| | 2,750 | | Deutsche Telekom AG—ADR . . . . | | | 32,972 | |
| Electric Utilities—4.6% | | | | |
| | 2,200 | | Companhia Energetica de Minas | | | | |
| | | | Gerais . . . . . . . . . . . . . . . . . . . . . | | | 34,868 | |
| | 400 | | CPFL Energia SA—ADR . . . . . . . . . | | | 24,876 | |
| | 550 | | E.ON AG (b) . . . . . . . . . . . . . . . . . . | | | 20,283 | |
| | 500 | | EDF SA (b) . . . . . . . . . . . . . . . . . . . | | | 26,797 | |
| | | | | | | 106,824 | |
| Energy Equipment & Services—3.9% | | | | |
| | 650 | | Schlumberger, Ltd. . . . . . . . . . . . . | | | 46,423 | |
| | 1,750 | | Seadrill, Ltd. (b) . . . . . . . . . . . . . . . | | | 44,080 | |
| | | | | | | 90,503 | |
| Food & Staples Retailing—2.8% | | | | |
| | 1,250 | | Sysco Corp. . . . . . . . . . . . . . . . . . . | | | 39,425 | |
| | 750 | | Walgreen Co. . . . . . . . . . . . . . . . . | | | 26,363 | |
| | | | | | | 65,788 | |
| Food Products—4.9% | | | | |
| | 1,500 | | Archer-Daniels-Midland Co. . . . . . | | | 41,910 | |
| | 550 | | Campbell Soup Co. . . . . . . . . . . . . | | | 19,723 | |
| | 325 | | General Mills, Inc. . . . . . . . . . . . . . | | | 23,133 | |
| | 500 | | The J.M. Smucker Co. . . . . . . . . . . | | | 30,535 | |
| | | | | | | 115,301 | |
| | | Security | | | |
| Shares | | Description | | Value | |
| Common Stocks—continued | | | |
| Health Care Equipment & Supplies—4.0% | | | |
| | 600 | | Becton, Dickinson & Co. . . . . . . . . | | $ | 45,822 | |
| | 500 | | DENTSPLY International, Inc. . . . . | | | 18,320 | |
| | 1,200 | | Masimo Corp. . . . . . . . . . . . . . . . . | | | 28,092 | |
| | | | | | | 92,234 | |
| Household Durables—1.6% | | | | |
| | 775 | | Snap-On, Inc. . . . . . . . . . . . . . . . . . | | | 37,339 | |
| Household Products—2.5% | | | | |
| | 550 | | Kimberly-Clark Corp. . . . . . . . . . . | | | 33,693 | |
| | 700 | | WD-40 Co. . . . . . . . . . . . . . . . . . . . | | | 24,661 | |
| | | | | | | 58,354 | |
| Industrial Conglomerates—1.7% | | | | |
| | 1,050 | | Tyco International Ltd. . . . . . . . . . | | | 40,730 | |
| IT Services—2.2% | | | | | | |
| | 400 | | International Business Machines | | | | |
| | | | Corp. . . . . . . . . . . . . . . . . . . . . . . | | | 51,600 | |
| Media—2.0% | | | | | | |
| | 2,400 | | Comcast Corp. — Class A. . . . . . | | | 47,376 | |
| Metals & Mining—5.0% | | | | |
| | 950 | | Cliffs Natural Resources, Inc. . . . . | | | 59,403 | |
| | 1,150 | | Vale SA — ADR . . . . . . . . . . . . . . . | | | 35,225 | |
| | 550 | | Vedanta Resources PLC (b) . . . . . . | | | 21,025 | |
| | | | | | | 115,653 | |
| Multi-Utilities—0.3% | | | | |
| | 200 | | GDF Suez (b) . . . . . . . . . . . . . . . . . | | | 7,113 | |
| Oil, Gas & Consumable Fuels—5.1% | | | | |
| | 1,000 | | Chevron Corp. . . . . . . . . . . . . . . . . | | | 81,440 | |
| | 1,400 | | El Paso Pipeline Partners LP. . . . . | | | 37,842 | |
| | | | | | | 119,282 | |
| Pharmaceuticals—1.3% | | | | |
| | 600 | | Abbott Laboratories . . . . . . . . . . . | | | 30,696 | |
| Road & Rail—3.3% | | | | |
| | 500 | | Norfolk Southern Corp. . . . . . . . . | | | 29,665 | |
| | 5,500 | | Tegma Gestao Logistica SA. . . . . | | | 47,145 | |
| | | | | | | 76,810 | |
| Semiconductors & Semiconductor | | | | |
| Equipment—5.8% | | | | | | |
| | 2,250 | | Applied Materials, Inc. . . . . . . . . . | | | 31,005 | |
| | 2,250 | | Intel Corp. . . . . . . . . . . . . . . . . . . . | | | 51,367 | |
| | 1,800 | | Linear Technology Corp. . . . . . . . | | | 54,108 | |
| | | | | | | 136,480 | |
| Software—1.6% | | | | | | |
| | 1,250 | | Microsoft Corp. . . . . . . . . . . . . . . . | | | 38,175 | |
| Specialty Retail—2.0% | | | | |
| | 1,000 | | Guess?, Inc. . . . . . . . . . . . . . . . . . . | | | 45,870 | |
| Thrifts & Mortgage Finance—1.9% | | | | |
| | 3,950 | | Brookline Bancorp, Inc. . . . . . . . . | | | 43,410 | |
| Transportation Infrastructure—1.2% | | | | |
| | 1,200 | | Companhia de Concessoes | | | | |
| | | | Rodoviarias . . . . . . . . . . . . . . . . | | | 27,614 | |
The accompanying notes are an integral part of these financial statements.
Alpine Accelerating Dividend Fund & #160; April 30, 2010 (Unaudited)
| | | Security | | | |
| Shares | | Description | | Value | |
| Common Stocks—continued | | | |
| Water Utilities—3.0% | | | |
| | 1,950 | | Aqua America, Inc. . . . . . . . . . . . . | | $ | 35,743 | |
| | 5,240 | | Cascal NV . . . . . . . . . . . . . . . . . . . . | | | 35,318 | |
| | | | | | | 71,061 | |
| | | | Total Common Stocks | | | | |
| | | | (Cost $1,906,905) . . . . . . . . . . . . | | | 2,128,735 | |
| | | Security | | | |
| Shares | | Description | | Value | |
| Short-Term Investments—7.7% | | | |
| | 179,895 | | Federated Treasury Obligations | | | |
| | | | Fund, 0.01% . . . . . . . . . . . . . . . | | $ | 179,895 | |
| | | | Total Short-Term Investments | | | | |
| | | | (Cost $179,895) . . . . . . . . . . . . . | | | 179,895 | |
| | | | Total Investments | | | | |
| | | | (Cost $2,086,800)—98.9% . . . . . | | | 2,308,630 | |
| | | | Other Assets in Excess of | | | | |
| | | | Liabilities—1.1% . . . . . . . . . . . . | | | 26,370 | |
| | | | TOTAL NET ASSETS—100.0% . . . . | | $ | 2,335,000 | |
| | | | | | | | |
Percentages are stated as a percent of net assets.
(a) Non-income producing security.
(b) Security fair valued in accordance with procedures approved by the Board of Trustees. These securities comprised 7.9% of the Fund’s net assets.
ADR—American Depositary Receipts
AG—Aktiengesellschaft is a German term that refers to a corporation that is limited by shares, i.e., owned by shareholders.
Co.—Company
Corp.—Corporation
Inc.—Incorporated
LP—Limited Partnership
Ltd.—Limited
NV—Naamloze Vennootschap is the Dutch term for a public limited liability corporation.
PLC—Public Limited Company
SA—Generally designates corporations in various countries, mostly those employing the civil law.
The accompanying notes are an integral part of these financial statements.
Alpine Dynamic Financial Services Fund ![]()
Schedule of Portfolio Investments
April 30, 2010 (Unaudited)
| | | Security | | | |
| Shares | | Description | | Value | |
| Common Stocks—99.8% | | | |
| Capital Markets—17.4% | | | |
| | 30,850 | | BGC Partners, Inc. . . . . . . . . . . . . . | | $ | 201,142 | |
| | 20,000 | | Blackstone Group LP . . . . . . . . . . . | | | 279,600 | |
| | 43,033 | | Cowen Group, Inc. (a) . . . . . . . . . . | | | 232,378 | |
| | 18,500 | | GFI Group, Inc. . . . . . . . . . . . . . . . | | | 127,650 | |
| | 2,000 | | Investment Technology Group, | | | | |
| | | | Inc. (a) . . . . . . . . . . . . . . . . . . . . | | | 34,740 | |
| | 13,000 | | JMP Group, Inc. . . . . . . . . . . . . . . . | | | 100,620 | |
| | 1,000 | | Legg Mason, Inc. . . . . . . . . . . . . . . | | | 31,690 | |
| | 25,100 | | MF Global Ltd. (a) . . . . . . . . . . . . . | | | 231,422 | |
| | 2,000 | | Och-Ziff Capital Management | | | | |
| | | | Group LLC . . . . . . . . . . . . . . . . . | | | 35,040 | |
| | 7,500 | | OptionsXpress Holdings, Inc. (a) . | | | 133,125 | |
| | 1,200 | | Piper Jaffray Companies (a) . . . . . | | | 47,232 | |
| | 39,952 | | Sanders Morris Harris Group, Inc. . | | | 238,513 | |
| | 6,900 | | Thomas Weisel Partners Group, | | | | |
| | | | Inc. (a) . . . . . . . . . . . . . . . . . . . . | | | 54,165 | |
| | 4,000 | | TradeStation Group, Inc. (a) . . . . . | | | 33,440 | |
| | | | | | | 1,780,757 | |
| Commercial Banks—48.1% | | | | |
| | 45,165 | | 1st United Bancorp, Inc. (a) . . . . . | | | 404,227 | |
| | 3,000 | | American River Bankshares . . . . . | | | 25,830 | |
| | 8,000 | | Banco do Estado do Rio Grande | | | | |
| | | | do Sul SA . . . . . . . . . . . . . . . . . . | | | 61,579 | |
| | 53,940 | | Bank of Commerce Holdings . . . . | | | 278,870 | |
| | 22,400 | | Bank of Florida Corp. (a) . . . . . . . | | | 23,744 | |
| | 55,712 | | Bank of Virginia (a) . . . . . . . . . . . | | | 268,532 | |
| | 13,428 | | Barclays PLC (b) . . . . . . . . . . . . . . . | | | 68,977 | |
| | 15,000 | | California United Bank (a) . . . . . . | | | 185,250 | |
| | 4,000 | | Cardinal Financial Corp. . . . . . . . . | | | 43,800 | |
| | 23,800 | | Centerstate Banks, Inc. . . . . . . . . . | | | 286,314 | |
| | 27,837 | | Citizens First Corp. (a) . . . . . . . . . . | | | 212,675 | |
| | 9,000 | | Columbia Banking System, Inc. . . | | | 202,320 | |
| | 4,700 | | Community National Bank of the | | | | |
| | | | Lakeway Area (a) . . . . . . . . . . . | | | 16,450 | |
| | 73,000 | | Emirates NBD PJSC (b) . . . . . . . . . | | | 59,058 | |
| | 25,000 | | First Bancorp of Puerto Rico . . . . | | | 53,000 | |
| | 4,000 | | First Business Financial Services, | | | | |
| | | | Inc. . . . . . . . . . . . . . . . . . . . . . . . | | | 40,000 | |
| | 80,000 | | First California Financial Group, | | | | |
| | | | Inc. (a) . . . . . . . . . . . . . . . . . . . . | | | 264,000 | |
| | 1,260 | | First Community Bank Corp. of | | | | |
| | | | America (a) . . . . . . . . . . . . . . . . | | | 3,276 | |
| | 1,500 | | Hampton Roads Bankshares, Inc. . | | | 4,335 | |
| | 37,000 | | National Bank of Greece | | | | |
| | | | SA—ADR . . . . . . . . . . . . . . . . . . | | | 120,620 | |
| | 10,200 | | New Centry Bancorp, Inc. (a) . . . . | | | 61,506 | |
| | 2,000 | | North Valley Bancorp (a) . . . . . . . | | | 5,300 | |
| | 2,375 | | Old Point Financial Corp. . . . . . . . | | | 34,461 | |
| | 4,000 | | Oriental Financial Group, Inc. . . . | | | 66,880 | |
| | 12,500 | | Orrstown Financial Services, Inc. . | | | 319,750 | |
| | 12,042 | | Pacific Mercantile Bancorp (a) . . . | | | 60,090 | |
| | 18,276 | | Pacific Premier Bancorp, Inc. (a) . | | | 90,649 | |
| | 3,120 | | Rurban Financial Corp. . . . . . . . . . | | | 22,230 | |
| | 127,600 | | Seacoast Banking Corp. of | | | | |
| | | | Florida (a) . . . . . . . . . . . . . . . . . | | | 278,168 | |
| | 2,388 | | The South Financial Group, Inc. . . | | | 1,839 | |
| | 38,750 | | Southern National Bancorp of | | | | |
| | | | Virginia, Inc. (a) . . . . . . . . . . . . . | | | 315,813 | |
| | 5,000 | | State Bancorp, Inc. . . . . . . . . . . . . | | | 49,500 | |
| | | Security | | | |
| Shares | | Description | | Value | |
| Common Stocks—continued | | | |
| Commercial Banks—continued | | | |
| | 2,500 | | Sterling Bancorp . . . . . . . . . . . . . . | | $ | 26,775 | |
| | 33,293 | | Sterling Bancshares, Inc. . . . . . . . . | | | 195,763 | |
| | 6,000 | | Summit State Bank . . . . . . . . . . . . | | | 40,800 | |
| | 500 | | Superior Bancorp (a) . . . . . . . . . . . | | | 1,770 | |
| | 152,347 | | Synovus Financial Corp. . . . . . . . . | | | 458,564 | |
| | 15,000 | | Tidelands Bancshares, Inc. (a) . . . | | | 33,750 | |
| | 34,300 | | United Community Banks, Inc. (a) . | | | 200,312 | |
| | 2,430 | | Valley Commerce Bancorp (a) . . . | | | 15,673 | |
| | 1,974 | | Yadkin Valley Financial Corp. . . . . | | | 9,041 | |
| | | | | | | 4,911,491 | |
| Diversified Financial Services—14.4% | | | | |
| | 7,124 | | BM&F Bovespa SA . . . . . . . . . . . . . | | | 46,926 | |
| | 125,000 | | Bolsa Mexicana de Valores SA | | | | |
| | | | de CV . . . . . . . . . . . . . . . . . . . . . | | | 212,187 | |
| | 27,693 | | Citigroup, Inc. (a) . . . . . . . . . . . . . | | | 121,018 | |
| | 665 | | CME Group, Inc. . . . . . . . . . . . . . . | | | 218,393 | |
| | 5,173 | | Interactive Brokers Group, Inc. (a) . | | | 88,665 | |
| | 4,315 | | IntercontinentalExchange, Inc. (a) . | | | 503,259 | |
| | 7,000 | | The NASDAQ OMX Group, Inc. (a) . | | | 147,000 | |
| | 4,000 | | NYSE Euronext . . . . . . . . . . . . . . . | | | 130,520 | |
| | | | | | | 1,467,968 | |
| Industrial Conglomerates—1.3% | | | | |
| | 7,000 | | General Electric Co. . . . . . . . . . . . | | | 132,020 | |
| Insurance—1.1% | | | | | | |
| | 8,000 | | CRM Holdings, Ltd. (a) . . . . . . . . . | | | 4,161 | |
| | 4,700 | | Tower Group, Inc. . . . . . . . . . . . . . | | | 108,382 | |
| | | | | | | 112,543 | |
| Real Estate Investment Trusts—4.4% | | | | |
| | 4,400 | | Chatham Lodging Trust (a) . . . . . | | | 87,340 | |
| | 17,000 | | Invesco Mortgage Capital, Inc. . . | | | 351,050 | |
| | | | | | | 438,390 | |
| Thrifts & Mortgage Finance—11.4% | | | | |
| | 30,398 | | Alliance Bancorp, Inc. of | | | | |
| | | | Pennsylvania . . . . . . . . . . . . . . . | | | 253,216 | |
| | 1,700 | | Astoria Financial Corp. . . . . . . . . . | | | 27,438 | |
| | 5,000 | | Central Federal Corp. (a) . . . . . . . | | | 8,000 | |
| | 2,144 | | Fidelity Bancorp, Inc. . . . . . . . . . . | | | 18,749 | |
| | 5,895 | | First Pactrust Bancorp, Inc. . . . . . . | | | 50,402 | |
| | 400,000 | | Flagstar Bancorp, Inc. (a) . . . . . . . | | | 254,000 | |
| | 1,100 | | Parkvale Financial Corp. . . . . . . . . | | | 11,077 | |
| | 50,000 | | Provident Financial Holdings, Inc. . | | | 300,000 | |
| | 130,000 | | United Western Bancorp, Inc. . . . | | | 237,900 | |
| | | | | | | 1,160,782 | |
| Transportation Infrastructure—1.7% | | | | |
| | 13,000 | | CAI International, Inc. (a) . . . . . . . | | | 176,930 | |
| | | | Total Common Stocks | | | | |
| | | | (Cost $12,867,992) . . . . . . . . . . . | | | 10,180,881 | |
| Convertible Preferred Stocks—0.0%* | | | | |
| Commercial Banks—0.0%* | | | | |
| | 70 | | Popular, Inc., Series D, 0.000% (a) . | | | 2,290 | |
| | | | Total Convertible Preferred Stocks | | | | |
| | | | (Cost $1,750) . . . . . . . . . . . . . . . | | | 2,290 | |
The accompanying notes are an integral part of these financial statements.
Alpine Dynamic Financial Services Fund ![]()
April 30, 2010 (Unaudited)
| Shares/ | | Security | | | |
| Par Value | | Description | | Value | |
| Investment Companies—1.2% | | | |
| | 1,950 | | Direxion Daily Financial Bear | | | |
| | | | 3X Shares (a) . . . . . . . . . . . . . . . | | $ | 23,888 | |
| | 4,000 | | Direxion Daily Large Cap Bear | | | | |
| | | | 3X Shares (a) . . . . . . . . . . . . . . . | | | 52,240 | |
| | 2,500 | | ProShares UltraShort | | | | |
| | | | Financials (a) . . . . . . . . . . . . . . . | | | 45,450 | |
| | | | Total Investment Companies | | | | |
| | | | (Cost $331,194) . . . . . . . . . . . . . | | | 121,578 | |
| Rights—0.1% | | | | | | |
| Commercial Banks—0.1% | | | | |
| | 67,200 | | Bank of Florida (b) . . . . . . . . . . . . | | | 14,112 | |
| | | | Total Rights (Cost $0) . . . . . . . . . . | | | 14,112 | |
| Shares/ | | Security | | | |
| Par Value | | Description | | Value | |
| Short-Term Investments—0.1% | | | |
| | 13,068 | | Federated Treasury Obligations | | | |
| | | | Fund, 0.01% . . . . . . . . . . . . . . . | | $ | 13,068 | |
| | | | Total Short-Term Investments | | | | |
| | | | (Cost $13,068) . . . . . . . . . . . . . . | | | 13,068 | |
| | | | Total Investments | | | | |
| | | | (Cost $13,214,004)—101.2% . . . | | | 10,331,929 | |
| | | | Liabilities in Excess of Other | | | | |
| | | | Assets—(1.2)% . . . . . . . . . . . . . . | | | (123,901 | ) |
| | | | TOTAL NET ASSETS—100.0% . . . . | | $ | 10,208,028 | |
| | | | | | | | |
Percentages are stated as a percent of net assets.
*Amount is less than 0.05%.
(a) Non-income producing security.
(b) Security fair valued in accordance with procedures approved by the Board of Trustees. These securities comprised 1.4% of the Fund’s net assets.
ADR—American Depositary Receipt
Co.—Company
Corp.—Corporation
Inc.—Incorporated
LLC—Limited Liability Company
LP—Limited Partnership
Ltd.—Limited
NBD—National Bank of Dubai
PJSC—Public Joint Stock Company
PLC—Public Limited Company
SA—Generally designates corporations in various countries, mostly those employing the civil law.
SA de CV—Sociedad Anonima de Capital Variable. It is the Spanish equivalent to Variable Capital Company.
The accompanying notes are an integral part of these financial statements.
Alpine Dynamic Innovators Fund
Schedule of Portfolio Investments
April 30, 2010 (Unaudited)
| | | Security | | | |
| Shares | | Description | | Value | |
| Common Stocks—104.6% | | | |
| Aerospace & Defense—2.1% | | | |
| | 4,000 | | Aerovironment, Inc. (a) . . . . . . . . | | $ | 104,720 | |
| | 10,000 | | Hexcel Corp. (a) . . . . . . . . . . . . . . . | | | 162,000 | |
| | | | | | | 266,720 | |
| Auto Components—5.0% | | | | |
| | 32,857 | | Westport Innovations, Inc. (a) . . . | | | 627,511 | |
| Chemicals—4.2% | | | | | | |
| | 7,000 | | Air Products & Chemicals, Inc. . . . | | | 537,460 | |
| Commercial Banks—2.6% | | | | |
| | 11,000 | | SunTrust Banks, Inc. . . . . . . . . . . . | | | 325,600 | |
| Communications Equipment—2.2% | | | | |
| | 8,000 | | DG FastChannel, Inc. (a) . . . . . . . . | | | 281,440 | |
| Computers & Peripherals—5.6% | | | | |
| | 5,000 | | Hewlett-Packard Co. . . . . . . . . . . . | | | 259,850 | |
| | 15,000 | | Stratasys, Inc. (a) . . . . . . . . . . . . . . | | | 357,600 | |
| | 3,000 | | Synaptics, Inc. (a) . . . . . . . . . . . . . | | | 91,860 | |
| | | | | | | 709,310 | |
| Diversified Financial Services—5.5% | | | | |
| | 800 | | CME Group, Inc. . . . . . . . . . . . . . . | | | 262,728 | |
| | 6,500 | | Portfolio Recovery Associates, | | | | |
| | | | Inc. (a) . . . . . . . . . . . . . . . . . . . . | | | 432,055 | |
| | | | | | | 694,783 | |
| Diversified Telecommunication Services—1.0% | | | | |
| | 2,500 | | AboveNet, Inc. (a) . . . . . . . . . . . . . | | | 126,350 | |
| Electrical Equipment—7.0% | | | | |
| | 35,000 | | LSI Industries, Inc. . . . . . . . . . . . . . | | | 246,050 | |
| | 57,000 | | PowerSecure International, | | | | |
| | | | Inc. (a) . . . . . . . . . . . . . . . . . . . . | | | 641,820 | |
| | | | | | | 887,870 | |
| Electronic Equipment, Instruments & | | | | |
| Components—13.9% | | | | |
| | 21,000 | | FLIR Systems, Inc. (a) . . . . . . . . . . . | | | 642,390 | |
| | 13,000 | | Itron, Inc. (a) . . . . . . . . . . . . . . . . . | | | 1,034,930 | |
| | 6,975 | | MOCON, Inc. . . . . . . . . . . . . . . . . . | | | 77,911 | |
| | | | | | | 1,755,231 | |
| Health Care Equipment & Supplies—11.8% | | | | |
| | 10,000 | | ABIOMED, Inc. (a) . . . . . . . . . . . . . | | | 96,400 | |
| | 4,000 | | Alcon, Inc. . . . . . . . . . . . . . . . . . . . | | | 623,440 | |
| | 10,000 | | Alphatec Holdings, Inc. (a) . . . . . . | | | 66,800 | |
| | 1,400 | | Intuitive Surgical, Inc. (a) . . . . . . . | | | 504,784 | |
| | 5,000 | | Inverness Medical Innovations, | | | | |
| | | | Inc. (a) . . . . . . . . . . . . . . . . . . . . | | | 198,900 | |
| | | | | | | 1,490,324 | |
| Health Care Providers & Services—9.3% | | | | |
| | 3,000 | | HMS Holdings Corp. (a) . . . . . . . . | | | 160,500 | |
| | 20,000 | | inVentiv Health, Inc. (a) . . . . . . . . | | | 460,600 | |
| | 8,000 | | MEDNAX, Inc. (a) . . . . . . . . . . . . . | | | 439,520 | |
| | 4,226 | | RehabCare Group, Inc. (a) . . . . . . | | | 120,525 | |
| | | | | | | 1,181,145 | |
| Health Care Technology—0.8% | | | | |
| | 5,000 | | Allscripts-Misys Healthcare | | | | |
| | | | Solutions, Inc. (a) . . . . . . . . . . . . | | | 100,850 | |
| Internet & Catalog Retail—8.3% | | | | |
| | 4,000 | | Priceline.com, Inc. (a) . . . . . . . . . . | | | 1,048,200 | |
| | | Security | | | |
| Shares | | Description | | Value | |
| Common Stocks—continued | | | |
| Internet Software & Services—2.9% | | | |
| | 700 | | Google, Inc. (a) . . . . . . . . . . . . . . . | | $ | 367,808 | |
| Life Sciences Tools & Services—6.7% | | | | |
| | 1,000 | | Bio-Rad Laboratories, Inc. (a) . . . . | | | 111,690 | |
| | 4,000 | | Charles River Laboratories | | | | |
| | | | International, Inc. (a) . . . . . . . . | | | 133,920 | |
| | 11,000 | | Life Technologies Corp. (a) . . . . . . | | | 601,810 | |
| | | | | | | 847,420 | |
| Machinery—6.3% | | | | | | |
| | 4,000 | | Flowserve Corp. . . . . . . . . . . . . . . | | | 458,320 | |
| | 1,500 | | ISE, Ltd. (a) . . . . . . . . . . . . . . . . . . | | | 4,519 | |
| | 5,391 | | Middleby Corp. (a) . . . . . . . . . . . . | | | 329,498 | |
| | | | | | | 792,337 | |
| Metals & Mining—0.7% | | | | |
| | 125,000 | | Imdex, Ltd. (a)(b) . . . . . . . . . . . . . | | | 90,064 | |
| Pharmaceuticals—0.6% | | | | |
| | 20,000 | | Penwest Pharmaceuticals Co. (a) . | | | 70,200 | |
| Semiconductors & Semiconductor | | | | |
| Equipment—1.0% | | | | | | |
| | 3,000 | | Veeco Instruments, Inc. (a) . . . . . . | | | 131,970 | |
| Software—7.1% | | | | | | |
| | 16,400 | | ANSYS, Inc. (a) . . . . . . . . . . . . . . . . | | | 738,000 | |
| | 2,000 | | Quality Systems, Inc. . . . . . . . . . . . | | | 128,020 | |
| | 8,000 | | Scientific Learning Corp. (a) . . . . . | | | 40,480 | |
| | | | | | | 906,500 | |
| | | | Total Common Stocks | | | | |
| | | | (Cost $12,343,224) . . . . . . . . . . . | | | 13,239,093 | |
| Short-Term Investments—0.0%* | | | | |
| | 923 | | Federated Treasury Obligations | | | | |
| | | | Fund, 0.01% . . . . . . . . . . . . . . . | | | 923 | |
| | | | Total Short-Term Investments | | | | |
| | | | (Cost $923) . . . . . . . . . . . . . . . . . | | | 923 | |
| | | | Total Investments | | | | |
| | | | (Cost $12,344,147)—104.6% . . . | | | 13,240,016 | |
| | | | Liabilities in Excess of Other | | | | |
| | | | Assets—(4.6)% . . . . . . . . . . . . . . | | | (583,742 | ) |
| | | | TOTAL NET ASSETS—100.0% . . . . | | $ | 12,656,274 | |
| | | | | | | | |
Percentages are stated as a percent of net assets.
*Amount is less than 0.05%.
(a) Non-income producing security.
(b) Security fair valued in accordance with procedures approved by the Board of Trustees. These securities comprised 0.7% of the Fund’s net assets.
Co.—Company
Inc.—Incorporated
Ltd.—Limited
The accompanying notes are an integral part of these financial statements.
Alpine Dynamic Transformations Fund 
Schedule of Portfolio Investments April 30, 2010 (Unaudited)
| | | Security | | | |
| Shares | | Description | | Value | |
| Common Stocks—103.6% | | | |
| Aerospace & Defense—3.0% | | | |
| | 1,500 | | Aerovironment, Inc. (a) . . . . . . . . | | $ | 39,270 | |
| | 4,000 | | BE Aerospace, Inc. (a) . . . . . . . . . . | | | 118,840 | |
| | | | | | | 158,110 | |
| Air Freight & Logistics—3.2% | | | | |
| | 3,100 | | Atlas Air Worldwide Holdings, | | | | |
| | | | Inc. (a) . . . . . . . . . . . . . . . . . . . . | | | 171,337 | |
| Auto Components—10.6% | | | | |
| | 6,000 | | Autoliv, Inc. (a) . . . . . . . . . . . . . . . | | | 328,500 | |
| | 19 | | Continental AG (a)(b) . . . . . . . . . . | | | 1,072 | |
| | 4,063 | | Tenneco, Inc. (a) . . . . . . . . . . . . . . | | | 104,704 | |
| | 6,897 | | Westport Innovations, Inc. (a) . . . | | | 131,043 | |
| | | | | | | 565,319 | |
| Chemicals—0.4% | | | | |
| | 10,000 | | Flotek Industries, Inc. (a) . . . . . . . | | | 20,300 | |
| Commercial Banks—2.5% | | | | |
| | 1,000 | | PNC Financial Services Group, Inc. . | | | 67,210 | |
| | 1,991 | | Wells Fargo & Co. . . . . . . . . . . . . . | | | 65,922 | |
| | | | | | | 133,132 | |
| Commercial Services & Supplies—4.0% | | | | |
| | 2,700 | | Clean Harbors, Inc. (a) . . . . . . . . . | | | 171,261 | |
| | 6,000 | | EnergySolutions, Inc. . . . . . . . . . . | | | 43,500 | |
| | | | | | | 214,761 | |
| Computers & Peripherals—5.1% | | | | |
| | 3,000 | | Hewlett-Packard Co. . . . . . . . . . . . | | | 155,910 | |
| | 5,000 | | Stratasys, Inc. (a) . . . . . . . . . . . . . . | | | 119,200 | |
| | | | | | | 275,110 | |
| Diversified Financial Services—7.0% | | | | |
| | 10,000 | | Bank of America Corp. . . . . . . . . . | | | 178,300 | |
| | 600 | | CME Group, Inc. . . . . . . . . . . . . . . | | | 197,046 | |
| | | | | | | 375,346 | |
| Electronic Equipment, Instruments & | | | | |
| Components—2.8% | | | | |
| | 4,940 | | FLIR Systems, Inc. (a) . . . . . . . . . . . | | | 151,115 | |
| Health Care Equipment & Supplies—15.8% | | | | |
| | 5,000 | | ABIOMED, Inc. (a) . . . . . . . . . . . . . | | | 48,200 | |
| | 1,500 | | Edwards Lifesciences Corp. (a) . . . | | | 154,620 | |
| | 50,000 | | HearUSA, Inc. (a) . . . . . . . . . . . . . . | | | 65,500 | |
| | 1,000 | | Intuitive Surgical, Inc. (a) . . . . . . . | | | 360,560 | |
| | 3,500 | | Teleflex, Inc. . . . . . . . . . . . . . . . . . | | | 214,620 | |
| | | | | | | 843,500 | |
| Health Care Providers & Services—7.5% | | | | |
| | 3,305 | | Emergency Medical Services | | | | |
| | | | Corp. (a) . . . . . . . . . . . . . . . . . . . | | | 174,768 | |
| | 8,000 | | RehabCare Group, Inc. (a) . . . . . . | | | 228,160 | |
| | | | | | | 402,928 | |
| | | Security | | | |
| Shares | | Description | | Value | |
| Common Stocks—continued | | | |
| Hotels, Restaurants & Leisure—2.4% | | | |
| | 5,000 | | Starbucks Corp. . . . . . . . . . . . . . . . | | $ | 129,900 | |
| Household Durables—4.7% | | | | |
| | 3,000 | | Pulte Group, Inc. (a) . . . . . . . . . . . | | | 39,270 | |
| | 3,000 | | Ryland Group, Inc. . . . . . . . . . . . . | | | 68,340 | |
| | 3,000 | | Snap-On, Inc. . . . . . . . . . . . . . . . . . | | | 144,540 | |
| | | | | | | 252,150 | |
| Industrial Conglomerates—3.6% | | | | |
| | 10,300 | | General Electric Co. . . . . . . . . . . . | | | 194,258 | |
| Internet & Catalog Retail—7.3% | | | | |
| | 1,500 | | Priceline.com, Inc. (a) . . . . . . . . . . | | | 393,075 | |
| Internet Software & Services—2.0% | | | | |
| | 200 | | Google, Inc. (a) . . . . . . . . . . . . . . . | | | 105,088 | |
| Machinery—9.2% | | | | |
| | 3,000 | | Cummins, Inc. . . . . . . . . . . . . . . . . | | | 216,690 | |
| | 7,000 | | Pall Corp. . . . . . . . . . . . . . . . . . . . . | | | 272,930 | |
| | | | | | | 489,620 | |
| Oil, Gas & Consumable Fuels—6.2% | | | | |
| | 2,000 | | CONSOL Energy, Inc. . . . . . . . . . . . | | | 89,360 | |
| | 3,000 | | Walter Energy, Inc. . . . . . . . . . . . . | | | 242,430 | |
| | | | | | | 331,790 | |
| Pharmaceuticals—0.3% | | | | |
| | 554 | | Warner Chilcott PLC (a) . . . . . . . . | | | 15,712 | |
| Real Estate Investment Trusts—0.4% | | | | |
| | 1,095 | | Walter Investment Management | | | | |
| | | | Corp. . . . . . . . . . . . . . . . . . . . . . . | | | 19,852 | |
| Semiconductors & Semiconductor Equipment—1.1% | | | | |
| | 20,000 | | Conexant Systems, Inc. (a) . . . . . . | | | 61,000 | |
| Specialty Retail—4.5% | | | | |
| | 25,000 | | Build-A-Bear Workshop, Inc. (a) | | | 239,000 | |
| | | | Total Common Stocks | | | | |
| | | | (Cost $4,412,383) . . . . . . . . . . . . | | | 5,542,403 | |
| Short-Term Investments—0.0%* | | | | |
| | 427 | | Federated Treasury Obligations | | | | |
| | | | Fund, 0.01% . . . . . . . . . . . . . . . | | | 427 | |
| | | | Total Short-Term Investments | | | | |
| | | | (Cost $427) . . . . . . . . . . . . . . . . . | | | 427 | |
| | | | Total Investments | | | | |
| | | | (Cost $4,412,810)—103.6% . . . . | | | 5,542,830 | |
| | | | Liabilities in Excess of Other | | | | |
| | | | Assets—(3.6)% . . . . . . . . . . . . . . | | | (191,162 | ) |
| | | | TOTAL NET ASSETS—100.0% . . . . | | $ | 5,351,668 | |
| | | | | | | | |
Percentages are stated as a percent of net assets.
*Amount is less than 0.05%.
(a) Non-income producing security.
(b) Security fair valued in accordance with procedures approved by the Board of Trustees. These securities comprised less than 0.05% of the Fund’s net assets.
AG—Aktiengesellschaft is a German term that refers to a corporation that is limited by shares, i.e., owned by shareholders.
Co.—Company
Corp.—Corporation
Inc.—Incorporated
PLC—Public Limited Company
The accompanying notes are an integral part of these financial statements.
Alpine Dynamic Balance Fund ; Schedule of Portfolio InvestmentsApril 30, 2010 (Unaudited)
| | | Security | | | |
| Shares | | Description | | Value | |
| Common Stocks—70.7% | | | |
| Aerospace & Defense—1.1% | | | |
| | 15,000 | | Honeywell International, Inc. . . . | | $ | 712,050 | |
| Auto Components—2.6% | | | | |
| | 30,500 | | Autoliv, Inc. (a) . . . . . . . . . . . . . . . | | | 1,669,875 | |
| Capital Markets—1.8% | | | | |
| | 25,900 | | State Street Corp. . . . . . . . . . . . . . | | | 1,126,650 | |
| Chemicals—1.9% | | | | |
| | 3,200 | | Air Products & Chemicals, Inc. . . . | | | 245,696 | |
| | 1,000 | | Lubrizol Corp. . . . . . . . . . . . . . . . . | | | 90,340 | |
| | 5,000 | | PPG Industries, Inc. . . . . . . . . . . . . | | | 351,850 | |
| | 25,000 | | RPM International, Inc. . . . . . . . . . | | | 552,000 | |
| | | | | | | 1,239,886 | |
| Commercial Banks—5.9% | | | | |
| | 18,000 | | Bancorp Rhode Island, Inc. . . . . . . | | | 516,060 | |
| | 3,846 | | IBERIABANK Corp. . . . . . . . . . . . . | | | 237,067 | |
| | 10,000 | | Pacific Continental Corp. . . . . . . . | | | 115,900 | |
| | 5,000 | | PNC Financial Services Group, Inc. . | | | 336,050 | |
| | 12,000 | | Regions Financial Corp. . . . . . . . . | | | 106,080 | |
| | 7,495 | | Southside Bancshares, Inc. . . . . . . | | | 161,742 | |
| | 2,293 | | Susquehanna Bancshares, Inc. . . . | | | 24,994 | |
| | 30,000 | | Valley National Bancorp . . . . . . . . | | | 487,200 | |
| | 69,501 | | Webster Financial Corp. . . . . . . . . | | | 1,440,061 | |
| | 10,432 | | Wells Fargo & Co. . . . . . . . . . . . . . | | | 345,404 | |
| | | | | | | 3,770,558 | |
| Commercial Services & Supplies—1.1% | | | | |
| | 27,500 | | McGrath RentCorp . . . . . . . . . . . . | | | 714,725 | |
| Construction Materials—1.2% | | | | |
| | 24,199 | | Eagle Materials, Inc. . . . . . . . . . . . | | | 771,222 | |
| Consumer Finance—0.3% | | | | |
| | 5,800 | | The Student Loan Corp. . . . . . . . . | | | 163,792 | |
| Diversified Financial Services—7.2% | | | | |
| | 63,041 | | Bank of America Corp. . . . . . . . . . | | | 1,124,021 | |
| | 143,670 | | Citigroup, Inc. (a) . . . . . . . . . . . . . | | | 627,838 | |
| | 2,600 | | CME Group, Inc. . . . . . . . . . . . . . . | | | 853,866 | |
| | 45,600 | | JPMorgan Chase & Co. . . . . . . . . . | | | 1,941,648 | |
| | 10,406 | | Medallion Financial Corp. . . . . . . | | | 83,248 | |
| | | | | | | 4,630,621 | |
| Electric Utilities—2.1% | | | | |
| | 51,000 | | Allegheny Energy, Inc. . . . . . . . . . | | | 1,110,780 | |
| | 6,900 | | American Electric Power Co., Inc. . | | | 236,670 | |
| | | | | | | 1,347,450 | |
| Electrical Equipment—2.5% | | | | |
| | 25,000 | | AMETEK, Inc. . . . . . . . . . . . . . . . . . | | | 1,081,250 | |
| | 10,700 | | Emerson Electric Co. . . . . . . . . . . . | | | 558,861 | |
| | | | | | | 1,640,111 | |
| Food & Staples Retailing—3.3% | | | | |
| | 200 | | Arden Group, Inc. . . . . . . . . . . . . . | | | 20,300 | |
| | 20,000 | | CVS Caremark Corp. . . . . . . . . . . . | | | 738,600 | |
| | 20,000 | | Sysco Corp. . . . . . . . . . . . . . . . . . . | | | 630,800 | |
| | 20,000 | | Walgreen Co. . . . . . . . . . . . . . . . . | | | 703,000 | |
| | | | | | | 2,092,700 | |
| Food Products—1.0% | | | | |
| | 12,000 | | Kellogg Co. . . . . . . . . . . . . . . . . . . | | | 659,280 | |
| | | Security | | | |
| Shares | | Description | | Value | |
| Common Stocks—continued | | | |
| Health Care Equipment & Supplies—2.4% | | | |
| | 8,600 | | Becton, Dickinson & Co. . . . . . . . . | | $ | 656,782 | |
| | 15,000 | | Teleflex, Inc. . . . . . . . . . . . . . . . . . | | | 919,800 | |
| | | | | | | 1,576,582 | |
| Health Care Providers & Services—1.1% | | | | |
| | 13,000 | | MEDNAX, Inc. (a) . . . . . . . . . . . . . | | | 714,220 | |
| Hotels, Restaurants & Leisure—0.7% | | | | |
| | 10,000 | | Darden Restaurants, Inc. . . . . . . . | | | 447,500 | |
| Household Durables—2.0% | | | | |
| | 20,000 | | Hovnanian Enterprises, Inc.— | | | | |
| | | | Class A (a) . . . . . . . . . . . . . . . . . | | | 142,200 | |
| | 28,000 | | Lennar Corp.—Class A . . . . . . . . . | | | 557,200 | |
| | 30,000 | | Pulte Homes, Inc. (a) . . . . . . . . . . . | | | 392,700 | |
| | 32,000 | | Standard Pacific Corp. (a) . . . . . . . | | | 205,120 | |
| | | | | | | 1,297,220 | |
| Household Products—0.9% | | | | |
| | 4,000 | | Clorox Co. . . . . . . . . . . . . . . . . . . . | | | 258,800 | |
| | 4,000 | | Colgate-Palmolive Co. . . . . . . . . . | | | 336,400 | |
| | | | | | | 595,200 | |
| Industrial Conglomerates—3.6% | | | | |
| | 10,000 | | 3M Co. . . . . . . . . . . . . . . . . . . . . . . | | | 886,700 | |
| | 74,600 | | General Electric Co. . . . . . . . . . . . | | | 1,406,956 | |
| | | | | | | 2,293,656 | |
| Insurance—0.7% | | | | |
| | 20,000 | | Ambac Financial Group, Inc. (a) . . | | | 30,200 | |
| | 5,000 | | Chubb Corp. . . . . . . . . . . . . . . . . . | | | 264,350 | |
| | 12,227 | | Fidelity National Financial, Inc.— | | | | |
| | | | Class A . . . . . . . . . . . . . . . . . . . . | | | 185,606 | |
| | | | | | | 480,156 | |
| IT Services—0.2% | | | | |
| | 5,374 | | Fidelity National Information | | | | |
| | | | Services, Inc. . . . . . . . . . . . . . . . . | | | 141,282 | |
| Machinery—2.2% | | | | |
| | 14,800 | | Lincoln Electric Holdings, Inc. | | | 887,112 | |
| | 12,000 | | PACCAR, Inc. . . . . . . . . . . . . . . . . . | | | 558,240 | |
| | | | | | | 1,445,352 | |
| Media—0.2% | | | | | | |
| | 7,692 | | CBS Corporation—Class B . . . . . . . | | | 124,687 | |
| Oil, Gas & Consumable Fuels—6.5% | | | | |
| | 59,000 | | CONSOL Energy, Inc. . . . . . . . . . . . | | | 2,636,120 | |
| | 8,000 | | El Paso Pipeline Partners LP . . . . . | | | 216,240 | |
| | 13,000 | | Hess Corp. . . . . . . . . . . . . . . . . . . . | | | 826,150 | |
| | 20,000 | | Penn Virginia Corp. . . . . . . . . . . . | | | 510,200 | |
| | | | | | | 4,188,710 | |
| Pharmaceuticals—3.3% | | | | |
| | 7,000 | | Abbott Laboratories . . . . . . . . . . . | | | 358,120 | |
| | 27,000 | | Johnson & Johnson . . . . . . . . . . . . | | | 1,736,100 | |
| | 1,384 | | Warner Chilcott PLC (a) . . . . . . . . | | | 39,250 | |
| | | | | | | 2,133,470 | |
The accompanying notes are an integral part of these financial statements.
Alpine Dynamic Balance Fund
Schedule of Portfolio Investments—Continued
April 30, 2010 (Unaudited)
| | | Security | | | |
| Shares | | Description | | Value | |
| | | | | | |
| Common Stocks—continued | | | |
| Real Estate Investment Trusts—9.3% | | | |
| | 20,000 | | Annaly Capital Management, Inc. . | | $ | 339,000 | |
| | 13,000 | | Boston Properties, Inc. . . . . . . . . . | | | 1,025,180 | |
| | 100,000 | | CBL & Associates Properties, Inc. . | | | 1,460,000 | |
| | 13,804 | | Developers Diversified Realty | | | | |
| | | | Corp. . . . . . . . . . . . . . . . . . . . . . . | | | 169,651 | |
| | 46,357 | | DiamondRock Hospitality Co. | | | 509,463 | |
| | 12,700 | | ProLogis . . . . . . . . . . . . . . . . . . . . . | | | 167,259 | |
| | 23,823 | | Simon Property Group, Inc. . . . . . | | | 2,120,724 | |
| | 20,000 | | Two Harbors Investment Corp. | | | 177,600 | |
| | | | | | | 5,968,877 | |
| Real Estate Management & Development—0.3% | | | | |
| | 8,433 | | Forestar Group, Inc. (a) . . . . . . . . . | | | 190,080 | |
| Road & Rail—1.4% | | | | |
| | 15,000 | | Norfolk Southern Corp. . . . . . . . . | | | 889,950 | |
| Semiconductors & Semiconductor | | | | |
| Equipment—0.5% | | | | |
| | 10,000 | | Microchip Technology, Inc. . . . . . . | | | 292,100 | |
| Thrifts & Mortgage Finance—1.2% | | | | |
| | 75,600 | | Federal National Mortgage | | | | |
| | | | Association (a) . . . . . . . . . . . . . . | | | 92,232 | |
| | 8,433 | | Guaranty Financial Group, Inc. (a) . | | | 337 | |
| | 31,500 | | New York Community Bancorp, | | | | |
| | | | Inc. . . . . . . . . . . . . . . . . . . . . . . . | | | 518,805 | |
| | 12,934 | | Ocwen Financial Corp. (a) . . . . . . | | | 149,388 | |
| | | | | | | 760,762 | |
| Trading Companies & Distributors—0.9% | | | | |
| | 15,000 | | WESCO International, Inc. (a) | | | 609,300 | |
| Water Utilities—1.3% | | | | |
| | 31,200 | | SJW Corp. . . . . . . . . . . . . . . . . . . . | | | 857,376 | |
| | | | Total Common Stocks | | | | |
| | | | (Cost $47,942,886) . . . . . . . . . . . | | | 45,545,400 | |
| | | | Security | | | |
| | Shares | | Description | | Value | |
| | | | | | | |
| Convertible Preferred Stocks—0.0%* | | | |
| Commercial Banks—0.0%* | | | |
| | | 47 | | Popular, Inc., Series D, 0.000% (a) | | $ | 1,537 | |
| | | | | Total Convertible Preferred | | | | |
| | | | | Stocks (Cost $1,175) . . . . . . . . . | | | 1,537 | |
| Investment Companies—0.5% | | | | |
| | | 2,000 | | Direxion Daily Technology Bull | | | | |
| | | | | 3X Shares . . . . . . . . . . . . . . . . . . | | | 329,220 | |
| | | | | Total Investment Companies | | | | |
| | | | | (Cost $448,236) . . . . . . . . . . . . . | | | 329,220 | |
| | Principal | | | | | | |
| | Amount | | | | | | |
| Bonds and Notes—21.0% | | | | |
| U.S. Treasury Bonds—17.7% | | | | |
| | $ | 3,000,000 | | 6.000%, 02/15/2026 . . . . . . . . . . . | | | 3,614,064 | |
| | | 7,000,000 | | 5.250%, 11/15/2028 . . . . . . . . . . . | | | 7,810,467 | |
| | | | | | | | 11,424,531 | |
| U.S. Treasury Notes—3.3% | | | | |
| | | 2,000,000 | | 5.000%, 08/15/2011 . . . . . . . . . . . | | | 2,114,610 | |
| | | | | Total Bonds and Notes | | | | |
| | | | | (Cost $13,463,889) . . . . . . . . . . . | | | 13,539,141 | |
| | Shares | | | | | | |
| Short-Term Investments—7.2% | | | | |
| | | 4,623,410 | | Federated Treasury Obligations | | | | |
| | | | | Fund, 0.01% . . . . . . . . . . . . . . . | | | 4,623,410 | |
| | | | | Total Short-Term Investments | | | | |
| | | | | (Cost $4,623,410) . . . . . . . . . . . . | | | 4,623,410 | |
| | | | | Total Investments | | | | |
| | | | | (Cost $66,479,596)—99.4% . . . . | | | 64,038,708 | |
| | | | | Other Assets in Excess of | | | | |
| | | | | Liabilities—0.6% . . . . . . . . . . . . | | | 412,064 | |
| | | | | TOTAL NET ASSETS—100.0% . . . . | | $ | 64,450,772 | |
| | | | | | | | | |
Percentages are stated as a percent of net assets.
*Amount is less than 0.05%.
(a) Non-income producing security.
Co.—Company
Corp.—Corporation
Inc.—Incorporated
LP—Limited Partnership
PLC—Public Limited Company
The accompanying notes are an integral part of these financial statements.
Alpine Ultra Short Tax Optimized Income Fund Schedule of Portfolio Investments
April 30, 2010 (Unaudited)
| Principal | | Security | | | |
| Amount | | Description | | Value | |
| Municipal Bonds—96.0% | | | |
| Alabama—4.9% | | | |
| $ | 1,000,000 | | Birmingham Water Works Board, | | | |
| | | | Subordinated Revenue | | | |
| | | | 3.000%, 07/01/2010 . . . . . . . . . . | | $ | 1,002,070 | |
| | 20,000,000 | | Chatom Industrial Development | | | | |
| | | | Board Revenue, Electric—Series A | | | | |
| | | | (SPA: National Rural Utility Finance) | | | | |
| | | | 1.230%, 08/01/2037 | | | | |
| | | | (Putable on 08/02/2010) . . . . . . | | | 19,997,000 | |
| | 2,000,000 | | Chatom Industrial Development | | | | |
| | | | Board Revenue, Electric—Series C | | | | |
| | | | (SPA: National Rural Utility Finance) | | | | |
| | | | 1.600%, 06/01/2010 . . . . . . . . . . | | | 1,999,960 | |
| | 33,000,000 | | Chatom Industrial Development | | | | |
| | | | Board Revenue, Powersouth | | | | |
| | | | Energy Cooperative—Series A | | | | |
| | | | (SPA: National Rural Utility Finance) | | | | |
| | | | 1.600%, 11/15/2038 | | | | |
| | | | (Putable on 05/15/2010) . . . . . . | | | 33,000,000 | |
| | 550,000 | | Cullman Healthcare Authority, | | | | |
| | | | Cullman Regional Medical | | | | |
| | | | Center—Series A | | | | |
| | | | 5.000%, 02/01/2011 . . . . . . . . . . | | | 560,637 | |
| | 5,795,000 | | Health Care Authority for Baptist | | | | |
| | | | Health—Series A | | | | |
| | | | (CS: Assured Guaranty) | | | | |
| | | | 6.125%, 05/15/2012 . . . . . . . . . . | | | 6,097,615 | |
| | 5,525,000 | | Health Care Authority for Baptist | | | | |
| | | | Health—Series B, ARN | | | | |
| | | | (CS: Assured Guaranty) | | | | |
| | | | 1.000%, 11/15/2037 | | | | |
| | | | (Putable on 05/07/2010) (a) | | | 5,525,000 | |
| | 1,660,000 | | Madison Industrial Development | | | | |
| | | | Board Revenue, WL Halsey | | | | |
| | | | Grocery Co., VRDN | | | | |
| | | | (LOC: Regions Bank) | | | | |
| | | | 1.050%, 04/01/2016 | | | | |
| | | | (Putable on 05/07/2010) (a) | | | 1,660,000 | |
| | | | Montgomery Industrial | | | | |
| | | | Development Board Revenue, | | | | |
| | | | Kinpak, Inc., VRDN | | | | |
| | | | (LOC: Regions Bank) | | | | |
| | 680,000 | | 2.000%, 03/01/2012 | | | | |
| | | | (Putable on 05/07/2010) (a) | | | 680,000 | |
| | 2,570,000 | | 2.000%, 06/01/2017 | | | | |
| | | | (Putable on 05/07/2010) (a) | | | 2,570,000 | |
| | | | | | | 73,092,282 | |
| Arizona—2.5% | | | | |
| | 8,500,000 | | Cochise County Pollution Control | | | | |
| | | | Corp., Arizona Electric Power | | | | |
| | | | Cooperative, Inc. | | | | |
| | | | 1.480%, 09/01/2010 . . . . . . . . . . | | | 8,496,600 | |
| | 500,000 | | Flagstaff, Aspen Place Sawmill | | | | |
| | | | Improvement District | | | | |
| | | | 5.000%, 01/01/2013 . . . . . . . . . . | | | 501,345 | |
| | 3,300,000 | | Maricopa County Pollution | | | | |
| | | | Control Corp., Arizona Public | | | | |
| | | | Services Co.—Series B | | | | |
| | | | 5.500%, 05/01/2012 . . . . . . . . . . | | | 3,504,138 | |
| Principal | | Security | | | |
| Amount | | Description | | Value | |
| Municipal Bonds—continued | | | |
| Arizona—continued | | | |
| $ | 6,000,000 | | Navajo County Pollution Control | | | |
| | | | Corp.—Series A | | | |
| | | | 5.000%, 06/01/2034 | | | |
| | | | (Putable on 06/01/2012) . . . . . . | | $ | 6,325,920 | |
| | 10,250,000 | | Scottsdale Industrial Development | | | | |
| | | | Authority Variable Hospital | | | | |
| | | | Revenue, ARN | | | | |
| | | | (CS: AGM) | | | | |
| | | | 1.010%, 09/01/2045 | | | | |
| | | | (Putable on 05/04/2010) (a) | | | 10,250,000 | |
| | 8,560,000 | | Tolleson Commercial Paper | | | | |
| | | | 0.900%, 05/05/2010 . . . . . . . . . . | | | 8,560,257 | |
| | | | | | | 37,638,260 | |
| Arkansas—2.3% | | | | |
| | 5,400,000 | | Pulaski County Public Facilities | | | | |
| | | | Board Revenue, Anthony | | | | |
| | | | School, VRDN | | | | |
| | | | (LOC: Regions Bank) | | | | |
| | | | 0.850%, 06/01/2033 | | | | |
| | | | (Putable on 05/07/2010) (a) | | | 5,400,000 | |
| | 5,425,000 | | Pulaski County Public Facilities | | | | |
| | | | Board Revenue, | | | | |
| | | | Chapelridge, VRDN | | | | |
| | | | (LOC: Regions Bank) | | | | |
| | | | 1.000%, 03/01/2032 | | | | |
| | | | (Putable on 05/07/2010) (a) | | | 5,425,000 | |
| | 6,350,000 | | Pulaski County Public Facilities | | | | |
| | | | Board Revenue, Chapelridge | | | | |
| | | | South West, VRDN | | | | |
| | | | (LOC: Regions Bank) | | | | |
| | | | 1.000%, 11/01/2034 | | | | |
| | | | (Putable on 05/07/2010) (a) | | | 6,350,000 | |
| | 4,350,000 | | Pulaski County Public Facilities | | | | |
| | | | Board, Valley Heights | | | | |
| | | | Apartments II—Series C, VRDN | | | | |
| | | | (LOC: Regions Bank) | | | | |
| | | | 1.000%, 04/01/2040 | | | | |
| | | | (Putable on 05/07/2010) (a) | | | 4,350,000 | |
| | 5,200,000 | | State Development Finance | | | | |
| | | | Authority, Capri Apartments— | | | | |
| | | | Series F, VRDN | | | | |
| | | | (LOC: Regions Bank) | | | | |
| | | | 1.000%, 10/01/2030 | | | | |
| | | | (Putable on 05/07/2010) (a) | | | 5,200,000 | |
| | 7,500,000 | | State Development Finance | | | | |
| | | | Authority, Chapelridge Benton— | | | | |
| | | | Series C, VRDN | | | | |
| | | | (LOC: Regions Bank) | | | | |
| | | | 1.000%, 06/01/2032 | | | | |
| | | | (Putable on 05/07/2010) (a) | | | 7,500,000 | |
| | | | | | | 34,225,000 | |
| California—5.3% | | | | |
| | 2,000,000 | | Bay Area Government Association, | | | | |
| | | | Acceleration Notes | | | | |
| | | | (CS: XLCA) | | | | |
| | | | 5.000%, 08/01/2013 . . . . . . . . . . | | | 2,014,580 | |
| | 1,750,000 | | Irvine Unified School District, | | | | |
| | | | Special Community Facilities | | | | |
| | | | District 86-1 | | | | |
| | | | (CS: Assured Guaranty) | | | | |
| | | | 3.000%, 09/01/2010 . . . . . . . . . . | | | 1,758,820 | |
The accompanying notes are an integral part of these financial statements.
Alpine Ultra Short Tax Optimized Income Fund Schedule of Portfolio Investments—Continued
April 30, 2010 (Unaudited)
| Principal | | Security | | | |
| Amount | | Description | | Value | |
| Municipal Bonds—continued | | | |
| California—continued | | | |
| $ | 8,675,000 | | Palomar Pomerado Health | | | |
| | | | Care—Series A, ARN | | | |
| | | | (CS: AGM) | | | |
| | | | 1.000%, 11/01/2036 | | | |
| | | | (Putable on 05/04/2010) (a) | | $ | 8,675,000 | |
| | 5,575,000 | | Palomar Pomerado Health | | | | |
| | | | Care—Series B, ARN | | | | |
| | | | (CS: AGM) | | | | |
| | | | 1.040%, 11/01/2036 | | | | |
| | | | (Putable on 05/05/2010) (a) | | | 5,575,000 | |
| | 13,325,000 | | Palomar Pomerado Health | | | | |
| | | | Care—Series C, ARN | | | | |
| | | | (CS: AGM) | | | | |
| | | | 1.000%, 11/01/2036 | | | | |
| | | | (Putable on 05/06/2010) (a) | | | 13,325,000 | |
| | 3,410,000 | | Sacramento County Certificates | | | | |
| | | | 5.000%, 02/01/2011 . . . . . . . . . . | | | 3,494,500 | |
| | 2,065,000 | | San Francisco City & County | | | | |
| | | | Airports Commissions, | | | | |
| | | | Second Series Issue 26a | | | | |
| | | | (CS: MBIA) | | | | |
| | | | 5.000%, 05/01/2012 . . . . . . . . . . | | | 2,086,125 | |
| | 500,000 | | State Communities Development | | | | |
| | | | Authority, Delaware Mesa | | | | |
| | | | Farms—Series A, VRDN | | | | |
| | | | (LOC: Wells Fargo Bank N.A.) | | | | |
| | | | 0.450%, 05/01/2019 | | | | |
| | | | (Putable on 05/07/2010) (a) | | | 500,000 | |
| | 325,000 | | State Housing Finance Agency | | | | |
| | | | Revenue, Multifamily Housing— | | | | |
| | | | Series A, VRDN | | | | |
| | | | (CS: AGM) | | | | |
| | | | 3.500%, 02/01/2034 | | | | |
| | | | (Putable on 05/07/2010) (a) | | | 325,000 | |
| | 38,260,000 | | State Revenue Anticipation Notes, | | | | |
| | | | Subordinated—Series A-1 | | | | |
| | | | 3.000%, 05/25/2010 . . . . . . . . . . | | | 38,312,415 | |
| | 1,665,000 | | State Revenue Anticipation Notes, | | | | |
| | | | Subordinated—Series A-2 | | | | |
| | | | 3.000%, 06/23/2010 . . . . . . . . . . | | | 1,670,045 | |
| | 125,000 | | State Township Health Care | | | | |
| | | | District Revenue—Series A | | | | |
| | | | 4.500%, 07/01/2011 . . . . . . . . . . | | | 130,028 | |
| | | | | | | 77,866,513 | |
| Colorado—1.3% | | | | |
| | 7,895,000 | | Denver City & County Airport | | | | |
| | | | Revenue—Series A | | | | |
| | | | (CS: AMBAC) | | | | |
| | | | 6.000%, 11/15/2011 | | | | |
| | | | (Putable on 11/15/2010) . . . . . . | | | 8,107,376 | |
| | 1,900,000 | | Denver City & County Airport | | | | |
| | | | Revenue, Subseries A3 | | | | |
| | | | (CS: AGM) | | | | |
| | | | 5.000%, 05/15/2011 . . . . . . . . . . | | | 1,971,136 | |
| | 3,000,000 | | Denver City & County Airport | | | | |
| | | | Revenue, Subseries A4 | | | | |
| | | | 5.250%, 05/15/2011 . . . . . . . . . . | | | 3,119,940 | |
| | 1,000,000 | | E-470 Public Highway Authority | | | | |
| | | | Revenue, Series A-2 | | | | |
| | | | (CS: MBIA) | | | | |
| | | | 5.000%, 09/01/2011 . . . . . . . . . . | | | 1,044,550 | |
| Principal | | Security | | | |
| Amount | | Description | | Value | |
| Municipal Bonds—continued | | | |
| Colorado—continued | | | |
| $ | 4,650,000 | | State Educational and Cultural | | | |
| | | | Facilities Authority, | | | |
| | | | First Academy, Inc., VRDN | | | |
| | | | (LOC: Fifth Third Bank) | | | |
| | | | 0.600%, 04/01/2037 | | | |
| | | | (Putable on 05/07/2010) (a) | | $ | 4,650,000 | |
| | | | | | | 18,893,002 | |
| Connecticut—0.4% | | | | |
| | 520,000 | | Bridgeport , Subordinated— | | | | |
| | | | Series A | | | | |
| | | | (CS: AGM) | | | | |
| | | | 2.000%, 08/15/2010 . . . . . . . . . . | | | 521,388 | |
| | 5,000,000 | | State Development Authority, | | | | |
| | | | Light & Power—Series A | | | | |
| | | | 1.400%, 04/01/2011 . . . . . . . . . . | | | 5,000,000 | |
| | | | | | | 5,521,388 | |
| Delaware—0.3% | | | | |
| | 3,850,000 | | State Economic Development | | | | |
| | | | Authority, Delmarva | | | | |
| | | | Power & Light Co. | | | | |
| | | | 5.650%, 07/01/2028 | | | | |
| | | | (Putable on 07/01/2010) | | | 3,867,287 | |
| Florida—10.2% | | | | |
| | 1,000,000 | | Arcadia Housing Authority, | | | | |
| | | | Arcadia Oaks Associated, Ltd. | | | | |
| | | | 4.250%, 01/01/2012 . . . . . . . . . . | | | 1,000,540 | |
| | 8,205,000 | | Broward County Housing Finance | | | | |
| | | | Authority, Golf View Gardens | | | | |
| | | | Apartments, VRDN | | | | |
| | | | (LOC: Regions Bank) | | | | |
| | | | 3.250%, 11/01/2043 | | | | |
| | | | (Putable on 05/07/2010) (a) | | | 8,205,000 | |
| | 2,705,000 | | Cape Coral Water & | | | | |
| | | | Sewer Revenue | | | | |
| | | | 6.000%, 10/01/2011 . . . . . . . . . . | | | 2,799,134 | |
| | 1,700,000 | | Citizens Property Insurance Corp., | | | | |
| | | | Senior Secured High Risk | | | | |
| | | | Notes—Series A | | | | |
| | | | (CS: MBIA) | | | | |
| | | | 5.000%, 03/01/2011 . . . . . . . . . . | | | 1,754,519 | |
| | | | Citizens Property Insurance Corp., | | | | |
| | | | Senior Secured High Risk | | | | |
| | | | Notes—Series A-2 | | | | |
| | 20,000,000 | | 4.500%, 06/01/2010 . . . . . . . . | | | 20,056,599 | |
| | 48,000,000 | | 2.000%, 04/21/2011 . . . . . . . . | | | 48,439,679 | |
| | 3,300,000 | | Eustis Multi-Purpose Revenue, | | | | |
| | | | Series A, VRDN | | | | |
| | | | (LOC: SunTrust Bank) | | | | |
| | | | 0.750%, 12/01/2027 | | | | |
| | | | (Putable on 05/07/2010) (a) | | | 3,300,000 | |
| | 1,000,000 | | Hillsborough County Aviation | | | | |
| | | | Authority, Tampa International | | | | |
| | | | Airport—Series D | | | | |
| | | | (CS: MBIA) | | | | |
| | | | 5.500%, 10/01/2010 . . . . . . . . . . | | | 1,019,770 | |
| | 8,360,000 | | Jackson County Industrial Revenue, | | | | |
| | | | Ice River Springs, VRDN | | | | |
| | | | (LOC: Regions Bank) | | | | |
| | | | 1.000%, 07/01/2023 | | | | |
| | | | (Putable on 05/07/2010) (a) | | | 8,360,000 | |
The accompanying notes are an integral part of these financial statements.
Alpine Ultra Short Tax Optimized Income Fund April 30, 2010 (Unaudited)
| Principal | | Security | | | |
| Amount | | Description | | Value | |
| Municipal Bonds—continued | | | |
| Florida—continued | | | |
| $ | 2,225,000 | | Jacksonville Aviation Authority | | | |
| | | | Revenue | | | |
| | | | (CS: AMBAC) | | | |
| | | | 5.000%, 10/01/2010 . . . . . . . . . . | | $ | 2,261,557 | |
| | 4,125,000 | | Lake County Industrial | | | | |
| | | | Development Authority, | | | | |
| | | | Senninger Irrigation, Inc., VRDN | | | | |
| | | | (LOC: SunTrust Bank) | | | | |
| | | | 0.920%, 11/01/2024 | | | | |
| | | | (Putable on 05/07/2010) (a) | | | 4,125,000 | |
| | 5,470,000 | | Lee County Housing Finance | | | | |
| | | | Authority Revenue, Heron | | | | |
| | | | Pond Apartments, VRDN | | | | |
| | | | (LOC: Regions Bank) | | | | |
| | | | 3.000%, 12/01/2043 | | | | |
| | | | (Putable on 05/07/2010) (a) | | | 5,470,000 | |
| | 5,000,000 | | Lee County, Solid Waste Systems | | | | |
| | | | (CS: MBIA) | | | | |
| | | | 5.625%, 10/01/2012 . . . . . . . . . . | | | 5,248,450 | |
| | 1,500,000 | | Marion County Industrial | | | | |
| | | | Development Authority, | | | | |
| | | | ESD Waste 2 Water, Inc., VRDN | | | | |
| | | | (LOC: SunTrust Bank) | | | | |
| | | | 0.670%, 10/01/2026 | | | | |
| | | | (Putable on 05/07/2010) (a) | | | 1,500,000 | |
| | | | Miami-Dade County Industrial | | | | |
| | | | Development Authority Revenue, | | | | |
| | | | Waste Management, Inc. | | | | |
| | 1,000,000 | | 1.800%, 11/01/2010 . . . . . . . . . . | | | 1,000,590 | |
| | 10,000,000 | | 5.400%, 08/01/2011 . . . . . . . . . . | | | 10,435,000 | |
| | 1,250,000 | | 2.000%, 12/01/2018 | | | | |
| | | | (Putable on 06/01/2010) . . . . . . | | | 1,250,000 | |
| | 5,185,000 | | Miami-Dade County State | | | | |
| | | | Aviation—Series C | | | | |
| | | | (CS: MBIA) | | | | |
| | | | 5.250%, 10/01/2012 | | | | |
| | | | (Putable on 10/01/2010) . . . . . . | | | 5,208,488 | |
| | 13,200,000 | | Orange County Health Facilities | | | | |
| | | | Authority, Adventist Long | | | | |
| | | | Term Care, VRDN | | | | |
| | | | (LOC: SunTrust Bank) | | | | |
| | | | 2.650%, 11/15/2036 | | | | |
| | | | (Putable on 05/07/2010) (a) | | | 13,200,000 | |
| | 1,595,000 | | Riviera Beach Industrial | | | | |
| | | | Development Revenue, | | | | |
| | | | Rain Manufacturing, VRDN | | | | |
| | | | (LOC: SunTrust Bank) | | | | |
| | | | 0.730%, 10/01/2010 | | | | |
| | | | (Putable on 05/07/2010) (a) | | | 1,595,000 | |
| | 1,000,000 | | St. Johns County Industrial | | | | |
| | | | Development Authority, Coastal | | | | |
| | | | Health Care Investor, VRDN | | | | |
| | | | (LOC: SunTrust Bank) | | | | |
| | | | 3.250%, 12/01/2016 | | | | |
| | | | (Putable on 05/07/2010) (a) | | | 1,000,000 | |
| | 3,050,000 | | State Finance Department | | | | |
| | | | General Service Revenue, | | | | |
| | | | Environmental Protection and | | | | |
| | | | Preservation—Series 2002-A | | | | |
| | | | (CS: MBIA) | | | | |
| | | | 5.375%, 07/01/2010 . . . . . . . . . . | | | 3,069,764 | |
| Principal | | Security | | | |
| Amount | | Description | | Value | |
| Municipal Bonds—continued | | | |
| Florida—continued | | | |
| $ | 320,000 | | University Athletic Association, Inc. | | | |
| | | | (LOC: SunTrust Bank) | | | |
| | | | 3.750%, 10/01/2011 . . . . . . . . . . | | $ | 330,973 | |
| | | | | | | 150,630,063 | |
| Georgia—2.5% | | | | |
| | 6,500,000 | | Atlanta Airport Revenue— | | | | |
| | | | Series C-2, VRDN | | | | |
| | | | (CS: MBIA; SPA: Wells | | | | |
| | | | Fargo Bank N.A.) | | | | |
| | | | 2.300%, 01/01/2030 | | | | |
| | | | (Putable on 05/07/2010) (a) | | | 6,500,000 | |
| | 4,420,000 | | Atlanta Urban Residential Finance | | | | |
| | | | Authority Revenue, Delmonte/ | | | | |
| | | | Brownlee—Series A, VRDN | | | | |
| | | | (LOC: SunTrust Bank) | | | | |
| | | | 0.680%, 06/01/2033 | | | | |
| | | | (Putable on 05/07/2010) (a) | | | 4,420,000 | |
| | 3,000,000 | | Burke County Development | | | | |
| | | | Authority Pollution Control | | | | |
| | | | Revenue, Oglethorpe Power Co. | | | | |
| | | | (CS: MBIA) | | | | |
| | | | 4.750%, 01/01/2040 | | | | |
| | | | (Putable on 04/01/2011) | | | 3,096,990 | |
| | 1,310,000 | | DeKalb County Housing Authority, | | | | |
| | | | Stone Mill Run Apartments, VRDN | | | | |
| | | | (LOC: Regions Bank) | | | | |
| | | | 1.050%, 06/01/2027 | | | | |
| | | | (Putable on 05/07/2010) (a) | | | 1,310,000 | |
| | 1,400,000 | | Douglas County Development | | | | |
| | | | Authority Revenue, Electrical | | | | |
| | | | Fiber Systems, VRDN | | | | |
| | | | (LOC: Regions Bank) | | | | |
| | | | 1.050%, 12/01/2021 | | | | |
| | | | (Putable on 05/07/2010) (a) | | | 1,400,000 | |
| | 300,000 | | Douglas County Development | | | | |
| | | | Authority Revenue, Whirlwind | | | | |
| | | | Steel Buildings, VRDN | | | | |
| | | | (LOC: JPMorgan Chase Bank) | | | | |
| | | | 0.850%, 12/01/2012 | | | | |
| | | | (Putable on 05/07/2010) (a) | | | 300,000 | |
| | 3,970,000 | | Griffin-Spalding County | | | | |
| | | | Development Authority | | | | |
| | | | Revenue, Woodland | | | | |
| | | | Industries, Inc., VRDN | | | | |
| | | | (LOC: SunTrust Bank) | | | | |
| | | | 1.800%, 02/01/2022 | | | | |
| | | | (Putable on 05/07/2010) (a) | | | 3,970,000 | |
| | 1,380,000 | | Liberty County Industrial Authority, | | | | |
| | | | HY Sil Manufacturing Co., Inc.— | | | | |
| | | | Series A, VRDN | | | | |
| | | | (LOC: SunTrust Bank) | | | | |
| | | | 0.880%, 03/01/2016 | | | | |
| | | | (Putable on 05/07/2010) (a) | | | 1,380,000 | |
| | 14,565,000 | | Walker Dade & Catoosa Counties | | | | |
| | | | Hospital Authority, | | | | |
| | | | Anticipation Certificates, | | | | |
| | | | Hutcheson Medical, VRDN | | | | |
| | | | (LOC: Regions Bank) | | | | |
| | | | 0.800%, 10/01/2028 | | | | |
| | | | (Putable on 05/07/2010) (a) | | | 14,565,000 | |
| | | | | | | 36,941,990 | |
The accompanying notes are an integral part of these financial statements.
Alpine Ultra Short Tax Optimized Income Fund April 30, 2010 (Unaudited)
| Principal | | Security | | | |
| Amount | | Description | | Value | |
| Municipal Bonds—continued | | | |
| Idaho—0.4% | | | | | |
| $ | 6,555,000 | | Boise Urban Renewal Agency— | | | |
| | | | Series A, VRDN | | | |
| | | | (LOC: Keybank N.A.) | | | |
| | | | 1.450%, 03/01/2024 | | | |
| | | | (Putable on 05/07/2010) (a) | | $ | 6,555,000 | |
| Illinois—6.7% | | | | | | |
| | 9,000,000 | | Aurora Economic Development | | | | |
| | | | Revenue, Aurora Christian | | | | |
| | | | Schools, Inc., VRDN | | | | |
| | | | (LOC: Fifth Third Bank) | | | | |
| | | | 0.600%, 06/01/2029 | | | | |
| | | | (Putable on 05/07/2010) (a) | | | 9,000,000 | |
| | 26,760,000 | | Crestwood Tax Increment Revenue, | | | | |
| | | | 135th & Cicero Redevelopment, | | | | |
| | | | VRDN | | | | |
| | | | (LOC: Fifth Third Bank) | | | | |
| | | | 1.500%, 12/01/2023 | | | | |
| | | | (Putable on 05/07/2010) (a) | | | 26,760,000 | |
| | 700,000 | | Des Plaines Industrial | | | | |
| | | | Development Revenue, | | | | |
| | | | MMP Properties LLC, VRDN | | | | |
| | | | (LOC: JPMorgan Chase Bank) | | | | |
| | | | 0.850%, 10/01/2018 | | | | |
| | | | (Putable on 05/07/2010) (a) | | | 700,000 | |
| | 310,000 | | Elk Grove Village Industrial | | | | |
| | | | Development, Rainbow Fish | | | | |
| | | | House, Inc., VRDN | | | | |
| | | | (LOC: JPMorgan Chase Bank) | | | | |
| | | | 0.850%, 05/01/2016 | | | | |
| | | | (Putable on 05/07/2010) (a) | | | 310,000 | |
| | 4,055,000 | | Granite City Solid Waste Revenue, | | | | |
| | | | Waste Management Inc. | | | | |
| | | | 4.875%, 05/01/2027 | | | | |
| | | | (Putable on 05/01/2013) . . . . . . | | | 4,055,000 | |
| | 7,350,000 | | Harvard Multifamily Housing | | | | |
| | | | Revenue, Northfield Court, VRDN | | | | |
| | | | (LOC: Fifth Third Bank) | | | | |
| | | | 1.250%, 12/01/2025 | | | | |
| | | | (Putable on 05/07/2010) (a) | | | 7,350,000 | |
| | 12,650,000 | | Rockford Revenue, Wesley | | | | |
| | | | Willows Obligation, VRDN | | | | |
| | | | (LOC: M&I Bank) | | | | |
| | | | 1.250%, 04/01/2032 | | | | |
| | | | (Putable on 05/07/2010) (a) | | | 12,650,000 | |
| | 20,795,000 | | Rockford Revenue, Wesley | | | | |
| | | | Willows Obligations Group, VRDN | | | | |
| | | | (LOC: M&I Bank) | | | | |
| | | | 1.250%, 04/01/2037 | | | | |
| | | | (Putable on 05/07/2010) (a) | | | 20,795,000 | |
| | 4,375,000 | | Springfield Airport Authority, | | | | |
| | | | Allied-Signal Inc., VRDN | | | | |
| | | | 6.500%, 09/01/2018 | | | | |
| | | | (Putable on 05/07/2010) (a) | | | 4,375,000 | |
| | 350,000 | | State Certificates | | | | |
| | | | 2.000%, 06/10/2010 . . . . . . . . . . | | | 350,466 | |
| | 4,710,000 | | State Finance Authority Revenue, | | | | |
| | | | Beverly Arts Center of Chicago, | | | | |
| | | | VRDN | | | | |
| | | | (LOC: Fifth Third Bank) | | | | |
| | | | 0.580%, 10/01/2028 | | | | |
| | | | (Putable on 05/07/2010) (a) | | | 4,710,000 | |
| Principal | | Security | | | |
| Amount | | Description | | Value | |
| Municipal Bonds—continued | | | |
| Illinois—continued | | | |
| | | State Finance Authority Revenue, | | | |
| | | Provena Health—Series A | | | |
| $ | 1,000,000 | | 5.000%, 05/01/2010 . . . . . . . . . . | | $ | 1,000,000 | |
| | 1,000,000 | | 5.000%, 05/01/2011 . . . . . . . . . . | | | 1,028,530 | |
| | 1,680,000 | | State Finance Authority Revenue, | | | | |
| | | | Transparent Container, VRDN | | | | |
| | | | (LOC: JPMorgan Chase Bank) | | | | |
| | | | 0.850%, 08/01/2024 | | | | |
| | | | (Putable on 05/07/2010) (a) | | | 1,680,000 | |
| | 3,010,000 | | Will-Kankakee Regional | | | | |
| | | | Development Authority, | | | | |
| | | | Atlas-Putty Products Co., VRDN | | | | |
| | | | (LOC: Fifth Third Bank) | | | | |
| | | | 0.580%, 08/01/2036 | | | | |
| | | | (Putable on 05/07/2010) (a) | | | 3,010,000 | |
| | 805,000 | | Woodridge Industrial Revenue, | | | | |
| | | | McDavid Knee Guard, VRDN | | | | |
| | | | (LOC: M&I Bank) | | | | |
| | | | 1.200%, 10/01/2011 | | | | |
| | | | (Putable on 05/07/2010) (a) | | | 805,000 | |
| | | | | | | 98,578,996 | |
| Indiana—2.5% | | | | |
| | 2,434,000 | | Bloomington Multifamily | | | | |
| | | | Housing Revenue, Willow | | | | |
| | | | Manor Apartments, VRDN | | | | |
| | | | (LOC: Fifth Third Bank) | | | | |
| | | | 0.670%, 11/01/2032 | | | | |
| | | | (Putable on 05/07/2010) (a) | | | 2,434,000 | |
| | 6,750,000 | | Columbus Revenue, | | | | |
| | | | Mill Division, VRDN | | | | |
| | | | (LOC: SunTrust Bank) | | | | |
| | | | 0.880%, 05/01/2015 | | | | |
| | | | (Putable on 05/07/2010) (a) | | | 6,750,000 | |
| | 500,000 | | Jasper County Pollution Control, | | | | |
| | | | Northern—Series A | | | | |
| | | | (CS: MBIA) | | | | |
| | | | 4.150%, 08/01/2010 . . . . . . . . . . | | | 502,760 | |
| | 5,900,000 | | St. Joseph County Educational | | | | |
| | | | Facilities Revenue, Holy Cross | | | | |
| | | | College, VRDN | | | | |
| | | | (LOC: Fifth Third Bank) | | | | |
| | | | 0.580%, 09/01/2025 | | | | |
| | | | (Putable on 05/07/2010) (a) | | | 5,900,000 | |
| | 19,045,000 | | State Finance Authority Revenue, | | | | |
| | | | Marion General Hospital— | | | | |
| | | | Series A, VRDN | | | | |
| | | | (LOC: Regions Bank) | | | | |
| | | | 2.000%, 07/01/2035 | | | | |
| | | | (Putable on 05/07/2010) (a) | | | 19,045,000 | |
| | 645,000 | | State Finance Authority Revenue, | | | | |
| | | | Marquette Manor | | | | |
| | | | 4.875%, 08/15/2010 . . . . . . . . . . | | | 647,806 | |
| | 1,600,000 | | State Health & Educational | | | | |
| | | | Facilities Financing Authority, | | | | |
| | | | Grandview Care— | | | | |
| | | | New Castle, VRDN | | | | |
| | | | (LOC: Fifth Third Bank) | | | | |
| | | | 0.580%, 08/01/2027 | | | | |
| | | | (Putable on 05/07/2010) (a) | | | 1,600,000 | |
| | | | | | | 36,879,566 | |
The accompanying notes are an integral part of these financial statements.
Alpine Ultra Short Tax Optimized Income Fund April 30, 2010 (Unaudited)
| | Principal | | Security | | | |
| | Amount | | Description | | Value | |
| Municipal Bonds—continued | | | |
| Kansas—0.2% | | | | | |
| | $ | 3,505,000 | | Topeka Multifamily Housing | | | |
| | | | | Refunding, Fleming Court, VRDN | | | |
| | | | | (LOC: M&I Bank) | | | |
| | | | | 2.110%, 12/01/2028 | | | |
| | | | | (Putable on 05/07/2010) (a) | | $ | 3,505,000 | |
| Kentucky—1.3% | | | | |
| | | 700,000 | | Bardstown Industrial | | | | |
| | | | | Development Revenue, | | | | |
| | | | | JAV Investments LLC, VRDN | | | | |
| | | | | (LOC: JPMorgan Chase Bank) | | | | |
| | | | | 0.850%, 06/01/2031 | | | | |
| | | | | (Putable on 05/07/2010) (a) | | | 700,000 | |
| | | 2,335,000 | | Fort Mitchell Industrial Building | | | | |
| | | | | Revenue, Grandview/Hemmer | | | | |
| | | | | (LOC: PNC Bank N.A.) | | | | |
| | | | | 1.750%, 08/01/2016 | | | | |
| | | | | (Putable on 08/01/2010) | | | 2,335,000 | |
| | | 400,000 | | Hancock County Industrial | | | | |
| | | | | Development Revenue, | | | | |
| | | | | Precision Roll Grinders, VRDN | | | | |
| | | | | (LOC: JPMorgan Chase Bank) | | | | |
| | | | | 0.850%, 06/01/2012 | | | | |
| | | | | (Putable on 05/07/2010) (a) | | | 400,000 | |
| | | 3,850,000 | | Pulaski County Waste Utilities | | | | |
| | | | | Revenue—Series B | | | | |
| | | | | 1.250%, 08/15/2010 | | | | |
| | | | | (Putable on 08/16/2010) | | | 3,849,307 | |
| | | 4,630,000 | | West Buechel Industrial Building | | | | |
| | | | | Revenue, Derby Fabricating, | | | | |
| | | | | LLC, VRDN | | | | |
| | | | | (LOC: Fifth Third Bank) | | | | |
| | | | | 0.670%, 06/01/2024 | | | | |
| | | | | (Putable on 05/07/2010) (a) | | | 4,630,000 | |
| | | 7,020,000 | | Wilmore Industrial Building | | | | |
| | | | | Revenue, Asbury Theological, | | | | |
| | | | | VRDN | | | | |
| | | | | (LOC: Regions Bank) | | | | |
| | | | | 0.850%, 08/01/2031 | | | | |
| | | | | (Putable on 05/07/2010) (a) | | | 7,020,000 | |
| | | | | | | | 18,934,307 | |
| Louisiana—5.4% | | | | |
| | | 3,085,000 | | Caddo-Bossier Parishes Port | | | | |
| | | | | Commission, Oakley | | | | |
| | | | | Louisiana Co., VRDN | | | | |
| | | | | (LOC: Regions Bank) | | | | |
| | | | | 1.000%, 01/01/2028 | | | | |
| | | | | (Putable on 05/07/2010) (a) | | | 3,085,000 | |
| | | 4,600,000 | | Jefferson Parish Industrial | | | | |
| | | | | Development Board Revenue, | | | | |
| | | | | Sara Lee Corp., VRDN | | | | |
| | | | | 5.250%, 06/01/2024 | | | | |
| | | | | (Putable on 05/07/2010) (a) | | | 4,600,000 | |
| | | 3,800,000 | | Lafayette Economic Development | | | | |
| | | | | Authority, Stirling Lafayette, | | | | |
| | | | | LLC, VRDN | | | | |
| | | | | (LOC: Regions Bank) | | | | |
| | | | | 0.850%, 02/01/2038 | | | | |
| | | | | (Putable on 05/07/2010) (a) | | | 3,800,000 | |
| Principal | | Security | | | |
| Amount | | Description | | Value | |
| Municipal Bonds—continued | | | |
| Louisiana—continued | | | |
| $ | 2,195,000 | | North Webster Parish Industrial | | | |
| | | | Development Revenue, | | | |
| | | | CSP, VRDN | | | |
| | | | (LOC: Regions Bank) | | | |
| | | | 3.400%, 09/01/2021 | | | |
| | | | (Putable on 05/07/2010) (a) | | $ | 2,195,000 | |
| | 2,825,000 | | Ouachita Parish Industrial | | | | |
| | | | Development Board, Garrett | | | | |
| | | | Manufacturing, LLC, VRDN | | | | |
| | | | (LOC: Regions Bank) | | | | |
| | | | 1.000%, 12/01/2016 | | | | |
| | | | (Putable on 05/07/2010) (a) | | | 2,825,000 | |
| | 20,000,000 | | Plaquemines Port Harbor & | | | | |
| | | | Terminal District Revenue, | | | | |
| | | | International Marine Terminal— | | | | |
| | | | Series A | | | | |
| | | | (LOC: Wells Fargo Bank N.A.) | | | | |
| | | | 1.200%, 03/15/2011 (a) . . . . . . . | | | 19,981,000 | |
| | 2,050,000 | | State Housing Finance Agency | | | | |
| | | | Revenue, Multifamily Housing | | | | |
| | | | Restoration—Series A, VRDN | | | | |
| | | | (LOC: Regions Bank) | | | | |
| | | | 1.000%, 12/01/2032 | | | | |
| | | | (Putable on 05/07/2010) (a) | | | 2,050,000 | |
| | 775,000 | | State Offshore Terminal Authority, | | | | |
| | | | Loop, LLC—Series B-1 | | | | |
| | | | 4.250%, 10/01/2037 | | | | |
| | | | (Putable on 10/01/2010) . . . . . . | | | 784,471 | |
| | 3,050,000 | | State Public Facilities Authority | | | | |
| | | | Revenue, Equipment & Capital | | | | |
| | | | Facilities Pooled—Loan B, VRDN | | | | |
| | | | (LOC: Hibernia National Bank) | | | | |
| | | | 1.600%, 07/01/2033 | | | | |
| | | | (Putable on 05/07/2010) (a) | | | 3,050,000 | |
| | 2,345,000 | | State Public Facilities Authority | | | | |
| | | | Revenue, Equipment & Capital | | | | |
| | | | Facilities Pooled—Series B, VRDN | | | | |
| | | | (LOC: Hibernia National Bank) | | | | |
| | | | 1.600%, 07/01/2033 | | | | |
| | | | (Putable on 05/07/2010) (a) | | | 2,345,000 | |
| | | | West Baton Rouge Commercial Paper | | | | |
| | 21,000,000 | | 0.830%, 05/06/2010 . . . . . . . . . . | | | 21,000,840 | |
| | 13,700,000 | | 0.830%, 05/07/2010 . . . . . . . . . . | | | 13,700,000 | |
| | | | | | | 79,416,311 | |
| Maine—0.5% | | | | | | |
| | 4,775,000 | | Finance Authority Industrial | | | | |
| | | | Development Revenue, | | | | |
| | | | Crobb Box Co.—Series A, VRDN | | | | |
| | | | (LOC: Keybank N.A.) | | | | |
| | | | 0.640%, 10/01/2019 | | | | |
| | | | (Putable on 05/07/2010) (a) | | | 4,775,000 | |
| | 1,750,000 | | State Finance Authority Solid | | | | |
| | | | Waste Disposal Revenue, | | | | |
| | | | Waste Management, Inc. | | | | |
| | | | 2.250%, 05/03/2010 . . . . . . . . . . | | | 1,750,000 | |
| | 880,000 | | State Governmental Facilities | | | | |
| | | | Authority—Series A | | | | |
| | | | 2.500%, 10/01/2010 . . . . . . . . . . | | | 886,758 | |
| | | | | | | 7,411,758 | |
The accompanying notes are an integral part of these financial statements.
Alpine Ultra Short Tax Optimized Income Fund April 30, 2010 (Unaudited)
| Principal | | Security | | | |
| Amount | | Description | | Value | |
| Municipal Bonds—continued | | | |
| Massachusetts—2.7% | | | |
| $ | 20,000,000 | | State Development Finance | | | |
| | | | Agency Commercial Paper | | | |
| | | | 0.900%, 05/05/2010 . . . . . . . . . . | | $ | 20,000,800 | |
| | 2,250,000 | | State Development Finance | | | | |
| | | | Agency, Waste Management, | | | | |
| | | | Inc.—Series B | | | | |
| | | | 3.400%, 12/01/2012 . . . . . . . . . . | | | 2,296,733 | |
| | 3,500,000 | | State Health & Educational | | | | |
| | | | Facilities Authority, Northeastern | | | | |
| | | | University—Series T-1 | | | | |
| | | | 4.125%, 10/01/2037 | | | | |
| | | | (Putable on 02/16/2012) . . . . . . | | | 3,653,825 | |
| | 2,000,000 | | State Health & Educational | | | | |
| | | | Facilities Authority, Northeastern | | | | |
| | | | University—Series T-2 | | | | |
| | | | 4.100%, 04/19/2012 . . . . . . . . . . | | | 2,095,480 | |
| | 760,000 | | State Health & Educational | | | | |
| | | | Facilities Authority, | | | | |
| | | | Springfield College | | | | |
| | | | 3.000%, 10/15/2011 . . . . . . . . . . | | | 771,195 | |
| | 11,470,000 | | State Port Authority Revenue— | | | | |
| | | | Series B | | | | |
| | | | (CS: AGM) | | | | |
| | | | 5.500%, 07/01/2010 . . . . . . . . . . | | | 11,547,193 | |
| | | | | | | 40,365,226 | |
| Michigan—5.1% | | | | |
| | 49,200,000 | | State Housing Development | | | | |
| | | | Authority Revenue— | | | | |
| | | | Series A, VRDN | | | | |
| | | | (CS: AGM; SPA: DEPFA Bank PLC) | | | | |
| | | | 1.150%, 04/01/2040 | | | | |
| | | | (Putable on 05/07/2010) (a) | | | 49,200,000 | |
| | 2,500,000 | | State Municipal Bond Authority, | | | | |
| | | | Aid Revenue Notes—Series B | | | | |
| | | | 5.000%, 03/21/2011 . . . . . . . . . . | | | 2,504,275 | |
| | 1,250,000 | | State Public Educational Facilities | | | | |
| | | | Authority Revenue Limited | | | | |
| | | | Obligation, Academy Woods, | | | | |
| | | | VRDN | | | | |
| | | | (LOC: Fifth Third Bank) | | | | |
| | | | 0.580%, 05/01/2026 | | | | |
| | | | (Putable on 05/07/2010) (a) | | | 1,250,000 | |
| | 300,000 | | State Strategic Fund Limited | | | | |
| | | | Obligations Revenue, Creative | | | | |
| | | | Foam Corp., VRDN | | | | |
| | | | (LOC: JPMorgan Chase Bank) | | | | |
| | | | 0.900%, 11/01/2011 | | | | |
| | | | (Putable on 05/07/2010) (a) | | | 300,000 | |
| | 300,000 | | State Strategic Fund Limited | | | | |
| | | | Obligations Revenue, | | | | |
| | | | CTD Real Estate Co. LLC, VRDN | | | | |
| | | | (LOC: JPMorgan Chase Bank) | | | | |
| | | | 1.200%, 11/01/2012 | | | | |
| | | | (Putable on 05/07/2010) (a) | | | 300,000 | |
| | 3,000,000 | | State Strategic Fund Limited | | | | |
| | | | Obligations Revenue, Detroit | | | | |
| | | | Education Court | | | | |
| | | | 3.050%, 12/03/2012 . . . . . . . . . . | | | 3,052,950 | |
| Principal | | Security | | | |
| Amount | | Description | | Value | |
| Municipal Bonds—continued | | | |
| Michigan—continued | | | |
| $ | 1,400,000 | | State Strategic Fund Limited | | | |
| | | | Obligations Revenue, Envelope | | | |
| | | | Printery, Inc., VRDN | | | |
| | | | (LOC: Fifth Third Bank) | | | |
| | | | 0.670%, 03/01/2027 | | | |
| | | | (Putable on 05/07/2010) (a) | | $ | 1,400,000 | |
| | 800,000 | | State Strategic Fund Limited | | | | |
| | | | Obligations Revenue, | | | | |
| | | | Press-Way Inc., VRDN | | | | |
| | | | (LOC: JPMorgan Chase Bank) | | | | |
| | | | 1.200%, 05/01/2018 | | | | |
| | | | (Putable on 05/07/2010) (a) | | | 800,000 | |
| | 3,520,000 | | State Strategic Fund Limited | | | | |
| | | | Obligations Revenue, | | | | |
| | | | Quantum, Inc., VRDN | | | | |
| | | | (LOC: Keybank N.A.) | | | | |
| | | | 3.950%, 06/01/2024 | | | | |
| | | | (Putable on 05/07/2010) (a) | | | 3,520,000 | |
| | 7,945,000 | | State Strategic Fund Limited | | | | |
| | | | Obligations Revenue, Sacred Heart | | | | |
| | | | Rehabilitation Center, VRDN | | | | |
| | | | (LOC: Fifth Third Bank) | | | | |
| | | | 0.580%, 03/01/2037 | | | | |
| | | | (Putable on 05/07/2010) (a) | | | 7,945,000 | |
| | 2,100,000 | | State Strategic Fund Limited | | | | |
| | | | Obligations Revenue, Taylor | | | | |
| | | | Building Products, Inc. | | | | |
| | | | (LOC: PNC Bank N.A.) | | | | |
| | | | 3.125%, 09/15/2010 . . . . . . . . . . | | | 2,107,497 | |
| | 300,000 | | State Strategic Fund Limited | | | | |
| | | | Obligations Revenue, Warren | | | | |
| | | | Screw Products, Inc., VRDN | | | | |
| | | | (LOC: JPMorgan Chase Bank) | | | | |
| | | | 1.200%, 09/01/2016 | | | | |
| | | | (Putable on 05/07/2010) (a) | | | 300,000 | |
| | | | State Strategic Fund Limited | | | | |
| | | | Obligations Revenue, Waste | | | | |
| | | | Management, Inc. | | | | |
| | 1,500,000 | | 1.000%, 08/02/2010 . . . . . . . . . . | | | 1,500,420 | |
| | 1,310,000 | | 4.625%, 12/01/2012 . . . . . . . . . . | | | 1,378,579 | |
| | | | | | | 75,558,721 | |
| Minnesota—0.2% | | | | |
| | 3,315,000 | | Ramsey Industrial Development | | | | |
| | | | Revenue, Kilkenny, LLC— | | | | |
| | | | Series A, VRDN | | | | |
| | | | (LOC: Associated Bank N.A.) | | | | |
| | | | 4.000%, 06/01/2025 | | | | |
| | | | (Putable on 05/07/2010) (a) | | | 3,315,000 | |
| Mississippi—1.9% | | | | |
| | 3,900,000 | | Claiborne County | | | | |
| | | | Commercial Paper | | | | |
| | | | 1.250%, 09/01/2010 . . . . . . . . . . | | | 3,910,959 | |
| | 6,560,000 | | State Business Finance Corp., | | | | |
| | | | Best Buy Plaza, LP, VRDN | | | | |
| | | | (LOC: Regions Bank) | | | | |
| | | | 0.850%, 09/01/2033 | | | | |
| | | | (Putable on 05/07/2010) (a) | | | 6,560,000 | |
The accompanying notes are an integral part of these financial statements.
Alpine Ultra Short Tax Optimized Income Fund April 30, 2010 (Unaudited)
| Principal | | Security | | | |
| Amount | | Description | | Value | |
| Municipal Bonds—continued | | | |
| Mississippi—continued | | | |
| $ | 7,500,000 | | State Business Finance Corp., | | | |
| | | | Coast Electric Power | | | |
| | | | Association—Series A | | | |
| | | | (SPA: National Rural Utility Finance) | | | |
| | | | 1.875%, 05/01/2037 | | | |
| | | | (Putable on 11/01/2010) . . . . . . | | $ | 7,500,000 | |
| | 2,900,000 | | State Business Finance Corp., | | | | |
| | | | Waste Management, Inc. | | | | |
| | | | 1.000%, 09/01/2010 . . . . . . . . . . | | | 2,900,000 | |
| | 6,050,000 | | State Home Corp. Multifamily | | | | |
| | | | Housing Authority Revenue, | | | | |
| | | | Chapel Ridge Apartments, VRDN | | | | |
| | | | (LOC: Regions Bank) | | | | |
| | | | 1.000%, 05/01/2031 | | | | |
| | | | (Putable on 05/07/2010) (a) | | | 6,050,000 | |
| | 750,000 | | State Hospital Equipment & | | | | |
| | | | Facilities Authority Revenue, | | | | |
| | | | Baptist Health System, Inc. | | | | |
| | | | 5.000%, 08/15/2011 . . . . . . . . . . | | | 772,928 | |
| | 250,000 | | State Hospital Equipment & | | | | |
| | | | Facilities Authority Revenue, | | | | |
| | | | Forrest County General Hospital | | | | |
| | | | 5.250%, 01/01/2011 . . . . . . . . . . | | | 254,913 | |
| | | | | | | 27,948,800 | |
| Missouri—2.0% | | | | |
| | 2,600,000 | | Springfield Industrial | | | | |
| | | | Development Authority, Edco | | | | |
| | | | Group, Inc., VRDN | | | | |
| | | | (LOC: M&I Bank) | | | | |
| | | | 1.990%, 10/01/2027 | | | | |
| | | | (Putable on 05/07/2010) (a) | | | 2,600,000 | |
| | 1,565,000 | | St. Louis Airport Revenue— | | | | |
| | | | Series A | | | | |
| | | | (CS: MBIA) | | | | |
| | | | 5.500%, 07/01/2010 . . . . . . . . . . | | | 1,574,640 | |
| | 3,025,000 | | St. Louis County Industrial | | | | |
| | | | Development Authority, | | | | |
| | | | Metal Products, VRDN | | | | |
| | | | (LOC: M&I Bank) | | | | |
| | | | 2.100%, 02/01/2023 | | | | |
| | | | (Putable on 05/07/2010) (a) | | | 3,025,000 | |
| | 3,750,000 | | State Development Finance | | | | |
| | | | Board, Kopytek Printing, VRDN | | | | |
| | | | (LOC: M&I Bank) | | | | |
| | | | 2.530%, 08/01/2032 | | | | |
| | | | (Putable on 05/07/2010) (a) | | | 3,750,000 | |
| | 17,950,000 | | State Health & Educational | | | | |
| | | | Facilities Authority, | | | | |
| | | | SSM Health Care—Series B | | | | |
| | | | 0.650%, 08/05/2010 . . . . . . . . . . | | | 17,950,000 | |
| | | | | | | 28,899,640 | |
| Multi-State—1.8% | | | | |
| | 23,620,000 | | Putable Floating Option | | | | |
| | | | Tax-Exempt Receipts, VRDN (LIQ: | | | | |
| | | | Merrill Lynch Capital Services) | | | | |
| | | | 0.620%, 07/01/2047 | | | | |
| | | | (Putable on 05/07/2010) (a) | | | 23,620,000 | |
| | 4,700,000 | | Theop, LLC, ARN | | | | |
| | | | 0.560%, 01/01/2039 (c)(d) . . . . . | | | 2,820,000 | |
| | | | | | | 26,440,000 | |
| | Principal | | Security | | | |
| | Amount | | Description | | Value | |
| Municipal Bonds—continued | | | |
| Nevada—0.1% | | | |
| | $ | 1,500,000 | | Clark County Passenger | | | |
| | | | | Facilities Revenue, | | | |
| | | | | Las Vegas McCarran Airport | | | |
| | | | | (CS: MBIA) | | | |
| | | | | 5.250%, 07/01/2010 . . . . . . . . . . | | $ | 1,510,695 | |
| | | 750,000 | | Reno Hospital Revenue, Washoe | | | | |
| | | | | Medical Center—Series C | | | | |
| | | | | (CS: AGM) | | | | |
| | | | | 3.000%, 06/01/2011 . . . . . . . . . . | | | 760,950 | |
| | | | | | | | 2,271,645 | |
| New Hampshire—0.8% | | | | |
| | | 5,000,000 | | State Business Financing | | | | |
| | | | | Authority Revenue, | | | | |
| | | | | Pennichuck Water Works | | | | |
| | | | | (CS: AMBAC) | | | | |
| | | | | 3.625%, 10/01/2035 | | | | |
| | | | | (Putable on 07/01/2010) | | | 5,003,050 | |
| | | 1,000,000 | | State Business Financing Authority, | | | | |
| | | | | United Illuminating Co. | | | | |
| | | | | 7.125%, 02/01/2012 . . . . . . . . . . | | | 1,077,100 | |
| | | 5,000,000 | | State Business Financing | | | | |
| | | | | Authority, United Illuminating | | | | |
| | | | | Co.—Series A | | | | |
| | | | | 6.875%, 02/01/2012 . . . . . . . . . . | | | 5,364,400 | |
| | | | | | | | 11,444,550 | |
| New Jersey—2.9% | | | | |
| | | 4,625,000 | | Gloucester County Improvement | | | | |
| | | | | Authority, Waste Management, | | | | |
| | | | | Inc.—Series A | | | | |
| | | | | 2.625%, 12/01/2029 | | | | |
| | | | | (Putable on 12/03/2012) | | | 4,697,243 | |
| | | 1,000,000 | | Gloucester County Improvement | | | | |
| | | | | Authority, Waste Management, | | | | |
| | | | | Inc.—Series B | | | | |
| | | | | 3.375%, 12/01/2029 | | | | |
| | | | | (Putable on 12/03/2012) | | | 1,008,480 | |
| | | 230,000 | | Health Care Facilities Finance | | | | |
| | | | | Authority Revenue, Trinitas | | | | |
| | | | | Hospital—Series A Convertible | | | | |
| | | | | 4.750%, 07/01/2012 . . . . . . . . . . | | | 235,909 | |
| | | 3,140,000 | | Irvington Township, Bond | | | | |
| | | | | Anticipation Notes | | | | |
| | | | | 2.350%, 03/11/2011 . . . . . . . . . . | | | 3,189,989 | |
| | | 1,500,000 | | Manchester Utilities Authority | | | | |
| | | | | Revenue, Temporary Funding | | | | |
| | | | | Notes | | | | |
| | | | | 3.500%, 02/04/2011 . . . . . . . . . . | | | 1,504,785 | |
| | | 9,800,000 | | Newark Bond Anticipation Notes | | | | |
| | | | | General Improvement—Series A | | | | |
| | | | | 1.250%, 06/17/2010 . . . . . . . . . . | | | 9,805,096 | |
| | | 5,000,000 | | Newark School Promissory | | | | |
| | | | | Notes—Series D | | | | |
| | | | | 1.250%, 06/17/2010 . . . . . . . . . . | | | 5,003,400 | |
| | | 796,000 | | Newark Special Emergency | | | | |
| | | | | Notes—Series C | | | | |
| | | | | 3.250%, 01/19/2011 . . . . . . . . . . | | | 799,646 | |
| | | 582,800 | | Newark Tax Appeal | | | | |
| | | | | Notes—Series H | | | | |
| | | | | 3.250%, 12/16/2010 . . . . . . . . . . | | | 584,962 | |
The accompanying notes are an integral part of these financial statements.
Alpine Ultra Short Tax Optimized Income Fund April 30, 2010 (Unaudited)
| | Principal | | Security | | | |
| | Amount | | Description | | Value | |
| Municipal Bonds—continued | | | |
| New Jersey—continued | | | |
| | $ | 6,500,000 | | State Economic Development | | | |
| | | | | Authority, EI Dorado—Series A | | | |
| | | | | 0.875%, 07/01/2010 . . . . . . . . . . | | $ | 6,499,610 | |
| | | | | State Housing & Mortgage | | | | |
| | | | | Finance Agency Revenue, | | | | |
| | | | | Single Family | | | | |
| | | | | Housing—Series EE | | | | |
| | | 915,000 | | 2.000%, 10/01/2010 . . . . . . . . . . | | | 915,137 | |
| | | 720,000 | | 2.750%, 04/01/2011 . . . . . . . . . . | | | 720,504 | |
| | | 870,000 | | Tobacco Settlement Financing | | | | |
| | | | | Corporation | | | | |
| | | | | 5.750%, 06/01/2032 . . . . . . . . . . | | | 934,049 | |
| | | 2,882,500 | | Trenton Bond Anticipation Notes, | | | | |
| | | | | General Improvement | | | | |
| | | | | 3.500%, 12/10/2010 . . . . . . . . . . | | | 2,897,114 | |
| | | | | Trenton Bond Anticipation Notes, | | | | |
| | | | | Water Utility | | | | |
| | | 1,710,379 | | 3.000%, 07/15/2010 . . . . . . . . . . | | | 1,712,466 | |
| | | 2,451,605 | | 3.500%, 07/15/2010 . . . . . . . . . . | | | 2,455,773 | |
| | | | | | | | 42,964,163 | |
| New Mexico—0.1% | | | | |
| | | 1,215,000 | | Las Cruces Industrial Development | | | | |
| | | | | Revenue, Parkview Metal | | | | |
| | | | | Products, VRDN | | | | |
| | | | | (LOC: JPMorgan Chase Bank) | | | | |
| | | | | 0.850%, 06/01/2022 | | | | |
| | | | | (Putable on 05/07/2010) (a) | | | 1,215,000 | |
| New York—1.4% | | | | |
| | | 3,235,000 | | Monroe County Industrial | | | | |
| | | | | Development Agency | | | | |
| | | | | Revenue—Series A, VRDN | | | | |
| | | | | (LOC: M&I Bank) | | | | |
| | | | | 0.690%, 12/01/2016 | | | | |
| | | | | (Putable on 05/07/2010) (a) | | | 3,235,000 | |
| | | 55,000 | | Monroe County Industrial | | | | |
| | | | | Development Agency Revenue, | | | | |
| | | | | Hillside Children’s Center, VRDN | | | | |
| | | | | (LOC: Keybank N.A.) | | | | |
| | | | | 0.490%, 08/01/2018 | | | | |
| | | | | (Putable on 05/07/2010) (a) | | | 55,000 | |
| | | 85,000 | | Otsego County Industrial | | | | |
| | | | | Development Agency Revenue, | | | | |
| | | | | Templeton Foundation—Series A, | | | | |
| | | | | VRDN (LOC: Keybank N.A) | | | | |
| | | | | 0.490%, 06/01/2027 | | | | |
| | | | | (Putable on 05/07/2010) (a) | | | 85,000 | |
| | | 1,800,000 | | State Adjusted Fiscal 2008, | | | | |
| | | | | Series J-3, VRDN | | | | |
| | | | | (LOC: Allied Irish Bank PLC) | | | | |
| | | | | 0.450%, 08/01/2023 | | | | |
| | | | | (Putable on 05/07/2010) (a) | | | 1,800,000 | |
| | | 1,345,000 | | State Dormitory Authority | | | | |
| | | | | Revenue, Manhattan | | | | |
| | | | | Marymount | | | | |
| | | | | 3.000%, 07/01/2011 . . . . . . . . . . | | | 1,364,126 | |
| | | 1,000,000 | | State Dormitory Authority | | | | |
| | | | | Revenue, NYU Hospital | | | | |
| | | | | Center—Series A | | | | |
| | | | | 5.000%, 07/01/2010 . . . . . . . . . . | | | 1,003,160 | |
| Principal | | Security | | | |
| Amount | | Description | | Value | |
| Municipal Bonds—continued | | | |
| New York—continued | | | |
| $ | 12,000,000 | | Town of East Hampton— | | | |
| | | | Anticipation Notes—Series D | | | |
| | | | 1.500%, 06/30/2010 . . . . . . . . . . | | $ | 12,007,800 | |
| | 500,000 | | Westchester Tobacco Asset | | | | |
| | | | Securitization Corporation | | | | |
| | | | 5.000%, 06/01/2026 . . . . . . . . . . | | | 477,635 | |
| | | | | | | 20,027,721 | |
| North Carolina—1.3% | | | | |
| | 2,770,000 | | Charlotte Airport | | | | |
| | | | Revenue—Series B | | | | |
| | | | 1.250%, 07/01/2010 . . . . . . . . . . | | | 2,770,665 | |
| | 16,750,000 | | Mecklenburg County | | | | |
| | | | Certificates—Series A, VRDN | | | | |
| | | | (SPA: SunTrust Bank) | | | | |
| | | | 0.580%, 02/01/2028 | | | | |
| | | | (Putable on 05/07/2010) (a) | | | 16,750,000 | |
| | | | | | | 19,520,665 | |
| Ohio—2.1% | | | | | | |
| | 1,260,000 | | Clermont County Industrial | | | | |
| | | | Development Revenue, | | | | |
| | | | Iannelli Enterprises, VRDN | | | | |
| | | | (LOC: Fifth Third Bank) | | | | |
| | | | 0.670%, 12/01/2020 | | | | |
| | | | (Putable on 05/07/2010) (a) | | | 1,260,000 | |
| | 1,600,000 | | Cleveland Certificates, Cleveland | | | | |
| | | | Stadium—Series A | | | | |
| | | | 2.000%, 11/15/2010 . . . . . . . . . . | | | 1,605,200 | |
| | 1,460,000 | | Hamilton County Economic, | | | | |
| | | | La Salle High School, VRDN | | | | |
| | | | (LOC: Fifth Third Bank) | | | | |
| | | | 0.580%, 03/01/2024 | | | | |
| | | | (Putable on 05/07/2010) (a) | | | 1,460,000 | |
| | 2,390,000 | | Mark Milford Hicksville Joint | | | | |
| | | | Township Hospital District, | | | | |
| | | | Community Memorial Hospital, | | | | |
| | | | VRDN (LOC: Fifth Third Bank) | | | | |
| | | | 0.580%, 12/01/2037 | | | | |
| | | | (Putable on 05/07/2010) (a) | | | 2,390,000 | |
| | 1,680,000 | | Marysville Tax Increment | | | | |
| | | | Revenue—Series A | | | | |
| | | | (LOC: Fifth Third Bank) | | | | |
| | | | 3.000%, 09/01/2010 . . . . . . . . . . | | | 1,683,074 | |
| | 1,000,000 | | Marysville Tax Increment Revenue, | | | | |
| | | | Gate Department—Series B | | | | |
| | | | (LOC: Fifth Third Bank) | | | | |
| | | | 3.500%, 09/01/2010 . . . . . . . . . . | | | 1,003,430 | |
| | 2,680,000 | | Sharonville Industrial | | | | |
| | | | Development Revenue, | | | | |
| | | | Duke Realty LP, VRDN | | | | |
| | | | (LOC: Fifth Third Bank) | | | | |
| | | | 0.670%, 09/01/2014 | | | | |
| | | | (Putable on 05/07/2010) (a) | | | 2,680,000 | |
| | 3,095,000 | | Stark County Industrial | | | | |
| | | | Development Revenue, | | | | |
| | | | Products, Inc., VRDN | | | | |
| | | | (LOC: Keybank N.A.) | | | | |
| | | | 0.640%, 06/01/2018 | | | | |
| | | | (Putable on 05/07/2010) (a) | | | 3,095,000 | |
| | 2,485,000 | | State Air Quality Development | | | | |
| | | | Authority, First Energy- Series C | | | | |
| | | | 3.000%, 04/02/2012 . . . . . . . . . . | | | 2,533,159 | |
The accompanying notes are an integral part of these financial statements.
Alpine Ultra Short Tax Optimized Income Fund April 30, 2010 (Unaudited)
| Principal | | Security | | | |
| Amount | | Description | | Value | |
| Municipal Bonds—continued | | | |
| Ohio—continued | | | |
| $ | 5,000,000 | | State Air Quality Development | | | |
| | | | Authority, Ohio Power | | | |
| | | | 7.125%, 06/01/2010 . . . . . . . . . . | | $ | 5,019,250 | |
| | 2,305,000 | | State Water Development | | | | |
| | | | Authority, First Energy—Series B | | | | |
| | | | 3.000%, 04/02/2012 . . . . . . . . . . | | | 2,349,671 | |
| | 4,055,000 | | Summit County Port Authority | | | | |
| | | | Revenue, Edgewood Apartments | | | | |
| | | | 4.250%, 05/01/2010 . . . . . . . . . . | | | 4,055,000 | |
| | 2,250,000 | | Warrensville Heights | | | | |
| | | | Anticipation Notes | | | | |
| | | | 3.000%, 02/03/2011 . . . . . . . . . . | | | 2,265,705 | |
| | | | | | | 31,399,489 | |
| Oklahoma—0.0%* | | | | |
| | 400,000 | | Cherokee Nation of Oklahoma | | | | |
| | | | National Healthcare System— | | | | |
| | | | Series 2006 | | | | |
| | | | (CS: ACA) | | | | |
| | | | 4.100%, 12/01/2011 (b) . . . . . . . | | | 410,548 | |
| Oregon—1.0% | | | | |
| | 15,000,000 | | Gilliam County Solid Waste | | | | |
| | | | Disposal Revenue, Waste | | | | |
| | | | Management, Inc. | | | | |
| | | | 1.000%, 09/01/2010 . . . . . . . . . . | | | 15,000,000 | |
| | 400,000 | | Gilliam County Solid Waste | | | | |
| | | | Disposal Revenue, Waste | | | | |
| | | | Management, Inc.—Series A | | | | |
| | | | 6.000%, 08/01/2025 | | | | |
| | | | (Putable on 05/01/2013) . . . . . . | | | 400,000 | |
| | | | | | | 15,400,000 | |
| Pennsylvania—6.5% | | | | |
| | 3,000,000 | | Allegheny County Airport Revenue, | | | | |
| | | | Pittsburgh International Airport | | | | |
| | | | (CS: MBIA) | | | | |
| | | | 5.750%, 01/01/2011 . . . . . . . . . . | | | 3,060,900 | |
| | 2,500,000 | | Allegheny County Hospital | | | | |
| | | | Development Authority, | | | | |
| | | | University Pittsburgh Medical | | | | |
| | | | Center—Series A | | | | |
| | | | 3.000%, 05/15/2011 . . . . . . . . . . | | | 2,563,475 | |
| | 21,865,000 | | Harrisburg Water Authority | | | | |
| | | | Revenue—Series B, VRDN | | | | |
| | | | (CS: AGM; SPA: DEXIA Credit | | | | |
| | | | Local) | | | | |
| | | | 0.730%, 07/15/2017 | | | | |
| | | | (Putable on 05/07/2010) (a) | | | 21,865,000 | |
| | 1,200,000 | | Lancaster County Solid Waste | | | | |
| | | | Management Authority— | | | | |
| | | | Series A | | | | |
| | | | 2.000%, 12/15/2010 . . . . . . . . . . | | | 1,201,812 | |
| | 1,000,000 | | Philadelphia Municipal Lease | | | | |
| | | | Authority Revenue—Series B | | | | |
| | | | (CS: AGM) | | | | |
| | | | 5.250%, 11/15/2010 . . . . . . . . . . | | | 1,017,880 | |
| | 60,000,000 | | Philadelphia Tax & Revenue | | | | |
| | | | Anticipation Notes—Series B | | | | |
| | | | 2.500%, 06/30/2010 . . . . . . . . . . | | | 60,176,999 | |
| Principal | | Security | | | |
| Amount | | Description | | Value | |
| Municipal Bonds—continued | | | |
| Pennsylvania—continued | | | |
| $ | 1,000,000 | | State Economic Development | | | |
| | | | Financing Authority Revenue, | | | |
| | | | Albert Einstein Healthcare— | | | |
| | | | Series A | | | |
| | | | 5.000%, 10/15/2010 . . . . . . . . . . | | $ | 1,012,740 | |
| | 1,000,000 | | State Economic Development | | | | |
| | | | Financing Authority Revenue, | | | | |
| | | | Exelon Generation | | | | |
| | | | 5.000%, 12/01/2042 | | | | |
| | | | (Putable on 06/01/2012) | | | 1,057,440 | |
| | 2,000,000 | | State Economic Development | | | | |
| | | | Financing Authority Revenue, | | | | |
| | | | Waste Management, Inc. | | | | |
| | | | 2.625%, 12/01/2033 | | | | |
| | | | (Putable on 12/03/2012) | | | 2,031,240 | |
| | 2,750,000 | | State Economic Development | | | | |
| | | | Financing Authority Revenue, | | | | |
| | | | Waste Management, Inc.— | | | | |
| | | | Series A | | | | |
| | | | 2.250%, 11/01/2021 | | | | |
| | | | (Putable on 05/01/2015) | | | 2,750,000 | |
| | | | | | | 96,737,486 | |
| Puerto Rico—3.5% | | | | |
| | 1,150,000 | | Electric Power Authority— | | | | |
| | | | Series Aa | | | | |
| | | | (CS: MBIA) | | | | |
| | | | 6.250%, 07/01/2010 . . . . . . . . . . | | | 1,159,338 | |
| | 1,590,000 | | Municipal Finance Agency— | | | | |
| | | | Series A | | | | |
| | | | (CS: AGM) | | | | |
| | | | 5.250%, 07/01/2010 . . . . . . . . . . | | | 1,594,563 | |
| | 26,500,000 | | Public Finance Corp., | | | | |
| | | | Commonwealth—Series A | | | | |
| | | | (LOC: Government Development | | | | |
| | | | Bank of Puerto Rico) | | | | |
| | | | 5.750%, 02/01/2012 . . . . . . . . . . | | | 27,564,240 | |
| | 20,000,000 | | Sales Tax Financing Corp.—Series A | | | | |
| | | | 5.000%, 08/01/2011 . . . . . . . . . . | | | 20,893,399 | |
| | | | | | | 51,211,540 | |
| Rhode Island—0.1% | | | | |
| | 1,000,000 | | State Economic Development | | | | |
| | | | Corp.—Series A | | | | |
| | | | (CS: MBIA) | | | | |
| | | | 6.000%, 07/01/2010 . . . . . . . . . . | | | 1,006,860 | |
| South Carolina—0.8% | | | | |
| | 6,550,000 | | State Jobs—Economic | | | | |
| | | | Development Authority Revenue, | | | | |
| | | | Congo Medical Products, VRDN | | | | |
| | | | (LOC: Bayerische Hypo-Und | | | | |
| | | | Veriensbank) | | | | |
| | | | 1.200%, 09/01/2010 | | | | |
| | | | (Putable on 05/07/2010) (a) | | | 6,550,000 | |
| | 5,000,000 | | State Jobs—Economic | | | | |
| | | | Development Authority Revenue, | | | | |
| | | | Goglanian Bakeries, Inc., VRDN | | | | |
| | | | (LOC: California Bank & Trust) | | | | |
| | | | 1.000%, 12/01/2029 | | | | |
| | | | (Putable on 05/07/2010) (a) | | | 5,000,000 | |
The accompanying notes are an integral part of these financial statements.
Alpine Ultra Short Tax Optimized Income Fund April 30, 2010 (Unaudited)
| Principal | | Security | | | |
| Amount | | Description | | Value | |
| Municipal Bonds—continued | | | |
| South Carolina—continued | | | |
| $ | 1,000,000 | | State Jobs—Economic | | | |
| | | | Development Authority | | | |
| | | | Revenue, Palmetto Health | | | |
| | | | 3.000%, 08/01/2010 . . . . . . . . . . | | $ | 1,002,170 | |
| | | | | | | 12,552,170 | |
| South Dakota—0.1% | | | | |
| | 1,425,000 | | Education Loans, Inc., South | | | | |
| | | | Dakota Student Tax Exempt | | | | |
| | | | Senior Asset Backed | | | | |
| | | | (CS: Guaranteed Student Loans) | | | | |
| | | | 4.950%, 06/01/2010 . . . . . . . . . . | | | 1,428,648 | |
| Tennessee—3.5% | | | | |
| | 11,000,000 | | Blount County Public Building | | | | |
| | | | Authority, Local Government | | | | |
| | | | Public Improvement | | | | |
| | | | Series D-3-A, VRDN | | | | |
| | | | (CS: Municipal Government | | | | |
| | | | Guaranteed; SPA: DEPFA Bank | | | | |
| | | | PLC) 0.600%, 06/01/2034 | | | | |
| | | | (Putable on 05/07/2010) (a) | | | 11,000,000 | |
| | | | Chattanooga-Hamilton County | | | | |
| | | | Hospital Authority, Erlaner Health | | | | |
| | | | (CS: AGM) | | | | |
| | 1,800,000 | | 2.000%, 10/01/2010 . . . . . . . . . . | | | 1,809,900 | |
| | 4,415,000 | | 2.000%, 10/01/2010 . . . . . . . . . . | | | 4,439,282 | |
| | 2,000,000 | | Franklin County Industrial | | | | |
| | | | Development Board, Hi-Tech, | | | | |
| | | | VRDN | | | | |
| | | | (LOC: Regions Bank) | | | | |
| | | | 1.000%, 11/01/2012 | | | | |
| | | | (Putable on 05/07/2010) (a) | | | 2,000,000 | |
| | 7,700,000 | | Franklin Public Building | | | | |
| | | | Authority—Series A-1, VRDN | | | | |
| | | | (SPA: DEPFA Bank PLC) | | | | |
| | | | 0.600%, 06/01/2037 | | | | |
| | | | (Putable on 05/07/2010) (a) | | | 7,700,000 | |
| | 2,250,000 | | Lewisburg Industrial Development | | | | |
| | | | Board, Waste Management, Inc. | | | | |
| | | | 2.500%, 07/01/2012 . . . . . . . . . . | | | 2,280,263 | |
| | 2,365,000 | | Metropolitan Government | | | | |
| | | | Nashville & Davidson County | | | | |
| | | | Health & Educational Facilities | | | | |
| | | | Board Revenue, Swiss Ridge | | | | |
| | | | Apartments, VRDN | | | | |
| | | | (LOC: Regions Bank) | | | | |
| | | | 1.000%, 12/01/2027 | | | | |
| | | | (Putable on 05/07/2010) (a) | | | 2,365,000 | |
| | 3,450,000 | | Metropolitan Government | | | | |
| | | | Nashville & Davidson County | | | | |
| | | | Health & Educational Facilities | | | | |
| | | | Board | | | | |
| | | | Revenue, Wedgewood— | | | | |
| | | | Series A, VRDN | | | | |
| | | | (LOC: Regions Bank) | | | | |
| | | | 1.000%, 06/01/2034 | | | | |
| | | | (Putable on 05/07/2010) (a) | | | 3,450,000 | |
| | 8,400,000 | | Sevier County Public Building | | | | |
| | | | Authority, VRDN | | | | |
| | | | (SPA: DEPFA Bank PLC) | | | | |
| | | | 0.600%, 06/01/2034 | | | | |
| | | | (Putable on 05/07/2010) (a) | | | 8,400,000 | |
| Principal | | Security | | | |
| Amount | | Description | | Value | |
| Municipal Bonds—continued | | | |
| Tennessee—continued | | | |
| $ | 6,355,000 | | Shelby County Health Educational | | | |
| | | | & Housing Facilities Board, | | | |
| | | | Eden Pointe Apartments, VRDN | | | |
| | | | (LOC: Regions Bank) | | | |
| | | | 1.000%, 03/01/2040 | | | |
| | | | (Putable on 05/07/2010) (a) | | $ | 6,355,000 | |
| | 1,700,000 | | Wilson County Industrial | | | | |
| | | | Development Board, Rock | | | | |
| | | | Tennessee Converting Co., VRDN | | | | |
| | | | (LOC: SunTrust Bank) | | | | |
| | | | 0.880%, 07/01/2035 | | | | |
| | | | (Putable on 05/07/2010) (a) | | | 1,700,000 | |
| | | | | | | 51,499,445 | |
| Texas—3.7% | | | | | | |
| | 410,000 | | Capital Area Cultural Education | | | | |
| | | | Facilities Finance Corp., Roman | | | | |
| | | | Catholic Diocese—Series A | | | | |
| | | | 4.000%, 04/01/2011 . . . . . . . . . . | | | 415,133 | |
| | 6,000,000 | | Gulf Coast Industrial Development | | | | |
| | | | Authority Revenue, Cinergy | | | | |
| | | | Solutions, VRDN | | | | |
| | | | 1.550%, 05/01/2039 | | | | |
| | | | (Putable on 05/07/2010) (a) | | | 6,000,000 | |
| | 15,600,000 | | Harris County Health Facilities | | | | |
| | | | Development Corp., Ars-Christus | | | | |
| | | | Health—Series A-3, ARN | | | | |
| | | | (CS: AGM) | | | | |
| | | | 1.080%, 07/01/2031 | | | | |
| | | | (Putable on 05/06/2010) (a) | | | 15,600,000 | |
| | 2,275,000 | | Harris County Health Facilities | | | | |
| | | | Development Corp., Ars-Christus | | | | |
| | | | Health—Series A-5, ARN | | | | |
| | | | (CS: AGM) | | | | |
| | | | 0.880%, 07/01/2036 | | | | |
| | | | (Putable on 05/06/2010) (a) | | | 2,275,000 | |
| | 2,000,000 | | Houston Airport Systems Revenue, | | | | |
| | | | People Mover—Series A | | | | |
| | | | (CS: AGM) | | | | |
| | | | 5.375%, 07/15/2010 . . . . . . . . . . | | | 2,004,440 | |
| | 1,000,000 | | Houston Airport Systems Revenue, | | | | |
| | | | Subordinated Lien—Series A | | | | |
| | | | (CS: AGM) | | | | |
| | | | 5.875%, 07/01/2012 . . . . . . . . . . | | | 1,007,110 | |
| | 500,000 | | Lufkin Health Facilities | | | | |
| | | | Development Corp., Memorial | | | | |
| | | | Health System of East Texas | | | | |
| | | | 3.500%, 02/15/2011 . . . . . . . . . . | | | 502,660 | |
| | 1,000,000 | | Matagorda County Navigation | | | | |
| | | | District No. 1, AEP Texas Central | | | | |
| | | | Company | | | | |
| | | | 5.125%, 06/01/2011 . . . . . . . . . . | | | 1,033,080 | |
| | 3,000,000 | | Mission Economic Development | | | | |
| | | | Corp., Waste Management, Inc. | | | | |
| | | | 2.000%, 06/01/2010 . . . . . . . . . . | | | 3,000,960 | |
| | 2,500,000 | | North Texas Tollway Authority | | | | |
| | | | Revenue—Series H | | | | |
| | | | 5.000%, 01/01/2011 . . . . . . . . . . | | | 2,560,800 | |
| | 4,970,000 | | North Texas Tollway Authority | | | | |
| | | | Revenue, First Tier—Series L-1 | | | | |
| | | | 5.500%, 01/01/2038 | | | | |
| | | | (Putable on 01/01/2011) . . . . . . | | | 5,102,749 | |
The accompanying notes are an integral part of these financial statements.
Alpine Ultra Short Tax Optimized Income Fund
Schedule of Portfolio Investments—Continued
April 30, 2010 (Unaudited)
| | Principal | | Security | | | |
| | Amount | | Description | | Value | |
| Municipal Bonds—continued | | | |
| Texas—continued | | | |
| | $ | 500,000 | | Sabine River Industrial | | | |
| | | | | Development Authority, | | | |
| | | | | Floating/Fixed Northeast Texas | | | |
| | | | | NRU-84Q | | | |
| | | | | 1.480%, 08/15/2014 | | | |
| | | | | (Putable on 08/16/2010) . . . . . . | | $ | 499,910 | |
| | | 5,380,000 | | San Antonio Airport System | | | | |
| | | | | Revenue—Series 2003 | | | | |
| | | | | (CS: AGM) | | | | |
| | | | | 6.000%, 07/01/2010 . . . . . . . . . . | | | 5,424,600 | |
| | | 2,000,000 | | State Municipal Gas Acquisition | | | | |
| | | | | & Supply Corp.—Series A | | | | |
| | | | | 5.000%, 12/15/2010 . . . . . . . . . . | | | 2,036,340 | |
| | | 5,000,000 | | State Transportation Commission, | | | | |
| | | | | First Tier | | | | |
| | | | | 5.000%, 02/15/2011 . . . . . . . . . . | | | 5,131,150 | |
| | | 2,850,000 | | Waxahachie Industrial | | | | |
| | | | | Development Authority Revenue, | | | | |
| | | | | VRDN | | | | |
| | | | | (LOC: SunTrust Bank) | | | | |
| | | | | 0.680%, 06/01/2013 | | | | |
| | | | | (Putable on 05/07/2010) (a) | | | 2,850,000 | |
| | | | | | | | 55,443,932 | |
| Vermont—0.2% | | | | |
| | | 2,435,000 | | State Economic Development | | | | |
| | | | | Authority, Hazelett | | | | |
| | | | | Strip-Casting, VRDN | | | | |
| | | | | (LOC: Keybank N.A.) | | | | |
| | | | | 0.640%, 12/01/2012 | | | | |
| | | | | (Putable on 05/07/2010) (a) | | | 2,435,000 | |
| Virgin Islands—0.1% | | | | |
| | | 500,000 | | Public Finance Authority | | | | |
| | | | | Revenue—Series B | | | | |
| | | | | 5.000%, 10/01/2010 . . . . . . . . . . | | | 507,080 | |
| | | 425,000 | | Water & Power Authority | | | | |
| | | | | Revenue—Series A | | | | |
| | | | | 4.000%, 07/01/2011 . . . . . . . . . . | | | 434,750 | |
| | | | | | | | 941,830 | |
| Virginia—1.6% | | | | |
| | | 3,500,000 | | Alexandria Industrial | | | | |
| | | | | Development Authority, | | | | |
| | | | | American Association for the | | | | |
| | | | | Study of Liver Diseases, VRDN | | | | |
| | | | | (LOC: SunTrust Bank) | | | | |
| | | | | 0.750%, 08/01/2036 | | | | |
| | | | | (Putable on 05/07/2010) (a) | | | 3,500,000 | |
| | | 6,700,000 | | Capital Beltway Funding Corp., | | | | |
| | | | | Hot Lanes—Series B, VRDN | | | | |
| | | | | (LOC: Banco Espirito Santo SA) | | | | |
| | | | | 3.600%, 12/31/2047 | | | | |
| | | | | (Putable on 05/07/2010) (a) | | | 6,700,000 | |
| | | | | Louisa Industrial Development | | | | |
| | | | | Authority, Electric & Power Co.— | | | | |
| | | | | Series A | | | | |
| | | 2,000,000 | | 1.375%, 04/01/2011 . . . . . . . . . . | | | 2,000,540 | |
| | | 5,000,000 | | 1.375%, 04/01/2011 . . . . . . . . . . | | | 5,001,350 | |
| Principal | | Security | | | |
| Amount | | Description | | Value | |
| Municipal Bonds—continued | | | |
| Virginia—continued | | | |
| $ | 6,975,000 | | Staunton Industrial Development | | | |
| | | | Authority, Specialty Blades, Inc., | | | |
| | | | VRDN | | | |
| | | | (LOC: SunTrust Bank) | | | |
| | | | 1.300%, 02/01/2027 | | | |
| | | | (Putable on 05/07/2010) (a) | | $ | 6,975,000 | |
| | | | | | | 24,176,890 | |
| Washington—2.4% | | | | |
| | 7,715,000 | | Everett Public Facilities District, | | | | |
| | | | VRDN | | | | |
| | | | (SPA: DEXIA Credit Local) | | | | |
| | | | 0.650%, 04/01/2036 | | | | |
| | | | (Putable on 05/07/2010) (a) | | | 7,715,000 | |
| | 700,000 | | King County Housing Authority, | | | | |
| | | | YWCA Family Village—Issaquah | | | | |
| | | | (CS: County Guaranteed) | | | | |
| | | | 2.400%, 01/01/2013 . . . . . . . . . . | | | 700,784 | |
| | 1,400,000 | | State Economic Development | | | | |
| | | | Finance Authority Revenue, | | | | |
| | | | Belina Interiors, Inc.—Series E, | | | | |
| | | | VRDN | | | | |
| | | | (LOC: Keybank N.A) | | | | |
| | | | 0.850%, 08/01/2033 | | | | |
| | | | (Putable on 05/07/2010) (a) | | | 1,400,000 | |
| | 1,110,000 | | State Economic Development | | | | |
| | | | Finance Authority Revenue, | | | | |
| | | | Belina Interiors, Inc.—Series F, | | | | |
| | | | VRDN | | | | |
| | | | (LOC: Keybank N.A.) | | | | |
| | | | 3.750%, 11/01/2023 | | | | |
| | | | (Putable on 05/07/2010) (a) | | | 1,110,000 | |
| | 4,545,000 | | State Economic Development | | | | |
| | | | Finance Authority Revenue, | | | | |
| | | | Waste Management, ARN | | | | |
| | | | 1.000%, 09/01/2010 . . . . . . . . . . | | | 4,546,136 | |
| | 20,000,000 | | State Economic Development | | | | |
| | | | Finance Authority Revenue, | | | | |
| | | | Waste Management— | | | | |
| | | | Series D, ARN | | | | |
| | | | 1.000%, 09/01/2010 . . . . . . . . . . | | | 20,005,000 | |
| | | | | | | 35,476,920 | |
| West Virginia—0.2% | | | | |
| | 3,000,000 | | Economic Development Authority | | | | |
| | | | Revenue, Appalachian Power Co. | | | | |
| | | | 7.125%, 06/01/2010 . . . . . . . . . . | | | 3,010,500 | |
| Wisconsin—3.0% | | | | |
| | 2,000,000 | | Baraboo Industrial Development | | | | |
| | | | Revenue, Teel Plastics, Inc., VRDN | | | | |
| | | | (LOC: M&I Bank) | | | | |
| | | | 2.090%, 11/01/2042 | | | | |
| | | | (Putable on 05/07/2010) (a) | | | 2,000,000 | |
| | 1,035,000 | | Mequon Industrial Development | | | | |
| | | | Revenue, SPI Lighting, VRDN | | | | |
| | | | (LOC: M&I Bank) | | | | |
| | | | 2.090%, 12/01/2023 | | | | |
| | | | (Putable on 05/07/2010) (a) | | | 1,035,000 | |
| | 250,000 | | Milwaukee County Airport | | | | |
| | | | Revenue—Series B | | | | |
| | | | 2.250%, 12/01/2010 . . . . . . . . . . | | | 250,168 | |
The accompanying notes are an integral part of these financial statements.
Alpine Ultra Short Tax Optimized Income Fund April 30, 2010 (Unaudited)
| Principal | | Security | | | |
| Amount | | Description | | Value | |
| Municipal Bonds—continued | | | |
| Wisconsin—continued | | | |
| $ | 1,200,000 | | Rhinelander Industrial | | | |
| | | | Development Revenue, Superior | | | |
| | | | Diesel/SDI Properties, VRDN | | | |
| | | | (LOC: Bank of New York) | | | |
| | | | 0.660%, 07/01/2021 | | | |
| | | | (Putable on 05/07/2010) (a) | | $ | 1,200,000 | |
| | 16,600,000 | | State Health & Educational | | | | |
| | | | Facilities Authority, Bay Area | | | | |
| | | | Medical Center, Inc., VRDN | | | | |
| | | | (LOC: M&I Bank) | | | | |
| | | | 2.000%, 02/01/2038 | | | | |
| | | | (Putable on 05/07/2010) (a) | | | 16,600,000 | |
| | 10,500,000 | | State Health & Educational | | | | |
| | | | Facilities Authority, Mercy | | | | |
| | | | Alliance, Inc., VRDN | | | | |
| | | | (LOC: M&I Bank) | | | | |
| | | | 1.250%, 06/01/2022 | | | | |
| | | | (Putable on 05/07/2010) (a) | | | 10,500,000 | |
| | 10,060,000 | | State Health & Educational | | | | |
| | | | Facilities Authority, Oakwood | | | | |
| | | | Village, VRDN | | | | |
| | | | (LOC: M&I Bank) | | | | |
| | | | 1.250%, 08/15/2028 | | | | |
| | | | (Putable on 05/07/2010) (a) | | | 10,060,000 | |
| | 1,200,000 | | State Health & Educational | | | | |
| | | | Facilities Authority, Sinai | | | | |
| | | | Samaritan—Series A, VRDN | | | | |
| | | | (LOC: M&I Bank) | | | | |
| | | | 1.910%, 09/01/2019 | | | | |
| | | | (Putable on 05/07/2010) (a) | | | 1,200,000 | |
| | Principal | | Security | | | |
| | Amount | | Description | | Value | |
| Municipal Bonds—continued | | | |
| Wisconsin—continued | | | |
| | $ | 1,000,000 | | Whitewater Community | | | |
| | | | | Development Authority, | | | |
| | | | | Wisconsin Housing Preservation, | | | |
| | | | | VRDN | | | |
| | | | | (LOC: M&I Bank) | | | |
| | | | | 1.910%, 06/01/2042 | | | |
| | | | | (Putable on 05/07/2010) (a) | | $ | 1,000,000 | |
| | | | | | | | 43,845,168 | |
| Wyoming—0.2% | | | | |
| | | 2,855,000 | | Gillette Environmental | | | | |
| | | | | Improvement Revenue, | | | | |
| | | | | Black Hills Power and Light | | | | |
| | | | | Co.—Series A, VRDN | | | | |
| | | | | 6.000%, 06/01/2024 | | | | |
| | | | | (Putable on 05/07/2010) (a) | | | 2,855,000 | |
| | | | | Total Municipal Bonds | | | | |
| | | | | (Cost $1,417,765,232) . . . . . . . . | | | 1,419,759,280 | |
| | Shares | | | | | | |
| Money Market Funds—0.0%* | | | | |
| | | 72,607 | | SEI Tax Exempt Trust—Institutional | | | | |
| | | | | Tax Free Fund—Class A, 0.05% | | | 72,607 | |
| | | | | Total Money Market Funds | | | | |
| | | | | (Cost $72,607) . . . . . . . . . . . . . . | | | 72,607 | |
| | | | | Total Investments | | | | |
| | | | | (Cost $1,417,837,839) 96.0% | | | 1,419,831,887 | |
| | | | | Other Assets in Excess of | | | | |
| | | | | Liabilities—4.0% . . . . . . . . . . . . | | | 58,509,839 | |
| | | | | TOTAL NET ASSETS 100.0% | | | | |
| | | | | | | $ | 1,478,341,726 | |
Percentages are stated as a percent of net assets.
*Amount is less than 0.05%.
(a) Variable Rate Security—The rate reported is the rate in effect as of April 30, 2010.
(b) Restricted under Rule 144A of the Securities Act of 1933. These securities may be resold in transactions exempt from registration, normally to qualified institutional buyers. These securities have been determined to be liquid under guidelines established by the Board of Trustees. Liquid securities restricted under Rule 144A comprised less than 0.05% of the Fund’s net assets.
(c) Restricted under Rule 144A of the Securities Act of 1933. These securities may be resold in transactions exempt from registration, normally to qualified institutional buyers. These securities have been determined to be illiquid under guidelines established by the Board of Trustees. Illiquid securities restricted under Rule 144A comprised 0.2% of the Fund’s net assets.
(d) Security fair valued in accordance with procedures approved by the Board of Trustees. These securities comprised 0.2% of the Fund’s net assets.
ARN—Auction Rate Note
Co.—Company
Corp.—Corporation
CS—Credit Support
CSP—Continental Structural Plastics
Inc.—Incorporated
LIQ—Liquidity Facility
LLC—Limited Liability Company
LP—Limited Partnership
LOC—Line of Credit
Ltd.—Limited
N.A.—North America
No.—Number
SPA—Standby Purchase Agreement
VRDN—Variable Rate Demand Note
The accompanying notes are an integral part of these financial statements.
Alpine Municipal Money Market Fund April 30, 2010 (Unaudited)
| Principal | | Security | | | |
| Amount | | Description | | Value | |
| Municipal Bonds—93.9% | | | |
| Alabama—0.7% | | | |
| $ | 4,000,000 | | Demopolis Industrial Development | | | |
| | | | Board, Delaware Mesa Farms, | | | |
| | | | VRDN | | | |
| | | | (LOC: Wells Fargo Bank N.A.) | | | |
| | | | 0.450%, 10/01/2019 | | | |
| | | | (Putable on 05/07/2010) (a) | | $ | 4,000,000 | |
| Alaska—0.1% | | | | | | |
| | 565,000 | | Industrial Development & Export | | | | |
| | | | Authority—Lot 12, VRDN | | | | |
| | | | (LOC: Bank of America N.A.) | | | | |
| | | | 0.820%, 07/01/2012 | | | | |
| | | | (Putable on 05/07/2010) (a) | | | 565,000 | |
| California—6.3% | | | | |
| | 1,300,000 | | San Francisco City & Country | | | | |
| | | | Redevelopment Agency, | | | | |
| | | | South Harbor, VRDN | | | | |
| | | | (LOC: DEXIA Credit Local) | | | | |
| | | | 0.670%, 12/01/2016 | | | | |
| | | | (Putable on 05/07/2010) (a) | | | 1,300,000 | |
| | 3,510,000 | | State Infrastructure & Economic | | | | |
| | | | Development Bank, Southern | | | | |
| | | | California Public Radio, VRDN | | | | |
| | | | (LOC: Allied Irish Bank PLC) | | | | |
| | | | 0.520%, 09/01/2025 | | | | |
| | | | (Putable on 05/03/2010) (a) | | | 3,510,000 | |
| | 24,435,000 | | State of California—Series DCL-049, | | | | |
| | | | VRDN | | | | |
| | | | (CS: AGM; LIQ, LOC: DEXIA | | | | |
| | | | Credit Local) | | | | |
| | | | 0.550%, 08/01/2032 | | | | |
| | | | (Putable on 05/07/2010) (a) | | | 24,435,000 | |
| | 4,000,000 | | Statewide Communities | | | | |
| | | | Development Authority, | | | | |
| | | | Delaware Mesa Farms—Series A, | | | | |
| | | | VRDN | | | | |
| | | | (LOC: Wells Fargo Bank N.A.) | | | | |
| | | | 0.450%, 05/01/2019 | | | | |
| | | | (Putable on 05/07/2010) (a) | | | 4,000,000 | |
| | 450,000 | | Statewide Communities | | | | |
| | | | Development Authority, | | | | |
| | | | Metropolitan Area Advisory, VRDN | | | | |
| | | | (LOC: Bank of America N.A.) | | | | |
| | | | 0.450%, 04/01/2032 | | | | |
| | | | (Putable on 05/07/2010) (a) | | | 450,000 | |
| | | | | | | 33,695,000 | |
| Colorado—1.0% | | | | |
| | 2,240,000 | | Housing & Finance Authority | | | | |
| | | | Economic Development Revenue, | | | | |
| | | | Cytoskeleton Inc., VRDN | | | | |
| | | | (LOC: Compass Bank) | | | | |
| | | | 0.550%, 11/01/2031 | | | | |
| | | | (Putable on 05/07/2010) (a) | | | 2,240,000 | |
| | 1,250,000 | | Housing & Finance Authority Economic | |
| | | | Development Revenue, Top S | | | | |
| | | | hop—Series A, VRDN | | | | |
| | | | (LOC: JPMorgan Chase Bank) | | | | |
| | | | 0.550%, 09/01/2035 | | | | |
| | | | (Putable on 05/07/2010) (a) | �� | | 1,250,000 | |
| Principal | | Security | | | |
| Amount | | Description | | Value | |
| Municipal Bonds—continued | | | |
| Colorado—continued | | | |
| $ | 1,737,000 | | Jefferson County Industrial | | | |
| | | | Development Revenue, | | | |
| | | | Epi-Center LLC, VRDN | | | |
| | | | (LOC: JPMorgan Chase Bank) | | | |
| | | | 0.550%, 12/01/2025 | | | |
| | | | (Putable on 05/07/2010) (a) | | $ | 1,737,000 | |
| | | | | | | 5,227,000 | |
| Florida—8.3% | | | | | | |
| | | | Citizens Property Insurance Corp., | | | | |
| | | | Senior Secured High Risk | | | | |
| | | | Notes—Series A-2 | | | | |
| | | | (LOC: Citizens Property | | | | |
| | | | Insurance Corp.) | | | | |
| | 20,000,000 | | 4.500%, 06/01/2010 . . . . . . . . . . | | | 20,015,491 | |
| | 6,000,000 | | 2.000%, 04/21/2011 . . . . . . . . . . | | | 6,041,479 | |
| | 7,995,000 | | Hillsborough County Aviation | | | | |
| | | | Authority, Putters—Series 3021, | | | | |
| | | | VRDN | | | | |
| | | | (CS: Assured Guaranty Corp.; | | | | |
| | | | LIQ: JPMorgan Chase Bank) | | | | |
| | | | 0.450%, 04/01/2016 | | | | |
| | | | (Putable on 05/07/2010) (a) | | | 7,995,000 | |
| | 3,705,000 | | Manatee County Industrial | | | | |
| | | | Development Revenue, | | | | |
| | | | Gaemmerler U.S. Corp., VRDN | | | | |
| | | | (LOC: Bank of America N.A.) | | | | |
| | | | 0.520%, 10/01/2035 | | | | |
| | | | (Putable on 05/07/2010) (a) | | | 3,705,000 | |
| | 1,850,000 | | Marion County Industrial | | | | |
| | | | Development Authority, | | | | |
| | | | Universal Forest Products, VRDN | | | | |
| | | | (LOC: JPMorgan Chase Bank) | | | | |
| | | | 0.520%, 11/01/2021 | | | | |
| | | | (Putable on 05/07/2010) (a) | | | 1,850,000 | |
| | 2,800,000 | | Miami—Dade County Industrial | | | | |
| | | | Development Authority, | | | | |
| | | | Atlas Packaging, Inc., VRDN | | | | |
| | | | (LOC: Banco De Sabadell) | | | | |
| | | | 1.650%, 10/01/2027 | | | | |
| | | | (Putable on 05/07/2010) (a) | | | 2,800,000 | |
| | 1,790,000 | | Polk County Industrial | | | | |
| | | | Development Authority, Elite | | | | |
| | | | Building Products, Inc., VRDN | | | | |
| | | | (LOC: Wells Fargo Bank N.A.) | | | | |
| | | | 0.670%, 10/01/2027 | | | | |
| | | | (Putable on 05/07/2010) (a) | | | 1,790,000 | |
| | | | | | | 44,196,970 | |
| Georgia—1.2% | | | | |
| | 2,450,000 | | Atlanta Urban Residential Finance | | | | |
| | | | Authority Revenue, New | | | | |
| | | | Community East Lake, VRDN | | | | |
| | | | (LOC: Bank of America N.A.) | | | | |
| | | | 0.400%, 11/01/2028 | | | | |
| | | | (Putable on 05/07/2010) (a) | | | 2,450,000 | |
The accompanying notes are an integral part of these financial statements.
Alpine Municipal Money Market Fund April 30, 2010 (Unaudited)
| Principal | | Security | | | |
| Amount | | Description | | Value | |
| Municipal Bonds—continued | | | |
| Georgia—continued | | | |
| $ | 4,000,000 | | Fulton County Development | | | |
| | | | Authority Industrial | | | |
| | | | Development Revenue, Leggett | | | |
| | | | & Platt, Inc., VRDN | | | |
| | | | (LOC: Wells Fargo Bank N.A.) | | | |
| | | | 0.630%, 06/01/2027 | | | |
| | | | (Putable on 05/07/2010) (a) | | $ | 4,000,000 | |
| | | | | | | 6,450,000 | |
| Illinois—6.9% | | | | | | |
| | 6,660,000 | | Aurora Economic Development | | | | |
| | | | Revenue, Aurora Christian | | | | |
| | | | Schools, Inc., VRDN | | | | |
| | | | (LOC: Fifth Third Bank) | | | | |
| | | | 0.600%, 06/01/2029 | | | | |
| | | | (Putable on 05/07/2010) (a) | | | 6,660,000 | |
| | 2,600,000 | | Aurora Economic Development | | | | |
| | | | Revenue, Christian Schools, | | | | |
| | | | Inc.—Series B, VRDN | | | | |
| | | | (LOC: Fifth Third Bank) | | | | |
| | | | 0.600%, 06/01/2029 | | | | |
| | | | (Putable on 05/07/2010) (a) | | | 2,600,000 | |
| | 210,000 | | Carol Stream Industrial | | | | |
| | | | Development Revenue, | | | | |
| | | | MI Enterprises, VRDN | | | | |
| | | | (LOC: JPMorgan Chase Bank) | | | | |
| | | | 0.750%, 12/01/2025 | | | | |
| | | | (Putable on 05/07/2010) (a) | | | 210,000 | |
| | 1,375,000 | | Finance Authority Industrial | | | | |
| | | | Development Revenue, | | | | |
| | | | 2500 DevelGroup LLC— | | | | |
| | | | Series A, VRDN | | | | |
| | | | (LOC: JPMorgan Chase Bank) | | | | |
| | | | 0.850%, 01/01/2021 | | | | |
| | | | (Putable on 05/07/2010) (a) | | | 1,375,000 | |
| | 1,495,000 | | Finance Authority Industrial | | | | |
| | | | Development Revenue, | | | | |
| | | | Alpha Beta Press, Inc., VRDN | | | | |
| | | | (LOC: JPMorgan Chase Bank) | | | | |
| | | | 0.850%, 06/01/2020 | | | | |
| | | | (Putable on 05/07/2010) (a) | | | 1,495,000 | |
| | 3,650,000 | | Finance Authority Industrial | | | | |
| | | | Development Revenue, | | | | |
| | | | Amtex Steel, Inc., VRDN | | | | |
| | | | (LOC: Bank of America N.A.) | | | | |
| | | | 0.450%, 10/01/2019 | | | | |
| | | | (Putable on 05/07/2010) (a) | | | 3,650,000 | |
| | 555,000 | | Finance Authority Industrial | | | | |
| | | | Development Revenue, | | | | |
| | | | Church Road Partnership, VRDN | | | | |
| | | | (LOC: JPMorgan Chase Bank) | | | | |
| | | | 0.850%, 10/01/2017 | | | | |
| | | | (Putable on 05/07/2010) (a) | | | 555,000 | |
| | 2,125,000 | | Finance Authority Industrial | | | | |
| | | | Development Revenue, | | | | |
| | | | E Kinast Distributors, Inc.— | | | | |
| | | | Series A, VRDN | | | | |
| | | | (LOC: JPMorgan Chase Bank) | | | | |
| | | | 0.660%, 10/01/2025 | | | | |
| | | | (Putable on 05/07/2010) (a) | | | 2,125,000 | |
| Principal | | Security | | | |
| Amount | | Description | | Value | |
| Municipal Bonds—continued | | | |
| Illinois—continued | | | |
| $ | 440,000 | | Finance Authority Industrial | | | |
| | | | Development Revenue, | | | |
| | | | Fine Points LLC, VRDN | | | |
| | | | (LOC: JPMorgan Chase Bank) | | | |
| | | | 0.850%, 01/01/2018 | | | |
| | | | (Putable on 05/07/2010) (a) | | $ | 440,000 | |
| | 4,300,000 | | Finance Authority Industrial | | | | |
| | | | Development Revenue, | | | | |
| | | | Flying Food Fare, Inc., VRDN | | | | |
| | | | (LOC: Bank of Montreal) | | | | |
| | | | 0.580%, 07/01/2028 | | | | |
| | | | (Putable on 05/07/2010) (a) | | | 4,300,000 | |
| | 1,040,000 | | Finance Authority Industrial | | | | |
| | | | Development Revenue, | | | | |
| | | | Haskris Co., VRDN | | | | |
| | | | (LOC: JPMorgan Chase Bank) | | | | |
| | | | 0.850%, 08/01/2021 | | | | |
| | | | (Putable on 05/07/2010) (a) | | | 1,040,000 | |
| | 3,000,000 | | Finance Authority Industrial | | | | |
| | | | Development Revenue, John | | | | |
| | | | Hofmeister & Son, Inc., VRDN | | | | |
| | | | (LOC: Bank of Montreal) | | | | |
| | | | 0.580%, 12/01/2037 | | | | |
| | | | (Putable on 05/07/2010) (a) | | | 3,000,000 | |
| | 990,000 | | Finance Authority Industrial | | | | |
| | | | Development Revenue, | | | | |
| | | | Merug LLC—Series B, VRDN | | | | |
| | | | (LOC: JPMorgan Chase Bank) | | | | |
| | | | 0.850%, 12/01/2018 | | | | |
| | | | (Putable on 05/07/2010) (a) | | | 990,000 | |
| | 4,000,000 | | Phoenix Realty Special Account—U | | | | |
| | | | LP Multifamily Revenue, | | | | |
| | | | Brightons Mark, VRDN | | | | |
| | | | (LOC: Northern Trust Company) | | | | |
| | | | 0.480%, 04/01/2020 | | | | |
| | | | (Putable on 05/07/2010) (a) | | | 4,000,000 | |
| | 1,800,000 | | Richton Park Industrial | | | | |
| | | | Development Revenue, | | | | |
| | | | Avatar Corp., VRDN | | | | |
| | | | (LOC: PNC Bank N.A.) | | | | |
| | | | 0.410%, 04/01/2027 | | | | |
| | | | (Putable on 05/07/2010) (a) | | | 1,800,000 | |
| | 2,720,000 | | Woodridge Du Page Will & Cook | | | | |
| | | | Counties Industrial Development | | | | |
| | | | Revenue, Home Run Inn | | | | |
| | | | Frozen Foods, VRDN | | | | |
| | | | (LOC: JPMorgan Chase Bank) | | | | |
| | | | 0.850%, 10/01/2025 | | | | |
| | | | (Putable on 05/07/2010) (a) | | | 2,720,000 | |
| | | | | | | 36,960,000 | |
| Indiana—3.0% | | | | |
| | 1,700,000 | | Finance Authority Industrial | | | | |
| | | | Revenue, IB & B LLC— | | | | |
| | | | Series A, VRDN | | | | |
| | | | (LOC: Bank of Montreal) | | | | |
| | | | 0.520%, 04/01/2036 | | | | |
| | | | (Putable on 05/07/2010) (a) | | | 1,700,000 | |
The accompanying notes are an integral part of these financial statements.
Alpine Municipal Money Market Fund April 30, 2010 (Unaudited)
| Principal | | Security | | | |
| Amount | | Description | | Value | |
| Municipal Bonds—continued | | | |
| Indiana—continued | | | |
| $ | 3,385,000 | | Hobart Economic Development | | | |
| | | | Revenue, Albanese | | | |
| | | | Confectionery—Series A, VRDN | | | |
| | | | (LOC: Bank of Montreal) | | | |
| | | | 0.580%, 07/01/2031 | | | |
| | | | (Putable on 05/07/2010) (a) | | $ | 3,385,000 | |
| | 1,300,000 | | State Health Facility Financing | | | | |
| | | | Authority, Southern Industry | | | | |
| | | | Rehab Hospital, VRDN | | | | |
| | | | (LOC: JPMorgan Chase Bank) | | | | |
| | | | 0.600%, 04/01/2020 | | | | |
| | | | (Putable on 05/07/2010) (a) | | | 1,300,000 | |
| | 9,540,000 | | Valparaiso Economic | | | | |
| | | | Development Revenue, | | | | |
| | | | Task Force Tips, Inc., VRDN | | | | |
| | | | (LOC: Bank of Montreal) | | | | |
| | | | 0.520%, 05/01/2033 | | | | |
| | | | (Putable on 05/07/2010) (a) | | | 9,540,000 | |
| | | | | | | 15,925,000 | |
| Iowa—2.3% | | | | | | |
| | 4,580,000 | | Lakes Trust Various State— | | | | |
| | | | Series 2007-2, VRDN | | | | |
| | | | (LOC: Bank of America N.A.) | | | | |
| | | | 0.500%, 01/01/2026 | | | | |
| | | | (Putable on 05/07/2010) (a) | | | 4,580,000 | |
| | 7,590,000 | | Sergeant Bluff Industrial | | | | |
| | | | Development Revenue, | | | | |
| | | | Sioux City Brick & Tile Co., VRDN | | | | |
| | | | (LOC: U.S. Bank N.A.) | | | | |
| | | | 0.410%, 03/01/2016 | | | | |
| | | | (Putable on 05/07/2010) (a) | | | 7,590,000 | |
| | | | | | | 12,170,000 | |
| Kansas—0.2% | | | | | | |
| | 1,110,000 | | State Development Finance | | | | |
| | | | Authority Multifamily Housing | | | | |
| | | | Revenue, Four Seasons | | | | |
| | | | Apartments, VRDN | | | | |
| | | | (LOC: U.S. Bank N.A.) | | | | |
| | | | 0.500%, 04/01/2036 | | | | |
| | | | (Putable on 05/07/2010) (a) | | | 1,110,000 | |
| Kentucky—5.4% | | | | |
| | 300,000 | | Bardstown Industrial Development | | | | |
| | | | Revenue, JAV Investment LLC, | | | | |
| | | | VRDN | | | | |
| | | | (LOC: JPMorgan Chase Bank) | | | | |
| | | | 0.850%, 06/01/2031 | | | | |
| | | | (Putable on 05/07/2010) (a) | | | 300,000 | |
| | 28,175,000 | | Danville Commercial Paper | | | | |
| | | | (LOC: Fifth Third Bank) | | | | |
| | | | 0.500%, 5/13/2010 . . . . . . . . . . . | | | 28,175,000 | |
| | 510,000 | | Hancock County Industrial | | | | |
| | | | Development Revenue, | | | | |
| | | | Precision Roll Grinders, VRDN | | | | |
| | | | (LOC: JPMorgan Chase Bank) | | | | |
| | | | 0.850%, 06/01/2012 | | | | |
| | | | (Putable on 05/07/2010) (a) | | | 510,000 | |
| | | | | | | 28,985,000 | |
| Principal | | Security | | | |
| Amount | | Description | | Value | |
| Municipal Bonds—continued | | | |
| Louisiana—0.2% | | | | | |
| $ | 1,040,000 | | Local Government Environmental | | | |
| | | | Facilities & Communities | | | |
| | | | Development Authority, | | | |
| | | | Hollybrook Cottonseed | | | |
| | | | Processing, LLC, VRDN | | | |
| | | | (LOC: Wells Fargo Bank N.A.) | | | |
| | | | 0.600%, 11/01/2026 | | | |
| | | | (Putable on 05/07/2010) (a) | | $ | 1,040,000 | |
| Massachusetts—2.9% | | | | |
| | 11,050,000 | | State Development Finance | | | | |
| | | | Agency, Boston University— | | | | |
| | | | Series U-6c, VRDN | | | | |
| | | | (LOC: Allied Irish Bank PLC) | | | | |
| | | | 0.500%, 10/01/2042 | | | | |
| | | | (Putable on 05/07/2010) (a) | | | 11,050,000 | |
| | 3,000,000 | | State Development Finance | | | | |
| | | | Agency, Bridgewell, Inc.— | | | | |
| | | | Series A, VRDN | | | | |
| | | | (LOC: Keybank N.A.) | | | | |
| | | | 0.390%, 06/01/2030 | | | | |
| | | | (Putable on 05/07/2010) (a) | | | 3,000,000 | |
| | 1,400,000 | | State Development Finance | | | | |
| | | | Agency, Mehmark New England, | | | | |
| | | | VRDN | | | | |
| | | | (LOC: TD Bank N.A.) | | | | |
| | | | 0.280%, 07/01/2026 | | | | |
| | | | (Putable on 05/07/2010) (a) | | | 1,400,000 | |
| | | | | | | 15,450,000 | |
| Michigan—5.0% | | | | | | |
| | 6,900,000 | | Municipal Bond Authority | | | | |
| | | | Revenue—Series A | | | | |
| | | | 1.500%, 08/23/2010 . . . . . . . . . . | | | 6,920,570 | |
| | 300,000 | | Sterling Heights Economic | | | | |
| | | | Development Corp., | | | | |
| | | | Kunath Enterprises, LLC, VRDN | | | | |
| | | | (LOC: JPMorgan Chase Bank) | | | | |
| | | | 0.900%, 02/01/2016 | | | | |
| | | | (Putable on 05/07/2010) (a) | | | 300,000 | |
| | 1,450,000 | | Strategic Fund Limited Obligation | | | | |
| | | | Revenue, Dawnbreakers, LLC, | | | | |
| | | | VRDN | | | | |
| | | | (LOC: Fifth Third Bank) | | | | |
| | | | 0.670%, 05/01/2018 | | | | |
| | | | (Putable on 05/07/2010) (a) | | | 1,450,000 | |
| | 7,600,000 | | Strategic Fund Limited Obligation | | | | |
| | | | Revenue, Glastender, Inc., VRDN | | | | |
| | | | (LOC: JPMorgan Chase Bank) | | | | |
| | | | 0.600%, 11/01/2023 | | | | |
| | | | (Putable on 05/07/2010) (a) | | | 7,600,000 | |
| | 2,980,000 | | Strategic Fund Limited Obligation | | | | |
| | | | Revenue, Greenpath, Inc., VRDN | | | | |
| | | | (LOC: Fifth Third Bank) | | | | |
| | | | 0.580%, 12/01/2017 | | | | |
| | | | (Putable on 05/07/2010) (a) | | | 2,980,000 | |
| | 1,570,000 | | Strategic Fund Limited Obligation | | | | |
| | | | Revenue, Kaja Enterprises, LLC, | | | | |
| | | | VRDN | | | | |
| | | | (LOC: PNC Bank N.A.) | | | | |
| | | | 0.410%, 07/01/2031 | | | | |
| | | | (Putable on 05/07/2010) (a) | | | 1,570,000 | |
The accompanying notes are an integral part of these financial statements.
Alpine Municipal Money Market Fund April 30, 2010 (Unaudited)
| | Principal | | Security | | | |
| | Amount | | Description | | Value | |
| Municipal Bonds—continued | | | |
| Michigan—continued | | | |
| | $ | 1,200,000 | | Strategic Fund Limited Obligation | | | |
| | | | | Revenue, Mold Masters Co., | | | |
| | | | | VRDN | | | |
| | | | | (LOC: JPMorgan Chase Bank) | | | |
| | | | | 0.850%, 08/01/2021 | | | |
| | | | | (Putable on 05/07/2010) (a) | | $ | 1,200,000 | |
| | | 1,995,000 | | Strategic Fund Limited Obligation | | | | |
| | | | | Revenue, Russell Investment Co., | | | | |
| | | | | VRDN | | | | |
| | | | | (LOC: Fifth Third Bank) | | | | |
| | | | | 0.710%, 05/01/2027 | | | | |
| | | | | (Putable on 05/07/2010) (a) | | | 1,995,000 | |
| | | 2,495,000 | | Strategic Fund Limited Obligation | | | | |
| | | | | Revenue, Sintel, Inc., VRDN | | | | |
| | | | | (LOC: Fifth Third Bank) | | | | |
| | | | | 0.580%, 10/01/2030 | | | | |
| | | | | (Putable on 05/07/2010) (a) | | | 2,495,000 | |
| | | | | | | | 26,510,570 | |
| Minnesota—0.3% | | | | |
| | | 1,510,000 | | Blooming Prairie Industrial | | | | |
| | | | | Development Revenue, | | | | |
| | | | | Metal Services, VRDN | | | | |
| | | | | (LOC: U.S. Bank N.A.) | | | | |
| | | | | 0.570%, 12/01/2026 | | | | |
| | | | | (Putable on 05/07/2010) (a) | | | 1,510,000 | |
| Mississippi—0.3% | | | | |
| | | 1,750,000 | | State Business Finance Corp., Epco | | | | |
| | | | | Carbondioxide Products, VRDN | | | | |
| | | | | (LOC: Comerica Bank) | | | | |
| | | | | 0.500%, 03/01/2017 | | | | |
| | | | | (Putable on 05/07/2010) (a) | | | 1,750,000 | |
| Missouri—3.9% | | | | |
| | | | | Springfield Industrial Development | | | | |
| | | | | Authority Revenue, | | | | |
| | | | | DMP Properties LLC, VRDN | | | | |
| | | | | (LOC: U.S. Bank N.A.) | | | | |
| | | 1,825,000 | | 0.500%, 08/01/2021 | | | | |
| | | | | (Putable on 05/07/2010) (a) | | | 1,825,000 | |
| | | 1,360,000 | | 0.500%, 08/01/2025 | | | | |
| | | | | (Putable on 05/07/2010) (a) | | | 1,360,000 | |
| | | 1,685,000 | | St. Charles County Industrial | | | | |
| | | | | Development Authority Revenue, | | | | |
| | | | | Patriot Machine, Inc., VRDN | | | | |
| | | | | (LOC: U.S. Bank N.A) | | | | |
| | | | | 0.500%, 06/01/2027 | | | | |
| | | | | (Putable on 05/07/2010) (a) | | | 1,685,000 | |
| | | 2,000,000 | | St. Joseph Industrial Development | | | | |
| | | | | Authority Revenue, Albaugh, | | | | |
| | | | | Inc.—Series A, VRDN | | | | |
| | | | | (LOC: U.S. Bank N.A.) | | | | |
| | | | | 0.500%, 11/01/2019 | | | | |
| | | | | (Putable on 05/07/2010) (a) | | | 2,000,000 | |
| | | 9,100,000 | | St. Louis Airport Revenue— | | | | |
| | | | | Series DCL-017, VRDN | | | | |
| | | | | (CS: AGM; LIQ, LOC: DEXIA | | | | |
| | | | | Credit Local) | | | | |
| | | | | 0.400%, 07/01/2022 | | | | |
| | | | | (Putable on 05/07/2010) (a) | | | 9,100,000 | |
| | Principal | | Security | | | |
| | Amount | | Description | | Value | |
| Municipal Bonds—continued | | | |
| Missouri—continued | | | |
| | $ | 4,800,000 | | State Environmental Improvement | | | |
| | | | | & Energy Resources Authority | | | |
| | | | | Revenue, Utilicorp | | | |
| | | | | United, Inc., VRDN | | | |
| | | | | (LOC: Bank of America N.A.) | | | |
| | | | | 1.000%, 05/01/2028 | | | |
| | | | | (Putable on 05/07/2010) (a) | | $ | 4,800,000 | |
| | | | | | | | 20,770,000 | |
| Nevada—0.6% | | | | |
| | | 3,170,000 | | Housing Division, Multi-Unit | | | | |
| | | | | Housing Revenue, Series A, VRDN | | | | |
| | | | | (LOC: Wells Fargo Bank N.A.) | | | | |
| | | | | 0.400%, 10/01/2030 | | | | |
| | | | | (Putable on 05/07/2010) (a) | | | 3,170,000 | |
| New Hampshire—2.1% | | | | |
| | | 2,000,000 | | State Business Finance Authority | | | | |
| | | | | Revenue, Mark H. Wentworth | | | | |
| | | | | Home, VRDN | | | | |
| | | | | (LOC: TD Bank N.A.) | | | | |
| | | | | 0.270%, 12/01/2036 | | | | |
| | | | | (Putable on 05/07/2010) (a) | | | 2,000,000 | |
| | | 9,000,000 | | State Health & Education Facilities, | | | | |
| | | | | Southern New Hampshire | | | | |
| | | | | University, VRDN | | | | |
| | | | | (LOC: TD Bank N.A.) | | | | |
| | | | | 0.270%, 01/01/2039 | | | | |
| | | | | (Putable on 05/07/2010) (a) | | | 9,000,000 | |
| | | | | | | | 11,000,000 | |
| New Jersey—2.2% | | | | |
| | | 1,200,000 | | Economic Development Authority, | | | | |
| | | | | Presbyterian Homes | | | | |
| | | | | Associated—Series S, VRDN | | | | |
| | | | | (LOC: TD Bank N.A.) | | | | |
| | | | | 0.260%, 04/01/2016 | | | | |
| | | | | (Putable on 05/07/2010) (a) | | | 1,200,000 | |
| | | 6,400,000 | | Economic Development Authority, | | | | |
| | | | | The Cooper Health System— | | | | |
| | | | | Series A, VRDN | | | | |
| | | | | (LOC: TD Bank N.A.) | | | | |
| | | | | 0.260%, 11/01/2038 | | | | |
| | | | | (Putable on 05/07/2010) (a) | | | 6,400,000 | |
| | | 4,300,000 | | Health Care Facilities Financing | | | | |
| | | | | Authority—Series A—3, VRDN | | | | |
| | | | | (LOC: Wells Fargo Bank N.A.) | | | | |
| | | | | 0.110%, 07/01/2035 | | | | |
| | | | | (Putable on 05/07/2010) (a) | | | 4,300,000 | |
| | | | | | | | 11,900,000 | |
| New Mexico—0.6% | | | | |
| | | 1,120,000 | | Albuquerque Industrial | | | | |
| | | | | Development Revenue, | | | | |
| | | | | Karsten Co.—Series A, VRDN | | | | |
| | | | | (LOC: U.S. Bank N.A.) | | | | |
| | | | | 0.610%, 12/01/2017 | | | | |
| | | | | (Putable on 05/07/2010) (a) | | | 1,120,000 | |
The accompanying notes are an integral part of these financial statements.
Alpine Municipal Money Market Fund April 30, 2010 (Unaudited)
| Principal | | Security | | | |
| Amount | | Description | | Value | |
| Municipal Bonds—continued | | | |
| New Mexico—continued | | | |
| $ | 1,830,000 | | Las Cruces Industrial Development | | | |
| | | | Revenue, Parkview Metal | | | |
| | | | Products, VRDN | | | |
| | | | (LOC: JPMorgan Chase Bank) | | | |
| | | | 0.850%, 06/01/2022 | | | |
| | | | (Putable on 05/07/2010) (a) | | $ | 1,830,000 | |
| | | | | | | 2,950,000 | |
| New York—5.9% | | | | |
| | 2,075,000 | | Albany Industrial Development | | | | |
| | | | Agency, Albany History | | | | |
| | | | Institute—Series A, VRDN | | | | |
| | | | (LOC: Keybank N.A.) | | | | |
| | | | 0.450%, 06/01/2019 | | | | |
| | | | (Putable on 05/07/2010) (a) | | | 2,075,000 | |
| | 4,000,000 | | Clinton County Industrial | | | | |
| | | | Development Agency, | | | | |
| | | | Champlain Valley Physicians | | | | |
| | | | Hospital—Series A, VRDN | | | | |
| | | | (CS: Radian; LOC: Keybank N.A.) | | | | |
| | | | 0.390%, 07/01/2042 | | | | |
| | | | (Putable on 05/07/2010) (a) | | | 4,000,000 | |
| | 1,800,000 | | Guilderland Industrial | | | | |
| | | | Development Agency, | | | | |
| | | | Multi-Mode-Wildwood— | | | | |
| | | | Series A, VRDN | | | | |
| | | | (LOC: Keybank N.A.) | | | | |
| | | | 0.490%, 07/01/2032 | | | | |
| | | | (Putable on 05/07/2010) (a) | | | 1,800,000 | |
| | 2,605,000 | | Monroe County Industrial | | | | |
| | | | Development Agency, | | | | |
| | | | Hillside Children’s Center, VRDN | | | | |
| | | | (LOC: Keybank N.A.) | | | | |
| | | | 0.490%, 08/01/2018 | | | | |
| | | | (Putable on 05/07/2010) (a) | | | 2,605,000 | |
| | 330,000 | | New York City Industrial | | | | |
| | | | Development Agency, | | | | |
| | | | Peninsula Hospital Center, VRDN | | | | |
| | | | (LOC: JPMorgan Chase Bank) | | | | |
| | | | 0.850%, 12/01/2013 | | | | |
| | | | (Putable on 05/07/2010) (a) | | | 330,000 | |
| | 19,300,000 | | New York Fiscal 2008, | | | | |
| | | | Subordinated—Series J-3, VRDN | | | | |
| | | | (LOC: Allied Irish Bank PLC) | | | | |
| | | | 0.450%, 08/01/2023 | | | | |
| | | | (Putable on 05/07/2010) (a) | | | 19,300,000 | |
| | 1,425,000 | | Otsego County Industrial | | | | |
| | | | Development Agency, Templeton | | | | |
| | | | Foundation—Series A, VRDN | | | | |
| | | | (LOC: Keybank N.A) | | | | |
| | | | 0.490%, 06/01/2027 | | | | |
| | | | (Putable on 05/07/2010) (a) | | | 1,425,000 | |
| | | | | | | 31,535,000 | |
| Ohio—2.7% | | | | | | |
| | 1,900,000 | | Bellevue Hospital Facilities, | | | | |
| | | | Bellevue Hospital, VRDN | | | | |
| | | | (LOC: Fifth Third Bank) | | | | |
| | | | 0.580%, 08/01/2033 | | | | |
| | | | (Putable on 05/07/2010) (a) | | | 1,900,000 | |
| | Principal | | Security | | | |
| | Amount | | Description | | Value | |
| Municipal Bonds—continued | | | |
| Ohio—continued | | | |
| | $ | 1,890,000 | | Clermont County Health Care | | | |
| | | | | Facilities, Sem Haven, Inc., VRDN | | | |
| | | | | (LOC: Fifth Third Bank) | | | |
| | | | | 0.590%, 11/01/2025 | | | |
| | | | | (Putable on 05/07/2010) (a) | | $ | 1,890,000 | |
| | | 4,015,000 | | Cuyahoga County Civic Facilities | | | | |
| | | | | Revenue, Fairfax Development | | | | |
| | | | | Corp., VRDN | | | | |
| | | | | (LOC: Keybank N.A.) | | | | |
| | | | | 0.490%, 06/01/2022 | | | | |
| | | | | (Putable on 05/07/2010) (a) | | | 4,015,000 | |
| | | 6,705,000 | | Henry County Revenue, Demand | | | | |
| | | | | Facilities Improvement Hospital, | | | | |
| | | | | VRDN | | | | |
| | | | | (LOC: Keybank N.A.) | | | | |
| | | | | 0.490%, 03/01/2031 | | | | |
| | | | | (Putable on 05/07/2010) (a) | | | 6,705,000 | |
| | | | | | | | 14,510,000 | |
| Oklahoma—0.9% | | | | |
| | | 1,300,000 | | Claremore Industrial & | | | | |
| | | | | Redevelopment Authority, | | | | |
| | | | | Whirlwind Steel Buildings, VRDN | | | | |
| | | | | (LOC: JPMorgan Chase Bank) | | | | |
| | | | | 0.850%, 09/01/2016 | | | | |
| | | | | (Putable on 05/07/2010) (a) | | | 1,300,000 | |
| | | 3,300,000 | | Guymon Utilities Authority Revenue, | | | | |
| | | | | Seaboard Farms, Inc., VRDN | | | | |
| | | | | (LOC: Bank of the West) | | | | |
| | | | | 0.480%, 02/01/2023 | | | | |
| | | | | (Putable on 05/07/2010) (a) | | | 3,300,000 | |
| | | | | | | | 4,600,000 | |
| Oregon—2.8% | | | | |
| | | 5,075,000 | | Multnomah County Higher | | | | |
| | | | | Education, Concordia University | | | | |
| | | | | of Portland, VRDN | | | | |
| | | | | (LOC: Keybank N.A.) | | | | |
| | | | | 0.490%, 12/01/2029 | | | | |
| | | | | (Putable on 05/07/2010) (a) | | | 5,075,000 | |
| | | 1,470,000 | | Portland Housing Authority, | | | | |
| | | | | Floyd Light, VRDN | | | | |
| | | | | (LOC: Bank of America N.A.) | | | | |
| | | | | 0.450%, 12/01/2027 | | | | |
| | | | | (Putable on 05/07/2010) (a) | | | 1,470,000 | |
| | | 2,200,000 | | State Economic Development | | | | |
| | | | | Revenue, McFarland Cascade— | | | | |
| | | | | Series 175, VRDN | | | | |
| | | | | (LOC: U.S. Bank N.A.) | | | | |
| | | | | 0.410%, 11/01/2016 | | | | |
| | | | | (Putable on 05/07/2010) (a) | | | 2,200,000 | |
| | | 5,950,000 | | State Economic Development | | | | |
| | | | | Revenue, YoCream, VRDN | | | | |
| | | | | (LOC: Keybank N.A.) | | | | |
| | | | | 0.540%, 02/01/2037 | | | | |
| | | | | (Putable on 05/07/2010) (a) | | | 5,950,000 | |
| | | | | | | | 14,695,000 | |
The accompanying notes are an integral part of these financial statements.
Alpine Municipal Money Market Fund April 30, 2010 (Unaudited)
| Principal | | Security | | | |
| Amount | | Description | | Value | |
| Municipal Bonds—continued | | | |
| Pennsylvania—3.7% | | | |
| $ | 8,800,000 | | Delaware River Port Authority— | | | |
| | | | Series B, VRDN | | | |
| | | | (LOC: TD Bank N.A.) | | | |
| | | | 0.260%, 01/01/2026 | | | |
| | | | (Putable on 05/07/2010) (a) | | $ | 8,800,000 | |
| | 430,000 | | Montgomery County Industrial | | | | |
| | | | Development Authority Revenue, | | | | |
| | | | Northwestern Human Services, | | | | |
| | | | VRDN | | | | |
| | | | (LOC: TD Bank N.A.) | | | | |
| | | | 0.300%, 06/01/2033 | | | | |
| | | | (Putable on 05/07/2010) (a) | | | 430,000 | |
| | 10,490,000 | | State Higher Educational Facilities | | | | |
| | | | Authority, Holy Family University, | | | | |
| | | | VRDN | | | | |
| | | | (LOC: TD Bank N.A.) | | | | |
| | | | 0.280%, 12/01/2033 | | | | |
| | | | (Putable on 05/07/2010) (a) | | | 10,490,000 | |
| | | | | | | 19,720,000 | |
| Rhode Island—0.2% | | | | |
| | 825,000 | | Providence Housing Authority, | | | | |
| | | | Cathedral Square—Series B, VRDN | | | | |
| | | | (LOC: Bank of America N.A.) | | | | |
| | | | 0.950%, 09/01/2017 | | | | |
| | | | (Putable on 05/07/2010) (a) | | | 825,000 | |
| South Carolina—1.2% | | | | |
| | 4,380,000 | | State Jobs—Economic Development | | | | |
| | | | Authority, Franco Manufacturing | | | | |
| | | | Co., Inc., VRDN | | | | |
| | | | (LOC: Bank of America N.A.) | | | | |
| | | | 0.450%, 05/01/2019 | | | | |
| | | | (Putable on 05/07/2010) (a) | | | 4,380,000 | |
| | 2,100,000 | | State Jobs—Economic | | | | |
| | | | Development Authority | | | | |
| | | | Revenue, Supreme Machined | | | | |
| | | | Products Co., VRDN | | | | |
| | | | (LOC: Bank of America N.A.) | | | | |
| | | | 0.450%, 06/01/2015 | | | | |
| | | | (Putable on 05/07/2010) (a) | | | 2,100,000 | |
| | | | | | | 6,480,000 | |
| Tennessee—0.9% | | | | |
| | 1,470,000 | | Henderson Industrial Development | | | | |
| | | | Board Revenue, Premier | | | | |
| | | | Manufacturing Corp., VRDN | | | | |
| | | | (LOC: PNC Bank N.A.) | | | | |
| | | | 0.410%, 04/01/2015 | | | | |
| | | | (Putable on 05/07/2010) (a) | | | 1,470,000 | |
| | 1,200,000 | | Huntingdon Industrial | | | | |
| | | | Development Board Revenue, | | | | |
| | | | Associates Rubber Co., VRDN | | | | |
| | | | (LOC: PNC Bank N.A.) | | | | |
| | | | 0.880%, 08/01/2014 | | | | |
| | | | (Putable on 05/07/2010) (a) | | | 1,200,000 | |
| | 2,155,000 | | Metropolitan Nashville Airport | | | | |
| | | | Authority Revenue, AERO | | | | |
| | | | Nashville LLC—Series A, VRDN | | | | |
| | | | (LOC: JPMorgan Chase Bank) | | | | |
| | | | 0.350%, 07/01/2036 | | | | |
| | | | (Putable on 05/07/2010) (a) | | | 2,155,000 | |
| Principal | | Security | | | |
| Amount | | Description | | Value | |
| Municipal Bonds—continued | | | |
| Tennessee—continued | | | |
| $ | 105,000 | | Sevier County Public Building | | | |
| | | | Authority, Local Government | | | |
| | | | Public Improvement VII— | | | |
| | | | Series C-1, VRDN | | | |
| | | | (LOC: Allied Irish Bank PLC) | | | |
| | | | 0.500%, 06/01/2030 | | | |
| | | | (Putable on 05/07/2010) (a) | | $ | 105,000 | |
| | | | | | | 4,930,000 | |
| Texas—9.9% | | | | | | |
| | 2,100,000 | | Dallam County Industrial | | | | |
| | | | Development Corp. Revenue, | | | | |
| | | | Cons Dairy Management LLC, | | | | |
| | | | VRDN | | | | |
| | | | (LOC: Wells Fargo Bank N.A.) | | | | |
| | | | 0.600%, 01/01/2027 | | | | |
| | | | (Putable on 05/07/2010) (a) | | | 2,100,000 | |
| | 2,600,000 | | Dallam County Industrial | | | | |
| | | | Development Corp. Revenue, | | | | |
| | | | Rick & Janice Van Ryan, VRDN | | | | |
| | | | (LOC: Wells Fargo Bank N.A.) | | | | |
| | | | 0.600%, 07/01/2037 | | | | |
| | | | (Putable on 05/07/2010) (a) | | | 2,600,000 | |
| | 3,250,000 | | Fort Bend County Industrial | | | | |
| | | | Development Corp. Revenue, | | | | |
| | | | Aaron Rents, Inc., VRDN | | | | |
| | | | (LOC: Wells Fargo Bank N.A.) | | | | |
| | | | 0.520%, 01/01/2026 | | | | |
| | | | (Putable on 05/07/2010) (a) | | | 3,250,000 | |
| | 2,000,000 | | Northside Independent School | | | | |
| | | | District | | | | |
| | | | (CS: PSF—GTD; LIQ: State | | | | |
| | | | Street Bank & Trust Co.) | | | | |
| | | | 1.200%, 06/01/2037 | | | | |
| | | | (Putable on 06/01/2010) . . . . . . | | | 2,000,000 | |
| | 12,000,000 | | Port Arthur Navigation District | | | | |
| | | | Revenue, BASF Corp., VRDN | | | | |
| | | | 0.450%, 04/01/2033 | | | | |
| | | | (Putable on 05/07/2010) (a) | | | 12,000,000 | |
| | | | Port Corpus Christi Authority of | | | | |
| | | | Nueces County Solid Waste | | | | |
| | | | Disposal, Flint Hills Resources LP, | | | | |
| | | | VRDN | | | | |
| | 6,500,000 | | 0.480%, 01/01/2030 | | | | |
| | | | (Putable on 05/07/2010) (a) | | | 6,500,000 | |
| | 9,000,000 | | 0.480%, 01/01/2030 | | | | |
| | | | (Putable on 05/07/2010) (a) | | | 9,000,000 | |
| | 15,500,000 | | 0.480%, 01/01/2032 | | | | |
| | | | (Putable on 05/07/2010) (a) | | | 15,500,000 | |
| | | | | | | 52,950,000 | |
| Vermont—4.9% | | | | |
| | 13,450,000 | | Housing Finance Agency— | | | | |
| | | | Series 26, VRDN | | | | |
| | | | (CS: AGM; SPA: TD Bank N.A.) | | | | |
| | | | 5.000%, 05/01/2037 | | | | |
| | | | (Putable on 05/07/2010) (a) | | | 13,450,000 | |
| | 12,800,000 | | Housing Finance Agency— | | | | |
| | | | Series A, VRDN | | | | |
| | | | (CS: AGM; SPA: DEXIA Credit | | | | |
| | | | Local) 0.440%, 05/01/2037 | | | | |
| | | | (Putable on 05/07/2010) (a) | | | 12,800,000 | |
| | | | | | | 26,250,000 | |
The accompanying notes are an integral part of these financial statements.
Alpine Municipal Money Market Fund April 30, 2010 (Unaudited)
| | Principal | | Security | | | |
| | Amount | | Description | | Value | |
| Municipal Bonds—continued | | | |
| Virginia—1.5% | | | | | |
| | $ | 3,000,000 | | Brunswick County Industrial | | | |
| | | | | Development Authority, Aegis | | | |
| | | | | Waste Solutions, Inc., VRDN | | | |
| | | | | (LOC: Bank of America N.A.) | | | |
| | | | | 0.850%, 01/01/2017 | | | |
| | | | | (Putable on 05/07/2010) (a) | | $ | 3,000,000 | |
| | | 5,150,000 | | Port Authority Revenue, | | | | |
| | | | | P-Floats—Series 2671, VRDN | | | | |
| | | | | (CS: AGM; LIQ: DEXIA Credit | | | | |
| | | | | Local) | | | | |
| | | | | 0.620%, 07/01/2015 | | | | |
| | | | | (Putable on 05/07/2010) (a) | | | 5,150,000 | |
| | | | | | | | 8,150,000 | |
| Washington—4.7% | | | | |
| | | 6,125,000 | | Port Bellingham Industrial | | | | |
| | | | | Development Corp. Revenue, | | | | |
| | | | | Hempler Foods Group, VRDN | | | | |
| | | | | (LOC: Bank of Montreal) | | | | |
| | | | | 0.520%, 07/01/2036 | | | | |
| | | | | (Putable on 05/07/2010) (a) | | | 6,125,000 | |
| | | 3,035,000 | | Port Bellingham Industrial | | | | |
| | | | | Development Corp. Revenue, | | | | |
| | | | | Wood Store Corp., VRDN | | | | |
| | | | | (LOC: Keybank N.A.) | | | | |
| | | | | 0.640%, 02/01/2027 | | | | |
| | | | | (Putable on 05/07/2010) (a) | | | 3,035,000 | |
| | | 5,300,000 | | Seattle Housing Authority | | | | |
| | | | | Revenue, High Point Project | | | | |
| | | | | Phase II, VRDN | | | | |
| | | | | (LOC: Keybank N.A.) | | | | |
| | | | | 0.540%, 03/01/2039 | | | | |
| | | | | (Putable on 05/07/2010) (a) | | | 5,300,000 | |
| | | 2,745,000 | | State Economic Development | | | | |
| | | | | Finance Authority, Wesmar | | | | |
| | | | | Company, Inc.—Series F, VRDN | | | | |
| | | | | (LOC: U.S. Bank N.A.) | | | | |
| | | | | 0.550%, 07/01/2032 | | | | |
| | | | | (Putable on 05/07/2010) (a) | | | 2,745,000 | |
| | | 7,900,000 | | State Housing Finance Commission, | | | | |
| | | | | Mirabella—Series A, VRDN | | | | |
| | | | | (LOC: HSH Nordbank AG) | | | | |
| | | | | 0.450%, 03/01/2036 | | | | |
| | | | | (Putable on 05/07/2010) (a) | | | 7,900,000 | |
| | | | | | | | 25,105,000 | |
| Principal | | Security | | | |
| Amount | | Description | | Value | |
| Municipal Bonds—continued | | | |
| West Virginia—0.8% | | | |
| $ | 4,000,000 | | Economic Development Authority | | | |
| | | | Facilities Revenue, Appalachian | | | |
| | | | Power—Series B, VRDN | | | |
| | | | (LOC: JPMorgan Chase Bank) | | | |
| | | | 0.420%, 02/01/2036 | | | |
| | | | (Putable on 05/07/2010) (a) | | $ | 4,000,000 | |
| Wisconsin—0.3% | | | | |
| | 200,000 | | Elkhorn Industrial Development | | | | |
| | | | Revenue, Lanco Precision Plus, | | | | |
| | | | VRDN | | | | |
| | | | (LOC: JPMorgan Chase Bank) | | | | |
| | | | 1.100%, 11/01/2019 | | | | |
| | | | (Putable on 05/07/2010) (a) | | | 200,000 | |
| | 600,000 | | Hartford Water & Electric | | | | |
| | | | Systems Revenue | | | | |
| | | | (CS: Assured Guaranty) | | | | |
| | | | 2.000%, 07/01/2010 . . . . . . . . . . | | | 600,904 | |
| | 1,000,000 | | Mequon Industrial Development | | | | |
| | | | Revenue, Gateway Plastics, | | | | |
| | | | Inc.—Series A, VRDN | | | | |
| | | | (LOC: JPMorgan Chase Bank) | | | | |
| | | | 0.850%, 08/01/2026 | | | | |
| | | | (Putable on 05/07/2010) (a) | | | 1,000,000 | |
| | | | | | | 1,800,904 | |
| | | | Total Municipal Bonds | | | | |
| | | | (Cost $500,885,444) . . . . . . . . . . | | | 500,885,444 | |
| Shares | | | | | | |
| Money Market Funds—3.8% | | | | |
| | 20,000,000 | | BlackRock Liquidity Fund | | | | |
| | | | MuniCash Portfolio, 0.19% | | | 20,000,000 | |
| | 41,821 | | SEI Tax Exempt Trust—Institutional | | | | |
| | | | Tax Free Fund—Class A, 0.05% . | | | 41,821 | |
| | | | Total Money Market Funds | | | | |
| | | | (Cost $20,041,821) . . . . . . . . . . . | | | 20,041,821 | |
| | | | Total Investments | | | | |
| | | | (Cost $520,927,265) 97.7% . . . . | | | 520,927,265 | |
| | | | Other Assets in Excess of | | | | |
| | | | Liabilities—2.3% . . . . . . . . . . . . | | | 12,158,185 | |
| | | | TOTAL NET ASSETS 100.0% | | $ | 533,085,450 | |
| | | | | | | | |
Percentages are stated as a percent of net assets.
(a) Variable Rate Security—The rate reported is the rate in effect as of April 30, 2010.
Co.—Company
Corp.—Corporation
CS—Credit Support
Inc.— Incorporated
LIQ—Liquidity Facility
LLC—Limited Liability Company
LOC—Letter of Credit
LP—Limited Partnership
SPA—Standby Purchase Agreement
VRDN—Variable Rate Demand Note
The accompanying notes are an integral part of these financial statements.
Statements of Assets and Liabilities April 30, 2010 (Unaudited)
| | | | | | | | | Dynamic Financial Services | |
| | | Fund | | | Fund | | | Fund | |
| ASSETS: | | | | | | | | | |
| Investments, at value (1) . . . . . . . . . . . . . . . . . . . . . . . . . . . . . . . . . . . . . . . . . . . . . . . | | $ | 723,699,542 | | | $ | 2,308,630 | | | $ | 10,331,929 | |
| Cash . . . . . . . . . . . . . . . . . . . . . . . . . . . . . . . . . . . . . . . . . . . . . . . . . . . . . . . . . . . . . . . . | | | 2,748,425 | | | | 1,050 | | | | — | |
| Cash denominated in foreign currencies, at value (2) . . . . . . . . . . . . . . . . . . . . . . . . | | | 5,404,471 | | | | 30,824 | | | | 60,581 | |
| Receivable from capital shares issued . . . . . . . . . . . . . . . . . . . . . . . . . . . . . . . . . . . . . | | | 5,549,618 | | | | 3,000 | | | | 109,697 | |
| Receivable from investment securities sold . . . . . . . . . . . . . . . . . . . . . . . . . . . . . . . . | | | 81,905,609 | | | | 189,291 | | | | 570,682 | |
| Receivable from swap contracts closed . . . . . . . . . . . . . . . . . . . . . . . . . . . . . . . . . . . . | | | 4,039,882 | | | | — | | | | — | |
| Due from Adviser . . . . . . . . . . . . . . . . . . . . . . . . . . . . . . . . . . . . . . . . . . . . . . . . . . . . . | | | — | | | | 3,441 | | | | — | |
| Dividends and interest receivable . . . . . . . . . . . . . . . . . . . . . . . . . . . . . . . . . . . . . . . . | | | 16,831,642 | | | | 22,209 | | | | 7,684 | |
| Prepaid expenses and other assets . . . . . . . . . . . . . . . . . . . . . . . . . . . . . . . . . . . . . . . | | | 67,542 | | | | 7,555 | | | | 10,309 | |
| Total assets . . . . . . . . . . . . . . . . . . . . . . . . . . . . . . . . . . . . . . . . . . . . . . . . . . . . . . . . . | | | 840,246,731 | | | | 2,566,000 | | | | 11,090,882 | |
| | | | | | | | | | | | | |
| LIABILITIES: | | | | | | | | | | | | |
| Payable for capital shares redeemed . . . . . . . . . . . . . . . . . . . . . . . . . . . . . . . . . . . . . | | | 639,231 | | | | — | | | | 1,679 | |
| Payable for investment securities purchased . . . . . . . . . . . . . . . . . . . . . . . . . . . . . . . | | | 81,638,962 | | | | 216,109 | | | | 854,736 | |
| Accrued expenses and other liabilities: | | | | | | | | | | | | |
| Investment advisory fees . . . . . . . . . . . . . . . . . . . . . . . . . . . . . . . . . . . . . . . . . . . . . | | | 630,197 | | | | — | | | | 4,625 | |
| Other . . . . . . . . . . . . . . . . . . . . . . . . . . . . . . . . . . . . . . . . . . . . . . . . . . . . . . . . . . . . . | | | 410,727 | | | | 14,891 | | | | 21,814 | |
| Total liabilities . . . . . . . . . . . . . . . . . . . . . . . . . . . . . . . . . . . . . . . . . . . . . . . . . . . . . . | | | 83,319,117 | | | | 231,000 | | | | 882,854 | |
Net Assets . . . . . . . . . . . . . . . . . . . . . . . . . . . . . . . . . . . . . . . . . . . . . . . . . . . . . . . . . . . . . | | $ | 756,927,614 | | | $ | 2,335,000 | | | $ | 10,208,028 | |
| | | | | | | | | | | | | |
| | | | | | | | | | | | | |
| Net assets represented by | | | | | | | | | | | | |
| Capital stock . . . . . . . . . . . . . . . . . . . . . . . . . . . . . . . . . . . . . . . . . . . . . . . . . . . . . . . . . | | $ | 1,708,376,998 | | | $ | 2,026,417 | | | $ | 13,325,468 | |
| Accumulated undistributed net investment income (loss) . . . . . . . . . . . . . . . . . . . . | | | (9,486,399 | ) | | | 23,230 | | | | (6,948 | ) |
| Accumulated net realized gains (losses) on investments, foreign currency | | | | | | | | | | | | |
| translation and swap contracts . . . . . . . . . . . . . . . . . . . . . . . . . . . . . . . . . . . . . . . . | | | (993,332,869 | ) | | | 63,377 | | | | (230,683 | ) |
| Net unrealized appreciation (depreciation) on: | | | | | | | | | | | | |
| Investments . . . . . . . . . . . . . . . . . . . . . . . . . . . . . . . . . . . . . . . . . . . . . . . . . . . . . . . . | | | 51,161,670 | | | | 221,830 | | | | (2,882,075 | ) |
| Foreign currency and foreign currency translation . . . . . . . . . . . . . . . . . . . . . . . . | | | 208,214 | | | | 146 | | | | 2,266 | |
Total Net Assets . . . . . . . . . . . . . . . . . . . . . . . . . . . . . . . . . . . . . . . . . . . . . . . . . . . . . . . . | | $ | 756,927,614 | | | $ | 2,335,000 | | | $ | 10,208,028 | |
| | | | | | | | | | | | | |
| | | | | | | | | | | | | |
| Net asset value | | | | | | | | | | | | |
| Net assets . . . . . . . . . . . . . . . . . . . . . . . . . . . . . . . . . . . . . . . . . . . . . . . . . . . . . . . . . . | | $ | 756,927,614 | | | $ | 2,335,000 | | | $ | 10,208,028 | |
| Shares of beneficial interest issued and outstanding . . . . . . . . . . . . . . . . . . . . . . | | | 157,130,304 | | | | 184,626 | | | | 1,119,455 | |
| Net asset value, offering price and redemption price per share . . . . . . . . . . . . . . | | $ | 4.82 | | | $ | 12.65 | | | $ | 9.12 | |
| | | | | | | | | | | | | |
| (1) Cost of investments . . . . . . . . . . . . . . . . . . . . . . . . . . . . . . . . . . . . . . . . . . . . . . . . . . | | $ | 672,537,872 | | | $ | 2,086,800 | | | $ | 13,214,004 | |
| (2) Cost of cash denominated in foreign currencies . . . . . . . . . . . . . . . . . . . . . . . . . . . | | $ | 5,341,168 | | | $ | 30,451 | | | $ | 58,414 | |
The accompanying notes are an integral part of these financial statements.
Alpine Mutual Funds
Statements of Assets and Liabilities—Continued
April 30, 2010 (Unaudited)
| | Dynamic | | Dynamic | | Dynamic |
| | Innovators | | Transformations | | Balance |
| | Fund | | Fund | | Fund |
| ASSETS: | | | | | |
| Investments, at value (1) . . . . . . . . . . . . . . . . . . . . . . . . . . . . . . . . . . . . . . . . . . . . . . . | $ | 13,240,016 | | $ | 5,542,830 | | $ | 64,038,708 |
| Receivable from capital shares issued . . . . . . . . . . . . . . . . . . . . . . . . . . . . . . . . . . . . . | | 9,283 | | | 10,283 | | | 13,325 |
| Receivable from investment securities sold . . . . . . . . . . . . . . . . . . . . . . . . . . . . . . . . | | 391,614 | | | 48,292 | | | 233,912 |
| Dividends and interest receivable . . . . . . . . . . . . . . . . . . . . . . . . . . . . . . . . . . . . . . . . | | 5,180 | | | — | | | 244,394 |
| Prepaid expenses and other assets . . . . . . . . . . . . . . . . . . . . . . . . . . . . . . . . . . . . . . . | | 8,893 | | | 11,169 | | | 16,722 |
| Total assets . . . . . . . . . . . . . . . . . . . . . . . . . . . . . . . . . . . . . . . . . . . . . . . . . . . . . . . . . | | 13,654,986 | | | 5,612,574 | | | 64,547,061 |
| | | | | | | | | |
| LIABILITIES: | | | | | | | | |
| Payable for capital shares redeemed . . . . . . . . . . . . . . . . . . . . . . . . . . . . . . . . . . . . . | | 569 | | | — | | | 8,809 |
| Payable for investment securities purchased . . . . . . . . . . . . . . . . . . . . . . . . . . . . . . . | | 4,663 | | | — | | | — |
| Accrued expenses and other liabilities: | | | | | | | | |
| Investment advisory fees . . . . . . . . . . . . . . . . . . . . . . . . . . . . . . . . . . . . . . . . . . . . . | | 7,724 | | | 1,068 | | | 52,247 |
| Line of credit . . . . . . . . . . . . . . . . . . . . . . . . . . . . . . . . . . . . . . . . . . . . . . . . . . . . . . . | | 962,000 | | | 242,000 | | | — |
| Other . . . . . . . . . . . . . . . . . . . . . . . . . . . . . . . . . . . . . . . . . . . . . . . . . . . . . . . . . . . . . | | 23,756 | | | 17,838 | | | 35,233 |
| Total liabilities . . . . . . . . . . . . . . . . . . . . . . . . . . . . . . . . . . . . . . . . . . . . . . . . . . . . . . | | 998,712 | | | 260,906 | | | 96,289 |
Net Assets . . . . . . . . . . . . . . . . . . . . . . . . . . . . . . . . . . . . . . . . . . . . . . . . . . . . . . . . . . . . . | $ | 12,656,274 | | $ | 5,351,668 | | $ | 64,450,772 |
| | | | | | | | | |
| | | | | | | | | |
| Net assets represented by | | | | | | | | |
| Capital stock . . . . . . . . . . . . . . . . . . . . . . . . . . . . . . . . . . . . . . . . . . . . . . . . . . . . . . . . . | $ | 25,560,559 | | $ | 5,238,306 | | $ | 67,157,014 |
| Accumulated undistributed net investment income (loss) . . . . . . . . . . . . . . . . . . . . | | (65,832 | ) | | (16,881 | ) | | 24,309 |
| Accumulated net realized losses on investments and written | | | | | | | | |
| option contracts expired or closed . . . . . . . . . . . . . . . . . . . . . . . . . . . . . . . . . . . . . | | (13,734,322 | ) | | (999,777 | ) | | (289,663) |
| Net unrealized appreciation (depreciation) on investments . . . . . . . . . . . . . . . . . . . | | 895,869 | | | 1,130,020 | | | (2,440,888) |
Total Net Assets . . . . . . . . . . . . . . . . . . . . . . . . . . . . . . . . . . . . . . . . . . . . . . . . . . . . . . . . | $ | 12,656,274 | | $ | 5,351,668 | | $ | 64,450,772 |
| | | | | | | | | |
| | | | | | | | | |
| Net asset value | | | | | | | | |
| Net assets . . . . . . . . . . . . . . . . . . . . . . . . . . . . . . . . . . . . . . . . . . . . . . . . . . . . . . . . . . | $ | 12,656,274 | | $ | 5,351,668 | | $ | 64,450,772 |
| Shares of beneficial interest issued and outstanding . . . . . . . . . . . . . . . . . . . . . . | | 1,243,054 | | | 526,045 | | | 6,258,517 |
| Net asset value, offering price and redemption price per share . . . . . . . . . . . . . . | $ | 10.18 | | $ | 10.17 | | $ | 10.30 |
| | | | | | | | | |
| (1) Cost of investments . . . . . . . . . . . . . . . . . . . . . . . . . . . . . . . . . . . . . . . . . . . . . . . . . . | $ | 12,344,147 | | $ | 4,412,810 | | $ | 66,479,596 |
The accompanying notes are an integral part of these financial statements.
Statements of Assets and Liabilities—Continued
April 30, 2010 (Unaudited)
| | | Ultra Short | | | |
| | | Tax Optimized | | Municipal | |
| | | Income | | Money Market | |
| | | Fund | | Fund | |
| ASSETS: | | | | | |
| Investments, at value (1) . . . . . . . . . . . . . . . . . . . . . . . . . . . . . . . . . . . . . . . . . . . . . . . . . . . . . . . . . . | | $ | 1,419,831,887 | | $ | 520,927,265 | |
| Receivable from capital shares issued . . . . . . . . . . . . . . . . . . . . . . . . . . . . . . . . . . . . . . . . . . . . . . . . | | | 6,027,516 | | | 71,058 | |
| Receivable from investment securities sold . . . . . . . . . . . . . . . . . . . . . . . . . . . . . . . . . . . . . . . . . . . | | | 52,110,012 | | | 18,070,251 | |
| Interest receivable . . . . . . . . . . . . . . . . . . . . . . . . . . . . . . . . . . . . . . . . . . . . . . . . . . . . . . . . . . . . . . . | | | 7,759,718 | | | 1,231,183 | |
| Prepaid expenses and other assets . . . . . . . . . . . . . . . . . . . . . . . . . . . . . . . . . . . . . . . . . . . . . . . . . . | | | 59,227 | | | 37,153 | |
| Total assets . . . . . . . . . . . . . . . . . . . . . . . . . . . . . . . . . . . . . . . . . . . . . . . . . . . . . . . . . . . . . . . . . . . | | | 1,485,788,360 | | | 540,336,910 | |
| | | | | | | | |
| LIABILITIES: | | | | | | | |
| Payable for capital shares redeemed . . . . . . . . . . . . . . . . . . . . . . . . . . . . . . . . . . . . . . . . . . . . . . . . | | | 5,308,496 | | | 7,005,369 | |
| Payable for investment securities purchased . . . . . . . . . . . . . . . . . . . . . . . . . . . . . . . . . . . . . . . . . . | | | 1,000,000 | | | — | |
| Payable to custodian . . . . . . . . . . . . . . . . . . . . . . . . . . . . . . . . . . . . . . . . . . . . . . . . . . . . . . . . . . . . . | | | 461,642 | | | 23,412 | |
| Accrued expenses and other liabilities: | | | | | | | |
| Investment advisory fees . . . . . . . . . . . . . . . . . . . . . . . . . . . . . . . . . . . . . . . . . . . . . . . . . . . . . . . . | | | 527,429 | | | 172,283 | |
| Distribution fees . . . . . . . . . . . . . . . . . . . . . . . . . . . . . . . . . . . . . . . . . . . . . . . . . . . . . . . . . . . . . . . | | | 47,833 | | | — | |
| Other . . . . . . . . . . . . . . . . . . . . . . . . . . . . . . . . . . . . . . . . . . . . . . . . . . . . . . . . . . . . . . . . . . . . . . . . | | | 101,234 | | | 50,396 | |
| Total liabilities . . . . . . . . . . . . . . . . . . . . . . . . . . . . . . . . . . . . . . . . . . . . . . . . . . . . . . . . . . . . . . . . . | | | 7,446,634 | | | 7,251,460 | |
Net Assets . . . . . . . . . . . . . . . . . . . . . . . . . . . . . . . . . . . . . . . . . . . . . . . . . . . . . . . . . . . . . . . . . . . . . . . . | | $ | 1,478,341,726 | | $ | 533,085,450 | |
| | | | | | | | |
| | | | | | | | |
| Net assets represented by | | | | | | | |
| Capital stock . . . . . . . . . . . . . . . . . . . . . . . . . . . . . . . . . . . . . . . . . . . . . . . . . . . . . . . . . . . . . . . . . . . . | | $ | 1,476,399,026 | | $ | 533,085,450 | |
| Accumulated undistributed net investment income . . . . . . . . . . . . . . . . . . . . . . . . . . . . . . . . . . . . | | | 892 | | | — | |
| Accumulated net realized losses on investments . . . . . . . . . . . . . . . . . . . . . . . . . . . . . . . . . . . . . . . | | | (52,240 | ) | | — | |
| Net unrealized appreciation on investments . . . . . . . . . . . . . . . . . . . . . . . . . . . . . . . . . . . . . . . . . . | | | 1,994,048 | | | — | |
Total Net Assets . . . . . . . . . . . . . . . . . . . . . . . . . . . . . . . . . . . . . . . . . . . . . . . . . . . . . . . . . . . . . . . . . . . | | $ | 1,478,341,726 | | $ | 533,085,450 | |
| | | | | | | | |
| | | | | | | | |
| Net asset value | | | | | | | |
| Adviser Class Shares | | | | | | | |
| Net assets . . . . . . . . . . . . . . . . . . . . . . . . . . . . . . . . . . . . . . . . . . . . . . . . . . . . . . . . . . . . . . . . . . . . . | | $ | 210,424,413 | | | | |
| Shares of beneficial interest issued and outstanding . . . . . . . . . . . . . . . . . . . . . . . . . . . . . . . . . | | | 20,820,504 | | | | |
| Net asset value and redemption price per share . . . . . . . . . . . . . . . . . . . . . . . . . . . . . . . . . . . . . | | $ | 10.11 | | | | |
| Maximum offering price per share (net asset value plus sales charge of 0.50%) . . . . . . . . . . . | | $ | 10.16 | | | | |
| Investor Class Shares | | | | | | | |
| Net assets . . . . . . . . . . . . . . . . . . . . . . . . . . . . . . . . . . . . . . . . . . . . . . . . . . . . . . . . . . . . . . . . . . . . . | | $ | 1,267,917,313 | | $ | 533,085,450 | |
| Shares of beneficial interest issued and outstanding . . . . . . . . . . . . . . . . . . . . . . . . . . . . . . . . . | | | 126,160,808 | | | 533,088,118 | |
| Net asset value, offering price and redemption price per share . . . . . . . . . . . . . . . . . . . . . . . . | | $ | 10.05 | | $ | 1.00 | |
| | | | | | | | |
| (1) Cost of investments . . . . . . . . . . . . . . . . . . . . . . . . . . . . . . . . . . . . . . . . . . . . . . . . . . . . . . . . . . . . . | | $ | 1,417,837,839 | | $ | 520,927,265 | |
The accompanying notes are an integral part of these financial statements.
Statements of Operations
For the six months ended April 30, 2010 (Unaudited)
| | Dynamic | | Accelerating | | Dynamic | |
| | Dividend | | Dividend | | Financial Services | |
| | Fund | | Fund | | Fund | |
| INVESTMENT INCOME: | | | | | | |
| Interest income . . . . . . . . . . . . . . . . . . . . . . . . . . . . . . . . . . . . . . . . . . . . . . . . . . . . . . . | $ | 2,551 | | $ | 9 | | $ | 4 | |
| Dividend income* . . . . . . . . . . . . . . . . . . . . . . . . . . . . . . . . . . . . . . . . . . . . . . . . . . . . . | | 45,277,681 | | | 65,435 | | | 46,208 | |
| Total investment income . . . . . . . . . . . . . . . . . . . . . . . . . . . . . . . . . . . . . . . . . . . . . . . | | 45,280,232 | | | 65,444 | | | 46,212 | |
| | | | | | | | | | |
| EXPENSES: | | | | | | | | | |
| Investment advisory fees . . . . . . . . . . . . . . . . . . . . . . . . . . . . . . . . . . . . . . . . . . . . . . . | | 3,347,830 | | | 9,961 | | | 41,168 | |
| Administration fees . . . . . . . . . . . . . . . . . . . . . . . . . . . . . . . . . . . . . . . . . . . . . . . . . . . | | 144,822 | | | 378 | | | 2,073 | |
| Fund accounting fees . . . . . . . . . . . . . . . . . . . . . . . . . . . . . . . . . . . . . . . . . . . . . . . . . . | | 84,940 | | | 224 | | | 1,220 | |
| Audit and tax fees . . . . . . . . . . . . . . . . . . . . . . . . . . . . . . . . . . . . . . . . . . . . . . . . . . . . | | 15,117 | | | 7,569 | | | 10,846 | |
| Custodian fees . . . . . . . . . . . . . . . . . . . . . . . . . . . . . . . . . . . . . . . . . . . . . . . . . . . . . . . . | | 32,318 | | | 90 | | | 462 | |
| Legal fees . . . . . . . . . . . . . . . . . . . . . . . . . . . . . . . . . . . . . . . . . . . . . . . . . . . . . . . . . . . | | 28,661 | | | 2,576 | | | 2,867 | |
| Registration and filing fees . . . . . . . . . . . . . . . . . . . . . . . . . . . . . . . . . . . . . . . . . . . . . | | 34,150 | | | 5,142 | | | 10,786 | |
| Printing and mailing fees . . . . . . . . . . . . . . . . . . . . . . . . . . . . . . . . . . . . . . . . . . . . . . . | | 89,047 | | | 112 | | | 1,887 | |
| Transfer agent fees . . . . . . . . . . . . . . . . . . . . . . . . . . . . . . . . . . . . . . . . . . . . . . . . . . . . | | 144,822 | | | 378 | | | 2,073 | |
| Trustee fees . . . . . . . . . . . . . . . . . . . . . . . . . . . . . . . . . . . . . . . . . . . . . . . . . . . . . . . . . . | | 2,356 | | | 1,552 | | | 1,863 | |
| Interest expense . . . . . . . . . . . . . . . . . . . . . . . . . . . . . . . . . . . . . . . . . . . . . . . . . . . . . . | | 184,652 | | | — | | | 2,192 | |
| Other fees . . . . . . . . . . . . . . . . . . . . . . . . . . . . . . . . . . . . . . . . . . . . . . . . . . . . . . . . . . . | | 23,894 | | | 85 | | | 216 | |
| Total expenses before expense waiver by Adviser . . . . . . . . . . . . . . . . . . . . . . . . . . . . . | | 4,132,609 | | | 28,067 | | | 77,653 | |
| Expense waiver by Adviser (Note 6) . . . . . . . . . . . . . . . . . . . . . . . . . . . . . . . . . . . . . . | | — | | | (14,620 | ) | | (19,840 | ) |
| Net expenses . . . . . . . . . . . . . . . . . . . . . . . . . . . . . . . . . . . . . . . . . . . . . . . . . . . . . . . | | 4,132,609 | | | 13,447 | | | 57,813 | |
| Net investment income (loss) . . . . . . . . . . . . . . . . . . . . . . . . . . . . . . . . . . . . . . . . . . . . . | | 41,147,623 | | | 51,997 | | | (11,601 | ) |
| | | | | | | | | | |
| REALIZED AND UNREALIZED GAIN (LOSS) ON INVESTMENTS: | | | | | | | | | |
| Net realized gain (loss) on: | | | | | | | | | |
| Investments . . . . . . . . . . . . . . . . . . . . . . . . . . . . . . . . . . . . . . . . . . . . . . . . . . . . . . . . | | 293,711 | | | 62,594 | | | 173,543 | |
| Foreign currency translation . . . . . . . . . . . . . . . . . . . . . . . . . . . . . . . . . . . . . . . . . . | | (129,606 | ) | | 784 | | | 478 | |
| Swap contracts . . . . . . . . . . . . . . . . . . . . . . . . . . . . . . . . . . . . . . . . . . . . . . . . . . . . . | | (1,869,561 | ) | | — | | | — | |
| Net realized gain (loss) . . . . . . . . . . . . . . . . . . . . . . . . . . . . . . . . . . . . . . . . . . . . . . . | | (1,705,456 | ) | | 63,378 | | | 174,021 | |
| Change in unrealized appreciation (depreciation) on: | | | | | | | | | |
| Investments . . . . . . . . . . . . . . . . . . . . . . . . . . . . . . . . . . . . . . . . . . . . . . . . . . . . . . . . | | 33,888,192 | | | 86,192 | | | 2,281,876 | |
| Foreign currency and foreign currency translation . . . . . . . . . . . . . . . . . . . . . . . . | | 168,802 | | | 144 | | | 2,201 | |
| Net change in unrealized appreciation . . . . . . . . . . . . . . . . . . . . . . . . . . . . . . . . . . | | 34,056,994 | | | 86,336 | | | 2,284,077 | |
| Net realized and unrealized gain on investments . . . . . . . . . . . . . . . . . . . . . . . . . . . . . | | 32,351,538 | | | 149,714 | | | 2,458,098 | |
| Change in net assets resulting from operations . . . . . . . . . . . . . . . . . . . . . . . . . . . . . . | $ | 73,499,161 | | $ | 201,711 | | $ | 2,446,497 | |
| | | | | | | | | | |
| | | | | | | | | | |
| * Net of foreign taxes withheld . . . . . . . . . . . . . . . . . . . . . . . . . . . . . . . . . . . . . . . . . . . | $ | 2,188,281 | | $ | 1,579 | | $ | 695 | |
The accompanying notes are an integral part of these financial statements.
Statements of Operations
For the six months ended April 30, 2010 (Unaudited)
| | Dynamic | | Dynamic | | Dynamic | |
| | Innovators | | Transformations | | Balance | |
| | Fund | | Fund | | Fund | |
| INVESTMENT INCOME: | | | | | | |
| Interest income . . . . . . . . . . . . . . . . . . . . . . . . . . . . . . . . . . . . . . . . . . . . . . . . . . . . . . . | $ | — | | $ | 3 | | $ | 280,798 | |
| Dividend income* . . . . . . . . . . . . . . . . . . . . . . . . . . . . . . . . . . . . . . . . . . . . . . . . . . . . . | | 22,354 | | | 13,944 | | | 497,954 | |
| Total investment income . . . . . . . . . . . . . . . . . . . . . . . . . . . . . . . . . . . . . . . . . . . . . . . | | 22,354 | | | 13,947 | | | 778,752 | |
| | | | | | | | | | |
| EXPENSES: | | | | | | | | | |
| Investment advisory fees . . . . . . . . . . . . . . . . . . . . . . . . . . . . . . . . . . . . . . . . . . . . . . . | | 58,599 | | | 22,229 | | | 294,320 | |
| Administration fees . . . . . . . . . . . . . . . . . . . . . . . . . . . . . . . . . . . . . . . . . . . . . . . . . . . | | 2,287 | | | 1,020 | | | 12,914 | |
| Fund accounting fees . . . . . . . . . . . . . . . . . . . . . . . . . . . . . . . . . . . . . . . . . . . . . . . . . . | | 1,334 | | | 599 | | | 7,579 | |
| Audit and tax fees . . . . . . . . . . . . . . . . . . . . . . . . . . . . . . . . . . . . . . . . . . . . . . . . . . . . | | 10,582 | | | 10,936 | | | 11,765 | |
| Custodian fees . . . . . . . . . . . . . . . . . . . . . . . . . . . . . . . . . . . . . . . . . . . . . . . . . . . . . . . . | | 506 | | | 222 | | | 2,883 | |
| Legal fees . . . . . . . . . . . . . . . . . . . . . . . . . . . . . . . . . . . . . . . . . . . . . . . . . . . . . . . . . . . | | 2,881 | | | 2,729 | | | 5,036 | |
| Registration and filing fees . . . . . . . . . . . . . . . . . . . . . . . . . . . . . . . . . . . . . . . . . . . . . | | 11,866 | | | 9,515 | | | 12,318 | |
| Printing and mailing fees . . . . . . . . . . . . . . . . . . . . . . . . . . . . . . . . . . . . . . . . . . . . . . . | | 2,408 | | | 279 | | | 1,740 | |
| Transfer agent fees . . . . . . . . . . . . . . . . . . . . . . . . . . . . . . . . . . . . . . . . . . . . . . . . . . . . | | 2,287 | | | 1,020 | | | 12,924 | |
| Trustee fees . . . . . . . . . . . . . . . . . . . . . . . . . . . . . . . . . . . . . . . . . . . . . . . . . . . . . . . . . . | | 1,744 | | | 1,873 | | | 1,828 | |
| Interest expense . . . . . . . . . . . . . . . . . . . . . . . . . . . . . . . . . . . . . . . . . . . . . . . . . . . . . . | | 9,077 | | | 819 | | | — | |
| Other fees . . . . . . . . . . . . . . . . . . . . . . . . . . . . . . . . . . . . . . . . . . . . . . . . . . . . . . . . . . . | | 415 | | | 183 | | | 2,181 | |
| Total expenses before expense waiver by Adviser . . . . . . . . . . . . . . . . . . . . . . . . . . . . . | | 103,986 | | | 51,424 | | �� | 365,488 | |
| Expense waiver by Adviser (Note 6) . . . . . . . . . . . . . . . . . . . . . . . . . . . . . . . . . . . . . . | | (15,800 | ) | | (20,596 | ) | | — | |
| Net expenses . . . . . . . . . . . . . . . . . . . . . . . . . . . . . . . . . . . . . . . . . . . . . . . . . . . . . . . | | 88,186 | | | 30,828 | | | 365,488 | |
| Net investment income (loss) . . . . . . . . . . . . . . . . . . . . . . . . . . . . . . . . . . . . . . . . . . . . . | | (65,832 | ) | | (16,881 | ) | | 413,264 | |
| REALIZED AND UNREALIZED GAIN (LOSS) ON INVESTMENTS: | | | | | | | | | |
| Net realized gain (loss) on: | | | | | | | | | |
| Investments . . . . . . . . . . . . . . . . . . . . . . . . . . . . . . . . . . . . . . . . . . . . . . . . . . . . . . . . | | (1,681,080 | ) | | (206,113 | ) | | (38,757 | ) |
| Written option contracts expired or closed . . . . . . . . . . . . . . . . . . . . . . . . . . . . . . | | — | | | — | | | 15,494 | |
| Net realized loss . . . . . . . . . . . . . . . . . . . . . . . . . . . . . . . . . . . . . . . . . . . . . . . . . . . . | | (1,681,080 | ) | | (206,113 | ) | | (23,263 | ) |
| Change in unrealized appreciation (depreciation) on: | | | | | | | | | |
| Investments . . . . . . . . . . . . . . . . . . . . . . . . . . . . . . . . . . . . . . . . . . . . . . . . . . . . . . . . | | 4,359,326 | | | 1,422,270 | | | 8,699,870 | |
| Written option contracts . . . . . . . . . . . . . . . . . . . . . . . . . . . . . . . . . . . . . . . . . . . . . | | — | | | — | | | (11,224 | ) |
| Net change in unrealized appreciation . . . . . . . . . . . . . . . . . . . . . . . . . . . . . . . . . . | | 4,359,326 | | | 1,422,270 | | | 8,688,646 | |
| Net realized and unrealized gain on investments . . . . . . . . . . . . . . . . . . . . . . . . . . . . . | | 2,678,246 | | | 1,216,157 | | | 8,665,383 | |
| Change in net assets resulting from operations . . . . . . . . . . . . . . . . . . . . . . . . . . . . . . | $ | 2,612,414 | | $ | 1,199,276 | | $ | 9,078,647 | |
| | | | | | | | | | |
| | | | | | | | | | |
| * Net of foreign taxes withheld . . . . . . . . . . . . . . . . . . . . . . . . . . . . . . . . . . . . . . . . . . . | $ | 33 | | $ | — | | $ | — | |
The accompanying notes are an integral part of these financial statements.
Statements of Operations
For the six months ended April 30, 2010 (Unaudited)
| | Ultra Short | | | | |
| | Tax Optimized | | | Municipal | |
| | Income | | | Money Market | |
| | Fund | | | Fund | |
| INVESTMENT INCOME: | | | | | |
| Interest income . . . . . . . . . . . . . . . . . . . . . . . . . . . . . . . . . . . . . . . . . . . . . . . . . . . . . . . . . . . . . . . . . . | $ | 13,810,443 | | | $ | 1,712,645 | |
| Total investment income . . . . . . . . . . . . . . . . . . . . . . . . . . . . . . . . . . . . . . . . . . . . . . . . . . . . . . . . . . | | 13,810,443 | | | | 1,712,645 | |
| | | | | | | | |
| EXPENSES: | | | | | | | |
| Investment advisory fees . . . . . . . . . . . . . . . . . . . . . . . . . . . . . . . . . . . . . . . . . . . . . . . . . . . . . . . . . . | | 6,085,101 | | | | 1,333,452 | |
| Administration fees . . . . . . . . . . . . . . . . . . . . . . . . . . . . . . . . . . . . . . . . . . . . . . . . . . . . . . . . . . . . . . | | 26,960 | | | | 6,240 | |
| Distribution fees - Adviser Class . . . . . . . . . . . . . . . . . . . . . . . . . . . . . . . . . . . . . . . . . . . . . . . . . . . . | | 280,948 | | | | — | |
| Fund accounting fees . . . . . . . . . . . . . . . . . . . . . . . . . . . . . . . . . . . . . . . . . . . . . . . . . . . . . . . . . . . . . | | 22,464 | | | | 5,198 | |
| Audit and tax fees . . . . . . . . . . . . . . . . . . . . . . . . . . . . . . . . . . . . . . . . . . . . . . . . . . . . . . . . . . . . . . . | | 10,208 | | | | 7,043 | |
| Custodian fees . . . . . . . . . . . . . . . . . . . . . . . . . . . . . . . . . . . . . . . . . . . . . . . . . . . . . . . . . . . . . . . . . . | | 13,480 | | | | 3,115 | |
| Legal fees . . . . . . . . . . . . . . . . . . . . . . . . . . . . . . . . . . . . . . . . . . . . . . . . . . . . . . . . . . . . . . . . . . . . . . | | 11,148 | | | | 9,115 | |
| Registration and filing fees . . . . . . . . . . . . . . . . . . . . . . . . . . . . . . . . . . . . . . . . . . . . . . . . . . . . . . . . | | 53,218 | | | | 16,608 | |
| Printing and mailing fees . . . . . . . . . . . . . . . . . . . . . . . . . . . . . . . . . . . . . . . . . . . . . . . . . . . . . . . . . | | 49,217 | | | | 7,428 | |
| Transfer agent fees . . . . . . . . . . . . . . . . . . . . . . . . . . . . . . . . . . . . . . . . . . . . . . . . . . . . . . . . . . . . . . . | | 30,010 | | | | 6,230 | |
| Trustee fees . . . . . . . . . . . . . . . . . . . . . . . . . . . . . . . . . . . . . . . . . . . . . . . . . . . . . . . . . . . . . . . . . . . . . | | 2,543 | | | | 1,394 | |
| Other fees . . . . . . . . . . . . . . . . . . . . . . . . . . . . . . . . . . . . . . . . . . . . . . . . . . . . . . . . . . . . . . . . . . . . . . | | 16,947 | | | | 8,177 | |
| Total expenses before expense waiver by Adviser . . . . . . . . . . . . . . . . . . . . . . . . . . . . . . . . . . . . . . . | | 6,602,244 | | | | 1,404,000 | |
| Expense waiver by Adviser (Note 6) . . . . . . . . . . . . . . . . . . . . . . . . . . . . . . . . . . . . . . . . . . . . . . . . . | | (2,151,691 | ) | | | (220,002 | ) |
| Net expenses . . . . . . . . . . . . . . . . . . . . . . . . . . . . . . . . . . . . . . . . . . . . . . . . . . . . . . . . . . . . . . . . . . | | 4,450,553 | | | | 1,183,998 | |
| Net investment income . . . . . . . . . . . . . . . . . . . . . . . . . . . . . . . . . . . . . . . . . . . . . . . . . . . . . . . . . . . . . | | 9,359,890 | | | | 528,647 | |
| | | | | | | | |
| REALIZED AND UNREALIZED GAIN ON INVESTMENTS: | | | | | | | |
| Net realized gain on investments . . . . . . . . . . . . . . . . . . . . . . . . . . . . . . . . . . . . . . . . . . . . . . . . . . . | | — | | | | — | |
| Change in unrealized appreciation on investments . . . . . . . . . . . . . . . . . . . . . . . . . . . . . . . . . . . . | | 661,898 | | | | — | |
| Net realized and unrealized gain on investments . . . . . . . . . . . . . . . . . . . . . . . . . . . . . . . . . . . . . . . | | 661,898 | | | | — | |
| Change in net assets resulting from operations . . . . . . . . . . . . . . . . . . . . . . . . . . . . . . . . . . . . . . . . . | $ | 10,021,788 | | | $ | 528,647 | |
| | | | | | | | |
The accompanying notes are an integral part of these financial statements.
Statements of Operations
For the six months ended April 30, 2010 (Unaudited)
| | | Dynamic | |
| | | Innovators Fund | |
| | | | |
| CASH FLOWS FROM OPERATING ACTIVITIES: | | | |
| Change in net assets resulting from operations . . . . . . . . . . . . . . . . . . . . . . . . . . . . . . . . . . . . . . . . . . . . . . . . . . . . . . . | | $ | 2,612,414 | |
| Adjustments to reconcile change in net assets resulting from operations to net cash | | | | |
| provided by operating activities: | | | | |
| Purchases of investments . . . . . . . . . . . . . . . . . . . . . . . . . . . . . . . . . . . . . . . . . . . . . . . . . . . . . . . . . . . . . . . . . . . . . . . . . . | | | (1,666,350 | ) |
| Proceeds from sales of investments . . . . . . . . . . . . . . . . . . . . . . . . . . . . . . . . . . . . . . . . . . . . . . . . . . . . . . . . . . . . . . . . . | | | 3,719,139 | |
| Increase in receivable from investment securities sold . . . . . . . . . . . . . . . . . . . . . . . . . . . . . . . . . . . . . . . . . . . . . . . . . . | | | (391,572 | ) |
| Decrease in payable for investment securities purchased . . . . . . . . . . . . . . . . . . . . . . . . . . . . . . . . . . . . . . . . . . . . . . . . | | | (101,776 | ) |
| Increase in dividends and interest receivable . . . . . . . . . . . . . . . . . . . . . . . . . . . . . . . . . . . . . . . . . . . . . . . . . . . . . . . . . . | | | (280 | ) |
| Decrease in prepaid expenses and other assets . . . . . . . . . . . . . . . . . . . . . . . . . . . . . . . . . . . . . . . . . . . . . . . . . . . . . . . . | | | 1,702 | |
| Decrease in accrued expenses and other liabilities . . . . . . . . . . . . . . . . . . . . . . . . . . . . . . . . . . . . . . . . . . . . . . . . . . . . . | | | (3,729 | ) |
| Net realized loss on investments . . . . . . . . . . . . . . . . . . . . . . . . . . . . . . . . . . . . . . . . . . . . . . . . . . . . . . . . . . . . . . . . . . . . | | | 1,681,080 | |
| Unrealized appreciation on investments . . . . . . . . . . . . . . . . . . . . . . . . . . . . . . . . . . . . . . . . . . . . . . . . . . . . . . . . . . . . . | | | (4,359,326 | ) |
| Net cash provided by operating activities . . . . . . . . . . . . . . . . . . . . . . . . . . . . . . . . . . . . . . . . . . . . . . . . . . . . . . . . . . . | | | 1,491,302 | |
| | | | | |
| CASH FLOWS FROM FINANCING ACTIVITIES: | | | | |
| Decrease in line of credit . . . . . . . . . . . . . . . . . . . . . . . . . . . . . . . . . . . . . . . . . . . . . . . . . . . . . . . . . . . . . . . . . . . . . . . . . . | | | (414,000 | ) |
| Proceeds from shares sold . . . . . . . . . . . . . . . . . . . . . . . . . . . . . . . . . . . . . . . . . . . . . . . . . . . . . . . . . . . . . . . . . . . . . . . . . | | | 791,787 | |
| Payment on shares redeemed . . . . . . . . . . . . . . . . . . . . . . . . . . . . . . . . . . . . . . . . . . . . . . . . . . . . . . . . . . . . . . . . . . . . . . | | | (1,869,089 | ) |
| Net cash used in financing activities . . . . . . . . . . . . . . . . . . . . . . . . . . . . . . . . . . . . . . . . . . . . . . . . . . . . . . . . . . . . . . . . . | | | (1,491,302 | ) |
| Net change in cash . . . . . . . . . . . . . . . . . . . . . . . . . . . . . . . . . . . . . . . . . . . . . . . . . . . . . . . . . . . . . . . . . . . . . . . . . . . . . . . . . | | $ | — | |
| | | | | |
| CASH: | | | | |
| Beginning balance . . . . . . . . . . . . . . . . . . . . . . . . . . . . . . . . . . . . . . . . . . . . . . . . . . . . . . . . . . . . . . . . . . . . . . . . . . . . . . . | | | — | |
| Ending balance . . . . . . . . . . . . . . . . . . . . . . . . . . . . . . . . . . . . . . . . . . . . . . . . . . . . . . . . . . . . . . . . . . . . . . . . . . . . . . . . . . | | $ | — | |
| | | | | |
| | | | | |
| Supplemental disclosure of cash flow information: | | | | |
During the six months ended April 30, 2010, the Dynamic Innovators Fund paid cash of $9,873 in interest. | | | | |
The accompanying notes are an integral part of these financial statements.
Statements of Changes in Net Assests
| | | Dynamic Dividend Fund | |
| | | Six Months Ended | | Year Ended | |
| | | April 30, 2010 | | October 31, 2009 | |
| | | (Unaudited) | | | |
| OPERATIONS: | | | | | |
| Net investment income . . . . . . . . . . . . . . . . . . . . . . . . . . . . . . . . . . . . . . . . . . . . . . . . . . . . . . . . . . . | | $ | 41,147,623 | | $ | 135,732,607 | |
| Net realized gain (loss) on: | | | | | | | |
| Investments . . . . . . . . . . . . . . . . . . . . . . . . . . . . . . . . . . . . . . . . . . . . . . . . . . . . . . . . . . . . . . . . . . . | | | 293,711 | | | (371,836,256 | ) |
| Written option contracts expired or closed . . . . . . . . . . . . . . . . . . . . . . . . . . . . . . . . . . . . . . . . . | | | — | | | 672,620 | |
| Foreign currency translation . . . . . . . . . . . . . . . . . . . . . . . . . . . . . . . . . . . . . . . . . . . . . . . . . . . . . | | | (129,606 | ) | | (1,907,275 | ) |
| Forward currency contracts . . . . . . . . . . . . . . . . . . . . . . . . . . . . . . . . . . . . . . . . . . . . . . . . . . . . . . | | | — | | | (3,392,718 | ) |
| Swap contracts . . . . . . . . . . . . . . . . . . . . . . . . . . . . . . . . . . . . . . . . . . . . . . . . . . . . . . . . . . . . . . . . | | | (1,869,561 | ) | | 5,526,555 | |
| Change in unrealized appreciation on: | | | | | | | |
| Investments . . . . . . . . . . . . . . . . . . . . . . . . . . . . . . . . . . . . . . . . . . . . . . . . . . . . . . . . . . . . . . . . . . . | | | 33,888,192 | | | 259,883,578 | |
| Foreign currency and foreign currency translation . . . . . . . . . . . . . . . . . . . . . . . . . . . . . . . . . . . | | | 168,802 | | | 249,106 | |
| Change in net assets resulting from operations . . . . . . . . . . . . . . . . . . . . . . . . . . . . . . . . . . . . . . . | | | 73,499,161 | | | 24,928,217 | |
| | | | | | | | |
| DISTRIBUTIONS TO SHAREHOLDERS: | | | | | | | |
| From net investment income . . . . . . . . . . . . . . . . . . . . . . . . . . . . . . . . . . . . . . . . . . . . . . . . . . . . . | | | (74,964,857 | ) | | (126,650,712 | ) |
| From net realized gain on investments . . . . . . . . . . . . . . . . . . . . . . . . . . . . . . . . . . . . . . . . . . . . | | | — | | | — | |
| Change in net assets resulting from distributions to shareholders . . . . . . . . . . . . . . . . . . . . . . . . | | | (74,964,857 | ) | | (126,650,712 | ) |
| | | | | | | | |
| CAPITAL SHARE TRANSACTIONS: | | | | | | | |
| Proceeds from shares sold . . . . . . . . . . . . . . . . . . . . . . . . . . . . . . . . . . . . . . . . . . . . . . . . . . . . . . . . . | | | 237,113,878 | | | 196,120,574 | |
| Dividends reinvested . . . . . . . . . . . . . . . . . . . . . . . . . . . . . . . . . . . . . . . . . . . . . . . . . . . . . . . . . . . . . | | | 52,078,218 | | | 87,140,087 | |
| Redemption fees . . . . . . . . . . . . . . . . . . . . . . . . . . . . . . . . . . . . . . . . . . . . . . . . . . . . . . . . . . . . . . . . | | | 48,672 | | | 178,370 | |
| Cost of shares redeemed . . . . . . . . . . . . . . . . . . . . . . . . . . . . . . . . . . . . . . . . . . . . . . . . . . . . . . . . . . | | | (102,998,865 | ) | | (208,323,675 | ) |
| Change in net assets from capital share transactions . . . . . . . . . . . . . . . . . . . . . . . . . . . . . . . . . . . | | | 186,241,903 | | | 75,115,356 | |
| Total change in net assets . . . . . . . . . . . . . . . . . . . . . . . . . . . . . . . . . . . . . . . . . . . . . . . . . . . . . . . | | | 184,776,207 | | | (26,607,139 | ) |
| | | | | | | | |
| NET ASSETS: | | | | | | | |
| Beginning of period . . . . . . . . . . . . . . . . . . . . . . . . . . . . . . . . . . . . . . . . . . . . . . . . . . . . . . . . . . . . . . | | | 572,151,407 | | | 598,758,546 | |
| End of period* . . . . . . . . . . . . . . . . . . . . . . . . . . . . . . . . . . . . . . . . . . . . . . . . . . . . . . . . . . . . . . . . . . | | $ | 756,927,614 | | $ | 572,151,407 | |
| | | | | | | | |
| * Including accumulated undistributed net investment income (loss) of: . . . . . . . . . . . . . . . . . . . . . | | $ | (9,486,399 | ) | $ | 24,330,835 | |
| | | | | | | | |
The accompanying notes are an integral part of these financial statements.
Statements of Changes in Net Assests - Continued
| | | Accelerating Dividend Fund | |
| | | Six Months Ended | | Period Ended | |
| | | April 30, 2010 | | | October 31, 2009 | (1) |
| | | (Unaudited) | | | | |
| OPERATIONS: | | | | | | |
| Net investment income . . . . . . . . . . . . . . . . . . . . . . . . . . . . . . . . . . . . . . . . . . . . . . . . . . . . . . . . . . . | | $ | 51,997 | | | $ | 12,387 | |
| Net realized gain on: | | | | | | | | |
| Investments . . . . . . . . . . . . . . . . . . . . . . . . . . . . . . . . . . . . . . . . . . . . . . . . . . . . . . . . . . . . . . . . . . . | | | 62,594 | | | | 5,392 | |
| Foreign currency translation . . . . . . . . . . . . . . . . . . . . . . . . . . . . . . . . . . . . . . . . . . . . . . . . . . . . . | | | 784 | | | | 182 | |
| Change in unrealized appreciation (depreciation) on: | | | | | | | | |
| Investments . . . . . . . . . . . . . . . . . . . . . . . . . . . . . . . . . . . . . . . . . . . . . . . . . . . . . . . . . . . . . . . . . . . | | | 86,937 | | | | 135,638 | |
| Foreign currency translation . . . . . . . . . . . . . . . . . . . . . . . . . . . . . . . . . . . . . . . . . . . . . . . . . . . . . | | | (601 | ) | | | 2 | |
| Change in net assets resulting from operations . . . . . . . . . . . . . . . . . . . . . . . . . . . . . . . . . . . . . . . | | | 201,711 | | | | 153,601 | |
| | | | | | | | | |
| DISTRIBUTIONS TO SHAREHOLDERS: | | | | | | | | |
| From net investment income . . . . . . . . . . . . . . . . . . . . . . . . . . . . . . . . . . . . . . . . . . . . . . . . . . . . . | | | (41,154 | ) | | | — | |
| From net realized gain on investments . . . . . . . . . . . . . . . . . . . . . . . . . . . . . . . . . . . . . . . . . . . . | | | (5,575 | ) | | | — | |
| Change in net assets resulting from distributions to shareholders . . . . . . . . . . . . . . . . . . . . . . . . | | | (46,729 | ) | | | — | |
| | | | | | | | | |
| CAPITAL SHARE TRANSACTIONS: | | | | | | | | |
| Proceeds from shares sold . . . . . . . . . . . . . . . . . . . . . . . . . . . . . . . . . . . . . . . . . . . . . . . . . . . . . . . . . | | | 969,367 | | | | 1,060,985 | |
| Dividends reinvested . . . . . . . . . . . . . . . . . . . . . . . . . . . . . . . . . . . . . . . . . . . . . . . . . . . . . . . . . . . . . | | | 29,359 | | | | — | |
| Redemption fees . . . . . . . . . . . . . . . . . . . . . . . . . . . . . . . . . . . . . . . . . . . . . . . . . . . . . . . . . . . . . . . . | | | 20 | | | | — | |
| Cost of shares redeemed . . . . . . . . . . . . . . . . . . . . . . . . . . . . . . . . . . . . . . . . . . . . . . . . . . . . . . . . . . | | | (33,314 | ) | | | — | |
| Change in net assets from capital share transactions . . . . . . . . . . . . . . . . . . . . . . . . . . . . . . . . . . . | | | 965,432 | | | | 1,060,985 | |
| Total change in net assets . . . . . . . . . . . . . . . . . . . . . . . . . . . . . . . . . . . . . . . . . . . . . . . . . . . . . . . | | | 1,120,414 | | | | 1,214,586 | |
| | | | | | | | | |
| NET ASSETS: | | | | | | | | |
| Beginning of period . . . . . . . . . . . . . . . . . . . . . . . . . . . . . . . . . . . . . . . . . . . . . . . . . . . . . . . . . . . . . . | | | 1,214,586 | | | | — | |
| End of period* . . . . . . . . . . . . . . . . . . . . . . . . . . . . . . . . . . . . . . . . . . . . . . . . . . . . . . . . . . . . . . . . . . | | $ | 2,335,000 | | | $ | 1,214,586 | |
| | | | | | | | | |
| * Including accumulated undistributed net investment income of: . . . . . . . . . . . . . . . . . . . . . . . . . | | $ | 23,230 | | | $ | 12,387 | |
| | | | | | | | | |
| (1) Fund commenced operations on November 5, 2008. | | | | | | | | |
The accompanying notes are an integral part of these financial statements.
Statements of Changes in Net Assests - Continued
| | | Dynamic Financial Services Fund | |
| | | Six Months Ended | | | Year Ended | |
| | | April 30, 2010 | | | October 31, 2009 | |
| | | (Unaudited) | | | | |
| OPERATIONS: | | | | | | |
| Net investment income (loss) . . . . . . . . . . . . . . . . . . . . . . . . . . . . . . . . . . . . . . . . . . . . . . . . . . . . . . | | $ | (11,601 | ) | | $ | 24,005 | |
| Net realized gain (loss) on: | | | | | | | | |
| Investments . . . . . . . . . . . . . . . . . . . . . . . . . . . . . . . . . . . . . . . . . . . . . . . . . . . . . . . . . . . . . . . . . . . | | | 173,543 | | | | (145,307 | ) |
| Foreign currency translation . . . . . . . . . . . . . . . . . . . . . . . . . . . . . . . . . . . . . . . . . . . . . . . . . . . . . | | | 478 | | | | 7,994 | |
| Change in unrealized appreciation on: | | | | | | | | |
| Investments . . . . . . . . . . . . . . . . . . . . . . . . . . . . . . . . . . . . . . . . . . . . . . . . . . . . . . . . . . . . . . . . . . . | | | 2,281,876 | | | | 1,352,226 | |
| Foreign currency translation . . . . . . . . . . . . . . . . . . . . . . . . . . . . . . . . . . . . . . . . . . . . . . . . . . . . . | | | 2,201 | | | | 674 | |
| Change in net assets resulting from operations . . . . . . . . . . . . . . . . . . . . . . . . . . . . . . . . . . . . . . . | | | 2,446,497 | | | | 1,239,592 | |
| | | | | | | | | |
| DISTRIBUTIONS TO SHAREHOLDERS: | | | | | | | | |
| From net investment income . . . . . . . . . . . . . . . . . . . . . . . . . . . . . . . . . . . . . . . . . . . . . . . . . . . . . | | | — | | | | (99,399 | ) |
| From net realized gain on investments . . . . . . . . . . . . . . . . . . . . . . . . . . . . . . . . . . . . . . . . . . . . | | | — | | | | (419,990 | ) |
| From tax return of capital . . . . . . . . . . . . . . . . . . . . . . . . . . . . . . . . . . . . . . . . . . . . . . . . . . . . . . . | | | — | | | | (4,121 | ) |
| Change in net assets resulting from distributions to shareholders . . . . . . . . . . . . . . . . . . . . . . . . | | | — | | | | (523,510 | ) |
| | | | | | | | | |
| CAPITAL SHARE TRANSACTIONS: | | | | | | | | |
| Proceeds from shares sold . . . . . . . . . . . . . . . . . . . . . . . . . . . . . . . . . . . . . . . . . . . . . . . . . . . . . . . . . | | | 1,150,371 | | | | 1,966,966 | |
| Dividends reinvested . . . . . . . . . . . . . . . . . . . . . . . . . . . . . . . . . . . . . . . . . . . . . . . . . . . . . . . . . . . . . | | | — | | | | 473,302 | |
| Redemption fees . . . . . . . . . . . . . . . . . . . . . . . . . . . . . . . . . . . . . . . . . . . . . . . . . . . . . . . . . . . . . . . . | | | 524 | | | | 1,015 | |
| Cost of shares redeemed . . . . . . . . . . . . . . . . . . . . . . . . . . . . . . . . . . . . . . . . . . . . . . . . . . . . . . . . . . | | | (1,284,297 | ) | | | (1,938,943 | ) |
| Change in net assets from capital share transactions . . . . . . . . . . . . . . . . . . . . . . . . . . . . . . . . . . . | | | (133,402 | ) | | | 502,340 | |
| Total change in net assets . . . . . . . . . . . . . . . . . . . . . . . . . . . . . . . . . . . . . . . . . . . . . . . . . . . . . . . | | | 2,313,095 | | | | 1,218,422 | |
| | | | | | | | | |
| NET ASSETS: | | | | | | | | |
| Beginning of period . . . . . . . . . . . . . . . . . . . . . . . . . . . . . . . . . . . . . . . . . . . . . . . . . . . . . . . . . . . . . . | | | 7,894,933 | | | | 6,676,511 | |
| End of period* . . . . . . . . . . . . . . . . . . . . . . . . . . . . . . . . . . . . . . . . . . . . . . . . . . . . . . . . . . . . . . . . . . | | $ | 10,208,028 | | | $ | 7,894,933 | |
| | | | | | | | | |
| * Including accumulated undistributed net investment income (loss) of: . . . . . . . . . . . . . . . . . . . . . | | $ | (6,948 | ) | | $ | 4,653 | |
| | | | | | | | | |
The accompanying notes are an integral part of these financial statements.
Statements of Changes in Net Assests - Continued
| | | Dynamic Innovators Fund | |
| | | Six Months Ended | | | Year Ended | |
| | | April 30, 2010 | | | October 31, 2009 | |
| | | (Unaudited) | | | | |
| OPERATIONS: | | | | | | |
| Net investment loss . . . . . . . . . . . . . . . . . . . . . . . . . . . . . . . . . . . . . . . . . . . . . . . . . . . . . . . . . . . . . . | | $ | (65,832 | ) | | $ | (90,764 | ) |
| Net realized gain (loss) on: | | | | | | | | |
| Investments . . . . . . . . . . . . . . . . . . . . . . . . . . . . . . . . . . . . . . . . . . . . . . . . . . . . . . . . . . . . . . . . . . . | | | (1,681,080 | ) | | | (5,526,915 | ) |
| Foreign currency translation . . . . . . . . . . . . . . . . . . . . . . . . . . . . . . . . . . . . . . . . . . . . . . . . . . . . . | | | — | | | | 92 | |
| Change in unrealized appreciation (depreciation) on: | | | | | | | | |
| Investments . . . . . . . . . . . . . . . . . . . . . . . . . . . . . . . . . . . . . . . . . . . . . . . . . . . . . . . . . . . . . . . . . . . | | | 4,359,326 | | | | 6,968,188 | |
| Foreign currency translation . . . . . . . . . . . . . . . . . . . . . . . . . . . . . . . . . . . . . . . . . . . . . . . . . . . . . | | | — | | | | (49 | ) |
| Change in net assets resulting from operations . . . . . . . . . . . . . . . . . . . . . . . . . . . . . . . . . . . . . . . | | | 2,612,414 | | | | 1,350,552 | |
| | | | | | | | | |
| DISTRIBUTIONS TO SHAREHOLDERS: | | | | | | | | |
| From net investment income . . . . . . . . . . . . . . . . . . . . . . . . . . . . . . . . . . . . . . . . . . . . . . . . . . . . . | | | — | | | | — | |
| From net realized gain on investments . . . . . . . . . . . . . . . . . . . . . . . . . . . . . . . . . . . . . . . . . . . . | | | — | | | | — | |
| Change in net assets resulting from distributions to shareholders . . . . . . . . . . . . . . . . . . . . . . . . | | | — | | | | — | |
| | | | | | | | | |
| CAPITAL SHARE TRANSACTIONS: | | | | | | | | |
| Proceeds from shares sold . . . . . . . . . . . . . . . . . . . . . . . . . . . . . . . . . . . . . . . . . . . . . . . . . . . . . . . . . | | | 800,970 | | | | 1,676,100 | |
| Dividends reinvested . . . . . . . . . . . . . . . . . . . . . . . . . . . . . . . . . . . . . . . . . . . . . . . . . . . . . . . . . . . . . | | | — | | | | — | |
| Redemption fees . . . . . . . . . . . . . . . . . . . . . . . . . . . . . . . . . . . . . . . . . . . . . . . . . . . . . . . . . . . . . . . . | | | 648 | | | | 1,168 | |
| Cost of shares redeemed . . . . . . . . . . . . . . . . . . . . . . . . . . . . . . . . . . . . . . . . . . . . . . . . . . . . . . . . . . | | | (1,865,273 | ) | | | (7,302,845 | ) |
| Change in net assets from capital share transactions . . . . . . . . . . . . . . . . . . . . . . . . . . . . . . . . . . . | | | (1,063,655 | ) | | | (5,625,577 | ) |
| Total change in net assets . . . . . . . . . . . . . . . . . . . . . . . . . . . . . . . . . . . . . . . . . . . . . . . . . . . . . . . | | | 1,548,759 | | | | (4,275,025 | ) |
| | | | | | | | | |
| NET ASSETS: | | | | | | | | |
| Beginning of period . . . . . . . . . . . . . . . . . . . . . . . . . . . . . . . . . . . . . . . . . . . . . . . . . . . . . . . . . . . . . . | | | 11,107,515 | | | | 15,382,540 | |
| End of period* . . . . . . . . . . . . . . . . . . . . . . . . . . . . . . . . . . . . . . . . . . . . . . . . . . . . . . . . . . . . . . . . . . | | $ | 12,656,274 | | | $ | 11,107,515 | |
| | | | | | | | | |
| * Including accumulated undistributed net investment loss of: . . . . . . . . . . . . . . . . . . . . . . . . . . . . | | $ | (65,832 | ) | | $ | — | |
| | | | | | | | | |
The accompanying notes are an integral part of these financial statements.
Statements of Changes in Net Assests - Continued
| | | Dynamic Transformations Fund | |
| | | Six Months Ended | | | Year Ended | |
| | | April 30, 2010 | | | October 31, 2009 | |
| | | (Unaudited) | | | | |
| OPERATIONS: | | | | | | |
| Net investment loss . . . . . . . . . . . . . . . . . . . . . . . . . . . . . . . . . . . . . . . . . . . . . . . . . . . . . . . . . . . . . . | | $ | (16,881 | ) | | $ | (4,327 | ) |
| Net realized loss on investments . . . . . . . . . . . . . . . . . . . . . . . . . . . . . . . . . . . . . . . . . . . . . . . . . . . . | | | (206,113 | ) | | | (653,420 | ) |
| Change in unrealized appreciation on investments . . . . . . . . . . . . . . . . . . . . . . . . . . . . . . . . . . . . | | | 1,422,270 | | | | 1,518,183 | |
| Change in net assets resulting from operations . . . . . . . . . . . . . . . . . . . . . . . . . . . . . . . . . . . . . . . | | | 1,199,276 | | | | 860,436 | |
| | | | | | | | | |
| DISTRIBUTIONS TO SHAREHOLDERS: | | | | | | | | |
| From net investment income . . . . . . . . . . . . . . . . . . . . . . . . . . . . . . . . . . . . . . . . . . . . . . . . . . . . . | | | — | | | | (14,717 | ) |
| From net realized gain on investments . . . . . . . . . . . . . . . . . . . . . . . . . . . . . . . . . . . . . . . . . . . . | | | — | | | | — | |
| From tax return of capital . . . . . . . . . . . . . . . . . . . . . . . . . . . . . . . . . . . . . . . . . . . . . . . . . . . . . . . | | | — | | | | (2,411 | ) |
| Change in net assets resulting from distributions to shareholders . . . . . . . . . . . . . . . . . . . . . . . . | | | — | | | | (17,128 | ) |
| | | | | | | | | |
| CAPITAL SHARE TRANSACTIONS: | | | | | | | | |
| Proceeds from shares sold . . . . . . . . . . . . . . . . . . . . . . . . . . . . . . . . . . . . . . . . . . . . . . . . . . . . . . . . . | | | 736,811 | | | | 82,368 | |
| Dividends reinvested . . . . . . . . . . . . . . . . . . . . . . . . . . . . . . . . . . . . . . . . . . . . . . . . . . . . . . . . . . . . . | | | — | | | | 17,115 | |
| Redemption fees . . . . . . . . . . . . . . . . . . . . . . . . . . . . . . . . . . . . . . . . . . . . . . . . . . . . . . . . . . . . . . . . | | | 247 | | | | 1 | |
| Cost of shares redeemed . . . . . . . . . . . . . . . . . . . . . . . . . . . . . . . . . . . . . . . . . . . . . . . . . . . . . . . . . . | | | (98,871 | ) | | | (78,085 | ) |
| Change in net assets from capital share transactions . . . . . . . . . . . . . . . . . . . . . . . . . . . . . . . . . . . | | | 638,187 | | | | 21,399 | |
| Total change in net assets . . . . . . . . . . . . . . . . . . . . . . . . . . . . . . . . . . . . . . . . . . . . . . . . . . . . . . . | | | 1,837,463 | | | | 864,707 | |
| | | | | | | | | |
| NET ASSETS: | | | | | | | | |
| Beginning of period . . . . . . . . . . . . . . . . . . . . . . . . . . . . . . . . . . . . . . . . . . . . . . . . . . . . . . . . . . . . . . | | | 3,514,205 | | | | 2,649,498 | |
| End of period* . . . . . . . . . . . . . . . . . . . . . . . . . . . . . . . . . . . . . . . . . . . . . . . . . . . . . . . . . . . . . . . . . . | | $ | 5,351,668 | | | $ | 3,514,205 | |
| | | | | | | | | |
| * Including accumulated undistributed net investment loss of: . . . . . . . . . . . . . . . . . . . . . . . . . . . . | | $ | (16,881 | ) | | $ | — | |
| | | | | | | | | |
The accompanying notes are an integral part of these financial statements.
Statements of Changes in Net Assests - Continued
| | | Dynamic Balance Fund | |
| | | Six Months Ended | | | Year Ended | |
| | | April 30, 2010 | | | October 31, 2009 | |
| | | (Unaudited) | | | | |
| OPERATIONS: | | | | | | |
| Net investment income . . . . . . . . . . . . . . . . . . . . . . . . . . . . . . . . . . . . . . . . . . . . . . . . . . . . . . . . . . . | | $ | 413,264 | | | $ | 841,491 | |
| Net realized gain (loss) on: | | | | | | | | |
| Investments . . . . . . . . . . . . . . . . . . . . . . . . . . . . . . . . . . . . . . . . . . . . . . . . . . . . . . . . . . . . . . . . . . . | | | (38,757 | ) | | | 703 | |
| Written option contracts expired or closed . . . . . . . . . . . . . . . . . . . . . . . . . . . . . . . . . . . . . . . . . | | | 15,494 | | | | 145,530 | |
| Change in unrealized appreciation (depreciation) on: | | | | | | | | |
| Investments . . . . . . . . . . . . . . . . . . . . . . . . . . . . . . . . . . . . . . . . . . . . . . . . . . . . . . . . . . . . . . . . . . . | | | 8,699,870 | | | | 4,462,680 | |
| Written option contracts . . . . . . . . . . . . . . . . . . . . . . . . . . . . . . . . . . . . . . . . . . . . . . . . . . . . . . . . | | | (11,224 | ) | | | 11,224 | |
| Change in net assets resulting from operations . . . . . . . . . . . . . . . . . . . . . . . . . . . . . . . . . . . . . . . | | | 9,078,647 | | | | 5,461,628 | |
| | | | | | | | | |
| DISTRIBUTIONS TO SHAREHOLDERS: | | | | | | | | |
| From net investment income . . . . . . . . . . . . . . . . . . . . . . . . . . . . . . . . . . . . . . . . . . . . . . . . . . . . . | | | (362,243 | ) | | | (845,241 | ) |
| From net realized gain on investments . . . . . . . . . . . . . . . . . . . . . . . . . . . . . . . . . . . . . . . . . . . . | | | — | | | | — | |
| From tax return on capital . . . . . . . . . . . . . . . . . . . . . . . . . . . . . . . . . . . . . . . . . . . . . . . . . . . . . . . | | | — | | | | (114,962 | ) |
| Change in net assets resulting from distributions to shareholders . . . . . . . . . . . . . . . . . . . . . . . . | | | (362,243 | ) | | | (960,203 | ) |
| | | | | | | | | |
| CAPITAL SHARE TRANSACTIONS: | | | | | | | | |
| Proceeds from shares sold . . . . . . . . . . . . . . . . . . . . . . . . . . . . . . . . . . . . . . . . . . . . . . . . . . . . . . . . . | | | 1,689,205 | | | | 314,766 | |
| Dividends reinvested . . . . . . . . . . . . . . . . . . . . . . . . . . . . . . . . . . . . . . . . . . . . . . . . . . . . . . . . . . . . . | | | 345,951 | | | | 918,908 | |
| Redemption fees . . . . . . . . . . . . . . . . . . . . . . . . . . . . . . . . . . . . . . . . . . . . . . . . . . . . . . . . . . . . . . . . | | | 1,511 | | | | 106 | |
| Cost of shares redeemed . . . . . . . . . . . . . . . . . . . . . . . . . . . . . . . . . . . . . . . . . . . . . . . . . . . . . . . . . . | | | (1,532,517 | ) | | | (3,602,450 | ) |
| Change in net assets from capital share transactions . . . . . . . . . . . . . . . . . . . . . . . . . . . . . . . . . . . | | | 504,150 | | | | (2,368,670 | ) |
| Total change in net assets . . . . . . . . . . . . . . . . . . . . . . . . . . . . . . . . . . . . . . . . . . . . . . . . . . . . . . . | | | 9,220,554 | | | | 2,132,755 | |
| | | | | | | | | |
| NET ASSETS: | | | | | | | | |
| Beginning of period . . . . . . . . . . . . . . . . . . . . . . . . . . . . . . . . . . . . . . . . . . . . . . . . . . . . . . . . . . . . . . | | | 55,230,218 | | | | 53,097,463 | |
| End of period* . . . . . . . . . . . . . . . . . . . . . . . . . . . . . . . . . . . . . . . . . . . . . . . . . . . . . . . . . . . . . . . . . . | | $ | 64,450,772 | | | $ | 55,230,218 | |
| | | | | | | | | |
| * Including accumulated undistributed net investment income (loss) of: . . . . . . . . . . . . . . . . . . . . . | | $ | 24,309 | | | $ | (26,712 | ) |
| | | | | | | | | |
The accompanying notes are an integral part of these financial statements.
Statements of Changes in Net Assests - Continued
| | | Ultra Short | |
| | | Tax Optimized Income Fund | |
| | | Six Months Ended | | | Year Ended | |
| | | April 30, 2010 | | | October 31, 2009 | |
| | | (Unaudited) | | | | |
| OPERATIONS: | | | | | | |
| Net investment income . . . . . . . . . . . . . . . . . . . . . . . . . . . . . . . . . . . . . . . . . . . . . . . . . . . . . . . . . . . | | $ | 9,359,890 | | | $ | 23,322,056 | |
| Net realized gain on investments . . . . . . . . . . . . . . . . . . . . . . . . . . . . . . . . . . . . . . . . . . . . . . . . . . . | | | — | | | | 2,449 | |
| Change in unrealized appreciation on investments . . . . . . . . . . . . . . . . . . . . . . . . . . . . . . . . . . . . | | | 661,898 | | | | 2,292,156 | |
| Change in net assets resulting from operations . . . . . . . . . . . . . . . . . . . . . . . . . . . . . . . . . . . . . . . | | | 10,021,788 | | | | 25,616,661 | |
| | | | | | | | | |
| DISTRIBUTIONS TO SHAREHOLDERS: | | | | | | | | |
| Distributions to Adviser Class Shareholders: | | | | | | | | |
| From net investment income . . . . . . . . . . . . . . . . . . . . . . . . . . . . . . . . . . . . . . . . . . . . . . . . . . . . . | | | (1,057,055 | ) | | | (1,957,636 | ) |
| Distributions to Investor Class Shareholders: | | | | | | | | |
| From net investment income . . . . . . . . . . . . . . . . . . . . . . . . . . . . . . . . . . . . . . . . . . . . . . . . . . . . . | | | (8,302,467 | ) | | | (21,386,016 | ) |
| Change in net assets resulting from distributions to shareholders . . . . . . . . . . . . . . . . . . . . . . . . | | | (9,359,522 | ) | | | (23,343,652 | ) |
| | | | | | | | | |
| CAPITAL SHARE TRANSACTIONS: | | | | | | | | |
| Proceeds from shares sold . . . . . . . . . . . . . . . . . . . . . . . . . . . . . . . . . . . . . . . . . . . . . . . . . . . . . . . . . | | | 553,378,877 | | | | 1,796,530,927 | |
| Dividends reinvested . . . . . . . . . . . . . . . . . . . . . . . . . . . . . . . . . . . . . . . . . . . . . . . . . . . . . . . . . . . . . | | | 6,353,359 | | | | 16,990,391 | |
| Redemption fees . . . . . . . . . . . . . . . . . . . . . . . . . . . . . . . . . . . . . . . . . . . . . . . . . . . . . . . . . . . . . . . . | | | 39,842 | | | | 67,162 | |
| Cost of shares redeemed . . . . . . . . . . . . . . . . . . . . . . . . . . . . . . . . . . . . . . . . . . . . . . . . . . . . . . . . . . | | | (755,952,757 | ) | | | (385,248,405 | ) |
| Change in net assets from capital share transactions . . . . . . . . . . . . . . . . . . . . . . . . . . . . . . . . . . . | | | (196,180,679 | ) | | | 1,428,340,075 | |
| Total change in net assets . . . . . . . . . . . . . . . . . . . . . . . . . . . . . . . . . . . . . . . . . . . . . . . . . . . . . . . | | | (195,518,413 | ) | | | 1,430,613,084 | |
| | | | | | | | | |
| NET ASSETS: | | | | | | | | |
| Beginning of period . . . . . . . . . . . . . . . . . . . . . . . . . . . . . . . . . . . . . . . . . . . . . . . . . . . . . . . . . . . . . . | | | 1,673,860,139 | | | | 243,247,055 | |
| End of period* . . . . . . . . . . . . . . . . . . . . . . . . . . . . . . . . . . . . . . . . . . . . . . . . . . . . . . . . . . . . . . . . . . | | $ | 1,478,341,726 | | | $ | 1,673,860,139 | |
| | | | | | | | | |
| * Including accumulated undistributed net investment income of: . . . . . . . . . . . . . . . . . . . . . . . . . | | $ | 892 | | | $ | 524 | |
| | | | | | | | | |
The accompanying notes are an integral part of these financial statements.
Statements of Changes in Net Assests - Continued
| | | Municipal Money Market Fund | |
| | | Six Months Ended | | | Year Ended | |
| | | April 30, 2010 | | | October 31, 2009 | |
| | | (Unaudited) | | | | |
| OPERATIONS: | | | | | | |
| Net investment income . . . . . . . . . . . . . . . . . . . . . . . . . . . . . . . . . . . . . . . . . . . . . . . . . . . . . . . . . . . | | $ | 528,647 | | | $ | 6,742,772 | |
| Net realized gain on investments . . . . . . . . . . . . . . . . . . . . . . . . . . . . . . . . . . . . . . . . . . . . . . . . . . . | | | — | | | | 87,593 | |
| Change in net assets resulting from operations . . . . . . . . . . . . . . . . . . . . . . . . . . . . . . . . . . . . . . . | | | 528,647 | | | | 6,830,365 | |
| | | | | | | | | |
| DISTRIBUTIONS TO SHAREHOLDERS: | | | | | | | | |
| From net investment income . . . . . . . . . . . . . . . . . . . . . . . . . . . . . . . . . . . . . . . . . . . . . . . . . . . . . | | | (528,647 | ) | | | (6,742,772 | ) |
| From net realized gain on investments . . . . . . . . . . . . . . . . . . . . . . . . . . . . . . . . . . . . . . . . . . . . | | | — | | | | (87,593 | ) |
| From tax return of capital . . . . . . . . . . . . . . . . . . . . . . . . . . . . . . . . . . . . . . . . . . . . . . . . . . . . . . . | | | — | | | | (2,781 | ) |
| Change in net assets resulting from distributions to shareholders . . . . . . . . . . . . . . . . . . . . . . . . | | | (528,647 | ) | | | (6,833,146 | ) |
| | | | | | | | | |
| CAPITAL SHARE TRANSACTIONS: | | | | | | | | |
| Proceeds from shares sold . . . . . . . . . . . . . . . . . . . . . . . . . . . . . . . . . . . . . . . . . . . . . . . . . . . . . . . . . | | | 665,537,605 | | | | 1,310,070,747 | |
| Dividends reinvested . . . . . . . . . . . . . . . . . . . . . . . . . . . . . . . . . . . . . . . . . . . . . . . . . . . . . . . . . . . . . | | | 379,518 | | | | 5,367,192 | |
| Cost of shares redeemed . . . . . . . . . . . . . . . . . . . . . . . . . . . . . . . . . . . . . . . . . . . . . . . . . . . . . . . . . . | | | (922,664,127 | ) | | | (1,190,003,238 | ) |
| Change in net assets from capital share transactions . . . . . . . . . . . . . . . . . . . . . . . . . . . . . . . . . . . | | | (256,747,004 | ) | | | 125,434,701 | |
| Total change in net assets . . . . . . . . . . . . . . . . . . . . . . . . . . . . . . . . . . . . . . . . . . . . . . . . . . . . . . . | | | (256,747,004 | ) | | | 125,431,920 | |
| | | | | | | | | |
| NET ASSETS: | | | | | | | | |
| Beginning of period . . . . . . . . . . . . . . . . . . . . . . . . . . . . . . . . . . . . . . . . . . . . . . . . . . . . . . . . . . . . . . | | | 789,832,454 | | | | 664,400,534 | |
| End of period* . . . . . . . . . . . . . . . . . . . . . . . . . . . . . . . . . . . . . . . . . . . . . . . . . . . . . . . . . . . . . . . . . . | | $ | 533,085,450 | | | $ | 789,832,454 | |
| | | | | | | | | |
| * Including accumulated undistributed net investment income of: . . . . . . . . . . . . . . . . . . . . . . . . . | | $ | — | | | $ | — | |
| | | | | | | | | |
The accompanying notes are an integral part of these financial statements.
Financial Highlights
(For a share outstanding throughout each period)
| Financial Highlights | | | | | | | | | | | | | |
| (For a share outstanding throughout each period) | | | | | | | | | | |
| | Dynamic Dividend Fund |
| | | | | | | | | | | | | | | | | | |
| | | | | Year Ended |
| | | | | October 31, |
| | | | | | | | | | | | | | | | | | |
| | | | | | | | | | | | | | | | | | |
| | | | | 2009 | | | 2008 | | | 2007 | | | 2006 | | | 2005 | |
| Per Share Data: | | | | | | | | | | | | | | | | | |
Net asset value per share, beginning of period . . . . | $ | 4.78 | | | $ | 5.72 | | | $ | 13.32 | | | $ | 12.52 | | | $ | 11.98 | | | $ | 12.34 | |
| Income from investment operations: | | | | | | | | | | | | | | | | | | | | | | | |
Net investment income . . . . . . . . . . . . . . . . . . . | | 0.29 | | | | 1.37 | | | | 1.33 | | | | 1.95 | | | | 1.61 | | | | 1.57 | |
Net realized and unrealized gains (losses) on | | | | | | | | | | | | | | | | | | | | | | | |
investments . . . . . . . . . . . . . . . . . . . . . . . . . . . . | | 0.30 | | | | (1.14 | ) | | | (7.29 | ) | | | 0.61 | | | | 0.51 | | | | (0.14 | ) |
Total from investment operations . . . . . . . . . | | 0.59 | | | | 0.23 | | | | (5.96 | ) | | | 2.56 | | | | 2.12 | | | | 1.43 | |
Redemption fees . . . . . . . . . . . . . . . . . . . . . . . . . . . . . . | | 0.00 | (a) | | | 0.00 | (a) | | | 0.00 | (a) | | | 0.00 | (a) | | | 0.00 | (a) | | | 0.00 | (a) |
| Less Distributions: | | | | | | | | | | | | | | | | | | | | | | | |
From net investment income . . . . . . . . . . . . . . | | (0.55 | ) | | | (1.17 | ) | | | (1.58 | ) | | | (1.76 | ) | | | (1.58 | ) | | | (1.51 | ) |
From net realized gains on investments . . . . | | — | | | | — | | | | — | | | | — | | | | — | | | | (0.28 | ) |
From tax return on capital . . . . . . . . . . . . . . . . | | — | | | | — | | | | (0.06 | ) | | | — | | | | — | | | | — | |
Total distributions . . . . . . . . . . . . . . . . . . . . . . | | (0.55 | ) | | | (1.17 | ) | | | (1.64 | ) | | | (1.76 | ) | | | (1.58 | ) | | | (1.79 | ) |
Net asset value per share, end of period . . . . . . . . . . | $ | 4.82 | | | $ | 4.78 | | | $ | 5.72 | | | $ | 13.32 | | | $ | 12.52 | | | $ | 11.98 | |
| | | | | | | | | | | | | | | | | | | | | | | | |
Total return . . . . . . . . . . . . . . . . . . . . . . . . . . . . . . . . . . | | 12.39 | %(b) | | | 6.64 | % | | | –49.05 | % | | | 21.66 | % | | | 18.68 | % | | | 11.85 | % |
| Ratios/Supplemental Data: | | | | | | | | | | | | | | | | | | | | | | | |
Net Assets at end of period (000) . . . . . . . . . . | $ | 756,928 | | | $ | 572,151 | | | $ | 598,759 | | | $ | 1,500,072 | | | $ | 633,264 | | | $ | 311,335 | |
Ratio of total expenses to average net assets: | | | | | | | | | | | | | | | | | | | | | | | |
Before waivers, reimbursements, | | | | | | | | | | | | | | | | | | | | | | | |
and recoveries . . . . . . . . . . . . . . . . . . . . . . . . | | 1.24 | %(c) | | | 1.20 | % | | | 1.18 | % | | | 1.15 | % | | | 1.18 | % | | | 1.20 | % |
After waivers, reimbursements, | | | | | | | | | | | | | | | | | | | | | | | |
and recoveries . . . . . . . . . . . . . . . . . . . . . . . . | | 1.24 | %(c) | | | 1.20 | % | | | 1.18 | % | | | 1.15 | % | | | 1.18 | % | | | 1.23 | % |
Ratio of interest expense to average net assets | | 0.06 | %(c) | | | 0.02 | % | | | 0.02 | % | | | 0.00 | %(a) | | | 0.00 | %(a) | | | — | |
Ratio of expenses to average net assets | | | | | | | | | | | | | | | | | | | | | | | |
excluding interest expense: | | | | | | | | | | | | | | | | | | | | | | | |
Before waivers, reimbursements, | | | | | | | | | | | | | | | | | | | | | | | |
and recoveries . . . . . . . . . . . . . . . . . . . . . . . . . . | | 1.18 | %(c) | | | 1.18 | % | | | 1.16 | % | | | 1.15 | % | | | 1.18 | % | | | 1.20 | % |
After waivers, reimbursements, | | | | | | | | | | | | | | | | | | | | | | | |
and recoveries . . . . . . . . . . . . . . . . . . . . . . . . . . | | 1.18 | %(c) | | | 1.18 | % | | | 1.16 | % | | | 1.15 | % | | | 1.18 | % | | | 1.23 | % |
Ratio of net investment income to average | | | | | | | | | | | | | | | | | | | | | | | |
net assets . . . . . . . . . . . . . . . . . . . . . . . . . . . . . . | | 12.29 | %(c) | | | 26.04 | % | | | 15.32 | % | | | 15.65 | % | | | 14.04 | % | | | 14.22 | % |
Portfolio turnover . . . . . . . . . . . . . . . . . . . . . . . | | 254 | % | | | 656 | % | | | 323 | % | | | 216 | % | | | 192 | % | | | 216 | % |
| | | | | | | | | | | | | | | | | | | | | | | | |
| (a) The amount is less than $0.005 per share or 0.005%. | | | | | | | | | | | | | | | | | | | | | |
| (b) Not annualized. | | | | | | | | | | | | | | | | | | | | | | | |
| (c) Annualized. | | | | | | | | | | | | | | | | | | | | | | | |
The accompanying notes are an integral part of these financial statements.
Financial Highlights—Continued
(For a share outstanding throughout each period)
| | | Accelerating | |
| | | Dividend | |
| | | Fund | |
| | | Six Months | | | | |
| | | Ended | | | Period Ended | |
| | | April 30, | | | October 31, | |
| | | 2010 | | | 2009 (a) | |
| Per Share Data: | | (Unaudited) | | | | |
| Net asset value per share, beginning of period . . . . . . . . . . . . . . . . . . . . . . . . . . . . . . . . . . . . . . | $ | 11.48 | | | $ | 10.00 | |
| Income from investment operations: | | | | | | | | |
Net investment income . . . . . . . . . . . . . . . . . . . . . . . . . . . . . . . . . . . . . . . . . . . . . . . . . . . . . . | | 0.36 | | | | 0.12 | |
Net realized and unrealized gains on investments. . . . . . . . . . . . . . . . . . . . . . . . . . . . . . . . | | | 1.07 | | | | 1.36 | |
Total from investment operations . . . . . . . . . . . . . . . . . . . . . . . . . . . . . . . . . . . . . . . . . . . . . . | | 1.43 | | | | 1.48 | |
Redemption fees . . . . . . . . . . . . . . . . . . . . . . . . . . . . . . . . . . . . . . . . . . . . . . . . . . . . . . . . . . . . . . . | | 0.00 | (b) | | | — | |
| Less Distributions: | | | | | | | | |
From net investment income . . . . . . . . . . . . . . . . . . . . . . . . . . . . . . . . . . . . . . . . . . . . . . . . . . | | (0.23 | ) | | | — | |
From net realized gains on investments . . . . . . . . . . . . . . . . . . . . . . . . . . . . . . . . . . . . . . . . . | | (0.03 | ) | | | — | |
Total distributions . . . . . . . . . . . . . . . . . . . . . . . . . . . . . . . . . . . . . . . . . . . . . . . . . . . . . . . . . . . | | (0.26 | ) | | | — | |
Net asset value per share, end of period . . . . . . . . . . . . . . . . . . . . . . . . . . . . . . . . . . . . . . . . . . . . | $ | 12.65 | | | $ | 11.48 | |
| | | | | | | | | |
Total return . . . . . . . . . . . . . . . . . . . . . . . . . . . . . . . . . . . . . . . . . . . . . . . . . . . . . . . . . . . . . . . . . . . . | | 12.50 | %(c) | | | 14.80 | %(c) |
| Ratios/Supplemental Data: | | | | | | | | |
Net Assets at end of period (000) . . . . . . . . . . . . . . . . . . . . . . . . . . . . . . . . . . . . . . . . . . . . . . | $ | 2,335 | | | $ | 1,215 | |
Ratio of expenses to average net assets: | | | | | | | | |
Before waivers . . . . . . . . . . . . . . . . . . . . . . . . . . . . . . . . . . . . . . . . . . . . . . . . . . . . . . . . . . . | | 2.82 | %(d) | | | 5.26 | %(d) |
After waivers . . . . . . . . . . . . . . . . . . . . . . . . . . . . . . . . . . . . . . . . . . . . . . . . . . . . . . . . . . . . | | 1.35 | %(d) | | | 1.35 | %(d) |
Ratio of net investment income to average net assets . . . . . . . . . . . . . . . . . . . . . . . . . . . . . | | 5.22 | %(d) | | | 1.19 | %(d) |
Portfolio turnover . . . . . . . . . . . . . . . . . . . . . . . . . . . . . . . . . . . . . . . . . . . . . . . . . . . . . . . . . . | | 187 | % | | | 104 | % |
| | | | | | | | | |
| (a) For the period from November 5, 2008 (inception of fund) to October 31, 2009. | | | | | | | |
| (b) The amount is less than $0.005 per share. | | | | | | | | |
| (c) Not annualized. | | | | | | | | |
| (d) Annualized. | | | | | | | | |
The accompanying notes are an integral part of these financial statements.
Financial Highlights—Continued
(For a share outstanding throughout each period)
| | | Dynamic Financial Services Fund | |
| | | Six Months Ended | | | Year Ended | | | Period Ended | |
| | | April 30, | | | October 31, | | | October 31, | |
| | | 2010 | | | 2009 | | | 2008 | | | 2007 | | | 2006 (a) | |
| Per Share Data: | | (Unaudited) | | | | | | | | | | | | | |
| Net asset value per share, beginning of period | | $ | 6.86 | | | $ | 6.24 | | | $ | 13.89 | | | $ | 12.13 | | | $ | 10.00 | |
Income from investment operations: | | | | | | | | | | | | | | | | | | | | |
Net investment income (loss) | | | (0.01 | ) | | | 0.03 | | | | 0.07 | | | | (0.02 | ) | | | 0.02 | |
Net realized and unrealized gains (losses) on investments | | | 2.27 | | | | 1.10 | | | | (4.40 | ) | | | 2.54 | | | | 2.12 | |
Total from investment operations | | | 2.26 | | | | 1.13 | | | | (4.33 | ) | | | 2.52 | | | | 2.14 | |
| Redemption fees | | | 0.00 | (b) | | | 0.00 | (b) | | | 0.01 | | | | 0.00 | (b) | | | 0.00 | (b) |
| Less Distributions: | | | | | | | | | | | | | | | | | | | | |
From net investment income | | | — | | | | (0.10 | ) | | | — | | | | (0.01 | ) | | | (0.01 | ) |
From net realized gains on investments | | | — | | | | (0.41 | ) | | | (3.33 | ) | | | (0.75 | ) | | | — | |
From tax return on capital | | | — | | | | (0.00 | )(b) | | | — | | | | — | | | | — | |
Total distributions | | | — | | | | (0.51 | ) | | | (3.33 | ) | | | (0.76 | ) | | | (0.01 | ) |
| Net asset value per share, end of period | | $ | 9.12 | | | $ | 6.86 | | | $ | 6.24 | | | $ | 13.89 | | | $ | 12.13 | |
| | | | | | | | | | | | | | | | | | | | | |
| Total return | | | 33.14 | %(c) | | | 21.83 | % | | | –41.16 | % | | | 21.64 | % | | | 21.47 | % |
| Ratios/Supplemental Data: | | | | | | | | | | | | | | | | | | | | |
Net Assets at end of period (000) | | $ | 10,208 | | | $ | 7,895 | | | $ | 6,677 | | | $ | 10,820 | | | $ | 7,544 | |
Ratio of total expenses to average net assets: | | | | | | | | | | | | | | | | | | | | |
Before waivers | | | 1.88 | %(d) | | | 2.06 | % | | | 1.94 | % | | | 2.61 | % | | | 2.53 | % |
After waivers | | | 1.40 | %(d) | | | 1.44 | % | | | 1.35 | % | | | 1.35 | % | | | 1.35 | % |
Ratio of interest expense to average net assets | | | 0.05 | %(d) | | | 0.09 | % | | | 0.37 | % | | | 1.02 | % | | | 0.01 | % |
Ratio of expenses to average net assets excluding | | | | | | | | | | | | | | | | | | | | |
interest expense: | | | | | | | | | | | | | | | | | | | | |
Before waivers | | | 1.83 | %(d) | | | 1.97 | % | | | 1.57 | % | | | 1.59 | % | | | 2.52 | % |
After waivers | | | 1.35 | %(d) | | | 1.35 | % | | | 0.98 | % | | | 0.33 | % | | | 1.34 | % |
Ratio of net investment income (loss) to average net asset | | | (0.28 | )%(d) | | | 0.39 | % | | | 1.32 | % | | | (0.16 | )% | | | 0.15 | % |
Portfolio turnover | | | 102 | % | | | 437 | % | | | 455 | % | | | 397 | % | | | 106 | % |
| | | | | | | | | | | | | | | | | | | | | |
| (a) | For the period from November 1, 2005 (inception of fund) to October 31, 2006. |
| (b) | The amount is less than $0.005 per share. |
The accompanying notes are an integral part of these financial statements.
Alpine Mutual Funds & #160;
Financial Highlights—Continued
(For a share outstanding throughout each period)
| | | | | | Dynamic Innovators Fund | | | | |
| | | Six Months Ended | | | Year Ended | | | Period Ended | |
| | | April 30, | | | October 31, | | | October 31, | |
| | | 2010 | | | 2009 | | | 2008 | | | 2007 | | | 2006 (a) | |
| Per Share Data: | | (Unaudited) | | | | | | | | | | | | | |
| Net asset value per share, beginning of period | | $ | 8.13 | | | $ | 6.83 | | | $ | 14.08 | | | $ | 10.31 | | | $ | 10.00 | |
Income from investment operations: | | | | | | | | | | | | | | | | | | | | |
Net investment income (loss) | | | (0.05 | ) | | | — | | | | (0.01 | ) | | | 0.07 | | | | 0.09 | |
Net realized and unrealized gains (losses) on investments | | | 2.10 | | | | 1.30 | | | | (6.84 | ) | | | 3.91 | | | | 0.22 | |
Total from investment operations | | | 2.05 | | | | 1.30 | | | | (6.85 | ) | | | 3.98 | | | | 0.31 | |
| Redemption fees | | | 0.00 | (b) | | | 0.00 | (b) | | | 0.03 | | | | 0.01 | | | | — | |
| Less Distributions: | | | | | | | | | | | | | | | | | | | | |
From net investment income | | | — | | | | — | | | | (0.02 | ) | | | (0.14 | ) | | | — | |
From net realized gains on investments | | | — | | | | — | | | | (0.41 | ) | | | (0.08 | ) | | | — | |
Total distributions | | | — | | | | — | | | | (0.43 | ) | | | (0.22 | ) | | | — | |
| Net asset value per share, end of period | | $ | 10.18 | | | $ | 8.13 | | | $ | 6.83 | | | $ | 14.08 | | | $ | 10.31 | |
| | | | | | | | | | | | | | | | | | | | | |
| Total return | | | 25.22 | %(c) | | | 19.03 | % | | | –49.95 | % | | | 39.47 | % | | | 3.10 | %(c) |
| Ratios/Supplemental Data: | | | | | | | | | | | | | | | | | | | | |
Net Assets at end of period (000) | | $ | 12,656 | | | $ | 11,108 | | | $ | 15,383 | | | $ | 48,355 | | | $ | 5,073 | |
Ratio of total expenses to average net assets: | | | | | | | | | | | | | | | | | | | | |
Before waivers, reimbursements, and recoveries | | | 1.77 | %(d) | | | 1.86 | % | | | 1.31 | % | | | 1.53 | % | | | 4.25 | %(d) |
After waivers, reimbursements, and recoveries | | | 1.50 | %(d) | | | 1.54 | % | | | 1.35 | % | | | 1.33 | % | | | 1.35 | %(d) |
Ratio of interest expense to average net assets | | | 0.15 | %(d) | | | 0.19 | % | | | 0.04 | % | | | — | | | | — | |
Ratio of expenses to average net assets excluding | | | | | | | | | | | | | | | | | | | | |
interest expense: | | | | | | | | | | | | | | | | | | | | |
Before waivers, reimbursements, and recoveries | | | 1.62 | %(d) | | | 1.67 | % | | | 1.27 | % | | | 1.53 | % | | | 4.25 | %(d) |
After waivers, reimbursements, and recoveries | | | 1.35 | %(d) | | | 1.35 | % | | | 1.31 | % | | | 1.33 | % | | | 1.35 | %(d) |
Ratio of net investment income (loss) to average net assets | | | (1.12 | )%(d) | | | (0.92 | )% | | | (0.18 | )% | | | 1.08 | % | | | 3.18 | %(d) |
Portfolio turnover | | | 13 | % | | | 20 | % | | | 76 | % | | | 135 | % | | | 3 | % |
| | | | | | | | | | | | | | | | | | | | | |
| (a) | For the period from July 11, 2006 (commencement of operations) to October 31, 2006. |
| (b) | The amount is less than $0.005 per share. |
The accompanying notes are an integral part of these financial statements.
Alpine Mutual Funds & #160;
Financial Highlights—Continued
(For a share outstanding throughout each period)
| | | Dynamic Transformation Fund | |
| | | Six Months | | | | | | | |
| | | Ended | | | Year Ended | | | Period Ended | |
| | | April 30, | | | October 31, | | | October 31, | |
| | | 2010 | | | 2009 | | | 2008 (a) | |
| Per Share Data: | | (Unaudited) | | | | | | | |
| Net asset value per share, beginning of period | | $ | 7.68 | | | $ | 5.79 | | | $ | 10.00 | |
Income from investment operations: | | | | | | | | | | | | |
Net investment income (loss) | | | (0.03 | ) | | | 0.01 | | | | 0.03 | |
Net realized and unrealized gains (losses) on investments | | | 2.52 | | | | 1.92 | | | | (4.24 | ) |
Total from investment operations | | | 2.49 | | | | 1.93 | | | | (4.21 | ) |
| Redemption fees | | | 0.00 | (b) | | | 0.00 | (b) | | | 0.00 | (b) |
| Less Distributions: | | | | | | | | | | | | |
From net investment income | | | — | | | | (0.03 | ) | | | — | |
From net realized gains on investments | | | — | | | | — | | | | — | |
From tax return of capital | | | — | | | | (0.01 | ) | | | — | |
Total distributions | | | — | | | | (0.04 | ) | | | — | |
| Net asset value per share, end of period | | $ | 10.17 | | | $ | 7.68 | | | $ | 5.79 | |
| | | | | | | | | | | | | |
| Total return | | | 32.42 | %(c) | | | 33.61 | % | | | –42.10 | %(c) |
| Ratios/Supplemental Data: | | | | | | | | | | | | |
Net Assets at end of period (000) | | $ | 5,352 | | | $ | 3,514 | | | $ | 2,649 | |
Ratio of total expenses to average net assets: | | | | | | | | | | | | |
Before waivers | | | 2.32 | %(d) | | | 2.86 | % | | | 2.95 | %(d) |
After waivers | | | 1.39 | %(d) | | | 1.35 | % | | | 1.35 | %(d) |
Ratio of interest expense to average net assets | | | 0.04 | %(d) | | | 0.00 | %(b) | | | — | |
Ratio of expenses to average net assets excluding interest expense: | | | | | | | | | | | | |
Before waivers | | | 2.28 | %(d) | | | 2.86 | % | | | 2.95 | %(d) |
After waivers | | | 1.35 | %(d) | | | 1.35 | % | | | 1.35 | %(d) |
Ratio of net investment income (loss) to average net assets | | | (0.76 | )%(d) | | | (0.16 | )% | | | 0.44 | %(d) |
Portfolio turnover | | | 17 | % | | | 57 | % | | | 108 | % |
| | | | | | | | | | | | | |
| (a) | For the period from December 31, 2007 (inception of fund) to October 31, 2008. |
| (b) | The amount is less than 0.005% or $0.005 per share. |
The accompanying notes are an integral part of these financial statements.
Alpine Mutual Funds & #160;
Financial Highlights—Continued
(For a share outstanding throughout each period)
| | | Dynamic Balance Fund | |
| | | Six Months | | | | | | | | | | | | | | | | |
| | | Ended | | | Year Ended | |
| | | April 30, | | | October 31, | |
| | | 2010 | | | 2009 | | | 2008 | | | 2007 | | | 2006 | | | 2005 | |
| Per Share Data: | | (Unaudited) | | | | | | | | | | | | | | | | |
| Net asset value per share, beginning of period | | $ | 8.88 | | | $ | 8.15 | | | $ | 13.55 | | | $ | 13.72 | | | $ | 12.67 | | | $ | 12.44 | |
Income from investment operations: | | | | | | | | | | | | | | | | | | | | | | | | |
Net investment income | | | 0.07 | | | | 0.13 | | | | 0.26 | | | | 0.26 | | | | 0.21 | | | | 0.19 | |
Net realized and unrealized gains (losses) | | | | | | | | | | | | | | | | | | | | | | | | |
on investments | | | 1.41 | | | | 0.73 | | | | (4.47 | ) | | | 0.28 | | | | 1.26 | | | | 0.85 | |
Total from investment operations | | | 1.48 | | | | 0.88 | | | | (4.21 | ) | | | 0.54 | | | | 1.47 | | | | 1.04 | |
| Redemption fees | | | 0.00 | (a) | | | 0.00 | (a) | | | 0.00 | (a) | | | 0.00 | (a) | | | 0.00 | (a) | | | — | |
| Less Distributions: | | | | | | | | | | | | | | | | | | | | | | | | |
From net investment income | | | (0.06 | ) | | | (0.13 | ) | | | (0.25 | ) | | | (0.24 | ) | | | (0.20 | ) | | | (0.19 | ) |
From net realized gains on investments | | | — | | | | — | | | | (0.93 | ) | | | (0.47 | ) | | | (0.22 | ) | | | (0.62 | ) |
From tax return on capital | | | — | | | | (0.02 | ) | | | (0.01 | ) | | | — | | | | — | | | | — | |
Total distributions | | | (0.06 | ) | | | (0.15 | ) | | | (1.19 | ) | | | (0.71 | ) | | | (0.42 | ) | | | (0.81 | ) |
| Net asset value per share, end of period | | $ | 10.30 | | | $ | 8.88 | | | $ | 8.15 | | | $ | 13.55 | | | $ | 13.72 | | | $ | 12.67 | |
| | | | | | | | | | | | | | | | | | | | | | | | | |
| Total return | | | 16.69 | %(b) | | | 11.03 | % | | | –33.63 | % | | | 4.03 | % | | | 11.79 | % | | | 8.46 | % |
| Ratios/Supplemental Data: | | | | | | | | | | | | | | | | | | | | | | | | |
Net Assets at end of period (000) | | $ | 64,451 | | | $ | 55,230 | | | $ | 53,097 | | | $ | 92,360 | | | $ | 98,162 | | | $ | 97,471 | |
Ratio of total expenses to average net assets: | | | | | | | | | | | | | | | | | | | | | | | | |
Before waivers, reimbursements, | | | | | | | | | | | | | | | | | | | | | | | | |
and recoveries | | | 1.24 | %(c) | | | 1.26 | % | | | 1.24 | % | | | 1.16 | % | | | 1.19 | % | | | 1.21 | % |
After waivers, reimbursements, and | | | | | | | | | | | | | | | | | | | | | | | | |
recoveries | | | 1.24 | %(c) | | | 1.26 | % | | | 1.24 | % | | | 1.16 | % | | | 1.19 | % | | | 1.31 | % |
Ratio of interest expense to average net assets | | | — | | | | 0.00 | %(a) | | | 0.90 | % | | | 0.00 | %(a) | | | — | | | | 0.00 | %(a) |
Ratio of expenses to average net assets | | | | | | | | | | | | | | | | | | | | | | | | |
excluding interest expense: | | | | | | | | | | | | | | | | | | | | | | | | |
Before waivers, reimbursements, | | | | | | | | | | | | | | | | | | | | | | | | |
and recoveries | | | 1.24 | %(c) | | | 1.26 | % | | | 1.15 | % | | | 1.16 | % | | | 1.19 | % | | | 1.21 | % |
After waivers, reimbursements, | | | | | | | | | | | | | | | | | | | | | | | | |
and recoveries | | | 1.24 | %(c) | | | 1.26 | % | | | 1.15 | % | | | 1.16 | % | | | 1.19 | % | | | 1.31 | % |
Ratio of net investment income to average | | | | | | | | | | | | | | | | | | | | | | | | |
net assets | | | 1.40 | %(c) | | | 1.65 | % | | | 2.35 | % | | | 1.87 | % | | | 1.60 | % | | | 1.60 | % |
Portfolio turnover | | | 8 | % | | | 41 | % | | | 34 | % | | | 28 | % | | | 22 | % | | | 36 | % |
| | | | | | | | | | | | | | | | | | | | | | | | | |
| (a) | The amount is less than $0.005 per share or 0.005%. |
The accompanying notes are an integral part of these financial statements.
Alpine Mutual Funds & #160;
Financial Highlights—Continued
(For a share outstanding throughout each period)
| | | Ultra Short Tax Optimized Income Fund | |
| | | Six Months | | | | | | | | | | | | | | | | |
| | | Ended | | | Year Ended | |
| | | April 30, | | | October 31, | |
| | | 2010 | | | 2009 | | | 2008 | | | 2007 | | | 2006 | | | 2005 | |
| Advisor Class Shares: | | (Unaudited) | | | | | | | | | | | | | | | | |
| Net asset value per share, beginning of period | | $ | 10.10 | | | $ | 10.05 | | | $ | 10.10 | | | $ | 10.10 | | | $ | 10.03 | | | $ | 10.15 | |
Income from investment operations: | | | | | | | | | | | | | | | | | | | | | | | | |
Net investment income | | | 0.05 | | | | 0.30 | | | | 0.38 | | | | 0.38 | | | | 0.31 | | | | 0.28 | |
Net realized and unrealized gains | | | | | | | | | | | | | | | | | | | | | | | | |
(losses) on investments | | | 0.01 | | | | 0.04 | | | | (0.04 | ) | | | 0.00 | (a) | | | 0.09 | | | | (0.12 | ) |
Total from investment operations | | | 0.06 | | | | 0.34 | | | | 0.34 | | | | 0.38 | | | | 0.40 | | | | 0.16 | |
| Redemption fees | | | 0.00 | (a) | | | 0.00 | (a) | | | 0.00 | (a) | | | 0.00 | (a) | | | 0.00 | (a) | | | 0.00 | (a) |
| Less Distributions: | | | | | | | | | | | | | | | | | | | | | | | | |
From net investment income | | | (0.05 | ) | | | (0.29 | ) | | | (0.39 | ) | | | (0.38 | ) | | | (0.33 | ) | | | (0.28 | ) |
From net realized gains on investments | | | — | | | | — | | | | — | | | | — | | | | (0.00 | )(a) | | | — | |
Total distributions | | | (0.05 | ) | | | (0.29 | ) | | | (0.39 | ) | | | (0.38 | ) | | | (0.33 | ) | | | (0.28 | ) |
| Net asset value per share, end of period | | $ | 10.11 | | | $ | 10.10 | | | $ | 10.05 | | | $ | 10.10 | | | $ | 10.10 | | | $ | 10.03 | |
| | | | | | | | | | | | | | | | | | | | | | | | | |
| Total return | | | 0.57 | %(b) | | | 3.40 | % | | | 3.39 | % | | | 3.82 | % | | | 4.01 | % | | | 1.60 | % |
| Ratios/Supplemental Data: | | | | | | | | | | | | | | | | | | | | | | | | |
Net Assets at end of period (000) | | $ | 210,424 | | | $ | 211,643 | | | $ | 11,568 | | | $ | 871,630 | | | $ | 408,535 | | | $ | 112,454 | |
Ratio of expenses to average net assets: | | | | | | | | | | | | | | | | | | | | | | | | |
Before waivers | | | 1.03 | %(c) | | | 1.05 | % | | | 1.08 | % | | | 1.14 | % | | | 1.16 | % | | | 1.15 | % |
After waivers | | | 0.76 | %(c) | | | 0.85 | % | | | 0.85 | % | | | 0.85 | % | | | 0.85 | % | | | 0.85 | % |
Ratio of net investment income to average | | | | | | | | | | | | | | | | | | | | | | | | |
net assets | | | 0.94 | %(c) | | | 2.75 | % | | | 4.12 | % | | | 3.82 | % | | | 3.33 | % | | | 2.73 | % |
Portfolio turnover (d) | | | 6 | % | | | 16 | % | | | 129 | % | | | 171 | % | | | 96 | % | | | 97 | % |
| | | | | | | | | | | | | | | | | | | | | | | | | |
| (a) | The amount is less than $0.005 per share. |
| (d) | Portfolio turnover is calculated on the basis of the Fund as a whole, without distinguishing between classes of shares issued. |
The accompanying notes are an integral part of these financial statements.
Alpine Mutual Funds & #160;
Financial Highlights—Continued
(For a share outstanding throughout each period)
| | | Ultra Short Tax Optimized Income Fund | |
| | | Six Months | | | | | | | | | | | | | | | | |
| | | Ended | | | Year Ended | |
| | | April 30, | | | October 31, | |
| | | 2010 | | | 2009 | | | 2008 | | | 2007 | | | 2006 | | | 2005 | |
| Investor Class Shares: | | (Unaudited) | | | | | | | | | | | | | | | | |
| Net asset value per share, beginning of period | | $ | 10.05 | | | $ | 10.00 | | | $ | 10.04 | | | $ | 10.05 | | | $ | 10.03 | | | $ | 10.15 | |
Income from investment operations: | | | | | | | | | | | | | | | | | | | | | | | | |
Net investment income | | | 0.06 | | | | 0.31 | | | | 0.41 | | | | 0.40 | | | | 0.36 | | | | 0.30 | |
Net realized and unrealized gains (losses) | | | | | | | | | | | | | | | | | | | | | | | | |
on investments | | | 0.00 | (a) | | | 0.05 | | | | (0.04 | ) | | | (0.01 | ) | | | 0.02 | | | | (0.12 | ) |
Total from investment operations | | | 0.06 | | | | 0.36 | | | | 0.37 | | | | 0.39 | | | | 0.38 | | | | 0.18 | |
| Redemption fees | | | 0.00 | (a) | | | 0.00 | (a) | | | 0.00 | (a) | | | 0.00 | (a) | | | 0.00 | (a) | | | 0.00 | (a) |
| Less Distributions: | | | | | | | | | | | | | | | | | | | | | | | | |
From net investment income | | | (0.06 | ) | | | (0.31 | ) | | | (0.41 | ) | | | (0.40 | ) | | | (0.36 | ) | | | (0.30 | ) |
From net realized gains on investments | | | — | | | | — | | | | — | | | | — | | | | (0.00 | )(a) | | | — | |
Total distributions | | | (0.06 | ) | | | (0.31 | ) | | | (0.41 | ) | | | (0.40 | ) | | | (0.36 | ) | | | (0.30 | ) |
| Net asset value per share, end of period | | $ | 10.05 | | | $ | 10.05 | | | $ | 10.00 | | | $ | 10.04 | | | $ | 10.05 | | | $ | 10.03 | |
| | | | | | | | | | | | | | | | | | | | | | | | | |
| Total return | | | 0.60 | %(b) | | | 3.65 | % | | | 3.75 | % | | | 3.97 | % | | | 3.88 | % | | | 1.84 | % |
| Ratios/Supplemental Data: | | | | | | | | | | | | | | | | | | | | | | | | |
Net Assets at end of period (000) | | $ | 1,267,917 | | | $ | 1,462,217 | | | $ | 231,679 | | | $ | 59,409 | | | $ | 45,260 | | | $ | 45,691 | |
Ratio of expenses to average net assets: | | | | | | | | | | | | | | | | | | | | | | | | |
Before waivers | | | 0.78 | %(c) | | | 0.80 | % | | | 0.83 | % | | | 0.89 | % | | | 0.91 | % | | | 0.90 | % |
After waivers | | | 0.51 | %(c) | | | 0.60 | % | | | 0.60 | % | | | 0.60 | % | | | 0.60 | % | | | 0.60 | % |
Ratio of net investment income to average | | | | | | | | | | | | | | | | | | | | | | | | |
net assets | | | 1.19 | %(c) | | | 3.00 | % | | | 4.37 | % | | | 4.07 | % | | | 3.58 | % | | | 2.98 | % |
Portfolio turnover (d) | | | 6 | % | | | 16 | % | | | 129 | % | | | 171 | % | | | 96 | % | | | 97 | % |
| | | | | | | | | | | | | | | | | | | | | | | | | |
| (a) | The amount is less than $0.005 per share. |
| (d) | Portfolio turnover is calculated on the basis of the Fund as a whole, without distinguishing between classes of shares issued. |
The accompanying notes are an integral part of these financial statements.
Alpine Mutual Funds & #160;
Financial Highlights—Continued
(For a share outstanding throughout each period)
| | | Municipal Money Market Fund | |
| | | Six Months | | | | | | | | | | | | | | | | |
| | | Ended | | | Year Ended | |
| | | April 30, | | | October 31, | |
| | | 2010 | | | 2009 | | | 2008 | | | 2007 | | | 2006 | | | 2005 | |
| Per Share Data: | | (Unaudited) | | | | | | | | | | | | | | | | |
| Net asset value per share, beginning of period | | $ | 1.00 | | | $ | 1.00 | | | $ | 1.00 | | | $ | 1.00 | | | $ | 1.00 | | | $ | 1.00 | |
Income from investment operations: | | | | | | | | | | | | | | | | | | | | | | | | |
Net investment income | | | 0.00 | (a) | | | 0.01 | | | | 0.03 | | | | 0.04 | | | | 0.03 | | | | 0.02 | |
Total from investment operations | | | — | | | | 0.01 | | | | 0.03 | | | | 0.04 | | | | 0.03 | | | | 0.02 | |
| Less Distributions: | | | | | | | | | | | | | | | | | | | | | | | | |
From net investment income | | | 0.00 | (a) | | | (0.01 | ) | | | (0.03 | ) | | | (0.04 | ) | | | (0.03 | ) | | | (0.02 | ) |
From tax return capital | | | — | | | | 0.00 | (a) | | | — | | | | — | | | | — | | | | — | |
Total distributions | | | — | | | | (0.01 | ) | | | (0.03 | ) | | | (0.04 | ) | | | (0.03 | ) | | | (0.02 | ) |
| Net asset value per share, end of period | | $ | 1.00 | | | $ | 1.00 | | | $ | 1.00 | | | $ | 1.00 | | | $ | 1.00 | | | $ | 1.00 | |
| | | | | | | | | | | | | | | | | | | | | | | | | |
| Total return | | | 0.09 | %(b) | | | 1.03 | % | | | 2.94 | % | | | 3.68 | % | | | 3.33 | % | | | 2.24 | % |
| Ratios/Supplemental Data: | | | | | | | | | | | | | | | | | | | | | | | | |
Net Assets at end of period (000) | | $ | 533,085 | | | $ | 789,832 | | | $ | 664,401 | | | $ | 1,115,100 | | | $ | 365,840 | | | $ | 204,689 | |
Ratio of total expenses to average net assets: | | | | | | | | | | | | | | | | | | | | | | | | |
Before waivers | | | 0.47 | %(c) | | | 0.53 | % | | | 0.49 | % | | | 0.49 | % | | | 0.53 | % | | | 0.53 | % |
After waivers | | | 0.40 | %(c) | | | 0.53 | % | | | 0.35 | % | | | 0.26 | % | | | 0.30 | % | | | 0.27 | % |
Ratio of interest expense to average net assets | | | — | | | | 0.00 | %(a) | | | — | | | | — | | | | — | | | | — | |
Ratio of expenses to average net assets | | | | | | | | | | | | | | | | | | | | | | | | |
excluding interest expense: | | | | | | | | | | | | | | | | | | | | | | | | |
Before waivers | | | 0.47 | %(c) | | | 0.53 | % | | | 0.49 | % | | | 0.49 | % | | | 0.53 | % | | | 0.53 | % |
After waivers | | | 0.40 | %(c) | | | 0.53 | % | | | 0.35 | % | | | 0.26 | % | | | 0.30 | % | | | 0.27 | % |
Ratio of net investment income to average | | | | | | | | | | | | | | | | | | | | | | | | |
net assets | | | 0.18 | %(c) | | | 0.99 | % | | | 2.93 | % | | | 3.37 | % | | | 3.31 | % | | | 2.26 | % |
| | | | | | | | | | | | | | | | | | | | | | | | | |
| (a) | The amount is less than 0.005% or $0.005 per share. |
The accompanying notes are an integral part of these financial statements.
Alpine Mutual Funds & #160;
Notes to Financial Statements
April 30, 2010 (Unaudited)
1. Organization:
Alpine Series Trust (the “Series Trust”) was organized in 2001 as a Delaware business trust, and is registered under the Investment Company Act of 1940, as amended (the “1940 Act”), as an open-end management investment company. Alpine Income Trust (the “Income Trust”) was organized in 2002 as a Delaware business trust, and is registered under the 1940 Act, as an open-end management investment company. The Alpine Dynamic Dividend Fund, Alpine Ac celerating Dividend Fund, Alpine Dynamic Financial Services Fund, Alpine Dynamic Innovators Fund, Alpine Dynamic Transformations Fund and Alpine Dynamic Balance Fund are six separate funds of the Series Trust. The Alpine Ultra Short Tax Optimized Income Fund and Alpine Municipal Money Market Fund are two separate funds of the Income Trust. The Alpine Dynamic Dividend Fund, Alpine Accelerating Dividend Fund, Alpine Dynamic Financial Services Fund, Alpine Dynamic Innovators Fund, Alpine Dynamic Transformations Fund, Alpine Dynamic Balance Fund, Alpine Ultra Short Tax Optimized Income Fund and Alpine Municipal Money Market Fund (individually referred to as a “Fund” and collectively, “the Funds”) are diversified funds. Alpine Woods Capital Investors, LLC (the “Adviser”) is a Delaware limited liability company and serves as the investment manager to the Funds. The Board of Trustees approved the closing of the Adviser Class of the Alpine Municipal Money Market Fund on September 24, 2007. The final day of operatio n for this class was December 4, 2007. The Alpine Accelerating Dividend Fund commenced operations on November 5, 2008.
2. Significant Accounting Policies:
The following is a summary of significant accounting policies consistently followed by the Funds in the preparation of their financial statements. The policies are in conformity with accounting principles generally accepted in the United States of America (“GAAP”), which require management to make estimates and assumptions that affect amounts reported herein. Actual results could differ from those estimates.
A. Valuation of Securities:
The net asset value (“NAV”) of shares of the Funds are calculated by dividing the value of the Funds’ net assets by the number of outstanding shares. NAV is determined each day the NYSE is open as of the close of regular trading (normally, 4:00 p.m., Eastern time). In computing NAV, portfolio securities of the Funds are valued at their current market values determined on the basis of market quotations. In computing the Funds’ net asset value, equity securities that are traded on a securities exchange in the United States are valued at the last reported sale price as of the time of valuation, or lacking any current reported sale at the time of valuation, at the mean between the most recent bid and asked quotations. Each option security traded on a securities exchange in the United States is valued at the last current reported sale price as of the time of valuation, or lacking any current reported sale at the time of valuation, the option is valued at the mid-point of the consolidated bid/ask quote for the option security. Each security traded in the over-the-counter market and quoted on the NASDAQ National Market System is valued at the NASDAQ Official Closing Price (“NOCP”) as determined by NASDAQ, or lacking an NOCP, the last current reported sale price as of the time of valuation by NASDAQ, or lacking any current reported sale on NASDAQ at the time of valuation, at the mean between the most recent bid and asked quotations. Each over-thecounter option that is not traded through the Options Clearing Corporation is valued by the counterparty, or if the counterparty’s price is not readily available then by using the Black-Scholes method. Debt securities are valued based on an evaluated mean price as furnished by pricing services approved by the Board of Trustees, which may be based on market transactions for comparable securities and various relationships between securities that are generally re cognized by institutional traders, a computerized matrix system, or appraisals derived from information concerning the securities or similar securities received from recognized dealers in those securities. Short-term securities with maturities of 60 days or less are valued at amortized cost, which approximates fair value.
Equity securities that are principally traded in a foreign market are valued at the last current sale price at the time of valuation or lacking any current or reported sale, at the time of valuation, at the mean between the most recent bid and asked quotations as of the close of the appropriate exchange or other designated time. Trading in securities on European and Far Eastern securities exchanges and over-the-counter markets is normally completed at various times before the close of business on each day on which the NYSE is open. Trading of these securities may not take place on every NYSE business day. In addition, trading may take place in various foreign markets on Saturdays or on other days when the NYSE is not open and on which the Funds’ net asset values are not calculated. As stated above, if the market prices are not readily available or are not reflective of the fair value of the security as of the clos e of the regular trading on the NYSE (normally, 4:00pm Eastern time) the security will be priced at a fair value following procedures approved by the Board of Trustees.
Alpine Mutual Funds & #160;
Financial Highlights—Continued
April 30, 2010 (Unaudited)
When market quotations are not readily available or when the valuation methods mentioned above are not reflective of a fair value of the security, the security is valued at fair value following procedures and/or guidelines approved by the Board of Trustees. The Board has approved the use of Interactive Data’s proprietary fair value pricing model to assist in determining current valuation for foreign securities traded in markets that close prior to the NYSE. When fair value pricing is employed, the value of the portfolio security used to calculate the Funds’ net asset values may differ from quoted or official closing prices. In light of the judgment involved in fair value decisions, there can be no assurance that a fair value assigned to a particular security is accurate.
As of April 30, 2010, the Dynamic Dividend Fund, Accelerating Dividend Fund, Dynamic Financial Services Fund, Dynamic Innovators Fund and Ultra Short Tax Optimized Income Fund held securities that are fair valued, which comprised 27.2%, 7.7%, 1.4%, 0.7%, less than 0.05% and 0.2%, respectively, of each Fund’s net assets.
The Municipal Money Market Fund values its investments at amortized cost, which approximates market value. Pursuant to Rule 2a-7 of the 1940 Act, amortized cost, as defined, is a method of valuing securities at acquisition cost, adjusted for amortization of premium or accretion of discount rather than at their value based on current market factors.
In accordance with GAAP, the Funds use a three-tier hierarchy to establish classification of fair value measurements for disclosure purposes. Inputs refer broadly to the assumptions that market participants would use in pricing the asset or liability, including assumptions about risk. Inputs may be observable or unobservable. Observable inputs
are inputs that reflect the assumptions market participants would use in pricing the asset or liability that are developed based on market data obtained from sources independent of the reporting entity. Unobservable inputs are inputs that reflect the reporting entities own assumptions about the assumptions market participants would use in pricing the asset or liability that are developed based on the best information available.
Level 1 — Unadjusted quoted prices in active markets for identical assets or liabilities that the Fund has the ability to access.
Level 2 — Observable inputs other than quoted prices included in level 1 that are observable for the asset or liability, either directly or indirectly. These inputs may
include quoted prices for the identical instrument on an inactive market, prices for similar instruments, interest rates, prepayment speeds, credit risk, yield
curves, default rates and similar data.
Level 3 — Unobservable inputs for the asset or liability, to the extent relevant observable inputs are not available; representing the Funds’ own assumptions about the
assumptions a market participant would use in valuing the asset or liability, and would be based on the best information available.
The availability of observable inputs can vary from security to security and is affected by a wide variety of factors, including, for example, the type of security, whether the security is new and not yet established in the marketplace, the liquidity of markets, and other characteristics particular to the security. To the extent that valuation is based on models or inputs that are less observable or unobservable in the market, the determination of fair value requires more judgmen t. Accordingly, the degree of judgment exercised in determining fair value is greatest for instruments categorized in level 3.
The inputs used to measure fair value may fall into different levels of the fair value hierarchy. In such cases, for disclosure purposes, the level in the fair value hierarchy within which the fair value measurement falls in its entirety, is determined based on the lowest level input that is significant to the fair value measurement in its
entirety.
Various inputs are used in determining the value of the Funds’ investments as of the reporting period end. The designated input levels are not necessarily an indication of the risk or liquidity associated with these investments. These inputs are categorized in the following hierarchy under applicable financial accounting standards.
Notes to Financial Statements—Continued
April 30, 2010 (Unaudited)
| | | | | | | | | Dynamic | | | | Dynamic | | | |
| | | Dynamic | | | Accelerating | | | Financial | | Dynamic | | Trans- | | Dynamic | |
| | | Dividend | | | Dividend | | | Services | | Innovators | | formations | | Balance | |
| | | Fund | | | Fund | | | Fund | | Fund | | Fund | | Fund | |
| Level 1: | | | | | | | | | | | | | | |
| Common Stocks | | | | | | | | | | | | | | |
| | Consumer Discretionary . . | $ | 46,639,563 | | | $ | 93,246 | | | $ | — | | $ | 1,675,711 | | $ | 1,433,832 | | $ | 3,539,282 | |
| | Consumer Staples . . . . . . . | | 39,756,912 | | | | 239,442 | | | | — | | | — | | | — | | | 3,347,180 | |
| | Energy . . . . . . . . . . . . . . . . | | 56,748,264 | | | | 165,705 | | | | — | | | — | | | 89,360 | | | 4,188,710 | |
| | Financials . . . . . . . . . . . . . . | | 71,732,031 | | | | 376,834 | | | | 9,490,680 | | | 1,020,382 | | | 528,330 | | | 17,091,496 | |
| | Health Care . . . . . . . . . . . . | | 53,544,223 | | | | 122,930 | | | | — | | | 3,817,960 | | | 1,262,140 | | | 4,424,272 | |
| | Industrials . . . . . . . . . . . . . | | 54,073,575 | | | | 219,968 | | | | 308,950 | | | 1,946,927 | | | 1,372,626 | | | 8,305,144 | |
| | Information Technology . . | | 59,417,763 | | | | 226,256 | | | | — | | | 4,024,239 | | | 592,313 | | | 433,382 | |
| | Materials . . . . . . . . . . . . . . | | 48,838,856 | | | | 292,463 | | | | — | | | 537,460 | | | 262,730 | | | 2,011,108 | |
| | Telecommunication | | | | | | | | | | | | | | | | | | | | |
| | Services . . . . . . . . . . . . . | | 16,248,689 | | | | 32,973 | | | | — | | | 126,350 | | | — | | | — | |
| | Utilities . . . . . . . . . . . . . . . | | 17,407,794 | | | | 95,937 | | | | — | | | — | | | — | | | 2,204,826 | |
| | Convertible Preferred Stocks | | | | | | | | | | | | | | | | | | | | |
| | Financials . . . . . . . . . . . . . . | | 61,037 | | | | — | | | | 2,290 | | | — | | | — | | | 1,537 | |
| | Equity-Linked Structured | | | | | | | | | | | | | | | | | | | | |
| | Notes . . . . . . . . . . . . . . . | | 1,744,095 | | | | — | | | | — | | | | | | | | | | |
| | Investment Companies . . . | | — | | | | — | | | | 121,578 | | | — | | | — | | | 329,220 | |
| | Short-Term Investments . . | | 32,869,294 | | | | 179,895 | | | | 13,068 | | | 923 | | | 427 | | | 4,623,410 | |
| Level 2: | | | | | | | | | | | | | | | | | | | | |
| Common Stocks | | | | | | | | | | | | | | | | | | | | |
| | Consumer Discretionary . . | | 44,476,056 | | | | — | | | | — | | | — | | | 1,072 | | | — | |
| | Consumer Staples . . . . . . . | | 20,060,919 | | | | — | | | | — | | | — | | | — | | | — | |
| | Energy . . . . . . . . . . . . . . . . | | 23,354,433 | | | | 44,080 | | | | — | | | — | | | — | | | — | |
| | Financials . . . . . . . . . . . . . . | | 12,032,987 | | | | 48,720 | | | | 381,251 | | | — | | | — | | | — | |
| | Health Care . . . . . . . . . . . . | | 1,569,822 | | | | — | | | | — | | | — | | | | | | | |
| | Industrials . . . . . . . . . . . . . | | 50,448,958 | | | | 60,096 | | | | — | | | — | | | | | | | |
| | Materials . . . . . . . . . . . . . . | | 32,739,601 | | | | 21,024 | | | | — | | | 90,064 | | | | | | | |
| | Telecommunication | | | | | | | | | | | | | | | | | | | | |
| | Services . . . . . . . . . . . . . | | 18,527,752 | | | | — | | | | — | | | — | | | | | | | |
| | Utilities . . . . . . . . . . . . . . . | | 21,406,918 | | | | 89,061 | | | | — | | | — | | | | | | | |
| | Bonds and Notes . . . . . . . . | | — | | | | — | | | | — | | | — | | | — | | | 13,539,141 | |
| | Rights . . . . . . . . . . . . . . . . . | | 0 | (1) | | | — | | | | 14,112 | | | — | | | — | | | — | |
| Level 3: | | | | | | | | | | | | | | | | | | | | |
| Common Stocks | | | | | | | | | | | | | | | | | | | | |
| | Financials . . . . . . . . . . . . . . | | 0 | (1)* | | | — | | | | — | | | — | | | — | | | — | |
| Total Investments . . . . . . . . . . | $ | 723,699,542 | | | $ | 2,308,630 | | | $ | 10,331,929 | | $ | 13,240,016 | | $ | 5,542,830 | | $ | 64,038,708 | |
| (1) Market value is equal to $0. | | | | | | | | | | | | | | | | | | | | |
| * | During the six months ended April 30, 2010, the Dynamic Dividend Fund held one security which was catego- | |
| | rized in level 3: Anglo Irish Bank Corp. PLC. The fair value of this security at April 30, 2010 was $0. There were | |
| | no transactions in this security during the six months ended April 30, 2010. | | | | | | | | | | |
Notes to Financial Statements—Continued
April 30, 2010 (Unaudited)
| | Ultra Short | | Municipal | |
| | Tax Optimized | | Money | |
| | Income Fund | | Market Fund | |
| Level 1: | | | | |
Money Market Funds . . . . . . . . . . . . . . . . . . . . . . . . . . . . . . . . . . . . . . . . . . . . . . . . . | $ | 72,607 | | $ | 20,041,821 | |
| Level 2: | | | | | | |
Alabama . . . . . . . . . . . . . . . . . . . . . . . . . . . . . . . . . . . . . . . . . . . . . . . . . . . . . . . . . . . | | 73,092,282 | | | 4,000,000 | |
Alaska . . . . . . . . . . . . . . . . . . . . . . . . . . . . . . . . . . . . . . . . . . . . . . . . . . . . . . . . . . . . . | | — | | | 565,000 | |
Arizona . . . . . . . . . . . . . . . . . . . . . . . . . . . . . . . . . . . . . . . . . . . . . . . . . . . . . . . . . . . . | | 37,638,260 | | | — | |
Arkansas . . . . . . . . . . . . . . . . . . . . . . . . . . . . . . . . . . . . . . . . . . . . . . . . . . . . . . . . . . . | | 34,225,000 | | | — | |
California . . . . . . . . . . . . . . . . . . . . . . . . . . . . . . . . . . . . . . . . . . . . . . . . . . . . . . . . . . | | 77,866,513 | | | 33,695,000 | |
Colorado . . . . . . . . . . . . . . . . . . . . . . . . . . . . . . . . . . . . . . . . . . . . . . . . . . . . . . . . . . . | | 18,893,002 | | | 5,227,000 | |
Connecticut . . . . . . . . . . . . . . . . . . . . . . . . . . . . . . . . . . . . . . . . . . . . . . . . . . . . . . . . . | | 5,521,388 | | | — | |
Delaware . . . . . . . . . . . . . . . . . . . . . . . . . . . . . . . . . . . . . . . . . . . . . . . . . . . . . . . . . . . | | 3,867,287 | | | — | |
Florida . . . . . . . . . . . . . . . . . . . . . . . . . . . . . . . . . . . . . . . . . . . . . . . . . . . . . . . . . . . . . | | 150,630,063 | | | 44,196,970 | |
Georgia . . . . . . . . . . . . . . . . . . . . . . . . . . . . . . . . . . . . . . . . . . . . . . . . . . . . . . . . . . . . | | 36,941,990 | | | 6,450,000 | |
Idaho . . . . . . . . . . . . . . . . . . . . . . . . . . . . . . . . . . . . . . . . . . . . . . . . . . . . . . . . . . . . . . | | 6,555,000 | | | — | |
Illinois . . . . . . . . . . . . . . . . . . . . . . . . . . . . . . . . . . . . . . . . . . . . . . . . . . . . . . . . . . . . . | | 98,578,996 | | | 36,960,000 | |
Indiana . . . . . . . . . . . . . . . . . . . . . . . . . . . . . . . . . . . . . . . . . . . . . . . . . . . . . . . . . . . . | | 36,879,566 | | | 15,925,000 | |
Iowa . . . . . . . . . . . . . . . . . . . . . . . . . . . . . . . . . . . . . . . . . . . . . . . . . . . . . . . . . . . . . . . | | — | | | 12,170,000 | |
Kansas . . . . . . . . . . . . . . . . . . . . . . . . . . . . . . . . . . . . . . . . . . . . . . . . . . . . . . . . . . . . . | | 3,505,000 | | | 1,110,000 | |
Kentucky . . . . . . . . . . . . . . . . . . . . . . . . . . . . . . . . . . . . . . . . . . . . . . . . . . . . . . . . . . . | | 18,934,307 | | | 28,985,000 | |
Louisiana . . . . . . . . . . . . . . . . . . . . . . . . . . . . . . . . . . . . . . . . . . . . . . . . . . . . . . . . . . . | | 79,416,311 | | | 1,040,000 | |
Maine . . . . . . . . . . . . . . . . . . . . . . . . . . . . . . . . . . . . . . . . . . . . . . . . . . . . . . . . . . . . . | | 7,411,758 | | | — | |
Massachusetts . . . . . . . . . . . . . . . . . . . . . . . . . . . . . . . . . . . . . . . . . . . . . . . . . . . . . . . | | 40,365,226 | | | 15,450,000 | |
Michigan . . . . . . . . . . . . . . . . . . . . . . . . . . . . . . . . . . . . . . . . . . . . . . . . . . . . . . . . . . . | | 75,558,721 | | | 26,510,570 | |
Minnesota . . . . . . . . . . . . . . . . . . . . . . . . . . . . . . . . . . . . . . . . . . . . . . . . . . . . . . . . . . | | 3,315,000 | | | 1,510,000 | |
Mississippi . . . . . . . . . . . . . . . . . . . . . . . . . . . . . . . . . . . . . . . . . . . . . . . . . . . . . . . . . . | | 27,948,800 | | | 1,750,000 | |
Missouri . . . . . . . . . . . . . . . . . . . . . . . . . . . . . . . . . . . . . . . . . . . . . . . . . . . . . . . . . . . . | | 28,899,640 | | | 20,770,000 | |
Multi-State . . . . . . . . . . . . . . . . . . . . . . . . . . . . . . . . . . . . . . . . . . . . . . . . . . . . . . . . . | | 23,620,000 | | | — | |
Nevada . . . . . . . . . . . . . . . . . . . . . . . . . . . . . . . . . . . . . . . . . . . . . . . . . . . . . . . . . . . . | | 2,271,645 | | | 3,170,000 | |
New Hampshire . . . . . . . . . . . . . . . . . . . . . . . . . . . . . . . . . . . . . . . . . . . . . . . . . . . . . | | 11,444,550 | | | 11,000,000 | |
New Jersey . . . . . . . . . . . . . . . . . . . . . . . . . . . . . . . . . . . . . . . . . . . . . . . . . . . . . . . . . | | 42,964,163 | | | 11,900,000 | |
New Mexico . . . . . . . . . . . . . . . . . . . . . . . . . . . . . . . . . . . . . . . . . . . . . . . . . . . . . . . . | | 1,215,000 | | | 2,950,000 | |
New York . . . . . . . . . . . . . . . . . . . . . . . . . . . . . . . . . . . . . . . . . . . . . . . . . . . . . . . . . . . | | 20,027,721 | | | 31,535,000 | |
North Carolina . . . . . . . . . . . . . . . . . . . . . . . . . . . . . . . . . . . . . . . . . . . . . . . . . . . . . . | | 19,520,665 | | | — | |
Ohio . . . . . . . . . . . . . . . . . . . . . . . . . . . . . . . . . . . . . . . . . . . . . . . . . . . . . . . . . . . . . . . | | 31,399,489 | | | 14,510,000 | |
Oklahoma . . . . . . . . . . . . . . . . . . . . . . . . . . . . . . . . . . . . . . . . . . . . . . . . . . . . . . . . . . | | 410,548 | | | 4,600,000 | |
Oregon . . . . . . . . . . . . . . . . . . . . . . . . . . . . . . . . . . . . . . . . . . . . . . . . . . . . . . . . . . . . | | 15,400,000 | | | 14,695,000 | |
Pennsylvania . . . . . . . . . . . . . . . . . . . . . . . . . . . . . . . . . . . . . . . . . . . . . . . . . . . . . . . . | | 96,737,486 | | | 19,720,000 | |
Puerto Rico . . . . . . . . . . . . . . . . . . . . . . . . . . . . . . . . . . . . . . . . . . . . . . . . . . . . . . . . . | | 51,211,540 | | | — | |
Rhode Island . . . . . . . . . . . . . . . . . . . . . . . . . . . . . . . . . . . . . . . . . . . . . . . . . . . . . . . . | | 1,006,860 | | | 825,000 | |
South Carolina . . . . . . . . . . . . . . . . . . . . . . . . . . . . . . . . . . . . . . . . . . . . . . . . . . . . . . | | 12,552,170 | | | 6,480,000 | |
South Dakota . . . . . . . . . . . . . . . . . . . . . . . . . . . . . . . . . . . . . . . . . . . . . . . . . . . . . . . | | 1,428,648 | | | — | |
Tennessee . . . . . . . . . . . . . . . . . . . . . . . . . . . . . . . . . . . . . . . . . . . . . . . . . . . . . . . . . . | | 51,499,445 | | | 4,930,000 | |
Texas . . . . . . . . . . . . . . . . . . . . . . . . . . . . . . . . . . . . . . . . . . . . . . . . . . . . . . . . . . . . . . | | 55,443,932 | | | 52,950,000 | |
Vermont . . . . . . . . . . . . . . . . . . . . . . . . . . . . . . . . . . . . . . . . . . . . . . . . . . . . . . . . . . . | | 2,435,000 | | | 26,250,000 | |
Virgin Islands . . . . . . . . . . . . . . . . . . . . . . . . . . . . . . . . . . . . . . . . . . . . . . . . . . . . . . . | | 941,830 | | | — | |
Virginia . . . . . . . . . . . . . . . . . . . . . . . . . . . . . . . . . . . . . . . . . . . . . . . . . . . . . . . . . . . . | | 24,176,890 | | | 8,150,000 | |
Washington . . . . . . . . . . . . . . . . . . . . . . . . . . . . . . . . . . . . . . . . . . . . . . . . . . . . . . . . . | | 35,476,920 | | | 25,105,000 | |
West Virginia . . . . . . . . . . . . . . . . . . . . . . . . . . . . . . . . . . . . . . . . . . . . . . . . . . . . . . . | | 3,010,500 | | | 4,000,000 | |
Wisconsin . . . . . . . . . . . . . . . . . . . . . . . . . . . . . . . . . . . . . . . . . . . . . . . . . . . . . . . . . . | | 43,845,168 | | | 1,800,904 | |
Wyoming . . . . . . . . . . . . . . . . . . . . . . . . . . . . . . . . . . . . . . . . . . . . . . . . . . . . . . . . . . . | | 2,855,000 | | | — | |
Notes to Financial Statements—Continued
April 30, 2010 (Unaudited)
| | | | | Ultra Short | | Municipal |
| | | | | Tax Optimized | | Money |
| | | | | Income Fund | | Market Fund |
| Level 3: | | | | | | | |
| Multi-State . . . . . . . . . . . . . . . . . . . . . . . . . . . . . . . . . . . . . . . . . . . . . . . . . . . . . . . . . | | $ 2,820,000 | | $ — |
Total Investments . . . . . . . . . . . . . . . . . . . . . . . . . . . . . . . . . . . . . . . . . . . . . . . . . . . . . . | | $ 1,419,831,887 | | $ 520,927,265 |
| | | | | | | | |
| | | | | | | Ultra Short |
| | | | | | | Tax Optimized |
| | | | | | | Income Fund |
| Balance as of October 31, 2009 . . . . . . . . . . . . . . . . . . . . . . . . . . . . . . . . . . . . . . . . . . . . . . . . . . . . . . . . . | | $ 3,031,500 |
| Accrued discounts / premiums . . . . . . . . . . . . . . . . . . . . . . . . . . . . . . . . . . . . . . . . . . . . . . . . . . . . . . . . | | — |
| Realized gain (loss) . . . . . . . . . . . . . . . . . . . . . . . . . . . . . . . . . . . . . . . . . . . . . . . . . . . . . . . . . . . . . . . . . | | — |
Change in unrealized appreciation (depreciation) . . . . . . . . . . . . . . . . . . . . . . . . . . . . . . . . . . . . . . . . | | (211,500) |
Net purchases (sales) . . . . . . . . . . . . . . . . . . . . . . . . . . . . . . . . . . . . . . . . . . . . . . . . . . . . . . . . . . . . . . . . | | — |
| Transfers in and / or out of Level 3 . . . . . . . . . . . . . . . . . . . . . . . . . . . . . . . . . . . . . . . . . . . . . . . . . . . . | | — |
| Balance as of April 30, 2010 . . . . . . . . . . . . . . . . . . . . . . . . . . . . . . . . . . . . . . . . . . . . . . . . . . . . . . . . . . . | | $ 2,820,000 |
B. Security Transactions and Investment Income:
Security transactions are recorded on the date a security is purchased or sold (i.e. on the trade date). Realized gains and losses are computed on the identified cost basis. Interest income is recorded on the accrual basis and includes accretion of discounts and amortization of premiums, where applicable. Dividend income is recorded on the exdividend date or in the case of some foreign securities, on the date thereafter when the Funds are made aware of the dividend. Foreign incom e may be subject to foreign withholding taxes, which are accrued as applicable. Capital gains realized on some foreign securities are subject to foreign taxes, which are accrued as applicable. Dividends and interest from non-U.S. sources received by the Funds are generally subject to non-U.S. withholding taxes at rates ranging up to 30%. Such withholding taxes may be reduced or eliminated under the terms of applicable U.S. income tax treaties, and the Funds intend to undertake any procedural steps required to claim the benefits of such treaties.
C. Line of Credit:
Each Fund has a line of credit with U.S. Bank N.A. Loans in aggregate, whether to cover overdrafts or for investment purposes, may not exceed the maximum amount that is permitted under the 1940 Act. For the six months ended April 30, 2010, the average interest rate paid on outstanding borrowings under the line of credit was 1.27%, 1.25%, 1.31% and 1.25% for the Dynamic Dividend Fund, Dynamic Financial Services Fund, Dynamic Innovators Fund and Dynamic Transformations Fund, respec tively. The Funds also incur interest expense on custody overdraft charges.
Notes to Financial Statements—Continued
April 30, 2010 (Unaudited)
| | | | | | Dynamic | | | | | | Dynamic | |
| | | Dynamic | | | Financial | | | Dynamic | | | Trans- | |
| | | Dividend | | | Services | | | Innovators | | | formations | |
| | | Fund | | | Fund | | | Fund | | | Fund | |
| Total line of credit amount available . . . . . . . . . . . . . . . | | $ | 280,082,244 | | | $ | 3,696,961 | | | $ | 4,551,662 | | | $ | 1,870,858 | |
| Line of credit outstanding at April 30, 2010 . . . . . . . . . | | | — | | | | — | | | | 962,000 | | | | 242,000 | |
| Line of credit amount unused at April 30, 2010 . . . . . . | | | 280,082,244 | | | | 3,696,961 | | | | 3,589,662 | | | | 1,628,858 | |
| Average balance outstanding during the period . . . . . | | | 28,923,989 | | | | 348,249 | | | | 1,380,718 | | | | 130,298 | |
| Interest expense incurred on line of credit | | | | | | | | | | | | | | | | |
during the period . . . . . . . . . . . . . . . . . . . . . . . . . . . . . | | | 181,779 | | | | 2,189 | | | | 9,077 | | | | 819 | |
| Interest expense incurred on custody overdrafts | | | | | | | | | | | | | | | | |
during the period . . . . . . . . . . . . . . . . . . . . . . . . . . . . . | | | 2,873 | | | | 3 | | | | — | | | | — | |
D. Income Taxes:
It is each Fund’s policy to comply with the requirements of Subchapter M of the Internal Revenue Code applicable to regulated investment companies and to distribute timely, all of its investment company taxable income and net realized capital gains to shareholders. Therefore, no federal income tax provision is recorded. Under applicable foreign tax laws, a withholding tax may be imposed on interest, dividends, and capital gains earned on foreign investments. Where available , the Funds will file for claims on foreign taxes withheld.
E. Dividends and Distributions:
Each of the Dynamic Dividend, Accelerating Dividend, Dynamic Financial Services, Dynamic Innovators, Dynamic Transformations, Dynamic Balance and Ultra Short Tax Optimized Income Funds intends to distribute substantially all of its net investment income and net realized capital gains, if any, throughout the year to its shareholders in the form of dividends. The Municipal Money Market Fund declares and accrues dividends daily on each business day based upon the Fund’s net in come, and pays dividends monthly. Distributions to shareholders are recorded at the close of business on the ex-dividend date. All dividends are automatically reinvested in full and fractional shares of the Fund at net asset value per share, unless otherwise requested.
The amounts of dividends from net investment income and of distributions from net realized gains are determined in accordance with federal income tax regulations, which may differ from GAAP. These differences are either considered temporary or permanent in nature. To the extent these differences are permanent in nature, such amounts are reclassified within the composition of net assets based on their federal tax-basis treatment; temporary differences do not require reclassificati on. In the event dividends and distributions to shareholders exceed net investment income and net realized gains for tax purposes they are reported as returns of capital.
F. Class Allocations:
Income, expenses (other than class specific expenses) and realized and unrealized gains and losses of the Ultra Short Tax Optimized Income Fund are allocated among the classes of the Fund based on the relative net assets of each class. Class specific expenses are allocated to the class to which they relate. Currently, class specific expenses are limited to those incurred under the Distribution Plan for Adviser Class shares.
G. Foreign Currency Translation Transactions:
The Dynamic Dividend Fund, Accelerating Dividend Fund, Dynamic Financial Services Fund and Dynamic Transformations Fund may invest without limitation in foreign securities.The Dynamic Innovators Fund and Dynamic Balance Fund may invest up to 20% and 15%, respectively, of the value of its net assets in foreign securities. The books and records of each Fund are maintained in U.S. dollars. Non-U.S. denominated amounts are translated into U.S. dollars as follows, with the resultant t ranslation gains and losses recorded in the Statements of Operations:
i) market value of investment securities and other assets and liabilities at the exchange rate on the valuation date,
ii) purchases and sales of investment securities, income and expenses at the exchange rate prevailing on the respective date of such transactions.
Notes to Financial Statements—Continued
April 30, 2010 (Unaudited)
H. Risk Associated With Foreign Securities and Currencies:
Investments in securities of foreign issuers carry certain risks not ordinarily associated with investments in securities of domestic issuers. Such risks include future political and economic developments and the possible imposition of exchange controls or other foreign governmental laws and restrictions. In addition, with respect to certain countries, there is a possibility of expropriation of assets, confiscatory taxation, political or social instability or diplomatic developme nts, which could adversely affect investments in those countries. Certain countries may also impose substantial restrictions on investments in their capital markets by foreign entities, including restrictions on investments in issuers or industries deemed sensitive to relevant national interests. These factors may limit the investment opportunities available to the Funds or result in a lack of liquidity and high price volatility with respect to securities of issuers from developing countries.
I. Written Option Contracts:
The Funds are subject to equity price risk in the normal course of pursuing its investment objectives. The Funds may write (sell) put and call options to gain exposure to or hedge against changes in the value of equities. When the Funds write (sell) an option, an amount equal to the premium received by the Funds is included in the Statement of Assets and Liabilities as an asset and an equivalent liability. The amount of the liability is subsequently marked-to-market to reflect th e current value of an option written. By writing an option, the Funds may become obligated during the term of the option to deliver (with respect to a call option) or purchase (with respect to a put option) the securities underlying the option at the exercise price if the option is exercised. When an option expires on its stipulated expiration date, the Funds realize a gain. When the Funds enter into a closing purchase transaction, the Funds realize a gain or loss if the cost of the closing purchase transaction differs from the premium received when the option was sold without regard to any unrea lized gain or loss on the underlying security, and the liability related to such option is eliminated. If a call option written by a Fund is exercised, the proceeds of the sale of the underlying security will be increased by the premium originally received and the Fund will realize a gain or loss on the sale of the security. If a put option written by a Fund is exercised, the Fund’s basis in the underlying security will be reduced by the premium originally received. The net realized gains or losses and change in unrealized appreciation or depreciation on written option contracts is included in the Statements of Operations. With written option contracts, there is minimal counterparty credit risk to the Funds since written option contracts are exchange traded.
The premium amount and the number of written option contracts during the six months ended April 30, 2010 were as follow:
| | Dynamic Balance Fund |
| | | Number of | | Premium |
| | | Contracts | | Amount |
| Options outstanding at October 31, 2009 . . . . . . . . . . . | 122 | | $ 15,494 |
| Options written . . . . . . . . . . . . . . . . . . . . . . . . . . . . . . . . | — | | — |
| Options closed . . . . . . . . . . . . . . . . . . . . . . . . . . . . . . . . . | — | | — |
| Options exercised . . . . . . . . . . . . . . . . . . . . . . . . . . . . . . | — | | — |
| Options expired . . . . . . . . . . . . . . . . . . . . . . . . . . . . . . . . | (122) | | (15,494) |
| Options outstanding at April 30, 2010 . . . . . . . . . . . . . | — | | $ — |
J. Swap Contracts:
The Funds are subject to equity price risk in the normal course of pursuing its investment objectives. Certain Funds may enter into long equity swap contracts with multiple brokers to manage or gain exposure to various securities or markets. A long equity swap contract entitles the Fund to receive from the counterparty any appreciation and dividends paid on an individual security, while obligating the Fund to pay the counterparty any depreciation on the security as well as intere st on the notional amount of the contract.
Fluctuations in the value of an open contract are recorded daily as a net unrealized gain or loss. The Fund will realize a gain or loss upon termination or reset of the contract. Either party, under certain conditions, may terminate the contract prior to the contract’s expiration date.
Alpine Mutual Funds & #160;
Notes to Financial Statements—Continued
April 30, 2010 (Unaudited)
Credit risk may arise as a result of the failure of the counterparty to comply with the terms of the contract. The Fund considers the creditworthiness of each counterparty to a contract in evaluating potential credit risk quarterly. The counterparty risk to the Fund is limited to the net unrealized gain, if any, on the contract, along with dividends receivable on long equity contracts. Additionally, risk may arise from unanticipated movements in interest rates or in the value of the underlying securit ies. During the six months ended April 30, 2010, the Dynamic Dividend Fund entered into 45 equity swap contracts with a notional value of $420,234,167.
The net realized gains or losses and change in unrealized appreciation or depreciation on swap contracts is included in the Statement of Operations.
K. Equity-Linked Structured Notes:
Certain Funds may invest in equity-linked structured notes. Equity-linked structured notes are securities which are specially designed to combine the characteristics of one or more underlying securities and their equity derivatives in a single note form. The return and/or yield or income component may be based on the performance of the underlying equity securities, and equity index, and/or option positions. Equity-linked structured notes are typically offered in limited transactions by financial insti tutions in either registered or non-registered form. An investment in equity-linked structured notes creates exposure to the credit risk of the issuing financial institution, as well as to the market risk of the underlying securities. There is no guaranteed return of principal with these securities and the appreciation potential of these securities may be limited by a maximum payment or call right. In certain cases, equity-linked structured notes may be more volatile and less liquid than less complex securities or other types of fixed-income securities. Such securities may exhibit price behavior that does not correlate with other fixed-income securities.
L. Forward Currency Contracts:
The Funds are subject to foreign currency exchange rate risk in the normal course of pursuing its investment objective. The Funds may use forward currency contracts to gain exposure to or hedge against changes in the value of foreign currencies. A forward currency contract (“forward”) is an agreement between two parties to buy and sell a currency at a set price on a future date. The market value of the forward contract fluctuates with changes in forward currency exchange rates. The forward contrac t is marked-to-market daily and the change in market value is recorded by each Fund as unrealized appreciation or depreciation. When the forward contract is closed, a Fund records a realized gain or loss equal to the fluctuation in value during the period the forward contract was open. A Fund could be exposed to risk if a counterparty is unable to meet the terms of a forward or if the value of the currency changes unfavorably. The Funds did not enter into any forward currency contracts during the six months ended April 30, 2010.
M. Derivatives:
The Funds have adopted authoritative standards regarding disclosure about derivatives and hedging activities and how they affect the Funds’ Statements of Assets and Liabilities and Statements of Operations.
As of April 30, 2010, the Funds did not have any outstanding derivative instruments.
The effect of derivative instruments on the Statements of Operations for the six months ended April 30, 2010:
| | | | | Change in |
| | | Net Realized Loss | | Unrealized Appreciation |
Derivatives _ __ | | on Derivatives | | (Depreciation) on Derivatives |
| Equity Contracts: | | | | |
| Swap contracts . . . . . . . . . . . . . . . . . . . | $(1,869,561) | | — |
| Dynamic Balance Fund | | | | |
| | | | | Change in |
| | | Net Realized Gain | | Unrealized Depreciation |
Derivatives_ __ | | on Derivatives | | on Derivatives |
| Equity Contracts: | | | | |
| Written option contracts . . . . . . . . . . . | $15,494 | | $(11,224) |
Notes to Financial Statements—Continued
April 30, 2010 (Unaudited)
N. New Accounting Pronouncements:
In January 2010, the Financial Accounting Standards Board (“FASB”) issued Accounting Standards Update No. 2010- 06, Improving Disclosures about Fair Value Measurements (“ASU 2010-06”). ASU 2010-06 amends ASC 820, Fair Value Measurements and Disclosures (formerly FASB Statement No. 157). Specifically, ASU 2010-06 requires entities to disclose a) the amounts of significant transfers between Level 1 and Level 2 of the fair value hierarchy and the reasons for these transfers, b) the reasons for any transfers in or out of Level 3 and c) information in the reconciliation of recurring Level 3 measurements about purchases, sales, issuances and settlements on a gross basis. In addition, ASU 2010-06 clarifies the requirement for entities to disclose information about both the valuation techniques and inputs used in estimating Level 2 and Level 3 fair value measurements. Except for the requirement to disclose information about purchases, sales, issuances and settlements in the reconciliation of recurring Level 3 measurements on a gross basis, all ASU 2010-06 disclosure requirements are effective for financial statements issued for interi m and annual reporting periods beginning after December 15, 2009. The requirement to separately disclose purchases, sales, issuances and settlements of recurring Level 3 measurements is effective for financial statements issued for interim and annual reporting periods beginning after December 15, 2010. At this time, management is evaluating the implications of ASU 2010-06 and the impact it will have to the Funds’ financial statement disclosures.
3. Capital Share Transactions:
The Funds have an unlimited number of shares of beneficial interest, with $0.0001 par value, authorized.
Transactions in shares and dollars of the Funds were as follows:
| | Six Months Ended | | Year Ended |
| Dynamic Dividend Fund | | April 30, 2010 | | October 31, 2009 |
| | | Shares | | | Amount | | Shares | | | Amount |
| Shares sold . . . . . . . . . . . . . . . . . . . . . . . . . . . . . . . . . . . . . | 47,412,467 | | $ | 237,113,878 | | 40,478,198 | | $ | 196,120,574 |
| Shares issued in reinvestment of dividends . . . . . . . . . . . | 10,585,684 | | | 52,078,218 | | 18,373,014 | | | 87,140,087 |
| Redemption fees . . . . . . . . . . . . . . . . . . . . . . . . . . . . . . . . | — | | | 48,672 | | — | | | 178,370 |
| Shares redeemed . . . . . . . . . . . . . . . . . . . . . . . . . . . . . . . . | (20,625,833) | | | (102,998,865) | | (43,839,028) | | | (208,323,675) |
| Total net change . . . . . . . . . . . . . . . . . . . . . . . . . . . . . . . . . | 37,372,318 | | $ | 186,241,903 | | 15,012,184 | | $ | 75,115,356 |
| | | | | | | | | | | |
| Accelerating Dividend Fund | | | | | | | | | | |
| | | Six Months Ended | | Period Ended |
| | | April 30, 2010 | | October 31, 2009 (1) |
| | | Shares | | | Amount | | Shares | | | Amount |
| Shares sold . . . . . . . . . . . . . . . . . . . . . . . . . . . . . . . . . . . . . | 79,123 | | $ | 969,367 | | 105,816 | | $ | 1,060,985 |
| Shares issued in reinvestment of dividends . . . . . . . . . . . | 2,393 | | | 29,359 | | — | | | — |
| Redemption fees . . . . . . . . . . . . . . . . . . . . . . . . . . . . . . . . | — | | | 20 | | — | | | — |
| Shares redeemed . . . . . . . . . . . . . . . . . . . . . . . . . . . . . . . . | (2,706) | | | (33,314) | | — | | | — |
| Total net change . . . . . . . . . . . . . . . . . . . . . . . . . . . . . . . . . | 78,810 | | $ | 965,432 | | 105,816 | | $ | 1,060,985 |
| (1) Fund commenced operations on November 5, 2008. | | | | | | | | | |
| | | | | | | | | | | |
| Dynamic Financial Services Fund | | | | | | | | | | |
| | | Six Months Ended | | Year Ended |
| | | April 30, 2010 | | October 31, 2009 |
| | | Shares | | | Amount | | Shares | | | Amount |
| Shares sold . . . . . . . . . . . . . . . . . . . . . . . . . . . . . . . . . . . . . | 141,572 | | $ | 1,150,371 | | 343,876 | | $ | 1,966,966 |
| Shares issued in reinvestment of dividends . . . . . . . . . . . | — | | | — | | 94,660 | | | 473,302 |
| Redemption fees . . . . . . . . . . . . . . . . . . . . . . . . . . . . . . . . | — | | | 524 | | — | | | 1,015 |
| Shares redeemed . . . . . . . . . . . . . . . . . . . . . . . . . . . . . . . . | (172,797) | | | (1,284,297) | | (357,977) | | | (1,938,943) |
| Total net change . . . . . . . . . . . . . . . . . . . . . . . . . . . . . . . . . | (31,225) | | $ | (133,402) | | 80,559 | | $ | 502,340 |
Notes to Financial Statements—Continued
April 30, 2010 (Unaudited)
| Dynamic Innovators Fund | | Six Months Ended | | Year Ended |
| | | April 30, 2010 | | October 31, 2009 |
| | | Shares | | | Amount | | Shares | | | Amount |
| Shares sold . . . . . . . . . . . . . . . . . . . . . . . . . . . . . . . . . . . . . | 85,740 | | $ | 800,970 | | 264,825 | | $ | 1,676,100 |
| Shares issued in reinvestment of dividends . . . . . . . . . . . | — | | | — | | — | | | — |
| Redemption fees . . . . . . . . . . . . . . . . . . . . . . . . . . . . . . . . | — | | | 648 | | — | | | 1,168 |
| Shares redeemed . . . . . . . . . . . . . . . . . . . . . . . . . . . . . . . . | (208,927) | | | (1,865,273) | | (1,152,188) | | | (7,302,845) |
| Total net change . . . . . . . . . . . . . . . . . . . . . . . . . . . . . . . . . | (123,187) | | $ | (1,063,655) | | (887,363) | | $ | (5,625,577) |
| Dynamic Transformations Fund | | | | | | | | | | |
| | | Six Months Ended | | Year Ended |
| | | April 30, 2010 | | October 31, 2009 |
| | | Shares | | | Amount | | Shares | | | Amount |
| Shares sold . . . . . . . . . . . . . . . . . . . . . . . . . . . . . . . . . . . . . | 79,249 | | $ | 736,811 | | 11,850 | | $ | 82,368 |
| Shares issued in reinvestment of dividends . . . . . . . . . . . | — | | | — | | 3,343 | | | 17,115 |
| Redemption fees . . . . . . . . . . . . . . . . . . . . . . . . . . . . . . . . | — | | | 247 | | — | | | 1 |
| Shares redeemed . . . . . . . . . . . . . . . . . . . . . . . . . . . . . . . . | (10,926) | | | (98,871) | | (15,191) | | | (78,085) |
| Total net change . . . . . . . . . . . . . . . . . . . . . . . . . . . . . . . . . | 68,323 | | $ | 638,187 | | 2 | | $ | 21,399 |
| Dynamic Balance Fund | | | | | | | | | | |
| | | Six Months Ended | | Year Ended |
| | | April 30, 2010 | | October 31, 2009 |
| | | Shares | | | Amount | | Shares | | | Amount |
| Shares sold . . . . . . . . . . . . . . . . . . . . . . . . . . . . . . . . . . . . . | 167,579 | | $ | 1,689,205 | | 38,357 | | $ | 314,766 |
| Shares issued in reinvestment of dividends . . . . . . . . . . . | 35,510 | | | 345,951 | | 113,108 | | | 918,908 |
| Redemption fees . . . . . . . . . . . . . . . . . . . . . . . . . . . . . . . . | — | | | 1,511 | | — | | | 106 |
| Shares redeemed . . . . . . . . . . . . . . . . . . . . . . . . . . . . . . . . | (160,911) | | | (1,532,517) | | (450,286) | | | (3,602,450) |
| Total net change . . . . . . . . . . . . . . . . . . . . . . . . . . . . . . . . . | 42,178 | | $ | 504,150 | | (298,821) | | $ | (2,368,670) |
| Ultra Short Tax Optimized Income Fund | | | | | | | | | | |
| | | Six Months Ended | | Year Ended |
| | | April 30, 2010 | | October 31, 2009 |
| | | Shares | | | Amount | | Shares | | | Amount |
| Adviser Class | | | | | | | | | | |
| Shares sold . . . . . . . . . . . . . . . . . . . . . . . . . . . . . . . . . | 6,860,089 | | $ | 69,348,013 | | 21,875,510 | | $ | 220,902,141 |
| Shares issued in reinvestment of dividends . . . . . . . | 74,650 | | | 754,714 | | 136,158 | | | 1,373,479 |
| Redemption fees . . . . . . . . . . . . . . . . . . . . . . . . . . . . | — | | | 5,033 | | — | | | 1,683 |
| Shares redeemed . . . . . . . . . . . . . . . . . . . . . . . . . . . . | (7,063,546) | | | (71,408,822) | | (2,212,979) | | | (22,346,415) |
| Total net change . . . . . . . . . . . . . . . . . . . . . . . . . . . . . | (128,807) $ | | | (1,301,062) | | 19,798,689 | | $ | 199,930,888 |
| | | | | | | | | | | |
| Investor Class | | | | | | | | | | |
| Shares sold . . . . . . . . . . . . . . . . . . . . . . . . . . . . . . . . . | 48,144,124 $ | | | 484,030,864 | | 156,952,569 | | | $1,575,628,786 |
| Shares issued in reinvestment of dividends . . . . . . . | 557,079 | | | 5,598,645 | | 1,557,326 | | | 15,616,912 |
| Redemption fees . . . . . . . . . . . . . . . . . . . . . . . . . . . . | — | | | 34,809 | | — | | | 65,479 |
| Shares redeemed . . . . . . . . . . . . . . . . . . . . . . . . . . . . | (68,086,878) | | | (684,543,935) | | (36,137,658) | | | (362,901,990) |
| Total net change . . . . . . . . . . . . . . . . . . . . . . . . . . . . . | (19,385,675) | | | $(194,879,617) | | 122,372,237 | | | $1,228,409,187 |
| | | | | | | | | | | |
Notes to Financial Statements—Continued
April 30, 2010 (Unaudited)
| Municipal Money Market Fund | | | | | | | | |
| | | Six Months Ended | | Year Ended |
| | | April 30, 2010 | | October 31, 2009 |
| | | Shares | | Amount | | Shares | | | Amount |
| Shares sold . . . . . . . . . . . . . . . . . . . . . . . . . . . . . . . . . . . | 665,537,605 | | $ 665,537,605 | | 1,310,070,747 | | $ | 1,310,070,747 |
| Shares issued in reinvestment of dividends . . . . . . . . . | 379,518 | | 379,518 | | 5,367,192 | | | 5,367,192 |
| Shares redeemed | . . . . . . . . . . . . . . . . . . . . . . . . . . . . . . | (922,664,127) | | (922,664,127) | | (1,190,003,238) | | | (1,190,003,238) |
| Total net change | . . . . . . . . . . . . . . . . . . . . . . . . . . . . . . | (256,747,004) | | $(256,747,004) | | 125,434,701 | | $ | 125,434,701 |
4. Purchases and Sales of Securities:
Purchases and sales of securities (excluding short-term securities) for the six months ended April 30, 2010 are as follows:
| | | Non-U.S. Government | | U.S. Government |
| | | Purchase | | Sales | | Purchase | Sales |
| Dynamic Dividend Fund . . . . . . . . . . . . . . . . . . . . . . | $ | 1,759,245,806 | $ | 1,668,530,650 | | — | — |
| Accelerating Dividend Fund . . . . . . . . . . . . . . . . . . . | | 4,180,234 | | 3,407,877 | | — | — |
| Dynamic Financial Services Fund . . . . . . . . . . . . . . . | | 8,820,312 | | 9,349,269 | | — | — |
| Dynamic Innovators Fund . . . . . . . . . . . . . . . . . . . . | | 1,647,596 | | 3,700,944 | | — | — |
| Dynamic Transformations Fund . . . . . . . . . . . . . . . . | | 1,812,011 | | 753,590 | | — | — |
| Dynamic Balance Fund . . . . . . . . . . . . . . . . . . . . . . . | | 4,498,358 | | 6,010,116 | | — | — |
| Ultra Short Tax Optimized Income Fund . . . . . . . . . | | 171,991,072 | | 12,800,000 | | — | — |
5. Distribution Plans:
Quasar Distributors, LLC (“Quasar”) serves as each Fund’s distributor. The Ultra Short Tax Optimized Income Fund has adopted a distribution and servicing plan (the “Plan”) for its Adviser Class shares as allowed by Rule 12b-1 under the 1940 Act. The Plan authorizes payments by the Fund in connection with the distribution and servicing of its shares at an annual rate, as determined from time to time by the Board of Trustees, of up to 0.25% of the Fund ’s average daily net assets. Amounts paid under the Plan by the Fund may be spent by the Fund on any activities or expenses primarily intended to result in the sale of shares of the Fund, including but not limited to advertising, compensation for sales and marketing activities of financial institutions and others such as dealers and distributors, shareholder account servicing, the printing and mailing of prospectuses to other than current shareholders and the printing and mailing of sales literature. The Ultra Short Tax Optimized Income Fund incurred $280,948 pursuant to the Plan for the si x months ended April 30, 2010.
The Plan for the Ultra Short Tax Optimized Income Fund may be terminated at any time by vote of the Trustees of the Income Trust who are not “interested persons”, as defined by the 1940 Act, of the Income Trust, or by vote of a majority of the outstanding voting shares of the respective class.
6. Investment Advisory Agreement and Other Affiliated Transactions:
Alpine Woods Capital Investors, LLC (“the Adviser”) provides investment advisory services to each of the Funds. Pursuant to the advisory agreements with the Funds, the Adviser is entitled to an annual fee based on 1.00% of each Fund’s average daily net assets for the Dynamic Dividend Fund, Accelerating Dividend Fund, Dynamic Financial Services Fund, Dynamic Innovators Fund, Dynamic Transformations Fund and Dynamic Balance Fund. The Adviser is entitled to an annu al fee based on 0.75% of the Ultra Short Tax Optimized Income Fund’s average daily net assets and an annual fee based on 0.45% of the Municipal Money Market Fund’s average daily net assets.
The Adviser agreed to reimburse the Dynamic Dividend Fund, Accelerating Dividend Fund, Dynamic Financial Services Fund, Dynamic Innovators Fund, Dynamic Transformations Fund, Dynamic Balance Fund and Ultra Short Tax Optimized Income Fund – Investor Class to the extent necessary to ensure that each Fund’s total operating expenses (excluding 12b-1 fees, interest, brokerage commissions and extraordinary expenses) does not exceed 1.35%, 1.35%, 1.35%, 1.35%, 1.35%, 1.35%, and 0.60% of the Fund’s average daily net assets, respectively. The expense cap for the Ultra Short Tax Optimized Income Fund – Adviser Class is 0.25% higher than the Investor Class.
Notes to Financial Statements—Continued
April 30, 2010 (Unaudited)
For the six months ended April 30, 2010, the Adviser agreed to reimburse the Municipal Money Market Fund to the extent necessary to ensure that the Fund’s total operating expenses (excluding interest, brokerage commissions and extraordinary expenses) did not exceed certain limits. The limits ranged from 0.38% to 0.44% of the Fund’s average daily net assets during the six months ended April 30, 2010. The Adviser may recover expenses paid in excess of the cap on expense s for the three previous years, as long as the recovery does not cause the Fund to exceed such cap on expenses. For the six months ended April 30, 2010, the Adviser waived investment advisory fees and other expenses totaling $14,620, $19,840, $15,800, $20,596, $2,151,691, and $220,002, for the Accelerating Dividend Fund, Dynamic Financial Services Fund, Dynamic Innovators Fund, Dynamic Transformations Fund, Ultra Short Tax Optimized Income Fund and Municipal Money Market Fund, respectively. The expense limitations will remain in effect for each Fund unless and until the Board of Trustees of the S eries and Income Trusts approve its modification or termination with respect to each Fund. Waived expenses subject to potential recovery by year of expiration are as follows:
| | | | | Dynamic | | | | | | | Ultra Short | | | |
| | | Accelerating | | Financial | | Dynamic | | | Dynamic | | Tax Optimized | | | Municipal |
| | | Dividend | | Services | | Innovators | | Transformations | | | Income | | | Money Market |
| Year of Expiration | | Fund | | Fund | | Fund | | | Fund | | | Fund | | | Fund |
| | | | | | | | | | | | | | | | |
| 10/31/2010 . . . . . . . . | $ | — | | $26,625 | | $22,424 | | $ | — | | $ | 148,724 | | $ | 1,718,243 |
| 10/31/2011 . . . . . . . . | | — | | 22,153 | | — | | | 53,829 | | | 322,815 | | | 1,007,557 |
| 10/31/2012 . . . . . . . . | | 40,707 | | 38,481 | | 31,680 | | | 41,270 | | | 1,528,133 | | | 9,413 |
7. Federal Income Tax Information
At October 31, 2009, the components of accumulated earnings (losses) on a tax basis were as follows:
| | | | | | | | | Dynamic | | Dynamic |
| | Dynamic | | Accelerating | | | Financial | | Innovators |
| | Dividend Fund | | Dividend Fund | | | Services Fund | | Fund |
| Cost of investments . . . . . . . . . . . . . . . . . . . . . . . . . . . | $ | 554,670,752 | | $ | 1,077,483 | | $ | 13,858,859 | | $ | 16,078,016 |
| Gross unrealized appreciation . . . . . . . . . . . . . . . . . . | | 63,507,760 | | | 144,468 | | | 197,657 | | | 1,139,842 |
| Gross unrealized depreciation . . . . . . . . . . . . . . . . . . | | (56,885,140) | | | (8,830) | | | (5,645,865) | | | (4,603,299) |
| Net unrealized appreciation (depreciation) . . . . . . . | | 6,622,620 | | | 135,638 | | | (5,448,208) | | | (3,463,457) |
| Undistributed ordinary income . . . . . . . . . . . . . . . . . | | 25,082,724 | | | 17,961 | | | — | | | | — |
| Undistributed long-term capital gain . . . . . . . . . . . . | | — | | | — | | | — | | | — |
| Total distributable earnings . . . . . . . . . . . . . . . . . . . . | | 25,082,724 | | | 17,961 | | | — | | | | — |
| Other accumulated gains (losses) . . . . . . . . . . . . . . . . | | (981,689,032) | | | 2 | | | (115,729) | | | (12,053,242) |
| Total accumulated gains (losses) . . . . . . . . . . . . . . . . | $ | (949,983,688) | | $ | 153,601 | | $ | (5,563,937) | | $ | (15,516,699) |
| | | | | | | | | | | | |
| | | Dynamic | | | Dynamic | | | Ultra Short | | | Municipal |
| | Transformations | | | Balance | | | Tax Optimized | | | Money |
| | | Fund | | | Fund | | | Income Fund | | | Market Fund |
| Cost of investments . . . . . . . . . . . . . . . . . . . . . . . . . . . | $ | 4,061,708 | | $ | 66,446,936 | | $ | 1,740,005,791 | $ | 776,443,317 |
| Gross unrealized appreciation . . . . . . . . . . . . . . . . . . | | 514,297 | | | 6,303,400 | | | 3,070,623 | | — |
| Gross unrealized depreciation . . . . . . . . . . . . . . . . . . | | (806,547) | | | (17,470,870) | | | (1,738,473) | | — |
| Net unrealized appreciation (depreciation) . . . . . . . | | (292,250) | | | (11,167,470) | | | 1,332,150 | | — |
| Undistributed ordinary income . . . . . . . . . . . . . . . . . | | — | | | — | | | 524 | | — |
| Undistributed long-term capital gain . . . . . . . . . . . . | | — | | | — | | | — | | | | — |
| Total distributable earnings . . . . . . . . . . . . . . . . . . . . | | — | | | — | | | 524 | | | | — |
| Other accumulated losses . . . . . . . . . . . . . . . . . . . . . . | | (793,664) | | | (255,176) | | | (52,240) | | | | — |
| Total accumulated gains (losses) . . . . . . . . . . . . . . . . | $ | (1,085,914) | | $ | (11,422,646) | | $ | 1,280,434 | | $ | | — |
Notes to Financial Statements—Continued
April 30, 2010 (Unaudited)
The tax basis of investments for tax and financial reporting purposes differs principally due to the deferral of losses on wash sales, REIT tax adjustments, and mark-to-market cost basis adjustments for investments in passive foreign investment companies (PFICs) for tax purposes.
The tax character of distributions paid during the years ended October 31, 2009 and 2008 were as follows:
| | | | 2009 | | | 2008 |
| Dynamic Dividend Fund | | | | | |
| Ordinary income | . . . . . . . . . . . . . . . . . . . . . . . . . . . . . . . . . . . . . . . . . . . . . . . . . . . . . . . . . | $ | 126,650,712 | | $ | 188,534,882 |
| Long-term capital gain . . . . . . . . . . . . . . . . . . . . . . . . . . . . . . . . . . . . . . . . . . . . . . . . . . . . | | — | | | — |
| Return of capital | . . . . . . . . . . . . . . . . . . . . . . . . . . . . . . . . . . . . . . . . . . . . . . . . . . . . . . . . . | | — | | | 5,952,906 |
| | | $ | 126,650,712 | | $ | 194,487,788 |
| Accelerating Dividend Fund | | | | | |
| Ordinary income | . . . . . . . . . . . . . . . . . . . . . . . . . . . . . . . . . . . . . . . . . . . . . . . . . . . . . . . . . | $ | — | | $ | — |
| Long-term capital gain . . . . . . . . . . . . . . . . . . . . . . . . . . . . . . . . . . . . . . . . . . . . . . . . . . . . | | — | | | — |
| Return of capital | . . . . . . . . . . . . . . . . . . . . . . . . . . . . . . . . . . . . . . . . . . . . . . . . . . . . . . . . . | | — | | | — |
| | | $ | — | | $ | — |
| Dynamic Financial Services Fund | | | | | |
| Ordinary income | . . . . . . . . . . . . . . . . . . . . . . . . . . . . . . . . . . . . . . . . . . . . . . . . . . . . . . . . . | $ | 519,389 | | $ | 2,663,086 |
| Long-term capital gain . . . . . . . . . . . . . . . . . . . . . . . . . . . . . . . . . . . . . . . . . . . . . . . . . . . . | | — | | | — |
| Return of capital | . . . . . . . . . . . . . . . . . . . . . . . . . . . . . . . . . . . . . . . . . . . . . . . . . . . . . . . . . | | 4,121 | | | — |
| | | $ | 523,510 | | $ | 2,663,086 |
| Dynamic Innovators Fund | | | | | |
| Ordinary income | . . . . . . . . . . . . . . . . . . . . . . . . . . . . . . . . . . . . . . . . . . . . . . . . . . . . . . . . . | $ | — | | $ | 1,950,065 |
| Long-term capital gain . . . . . . . . . . . . . . . . . . . . . . . . . . . . . . . . . . . . . . . . . . . . . . . . . . . . | | — | | | 54,800 |
| Return of capital | . . . . . . . . . . . . . . . . . . . . . . . . . . . . . . . . . . . . . . . . . . . . . . . . . . . . . . . . . | | — | | | — |
| | | $ | — | | $ | 2,004,865 |
| Dynamic Transformations Fund | | | | | |
| Ordinary income | . . . . . . . . . . . . . . . . . . . . . . . . . . . . . . . . . . . . . . . . . . . . . . . . . . . . . . . . . | $ | 14,717 | | $ | — |
| Long-term capital gain . . . . . . . . . . . . . . . . . . . . . . . . . . . . . . . . . . . . . . . . . . . . . . . . . . . . | | — | | | — |
| Return of capital | . . . . . . . . . . . . . . . . . . . . . . . . . . . . . . . . . . . . . . . . . . . . . . . . . . . . . . . . . | | 2,411 | | | — |
| | | $ | 17,128 | | $ | — |
| Dynamic Balance Fund | | | | | |
| Ordinary income | . . . . . . . . . . . . . . . . . . . . . . . . . . . . . . . . . . . . . . . . . . . . . . . . . . . . . . . . . | $ | 845,241 | | $ | 2,209,394 |
| Long-term capital gain . . . . . . . . . . . . . . . . . . . . . . . . . . . . . . . . . . . . . . . . . . . . . . . . . . . . | | — | | | 5,536,488 |
| Return of capital | . . . . . . . . . . . . . . . . . . . . . . . . . . . . . . . . . . . . . . . . . . . . . . . . . . . . . . . . . | | 114,962 | | | 102,670 |
| | | $ | 960,203 | | $ | 7,848,552 |
| Ultra Short Tax Optimized Income Fund | | | | | |
| Ordinary income | . . . . . . . . . . . . . . . . . . . . . . . . . . . . . . . . . . . . . . . . . . . . . . . . . . . . . . . . . | $ | 91,364 | | $ | 297,298 |
| Exempt interest dividends . . . . . . . . . . . . . . . . . . . . . . . . . . . . . . . . . . . . . . . . . . . . . . . . . | | 23,252,288 | | | 5,927,147 |
| Return of capital | . . . . . . . . . . . . . . . . . . . . . . . . . . . . . . . . . . . . . . . . . . . . . . . . . . . . . . . . . | | — | | | — |
| | | $ | 23,343,652 | | $ | 6,224,445 |
Notes to Financial Statements—Continued
April 30, 2010 (Unaudited)
| Municipal Money Market Fund | | | | | |
| Ordinary income | . . . . . . . . . . . . . . . . . . . . . . . . . . . . . . . . . . . . . . . . . . . . . . . . . . . . . . . . . | $ | 134,761 | | $ | 141,465 |
| Exempt interest dividends . . . . . . . . . . . . . . . . . . . . . . . . . . . . . . . . . . . . . . . . . . . . . . . . . | | 6,695,604 | | | 22,003,941 |
| Return of capital | . . . . . . . . . . . . . . . . . . . . . . . . . . . . . . . . . . . . . . . . . . . . . . . . . . . . . . . . . | | 2,781 | | | — |
| | | $ | 6,833,146 | | $ | 22,145,406 |
During the year ended October 31, 2009, the Dynamic Balance Fund and Ultra Short Tax Optimized Income Fund utilized $217,302 and $2,449 of capital loss carryovers, respectively. Capital loss carryovers as of October 31, 2009 are as follows:
| | | | | | | | | Dynamic | | | |
| | | Dynamic | | Accelerating | | Financial | | Dynamic |
| Expiration Date | Dividend Fund | | Dividend Fund | | Services Fund | | Innovators Fund |
| 10/31/2013 | . . . . . . . . . . . . . . . . . . . . . . . . . . . . . . . . . . | $ | 4,335,047 | | $ | — | | $ | — | | $ | — |
| 10/31/2014 | . . . . . . . . . . . . . . . . . . . . . . . . . . . . . . . . . . | $ | 15,084,034 | | $ | — | | $ | — | | $ | — |
| 10/31/2015 | . . . . . . . . . . . . . . . . . . . . . . . . . . . . . . . . . . | $ | 37,200,325 | | $ | — | | $ | — | | $ | — |
| 10/31/2016 | . . . . . . . . . . . . . . . . . . . . . . . . . . . . . . . . . . | $ | 536,971,822 | | $ | — | | $ | — | | $ | 6,415,976 |
| 10/31/2017 | . . . . . . . . . . . . . . . . . . . . . . . . . . . . . . . . . . | $ | 388,137,216 | | $ | — | | $ | 115,243 | | $ | 5,637,266 |
| | | Dynamic | | Dynamic | | Ultra Short | | Municipal |
| | | Transformations | | Balance | | Tax Optimized | | Money |
Expiration Date | Fund | | Fund | | Income Fund | | Market Fund |
| 10/31/2014 | . . . . . . . . . . . . . . . . . . . . . . . . . . . . . . . . . . | $ | — | | $ | — | | $ | 50,128 | | $ | — |
| 10/31/2015 | . . . . . . . . . . . . . . . . . . . . . . . . . . . . . . . . . . | $ | — | | $ | — | | $ | 2,112 | | $ | — |
| 10/31/2016 | . . . . . . . . . . . . . . . . . . . . . . . . . . . . . . . . . . | $ | 140,244 | | $ | 266,400 | | $ | — | | $ | — |
| 10/31/2017 | . . . . . . . . . . . . . . . . . . . . . . . . . . . . . . . . . . | $ | 653,420 | | $ | — | | $ | — | | $ | — |
In accordance with U.S. GAAP, the Funds have previously adopted accounting standards related to the accounting for uncertain tax positions. In accordance with this guidance, the Funds analyzed all open tax years, as defined by the Statute of Limitations, for all major jurisdiction. Open tax years are those that are open for exam by taxing authorities. Major jurisdictions for the Funds included Federal and the state of New York. As of October 31, 2009, open Federal and New York ta x years include the tax years ended October 31, 2006 through 2009. The Funds have no examination in progress.
The Funds have reviewed all open tax years and major jurisdictions and concluded that there is no impact on the Funds’ net assets and no tax liability resulting from unrecognized tax benefits relating to uncertain income tax positions taken or expected to be taken on the tax return for the fiscal year-end October 31, 2009. Also, the Funds have recognized no interest and penalties related to uncertain tax benefits. The Funds are also not aware of any tax positions for which it is reasonably possible that the total amounts of unrecognized tax benefits will significantly change in the next six months.
8. Subsequent Events:
In preparing these financial statements, the Funds have evaluated events and transactions for potential recognition or disclosure resulting from subsequent events through the date the financial statements were issued.
Distributions: The Dynamic Dividend Fund and Accelerating Dividend Fund paid a distribution of $11,125,233 and $6,681or $0.07 and $0.0359 per share, respectively, on May 27, 2010 to shareholders of record on May 26, 2010. The Ultra Short Tax Optimized Income Fund – Adviser Class and Investor Class paid a distribution of $200,437 and $1,352,136 or $0.0089 and $0.0109 per share, respectively, on May 28, 2010 to shareholders of record on May 27, 2010.
The Dynamic Dividend Fund, Accelerating Dividend Fund and Dynamic Balance Fund also declared distributions of $0.07, $0.03615 and $0.03147445 per share, respectively, payable on June 29, 2010 to shareholders of record on June 28, 2010. The Ultra Short Tax Optimized Income Fund – Adviser Class and Investor Class also declared distributions of any distributable income payable on June 30, 2010 to shareholders of record on June 29, 2010.
Additional Information (Unaudited)
Expenses Examples
April 30, 2010
As a shareholder of the Dynamic Dividend Fund, Accelerating Dividend Fund, Dynamic Financial Services Fund, Dynamic Innovators Fund, Dynamic Transformations Fund, Dynamic Balance Fund and Ultra Short Tax Optimized Income Fund – Adviser and Investor Class, you will incur two types of costs: (1) transaction costs, such as initial sales charges (loads) and/or redemption fees and (2) ongoing costs, including management fees; distribution and/or service fees; and other Fund expenses. As a shareholder of the Municipal Money Market Fund, you will incur ongoing costs, including management fees and other Fund expenses. The examples below are intended to help you understand your ongoing costs (in dollars) of investing in the Funds and to compare these costs with the ongoing costs of investing in other mutual funds. The examples are based on an investment of $1,000 for the period 11/1/2009 – 4/30/2010.
Actual Expenses
The first line of the tables below provides information about actual account values and actual expenses. The Funds charge no sales load (except the Ultra Short Tax Optimized Income Fund – Adviser Class, which charges a sales load of 0.50% on purchases) or transaction fees, but do assess shareholders for outgoing wire transfers, returned checks and stop payment orders at prevailing rates charged by U.S. Bancorp Fund Services, LLC, the Funds’ transfer agent. If you request a redemption by wire transfer, currently a $15.00 fee is charged by the Funds’ transfer agent. Shareholders in the Dynamic Dividend Fund, Accelerating Dividend Fund, Dynamic Financial Services Fund, Dynamic Innovators Fund, Dynamic Transformations Fund and Dynamic Balance Fund will be charged a redemption fee equal to 1.00% of the net amount of the redemption if they redeem their shares less than two months after purchase. Shareholders in the Ultra Short Tax Optimized Income Fund – Adviser and Investor Class will be charged a redemption fee equal to 0.25% of the net amount of the redemption if they redeem their shares less than one month after purchase. IRA accounts will be charged a $15.00 annual maintenance fee. To the extent the Funds invest in shares of other investment companies as a part of their investment strategies, you will indirectly bear your proportionate share of any fees and expenses charged by the underlying funds in which the Funds invest in addition to the expenses of the Fund. These expenses are not included in the example below. The example below includes, but is not limited to, management fees, shareholder s ervicing fees, fund accounting, custody and transfer agent fees. You may use the information in this line, together with the amount you invested, to estimate the expenses that you paid over the period. Simply divide your account value by $1,000 (for example, an $8,600 account value divided by $1,000 = 8.6), then multiply the result by the number in the first line under the heading entitled "Expenses Paid During Period" to estimate the expenses you paid on your account during the period.
Hypothetical Example for Comparison Purposes
The second line of the table below provides information about hypothetical account values and hypothetical expenses based on the Funds’ actual expense ratios and an assumed rate of return of 5% per year before expenses, which does not represent the Funds’ actual returns. The hypothetical account values and expenses may not be used to estimate the actual ending account balance or expenses you paid for the period. You may use this information to compare the ongoing costs of investing in the Funds and other funds. To do so, compare this 5% hypothetical example with the 5% hypothetical examples that appear in the shareholder reports of other funds. Please note that the expenses shown in the table are meant to highlight your ongoing costs only and do not reflect any transactional costs, such as redemption fees. Therefore, the second line of the table is useful in comparing ongoing costs only, and will not help you determine the relative total costs of owning different funds. In addition, if these transactional costs were included, your costs would have been higher.
Alpine Mutual Funds & #160;
Additional Information (Unaudited) - Continued
Expenses Examples
Dynamic Dividend Fund
| | Beginning | | Ending | | Expenses Paid |
| | Account Value | | Account Value | | During Period |
| | 11/1/2009 | | 4/30/2010 | | 11/1/2009-4/30/2010 (3)* |
| Actual (1 | $1,000.00 | | $1,123.90 | | $6.53 |
| Hypothetical (2) | $1,000.00 | | $1,018.65 | | $6.21 |
| (1) | Ending account values and expenses paid during period based on a 12.39% return. The return is considered after expenses are deducted from the Fund. |
| (2) | Ending account values and expenses paid during period based on a 5.00% annual return. The return is considered before expenses are deducted from the Fund. |
| (3) | Excluding interest expense of 0.06%, the actual and hypothetical expenses paid during the period were $6.21 and $5.91, respectively. |
| * | Expenses are equal to the Fund's annualized expense ratio of 1.24%, multiplied by the average account value over the period, multiplied by 181/365 (to reflect the one-half year period). |
Accelerating Dividend Fund
| | Beginning | | Ending | | Expenses Paid |
| | Account Value | | Account Value | | During Period |
| | 11/1/2009 | | 4/30/2010 | | 11/1/2009-4/30/2010* |
| Actual (1) | $1,000.00 | | $1,125.00 | | $7.11 |
| Hypothetical (2) | $1,000.00 | | $1,018.10 | | $6.76 |
| (1) | Ending account values and expenses paid during period based on a 12.50% return. The return is considered after expenses are deducted from the Fund. |
| (2) | Ending account values and expenses paid during period based on a 5.00% annual return. The return is considered before expenses are deducted from the Fund. |
| Expenses are equal to the Fund's annualized expense ratio of 1.35%, multiplied by the average account value over the period, multiplied by 181/365 (to reflect the one-half year period). |
Dynamic Financial Services Fund
| | Beginning | | Ending | | Expenses Paid |
| | Account Value | | Account Value | | During Period |
| | 11/1/2009 | | 4/30/2010 | | 11/1/2009-4/30/2010 (3)* |
| Actual (1) | $1,000.00 | | $1,331.40 | | $8.09 |
| Hypothetical (2) | $1,000.00 | | $1,017.85 | | $7.00 |
| (1) | Ending account values and expenses paid during period based on a 33.14% return. The return is considered after expenses are deducted from the Fund. |
| (2) | Ending account values and expenses paid during period based on a 5.00% annual return. The return is considered before expenses are deducted from the Fund. |
| (3) | Excluding interest expense of 0.05%, the actual and hypothetical expenses paid during the period were $7.80 and $6.76, respectively. |
| * | Expenses are equal to the Fund's annualized expense ratio of 1.40%, multiplied by the average account value over the period, multiplied by 181/365 (to reflect the one-half year period). |
Additional Information (Unaudited)—Continued
Expense Examples April 30, 2010
Dynamic Innovators Fund
| | Beginning | | Ending | | Expenses Paid |
| | Account Value | | Account Value | | During Period |
| | 11/1/2009 | | 4/30/2010 | | 11/1/2009-4/30/2010 (3)* |
| Actual (1) | $1,000.00 | | $1,252.20 | | $8.38 |
| Hypothetical (2) | $1,000.00 | | $1,017.36 | | $7.50 |
| (1) | Ending account values and expenses paid during period based on a 25.22% return. The return is considered after expenses are deducted from the Fund. |
| (2) | Ending account values and expenses paid during period based on a 5.00% annual return. The return is considered before expenses are deducted from the Fund. |
| (3) | Excluding interest expense of 0.15%, the actual and hypothetical expenses paid during the period were $7.54 and $6.76, respectively. |
| * | Expenses are equal to the Fund's annualized expense ratio of 1.50%, multiplied by the average account value over the period, multiplied by 181/365 (to reflect the one-half year period). |
Dynamic Transformations Fund
| | Beginning | | Ending | | Expenses Paid |
| | Account Value | | Account Value | | During Period |
| | 11/1/2009 | | 4/30/2010 | | 11/1/2009-4/30/2010 (3)* |
| Actual (1) | $1,000.00 | | $1,324.20 | | $8.01 |
| Hypothetical (2) | $1,000.00 | | $1,017.90 | | $6.95 |
| (1) | Ending account values and expenses paid during period based on a 32.42% return. The return is considered after expenses are deducted from the Fund. |
| (2) | Ending account values and expenses paid during period based on a 5.00% annual return. The return is considered before expenses are deducted from the Fund. |
| (3) | Excluding interest expense of 0.04%, the actual and hypothetical expenses paid during the period were $7.78 and $6.76, respectively. |
| * | Expenses are equal to the Fund's annualized expense ratio of 1.39%, multiplied by the average account value over the period, multiplied by 181/365 (to reflect the one-half year period). |
Dynamic Balance Fund
| | Beginning | | Ending | | Expenses Paid |
| | Account Value | | Account Value | | During Period |
| | 11/1/2009 | | 4/30/2010 | | 11/1/2009-4/30/2010* |
| Actual (1) | $1,000.00 | | $1,166.90 | | $6.66 |
| Hypothetical (2) | $1,000.00 | | $1,018.65 | | $6.21 |
| (1) | Ending account values and expenses paid during period based on a 16.69% return. The return is considered after expenses are deducted from the Fund. |
| (2) | Ending account values and expenses paid during period based on a 5.00% annual return. The return is considered before expenses are deducted from the Fund. |
| * | Expenses are equal to the Fund's annualized expense ratio of 1.24%, multiplied by the average account value over the period, multiplied by 181/365 (to reflect the one-half year period). |
Additional Information (Unaudited)—Continued
Expense Examples April 30, 2010
Ultra Short Tax Optimized Income Fund Adviser Class Shares
Adviser Class Shares
| | Beginning | | Ending | | Expenses Paid |
| | Account Value | | Account Value | | During Period |
| | 11/1/2009 | | 4/30/2010 | | 11/1/2009-4/30/2010* |
| Actual (1) | $1,000.00 | | $1,005.70 | | $3.78 |
| Hypothetical (2) | $1,000.00 | | $1,021.03 | | $3.81 |
| (1) | Ending account values and expenses paid during period based on a 0.57% return. The return is considered after expenses are deducted from the Fund. |
| (2) | Ending account values and expenses paid during period based on a 5.00% annual return. The return is considered before expenses are deducted from the Fund. |
| * | Expenses are equal to the Fund's annualized expense ratio of 0.76%, multiplied by the average account value over the period, multiplied by 181/365 (to reflect the one-half year period). |
Ultra Short Tax Optimized Income Fund
Investor Class Shares
| | Beginning | | Ending | | Expenses Paid |
| | Account Value | | Account Value | | During Period |
| | 11/1/2009 | | 4/30/2010 | | 11/1/2009-4/30/2010* |
| Actual (1) | $1,000.00 | | $1,006.00 | | $2.54 |
| Hypothetical (2) | $1,000.00 | | $1,022.27 | | $2.56 |
| (1) | Ending account values and expenses paid during period based on a 0.60% return. The return is considered after expenses are deducted from the Fund. |
| (2) | Ending account values and expenses paid during period based on a 5.00% annual return. The return is considered before expenses are deducted from the Fund. |
| * | Expenses are equal to the Fund's annualized expense ratio of 0.51%, multiplied by the average account value over the period, multiplied by 181/365 (to reflect the one-half year period). |
Municipal Money Market Fund
| | Beginning | | Ending | | Expenses Paid |
| | Account Value | | Account Value | | During Period |
| | 11/1/2009 | | 4/30/2010 | | 11/1/2009-4/30/2010* |
| Actual (1) | $1,000.00 | | $1,000.90 | | $1.98 |
| Hypothetical (2) | $1,000.00 | | $1,022.81 | | $2.01 |
| (1) | Ending account values and expenses paid during period based on a 0.09% return. The return is considered after expenses are deducted from the Fund. |
| (2) | Ending account values and expenses paid during period based on a 5.00% annual return. The return is considered before expenses are deducted from the Fund. |
| * | Expenses are equal to the Fund's annualized expense ratio of 0.40%, multiplied by the average account value over the period, multiplied by 181/365 (to reflect the one-half year period). |
Additional Information (Unaudited)—Continued
April 30, 2010
Investment Adviser and Advisory Contracts
On January 15, 2010, at a meeting called for the purpose of voting on such approval, the Boards of Trustees, including all of the Trustees who are not parties to the Advisory Contracts or interested persons of any such party (the non-interested Trustees), approved the continuance of the Advisory Contracts for the Funds. In so doing, the Board Members studied materials specifically relating to the Advisory Contracts provided by the Adviser, the Funds’ counsel and the Funds’ administrator (“USBFS”). The Board Members considered a variety of factors, including the following:
The Board Members considered the expected nature, quality and scope of the management and investment advisory services and personnel provided to each Fund by the Adviser; the rate of investment advisory fees payable to the Adviser and a comparison of the fees paid by comparable funds; the compensation (in addition to the investment advisory fees) and other benefits received by the Adviser and its respective affiliates; the Adviser’s costs in providing services; the economies of scale realized by the Adviser; the annual operating expenses of each Fund; and the policies and practices of the Adviser with respect to portfolio transactions for each Fund.
After reviewing the diligence materials provided by USBFS, the Adviser and Fund Counsel, the Board began a discussion to assess the overall quality of services the Board considered the Adviser’s specific responsibilities in all aspects of day-to-day management of each Fund managed by the Adviser, as well as the qualifications, experience and responsibilities of the portfolio managers and other key personnel at the Adviser involved in the day-to-day activities of each Fund. The Board also considered, with regard to each Fund, the prior relationship between the Adviser and the Fund, as well as the Board’s knowledge of the Adviser’s operations. The Trustees also considered the Adviser’s marketing activity and commitment to Fund growth. The Trustees also considered the structure and effect iveness of the Adviser’s compliance procedures and the Adviser’s record of willingness to meet in person with the Trustees to discuss various performance, marketing and compliance issues. The Trustees also noted any services that extended beyond portfolio management, and they considered the trading capability of the Adviser.
The Board Members also evaluated the investment performance of the Funds on an absolute basis, relative to their respective benchmark indices over the last year, three years, five years, ten years and since inception (as applicable) and in comparison to their relative peer groups.
The Board Members also reviewed Morningstar analytical data relating to average expenses and advisory fees for comparable funds. Based on the information provided, the Board Members determined that each Fund’s fee structure is competitive with funds having similar investment goals and strategies.
The Board Members considered each Fund’s total expense ratios and contractual investment advisory fees compared to its respective industry average by quartile, within the appropriate Lipper benchmark category and Lipper category range. The Board Members also considered the amount and nature of fees paid by shareholders.
The Trustees also considered the overall profitability of the Adviser, reviewing certain financial information and noting in particular whether the Adviser had subsidized a Fund’s operations in its early years and whether it had recouped the amount of these subsidies. The Trustees considered both the direct and indirect benefits to the Adviser from advising the Funds. The Trustees also examined the level of profits that could be expected to accrue to the Adviser from the fees payable under the Agreements and any expense subsidization undertaken by the Adviser, as well as each Fund’s brokerage and commissions. The Board Members considered the fact that the Adviser has contractually agreed to waive a portion of its fees for the Realty Income & Growth Fund, the Emerging Markets Real Estate Fund a nd the Global Infrastructure Fund for a period of one year, to be reviewed again at the next Advisory Contract renewal. It was noted that each Fund’s management fee and expense ratio are within the average range compared to its peer funds.
Based on the Board Members’ review and consultation with the Funds’ independent counsel, of the material aspects of the Advisory Contracts, including the foregoing factors and such other information believed to be reasonably necessary to evaluate the terms of the Advisory Contracts, the Board Members, including all of the non-interested Trustees voting separately, concluded that the continuation of the Advisory Contracts would be in the best interest of the Funds’ shareholders, and determined that the compensation to the Adviser provided for in the Advisory Contracts is fair and equitable.
Additional Information (Unaudited)—Continued
April 30, 2010
| Name and Age | Position(s) Held with the Trust | Term of Office and Length of Time Served | Principal Occupation During Past Five Years | # of Portfolios in Fund Complex** | Other Directorships Held by Trustee |
| | | | | | |
| Laurence B. Ashkin (82) | Independent Trustee | Indefinite, since the Trust’s inception | Real estate developer since 1980; Founder and President of Centrum Properties, Inc. since 1980. | 16 | Board of Trustees Chairman, Perspective Charter Schools, Chicago, IL; Director, Chicago Public Radio; Trustee of each of the Alpine Trusts.* |
| | | | | | | |
| H. Guy Leibler (55) | Independent Trustee | Indefinite, since the Trust’s inception | Private investor, since 2007; Vice Chair & Chief Operating Officer of L&L Acquisitions, LLC (2004-2007); President, Skidmore, Owings & Merrill LLP (2001-2004). | 16 | Chairman Emeritus, White Plains Hospital Center; Trustee, each of the Alpine Trusts.* |
| | | | | | |
| Jeffrey E. Wacksman (49) | Independent Trustee | Indefinite, since 2004 | Partner, Loeb, Block & Partners LLP, since 1994. | 16 | Director, International Succession Planning Association; Trustee, Larchmont Manor Park Society; Director, Bondi Icebergs Inc. (Women’s Sportswear); Director, MH Properties, Inc.; Trustee, each of the Alpine Trusts.* |
| | | | | | |
| James A. Jacobson (65) | Independent Trustee | Indefinite, since July 2009 | Retired, since November 2008; Vice Chairman and Managing Director, Spear Leeds & Kellogg Specialists, LLC, January 2003 to November 2008. | 16 | Trustee, Allianz Global Investors Multi-Funds. Trustee, each of the Alpine Trusts.* |
| | | | | | |
| * | The term “Fund Complex” refers to the Funds in the Alpine Equity Trust, Alpine Series Trust, and Alpine Income Trust, and Alpine Global Dynamic Dividend Fund, Alpine Total Dynamic Dividend Fund, and Alpine Global Premier Properties Fund (the “Alpine Trusts”). |
Additional Information (Unaudited)—Continued
April 30, 2010
Interested Trustees & Officers
| Name and Age | Position(s) Held with the Trust | Term of Office and Length of Time Served | Principal Occupation During Past Five Years | # of Portfolios in Fund Complex** | Other Directorships Held by Trustee |
| | | | | | |
| Samuel A. Lieber* (53) | Interested Trustee, President and Portfolio Manager | Indefinite, since the Trust’s inception | CEO of Alpine Woods Capital Investors, LLC since November 1997. President of Alpine Trusts since 1998. | 16 | Trustee, each of the Alpine Trusts. |
| | | | | | |
| Stephen A. Lieber*** (84) | Vice President and Portfolio Manager | Indefinite, since the Trust’s inception | Chief Investment Officer, Alpine Woods Capital Investors, LLC since 2003; Chairman and Senior Portfolio Manager, Saxon Woods Advisors, LLC since 1999. | N/A | None |
| | | | | | |
| John Megyesi (49) | Chief Compliance Officer | Indefinite, since January 2009 | Chief Compliance Officer, Alpine Woods Capital Investors, LLC since January 2009; Vice President and Manager, Trade Surveillance, Credit Suisse Asset Management, LLC (2006-2009); Manager, Trading and Surveillance, Allianz Global Investors (2004-2006). | N/A | None |
| | | | | | |
| Ronald Palmer (41) | Chief Financial Officer | Indefinite, since January 2010 | Chief Financial Officer, Alpine Woods Capital Investors, LLC since January 2010; Independent Consultant (2008-2009); Vice President, Cash Management and Foreign Exchange, Macquarie Capital Investment Management, LLC (2007-2008); Chief Operating Officer, Macquarie Fund Adviser, LLC (2004-2007). | N/A | None |
| | | | | | |
| Meimei Li (46) | Treasurer | Indefinite, since March 2009 | Controller, Alpine Woods Capital Investors, LLC since February 2007; Senior Accountant Pinnacle Group (2005-2007); Senior Auditor, Eisner & Lubin (2001-2005). | N/A | None |
| | | | | | |
| Andrew Pappert (30) | Secretary | Indefinite, since March 2009 | Director of Fund Operations, Alpine Woods Capital Investors, LLC since September 2008; Assistant Vice President, Mutual Fund Operations, Credit Suisse Asset Management, LLC (2003- 2008). | N/A | None |
| | | | | | |
| | | | | | |
| * | Denotes Trustees who are “interested persons” of the Trust or Fund under the 1940 Act. |
| ** | The term “Fund Complex” refers to the Funds in the Alpine Equity Trust, Alpine Series Trust, and Alpine Income Trust, and Alpine Global Dynamic Dividend Fund, Alpine Total Dynamic Dividend Fund, and Alpine Global Premier Properties Fund (the “Alpine Trusts”). |
| *** | Stephen A. Lieber is the father of Samuel A. Lieber. |
Additional Information (Unaudited)—Continued
April 30, 2010
Tax Information
The Funds designated the following percentages of dividends declared during the fiscal year ended October 31, 2009 as dividends qualifying for the dividends received deduction available to corporate shareholders.
| Dynamic Dividend Fund | 23% |
| Accelerating Dividend Fund | 0% |
| Dynamic Financial Services Fund | 46% |
| Dynamic Innovators Fund | 0% |
| Dynamic Transformations Fund | 86% |
| Dynamic Balance Fund | 33% |
| Ultra Short Tax Optimized Income Fund | 0% |
| Municipal Money Market Fund | 0% |
The Fund designated as long-term capital gain dividend, pursuant to Internal Revenue Cose Section 852(b)(3), the amount necessary to reduce the earnings and profits of the Fund related to net capital gain to zero for the tax year ended October 31, 2009.
Availability of Proxy Voting Information
Information regarding how each Fund votes proxies relating to portfolio securities is available without charge upon request by calling toll-free at 1-888-785-5578 and on the SEC’s website at www.sec.gov. Information regarding how each Fund voted proxies relating to portfolio securities during the most recent twelve month period ended June 30 is available on the SEC’s website at www.sec.gov or by calling the toll-free number listed above.
Availability of Quarterly Portfolio Schedule
Beginning with each Fund’s fiscal quarter ended July 31, 2004, each Fund filed its complete schedule of portfolio holdings on Form N-Q with the SEC. Going forward, each Fund will file Form N-Q for the first and third quarters of each fiscal year on Form N-Q. Each Fund’s Form N-Q is available on the SEC’s website at www.sec.gov and may be reviewed and copied at the SEC’s Public Reference Room in Washington, DC. Information on the operation of the Public Reference Room may be obtained by calling 1-202-551-8090.
TRUSTEES
Samuel A. Lieber
Laurence B. Ashkin
James A. Jacobson
H. Guy Leibler
Jeffrey E. Wacksman
CUSTODIAN
U.S. Bank, N.A.
1555 N. Rivercenter Dr. Suite 302
Milwaukee, WI 53212
SUB-CUSTODIAN
The Bank of New York Mellon
One Wall Street
New York, NY 10286
INDEPENDENT REGISTERED
PUBLIC ACCOUNTING FIRM
Deloitte & Touche LLP
555 East Wells Street
Milwaukee, WI 53202
FUND COUNSEL
Blank Rome LLP
The Chrysler Building
405 Lexington Avenue
New York, NY 10174
DISTRIBUTOR
Quasar Distributors, LLC
615 East Michigan Street
Milwaukee, WI 53202
INVESTMENT ADVISER
Alpine Woods Capital Investors, LLC
2500 Westchester Ave., Suite 215
Purchase, NY 10577
TRANSFER AGENT &
ADMINISTRATOR
US Bancorp Fund Services, LLC
615 East Michigan Street Milwaukee, WI 53202
[insert Alpine Logo]
SHAREHOLDER | INVESTOR INFORMATION
1(888)785.5578
www.alpinefunds.com
This material must be preceded or accompanied by a current prospectus.
Item 2. Code of Ethics.
Not applicable for semi-annual reports.
Item 3. Audit Committee Financial Expert.
Not applicable for semi-annual reports.
Item 4. Principal Accountant Fees and Services.
Not applicable for semi-annual reports.
Item 5. Audit Committee of Listed Registrants.
Not applicable to registrants who are not listed issuers (as defined in Rule 10A-3 under the Securities Exchange Act of 1934).
Item 6. Investments.
Schedule of Investments is included as part of the report to shareholders filed under Item 1 of this Form.
Item 7. Disclosure of Proxy Voting Policies and Procedures for Closed-End Management Investment Companies.
Not applicable to open-end investment companies.
Item 8. Portfolio Managers of Closed-End Management Investment Companies.
Not applicable to open-end investment companies.
Item 9. Purchases of Equity Securities by Closed-End Management Investment Company and Affiliated Purchasers.
Not applicable to open-end investment companies.
Item 10. Submission of Matters to a Vote of Security Holders.
There have been no material changes to the procedures by which shareholders may recommend nominees to the registrant’s board of trustees. The registrant’s Nominating Committee policy states that any shareholder of a Fund may submit the name of a candidate by consideration by the Nominating Committee by submitting a written nomination to the Fund’s secretary in accordance with the provisions of the Fund’s Agreement and Declaration of the Fund, as may be amended from time to time. The secretary will forward any such nomination to the Nominating Committee promptly upon receipt.
Item 11. Controls and Procedures.
| (a) | The Registrant’s President and Chief Financial Officer have reviewed the Registrant's disclosure controls and procedures (as defined in Rule 30a-3(c) under the Investment Company Act of 1940 (the “Act”)) as of a date within 90 days of the filing of this report, as required by Rule 30a-3(b) under the Act and Rules 13a-15(b) or 15d-15(b) under the Securities Exchange Act of 1934. Based on their review, such officers have concluded that the disclosure controls and procedures are effective in ensuring that information required to be disclosed in this report is appropriately recorded, processed, summarized and reported and made known to them by others within the Registrant and by the Registrant’s service provider. |
| (b) | There were no changes in the Registrant's internal control over financial reporting (as defined in Rule 30a-3(d) under the Act) that occurred during the second fiscal quarter of the period covered by this report that has materially affected, or is reasonably likely to materially affect, the Registrant's internal control over financial reporting. |
Item 12. Exhibits.
| (a) | (1) Any code of ethics or amendment thereto, that is the subject of the disclosure required by Item 2, to the extent that the registrant intends to satisfy Item 2 requirements through filing an exhibit. Not applicable. |
(2) A separate certification for each principal executive and principal financial officer pursuant to Section 302 of the Sarbanes-Oxley Act of 2002. Filed herewith.
(3) Any written solicitation to purchase securities under Rule 23c-1 under the Act sent or given during the period covered by the report by or on behalf of the registrant to 10 or more persons. Not applicable to open-end investment companies.
| (b) | Certifications pursuant to Section 906 of the Sarbanes-Oxley Act of 2002. Furnished herewith. |
SIGNATURES
Pursuant to the requirements of the Securities Exchange Act of 1934 and the Investment Company Act of 1940, the registrant has duly caused this report to be signed on its behalf by the undersigned, thereunto duly authorized.
(Registrant) Alpine Income Trust � 60;
By (Signature and Title)* /s/Samuel A. Lieber
Samuel A. Lieber, President
Date 07/09/2010
Pursuant to the requirements of the Securities Exchange Act of 1934 and the Investment Company Act of 1940, this report has been signed below by the following persons on behalf of the registrant and in the capacities and on the dates indicated.
By (Signature and Title)* /s/Samuel A. Lieber
Samuel A. Lieber, President
Date 07/09/2010 & #160;
By (Signature and Title)* /s/Ronald G. Palmer, Jr.
Ronald G. Palmer, Jr., Chief Financial Officer
Date 07/09/2010 &# 160;
* Print the name and title of each signing officer under his or her signature