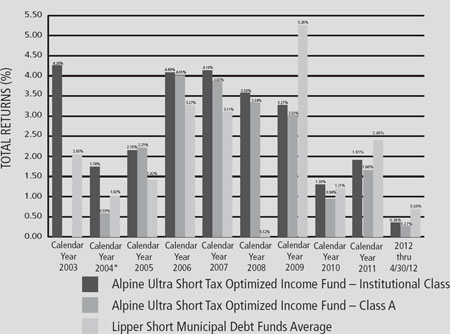
declining credit and historically low interest rates. While the fund’s total return has not kept pace with other funds that had large exposure to lower-rated bonds or longer maturities during the past six months, we feel our fund is well positioned based on our primary objectives and present conditions in the marketplace.
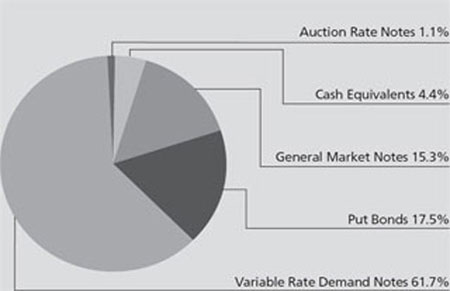
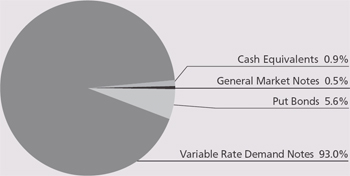
Upon examining the fundamentals of the municipal marketplace over the past six months, we saw three key strategies that formulated our investment strategy. These included historically low interest rates, a supply/demand imbalance of tax exempt securities and deteriorating credit quality. When we took all three of these factors into consideration, we concluded that, based on our specific objective for the fund that, it would be prudent to keep our average weighted maturity short and keep our liquidity high. As a result, our fund’s average weighted maturity fell to 69 days at the end of April a lot shorter than that of our benchmark. With short-term rates so low we will most likely keep the fund’s average maturity under 100 days until we see rates move higher or there are some other major changes in the market that would warrant such a move. We continued to overweight the portfolio in near-cash or short-term bonds that mature within a year with over 50% of the fund in variable rate demand notes (VRDN’s). VRDNs have been a big component of the fund for the last several years as they provide the fund both with an attractive yield relative to longer maturing securities and the ability to sell at par on a daily or weekly basis depending on the specific type. Lastly, we continue to see an increase in the yield of these securities that either have a European bank letter of credit or act as a liquidity provider. We are very conscious of the volatility overseas and have limited our exposure to no more than seven days in any one security. Many of the issues end up getting called or refinanced as the rates increase to unsatisfying levels, and we continue to seek out bonds that we know are being called at a future date. The reason being is that they provide an above average yield and relative safety of principal.
Other investments included purchasing put bonds in the three to 12-month range, general market notes and the first year or two of standard municipal bond deals. Unfortunately, yields on our holdings of tax exempt commercial paper have fallen dramatically from where we originally purchased it and we will likely sell the positions if the yield drops much further. On the other hand, we have increased our holdings in general market notes as more issuers have recently come to the market at somewhat attractive yields. Overall, these three
different types of securities helped us balance out the portfolio by extending ever so slightly on the yield curve.
ALPINE MUNICIPAL MONEY MARKET FUND
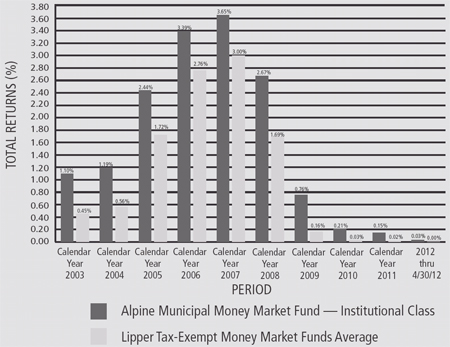
With the Federal Reserve’s zero interest rate policy now in place for more than three years and showing no signs of abating, rates in the municipal money market offer minimal return for investors. One aspect of Fed policy has been to motivate investors to shift assets away from lower risk returns of money funds towards higher risk alternatives. As a result, money fund assets are down significantly from their 2008 peaks.
Overall, rates across the money market curve were lower compared with those in place a year ago. Overnight rates at the close of our fiscal period averaged 0.28% compared with .30% in the prior period, while seven-day dates averaged 0.36% compared with 0.41%. Six-month and one-year note yields pushed lower, both yielding about half of what they were a year ago.
One interesting sidebar within the municipal money markets has been the growing popularity of tax exempt municipal variable rate demand notes within taxable money market funds. SEC rules now require money funds to maintain significant overnight and seven-day liquidity and VRDNs nicely perform that function. Moreover, for quite some time, yields on tax exempt VRDNs were comparable to taxable yields. These attributes created significant demand for VRDNs and have been a contributor to the push to lower yields.
Credit quality remains a key focus in the management of the fund, both with respect to municipal issuer as well as to the banks that figure prominently in providing forms of credit and liquidity support to so many municipal issuers. Ratings downgrade concerns force us to consistently reevaluate which banks we feel comfortable with and for what period of time. As a result, we have continued to maintain a very short average weight maturity of 10 days that provides us with the flexibility to adjust the portfolio as needed. This is significantly shorter than the industry average of 26 days.
Recently, headlines have suggested that regulators may be considering further changes to rules governing money funds. We monitor such a possibility but are unclear as to the benefits of some proposals. Despite the challenges, we continue to focus on managing the fund with an emphasis on credit quality and principal stability.
| |
Alpine Ultra Short Tax Optimized Income Fund /
Alpine Municipal Money Market Fund | 
|
| | |
OUTLOOK
We believe that the municipal bond market is a high quality market with good opportunities for long-term investors. While frustrated by Federal Reserve assurances that interest rate hikes are not imminent, we do feel comforted in the belief that states and municipalities have the ability to balance their budgets in these tough times. As always, we are on the outlook for attractively
valued bonds issued by municipalities with good fundamentals – an investment strategy that has served our investors well in the past.
Sincerely,
Steven C. Shachat
Portfolio Manager
| |
| | |
Mutual fund investing involves risk. Principal loss is possible. The Fund is subject to the following risks: |
Credit Risk – The credit quality and liquidity of the Ultra Short Fund’s investments in municipal obligations and other debt securities may be dependent in part on the credit quality of third parties, such as banks and other financial institutions, which provide credit and liquidity enhancements to the Ultra Short Fund’s investments. Adverse changes in the credit quality of these third parties could cause losses to a Fund and affect its share price.
Derivative Securities Risk – The Ultra Short Fund may invest in municipal derivative securities which are subject to structural risks that could cause the Ultra Short Fund to receive taxable income or to lose money.
Fixed Income Securities Risk – Fixed income securities are subject to issuer risk, interest rate risk and market risk.
Interest Rate Risk – Interest rates may rise resulting in a decrease in the value of the securities held by the Ultra Short Fund, or may fall resulting in an increase in the value of such securities. Securities having longer maturities generally involve a greater risk of fluctuations in the value resulting from changes in interest rates.
Issuer Risk – Changes in the financial condition of the issuer of an obligation, changes in general economic conditions, or changes in economic conditions that affect the issuer may impact its actual or perceived willingness or ability to make timely payments of interest or principal.
Liquidity Risk – Some securities held by the Ultra Short Fund may be difficult to sell, or illiquid, particularly during times of market turmoil. Illiquid securities may also be difficult to value. If the Ultra Short Fund is forced to sell an illiquid asset to meet redemption requests or other cash needs, the Ultra Short Fund may be forced to sell at a loss.
Management Risk – The Adviser’s security selections and other investment decisions might produce losses or cause the Ultra Short Fund to under perform when compared to other funds with similar investment goals.
Market Risk – The price of a security held by the Ultra Short Fund may fall due to changing market, economic or political conditions.
Mortgage Related and Asset Backed Securities Risk – These securities are subject to prepayment risk, which is the risk that the borrower will prepay some or all of the principal owed to the owner. This could reduce the Ultra Short Fund’s share price and its income distributions.
Municipal Securities Risk – Municipal securities include revenue bonds, general obligation bonds and municipal lease obligations. Revenue bonds include private activity bonds, which are not payable from the general revenues of the issuer. Consequently, the credit quality of private activity bonds is usually directly related to the credit standing of the corporate user of the facility involved. To the extent that the Fund’s assets are invested in private activity bonds, the Fund will be subject to the particular risks presented by the laws and economic conditions relating to such projects and bonds to a greater extent than if its assets were not so invested. Municipal securities also include moral obligation bonds, which are normally issued by special purpose public authorities. If the issuer of moral obligation bonds is unable to pay its debts from current revenues, it may draw on a reserve fund the restoration of which is a moral but not a legal obligation of the state or municipality which created the issuer. Municipal lease obligations are not guaranteed by the issuer and are generally less liquid than other securities. Municipal lease obligations also are subject to the risk that the municipality will not appropriate funds for lease payments. There may be less information available on the financial condition of issuers of municipal securities than for public corporations. The market for municipal bonds may be less liquid than for taxable bonds. This means that it may be harder to buy and sell municipal securities, especially on short notice, and municipal securities may be more difficult for the Fund to value accurately than securities of public corporations. In addition, municipal securities are subject to the risk that their tax treatment could be changed by the U.S. Congress or state legislatures, thereby affecting the value of outstanding municipal securities.
Portfolio Turnover Risk – High portfolio turnover necessarily results in greater transaction costs which may reduce Fund performance.
44
| |
Alpine Ultra Short Tax Optimized Income Fund /
Alpine Municipal Money Market Fund |
|
| | |
Tax Risk – Changes in tax laws or adverse determinations by the Internal Revenue Service may make the income from some municipal obligations taxable. Additionally, maximizing after-tax income may require trade-offs that reduce pre-tax income. The Ultra Short Fund’s tax-efficient strategies may reduce the taxable income of the Ultra Short Fund’s shareholders, but will not eliminate it. There can be no assurance that taxable distributions can always be avoided or that the Ultra Short Fund will achieve its investment objective.
Variable Rate Demand Obligations Risk – Variable rate demand obligations are floating rate securities that combine an interest in a long term municipal bond with a right to demand payment before maturity from a bank or other financial institution. If the bank or financial institution is unable to pay, the Fund may lose money.
Credit Risk – The credit quality and liquidity of the Municipal Money Market Fund’s investments in municipal obligations and other debt securities may be dependent in part on the credit quality of third parties, such as banks and other financial institutions, which provide credit and liquidity enhancements to the Municipal Money Market Fund’s investments. Adverse changes in the credit quality of these third parties could cause losses to a Fund and affect its share price.
Fixed Income Securities Risk – Fixed income securities are subject to issuer risk, interest rate risk and market risk.
Interest Rate Risk – Interest rates may rise resulting in a decrease in the value of the securities held by the Municipal Money Market Fund, or may fall resulting in an increase in the value of such securities. Securities having longer maturities generally involve a greater risk of fluctuations in the value resulting from federal tax consistent changes in interest rates.
Issuer Risk – Changes in the financial condition of the issuer of an obligation, changes in general economic conditions, or changes in economic conditions that affect the issuer may impact its actual or perceived willingness or ability to make timely payments of interest or principal.
Liquidity Risk – Some securities held by the Municipal Money Market Fund may be difficult to sell, or illiquid, particularly during times of market turmoil. Illiquid securities may also be difficult to value. If the Municipal Money Market Fund is forced to sell an illiquid asset to meet redemption requests or other cash needs, the Municipal Money Market Fund may be forced to sell at a loss.
Management Risk – The Adviser’s security selections and other investment decisions might produce losses or cause the Municipal Money Market Fund to under perform when compared to other funds with preservation of capital similar investment goals.
Market Risk – The price of a security held by the Municipal Money Market Fund may fall due to changing market, economic or political conditions.
Municipal Securities Concentration Risk – From time to time the Municipal Money Market Fund may invest a substantial amount of its assets in municipal securities whose interest is paid solely from revenues of similar projects. If the Municipal Money Market Fund concentrates its investments in this manner, it assumes the economic risks relating to such projects and this may have a significant impact on the Municipal Money Market Fund’s investment performance.
Municipal Securities Risk – Municipal securities risks include the ability of the issuer to repay the obligation, the relative lack of information about certain issuers of municipal securities, and the possibility of future legislative changes which could affect the market for and value of municipal securities. Certain municipal securities, including private activity bonds, are not backed by the full faith, credit and taxing power of the issuer. Additionally, if events occur after the security is acquired that impact the security’s tax-exempt status, the Municipal Money Market Fund and its shareholders could be subject to substantial tax liabilities.
Redemption Risk – The Municipal Money Market Fund may experience heavy redemptions, particularly during periods of declining or illiquid markets, that could cause the Municipal Money Market Fund to liquidate its assets at inopportune times or at a loss or depressed value and that could affect the Municipal Money Market Fund’s ability to maintain a $1.00 share price. In addition, the Municipal Money Market Fund may suspend redemptions when permitted by applicable regulations.
Regulatory Risk – The SEC recently amended the rules governing money market funds. In addition, the SEC continues to review the regulation of such funds. Any further changes by the SEC or additional legislative developments may affect the Alpine Municipal Money Market Fund’s operations, investment strategies, performance and yield.
Variable Rate Demand Obligations Risk – Variable rate demand obligations are floating rate securities that combine an interest in a long term municipal bond with a right to demand payment before maturity from a bank or other financial institution. If the bank or financial institution is unable to pay, the Fund may lose money.
Please refer to pages 4-5 for other important disclosures and definitions.
45
Information about your Funds Expenses (Unaudited)
April 30, 2012
Fund expenses (unaudited)
Example
As a shareholder of the Fund, you may incur two types of costs: (1) transaction costs, including front-end on purchase payments; and (2) ongoing costs, including management fees; service and/or distribution (12b-1) fees; and other Fund expenses. This example is intended to help you understand your ongoing costs (in dollars) of investing in the Fund and to compare these costs with the ongoing costs of investing in other mutual funds.
This example is based on an investment of $1,000 invested on November 1, 2011 and held for the six months ended April 30, 2012.
Actual expenses
The table below titled “Based on Actual Total Return” provides information about actual account values and actual expenses. You may use the information provided in this table, together with the amount you invested, to estimate the expenses that you paid over the period. To estimate the expenses you paid on your account, divide your ending account value by $1,000 (for example, an $8,600 ending account value divided by $1,000 = 8.6), then multiply the result by the number under the heading entitled “Expenses Paid During the Period”.
Hypothetical example for comparison purposes
The table below titled “Based on Hypothetical Total Return” provides information about hypothetical account values and hypothetical expenses based on the actual expense ratio and an assumed rate of return of 5.00% per year before expenses, which is not the Fund’s actual return. The hypothetical account values and expenses may not be used to estimate the actual ending account balance or expenses you paid for the period. You may use the information provided in this table to compare the ongoing costs of investing in the Fund and other funds. To do so, compare the 5.00% hypothetical example relating to the Fund with the 5.00% hypothetical examples that appear in the shareholder reports of the other funds.
Please note that the expenses shown in the table below are meant to highlight your ongoing costs only and do not reflect any transactional costs, such as front-end or back-end sales charges (loads). Therefore, the table is useful in comparing ongoing costs only, and will not help you determine the relative total costs of owning different funds. In addition, if these transaction costs were included, your costs would have been higher.
46
Information about your Funds Expenses (Unaudited)—Continued
Expense Examples
April 30, 2012
| | | | | | | | | | | | | |
Dynamic Dividend Fund |
| | | | | | | | | | | | |
Based on actual total return (1) |
Class | | | Actual Total
Return Without
Sales Charges (2) | | Beginning
Account Value | | Ending
Account Value | | Annualized
Expense
Ratio | | Expenses
Paid During
the Period (3) | |
| | | | | | | | | | | | | |
| | | | | | | | | | | | |
Class A | | 7.59 | % | | $ 1,000.00 | | $ 1,075.90 | | 1.49% | | $5.11 | |
| | | | | | | | | | | | |
Institutional | | 3.61 | % | | $ 1,000.00 | | $ 1,036.10 | | 1.23% | | $6.23 | |
| | | | | | | | | | | | |
Based on hypothetical total return (1) |
Class | | | Hypothetical
Annualized
Total Return | | Beginning
Account Value | | Ending
Account Value | | Annualized
Expense
Ratio | | Expenses
Paid During
the Period (4) | |
| | | | | | | | | | | | | |
| | | | | | | | | | | | |
Class A | | 5.00 | % | | $ 1,000.00 | | $ 1,017.45 | | 1.49% | | $7.47 | |
| | | | | | | | | | | | |
Institutional | | 5.00 | % | | $ 1,000.00 | | $ 1,018.75 | | 1.23% | | $6.17 | |
| | | | | | | | | | | | |
Accelerating Dividend Fund |
| | | | | | | | | | | | |
Based on actual total return (1) |
Class | | | Actual Total
Return Without
Sales Charges (2) | | Beginning
Account Value | | Ending
Account Value | | Annualized
Expense
Ratio | | Expenses
Paid During
the Period (3) | |
| | | | | | | | | | | | | |
| | | | | | | | | | | | |
Class A | | 9.46 | % | | $ 1,000.00 | | $ 1,094.60 | | 1.61% | | $5.57 | |
| | | | | | | | | | | | |
Institutional | | 10.32 | % | | $ 1,000.00 | | $ 1,103.20 | | 1.36% | | $7.11 | |
| | | | | | | | | | | | |
Based on hypothetical total return (1) |
Class | | | Hypothetical
Annualized
Total Return | | Beginning
Account Value | | Ending
Account Value | | Annualized
Expense
Ratio | | Expenses
Paid During
the Period (4) | |
| | | | | | | | | | | | | |
| | | | | | | | | | | | |
Class A | | 5.00 | % | | $ 1,000.00 | | $ 1,016.86 | | 1.61% | | $8.07 | |
| | | | | | | | | | | | |
Institutional | | 5.00 | % | | $ 1,000.00 | | $ 1,018.10 | | 1.36% | | $6.82 | |
| | | | | | | | | | | | |
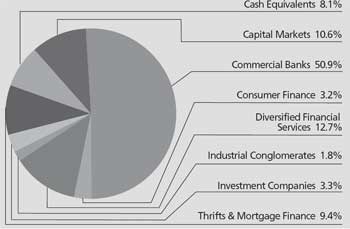
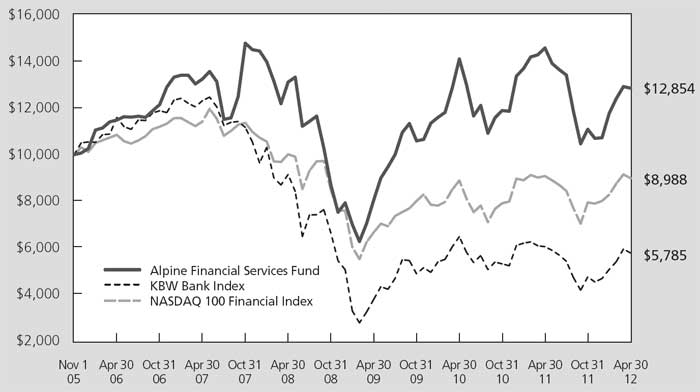
Financial Services Fund |
| | | | | | | | | | | | |
Based on actual total return (1) |
Class | | | Actual Total
Return Without
Sales Charges (2) | | Beginning
Account Value | | Ending
Account Value | | Annualized
Expense
Ratio | | Expenses
Paid During
the Period (3) | |
| | | | | | | | | | | | | |
| | | | | | | | | | | | |
Class A | | 19.71 | % | | $ 1,000.00 | | $ 1,197.10 | | 1.64% | | $5.96 | |
| | | | | | | | | | | | |
Institutional | | 15.94 | % | | $ 1,000.00 | | $ 1,159.40 | | 1.41% | | $7.57 | |
| | | | | | | | | | | | |
Based on hypothetical total return (1) |
Class | | | Hypothetical
Annualized
Total Return | | Beginning
Account Value | | Ending
Account Value | | Annualized
Expense
Ratio | | Expenses
Paid During
the Period (4) | |
| | | | | | | | | | | | | |
| | | | | | | | | | | | |
Class A | | 5.00 | % | | $ 1,000.00 | | $ 1,016.71 | | 1.64% | | $8.22 | |
| | | | | | | | | | | | |
Institutional | | 5.00 | % | | $ 1,000.00 | | $ 1,017.85 | | 1.41% | | $7.07 | |
47
Information about your Funds Expenses (Unaudited)—Continued
Expense Examples
April 30, 2012
| | | | | | | | | | | | | |
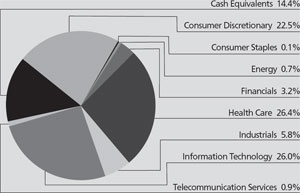
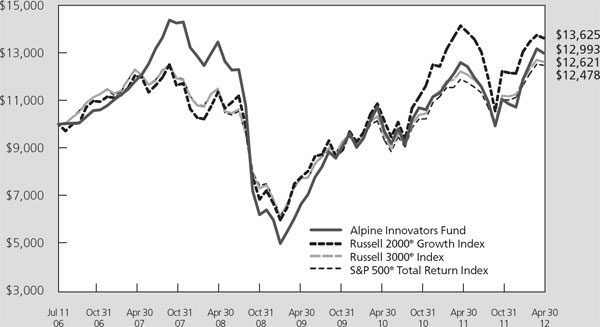
Innovators Fund |
| | | | | | | | | | | | |
Based on actual total return (1) |
Class | | | Actual Total
Return Without
Sales Charges (2) | | Beginning
Account Value | | Ending
Account Value | | Annualized
Expense
Ratio | | Expenses
Paid During
the Period (3) | |
| | | | | | | | | | | | | |
| | | | | | | | | | | | |
Class A | | 21.14 | % | | $ 1,000.00 | | $ 1,211.40 | | 1.60% | | $5.85 | |
| | | | | | | | | | | | |
Institutional | | 17.65 | % | | $ 1,000.00 | | $ 1,176.50 | | 1.36% | | $7.36 | |
| | | | | | | | | | | | |
Based on hypothetical total return (1) |
Class | | | Hypothetical
Annualized
Total Return | | Beginning
Account Value | | Ending
Account Value | | Annualized
Expense
Ratio | | Expenses
Paid During
the Period (4) | |
| | | | | | | | | | | | | |
| | | | | | | | | | | | |
Class A | | 5.00 | % | | $ 1,000.00 | | $ 1,016.91 | | 1.60% | | $8.02 | |
| | | | | | | | | | | | |
Institutional | | 5.00 | % | | $ 1,000.00 | | $ 1,018.10 | | 1.36% | | $6.82 | |
| | | | | | | | | | | | |
Transformations Fund |
| | | | | | | | | | | | |
Based on actual total return (1) |
Class | | | Actual Total
Return Without
Sales Charges (2) | | Beginning
Account Value | | Ending
Account Value | | Annualized
Expense
Ratio | | Expenses
Paid During
the Period (3) | |
| | | | | | | | | | | | | |
| | | | | | | | | | | | |
Class A | | 16.22 | % | | $ 1,000.00 | | $ 1,162.20 | | 1.61% | | $5.75 | |
| | | | | | | | | | | | |
Institutional | | 11.05 | % | | $ 1,000.00 | | $ 1,110.50 | | 1.35% | | $7.08 | |
| | | | | | | | | | | | |
Based on hypothetical total return (1) |
Class | | | Hypothetical
Annualized
Total Return | | Beginning
Account Value | | Ending
Account Value | | Annualized
Expense
Ratio | | Expenses
Paid During
the Period (4) | |
| | | | | | | | | | | | | |
| | | | | | | | | | | | |
Class A | | 5.00 | % | | $ 1,000.00 | | $ 1,016.86 | | 1.61% | | $8.07 | |
| | | | | | | | | | | | |
Institutional | | 5.00 | % | | $ 1,000.00 | | $ 1,018.15 | | 1.35% | | $6.77 | |
| | | | | | | | | | | | |
Foundation Fund |
| | | | | | | | | | | | |
Based on actual total return (1) |
Class | | | Actual Total
Return Without
Sales Charges (2) | | Beginning
Account Value | | Ending
Account Value | | Annualized
Expense
Ratio | | Expenses
Paid During
the Period (3) | |
| | | | | | | | | | | | | |
| | | | | | | | | | | | |
Class A | | 7.92 | % | | $ 1,000.00 | | $ 1,079.20 | | 1.49% | | $5.12 | |
| | | | | | | | | | | | |
Institutional | | 8.44 | % | | $ 1,000.00 | | $ 1,084.40 | | 1.21% | | $6.27 | |
| | | | | | | | | | | | |
Based on hypothetical total return (1) |
Class | | | Hypothetical
Annualized
Total Return | | Beginning
Account Value | | Ending
Account Value | | Annualized
Expense
Ratio | | Expenses
Paid During
the Period (4) | |
| | | | | | | | | | | | | |
| | | | | | | | | | | | |
Class A | | 5.00 | % | | $ 1,000.00 | | $ 1,017.45 | | 1.49% | | $7.47 | |
| | | | | | | | | | | | |
Institutional | | 5.00 | % | | $ 1,000.00 | | $ 1,018.85 | | 1.21% | | $6.07 | |
| | |
| | |
(1) | For the six months ended April 30, 2012. |
(2) | Assumes the reinvestment of all distributions, including returns of capital, if any, at net asset value and does not reflect the deduction of the applicable sales charge. Total return is not annualized, as it may not be representative of the total return for the year. Performance figures may reflect fee waivers and/or expense reimbursements. In the absence of fee waivers and/or expense reimbursements, the total return would have been lower. |
| Past performance is no guarantee of future results. |
48
Information about your Funds Expenses (Unaudited)—Continued
Expense Examples
April 30, 2012
| |
(3) | Expenses (net of fee waivers and/or expense reimbursements) are equal to each class’ respective annualized expense ratio multiplied by the average account value over the period, multiplied by the number of days in the most recent fiscal half-year (121 and 182, for Class A and Institutional Shares, respectfully), then divided by 366. |
(4) | Class A Shares commenced operations on December 30, 2011. Hypothetical expense examples assume a 5% return over a hypothetical 182 day period. |
| | | | | | | | | | | | | |
Ultra Short Tax Optimized Income Fund |
| | | | | | | | | | | | |
Based on actual total return (1) |
Class | | | Actual Total
Return Without
Sales Charges (2) | | Beginning
Account Value | | Ending
Account Value | | Annualized
Expense
Ratio | | Expenses
Paid During
the Period (3) | |
| | | | | | | | | | | | | |
| | | | | | | | | | | | |
Class A | | 0.49 | % | | $ 1,000.00 | | $ 1,004.90 | | 0.90% | | $4.49 | |
| | | | | | | | | | | | |
Institutional | | 0.61 | % | | $ 1,000.00 | | $ 1,006.10 | | 0.65% | | $3.24 | |
| | | | | | | | | | | | |
Based on hypothetical total return (1) |
Class | | | Hypothetical
Annualized
Total Return | | Beginning
Account Value | | Ending
Account Value | | Annualized
Expense
Ratio | | Expenses
Paid During
the Period (3) | |
| | | | | | | | | | | | | |
| | | | | | | | | | | | |
Class A | | 5.00 | % | | $ 1,000.00 | | $ 1,020.39 | | 0.90% | | $4.52 | |
| | | | | | | | | | | | |
Institutional | | 5.00 | % | | $ 1,000.00 | | $ 1,021.63 | | 0.65% | | $3.27 | |
| | | | | | | | | | | | |
Municipal Money Market Fund |
| | | | | | | | | | | | |
Based on actual total return (1) |
Class | | | Actual Total
Return Without
Sales Charges (2) | | Beginning
Account Value | | Ending
Account Value | | Annualized
Expense
Ratio | | Expenses
Paid During
the Period (3) | |
| | | | | | | | | | | | | |
| | | | | | | | | | | | |
Institutional | | 0.05 | % | | $ 1,000.00 | | $ 1,000.50 | | 0.32% | | $1.59 | |
| | | | | | | | | | | | |
Based on hypothetical total return (1) |
Class | | | Hypothetical
Annualized
Total Return | | Beginning
Account Value | | Ending
Account Value | | Annualized
Expense
Ratio | | Expenses
Paid During
the Period (3) | |
| | | | | | | | | | | | | |
| | | | | | | | | | | | |
Institutional | | 5.00 | % | | $ 1,000.00 | | $ 1,023.27 | | 0.32% | | $1.61 | |
| | |
| | |
(1) | For the six months ended April 30, 2012. |
(2) | Assumes the reinvestment of all distributions, including returns of capital, if any, at net asset value and does not reflect the deduction of the applicable sales charge. Total return is not annualized, as it may not be representative of the total return for the year. Performance figures may reflect fee waivers and/or expense reimbursements. In the absence of fee waivers and/or expense reimbursements, the total return would have been lower. Past performance is no guarantee of future results. |
(3) | Expenses (net of fee waivers and/or expense reimbursements) are equal to each class’ respective annualized expense ratio multiplied by the average account value over the period, multiplied by the number of days in the most recent fiscal half-year (182), then divided by 366. |
49
|
Alpine Dynamic Dividend Fund |
| |
Schedule of Portfolio Investments
April 30, 2012 (Unaudited)
| | | | | | | |
Shares | | Security
Description | | Value | |
| | | | | | |
|
Common Stocks—94.3% | | | | |
Brazil—4.1% | | | | |
| 353,100 | | All America Latina Logistica SA | | $ | 1,607,905 | |
| 293,401 | | Anhanguera Educacional
Participacoes SA | | 3,900,418 | |
| 226,400 | | Arcos Dorados Holdings, Inc. | | | 4,045,768 | |
| 122,700 | | BTG Pactual Participations, Ltd. (a) | | | 1,969,096 | |
| 2,082,700 | | PDG Realty SA Empreendimentos
e Participacoes | | | 4,916,796 | |
| | | | | | | |
| | | | | | 16,439,983 | |
| | | | | | | |
Canada—0.5% | | | | |
| 129,925 | | PetroBakken Energy,
Ltd.—Class A | | | 1,880,779 | |
| | | | | | | |
China—0.4% | | | | |
| 13,591,000 | | Daqing Dairy Holdings, Ltd.
(a)(b)(c) | | | 1,742,088 | |
| | | | | | | |
France—1.2% | | | | |
| 232,800 | | Mercialys SA | | | 4,651,636 | |
| | | | | | | |
Israel—2.0% | | | | |
| 2,351,000 | | Bezeq The Israeli
Telecommunication Corp., Ltd. | | | 3,934,205 | |
| 86,321 | | Teva Pharmaceutical
Industries, Ltd.—ADR | | | 3,948,323 | |
| | | | | | | |
| | | | | | 7,882,528 | |
| | | | | | | |
Norway—2.6% | | | | |
| 271,700 | | Seadrill, Ltd. | | | 10,515,827 | |
| | | | | | | |
Singapore—1.2% | | | | |
| 135,611 | | Avago Technologies, Ltd. | | | 4,675,867 | |
| | | | | | | |
South Korea—1.9% | | | | |
| 102,500 | | Kia Motors Corp. | | | 7,564,208 | |
| | | | | | | |
Sweden—4.9% | | | | |
| 115,800 | | Hennes & Mauritz AB—Class B | | | 3,978,132 | |
| 423,465 | | Tele2 AB-B Shares | | | 8,070,741 | |
| 765,000 | | Telefonaktiebolaget LM
Ericsson—B Shares | | | 7,580,230 | |
| | | | | | | |
| | | | | | 19,629,103 | |
| | | | | | | |
Switzerland—0.6% | | | | |
| 39,838 | | Novartis AG—ADR | | | 2,197,862 | |
| | | | | | | |
United Kingdom—4.3% | | | | |
| 178,000 | | BG Group PLC | | | 4,190,149 | |
| 128,947 | | Ensco PLC—ADR | | | 7,046,953 | |
| 127,804 | | GlaxoSmithKline PLC—ADR | | | 5,908,379 | |
| | | | | | | |
| | | | | | 17,145,481 | |
| | | | | | | |
United States—70.6% | | | | |
| 63,588 | | Abbott Laboratories | | | 3,946,271 | |
| 65,160 | | Aetna, Inc. | | | 2,869,646 | |
| 26,770 | | American Electric Power Co., Inc. | | | 1,039,747 | |
| 63,593 | | American Tower Corp.—Class A | | | 4,170,429 | |
| 10,011 | | Apple, Inc. (a) | | | 5,848,827 | |
| 30,351 | | Ashland, Inc. | | | 1,999,220 | |
| 35,617 | | Caterpillar, Inc. | | | 3,660,359 | |
| 114,991 | | CBS Corp.—Class B | | | 3,834,950 | |
| 38,048 | | Chevron Corp. | | | 4,054,395 | |
| 205,844 | | Citigroup, Inc. | | | 6,801,086 | |
| 53,430 | | Coach, Inc. | | | 3,908,939 | |
| 69,248 | | Colgate-Palmolive Co. | | | 6,851,397 | |
| 190,141 | | Comcast Corp.—Class A | | | 5,766,977 | |
| 68,164 | | ConocoPhillips | | | 4,882,587 | |
| 128,798 | | Cooper Tire & Rubber Co. | | | 1,925,530 | |
| 24,728 | | Cummins, Inc. | | | 2,864,244 | |
| | | | | | | |
Shares | | Security
Description | | Value | |
| | | | | | |
|
Common Stocks—continued | | | | |
United States—continued | | | | |
| 95,988 | | CVS Caremark Corp. | | $ | 4,282,985 | |
| 59,304 | | Domino’s Pizza, Inc. | | | 2,242,284 | |
| 96,567 | | Eli Lilly & Co. | | | 3,996,908 | |
| 103,387 | | Exelon Corp. | | | 4,033,127 | |
| 47,118 | | Exxon Mobil Corp. | | | 4,068,168 | |
| 105,117 | | Family Dollar Stores, Inc. | | | 7,100,653 | |
| 79,086 | | Foot Locker, Inc. | | | 2,419,241 | |
| 93,318 | | Hasbro, Inc. | | | 3,428,503 | |
| 260,641 | | Healthcare Services Group, Inc. | | | 5,530,802 | |
| 177,122 | | Hewlett-Packard Co. | | | 4,385,541 | |
| 159,911 | | Intel Corp. | | | 4,541,472 | |
| 45,056 | | International Business
Machines Corp. | | | 9,330,197 | |
| 114,579 | | ITC Holdings Corp. | | | 8,875,289 | |
| 75,973 | | Johnson & Johnson | | | 4,945,083 | |
| 26,889 | | Joy Global, Inc. | | | 1,902,935 | |
| 197,753 | | JPMorgan Chase & Co. | | | 8,499,424 | |
| 221,100 | | Kaydon Corp. | | | 5,423,583 | |
| 116,900 | | KBR, Inc. | | | 3,958,234 | |
| 299,678 | | KKR & Co. Guernsey LP | | | 4,231,453 | |
| 127,476 | | Kraft Foods, Inc.—Class A | | | 5,082,468 | |
| 76,800 | | Loral Space & Communications, Inc. | | | 4,765,440 | |
| 96,634 | | McDonald’s Corp. | | | 9,416,983 | |
| 64,361 | | McKesson Corp. | | | 5,883,239 | |
| 238,425 | | Meridian Bioscience, Inc. | | | 4,899,634 | |
| 138,527 | | Microchip Technology, Inc. | | | 4,895,544 | |
| 148,190 | | Microsoft Corp. | | | 4,745,044 | |
| 41,759 | | Occidental Petroleum Corp. | | | 3,809,256 | |
| 549,907 | | Och-Ziff Capital Management
Group, LLC—Class A | | | 4,828,183 | |
| 214,714 | | Oracle Corp. | | | 6,310,444 | |
| 22,583 | | Progress Energy, Inc. | | | 1,201,867 | |
| 134,859 | | QUALCOMM, Inc. | | | 8,609,399 | |
| 231,674 | | Regal Entertainment
Group—Class A | | | 3,153,083 | |
| 471,200 | | Sara Lee Corp. | | | 10,385,248 | |
| 51,572 | | Snap-On, Inc. | | | 3,225,313 | |
| 64,079 | | The Coca-Cola Co. | | | 4,890,509 | |
| 28,385 | | The Dow Chemical Co. | | | 961,684 | |
| 46,192 | | The Estee Lauder Cos.,
Inc.—Class A | | | 3,018,647 | |
| 42,935 | | The Southern Co. | | | 1,972,434 | |
| 12,580 | | Union Pacific Corp. | | | 1,414,495 | |
| 48,951 | | United Technologies Corp. | | | 3,996,360 | |
| 99,795 | | Verizon Communications, Inc. | | | 4,029,722 | |
| 68,058 | | Wal-Mart Stores, Inc. | | | 4,009,297 | |
| 128,504 | | Walgreen Co. | | | 4,505,350 | |
| 239,439 | | Wells Fargo & Co. | | | 8,004,446 | |
| 86,520 | | Yum! Brands, Inc. | | | 6,292,600 | |
| | | | | | | |
| | | | | | 281,927,175 | |
| | | | | | | |
| | | Total Common Stocks
(Cost $348,507,739) | | $ | 376,252,537 | |
| | | | | | | |
The accompanying notes are an integral part of these financial statements.
50
|
Alpine Dynamic Dividend Fund |
| |
Schedule of Portfolio Investments—Continued
April 30, 2011 (Unaudited)
| | | | | | | |
Principal
Amount | | Security
Description | | Value | |
| | | | | | |
| | | | |
Short-Term Investments—4.6% | | | | |
$ | 18,369,000 | | State Street Eurodollar
Time Deposit, 0.01% | | $ | 18,369,000 | |
| | | | | | | |
| | | Total Short-Term Investments
(Cost $18,369,000) | | | 18,369,000 | |
| | | | | | | |
| | | Total Investments
(Cost $366,876,739)—98.9% (d) | | | 394,621,537 | |
| | | Other Assets in Excess of
Liabilities—1.1% | | | 4,468,635 | |
| | | | | | | |
| | | TOTAL NET ASSETS 100.0% | | $ | 399,090,172 | |
| | | | | | | |
| | |
| | |
Percentages are stated as a percent of net assets. |
|
(a) | Non-income producing security. |
| |
(b) | Illiquid security. |
| |
(c) | Security fair valued in accordance with procedures approved by the Board of Trustees. These securities comprised 0.4% of the Fund’s net assets. |
| |
(d) | Includes securities pledged as collateral for line of credit outstanding on April 30, 2012. |
| |
AB—Aktiebolag is the Swedish equivalent of the term corporation. |
| |
ADR—American Depositary Receipt |
|
AG—Aktiengesellschaft is a German term that refers to a corporation that is limited by shares, i.e., owned by shareholders. |
|
PLC—Public Limited Company |
|
SA—Generally designates corporations in various countries, mostly those employing the civil law. |
The accompanying notes are an integral part of these financial statements.
51
|
Alpine Accelerating Dividend Fund |
| |
Schedule of Portfolio Investments
April 30, 2012 (Unaudited)
| | | | | | | |
Shares | | Security
Description | | Value | |
| | | | | | |
| | | | | | | |
Common Stocks—94.6% | | | | |
Aerospace & Defense—2.0% | | | | |
| 700 | | Ceradyne, Inc. | | $ | 17,724 | |
| 450 | | United Technologies Corp. | | | 36,738 | |
| | | | | | | |
| | | | | | 54,462 | |
| | | | | | | |
Beverages—3.4% | | | | |
| 600 | | Anheuser-Busch InBev NV—ADR | | | 43,572 | |
| 750 | | PepsiCo, Inc. | | | 49,500 | |
| | | | | | | |
| | | | | | 93,072 | |
| | | | | | | |
Biotechnology—1.6% | | | | |
| 600 | | Amgen, Inc. | | | 42,666 | |
| | | | | | | |
Capital Markets—2.8% | | | | |
| 2,700 | | FXCM, Inc.—Class A | | | 31,266 | |
| 5,000 | | Och-Ziff Capital Management
Group, LLC—Class A | | | 43,900 | |
| | | | | | | |
| | | | | | 75,166 | |
| | | | | | | |
Chemicals—2.8% | | | | |
| 400 | | Air Products & Chemicals, Inc. | | | 34,196 | |
| 975 | | Potash Corp. of
Saskatchewan, Inc. | | | 41,418 | |
| | | | | | | |
| | | | | | 75,614 | |
| | | | | | | |
Commercial Banks—4.7% | | | | |
| 2,500 | | Financial Institutions, Inc. | | | 42,300 | |
| 6,200 | | Huntington Bancshares, Inc. | | | 41,478 | |
| 650 | | PNC Financial Services Group, Inc. | | | 43,108 | |
| | | | | | | |
| | | | | | 126,886 | |
| | | | | | | |
Communications Equipment—3.5% | | | | |
| 2,175 | | Cisco Systems, Inc. | | | 43,826 | |
| 800 | | QUALCOMM, Inc. | | | 51,072 | |
| | | | | | | |
| | | | | | 94,898 | |
| | | | | | | |
Computers & Peripherals—1.3% | | | | |
| 1,400 | | Hewlett-Packard Co. | | | 34,664 | |
| | | | | | | |
Diversified Financial Services—2.1% | | | | |
| 800 | | Citigroup, Inc. | | | 26,432 | |
| 1,250 | | The NASDAQ OMX
Group, Inc. (a) | | | 30,712 | |
| | | | | | | |
| | | | | | 57,144 | |
| | | | | | | |
Energy Equipment & Services—2.6% | | | | |
| 700 | | Bristow Group, Inc. | | | 34,195 | |
| 500 | | Schlumberger, Ltd. | | | 37,070 | |
| | | | | | | |
| | | | | | 71,265 | |
| | | | | | | |
Food & Staples Retailing—1.5% | | | | |
| 1,150 | | Walgreen Co. | | | 40,319 | |
| | | | | | | |
Food Products—3.5% | | | | |
| 1,250 | | General Mills, Inc. | | | 48,613 | |
| 570 | | The J.M. Smucker Co. | | | 45,389 | |
| | | | | | | |
| | | | | | 94,002 | |
| | | | | | | |
Gas Utilities—3.1% | | | | |
| 1,150 | | Atmos Energy Corp. | | | 37,467 | |
| 1,550 | | UGI Corp. | | | 45,229 | |
| | | | | | | |
| | | | | | 82,696 | |
| | | | | | | |
Health Care Equipment & Supplies—3.2% | | | | |
| 600 | | Becton, Dickinson & Co. | | | 47,070 | |
| 1,200 | | Hill-Rom Holdings, Inc. | | | 38,940 | |
| | | | | | | |
| | | | | | 86,010 | |
| | | | | | | |
| | | | | | | |
Shares | | Security
Description | | Value | |
| | | | | | |
| | | | | | | |
Common Stocks—continued | | | | |
Health Care Providers & Services—2.4% | | | | |
| 850 | | Aetna, Inc. | | $ | 37,434 | |
| 500 | | UnitedHealth Group, Inc. | | | 28,075 | |
| | | | | | | |
| | | | | | 65,509 | |
| | | | | | | |
Hotels, Restaurants & Leisure—1.5% | | | | |
| 1,275 | | Carnival Corp. | | | 41,425 | |
| | | | | | | |
Household Durables—0.9% | | | | |
| 10,500 | | PDG Realty SA Empreendimentos
e Participacoes | | | 24,788 | |
| | | | | | | |
Household Products—1.6% | | | | |
| 700 | | The Procter & Gamble Co. | | | 44,548 | |
| | | | | | | |
Industrial Conglomerates—1.3% | | | | |
| 400 | | 3M Co. | | | 35,744 | |
| | | | | | | |
Insurance—1.3% | | | | |
| 1,700 | | Montpelier Re Holdings, Ltd. | | | 34,884 | |
| | | | | | | |
IT Services—3.4% | | | | |
| 230 | | International Business
Machines Corp. | | | 47,628 | |
| 350 | | Visa, Inc.—Class A | | | 43,043 | |
| | | | | | | |
| | | | | | 90,671 | |
| | | | | | | |
Machinery—3.3% | | | | |
| 500 | | Dover Corp. | | | 31,330 | |
| 550 | | Robbins & Myers, Inc. | | | 26,790 | |
| 500 | | Snap—On, Inc. | | | 31,270 | |
| | | | | | | |
| | | | | | 89,390 | |
| | | | | | | |
Media—4.6% | | | | |
| 1,200 | | CBS Corp.—Class B | | | 40,020 | |
| 1,550 | | Comcast Corp.—Class A | | | 47,012 | |
| 1,600 | | SES SA | | | 38,313 | |
| | | | | | | |
| | | | | | 125,345 | |
| | | | | | | |
Metals & Mining—0.8% | | | | |
| 1,000 | | Vale SA—ADR | | | 22,200 | |
| | | | | | | |
Multi-Utilities—3.1% | | | | |
| 900 | | OGE Energy Corp. | | | 48,564 | |
| 1,300 | | Xcel Energy, Inc. | | | 35,178 | |
| | | | | | | |
| | | | | | 83,742 | |
| | | | | | | |
Oil, Gas & Consumable Fuels—8.9% | | | | |
| 4,785 | | Cairn Energy PLC | | | 26,698 | |
| 350 | | Chevron Corp. | | | 37,296 | |
| 600 | | ConocoPhillips | | | 42,978 | |
| 1,800 | | Crosstex Energy LP | | | 32,040 | |
| 450 | | Devon Energy Corp. | | | 31,433 | |
| 360 | | Occidental Petroleum Corp. | | | 32,839 | |
| 1,100 | | Suncor Energy, Inc. | | | 36,344 | |
| | | | | | | |
| | | | | | 239,628 | |
| | | | | | | |
Pharmaceuticals—3.9% | | | | |
| 800 | | Abbott Laboratories | | | 49,648 | |
| 1,200 | | Teva Pharmaceutical
Industries, Ltd.—ADR | | | 54,888 | |
| | | | | | | |
| | | | | | 104,536 | |
| | | | | | | |
Professional Services—1.0% | | | | |
| 1,200 | | VSE Corp. | | | 26,400 | |
| | | | | | | |
The accompanying notes are an integral part of these financial statements.
52
|
Alpine Accelerating Dividend Fund |
| |
Schedule of Portfolio Investments—Continued
April 30, 2012 (Unaudited)
| | | | | | | |
Shares | | Security
Description | | Value | |
| | | | | | |
| | | | | | | |
Common Stocks—continued | | | | |
Real Estate Investment Trusts—3.3% | | | | |
| 700 | | American Tower Corp. | | $ | 45,906 | |
| 2,600 | | Colony Financial, Inc. | | | 44,174 | |
| | | | | | | |
| | | | | | 90,080 | |
| | | | | | | |
Road & Rail—1.3% | | | | |
| 1,700 | | Marten Transport, Ltd. | | | 35,819 | |
| | | | | | | |
Semiconductors & Semiconductor Equipment—5.1% | | | | |
| 1,250 | | Avago Technologies, Ltd. | | | 43,100 | |
| 1,700 | | Intel Corp. | | | 48,280 | |
| 1,400 | | Linear Technology Corp. | | | 45,794 | |
| | | | | | | |
| | | | | | 137,174 | |
| | | | | | | |
Software—4.4% | | | | |
| 1,500 | | Microsoft Corp. | | | 48,030 | |
| 1,450 | | Oracle Corp. | | | 42,616 | |
| 1,500 | | Totvs SA | | | 29,234 | |
| | | | | | | |
| | | | | | 119,880 | |
| | | | | | | |
Specialty Retail—1.4% | | | | |
| 750 | | Dick’s Sporting Goods, Inc. | | | 37,950 | |
| | | | | | | |
| | | | | | | |
Shares | | Security
Description | | Value | |
| | | | | | |
| | | | | | | |
Common Stocks—continued | | | | |
Textiles, Apparel & Luxury Goods—3.0% | | | | |
| 360 | | NIKE, Inc.—Class B | | $ | 40,273 | |
| 270 | | VF Corp. | | | 41,054 | |
| | | | | | | |
| | | | | | 81,327 | |
| | | | | | | |
| | | Total Common Stocks
(Cost $2,301,175) | | | 2,559,904 | |
| | | | | | | |
| | | | | | | |
Principal
Amount | | | | | | |
| | | | | | | |
| | | | | | | |
Short-Term Investments—6.1% | | | | |
$ | 166,000 | | State Street Eurodollar
Time Deposit, 0.01% | | | 166,000 | |
| | | | | | | |
| | | Total Short-Term Investments
(Cost $166,000) | | | 166,000 | |
| | | | | | | |
| | | Total Investments
(Cost $2,467,175)—100.7% (b) | | | 2,725,904 | |
| | | Liabilities in Excess of | | | | |
| | | Other Assets—(0.7)% | | | (18,451) | |
| | | | | | | |
| | | TOTAL NET ASSETS 100.0% | | $ | 2,707,453 | |
| | | | | | | |
| | |
| | |
Percentages are stated as a percent of net assets. |
| |
(a) | Non-income producing security. |
| |
(b) | Includes securities pledged as collateral for line of credit outstanding on April 30, 2012. |
| |
ADR—American Depositary Receipt |
|
NV—Naamloze Vennootschap is the Dutch term for a public limited liability corporation. |
|
PLC—Public Limited Company |
|
SA—Generally designates corporations in various countries, mostly those employing the civil law. |
The accompanying notes are an integral part of these financial statements.
53
|
Alpine Financial Services Fund |
| |
Schedule of Portfolio Investments
April 30, 2012 (Unaudited)
| | | | | | | |
Shares | | Security
Description | | Value | |
| | | | | | |
| | | | |
Common Stocks—87.4% | | | | |
Capital Markets—10.5% | | | | |
| 20,000 | | BGC Partners, Inc.—Class A | | $ | 139,400 | |
| 52,033 | | Cowen Group, Inc.—Class A (a) | | | 131,123 | |
| 18,500 | | GFI Group, Inc. | | | 61,050 | |
| 40,000 | | Gleacher & Co., Inc. (a) | | | 41,600 | |
| 13,000 | | JMP Group, Inc. | | | 96,330 | |
| 2,000 | | Och-Ziff Capital Management
Group, LLC—Class A | | | 17,560 | |
| 65,259 | | Rodman & Renshaw Capital
Group, Inc. (a) | | | 47,639 | |
| 1,705 | | SWS Group, Inc. (a) | | | 9,616 | |
| 20,000 | | The Blackstone Group LP | | | 271,200 | |
| | | | | | | |
| | | | | | 815,518 | |
| | | | | | | |
Commercial Banks—50.0% | | | | |
| 45,165 | | 1st United Bancorp, Inc. (a) | | | 273,700 | |
| 3,000 | | American River Bankshares (a) | | | 21,840 | |
| 48,940 | | Bank of Commerce Holdings | | | 208,484 | |
| 5,000 | | Bank of Georgia Holdings PLC (a) | | | 87,637 | |
| 45,737 | | Bank of Virginia (a) | | | 38,190 | |
| 13,428 | | Barclays PLC | | | 47,562 | |
| 15,000 | | California United Bank (a) | | | 164,100 | |
| 93,069 | | Carolina Trust Bank (a) | | | 232,672 | |
| 12,493 | | Centerstate Banks, Inc. | | | 100,444 | |
| 36,627 | | Citizens First Corp. (a) | | | 302,173 | |
| 7,095 | | Comerica, Inc. | | | 227,182 | |
| 4,700 | | Community National Bank of
the Lakeway Area (a)(b) | | | 15,675 | |
| 3,002 | | Fidelity Southern Corp. | | | 25,487 | |
| 4,000 | | First Business Financial
Services, Inc. | | | 90,840 | |
| 72,700 | | First California Financial
Group, Inc. (a) | | | 396,942 | |
| 1,000 | | FirstMerit Corp. | | | 16,800 | |
| 100 | | Middleburg Financial Corp. | | | 1,635 | |
| 21,000 | | Mitsubishi UFJ Financial
Group, Inc. | | | 101,791 | |
| 7,400 | | National Bank of Greece
SA—ADR (a) | | | 16,872 | |
| 10,200 | | New Century Bancorp, Inc. (a) | | | 44,064 | |
| 400 | | North Valley Bancorp (a) | | | 5,032 | |
| 2,375 | | Old Point Financial Corp. | | | 25,579 | |
| 4,000 | | Oriental Financial Group, Inc. | | | 47,280 | |
| 24,642 | | Pacific Mercantile Bancorp (a) | | | 147,113 | |
| 18,276 | | Pacific Premier Bancorp, Inc. (a) | | | 142,187 | |
| 75,000 | | Republic First Bancorp, Inc. (a) | | | 162,000 | |
| 3,120 | | Rurban Financial Corp. (a) | | | 14,976 | |
| 38,750 | | Southern National Bancorp
of Virginia, Inc. | | | 267,375 | |
| 3,000 | | Sumitomo Mitsui Financial
Group, Inc. | | | 97,094 | |
| 6,000 | | Summit State Bank | | | 37,440 | |
| 152,347 | | Synovus Financial Corp. | | | 319,929 | |
| 5,000 | | The Savannah Bancorp, Inc. (a) | | | 25,500 | |
| 2,551 | | Valley Commerce Bancorp (a)(b) | | | 25,497 | |
| 32,000 | | VTB Bank OJSC—GDR (a)(c) | | | 134,112 | |
| 1,974 | | Yadkin Valley Financial Corp. (a) | | | 6,435 | |
| | | | | | | |
| | | | | | 3,871,639 | |
| | | | | | | |
| | | | | | | |
Shares | | Security
Description | | Value | |
| | | | | | |
| | | | |
Common Stocks—continued | | | | |
Consumer Finance—3.2% | | | | |
| 2,000 | | Ezcorp, Inc.—Class A (a) | | $ | 53,580 | |
| 1,000 | | Green Dot Corp.—Class A (a) | | | 26,390 | |
| 25,000 | | Imperial Holdings, Inc. (a) | | | 95,750 | |
| 9,000 | | Netspend Holdings, Inc. (a) | | | 68,670 | |
| | | | | | | |
| | | | | | 244,390 | |
| | | | | | | |
Diversified Financial Services—12.6% |
| 7,124 | | BM&F Bovespa SA | | | 40,065 | |
| 1,100 | | BTG Pactual Participations, Ltd. (a) | | | 17,653 | |
| 665 | | CME Group, Inc. | | | 176,770 | |
| 162,000 | | Dubai Financial Market (a) | | | 49,840 | |
| 3,115 | | IntercontinentalExchange, Inc. (a) | | | 414,419 | |
| 4,000 | | NYSE Euronext | | | 103,000 | |
| 7,000 | | The NASDAQ OMX Group, Inc. (a) | | | 171,990 | |
| | | | | | | |
| | | | | | 973,737 | |
| | | | | | | |
Industrial Conglomerates—1.8% | | | | |
| 7,000 | | General Electric Co. | | | 137,060 | |
| | | | | | | |
Thrifts & Mortgage Finance—9.3% | | | | |
| 17,105 | | Alliance Bancorp, Inc.
of Pennsylvania | | | 198,418 | |
| 5,000 | | Central Federal Corp. (a) | | | 2,800 | |
| 2,144 | | Fidelity Bancorp, Inc. | | | 23,423 | |
| 5,895 | | First Pactrust Bancorp, Inc. | | | 64,786 | |
| 40,000 | | Flagstar Bancorp, Inc. (a) | | | 34,816 | |
| 8,823 | | HopFed Bancorp, Inc. | | | 78,437 | |
| 29,751 | | Provident Financial Holdings, Inc. | | | 321,013 | |
| | | | | | | |
| | | | | | 723,693 | |
| | | | | | | |
| | | Total Common Stocks
(Cost $8,955,770) | | | 6,766,037 | |
| | | | | | | |
Preferred Stocks—0.5% | | | | |
Commercial Banks—0.5% | | | | |
| 13,000 | | Banco Industrial e Comercial SA | | | 40,784 | |
| | | | | | | |
| | | Total Preferred Stocks
(Cost $92,416) | | | 40,784 | |
| | | | | | | |
Investment Companies—3.4% | | | | |
| 12,200 | | Direxion Daily Financial Bear
3X Shares (a) | | | 258,762 | |
| | | | | | | |
| | | Total Investment Companies
(Cost $310,703) | | | 258,762 | |
| | | | | | | |
| | | | | | | |
Principal
Amount | | | | | | |
| | | | | | | |
Short-Term Investments—8.0% | | | | |
$ | 622,000 | | State Street Eurodollar
Time Deposit, 0.01% | | | 622,000 | |
| | | | | | | |
| | | Total Short-Term Investments
(Cost $622,000) | | | 622,000 | |
| | | | | | | |
| | | Total Investments
(Cost $9,980,889)—99.3% (d) | | | 7,687,583 | |
| | | Other Assets in Excess
of Liabilities—0.7% | | | 57,306 | |
| | | | | | | |
| | | TOTAL NET ASSETS 100.0% | | $ | 7,744,889 | |
| | | | | | | |
The accompanying notes are an integral part of these financial statements.
54
|
Alpine Financial Services Fund |
| |
Schedule of Portfolio Investments—Continued
April 30, 2012 (Unaudited)
| | |
| | |
Percentages are stated as a percent of net assets. |
|
(a) | Non-income producing security. |
| |
(b) | Illiquid security. |
| |
(c) | Restricted under Rule 144A of the Securities Act of 1933. These securities may be resold in transactions exempt from registration, normally to qualified institutional buyers. These securities have been determined to be liquid under guidelines established by the Board of Trustees. Liquid securities restricted under Rule 144A comprised 1.7% of the Fund’s net assets. |
| |
(d) | Includes securities pledged as collateral for line of credit outstanding on April 30, 2012. |
|
ADR—American Depositary Receipt |
|
GDR—Global Depositary Receipt |
|
OJSC—Open Joint Stock Company |
|
PLC—Public Limited Company |
|
SA—Generally designates corporations in various countries, mostly those employing the civil law. |
The accompanying notes are an integral part of these financial statements.
55
Schedule of Portfolio Investments
April 30, 2012 (Unaudited)
| | | | | | | |
Shares | | Security
Description | | Value | |
| | | | | | |
| | | | |
Common Stocks—86.4% | | | | |
Auto Components—1.2% | | | | |
| 2,000 | | BorgWarner, Inc. (a) | | $ | 158,080 | |
| | | | | | | |
Biotechnology—2.6% | | | | |
| 12,500 | | ARIAD Pharmaceuticals, Inc. (a) | | | 203,750 | |
| 5,000 | | Myriad Genetics, Inc. (a) | | | 130,050 | |
| | | | | | | |
| | | | | | 333,800 | |
| | | | | | | |
Commercial Banks—1.5% | | | | |
| 8,000 | | SunTrust Banks, Inc. | | | 194,240 | |
| | | | | | | |
Commercial Services & Supplies—1.3% | | | | |
| 6,000 | | Copart, Inc. (a) | | | 158,460 | |
| | | | | | | |
Communications Equipment—0.9% | | | | |
| 4,000 | | Acme Packet, Inc. (a) | | | 112,280 | |
| | | | | | | |
Computers & Peripherals—4.6% | | | | |
| 500 | | Apple, Inc. (a) | | | 292,120 | |
| 15,000 | | Cray, Inc. (a) | | | 167,250 | |
| 5,000 | | Hewlett-Packard Co. | | | 123,800 | |
| | | | | | | |
| | | | | | 583,170 | |
| | | | | | | |
Diversified Financial Services—1.7% | | | | |
| 800 | | CME Group, Inc. | | | 212,656 | |
| | | | | | | |
Electronic Equipment, Instruments & Components—6.7% | | | | |
| 11,000 | | FLIR Systems, Inc. | | | 247,060 | |
| 12,434 | | InvenSense, Inc. (a) | | | 199,939 | |
| 7,000 | | Itron, Inc. (a) | | | 285,600 | |
| 6,975 | | MOCON, Inc. | | | 124,364 | |
| | | | | | | |
| | | | | | 856,963 | |
| | | | | | | |
Energy Equipment & Services—0.7% | | | | |
| 25,000 | | Electromagnetic GeoServices (a) | | | 79,068 | |
| 10,833 | | Polarcus, Ltd. (a) | | | 11,168 | |
| | | | | | | |
| | | | | | 90,236 | |
| | | | | | | |
Health Care Equipment & Supplies—9.2% | | | | |
| 10,000 | | Endologix, Inc. (a) | | | 149,800 | |
| 1,400 | | Intuitive Surgical, Inc. (a) | | | 809,480 | |
| 5,000 | | MAKO Surgical Corp. (a) | | | 206,550 | |
| | | | | | | |
| | | | | | 1,165,830 | |
| | | | | | | |
Health Care Providers & Services—7.1% | | | | |
| 17,000 | | Bio-Reference Labs, Inc. (a) | | | 362,440 | |
| 5,000 | | HMS Holdings Corp. (a) | | | 120,300 | |
| 6,000 | | MEDNAX, Inc. (a) | | | 421,440 | |
| | | | | | | |
| | | | | | 904,180 | |
| | | | | | | |
Health Care Technology—1.5% | | | | |
| 3,228 | | Allscripts Healthcare
Solutions, Inc. (a) | | | 35,766 | |
| 4,000 | | Quality Systems, Inc. | | | 149,600 | |
| | | | | | | |
| | | | | | 185,366 | |
| | | | | | | |
| | | | | | | |
Shares | | Security
Description | | Value | |
| | | | | | |
| | | | | | | |
Common Stocks—continued | | | | |
Household Durables—2.6% | | | | |
| 25,000 | | Zagg, Inc. (a) | | $ | 325,750 | |
| | | | | | | |
Internet & Catalog Retail—18.0% | | | | |
| 40 | | Amazon.com, Inc. (a) | | | 9,276 | |
| 3,000 | | priceline.com, Inc. (a) | | | 2,282,460 | |
| | | | | | | |
| | | | | | 2,291,736 | |
| | | | | | | |
Internet Software & Services—3.3% | | | | |
| 700 | | Google, Inc.—Class A (a) | | | 423,661 | |
| | | | | | | |
Leisure Equipment & Products—0.9% | | | | |
| 1,500 | | Polaris Industries, Inc. | | | 119,160 | |
| | | | | | | |
Life Sciences Tools & Services—4.9% | | | | |
| 1,000 | | Bio-Rad Laboratories,
Inc.—Class A (a) | | | 107,990 | |
| 11,000 | | Life Technologies Corp. (a) | | | 509,960 | |
| | | | | | | |
| | | | | | 617,950 | |
| | | | | | | |
Machinery—4.6% | | | | |
| 12,500 | | Commercial Vehicle Group, Inc. (a) | | | 133,000 | |
| 3,900 | | Flowserve Corp. | | | 448,227 | |
| | | | | | | |
| | | | | | 581,227 | |
| | | | | | | |
Personal Products—0.1% | | | | |
| 200 | | Herbalife, Ltd. | | | 14,064 | |
| | | | | | | |
Pharmaceuticals—1.4% | | | | |
| 8,000 | | The Medicines Co. (a) | | | 176,720 | |
| | | | | | | |
Semiconductors & Semiconductor Equipment—1.4% | | | | |
| 6,000 | | Veeco Instruments, Inc. (a) | | | 181,140 | |
| | | | | | | |
Software—10.2% | | | | |
| 16,400 | | ANSYS, Inc. (a) | | | 1,099,948 | |
| 10,000 | | Callidus Software, Inc. (a) | | | 79,200 | |
| 20,600 | | Mitek Systems, Inc. (a) | | | 116,596 | |
| | | | | | | |
| | | | | | 1,295,744 | |
| | | | | | | |
| | | Total Common Stocks
(Cost $7,783,107) | | | 10,982,413 | |
| | | | | | | |
| | | | | | | |
Principal
Amount | | | | | | |
| | | | | | | |
Short-Term Investments—14.6% | | | | |
$ | 1,849,000 | | State Street Eurodollar
Time Deposit, 0.01% | | | 1,849,000 | |
| | | | | | | |
| | | Total Short-Term Investments
(Cost $1,849,000) | | | 1,849,000 | |
| | | | | | | |
| | | Total Investments
(Cost $9,632,107)—101.0% (b) | | | 12,831,413 | |
| | | Liabilities in Excess of
Other Assets—(1.0)% | | | (127,971 | ) |
| | | | | | | |
| | | TOTAL NET ASSETS 100.0% | | $ | 12,703,442 | |
| | | | | | | |
| | |
| | |
| |
Percentages are stated as a percent of net assets. |
| |
(a) | Non-income producing security. |
| |
(b) | Includes securities pledged as collateral for line of credit outstanding on April 30, 2012. |
The accompanying notes are an integral part of these financial statements.
56
|
Alpine Transformations Fund |
| |
Schedule of Portfolio Investments
April 30, 2012 (Unaudited)
| | | | | | | |
Shares | | Security
Description | | Value | |
| | | | | | |
| | | | | | | |
Common Stocks—87.4% | | | | |
Air Freight & Logistics—2.3% | | | | |
| 2,000 | | FedEx Corp. | | $ | 176,480 | |
| | | | | | | |
Auto Components—0.9% | | | | |
| 5,000 | | Amerigon, Inc. (a) | | | 71,500 | |
| | | | | | | |
Chemicals—4.5% | | | | |
| 2,500 | | Ashland, Inc. | | | 164,675 | |
| 13,000 | | Flotek Industries, Inc. (a) | | | 177,320 | |
| | | | | | | |
| | | | | | 341,995 | |
| | | | | | | |
Commercial Banks—0.9% | | | | |
| 1,991 | | Wells Fargo & Co. | | | 66,559 | |
| | | | | | | |
Computers & Peripherals—5.2% | | | | |
| 400 | | Apple, Inc. (a) | | | 233,696 | |
| 14,758 | | Cray, Inc. (a) | | | 164,552 | |
| | | | | | | |
| | | | | | 398,248 | |
| | | | | | | |
Diversified Financial Services—1.1% | | | | |
| 10,000 | | Bank of America Corp. | | | 81,100 | |
| | | | | | | |
Electronic Equipment, Instruments
& Components—0.9% | | | | |
| 5,000 | | Corning, Inc. | | | 71,750 | |
| | | | | | | |
Energy Equipment & Services—6.6% | | | | |
| 2,000 | | CARBO Ceramics, Inc. | | | 168,180 | |
| 25,000 | | Electromagnetic GeoServices (a) | | | 79,068 | |
| 8,000 | | ION Geophysical Corp. (a) | | | 49,840 | |
| 2,000 | | National Oilwell Varco, Inc. | | | 151,520 | |
| 10,833 | | Polarcus, Ltd. (a) | | | 11,168 | |
| 1,000 | | Transocean, Ltd. | | | 50,390 | |
| | | | | | | |
| | | | | | 510,166 | |
| | | | | | | |
Health Care Equipment & Supplies—9.7% | | | | |
| 2,000 | | Edwards Lifesciences Corp. (a) | | | 165,940 | |
| 1,000 | | Intuitive Surgical, Inc. (a) | | | 578,200 | |
| | | | | | | |
| | | | | | 744,140 | |
| | | | | | | |
Health Care Technology—0.1% | | | | |
| 728 | | Allscripts Healthcare
Solutions, Inc. (a) | | | 8,066 | |
| | | | | | | |
Hotels, Restaurants & Leisure—3.0% | | | | |
| 4,000 | | Starbucks Corp. | | | 229,520 | |
| | | | | | | |
Household Durables—11.6% | | | | |
| 5,000 | | Garmin, Ltd. | | | 235,650 | |
| 6,500 | | Helen of Troy, Ltd. (a) | | | 224,900 | |
| 4,000 | | Tempur-Pedic International,
Inc. (a) | | | 235,360 | |
| 15,000 | | Zagg, Inc. (a) | | | 195,450 | |
| | | | | | | |
| | | | | | 891,360 | |
| | | | | | | |
Industrial Conglomerates—2.6% | | | | |
| 10,300 | | General Electric Co. | | | 201,674 | |
| | | | | | | |
Internet & Catalog Retail—7.9% | | | | |
| 800 | | priceline.com, Inc. (a) | | | 608,656 | |
| | | | | | | |
| | | | | | | |
Shares | | Security
Description | | Value | |
| | | | | | |
| | | | | | | |
Common Stocks—continued | | | | |
Internet Software & Services—1.6% | | | | |
| 200 | | Google, Inc.—Class A (a) | | $ | 121,046 | |
| | | | | | | |
Leisure Equipment & Products—1.6% | | | | |
| 1,500 | | Polaris Industries, Inc. | | | 119,160 | |
| | | | | | | |
Machinery—9.8% | | | | |
| 12,500 | | Commercial Vehicle Group, Inc. (a) | | | 133,000 | |
| 2,400 | | Cummins, Inc. | | | 277,992 | |
| 7,000 | | Manitex International, Inc. (a) | | | 66,710 | |
| 3,000 | | Snap-On, Inc. | | | 187,620 | |
| 10,000 | | Wabash National Corp. (a) | | | 83,700 | |
| | | | | | | |
| | | | | | 749,022 | |
| | | | | | | |
Metals & Mining—1.3% | | | | |
| 1,500 | | Walter Energy, Inc. | | | 99,465 | |
| | | | | | | |
Multi-Utilities—1.7% | | | | |
| 10,000 | | Just Energy Group, Inc. | | | 131,498 | |
| | | | | | | |
Multiline Retail—2.6% | | | |
| 2,000 | | Dollar Tree, Inc. (a) | | | 203,320 | |
| | | | | | | |
Oil, Gas & Consumable Fuels—2.2% | | | | |
| 372 | | Apache Corp. | | | 35,690 | |
| 15,000 | | Kodiak Oil & Gas Corp. (a) | | | 132,750 | |
| | | | | | | |
| | | | | | 168,440 | |
| | | | | | | |
Real Estate Investment Trusts (REITs)—0.3% | | | | |
| 1,102 | | Walter Investment
Management Corp. | | | 22,293 | |
| | | | | | | |
Software—9.0% | | | | |
| 15,000 | | Callidus Software, Inc. (a) | | | 118,800 | |
| 20,600 | | Mitek Systems, Inc. (a) | | | 116,596 | |
| 5,000 | | Nuance Communications, Inc. (a) | | | 122,200 | |
| 5,000 | | Oracle Corp. | | | 146,950 | |
| 4,000 | | SolarWinds, Inc. (a) | | | 187,640 | |
| | | | | | | |
| | | | | | 692,186 | |
| | | | | | | |
| | | Total Common Stocks
(Cost $5,153,623) | | | 6,707,644 | |
| | | | | | | |
| | | | | | | |
Principal | | | | | | |
Amount | | | | | | |
| | | | | | | |
Short-Term Investments—12.5% | | | | |
$ | 959,000 | | State Street Eurodollar
Time Deposit, 0.01% | | | 959,000 | |
| | | | | | | |
| | | Total Short-Term Investments
(Cost $959,000) | | | 959,000 | |
| | | | | | | |
| | | Total Investments
(Cost $6,112,623)—99.9% (b) | | | 7,666,644 | |
| | | Other Assets in Excess
of Liabilities—0.1% | | | 10,567 | |
| | | | | | | |
| | | TOTAL NET ASSETS 100.0% | | $ | 7,677,211 | |
| | | | | | | |
| | |
| | |
| |
Percentages are stated as a percent of net assets. |
| |
(a) | Non-income producing security. |
| |
(b) | Includes securities pledged as collateral for line of credit outstanding on April 30, 2012. |
The accompanying notes are an integral part of these financial statements.
57
Schedule of Portfolio Investments
April 30, 2012 (Unaudited)
| | | | | | | |
Shares | | Security
Description | | Value | |
| | | | | | |
| | | | |
Common Stocks—72.6% | | | | |
Aerospace & Defense—1.5% | | | | |
| 10,000 | | Honeywell International, Inc. | | $ | 606,600 | |
| 5,000 | | The Boeing Co. | | | 384,000 | |
| | | | | | | |
| | | | | | 990,600 | |
| | | | | | | |
Auto Components—3.4% | | | | |
| 30,500 | | Autoliv, Inc. | | | 1,913,570 | |
| 20,000 | | Cooper Tire & Rubber Co. | | | 299,000 | |
| | | | | | | |
| | | | | | 2,212,570 | |
| | | | | | | |
Beverages—0.6% | | | | |
| 5,000 | | Anheuser-Busch InBev NV—ADR | | | 363,100 | |
| | | | | | | |
Capital Markets—1.8% | | | | |
| 25,900 | | State Street Corp. | | | 1,197,098 | |
| | | | | | | |
Chemicals—3.2% | | | | |
| 20,000 | | E.I. duPont de Nemours & Co. | | | 1,069,200 | |
| 12,000 | | Eastman Chemical Co. | | | 647,640 | |
| 10,000 | | The Dow Chemical Co. | | | 338,800 | |
| | | | | | | |
| | | | | | 2,055,640 | |
| | | | | | | |
Commercial Banks—4.6% | | | | |
| 5,000 | | PNC Financial Services Group, Inc. | | | 331,600 | |
| 8,262 | | Southside Bancshares, Inc. | | | 168,554 | |
| 35,000 | | Sun Bancorp, Inc. (a) | | | 101,150 | |
| 7,293 | | Susquehanna Bancshares, Inc. | | | 75,628 | |
| 33,075 | | Valley National Bancorp | | | 416,745 | |
| 10,000 | | Washington Trust Bancorp, Inc. | | | 236,700 | |
| 59,501 | | Webster Financial Corp. | | | 1,352,458 | |
| 10,432 | | Wells Fargo & Co. | | | 348,742 | |
| | | | | | | |
| | | | | | 3,031,577 | |
| | | | | | | |
Computers & Peripherals—1.4% | | | | |
| 1,000 | | Apple, Inc. (a) | | | 584,240 | |
| 14,000 | | Hewlett-Packard Co. | | | 346,640 | |
| | | | | | | |
| | | | | | 930,880 | |
| | | | | | | |
Containers & Packaging—0.4% | | | | |
| 30,000 | | Boise, Inc. | | | 229,200 | |
| | | | | | | |
Diversified Financial Services—5.8% | | | | |
| 63,041 | | Bank of America Corp. | | | 511,262 | |
| 14,367 | | Citigroup, Inc. | | | 474,686 | |
| 2,600 | | CME Group, Inc. | | | 691,132 | |
| 45,600 | | JPMorgan Chase & Co. | | | 1,959,888 | |
| 15,406 | | Medallion Financial Corp. | | | 168,388 | |
| | | | | | | |
| | | | | | 3,805,356 | |
| | | | | | | |
Diversified Telecommunication Services—0.7% | | | | |
| 66,185 | | TeliaSonera AB | | | 442,428 | |
| | | | | | | |
Electric Utilities—0.7% | | | | |
| 7,200 | | Entergy Corp. | | | 472,032 | |
| | | | | | | |
Electrical Equipment—2.9% | | | | |
| 22,500 | | AMETEK, Inc. | | | 1,132,425 | |
| 8,700 | | Preformed Line Products Co. | | | 502,251 | |
| 4,000 | | Regal-Beloit Corp. | | | 270,560 | |
| | | | | | | |
| | | | | | 1,905,236 | |
| | | | | | | |
Electronic Equipment, Instruments &
Components—0.4% | | | | |
| 20,000 | | Corning, Inc. | | | 287,000 | |
| | | | | | | |
Food & Staples Retailing—2.1% | | | | |
| 15,000 | | CVS Caremark Corp. | | | 669,300 | |
| 20,000 | | Walgreen Co. | | | 701,200 | |
| | | | | | | |
| | | | | | 1,370,500 | |
| | | | | | | |
| | | | | | | |
Shares | | Security
Description | | Value | |
| | | | | | |
| |
Common Stocks—continued | | | | |
Food Products—0.8% | | | | |
| 10,000 | | H.J. Heinz Co. | | $ | 533,100 | |
| | | | | | | |
Health Care Equipment & Supplies—1.0% | | | | |
| 8,600 | | Becton, Dickinson & Co. | | | 674,670 | |
| | | | | | | |
Health Care Providers & Services—1.4% | | | | |
| 20,000 | | HCA Holdings, Inc. | | | 538,400 | |
| 4,000 | | McKesson Corp. | | | 365,640 | |
| | | | | | | |
| | | | | | 904,040 | |
| | | | | | | |
Hotels, Restaurants & Leisure—0.8% | | | |
| 10,000 | | Darden Restaurants, Inc. | | | 500,800 | |
| | | | | | | |
Household Durables—1.2% | | | | |
| 28,000 | | Lennar Corp.—Class A | | | 776,720 | |
| | | | | | | |
Household Products—0.6% | | | | |
| 4,000 | | Colgate-Palmolive Co. | | | 395,760 | |
| | | | | | | |
Industrial Conglomerates—2.9% | | | | |
| 5,000 | | 3M Co. | | | 446,800 | |
| 74,600 | | General Electric Co. | | | 1,460,668 | |
| | | | | | | |
| | | | | | 1,907,468 | |
| | | | | | | |
Insurance—0.6% | | | | |
| 5,000 | | The Chubb Corp. | | | 365,350 | |
| | | | | | | |
IT Services—3.7% | | | |
| 5,000 | | Accenture PLC—Class A | | | 324,750 | |
| 10,000 | | International Business
Machines Corp. | | | 2,070,800 | |
| | | | | | | |
| | | | | | 2,395,550 | |
| | | | | | | |
Leisure Equipment & Products—0.6% | | | | |
| 10,000 | | Hasbro, Inc. | | | 367,400 | |
| | | | | | | |
Machinery—2.1% | | | | |
| 5,000 | | Caterpillar, Inc. | | | 513,850 | |
| 7,000 | | Joy Global, Inc. | | | 495,390 | |
| 4,000 | | Stanley Black & Decker, Inc. | | | 292,640 | |
| 10,000 | | Wabash National Corp. (a) | | | 83,700 | |
| | | | | | | |
| | | | | | 1,385,580 | |
| | | | | | | |
Media—0.4% | | | | |
| 7,692 | | CBS Corp.—Class B | | | 256,528 | |
| | | | | | | |
Multi-Utilities—1.0% | | | | |
| 50,000 | | Just Energy Group, Inc. | | | 657,488 | |
| | | | | | | |
Multiline Retail—0.6% | | | | |
| 10,000 | | Macy’s, Inc. | | | 410,200 | |
| | | | | | | |
Oil, Gas & Consumable Fuels—5.1% | | | | |
| 6,000 | | Cenovus Energy, Inc. | | | 217,500 | |
| 59,000 | | CONSOL Energy, Inc. | | | 1,961,160 | |
| 8,000 | | El Paso Pipeline Partners LP | | | 270,960 | |
| 20,000 | | Penn Virginia Corp. | | | 102,400 | |
| 17,547 | | World Fuel Services Corp. | | | 773,121 | |
| | | | | | | |
| | | | | | 3,325,141 | |
| | | | | | | |
Pharmaceuticals—4.6% | | | | |
| 7,000 | | Abbott Laboratories | | | 434,420 | |
| 10,000 | | Eli Lilly & Co. | | | 413,900 | |
| 27,000 | | Johnson & Johnson | | | 1,757,430 | |
| 8,000 | | Teva Pharmaceutical
Industries, Ltd.—ADR | | | 365,920 | |
| | | | | | | |
| | | | | | 2,971,670 | |
| | | | | | | |
The accompanying notes are an integral part of these financial statements.
58
Schedule of Portfolio Investments—Continued
April 30, 2012 (Unaudited)
| | | | | | | |
Shares | | Security
Description | | Value | |
| | | | | | |
| | | | | | | |
Common Stocks—continued | | | | |
Real Estate Investment Trusts—11.6% | | | | |
| 13,000 | | Boston Properties, Inc. | | $ | 1,407,250 | |
| 100,000 | | CBL & Associates Properties, Inc. | | | 1,863,000 | |
| 13,804 | | DDR Corp. | | | 204,299 | |
| 5,669 | | ProLogis, Inc. | | | 202,837 | |
| 23,823 | | Simon Property Group, Inc. | | | 3,706,859 | |
| 20,000 | | Two Harbors Investment Corp. | | | 209,200 | |
| | | | | | | |
| | | | | | 7,593,445 | |
| | | | | | | |
Road & Rail—1.1% | | | | |
| 10,000 | | Norfolk Southern Corp. | | | 729,300 | |
| | | | | | | |
Textiles, Apparel & Luxury Goods—1.6% | | | | |
| 5,000 | | PVH Corp. | | | 444,000 | |
| 4,000 | | VF Corp. | | | 608,200 | |
| | | | | | | |
| | | | | | 1,052,200 | |
| | | | | | | |
Thrifts & Mortgage Finance—0.4% | | | | |
| 21,500 | | New York Community
Bancorp, Inc. | | | 290,035 | |
| | | | | | | |
Trading Companies & Distributors—1.0% | | | | |
| 3,000 | | WW Grainger, Inc. | | | 623,460 | |
| | | | | | | |
| | | Total Common Stocks
(Cost $41,573,636) | | | 47,409,122 | |
| | | | | | | |
| | | | | | | |
Principal
Amount | | Security
Description | | Value | |
| | | | | | |
| | | | | | | |
Bonds—21.4% | | | | |
U.S. Treasury Bonds—21.4% | | | | |
$ | 6,000,000 | | 6.000%, 02/15/2026 | | $ | 8,535,936 | |
| 4,000,000 | | 5.250%, 11/15/2028 | | | 5,419,376 | |
| | | | | | | |
| | | | | | 13,955,312 | |
| | | | | | | |
| | | Total Bonds
(Cost $11,945,579) | | | 13,955,312 | |
| | | | | | | |
Short-Term Investments—5.5% | | | | |
| 3,601,000 | | State Street Eurodollar
Time Deposit, 0.01% | | | 3,601,000 | |
| | | | | | | |
| | | Total Short-Term Investments
(Cost $3,601,000) | | | 3,601,000 | |
| | | | | | | |
| | | Total Investments
(Cost $57,120,215)—99.5% | | | 64,965,434 | |
| | | Other Assets in Excess
of Liabilities—0.5% | | | 351,786 | |
| | | | | | | |
| | | TOTAL NET ASSETS 100.0% | | $ | 65,317,220 | |
| | | | | | | |
| | |
| | |
| |
Percentages are stated as a percent of net assets. |
| |
(a) | Non-income producing security. |
| |
AB—Aktiebolag is the Swedish equivalent of the term corporation. |
|
ADR—American Depositary Receipt |
|
NV—Naamloze Vennootschap is the Dutch term for a public limited liability corporation. |
|
PLC—Public Limited Company |
The accompanying notes are an integral part of these financial statements.
59
|
Alpine Ultra Short Tax Optimized Income Fund |
| |
Schedule of Portfolio Investments
April 30, 2012 (Unaudited)
| | | | | | | |
Principal
Amount | | Security
Description | | Value | |
| | | | | | |
|
Municipal Bonds—98.6% | | | | |
Alabama—3.0% | | | | |
$ | 425,000 | | Bessemer Board of Education,
School Tax Warrants—Series A
(CS: Assured Guaranty Municipal)
2.000%, 02/01/2013 | | $ | 428,205 | |
| 2,370,000 | | Birmingham Airport Authority
Airport Revenue
(CS: AMBAC)
5.000%, 07/01/2012 | | | 2,382,916 | |
| 4,500,000 | | Chatom Industrial Development
Board Gulf Opportunity Zone
Revenue, Powersouth Energy
Cooperative—Series A, VRDN
(SPA: National Rural Utilities
Finance)
0.950%, 11/15/2038
(Putable on 05/15/2012) (a) | | | 4,500,495 | |
| 2,000,000 | | Chatom Industrial Development
Board Pollution Control
Revenue, Electric—Series C, VRDN
(SPA: National Rural Utilities
Finance)
0.950%, 12/01/2024
(Putable on 06/01/2012) (a) | | | 2,000,240 | |
| 6,280,000 | | Jefferson County Sewer Revenue
Capital Improvement
Warrants—Series D
5.000%, 02/01/2032 | | | 6,349,394 | |
| 1,150,000 | | Madison Industrial Development
Board Revenue, WL Halsey
Grocery Co., VRDN
(LOC: Regions Bank)
1.320%, 04/01/2016
(Putable on 05/07/2012) (a) | | | 1,150,000 | |
| 5,915,000 | | Mobile Downtown Redevelopment
Authority Revenue, Lafayette
Plaza Hotel Project—Series A, VRDN
(LOC: Regions Bank)
0.970%, 05/01/2032
(Putable on 05/07/2012) (a) | | | 5,915,000 | |
| 20,000,000 | | Mobile Industrial Development
Board Pollution Control Revenue,
Alabama Power Co., Barry Plant,
VRDN
(CS: Alabama Power Co.)
0.750%, 07/15/2034
(Putable on 08/22/2012) (a) | | | 20,006,600 | |
| 4,009,000 | | State Housing Finance Authority
Revenue, Multi-Family Housing
Revenue, Phoenix Apartments
Project—Series A, VRDN
(LOC: Regions Bank)
1.220%, 01/01/2036
(Putable on 05/07/2012) (a) | | | 4,009,000 | |
| 5,795,000 | | The Health Care Authority for
Baptist Health—Series A, VRDN
(CS: Baptist Health)
6.125%, 11/15/2036
(Putable on 05/15/2012) (a) | | | 5,804,562 | |
| | | | | | | |
Principal
Amount | | Security
Description | | Value | |
| | | | | | |
|
Municipal Bonds—continued | | | | |
Alabama—continued | | | | |
$ | 2,325,000 | | The Medical Clinic Board of the
City of Gulf Shores Revenue,
Colonial Pinnacle MOB Project,
VRDN
(LOC: Regions Bank)
0.870%, 07/01/2034
(Putable on 05/07/2012) (a) | | $ | 2,325,000 | |
| | | | | | | |
| | | | | | 54,871,412 | |
| | | | | | | |
Arizona—1.7% | | | | |
| 14,400,000 | | Cochise County Pollution Control
Corp., Revenue, Arizona Electric
Power Cooperative, Inc., Project,
VRDN
(CS: National Rural Utilities Corp.)
0.650%, 09/01/2024 (Putable on 09/01/2012) (a) | | | 14,400,000 | |
| 4,120,000 | | Coconino County Pollution Control
Corp., Revenue, Arizona Public
Services Navajo—Series A
(CS: Arizona Public Service Corp.)
3.625%, 10/01/2029
(Putable on 07/13/2013) | | | 4,200,834 | |
| 325,000 | | Flagstaff, Aspen Place Sawmill
Improvement District
(CS: Flagstaff Arizona Revenue)
5.000%, 01/01/2013 | | | 326,105 | |
| 3,300,000 | | Maricopa County Pollution
Control Corp., Arizona Public
Services Co.—Series B
(CS: Arizona Public Service Corp.)
5.500%, 05/01/2029 | | | 3,300,000 | |
| 8,250,000 | | Navajo County Pollution Control
Corp.,—Series A
(CS: Arizona Public Service Corp.)
5.000%, 06/01/2034
(Putable on 06/01/2012) | | | 8,278,628 | |
| 400,000 | | University Medical Center Corp.,
Hospital Revenue
3.000%, 07/01/2012 | | | 401,592 | |
| | | | | | | |
| | | | | | 30,907,159 | |
| | | | | | | |
Arkansas—0.8% | | | | |
| 5,180,000 | | Pulaski County Public Facilities
Board Revenue, Anthony
School, VRDN
(LOC: Regions Bank)
0.970%, 06/01/2033
(Putable on 05/07/2012) (a) | | | 5,180,000 | |
| 4,350,000 | | Pulaski County Public Facilities
Board Revenue, Valley Heights
Apartments II—Series C, VRDN
(LOC: Regions Bank)
1.220%, 04/01/2040
(Putable on 05/07/2012) (a) | | | 4,350,000 | |
| 5,200,000 | | State Development Finance
Authority, Capri
Apartments—Series F, VRDN
(LOC: Regions Bank)
1.220%, 10/01/2030
(Putable on 05/07/2012) (a) | | | 5,200,000 | |
| | | | | | | |
| | | | | | 14,730,000 | |
| | | | | | | |
The accompanying notes are an integral part of these financial statements.
60
|
Alpine Ultra Short Tax Optimized Income Fund |
| |
Schedule of Portfolio Investments—Continued
April 30, 2012 (Unaudited)
| | | | | | | |
Principal
Amount | | Security
Description | | Value | |
| | | | | | |
|
Municipal Bonds—continued | | | | |
California—6.7% | | | | |
$ | 280,000 | | ABAG Finance Authority for
Nonprofit Corp., Revenue,
Episcopal Senior Communities
3.000%, 07/01/2012 | | $ | 280,585 | |
| 15,450,000 | | Los Angeles County Schools
Pooled Financing Program—
Series B-5
(CS: GO of Participants)
2.000%, 01/31/2013 | | | 15,593,685 | |
| 1,500,000 | | Los Angeles County Schools
Pooled Financing Program—
Series B-6
(CS: GO of Participants)
2.000%, 01/31/2013 | | | 1,511,130 | |
| 7,000,000 | | Moreno Valley Unified School
District, Tax and Revenue
Anticipation Notes
2.500%, 10/01/2012 | | | 7,051,170 | |
| 7,125,000 | | Palomar Pomerado Health
Care—Series A, ARN
(CS: Assured Guaranty)
0.580%, 11/01/2036 (a) | | | 7,125,000 | |
| 1,450,000 | | Palomar Pomerado Health
Care—Series B, ARN
(CS: Assured Guaranty)
0.590%, 11/01/2036 (a) | | | 1,450,000 | |
| 7,850,000 | | Palomar Pomerado Health
Care—Series C, ARN
(CS: Assured Guaranty)
0.590%, 11/01/2036 (a) | | | 7,850,000 | |
| 10,475,000 | | State Municipal Finance
Authority Revenue, St.
Andrews Parish, VRDN
(LOC: Allied Irish Bank PLC)
5.300%, 09/01/2036
(Putable on 05/07/2012) (a) | | | 10,475,000 | |
| 49,805,000 | | State Pollution Control Finance
Authority Solid Waste Revenue,
Republic Services, Inc.—Series A,
VRDN (CS: Republic Services, Inc.)
0.650%, 08/01/2023 (Putable on
08/01/2012) (a) | | | 49,805,000 | |
| 3,000,000 | | State Pollution Control Financing
Authority, Solid Waste Disposal
Revenue, P & D Dairy and Poso
Creek Family Dairy, LLC Project,
VRDN (LOC: Bank of the West)
1.750%, 05/01/2028
(Putable on 05/07/2012) (a) | | | 3,000,000 | |
| 4,500,000 | | The City of Los Angeles
Multifamily Housing Revenue,
Masselin Manor Project—
Series J, VRDN
(LOC: Bank of America)
0.750%, 07/01/2015
(Putable on 05/07/2012) (a) | | | 4,500,000 | |
| | | | | | | |
Principal
Amount | | Security
Description | | Value | |
| | | | | | |
|
Municipal Bonds—continued | | | | |
California—continued | | | | |
| | | Twin Rivers Unified School District,
School Facilities Boarding Program
(CS: Assured Guaranty) | | | | |
$ | 10,000,000 | | 3.500%, 06/01/2027
(Putable on 05/31/2013) | | $ | 10,025,200 | |
| 5,000,000 | | 3.500%, 06/01/2035
(Putable on 05/01/2013) | | | 5,012,600 | |
| | | | | | | |
| | | | | | 123,679,370 | |
| | | | | | | |
Colorado—0.2% | | | | |
| 4,000,000 | | City & County of Denver Airport
System Revenue—Series E
5.250%, 11/15/2014 | | | 4,099,760 | |
| 350,000 | | State Health Facilities Authority
Revenue, National Jewish
Health Project
4.000%, 01/01/2014 | | | 362,187 | |
| | | | | | | |
| | | | | | 4,461,947 | |
| | | | | | | |
Connecticut—0.3% | | | | |
| 6,250,000 | | Town of Hamden, General
Obligation Bond, Anticipation
Notes—Lot A
3.000%, 08/23/2012 | | | 6,302,375 | |
| | | | | | | |
District of Columbia—0.8% | | | | |
| 15,000,000 | | State Revenue, National
Association of Realtors Issue—
Series A, VRDN
(LOC: SunTrust Bank)
0.470%, 04/01/2024
(Putable on 05/07/2012) (a) | | | 15,000,000 | |
| | | | | | | |
Florida—3.4% | | | | |
| 7,690,000 | | Broward County Housing
Finance Authority, Golf View
Gardens Apartments, VRDN
(LOC: Regions Bank)
1.450%, 11/01/2043
(Putable on 05/07/2012) (a) | | | 7,690,000 | |
| 1,000,000 | | Citizens Property Insurance Corp.
Revenue, High-Risk Account
Senior Secured Bonds—Series A3,
VRDN
2.000%, 06/01/2013 (a) | | | 1,007,630 | |
| 6,700,000 | | Citizens Property Insurance Corp.,
Revenue, High-Risk Account—A-1
(CS: Citizens Property Ins. Corp)
5.000%, 06/01/2012 | | | 6,723,919 | |
| 22,850,000 | | Citizens Property Insurance Corp.,
Coastal Account Revenue, Senior
Secured Notes—Series A-2
(CS: Citizens Property Ins. Corp)
2.000%, 06/01/2012 | | | 22,880,847 | |
| 250,000 | | Cityplace Community Development
District Special Assessment Revenue
5.000%, 05/01/2013 | | | 259,035 | |
| 5,130,000 | | Lee County Housing Finance
Authority Revenue, Heron Pond
Apartments, VRDN
(LOC: Regions Bank
1.450%, 12/01/2043
(Putable on 05/07/2012) (a) | | | 5,130,000 | |
The accompanying notes are an integral part of these financial statements.
61
|
Alpine Ultra Short Tax Optimized Income Fund |
| |
Schedule of Portfolio Investments—Continued
April 30, 2012 (Unaudited)
| | | | | | | |
Principal
Amount | | Security
Description | | Value | |
| | | | | | |
|
Municipal Bonds—continued | | | | |
Florida—continued | | | | |
$ | 7,760,000 | | Miami-Dade County Industrial
Development Authority Revenue,
Airbus Service Co., Inc.—Series A,
VRDN
(LOC: Calyon Bank)
2.300%, 04/01/2030
(Putable on 05/07/2012) (a) | | $ | 7,760,000 | |
| 1,000,000 | | Miami-Dade County Industrial
Development Authority Revenue,
Waste Management, Inc., VRDN
(CS: Waste Management, Inc.)
2.625%, 08/01/2023
(Putable on 08/01/2014) (a) | | | 1,024,060 | |
| 5,185,000 | | Miami-Dade County State
Aviation—Series C
(CS: MBIA)
5.250%, 10/01/2012 | | | 5,201,955 | |
| 800,000 | | Saint Johns County Industrial
Development Authority, Coastal
Health Care Investor, VRDN
(LOC: SunTrust Bank)
2.750%, 12/01/2016
(Putable on 05/07/2012) (a) | | | 800,000 | |
| 4,400,000 | | Sarasota County Health Facilities
Authority Revenue, Bay Village
of Sarasota, Inc. Project, VRDN
(LOC: Bank of America N.A.)
0.530%, 12/01/2023
(Putable on 05/07/2012) (a) | | | 4,400,000 | |
| | | State Higher Educational Facilities
Financing Authority Revenue,
The University of Tampa
Project—Series A | | | | |
| 250,000 | | 3.000%, 04/01/2013 | | | 254,660 | |
| 300,000 | | 4.000%, 04/01/2014 | | | 314,715 | |
| | | | | | | |
| | | | | | 63,446,821 | |
| | | | | | | |
Georgia—2.7% | | | | |
| 7,190,000 | | Albany-Dougherty County
Hospital Authority, Refunding
Anticipation Certificates,
Phoebe Putney Memorial—
Series B, VRDN
(LOC: Regions Bank)
0.600%, 09/01/2032
(Putable on 05/01/2012) (a) | | | 7,190,000 | |
| 11,240,000 | | Burke County Development
Authority Revenue, Georgia
Power Company Plant Vogtle
Project—Series A
(CS: Oglethorpe Power Corp)
2.500%, 01/01/2040
(Putable on 03/01/2013) | | | 11,387,918 | |
| 3,875,000 | | Burke County Development
Authority Revenue, Georgia
Power Company Plant Vogtle
Project—Series G
(CS: Oglethorpe Power Corp)
0.900%, 01/01/2039
(Putable on 03/01/2013) | | | 3,875,000 | |
| | | | | | | |
Principal
Amount | | Security
Description | | Value | |
| | | | | | |
|
Municipal Bonds—continued | | | | |
Georgia—continued | | | | |
$ | 1,200,000 | | Douglas County Development
Authority Revenue, Electrical
Fiber Systems, VRDN
(LOC: Regions Bank)
1.320%, 12/01/2021
(Putable on 05/07/2012) (a) | | $ | 1,200,000 | |
| 2,405,000 | | Gainesville & Hall County
Development Authority Tax-
Exempt Revenue, Atex, Inc.,
Project, VRDN
(LOC: Regions Bank)
1.270%, 09/01/2023
(Putable on 05/07/2012) (a) | | | 2,405,000 | |
| 11,525,000 | | Gwinnett County Housing Authority Multi-Family
Housing Revenue, Palisades
Apartments Project, VRDN
(LOC: SunTrust Bank)
0.650%, 03/01/2041
(Putable on 05/07/2012) (a) | | | 11,525,000 | |
| 2,010,000 | | Monroe County Development
Authority Revenue, Georgia
Power Company Plant Scherer
Project—Series A
(CS: Oglethorpe Power Corp)
0.900%, 01/01/2039
(Putable on 03/01/2013) | | | 2,010,000 | |
| 1,850,000 | | Rome-Floyd County Development
Authority Revenue, Steel King
Industries Inc., VRDN
(LOC: BMO Harris Bank N.A.)
0.890%, 07/01/2020
(Putable on 05/07/2012) (a) | | | 1,850,000 | |
| 215,000 | | Union City Water & Sewerage
Revenue 2.000%, 07/01/2013 | | | 217,675 | |
| 9,430,000 | | Walker Dade & Catoosa Counties
Hospital Authority, Anticipation
Certificates, Hutcheson Medical,
VRDN
(LOC: Regions Bank)
0.870%, 10/01/2028
(Putable on 05/07/2012) (a) | | | 9,430,000 | |
| | | | | | | |
| | | | | | 51,090,593 | |
| | | | | | | |
Illinois—6.1% | | | | |
| 800,000 | | Chicago Transit Authority
Capital Grant Receipts Revenue
(CS: AMBAC)
5.000%, 06/01/2013 | | | 834,744 | |
| 26,760,000 | | Crestwood Tax Increment
Revenue, 135th & Cicero
Redevelopment, VRDN
(LOC: Fifth Third Bank)
0.400%, 12/01/2023
(Putable on 05/07/2012) (a) | | | 26,760,000 | |
| 4,400,000 | | Springfield Airport Authority,
Allied-Signal Inc., VRDN
(CS: Honeywell Int.)
6.500%, 09/01/2018
(Putable on 05/07/2012) (a) | | | 4,400,000 | |
The accompanying notes are an integral part of these financial statements.
62
|
Alpine Ultra Short Tax Optimized Income Fund |
| |
Schedule of Portfolio Investments—Continued
April 30, 2012 (Unaudited)
| | | | | | | |
Principal
Amount | | Security
Description | | Value | |
| | | | | | |
|
Municipal Bonds—continued | | | | |
Illinois—continued | | | | |
$ | 8,850,000 | | State Finance Authority Industrial
Development Revenue, Lutheran
Home & Services, VRDN
(LOC: Allied Irish Bank PL
4.480%, 08/15/2031
(Putable on 05/07/2012) (a) | | $ | 8,850,000 | |
| 3,000,000 | | State Finance Authority Solid
Waste Revenue, Waste
Management, Inc., Project, VRDN
(CS: Waste Management, Inc.)
1.125%, 04/01/2013
(Putable on 10/01/2012) (a) | | | 3,008,550 | |
| 66,300,000 | | State General Obligation Bond
Unlimited—Series B, VRDN
(SPA: DEPFA Bank PLC)
2.850%, 10/01/2033
(Putable on 05/07/2012) (a) | | | 66,300,000 | |
| 3,400,000 | | State of Illinois General Obligation
5.000%, 03/01/2013 | | | 3,520,700 | |
| | | | | | | |
| | | | | | 113,673,994 | |
| | | | | | | |
Indiana—4.2% | | | | |
| 60,000,000 | | Reset Optional Certificates
Trust II—R Revenue, VRDN
(LIQ FAC/Guaranty Agreement:
CitiGroup Financial)
1.500%, 10/26/2017
(Putable on 05/07/2012) (a) | | | 60,000,000 | |
| 10,000,000 | | State Finance Authority Economic
Development Revenue, Republic
Services, Inc.,—Series A, VRDN
(CS: Republic Services, Inc.)
0.600%, 05/01/2034
(Putable on 06/01/2012) (a) | | | 9,999,900 | |
| 7,310,000 | | State Finance Authority Revenue,
Education Facilities Obligation
Group Project, VRDN
(LOC: Allied Irish Bank PLC)
3.500%, 06/01/2038
(Putable on 05/07/2012) (a) | | | 7,310,000 | |
| 1,000,000 | | The City of Indianapolis
Industrial Development Revenue,
Joint Clutch Service, VRDN
(LOC: PNC Bank N.A.)
1.490%, 12/01/2014 (a) | | | 1,000,000 | |
| | | | | | | |
| | | | | | 78,309,900 | |
| | | | | | | |
Iowa—1.9% | | | | |
| 940,000 | | Coralville General Obligation
Annual Appropriation,
Refunding Urban Renewal—
Series D-1 (CS: Coralville, VA)
2.000%, 06/01/2012 | | | 940,696 | |
| 35,000,000 | | State Finance Authority
Midwestern Disaster Area
Economic Development Revenue,
CJ Bio America Inc. Project, VRDN
(LOC: Korea Development Bank)
0.650%, 04/01/2022
(Putable on 05/07/2012) (a) | | | 35,000,000 | |
| | | | | | | |
| | | | | | 35,940,696 | |
| | | | | | | |
| | | | | | | |
Principal
Amount | | Security
Description | | Value | |
| | | | | | |
|
Municipal Bonds—continued | | | | |
Kansas—0.1% | | | | |
$ | 1,000,000 | | City of Dodge City Industrial
Development Revenue,
Farmland National Beef
Packing Co., L.P., Project, VRDN
(LOC: Rabobank International)
1.750%, 03/01/2027
(Putable on 05/07/2012) (a) | | $ | 1,000,000 | |
| 1,000,000 | | City of Liberal Industrial
Development Revenue,
Farmland National Beef
Packing Co., L.P., Project, VRDN
(LOC: Rabobank International)
1.750%, 02/01/2029 (Putable on 05/07/2012) (a) | | | 1,000,000 | |
| | | | | | | |
| | | | | | 2,000,000 | |
| | | | | | | |
Kentucky—1.1% | | | | |
| 1,835,000 | | Fort Mitchell Industrial Building
Revenue, Grandview/Hemmer,
VRDN
(LOC: PNC Bank N.A.)
1.500%, 08/01/2016
(Putable on 08/01/2012) (a) | | | 1,835,000 | |
| 2,000,000 | | Lexington-Fayette Urban County
Government Revenue, Richmond
Place Associates, L.P Project, VRDN
(LOC: Bank of America N.A.)
1.200%, 04/01/2015
(Putable on 04/01/2013) (a) | | | 2,000,000 | |
| 5,000,000 | | Pikeville Educational Facilities
Revenue, Bond Anticipation
Notes 4.000%, 05/01/2013 | | | 5,064,850 | |
| 6,900,000 | | Pulaski County Solid Waste
Disposal Revenue, National
Rural Utilities-East Kentucky
Power—Series B, VRDN
(CS: National Rural Utilities Corp.)
0.650%, 08/15/2023
(Putable on 08/15/2012) (a) | | | 6,900,138 | |
| 4,105,000 | | State Economic Development
Finance Authority Solid Waste
Revenue, Republic Services, Inc.
Project—Series A, VRDN
(CS: Republic Services, Inc.)
0.600%, 04/01/2031
(Putable on 06/01/2012) (a) | | | 4,105,041 | |
| | | | | | | |
| | | | | | 19,905,029 | |
| | | | | | | |
Louisiana—4.8% | | | | |
| 15,000,000 | | Ascension Parish Industrial
Development Board Inc.
Revenue, Impala Warehousing
(US) LLC Project, VRDN
(LOC: Natixis)
1.130%, 12/01/2041
(Putable on 05/07/2012) (a) | | | 15,000,000 | |
| 425,000 | | Donaldsonville Industrial
Development Revenue, Chef
John Folse & Co., Inc., VRDN
(LOC: Regions Bank)
3.730%, 04/01/2023
(Putable on 05/07/2012) (a) | | | 425,000 | |
The accompanying notes are an integral part of these financial statements.
63
|
Alpine Ultra Short Tax Optimized Income Fund |
| |
Schedule of Portfolio Investments—Continued
April 30, 2012 (Unaudited)
| | | | | | | |
Principal
Amount | | Security
Description | | Value | |
| | | | | | |
|
Municipal Bonds—continued | | | | |
Louisiana—continued | | | | |
$ | 5,000,000 | | Donaldsonville Industrial
Development Revenue,
Chef John Folse & Co., Inc.,—
Series A, VRDN
(LOC: Regions Bank)
3.730%, 02/01/2027
(Putable on 05/07/2012) (a) | | $ | 5,000,000 | |
| 500,000 | | Jefferson Parish Hospital District
No. 1 Hospital Revenue, West
Jefferson Medical Center—
Series A 2.100%, 01/01/2013 | | | 503,315 | |
| 4,600,000 | | Jefferson Parish Industrial
Development Board Revenue,
Sara Lee Corp., VRDN
1.990%, 06/01/2024
(Putable on 05/01/2012) (a) | | | 4,600,000 | |
| 1,930,000 | | North Webster Parish Industrial
Development Revenue, CSP
Project, VRDN
(LOC: Regions Bank)
3.380%, 09/01/2021
(Putable on 05/07/2012) (a) | | | 1,930,000 | |
| 2,105,000 | | Ouachita Parish Industrial
Development Board, Garrett
Manufacturing LLC, VRDN
(LOC: Regions Bank)
1.270%, 12/01/2016
(Putable on 05/07/2012) (a) | | | 2,105,000 | |
| 20,000,000 | | Plaquemines Port Harbor &
Terminal District Revenue,
International Marine Terminal—
Series A, VRDN
(LOC: Wells Fargo Bank N.A.)
1.280%, 03/15/2025
(Putable on 09/24/2012) (a) | | | 20,000,000 | |
| 250,000 | | State Citizens Property Insurance
Corp. Assessment Revenue,
2.000%, 06/01/2014 | | | 253,317 | |
| 2,050,000 | | State Housing Finance Agency
Revenue, Multifamily Housing
Restoration—Series A, VRDN
(LOC: Regions Bank)
1.270%, 12/01/2032
(Putable on 05/07/2012) (a) | | | 2,050,000 | |
| 33,400,000 | | State Municipal Natural Gas
Purchasing and Distribution
Authority Revenue—
Series 1411Q, VRDN
(LOC/LIQ FAC: JPMorgan
Chase & Co.) 0.370%, 08/01/2016
(Putable on 05/07/2012) (a) | | | 33,400,000 | |
| 2,850,000 | | State Public Facilities Authority
Revenue, Equipment & Capital
Facilities Pooled—Loan B, VRDN
(CS: Capital One, LOC: Hibernia
National Bank) 1.500%, 07/01/2033
(Putable on 05/07/2012) (a) | | | 2,850,000 | |
| | | | | | | |
Principal
Amount | | Security
Description | | Value | |
| | | | | | |
|
Municipal Bonds—continued | | | | |
Louisiana—continued | | | | |
$ | 1,520,000 | | State Public Facilities Authority
Revenue, Equipment & Capital
Facilities Pooled—Series B,
VRDN
(CS: Capital One; LOC:
Hibernia National Bank)
1.500%, 07/01/2033
(Putable on 05/07/2012) (a) | | $ | 1,520,000 | |
| | | | | | | |
| | | | | | 89,636,632 | |
| | | | | | | |
Maryland—0.9% | | | | |
| 1,750,000 | | Howard County Economic
Development Revenue, Eight P
CPL, LLC, Project, VRDN
(LOC: Sovereign Bank FSB, Banco
Santander SA) 2.120%, 12/01/2015
(Putable on 05/07/2012) (a) | | | 1,750,000 | |
| 14,930,000 | | State Health & Higher Educational
Facilities Authority Revenue,
Woodmont Academy, VRDN
(LOC: Allied Irish Bank PLC)
3.500%, 07/01/2038
(Putable on 05/07/2012) (a) | | | 14,930,000 | |
| | | | | | | |
| | | | | | 16,680,000 | |
| | | | | | | |
Massachusetts—0.1% | | | | |
| 2,250,000 | | State Development Finance
Agency, Waste Management,
Inc.,—Series B
(CS: Waste Management, Inc.)
3.400%, 12/01/2029
(Putable on 12/01/2012) (a) | | | 2,282,333 | |
| | | | | | | |
Michigan—1.8% | | | | |
| 1,240,000 | | City of Detroit School District,
School Building and Site
Improvement Refunding—Series A
(CS: Qualified School Board Loan
Fund) 3.000%, 05/01/2013 | | | 1,265,594 | |
| | | State Finance Authority Revenue,
Detroit School District
(CS: Detroit CSD) | | | | |
| 12,570,000 | | 4.000%, 06/01/2012 | | | 12,593,631 | |
| 10,355,000 | | 5.000%, 06/01/2013 | | | 10,691,227 | |
| 555,000 | | State Housing Development
Authority Revenue—Series A
1.450%, 11/01/2012 | | | 555,599 | |
| 1,570,000 | | State Strategic Fund Limited
Obligation Revenue, Industrial
Development Bank Real Estate
Project, VRDN
(LOC: Fifth Third Bank)
0.450%, 12/01/2023
(Putable on 05/07/2012) (a) | | | 1,570,000 | |
| 3,000,000 | | State Strategic Fund Limited
Obligations Revenue, Detroit
Education Court
(CS: Detroit Edison Co.)
3.050%, 08/01/2024
(Putable on 12/03/2012) | | | 3,024,270 | |
The accompanying notes are an integral part of these financial statements.
64
|
Alpine Ultra Short Tax Optimized Income Fund |
| |
Schedule of Portfolio Investments—Continued
April 30, 2012 (Unaudited)
| | | | | | | |
Principal
Amount | | Security
Description | | Value | |
| | | | | | |
|
Municipal Bonds—continued | | | | |
Michigan—continued | | | | |
$ | 800,000 | | State Strategic Fund Limited
Obligations Revenue, Press-
Way, Inc., VRDN
0.650%, 05/01/2018
(Putable on 05/07/2012) (a) | | $ | 800,000 | |
| | | State Strategic Fund Limited
Obligations Revenue, Waste
Management, Inc.
(CS: Waste Management, Inc.) | | | | |
| 1,500,000 | | 3.200%, 08/01/2027
(Putable on 08/01/2013) | | | 1,537,500 | |
| 1,910,000 | | 4.625%, 12/01/2012 | | | 1,945,526 | |
| | | | | | | |
| | | | | | 33,983,347 | |
| | | | | | | |
Minnesota—0.1% | | | | |
| 2,540,000 | | City of Eden Prairie Multifamily
Housing Revenue, Eden Prairie
Leased Housing Associates I,
Limited Partnership Project—
Series A, VRDN
(LOC: Bank of America N.A.)
0.650%, 03/01/2036
(Putable on 05/07/2012) (a) | | | 2,540,000 | |
| | | | | | | |
Mississippi—0.9% | | | | |
| 5,500,000 | | State Business Finance Corp., Gulf
Opportunity Zone Revenue,
Coast Electric Power Association—
Series C, VRDN
(SPA: National Rural Utilities
Cooperative Finance Corp.)
0.600%, 05/01/2037
(Putable on 11/01/2012) (a) | | | 5,500,000 | |
| 6,495,000 | | State Business Finance Corp.,
Hattiesburg Clinic Professional
Association Project, VRDN
(LOC: Regions Bank)
0.870%, 11/01/2026
(Putable on 05/07/2012) (a) | | | 6,495,000 | |
| 5,040,000 | | State Business Finance Corp.,
Tri-State Truck Center, Inc.,
Project, VRDN
(LOC: Regions Bank)
0.970%, 03/01/2033
(Putable on 05/07/2012) (a) | | | 5,040,000 | |
| | | | | | | |
| | | | | | 17,035,000 | |
| | | | | | | |
Missouri—0.5% | | | | |
| 7,400,000 | | City of Brentwood Refunding
Revenue, 8300 Eager Road
Project Phase 1—Series A, VRDN
(LOC: Compass Bank)
1.500%, 11/01/2023
(Putable on 05/07/2012) (a) | | | 7,400,000 | |
| 250,000 | | Joplin Industrial Development
Authority Health Facilities
Revenue, Freeman Health System
2.500%, 02/15/2013 | | | 251,938 | |
| | | | | | | |
Principal
Amount | | Security
Description | | Value | |
| | | | | | |
|
Municipal Bonds—continued | | | | |
Missouri—continued | | | | |
$ | 1,500,000 | | State Health & Educational Facilities
Authority Revenue, Private
Education Working Capital Loan
Program—Series B
(CS: Rockhurst University)
3.000%, 04/25/2013 | | $ | 1,515,960 | |
| | | | | | | |
| | | | | | 9,167,898 | |
| | | | | | | |
Nebraska—0.1% | | | | |
| | | Central Plains Energy Project, Gas
Project Revenue (Project No. 3) | | | | |
| 500,000 | | 3.000%, 09/01/2013 | | | 510,085 | |
| 655,000 | | 4.000%, 09/01/2014 | | | 688,307 | |
| | | | | | | |
| | | | | | 1,198,392 | |
| | | | | | | |
Nevada—0.3% | | | | |
| 5,350,000 | | Clark County Airport System
Subordinate Lien Revenue—
Series C-3, VRDN (LOC: Landesbank Baden-
Wurttemberg)
0.750%, 07/01/2029
(Putable on 05/07/2012) (a) | | | 5,350,000 | |
| | | | | | | |
New Jersey—7.0% | | | | |
| 10,000,000 | | City of Newark General
Improvement Bond
Anticipation Notes—Series B
3.500%, 12/13/2012 | | | 10,084,500 | |
| 14,000,000 | | City of Newark Tax Anticipation
Notes—Series A
2.400%, 02/20/2013 | | | 14,044,520 | |
|
|
| 4,625,000 | | Gloucester County Improvement
Authority, Waste Management,
Inc.,—Series A
(CS: Waste Management, Inc.)
2.625%, 12/01/2029
(Putable on 12/03/2012) | | | 4,677,262 | |
| 1,000,000 | | Gloucester County Improvement
Authority, Waste Management,
Inc.,—Series B
(CS: Waste Management, Inc.)
3.375%, 12/01/2029
(Putable on 12/03/2012) | | | 1,014,360 | |
| 665,000 | | Jersey City Municipal Utilities
Authority Revenue—Series A
(CS: Assured Guaranty)
3.000%, 10/15/2012 | | | 669,755 | |
| 3,000,000 | | State Economic Development
Authority Cigarette Tax Revenue,
5.000%, 06/15/2013 | | | 3,140,460 | |
| 1,900,000 | | State Economic Development
Authority Revenue, El Dorado
Terminals Co., Project—Series A,
VRDN
(CS: Dow Chemical Company)
0.550%, 12/01/2021
(Putable on 07/02/2012) (a) | | | 1,900,019 | |
The accompanying notes are an integral part of these financial statements.
65
|
Alpine Ultra Short Tax Optimized Income Fund |
| |
Schedule of Portfolio Investments—Continued
April 30, 2012 (Unaudited)
| | | | | | | |
Principal
Amount | | Security
Description | | Value | |
| | | | | | |
|
Municipal Bonds—continued | | | | |
New Jersey—continued | | | | |
$ | 7,775,000 | | State Economic Development
Authority Revenue, Geriatric
Services Housing Corp.,
Inc.—CNJJHA Assisted
Living Project, VRDN
(CS: Geriatric Services
Housing Corp)
0.510%, 11/01/2031
(Putable on 05/07/2012) (a) | | $ | 7,775,000 | |
| 230,000 | | State Health Care Facilities
Finance Authority Revenue,
Trinitas Hospital—Series A
(CS: Trintas Hospital)
4.750%, 07/01/2012 | | | 231,288 | |
| | | State Health Care Facilities
Financing Authority Revenue,
Barnabas Health Issues—Series A | | | | |
| 2,200,000 | | 3.000%, 07/01/2012 | | | 2,207,612 | |
| 3,035,000 | | 5.000%, 07/01/2013 | | | 3,173,305 | |
| 500,000 | | State Health Care Facilities
Financing Authority Revenue,
Meridian Health System
Obligated Group Issue
4.000%, 07/01/2013 | | | 518,330 | |
| 2,200,000 | | State Higher Education
Assistance Authority Student
Loan Revenue—Series
13.000%, 12/01/2012 | | | 2,218,766 | |
| 58,000,000 | | State Turnpike Authority
Revenue—Series D, VRDN
(LOC: Societe Generale)
1.000%, 01/01/2018
(Putable on 05/07/2012) (a) | | | 58,000,000 | |
| 580,000 | | The City of New Brunswick
Housing Authority Revenue,
Public Improvement Refunding
Bonds, Golden Triangle Project
(CS: Assured Guaranty Municipal)
1.500%, 08/01/2012 | | | 580,673 | |
| 660,000 | | Tobacco Settlement Financing Corp.
(CS: Tobacco Settlement Fund)
5.750%, 06/01/2032 | | | 662,864 | |
| 2,000,000 | | Tobacco Settlement Financing
Corp.—Series 1A
4.250%, 06/01/2012 | | | 2,005,020 | |
| 3,980,000 | | Town of Harrison Tax Anticipation
Notes, 3.375%, 02/15/2013 | | | 4,002,368 | |
| | | Township of Lyndhurst Bond
Anticipation Notes, | | | | |
| 10,000,000 | | 1.750%, 02/15/2013 | | | 10,027,000 | |
| 3,297,500 | | 1.750%, 03/21/2013 | | | 3,307,590 | |
| | | | | | | |
| | | | | | 130,240,692 | |
| | | | | | | |
New Mexico—0.3% | | | | |
| 5,000,000 | | State Hospital Equipment Loan
Council Revenue, Dialysis Clinic,
Inc., Project, VRDN
(LOC: SunTrust Bank)
0.600%, 07/01/2025
(Putable on 05/07/2012) (a) | | | 5,000,000 | |
| | | | | | | |
|
Principal
Amount | | Security
Description | | Value | |
| | | | | | |
|
Municipal Bonds—continued | | | | |
New York—17.1% | | | | |
$ | 1,700,000 | | City of Long Beach General
Obligation Bond Unlimited,
4.150%, 04/19/2013 | | $ | 1,712,750 | |
| 23,700,000 | | City of New York General
Obligation Bond Unlimited—
Subseries A-4, VRDN
(LOC: KBC Bank NV)
0.410%, 08/01/2038
(Putable on 05/01/2012) (a) | | | 23,700,000 | |
| 25,100,000 | | City of New York General
Obligation Bond Unlimited—
Subseries H-1, VRDN
0.380%, 01/01/2036
(Putable on 05/01/2012) (a) | | | 25,100,000 | |
| 34,200,000 | | Metropolitan Transportation
Authority Dedicated Tax
Fund Refunding Revenue—
Subseries B-4, VRDN
(LOC: KBC Bank NV)
0.700%, 11/01/2025
(Putable on 05/07/2012) (a) | | | 34,200,000 | |
| 7,000,000 | | Nassau County General Obligation
Notes Unlimited—Series A
2.500%, 09/30/2012 | | | 7,063,420 | |
| 29,200,000 | | New York City Municipal Water
Finance Authority Water
and Sewer System Revenue,
Second General Resolution—
Series AA-3, VRDN
(SPA: Dexia Credit Local)
0.370%, 06/15/2032
(Putable on 05/07/2012) (a) | | | 29,200,000 | |
| 42,700,000 | | New York City Transitional
Finance Authority Revenue—
Subseries 2B, VRDN
(SPA: Dexia Credit Local)
0.410%, 11/01/2022
(Putable on 05/07/2012) (a) | | | 42,700,000 | |
| | | Rockland County Revenue
Anticipation Notes—Series B | | | | |
| 995,000 | | 2.250%, 09/21/2012 | | | 998,612 | |
| 12,000,000 | | 2.500%, 09/21/2012 | | | 12,055,200 | |
| 10,000,000 | | Rockland County Revenue
Anticipation Notes,
2.500%, 03/06/2013 | | | 10,097,100 | |
| 15,000,000 | | Rockland County Tax Anticipation
Notes, 2.500%, 03/06/2013 | | | 15,139,200 | |
| 6,655,000 | | Rockland County, Bond
Anticipation Notes—Series A
2.000%, 04/19/2013 | | | 6,693,133 | |
| 15,500,000 | | Roosevelt Union Free School
District Bond, Anticipation
Notes for School Construction
2.250%, 09/27/2012 | | | 15,550,375 | |
| 3,000,000 | | State Environmental Facilities
Corp. Solid Waste Disposal
Revenue, Waste Management,
Inc. Project, VRDN
1.000%, 05/01/2030 (a) | | | 3,000,000 | |
The accompanying notes are an integral part of these financial statements.
66
|
Alpine Ultra Short Tax Optimized Income Fund |
| |
Schedule of Portfolio Investments—Continued
April 30, 2012 (Unaudited)
| | | | | | | |
Principal
Amount | | Security
Description | | Value | |
| | | | | | |
|
Municipal Bonds—continued | | | | |
New York—continued | | | | |
$ | 53,850,000 | | State Housing Finance Agency
Revenue, Related—42nd and
10th Housing—Series A, VRDN
(LOC: Landesbank Baden-
Wurttemberg)
0.600%, 11/01/2041
(Putable on 05/07/2012) (a) | | $ | 53,850,000 | |
| 25,000,000 | | Suffolk County Revenue
Anticipation Notes,
2.000%, 03/28/2013 | | | 25,271,000 | |
| 10,350,000 | | Town of Hempstead Industrial
Development Agency Revenue,
Trigen-Nassau Energy Corp., VRDN
(LOC: Societe Generale)
2.000%, 09/15/2015
(Putable on 05/07/2012) (a) | | | 10,350,000 | |
| 500,000 | | Westchester Tobacco Asset
Securitization Corp.
(CS: Westchester Tobacco)
5.000%, 06/01/2026 | | | 496,985 | |
| | | | | | | |
| | | | | | 317,177,775 | |
| | | | | | | |
North Carolina—0.8% | | | | |
| 15,000,000 | | State Capital Facilities Finance
Agency Solid Waste Disposal
Revenue, Republic Services,
Inc.,—Series B, VRDN
(CS: Republic Services, Inc.)
0.800%, 12/01/2020
(Putable on 06/01/2012) (a) | | | 14,999,550 | |
| | | | | | | |
North Dakota—0.5% | | | | |
| 10,000,000 | | State Housing Finance Agency
Revenue, Housing Finance
Program Bonds—Series B, VRDN
(SPA: KBC Bank NV)
0.900%, 07/01/2034
(Putable on 05/07/2012) (a) | | | 10,000,000 | |
| | | | | | | |
Ohio—1.6% | | | | |
| 1,575,000 | | Marysville Tax Increment
Financing Revenue, City Gate
Development—Series B
(LOC: Fifth Third Bank)
2.500%, 08/29/2012 | | | 1,579,158 | |
| 3,005,000 | | Marysville Tax Increment Financing
Revenue, Coleman’s Crossing
Development—Series A
(LOC: Fifth Third Bank)
2.500%, 08/29/2012 | | | 3,012,933 | |
| 18,800,000 | | State Housing Finance Agency
Residential Mortgage Revenue—
Series B, VRDN
(SPA: KBC Bank NV)
0.900%, 09/01/2038
(Putable on 05/07/2012) (a) | | | 18,800,000 | |
| 3,000,000 | | State Water Development Authority,
Solid Waste Revenue, VRDN
(CS: Waste Management, Inc)
4.670%, 11/01/2022
(Putable on 11/01/2012) (a) | | | 3,055,680 | |
| | | | | | | |
Principal
Amount | | Security
Description | | Value | |
| | | | | | |
|
Municipal Bonds—continued | | | | |
Ohio—continued | | | | |
$ | 2,852,000 | | Warrensville Heights Bond,
Anticipation Notes—Series 2
2.375%, 09/06/2012 | | $ | 2,866,945 | |
| | | | | | | |
| | | | | | 29,314,716 | |
| | | | | | | |
Oklahoma—3.7% | | | | |
| 67,950,000 | | State Development Finance
Authority Continuing Care
Retirement Community
Revenue, Inverness Village
Project—Series A, VRDN
(LOC: KBC Bank NV)
0.480%, 01/01/2042
(Putable on 05/07/2012) (a) | | | 67,950,000 | |
| | | | | | | |
Oregon—1.7% | | | | |
| 1,400,000 | | Gilliam County Solid Waste Disposal Revenue, Waste
Management, Inc., Project—
Series A, VRDN
(CS: Waste Management, Inc.)
2.500%, 07/01/2038
(Putable on 05/01/2017) (a) | | | 1,400,000 | |
| 500,000 | | State Facilities Authority Revenue,
Legacy Health Project—Series A
(CS: Legacy Health System)
3.000%, 05/01/2012 | | | 500,000 | |
| 29,820,000 | | State Housing & Community
Services Department Mortgage
Revenue, Single-Family Mortgage
Program—Series E, VRDN
(SPA: KBC Bank NV)
0.900%, 07/01/2038
(Putable on 05/07/2012) (a) | | | 29,820,000 | |
| | | | | | | |
| | | | | | 31,720,000 | |
| | | | | | | |
Pennsylvania—5.3% | | | | |
| 250,000 | | Allegheny County Higher
Education Building Authority
University Revenue, Chatham
University—Series A
(CS: Chatham University)
3.000%, 09/01/2013 | | | 255,440 | |
| 13,890,000 | | Cumberland County Municipal
Authority Revenue, Asbury
Pennsylvania Obligated
Group, VRDN
(LOC: KBC Bank NV)
0.480%, 01/01/2041
(Putable on 05/07/2012) (a) | | | 13,890,000 | |
| 28,515,000 | | Delaware Valley Regional Financial
Authority Revenue, Bi-Modal
Term Format, Mode 1, VRDN
(LOC: Bayerische Landesbank)
0.800%, 08/01/2016
(Putable on 05/07/2012) (a) | | | 28,515,000 | |
| 44,550,000 | | JPMorgan Chase Putters/Drivers
Trust—Series 3933, VRDN
0.420%, 06/29/2012
(Putable on 05/01/2012) (a)(b) | | | 44,550,000 | |
The accompanying notes are an integral part of these financial statements.
67
|
Alpine Ultra Short Tax Optimized Income Fund |
| |
Schedule of Portfolio Investments—Continued
April 30, 2012 (Unaudited)
| | | | | | | |
Principal
Amount | | Security
Description | | Value | |
| | | | | | |
| | | | | | | |
Municipal Bonds—continued | | | | |
Pennsylvania—continued | | | | |
$ | 2,875,000 | | Lawrence County Industrial
Development Authority
Revenue, L&N Metallurgical
Products Co., Project, VRDN
(LOC: Banque Paribas)
0.890%, 12/01/2012
(Putable on 05/07/2012) (a) | | $ | 2,875,000 | |
| 750,000 | | Philadelphia Airport Revenue,—
Series A 4.000%, 06/15/2013 | | | 773,557 | |
| 1,000,000 | | State Economic Development
Financing Authority Revenue,
Exelon Generation
(CS: Exelon Generation)
5.000%, 12/01/2042
(Putable on 06/01/2012) | | | 1,003,610 | |
| 2,000,000 | | State Economic Development
Financing Authority Revenue,
Waste Management, Inc., VRDN
(CS: Waste Management, Inc.)
2.625%, 12/01/2033
(Putable on 12/03/2012) (a) | | | 2,022,600 | |
| 5,000,000 | | State Economic Development
Financing Authority Solid Waste
Disposal Revenue, Republic
Services, Inc.,—Series A, VRDN
(CS: Republic Services, Inc.)
0.600%, 04/01/2019
(Putable on 07/02/2012) (a) | | | 5,000,050 | |
| | | | | | | |
| | | | | | 98,885,257 | |
| | | | | | | |
Puerto Rico—4.2% | | | | |
| 28,140,000 | | Government Development Bank
Commonwealth, Senior Notes—
Series C
(LOC: Government Development
Bank for Puerto Rico)
1.000%, 10/15/2012
(Putable on 07/30/2012) | | | 28,107,920 | |
| 2,025,000 | | State Commonwealth Aqueduct
& Sewer Authority Revenue—
Series A, 5.000%, 07/01/2015 | | | 2,198,462 | |
| 46,785,000 | | State Infrastructure Financing
Authority Revenue, Ports
Authority Project—Series C
(LOC: Government Development
Bank for Puerto Rico)
2.750%, 12/15/2026
(Putable on 06/17/2013) | | | 46,942,665 | |
| | | | | | | |
| | | | | | 77,249,047 | |
| | | | | | | |
Rhode Island—0.1% | | | | |
| 500,000 | | Providence Public Buildings
Authority Revenue, Various
Capital Projects—Series A
(CS: Assured Guaranty)
3.000%, 06/15/2012 | | | 500,355 | |
| 2,190,000 | | State Economic Development
Corp., Revenue, Airport
Revenue Bonds—Series A
(CS: National Public Finance
Guarantee Corp.)
5.000%, 07/01/2012 | | | 2,200,906 | |
| | | | | | | |
| | | | | | 2,701,261 | |
| | | | | | | |
| | | | | | | |
Principal
Amount | | Security
Description | | Value | |
| | | | | | |
| | | | | | | |
Municipal Bonds—continued | | | | |
South Carolina—0.5% | | | | |
$ | 1,000,000 | | South Carolina Jobs Economic
Development Revenue, Waste
Management Project, VRDN
(CS: Waste Management, Inc.)
2.250%, 11/01/2016
(Putable on 11/01/2013) (a) | | $ | 1,015,950 | |
| 8,000,000 | | State Jobs—Economic
Development Authority
Revenue, Goglanian Bakeries,
Inc., VRDN
(LOC: Zions First National Bank)
1.500%, 12/01/2029 (Putable on 05/07/2012) (a) | | | 8,000,000 | |
| | | | | | | |
| | | | | | 9,015,950 | |
| | | | | | | |
Tennessee—2.0% | | | | |
| 2,255,000 | | Franklin County Industrial
Development Board Revenue,
Zanini Tennessee, Inc., Project—
Series B, VRDN
(LOC: Regions Bank)
1.270%, 12/01/2020
(Putable on 05/07/2012) (a) | | | 2,255,000 | |
| 12,550,000 | | Franklin Public Building Authority
Revenue, Local Government
Public Improvement—
Series-101-A-1, VRDN
(SPA: DEPFA Bank PLC)
0.570%, 06/01/2037
(Putable on 05/01/2012) (a) | | | 12,550,000 | |
| 2,250,000 | | Lewisburg Industrial Development
Board, Waste Management, Inc.
(CS: Waste Management, Inc.)
2.500%, 07/01/2012 | | | 2,255,760 | |
| 3,035,000 | | Metropolitan Government
Nashville & Davidson County
Health & Educational Facilities
Board Revenue, Summerwind
Apartments Project, VRDN
(LOC: Regions Bank)
1.800%, 12/01/2040
(Putable on 05/07/2012) (a) | | | 3,035,000 | |
| 4,365,000 | | Metropolitan Government
Nashville & Davidson County
Health & Educational Facilities
Board Revenue, Swiss Ridge
Apartments Project, VRDN
(LOC: Regions Bank)
1.220%, 12/01/2027
(Putable on 05/07/2012) (a) | | | 4,365,000 | |
| 3,415,000 | | Metropolitan Government
Nashville & Davidson County
Health & Educational Facilities
Board Revenue, Wedgewood—
Series A, VRDN
(LOC: Regions Bank)
1.270%, 06/01/2034
(Putable on 05/07/2012) (a) | | | 3,415,000 | |
The accompanying notes are an integral part of these financial statements.
68
|
Alpine Ultra Short Tax Optimized Income Fund |
| |
Schedule of Portfolio Investments—Continued
April 30, 2012 (Unaudited)
| | | | | | | |
Principal
Amount | | Security
Description | | Value | |
| | | | | | |
| | | | | | | |
Municipal Bonds—continued | | | | |
Tennessee—continued | | | | |
$ | 4,450,000 | | Metropolitan Government
Nashville & Davidson County
Industrial Development Board
Revenue, Rodgers Welch
Venture, VRDN
(LOC: Regions Bank)
2.400%, 12/01/2014
(Putable on 05/07/2012) (a) | | $ | 4,450,000 | |
| 4,705,000 | | Shelby County Health Educational
& Housing Facilities Board, Eden
Pointe Apartments, VRDN
(LOC: Regions Bank)
1.220%, 03/01/2040
(Putable on 05/07/2012) (a) | | | 4,705,000 | |
| 555,000 | | The City of Jackson Health
Educational & Housing Facility
Board Multifamily Revenue,
Creekside Apartments Project,
VRDN
(LOC: First Tennessee Bank)
2.500%, 12/01/2017
(Putable on 05/10/2012) (a) | | | 555,000 | |
| | | | | | | |
| | | | | | 37,585,760 | |
| | | | | | | |
Texas—6.1% | | | | |
| 675,000 | | City of Galveston Wharves &
Terminal Revenue,
4.000%, 02/01/2013 | | | 687,285 | |
| 4,000,000 | | Coastal Bend Health Facilities
Development Corp., Christus
Health—Subseries B-2, ARN
(CS: Assured Guaranty)
0.480%, 07/01/2031 (a) | | | 4,000,000 | |
| 4,975,000 | | Crawford Education Facilities Corp.
Revenue, I.F. Obligated Group
Project—Series A, VRDN
(LOC: Allied Irish Bank PLC)
3.500%, 09/01/2039
(Putable on 05/07/2012) (a) | | | 4,975,000 | |
| 6,945,000 | | Crawford Education Facilities Corp.,
Revenue, I.F. Obligated Group
Project—Series A, VRDN
(LOC: Allied Irish Bank PLC)
3.500%, 05/01/2038
(Putable on 05/07/2012) (a) | | | 6,945,000 | |
| 62,920,000 | | Harris County Health Facilities
Development Corp. Revenue,
Baylor College of Medicine—
Series A, VRDN
(LOC: Compass Bank)
0.450%, 11/15/2047
(Putable on 05/07/2012) (a) | | | 62,920,000 | |
| 5,025,000 | | Matagorda County Navigation
District No. 1 AEP Texas Central Co.
(CS: American Electric Power)
1.125%, 06/01/2030
(Putable on 06/01/2012) | | | 5,025,804 | |
| | | | | | | |
Principal
Amount | | Security
Description | | Value | |
| | | | | | |
| | | | | | | |
Municipal Bonds—continued | | | | |
Texas—continued | | | | |
$ | 9,200,000 | | Mission Economic Development
Corp., Solid Waste Disposal
Revenue, Republic Services,
Inc.,—Series A, VRDN
0.450%, 01/01/2020
(Putable on 07/02/2012) (a) | | $ | 9,200,184 | |
| 300,000 | | Sabine River Industrial
Development Authority,
Northeast Texas—NRU-84Q, VRDN
(CS: National Rural Utilities Corp.)
0.800%, 08/15/2014
(Putable on 08/15/2012) (a) | | | 300,006 | |
| 14,355,000 | | Weslaco Health Facilities
Development Corp., Knapp
Medical Center—Series A, VRDN
(LOC: Compass Bank)
1.420%, 06/01/2038 (Putable on 05/07/2012) (a) | | | 14,355,000 | |
| 4,460,000 | | Weslaco Health Facilities
Development Corp., Knapp
Medical Center—Series B, VRDN
(LOC: Compass Bank)
1.420%, 06/01/2031
(Putable on 05/07/2012) (a) | | | 4,460,000 | |
| | | | | | | |
| | | | | | 112,868,279 | |
| | | | | | | |
Virginia—3.1% | | | | | |
| 55,350,000 | | Capital Beltway Funding Corp.,
Hot Lanes—Series B, VRDN
(LOC: Banco Espirito Santo SA)
5.450%, 12/31/2047
(Putable on 05/07/2012) (a) | | | 55,350,000 | |
| 2,415,000 | | Staunton Industrial Development
Authority Revenue, Specialty
Blades, Inc., Project, VRDN
(LOC: Sun Trust Bank)
0.470%, 02/01/2027
(Putable on 05/07/2012) (a) | | | 2,415,000 | |
| | | | | | | |
| | | | | | 57,765,000 | |
| | | | | | | |
Washington—1.5% | | | | |
| 700,000 | | King County Housing Authority,
YWCA Family Village—Issaquah
(CS: County Guaranteed)
2.400%, 01/01/2013 | | | 700,252 | |
| 20,000,000 | | State Health Care Facilities
Authority Revenue, Kadlec
Medical Center—Series B, VRDN
(CS: Kadlec Medical Center;
SPA: KeyBank N.A.)
0.750%, 12/01/2036
Putable on 05/07/2012) (a) | | | 20,000,000 | |
| 6,880,000 | | State Housing Finance Commission,
Mirabella—Series A
(LOC: HSH Nordbank AG)
1.750%, 03/01/2036
(Putable on 05/01/2012) | | | 6,880,000 | |
| | | | | | | |
| | | | | | 27,580,252 | |
| | | | | | | |
The accompanying notes are an integral part of these financial statements.
69
|
Alpine Ultra Short Tax Optimized Income Fund |
| |
Schedule of Portfolio Investments—Continued
April 30, 2011 (Unaudited)
| | | | | | | |
Principal
Amount | | Security
Description | | Value | |
| | | | | | |
| | | | | | | |
Municipal Bonds—continued | | | | |
West Virginia—0.1% | | | | |
$ | 825,000 | | Monongalia County Building
Commission Revenue,
Monongalia Health System
(CS: Monongalia Elder Services,
Inc.) 2.000%, 07/01/2012 | | $ | 825,446 | |
| 1,105,000 | | State Hospital Finance Authority
Revenue, Pallottine Health
Services, Inc., VRDN
(LOC: Fifth Third Bank)
0.400%, 10/01/2036
(Putable on 05/07/2012) (a) | | | 1,105,000 | |
| | | | | | | |
| | | | | | 1,930,446 | |
| | | | | | | |
Wisconsin—0.3% | | | | |
| 2,180,000 | | Baraboo Industrial Development
Revenue, Teel Plastics, Inc., VRDN
(LOC: BMO Harris Bank N.A.)
0.600%, 11/01/2042
(Putable on 05/07/2012) (a) | | | 2,180,000 | |
| 490,000 | | Pewaukee Industrial Development
Revenue, Schutzman/Leibl—
Series A, VRDN
(LOC: BMO Harris Bank N.A.)
0.650%, 06/01/2019
(Putable on 05/07/2012) (a) | | | 490,000 | |
| 3,020,000 | | Village of Menomonee Falls
Industrial Development Revenue,
AJ Die-Namics Project, VRDN
(LOC: BMO Harris Bank N.A.)
0.600%, 11/01/2036
(Putable on 05/07/2012) (a) | | | 3,020,000 | |
| | | | | | | |
| | | | | | 5,690,000 | |
| | | | | | | |
Wyoming—0.2% | | | | |
| 2,855,000 | | Gillette Environmental
Improvement Revenue, Black
Hills Power and Light Co.,—
Series A, VRDN
(CS: Black Hills Power and
Light Co.)
3.000%, 06/01/2024
(Putable on 05/07/2012) (a) | | | 2,855,000 | |
| | | | | | | |
| | | Total Municipal Bonds
(Cost $1,831,606,431) | | | 1,832,721,883 | |
| | | | | | | |
| | | | | | | |
Shares | | | | | |
| | | | | | |
| | | | | | | |
Money Market Funds—0.3% | | | | |
| 6,307,535 | | BlackRock Liquidity Funds:
MuniCash Portfolio, 0.19% | | | 6,307,535 | |
| 5,987 | | Federated Municipal Obligation
Fund, 0.21% | | | 5,987 | |
| 30,125 | | Western Assets Institutional Tax
Free Reserves Fund, 0.09% | | | 30,125 | |
| | | | | | | |
| | | Total Money Market Funds
(Cost $6,343,647) | | | 6,343,647 | |
| | | | | | | |
|
Principal
Amount | | Security
Description | | Value | |
| | | | | | |
| | | | | | | |
Short-Term Investments—4.2% | | | | |
$ | 9,845,000 | | Claiborne County, Mississippi
Note, 0.50% | | $ | 9,845,000 | |
| 18,000,000 | | Massachusetts Bay, Massachusetts
Transportation Authority—
Series A, 0.65% | | | 18,000,000 | |
| 50,000,000 | | New Jersey Economic Development
Authority Revenue—Chambers
Cogeneration LP, 0.70% | | | 50,000,000 | |
| | | | | | | |
| | | Total Short-Term Investments
(Cost $77,845,000) | | | 77,845,000 | |
| | | | | | | |
| | | Total Investments
(Cost $1,915,795,078)—103.1% | | | 1,916,910,530 | |
| | | Liabilities in Excess of Other
Assets—(3.1)% | | | (57,167,360) | |
| | | | | | | |
| | | TOTAL NET ASSETS 100.0% | | $ | 1,859,743,170 | |
| | | | | | | |
The accompanying notes are an integral part of these financial statements.
70
|
Alpine Ultra Short Tax Optimized Income Fund |
| |
Schedule of Portfolio Investments—Continued
April 30, 2012 (Unaudited)
| | |
| | |
| | |
Percentages are stated as a percent of net assets. |
| | |
(a) | Variable Rate Security—The rate reported is the rate in effect as of April 30, 2012. |
| | |
(b) | Restricted under Rule 144A of the Securities Act of 1933. These securities may be resold in transactions exempt from registration, normally to qualified institutional buyers. These securities have been determined to be liquid under guidelines established by the Board of Trustees. Liquid securities restricted under Rule 144A comprised 2.4% of the Fund’s net assets. |
| | |
AG—Aktiengesellschaft is a German term that refers to a corporation that is limited by shares, i.e., owned by shareholders. |
| |
AMBAC—American Municipal Bond Assurance Corp. |
| |
ARN—Auction Rate Note |
| |
CS—Credit Support |
| |
CSP—Continental Structural Plastics |
| |
LIQ FAC—Liquidity Facility |
| |
LOC—Letter of Credit |
| |
MBIA—Municipal Bond Investor Assurance Corp. |
| |
NV—Naamloze Vennootschap is the Dutch term for a public limited liability corporation. |
| |
PLC—Public Limited Company |
| |
SA—Generally designates corporations in various countries, mostly those employing the civil law. |
| |
SPA—Standby Purchase Agreement |
| |
VRDN—Variable Rate Demand Note |
The accompanying notes are an integral part of these financial statements.
71
|
Alpine Municipal Money Market Fund |
| |
|
Schedule of Portfolio Investments
April 30, 2012 (Unaudited)
| | | | | | | |
Principal
Amount | | Security
Description | | Value | |
| | | | | | |
| | | | |
Municipal Bonds—99.1% | | | | |
Alaska—0.1% | | | | |
$ | 295,000 | | Industrial Development & Export
Authority—Lot 12, VRDN
(LOC: Bank of America N.A.)
0.870%, 07/01/2012
(Putable on 05/07/2012) (a) | | $ | 295,000 | |
| | | | | | | |
California—1.5% | | | | |
| 2,500,000 | | Pollution Control Financing
Authority, Solid Waste Disposal,
George & Jennifer Deboer, VRDN
(LOC: Wells Fargo Bank N.A.)
0.500%, 05/01/2029
(Putable on 05/07/2012) (a) | | | 2,500,000 | |
| 1,500,000 | | Pollution Control Financing
Authority, Solid Waste Disposal,
Heritage Dairy, VRDN
(LOC: Wells Fargo Bank N.A.)
0.500%, 10/01/2027
(Putable on 05/07/2012) (a) | | | 1,500,000 | |
| | | | | | | |
| | | | | | 4,000,000 | |
| | | | | | | |
Colorado—5.0% | | | | |
| 1,530,000 | | Housing & Finance Authority
Economic Development Revenue,
Corey Building LLC—Series A, VRDN
(LOC: Wells Fargo Bank N.A.)
0.450%, 02/01/2029
(Putable on 05/07/2012) (a) | | | 1,530,000 | |
| 2,940,000 | | Housing & Finance Authority
Economic Development Revenue,
Monaco LLC—Series A, VRDN
(LOC: UMB Bank N.A.)
0.400%, 12/01/2027
(Putable on 05/07/2012) (a) | | | 2,940,000 | |
| 1,140,000 | | Housing & Finance Authority
Economic Development Revenue,
Top Shop—Series A, VRDN
(LOC: JPMorgan Chase Bank)
0.450%, 09/01/2035
(Putable on 05/07/2012) (a) | | | 1,140,000 | |
| 1,517,000 | | Jefferson County Industrial
Development Revenue, Epi-Center
LLC, VRDN
(LOC: JPMorgan Chase Bank)
0.450%, 12/01/2025
(Putable on 05/07/2012) (a) | | | 1,517,000 | |
| 5,700,000 | | State Health Facilities Authority
Revenue, National Jewish Medical
and Research Center Project, VRDN
(LOC: UMB Bank N.A.)
0.320%, 01/01/2035
(Putable on 05/07/2012) (a) | | | 5,700,000 | |
| | | | | | | |
| | | | | | 12,827,000 | |
| | | | | | | |
Florida—4.6% | | | | |
| 2,000,000 | | Housing Finance Corp. Revenue,
Northbridge Apartments—
Series G-1, VRDN
(LOC: KeyBank N.A.)
0.620%, 06/15/2036
(Putable on 05/07/2012) (a) | | | 2,000,000 | |
| | | | | | | |
Principal
Amount | | Security
Description | | Value | |
| | | | | | |
| | | | |
Municipal Bonds—continued | | | | |
Florida—continued | | | | |
$ | 3,745,000 | | Lee County Industrial
Development Health Care
Authority Revenue, Shady Rest
Care Pavilion, VRDN
(LOC: Fifth Third Bank)
0.400%, 06/01/2025
(Putable on 05/07/2012) (a) | | $ | 3,745,000 | |
| 3,525,000 | | Manatee County Industrial
Development Revenue,
Gaemmerler U.S. Corp., VRDN
(LOC: Wells Fargo Bank N.A.)
0.440%, 10/01/2035
(Putable on 05/07/2012) (a) | | | 3,525,000 | |
| 2,600,000 | | Sarasota County Industrial
Development Revenue, Tervis
Tumbler Co., VRDN
(LOC: Bank of America N.A.)
1.000%, 11/01/2024
(Putable on 05/07/2012) (a) | | | 2,600,000 | |
| | | | | | | |
| | | | | | 11,870,000 | |
| | | | | | | |
Georgia—1.6% | | | | |
| 4,000,000 | | Fulton County Development
Authority Industrial
Development Revenue, Leggett
& Platt, Inc., VRDN
(LOC: Wells Fargo Bank N.A.)
0.480%, 06/01/2027
(Putable on 05/07/2012) (a) | | | 4,000,000 | |
| | | | | | | |
Illinois—15.7% | | | | |
| 1,000,000 | | City of Chicago Industrial
Development Revenue, Enterprise
Center VII, VRDN
(LOC: Bank of America N.A.)
0.600%, 06/01/2022
(Putable on 05/07/2012) (a) | | | 1,000,000 | |
| 2,600,000 | | City of Chicago Industrial
Development Revenue, Victoria
Limited, LLC, VRDN
(LOC: Bank of America N.A.)
0.650%, 03/01/2034
(Putable on 05/07/2012) (a) | | | 2,600,000 | |
| 14,645,000 | | City of Chicago O’Hare
International Airport,
Rocs RR II—Series R-011312, VRDN
(CS: Assured Guaranty; LIQ
FAC: CitiBank N.A.)
0.400%, 01/01/2016
(Putable on 05/07/2012) (a) | | | 14,645,000 | |
| 1,120,000 | | City of East Moline, Rock Island
County Industrial Development
Revenue, Elliott Aviation, VRDN
(LOC: U.S. Bank N.A.)
0.620%, 12/01/2019
(Putable on 05/07/2012) (a) | | | 1,120,000 | |
| 580,000 | | Des Plaines Industrial Development
Revenue, MMP Properties LLC, VRDN
(LOC: JPMorgan Chase Bank)
0.500%, 10/01/2018
(Putable on 05/07/2012) (a) | | | 580,000 | |
The accompanying notes are an integral part of these financial statements.
72
|
Alpine Municipal Money Market Fund |
| |
Schedule of Portfolio Investments—Continued
April 30, 2012 (Unaudited)
| | | | | | | |
Principal
Amount | | Security
Description | | Value | |
| | | | | | |
| | | | |
Municipal Bonds—continued | | | | |
Illinois—continued | | | | |
$ | 1,125,000 | | Finance Authority Industrial
Development Revenue, 2500
DevelGroup LLC—Series A, VRDN
(LOC: JPMorgan Chase Bank)
0.500%, 01/01/2021
(Putable on 05/07/2012) (a) | | $ | 1,125,000 | |
| 1,185,000 | | Finance Authority Industrial
Development Revenue, Alpha
Beta Press, Inc.—Series A, VRDN
(LOC: JPMorgan Chase Bank)
0.500%, 06/01/2020
(Putable on 05/07/2012) (a) | | | 1,185,000 | |
| 445,000 | | Finance Authority Industrial
Development Revenue, Church
Road Partnership, VRDN
(LOC: JPMorgan Chase Bank)
0.500%, 10/01/2017
(Putable on 05/07/2012) (a) | | | 445,000 | |
| 340,000 | | Finance Authority Industrial
Development Revenue, Fine
Points LLC, VRDN
(LOC: JPMorgan Chase Bank)
0.700%, 01/01/2018
(Putable on 05/07/2012) (a) | | | 340,000 | |
| 4,100,000 | | Finance Authority Industrial
Development Revenue, Flying
Food Fare, Inc., VRDN
(LOC: BMO Harris Bank N.A.)
0.370%, 07/01/2028
(Putable on 05/07/2012) (a) | | | 4,100,000 | |
| 2,100,000 | | Finance Authority Industrial
Development Revenue, Industrial
Steel Construction, Inc., VRDN
(LOC: JPMorgan Chase Bank)
0.500%, 07/15/2023
(Putable on 05/07/2012) (a) | | | 2,100,000 | |
| 3,000,000 | | Finance Authority Industrial
Development Revenue, John
Hofmeister & Son, Inc., VRDN
(LOC: BMO Harris Bank N.A.)
0.370%, 12/01/2037
(Putable on 05/07/2012) (a) | | | 3,000,000 | |
| 730,000 | | Finance Authority Industrial
Development Revenue, Merug
LLC—Series B, VRDN
(LOC: JPMorgan Chase Bank)
0.500%, 12/01/2018
(Putable on 05/07/2012) (a) | | | 730,000 | |
| 4,000,000 | | Phoenix Realty Special Account-U LP
MultiFamily Housing Revenue,
Brightons Mark, VRDN
(LOC: Northern Trust Co.)
0.370%, 04/01/2020
(Putable on 05/07/2012) (a) | | | 4,000,000 | |
| 515,000 | | Village of Hanover Park Industrial
Development Revenue, Spectra-
Tech, Inc. Project, VRDN
(LOC: BMO Harris Bank N.A.)
0.650%, 08/01/2017
(Putable on 05/07/2012) (a) | | | 515,000 | |
| | | | | | | |
Principal
Amount | | Security
Description | | Value | |
| | | | | | |
| | | | |
Municipal Bonds—continued | | | | |
Illinois—continued | | | | |
$ | 450,000 | | Village of Wheeling Industrial
Project Revenue, V-S Industries,
Inc. Project, VRDN
(LOC: JPMorgan Chase Bank)
0.650%, 12/01/2015
(Putable on 05/07/2012) (a) | | $ | 450,000 | |
| 2,350,000 | | Village of Woodridge Du Page
Will & Cook Counties Industrial
Development Revenue, Home
Run Inn Frozen Food, VRDN
(LOC: JPMorgan Chase Bank)
0.500%, 10/01/2025
(Putable on 05/07/2012) (a) | | | 2,350,000 | |
| | | | | | | |
| | | | | | 40,285,000 | |
| | | | | | | |
Indiana—2.3% | | | | |
| 3,385,000 | | Hobart Economic Development
Revenue, Albanese
Confectionery—Series A, VRDN
(LOC: BMO Harris Bank N.A.)
0.370%, 07/01/2031
(Putable on 05/07/2012) (a) | | | 3,385,000 | |
| 1,970,000 | | State Development Finance
Authority Development Revenue,
TTP, Inc. Project, VRDN
(LOC: Bank of America N.A.)
0.700%, 02/01/2026
(Putable on 05/07/2012) (a) | | | 1,970,000 | |
| 530,000 | | Valparaiso Economic Development
Revenue, Task Force Tips, Inc., VRDN
(LOC: BMO Harris Bank N.A.)
0.320%, 05/01/2033
(Putable on 05/07/2012) (a) | | | 530,000 | |
| | | | | | | |
| | | | | | 5,885,000 | |
| | | | | | | |
Kansas—0.4% | | | | |
| 1,110,000 | | State Development Finance
Authority Multifamily Housing
Revenue, Four Seasons
Apartments, VRDN
(LOC: U.S. Bank N.A.)
0.430%, 04/01/2036
(Putable on 05/07/2012) (a) | | | 1,110,000 | |
| | | | | | | |
Kentucky—1.0% | | | | |
| 900,000 | | Bardstown Revenue, JAV
Investment LLC, VRDN
(LOC: JPMorgan Chase Bank)
0.500%, 06/01/2031
(Putable on 05/07/2012) (a) | | | 900,000 | |
| 135,000 | | Hancock County Industrial
Development Revenue, Precision
Roll Grinders, VRDN
(LOC: JPMorgan Chase Bank)
0.700%, 06/01/2012
(Putable on 05/07/2012) (a) | | | 135,000 | |
| 1,495,000 | | Montgomery County Industrial
Building Revenue, Connecticut
Fineblanking Corp., VRDN
(LOC: Bank of America N.A.)
0.600%, 08/01/2015
(Putable on 05/07/2012) (a) | | | 1,495,000 | |
| | | | | | | |
| | | | | | 2,530,000 | |
| | | | | | | |
The accompanying notes are an integral part of these financial statements.
73
|
Alpine Municipal Money Market Fund |
| |
Schedule of Portfolio Investments—Continued
April 30, 2012 (Unaudited)
| | | | | | | |
Principal
Amount | | Security
Description | | Value | |
| | | | | | |
| | | | |
Municipal Bonds—continued | | | | |
Louisiana—1.4% | | | | |
$ | 2,870,000 | | Caddo-Bossier Parishes Port
Commission Revenue, Oakley
Louisiana, Inc., VRDN
(LOC: Bank of America N.A.)
0.550%, 01/01/2028
(Putable on 05/07/2012) (a) | | $ | 2,870,000 | |
| 700,000 | | Parish of Ascension Revenue,
BASF Corp., VRDN
(CS: BASF Corp.)
0.390%, 12/01/2028
(Putable on 05/01/2012) (a) | | | 700,000 | |
| | | | | | | |
| | | | | | 3,570,000 | |
| | | | | | | |
Maryland—1.7% | | | | |
| 3,000,000 | | State Health & Higher Educational
Facilities Authority Revenue, Glen
Meadows Retirement Community
Issue—Series A, VRDN
(LOC: TD Bank N.A.)
0.230%, 07/01/2029
(Putable on 05/07/2012) (a) | | | 3,000,000 | |
| 1,294,000 | | State Industrial Development
Financing Authority Revenue,
Greater Washington Jewish
Community, VRDN
(LOC: PNC Bank N.A.)
0.820%, 12/01/2018
(Putable on 05/07/2012) (a) | | | 1,294,000 | |
| | | | | | | |
| | | | | | 4,294,000 | |
| | | | | | | |
Michigan—8.8% | | | | |
| 3,115,000 | | Kalamazoo County Economic
Development Authority Limited
Obligation Revenue, W.B.C
Properties LP, VRDN
(LOC: Fifth Third Bank)
0.500%, 09/01/2015
(Putable on 05/07/2012) (a) | | | 3,115,000 | |
| 200,000 | | Lake Superior State University Board
of Trustees General Revenue,
(CS: Assured Guaranty/Lake
Superior State University)
2.000%, 11/15/2012 | | | 201,720 | |
| 950,000 | | Macomb County Economic
Development Corp., Aim
Plastics, Inc., VRDN
(LOC: Comerica Bank)
0.350%, 06/01/2037
(Putable on 05/07/2012) (a) | | | 950,000 | |
| 2,100,000 | | Oakland County Economic
Development Corp. Revenue, IBC
North America Inc., Project, VRDN
(LOC: Comerica Bank)
0.350%, 07/01/2023
(Putable on 05/07/2012) (a) | | | 2,100,000 | |
| 200,000 | | Sterling Heights Economic
Development Corp. Revenue,
Kunath Enterprises LLC, VRDN
(LOC: JPMorgan Chase Bank)
0.700%, 02/01/2016
(Putable on 05/07/2012) (a) | | | 200,000 | |
| | | | | | | |
Principal
Amount | | Security
Description | | Value | |
| | | | | | |
| | | | | | | |
Municipal Bonds—continued | | | | |
Michigan—continued | | | | |
$ | 1,220,000 | | Strategic Fund Limited
Obligation Revenue,
Dawnbreakers LLC, VRDN
(LOC: Fifth Third Bank)
0.450%, 05/01/2018
(Putable on 05/07/2012) (a) | | $ | 1,220,000 | |
| 1,400,000 | | Strategic Fund Limited
Obligation Revenue, Envelope
Printery, Inc., VRDN
(LOC: Fifth Third Bank)
0.450%, 03/01/2027
(Putable on 05/07/2012) (a) | | | 1,400,000 | |
| 7,015,000 | | Strategic Fund Limited Obligation
Revenue, Glastender, Inc., VRDN (LOC: JPMorgan Chase Bank)
0.550%, 11/01/2023
(Putable on 05/07/2012) (a) | | | 7,015,000 | |
| 700,000 | | Strategic Fund Limited Obligation
Revenue, Merrill Tool Holding
Co. Project—Series B, VRDN
(LOC: Bank of America N.A.)
0.650%, 06/01/2025
(Putable on 05/07/2012) (a) | | | 700,000 | |
| 5,800,000 | | Strategic Fund Limited Obligation
Revenue, Sacred Heart
Rehabilitation Center, VRDN
(LOC: Fifth Third Bank
0.400%, 03/01/2037
(Putable on 05/07/2012) (a) | | | 5,800,000 | |
| | | | | | | |
| | | | | | 22,701,720 | |
| | | | | | | |
Minnesota—0.5% | | | | |
| 1,380,000 | | Blooming Prairie Industrial
Development Revenue, Metal
Services, VRDN
(LOC: U.S. Bank N.A.)
0.510%, 12/01/2026
(Putable on 05/07/2012) (a) | | | 1,380,000 | |
| | | | | | | |
Missouri—1.7% | | | | |
| 4,510,000 | | St. Charles County Industrial
Development Authority Revenue,
Newco Enterprises Inc., Project—
Series A, VRDN
(LOC: BMO Harris Bank N.A.)
0.370%, 12/01/2029
(Putable on 05/07/2012) (a) | | | 4,510,000 | |
| | | | | | | |
New Jersey—5.5% | | | | |
| 1,210,000 | | Passaic County, General Obligation
Unlimited Refunding
(CS: Passaic County)
2.000%, 05/01/2012 | | | 1,210,000 | |
| 12,850,000 | | State Turnpike Authority
Revenue—Series D, VRDN
(LOC: Societe Generale)
1.000%, 01/01/2018
(Putable on 05/07/2012) (a) | | | 12,850,000 | |
| | | | | | | |
| | | | | | 14,060,000 | |
| | | | | | | |
The accompanying notes are an integral part of these financial statements.
74
|
Alpine Municipal Money Market Fund |
| |
Schedule of Portfolio Investments—Continued
April 30, 2012 (Unaudited)
| | | | | | | |
Principal
Amount | | Security
Description | | Value | |
| | | | | | |
| | | | |
Municipal Bonds—continued | | | | |
New Mexico—2.2% | | | | |
$ | 750,000 | | Albuquerque Industrial
Development Revenue,
Karsten Co.—Series A, VRDN
(LOC: U.S. Bank N.A.)
0.400%, 12/01/2017
(Putable on 05/07/2012) (a) | | $ | 750,000 | |
| 5,000,000 | | Santa Fe County Education
Facility Revenue, Archdioceses
of Santa Fe School Project—
Series A, VRDN
(LOC: U.S. Bank N.A.)
0.340%, 06/01/2028
(Putable on 05/07/2012) (a) | | | 5,000,000 | |
| | | | | | | |
| | | | | | 5,750,000 | |
| | | | | | | |
New York—8.8% | | | | |
| 1,700,000 | | Madison County Industrial
Development Agency, Owl Wire
& Cable, Inc.—Series A, VRDN
(LOC: KeyBank N.A.)
0.440%, 12/01/2012
(Putable on 05/07/2012) (a) | | | 1,700,000 | |
| 7,000,000 | | Metropolitan Transportation
Authority Dedicated Tax
Fund Refunding Revenue—
Subseries B-4, VRDN
(LOC: KBC Bank NV)
0.700%, 11/01/2025
(Putable on 05/07/2012) (a) | | | 7,000,000 | |
| 2,185,000 | | Monroe County Industrial
Development Agency, Hillside
Children’s Center, VRDN
(LOC: KeyBank N.A.)
0.390%, 08/01/2018
(Putable on 05/07/2012) (a) | | | 2,185,000 | |
| 805,000 | | New York City Industrial
Development Agency, Allway
Tools, Inc., VRDN
(LOC: CitiBank N.A.)
0.750%, 08/01/2017
(Putable on 05/07/2012) (a) | | | 805,000 | |
| 6,300,000 | | State Dormitory Authority
Revenue, City University System
Consolidated Fifth General
Resolution—Series D, VRDN
(LOC: TD Bank N.A.)
0.220%, 07/01/2031
(Putable on 05/07/2012) (a) | | | 6,300,000 | |
| 2,100,000 | | State Dormitory Authority Revenue,
Northern Westchester Hospital
Association, VRDN
(LOC: TD Bank N.A.)
0.220%, 11/01/2034
(Putable on 05/07/2012) (a) | | | 2,100,000 | |
| 2,455,000 | | Suffolk County Industrial
Development Agency Revenue,
Hampton Day School Civic
Facility—Series A, VRDN
(LOC: JPMorgan Chase Bank)
0.750%, 02/01/2031
(Putable on 05/07/2012) (a) | | | 2,455,000 | |
| | | | | | | |
| | | | | | 22,545,000 | |
| | | | | | | |
| | | | | | | |
Principal
Amount | | Security
Description | | Value | |
| | | | | | |
| | | | | |
Municipal Bonds—continued | | | | |
North Carolina—0.4% | | | | |
$ | 1,000,000 | | Davidson County Industrial
Facilities & Pollution Control
Financing Authority Revenue,
Dieboid Inc., VRDN
(LOC: Bank of America N.A.)
1.150%, 06/01/2017
(Putable on 05/07/2012) (a) | | $ | 1,000,000 | |
| | | | | | | |
Ohio—3.4% | | | | |
| 3,650,000 | | Cuyahoga County Civic Facilities,
Fairfax Development Corp., VRDN
(LOC: KeyBank N.A.)
0.390%, 06/01/2022 (Putable on 05/07/2012) (a) | | | 3,650,000 | |
| 2,550,000 | | Stark County Industrial
Development Authority,
H-P Products, Inc., VRDN
(LOC: KeyBank N.A.)
0.440%, 06/01/2018
(Putable on 05/07/2012) (a) | | | 2,550,000 | |
| 500,000 | | State Air Quality Development
Authority, Pollution Control
Revenue, The Timken Co.
Project, VRDN
(LOC: KeyBank N.A.)
0.420%, 06/01/2033
(Putable on 05/07/2012) (a) | | | 500,000 | |
| 2,000,000 | | Summit County Port Authority
Facilities, KB Compost Services,
Inc., VRDN
(LOC: PNC Bank N.A.)
0.360%, 04/01/2021
(Putable on 05/07/2012) (a) | | | 2,000,000 | |
| | | | | | | |
| | | | | | 8,700,000 | |
| | | | | | | |
Oregon—2.1% | | | | |
| 1,325,000 | | Portland Housing Authority,
Floyd Light, VRDN
(LOC: Bank of America N.A.)
0.600%, 12/01/2027
(Putable on 05/07/2012) (a) | | | 1,325,000 | |
| 1,000,000 | | State Economic Development
Revenue, Oregon Precision
Industries, Inc. Project—
Series 204A, VRDN
(LOC: Bank of America N.A.)
0.620%, 12/01/2026
(Putable on 05/07/2012) (a) | | | 1,000,000 | |
| 3,000,000 | | State Economic Development
Revenue, YoCream, VRDN
(LOC: KeyBank N.A.)
0.390%, 02/01/2037
(Putable on 05/07/2012) (a) | | | 3,000,000 | |
| | | | | | | |
| | | | | | 5,325,000 | |
| | | | | | | |
Pennsylvania—7.1% | | | | |
| 2,200,000 | | Beaver County Industrial
Development Authority,
BASF Corp., VRDN
(CS: BASF Corp.)
0.390%, 09/01/2032
(Putable on 05/07/2012) (a) | | | 2,200,000 | |
The accompanying notes are an integral part of these financial statements.
75
|
Alpine Municipal Money Market Fund |
| |
Schedule of Portfolio Investments—Continued
April 30, 2012 (Unaudited)
| | | | | | | |
Principal
Amount | | Security
Description | | Value | |
| | | | | | |
| | | | |
Municipal Bonds—continued | | | | |
Pennsylvania—continued | | | | |
$ | 3,140,000 | | Higher Educational Facilities
Authority, Holy Family
College—Series A, VRDN
(LOC: TD Bank N.A.)
0.230%, 12/01/2032
(Putable on 05/07/2012) (a) | | $ | 3,140,000 | |
| 8,560,000 | | Philadelphia Authority for
Industrial Development, Gift
of Life Donor Program, VRDN
(LOC: TD Bank N.A.)
0.230%, 12/01/2034
(Putable on 05/07/2012) (a) | | | 8,560,000 | |
| 4,450,000 | | Washington County Hospital
Authority Revenue, Washington
Hospital—Series A, VRDN
(LOC: Wells Fargo Bank N.A.)
0.470%, 07/01/2037
(Putable on 07/01/2012) (a) | | | 4,450,000 | |
| | | | | | | |
| | | | | | 18,350,000 | |
| | | | | | | |
South Carolina—2.9% | | | | |
| 2,400,000 | | State Jobs—Economic Development
Authority, Dorris Properties LLC
Project, VRDN
(LOC: TD Bank N.A.)
0.400%, 07/01/2032
(Putable on 05/07/2012) (a) | | | 2,400,000 | |
| 3,590,000 | | State Jobs—Economic Development
Authority, Franco Manufacturing
Co., Inc., VRDN
(LOC: Bank of America N.A.)
0.600%, 05/01/2019
(Putable on 05/07/2012) (a) | | | 3,590,000 | |
| 1,500,000 | | State Jobs—Economic Development
Authority, Supreme Machined
Products Co., VRDN
(LOC: Bank of America N.A.)
0.750%, 06/01/2015
(Putable on 05/07/2012) (a) | | | 1,500,000 | |
| | | | | | | |
| | | | | | 7,490,000 | |
| | | | | | | |
Tennessee—2.9% | | | | |
| 7,500,000 | | Hendersonville Industrial
Development Board—
Series A, VRDN
(LOC: Fifth Third Bank)
0.400%, 05/01/2036
(Putable on 05/07/2012) (a) | | | 7,500,000 | |
| | | | | | | |
Texas—8.3% | | | | |
| 2,600,000 | | Dallam County Industrial
Development Corp., Rick &
Janice Van Ryan, VRDN
(LOC: Wells Fargo Bank N.A.)
0.500%, 07/01/2037
(Putable on 05/07/2012) (a) | | | 2,600,000 | |
| 3,250,000 | | Fort Bend County Industrial
Development Corp., Aaron
Rents, Inc., VRDN
(LOC: Wells Fargo Bank N.A.)
0.440%, 01/01/2026
(Putable on 05/07/2012) (a) | | | 3,250,000 | |
|
Principal
Amount | | Security
Description | | Value | |
| | | | | | |
| | | | |
Municipal Bonds—continued | | | | |
Texas—continued | | | | |
$ | 870,000 | | Jefferson County Industrial
Development Corp. Hurricane
Ike Disaster Area Revenue,
Jefferson Refinery LLC
Project, VRDN
(CS: Branch Bank & Trust,
Jefferson Refinery LLC)
0.450%, 12/01/2040
(Putable on 06/28/2012) (a) | | $ | 870,000 | |
| 9,000,000 | | Jefferson County Industrial
Development Corp. Revenue,
Jefferson Refinery LLC—
Series A, VRDN (CS: Branch Bank & Trust,
Jefferson Refinery LLC)
0.450%, 12/01/2040
(Putable on 06/28/2012) (a) | | | 9,000,000 | |
| 5,600,000 | | Port Arthur Navigation District
Revenue, BASF Corp., VRDN
(CS: BASF Corp.)
0.390%, 04/01/2033
(Putable on 05/07/2012) (a) | | | 5,600,000 | |
| | | | | | | |
| | | | | | 21,320,000 | |
| | | | | | | |
Utah—0.6% | | | | |
| 1,460,000 | | City of West Jordan Industrial
Development Revenue, PenCo
Products, Inc., VRDN
(LOC: KeyBank N.A.)
1.000%, 04/01/2019
(Putable on 05/07/2012) (a) | | | 1,460,000 | |
| | | | | | | |
Vermont—0.3% | | | | |
| 720,000 | | Economic Development Authority,
Hazelett Strip—Casting, VRDN
(LOC: KeyBank N.A.)
0.440%, 12/01/2012
(Putable on 05/07/2012) (a) | | | 720,000 | |
| | | | | | | |
Virginia—1.8% | | | | |
| 3,000,000 | | Brunswick County Industrial
Development Authority Revenue,
Aegis Waste Solutions, Inc., VRDN
(LOC: Bank of America N.A.)
0.500%, 01/01/2017
(Putable on 05/07/2012) (a) | | | 3,000,000 | |
| 1,600,000 | | City of Emporia Industrial
Development Authority Revenue,
Toll VA III, L.P. Project, VRDN
(LOC: Bank of America N.A.)
0.570%, 11/01/2023
(Putable on 05/07/2012) (a) | | | 1,600,000 | |
| | | | | | | |
| | | | | | 4,600,000 | |
| | | | | | | |
Washington—4.1% | | | | |
| 1,140,000 | | Economic Development Finance
Authority, Art & Theresa
Mensonides—Series I, VRDN
(LOC: Wells Fargo Bank N.A.)
0.500%, 10/01/2016
(Putable on 05/07/2012) (a) | | | 1,140,000 | |
The accompanying notes are an integral part of these financial statements.
76
|
Alpine Municipal Money Market Fund |
| |
Schedule of Portfolio Investments—Continued
April 30, 2012 (Unaudited)
| | | | | | | |
Principal
Amount | | Security
Description | | Value | |
| | | | | | |
| | | | |
Municipal Bonds—continued | | | | |
Washington—continued | | | | |
$ | 1,400,000 | | Economic Development Finance
Authority, Belina Interiors,
Inc.—Series E, VRDN
(LOC: KeyBank N.A.)
1.000%, 08/01/2033
(Putable on 05/07/2012) (a) | | $ | 1,400,000 | |
| 1,110,000 | | Economic Development Finance
Authority, Belina Interiors, Inc.—
Series F, VRDN
(LOC: KeyBank N.A.)
1.000%, 11/01/2023
(Putable on 05/07/2012) (a) | | | 1,110,000 | |
| 2,745,000 | | Economic Development Finance
Authority, Wesmar Co., Inc.
Project—Series F, VRDN
(LOC: U.S. Bank N.A.)
0.450%, 07/01/2032
(Putable on 05/07/2012) (a) | | | 2,745,000 | |
| 2,805,000 | | Port Bellingham Industrial
Development Corp., Wood
Stone Corp., VRDN
(LOC: KeyBank N.A.)
0.440%, 02/01/2027
(Putable on 05/07/2012) (a) | | | 2,805,000 | |
| 1,330,000 | | Seattle Housing Authority Revenue,
Douglas Apartments, VRDN
(LOC: KeyBank N.A.)
0.390%, 06/01/2040
(Putable on 05/07/2012) (a) | | | 1,330,000 | |
| | | | | | | |
| | | | | | 10,530,000 | |
| | | | | | | |
Wisconsin—2.4% | | | | |
| 1,000,000 | | Mequon Industrial Development
Revenue, Gateway Plastics, Inc.—
Series A, VRDN
(LOC: JPMorgan Chase Bank)
0.500%, 08/01/2026
(Putable on 05/07/2012) (a) | | | 1,000,000 | |
| 1,665,000 | | Mequon Industrial Development
Revenue, SPI Lighting, VRDN
(LOC: BMO Harris Bank N.A.)
0.600%, 12/01/2023
(Putable on 05/07/2012) (a) | | | 1,665,000 | |
| | | | | | | |
Principal
Amount | | Security
Description | | Value | |
| | | | | | |
| | | |
Municipal Bonds—continued | | | | |
Wisconsin—continued | | | | |
$ | 500,000 | | Milwaukee Redevelopment
Authority, Kubin Nicholson
Corp Project—Series A, VRDN
(LOC: BMO Harris Bank N.A.)
0.650%, 08/01/2020
(Putable on 05/07/2012) (a) | | $ | 500,000 | |
| 1,125,000 | | Rhinelander Industrial Development
Revenue, Super Diesel/SDI
Properties, VRDN
(LOC: JPMorgan Chase Bank)
0.590%, 07/01/2021
(Putable on 05/07/2012) (a) | | | 1,125,000 | |
| 975,000 | | Village of Mukwonago Industrial
Development Revenue, Empire
Level Industrial Project, VRDN
(LOC: BMO Harris Bank N.A.)
0.680%, 08/01/2014
(Putable on 05/07/2012) (a) | | | 975,000 | |
| 1,000,000 | | Wausau Industrial Development
Revenue, Apogee Enterprises,
Inc., VRDN
(LOC: Comerica Bank)
0.510%, 03/01/2022
(Putable on 05/07/2012) (a) | | | 1,000,000 | |
| | | | | | | |
| | | | | | 6,265,000 | |
| | | | | | | |
| | | Total Municipal Bonds
(Cost $254,872,720) | | | 254,872,720 | |
| | | | | | | |
|
Shares | | | | | | |
| | | | | | | |
| | | | |
Money Market Funds—0.8% | | | | |
| 2,166,607 | | BlackRock Liquidity Funds:
MuniCash Portfolio, 0.20% | | | 2,166,607 | |
| 19,731 | | Western Assets Institutional Tax
Free Reserves Fund, 0.14% | | | 19,731 | |
| | | | | | | |
| | | Total Money Market Funds
(Cost $2,186,338) | | | 2,186,338 | |
| | | | | | | |
| | | Total Investments
(Cost $257,059,058)—99.9% | | | 257,059,058 | |
| | | Other Assets in Excess of
Liabilities—0.1% | | | 150,045 | |
| | | | | | | |
| | | TOTAL NET ASSETS 100.0% | | $ | 257,209,103 | |
| | | | | | | |
| | |
| | |
Percentages are stated as a percent of net assets. |
| |
(a) | Variable Rate Security—The rate reported is the rate in effect as of April 30, 2012. |
| |
CS—Credit Support |
| |
LIQ FAC—Liquidity Facility |
| |
LOC—Letter of Credit |
| |
NV—Naamloze Vennootschap is the Dutch term for a public limited liability corporation. |
| |
VRDN—Variable Rate Demand Note |
The accompanying notes are an integral part of these financial statements.
77
Statements of Assets and Liabilities
April 30, 2012 (Unaudited)
| | | | | | | | | | | | |
| | Dynamic
Dividend
Fund | | Accelerating
Dividend
Fund | | Financial
Services
Fund | |
| | | | | | | |
| | | | | | | | | | |
ASSETS: | | | | | | | | | | | | |
Investments, at value (Cost—$366,876,739, $2,467,175 and $9,980,889) | | $ | 394,621,537 | | | $ | 2,725,904 | | | $ | 7,687,583 | |
Foreign currencies, at value (Cost—$116,146, $1,584 and $66,237) | | | 116,137 | | | | 1,584 | | | | 63,132 | |
Cash | | | 425 | | | | 594 | | | | 930 | |
Receivable from investment securities sold | | | 34,929,817 | | | | 22,141 | | | | 41,087 | |
Dividends and interest receivable | | | 7,851,154 | | | | 4,287 | | | | 3,215 | |
Receivable from capital shares issued | | | 329,223 | | | | 100 | | | | 500 | |
Unrealized appreciation on forward currency contracts | | | 195,716 | | | | — | | | | — | |
Prepaid expenses and other assets | | | 38,396 | | | | 1,135 | | | | 1,373 | |
Due from Adviser | | | — | | | | 4,011 | | | | 2,984 | |
| | | | | | | | | | | | |
Total assets | | | 438,082,405 | | | | 2,759,756 | | | | 7,800,804 | |
| | | | | | | | | | | | |
| | | | | | | | | | | | |
LIABILITIES: | | | | | | | | | | | | |
Payable for investment securities purchased | | | 35,095,964 | | | | 17,418 | | | | — | |
Payable for distributions to shareholders | | | 1,653,193 | | | | 1,575 | | | | — | |
Payable for capital shares redeemed | | | 1,290,781 | | | | 15,507 | | | | 40,175 | |
Unrealized depreciation on forward currency contracts | | | 389,177 | | | | — | | | | — | |
Accrued expenses and other liabilities: | | | | | | | | | | | | |
Investment advisory fees | | | 332,214 | | | | 2,215 | | | | 6,300 | |
Distribution fees | | | 89 | | | | 89 | | | | 94 | |
Other | | | 230,815 | | | | 15,499 | | | | 9,346 | |
| | | | | | | | | | | | |
Total liabilities | | | 38,992,233 | | | | 52,303 | | | | 55,915 | |
| | | | | | | | | | | | |
Net Assets | | $ | 399,090,172 | | | $ | 2,707,453 | | | $ | 7,744,889 | |
| | | | | | | | | | | | |
| | | | | | | | | | | | |
Net assets represented by: | | | | | | | | | | | | |
Capital stock | | $ | 1,499,925,262 | | | $ | 2,325,998 | | | $ | 11,960,535 | |
Accumulated net investment income (loss) | | | 19,231,992 | | | | 66,137 | | | | (12,896 | ) |
Accumulated net realized gains (losses) from investments, foreign currency transactions and swap contracts | | | (1,147,801,220 | ) | | | 56,599 | | | | (1,906,208 | ) |
Net unrealized appreciation (depreciation) on: | | | | | | | | | | | | |
Investments | | | 27,744,798 | | | | 258,729 | | | | (2,293,306 | ) |
Foreign currency translation | | | (10,660 | ) | | | (10 | ) | | | (3,236 | ) |
| | | | | | | | | | | | |
Total Net Assets | | $ | 399,090,172 | | | $ | 2,707,453 | | | $ | 7,744,889 | |
| | | | | | | | | | | | |
| | | | | | | | | | | | |
Net asset value | | | | | | | | | | | | |
Class A Shares | | | | | | | | | | | | |
Net assets | | $ | 107,624 | | | $ | 109,426 | | | $ | 119,773 | |
Shares outstanding | | | 28,921 | | | | 8,414 | | | | 14,493 | |
Net asset value per share | | $ | 3.72 | | | $ | 13.01 | | | $ | 8.26 | |
Maximum offering price per share (net asset value plus sales charge of 5.50%) | | $ | 3.94 | | | $ | 13.77 | | | $ | 8.74 | |
Institutional Class Shares | | | | | | | | | | | | |
Net assets | | $ | 398,982,548 | | | $ | 2,598,027 | | | $ | 7,625,116 | |
Shares outstanding | | | 107,228,273 | | | | 199,774 | | | | 922,041 | |
Net asset value, offering price and redemption price per share* | | $ | 3.72 | | | $ | 13.00 | | | $ | 8.27 | |
| | | | | | | | | | | | |
* If applicable, redemption price per share may be reduced by a redemption fee.
The accompanying notes are an integral part of these financial statements.
78
Statements of Assets and Liabilities—Continued
April 30, 2012 (Unaudited)
| | | | | | | | | | | | |
| | Innovators
Fund | | Transformations
Fund | | Foundation
Fund | |
| | | | | | | |
| | | | | | | |
ASSETS: | | | | | | | | | | |
Investments, at value (Cost—$9,632,107, $6,112,623 and $57,120,215) | | $ | 12,831,413 | | | $ | 7,666,644 | | | $ | 64,965,434 | |
Foreign currencies, at value (Cost—$—, $894 and $4,477) | | | — | | | | 887 | | | | 4,446 | |
Cash | | | 560 | | | | 629 | | | | 572 | |
Dividends and interest receivable | | | 1 | | | | 844 | | | | 206,373 | |
Receivable from investment securities sold | | | 99,690 | | | | 185,786 | | | | 192,375 | |
Prepaid expenses and other assets | | | 8,223 | | | | 13,848 | | | | 6,298 | |
Receivable from capital shares issued | | | 164,323 | | | | 18,002 | | | | 172 | |
Due from Adviser | | | 1,583 | | | | 2,004 | | | | — | |
| | | | | | | | | | | | |
Total assets | | | 13,105,793 | | | | 7,888,644 | | | | 65,375,670 | |
| | | | | | | | | | | | |
| | | | | | | | | | | | |
LIABILITIES: | | | | | | | | | | | | |
Payable for investment securities purchased | | | 385,188 | | | | 165,532 | | | | — | |
Payable for capital shares redeemed | | | — | | | | 37,190 | | | | — | |
Accrued expenses and other liabilities: | | | | | | | | | | | | |
Investment advisory fees | | | 10,281 | | | | 6,241 | | | | 53,221 | |
Distribution fees | | | 102 | | | | 93 | | | | 87 | |
Other | | | 6,780 | | | | 2,377 | | | | 5,142 | |
| | | | | | | | | | | | |
Total liabilities | | | 402,351 | | | | 211,433 | | | | 58,450 | |
| | | | | | | | | | | | |
Net Assets | | $ | 12,703,442 | | | $ | 7,677,211 | | | $ | 65,317,220 | |
| | | | | | | | | | | | |
| | | | | | | | | | | | |
Net assets represented by: | | | | | | | | | | | | |
Capital stock | | $ | 23,209,595 | | | $ | 6,013,472 | | | $ | 61,301,966 | |
Accumulated net investment income (loss) | | | (58,625 | ) | | | (20,895 | ) | | | 18,026 | |
Accumulated net realized gains (losses) from investments and foreign currency transactions | | | (13,646,834 | ) | | | 130,548 | | | | (3,847,978 | ) |
Net unrealized appreciation (depreciation) on: | | | | | | | | | | | | |
Investments | | | 3,199,306 | | | | 1,554,021 | | | | 7,845,219 | |
Foreign currency translation | | | — | | | | 65 | | | | (13 | ) |
| | | | | | | | | | | | |
Total Net Assets | | $ | 12,703,442 | | | $ | 7,677,211 | | | $ | 65,317,220 | |
| | | | | | | | | | | | |
| | | | | | | | | | | | |
Net asset value | | | | | | | | | | | | |
Class A Shares | | | | | | | | | | | | |
Net assets | | $ | 158,132 | | | $ | 116,299 | | | $ | 107,875 | |
Shares outstanding | | | 12,834 | | | | 8,913 | | | | 9,458 | |
Net asset value per share | | $ | 12.32 | | | $ | 13.05 | | | $ | 11.41 | |
Maximum offering price per share (net asset value plus sales charge of 5.50%) | | $ | 13.04 | | | $ | 13.81 | | | $ | 12.07 | |
Institutional Class Shares | | | | | | | | | | | | |
Net assets | | $ | 12,545,310 | | | $ | 7,560,912 | | | $ | 65,209,345 | |
Shares outstanding | | | 1,016,825 | | | | 578,764 | | | | 5,716,135 | |
Net asset value, offering price and redemption price per share* | | $ | 12.34 | | | $ | 13.06 | | | $ | 11.41 | |
| | | | | | | | | | | | |
* If applicable, redemption price per share may be reduced by a redemption fee.
The accompanying notes are an integral part of these financial statements.
79
Statements of Assets and Liabilities—Continued
April 30, 2012 (Unaudited)
| | | | | | | | | |
| | Ultra Short
Tax Optimized
Income
Fund | | Municipal
Money Market
Fund | |
| | | | | |
| | | | | |
ASSETS: | | | | | | | |
Investments, at value (Cost—$1,915,795,078 and $257,059,058) | | $ | 1,916,910,530 | | | $ | 257,059,058 | | |
Receivable from capital shares issued | | | 10,055,778 | | | | 126,697 | | |
Interest receivable | | | 6,601,069 | | | | 190,858 | | |
Receivable from investment securities sold | | | 4,185,046 | | | | — | | |
Due from Adviser | | | 246,506 | | | | 46,281 | | |
Prepaid expenses and other assets | | | 45,350 | | | | 25,471 | | |
| | | | | | | | | |
Total assets | | | 1,938,044,279 | | | | 257,448,365 | | |
| | | | | | | | | |
| | | | | | | | | |
LIABILITIES: | | | | | | | | | |
Payable for investment securities purchased | | | 71,974,724 | | | | 100,000 | | |
Payable for capital shares redeemed | | | 4,569,492 | | | | 16,051 | | |
Accrued expenses and other liabilities: | | | | | | | | | |
Investment advisory fees | | | 1,152,334 | | | | 95,769 | | |
Distribution fees | | | 97,084 | | | | — | | |
Other | | | 507,475 | | | | 27,442 | | |
| | | | | | | | | |
Total liabilities | | | 78,301,109 | | | | 239,262 | | |
| | | | | | | | | |
Net Assets | | $ | 1,859,743,170 | | | $ | 257,209,103 | | |
| | | | | | | | | |
| | | | | | | | | |
Net assets represented by: | | | | | | | | | |
Capital stock | | $ | 1,858,771,973 | | | $ | 257,209,103 | | |
Accumulated net investment income | | | 135 | | | | — | | |
Accumulated net realized losses from investments | | | (144,390 | ) | | | — | | |
Net unrealized appreciation (depreciation) on investments | | | 1,115,452 | | | | — | | |
| | | | | | | | | |
Total Net Assets | | $ | 1,859,743,170 | | | $ | 257,209,103 | | |
| | | | | | | | | |
| | | | | | | | | |
Net asset value | | | | | | | | | |
Class A Shares | | | | | | | | | |
Net assets | | $ | 460,321,474 | | | | | | |
Shares outstanding | | | 45,562,753 | | | | | | |
Net asset value per share | | $ | 10.10 | | | | | | |
Maximum offering price per share (net asset value plus sales charge of 0.50%) | | $ | 10.15 | | | | | | |
Institutional Class Shares | | | | | | | | | |
Net assets | | $ | 1,399,421,696 | | | $ | 257,209,103 | | |
Shares outstanding | | | 139,304,501 | | | | 257,211,771 | | |
Net asset value, offering price and redemption price per share* | | $ | 10.05 | | | $ | 1.00 | | |
| | | | | | | | | |
* If applicable, redemption price per share may be reduced by a redemption fee.
The accompanying notes are an integral part of these financial statements.
80
Statements of Operations
For the six months ended April 30, 2012 (Unaudited)
| | | | | | | | | | | | |
| | Dynamic
Dividend
Fund | | Accelerating
Dividend
Fund | | Financial
Services
Fund | |
| | | | | | | |
| | | | | | | |
INVESTMENT INCOME: | | | | | | | | | | |
Interest income | | $ | 363 | | | $ | 10 | | | $ | 5 | |
Dividends income | | | 42,227,317 | | | | 131,134 | | | | 49,032 | |
Less: Foreign taxes withheld | | | (1,532,766 | ) | | | (853 | ) | | | (680 | ) |
| | | | | | | | | | | | |
Total investment income | | | 40,694,914 | | | | 130,291 | | | | 48,357 | |
| | | | | | | | | | | | |
| | | | | | | | | | | | |
EXPENSES: | | | | | | | | | | | | |
Investment advisory fee (Note 6) | | | 2,107,368 | | | | 14,954 | | | | 32,959 | |
Transfer agent fees | | | 160,684 | | | | 4,236 | | | | 6,301 | |
Printing and mailing fees | | | 80,190 | | | | 2,377 | | | | 3,558 | |
Legal fees | | | 49,140 | | | | 1,011 | | | | 1,188 | |
Interest on line of credit expense (Note 2) | | | 42,977 | | | | 84 | | | | 1,859 | |
Administration fee (Note 6) | | | 42,496 | | | | 297 | | | | 687 | |
Audit and tax fees | | | 25,204 | | | | 4,683 | | | | 4,793 | |
Trustee fees | | | 22,593 | | | | 150 | | | | 319 | |
Registration and filing fees | | | 21,069 | | | | 8,172 | | | | 11,117 | |
Fund accounting and custody fees | | | 24,160 | | | | 8,831 | | | | 3,291 | |
Distribution fees—Class A (Note 5) | | | 89 | | | | 89 | | | | 95 | |
Other fees | | | 24,610 | | | | 831 | | | | 953 | |
| | | | | | | | | | | | |
Total expenses | | | 2,600,580 | | | | 45,715 | | | | 67,120 | |
Less: Fee waivers and/or expense reimbursements (Note 6) | | | — | | | | (25,355 | ) | | | (20,671 | ) |
| | | | | | | | | | | | |
Net expenses | | | 2,600,580 | | | | 20,360 | | | | 46,449 | |
| | | | | | | | | | | | |
Net investment income | | | 38,094,334 | | | | 109,931 | | | | 1,908 | |
| | | | | | | | | | | | |
| | | | | | | | | | | | |
NET REALIZED AND UNREALIZED ON INVESTMENTS AND FOREIGN CURRENCY | | | | | | | | | | | | |
Net realized gain (loss) on: | | | | | | | | | | | | |
Securities transactions | | | (35,991,248 | ) | | | 53,716 | | | | (122,876 | ) |
Less: Foreign capital gains taxes | | | (8,969 | ) | | | (8 | ) | | | — | |
Foreign currency transactions | | | (344,610 | ) | | | (222 | ) | | | (3,027 | ) |
| | | | | | | | | | | | |
Net realized gain (loss) | | | (36,344,827 | ) | | | 53,486 | | | | (125,903 | ) |
| | | | | | | | | | | | |
Change in net unrealized appreciation (depreciation) on: | | | | | | | | | | | | |
Investments | | | 12,593,470 | | | | 155,505 | | | | 1,105,824 | |
Foreign currency translations | | | (514,241 | ) | | | 127 | | | | (3,165 | ) |
| | | | | | | | | | | | |
Net change in unrealized appreciation (depreciation) | | | 12,079,229 | | | | 155,632 | | | | 1,102,659 | |
| | | | | | | | | | | | |
Net gain (loss) on investments and foreign currency | | | (24,265,598 | ) | | | 209,118 | | | | 976,756 | |
| | | | | | | | | | | | |
Increase in net assets from operations | | $ | 13,828,736 | | | $ | 319,049 | | | $ | 978,664 | |
| | | | | | | | | | | | |
The accompanying notes are an integral part of these financial statements.
81
|
Alpine Mutual Funds |
| |
|
Statements of Operations—Continued
For the six months ended April 30, 2012 (Unaudited) |
| | | | | | | | | | | | | | | | |
| | Innovators
Fund | | Transformations
Fund | | Foundation
Fund | |
| | | | | | | |
INVESTMENT INCOME: | | | | | | | | | | |
Interest income | | | $ | 37 | | | | $ | 45 | | | | $ | 234,290 | | |
Dividends income | | | | 17,366 | | | | | 25,402 | | | | | 711,623 | | |
Less: Foreign taxes withheld | | | | — | | | | | (770 | ) | | | | (9,379 | ) | |
| | | | | | | | | | | | | | | | |
Total investment income | | | | 17,403 | | | | | 24,677 | | | | | 936,534 | | |
| | | | | | | | | �� | | | | | | | |
| | | | | | | | | | | | | | | | |
EXPENSES: | | | | | | | | | | | | | | | | |
Investment advisory fee (Note 6) | | | | 55,700 | | | | | 33,688 | | | | | 313,573 | | |
Registration and filing fees | | | | 10,118 | | | | | 9,615 | | | | | 19,679 | | |
Printing and mailing fees | | | | 3,484 | | | | | 2,140 | | | | | 16,293 | | |
Audit and tax fees | | | | 4,941 | | | | | 4,793 | | | | | 6,765 | | |
Administration fee (Note 6) | | | | 1,116 | | | | | 666 | | | | | 6,202 | | |
Transfer agent fees | | | | 6,956 | | | | | 3,294 | | | | | 5,808 | | |
Legal fees | | | | 1,054 | | | | | 1,794 | | | | | 5,524 | | |
Trustee fees | | | | 524 | | | | | 319 | | | | | 3,065 | | |
Fund accounting and custody fees | | | | 1,317 | | | | | 1,465 | | | | | 2,469 | | |
Interest on line of credit expense (Note 2) | | | | 729 | | | | | — | | | | | — | | |
Distribution fees—Class A (Note 5) | | | | 104 | | | | | 93 | | | | | 87 | | |
Other fees | | | | 1,170 | | | | | 937 | | | | | 522 | | |
| | | | | | | | | | | | | | | | |
Total expenses | | | | 87,213 | | | | | 58,804 | | | | | 379,987 | | |
Less: Fee waivers and/or expense reimbursements (Note 6) | | | | (11,185 | ) | | | | (13,232 | ) | | | | — | | |
| | | | | | | | | | | | | | | | |
Net expenses | | | | 76,028 | | | | | 45,572 | | | | | 379,987 | | |
| | | | | | | | | | | | | | | | |
Net investment income (loss) | | | | (58,625 | ) | | | | (20,895 | ) | | | | 556,547 | | |
| | | | | | | | | | | | | | | | |
| | | | | | | | | | | | | | | | |
NET REALIZED AND UNREALIZED ON INVESTMENTS AND FOREIGN CURRENCY | | | | | | | | | | | | | | | | |
Net realized gain (loss) on: | | | | | | | | | | | | | | | | |
Securities transactions | | | | 333,827 | | | | | 416,058 | | | | | (3,538,310 | ) | |
Foreign currency transactions | | | | (3,934 | ) | | | | (128 | ) | | | | (815 | ) | |
| | | | | | | | | | | | | | | | |
Net realized gain (loss) | | | | 329,893 | | | | | 415,930 | | | | | (3,539,125 | ) | |
| | | | | | | | | | | | | | | | |
Change in net unrealized appreciation (depreciation) on: | | | | | | | | | | | | | | | | |
Investments | | | | 1,565,222 | | | | | 333,028 | | | | | 8,126,512 | | |
Foreign currency translations | | | | — | | | | | 181 | | | | | (13 | ) | |
| | | | | | | | | | | | | | | | |
Net change in unrealized appreciation (depreciation) | | | | 1,565,222 | | | | | 333,209 | | | | | 8,126,499 | | |
| | | | | | | | | | | | | | | | |
Net gain on investments | | | | 1,895,115 | | | | | 749,139 | | | | | 4,587,374 | | |
| | | | | | | | | | | | | | | | |
Increase in net assets from operations | | | $ | 1,836,490 | | | | $ | 728,244 | | | | $ | 5,143,921 | | |
| | | | | | | | | | | | | | | | |
The accompanying notes are an integral part of these financial statements.
82
|
Alpine Mutual Funds |
| |
|
Statements of Operations—Continued
For the six months ended April 30, 2012 (Unaudited) |
| | | | | | | | | | | |
| | Ultra Short
Tax Optimized
Income
Fund | | Municipal
Money Market
Fund | |
| | | | | |
INVESTMENT INCOME: | | | | | | | |
Interest income | | | $ | 16,485,106 | | | | $ | 601,893 | | |
| | | | | | | | | | | |
Total investment income | | | | 16,485,106 | | | | | 601,893 | | |
| | | | | | | | | | | |
| | | | | | | | | | | |
EXPENSES: | | | | | | | | | | | |
Investment advisory fee (Note 6) | | | | 6,597,147 | | | | | 655,364 | | |
Distribution fees—Class A (Note 5) | | | | 504,110 | | | | | — | | |
Administration fee (Note 6) | | | | 173,943 | | | | | 28,241 | | |
Fund accounting and custody fees | | | | 93,461 | | | | | 14,474 | | |
Registration and filing fees | | | | 64,394 | | | | | 16,461 | | |
Transfer agent fees | | | | 60,902 | | | | | 13,109 | | |
Legal fees | | | | 52,096 | | | | | 27,985 | | |
Printing and mailing fees | | | | 46,637 | | | | | 11,263 | | |
Trustee fees | | | | 22,351 | | | | | 4,398 | | |
Insurance fees | | | | 17,948 | | | | | 5,663 | | |
Compliance fees | | | | 8,707 | | | | | 2,404 | | |
Audit and tax fees | | | | 3,798 | | | | | 2,735 | | |
Other fees | | | | 1,328 | | | | | 588 | | |
| | | | | | | | | | | |
Total expenses | | | | 7,646,822 | | | | | 782,685 | | |
Less: Fee waivers and/or expense reimbursement (Note 6) | | | | (1,425,185 | ) | | | | (311,438 | ) | |
| | | | | | | | | | | |
Net expenses | | | | 6,221,637 | | | | | 471,247 | | |
| | | | | | | | | | | |
Net investment income | | | | 10,263,469 | | | | | 130,646 | | |
| | | | | | | | | | | |
| | | | | | | | | | | |
NET REALIZED AND UNREALIZED ON INVESTMENTS | | | | | | | | | | | |
Net realized gain on securities transactions | | | | 29,830 | | | | | — | | |
Change in net unrealized appreciation (depreciation) on investments | | | | (304,023 | ) | | | | — | | |
| | | | | | | | | | | |
Net gain (loss) on investments | | | | (274,193 | ) | | | | — | | |
| | | | | | | | | | | |
Increase in net assets from operations | | | $ | 9,989,276 | | | | $ | 130,646 | | |
| | | | | | | | | | | |
The accompanying notes are an integral part of these financial statements.
83
|
Alpine Mutual Funds |
| |
|
Statements of Changes in Net Assets |
| | | | | | | | | | | |
| | Dynamic Dividend Fund | |
| | | |
| | Six Months Ended
April 30, 2012 | | Year Ended
October 31, 2011 | |
| | | | | |
| | (Unaudited) | | | |
OPERATIONS: | | | | | | | |
Net investment income | | | $ | 38,094,334 | | | | $ | 61,748,711 | | |
Net realized gain (loss) on: | | | | | | | | | | | |
Securities transactions | | | | (36,000,217 | ) | | | | 33,657,509 | | |
Foreign currency transactions | | | | (344,610 | ) | | | | (9,000,198 | ) | |
Swap contracts | | | | — | | | | | (865,496 | ) | |
Change in net unrealized appreciation (depreciation) on: | | | | | | | | | | | |
Investments | | | | 12,593,470 | | | | | (92,627,923 | ) | |
Foreign currency translations | | | | (514,241 | ) | | | | 2,284,481 | | |
| | | | | | | | | | | |
Increase (Decrease) in net assets from operations | | | | 13,828,736 | | | | | (4,802,916 | ) | |
| | | | | | | | | | | |
| | | | | | | | | | | |
DISTRIBUTIONS TO SHAREHOLDERS: | | | | | | | | | | | |
Distributions to Class A Shareholders: | | | | | | | | | | | |
From net investment income | | | | (4,645 | ) | | | | — | | |
From net realized gain on investments | | | | — | | | | | — | | |
Distributions to Institutional Class Shareholders: | | | | | | | | | | | |
From net investment income | | | | (28,009,422 | ) | | | | (69,799,231 | ) | |
From net realized gain on investments | | | | — | | | | | — | | |
| | | | | | | | | | | |
Decrease in net assets from distributions to shareholders | | | | (28,014,067 | ) | | | | (69,799,231 | ) | |
| | | | | | | | | | | |
| | | | | | | | | | | |
CAPITAL SHARE TRANSACTIONS (NOTE 3) | | | | | | | | | | | |
Net proceeds from shares sold | | | | 18,382,901 | | | | | 88,626,740 | | |
Dividends reinvested | | | | 17,849,206 | | | | | 47,602,166 | | |
Redemption fees | | | | 32,924 | | | | | 48,509 | | |
Cost of shares repurchased | | | | (83,455,301 | ) | | | | (230,053,339 | ) | |
| | | | | | | | | | | |
Decrease in net assets from capital share transactions | | | | (47,190,270 | ) | | | | (93,775,924 | ) | |
| | | | | | | | | | | |
Total decrease in net assets | | | | (61,375,601 | ) | | | | (168,378,071 | ) | |
| | | | | | | | | | | |
| | | | | | | | | | | |
NET ASSETS: | | | | | | | | | | | |
Beginning of period | | | | 460,465,773 | | | | | 628,843,844 | | |
| | | | | | | | | | | |
End of period* | | | $ | 399,090,172 | | | | $ | 460,465,773 | | |
| | | | | | | | | | | |
* Including undistributed net investment income of: | | | $ | 19,231,992 | | | | $ | 9,151,725 | | |
| | | | | | | | | | | |
The accompanying notes are an integral part of these financial statements.
84
|
Alpine Mutual Funds |
| |
|
Statements of Changes in Net Assets—Continued |
| | | | | | | | | | | |
| | Accelerating Dividend Fund | |
| | | |
| | Six Months Ended
April 30, 2012 | | Year Ended
October 31, 2011 | |
| | | | | |
| | (Unaudited) | | | | |
OPERATIONS: | | | | | | | |
Net investment income | | | $ | 109,931 | | | | $ | 111,288 | | |
Net realized gain (loss) on: | | | | | | | | | | | |
Securities transactions | | | | 53,708 | | | | | 195,503 | | |
Foreign currency transactions | | | | (222 | ) | | | | (1,808 | ) | |
Change in net unrealized appreciation (depreciation) on: | | | | | | | | | | | |
Investments | | | | 155,505 | | | | | (161,355 | ) | |
Foreign currency translations | | | | 127 | | | | | (135 | ) | |
| | | | | | | | | | | |
Increase in net assets from operations | | | | 319,049 | | | | | 143,493 | | |
| | | | | | | | | | | |
| | | | | | | | | | | |
DISTRIBUTIONS TO SHAREHOLDERS: | | | | | | | | | | | |
Distributions to Class A Shareholders: | | | | | | | | | | | |
From net investment income | | | | (1,216 | ) | | | | — | | |
From net realized gain on investments | | | | — | | | | | — | | |
Distributions to Institutional Class Shareholders: | | | | | | | | | | | |
From net investment income | | | | (60,613 | ) | | | | (118,437 | ) | |
From net realized gain on investments | | | | (197,496 | ) | | | | (41,908 | ) | |
| | | | | | | | | | | |
Decrease in net assets from distributions to shareholders | | | | (259,325 | ) | | | | (160,345 | ) | |
| | | | | | | | | | | |
| | | | | | | | | | | |
CAPITAL SHARE TRANSACTIONS (NOTE 3) | | | | | | | | | | | |
Net proceeds from shares sold | | | | 233,977 | | | | | 827,453 | | |
Dividends reinvested | | | | 158,511 | | | | | 105,232 | | |
Redemption fees | | | | — | | | | | 21 | | |
Cost of shares repurchased | | | | (962,955 | ) | | | | (91,097 | ) | |
| | | | | | | | | | | |
Increase (Decrease) in net assets from capital share transactions | | | | (570,467 | ) | | | | 841,609 | | |
| | | | | | | | | | | |
Total Increase (Decrease) in net assets | | | | (510,743 | ) | | | | 824,757 | | |
| | | | | | | | | | | |
| | | | | | | | | | | |
NET ASSETS: | | | | | | | | | | | |
Beginning of period | | | | 3,218,196 | | | | | 2,393,439 | | |
| | | | | | | | | | | |
End of period* | | | $ | 2,707,453 | | | | $ | 3,218,196 | | |
| | | | | | | | | | | |
* Including undistributed net investment income of: | | | $ | 66,137 | | | | $ | 18,035 | | |
| | | | | | | | | | | |
The accompanying notes are an integral part of these financial statements.
85
|
Alpine Mutual Funds |
| |
|
Statements of Changes in Net Assets—Continued |
| | | | | | | | | | | |
| | Financial Services Fund | |
| | | |
| | Six Months Ended
April 30, 2012 | | Year Ended
October 31, 2011 | |
| | | | | |
| | (Unaudited) | | | |
OPERATIONS: | | | | | | | |
Net investment income | | | $ | 1,908 | | | | $ | 24,595 | | |
Net realized loss on: | | | | | | | | | | | |
Securities transactions | | | | (122,876 | ) | | | | (1,086,243 | ) | |
Foreign currency transactions | | | | (3,027 | ) | | | | (1,938 | ) | |
Change in net unrealized appreciation (depreciation) on: | | | | | | | | | | | |
Investments | | | | 1,105,824 | | | | | 649,026 | | |
Foreign currency translations | | | | (3,165 | ) | | | | (71 | ) | |
| | | | | | | | | | | |
Increase (Decrease) in net assets from operations | | | | 978,664 | | | | | (414,631 | ) | |
| | | | | | | | | | | |
| | | | | | | | | | | |
DISTRIBUTIONS TO SHAREHOLDERS: | | | | | | | | | | | |
Distributions to Class A Shareholders: | | | | | | | | | | | |
From net investment income | | | | — | | | | | — | | |
From net realized gain on investments | | | | — | | | | | — | | |
Distributions to Institutional Class Shareholders: | | | | | | | | | | | |
From net investment income | | | | (13,524 | ) | | | | (13,114 | ) | |
From net realized gain on investments | | | | — | | | | | — | | |
From tax return of capital | | | | — | | | | | (9,617 | ) | |
| | | | | | | | | | | |
Decrease in net assets from distributions to shareholders | | | | (13,524 | ) | | | | (22,731 | ) | |
| | | | | | | | | | | |
| | | | | | | | | | | |
CAPITAL SHARE TRANSACTIONS (NOTE 3) | | | | | | | | | | | |
Net proceeds from shares sold | | | | 1,220,587 | | | | | 2,447,441 | | |
Dividends reinvested | | | | 11,966 | | | | | 19,879 | | |
Redemption fees | | | | 1,579 | | | | | 2,059 | | |
Cost of shares repurchased | | | | (705,275 | ) | | | | (3,498,930 | ) | |
| | | | | | | | | | | |
Increase (Decrease) in net assets from capital share transactions | | | | 528,857 | | | | | (1,029,551 | ) | |
| | | | | | | | | | | |
Total Increase (Decrease) in net assets | | | | 1,493,997 | | | | | (1,466,913 | ) | |
| | | | | | | | | | | |
| | | | | | | | | | | |
NET ASSETS: | | | | | | | | | | | |
Beginning of period | | | | 6,250,892 | | | | | 7,717,805 | | |
| | | | | | | | | | | |
End of period* | | | $ | 7,744,889 | | | | $ | 6,250,892 | | |
| | | | | | | | | | | |
* Including accumulated net investment loss of: | | | $ | (12,896 | ) | | | $ | (1,280 | ) | |
| | | | | | | | | | | |
The accompanying notes are an integral part of these financial statements.
86
|
Alpine Mutual Funds |
| |
|
Statements of Changes in Net Assets—Continued |
| | | | | | | | | | | |
| | Innovators Fund | |
| | | |
| | Six Months Ended
April 30, 2012 | | Year Ended
October 31, 2011 | |
| | | | | |
| | (Unaudited) | | | | |
OPERATIONS: | | | | | | | |
Net investment loss | | | $ | (58,625 | ) | | | $ | (109,854 | ) | |
Net realized gain (loss) on: | | | | | | | | | | | |
Securities transactions | | | | 333,827 | | | | | (316,996 | ) | |
Foreign currency transactions | | | | (3,934 | ) | | | | — | | |
Change in net unrealized appreciation on investments | | | | 1,565,222 | | | | | 889,500 | | |
| | | | | | | | | | | |
Increase in net assets from operations | | | | 1,836,490 | | | | | 462,650 | | |
| | | | | | | | | | | |
| | | | | | | | | | | |
CAPITAL SHARE TRANSACTIONS (NOTE 3) | | | | | | | | | | | |
Net proceeds from shares sold | | | | 1,129,151 | | | | | 133,270 | | |
Redemption fees | | | | 275 | | | | | 34 | | |
Cost of shares repurchased | | | | (645,877 | ) | | | | (2,059,520 | ) | |
| | | | | | | | | | | |
Increase (Decrease) in net assets from capital share transactions | | | | 483,549 | | | | | (1,926,216 | ) | |
| | | | | | | | | | | |
Total Increase (Decrease) in net assets | | | | 2,320,039 | | | | | (1,463,566 | ) | |
| | | | | | | | | | | |
| | | | | | | | | | | |
NET ASSETS: | | | | | | | | | | | |
Beginning of period | | | | 10,383,403 | | | | | 11,846,969 | | |
| | | | | | | | | | | |
End of period* | | | $ | 12,703,442 | | | | $ | 10,383,403 | | |
| | | | | | | | | | | |
* Including accumulated/undistributed net investment loss of: | | | $ | (58,625 | ) | | | $ | — | | |
| | | | | | | | | | | |
The accompanying notes are an integral part of these financial statements.
87
|
Alpine Mutual Funds |
| |
|
Statements of Changes in Net Assets—Continued |
| | | | | | | | | | | |
| | Transformations Fund | |
| | | |
| | Six Months Ended
April 30, 2012 | | Year Ended
October 31, 2011 | |
| | | | | |
| | (Unaudited) | | | | |
OPERATIONS: | | | | | | | |
Net investment loss | | | $ | (20,895 | ) | | | $ | (38,058 | ) | |
Net realized gain (loss) on: | | | | | | | | | | | |
Securities transactions | | | | 416,058 | | | | | 518,227 | | |
Foreign currency transactions | | | | (128 | ) | | | | (184 | ) | |
Change in net unrealized appreciation (depreciation) on: | | | | | | | | | | | |
Investments | | | | 333,028 | | | | | 230,670 | | |
Foreign currency translations | | | | 181 | | | | | (116 | ) | |
| | | | | | | | | | | |
Increase in net assets from operations | | | | 728,244 | | | | | 710,539 | | |
| | | | | | | | | | | |
| | | | | | | | | | | |
CAPITAL SHARE TRANSACTIONS (NOTE 3) | | | | | | | | | | | |
Net proceeds from shares sold | | | | 1,140,983 | | | | | 1,211,025 | | |
Redemption fees | | | | 739 | | | | | 555 | | |
Cost of shares repurchased | | | | (459,681 | ) | | | | (949,393 | ) | |
| | | | | | | | | | | |
Increase in net assets from capital share transactions | | | | 682,041 | | | | | 262,187 | | |
| | | | | | | | | | | |
Total Increase in net assets | | | | 1,410,285 | | | | | 972,726 | | |
| | | | | | | | | | | |
| | | | | | | | | | | |
NET ASSETS: | | | | | | | | | | | |
Beginning of period | | | | 6,266,926 | | | | | 5,294,200 | | |
| | | | | | | | | | | |
End of period* | | | $ | 7,677,211 | | | | $ | 6,266,926 | | |
| | | | | | | | | | | |
* Including accumulated/undistributed net investment loss of: | | | $ | (20,895 | ) | | | $ | — | | |
| | | | | | | | | | | |
The accompanying notes are an integral part of these financial statements.
88
|
Alpine Mutual Funds |
| |
|
Statements of Changes in Net Assets—Continued |
| | | | | | | | | | | |
| | Foundation Fund | |
| | | | |
| | Six Months Ended
April 30, 2012 | | Year Ended
October 31, 2011 | |
| | | | | |
| | (Unaudited) | | | | |
OPERATIONS: | | | | | | | |
Net investment income | | | $ | 556,547 | | | | $ | 939,172 | | |
Net realized gain (loss) on: | | | | | | | | | | | |
Securities transactions | | | | (3,538,310 | ) | | | | 1,536,745 | | |
Foreign currency transactions | | | | (815 | ) | | | | 2 | | |
Change in net unrealized appreciation (depreciation) on: | | | | | | | | | | | |
Investments | | | | 8,126,512 | | | | | 1,500,399 | | |
Foreign currency translations | | | | (13 | ) | | | | — | | |
| | | | | | | | | | | |
Increase in net assets from operations | | | | 5,143,921 | | | | | 3,976,318 | | |
| | | | | | | | | | | |
| | | | | | | | | | | |
DISTRIBUTIONS TO SHAREHOLDERS: | | | | | | | | | | | |
Distributions to Class A Shareholders: | | | | | | | | | | | |
From net investment income | | | | (378 | ) | | | | — | | |
From net realized gain on investments | | | | — | | | | | — | | |
Distributions to Institutional Class Shareholders: | | | | | | | | | | | |
From net investment income | | | | (528,796 | ) | | | | (1,049,287 | ) | |
From net realized gain on investments | | | | — | | | | | — | | |
| | | | | | | | | | | |
Decrease in net assets from distributions to shareholders | | | | (529,174 | ) | | | | (1,049,287 | ) | |
| | | | | | | | | | | |
| | | | | | | | | | | |
CAPITAL SHARE TRANSACTIONS (NOTE 3) | | | | | | | | | | | |
Net proceeds from shares sold | | | | 157,258 | | | | | 830,757 | | |
Dividends reinvested | | | | 514,935 | | | | | 1,024,279 | | |
Redemption fees | | | | — | | | | | 1,429 | | |
Cost of shares repurchased | | | | (1,670,917 | ) | | | | (6,015,870 | ) | |
| | | | | | | | | | | |
Decrease in net assets from capital share transactions | | | | (998,724 | ) | | | | (4,159,405 | ) | |
| | | | | | | | | | | |
Total Increase (Decrease) in net assets | | | | 3,616,023 | | | | | (1,232,374 | ) | |
| | | | | | | | | | | |
| | | | | | | | | | | |
NET ASSETS: | | | | | | | | | | | |
Beginning of period | | | | 61,701,197 | | | | | 62,933,571 | | |
| | | | | | | | | | | |
End of period* | | | $ | 65,317,220 | | | | $ | 61,701,197 | | |
| | | | | | | | | | | |
* Including accumulated/undistributed net investment income (loss) of: | | | $ | 18,026 | | | | $ | (9,347 | ) | |
| | | | | | | | | | | |
The accompanying notes are an integral part of these financial statements.
89
|
Alpine Mutual Funds |
| |
|
Statements of Changes in Net Assets—Continued |
| | | | | | | | | | | |
| | Ultra Short
Tax Optimized Income Fund | |
| | | |
| | Six Months Ended
April 30, 2012 | | Year Ended
October 31, 2011 | |
| | | | | |
| | (Unaudited) | | | | |
OPERATIONS: | | | | | | | |
Net investment income | | | $ | 10,263,469 | | | | $ | 25,425,034 | | |
Net realized gain (loss) on securities transactions | | | | 29,830 | | | | | (124,756 | ) | |
Change in net unrealized depreciation on investments | | | | (304,023 | ) | | | | (296,662 | ) | |
| | | | | | | | | | | |
Increase in net assets from operations | | | | 9,989,276 | | | | | 25,003,616 | | |
| | | | | | | | | | | |
| | | | | | | | | | | |
DISTRIBUTIONS TO SHAREHOLDERS: | | | | | | | | | | | |
Distributions to Class A Shareholders: | | | | | | | | | | | |
From net investment income | | | | (1,931,823 | ) | | | | (4,909,350 | ) | |
From net realized gain on investments | | | | — | | | | | — | | |
Distributions to Institutional Class Shareholders: | | | | | | | | | | | |
From net investment income | | | | (8,331,511 | ) | | | | (20,529,866 | ) | |
From net realized gain on investments | | | | — | | | | | — | | |
| | | | | | | | | | | |
Decrease in net assets from distributions to shareholders | | | | (10,263,334 | ) | | | | (25,439,216 | ) | |
| | | | | | | | | | | |
| | | | | | | | | | | |
CAPITAL SHARE TRANSACTIONS (NOTE 3) | | | | | | | | | | | |
Net proceeds from shares sold | | | | 772,544,957 | | | | | 1,069,893,101 | | |
Dividends reinvested | | | | 6,474,096 | | | | | 17,865,869 | | |
Redemption fees | | | | 26,094 | | | | | 38,258 | | |
Cost of shares repurchased | | | | (543,140,550 | ) | | | | (902,146,730 | ) | |
| | | | | | | | | | | |
Increase in net assets from capital share transactions | | | | 235,904,597 | | | | | 185,650,498 | | |
| | | | | | | | | | | |
Total Increase in net assets | | | | 235,630,539 | | | | | 185,214,898 | | |
| | | | | | | | | | | |
| | | | | | | | | | | |
NET ASSETS: | | | | | | | | | | | |
Beginning of period | | | | 1,624,112,631 | | | | | 1,438,897,733 | | |
| | | | | | | | | | | |
End of period* | | | $ | 1,859,743,170 | | | | $ | 1,624,112,631 | | |
| | | | | | | | | | | |
* Including accumulated/undistributed net investment income of: | | | $ | 135 | | | | $ | — | | |
| | | | | | | | | | | |
The accompanying notes are an integral part of these financial statements.
90
|
Alpine Mutual Funds |
| |
|
Statements of Changes in Net Assets—Continued |
| | | | | | | | | | | |
| | Municipal Money Market Fund | |
| | | |
| | Six Months Ended
April 30, 2012 | | Year Ended
October 31, 2011 | |
| | | | | |
| | (Unaudited) | | | |
OPERATIONS: | | | | | | | |
Net investment income | | | $ | 130,646 | | | | $ | 799,038 | | |
Net realized gain on securities transactions | | | | — | | | | | 45,443 | | |
| | | | | | | | | | | |
Increase in net assets from operations | | | | 130,646 | | | | | 844,481 | | |
| | | | | | | | | | | |
| | | | | | | | | | | |
DISTRIBUTIONS TO SHAREHOLDERS: | | | | | | | | | | | |
From net investment income | | | | (130,646 | ) | | | | (799,048 | ) | |
From net realized gain on investments | | | | — | | | | | (45,444 | ) | |
| | | | | | | | | | | |
Decrease in net assets from distributions to shareholders | | | | (130,646 | ) | | | | (844,492 | ) | |
| | | | | | | | | | | |
| | | | | | | | | | | |
CAPITAL SHARE TRANSACTIONS (NOTE 3) | | | | | | | | | | | |
Net proceeds from shares sold | | | | 108,959,984 | | | | | 1,055,218,569 | | |
Dividends reinvested | | | | 92,805 | | | | | 457,009 | | |
Cost of shares repurchased | | | | (161,901,464 | ) | | | | (1,215,786,617 | ) | |
| | | | | | | | | | | |
Decrease in net assets from capital share transactions | | | | (52,848,675 | ) | | | | (160,111,039 | ) | |
| | | | | | | | | | | |
Total Decrease in net assets | | | | (52,848,675 | ) | | | | (160,111,050 | ) | |
| | | | | | | | | | | |
| | | | | | | | | | | |
NET ASSETS: | | | | | | | | | | | |
Beginning of period | | | | 310,057,778 | | | | | 470,168,828 | | |
| | | | | | | | | | | |
End of period* | | | $ | 257,209,103 | | | | $ | 310,057,778 | | |
| | | | | | | | | | | |
* Including accumulated/undistributed net investment income of: | | | $ | — | | | | $ | — | | |
| | | | | | | | | | | |
The accompanying notes are an integral part of these financial statements.
91
|
Alpine Mutual Funds |
| |
|
Financial Highlights |
(For a share outstanding throughout each period) |
| | | | | | |
| | |
| | Dynamic Dividend Fund | |
| | |
| Period
Ended
April 30,
2012 (a) | | |
| | | |
| (Unaudited) | | |
Class A Shares: | | | | | | |
Net asset value per share, beginning of period | | $ | 3.61 | | | |
| | | | | | |
Income from investment operations: | | | | | | |
Net investment income | | | 0.32 | | | |
Net realized and unrealized loss on investments | | | (0.04 | ) | | |
| | | | | | |
Total from investment operations | | | 0.28 | | | |
| | | | | | |
Redemption fees | | | — | | | |
Less distributions from: | | | | | | |
Net investment income | | | (0.17 | ) | | |
Net realized gains on investments | | | — | | | |
| | | | | | |
Total distributions | | | (0.17 | ) | | |
| | | | | | |
Net asset value per share, end of period | | $ | 3.72 | | | |
| | | | | | |
Total return | | | 7.59 | %(b) | | |
Ratios/Supplemental Data: | | | | | | |
Net Assets at end of period (000) | | $ | 108 | | | |
Ratio of total expenses to average net assets | | | 1.49 | %(c) | | |
Ratio of interest expense to average net assets | | | 0.02 | %(c) | | |
Ratio of expenses to average net assets excluding interest expense | | | 1.47 | %(c) | | |
Ratio of net investment income to average net assets | | | 25.41 | %(c) | | |
Portfolio turnover rate (d) | | | 164 | %(b) | | |
| | |
| | |
|
(a) | Class A commenced operations on December 30, 2011. |
| |
(b) | Not annualized. |
| |
(c) | Annualized. |
| |
(d) | Portfolio turnover is calculated on the basis of the Fund as a whole, without distinguishing between classes of shares issued. |
The accompanying notes are an integral part of these financial statements.
92
Financial Highlights—Continued
(For a share outstanding throughout each period)
| | | | | | | | | | | | | | | | | | | | | |
| | | |
| | Dynamic Dividend Fund | |
| | | |
| | Six Months
Ended
April 30,
2012 | | Year Ended
October 31, | |
| | | |
| | | | |
| | | 2011 | | 2010 | | 2009 | | 2008 | | 2007 | |
| | | | | | | | | | | | | |
| | (Unaudited) | | | | | | | | | | | | | | | | |
Institutional Class Shares: | | | | | | | | | | | | | | | | | | | |
Net asset value per share, beginning of period | | | $ | 3.84 | | | $ | 4.48 | | $ | 4.78 | | $ | 5.72 | | $ | 13.32 | | $ | 12.52 | |
| | | | | | | | | | | | | | | | | | | | | |
Income from investment operations: | | | | | | | | | | | | | | | | | | | | | |
Net investment income | | | | 0.36 | | | | 0.49 | | | 0.56 | | | 1.37 | (a) | | 1.33 | (a) | | 1.95 | |
Net realized and unrealized gains (losses) on investments | | | | (0.23 | ) | | | (0.59 | ) | | 0.00 | (b) | | (1.14 | ) | | (7.29 | ) | | 0.61 | |
| | | | | | | | | | | | | | | | | | | | | |
Total from investment operations | | | | 0.13 | | | | (0.10 | ) | | 0.56 | | | 0.23 | | | (5.96 | ) | | 2.56 | |
| | | | | | | | | | | | | | | | | | | | | |
Redemption fees | | | | 0.00 | (b) | | | 0.00 | (b) | | 0.00 | (b) | | 0.00 | (b) | | 0.00 | (b) | | 0.00 | (b) |
Less distributions from: | | | | | | | | | | | | | | | | | | | | | |
Net investment income | | | | (0.25 | ) | | | (0.54 | ) | | (0.86 | ) | | (1.17 | ) | | (1.58 | ) | | (1.76 | ) |
Net realized gains on investments | | | | — | | | | — | | | — | | | — | | | — | | | — | |
Tax return of capital | | | | — | | | | — | | | — | | | — | | | (0.06 | ) | | — | |
| | | | | | | | | | | | | | | | | | | | | |
Total distributions | | | | (0.25 | ) | | | (0.54 | ) | | (0.86 | ) | | (1.17 | ) | | (1.64 | ) | | (1.76 | ) |
| | | | | | | | | | | | | | | | | | | | | |
Net asset value per share, end of period | | | $ | 3.72 | | | $ | 3.84 | | $ | 4.48 | | $ | 4.78 | | $ | 5.72 | | $ | 13.32 | |
| | | | | | | | | | | | | | | | | | | | | |
Total return | | | | 3.61 | %(c) | | | (3.48 | )% | | 12.72 | % | | 6.64 | % | | (49.05 | )% | | 21.66 | % |
Ratios/Supplemental Data: | | | | | | | | | | | | | | | | | | | | | |
Net Assets at end of period (000) | | | $ | 398,982 | | | $ | 460,466 | | $ | 628,844 | | $ | 572,151 | | $ | 598,759 | | $ | 1,500,072 | |
Ratio of total expenses to average net assets | | | | 1.23 | %(d) | | | 1.21 | % | | 1.21 | % | | 1.20 | % | | 1.18 | % | | 1.15 | % |
Ratio of interest expense to average net assets | | | | 0.02 | %(d) | | | 0.03 | % | | 0.04 | % | | 0.02 | % | | 0.02 | % | | 0.00 | %(b) |
Ratio of expenses to average net assets excluding interest expense | | | | 1.21 | %(d) | | | 1.18 | % | | 1.18 | % | | 1.18 | % | | 1.16 | % | | 1.15 | % |
Ratio of net investment income to average net assets | | | | 18.08 | %(d) | | | 10.39 | % | | 12.85 | % | | 26.04 | % | | 15.32 | % | | 15.65 | % |
Portfolio turnover (e) | | | | 164 | %(c) | | | 358 | % | | 506 | % | | 656 | % | | 323 | % | | 216 | % |
| | |
| | |
|
(a) | Net investment income per share is calculated using ending balances after consideration of adjustments for permanent book and tax differences. |
| |
(b) | The amount is less than $0.005 per share or 0.005%. |
| |
(c) | Not annualized. |
| |
(d) | Annualized. |
| |
(e) | Portfolio turnover is calculated on the basis of the Fund as a whole, without distinguishing between classes of shares issued. |
The accompanying notes are an integral part of these financial statements.
93
Financial Highlights—Continued
(For a share outstanding throughout each period)
| | | | | | | | | | | | | | | | | | | | | |
| | | |
| | Accelerating Dividend Fund | |
| | | |
| | Period
Ended
April 30,
2012 (a) | | | | | | | | | | | | | | | |
| | | | | | | | | | | | | | | | | |
| | (Unaudited) | | | | | | | | | | | | | | | |
Class A Shares: | | | | | | | | | | | | | | | | | | | | | |
Net asset value per share, beginning of period | | | $ | 12.02 | | | | | | | | | | | | | | | | | |
| | | | | | | | | | | | | | | | | | | | | |
Income from investment operations: | | | | | | | | | | | | | | | | | | | | | |
Net investment income | | | | 0.37 | | | | | | | | | | | | | | | | | |
Net realized and unrealized gain on investments | | | | 0.77 | | | | | | | | | | | | | | | | | |
| | | | | | | | | | | | | | | | | | | | | |
Total from investment operations | | | | 1.14 | | | | | | | | | | | | | | | | | |
| | | | | | | | | | | | | | | | | | | | | |
Redemption fees | | | | — | | | | | | | | | | | | | | | | | |
Less distributions from: | | | | | | | | | | | | | | | | | | | | | |
Net investment income | | | | (0.15 | ) | | | | | | | | | | | | | | | | |
Net realized gains on investments | | | | — | | | | | | | | | | | | | | | | | |
| | | | | | | | | | | | | | | | | | | | | |
Total distributions | | | | (0.15 | ) | | | | | | | | | | | | | | | | |
| | | | | | | | | | | | | | | | | | | | | |
Net asset value per share, end of period | | | $ | 13.01 | | | | | | | | | | | | | | | | | |
| | | | | | | | | | | | | | | | | | | | | |
Total return | | | | 9.46 | %(b) | | | | | | | | | | | | | | | | |
Ratios/Supplemental Data: | | | | | | | | | | | | | | | | | | | | | |
Net Assets at end of period (000) | | | $ | 109 | | | | | | | | | | | | | | | | | |
Ratio of total expenses to average net assets: | | | | | | | | | | | | | | | | | | | | | |
Before waivers | | | | 3.31 | %(c) | | | | | | | | | | | | | | | | |
After waivers | | | | 1.61 | %(c) | | | | | | | | | | | | | | | | |
Ratio of interest expense to average net assets | | | | 0.01 | %(c) | | | | | | | | | | | | | | | | |
Ratio of expenses to average net assets excluding interest expense: | | | | | | | | | | | | | | | | | | | | | |
Before waivers | | | | 3.30 | %(c) | | | | | | | | | | | | | | | | |
After waivers | | | | 1.60 | %(c) | | | | | | | | | | | | | | | | |
Ratio of net investment income to average net assets | | | | 8.74 | %(c) | | | | | | | | | | | | | | | | |
Portfolio turnover rate (d) | | | | 43 | %(b) | | | | | | | | | | | | | | | | |
| | |
| | |
|
(a) | Class A commenced operations on December 30, 2011. |
| |
(b) | Not annualized. |
| |
(c) | Annualized. |
| |
(d) | Portfolio turnover is calculated on the basis of the Fund as a whole, without distinguishing between classes of shares issued. |
The accompanying notes are an integral part of these financial statements.
94
Financial Highlights—Continued
(For a share outstanding throughout each period)
| | | | | | | | | | | | | | | | | |
| | | |
| | Accelerating Dividend Fund | |
| | | |
| | Six Months
Ended
April 30,
2012 | | Year Ended
October 31, | | Period
Ended
October 31,
2009 (a) | |
| | | | |
| | | | | |
| | | 2011 | | 2010 | | |
| | | | | | | | | |
| | (Unaudited) | | | | | | | |
Institutional Class Shares: | | | | | | | | | | | | | | | |
Net asset value per share, beginning of period | | | $ | 12.83 | | | $ | 12.80 | | $ | 11.48 | | | $ | 10.00 | | |
| | | | | | | | | | | | | | | | | |
Income from investment operations: | | | | | | | | | | | | | | | | | |
Net investment income | | | | 0.51 | | | | 0.51 | | | 0.51 | | | | 0.12 | (b) | |
Net realized and unrealized gains on investments | | | | 0.72 | | | | 0.32 | | | 1.29 | | | | 1.36 | | |
| | | | | | | | | | | | | | | | | |
Total from investment operations | | | | 1.23 | | | | 0.83 | | | 1.80 | | | | 1.48 | | |
| | | | | | | | | | | | | | | | | |
Redemption fees | | | | — | | | | 0.00 | (c) | | 0.00 | (c) | | | — | | |
Less distributions from: | | | | | | | | | | | | | | | | | |
Net investment income | | | | (0.26 | ) | | | (0.58 | ) | | (0.45 | ) | | | — | | |
Net realized gains on investments | | | | (0.80 | ) | | | (0.22 | ) | | (0.03 | ) | | | — | | |
| | | | | | | | | | | | | | | | | |
Total distributions | | | | (1.06 | ) | | | (0.80 | ) | | (0.48 | ) | | | — | | |
| | | | | | | | | | | | | | | | | |
Net asset value per share, end of period | | | $ | 13.00 | | | $ | 12.83 | | $ | 12.80 | | | $ | 11.48 | | |
| | | | | | | | | | | | | | | | | |
Total return | | | | 10.24 | %(d) | | | 6.43 | % | | 16.06 | % | | | 14.80 | %(d) | |
Ratios/Supplemental Data: | | | | | | | | | | | | | | | | | |
Net Assets at end of period (000) | | | $ | 2,598 | | | $ | 3,218 | | $ | 2,393 | | | $ | 1,215 | | |
Ratio of total expenses to average net assets: | | | | | | | | | | | | | | | | | |
Before waivers | | | | 3.05 | %(e) | | | 2.64 | % | | 2.70 | % | | | 5.26 | %(e) | |
After waivers | | | | 1.36 | %(e) | | | 1.35 | % | | 1.35 | % | | | 1.35 | %(e) | |
Ratio of interest expense to average net assets | | | | 0.01 | %(e) | | | 0.00 | % | | 0.00 | % | | | 0.00 | % | |
Ratio of expenses to average net assets excluding interest expense: | | | | | | | | | | | | | | | | | |
Before waivers | | | | 3.04 | %(e) | | | 2.64 | % | | 2.70 | % | | | 5.26 | %(e) | |
After waivers | | | | 1.35 | %(e) | | | 1.35 | % | | 1.35 | % | | | 1.35 | %(e) | |
Ratio of net investment income to average net assets | | | | 7.32 | %(e) | | | 4.09 | % | | 4.85 | % | | | 1.19 | %(e) | |
Portfolio turnover (f) | | | | 43 | %(d) | | | 137 | % | | 225 | % | | | 104 | %(d) | |
| | |
| | |
|
(a) | For the period from November 5, 2008 (inception of fund) to October 31, 2009. |
| |
(b) | Net investment income per share is calculated using ending balances after consideration of adjustments for permanent book and tax differences. |
| |
(c) | The amount is less than $0.005 per share. |
| |
(d) | Not annualized. |
| |
(e) | Annualized. |
| |
(f) | Portfolio turnover is calculated on the basis of the Fund as a whole, without distinguishing between classes of shares issued. |
The accompanying notes are an integral part of these financial statements.
95
Financial Highlights—Continued
(For a share outstanding throughout each period)
| | | | | | | | | | | | | | | | | | | | | |
| | | |
| | Financial Services Fund | |
| | | |
| | Period
Ended
April 30,
2012 (a) | | | | | | | | | | | | | | | | |
| | | | | | | | | | | | | | | | | | |
| | (Unaudited) | | | | | | | | | | | | | | | | |
Class A Shares: | | | | | | | | | | | | | | | | | | | | | |
Net asset value per share, beginning of period | | | $ | 6.90 | | | | | | | | | | | | | | | | | |
| | | | | | | | | | | | | | | | | | | | | |
Income from investment operations: | | | | | | | | | | | | | | | | | | | | | |
Net investment loss | | | | (0.01 | ) | | | | | | | | | | | | | | | | |
Net realized and unrealized gain on investments | | | | 1.37 | | | | | | | | | | | | | | | | | |
| | | | | | | | | | | | | | | | | | | | | |
Total from investment operations | | | | 1.36 | | | | | | | | | | | | | | | | | |
| | | | | | | | | | | | | | | | | | | | | |
Redemption fees | | | | — | | | | | | | | | | | | | | | | | |
Less distributions from: | | | | | | | | | | | | | | | | | | | | | |
Net investment income | | | | — | | | | | | | | | | | | | | | | | |
Net realized gains on investments | | | | — | | | | | | | | | | | | | | | | | |
| | | | | | | | | | | | | | | | | | | | | |
Total distributions | | | | — | | | | | | | | | | | | | | | | | |
| | | | | | | | | | | | | | | | | | | | | |
Net asset value per share, end of period | | | $ | 8.26 | | | | | | | | | | | | | | | | | |
| | | | | | | | | | | | | | | | | | | | | |
Total return | | | | 19.71 | %(b) | | | | | | | | | | | | | | | | |
Ratios/Supplemental Data: | | | | | | | | | | | | | | | | | | | | | |
Net Assets at end of period (000) | | | $ | 120 | | | | | | | | | | | | | | | | | |
Ratio of total expenses to average net assets: | | | | | | | | | | | | | | | | | | | | | |
Before waivers | | | | 2.18 | %(c) | | | | | | | | | | | | | | | | |
After waivers | | | | 1.64 | %(c) | | | | | | | | | | | | | | | | |
Ratio of interest expense to average net assets | | | | 0.04 | %(c) | | | | | | | | | | | | | | | | |
Ratio of expenses to average net assets excluding interest expense: | | | | | | | | | | | | | | | | | | | | | |
Before waivers | | | | 2.15 | %(c) | | | | | | | | | | | | | | | | |
After waivers | | | | 1.60 | %(c) | | | | | | | | | | | | | | | | |
Ratio of net investment loss to average net assets | | | | (0.51 | )%(c) | | | | | | | | | | | | | | | | |
Portfolio turnover rate (d) | | | | 44 | %(b) | | | | | | | | | | | | | | | | |
| | |
| | |
|
(a) | Class A commenced operations on December 30, 2011. |
| |
(b) | Not annualized. |
| |
(c) | Annualized. |
| |
(d) | Portfolio turnover is calculated on the basis of the Fund as a whole, without distinguishing between classes of shares issued. |
The accompanying notes are an integral part of these financial statements.
96
Financial Highlights—Continued
(For a share outstanding throughout each period)
| | | | | | | | | | | | | | | | | | | | | |
| | | |
| | Financial Services Fund | |
| | | |
| | Six Months | | Year Ended | |
| | Ended | | |
| | April 30, | | October 31, | |
| | 2012 | | 2011 | | 2010 | | 2009 | | 2008 | | 2007 | |
| | | | | | | | | | | | | |
| | (Unaudited) | | | | | | | | | | | |
Institutional Class Shares: | | | | | | | | | | | | | | | | | | | | | |
Net asset value per share, beginning of period | | | $ | 7.15 | | | $ | 7.69 | | $ | 6.86 | | $ | 6.24 | | $ | 13.89 | | $ | 12.13 | |
| | | | | | | | | | | | | | | | | | | | | |
Income from investment operations: | | | | | | | | | | | | | | | | | | | | | |
Net investment income (loss) | | | | 0.00 | (b) | | | 0.02 | | | (0.01 | ) | | 0.03 | (a) | | 0.07 | (a) | | (0.02 | ) |
Net realized and unrealized gains (losses) on investments | | | | 1.14 | | | | (0.54 | ) | | 0.84 | | | 1.10 | | | (4.40 | ) | | 2.54 | |
| | | | | | | | | | | | | | | | | | | | | |
Total from investment operations | | | | 1.14 | | | | (0.52 | ) | | 0.83 | | | 1.13 | | | (4.33 | ) | | 2.52 | |
| | | | | | | | | | | | | | | | | | | | | |
Redemption fees | | | | 0.00 | (b) | | | 0.00 | (b) | | 0.00 | (b) | | 0.00 | (b) | | 0.01 | | | 0.00 | (b) |
Less distributions from: | | | | | | | | | | | | | | | | | | | | | |
Net investment income | | | | (0.02 | ) | | | (0.01 | ) | | — | | | (0.10 | ) | | — | | | (0.01 | ) |
Net realized gains on investments | | | | — | | | | — | | | — | | | (0.41 | ) | | (3.33 | ) | | (0.75 | ) |
Tax return of capital | | | | — | | | | (0.01 | ) | | — | | | (0.00 | )(b) | | — | | | — | |
| | | | | | | | | | | | | | | | | | | | | |
Total distributions | | | | (0.02 | ) | | | (0.02 | ) | | — | | | (0.51 | ) | | (3.33 | ) | | (0.76 | ) |
| | | | | | | | | | | | | | | | | | | | | |
Net asset value per share, end of period | | | $ | 8.27 | | | $ | 7.15 | | $ | 7.69 | | $ | 6.86 | | $ | 6.24 | | $ | 13.89 | |
| | | | | | | | | | | | | | | | | | | | | |
Total return | | | | 15.94 | %(c) | | | (6.77 | )% | | 12.26 | % | | 21.83 | % | | (41.16 | )% | | 21.64 | % |
Ratios/Supplemental Data: | | | | | | | | | | | | | | | | | | | | | |
Net Assets at end of period (000) | | | $ | 7,625 | | | $ | 6,251 | | $ | 7,718 | | $ | 7,895 | | $ | 6,677 | | $ | 10,820 | |
Ratio of total expenses to average net assets: | | | | | | | | | | | | | | | | | | | | | |
Before waivers | | | | 2.03 | %(d) | | | 1.85 | % | | 1.85 | % | | 2.06 | % | | 1.94 | % | | 2.61 | % |
After waivers | | | | 1.41 | %(d) | | | 1.44 | % | | 1.43 | % | | 1.44 | % | | 1.35 | % | | 1.35 | % |
Ratio of interest expense to average net assets | | | | 0.06 | %(d) | | | 0.09 | % | | 0.08 | % | | 0.09 | % | | 0.37 | % | | 1.02 | % |
Ratio of expenses to average net assets excluding interest expense: | | | | | | | | | | | | | | | | | | | | | |
Before waivers | | | | 1.97 | %(d) | | | 1.75 | % | | 1.77 | % | | 1.97 | % | | 1.57 | % | | 1.59 | % |
After waivers | | | | 1.35 | %(d) | | | 1.35 | % | | 1.35 | % | | 1.35 | % | | 0.98 | % | | 0.33 | % |
Ratio of net investment income (loss) to average net assets | | | | 0.06 | %(d) | | | 0.30 | % | | (0.09 | )% | | 0.39 | % | | 1.32 | % | | (0.16 | )% |
Portfolio turnover (e) | | | | 44 | %(c) | | | 73 | % | | 133 | % | | 437 | % | | 455 | % | | 397 | % |
| | |
| | |
|
(a) | Net investment income per share is calculated using ending balances after consideration of adjustments for permanent book and tax differences. |
| |
(b) | The amount is less than $0.005 per share. |
| |
(c) | Not annualized. |
| |
(d) | Annualized. |
| |
(e) | Portfolio turnover is calculated on the basis of the Fund as a whole, without distinguishing between classes of shares issued. |
The accompanying notes are an integral part of these financial statements.
97
Financial Highlights—Continued
(For a share outstanding throughout each period)
| | | | | | | | | | | | | | | | | | | | | |
| | | |
| | Innovators Fund | |
| | | |
| | Period
Ended
April 30,
2012 (a) | | | | | | | | | | | | | | | |
| | | | | | | | | | | | | | | | | |
| | (Unaudited) | | | | | | | | | | | | | | | |
Class A Shares: | | | | | | | | | | | | | | | | | | | | | |
Net asset value per share, beginning of period | | | $ | 10.17 | | | | | | | | | | | | | | | | | |
| | | | | | | | | | | | | | | | | | | | | |
Income from investment operations: | | | | | | | | | | | | | | | | | | | | | |
Net investment loss | | | | (0.04 | ) | | | | | | | | | | | | | | | | |
Net realized and unrealized gain on investments | | | | 2.19 | | | | | | | | | | | | | | | | | |
| | | | | | | | | | | | | | | | | | | | | |
Total from investment operations | | | | 2.15 | | | | | | | | | | | | | | | | | |
| | | | | | | | | | | | | | | | | | | | | |
Redemption fees | | | | — | | | | | | | | | | | | | | | | | |
Less distributions from: | | | | | | | | | | | | | | | | | | | | | |
Net investment income | | | | — | | | | | | | | | | | | | | | | | |
Net realized gains on investments | | | | — | | | | | | | | | | | | | | | | | |
| | | | | | | | | | | | | | | | | | | | | |
Total distributions | | | | — | | | | | | | | | | | | | | | | | |
| | | | | | | | | | | | | | | | | | | | | |
Net asset value per share, end of period | | | $ | 12.32 | | | | | | | | | | | | | | | | | |
| | | | | | | | | | | | | | | | | | | | | |
Total return | | | | 21.14 | %(b) | | | | | | | | | | | | | | | | |
Ratios/Supplemental Data: | | | | | | | | | | | | | | | | | | | | | |
Net Assets at end of period (000) | | | $ | 158 | | | | | | | | | | | | | | | | | |
Ratio of total expenses to average net assets: | | | | | | | | | | | | | | | | | | | | | |
Before waivers | | | | 1.78 | %(c) | | | | | | | | | | | | | | | | |
After waivers | | | | 1.60 | %(c) | | | | | | | | | | | | | | | | |
Ratio of net investment loss to average net assets | | | | (1.35 | )%(c) | | | | | | | | | | | | | | | | |
Portfolio turnover rate (d) | | | | 17 | %(b) | | | | | | | | | | | | | | | | |
| | |
| | |
|
(a) | Class A commenced operations on December 30, 2011. |
| |
(b) | Not annualized. |
| |
(c) | Annualized. |
| |
(d) | Portfolio turnover is calculated on the basis of the Fund as a whole, without distinguishing between classes of shares issued. |
The accompanying notes are an integral part of these financial statements.
98
Financial Highlights—Continued
(For a share outstanding throughout each period)
| | | | | | | | | | | | | | | | | | | | | |
| | | |
| | Innovators Fund | |
| | | |
| | Six Months
Ended
April 30,
2012 | | Year Ended
October 31, | |
| | | | |
| | | 2011 | | 2010 | | 2009 | | 2008 | | 2007 | |
| | | | | | | | | | | | | |
| | (Unaudited) | | | | | | | | | | | | | | | | |
Institutional Class Shares: | | | | | | | | | | | | | | | | | | | | | |
Net asset value per share, beginning of period | | | $ | 10.48 | | | $ | 10.14 | | $ | 8.13 | | $ | 6.83 | | $ | 14.08 | | $ | 10.31 | |
Income from investment operations: | | | | | | | | | | | | | | | | | | | | | |
Net investment income (loss) | | | | (0.06 | ) | | | (0.11 | ) | | (0.10 | ) | | — | (a) | | (0.01 | )(a) | | 0.07 | |
Net realized and unrealized gains (losses) on investments | | | | 1.92 | | | | 0.45 | | | 2.11 | | | 1.30 | | | (6.84 | ) | | 3.91 | |
Total from investment operations | | | | 1.86 | | | | 0.34 | | | 2.01 | | | 1.30 | | | (6.85 | ) | | 3.98 | |
Redemption fees | | | | 0.00 | (b) | | | 0.00 | (b) | | 0.00 | (b) | | 0.00 | (b) | | 0.03 | | | 0.01 | |
Less distributions from: | | | | | | | | | | | | | | | | | | | | | |
Net investment income | | | | — | | | | — | | | — | | | — | | | (0.02 | ) | | (0.14 | ) |
Net realized gains on investments | | | | — | | | | — | | | — | | | — | | | (0.41 | ) | | (0.08 | ) |
Total distributions | | | | — | | | | — | | | — | | | — | | | (0.43 | ) | | (0.22 | ) |
Net asset value per share, end of period | | | $ | 12.34 | | | $ | 10.48 | | $ | 10.14 | | $ | 8.13 | | $ | 6.83 | | $ | 14.08 | |
| | | | | | | | | | | | | | | | | | | | | |
Total return | | | | 17.75 | %(c) | | | 3.35 | % | | 24.72 | % | | 19.03 | % | | (49.95 | )% | | 39.47 | % |
Ratios/Supplemental Data: | | | | | | | | | | | | | | | | | | | | | |
Net Assets at end of period (000) | | | $ | 12,545 | | | $ | 10,383 | | $ | 11,847 | | $ | 11,108 | | $ | 15,383 | | $ | 48,355 | |
Ratio of total expenses to average net assets: | | | | | | | | | | | | | | | | | | | | | |
Before waivers | | | | 1.56 | %(d) | | | 1.59 | % | | 1.70 | % | | 1.86 | % | | 1.31 | % | | 1.53 | % |
After waivers | | | | 1.36 | %(d) | | | 1.41 | % | | 1.44 | % | | 1.54 | % | | 1.35 | % | | 1.33 | % |
Ratio of interest expense to average net assets | | | | 0.01 | %(d) | | | 0.06 | % | | 0.09 | % | | 0.19 | % | | 0.04 | % | | 0.00 | % |
Ratio of expenses to average net assets excluding interest expense: | | | | | | | | | | | | | | | | | | | | | |
Before waivers | | | | 1.55 | %(d) | | | 1.53 | % | | 1.61 | % | | 1.67 | % | | 1.27 | % | | 1.53 | % |
After waivers | | | | 1.35 | %(d) | | | 1.35 | % | | 1.35 | % | | 1.35 | % | | 1.31 | % | | 1.33 | % |
Ratio of net investment income (loss) to average net assets | | | | (1.05 | )%(d) | | | (0.97 | )% | | (1.01 | )% | | (0.92 | )% | | (0.18 | )% | | 1.08 | % |
Portfolio turnover (e) | | | | 17 | %(c) | | | 18 | % | | 22 | % | | 20 | % | | 76 | % | | 135 | % |
| | |
| |
| |
(a) | Net investment income per share is calculated using ending balances after consideration of adjustments for permanent book and tax differences. |
| | |
(b) | The amount is less than $0.005 per share. |
| |
(c) | Not annualized. |
| |
(d) | Annualized. |
| |
(e) | Portfolio turnover is calculated on the basis of the Fund as a whole, without distinguishing between classes of shares issued. |
The accompanying notes are an integral part of these financial statements.
99
Financial Highlights—Continued
(For a share outstanding throughout each period)
| | | | | | | | | | | | | | | | | | | | | |
| | Transformations Fund | |
| | Period
Ended
April 30,
2012 (a) | | | | | | | | | | | | | | | | |
| | (Unaudited) | | | | | | | | | | | | | | | | |
Class A Shares: | | | | | | | | | | | | | | | | | | | | | |
Net asset value per share, beginning of period | | | $ | 11.22 | | | | | | | | | | | | | | | | | |
Income from investment operations: | | | | | | | | | | | | | | | | | | | | | |
Net investment loss | | | | (0.04 | ) | | | | | | | | | | | | | | | | |
Net realized and unrealized gain on investments | | | | 1.87 | | | | | | | | | | | | | | | | | |
Total from investment operations | | | | 1.83 | | | | | | | | | | | | | | | | | |
Redemption fees | | | | — | | | | | | | | | | | | | | | | | |
Less distributions from: | | | | | | | | | | | | | | | | | | | | | |
Net investment income | | | | — | | | | | | | | | | | | | | | | | |
Net realized gains on investments | | | | — | | | | | | | | | | | | | | | | | |
Total distributions | | | | — | | | | | | | | | | | | | | | | | |
Net asset value per share, end of period | | | $ | 13.05 | | | | | | | | | | | | | | | | | |
| | | | | | | | | | | | | | | | | | | | | |
Total return | | | | 16.31 | %(b) | | | | | | | | | | | | | | | | |
Ratios/Supplemental Data: | | | | | | | | | | | | | | | | | | | | | |
Net Assets at end of period (000) | | | $ | 116 | | | | | | | | | | | | | | | | | |
Ratio of total expenses to average net assets: | | | | | | | | | | | | | | | | | | | | | |
Before waivers | | | | 1.96 | %(c) | | | | | | | | | | | | | | | | |
After waivers | | | | 1.60 | %(c) | | | | | | | | | | | | | | | | |
Ratio of net investment loss to average net assets | | | | (0.94 | )%(c) | | | | | | | | | | | | | | | | |
Portfolio turnover rate (d) | | | | 34 | %(b) | | | | | | | | | | | | | | | | |
| | |
| |
| | |
(a) | Class A commenced operations on December 30, 2011. |
| | |
(b) | Not annualized. |
| | |
(c) | Annualized. |
| | |
(d) | Portfolio turnover is calculated on the basis of the Fund as a whole, without distinguishing between classes of shares issued. |
The accompanying notes are an integral part of these financial statements.
100
Financial Highlights—Continued
(For a share outstanding throughout each period)
| | | | | | | | | | | | | | | | | | | | |
| | Transformations Fund | |
| | Six Months
Ended
April 30,
2012 | | | | | | | | Period
Ended
October 31,
2008 (a) | |
| | | Year Ended
October 31, | | |
| | | 2011 | | 2010 | | 2009 | | |
| | (Unaudited) | | | | | | | | | |
Institutional Class Shares: | | | | | | | | | | | | | | | | | | | | |
Net asset value per share, beginning of period | | | $ | 11.75 | | | $ | 10.30 | | $ | 7.68 | | $ | 5.79 | | | $ | 10.00 | | |
Income from investment operations: | | | | | | | | | | | | | | | | | | | | |
Net investment income (loss) | | | | (0.04 | ) | | | (0.07 | ) | | (0.06 | ) | | 0.01 | (b) | | | 0.03 | (b) | |
Net realized and unrealized gains (losses) on investments | | | | 1.35 | | | | 1.52 | | | 2.68 | | | 1.92 | | | | (4.24 | ) | |
Total from investment operations | | | | 1.31 | | | | 1.45 | | | 2.62 | | | 1.93 | | | | (4.21 | ) | |
Redemption fees | | | | 0.00 | (c) | | | 0.00 | (c) | | 0.00 | (c) | | 0.00 | (c) | | | 0.00 | (c) | |
Less distributions from: | | | | | | | | | | | | | | | | | | | | |
Net investment income | | | | — | | | | — | | | — | | | (0.03 | ) | | | — | | |
Net realized gains on investments | | | | — | | | | — | | | — | | | — | | | | — | | |
Tax return of capital | | | | — | | | | — | | | — | | | (0.01 | ) | | | — | | |
Total distributions | | | | — | | | | — | | | — | | | (0.04 | ) | | | — | | |
Net asset value per share, end of period | | | $ | 13.06 | | | $ | 11.75 | | $ | 10.30 | | $ | 7.68 | | | $ | 5.79 | | |
| | | | | | | | | | | | | | | | | | | | |
Total return | | | | 11.15 | %(d) | | | 14.08 | % | | 34.11 | % | | 33.61 | % | | | (42.10 | )%(d) | |
Ratios/Supplemental Data: | | | | | | | | | | | | | | | | | | | | |
Net Assets at end of period (000) | | | $ | 7,561 | | | $ | 6,267 | | $ | 5,294 | | $ | 3,514 | | | $ | 2,649 | | |
Ratio of total expenses to average net assets: | | | | | | | | | | | | | | | | | | | | |
Before waivers | | | | 1.74 | %(e) | | | 1.68 | % | | 2.17 | % | | 2.86 | % | | | 2.95 | %(e) | |
After waivers | | | | 1.35 | %(e) | | | 1.35 | % | | 1.37 | % | | 1.35 | % | | | 1.35 | %(e) | |
Ratio of interest expense to average net assets | | | | 0.00 | % | | | 0.00 | %(c) | | 0.02 | % | | 0.00 | %(c) | | | 0.00 | % | |
Ratio of expenses to average net assets excluding interest expense: | | | | | | | | | | | | | | | | | | | | |
Before waivers | | | | 1.74 | %(e) | | | 1.68 | % | | 2.15 | % | | 2.86 | % | | | 2.95 | %(e) | |
After waivers | | | | 1.35 | %(e) | | | 1.35 | % | | 1.35 | % | | 1.35 | % | | | 1.35 | %(e) | |
Ratio of net investment income (loss) to average net assets | | | | (0.62 | )%(e) | | | (0.60 | )% | | (0.68 | )% | | (0.16 | )% | | | 0.44 | %(e) | |
Portfolio turnover (f) | | | | 34 | %(d) | | | 72 | % | | 52 | % | | 57 | % | | | 108 | %(d) | |
| | |
| |
| | |
(a) | For the period from December 31, 2007 (inception of the fund) to October 31, 2008. |
| | |
(b) | Net investment income per share is calculated using ending balances after consideration of adjustments for permanent book and tax differences. |
| | |
(c) | The amount is less than $0.005 per share or 0.005%. |
| | |
(d) | Not annualized. |
| | |
(e) | Annualized. |
| | |
(f) | Portfolio turnover is calculated on the basis of the Fund as a whole, without distinguishing between classes of shares issued. |
The accompanying notes are an integral part of these financial statements.
101
Financial Highlights—Continued
(For a share outstanding throughout each period)
| | | | | | | | | | | | | | | | | | | | |
| | Foundation Fund | |
| | Period
Ended
April 30,
2012 (a) | | | | | | | | | | | | | |
| | (Unaudited) | | | | | | | | | | | | | |
Class A Shares: | | | | | | | | | | | | | | | | |
Net asset value per share, beginning of period | | | $ | 10.61 | | | | | | | | | | | | | | |
Income from investment operations: | | | | | | | | | | | | | | | | | | |
Net investment income | | | | 0.05 | | | | | | | | | | | | | | |
Net realized and unrealized gain on investments | | | | 0.79 | | | | | | | | | | | | | | |
Total from investment operations | | | | 0.84 | | | | | | | | | | | | | | |
Redemption fees | | | | — | | | | | | | | | | | | | | |
Less distributions from: | | | | | | | | | | | | | | | | | | |
Net investment income | | | | (0.04 | ) | | | | | | | | | | | | | |
Net realized gains on investments | | | | — | | | | | | | | | | | | | | |
Total distributions | | | | (0.04 | ) | | | | | | | | | | | | | |
Net asset value per share, end of period | | | $ | 11.41 | | | | | | | | | | | | | | |
| | | | | | | | | | | | | | | | | | |
Total return | | | | 7.92 | %(b) | | | | | | | | | | | | | |
Ratios/Supplemental Data: | | | | | | | | | | | | | | | | | | |
Net Assets at end of period (000) | | | $ | 108 | | | | | | | | | | | | | | |
Ratio of total expenses to average net assets | | | | 1.49 | %(c) | | | | | | | | | | | | | |
Ratio of net investment income to average net assets | | | | 1.34 | %(c) | | | | | | | | | | | | | |
Portfolio turnover rate (d) | | | | 14 | %(b) | | | | | | | | | | | | | |
| | |
| |
| | |
(a) | Class A commenced operations on December 30, 2011. |
| | |
(b) | Not annualized. |
| | |
(c) | Annualized. |
| | |
(d) | Portfolio turnover is calculated on the basis of the Fund as a whole, without distinguishing between classes of shares issued. |
The accompanying notes are an integral part of these financial statements.
102
Financial Highlights—Continued
(For a share outstanding throughout each period)
| | | | | | | | | | | | | | | | | | | | | |
| | | |
| | Foundation Fund | |
| | | |
| | Six Months
Ended
April 30,
2012 | | Year Ended
October 31, | |
| | | | |
| | | 2011 | | 2010 | | 2009 | | 2008 | | 2007 | |
| | | | | | | | | | | | | |
| | (Unaudited) | | | | | | | | | | | | | | | | |
Institutional Class Shares: | | | | | | | | | | | | | | | | | | | | | |
Net asset value per share, beginning of period | | | $ | 10.61 | | | $ | 10.16 | | $ | 8.88 | | $ | 8.15 | | $ | 13.55 | | $ | 13.72 | |
| | | | | | | | | | | | | | | | | | | | | |
Income from investment operations: | | | | | | | | | | | | | | | | | | | | | |
Net investment income | | | | 0.10 | | | | 0.16 | | | 0.12 | | | 0.13 | (a) | | 0.26 | (a) | | 0.26 | |
Net realized and unrealized gains (losses) on investments | | | | 0.79 | | | | 0.47 | | | 1.27 | | | 0.75 | | | (4.47 | ) | | 0.28 | |
| | | | | | | | | | | | | | | | | | | | | |
Total from investment operations | | | | 0.89 | | | | 0.63 | | | 1.39 | | | 0.88 | | | (4.21 | ) | | 0.54 | |
| | | | | | | | | | | | | | | | | | | | | |
Redemption fees | | | | — | | | | 0.00 | (b) | | 0.00 | (b) | | 0.00 | (b) | | 0.00 | (b) | | 0.00 | (b) |
Less distributions from: | | | | | | | | | | | | | | | | | | | | | |
Net investment income | | | | (0.09 | ) | | | (0.18 | ) | | (0.11 | ) | | (0.13 | ) | | (0.25 | ) | | (0.24 | ) |
Net realized gains on investments | | | | — | | | | — | | | — | | | — | | | (0.93 | ) | | (0.47 | ) |
Tax return of capital | | | | — | | | | — | | | — | | | (0.02 | ) | | (0.01 | ) | | — | |
| | | | | | | | | | | | | | | | | | | | | |
Total distributions | | | | (0.09 | ) | | | (0.18 | ) | | (0.11 | ) | | (0.15 | ) | | (1.19 | ) | | (0.71 | ) |
| | | | | | | | | | | | | | | | | | | | | |
Net asset value per share, end of period | | | $ | 11.41 | | | $ | 10.61 | | $ | 10.16 | | $ | 8.88 | | $ | 8.15 | | $ | 13.55 | |
| | | | | | | | | | | | | | | | | | | | | |
Total return | | | | 8.44 | %(c) | | | 6.19 | % | | 15.77 | % | | 11.03 | % | | (33.63 | )% | | 4.03 | % |
Ratios/Supplemental Data: | | | | | | | | | | | | | | | | | | | | | |
Net Assets at end of period (000) | | | $ | 65,209 | | | $ | 61,701 | | $ | 62,934 | | $ | 55,230 | | $ | 53,097 | | $ | 92,360 | |
Ratio of total expenses to average net assets | | | | 1.21 | %(d) | | | 1.16 | % | | 1.23 | % | | 1.26 | % | | 1.24 | % | | 1.16 | % |
Ratio of interest expense to average net assets | | | | 0.00 | % | | | 0.00 | % | | 0.00 | % | | 0.00 | %(b) | | 0.90 | % | | 0.00 | %(b) |
Ratio of expenses to average net assets excluding interest expense | | | | 1.21 | %(d) | | | 1.16 | % | | 1.23 | % | | 1.26 | % | | 1.15 | % | | 1.16 | % |
Ratio of net investment income to average net assets | | | | 1.78 | %(d) | | | 1.46 | % | | 1.22 | % | | 1.65 | % | | 2.35 | % | | 1.87 | % |
Portfolio turnover (e) | | | | 14 | %(c) | | | 34 | % | | 16 | % | | 41 | % | | 34 | % | | 28 | % |
| | |
| | |
|
(a) | Net investment income per share is calculated using ending balances after consideration of adjustments for permanent book and tax differences. |
| |
(b) | The amount is less than $0.005 per share or 0.005%. |
| |
(c) | Not annualized. |
| |
(d) | Annualized. |
| |
(e) | Portfolio turnover is calculated on the basis of the Fund as a whole, without distinguishing between classes of shares issued. |
The accompanying notes are an integral part of these financial statements.
103
Financial Highlights—Continued
(For a share outstanding throughout each period)
| | | | | | | | | | | | | | | | | | | | | |
| | | |
| | Ultra Short Tax Optimized Income Fund | |
| | | |
| | Six Months
Ended
April 30,
2012 | | Year Ended
October 31, | |
| | | | |
| | | 2011 | | 2010 | | 2009 | | 2008 | | 2007 | |
| | | | | | | | | | | | | |
| | (Unaudited) | | | | | | | | | | | | | | | | |
Class A Shares: | | | | | | | | | | | | | | | | | | | | | |
Net asset value per share, beginning of period | | | $ | 10.10 | | | $ | 10.10 | | $ | 10.10 | | $ | 10.05 | | $ | 10.10 | | $ | 10.10 | |
| | | | | | | | | | | | | | | | | | | | | |
Income from investment operations: | | | | | | | | | | | | | | | | | | | | | |
Net investment income | | | | 0.05 | | | | 0.16 | | | 0.10 | | | 0.30 | (a) | | 0.38 | (a) | | 0.38 | |
Net realized and unrealized gain (loss) on investments | | | | (0.00 | )(b) | | | (0.00 | )(b) | | 0.01 | | | 0.04 | | | (0.04 | ) | | 0.00 | (b) |
| | | | | | | | | | | | | | | | | | | | | |
Total from investment operations | | | | 0.05 | | | | 0.16 | | | 0.11 | | | 0.34 | | | 0.34 | | | 0.38 | |
| | | | | | | | | | | | | | | | | | | | | |
Redemption fees | | | | 0.00 | (b) | | | 0.00 | (b) | | 0.00 | (b) | | 0.00 | (b) | | 0.00 | (b) | | 0.00 | (b) |
Less distributions from: | | | | | | | | | | | | | | | | | | | | | |
Net investment income | | | | (0.05 | ) | | | (0.16 | ) | | (0.11 | ) | | (0.29 | ) | | (0.39 | ) | | (0.38 | ) |
Net realized gains on investments | | | | — | | | | — | | | — | | | — | | | — | | | — | |
| | | | | | | | | | | | | | | | | | | | | |
Total distributions | | | | (0.05 | ) | | | (0.16 | ) | | (0.11 | ) | | (0.29 | ) | | (0.39 | ) | | (0.38 | ) |
| | | | | | | | | | | | | | | | | | | | | |
Net asset value per share, end of period | | | $ | 10.10 | | | $ | 10.10 | | $ | 10.10 | | $ | 10.10 | | $ | 10.05 | | $ | 10.10 | |
| | | | | | | | | | | | | | | | | | | | | |
| | | | | | | | | | | | | | | | | | | | | |
Total return | | | | 0.49 | %(c) | | | 1.61 | % | | 1.05 | % | | 3.40 | % | | 3.39 | % | | 3.82 | % |
Ratios/Supplemental Data | | | | | | | | | | | | | | | | | | | | | |
Net Assets at end of period (000) | | | $ | 460,321 | | | $ | 358,284 | | $ | 292,565 | | $ | 211,643 | | $ | 11,568 | | $ | 871,630 | |
Ratio of total expenses to average net assets: | | | | | | | | | | | | | | | | | | | | | |
Before waivers | | | | 1.06 | %(d) | | | 1.07 | % | | 1.03 | % | | 1.05 | % | | 1.08 | % | | 1.14 | % |
After waivers | | | | 0.90 | %(d) | | | 0.88 | % | | 0.78 | % | | 0.85 | % | | 0.85 | % | | 0.85 | % |
Ratio of net investment income to average net assets | | | | 0.96 | %(d) | | | 1.61 | % | | 1.04 | % | | 2.75 | % | | 4.12 | % | | 3.82 | % |
Portfolio turnover rate (e) | | | | 118 | %(c) | | | 174 | % | | 19 | % | | 16 | % | | 129 | % | | 171 | % |
| | |
| | |
|
(a) | Net investment income per share is calculated using ending balances after consideration of adjustments for permanent book and tax differences. |
| |
(b) | The amount is less than $0.005 per share. |
| |
(c) | Not annualized. |
| |
(d) | Annualized. |
| |
(e) | Portfolio turnover is calculated on the basis of the Fund as a whole, without distinguishing between classes of shares issued. Effective January 3, 2012, the share class was renamed Class A. |
The accompanying notes are an integral part of these financial statements.
104
Financial Highlights—Continued
(For a share outstanding throughout each period)
| | | | | | | | | | | | | | | | | | | | | |
| | | |
| | Ultra Short Tax Optimized Income Fund | |
| | | |
| | Six Months
Ended
April 30,
2012 | | Year Ended
October 31, | |
| | | | |
| | | 2011 | | 2010 | | 2009 | | 2008 | | 2007 | |
| | | | | | | | | | | | | |
| | (Unaudited) | | | | | | | | | | | | | | | | |
Institutional Class Shares: | | | | | | | | | | | | | | | | | | | |
Net asset value per share, beginning of period | | | $ | 10.05 | | | $ | 10.05 | | $ | 10.05 | | $ | 10.00 | | $ | 10.04 | | $ | 10.05 | |
| | | | | | | | | | | | | | | | | | | | | |
Income from investment operations: | | | | | | | | | | | | | | | | | | | | | |
Net investment income | | | | 0.06 | | | | 0.19 | | | 0.13 | | | 0.31 | (a) | | 0.41 | (a) | | 0.40 | |
Net realized and unrealized gains (losses) on investments | | | | (0.00 | )(b) | | | (0.00 | )(b) | | (0.00 | )(b) | | 0.05 | | | (0.04 | ) | | (0.01 | ) |
| | | | | | | | | | | | | | | | | | | | | |
Total from investment operations | | | | 0.06 | | | | 0.19 | | | 0.13 | | | 0.36 | | | 0.37 | | | 0.39 | |
| | | | | | | | | | | | | | | | | | | | | |
Redemption fees | | | | 0.00 | (b) | | | 0.00 | (b) | | 0.00 | (b) | | 0.00 | (b) | | 0.00 | (b) | | 0.00 | (b) |
Less distributions from: | | | | | | | | | | | | | | | | | | | | | |
Net investment income | | | | (0.06 | ) | | | (0.19 | ) | | (0.13 | ) | | (0.31 | ) | | (0.41 | ) | | (0.40 | ) |
Net realized gains on investments | | | | — | | | | — | | | — | | | — | | | — | | | — | |
| | | | | | | | | | | | | | | | | | | | | |
Total distributions | | | | (0.06 | ) | | | (0.19 | ) | | (0.13 | ) | | (0.31 | ) | | (0.41 | ) | | (0.40 | ) |
| | | | | | | | | | | | | | | | | | | | | |
Net asset value per share, end of period | | | $ | 10.05 | | | $ | 10.05 | | $ | 10.05 | | $ | 10.05 | | $ | 10.00 | | $ | 10.04 | |
| | | | | | | | | | | | | | | | | | | | | |
Total return | | | | 0.61 | %(c) | | | 1.87 | % | | 1.31 | % | | 3.65 | % | | 3.75 | % | | 3.97 | % |
Ratios/Supplemental Data | | | | | | | | | | | | | | | | | | | | | |
Net Assets at end of period (000) | | | $ | 1,399,422 | | | $ | 1,265,829 | | $ | 1,146,333 | | $ | 1,462,217 | | $ | 231,679 | | $ | 59,409 | |
Ratio of total expenses to average net assets: | | | | | | | | | | | | | | | | | | | | | |
Before waivers | | | | 0.81 | %(d) | | | 0.82 | % | | 0.78 | % | | 0.80 | % | | 0.83 | % | | 0.89 | % |
After waivers | | | | 0.65 | %(d) | | | 0.63 | % | | 0.53 | % | | 0.60 | % | | 0.60 | % | | 0.60 | % |
Ratio of net investment income to average net assets | | | | 1.23 | %(d) | | | 1.86 | % | | 1.29 | % | | 3.00 | % | | 4.37 | % | | 4.07 | % |
Portfolio turnover (e) | | | | 118 | %(c) | | | 174 | % | | 19 | % | | 16 | % | | 129 | % | | 171 | % |
| | |
| | |
|
(a) | Net investment income per share is calculated using ending balances after consideration of adjustments for permanent book and tax differences. |
| |
(b) | The amount is less than $0.005 per share. |
| |
(c) | Not annualized. |
| |
(d) | Annualized. |
| |
(e) | Portfolio turnover is calculated on the basis of the Fund as a whole, without distinguishing between classes of shares issued. Effective January 3, 2012, the share class was renamed the Institutional Class. |
The accompanying notes are an integral part of these financial statements.
105
Financial Highlights—Continued
(For a share outstanding throughout each period)
| | | | | | | | | | | | | | | | | | | | | |
| | | |
| | Municipal Money Market Fund | |
| | | |
| | Six Months
Ended
April 30,
2012 | | Year Ended
October 31, | |
| | | | |
| | | 2011 | | 2010 | | 2009 | | 2008 | | 2007 | |
| | | | | | | | | | | | | |
| | (Unaudited) | | | | | | | | | | | | | | | | |
Institutional Class Shares: | | | | | | | | | | | | | | | | | | | | | |
Net asset value per share, beginning of period | | | $ | 1.00 | | | $ | 1.00 | | $ | 1.00 | | $ | 1.00 | | $ | 1.00 | | $ | 1.00 | |
| | | | | | | | | | | | | | | | | | | | | |
Income from investment operations: | | | | | | | | | | | | | | | | | | | | | |
Net investment income | | | | 0.00 | (a) | | | 0.00 | (a) | | 0.00 | (a) | | 0.01 | (b) | | 0.03 | (b) | | 0.04 | |
| | | | | | | | | | | | | | | | | | | | | |
Total from investment operations | | | | 0.00 | (a) | | | 0.00 | (a) | | 0.00 | (a) | | 0.01 | | | 0.03 | | | 0.04 | |
| | | | | | | | | | | | | | �� | | | | | | | |
Less distributions from: | | | | | | | | | | | | | | | | | | | | | |
Net investment income | | | | (0.00 | )(a) | | | (0.00 | )(a) | | (0.00 | )(a) | | (0.01 | ) | | (0.03 | ) | | (0.04 | ) |
Net realized gains on investments | | | | — | | | | (0.00 | )(a) | | — | | | — | | | — | | | — | |
Tax return of capital | | | | — | | | | — | | | — | | | (0.00 | )(a) | | — | | | — | |
| | | | | | | | | | | | | | | | | | | | | |
Total distributions | | | | (0.00 | )(a) | | | (0.00 | )(a) | | (0.00 | )(a) | | (0.01 | ) | | (0.03 | ) | | (0.04 | ) |
| | | | | | | | | | | | | | | | | | | | | |
Net asset value per share, end of period | | | $ | 1.00 | | | $ | 1.00 | | $ | 1.00 | | $ | 1.00 | | $ | 1.00 | | $ | 1.00 | |
| | | | | | | | | | | | | | | | | | | | | |
Total return | | | | 0.05 | %(c) | | | 0.18 | % | | 0.20 | % | | 1.03 | % | | 2.94 | % | | 3.68 | % |
Ratios/Supplemental Data: | | | | | | | | | | | | | | | | | | | | | |
Net Assets at end of period (000) | | | $ | 257,209 | | | $ | 310,058 | | $ | 470,169 | | $ | 789,832 | | $ | 664,401 | | $ | 1,115,100 | |
Ratio of total expenses to average net assets: | | | | | | | | | | | | | | | | | | | | | |
Before waivers | | | | 0.54 | %(d) | | | 0.52 | % | | 0.48 | % | | 0.53 | % | | 0.49 | % | | 0.49 | % |
After waivers | | | | 0.32 | %(d) | | | 0.38 | % | | 0.43 | % | | 0.53 | % | | 0.35 | % | | 0.26 | % |
Ratio of interest expense to average net assets | | | | 0.00 | % | | | 0.00 | % | | 0.00 | % | | 0.00 | %(a) | | 0.00 | % | | 0.00 | % |
Ratio of expenses to average net assets excluding interest expense: | | | | | | | | | | | | | | | | | | | | | |
Before waivers | | | | 0.54 | %(d) | | | 0.52 | % | | 0.48 | % | | 0.53 | % | | 0.49 | % | | 0.49 | % |
After waivers | | | | 0.32 | %(d) | | | 0.38 | % | | 0.43 | % | | 0.53 | % | | 0.35 | % | | 0.26 | % |
Ratio of net investment income to average net assets | | | | 0.09 | %(d) | | | 0.18 | % | | 0.20 | % | | 0.99 | % | | 2.93 | % | | 3.37 | % |
| | |
| | |
|
(a) | The amount is less than $0.005 per share or 0.005%. |
| |
(b) | Net investment income per share is calculated using ending balances after consideration of adjustments for permanent book and tax differences. |
| |
(c) | Not annualized. |
| |
(d) | Annualized. |
The accompanying notes are an integral part of these financial statements.
106
Notes to Financial Statements
April 30, 2012 (Unaudited)
| |
1. | Organization: |
| |
| Alpine Series Trust (the “Series Trust”) was organized in 2001 as a Delaware statutory trust, and is registered under the Investment Company Act of 1940, as amended (the “1940 Act”), as an open-end management investment company. Alpine Income Trust (the “Income Trust”) was organized in 2002 as a Delaware statutory trust, and is registered under the 1940 Act, as an open-end management investment company. The Alpine Dynamic Dividend Fund, Alpine Accelerating Dividend Fund, Alpine Financial Services Fund (formerly, Alpine Dynamic Financial Services Fund), Alpine Innovators Fund (formerly, Alpine Dynamic Innovators Fund), Alpine Transformations Fund (formerly, Alpine Dynamic Transformations Fund) and Alpine Foundation Fund (formerly, Alpine Dynamic Balance Fund) are six separate funds of the Series Trust. The Alpine Ultra Short Tax Optimized Income Fund and Alpine Municipal Money Market Fund are two separate funds of the Income Trust. The Alpine Dynamic Dividend Fund, Alpine Accelerating Dividend Fund, Alpine Financial Services Fund, Alpine Innovators Fund, Alpine Transformations Fund, Alpine Foundation Fund, Alpine Ultra Short Tax Optimized Income Fund and Alpine Municipal Money Market Fund (individually referred to as a “Fund” and collectively, “the Funds”) are diversified funds. Alpine Woods Capital Investors, LLC (the “Adviser”) is a Delaware limited liability company and serves as the investment manager to the Funds. |
| |
2. | Significant Accounting Policies: |
| |
| The following is a summary of significant accounting policies consistently followed by the Funds in the preparation of their financial statements. The policies are in conformity with accounting principles generally accepted in the United States of America (“GAAP”), which require management to make estimates and assumptions that affect amounts reported herein. Actual results could differ from those estimates. Changes in the economic environment financial markets and any other parameters used in determining these estimates could cause actual results to differ. Subsequent events have been evaluated through the date the financial statements were issued. |
| |
| A. Valuation of Securities: |
| |
| The net asset value (“NAV”) of shares of the Funds are calculated by dividing the value of the Funds’ net assets by the number of outstanding shares. NAV is determined each day the NYSE is open as of the close of regular trading (normally, 4:00 p.m., Eastern time). In computing NAV, portfolio securities of the Funds are valued at their current market values determined on the basis of market quotations or if market quotations are not available or determined to be reliable, through procedures and/or guidelines established by the Board of Trustees. In computing the Fund’s net asset value, equity securities that are traded on a securities exchange in the United States are valued at the last reported sale price as of the time of valuation, or lacking any current reported sale at the time of valuation, at the mean between the most recent bid and asked quotations. Each option security traded on a securities exchange in the United States is valued at the last current reported sale price as of the time of valuation, or lacking any current reported sale at the time of valuation, the option is valued at the mid-point of the consolidated bid/ask quote for the option security. Each security traded in the over-the-counter market and quoted on the NASDAQ National Market System, is valued at the NASDAQ Official Closing Price (“NOCP”), as determined by NASDAQ, or lacking an NOCP, the last current reported sale price as of the time of valuation by NASDAQ, or lacking any current reported sale on NASDAQ at the time of valuation, at the mean between the most recent bid and asked quotations. Each over-the-counter option that is not traded through the Options Clearing Corporation is valued by the counterparty, or if the counterparty’s price is not readily available then by using the Black-Scholes method. Debt securities are valued based on an evaluated mean price as furnished by pricing services approved by the Board of Trustees, which may be based on market transactions for comparable securities and various relationships between securities that are generally recognized by institutional traders, a computerized matrix system, or appraisals derived from information concerning the securities or similar securities received from recognized dealers in those securities. Short-term securities with maturities of 60 days or less are valued at amortized cost, which approximates fair value. |
| |
| Equity securities that are principally traded in a foreign market are valued at the last current sale price at the time of valuation or lacking any current or reported sale, at the time of valuation, at the mean between the most recent bid and asked quotations as of the close of the appropriate exchange or other designated time. |
| |
| Trading in securities on European and Far Eastern securities exchanges and over-the-counter markets is normally completed at various times before the close of business on each day on which the NYSE is open. Trading of these securities may not take place on every NYSE business day. In addition, trading may take place in various foreign |
107
Notes to Financial Statements—Continued
April 30, 2012 (Unaudited)
| | |
| markets on Saturdays or on other days when the NYSE is not open and on which the Fund’s net asset values are not calculated. As stated above, if the market prices are not readily available or not reflective of the fair value of the security, as of the close of the regular trading on the NYSE (normally, 4:00 p.m., Eastern time), the security will be priced at fair value following procedures approved by the Board of Trustees. |
| | |
| When market quotations are not readily available or when the valuation methods mentioned above are not reflective of a fair value of the security, the security is valued at fair value following procedures and/or guidelines approved by the Board of Trustees. The Board has approved the use of Interactive Data’s proprietary fair value pricing model to assist in determining current valuation for foreign securities traded in markets that close prior to the NYSE. When fair value pricing is employed, the value of the portfolio security used to calculate the Fund’s net asset values may differ from quoted or official closing prices. |
| | |
| As of April 30, 2012, the Dynamic Dividend Fund held a security that is fair valued, which comprised 0.4% of the Fund’s net assets. |
| | |
| The Municipal Money Market Fund values its investments at amortized cost, which approximates market value. Pursuant to Rule 2a-7 of the 1940 Act, amortized cost, as defined, is a method of valuing securities at acquisition cost, adjusted for amortization of premium or accretion of discount rather than at their value based on current market factors. |
| | |
| The Fund’s have adopted Financial Accounting Standards Board Codification Topic 820 (“ASC Topic 820”). ASC Topic 820 establishes a single definition of fair value, creates a three-tier hierarchy as a framework for measuring fair value based on inputs used to value the Fund’s investments, and requires additional disclosure about fair value. The hierarchy of inputs is summarized below. |
| | |
| | Level 1 — quoted prices in active markets for identical investments |
| | |
| | Level 2 — other significant observable inputs (including quoted prices for similar investments, interest rates, prepayment speeds, credit risk, etc.) |
| | |
| | Level 3 — significant unobservable inputs (including the Fund’s own assumptions in determining the fair value of investments) |
| | |
| The inputs or methodology used for valuing securities are not necessarily an indication of the risk associated with investing in those securities. |
| | |
| The Fund uses valuation techniques to measure fair value that are consistent with the market approach and/or income approach, depending on the type of security and the particular circumstance. The market approach uses prices and other relevant information generated by market transactions involving identical or comparable securities. The income approach uses valuation techniques to discount estimated future cash flows to present value. |
108
Notes to Financial Statements—Continued
April 30, 2012 (Unaudited)
| | | | | | | | | | | | | | |
The following is a summary of the inputs used in valuing the Fund’s assets and liabilities carried at fair value: |
| | | | | | | | | | | | | | |
| | | Valuation Inputs | | | |
| | | | | | |
Dynamic Dividend Fund* | | | Level 1 ** | | Level 2 ** | | Level 3 | | Total Value | |
| | | | | | | | | | | |
Common Stocks | | | | | | | | | | | | | |
Brazil | | $ | 16,439,983 | | $ | — | | $ | — | | $ | 16,439,983 | |
Canada | | | 1,880,779 | | | — | | | — | | | 1,880,779 | |
China | | | — | | | — | | | 1,742,088 | | | 1,742,088 | |
France | | | 4,651,636 | | | — | | | — | | | 4,651,636 | |
Israel | | | 7,882,528 | | | — | | | — | | | 7,882,528 | |
Norway | | | 10,515,827 | | | — | | | — | | | 10,515,827 | |
Singapore | | | 4,675,867 | | | — | | | — | | | 4,675,867 | |
South Korea | | | 7,564,208 | | | — | | | — | | | 7,564,208 | |
Sweden | | | 19,629,103 | | | — | | | — | | | 19,629,103 | |
Switzerland | | | 2,197,862 | | | — | | | — | | | 2,197,862 | |
United Kingdom | | | 17,145,481 | | | — | | | — | | | 17,145,481 | |
United States | | | 281,927,175 | | | — | | | — | | | 281,927,175 | |
Short-Term Investments | | | — | | | 18,369,000 | | | — | | | 18,369,000 | |
| | | | | | | | | | | | | |
Total | | $ | 374,510,449 | | $ | 18,369,000 | | $ | 1,742,088 | | $ | 394,621,537 | |
| | | | | | | | | | | | | |
| | | | | | | | | | | | | | |
| | | Valuation Inputs | | | |
| | | | | | |
Other Financial Instruments* | | | Level 1 | | Level2 | | Level 3 | | Total Value | |
| | | | | | | | | | | |
Assets | | | | | | | | | | | | | |
Forward Currency Contracts | | $ | — | | $ | 195,716 | | $ | — | | $ | 195,716 | |
| | | | | | | | | | | | | |
Liabilities | | | | | | | | | | | | | |
Forward Currency Contracts | | | — | | | (389,177 | ) | | — | | | (389,177 | ) |
| | | | | | | | | | | | | |
Total | | $ | — | | $ | (193,461 | ) | $ | — | | $ | (193,461 | ) |
| | | | | | | | | | | | | |
| | | | | | | | | | | | | | |
| | | Valuation Inputs | | | |
| | | | | | |
Accelerating Dividend Fund* | | | Level 1 ** | | Level 2 ** | | Level 3 | | Total Value | |
| | | | | | | | | | | |
Common Stocks | | $ | 2,559,904 | | $ | — | | $ | — | | $ | 2,559,904 | |
Short-Term Investments | | | — | | | 166,000 | | | — | | | 166,000 | |
| | | | | | | | | | | | | |
Total | | $ | 2,559,904 | | $ | 166,000 | | $ | — | | $ | 2,725,904 | |
| | | | | | | | | | | | | |
| | | | | | | | | | | | | | |
| | | Valuation Inputs | | | |
| | | | | | |
Financial Services Fund* | | | Level 1 ** | | Level 2 ** | | Level 3 | | Total Value | |
| | | | | | | | | | | |
Common Stocks | | | | | | | | | | | | | |
Capital Markets | | $ | 815,518 | | $ | — | | $ | — | | $ | 815,518 | |
Commercial Banks | | | 3,737,527 | | | 134,112 | | | — | | | 3,871,639 | |
Consumer Finance | | | 244,390 | | | — | | | — | | | 244,390 | |
Diversified Financial Services | | | 973,737 | | | — | | | — | | | 973,737 | |
Industrial Conglomerates | | | 137,060 | | | — | | | — | | | 137,060 | |
Thrifts & Mortgage Finance | | | 723,693 | | | — | | | — | | | 723,693 | |
Preferred Stocks | | | 40,784 | | | — | | | — | | | 40,784 | |
Investment Companies | | | 258,762 | | | — | | | — | | | 258,762 | |
Short-Term Investments | | | — | | | 622,000 | | | — | | | 622,000 | |
| | | | | | | | | | | | | |
Total | | $ | 6,931,471 | | $ | 756,112 | | $ | — | | $ | 7,687,583 | |
| | | | | | | | | | | | | |
109
Notes to Financial Statements—Continued
April 30, 2012 (Unaudited)
| | | | | | | | | | | | | | |
| | Valuation Inputs | | | | |
| | | | | | | |
Innovators Fund* | | | Level 1 ** | | Level 2 | | Level 3 | | Total Value | |
| | | | | | | | | | | |
Common Stocks | | $ | 10,982,413 | | $ | — | | $ | — | | $ | 10,982,413 | |
Short-Term Investments | | | — | | | 1,849,000 | | | — | | | 1,849,000 | |
| | | | | | | | | | | | | |
Total | | $ | 10,982,413 | | $ | 1,849,000 | | $ | — | | $ | 12,831,413 | |
| | | | | | | | | | | | | |
| | | | | | | | | | | | | | |
| | Valuation Inputs | | | | |
| | | | | | | |
Transformations Fund* | | | Level 1 ** | | Level 2 ** | | Level 3 | | Total Value | |
| | | | | | | | | | | |
Common Stocks | | $ | 6,707,644 | | $ | — | | $ | — | | $ | 6,707,644 | |
Short-Term Investments | | | — | | | 959,000 | | | — | | | 959,000 | |
| | | | | | | | | | | | | |
Total | | $ | 6,707,644 | | $ | 959,000 | | $ | — | | $ | 7,666,644 | |
| | | | | | | | | | | | | |
| | | | | | | | | | | | | | |
| | Valuation Inputs | | | | |
| | | | | | | |
Foundation Fund* | | | Level 1 ** | | Level 2 ** | | Level 3 | | Total Value | |
| | | | | | | | | | | |
Common Stocks | | $ | 47,409,122 | | $ | — | | $ | — | | $ | 47,409,122 | |
Bonds | | | — | | | 13,955,312 | | | — | | | 13,955,312 | |
Short-Term Investments | | | — | | | 3,601,000 | | | — | | | 3,601,000 | |
| | | | | | | | | | | | | |
Total | | $ | 47,409,122 | | $ | 17,556,312 | | $ | — | | $ | 64,965,434 | |
| | | | | | | | | | | | | |
| | | | | | | | | | | | | | |
| | Valuation Inputs | | | | |
| | | | | | | |
Ultra Short Tax Optimized Income Fund* | | | Level 1 ** | | Level 2 ** | | Level 3 | | Total Value | |
| | | | | | | | | | | |
Municipal Bonds | | $ | — | | $ | 1,832,721,883 | | $ | — | | $ | 1,832,721,883 | |
Money Market Funds | | | — | | | 6,343,647 | | | — | | | 6,343,647 | |
Short-Term Investments | | | — | | | 77,845,000 | | | — | | | 77,845,000 | |
| | | | | | | | | | | | | |
Total | | $ | — | | $ | 1,916,910,530 | | $ | — | | $ | 1,916,910,530 | |
| | | | | | | | | | | | | |
| | | | | | | | | | | | | | |
| | Valuation Inputs | | | | |
| | | | | | | |
Municipal Money Market Fund* | | | Level 1 ** | | Level 2 ** | | Level 3 | | Total Value | |
| | | | | | | | | | | |
Municipal Bonds | | $ | — | | $ | 254,872,720 | | $ | — | | $ | 254,872,720 | |
Money Market Funds | | | — | | | 2,186,338 | | | — | | | _ 2,186,338 | |
| | | | | | | | | | | | | |
Total | | $ | — | | $ | 257,059,058 | | $ | — | | $ | 257,059,058 | |
| | | | | | | | | | | | | |
| |
* | For detailed country, sector, and state descriptions, see accompanying Schedule of Portfolio Investments |
| |
** | During the period ended April 30, 2012 there were significant transfers between Level 1 and Level 2 securities. A security’s classification as Level 1 or Level 2 within the Fund can move on a daily basis throughout the year depending on whether or not the Fund has determined the value of securities principally traded in foreign markets has become stale between the close of the foreign exchanges and the time the funds calculate their NAV. If management determines the price has become stale, a fair value adjustment will be made to the impacted securities and these fair value adjusted securities are considered to be priced using Level 2 inputs. As a result, it is not practicable to disclose transfers between Level 1 and Level 2 within the fair value hierarchy for the period ended April 30, 2012. |
110
Notes to Financial Statements—Continued
April 30, 2012 (Unaudited)
| |
| Following is a reconciliation of Level 3 assets for which significant unobservable inputs were used to determine fair value: |
| | | | | | | | | | | |
| | Dynamic
Dividend
Fund | | Financial
Services
Fund | |
| | | | | |
Balance as of October 31, 2011 | | | $ | — | | | | $ | 251 | | |
Accrued discounts / premiums | | | | — | | | | | — | | |
Realized gain (loss) | | | | (265,954 | ) | | | | (144,034 | ) | |
Change in unrealized appreciation (depreciation) | | | | (1,324,203 | ) | | | | 149,024 | | |
Purchases | | | | — | | | | | — | | |
Sales | | | | (154,436 | ) | | | | (5,241 | ) | |
Transfers in to Level 3* | | | | 3,486,681 | | | | | — | | |
Transfers out of Level 3 | | | | — | | | | | — | | |
| | | | | | | | | | | |
Balance as of April 30, 2012 | | | $ | 1,742,088 | | | | $ | — | | |
| | | | | | | | | | | |
| | | | | | | | | | | |
Change in net unrealized appreciation (depreciation) on
level 3 holdings held at period end | | | $ | (1,491,288 | ) | | | $ | — | | |
| | | | | | | | | | | |
| | |
| | |
* | The transfer into level 3 pertains to Daqing Dairy. The company’s auditor resigned on March 21, 2012 and the company’s shares have not traded since that time. Prior to the suspension of trading, the shares had declined by approximately 12%. The majority of the decline in value during the period is attributable to a 40% discount taken due to the Fund’s concerns about the company’s disclosures and issues raised by the Daqing’s former auditors. The value at April 30, 2012 includes significant unobservable inputs. Due to the uncertainty described above, the realization of the value of the position may be substantially different than the reported value. Furthermore, the value of the position may change substantially in the future as the Fund considers additional information as it becomes available. |
| |
| B. Security Transactions and Investment Income: |
| |
| Security transactions are accounted for on a trade date basis. Realized gains and losses are computed on the identified cost basis. Interest income is recorded on the accrual basis and includes accretion of discounts and amortization of premiums, where applicable. To the extent any issuer defaults or a credit event occurs that impacts the issuer, the Funds’ may halt any additional interest income accruals and consider the realizability of interest accrued up to the date of default or credit event. Dividend income is recorded on the ex-dividend date or in the case of some foreign securities, on the date thereafter when the Funds are made aware of the dividend. Foreign income may be subject to foreign withholding taxes, which are accrued as applicable. Capital gains realized on some foreign securities are subject to foreign taxes, which are accrued as applicable. Dividends and interest from non-U.S. sources received by the Funds are generally subject to non-U.S. withholding taxes at rates ranging up to 30%. Such withholding taxes may be reduced or eliminated under the terms of applicable U.S. income tax treaties, and the Funds intend to undertake any procedural steps required to claim the benefits of such treaties. |
| |
| C. Line of Credit: |
| |
| On December 1, 2010 each Trust entered into a lending agreement with BNP Paribas through its New York branch. Loans in aggregate, whether to cover overdrafts or for investment purposes, may not exceed the maximum amount that is permitted under the 1940 Act. For the period ended April 30, 2012, the average interest rate paid on outstanding borrowings under the line of credit was 1.06%, 1.08%, 1.03% and 1.02% for the Dynamic Dividend Fund, Accelerating Dividend Fund, Financial Services Fund and Innovators Fund, respectively. The Funds also incur interest expense on custody overdraft charges. |
111
Notes to Financial Statements— Continued
April 30, 2012 (Unaudited)
| | | | | | | | | | | | | |
| | Dynamic
Dividend
Fund | | Accelerating
Dividend
Fund | | Financial
Services
Fund | | Innovators
Fund | |
| | | | | | | | | |
Total line of credit amount available at April 30, 2012 | | | $146,027,468 | | | $919,919 | | | $2,600,268 | | | $4,368,598 | |
Line of credit outstanding at April 30, 2012 | | | — | | | — | | | — | | | — | |
Line of credit amount unused at April 30, 2012 | | | 146,027,468 | | | 919,919 | | | 2,600,268 | | | 4,368,598 | |
Average balance outstanding during the period | | | 8,051,506 | | | 15,449 | | | 356,788 | | | 140,685 | |
Interest expense incurred on line of credit during the period | | | 42,977 | | | 84 | | | 1,859 | | | 729 | |
Interest expense incurred on custody overdrafts during the period | | | — | | | — | | | — | | | — | |
| |
| D. Federal and Other Income Taxes: |
| |
| It is each Fund’s policy to comply with the Federal income and excise tax requirements of the Internal Revenue Code of 1986 (the “Code”), as amended applicable to regulated investment companies and to distribute timely, all of its investment company taxable income and net realized capital gains to shareholders in accordance with the timing requirements imposed by the Code. Therefore, no federal income tax provision is recorded. Under applicable foreign tax laws, a withholding tax may be imposed on interest, dividends, and capital gains earned on foreign investments. Where available, the Funds will file for claims on foreign taxes withheld. |
| |
| Management has analyzed the Fund’s tax positions taken on income tax returns for all open tax years and has concluded that as of April 30, 2012, no provision for income tax is required in the Fund’s financial statements. The Fund’s federal and state income and federal excise tax returns for tax years for which the applicable statutes of limitations have not expired are subject to examination by Internal Revenue Service and state departments of revenue. |
| |
| Under the applicable foreign tax laws, a withholding tax may be imposed on interest, dividends and capital gains at various rates. |
| |
| GAAP requires that certain components of net assets be reclassified to reflect permanent differences between financial and tax reporting. These reclassifications have no effect on net assets or net asset value per share. |
| |
| E. Distributions to Shareholders: |
| |
| Each of the Dynamic Dividend, Accelerating Dividend, Financial Services, Innovators, Transformations, Foundation and Ultra Short Tax Optimized Income Funds intends to distribute substantially all of its net investment income and net realized capital gains, if any, throughout the year to its shareholders in the form of dividends. The Municipal Money Market Fund declares and accrues dividends daily on each business day based upon the Fund’s net income, and pays dividends monthly. Distributions to shareholders are recorded at the close of business on the ex-dividend date. All dividends are automatically reinvested in full and fractional shares of the Fund at net asset value per share, unless otherwise requested. |
| |
| The amounts of dividends from net investment income and of distributions from net realized gains are determined in accordance with federal income tax regulations, which may differ from GAAP. These differences are either considered temporary or permanent in nature. To the extent these differences are permanent in nature, such amounts are reclassified within the composition of net assets based on their federal tax-basis treatment; temporary differences do not require reclassification. In the event dividends and distributions to shareholders exceed net investment income and net realized gains for tax purposes they are reported as returns of capital. |
| |
| F. Class Allocations: |
| |
| Income, expenses (other than class specific expenses) and realized and unrealized gains and losses are allocated among the classes of the Fund based on the relative net assets of each class. Class specific expenses are allocated to the class to which they relate. Currently, class specific expenses are limited to those incurred under the Distribution Plan for Class A shares (formerly, Adviser Class shares, for the Ultra Short Tax Optimized Income Fund). |
112
Notes to Financial Statements—Continued
April 30, 2012 (Unaudited)
| | | |
| G. Foreign Currency Translation Transactions: |
| |
| Each of the Dynamic Dividend, Accelerating Dividend, Financial Services and Transformations Funds may invest without limitation in foreign securities. The Innovators Fund and Foundation Fund may invest up to 20% and 15%, respectively, of the value of its net assets in foreign securities. The books and records of each Fund are maintained in U.S. dollars. Non-U.S. denominated amounts are translated into U.S. dollars as follows, with the resultant translation gains and losses recorded in the Statements of Operations: |
| | | |
| | i) | market value of investment securities and other assets and liabilities at the exchange rate on the valuation date, |
| | | |
| | ii) | purchases and sales of investment securities, income and expenses at the exchange rate prevailing on the respective date of such transactions. |
| | | |
| H. Risk Associated With Foreign Securities and Currencies: |
| |
| Investments in securities of foreign issuers carry certain risks not ordinarily associated with investments in securities of domestic issuers. Such risks include future political and economic developments and the possible imposition of exchange controls or other foreign governmental laws and restrictions. In addition, with respect to certain countries, there is a possibility of expropriation of assets, confiscatory taxation, political or social instability or diplomatic developments, which could adversely affect investments in those countries. Certain countries may also impose substantial restrictions on investments in their capital markets by foreign entities, including restrictions on investments in issuers or industries deemed sensitive to relevant national interests. These factors may limit the investment opportunities available to the Funds or result in a lack of liquidity and high price volatility with respect to securities of issuers from developing countries. |
| |
| I. Forward Currency Contracts: |
| |
| The Funds are subject to foreign currency exchange rate risk in the normal course of pursuing its investment objective. The Funds may use forward currency contracts to gain exposure to or hedge against changes in the value of foreign currencies. A forward currency contract (“forward”) is an agreement between two parties to buy and sell a currency at a set price on a future date. The market value of the forward contract fluctuates with changes in forward currency exchange rates. The forward contract is marked-to-market daily and the change in market value is recorded by each Fund as unrealized appreciation or depreciation. When the forward contract is closed, a Fund records a realized gain or loss equal to the fluctuation in value during the period the forward contract was open. A Fund could be exposed to risk if a counterparty is unable to meet the terms of a forward or if the value of the currency changes unfavorably. |
| |
| The following forward currency contracts were held at April 30, 2012: |
| | | | | | | | | | | | | | | | | |
Dynamic Dividend Fund | | | | | | | | | | | | | | | | |
|
Description | | | Expiration
Date | | Contracts to
Deliver/Receive | | Settlement
Value | | Current
Value | | Unrealized
Gain/(Loss) | |
| | | | | | | | | | | | | |
Contracts Bought: | | | | | | | | | | | | | | | | |
British Pound | | | 06/29/12 | | | 2,442,600 (GBP | ) | $ | 3,883,257 | | $ | 3,962,700 | | $ | 79,443 | |
Euro | | | 06/29/12 | | | 10,127,400 (EUR | ) | | 13,323,965 | | | 13,409,183 | | | 85,218 | |
Swedish Krona | | | 06/29/12 | | | 45,647,000 (SEK | ) | | 6,758,564 | | | 6,775,942 | | | 17,378 | |
| | | | | | | | | | | | | | | | |
| | | | | | | | | | | $ | 24,147,825 | | $ | 182,039 | |
| | | | | | | | | | | | | | | | |
| | | | | | | | | | | | | | | | |
Contracts Sold: | | | | | | | | | | | | | | | | |
British Pound | | | 06/29/12 | | | 5,949,400 (GBP | ) | $ | 9,386,654 | | $ | 9,651,882 | | $ | (265,228 | ) |
Euro | | | 06/29/12 | | | 3,717,688 (EUR | ) | | 4,929,384 | | | 4,922,405 | | | 6,979 | |
Euro | | | 06/29/12 | | | 9,506,412 (EUR | ) | | 12,480,969 | | | 12,586,964 | | | (105,995 | ) |
Swedish Krona | | | 06/29/12 | | | 44,039,500 (SEK | ) | | 6,544,019 | | | 6,537,321 | | | 6,698 | |
Swedish Krona | | | 06/29/12 | | | 53,730,600 (SEK | ) | | 7,957,935 | | | 7,975,889 | | | (17,954 | ) |
| | | | | | | | | | | | | | | | |
| | | | | | | | | | | $ | 41,674,461 | | $ | (375,500 | ) |
| | | | | | | | | | | | | | | | |
113
Notes to Financial Statements—Continued
April 30, 2012 (Unaudited)
| |
| J. Derivative instruments and hedging activities: |
| |
| Financial Accounting Standards Board Codification Topic 815 requires enhanced disclosure about an entity’s derivative and hedging activities. |
| |
| The following tables provide information about the effect of derivatives and hedging activities on the Fund’s Statement of Operations for the six months ended April 30, 2012. The first table provides additional detail about the amounts and sources of gains (losses) realized on derivatives during the period. The second table provides additional information about the change in unrealized appreciation (depreciation) resulting from the Fund’s derivatives and hedging activities during the period. |
| |
| The effect of derivative instruments on the Statement of Assets and Liabilities as of April 30, 2012: |
| | | | | | | | | |
Dynamic Dividend Fund | | | | | | | | |
|
Derivatives | | | Statement of Assets
and Liabilities Location | | Unrealized Appreciation
(Depreciation) | |
| | | | | | | |
Forward Currency Contracts | | Unrealized appreciation on
forward currency contracts | | | $ | 195,716 | | |
Forward Currency Contracts | | Unrealized depreciation on
forward currency contracts | | | $ | (389,177 | ) | |
The effect of derivative instruments on the Statements of Operations for the six months ended April 30, 2012:
| | | | | | | | | | | | |
Dynamic Dividend Fund | | | | | | | | |
Derivatives | | | Net Realized Gain (Loss) | | Change in Unrealized
Depreciation | |
| | | | | | | |
Forward Currency Contracts | | | $ | — | | | | $ | (193,461) | | |
| |
3. | Capital Share Transactions: |
| |
| The Funds have an unlimited number of shares of beneficial interest, with $0.0001 par value, authorized. Transactions in shares and dollars of the Funds were as follows: |
| |
| Dynamic Dividend Fund |
| | | | | | | | | | | | | |
| | Period Ended
April 30, 2012* | | Year Ended
October 31, 2011 | |
| | | | | |
| | Shares | | Amount | | Shares | | Amount | |
| | | | | | | | | |
Class A | | | | | | | | | | | | | |
Shares sold | | | 27,701 | | $ | 100,000 | | | N/A | | | N/A | |
Shares issued in reinvestment of dividends | | | 1,220 | | | 4,645 | | | N/A | | | N/A | |
Redemption fees | | | — | | | — | | | N/A | | | N/A | |
Shares redeemed | | | — | | | — | | | N/A | | | N/A | |
| | | | | | | | | | | | | |
Total net change | | | 28,921 | | $ | 104,645 | | | N/A | | | N/A | |
| | | | | | | | | | | | | |
Institutional Class | | | | | | | | | | | | | |
Shares sold | | | 4,863,622 | | $ | 18,282,901 | | | 19,505,877 | | $ | 88,626,740 | |
Shares issued in reinvestment of dividends | | | 4,789,357 | | | 17,844,561 | | | 10,480,162 | | | 47,602,166 | |
Redemption fees | | | — | | | 32,924 | | | — | | | 48,509 | |
Shares redeemed | | | (22,303,047 | ) | | (83,455,301 | ) | | (50,504,137 | ) | | (230,053,339 | ) |
| | | | | | | | | | | | | |
Total net change | | | (12,650,068 | ) | $ | (47,294,915 | ) | | (20,518,098 | ) | $ | (93,775,924 | ) |
| | | | | | | | | | | | | |
114
Notes to Financial Statements—Continued
April 30, 2012 (Unaudited)
| | | | | | | | | | | | | |
Accelerating Dividend Fund | |
| | | | | |
| | Period Ended
April 30, 2012* | | Year Ended
October 31, 2011 | |
| | | | | |
| | Shares | | Amount | | Shares | | Amount | |
| | | | | | | | | |
Class A | | | | | | | | | | | | | |
Shares sold | | | 8,320 | | $ | 100,000 | | | N/A | | | N/A | |
Shares issued in reinvestment of dividends | | | 94 | | | 1,217 | | | N/A | | | N/A | |
Redemption fees | | | — | | | — | | | N/A | | | N/A | |
Shares redeemed | | | — | | | — | | | N/A | | | N/A | |
| | | | | | | | | | | | | |
Total net change | | | 8,414 | | $ | 101,217 | | | N/A | | | N/A | |
| | | | | | | | | | | | | |
| | | | | | | | | | | | | |
Institutional Class | | | | | | | | | | | | | |
Shares sold | | | 10,473 | | $ | 133,977 | | | 62,763 | | $ | 827,453 | |
Shares issued in reinvestment of dividends | | | 12,842 | | | 157,294 | | | 7,939 | | | 105,232 | |
Redemption fees | | | — | | | — | | | — | | | 21 | |
Shares redeemed | | | (74,365 | ) | | (962,955 | ) | | (6,833 | ) | | (91,097 | ) |
| | | | | | | | | | | | | |
Total net change | | | (51,050 | ) | $ | (671,684 | ) | | 63,869 | | $ | 841,609 | |
| | | | | | | | | | | | | |
| | | | | | | | | | | | | |
Financial Services Fund | | | | | | | | | | | | | |
| | | | | | | | | | | | | |
| | Period Ended
April 30, 2012* | | Year Ended
October 31, 2011 | |
| | | | | |
| | Shares | | Amount | | Shares | | Amount | |
| | | | | | | | | |
Class A | | | | | | | | | | | | | |
Shares sold | | | 14,493 | | $ | 100,000 | | | N/A | | | N/A | |
Shares issued in reinvestment of dividends | | | — | | | — | | | N/A | | | N/A | |
Redemption fees | | | — | | | — | | | N/A | | | N/A | |
Shares redeemed | | | — | | | — | | | N/A | | | N/A | |
| | | | | | | | | | | | | |
Total net change | | | 14,493 | | $ | 100,000 | | | N/A | | | N/A | |
| | | | | | | | | | | | | |
| | | | | | | | | | | | | |
Institutional Class | | | | | | | | | | | | | |
Shares sold | | | 142,220 | | $ | 1,120,587 | | | 289,711 | | $ | 2,447,441 | |
Shares issued in reinvestment of dividends | | | 1,754 | | | 11,966 | | | 2,306 | | | 19,879 | |
Redemption fees | | | — | | | 1,579 | | | — | | | 2,059 | |
Shares redeemed | | | (95,778 | ) | | (705,275 | ) | | (421,671 | ) | | (3,498,930 | ) |
| | | | | | | | | | | | | |
Total net change | | | 48,196 | | $ | 428,857 | | | (129,654 | ) | $ | (1,029,551 | ) |
| | | | | | | | | | | | | |
115
Notes to Financial Statements—Continued
April 30, 2012 (Unaudited)
| | | | | | | | | | | | | |
Innovators Fund | |
| | | | | |
| | Period Ended
April 30, 2012* | | Year Ended
October 31, 2011 | |
| | | | | |
| | Shares | | Amount | | Shares | | Amount | |
| | | | | | | | | |
Class A | | | | | | | | | | | | | |
Shares sold | | | 12,834 | | $ | 137,500 | | | N/A | | | N/A | |
Shares issued in reinvestment of dividends | | | — | | | — | | | N/A | | | N/A | |
Redemption fees | | | — | | | — | | | N/A | | | N/A | |
Shares redeemed | | | — | | | — | | | N/A | | | N/A | |
| | | | | | | | | | | | | |
Total net change | | | 12,834 | | $ | 137,500 | | | N/A | | | N/A | |
| | | | | | | | | | | | | |
| | | | | | | | | | | | | |
Institutional Class | | | | | | | | | | | | | |
Shares sold | | | 82,414 | | $ | 991,651 | | | 12,473 | | $ | 133,270 | |
Shares issued in reinvestment of dividends | | | — | | | — | | | — | | | — | |
Redemption fees | | | — | | | 275 | | | — | | | 34 | |
Shares redeemed | | | (56,378 | ) | | (645,877 | ) | | (190,018 | ) | | (2,059,520 | ) |
| | | | | | | | | | | | | |
Total net change | | | 26,036 | | $ | 346,049 | | | (177,545 | ) | $ | (1,926,216 | ) |
| | | | | | | | | | | | | |
| | | | | | | | | | | | | |
Transformations Fund | | | | | | | | | | | | | |
| | | | | | | | | | | | | |
| | Period Ended
April 30, 2012* | | Year Ended
October 31, 2011 | |
| | | | | |
| | Shares | | Amount | | Shares | | Amount | |
| | | | | | | | | |
Class A | | | | | | | | | | | | | |
Shares sold | | | 8,913 | | $ | 100,000 | | | N/A | | | N/A | |
Shares issued in reinvestment of dividends | | | — | | | — | | | N/A | | | N/A | |
Redemption fees | | | — | | | — | | | N/A | | | N/A | |
Shares redeemed | | | — | | | — | | | N/A | | | N/A | |
| | | | | | | | | | | | | |
Total net change | | | 8,913 | | $ | 100,000 | | | N/A | | | N/A | |
| | | | | | | | | | | | | |
| | | | | | | | | | | | | |
Institutional Class | | | | | | | | | | | | | |
Shares sold | | | 83,179 | | $ | 1,040,983 | | | 102,599 | | $ | 1,211,025 | |
Shares issued in reinvestment of dividends | | | — | | | — | | | — | | | — | |
Redemption fees | | | — | | | 739 | | | — | | | 555 | |
Shares redeemed | | | (37,837 | ) | | (459,681 | ) | | (82,972 | ) | | (949,393 | ) |
| | | | | | | | | | | | | |
Total net change | | | 45,342 | | $ | 582,041 | | | 19,627 | | $ | 262,187 | |
| | | | | | | | | | | | | |
116
Notes to Financial Statements—Continued
April 30, 2012 (Unaudited)
| | | | | | | | | | | | | |
Foundation Fund | |
| | | | | |
| | Period Ended
April 30, 2012* | | Year Ended
October 31, 2011 | |
| | | | | |
| | Shares | | Amount | | Shares | | Amount | |
| | | | | | | | | |
Class A | | | | | | | | | | | | | |
Shares sold | | | 9,425 | | $ | 100,000 | | | N/A | | | N/A | |
Shares issued in reinvestment of dividends | | | 33 | | | 378 | | | N/A | | | N/A | |
Redemption fees | | | — | | | — | | | N/A | | | N/A | |
Shares redeemed | | | — | | | — | | | N/A | | | N/A | |
| | | | | | | | | | | | | |
Total net change | | | 9,458 | | $ | 100,378 | | | N/A | | | N/A | |
| | | | | | | | | | | | | |
| | | | | | | | | | | | | |
Institutional Class | | | | | | | | | | | | | |
Shares sold | | | 5,316 | | $ | 57,258 | | | 76,697 | | $ | 830,757 | |
Shares issued in reinvestment of dividends | | | 46,816 | | | 514,557 | | | 97,394 | | | 1,024,279 | |
Redemption fees | | | — | | | — | | | — | | | 1,429 | |
Shares redeemed | | | (152,845 | ) | | (1,670,917 | ) | | (551,645 | ) | | (6,015,870 | ) |
| | | | | | | | | | | | | |
Total net change | | | (100,713 | ) | $ | (1,099,102 | ) | | (377,554 | ) | $ | (4,159,405 | ) |
| | | | | | | | | | | | | |
| | | | | | | | | | | | | |
Ultra Short Tax Optimized Income Fund | | | | | | | | | | | | | |
| | | | | | | | | | | | | |
| | Six Months Ended
April 30, 2012** | | Year Ended
October 31, 2011 | |
| | | | | |
| | Shares | | Amount | | Shares | | Amount | |
| | | | | | | | | |
Class A | | | | | | | | | | | | | |
Shares sold | | | 21,552,208 | | $ | 217,838,236 | | | 22,357,186 | | $ | 225,873,682 | |
Shares issued in reinvestment of dividends | | | 148,481 | | | 1,499,657 | | | 368,680 | | | 3,722,267 | |
Redemption fees | | | — | | | 4,996 | | | — | | | 8,343 | |
Shares redeemed | | | (11,599,554 | ) | | (117,241,601 | ) | | (16,219,123 | ) | | (163,836,074 | ) |
| | | | | | | | | | | | | |
Total net change | | | 10,101,135 | | $ | 102,101,288 | | | 6,506,743 | | $ | 65,768,218 | |
| | | | | | | | | | | | | |
| | | | | | | | | | | | | |
Institutional Class | | | | | | | | | | | | | |
Shares sold | | | 55,186,493 | | $ | 554,706,721 | | | 84,004,660 | | $ | 844,019,419 | |
Shares issued in reinvestment of dividends | | | 494,969 | | | 4,974,439 | | | 1,408,984 | | | 14,143,602 | |
Redemption fees | | | — | | | 21,098 | | | — | | | 29,915 | |
Shares redeemed | | | (42,373,639 | ) | | (425,898,949 | ) | | (73,505,192 | ) | | (738,310,656 | ) |
| | | | | | | | | | | | | |
Total net change | | | 13,307,823 | | $ | 133,803,309 | | | 11,908,452 | | $ | 119,882,280 | |
| | | | | | | | | | | | | |
| | | | | | | | | | | | | |
Municipal Money Market Fund | | | | | | | | | | | | | |
| | | | | | | | | | | | | |
| | Period Ended
April 30, 2012 | | Year Ended
October 31, 2011 | |
| | | | | |
| | Shares | | Amount | | Shares | | Amount | |
| | | | | | | | | |
Shares sold | | | 108,959,984 | | $ | 108,959,984 | | | 1,055,218,570 | | $ | 1,055,218,569 | |
Shares issued in reinvestment of dividends | | | 92,805 | | | 92,805 | | | 457,009 | | | 457,009 | |
Shares redeemed | | | (161,901,464 | ) | | (161,901,464 | ) | | (1,215,786,716 | ) | | (1,215,786,617 | ) |
| | | | | | | | | | | | | |
Total net change | | | (52,848,675 | ) | $ | (52,848,675 | ) | | (160,111,137 | ) | $ | (160,111,039 | ) |
| | | | | | | | | | | | | |
| | |
| * | Class A commenced operations on December 30, 2011. |
| ** | Effective January 3, 2012, the Adviser share class was renamed to Class A and Investor share class was renamed to Institutional Class. |
117
Notes to Financial Statements—Continued
April 30, 2012 (Unaudited)
| |
4. | Purchases and Sales of Securities: |
| |
| Purchases and sales of securities (excluding short-term securities) for the six months ended April 30, 2012 are as follows: |
| | | | | | | |
| | Non-U.S. Government | |
| | | |
| | Purchases | | Sales | |
| | | | | |
Dynamic Dividend Fund | | $ | 686,785,148 | | $ | 735,515,658 | |
Accelerating Dividend Fund | | | 1,198,078 | | | 1,797,068 | |
Financial Services Fund | | | 3,008,394 | | | 3,795,049 | |
Innovators Fund | | | 1,777,755 | | | 3,459,003 | |
Transformations Fund | | | 2,527,829 | | | 2,016,962 | |
Foundation Fund | | | 11,143,454 | | | 8,158,001 | |
Ultra Short Tax Optimized Income Fund | | | 2,256,413,622 | | | 1,991,625,369 | |
| |
| The Funds did not have purchases and sales of U.S. Government obligations for the six months ended April 30, 2012. |
| |
5. | Distribution Plans: |
| |
| Quasar Distributors, LLC (“Quasar”) serves as each Funds’ distributor. Certain of the Funds have adopted distribution and servicing plans (the “Plans”) for their Class A shares (in the case of the Ultra Short Tax Optimized Fund formerly known as the Adviser Class) as allowed by Rule 12b-1 under the 1940 Act. The Plans authorize payments by the Funds in connection with the distribution and servicing of its shares at an annual rate, as determined from time to time by the Board of Trustees, of up to 0.25% of the Fund’s average daily net assets. Amounts paid under the Plans by the Funds may be spent by the Funds on any activities or expenses primarily intended to result in the sale of shares of the Funds, including but not limited to advertising, compensation for sales and marketing activities of financial institutions and others such as dealers and distributors, shareholder account servicing, the printing and mailing of prospectuses to other than current shareholders and the printing and mailing of sales literature. Dynamic Dividend Fund, Accelerating Dividend Fund, Financial Services Fund, Innovators Fund, Transformations Fund, Foundation Fund and Ultra Short Tax Optimized Fund incurred $89, $89, $94, $104, $93, $87 and $504,110, respectively, pursuant to the Plans for the six months ended April 30, 2012. |
| |
| The Plans for the Funds may be terminated at any time by vote of the Trustees of the Trusts who are not “interested persons”, as defined by the 1940 Act, of the Trusts, or by vote of a majority of the outstanding voting shares of the respective class. |
| |
| Alpine Woods Capital Investors, LLC (the “Adviser”) makes payments to intermediaries that provide omnibus account services, sub-accounting services and/or networking services with respect to the Funds. On February 2nd, the Board approved, subject to certain limitations, that the reimbursement of such fees paid by the Adviser, to intermediaries that provide omnibus account services or sub-accounting, are charged back to the appropriate Fund. |
| |
| For the six months ended April 30, 2012, The Adviser did not charge back any amounts to the Funds, however, it intends to submit such charges incurred in the period for approval by the Board at its next regularly scheduled meeting and will continue to submit such charges for approval at each regularly scheduled Board meeting occurring in the next quarter after such charges have been paid by the Adviser. These charges will be included in the transfer agent fees and expenses in the Statement of Operations. |
| |
6. | Investment Advisory Agreement and Administration Agreement: |
| |
| Alpine Woods Capital Investors, LLC (“the Adviser”) provides investment advisory services to each of the Funds. Pursuant to the advisory agreements with the Funds, the Adviser is entitled to an annual fee based on 1.00% of each Fund’s average daily net assets for the Dynamic Dividend Fund, Accelerating Dividend Fund, Financial Services Fund, Innovators Fund, Transformations Fund and Foundation Fund. The Adviser is entitled to an annual fee based on 0.75% of the Ultra Short Tax Optimized Income Fund’s average daily net assets and an annual fee based on 0.45% of the Municipal Money Market Fund’s average daily net assets. |
| |
| The Adviser agreed to reimburse the Dynamic Dividend Fund, Accelerating Dividend Fund, Financial Services Fund, Innovators Fund, Transformations Fund and Foundation Fund to the extent necessary to ensure that each Fund’s |
118
Notes to Financial Statements—Continued
April 30, 2012 (Unaudited)
| |
| total operating expenses (excluding 12b-1 fees, interest, brokerage commissions and extraordinary expenses) does not exceed 1.35%, 1.35%, 1.35%, 1.35%, 1.35% and 1.35%, respectively, of the Fund’s average daily net assets. The expense cap for the Ultra Short Tax Optimized Income Fund – Class A Shares (formerly, Adviser Class) and Ultra Short Tax Optimized Income Fund – Institutional Class Shares (formerly Investor Class) is 0.95% and 0.70%, respectively, at April 30, 2012. In addition, the Adviser voluntarily agreed to reimburse the Ultra Short Tax Optimized Income Fund to the extent necessary to ensure that the Fund’s total operating expenses (excluding interest, brokerage commissions and extraordinary expenses) did not exceed certain limits. The limit was 0.65% of the Fund’s average daily net assets during the period ended April 30, 2012. The Adviser may recover expenses paid in excess of the cap on expenses for the three previous years, as long as the recovery does not cause the Fund to exceed such cap on expenses. For the six months ended April 30, 2012, the Adviser waived investment advisory fees and other expenses totaling $25,355, $20,671, $11,185, $13,232 and $1,425,185, for the Accelerating Dividend Fund, Financial Services Fund, Innovators Fund, Transformations Fund and Ultra Short Tax Optimized Income Fund, respectively. The expense limitations will remain in effect for each Fund unless and until the Board of Trustees of the Series and Income Trusts approve its modification or termination with respect to each Fund. Waived expenses subject to potential recovery by year of expiration are as follows: |
| | | | | | | | | | | | | | | | | | | | | | | | | | | |
Year of Expiration | | | Accelerating
Dividend
Fund | | Financial
Services
Fund | | Innovators
Fund | | Transformations
Fund | | Ultra Short
Tax Optimized
Income
Fund | |
| | | | | | | | | | | | | |
10/31/2012 | | | $ | 40,707 | | | | $ | 38,481 | | | | $ | 31,680 | | | | $ | 41,270 | | | | $ | 1,528,133 | | |
10/31/2013 | | | | 28,493 | | | | | 34,708 | | | | | 29,521 | | | | | 37,330 | | | | | 3,894,496 | | |
10/31/2014 | | | | 35,094 | | | | | 32,910 | | | | | 20,239 | | | | | 21,099 | | | | | 2,722,733 | | |
10/31/2015 | | | | 25,355 | | | | | 20,671 | | | | | 11,185 | | | | | 13,232 | | | | | 1,425,185 | | |
| |
| For the six months ended April 30, 2012, the Adviser voluntarily agreed to reimburse the Municipal Money Market Fund to the extent necessary to ensure that the Fund’s total operating expenses (excluding interest, brokerage commissions and extraordinary expenses) did not exceed certain limits. The limits ranged from 0.31% to 0.34% of the Fund’s average daily net assets during the six months ended April 30, 2012. For the six months ended April 30, 2012 the Adviser waived investment advisory fees and other expenses totaling $311,438 for the Municipal Market Fund. |
| |
| State Street Bank and Trust (“SSBT”) serves as the Funds’ Administrator. |
| |
7. | Federal Income Tax Information |
| |
| At October 31, 2011, the components of accumulated earnings (losses) on a tax basis were as follows: |
| | | | | | | | | | | | | |
| | Dynamic
Dividend Fund | | Accelerating
Dividend Fund | | Financial
Services Fund | | Innovators Fund | |
| | | | | | | | | |
Cost of investments | | $ | 438,924,296 | | $ | 3,336,185 | | $ | 10,580,824 | | $ | 9,130,528 | |
| | | | | | | | | | | | | |
Gross unrealized appreciation | | | 32,592,115 | | | 262,272 | | | 486,772 | | | 3,339,682 | |
Gross unrealized depreciation | | | (22,987,480 | ) | | (156,716 | ) | | (4,191,056 | ) | | (1,705,598 | ) |
| | | | | | | | | | | | | |
Net unrealized appreciation (depreciation) | | | 9,604,635 | | | 105,556 | | | (3,704,284 | ) | | 1,634,084 | |
| | | | | | | | | | | | | |
Undistributed ordinary income | | | 9,417,895 | | | 18,814 | | | — | | | — | |
Undistributed long-term capital gain | | | — | | | 197,493 | | | — | | | — | |
| | | | | | | | | | | | | |
Total distributable earnings | | | 9,417,895 | | | 216,307 | | | — | | | — | |
| | | | | | | | | | | | | |
Other accumulated gains (losses) | | | (1,105,672,289 | ) | | (132 | ) | | (1,476,502 | ) | | (13,976,727 | ) |
| | | | | | | | | | | | | |
Total accumulated gains (losses) | | $ | (1,086,649,759 | ) | $ | 321,731 | | $ | (5,180,786 | ) | $ | (12,342,643 | ) |
| | | | | | | | | | | | | |
119
Notes to Financial Statements—Continued
April 30, 2012 (Unaudited)
| | | | | | | | | | | | | |
| | Transformations
Fund | | Foundation
Fund | | Ultra Short
Tax Optimized
Income Fund | | Municipal
Money
Market Fund | |
| | | | | | | | | |
Cost of investments | | $ | 5,394,709 | | $ | 58,840,557 | | $ | 1,633,226,625 | | $ | 310,499,927 | |
| | | | | | | | | | | | | |
Gross unrealized appreciation | | | 1,527,105 | | | 10,273,957 | | | 1,500,318 | | | — | |
Gross unrealized depreciation | | | (306,112 | ) | | (10,540,536 | ) | | (80,843 | ) | | — | |
| | | | | | | | | | | | | |
Net unrealized appreciation (depreciation) | | | 1,220,993 | | | (266,579 | ) | | 1,419,475 | | | — | |
| | | | | | | | | | | | | |
Undistributed ordinary income | | | — | | | — | | | — | | | — | |
Undistributed tax exempt income | | | — | | | — | | | — | | | — | |
Undistributed long-term capital gain | | | — | | | — | | | — | | | — | |
| | | | | | | | | | | | | |
Total distributable earnings | | | — | | | — | | | — | | | — | |
| | | | | | | | | | | | | |
Other accumulated gains (losses) | | | (285,498 | ) | | (332,914 | ) | | (174,220 | ) | | — | |
| | | | | | | | | | | | | |
Total accumulated gains (losses) | | $ | 935,495 | | $ | (599,493 | ) | $ | 1,245,255 | | $ | — | |
| | | | | | | | | | | | | |
| |
| The tax basis of investments for tax and financial reporting purposes differs principally due to the deferral of losses on wash sales, partnership tax adjustments, and mark-to-market cost basis adjustments for investments in passive foreign investment companies (PFICs) for tax purposes. |
| |
| The tax character of distributions paid during the years ended October 31, 2011 and 2010 were as follows: |
| | | | | | | |
| | 2011 | | 2010 | |
| | | | | |
| | | | | |
Dynamic Dividend Fund | | | | | | | |
Ordinary income | | $ | 69,799,231 | | $ | 121,681,531 | |
Long-term capital gain | | | — | | | — | |
| | | | | | | |
| | $ | 69,799,231 | | $ | 121,681,531 | |
| | | | | | | |
| | | | | | | |
Accelerating Dividend Fund | | | | | | | |
Ordinary income | | $ | 118,437 | | $ | 87,503 | |
Long-term capital gain | | | 41,908 | | | — | |
| | | | | | | |
| | $ | 160,345 | | $ | 87,503 | |
| | | | | | | |
| | | | | | | |
Financial Services Fund | | | | | | | |
Ordinary income | | $ | 13,114 | | $ | — | |
Long-term capital gain | | | — | | | — | |
Return of capital | | | 9,617 | | | — | |
| | | | | | | |
| | $ | 22,731 | | $ | — | |
| | | | | | | |
| | | | | | | |
Innovators Fund | | | | | | | |
Ordinary income | | $ | — | | $ | — | |
Long-term capital gain | | | — | | | — | |
| | | | | | | |
| | $ | — | | $ | — | |
| | | | | | | |
| | | | | | | |
Transformations Fund | | | | | | | |
Ordinary income | | $ | — | | $ | — | |
Long-term capital gain | | | — | | | — | |
| | | | | | | |
| | $ | — | | $ | — | |
| | | | | | | |
120
Notes to Financial Statements—Continued
April 30, 2012 (Unaudited)
| | | | | | | |
| | 2011 | | 2010 | |
| | | | | |
| | | | | | | |
Foundation Fund | | | | | | | |
Ordinary income | | $ | 1,049,287 | | $ | 711,332 | |
Long-term capital gain | | | — | | | — | |
| | | | | | | |
| | $ | 1,049,287 | | $ | 711,332 | |
| | | | | | | |
| | | | | | | |
Ultra Short Tax Optimized Income Fund | | | | | | | |
Ordinary income | | $ | 28,462 | | $ | 20,593 | |
Exempt interest dividends | | | 25,410,754 | | | 19,469,207 | |
Return of capital | | | — | | | 317 | |
| | | | | | | |
| | $ | 25,439,216 | | $ | 19,490,117 | |
| | | | | | | |
| | | | | | | |
Municipal Money Market Fund | | | | | | | |
Ordinary income | | $ | — | | $ | — | |
Exempt interest dividends | | | 799,048 | | | 1,105,683 | |
Long-term capital gain | | | 45,444 | | | — | |
| | | | | | | |
| | $ | 844,492 | | $ | 1,105,683 | |
| | | | | | | |
| |
| During the year ended October 31, 2011, the Dynamic Dividend Fund, Transformations Fund and Foundation Fund utilized $30,070,697, $517,254 and $1,515,073 of capital loss carryovers, respectively. Capital loss carryovers as of October 31, 2011 are as follows: |
| | | | | | | | | | | | | | | | | | | | | | |
Expiration Date | | | Dynamic
Dividend Fund | | Accelerating
Dividend Fund | | Financial
Services Fund | | Innovators Fund | |
| | | | | | | | | | | |
10/31/2013 | | | $ | — | | | | $ | — | | | | $ | — | | | | $ | — | | |
10/31/2014 | | | $ | — | | | | $ | — | | | | $ | — | | | | $ | — | | |
10/31/2015 | | | $ | 26,548,709 | | | | $ | — | | | | $ | — | | | | $ | — | | |
10/31/2016 | | | $ | 536,971,822 | | | | $ | — | | | | $ | — | | | | $ | 6,415,976 | | |
10/31/2017 | | | $ | 388,131,987 | | | | $ | — | | | | $ | 115,243 | | | | $ | 5,637,266 | | |
10/31/2018 | | | $ | 154,525,095 | | | | $ | — | | | | $ | 143,772 | | | | $ | 1,581,056 | | |
10/31/2019 | | | $ | — | | | | $ | — | | | | $ | 1,217,416 | | | | $ | 342,429 | | |
| | | | | | | | | | | | | | | | | | | | | | |
Expiration Date | | | Transformations
Fund | | Foundation
Fund | | Ultra Short
Tax Optimized
Income Fund | | Municipal
Money
Market Fund | |
| | | | | | | | | | | |
10/31/2014 | | | $ | — | | | | $ | — | | | | $ | 47,352 | | | | $ | — | | |
10/31/2015 | | | $ | — | | | | $ | — | | | | $ | 2,112 | | | | $ | — | | |
10/31/2016 | | | $ | — | | | | $ | — | | | | $ | — | | | | $ | — | | |
10/31/2017 | | | $ | 276,410 | | | | $ | 332,914 | | | | $ | — | | | | $ | — | | |
10/31/2018 | | | $ | 9,077 | | | | $ | — | | | | $ | — | | | | $ | — | | |
10/31/2019 | | | $ | — | | | | $ | — | | | | $ | 124,756 | | | | $ | — | | |
| |
| In accordance with U.S. GAAP, the Funds have previously adopted accounting standards related to the accounting for uncertain tax positions. In accordance with this guidance, the Funds analyzed all open tax years, as defined by the Statute of Limitations, for all major jurisdiction. Open tax years are those that are open for exam by taxing authorities. Major jurisdictions for the Funds included Federal and the state of New York. As of October 31, 2011, open Federal and New York tax years include the tax years ended October 31, 2008 through 2011. The Funds have no examination in progress. The Funds have reviewed all open tax years and major jurisdictions and concluded that there is no impact on the Funds’ net assets and no tax liability resulting from unrecognized tax benefits relating to uncertain income tax positions taken in previous years or expected to be taken on the tax return for the fiscal year-end October 31, 2011. Also, the Funds have recognized no interest and penalties related to uncertain tax benefits. The Funds are also not aware of any tax positions for which it is reasonably possible that the total amounts of unrecognized tax benefits will significantly change in the next twelve months. |
121
Notes to Financial Statements—Continued
April 30, 2012 (Unaudited)
| |
| The Regulated Investment Company (“RIC”) Modernization Act of 2010 (the “Modernization Act”) modernizes several of the federal income and excise tax provisions related to RICs. The Modernization Act contains simplification provisions effective for taxable years beginning after December 22, 2010, which are aimed at preventing disqualification of a RIC for “inadvertent” failures of the asset diversification and/or qualifying income tests. Additionally, the Modernization Act allows capital losses to be carried forward indefinitely, and retain the character of the original loss, exempts RICs from the preferential dividend rule and repealed the 60-day designation requirement for certain types of pay-through income and gains. |
| |
8. | Subsequent Events: |
| |
| Distributions: The Dynamic Dividend Fund – Institutional Class and Class A paid a distribution from net investment income of $4,485,115 and $1,181 or $0.042 and $0.0413 per share, respectively, on April 30, 2012 to shareholders of record on April 27, 2012. The Accelerating Dividend Fund – Institutional Class and Class A paid a distribution from net investment income of $7,839 and $306 or $0.0391 and $0.0365 per share, respectively, on April 30, 2012 to shareholders of record on April 27, 2012. The Ultra Short Tax Optimized Income Fund – Class A and Institutional Class paid a distribution from net investment income of $182,638 and $850,836 or $0.00400389 and $0.00610849 per shares, respectively, on April 30, 2012 to shareholders of record on April 27, 2012. |
| |
9. | New Accounting Pronouncement: In May 2011, the FASB issued ASU No. 2011-04, “Fair Value Measurement: Amendments to Achieve Common Fair Value Measurement and Disclosure Requirements in U.S. GAAP and IFRS” (“ASU 2011-04”), modifying ASC 820. At the same time, the International Accounting Standards Board (“IASB”) issued International Financial Reporting Standard (“IFRS”) 13, “Fair Value Measurement”. The objective by the FASB and IASB is convergence of their guidance on fair value measurements and disclosures. Specifically, ASU 2011-04 requires reporting entities to disclose: (1) the amounts and reasons for any transfers between Level 1 and Level 2, and (2) for Level 3 fair value measurements: (a) quantitative information about significant unobservable inputs used, (b) a description of the valuation procedures used by the reporting entity, and (c) a narrative description of the sensitivity of the fair value measurement to changes in unobservable inputs if a change in those inputs might result in a significantly higher or lower fair value measurement. The effective date of ASU 2011-04 is for interim and annual periods beginning after December 15, 2011. At this time, management is evaluating the implications of this requirement and the impact it will have to the Fund’s financial statement disclosures. |
122
|
Alpine Mutual Funds |
| |
|
Additional Information (Unaudited) |
April 30, 2012 |
In the weeks leading up to the Meeting of the Board on March 28th, 2012, the Board Members reviewed materials specifically relating to the Advisory Contracts provided by the Adviser. The Board members had the opportunity to, and did, ask specific questions of the Adviser relating to the materials provided. In deciding whether to renew the Agreements, the Independent Trustees considered various factors, including (i) the nature, extent and quality of the services provided by Adviser under the Agreements, (ii) the investment performance of the Funds, (iii) the costs to the Adviser of its services and the profits realized by the Adviser, from its relationship with the Funds, and (iv) the extent to which economies of scale would be realized if and as a Fund grows and whether the fee levels in the Agreements reflect these economies of scale.
In considering the nature, extent and quality of the services provided by Adviser, the Independent Trustees relied on their prior experience as Independent Trustees of the Funds as well as on the materials provided at and prior to the meeting. They noted that under the Agreements, the Adviser is responsible for managing the Funds’ investments in accordance with the Fund’s investment objectives and policies, applicable legal and regulatory requirements, and the instructions of the Independent Trustees, for providing necessary and appropriate reports and information to the Independent Trustees, and for furnishing the Funds with the assistance, cooperation, and information necessary for the Funds to meet various legal requirements regarding registration and reporting. They also noted the experience and expertise of the Adviser as appropriate as an adviser to the Funds.
The Independent Trustees reviewed the background and experience of the Adviser’s senior management, including those individuals responsible for the investment and compliance operations with respect to the Funds’ investments, and the responsibilities of the investment and compliance personnel with respect to the Fund. They also considered the resources, operational structures and practices of the Adviser in managing the Funds’ portfolios, in monitoring and securing the Funds’ compliance with investment objectives and policies and with applicable laws and regulations, and in seeking best execution of portfolio transactions. Drawing upon the materials provided and their general knowledge of the business of the Adviser, the Independent Trustees took into account that the Adviser’s experience, resources and strength in these areas are deep, extensive and of high quality. On the basis of this review, the Independent Trustees determined that the nature and extent of the services provided by the Adviser to the Fund were appropriate, had been of high quality, and could be expected to remain so.
The Independent Trustees discussed the Fund performance metrics compiled from Morningstar data and those internally generated by Alpine. It was observed that the last quarter of performance had been strong for several of the Funds. In assessing the quality of the portfolio management delivered by the Adviser, the Independent Trustees also compared the short-term and long-term performance of each Fund on both an absolute basis and in comparison to its peer group, as constructed by data provided by independent rating agencies. The Independent Trustees noted that the performance of a number of the Funds was strong. Of importance to the Independent Trustees was the extent to which the Funds achieved their objectives. They further concluded that the expense ratios of the Funds were appropriate and in line with competitors. Accordingly, the Independent Trustees concluded that the performance of the Funds was satisfactory.
The Independent Trustees considered the profitability of the advisory arrangement with the Adviser. The Independent Trustees had been provided with general data on the Funds’ profitability with respect to the advisory arrangement with the Adviser. The Independent Trustees also examined the level of profits that could be expected to accrue to the Adviser from the fees payable under the Agreements and any expense subsidization undertaken by the Adviser, as well as each Funds’ brokerage and commissions. After discussion and analysis, they concluded that, to the extent that the Adviser’s relationship with the Funds had been profitable, the profitability was in no case such as to render the advisory fee excessive.
The Independent Trustees discussed the other materials provided by Alpine, including expense information, organization charts, advisory fee breakpoints and profitability data. In reviewing breakpoints, the Independent Trustees recognized that breakpoints were more relevent for open-end funds, where assets could continue to grow over time.
In considering whether the Adviser benefits in other ways from its relationship with the Funds, the Independent Trustees concluded that, to the extent that Adviser derives other benefits from its relationship with the Funds, those benefits are not so significant as to render the Adviser’s fees excessive.
On the basis of their discussions with management and their analysis of information provided at the meeting, the Independent Trustees determined that the nature of the Funds and their operations is such that the Adviser may realize economies of scale in the management of certain Funds as they grow in size.
123
|
Alpine Mutual Funds |
| |
|
Additional Information (Unaudited)—Continued |
April 30, 2012 |
The Independent Trustees approved the continuance of the Funds’ Agreements with Adviser after weighing the foregoing factors. They reasoned that the nature and extent of the services provided by the Adviser were appropriate, that the performance of the Funds had been satisfactory, and that Adviser could be expected to provide services of high quality. As to the Adviser’s fees for the Funds, the Independent Trustees determined that the fees, considered in relation to the services provided, were fair and reasonable, that the Funds’ relationship with the Adviser was not so profitable as to render the fees excessive, that any additional benefits to the Adviser were not of a magnitude that materially affected the Independent Trustees’ deliberations, and that the fees adequately reflected shared economies of scale with the Funds.
After reconvening, the Trustees, including a majority of the Independent Trustees, agreed to approve the continuation of the Agreements for one year.
SHAREHOLDER MEETING
On June 8, 2012, the Fund held its Annual Meeting of Shareholders (the “Meeting”) for the purpose of voting on proposals below. The results stated as a percentage of the shares voted are as follows:
Proposal 1: To elect H. Guy Leibler, James A. Jacobson, Jeffrey E. Wacksman, and Samuel A. Lieber as Trustee to the Board of Trustees for an indefinite term or until his successor has been duly elected and qualified.
| | | | | | | | |
| | Series Trust | | Income Trust |
| | For | | Withheld | | For | | Withheld |
H. Guy Leibler | | 89.99% | | 10.01% | | 99.15% | | 0.85% |
James A. Jacobson | | 90.14% | | 9.86% | | 99.13% | | 0.87% |
Jeffrey E. Wacksman | | 90.17% | | 9.83% | | 99.26% | | 0.74% |
Samuel A. Lieber | | 89.85% | | 10.15% | | 98.63% | | 1.37% |
Proposal 2: To transact such other business as may properly come before the meeting or any adjournments or postponements thereof.
| | | | |
| | Series Trust | | Income Trust |
For | | 85.69% | | 80.33% |
Against | | 10.62% | | 18.73% |
Abstain | | 3.69% | | 0.94% |
124
|
Alpine Mutual Funds |
| |
|
Additional Information (Unaudited)—Continued |
April 30, 2012 |
Tax Information
The Funds designated the following percentages of dividends declared from net investment income for the fiscal year ended October 31, 2011 as qualified dividend income under the Jobs & Growth Tax Relief Reconciliation Act of 2003.
| |
Dynamic Dividend Fund | 59% |
Accelerating Dividend Fund | 53% |
Financial Services Fund | 100% |
Innovators Fund | 0% |
Transformations Fund | 0% |
Foundation Fund | 93% |
Ultra Short Tax Optimized Income Fund | 0% |
Municipal Money Market Fund | 0% |
The Funds designated the following percentages of dividends declared during the fiscal year ended October 31, 2011 as dividends qualifying for the dividends received deduction available to corporate shareholders.
| |
Dynamic Dividend Fund | 13% |
Accelerating Dividend Fund | 38% |
Financial Services Fund | 100% |
Innovators Fund | 0% |
Transformations Fund | 0% |
Foundation Fund | 73% |
Ultra Short Tax Optimized Income Fund | 0% |
Municipal Money Market Fund | 0% |
| |
The Funds designated the following percentages of taxable ordinary income distributions as short-term capital gain distributions under Internal Revenue Section 871(k)(2)(C). |
| |
Dynamic Dividend Fund | 0% |
Accelerating Dividend Fund | 0% |
Financial Services Fund | 0% |
Innovators Fund | 0% |
Transformations Fund | 0% |
Foundation Fund | 0% |
Ultra Short Tax Optimized Income Fund | 0% |
Municipal Money Market Fund | 0% |
The Fund designated as long-term capital gain dividend, pursuant to Internal Revenue Cose Section 852(b)(3), the amount necessary to reduce the earnings and profits of the Fund related to net capital gain to zero for the tax year ended October 31, 2011.
Availability of Proxy Voting Information
Information regarding how each Fund votes proxies relating to portfolio securities is available without charge upon request by calling toll-free at 1-888-785-5578 and on the SEC’s website at www.sec.gov. Information regarding how each Fund voted proxies relating to portfolio securities during the most recent twelve month period ended June 30 is available on the SEC’s website at www.sec.gov or by calling the toll-free number listed above.
Availability of Quarterly Portfolio Schedule
Beginning with each Fund’s fiscal quarter ended July 31, 2004, each Fund filed its complete schedule of portfolio holdings on Form N-Q with the SEC. Going forward, each Fund will file Form N-Q for the first and third quarters of each fiscal year on Form N-Q. Each Fund’s Form N-Q is available on the SEC’s website at www.sec.gov and may be reviewed and copied at the SEC’s Public Reference Room in Washington, DC. Information on the operation of the Public Reference Room may be obtained by calling 1-202-551-8090.
125
|
Alpine Mutual Funds |
| |
|
Additional Information (Unaudited)—Continued |
April 30, 2012 |
Privacy Policy
The Funds collect non-public information about you from the following sources:
| | |
| • | information we receive about you on applications or other forms; |
| • | information you give us orally; and |
| • | information about your transactions with others or us. |
The Funds do not disclose any non-public personal information about our customers or former customers without the customer’s authorization, except as required by law or in response to inquiries from governmental authorities. The Funds restrict access to your personal and account information to those employees who need to know that information to provide products and services to you. The Funds also may disclose that information to unaffiliated third parties (such as to brokers or custodians) only as permitted by law and only as needed for us to provided agreed services to you. The Funds maintain physical, electronic and procedural safeguards to guard your non-public personal information.
In the event that you hold shares of the Funds through a financial intermediary, including, but not limited to a broker dealer, bank or trust company, the privacy policy of your financial intermediary would govern how your non-public personal information would be shared with unaffiliated third parties.
126
|
TRUSTEES |
Samuel A. Lieber |
James A. Jacobson |
H. Guy Leibler |
Jeffrey E. Wacksman |
|
CUSTODIAN & |
ADMINISTRATOR |
State Street Bank & Trust Company |
One Lincoln Street |
Boston, MA 02111 |
|
INDEPENDENT REGISTERED |
PUBLIC ACCOUNTING FIRM |
Deloitte & Touche LLP |
555 East Wells Street |
Milwaukee, WI 53202 |
|
FUND COUNSEL |
Wilkie Farr & Gallagher LLP |
787 7th Avenue 40th FL |
New York, NY 10019 |
|
DISTRIBUTOR |
Quasar Distributors, LLC |
615 East Michigan Street |
Milwaukee, WI 53202 |
|
INVESTMENT ADVISER |
Alpine Woods Capital Investors, LLC |
2500 Westchester Ave., Suite 215 |
Purchase, NY 10577 |
|
TRANSFER AGENT |
Boston Financial Data Services |
Two Heritage Drive |
North Quincy, MA 02171 |
|

|
|
SHAREHOLDER | INVESTOR INFORMATION |
|
1(888)785.5578 |
www.alpinefunds.com |
|
This material must be preceded or accompanied by a current prospectus. |
Item 2. Code of Ethics
Not applicable to semi-annual reports.
Item 3. Audit Committee Financial Expert
Not applicable to semi-annual reports.
Item 4. Principal Accountant Fees and Services
Not applicable to semi-annual reports.
Item 5. Audit Committee of Listed Registrants
Not applicable to registrants who are not listed issuers (as defined in Rule 10A-3 under the Securities Exchange Act of 1934).
Item 6. Schedule of Investments
| |
(a) | Schedule of Investments is included as part of Item 1 of the Form N-CSR. |
| |
(b) | Not applicable. |
Item 7. Disclosure of Proxy Voting Policies and Procedures for Closed-End Management Investment Companies.
Not applicable to open-end investment management companies.
Item 8. Portfolio Managers of Closed-End Management Investment Companies.
Not applicable to open-end investment management companies.
Item 9. Purchases of Equity Securities by Closed-End Management Investment Company and Affiliated Purchasers.
Not applicable to open-end investment management companies.
Item 10. Submission of Matters to a Vote of Security Holders.
There were no material changes to the procedures by which shareholders may recommend nominees to the Registrant’s Board of Trustees.
Item 11. Controls and Procedures.
| |
| (a) The Registrant’s principal executive officer and principal financial officer have evaluated the registrant’s disclosure controls and procedures (as defined in Rule 30a-3(c) under the Investment Company Act of 1940, as amended) within 90 days of this filing and have concluded that the Registrant’s disclosure controls and procedures were effective, as of that date. |
| |
| (b) There was no change in the Registrant’s internal control over financial reporting (as defined in Rule 30a-3(d) under the Investment Company Act of 1940, as amended) during the second fiscal quarter of the period covered by this report that has materially affected, or is reasonably likely to materially affect, the Registrant’s internal control over financial reporting. |
Item 12. Exhibits
(a)(1) Not applicable to semi-annual reports.
(a)(2) The certifications required by Rule 30a-2(a) of the Investment Company Act of 1940, as amended, and Section 302 of the Sarbanes-Oxley Act of 2002 are attached hereto as Ex99.Cert.
(a)(3) Not applicable.
(b) The certifications by the Registrant’s Principal Executive Officer and Principal Financial Officer, as required by Rule 30a-2(b) of the Investment Company Act of 1940, as amended, and Section 906 of the Sarbanes-Oxley Act of 2002 are attached hereto as Ex99.906Cert.
SIGNATURES
Pursuant to the requirements of the Securities Exchange Act of 1934 and the Investment Company Act of 1940, the registrant has duly caused this report to be signed on its behalf by the undersigned, thereunto duly authorized.
| | |
Alpine Income Trust | |
| | |
By: | /s/ Samuel A. Lieber | |
|
| |
| Samuel A. Lieber | |
| Chief Executive Officer (Principal Executive Officer) |
| | |
Date: | July 9, 2012 | |
Pursuant to the requirements of the Securities Exchange Act of 1934 and the Investment Company Act of 1940, this report has been signed below by the following persons on behalf of the registrant and in the capacities and on the dates indicated.
| | |
By: | /s/ Samuel A. Lieber | |
|
| |
| Samuel A. Lieber | |
| Chief Executive Officer (Principal Executive Officer) |
| | |
By: | /s/ Ronald G. Palmer, Jr. | |
|
| |
| Ronald G. Palmer, Jr. | |
| Chief Financial Officer (Principal Financial Officer) |
| | |
Date: | July 9, 2012 | |