UNITED STATES
SECURITIES AND EXCHANGE COMMISSION
Washington, D.C. 20549
FORM N-CSR
CERTIFIED SHAREHOLDER REPORT OF REGISTERED
MANAGEMENT INVESTMENT COMPANIES
Investment Company Act file number: 811-21210
Alpine Income Trust
(Exact name of registrant as specified in charter)
2500 Westchester Avenue, Suite 215
Purchase, New York 10577
(Address of principal executive offices)(Zip code)
(Name and Address of Agent for
Service) | Copy to: |
Samuel A. Lieber Alpine Woods Capital Investors, LLC 2500 Westchester Avenue, Suite 215 Purchase, New York 10577 | Rose DiMartino Attorney at Law Willkie Farr & Gallagher 787 7th Avenue, 40th Floor New York, New York 10019 |
Registrant’s telephone number, including area code: (914) 251-0880
Date of fiscal year end: October 31
Date of reporting period: November 1, 2012 - April 30, 2013
Item 1: Shareholder Report

Equity & Income Funds
| | | | | |
| | Alpine Dynamic Dividend Fund
Institutional Class (ADVDX)
Class A (ADAVX) | | Alpine Transformations Fund
Institutional Class (ADTRX)
Class A (ADATX) | |
| | Alpine Accelerating Dividend Fund Institutional Class (AADDX)
Class A (AAADX) | | Alpine Foundation Fund
Institutional Class (ADBYX)
Class A (ADABX) | |
| | Alpine Financial Services Fund
Institutional Class (ADFSX)
Class A (ADAFX) | | Alpine Ultra Short Tax Optimized Income Fund
Institutional Class (ATOIX)
Class A (ATOAX) | |
| | Alpine Innovators Fund
Institutional Class (ADINX)
Class A (ADIAX) | | Alpine Municipal Money Market Fund
Investor Class (AMUXX) | |
Semi-Annual Report
Table of Contents
Additional Alpine Funds are offered in the Alpine Equity Trust. These Funds include:
| Alpine International Real Estate Equity Fund | Alpine Global Infrastructure Fund |
| | |
| Alpine Realty Income & Growth Fund | Alpine Global Consumer Growth Fund |
| | |
| Alpine Cyclical Advantage Property Fund | |
| | |
| Alpine Emerging Markets Real Estate Fund | |
Alpine’s Real Estate Funds’ investment objectives, risks, charges and expenses must be considered carefully before investing in funds of the Alpine Equity Trust. The statutory and summary prospectuses contain this and other important information about the investment company, and it may be obtained by calling 1-888-785-5578, or visiting www.alpinefunds.com. Read it carefully before investing.
Mutual fund investing involves risk. Principal loss is possible.

Alpine’s Investment Outlook
Dear Shareholders:
Over the past six months, capital markets have been induced by cheap money into following the “hope” trade. The ‘hope’ is that global central bank stimuli will continue to drive demand for stocks, bonds and alternative investments, allowing for continued balance sheet recapitalization and debt cost reduction until the onset of meaningful job and income growth kicks in. Nevertheless, if the markets are broadly heeding the call of ‘don’t fight the Fed (Federal Reserve)’, an increasing number of market participants are focusing on the potential impact of an eventual unwinding of this global pump priming with considerable trepidation. For example, if the Fed ‘tapers’ the amount of its asset buying program known as quantitative easing (QE), will this be akin to setting a raft adrift in mid-ocean, or will they only do so when land is visible, when employment and economic growth have been sustained? We just learned that the Fed will keep some assets bought under QE ($3.5 trillion to date) on its balance sheet until the bonds mature. While speculating on when, how quickly, and on what scale, the Fed divests fills considerable time on CNBC, it is really just another set of data points in setting investment policy.
These as yet uncertain outcomes are already being partly discounted by the market, potentially years in advance. Perhaps such concerns will continue to create a waltz-like pattern of returns, advancing two steps forward for each move sideways or back, a pattern some call “climbing a wall of worry.” This typically occurs when the market has yet to embrace a trend, despite overall positive sentiment. While at times the ensuing volatility is unsettling, this trend limits excess exuberance.
Alpine believes that all of the world’s major central banks will gradually join the fight against potential deflation, brought on by debt repayment and deleveraging at a time of slow growth which is characterized by moderating consumer demand. However, without the conventional push of fiscal stimulus working in tandem with monetary easing, the recovery from the Great Recession has been anemic. This has been reflected in the velocity of global monetary growth, which already slow,
has been declining over the past year. Instead, global growth has moderated while we hope for a job creating economic recovery fueled by pent up consumer demand and expansionary corporate capex. Over time, such a rise in activity would hopefully launch a self-sustaining surge in corporate profits and equity market expansion which would offset the negative impact of rising bond yields. If this occurs, it is more likely that other factors or even global events, financial or otherwise, would temper such an optimistic scenario. Nonetheless, we should be able to bank on the Fed’s own statement “...that a highly accommodative stance ... will remain appropriate for a considerable time after the asset purchase program ends and the economic recovery strengthens.” The Fed has stated that the Fed-Funds rate is not projected to rise until 2015, leading us to project limited increases in long rates for the next few years with 10-year U.S. Treasury yields fluctuating around the average of the past five years centered at 2.78%. Some fear that this could prove inflationary over time, and we believe this is precisely what the Fed is in fact targeting.
Historical Precedents for Stimulus
Historically, government intervention via monetary and fiscal policy tools has induced both economic slowdowns and surges. Former Fed Governor Paul Volker squeezed inflationary expectations and pressures out of the U.S. financial system, inducing the recession of 1981-82 through a highly restrictive monetary policy. The subsequent “Reagan recovery” used massive tax and fiscal stimulus to drive the economy forward. However, lax regulation and continued monetary stimulus following 1987’s “Black Monday” stock market crash led to the excesses and bust of the Savings & Loan (“S&L”) industry in 1989-90.
After the S&L crisis of 1990, our economy was rebooted and rallied in the aftermath of the “Desert Storm” campaign to contain Iraq. By mid-decade, we enjoyed a great surge in growth, job expansion and family wealth creation throughout the U.S., pulling along much of the world over a prolonged recovery. Innovation and internet expansion were further fueled by easy money (leading up
1
to Y2K), which ended with the collapse of the internet bubble in 2000. After the tragedy of “9/11”, this millennium’s first decade endured a bad experience of “guns and butter” stimulus through draining wars, tax cuts and uncontrolled financial excesses. This set up a roller coaster ride, first down and then way up, without functional brakes, before crashing in 2008.
Alas, this near systemic meltdown has required an extended period of adjustment, absorption, and/or rationalization of excesses, in the form of jobs, businesses, corporate spending, and inevitably, government tax receipts and spending. In essence, the credit based capital delivery system was broken, perhaps beyond repair, but the collective response has not been to redesign and build anew. Instead, we cut back the weak branches but have not fed or fertilized the plant, providing only a steady drip for life support. This period of downsizing has been supported by central bankers around the world who have pumped capital into the global financial system in order to stabilize markets, support weak bank balance sheets until they can become healthy, and moderate the impact of slow economic growth on unemployment.
Must There be An Era of Austerity?
The product of monetary stimulus over the past four and one-half years is a modest recovery in the U.S., new hope for recovery in Japan, a stable if somewhat slower China, and a still weak, if not further receding European economy. Notably, all of the major global economies withdrew or significantly reduced their fiscal stimulus following the initial stabilization efforts after the desperate days of 2008 and 2009. This is in contrast with the historic patterns of prior recessionary periods in the U.S., such as 1981-1982, or 1990-1991, when there were rising levels of aggregate fiscal stimulus for extended periods of two to three years. That is, historically our Government either extended tax relief, program support and/or made direct investments to foster economic activity over a sustained period of time. This time, substantial monetary and fiscal stimulus during 2009 was not extended amidst fears that higher Government debt would further strain weak GDP levels in an economy already straining against an aging demographic profile with higher future costs. The prospect of higher debt burdens just as many faced retirement was not politically palatable. However, unlike past recoveries which typically took hold a few years after recession ended, the significant short term erosion of tax receipts due to lower taxable sales and earnings, had made annual fiscal deficits appear much higher than the long term trend.
Now, it appears that prospective deficits are smaller than some feared, just as fiscal policy paralysis set in, compounded by election cycles around the world. In fact, the confluence of strong current positions of politically and fiscally conservative parties in power across many key countries led to the imposition of virtual, if not outright, austerity beginning in 2010 and extending throughout Europe and North America. Many believe that the impact of sequestration in the U.S. will slow our economy, notably in the second quarter, limiting the prior period’s buildup. However, we now see an alternative emerging, perhaps out of desperation. A very bold, and potentially very powerful economic experiment is underway in Japan. If Japan’s experiment fails, it will become yet another drag to economic growth (albeit at 7% of global GDP, no longer large enough to be catastrophic). If it succeeds in fostering a dynamic level of economic activity, however, the rest of the world may follow suit.
Japan can be viewed as the progenitor of the recent decade’s debt fueled bubble economics and, perhaps, is an example of how bad things can get if they are not handled correctly. Japan has muddled through a period of extended wealth depreciation, asset deflation and debt expansion since its stock market peaked in 1990. This predicament has evolved by alternating between ineffectual austerity programs and inadequate stimulus packages. The recently elected President, Shinzaro Abe, has reshuffled the Bank of Japan and the Finance Ministry to push quantitative easing on a relative scale of three-fold what our Fed has done. Of perhaps greater impact, Abe will seek a parliamentary victory this summer as a mandate for creating fiscal and structural economic reforms. If indeed there are material reforms, there is a possibility that Japan can restart a new period of economic growth with a more dynamic economy. This could happen despite demographic constraints, the world’s highest government debt to GDP ratio (in excess of 200% or over 400% when corporate and household debt are included) and a history of negative consumer and investor sentiment.
Our View: Fiscal Stimulus Has Already Had Success Here
In October 2008, President Bush signed the legislation creating the $700 billion Troubled Asset Relief Program (TARP), which was used initially to help keep AIG, Citigroup and Bank of America afloat, and later provided much needed assistance (which President Obama augmented) to Chrysler and General Motors (GM). On June 6, both GM and AIG rejoined the S&P 500, a triumphant (if symbolic) victory since their near collapse some five years ago. And as unthinkable as it was five years ago, the taxpayers have
2
turned a profit on the AIG deal. Later, the Obama administration provided stimulus via loans through the Department of Energy to green tech entrepreneurs like Solyndra and Tesla Motors. And while the Solyndra bankruptcy was a politically embarrassing poor investment, it turns out that Tesla was a pretty good one, having recently raised capital to pay the government back - nine years ahead of schedule. It’s worth noting that cars being made in the U.S., relative to foreign competitors, are now widely judged as comparable in terms of quality and value for the first time in a generation. Also, it is significant that Consumer Reports gave the Tesla ‘S’ its highest score of any car since a top of the line Lexus in 2008. Pretty impressive for a new company!
Obama’s 2009 stimulus package also offered investments beyond “shovel-ready” projects, such as advanced manufacturing tax credits for clean energy that went to approximately 200 U.S. factories, with significant results. To provide one example, in 2008, approximately 80% of the average U.S. wind turbine was made of imported parts. But after the stimulus created these factories that make one or several of the 8,000 parts that go into a turbine, the percentage of imported parts has dropped to 40%. In some ways, this is not very different than when the government subsidizes oil well drilling, or private equity investments by allowing deferred payback of gains or carrying losses on poor investments to offset future gains from productive ones. All of this suggests that stimulus investing could be beneficial in retaining jobs for the short run and aiding the growth of new businesses in the medium to long run.
What Should We Do Next?
In the U.S., we can take pride not only in the quality of our new cars but also in the fact that we still have the most significant economy in the world. Over time, our banks’ balance sheets and business models have become more stable, while economic output and household and corporate balance sheets are stronger than they were before the bust. As a result, the U.S. consumer is recovering confidence and household net worth is again growing now that housing prices are returning to long term trend levels. It does not hurt that the potential realization of huge oil and gas reserves through improved extraction technology promises energy cost advantages for the U.S. over the next generation, although its initial benefits have yet been barely realized. Indeed, in 2008 “drill baby drill” became a rallying cry that ultimately was more political inspiration than economic necessity. Perhaps today a more beneficial and promising slogan should be “build baby build”. To realize this energy wealth, we believe we need to build pipelines
and transportation systems that are secure from storms, hackers or other forms of attack. We also believe that we need refineries, fertilizer plants, and environmental control procedures that are state of the art. Pressure is intensifying to rebuild those under- maintained bridges and roads upon which our interstate commerce is dependent and rebuild or expand regional rail networks for commuters. It is our opinion that we need to enhance our water treatment and distribution plants, and to take our above-ground electric and telephone utility wires underground before too many hurricanes, tornados or mudslides force us to continually rebuild them. Major ports of entry into the country, be they by air or sea, for people or freight, should be upgraded to a level commensurate with the stature of our economy. We feel these efforts would not only create much needed engineering and construction jobs now, but would be investments that could have meaningful returns over many years. That is just what we did with the interstate highway system and the GPS navigation system, both of which were created by government, and have dramatically aided industry, consumption, and individual use. The myriad of benefits over the years, including job creation and a generation of strong returns, probably sounds like a good investment to most people.
It is often said that the 1944 GI bill, with its low cost mortgages, business loans and tuition assistance, created the middle class. Well, another level of investment that should be made is for our soldiers returning from active deployment and desirous of further service, training or perhaps advanced education, but who are unable to access these for various reasons. The payback as illustrated by the unemployment data is quite stark in the disparity between those with a college degree (-3.9%) versus those without a secondary degree (-11.65%). So beyond further assistance, perhaps we should strengthen an independent Coast Guard, rebuild the Park Service, expand the Job Corps, and institutionalize technical training more broadly. Here the payback will not be as quick and the monetary returns will be partially indirect, but it is a worthy undertaking if we can lower prison populations, reduce alcoholism or drug dependency, and host fewer homeless people in emergency rooms.
What Could This Mean for Markets?
So what does this mean for stock investing? Money is still flowing into the U.S. to invest, which should strengthen the dollar over time and keep inflation in this country low while also supporting our bond and equity markets. The U.S., U.K. and Japan have all adopted quantitative easing strategies and it is likely that the Europeans will probably do so within the next three to six months, depending
3
upon unemployment rates and contested German elections in September. In recent months, European equities and bonds have traded well in response to stabilization efforts, and in anticipation of funds flowing out of Japanese debt markets in a global search of higher yields. While Italian and Spanish 10-year debt trades at yields of 3.88% and 4.11% respectively, this is a big spread over Japanese bonds at 0.88%, or even U.S. bonds at 1.64% (Bloomberg, May 1st). If the European Central Bank (ECB) also undertakes quantitative easing before year end, we believe that the global equity rally may continue and sustain current trends well into 2014.
The big test will be whether the global economy shows increased prospects for gradual expansion into 2015. We believe a major wild card will be whether Japan undertakes meaningful fiscal and structural reforms as well as direct stimulus of the economy to help boost business and consumer demand. This means no more bridges to nowhere, but practical and impactful investments which create jobs and provide a return on invested capital that appeals to global investors. It will require streamlining regulations and revamping or redefining bureaucracies. It is possible that Japan could become a model for other countries to follow. Such a scenario suggests a meaningful and robust economic climate could unfold for an extended period of time. While prudence suggests that one should rarely bet on the most optimistic scenario, it has often been the case that great challenges set the stage for positive change and new opportunity.
Alpine believes that the forces for change are stronger than those of complacency and the status quo. High unemployment led to the street riots in Tunisia, which set off the Jasmine Revolution in the Middle East two years ago, and today we find youth unemployment in Spain and Greece is over 55%, over 30% in Ireland, 33% in Italy, 26% in France, and even 20% in the U.K. Historically, civilizations either adapt and survive when one crisis begets another, or they perish.
The globalization of labor, ideas and capital has dramatically shifted the landscape over the past 50 years, yet the organization and operational structure of many of our institutions often dates back 50 years. In that time, demographic profiles have changed dramatically within countries and between regions. In similar fashion, economic powers are shifting as industries expand and contract across countries and regions. Now, with the advent of rapid mass mobile communications, more people know what they want and have the means to figure out how to get it. All of this increases the odds that the flashpoint which unleashes change could come from unlikely places.
Could the last ‘Bubble Economy’ of the Twentieth Century be the first economy to shift from deflation to inflation and show the rest of us how to reignite growth? We are hopeful that if Japan sets a successful model for fiscal and structural reform and stimulus, other countries will follow. If not Japan, we firmly believe that another protagonist will emerge.
We thank you for your support and interest.
Sincerely,

Samuel A. Lieber
President
Past performance is not a guarantee of future results. The specific market, sector or investment conditions that contribute to a Fund’s performance may not be replicated in future periods.
Mutual fund investing involves risk. Principal loss is possible. Please refer to the individual fund letters for risks specific to that fund.
This letter and the letters that follow represent the opinions of the Fund’s management and are subject to change, are not guaranteed and should not be considered recommendations to buy or sell any security. The information provided is not intended to be, and is not, a forecast of future events, a guarantee of future results, or investment advice.
4
| Disclosures and Definitions |  |
Equity Income Disclosures –
Please refer to the Schedule of Portfolio Investments for each Fund’s holding information. Fund holdings and sector allocations are subject to change and should not be considered a recommendation to buy or sell any security.
Current and future portfolio holdings are subject to risk.
Favorable tax treatment of Fund distributions may be adversely affected, changed or repealed by future changes in tax laws. Alpine may not be able to anticipate the level of dividends that companies will pay in any given timeframe.
A portion of the Fund’s distributions may be comprised of return of capital or short-term or long-term capital gains. To the extent that the distribution is from a source other than net investment income, a 19a-1 notice will be provided and is available on our website.
Neither the Fund nor any of its representatives may give tax advice. Investors should consult their tax advisor for information concerning their particular situation.
Diversification does not assure a profit or protect against loss in a declining market.
Must be preceded or accompanied by a prospectus.
Quasar Distributors, LLC, distributor.
Equity Income Definitions
A Basis Point is a value equaling one one-hundredth of a percent (1/100 of 1%).
Cash Burn is the rate at which a new company uses up its venture capital to finance overhead before generating positive cash flow from operations. Also used as a measure of negative cash flow.
Custom Balanced Benchmark reflects an unmanaged portfolio (rebalanced monthly) of 60% of the S&P 500 Index, which is a market capitalization-weighted index of 500 large capitalization stocks commonly used to represent the U.S. equity market, and 40% of the Barclays Capital U.S. Aggregate Bond Index (BCAG), which is a widely recognized, unmanaged index of U.S. dollar-denominated investment-grade fixed income securities. The Fund may, however, invest up to 75% of its total assets in equity securities.
EBITDA (Earnings Before Interest, Taxes, Depreciation and Amortization) is essentially Net Income with Interest, Taxes, Depreciation, and Amortization added back to it. EBITDA can be used to analyze and compare profitability between companies and industries because it eliminates the effects of financing and accounting decisions. However, this is a non-GAAP measure that allows a
greater amount of discretion as to what is (and is not) included in the calculation. This also means that companies often change the items included in their EBITDA calculation from one reporting period to the next.
Hedge involves making an investment to reduce the risk of adverse price movements in an asset. Normally, a hedge consists of taking an offsetting position in a related security, such as a futures contract.
KBW Bank Index is a modified cap-weighted index consisting of 24 exchange-listed and National Market System stocks, representing national money center banks and leading regional institutions.”
Lipper Mixed-Asset Target Allocation Growth Funds Average is an average of funds that, by portfolio practice, maintain a mix of between 60%-80% equity securities, with the remainder invested in bonds, cash, and cash equivalents.
MSCI All Country World Index Gross USD is a free float-adjusted market capitalization-weighted index that is designed to measure the equity market performance of developed and emerging markets. Source: MSCI. MSCI makes no express or implied warranties or representations and shall have no liability whatsoever with respect to any MSCI data contained herein. The MSCI data may not be further redistributed or used as a basis for other indices or any securities or financial products. This report is not approved, reviewed or produced by MSCI.
NASDAQ Financial-100 Index includes 100 of the largest domestic and international financial securities listed on the NASDAQ Stock Market based on market capitalization. They include companies classified according to the Industry Classification Benchmark as Financials, which are included within the NASDAQ Bank, NASDAQ Insurance, and NASDAQ Other Finance Indexes.
Russell 3000® Index measures the performance of the largest 3000 U.S. companies representing approximately 98% of the investable U.S. equity market.
S&P 500® Index is float-adjusted, market capitalization-weighted index of 500 common stocks chosen for market size, liquidity, and industry group representation to represent U.S. equity performance.
5
[THIS PAGE INTENTIONALLY LEFT BLANK]
6
Equity Manager Reports

| | Alpine Dynamic Dividend Fund | |
| | | |
| | Alpine Accelerating Dividend Fund | |
| | | |
| | Alpine Financial Services Fund | |
| | | |
| | Alpine Innovators Fund | |
| | | |
| | Alpine Transformations Fund | |
| | | |
| | Alpine Foundation Fund | |
7
| Alpine Dynamic Dividend Fund |  |
| Comparative Annualized Returns as of 4/30/13 (unaudited) | | |
| | | 6 Months(1) | | 1 Year | | 3 Years | | 5 Years | | Since Inception(2) |
| Alpine Dynamic Dividend Fund — Institutional Class | | | 9.88 | % | | | 10.78 | % | | | 3.57 | % | | | -4.70 | % | | | 4.04 | % |
| Alpine Dynamic Dividend Fund — Class A (Without Load) | | | 9.74 | % | | | 10.54 | % | | | N/A | | | | N/A | | | | 13.87 | % |
| Alpine Dynamic Dividend Fund — Class A (With Load) | | | 3.80 | % | | | 4.36 | % | | | N/A | | | | N/A | | | | 9.14 | % |
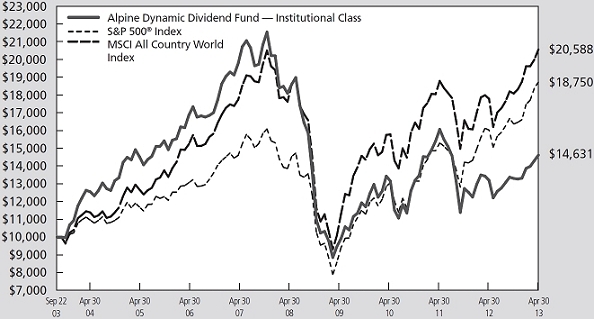
| MSCI All Country World Index Gross USD | | | 13.72 | % | | | 15.60 | % | | | 9.22 | % | | | 2.01 | % | | | 7.81 | % |
| S&P 500® Index | | | 14.42 | % | | | 16.89 | % | | | 12.80 | % | | | 5.21 | % | | | 6.77 | % |
| Lipper Global Equity Income Funds Average(3) | | | 12.29 | % | | | 15.48 | % | | | 9.16 | % | | | 1.13 | % | | | 6.29 | % |
| Lipper Global Equity Income Funds Ranking(3) | | | N/A | (4) | | | 74/76 | | | | 50/50 | | | | 38/38 | | | | 12/12 | |
| Gross Expense Ratio (Institutional Class): 1.28%(5) | | | | | | | | | | | | | | | | | | | | |
| Net Expense Ratio (Institutional Class): 1.28%(5) | | | | | | | | | | | | | | | | | | | | |
| Gross Expense Ratio (Class A): 1.53%(5) | | | | | | | | | | | | | | | | | | | | |
| Net Expense Ratio (Class A): 1.53%(5) | | | | | | | | | | | | | | | | | | | | |
| (1) | Not annualized. |
| (2) | Institutional Class shares commenced on September 22, 2003 and Class A shares commenced on December 30, 2011. Returns for indices are since September 22, 2003. |
| (3) | The since inception return represents the period beginning September 25, 2003 (Institutional Class only). |
| (4) | FINRA does not recognize rankings for less than one year. |
| (5) | As disclosed in the prospectus dated February 28, 2013. |
Performance data quoted represents past performance and is not predictive of future results. Investment return and principal value of the Fund fluctuate, so that the shares, when redeemed, may be worth more or less than their original cost. Performance current to the most recent month end may be lower or higher than performance quoted and may be obtained by calling 1-888-785-5578. Performance data shown does not reflect the 1.00% redemption fee imposed on shares held for fewer than 60 days. If it did, total returns would be reduced. Returns for the Class A shares with sales charge reflect a maximum sales charge of 5.50%. Performance for the Class A shares without sales charges does not reflect this load.
The MSCI All Country World Index Gross USD is a free float-adjusted market capitalization-weighted index that is designed to measure the equity market performance of developed markets. Source: MSCI. MSCI data may not be reproduced or used for any other purpose. The S&P 500® Index is float-adjusted market capitalization index of 500 common stocks chosen for market size, liquidity and industry group representation to represent U.S. equity performance. The Lipper Global Equity Income Funds Average is an average of funds that by prospectus language and portfolio practice seek relatively high current income and growth of income by investing at least 65% of their portfolio in dividend-paying securities of domestic and foreign companies. Lipper rankings for the periods shown are based on fund total returns with dividends and distributions reinvested and do not reflect sales charges. The S&P 500® Index and the Lipper Global Equity Income Funds Average are unmanaged and do not reflect the deduction of direct fees associated with a mutual fund, such as investment adviser fees; however, the Lipper Global Equity Income Funds Average reflects fees charged by the underlying funds. The performance for the Alpine Dynamic Dividend Fund reflects the deduction of fees for these value-added services. Investors cannot directly invest in an index.
Expense ratios reflect the ratios reported in the Fund’s most recent prospectus. The Alpine Dynamic Dividend Fund has a contractual expense waiver that continues through February 28, 2014. Where a Fund’s gross and net expense ratio are the same for the period reported, the contractual expense reimbursement level was not reached as of the end of that period. To the extent the Fund’s expenses were reduced by waivers, the Fund’s total returns were increased. In these cases, in the absence of the expense waivers, the Fund’s total returns would have been lower.
To the extent that the Fund’s historical performance resulted from gains derived from participation in Initial Public Offerings (“IPOs”) and/or Secondary Offerings, there is no guarantee that these results can be replicated in future periods or that the Fund will be able to participate to the same degree in IPO/Secondary Offerings in the future.
8
| Alpine Dynamic Dividend Fund (continued) | |
Portfolio Distributions* (unaudited)

Top 10 Holdings* (unaudited)
| 1. | | Apple, Inc. | | 2.62% |
| 2. | | Vodafone Group PLC-ADR | | 2.09% |
| 3. | | QUALCOMM, Inc. | | 1.87% |
| 4. | | Canadian Pacific Railway, Ltd. | | 1.77% |
| 5. | | Nestle SA | | 1.76% |
| 6. | | Accenture PLC-Class A | | 1.75% |
| 7. | | Novartis AG-ADR | | 1.72% |
| 8. | | Corrections Corp. of America | | 1.69% |
| 9. | | Comcast Corp.-Class A | | 1.66% |
| 10. | | Roche Holding AG | | 1.64% |
| | | |
| * | Top 10 Holdings do not include short-term investments and percentages are based on total net assets. Portfolio Distributions percentages are based on total investments. Portfolio holdings and sector distributions are as of 04/30/13 and are subject to change. Portfolio holdings are not recommendations to buy or sell any securities. |
| |
| Value of a $10,000 Investment (unaudited) |
| |
 |
|---|
|
| |
This chart represents a comparison of a hypothetical $10,000 investment in the Fund versus a similar investment in the Fund’s benchmark. The graph and the table do not reflect the deduction of taxes that a shareholder would pay on Fund distributions or the redemption of Fund shares. Investment performance reflects the waiver and recovery of certain fees, if applicable. Without the waiver and recovery of fees, the Fund’s total return would have differed.
Performance data quoted represents past performance and is not predictive of future results. Investment return and principal value of the Fund fluctuate, so that shares, when redeemed, may be worth more or less than their original cost.
9
| Alpine Dynamic Dividend Fund (continued) | |
Commentary
Dear Investor:
In the six-month period ended April 30, 2013, the Alpine Dynamic Dividend Fund generated a total return of 9.88% versus our benchmark, the MSCI All Country World Index Gross USD, which had a total return of 13.72%. All returns include reinvestment of all distributions. On December 13, 2012, we were named co-portfolio managers of this Fund. From that date until April 30, 2013, the total return was 10.13% versus the benchmark return of 10.73%. All returns include reinvestment of all distributions. The Fund distributed $0.164 per share during the period. All references in this letter to the Fund’s performance relate to the performance of the Fund’s Institutional Class.
The Fund’s investment objectives remain the same – to seek high current dividend income, a majority of which is intended to be qualified dividend income, and secondarily, long-term growth of capital. As previously announced in January, 2013, we reduced the distribution rate during the period to align the Fund’s distribution rate with our assessment of the Fund’s long-term return potential as well as our projected levels of dividend income available to the Fund and to provide the Fund more flexibility to seek capital appreciation.
PERFORMANCE DRIVERS
Over the past six months, the stock market marched higher due to a number of factors including highly accommodative global monetary policy, improving macroeconomic indicators, bullish sentiment and inflows into equity-oriented mutual funds and exchange-traded funds. Although economic growth has been slow by historical standards, the central banks’ policies have helped fuel the stock market rally. Government interventions such as quantitative easing in the United States, the launch of the long-term refinancing operations (“LTRO”) in Europe by the European Central Bank and the Bank of Japan’s aggressive stimulus policy have put significant downward pressure on yields of a wide variety of fixed-income investments. As a result, we believe equities are becoming the favored asset class among market participants.
For the six-month period, the industrials and utilities sectors had the greatest positive effect on the Fund’s total return on a relative basis. In the industrials sector the Fund benefited from its exposure to companies that had a specific catalyst such as a new CEO at Canadian Pacific, and a successful debt refinancing at R.R. Donnelley. In the utilities sector, the Fund benefited from its overweight in domestic companies. On a relative basis, Consumer discretionary and information technology were the sectors that had the greatest negative effect on
total return. The Fund was adversely impacted by its exposure to companies in the consumer discretionary sector that were directly impacted by the hike in payroll taxes, colder-than-normal weather in the spring, and persistently high gasoline prices in the United States. In the information technology sector, the Fund underperformed due primarily to its overweight in Apple, which experienced margin pressure amidst increasing competition in smart phones.
PORTFOLIO ANALYSIS
The top five contributors to the Fund’s performance for the six-month period ended April 30, 2013 based on contribution to total return were Canadian Pacific Railway Ltd. (35.95%), Walgreen Co. (42.67%), R.R. Donnelley & Sons Co. (30.86%), Vodafone Group PLC (21.45%), and HollyFrontier Corp. (31.84%).
Canadian Pacific Railway (average weight 1.61%) was a top-performing stock for the period as the new CEO, Hunter Harrison’s efforts to restructure the railway began to bear fruit, and the company reported its highest first quarter earnings results in history. The restructuring has included headcount reduction, running more efficient (longer) trains, and a fuel conservation strategy. These changes have been implemented faster than the original timetable set out by the new management team.
Walgreen Company (average weight 1.25%) is the largest drugstore chain in the United States with over 7,900 stores. The stock outperformed during the period due primarily to the game-changing ten year distribution agreement with AmerisourceBergen, which allowed Walgreen to benefit from greater purchasing scale, distribution efficiencies and global growth opportunities. The company also benefited from the highly accretive and strategic acquisition of UK retailer and pharmaceutical wholesaler Alliance Boots.
R.R. Donnelley & Sons (average weight 0.76%) outperformed during the period despite weakness in the printing business. Increased revenue in their logistics segment partially offset lower printing revenue worldwide, and extending debt maturities allayed fears about the security of the dividend. Strong cash flow expected by management this year along with limited capital expenditure needs is also encouraging.
Vodafone (average weight 1.91%) is a multi-national telecommunications company. The stock outperformed during the period due to speculation that the company will sell its stake in Verizon Wireless to Verizon Communications, potentially unlocking significant shareholder value in the process. Vodafone currently owns a 45% stake in the joint venture.
10
| Alpine Dynamic Dividend Fund (continued) | |
HollyFrontier Corp. (average weight 1.44%) created by the 2011 merger of Holly and Frontier Oil, is one of the most profitable refining companies in North America. The company has been among the most significant beneficiaries of the widening spreads between crude oil-based inputs and refined product outputs that have arisen from the strong production growth of oil in North America and the insufficient pipeline capacity to transport that oil from the mid-continent to the coastal markets. HollyFrontier’s outperformance is also a result of its generous dividend policy, with quarterly special dividends enhancing its yield.
The following companies had the largest adverse impact on the performance of the Fund based on contribution to return for the six month period ended April 30, 2013: Apple Inc. (-24.85%), Freeport-McMoran Copper & Gold Inc. (-20.12%), Tronox Ltd. (-25.33%), Petrofac Ltd. (-19.13%) and Oi S.A. (-27.90%).
Apple (average weight 2.53%) underperformed during the period as its industry-leading operating margins came under pressure with intensified competition in smart phones. The negative earnings revisions by Wall Street analysts during the period also hurt the performance of the stock. In addition, investors have been concerned that Apple has lost its cachet as an innovator. On the flipside, Apple has generated goodwill by returning some of its enormous cash hoard to shareholders via increased dividends and share buybacks.
Freeport-McMoRan Copper & Gold (average weight 0.39%) is the second largest copper producer in the world behind Chile’s Codelco with reserves of 117 billion pounds and annual production of nearly 4 billion pounds, 8% of the global supply of copper. In December 2012, Freeport McMoRan announced a deal to buy McMoRan Exploration Company and Plains Exploration & Production for a combined $10 billion. The deal was a big surprise to us and the market, and the stock underperformed as a result.
Tronox (average weight 0.09%) is the only vertically-integrated producer of titanium dioxide (TiO2), a whitening/brightening pigment used in paints, plastics, paper, sunscreen and food coloring with no effective substitutes. Due to an extended destocking period in China and weak end markets in Europe, the Board of Tronox decided to cancel the special dividend which was the basis of the Fund’s investment in the stock and we sold the position.
Petrofac (average weight 0.83%) is a high quality oil and gas-focused engineering, procurement and construction company with a strong reputation as a primary contractor able to execute large capital projects in a range of competencies from upstream to downstream facilities. The stock underperformed as a dearth of project awards in the
increasingly competitive onshore markets led to questions around near term revenues and margins.
Oi S.A. (average weight 0.18%) is one of the largest integrated telecommunication companies in Brazil. Oi underperformed due to concerns regarding the sustainability of its high dividend yield with net debt-to-EBITDA exceeding 3 times and negative cash flow accelerating due to rising capital expenditures and weak operating results. We exited the position as the headwinds mounted for the company.
We have hedged a portion of our currency exposures to the Swiss Franc, Japanese Yen and British Pound. We also used leverage at times both in the execution of the strategy of the Fund and to help manage significant amounts of net outflows during the period.
SUMMARY
We believe the Alpine Dynamic Dividend Fund has been reinvigorated in order to best pursue its primary objective: to seek high current dividend income that qualifies for the reduced U.S. Federal income tax rates created by the “Jobs and Growth Tax Relief Reconciliation Act of 2003” while also focusing on total return for long-term growth of capital. We have shifted to a team-based structure that incorporates both top-down and bottom-up stock picking. The investment team includes experienced Alpine portfolio managers and research analysts who provide analysis and recommendations on stocks within the sectors they cover. We, along with our CEO, CIO and Senior Investment Risk Strategist, comprise a committee that provides strategic oversight to the Fund and monitors sector and regional exposures, as well as quantitative and qualitative risk factors.
We believe dividend-paying stocks may be an attractive asset class for three reasons. The first is that we are in a historically low yield environment. The second is that these dividend-paying stocks have the potential for great risk/reward, and may offer the potential for less volatility than other equity investments. The third is that while bonds offer fixed rates, therefore tending to do poorly in inflationary environments, dividends have historically grown at a faster rate than inflation.
We are pleased with the structure of our portfolio. We will continue to adapt our investment approach as economic conditions change and look forward to discussing the portfolio and the prospects for the Fund in future communications.
Sincerely,
Brian Hennessey
Joshua Duitz
Co-Portfolio Managers
11
| Alpine Dynamic Dividend Fund (continued) | |
This letter represents the opinions of the Fund’s management and is subject to change, is not guaranteed and should not be considered recommendations to buy or sell any security. The information provided is not intended to be, and is not, a forecast of future events, a guarantee of future results, or investment advice. Views expressed may vary from those of the firm as a whole.
Mutual fund investing involves risk. Principal loss is possible. The Fund is subject to risks, including the following:
Credit Risk – Credit risk refers to the possibility that the issuer of a security will not be able to make payments of interest and principal when due. Changes in an issuer’s credit rating or the market’s perception of an issuer’s creditworthiness may also affect the value of the Fund’s investment in that issuer. The degree of credit risk depends on both the financial condition of the issuer and the terms of the obligation.
Dividend Strategy Risk – The Fund’s strategy of investing in dividend-paying stocks involves the risk that such stocks may fall out of favor with investors and underperform the market. Companies that issue dividend paying-stocks are not required to continue to pay dividends on such stocks. Therefore, there is the possibility that such companies could reduce or eliminate the payment of dividends in the future. The Fund may hold securities for short periods of time related to the dividend payment periods and may experience loss during these periods.
Emerging Market Securities Risk – The risks of foreign investments are heightened when investing in issuers in emerging market countries. Emerging market countries tend to have economic, political and legal systems that are less fully developed and are less stable than those of more developed countries. They are often particularly sensitive to market movements because their market prices tend to reflect speculative expectations. Low trading volumes may result in a lack of liquidity and in extreme price volatility.
Equity Securities Risk – The stock or other security of a company may not perform as well as expected, and may decrease in value, because of factors related to the company (such as poorer than expected earnings or certain management decisions) or to the industry in which the company is engaged (such as a reduction in the demand for products or services in a particular industry).
Foreign Currency Transactions Risk – Foreign securities are often denominated in foreign currencies. As a result, the value of the Fund’s shares is affected by changes in exchange rates. The Fund may enter into foreign currency transactions to try to manage this risk. The Fund’s ability to use foreign currency transactions successfully depends on a number of factors, including the foreign currency transactions being available at prices that are not too costly, the availability of liquid markets and the ability of the Adviser to accurately predict the direction of changes in currency exchange rates. The Fund may enter into forward foreign currency exchange contracts in order to protect against possible losses on foreign investments resulting from adverse changes in the relationship between the U.S. dollar and foreign currencies. Although this method attempts to protect the value of the Fund’s portfolio securities against a decline in the value of a currency, it does not eliminate fluctuations in the underlying prices of the securities and while such contracts tend to minimize the risk of loss due to a decline in the value of the hedged currency, they tend to limit any potential gain which might result should the value of such currency increase.
Foreign Securities Risk – The Fund’s investments in securities of foreign issuers or issuers with significant exposure to foreign markets involve additional risk. Foreign countries in which the Fund may invest may have markets that are less liquid, less regulated and more volatile than U.S. markets. The value of the Fund’s investments may decline because of factors affecting the particular issuer as well as foreign markets and issuers generally, such as unfavorable government actions, and political or financial instability. Lack of information may also affect the value of these securities. The risks of foreign investment are heightened when investing in issuers of emerging market countries.
Growth Stock Risk – Growth stocks are stocks of companies believed to have above-average potential for growth in revenue and earnings. Growth stocks typically are very sensitive to market movements because their market prices tend to reflect future expectations. When it appears those expectations will not be met, the prices of growth stocks typically fall. Growth stocks as a group may be out of favor and underperform the overall equity market while the market concentrates on undervalued stocks.
12
| Alpine Dynamic Dividend Fund (continued) | |
Initial Public Offerings and Secondary Offerings Risk – The Fund may invest a portion of its assets in shares of IPOs or secondary offerings of an issuer. IPOs and secondary offerings may have a magnified impact on the performance of a Fund with a small asset base. The impact of IPOs and secondary offerings on a Fund’s performance likely will decrease as the Fund’s asset size increases, which could reduce a Fund’s returns. IPOs and secondary offerings may not be consistently available to the Fund for investing. IPO and secondary offering shares frequently are volatile in price due to the absence of a prior public market, the small number of shares available for trading and limited information about the issuer. Therefore, the Fund may hold IPO and secondary offering shares for a very short period of time. This may increase the turnover of the Fund and may lead to increased expenses for the Fund, such as commissions and transaction costs. In addition, IPO and secondary offering shares can experience an immediate drop in value if the demand for the securities does not continue to support the offering price.
Leverage Risk – The Fund may use leverage to purchase securities. Increases and decreases in the value of the Fund’s portfolio will be magnified when the Fund uses leverage.
Management Risk – The Adviser’s judgment about the quality, relative yield or value of, or market trends affecting, a particular security or sector, or about interest rates generally, may be incorrect. The Adviser’s security selections and other investment decisions might produce losses or cause the Fund to underperform when compared to other funds with similar investment objectives and strategies.
Market Risk – The price of a security held by the Fund may fall due to changing market, economic or political conditions.
Micro Capitalization Company Risk – Stock prices of micro capitalization companies are significantly more volatile, and more vulnerable to adverse business and economic developments than those of larger companies. Micro capitalization companies often have narrower markets for their goods and/or services and more limited managerial and financial resources than larger, more established companies, including small or medium capitalization companies.
Portfolio Turnover Risk – High portfolio turnover necessarily results in greater transaction costs which may reduce Fund performance.
Qualified Dividend Tax Risk – Favorable U.S. federal tax treatment of Fund distributions may be adversely affected, changed or repealed by future changes in tax laws.
Small and Medium Capitalization Company Risk – Securities of small or medium capitalization companies are more likely to experience sharper swings in market values, less liquid markets, in which it may be more difficult for the Adviser to sell at times and at prices that the Adviser believes appropriate and generally are more volatile than those of larger companies.
Swaps Risk – Swap agreements are derivative instruments that can be individually negotiated and structured to address exposure to a variety of different types of investments or market factors. Depending on their structure, swap agreements may increase or decrease the Fund’s exposure to long- or short-term interest rates, foreign currency values, mortgage securities, corporate borrowing rates, or other factors such as security prices or inflation rates. The Fund also may enter into swaptions, which are options to enter into a swap agreement. Since these transactions generally do not involve the delivery of securities or other underlying assets or principal, the risk of loss with respect to swap agreements and swaptions generally is limited to the net amount of payments that the Fund is contractually obligated to make. There is also a risk of a default by the other party to a swap agreement or swaption, in which case the Fund may not receive the net amount of payments that the Fund contractually is entitled to receive.
Undervalued Stock Risk – The Fund may pursue strategies that may include investing in securities, which, in the opinion of the Adviser, are undervalued. The identification of investment opportunities in undervalued securities is a difficult task and there is no assurance that such opportunities will be successfully recognized or acquired. While investments in undervalued securities offer opportunities for above-average capital appreciation, these investments involve a high degree of financial risk and can result in substantial losses.
Please refer to page 5 for other important disclosures and definitions.
13
| Alpine Accelerating Dividend Fund | |
| Comparative Annualized Returns as of 4/30/13 (unaudited) | | |
| | | |
| | | | 6 Months(1) | | | 1 Year | | | 3 Years | | | Since Inception(2) |
| Alpine Accelerating Dividend Fund — Institutional Class | | | 15.11 | % | | | 16.12 | % | | | 12.04 | % | | | 14.24 | % | |
| Alpine Accelerating Dividend Fund — Class A (Without Load) | | | 14.98 | % | | | 15.85 | % | | | N/A | | | 19.49 | % | |
| Alpine Accelerating Dividend Fund — Class A (With Load) | | | 8.65 | % | | | 9.46 | % | | | N/A | | | 14.52 | % | |
| S&P 500® Index | | | 14.42 | % | | | 16.89 | % | | | 12.80 | % | | | 13.37 | % | |
| Dow Jones Industrial Average | | | 14.86 | % | | | 15.39 | % | | | 13.48 | % | | | 13.31 | % | |
| Lipper Equity Income Funds Average(3) | | | 14.08 | % | | | 17.00 | % | | | 12.57 | % | | | 15.02 | % | |
| Lipper Equity Income Funds Ranking(3) | | | N/A | (4) | | | 240/337 | | | 158/263 | | | 170/248 | |
| Gross Expense Ratio (Institutional Class): 3.26%(5) | | | | | | | | | | | | | | | | | |
| Net Expense Ratio (Institutional Class): 1.35%(5) | | | | | | | | | | | | | | | | | |
| Gross Expense Ratio (Class A): 3.51%(5) | | | | | | | | | | | | | | | | | |
| Net Expense Ratio (Class A): 1.60%(5) | | | | | | | | | | | | | | | | | |
| (1) | Not annualized. |
| (2) | Institutional Class shares commenced on November 5, 2008 and Class A shares commenced on December 30, 2011. Returns for indices are since November 5, 2008. |
| (3) | The since inception data represents the period beginning November 6, 2008 (Institutional Class only). |
| (4) | FINRA does not recognize rankings for less than one year. |
| (5) | As disclosed in the prospectus dated February 28, 2013. |
Performance data quoted represents past performance and is not predictive of future results. Investment return and principal value of the Fund fluctuate, so that the shares, when redeemed, may be worth more or less than their original cost. Performance current to the most recent month end may be lower or higher than performance quoted and may be obtained by calling 1-888-785-5578. Performance data shown does not reflect the 1.00% redemption fee imposed on shares held for fewer than 60 days. If it did, total returns would be reduced. Returns for the Class A shares with sales charge reflect a maximum sales charge of 5.50%. Performance for the Class A shares without sales charges does not reflect this load.
The S&P 500® Index is a float-adjusted market capitalization-weighted index of 500 common stocks chosen for market size, liquidity, and industry group representation to represent U.S. equity performance. Dow Jones Industrial Average is a price-weighted average of 30 blue chip stocks that are generally the leaders in their industry. The Lipper Equity Income Funds Average is an average of funds that seek relatively high current income and income growth through investing 60% or more of their respective portfolios in equities. Lipper rankings for the periods shown are based on fund total returns with dividends and distributions reinvested and do not reflect sales charges. The S&P 500® Index, the Dow Jones Industrial Average, and the Lipper Equity Income Funds Average are unmanaged and do not reflect direct fees associated with a mutual fund, such as investment adviser fees; however, the Lipper Equity Income Funds Average reflects fees charged by the underlying funds. The performance for the Alpine Accelerating Dividend Fund reflects the deduction of fees for these value-added services. Investors cannot directly invest in an index.
Expense ratios reflect the ratios reported in the Fund’s most recent prospectus. The Alpine Accelerating Dividend Fund has a contractual expense waiver that continues through February 28, 2014. Where a Fund’s gross and net expense ratio are the same for the period reported, the contractual expense reimbursement level was not reached as of the end of that period. To the extent the Fund’s expenses were reduced by waivers, the Fund’s total returns were increased. In these cases, in the absence of the expense waivers, the Fund’s total returns would have been lower.
To the extent that the Fund’s historical performance resulted from gains derived from participation in Initial Public Offerings (“IPOs”) and/or Secondary Offerings, there is no guarantee that these results can be replicated in future periods or that the Fund will be able to participate to the same degree in IPO/Secondary Offerings in the future.
14
| Alpine Dynamic Dividend Fund (continued) | |
Portfolio Distributions* (unaudited)

| | |
| Top 10 Holdings* (unaudited) | |
| 1. | | American Tower Corp. | 1.78% | |
| 2. | | Walgreen Co. | 1.65% | |
| 3. | | Comcast Corp.-Class A | 1.63% | |
| 4. | | Apple, Inc. | 1.61% | |
| 5. | | Dick’s Sporting Goods, Inc. | 1.60% | |
| 6. | | Xcel Energy, Inc. | 1.59% | |
| 7. | | CMS Energy Corp. | 1.59% | |
| 8. | | QUALCOMM, Inc. | 1.59% | |
| 9. | | Agilent Technologies, Inc. | 1.57% | |
| 10. | | The J.M. Smucker Co. | 1.57% | |
| * | Top 10 Holdings do not include short-term investments and percentages are based on total net assets. Portfolio Distributions percentages are based on total investments. Portfolio holdings and sector distributions are as of 04/30/13 and are subject to change. Portfolio holdings are not recommendations to buy or sell any securities. |
| | |
| Value of a $10,000 Investment (unaudited) |
| | |
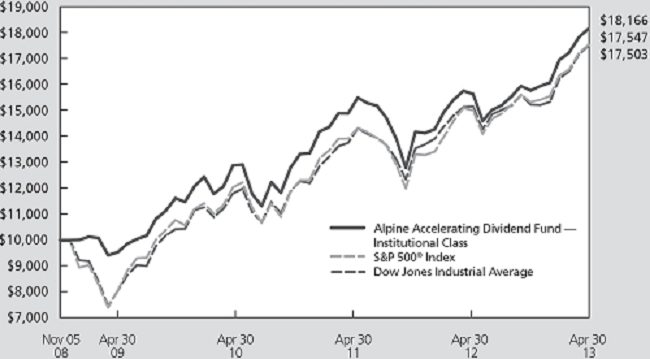 |
This chart represents a comparison of a hypothetical $10,000 investment in the Fund versus a similar investment in the Fund’s benchmark. The graph and the table do not reflect the deduction of taxes that a shareholder would pay on Fund distributions or the redemption of Fund shares. Investment performance reflects the waiver and recovery of certain fees, if applicable. Without the waiver and recovery of fees, the Fund’s total return would have differed.
Performance data quoted represents past performance and is not predictive of future results. Investment return and principal value of the Fund fluctuate, so that shares, when redeemed, may be worth more or less than their original cost.
15
| Alpine Accelerating Dividend Fund (continued) | |
Commentary
For the six months ended April 30, 2013, the Alpine Accelerating Dividend Fund generated a total return of 15.11%. This compares with a total return of 14.42% for the S&P 500® for the same period. During the last six months, the Fund steadily increased its monthly payout from $0.0397 to $0.0403 per share. All references in this letter to the Fund’s performance relate to the performance of the Fund’s Institutional Class.
PERFORMANCE DRIVERS
The Fund generally prefers to take a conservative investment stance with regard to portfolio construction and security selection during times of economic and geopolitical uncertainty. For example, the Fund had an average cash holding of 7.7% during the six months ended April 30, 2013 and a portfolio beta of less than 1.0 during the same span. Given the rally in the markets in the second half of the fiscal year, the cash position was a drag on the Fund’s total return. Despite this conservative posture, the fund was able to outperform the S&P 500® by 0.69% for the semi-annual period as our security selection more than compensated for the cash drag.
On a sector basis, the financials had the largest positive impact on the absolute performance of the Fund, followed by consumer staples and healthcare. Telecommunications was the only segment to generate a negative return over the past six months. On a relative basis, financials generated the largest outperformance versus the S&P 500®, followed by consumer staples and industrials. Telecommunications, consumer discretionary, and materials were the worst relative performers.
PORTFOLIO ANALYSIS
The top five contributors to the Fund’s performance during the six months ended April 30, 2013, based on contribution to total return were CBS Corp (42.50%), WisdomTree Investments (85.93%), FXCM Inc. (47.89%), Walgreen Co. (42.62%), and Energizer Holdings Inc. (33.54%).
| | • | CBS Corp. (average weight 1.65%) shares continue to outperform the market for several reasons. Management has improved the visibility of the business by reducing its exposure to the advertising market and the company has made several moves in seeking to improve shareholder returns, such as increasing its buyback program and its dividend payout. |
| | • | WisdomTree (average weight 0.74%) has seen its assets under management grow from $16.7B to $28.0B in the six months ended April 30, 2013 due in large part to the popularity and success of its Japan Hedged Equity ETF, which has received net inflows in excess of $6B and has generated a total return of 50.4% during the period. |
| | • | FXCM (average weight 1.08%), an online foreign exchange broker, enjoyed a rebound in FX trading volumes in the wake of the Japanese central bank’s decision to engage in massive monetary stimulus. As a result of these actions, the Yen has depreciated by over 20% versus the U.S. dollar during the fiscal half year ended April 30, 2013. |
| | | |
| | • | In the period, Walgreens (average weight 1.59%) benefited from improved prescription trends since its settlement with Express Scripts in the latter half of 2012. Plus, the synergies from its Alliance Boots acquisition and the partnership with AmerisourceBergen led to an improvement in the company’s outlook. |
| | | |
| | • | Energizer’s (average weight 1.68%) outlook rose as management was able to achieve its cost savings targets faster than expected. Meanwhile, the battery business has held up a bit better than many investors had feared. |
Apple Inc. (-24.53%), Oi S.A. (-21.99%), Devon Energy Corp. (-4.77%), Suncor Energy (-6.63%), and Elisa OYJ (-7.84%) had the largest adverse impact on the performance of the Fund over the fiscal half year ended April 30, 2013.
| | • | Apple (average weight 1.61%) shares tumbled as the company appeared to reach maturity in its product line and competition began to take a technology lead. In addition, concerns about margins have increased as newer products (such as the iPad Mini) carry margins lower than the corporate average. |
| | | |
| | • | The Brazilian telecommunications industry has struggled this year and Oi S.A. (average weight 0.19%) has been caught in the downdraft. Investors continued to sell shares of Oi as they became frustrated with the slow pace of operational improvements despite multiple years of restructuring. |
| | | |
| | • | Shares of Devon (average weight 1.29%) fell in the wake of its fourth quarter earnings report in February. Investors were disappointed with the |
16
| Alpine Accelerating Dividend Fund (continued) | |
| | | flattish production growth outlook for 2013 as well as the slow pace of management’s strategic review. |
| | | |
| | • | Similar to Devon, Suncor’s (average weight 1.41%) shares fell after a difficult fourth quarter that witnessed several operating challenges and included a $1.4B non-cash charge for the impairment of the Voyageur JV project that was subsequently cancelled in March. |
| | | |
| | • | Elisa OYJ (average weight 0.18%) shares sold off on the heels of a disappointing first quarter earnings report highlighting an extremely challenging operating environment in the Nordic mobile telecommunications market. |
SUMMARY & OUTLOOK
The Alpine Accelerating Dividend Fund seeks to invest in dividend-paying companies which have the potential to increase or accelerate their dividends in the future, based on our analysis of their growth prospects and cash flow-generating capabilities. The Fund aims to achieve a sustainable and rising stream of dividend income as well as long-term capital growth. We believe that companies with strong franchises characterized by defensible margins and a solid balance sheet are best positioned to increase, and even accelerate, their dividends over time. Overall, we aim to manage the fund conservatively by limiting our international exposure, eschewing the use of leverage, and avoiding large sector bets when possible.
As we look towards the balance of 2013, we remain cautious in our investment stance. The geopolitical environment remains unsettled and there is a great deal of uncertainty as to the strength and durability of the economic recovery underway in the U.S. while Europe remains mired in recession. As such, even in the face of potentially higher taxes in the U.S., we believe that dividend income may become a key signpost for investors to gauge the true financial strength of companies. In a world currently offering low single-digit yields on government bonds, companies with track records of increasing dividends could be the winners in the equity market, in our view. As a result, we are sticking to our knitting – we believe a strategy that seeks to identify stocks with rising dividends as well as those with the potential to not only increase the dividend, but to do so at an accelerating pace, may succeed in the uncertain market environment in which we currently find ourselves and to potentially outperform over time. We think the Fund offers investors an attractive combination of current yield with the potential for increasing payouts over time.
We thank our shareholders for their support and look forward to continued success over the next year.
Sincerely,
Bryan Keane
Andrew Kohl
Co-Portfolio Managers
17
| Alpine Accelerating Dividend Fund (continued) | |
This letter represents the opinions of the Fund’s management and is subject to change, is not guaranteed and should not be considered recommendations to buy or sell any security. The information provided is not intended to be, and is not, a forecast of future events, a guarantee of future results, or investment advice. Views expressed may vary from those of the firm as a whole.
Mutual fund investing involves risk. Principal loss is possible. The Fund is subject to risks, including the following:
Dividend Strategy Risk – The Fund’s strategy of investing in dividend-paying stocks involves the risk that such stocks may fall out favor with investors and underperform the market. Companies that issue dividend paying-stocks are not required to continue to pay dividends on such stocks. Therefore, there is the possibility that such companies could reduce or eliminate the payment of dividends in the future or the anticipated acceleration of dividends could not occur.
Equity Securities Risk – The stock or other security of a company may not perform as well as expected, and may decrease in value, because of factors related to the company (such as poorer than expected earnings or certain management decisions) or to the industry in which the company is engaged (such as a reduction in the demand for products or services in a particular industry).
Foreign Currency Transactions Risk – Foreign securities are often denominated in foreign currencies. As a result, the value of the Fund’s shares is affected by changes in exchange rates. The Fund may enter into foreign currency transactions to try to manage this risk. The Fund’s ability to use foreign currency transactions successfully depends on a number of factors, including the foreign currency transactions being available at prices that are not too costly, the availability of liquid markets and the ability of the Adviser to accurately predict the direction of changes in currency exchange rates.
Foreign Securities Risk – The Fund’s investments in securities of foreign issuers or issuers with significant exposure to foreign markets involve additional risk. Foreign countries in which the Fund may invest may have markets that are less liquid, less regulated and more volatile than U.S. markets. The value of the Fund’s investments may decline because of factors affecting the particular issuer as well as foreign markets and issuers generally, such as unfavorable government actions, and political or financial instability. Lack of information may also affect the value of these securities. The risks of foreign investments are heightened when investing in issuers in emerging market countries.
Growth Stock Risk – Growth stocks typically are very sensitive to market movements because their market prices tend to reflect future expectations. When it appears those expectations will not be met, the prices of growth stocks typically fall. Growth stocks as a group may be out of favor and underperform the overall equity market while the market concentrates on undervalued stocks. Although the Fund will not concentrate its investments in any one industry or industry group, it may, like many growth funds, weight its investments toward certain industries, thus increasing its exposure to factors adversely affecting issuers within those industries.
Initial Public Offerings and Secondary Offerings Risk – The Fund may invest a portion of its assets in shares of IPOs or secondary offerings of an issuer. IPOs and secondary offerings may have a magnified impact on the performance of a Fund with a small asset base. The impact of IPOs and secondary offerings on a Fund’s performance likely will decrease as the Fund’s asset size increases, which could reduce a Fund’s returns. IPOs and secondary offerings may not be consistently available to the Fund for investing. IPO and secondary offering shares frequently are volatile in price due to the absence of a prior public market, the small number of shares available for trading and limited information about the issuer. Therefore, the Fund may hold IPO and secondary offering shares for a very short period of time. This may increase the turnover of the Fund and may lead to increased expenses for the Fund, such as commissions and transaction costs. In addition, IPO and secondary offering shares can experience an immediate drop in value if the demand for the securities does not continue to support the offering price.
Management Risk – The Adviser’s judgment about the quality, relative yield or value of, or market trends affecting, a particular security or sector, or about interest rates generally, may be incorrect. The Adviser’s security selections and other investment decisions might produce losses or cause the Fund to underperform when compared to other funds with similar investment objectives and strategies.
Market Risk – The price of a security held by the Fund may fall due to changing market, economic or political conditions.
Micro Capitalization Company Risk – Stock prices of micro capitalization companies are significantly more volatile, and more vulnerable to adverse business and economic developments than those of larger companies. Micro capitalization companies often have narrower markets for their goods and/or services and more limited managerial and financial resources than larger, more established companies, including small or medium capitalization companies.
Portfolio Turnover Risk – High portfolio turnover necessarily results in greater transaction costs which may reduce Fund performance.
18
| Alpine Accelerating Dividend Fund (continued) | |
Small and Medium Capitalization Company Risk – Securities of small or medium capitalization companies are more likely to experience sharper swings in market values, less liquid markets, in which it may be more difficult for the Adviser to sell at times and at prices that the Adviser believes appropriate and generally are more volatile than those of larger companies.
Undervalued Stock Risk – The Fund may pursue strategies that may include investing in securities, which, in the opinion of the Adviser, are undervalued. The identification of investment opportunities in undervalued securities is a difficult task and there is no assurance that such opportunities will be successfully recognized or acquired. While investments in undervalued securities offer opportunities for above-average capital appreciation, these investments involve a high degree of financial risk and can result in substantial losses.
Please refer to page 5 for other important disclosures and definitions.
19
| Alpine Financial Services Fund | |
| Comparative Annualized Returns as of 4/30/13 (unaudited) | |
| | | 6 Months(1) | | 1 Year | | 3 Years | | 5 Years | | Since Inception(2) |
| Alpine Financial Services Fund — Institutional Class | | | 18.93 | % | | | 26.12 | % | | | 4.75 | % | | | 4.34 | % | | | | 6.66 | % |
| Alpine Financial Services Fund — Class A (Without Load) | | | 18.86 | % | | | 25.91 | % | | | N/A | | | | N/A | | | | | 36.00 | % |
| Alpine Financial Services Fund — Class A (With Load) | | | 12.31 | % | | | 18.99 | % | | | N/A | | | | N/A | | | | | 30.38 | % |
| KBW Bank Index | | | 15.87 | % | | | 20.32 | % | | | 2.45 | % | | | -5.23 | % | | | | -4.72 | % |
| NASDAQ Financial-100 Index | | | 16.16 | % | | | 20.48 | % | | | 6.78 | % | | | 1.58 | % | | | | 1.07 | % |
| S&P 500® Index | | | 14.42 | % | | | 16.89 | % | | | 12.80 | % | | | 5.21 | % | | | | 6.05 | % |
| Lipper Financial Services Funds Average(3) | | | 15.78 | % | | | 20.54 | % | | | 5.32 | % | | | -0.41 | % | | | | -1.05 | % |
| Lipper Financial Services Funds Ranking(3) | | | N/A | (4) | | | 11/79 | | | | 35/68 | | | | 11/62 | | | | | 2/51 | |
| Gross Expense Ratio (Institutional Class): 1.98%(5) | | | | | | | | | | | | | | | | | | | | | |
| Net Expense Ratio (Institutional Class): 1.42%(5) | | | | | | | | | | | | | | | | | | | | | |
| Gross Expense Ratio (Class A): 2.23%(5) | | | | | | | | | | | | | | | | | | | | | |
| Net Expense Ratio (Class A): 1.67%(5) | | | | | | | | | | | | | | | | | | | | | |
| (1) | Not annualized. |
| (2) | Institutional Class shares commenced on November 1, 2005 and Class A shares commenced on December 30, 2011. Returns for indices are since November 1, 2005. |
| (3) | The since inception data represents the period beginning November 3, 2005 (Institutional Class only). |
| (4) | FINRA does not recognize rankings for less than one year. |
| (5) | As disclosed in the prospectus dated February 28, 2013. |
Performance data quoted represents past performance and is not predictive of future results. Investment return and principal value of the Fund fluctuate, so that the shares, when redeemed, may be worth more or less than their original cost. Performance current to the most recent month end may be lower or higher than performance quoted and may be obtained by calling 1-888-785-5578. Performance data shown does not reflect the 1.00% redemption fee imposed on shares held for fewer than 60 days. If it did, total returns would be reduced. Returns for the Class A shares with sales charge reflect a maximum sales charge of 5.50%. Performance for the Class A shares without sales charges does not reflect this load.
KBW Bank Index is a modified cap-weighted index consisting of 24 exchange-listed and National Market System stocks, representing national money center banks and leading regional institutions. The NASDAQ Financial-100 Index includes 100 of the largest domestic and international financial securities listed on The NASDAQ Stock Market based on market capitalization. They include companies classified according to the Industry Classification Benchmark as Financials, which are included within the NASDAQ Bank, NASDAQ Insurance, and NASDAQ Other Finance Indexes. The S&P 500® Index is a float-adjusted market capitalization-weighted index of 500 common stocks chosen for market size, liquidity, and industry group representation to represent U.S. equity performance. The Lipper Financial Services Funds Average is an average of funds whose primary objective is to invest primarily in equity securities of companies engaged in providing financial services. Lipper rankings for the periods shown are based on fund total returns with dividends and distributions reinvested and do not reflect sales charges. The KBW Bank Index, the NASDAQ Financial-100 Index, the S&P 500® Index and the Lipper Financial Services Funds Average are unmanaged and do not reflect the deduction of direct fees associated with a mutual fund, such as investment adviser fees; however, the Lipper Financial Services Fund Average reflects fees charged by the underlying funds. The performance for the Alpine Financial Services Fund reflects the deduction of fees for these value-added services. Investors cannot directly invest in an index.
Expense ratios reflect the ratios reported in the Fund’s most recent prospectus. The Alpine Financial Services Fund has a contractual expense waiver that continues through February 28, 2014. Where a Fund’s gross and net expense ratio are the same for the period reported, the contractual expense reimbursement level was not reached as of the end of that period. To the extent the Fund’s expenses were reduced by waivers, the Fund’s total returns were increased. In these cases, in the absence of the expense waivers, the Fund’s total returns would have been lower.
The Fund’s past performance benefitted significantly from Initial Public Offerings (“IPOs”) of certain issuers, and there is no assurance that the Fund can replicate this performance in the future. To the extent that the Fund’s historical performance resulted from gains derived from participation in Secondary Offerings, there is no guarantee that these results can be replicated or that the Fund will be able to participate to the same degree in IPO/Secondary Offerings in the future.
20
| Alpine Financial Services Fund (continued) | |
Portfolio Distributions* (unaudited)

| Top 10 Holdings* (unaudited) | |
| 1. | Pacific Premier Bancorp, Inc. | 3.74% |
| 2. | First Business Financial Services, Inc. | 3.51% |
| 3. | IntercontinentalExchange, Inc. | 3.23% |
| 4. | BB Seguridade Participacoes SA | 3.16% |
| 5. | The Carlyle Group LP | 3.10% |
| 6. | Capital One Financial Corp. | 2.64% |
| 7. | The Blackstone Group LP | 2.62% |
| 8. | Synovus Financial Corp. | 2.61% |
| 9. | Southern National Bancorp of Virginia, Inc. | 2.49% |
| 10. | Provident Financial Holdings, Inc. | 2.45% |
| | | |
| * | Top 10 Holdings do not include short-term investments and percentages are based on total net assets. Portfolio Distributions percentages are based on total investments. Portfolio holdings and sector distributions are as of 04/30/13 and are subject to change. Portfolio holdings are not recommendations to buy or sell any securities. |
| | |
| Value of a $10,000 Investment (unaudited) |
| |
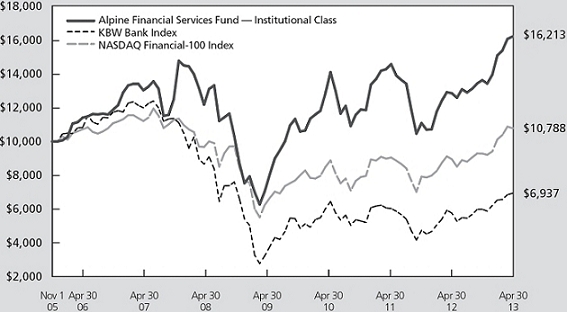 |
| |
This chart represents a comparison of a hypothetical $10,000 investment in the Fund versus a similar investment in the Fund’s benchmark. The graph and the table do not reflect the deduction of taxes that a shareholder would pay on Fund distributions or the redemption of Fund shares. Investment performance reflects the waiver and recovery of certain fees, if applicable. Without the waiver and recovery of fees, the Fund’s total return would have differed.
Performance data quoted represents past performance and is not predictive of future results. Investment return and principal value of the Fund fluctuate, so that shares, when redeemed, may be worth more or less than their original cost.
21
| Alpine Financial Services Fund (continued) | |
Commentary
The Alpine Financial Services Fund generated an 18.93% total return for the six months ended April 30, 2013. This compares to the Fund’s benchmarks which showed total returns of 16.16% for the NASDAQ Financial-100 Index and 15.87% for the KBW Bank Index during the same period. Since inception (11/01/2005), the Fund has generated an annualized total return of 6.66%. This compares favorably to a 1.07% annualized return for the NASDAQ Financial-100 Index and -4.72% for the KBW Bank Index during the same time period. All references in this letter to the Fund’s performance relate to the performance of the Fund’s Institutional Class.
SEMI-ANNUAL IN REVIEW
In the minds of investors, U.S. Government sequestration, Cyprus fiscal crisis, European recession and China slowdown all took a backseat to news reports of central banks easing around the globe and a strengthening U.S. economy. Any market sell-off during the period was short-lived as investors viewed these corrections as buying opportunities. With central banks driving yields on government bonds down to, or near, historic lows, some investors turned to dividend-paying stocks in order to receive a better yield.
Being economically sensitive, bank stocks performed well amid reports of an improving U.S. labor market and rising home sales. The belief is that more people employed will lead to much needed loan demand for the banking industry. Banks today are flush with liquidity that is generating little interest spread. We believe that if banks can re-allocate their low yielding securities into higher yielding loans much of that yield pickup will flow to the bottom line. The strong capital markets during the period helped the stocks of investment banks and asset managers. Investors purchased these stocks in anticipation of future growth in investment banking and asset management fees that a continuing bull market could provide.
CONTRIBUTING FACTORS
The top five contributors to the Fund’s performance during the first six months of fiscal 2013 were NYSE Euronext (65.39%), WidsomTree Investments Inc. (76.91%), KKR & Co. L.P. (47.88%), Blackstone Group L.P. (43.06%), and Southern National Bancorp of Virginia Inc. (28.05%).
| • | NYSE Euronext (average weight 2.40%) is one of the largest global operators of stock exchanges. The stock jumped sharply on the announcement that IntercontinentalExchange Inc. will acquire the company. |
| • | WisdomTree Investments Inc. (average weight 1.91%) is an asset manager of exchange-traded funds. The company is achieving robust organic asset growth. A primary driver of this growth is their successful Japan Hedged Equity Fund. |
| • | KKR & Co. L.P. (average weight 3.02%) is a private equity investment firm. The rally in equity markets has contributed to investment portfolio appreciation and increased performance-based management fees. This aided in the stock outperformance. |
| • | Blackstone Group L.P. (average weight 2.76%) is an alternative asset management firm. The company has been successful in growing their assets under management. This growth combined with an increase in performance-based management fees bolstered the stock performance this period. |
| • | Southern National Bancorp of Virginia (average weight 2.77%) is a bank headquartered in McLean, Virginia. The company has combined acquisitions with organic growth to build a profitable franchise which investors are beginning to notice. |
The five largest detractors to the Fund’s performance during the first half of fiscal 2013 were Direxion Daily Financial Bear (-44.60%), Pacific Mercantile Bancorp (-16.30), ProShares UltraShort Financials (-31.66%), VTB Bank (-8.86%), and VeriFone Systems Inc. (-38.39%).
| • | Direxion Daily Financial Bear (average weight 1.47%) is an ETF which we use at times of market swings to try to reduce the daily volatility of the portfolio. |
| • | Pacific Mercantile Bancorp (average weight 1.22%) is a $1 billion in asset bank headquartered in Costa Mesa, California. After being one of the Fund’s top contributors in fiscal 2012, the stock has underperformed this year as the company transitions their business model under the direction of a new CEO. |
| • | ProShares UltraShort Financial (average weight 0.56%) is an ETF which, similar to Direxion Daily Financial Bear, is used to try to reduce the daily volatility of the portfolio. |
| • | VTB Bank (average weight 1.18%) is a Russian commercial bank. Concerns over weak operating results have put pressure on the stock’s performance. |
| • | VeriFone Systems Inc. (average weight 0.09%) is a financial technology company that offers products which facilitate secure electronic payment transactions at the point of sale. The stock was |
22
| Alpine Financial Services Fund (continued) | |
| | negatively affected by disappointing first quarter results. |
The Fund has participated in Initial Public Offerings (“IPO’s”) both within and outside of the financial sector. The Fund’s trading in IPO’s had a positive impact on the Fund’s return for the reporting period. We cannot predict whether there will be more IPO’s that meet our investment standards, or that we will be able to participate and benefit from them, but we will continue to search.
We also continued to find value in the Secondary Offerings in the financial sector. As a result, the Fund has been an active participant in these offerings and they have contributed to the Fund’s return for the period. Similar to the IPO’s, we cannot predict whether these offerings will continue to exist, but provided the market offers what we believe to be attractively-priced Secondary Offerings, the Fund will continue to participate in them.
We had significant net inflows to the Fund during the period and as a result, maintained large cash positions that had a detrimental effect on the Fund’s total return for the period.
SUMMARY & OUTLOOK
From a macro point of view, we still favor financials headquartered in the United States. We are encouraged by early signs of an economic recovery. If this trend continues, it should bode well for the sector’s growth
prospects. But that said, we still believe that small and mid-size banks will need to augment their organic growth with external acquisitions. In the current environment of rising regulatory costs and government restrictions on certain service fees, we believe banks must achieve some critical mass in order to generate a reasonable return for their shareholders. We noticed the pace of mergers accelerate last year and feel this is the beginning of another wave of industry consolidation. We thus favor small community bank stocks.
Another subsector we like within the financial industry is the asset managers. After a long hiatus, the industry began experiencing an inflow of money into equity funds this year. If the bull market continues, we would expect inflows into this sector to continue which in turn would drive revenue growth for the subsector. An increase in assets under management combined with a rising stock market can be especially favorable to alternative asset managers. This is because in addition to a basic management fee their products tend to charge performance fees if certain minimum returns are generated.
We would like to take this opportunity to thank you for your ongoing support.
Sincerely,
Peter J. Kovalski
Stephen A. Lieber
Co-Portfolio Managers
23
| Alpine Financial Services Fund (continued) | |
This letter represents the opinions of the Fund’s management and is subject to change, is not guaranteed and should not be considered recommendations to buy or sell any security. The information provided is not intended to be, and is not, a forecast of future events, a guarantee of future results, or investment advice. Views expressed may vary from those of the firm as a whole.
Mutual fund investing involves risk. Principal loss is possible. The Fund is subject to risks, including the following:
Concentration Risk – The Fund’s strategy of concentrating in companies in a specific industry means that its performance will be closely tied to the performance of a particular market segment. The Fund’s concentration in these companies may present more risks than if it were broadly diversified over numerous industries and sectors of the economy. A downturn in these companies would have a larger impact on the Fund than on a mutual fund that does not concentrate in such companies. At times, the performance of these companies will lag the performance of other industries or the broader market as a whole.
Equity Securities Risk – The stock or other security of a company may not perform as well as expected, and may decrease in value, because of factors related to the company (such as poorer than expected earnings or certain management decisions) or to the industry in which the company is engaged (such as a reduction in the demand for products or services in a particular industry).
Financial Services Industry Concentration Risk – The Fund is subject to the risk of concentrating investments in financial services companies, which makes it more susceptible to factors adversely affecting issuers within that industry than would a fund investing in a more diversified portfolio of securities. Economic downturns, credit losses and severe price competition can negatively affect this industry. The profitability of financial services companies is dependent on the availability and cost of capital and can fluctuate significantly when interest rates change. Financial services companies are also subject to extensive government regulation. The impact of recent legislation on any individual company or on the industry as a whole cannot be predicted.
Foreign Currency Transactions Risk – Foreign securities are often denominated in foreign currencies. As a result, the value of the Fund’s shares is affected by changes in exchange rates. The Fund may enter into foreign currency transactions to try to manage this risk. The Fund’s ability to use foreign currency transactions successfully depends on a number of factors, including the foreign currency transactions being available at prices that are not too costly, the availability of liquid markets and the ability of the Adviser to accurately predict the direction of changes in currency exchange rates.
Foreign Securities Risk – The Fund’s investments in securities of foreign issuers or issuers with significant exposure to foreign markets involve additional risk. Foreign countries in which the Fund may invest may have markets that are less liquid, less regulated and more volatile than U.S. markets. The value of the Fund’s investments may decline because of factors affecting the particular issuer as well as foreign markets and issuers generally, such as unfavorable government actions, and political or financial instability. Lack of information may also affect the value of these securities. The risks of foreign investments are heightened when investing in issuers in emerging market countries.
Growth Stock Risk – Growth stocks are stocks of companies believed to have above-average potential for growth in revenue and earnings. Growth stocks typically are very sensitive to market movements because their market prices tend to reflect future expectations. When it appears those expectations will not be met, the prices of growth stocks typically fall. Growth stocks as a group may be out of favor and underperform the overall equity market while the market concentrates on undervalued stocks.
Initial Public Offerings and Secondary Offerings Risk – The Fund may invest a portion of its assets in shares of IPOs or secondary offerings of an issuer. IPOs and secondary offerings may have a magnified impact on the performance of a Fund with a small asset base. The impact of IPOs and secondary offerings on a Fund’s performance likely will decrease as the Fund’s asset size increases, which could reduce a Fund’s returns. IPOs and secondary offerings may not be consistently available to the Fund for investing. IPO and secondary offering shares frequently are volatile in price due to the absence of a prior public market, the small number of shares available for trading and limited information about the issuer. Therefore, the Fund may hold IPO and secondary offering shares for a very short period of time. This may increase the turnover of the Fund and may lead to increased expenses for the Fund, such as commissions and transaction costs. In addition, IPO and secondary offering shares can experience an immediate drop in value if the demand for the securities does not continue to support the offering price.
Leverage Risk – The Fund may use leverage to purchase securities. Increases and decreases in the value of the Fund’s portfolio will be magnified when the Fund uses leverage.
24
| Alpine Financial Services Fund (continued) | |
Liquidity Risk – Some securities held by the Fund may be difficult to sell, or illiquid, particularly during times of market turmoil. Illiquid securities may also be difficult to value. If the Fund is forced to sell an illiquid asset to meet redemption requests or other cash needs, the Fund may be forced to sell at a loss.
Management Risk – The Adviser’s judgment about the quality, relative yield or value of, or market trends affecting, a particular security or sector, or about interest rates generally, may be incorrect. The Adviser’s security selections and other investment decisions might produce losses or cause the Fund to underperform when compared to other funds with similar investment objectives and strategies.
Market Risk – The price of a security held by the Fund may fall due to changing market, economic or political conditions.
Micro Capitalization Company Risk – Stock prices of micro capitalization companies are significantly more volatile, and more vulnerable to adverse business and economic developments than those of larger companies. Micro capitalization companies often have narrower markets for their goods and/or services and more limited managerial and financial resources than larger, more established companies, including small or medium capitalization companies.
Portfolio Turnover Risk – High portfolio turnover necessarily results in greater transaction costs which may reduce Fund performance.
Small and Medium Capitalization Company Risk – Securities of small or medium capitalization companies are more likely to experience sharper swings in market values, less liquid markets, in which it may be more difficult for the Adviser to sell at times and at prices that the Adviser believes appropriate and generally are more volatile than those of larger companies.
Undervalued Stock Risk – The Fund may pursue strategies that may include investing in securities, which, in the opinion of the Adviser, are undervalued. The identification of investment opportunities in undervalued securities is a difficult task and there is no assurance that such opportunities will be successfully recognized or acquired. While investments in undervalued securities offer opportunities for above-average capital appreciation, these investments involve a high degree of financial risk and can result in substantial losses.
Please refer to page 5 for other important disclosures and definitions.
25
| Alpine Innovators Fund | |
| Comparative Annualized Returns as of 4/30/13 (unaudited) | |
| | |
| | | 6 Months(1) | | 1 Year | | 3 Years | | 5 Years | | Since Inception(2) |
| Alpine Innovators Fund — Institutional Class | | | 11.83 | % | | | 2.76 | % | | | 7.57 | % | | | 0.58 | % | | | 4.34 | % |
| Alpine Innovators Fund — Class A (Without Load) | | | 11.68 | % | | | 2.44 | % | | | N/A | | | | N/A | | | | 17.56 | % |
| Alpine Innovators Fund — Class A (With Load) | | | 5.52 | % | | | -3.22 | % | | | N/A | | | | N/A | | | | 12.69 | % |
| Russell 3000® Index | | | 15.16 | % | | | 17.21 | % | | | 12.78 | % | | | 5.63 | % | | | 5.92 | % |
| Russell 2000® Growth Index | | | 16.60 | % | | | 15.67 | % | | | 12.94 | % | | | 7.81 | % | | | 6.91 | % |
| S&P 500® Index | | | 14.42 | % | | | 16.89 | % | | | 12.80 | % | | | 5.21 | % | | | 5.70 | % |
| Lipper Multi-Cap Growth Funds Average(3) | | | 13.39 | % | | | 10.66 | % | | | 11.07 | % | | | 4.62 | % | | | 6.42 | % |
| Lipper Multi-Cap Growth Funds Ranking(3) | | | N/A | (4) | | 498/527 | | 410/456 | | 350/383 | | 263/315 |
| Gross Expense Ratio (Institutional Class): 1.67%(5) | | | | | | | | | | | | | | | | | | | | |
| Net Expense Ratio (Institutional Class): 1.36%(5) | | | | | | | | | | | | | | | | | | | | |
| Gross Expense Ratio (Class A): 1.92%(5) | | | | | | | | | | | | | | | | | | | | |
| Net Expense Ratio (Class A): 1.61%(5) | | | | | | | | | | | | | | | | | | | | |
| (1) | Not annualized. |
| (2) | Institutional Class shares commenced on July 11, 2006 and Class A shares commenced on December 30, 2011. Returns for indices are since July 11, 2006. |
| (3) | The since inception data represents the period beginning July 13, 2006 (Institutional Class only). |
| (4) | FINRA does not recognize rankings for less than one year. |
| (5) | As disclosed in the prospectus dated February 28, 2013. |
Performance data quoted represents past performance and is not predictive of future results. Investment return and principal value of the Fund fluctuate, so that the shares, when redeemed, may be worth more or less than their original cost. Performance current to the most recent month end may be lower or higher than performance quoted and may be obtained by calling 1-888-785-5578. Performance data shown does not reflect the 1.00% redemption fee imposed on shares held for fewer than 60 days. If it did, total returns would be reduced. Returns for the Class A shares with sales charge reflect a maximum sales charge of 5.50%. Performance for the Class A shares without sales charges does not reflect this load.
Russell 3000® Index measures the performance of the largest 3000 U.S. companies representing approximately 98% of the investable U.S. equity market. Russell 2000® Growth Index measures the performance of the small-cap growth segment of the U.S. equity universe. It includes those Russell 2000 Index companies with higher price-to-value ratios and higher forecasted growth values. The S&P 500® Index is a float-adjusted market capitalization-weighted index of 500 common stocks chosen for market size, liquidity, and industry group representation to represent U.S. equity performance. The Lipper Multi-Cap Growth Funds Average is an average of funds that, by portfolio practice, invest in a variety of market-capitalization ranges without concentrating 75% of their equity assets in any one market-capitalization range over an extended period of time. Multi-cap growth funds typically have an above-average price-to-earnings ratio, price-to-book ratio, and three-year sales per-share growth value, compared to the S&P SuperComposite 1500 Index. Lipper rankings for the periods shown are based on fund total returns with dividends and distributions reinvested and do not reflect sales charges. The Russell 3000® Index, the Russell 2000® Growth Index, the S&P 500® Index and the Lipper Multi-Cap Growth Funds Average are unmanaged and do not reflect the deduction of direct fees associated with a mutual fund, such as investment advisor fees; however, the Lipper Multi-Cap Growth Funds Average reflects fees charged by the underlying funds. The performance for the Alpine Innovators Fund reflects the deduction of fees for these value-added services. Investors cannot directly invest in an index.
Expense ratios reflect the ratios reported in the Fund’s most recent prospectus. The Alpine Innovators Fund has a contractual expense waiver that continues through February 28, 2014. Where a Fund’s gross and net expense ratio are the same for the period. To the extent the Fund’s expenses were reduced by waivers, the Fund’s total returns were increased. In these cases, in the absence of the expense waivers, the Fund’s total returns would have been lower.
The Fund’s past performance benefitted significantly from Initial Public Offerings (“IPOs”) of certain issuers, and there is no assurance that the Fund can replicate this performance in the future. To the extent that the Fund’s historical performance resulted from gains derived from participation in Secondary Offerings, there is no guarantee that these results can be replicated or that the Fund will be able to participate to the same degree in IPO/Secondary Offerings in the future.
26
| Alpine Innovators Fund (continued) | |
Portfolio Distributions* (unaudited)
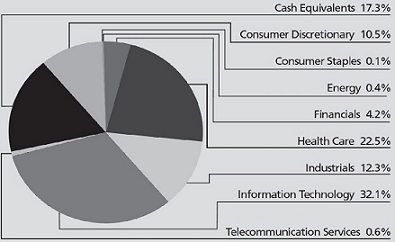
Top 10 Holdings* (unaudited)
| 1. | | ANSYS, Inc. | | 11.60 | % |
| 2. | | priceline.com, Inc. | | 9.13 | % |
| 3. | | Life Technologies Corp. | | 7.09 | % |
| 4. | | Google, Inc.-Class A | | 5.05 | % |
| 5. | | MEDNAX, Inc. | | 4.66 | % |
| 6. | | Flowserve Corp. | | 3.73 | % |
| 7. | | Apple, Inc. | | 3.10 | % |
| 8. | | FLIR Systems, Inc. | | 2.34 | % |
| 9. | | Proto Labs, Inc. | | 2.23 | % |
| 10. | | CME Group, Inc. | | 2.13 | % |
| | | |
| * | Top 10 Holdings do not include short-term investments and percentages are based on total net assets. Portfolio Distributions percentages are based on total investments. Portfolio holdings and sector distributions are as of 04/30/13 and are subject to change. Portfolio holdings are not recommendations to buy or sell any securities. |
| Value of a $10,000 Investment (unaudited) |

This chart represents a comparison of a hypothetical $10,000 investment in the Fund versus a similar investment in the Fund’s benchmark. The graph and the table do not reflect the deduction of taxes that a shareholder would pay on Fund distributions or the redemption of Fund shares. Investment performance reflects the waiver and recovery of certain fees, if applicable. Without the waiver and recovery of fees, the Fund’s total return would have differed.
Performance data quoted represents past performance and is not predictive of future results. Investment return and principal value of the Fund fluctuate, so that shares, when redeemed, may be worth more or less than their original cost.
27
| Alpine Innovators Fund (continued) | |
Commentary
The Alpine Dynamic Innovators Fund provided an 11.83% return for the semi-annual period ending April 30, 2013. This compared with 14.42% for the S&P 500® Index and 15.16% for the Russell 3000® Index over the same period. All references in this letter to the Fund’s performance relate to the performance of the Fund’s Institutional Class.
Emphasis on companies which are expected to increase growth through innovative products or management strategies remained the dominant portfolio theme. Comparative performance was negatively impacted by our holding of an above normal average weight of cash position – 16% – and a holding selection which was underweight in the financials group.
Portfolio performance leadership reflected the results of innovative companies. The top five contributors to performers were:
| Cray Inc. | 56.08% |
| | |
| Life Technologies | 50.66% |
| | |
| Mednex Inc. | 28.63% |
| | |
| priceline.com, Inc. | 22.26% |
| | |
| Ansys Inc. | 15.10% |
Each of these company’s, (with a combined average weight of 31.74%*) strength reflected what we believe is their innovative positions. Cray introduced new products in specialized, very high performance computers. Life Technologies was the subject of an acquisition offer, Mednax continues to expand through further acquisitions in the medical care field. Priceline.com exhibited sustained growth through broadening its participation in the international hotel reservations market. Ansys maintained its long term consistent growth pattern as a leader in computer generated engineering design.
The bottom five contributors to performance in the portfolio had a combined average weight of 11.54%* of the portfolio. The most adverse return, based on contribution, was Apple, Inc., down 25.01%. In this recent period, Apple suffered from growth of competition in its dominant areas of cell phones and tablets, and concern about the near-term absence of new product introductions. Mako Surgical Corp. was down 30.10% as its robotic surgical systems for the treatment of joints met slowing demand. Ariad Pharmaceuticals, Inc. was down 17.08% as the shares reflected warnings that there might be possible side effects of blood clotting and liver toxicity
in its chronic myloid leukemia drug. AeroVironment, Inc. was down 11.96%, a reflection of anticipated order cuts as part of the sequestration process in the number of drones ordered by the U.S. military. Intuitive Surgical, Inc. was down 9.04% as reports increased that certain of its robotic surgical procedures were the subject of an FDA probe.
In the case of each of these issues which declined during the quarter, our belief is that their fundamental growth rates can be sustained or repaired and that only near-term adverse expectations have brought prices down. We believe that opportunities remain even in a somewhat challenged economy. Illustrating this goal are our three largest holdings as of April 30, 2013. Ansys Inc. has established itself as a leader in the development of computer system based engineering analysis. Priceline.com, Inc. developed innovative opportunities for growth in internet based pricing discount service for hotel and travel reservations, Life Technologies (subject to the tender offer from ThermoFisher noted above) is a global life sciences and biotechnology company whose products are used in forensics, food and water safety, animal testing and other industrial applications.
The investment strategy of this Fund continues to embrace a broad range of relatively small companies which we believe have advanced technologies, as well as larger, well established leaders with what, in our view, are highly innovative product lines or potentials. We believe the investment environment will continue favorable for such holdings even with often stagnant or challenged investment conditions.
Sincerely,
Stephen A. Lieber
Samuel A. Lieber
Portfolio Managers
| * | Average weights for each individual holding were as follows: priceline.com 9.89%, Life Technologies, 5.59%, Ansys, 10.51%, Mednax, 4.38% and Cray, 1.37%, Apple 2.65%, Intuitive Surgical 4.31%, Ariad Pharmaceuticals 2.21%, AeroVironment 1.83%, MAKO Surgical Corp, 0.54%. |
28
| Alpine Innovators Fund (continued) | |
This letter represents the opinions of the Fund’s management and is subject to change, is not guaranteed and should not be considered recommendations to buy or sell any security. The information provided is not intended to be, and is not, a forecast of future events, a guarantee of future results, or investment advice. Views expressed may vary from those of the firm as a whole.
Mutual fund investing involves risk. Principal loss is possible. The fund is subject to risks, including the following:
Equity Securities Risk – The stock or other security of a company may not perform as well as expected, and may decrease in value, because of factors related to the company (such as poorer than expected earnings or certain management decisions) or to the industry in which the company is engaged (such as a reduction in the demand for products or services in a particular industry).
Growth Stock Risk – Growth stocks are stocks of companies believed to have above-average potential for growth in revenue and earnings. Growth stocks typically are very sensitive to market movements because their market prices tend to reflect future expectations. When it appears those expectations will not be met, the prices of growth stocks typically fall. Growth stocks as a group may be out of favor and underperform the overall equity market while the market concentrates on undervalued stocks.
Initial Public Offerings and Secondary Offerings Risk – The Fund may invest a portion of its assets in shares of IPOs or secondary offerings of an issuer. IPOs and secondary offerings may have a magnified impact on the performance of a Fund with a small asset base. The impact of IPOs and secondary offerings on a Fund’s performance likely will decrease as the Fund’s asset size increases, which could reduce a Fund’s returns. IPOs and secondary offerings may not be consistently available to the Fund for investing. IPO and secondary offering shares frequently are volatile in price due to the absence of a prior public market, the small number of shares available for trading and limited information about the issuer. Therefore, the Fund may hold IPO and secondary offering shares for a very short period of time. This may increase the turnover of the Fund and may lead to increased expenses for the Fund, such as commissions and transaction costs. In addition, IPO and secondary offering shares can experience an immediate drop in value if the demand for the securities does not continue to support the offering price.
Innovators Risk – The Adviser seeks to invest in the securities of companies that the Adviser believes have a competitive advantage and offer superior growth potential due to the innovative nature of each company’s products, technology or business model. No assurance can be made that these perceived innovations will occur, or, if they do, that they will result in the vigorous growth anticipated by the Adviser or such growth may be significantly delayed.
Leverage Risk – The Fund may use leverage to purchase securities. Increases and decreases in the value of the Fund’s portfolio will be magnified when the Fund uses leverage.
Management Risk – The Adviser’s judgment about the quality, relative yield or value of, or market trends affecting, a particular security or sector, or about interest rates generally, may be incorrect. The Adviser’s security selections and other investment decisions might produce losses or cause the Fund to underperform when compared to other funds with similar investment objectives and strategies.
Market Risk – The price of a security held by the Fund may fall due to changing market, economic or political conditions.
Micro Capitalization Company Risk – Stock prices of micro capitalization companies are significantly more volatile, and more vulnerable to adverse business and economic developments than those of larger companies. Micro capitalization companies often have narrower markets for their goods and/or services and more limited managerial and financial resources than larger, more established companies, including small or medium capitalization companies.
Small and Medium Capitalization Company Risk – Securities of small or medium capitalization companies are more likely to experience sharper swings in market values, less liquid markets, in which it may be more difficult for the Adviser to sell at times and at prices that the Adviser believes appropriate and generally are more volatile than those of larger companies. Innovative companies may lack profitability which in turn may result in the lack of innovative support.
Undervalued Stock Risk – The Fund may pursue strategies that may include investing in securities, which, in the opinion of the Adviser, are undervalued. The identification of investment opportunities in undervalued securities is a difficult task and there is no assurance that such opportunities will be successfully recognized or acquired. While investments in undervalued securities offer opportunities for above-average capital appreciation, these investments involve a high degree of financial risk and can result in substantial losses.
Please refer to page 5 for other important disclosures and definitions.
29
| Alpine Transformations Fund | |
| Comparative Annualized Returns as of 4/30/13 (unaudited) | |
| | | 6 Months(1) | | 1 Year | | 3 Years | | 5 Years | | Since Inception(2) |
| Alpine Transformations Fund — Institutional Class | | | 8.38% | | | | -2.66% | | | | 7.72% | | | | 4.88% | | | | 4.75% | |
| Alpine Transformations Fund — Class A (Without Load) | | | 8.32% | | | | -2.81% | | | | N/A | | | | N/A | | | | 9.56% | |
| Alpine Transformations Fund — Class A (With Load) | | | 2.37% | | | | -8.17% | | | | N/A | | | | N/A | | | | 5.03% | |
| Russell 3000® Index | | | 15.16% | | | | 17.21% | | | | 12.78% | | | | 5.63% | | | | 4.13% | |
| Russell 2000® Value Index | | | 16.58% | | | | 19.71% | | | | 9.58% | | | | 6.60% | | | | 5.35% | |
| S&P 500® Index | | | 14.42% | | | | 16.89% | | | | 12.80% | | | | 5.21% | | | | 3.73% | |
| S&P MidCap 400® Index | | | 19.23% | | | | 18.84% | | | | 13.76% | | | | 8.37% | | | | 7.34% | |
| Lipper Multi-Cap Growth Funds Average(4) | | | 13.39% | | | | 10.66% | | | | 11.07% | | | | 4.62% | | | | 2.91% | |
| Lipper Multi-Cap Growth Funds Ranking(4) | | | N/A(3) | | | | 524/527 | | | | 403/456 | | | | 185/383 | | | | 94/373 | |
| Gross Expense Ratio (Institutional Class): 1.98%(5) | | | | | | | | | | | | | | | | | | | | |
| Net Expense Ratio (Institutional Class): 1.35%(5) | | | | | | | | | | | | | | | | | | | | |
| Gross Expense Ratio (Class A): 2.23%(5) | | | | | | | | | | | | | | | | | | | | |
| Net Expense Ratio (Class A): 1.60%(5) | | | | | | | | | | | | | | | | | | | | |
| (2) | Institutional Class shares commenced on December 31, 2007 and Class A shares commenced on December 30, 2011. Returns for indices are since December 31, 2007. |
| (3) | FINRA does not recognize rankings for less than one year. |
| (4) | Institutional Class only. |
| (5) | As disclosed in the prospectus dated February 28, 2013. |
Performance data quoted represents past performance and is not predictive of future results. Investment return and principal value of the Fund fluctuate, so that the shares, when redeemed, may be worth more or less than their original cost. Performance current to the most recent month end may be lower or higher than performance quoted and may be obtained by calling 1-888-785-5578. Performance data shown does not reflect the 1.00% redemption fee imposed on shares held for fewer than 60 days. If it did, total returns would be reduced. Returns for the Class A shares with sales charge reflect a maximum sales charge of 5.50%. Performance for the Class A shares without sales charges does not reflect this load.
Russell 3000® Index measures the performance of the largest 3000 U.S. companies representing approximately 98% of the investable U.S. equity market. Russell 2000® Value Index measures the performance of small-cap value segment of the U.S. equity universe. It includes those Russell 2000 Index companies with lower price-to-book ratios and lower forecasted growth values. The S&P 500® Index is a float-adjusted market capitalization-weighted index of 500 common stocks chosen for market size, liquidity, and industry group representation to represent U.S. equity performance. The S&P MidCap 400® Index is a float-adjusted market capitalization-weighted index of 400 medium-capitalization domestic stocks chosen for market size, liquidity, and industry group representation. The Lipper Multi-Cap Growth Funds Average is an average of Funds that, by portfolio practice, invest in a variety of market-capitalization ranges without concentrating 75% of their equity assets in any one market-capitalization range over an extended period of time. Multi-cap growth funds typically have an above-average price-to-earnings ratio, price-to-book ratio, and three-year sales per-share growth value, compared to the S&P SuperComposite 1500 Index. Lipper rankings for the periods shown are based on fund total returns with dividends and distributions reinvested and do not reflect sales charges. The Russell 3000® Index, the Russell 2000® Value Index, the S&P 500® Index, the S&P MidCap 400® Index and the Lipper Multi-Cap Growth Funds Average are unmanaged and do not reflect the deduction of direct fees associated with a mutual fund, such as investment advisor fees; however, the Lipper Multi-Cap Growth Funds Average reflects fees charged by the underlying funds. The performance for the Alpine Transformations Fund reflects the deduction of fees for these value-added services. Investors cannot directly invest in an index.
Expense ratios reflect the ratios reported in the Fund’s most recent prospectus. The Alpine Transformations Fund has a contractual expense waiver that continues through February 28, 2014. Where a Fund’s gross and net expense ratio are the same for the period reported, the contractual expense reimbursement level was not reached as of the end of that period. To the extent the Fund’s expenses were reduced by waivers, the Fund’s total returns were increased. In these cases, in the absence of the expense waivers, the Fund’s total returns would have been lower.
To the extent that the Fund’s historical performance resulted from gains derived from participation in Initial Public Offerings (“IPOs”) and/or Secondary Offerings, there is no guarantee that these results can be replicated in future periods or that the Fund will be able to participate to the same degree in IPO/Secondary Offerings in the future.
30
| Alpine Transformations Fund (continued) | |
Portfolio Distributions* (unaudited)
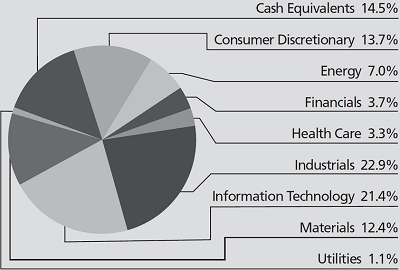
| |
| Top 10 Holdings* (unaudited) |
| 1. | Cray, Inc. | 4.94% |
| 2. | Apple, Inc. | 4.90% |
| 3. | priceline.com, Inc. | 4.41% |
| 4. | Snap-On, Inc. | 4.09% |
| 5. | Chart Industries, Inc. | 3.36% |
| 6. | Flotek Industries, Inc. | 3.30% |
| 7. | SolarWinds, Inc. | 3.22% |
| 8. | Proto Labs, Inc. | 2.83% |
| 9. | Garmin, Ltd. | 2.78% |
| 10. | Eastman Chemical Co. | 2.64% |
| | | |
| * | Top 10 Holdings do not include short-term investments and percentages are based on total net assets. Portfolio Distributions percentages are based on total investments. Portfolio holdings and sector distributions are as of 04/30/13 and are subject to change. Portfolio holdings are not recommendations to buy or sell any securities. |
| Value of a $10,000 Investment (unaudited) | |
| | 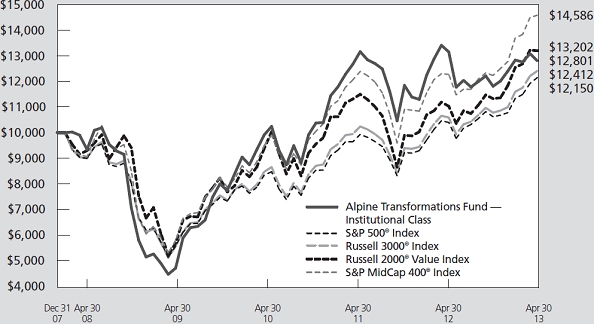 | |
This chart represents a comparison of a hypothetical $10,000 investment in the Fund versus a similar investment in the Fund’s benchmark. The graph and the table do not reflect the deduction of taxes that a shareholder would pay on Fund distributions or the redemption of Fund shares. Investment performance reflects the waiver and recovery of certain fees, if applicable. Without the waiver and recovery of fees, the Fund’s total return would have differed.
Performance data quoted represents past performance and is not predictive of future results. Investment return and principal value of the Fund fluctuate, so that shares, when redeemed, may be worth more or less than their original cost.
31
| Alpine Transformations Fund (continued) | |
Commentary
The Alpine Transformations Fund investment result for the six-month period ending April 30, 2013 was 8.38%. This compared with a gain of 14.42% for the S&P 500® Index and 15.16% for the Russell 3000® Index. While this year’s performance was weaker than the Averages, we believe that we have designed a portfolio with growth potential over the longer term. All references in this letter to the Fund’s performance relate to the performance of the Fund’s Institutional Class.
In the semi-annual period, there were three primary drivers of the underperformance versus the benchmarks – the cash position (average weight 15.37%), our underweight position and stock selection in the Health Care sector, and the stock selection in the Energy Sector.
Among the five top contributors to performance (with a combined average weight of 13.02 %* of the portfolio), the best performer was Cray Inc., up 74.44%. Cray designs, develops, manufactures and markets high-performance supercomputers and has recently received some global contracts, including a $32M contract for upgrading the Cray system at the Swiss National Supercomputing Centre and the first supercomputer installed in Asia at the Japan Advanced Institute of Science and Technology. Next in contribution was priceline.com Inc. which rose 22.29%. Priceline is an online travel company which provides internet based services for booking hotels, airfares, vacation packages, cruises etc. Priceline has continued its ability to increase their share of the market – bookings and gross profits were up as international vacation travel remains quite strong – in addition to making some strategic acquisitions (kayak.com). Flotek Industries up 44.37%, Best Buy up 50.45% and Tempur-Pedic International up 51.40% complete the top five contributors. Flotek Industries engages in the supply of drilling and production related products/services to the energy and mining industries. Flotek’s performance was improved during the semi-annual period partly due to better results and a share buyback as well as the company’s superior chemical technology. Best Buy is a multinational retailer which provides consumer electronics and has been under significant pressure. Now it appears to be a turnaround story as there has been stabilization in both sales and margins, as well as a significant partnership with Samsung (a key competitor for Apple) to create Samsung Experience Shops within all of its full-service and BBY Mobile stores, as well as the sale of its stake in its European operations to Carphone Warehouse. Tempur-Pedic, was also under pressure due to poor product
launches early this year and significant pressures from competitors. Tempur-Pedic intends to merge with Sleepy’s and there should be cost synergies from this move as well as the potential for long-term growth.
In contrast to the top five contributors, we note the negative results of the Fund’s most challenged holdings which combined for a 12.98%* total average weight of the portfolio. Apple Inc. was down 25.05% as the company continues to be under pressure from competition in the tablet and telephone area as well as concerns surrounding their ability to offer increasingly innovative future products. Edwards Lifesciences, down 26.53%, designs, develops, manufactures and markets products to treat late stage cardiovascular disease and has been under pressure due to growth slowing in the face of international competition and market development challenges in the U.S. They missed their earnings and have cut guidance. Just Energy, down 30.35%, is engaged in the sale of natural gas and electricity to residential and commercial customers –the issues’ performance suffered because of margin pressures as well as demand trailing from an extraordinarily warm 2011/2012 winter. In addition, because of balance sheet concerns, the company cut its monthly dividend from $0.10 to $0.07. Intuitive Surgical, which has been a successful long term holding for us, was down 8.88% in the semi-annual period and Walter Energy, down 48.38%, a producer of metallurgical coal for the steel industry, suffered from the decline of coal prices, oversupply and the switch to natural gas due to the cost advantages.
The transformation of a company can take some time, often measured in years rather than in quarters. We seek to find good companies in transition, as well as those moving into new products, geographies or areas of expertise. We will continue to look for investment opportunities for this Fund which we believe are undervalued and have the potential for vigorous growth.
Sincerely,
Stephen A. Lieber
Sarah Hunt
Co-Portfolio Managers
| * | Average weights for each individual holding were as follows: Cray, Inc; 4.08%, priceline.com, Inc. 4.58%, Flotek Industries, 2.71%, Best Buy Co. Inc .73%, Tempur-Pedic International Inc. ..92%, Apple Inc, 3.97%, Edwards Lifesciences Corp 2.71%, Just Energy Group Inc. 1.32%, Intuitive Surgical Inc. 4.23%, Walter Energy Inc. .74%. |
32
| Alpine Transformations Fund (continued) | |
This letter represents the opinions of the Fund’s management and is subject to change, is not guaranteed and should not be considered recommendations to buy or sell any security. The information provided is not intended to be, and is not, a forecast of future events, a guarantee of future results, or investment advice. Views expressed may vary from those of the firm as a whole.
Mutual fund investing involves risk. Principal loss is possible. The Fund is subject risks including the following:
Equity Securities Risk – The stock or other security of a company may not perform as well as expected, and may decrease in value, because of factors related to the company (such as poorer than expected earnings or certain management decisions) or to the industry in which the company is engaged (such as a reduction in the demand for products or services in a particular industry).
Foreign Securities Risk – The Fund’s investments in securities of foreign issuers or issuers with significant exposure to foreign markets involve additional risk. Foreign countries in which the Fund may invest may have markets that are less liquid, less regulated and more volatile than U.S. markets. The value of the Fund’s investments may decline because of factors affecting the particular issuer as well as foreign markets and issuers generally, such as unfavorable government actions, and political or financial instability. Lack of information may also affect the value of these securities. The risks of foreign investments are heightened when investing in issuers in emerging market countries.
Growth Stock Risk – Growth stocks are stocks of companies believed to have above-average potential for growth in revenue and earnings. Growth stocks typically are very sensitive to market movements because their market prices tend to reflect future expectations. When it appears those expectations will not be met, the prices of growth stocks typically fall. Growth stocks as a group may be out of favor and underperform the overall equity market while the market concentrates on undervalued stocks.
Initial Public Offerings and Secondary Offerings Risk – The Fund may invest a portion of its assets in shares of IPOs or secondary offerings of an issuer. IPOs and secondary offerings may have a magnified impact on the performance of a Fund with a small asset base. The impact of IPOs and secondary offerings on a Fund’s performance likely will decrease as the Fund’s asset size increases, which could reduce a Fund’s returns. IPOs and secondary offerings may not be consistently available to the Fund for investing. IPO and secondary offering shares frequently are volatile in price due to the absence of a prior public market, the small number of shares available for trading and limited information about the issuer. Therefore, the Fund may hold IPO and secondary offering shares for a very short period of time. This may increase the turnover of the Fund and may lead to increased expenses for the Fund, such as commissions and transaction costs. In addition, IPO and secondary offering shares can experience an immediate drop in value if the demand for the securities does not continue to support the offering price.
Management Risk – The Adviser’s judgment about the quality, relative yield or value of, or market trends affecting, a particular security or sector, or about interest rates generally, may be incorrect. The Adviser’s security selections and other investment decisions might produce losses or cause the Fund to underperform when compared to other funds with similar investment objectives and strategies.
Market Risk – The price of a security held by the Fund may fall due to changing market, economic or political conditions.
Micro Capitalization Company Risk – Stock prices of micro capitalization companies are significantly more volatile, and more vulnerable to adverse business and economic developments than those of larger companies. Micro capitalization companies often have narrower markets for their goods and/or services and more limited managerial and financial resources than larger, more established companies, including small or medium capitalization companies.
Small and Medium Capitalization Company Risk – Securities of small or medium capitalization companies are more likely to experience sharper swings in market values, less liquid markets, in which it may be more difficult for the Adviser to sell at times and at prices that the Adviser believes appropriate and generally are more volatile than those of larger companies.
“Special Situations” Companies Risk – “Special situations” include a change in management or management policies, the acquisition of a significant equity position in the company by others, a merger or reorganization, or the sale of spin-off of a division or subsidiary which, if resolved favorably, would improve the value of the company’s stock. If the actual or prospective situation does not materialize as anticipated, the market price of the securities of a special situation company may decline significantly. There can be no assurance that a special situation that exists at the time of its investment will be consummated under the terms and within the time period contemplated. Investments in “special situations” companies can present greater risks than investments in companies not experiencing special situations.
33
| Alpine Transformations Fund (continued) | |
Transformation Risk – The Adviser seeks to invest in the securities of companies that the Adviser believes are entering or on the verge of entering a corporate transformation. No assurance can be made that these transformations will result in the vigorous growth anticipated by the Adviser or such growth may be significantly delayed.
Undervalued Stock Risk – The Fund may pursue strategies that may include investing in securities, which, in the opinion of the Adviser, are undervalued. The identification of investment opportunities in undervalued securities is a difficult task and there is no assurance that such opportunities will be successfully recognized or acquired. While investments in undervalued securities offer opportunities for above-average capital appreciation, these investments involve a high degree of financial risk and can result in substantial losses.
Please refer to page 5 for other important disclosures and definitions
34
| Alpine Foundation Fund | |
| Comparative Annualized Returns as of 4/30/13 (unaudited) | | |
| | | 6 Months(1) | | 1 Year | | 3 Years | | 5 Years | | 10 Years | | Since Inception(2) |
| Alpine Foundation Fund — Institutional Class | | | 8.98 | % | | | 10.50 | % | | | 8.08 | % | | | 2.80 | % | | | 5.98 | % | | | 5.20 | % |
| Alpine Foundation Fund — Class A (Without Load) | | | 8.76 | % | | | 10.19 | % | | | N/A | | | | N/A | | | | N/A | | | | 13.86 | % |
| Alpine Foundation Fund — Class A (With Load) | | | 2.76 | % | | | 4.16 | % | | | N/A | | | | N/A | | | | N/A | | | | 9.12 | % |
| S&P 500® Index | | | 14.42 | % | | | 16.89 | % | | | 12.80 | % | | | 5.21 | % | | | 7.88 | % | | | 3.97 | % |
| Custom Balanced Benchmark | | | 8.87 | % | | | 11.59 | % | | | 10.17 | % | | | 5.87 | % | | | 7.03 | % | | | 4.98 | % |
| Lipper Mixed-Asset Target Allocation Growth Funds Average(4) | | | 10.39 | % | | | 12.27 | % | | | 8.85 | % | | | 4.06 | % | | | 6.97 | % | | | 4.38 | % |
| Lipper Mixed-Asset Target Allocation Growth Funds Ranking(4) | | | N/A | (3) | | | 425/551 | | | | 362/516 | | | | 381/473 | | | | 210/270 | | | | 52/206 | |
| Gross Expense Ratio (Institutional Class): 1.24%(5) | | | | | | | | | | | | | | | | | | | | | | | | |
| Net Expense Ratio (Institutional Class): 1.24%(5) | | | | | | | | | | | | | | | | | | | | | | | | |
| Gross Expense Ratio (Class A): 1.49%(5) | | | | | | | | | | | | | | | | | | | | | | | | |
| Net Expense Ratio (Class A): 1.49%(5) | | | | | | | | | | | | | | | | | | | | | | | | |
| (1) | Not annualized. |
| (2) | Institutional Class shares commenced on June 7, 2001 and Class A shares commenced on December 30, 2011. Returns for indices are since June 7, 2001. |
| (3) | FINRA does not recognize rankings for less than one year. |
| (4) | Institutional Class only. |
| (5) | As disclosed in the prospectus dated February 28, 2013. |
Performance data quoted represents past performance and is not predictive of future results. Investment return and principal value of the Fund fluctuate, so that the shares, when redeemed, may be worth more or less than their original cost. Performance current to the most recent month end may be lower or higher than performance quoted and may be obtained by calling 1-888-785-5578. Performance data shown does not reflect the 1.00% redemption fee imposed on shares held for fewer than 60 days. If it did, total returns would be reduced. Returns for the Class A shares with sales charge reflect a maximum sales charge of 5.50%. Performance for the Class A shares without sales charges does not reflect this load.
The S&P 500® Index is a float-adjusted market capitalization-weighted index of 500 common stocks chosen for market size, liquidity, and industry group representation to represent U.S. equity performance. The Custom Balanced Benchmark reflects an unmanaged portfolio (rebalanced monthly) of 60% of the S&P 500® Index and 40% of the Barclays U.S. Aggregate Bond Index, which is a widely recognized, unmanaged index of U.S. dollar-denominated investment-grade fixed income securities. The Fund may, however, invest up to 75% of its total assets in equity securities. The Lipper Mixed-Asset Target Allocation Growth Funds Average is an average of funds that, by portfolio practice, maintain a mix of between 60%-80% equity securities, with the remainder invested in bonds, cash, and cash equivalents. Lipper rankings for the periods shown are based on fund total returns with dividends and distributions reinvested and do not reflect sales charges. The S&P 500® Index and the Lipper Mixed-Asset Target Allocation Growth Funds Average are unmanaged and do not reflect the deduction of direct fees associated with a mutual fund, such as investment adviser fees; however, the Lipper Mixed-Asset Target Allocation Growth Funds Average reflects fees charged by the underlying funds. The performance for the Alpine Foundation Fund reflects the deduction of fees for these value-added services. Investors cannot directly invest in an index.
Expense ratios reflect the ratios reported in the Fund’s most recent prospectus. The Alpine Foundation Fund has a contractual expense waiver that continues through February 28, 2014. Where a Fund’s gross and net expense ratio are the same for the period reported, the contractual expense reimbursement level was not reached as of the end of that period. To the extent the Fund’s expenses were reduced by waivers, the Fund’s total returns were increased. In these cases, in the absence of the expense waivers, the Fund’s total returns would have been lower.
To the extent that the Fund’s historical performance resulted from gains derived from participation in Initial Public Offerings (“IPOs”) and/or Secondary Offerings, there is no guarantee that these results can be replicated in future periods or that the Fund will be able to participate to the same degree in IPO/Secondary Offerings in the future.
35
| Alpine Foundation Fund (continued) | |
Portfolio Distributions* (unaudited)
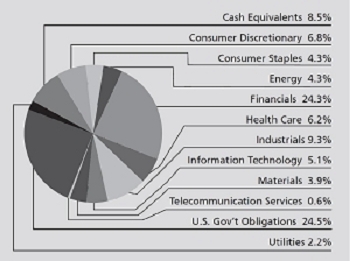
Top 10 Holdings* (unaudited)
| 1. | | U.S. Treasury Bonds, 6.000%, 02/15/2026 | | 12.32% |
| 2. | | U.S. Treasury Bonds, 5.250%, 11/15/2028 | | 7.86% |
| 3. | | Simon Property Group, Inc. | | 6.01% |
| 4. | | U.S. Treasury Bonds, 3.000%, 05/15/2042 | | 4.35% |
| 5. | | CBL & Associates Properties, Inc. | | 3.42% |
| 6. | | Johnson & Johnson | | 3.26% |
| 7. | | JPMorgan Chase & Co. | | 3.17% |
| 8. | | International Business Machines Corp. | | 2.87% |
| 9. | | CONSOL Energy, Inc. | | 2.45% |
| 10. | | General Electric Co. | | 2.35% |
| * | Top 10 Holdings do not include short-term investments and percentages are based on total net assets. Portfolio Distributions percentages are based on total investments. Portfolio holdings and sector distributions are as of 04/30/13 and are subject to change. Portfolio holdings are not recommendations to buy or sell any securities. |
| | |
| |
| Value of a $10,000 Investment (unaudited) |
| |
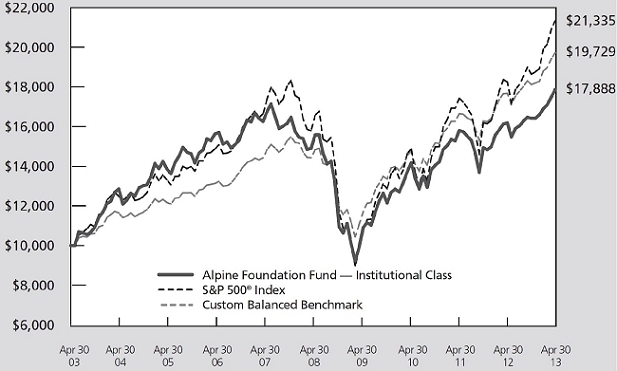 |
This chart represents a comparison of a hypothetical $10,000 investment in the Fund versus a similar investment in the Fund’s benchmark. The graph and the table do not reflect the deduction of taxes that a shareholder would pay on Fund distributions or the redemption of Fund shares. Investment performance reflects the waiver and recovery of certain fees, if applicable. Without the waiver and recovery of fees, the Fund’s total return would have differed.
Performance data quoted represents past performance and is not predictive of future results. Investment return and principal value of the Fund fluctuate, so that shares, when redeemed, may be worth more or less than their original cost.
36
| Alpine Foundation Fund (continued) | |
Commentary
The Alpine Foundation Fund provided an 8.98% total return for the six months ended April 30, 2013. This return compared with the 8.87% return of the Custom Balanced Benchmark and the 10.39% return of the Lipper Mixed-Asset Target Allocation Growth Funds Average for the same period. All references in this letter to the Fund’s performance relate to the performance of the Fund’s Institutional Class.
Our portfolio investments remained consistent with the Fund’s policy of maintaining at least 25% in fixed income investments which we achieved through U.S. Government Obligations or cash equivalents. With a slightly less than 2% in return from this segment of the portfolio, the bulk of investment return was derived from the equity portfolio.
The top five contributors to performance from the equity portfolio for the first half of the fiscal year were as follows:
| Walgreen Company | 42.83% |
| | |
| Boeing Company | 31.43% |
| | |
| Johnson & Johnson Corp. | 22.37% |
| | |
| JPMorganChase & Co. | 19.13% |
| | |
| Simon Property Group | 18.69% |
The combined average weight for the period for these securities was 14.63%*. Each was supported by the growing strength of the underlying economy as well as their internal growth prospects. Walgreen added to its portfolio with a pharmaceuticals distribution alliance and acquired additional retail capacity. Boeing disclosed a battery problem in its 787 major airliner and then demonstrated its readiness to repair that problem and restore its delivery program. Johnson & Johnson received the FDA’s “breakthrough therapy” designation1 for its Ibrutinip and the diabetes drug Invokana. JPMorganChase demonstrated its sustained earnings power, notwithstanding extraordinary trading losses suffered last year. Simon Property Group continued its trend of growth sustained by its retail customer base of the upper income consumer segment.
The weakest five performers in the portfolio for the semi-annual period were as follows:
| Just Energy Group | -30.35% |
| | |
| Apple, Inc. | -24.85% |
| Darden Restaurants | -10.27% |
| | |
| Joy Global Inc. | -8.97% |
| | |
| Consolidated Energy | -3.61% |
The combined average weight for this group of securities was 5.5%*. Just Energy is a reseller of natural gas and electricity to residential commercial customers. It was impacted by warm weather and balance sheet concerns which led the company to cut its monthly dividend from $0.10 to $0.07. Apple, Inc. came under significant pressure from growing competition in both the telephone and tablet areas as well as frequently expressed concerns about their ability to sustain the offering of innovative new products. Darden Restaurants suffered from a pullback in consumer spending and higher costs. Joy Global shares were negatively impacted by changing industry trends as its coal mining equipment saw declining demand because lower natural gas prices had displaced coal needs for many utilities.
The fixed income segment of the portfolio had only a minor change, the addition of a 3% U.S. Treasury Obligation due in 2042 – lengthening our maturity spectrum. The overall return on the fixed income segment of the portfolio was under 2%, reflecting an effort of the Federal Reserve to keep rates low through the continuous buying of U.S. Government Obligations. We expect near-term continuation of these trends as the Federal Reserve has communicated its strategy of low interest rates for the current period to help the economy return to greater employment growth.
Our common stock selection remains consistent with that discussed in earlier reports. We are focusing on companies with catalysts for capital value increase through innovative products and services or key business transformations. Illustrative of that strategy is our purchase of Williams-Sonoma Corp., whose retail distribution of household goods focuses on the upper income population segment which benefits from the recovery in housing construction and consumer confidence. We continue to include in the Fund’s portfolio companies that we believe have the ability and inclination to enhance their product lines. Deluxe Corp., the leading printer of checks, is building a diversified package of new online product aimed at increasing their customers’ visibility. Eastman Chemical Company recently purchased Solutia, integrating and expanding its film and
1 “Breakthrough therapy” designation is a provision of the Food and Drug Administration Safety and Innovation Act which enables the FDA to allow drug developers to expedite development of drug therapies that have shown, in preliminary clinical evidence, to be a substantial improvement over existing therapies for serious or life-threatening diseases.
37
| Alpine Foundation Fund (continued) | |
fiber product positions. Our holdings in financial institutions range from smaller community oriented banking systems, such as Susquehanna Bank in Pennsylvania and Webster Financial Corp. in Connecticut to mid-sized leaders such as PNC Financial Services in Pennsylvania and Ohio, to the largest bank holding company, Wells Fargo & Co. We have held the view that the banking industry is in the process of a recovery with prospectively greater financial strength.
Our long term position in health care has been sustained, led by holdings in Abbott Laboratories, Becton Dickinson & Company, Johnson & Johnson Corp. and McKesson Corp. Utility stocks continue to provide what we believe are moderate appreciation opportunities and above average income. The range of utilities holdings in the portfolio is broad: from American Electric Power in the midwest to Hawaiian Electric and to Northwest Natural Gas.
Real estate holdings remain a significant portion of the portfolio, at 13.0% weight in the period. Simon Property Group is the largest holding, with 6.01% of Fund assets. It is followed by CBL & Associates with 3.42% and Boston Properties with 2.01%. Each represents a specialized real estate asset area with a demonstrated record of sustained earnings and dividend leadership.
The portfolio is focused on an equity position which we view as both defensive in a subpar economy and capable
of growth. We believe the individual companies have growth programs and resources to realize their potentials. Many carry reasonable dividend income. The fixed income portion of the portfolio is potentially limited by current Federal Reserve policy. Our use of government bonds was intended as a defensive investment policy. The opportunities for participating in bond market movements are limited in the present environment. It may well be that this will have to be reviewed as the Federal Reserve policy and economic situation develops.
We will continue to focus our efforts on building this Fund as a solid balanced fund seeking fixed income and attractive equity exposure.
Sincerely,
Stephen A. Lieber
Samuel A. Lieber
Portfolio Managers
| * | Average weights for each individual holding included in this letter were as follows: Simon Property Group 5.66%; Johnson & Johnson 3.01%; JP Morgan Chase 3.11%; Boeing Co 1.74%; Walgreen 1.11%; Apple 1.45%; Just Energy Group, 0.63%; Consol Energy 2.49%, Darden Restaurants Inc., 0.15%; Joy Global Inc., 0.81%. |
This letter represents the opinions of the Fund’s management and is subject to change, is not guaranteed and should not be considered recommendations to buy or sell any security. The information provided is not intended to be, and is not, a forecast of future events, a guarantee of future results, or investment advice. Views expressed may vary from those of the firm as a whole.
Mutual fund investing involves risk. Principal loss is possible. The Fund is subject to risks, including the following:
Credit Risk – Credit risk refers to the possibility that the issuer of a security will not be able to make payments of interest and principal when due. Changes in an issuer’s credit rating or the market’s perception of an issuer’s creditworthiness may also affect the value of the Fund’s investment in that issuer.
Dividend Strategy Risk – The Fund’s strategy of investing in dividend-paying stocks involves the risk that such stocks may fall out of favor with investors and underperform the market. Companies that issue dividend paying-stocks are not required to continue to pay dividends on such stocks. Therefore, there is the possibility that such companies could reduce or eliminate the payment of dividends in the future.
Equity Securities Risk – The stock or other security of a company may not perform as well as expected, and may decrease in value, because of factors related to the company (such as poorer than expected earnings or certain management decisions) or to the industry in which the company is engaged (such as a reduction in the demand for products or services in a particular industry).
Fixed Income Securities Risk – Fixed income securities are subject to issuer risk, interest rate risk and market risk.
Growth Stock Risk – Growth stocks typically are very sensitive to market movements because their market prices tend to reflect future expectations. When it appears those expectations will not be met, the prices of growth stocks typically fall. Growth stocks as a group may be out of favor and underperform the overall equity market while the market concentrates on undervalued stocks. Although the Fund will not concentrate its investments in any one industry or industry group, it may, like many growth funds, weight its investments toward certain industries, thus increasing its exposure to factors adversely affecting issuers within those industries.
38
| Alpine Foundation Fund (continued) | |
Initial Public Offerings and Secondary Offerings Risk – The Fund may invest a portion of its assets in shares of IPOs or secondary offerings of an issuer. IPOs and secondary offerings may have a magnified impact on the performance of a Fund with a small asset base. The impact of IPOs and secondary offerings on a Fund’s performance likely will decrease as the Fund’s asset size increases, which could reduce a Fund’s returns. IPOs and secondary offerings may not be consistently available to the Fund for investing. IPO and secondary offering shares frequently are volatile in price due to the absence of a prior public market, the small number of shares available for trading and limited information about the issuer. Therefore, the Fund may hold IPO and secondary offering shares for a very short period of time. This may increase the turnover of the Fund and may lead to increased expenses for the Fund, such as commissions and transaction costs. In addition, IPO and secondary offering shares can experience an immediate drop in value if the demand for the securities does not continue to support the offering price.
Interest Rate Risk – Interest rates may rise resulting in a decrease in the value of securities held by the Fund, or may fall resulting in an increase in the value of such securities. Securities having longer maturities generally involve a greater risk of fluctuations in the value resulting from changes in interest rates.
Issuer Risk – Changes in the financial condition of the issuer of an obligation, changes in general economic conditions, or changes in economic conditions that affect the issuer may impact its actual or perceived willingness or ability to make timely payments of interest or principal.
Management Risk – The Adviser’s judgment about the quality, relative yield or value of, or market trends affecting, a particular security or sector, or about interest rates generally, may be incorrect. The Adviser’s security selections and other investment decisions might produce losses or cause the Fund to underperform when compared to other funds with similar investment objectives and strategies.
Market Risk – The price of a security held by the Fund may fall due to changing market, economic or political conditions.
Micro Capitalization Company Risk – Stock prices of micro capitalization companies are significantly more volatile, and more vulnerable to adverse business and economic developments than those of larger companies. Micro capitalization companies often have narrower markets for their goods and/or services and more limited managerial and financial resources than larger, more established companies, including small or medium capitalization companies.
Small and Medium Capitalization Company Risk – Securities of small or medium capitalization companies are more likely to experience sharper swings in market values, less liquid markets, in which it may be more difficult for the Adviser to sell at times and at prices that the Adviser believes appropriate and generally are more volatile than those of larger companies.
“Special Situations” Companies Risk – “Special situations” include a change in management or management policies, the acquisition of a significant equity position in the company by others, a merger or reorganization, or the sale of spin-off of a division or subsidiary which, if resolved favorably, would improve the value of the company’s stock. If the actual or prospective situation does not materialize as anticipated, the market price of the securities of a special situation company may decline significantly. There can be no assurance that a special situation that exists at the time of its investment will be consummated under the terms and within the time period contemplated. Investments in “special situations” companies can present greater risks than investments in companies not experiencing special situations.
Undervalued Stock Risk – The Fund may pursue strategies that may include investing in securities, which, in the opinion of the Adviser, are undervalued. The identification of investment opportunities in undervalued securities is a difficult task and there is no assurance that such opportunities will be successfully recognized or acquired. While investments in undervalued securities offer opportunities for above-average capital appreciation, these investments involve a high degree of financial risk and can result in substantial losses.
U.S. Government Securities Risk – U.S. government securities are obligations of, or guaranteed by, the U.S. government, its agencies or government-sponsored entities. U.S. government securities include issues by non-governmental entities (like financial institutions) that carry direct guarantees from U.S. government agencies as part of government initiatives in response to the market crisis or otherwise. Although the U.S. government guarantees principal and interest payments on securities issued by the U.S. government and some of its agencies, such as securities issued by the Government National Mortgage Association (Ginnie Mae), this guarantee does not apply to losses resulting from declines in the market value of these securities. Some of the U.S. government securities that the Fund may hold are not guaranteed or backed by the full faith and credit of the U.S. government, such as those issued by the Federal National Mortgage Association (Fannie Mae) and the Federal Home Loan Mortgage Corporation (Freddie Mac). Although the U.S. government has recently provided financial support to Fannie Mae and Freddie Mac, there can be no assurance that it will support these or other government-sponsored enterprises in the future.
Please refer to page 5 for other important and definitions.
39
Fixed Income Manager Reports

| | | Alpine Ultra Short Tax Optimized Income Fund |
| | | |
| | | Alpine Municipal Money Market Fund |
| Alpine Ultra Short Tax Optimized Income Fund | |
| Comparative Annualized Returns as of 4/30/13 (unaudited) | | |
| | | 6 Months(1) | | 1 Year | | 3 Years | | 5 Years | | 10 Years | | Since Inception(2) |
| Alpine Ultra Short Tax Optimized Income Fund — Institutional Class | | | 0.19 | % | | | 0.53 | % | | | 1.24 | % | | | 1.99 | % | | | 2.55 | % | | | 2.68 | % |
| Alpine Ultra Short Tax Optimized Income Fund — Institutional Class (Pre-liquidation, After-tax) | | | 0.07 | % | | | 0.29 | % | | | 1.12 | % | | | 1.91 | % | | | 2.30 | % | | | 2.41 | % |
| Alpine Ultra Short Tax Optimized Income Fund — Institutional Class (Post-liquidation, After-tax) | | | 0.12 | % | | | 0.34 | % | | | 1.13 | % | | | 1.90 | % | | | 2.32 | % | | | 2.40 | % |
| Alpine Ultra Short Tax Optimized Income Fund — Class A | | | 0.17 | % | | | 0.38 | % | | | 0.99 | % | | | 1.76 | % | | | N/A | | | | 2.23 | % |
| Alpine Ultra Short Tax Optimized Income Fund — Class A (Pre-liquidation, After-tax) | | | 0.10 | % | | | 0.24 | % | | | 0.91 | % | | | 1.70 | % | | | N/A | | | | 2.04 | % |
| Alpine Ultra Short Tax Optimized Income Fund — Class A (Post-liquidation, After-tax) | | | 0.10 | % | | | 0.24 | % | | | 0.91 | % | | | 1.68 | % | | | N/A | | | | 2.08 | % |
| Barclays 1 Year Municipal Bond Index | | | 0.40 | % | | | 0.77 | % | | | 1.13 | % | | | 2.03 | % | | | 2.31 | % | | | 2.33 | % |
| Lipper Short Municipal Debt Funds Average(3) | | | 0.45 | % | | | 1.14 | % | | | 1.63 | % | | | 2.03 | % | | | 2.10 | % | | | 2.11 | % |
| Lipper Short Municipal Debt Funds Ranking — Institutional Class(3) | | | N/A | (4) | | | 74/90 | | | | 49/81 | | | | 35/64 | | | | 11/49 | | | | 9/43 | |
| Gross Expense Ratio (Institutional Class): 0.84%(5) | | | | | | | | | | | | | | | | | | | | | | | | |
| Net Expense Ratio (Institutional Class): 0.70%(5) | | | | | | | | | | | | | | | | | | | | | | | | |
| Gross Expense Ratio (Class A): 1.09%(5) | | | | | | | | | | | | | | | | | | | | | | | | |
| Net Expense Ratio (Class A): 0.95%(5) | | | | | | | | | | | | | | | | | | | | | | | | |
| (1) | Not annualized. |
| (2) | Institutional Class shares commenced on December 5, 2002 and Class A shares commenced on March 30, 2004. Returns for indices are since December 5, 2002. |
| (3) | The since inception data represents the period beginning December 31, 2002. (4) FINRA does not recognize rankings for less than one year. |
| (5) | As disclosed in the prospectus dated February 28, 2013. |
Performance data quoted represents past performance and is not predictive of future results. Investment return and principal value of the Fund fluctuate, so that the shares, when redeemed, may be worth more or less than their original cost. Performance current to the most recent month end may be lower or higher than performance quoted and may be obtained by calling 1-888-785-5578. Performance data shown does not reflect the 0.25% redemption fee imposed on shares held for fewer than 30 days. If it did, total returns would be reduced. Effective 10/12/07, Alpine Ultra Short Tax Optimized Fund - Class A began imposing a maximum sales charge of 0.50% on purchases. Performance data shown for time period beginning with dates after 10/12/07 reflect the sales charge.
The Barclays 1 Year Municipal Bond Index is the 1-year component of the Municipal Bond Index. The Barclays 1 Year Municipal Bond Index is a rules-based, market value-weighted index engineered for the long-term, tax-exempt bond market. The Lipper Short Municipal Debt Funds Average is an unmanaged index that tracks funds that invest in municipal debt issues with dollar-weighted average maturities of less than three years. Lipper rankings for the periods shown are based on fund total returns with dividends and distributions reinvested and do not reflect sales charges. The Barclays 1 Year Municipal Bond Index and the Lipper Short Municipal Debt Funds Average are unmanaged and do not reflect the deduction of direct fees associated with a mutual fund, such as investment adviser fees; however, the Lipper Short Municipal Debt Funds Average reflects fees charged by the underlying funds. The performance for the Alpine Ultra Short Tax Optimized Income Fund reflects the deduction of fees for these value-added services. Investors cannot directly invest in an index.
Expense ratios reflect the ratios reported in the Fund’s most recent prospectus. The Alpine Ultra Short Tax Optimized Income Fund has a contractual expense waiver that continues through February 28, 2014. Where a Fund’s gross and net expense ratio are the same for the period reported, the contractual expense reimbursement level was not reached as of the end of that period. To the extent the Fund’s expenses were reduced by waivers, the Fund’s total returns were increased. In these cases, in the absence of the expense waivers, the Fund’s total returns would have been lower. The Adviser has also voluntarily waived a portion of the expenses for the Alpine Ultra Short Tax Optimized Income Fund. To the extent the Fund’s expenses were reduced by waivers, the Fund’s total returns were increased. In these cases, in the absence of the expense waivers, the Fund’s total returns would have been lower.
41
| Alpine Ultra Short Tax Optimized Income Fund (continued) | |
| Alpine Ultra Short Tax Optimized Income Fund vs. Peer Performance (unaudited) |
| |
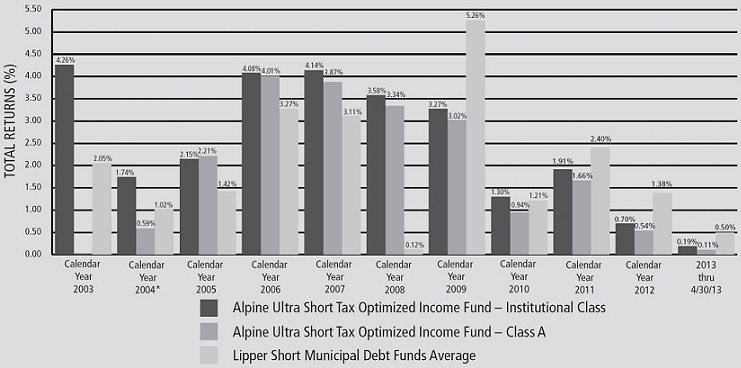 |
* The Class A Return for 2004 is from 3/30/2004 (inception) — 12/31/2004
Portfolio Distributions* (unaudited)

Top 10 Holdings* (unaudited)
| 1. | | Illinois General Obligation Unlimited-Series B, 2.00%, 10/01/2033 (Putable on 05/07/2013) | | 4.97 | % |
| 2. | | Indiana Reset Optional Certificates Trust II-R Revenue, 1.00%, 10/26/2017 (Putable on 05/07/2013) | | 4.36 | % |
| 3. | | Virginia Capital Beltway Funding Corp.,Hot Lanes-Series B, 2.28%, 12/31/2047 (Putable on 05/07/2013) | | 4.03 | % |
| 4. | | Puerto Rico Infrastructure Financing Authority Revenue, Ports Authority Project-Series C, 2.75%, 12/15/2026 (Putable on 06/17/2013) | | 3.44 | % |
| 5. | | New York Suffolk County, Tax Anticipation Notes, 2.00%, 08/14/2013 | | 2.92 | % |
| 6. | | Phoenix Industrial Development Authority Solid Waste Revenue, Republic Services, Inc. Project,0.58%, 12/01/2035 (Putable on 05/01/2013) | | 2.91 | % |
| 7. | | Puerto Rico Commonwealth Highway & Transportation Authority Revenue, 0.67%,07/01/2035 (Putable on 05/07/2013) | | 2.73 | % |
| 8. | | New Jersey Economic Development Authority Revenue, Port Newark Container Terminal LLC Project-Series B, 1.60%, 07/01/2030 (Putable on 05/07/2013) | | 2.64 | % |
| 9. | | Chicago Board of Education-Series-DCL-2012-001, 0.95%, 12/01/2034 | | 2.58 | % |
| 10. | | Miami-Dade County Expressway Authority Toll System Revenue-Series-DCL-2012-005, 0.85%,05/20/2029 (Putable on 06/13/2013) | | 2.48 | % |
| | | |
| * | Portfolio holdings and sector distributions are as of 04/30/13 and are subject to change. Portfolio holdings are not recommendations to buy or sell any securities. Portfolio Distributions percentages are based on total investments and Top 10 Holdings percentages are based on total net assets. |
| | |
42
| Alpine Ultra Short Tax Optimized Income Fund (continued) | |
| Value of a $10,000 Investment (unaudited) |
| |
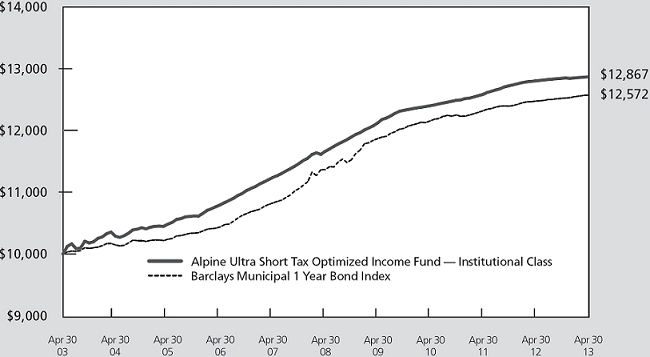 |
| |
This chart represents a comparison of a hypothetical $10,000 investment in the Fund versus a similar investment in the Fund’s benchmark. The graph and the table do not reflect the deduction of taxes that a shareholder would pay on Fund distributions or the redemption of Fund shares. Investment performance reflects the waiver and recovery of certain fees, if applicable. Without the waiver and recovery of fees, the Fund’s total return would have differed.
Performance data quoted represents past performance and is not predictive of future results. Investment return and principal value of the Fund fluctuate, so that shares, when redeemed, may be worth more or less than their original cost.
43
| Alpine Municipal Money Market Fund | |
| Comparative Annualized Returns as of 4/30/13 (unaudited) |
| | | 6 Months(1) | | 1 Year | | 3 Years | | 5 Years | | 10 Years | | Since Inception
(12/5/02) |
| Alpine Municipal Money Market Fund — Investor Class | | | 0.03 | % | | | 0.08 | % | | | 0.14 | % | | | 0.59 | % | | | 1.53 | % | | | 1.52 | % |
| Lipper Tax-Exempt Money Market Funds Average(2) | | | 0.01 | % | | | 0.01 | % | | | 0.02 | % | | | 0.26 | % | | | 1.07 | % | | | 1.07 | % |
| Lipper Tax-Exempt Money Market Funds Ranking(2) | | | N/A(3) | | | | 4/86 | | | | 1/82 | | | | 1/76 | | | | 1/56 | | | | 1/51 | |
| Alpine Municipal Money Market Fund — Investor Class, 7-day effective yield (as of 4/30/13): 0.11% | | | | | | | | | | | | | | | | | | | | | | | | |
| Net Expense Ratio: 0.56%(4) | | | | | | | | | | | | | | | | | | | | | | | | |
| (1) | Not annualized. |
| (2) | The since inception data represents the period beginning 12/31/2002. |
| (3) | FINRA does not recognize rankings for less than one year. |
| (4) | As disclosed in the prospectus dated February 28, 2013. |
Note, the yield more closely reflects the current earnings of the money market fund than the total return.
Performance data quoted represents past performance and is not predictive of future results. Performance current to the most recent month end may be lower or higher than the performance quoted and may be obtained by calling 1-888-785-5578.
The Lipper Tax-Exempt Money Market Funds Average is an average of funds that invest in high quality municipal obligations with dollar-weighted average maturities of less than 90 days. The Lipper Tax-Exempt Money Market Funds Average is unmanaged and does not reflect the deduction of direct fees associated with a mutual fund, such as investment adviser fees; however, the Lipper Tax-Exempt Money Market Funds Average reflects fees charged by the underlying funds. Lipper rankings for the periods shown are based on fund total returns with dividends and distributions reinvested and do not reflect sales charges. The performance for the Alpine Municipal Money Market Fund reflects the deduction of fees for these value-added services. Investors cannot directly invest in an index.
Expense ratios reflect the ratios reported in the Fund’s most recent prospectus. The Adviser has voluntarily waived a portion of the expenses for the Alpine Municipal Money Market Fund. To the extent the Fund’s expenses were reduced by waivers, the Fund’s total returns were increased. In these cases, in the absence of the expense waivers, the Fund’s total returns would have been lower.
| Alpine Municipal Money Market Fund vs. Peer Performance (unaudited) |
| |
 |
The graph and the table do not reflect the deduction of taxes that a shareholder would pay on Fund distributions or the redemption of Fund shares. Investment performance reflects the waiver of certain fees. Without the waiver of fees, the Fund’s total return would have been lower.
44
| Alpine Municipal Money Market Fund (continued) | |
Portfolio Distributions* (unaudited)
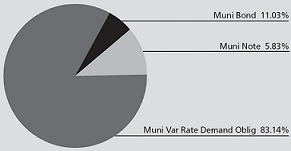
| Top 10 Holdings* (unaudited) | | |
| 1. | | Texas Jefferson County Industrial Development Corp. Revenue, Jefferson Refinery LLC, 0.45%,12/01/2040 (Putable on 06/25/2013) | | 4.53% |
| 2. | | Texas Port of Corpus Christi Authority of Nueces County, Solid Waste Disposal Revenue, Flint Hills Resources LP, West Plant Project, 0.22%, 07/01/2029 (Putable on 05/07/2013) | | 4.33% |
| 3. | | Oklahoma State Development Finance Authority Continuing Care Retirement Community Revenue, Inverness Village Project, 0.41%, 01/01/2042 (Putable on 05/07/2013) | | 3.93% |
| 4. | | Tennessee Hendersonville Industrial Development Board, 0.36%, 05/01/2036 (Putable on 05/07/2013) | | 3.78% |
| 5. | | New Jersey Hudson County Improvement Authority, Guaranteed Pooled Notes, Local Unit Loan Program, 2.00%, 06/05/2013 | | 3.57% |
| 6. | | New York Metropolitan Transportation Authority Dedicated Tax Fund Refunding Revenue, 0.43%, 11/01/2025 (Putable on 05/07/2013) | | 3.53% |
| 7. | | Michigan Strategic Fund Limited Obligation Revenue, Glastender, Inc., 0.45%, 11/01/2023 (Putable on 05/07/2013) | | 3.24% |
| 8. | | Texas Port Arthur Navigation District Revenue, BASF Corp., 0.37%, 04/01/2033 (Putable on 05/07/2013) | | 2.82% |
| 9. | | Michigan Strategic Fund Limited Obligation Revenue, Sacred Heart Rehabilitation Center, 0.36%, 03/01/2037 (Putable on 05/07/2013) | | 2.82% |
| 10. | | Pennsylvania Washington County Hospital Authority Revenue, Washington Hospital, 0.45%, 07/01/2037 (Putable on 07/01/2013) | | 2.79% |
| | | |
| * | Top 10 Holdings do not include short-term investments and percentages are based on total net assets. Portfolio Distributions percentages are based on total investments. Portfolio holdings and sector distributions are as of 04/30/13 and are subject to change. Portfolio holdings are not recommendations to buy or sell any securities. |
| Equivalent Taxable Yields as of 4/30/13 (unaudited) | |
| | | | | | | | Your Tax-Exempt Current |
| | | | | Marginal | | 7 Day Yield of 0.11% is |
| Joint Return | | Single Return | | Tax Rate | | Equivalent to a Taxable Yield of: |
| $ 68,000 - 137,300 | | $34,000 - 82,400 | | | 25 | % | | | 0.15 | % |
| $137,301 - 209,250 | | $82,401 - 171,850 | | | 28 | % | | | 0.15 | % |
| $209,251 - 373,650 | | $171,851 - 373,650 | | | 33 | % | | | 0.16 | % |
| Over $373,650 | | Over $373,650 | | | 35 | % | | | 0.17 | % |
The chart reflects 2012 marginal federal tax rates before limitations and phaseouts. Individuals should consult a tax professional to determine their actual 2012 marginal tax rate.
45
Alpine Ultra Short Tax Optimized Income Fund /
Alpine Municipal Money Market Fund | |
We are pleased to provide you with the semi-annual report for the Alpine Income Trust for the period ending April 30, 2013. The Income Trust includes both the Alpine Ultra Short Tax Optimized Income Fund and the Alpine Municipal Money Market Fund. All references in this letter to the Funds’ performance relate to the performance of the Alpine Ultra Short Tax Optimized Income Fund’s Institutional Class and the Alpine Municipal Money Market Fund’s Investor Class.
PERFORMANCE SUMMARY
According to Lipper Analytical Services, for the semi-annual period ending April 30, 2013, the total return for the Alpine Ultra Short Tax Optimized Income Fund was 0.19% and 0.03% for the Alpine Municipal Money Market Fund. The Lipper average for the same period was 0.45% and 0.01% for the Short Municipal Debt Funds and Tax-Exempt Money Market Funds peer group, respectively.
MARKET OVERVIEW
The U.S. economy expanded at a modest pace over the last six months. Employment has been steady, but the national unemployment level remains elevated. The housing market recovery has been gaining traction, although its contribution to overall growth is smaller than in previous expansions. We believe Gross Domestic Product growth will continue in 2013, but uncertainty about U.S. fiscal policy, which restrained economic activity in 2012, could continue to do so in the months ahead. On January 1, 2013, Congress passed legislation to avoid the full brunt of the federal tax increases and automatic spending cuts scheduled to take place at the end of 2012. The 39.6% federal tax bracket was reinstated, and the 2% payroll tax cut in place since the beginning of 2011 was allowed to expire. Scheduled budget sequestration was delayed for two months. The new Congress will need to address the approaching legal borrowing limit for the Federal Government in the near future.
To support the economy over the last year, the Federal Reserve kept its Fed Funds target rate in the 0.00% to 0.25% range. The central bank is purchasing $40 billion of agency mortgage-backed securities every month – a plan started in September. In addition, the Fed announced in late 2012 that it will purchase $45 billion worth of Treasury securities monthly in 2013 and that it plans to keep short-term rates very low as long as the national unemployment rate remains above 6.5% and inflation is projected at no more that 2.5% in the next 12 to 24 months.
Shorter-term municipal yields remained low and were little changed over the last six months. Yields of short-term high-quality munis declined slightly during this reporting period. With municipal yields about the same
as Treasury yields across the yield curve, tax-free securities appear to be an attractive alternative for fixed income investors on a relative basis. As of April 30, 2013, the 0.74% yield offered by a five-year tax-free municipal bond rated AAA was 108% of the pretax yield offered by a five-year Treasury bond.
Municipal issuance totaled $373 billion in 2012 and slightly under $117 billion through the first four months of 2013, according to The Bond Buyer. Much of that reflects municipalities refinancing their debts to take advantage of low long-term interest rates, rather than net new issuance. One positive factor for munis is that austerity-minded state and local governments have been conservative about adding indebtedness, despite prevailing low yields. Another favorable factor supporting the market is brisk demand, particularly for long-term issues. We anticipate that 2013 will see the same amount of issuance as in 2012.
Since the last recession, many states have faced fiscal challenges, and most have responded by cutting spending and raising taxes and fees to close budget deficits. While tax revenues collected by states are growing again, the pattern has been slower and more uneven than historically, and expense pressures continue. Balancing state budgets is not easy work and most states do a good job, although those that are not properly funding pensions and other retirement benefits are viewed unfavorably. We believe most states deserve high credit ratings and that state governments will be able to continue servicing their outstanding debts. However, we have longer-term concerns about the willingness and ability of some states to address sizable pension obligations and other retirement benefits.
Municipal bond performance throughout the six months ended April 30, 2013 was driven by investor’s search for higher yields in a low interest rate environment. Revenue bonds outperformed local and state general obligations (GO’s). Among revenue bonds, industrial revenue issues fared best, especially tobacco issues. Healthcare bonds did well, but we are being more selective among hospital revenue bonds as new issue supply and some credit concerns are weighing on the sector. Pre-refunded bonds, which are backed by U.S. Treasuries, lagged significantly.
ALPINE ULTRA SHORT TAX OPTIMIZED INCOME FUND
During the past six months, we continued to see lows yields and high demand despite stagnant or even deteriorating credit quality in the front end of the curve. This has been a constant theme in the municipal market for the past year and, unfortunately, we do not believe it will change in the very near future. As a result, we were
46
Alpine Ultra Short Tax Optimized Income Fund /
Alpine Municipal Money Market Fund (continued) | |
forced to deal with the realities of the market and made what we believe were prudent investment decisions that were necessary in meeting the core objectives of the Fund. We let our average maturity drift lower and ended the reporting period at 77 days which is significantly shorter than funds in our peer group. It is not until we see some compelling reason to look farther out on the curve that we will start to extend our maturity. We have also continued to support the Fund by voluntarily waiving a portion of our management fee, beyond what is required under our contractual expense limitation agreement, to provide what we believe is a competitive yield to our shareholders. Absent these waivers, the yield of the Fund would have been significantly lower.
We have always tried to break down the fundamentals of the municipal market into four key areas which includes evaluating supply and demand, credit quality, liquidity, and the economic environment. For the most part, these fundamentals resulted in a market with a relatively flat yield curve in the first three years which is the part of the curve this Fund focuses on. As a result, we limited the majority of our new investments to general municipal notes in the three-to-13 month range, three-to-six month put bonds and variable rate demand notes (VRDN). While VRDNs have been a big component of the fund for the past several years we believe they have continued to lose their luster as many of our higher-yielding positions have been refunded, had letter of credit changes or lost their higher yield due to demand for the product. We were able to make some select new purchases of VRDNs where the yield actually increased as a result of a credit downgrade or were overlooked by other buyers, but these purchases are becoming harder to find. While the proportion of VRDNs in the portfolio has decreased slightly they may continue to comprise a meaningful portion of the Fund.
One noticeable change that occurred in the marketplace and also in our portfolio was the ratings downgrade of various issuers from Puerto Rico, including their general obligation bonds. Historically, the debt issued by the different entities in Puerto Rico has been widely held by general market and specialty state funds because of its attractive yield and the exemption from Federal, state and local taxes. We have always been careful to spread the maturity risk of our holdings across the front end of the curve in seeking to minimize any principal depreciation should a downgrade occur. As a result of the rating changes, we saw a larger than normal sell-off in the market for Puerto Rico bonds in late December and January. We pared our holdings of our longer-maturing bonds in the two year range until we could determine how the government was going to address its fiscal difficulties. Over the last two months, news started
surfacing about changes being made to tackle their pension obligations and other related fiscal problems. Subsequently, the market has not only settled down, but the bonds have been one of the better performing sectors of the marketplace over the last couple of months. Regardless of the positive news, we will continue to closely monitor this market and will seek to make any necessary changes as needed.
With such yield compression in the market it has become more challenging to find good opportunities for investment. We will not hesitate to maintain a higher than normal level of cash equivalent securities, until what we believe are the right investments present themselves.
ALPINE MUNICIPAL MONEY MARKET FUND
As the period of the Federal Reserve’s zero interest rate policy continues, municipal money market rate movements were quite minimal. Generally, over the six months ended April 30, 2013, yields across the curve were slightly lower. Rates have ranged from an average of 10 basis points (0.10%) for overnight maturities to around 20 basis points (0.20%) for notes maturing in one year. The curve steepened by a few basis points, as commercial paper rates in maturities of 30 to 90 days moved slightly lower, while one-year maturity yields remained largely unchanged. The move lower in yields is generally consistent with other money market sectors, as the quest for any yield gradually grinds all money market rates lower. Placing further pressure on rates, new supply continues to be constrained; issuers continue to prefer refinancing in longer-dated bonds as they lock in record low yields, thus reducing investable supply in money markets. On a positive note, rates trended higher toward the end of this reporting period, as is consistent during this time of the year, as money funds typically lose assets due to redemptions for tax payments. We anticipate as redemptions subside, rates will gradually decrease again. We have also continued to support the Fund by voluntarily waiving a portion of our management fee to provide what we believe is a competitive yield to our shareholders. Absent this waiver, the yield of the Fund would have been significantly lower.
Credit quality continues to play a big role in the management of the Fund. We continue to maintain a diversified portfolio across industry sectors, issuers and states. As always, bank liquidity plays a big part in financing short-term municipal debt. We are mindful of their impact on the Fund. Our largest bank letter of credit exposures are to Wells Fargo, JPMorgan Chase, and Bank of America. Currently, we continue to hold a significant portion of the portfolio in Variable Rate Demand Notes with a small allotment invested in general market notes
47
Alpine Ultra Short Tax Optimized Income Fund /
Alpine Municipal Money Market Fund (continued) | |
and put bonds. Our average maturity continues to decline. At the end of our reporting period, it was at 21 days, which was seven days shorter than the industry average. As we enter the summer months, we will contemplate investing in the large issuance of municipal notes that historically come to the market during this period.
Yields are likely to remain stable over the next six months barring a flare-up in the European crisis or some other supply dislocation. Given this outlook, and with the Fed on hold, we likely will not stray from the maturity range that we have been in for the past year. As always, we are committed to managing a high-quality diversified portfolio, with a focus on liquidity and stability of principal.
Measures implemented by the Securities and Exchange Commission in 2010 that mandated higher liquidity requirements and reduced credit risk for all money market funds have resulted in more resilient products for all shareholders. However, the government’s Financial Stability Oversight Council has weighed in on the regulatory debate after the SEC failed to come to a consensus on the topic. Subsequent to the period end, the SEC has put forward new proposals for money market reform. We expect money market fund reform to remain a main focus for regulators in the money market fund industry.
OUTLOOK
While we are pleased with the performance of municipal bonds over the last two years, we believe that returns in the period ahead will moderate; the credit and economic environment for municipalities will likely remain challenging, and yields are unlikely to fall significantly from current levels. Modest economic growth and improving income and sales tax revenues are providing some support for state and local governments. However, cutbacks in state support for municipalities and persistent downward pressure on property tax revenue could keep local municipal issuers vulnerable. If the economy slides back into a recession-which we are not predicting currently-municipalities could face even tougher challenges.
While we do not anticipate any near-term rate hikes by the Federal Reserve, we are mindful that municipal yields are at or near historical lows and there is potential for losses, especially on the longer end of the curve, if rates rise in response to stronger economic growth or inflation. Therefore we will be careful with any investment shift that might materially increase our portfolio’s interest rate sensitivity. As always, we are on the outlook for attractively-priced bonds and continue to be mindful of the economic environment we are in.
Sincerely,
Steven C. Shachat
Portfolio Manager
This letter represents the opinions of the Fund’s management and is subject to change, is not guaranteed and should not be considered recommendations to buy or sell any security. The information provided is not intended to be, and is not, a forecast of future events, a guarantee of future results, or investment advice. Views expressed may vary from those of the firm as a whole.
Mutual fund investing involves risk. Principal loss is possible. The Alpine Ultra Short Tax Optimized Income Fund is subject to risks, including the following:
Credit Risk – The credit quality and liquidity of the Fund’s investments in municipal obligations and other debt securities may be dependent in part on the credit quality of third parties, such as banks and other financial institutions, which provide credit and liquidity enhancements to the Fund’s investments. Adverse changes in the credit quality of these third parties could cause losses to the Fund and affect its share price.
Fixed Income Securities Risk – Fixed income securities are subject to issuer risk, interest rate risk and market risk.
Interest Rate Risk – Interest rates may rise resulting in a decrease in the value of the securities held by the Fund, or may fall resulting in an increase in the value of such securities. Securities having longer maturities generally involve a greater risk of fluctuations in the value resulting from changes in interest rates.
Issuer Risk – Changes in the financial condition of the issuer of an obligation, changes in general economic conditions, or changes in economic conditions that affect the issuer may impact its actual or perceived willingness or ability to make timely payments of interest or principal.
Liquidity Risk – Some securities held by the Fund may be difficult to sell, or illiquid, particularly during times of market turmoil. Illiquid securities may also be difficult to value. If the Fund is forced to sell an illiquid asset to meet redemption requests or other cash needs, it may be forced to sell at a loss.
48
Alpine Ultra Short Tax Optimized Income Fund /
Alpine Municipal Money Market Fund (continued) | |
Management Risk – The Adviser’s judgment about the quality, relative yield or value of, or market trends affecting, a particular security or sector, or about interest rates generally, may be incorrect. The Adviser’s security selections and other investment decisions might produce losses or cause the Fund to underperform when compared to other funds with similar investment objectives and strategies.
Market Risk – The price of a security held by the Fund may fall due to changing market, economic or political conditions.
Municipal Securities Concentration Risk – From time to time the Fund may invest a substantial amount of its assets in municipal securities whose interest is paid solely from revenues of similar projects. If the Fund concentrates its investments in this manner, it assumes the economic risks relating to such projects and this may have a significant impact on the Fund’s investment performance.
Municipal Securities Risk – Municipal securities risks include the ability of the issuer to repay the obligation, the relative lack of information about certain issuers of municipal securities, and the possibility of future legislative changes which could affect the market for and value of municipal securities. Certain municipal securities, including private activity bonds, are not backed by the full faith, credit and taxing power of the issuer. Additionally, if events occur after the security is acquired that impact the security’s tax-exempt status, the Fund and its shareholders could be subject to substantial tax liabilities.
Portfolio Turnover Risk – High portfolio turnover necessarily results in greater transaction costs which may reduce Fund performance.
Tax Risk – Changes in tax laws or adverse determinations by the Internal Revenue Service may make the income from some municipal obligations taxable. Additionally, maximizing after-tax income may require trade-offs that reduce pre-tax income. The Fund’s tax-efficient strategies may reduce the taxable income of the Fund’s shareholders, but will not eliminate it. There can be no assurance that taxable distributions can always be avoided or that the Fund will achieve its investment objective.
Variable Rate Demand Obligations Risk – Variable rate demand obligations are floating rate securities that combine an interest in a long term municipal bond with a right to demand payment before maturity from a bank or other financial institution. If the bank or financial institution is unable to pay, the Fund may lose money.
The Alpine Municipal Money Market Fund is subject to risks, including the following:
An investment in the Municipal Money Market Fund is not insured or guaranteed by the Federal Deposit Insurance Corporation or any other government agency. Although the Municipal Money Market seeks to preserve the value of your investment at $1.00 per share, it is possible to lose money by investing in the Municipal Money Market.
Credit Risk – The credit quality and liquidity of the Fund’s investments in municipal obligations and other debt securities may be dependent in part on the credit quality of third parties, such as banks and other financial institutions, which provide credit and liquidity enhancements to the Fund’s investments. Adverse changes in the credit quality of these third parties could cause losses to the Fund and affect its share price.
Fixed Income Securities Risk – Fixed income securities are subject to issuer risk, interest rate risk and market risk.
Interest Rate Risk – Interest rates may rise resulting in a decrease in the value of the securities held by the Fund, or may fall resulting in an increase in the value of such securities. Securities having longer maturities generally involve a greater risk of fluctuations in the value resulting from federal tax consistent changes in interest rates.
Issuer Risk – Changes in the financial condition of the issuer of an obligation, changes in general economic conditions, or changes in economic conditions that affect the issuer may impact its actual or perceived willingness or ability to make timely payments of interest or principal.
Liquidity Risk – Some securities held by the Fund may be difficult to sell, or illiquid, particularly during times of market turmoil. Illiquid securities may also be difficult to value. If the Fund is forced to sell an illiquid asset to meet redemption requests or other cash needs, the Fund may be forced to sell at a loss.
Management Risk – The Adviser’s judgment about the quality, relative yield or value of, or market trends affecting, a particular security or sector, or about interest rates generally, may be incorrect. The Adviser’s security selections and other investment decisions might produce losses or cause the Fund to underperform when compared to other funds with similar investment objectives and strategies.
Market Risk – The price of a security held by the Fund may fall due to changing market, economic or political conditions.
49
Alpine Ultra Short Tax Optimized Income Fund /
Alpine Municipal Money Market Fund (continued) | |
Municipal Securities Concentration Risk – From time to time the Fund may invest a substantial amount of its assets in municipal securities whose interest is paid solely from revenues of similar projects. If the Fund concentrates its investments in this manner, it assumes the economic risks relating to such projects and this may have a significant impact on the Fund’s investment performance.
Municipal Securities Risk – Municipal securities risks include the ability of the issuer to repay the obligation, the relative lack of information about certain issuers of municipal securities, and the possibility of future legislative changes which could affect the market for and value of municipal securities. Certain municipal securities, including private activity bonds, are not backed by the full faith, credit and taxing power of the issuer. Additionally, if events occur after the security is acquired that impact the security’s tax-exempt status, the Fund and its shareholders could be subject to substantial tax liabilities.
Redemption Risk – The Fund may experience heavy redemptions, particularly during periods of declining or illiquid markets, that could cause the Fund to liquidate its assets at inopportune times or at a loss or depressed value and that could affect the Fund’s ability to maintain a $1.00 share price. In addition, the Fund may suspend redemptions when permitted by applicable regulations.
Regulatory Risk – The SEC recently amended the rules governing money market funds. In addition, the SEC continues to review the regulation of such funds. Any further changes by the SEC or additional legislative developments may affect the Fund’s operations, investment strategies, performance and yield.
Tax Risk – To be tax-exempt, municipal obligations generally must meet certain regulatory requirements. If any such municipal obligation fails to meet these regulatory requirements, the interest received by the Fund from its investment in such obligations and distributed to Fund shareholders will be taxable. There is no guarantee that all of the Fund’s income will remain exempt from federal or state income taxes. Income from municipal bonds held by a Fund could be declared taxable because of unfavorable changes in tax laws, adverse interpretations by the Internal Revenue Service or state tax authorities, or noncompliant conduct of a bond issuer.
Variable Rate Demand Obligations Risk – Variable rate demand obligations are floating rate securities that combine an interest in a long term municipal bond with a right to demand payment before maturity from a bank or other financial institution. If the bank or financial institution is unable to pay, the Fund may lose money.
Please refer to page 5 for other important disclosures and definitions.
50
Alpine Dynamic Dividend Fund
Schedule of Portfolio Investments
April 30, 2013 (Unaudited)
| | | | Security | | | |
| Shares | | | Description | | Value | |
| | | | | | | |
| Common Stocks—95.6% |
| Aerospace & Defense—0.7% |
| | 35,000 | | | European Aeronautic Defence
and Space Co. NV | | $ | 1,848,570 | |
| Airlines—1.3% |
| | 72,398 | | | Japan Airlines Co., Ltd. (a) | | | 3,668,730 | |
| Auto Components—1.5% |
| | 93,148 | | | Cooper Tire & Rubber Co. | | | 2,318,454 | |
| | 79,000 | | | Gentex Corp. | | | 1,777,500 | |
| | | | | | | | 4,095,954 | |
| Beverages—1.8% |
| | 145,000 | | | Diageo PLC | | | 4,423,630 | |
| | 70,580 | | | Grupo Modelo SAB de CV—
Series C | | | 641,842 | |
| | | | | | | | 5,065,472 | |
| Capital Markets—1.3% |
| | 79,500 | | | Daiwa Securities Group, Inc. | | | 703,785 | |
| | 279,000 | | | Och-Ziff Capital Management
Group, LLC—Class A (a) | | | 2,862,540 | |
| | | | | | | | 3,566,325 | |
| Chemicals—1.7% |
| | 169,000 | | | Clariant AG (b) | | | 2,471,929 | |
| | 57,000 | | | Croda International PLC | | | 2,194,045 | |
| | | | | | | | 4,665,974 | |
| Commercial Banks—7.5% |
| | 294,090 | | | Aozora Bank, Ltd. | | | 920,115 | |
| | 185,000 | | | Bangkok Bank PCL | | | 1,424,531 | |
| | 62,500 | | | Hana Financial Group, Inc. | | | 1,997,639 | |
| | 470,000 | | | Malayan Banking BHD | | | 1,486,080 | |
| | 100,000 | | | Mitsubishi UFJ Financial
Group, Inc. | | | 680,105 | |
| | 43,500 | | | PNC Financial Services Group, Inc. | | | 2,952,780 | |
| | 1,783,581 | | | PT Bank Rakyat Indonesia
Persero Tbk | | | 1,724,419 | |
| | 217,500 | | | Sberbank of Russia—ADR | | | 2,797,050 | |
| | 120,000 | | | Standard Chartered PLC | | | 3,014,120 | |
| | 14,500 | | | Sumitomo Mitsui Financial
Group, Inc. | | | 684,952 | |
| | 78,000 | | | Wells Fargo & Co. (a) | | | 2,962,440 | |
| | | | | | | | 20,644,231 | |
| Commercial Services & Supplies—2.9% |
| | 128,000 | | | Corrections Corp. of America (a) | | | 4,633,600 | |
| | 270,000 | | | RR Donnelley & Sons Co. | | | 3,323,700 | |
| | | | | | | | 7,957,300 | |
| Communications Equipment—2.9% |
| | 141,000 | | | Cisco Systems, Inc. (a) | | | 2,949,720 | |
| | 83,000 | | | QUALCOMM, Inc. (a) | | | 5,114,460 | |
| | | | | | | | 8,064,180 | |
| Computers & Peripherals—2.6% |
| | 16,234 | | | Apple, Inc. (a) | | | 7,187,603 | |
| Construction & Engineering—1.2% |
| | 67,000 | | | Vinci SA | | | 3,225,896 | |
| Diversified Consumer Services—1.4% |
| | 208,000 | | | Anhanguera Educacional
Participacoes SA | | | 3,742,597 | |
| Diversified Financial Services—1.9% |
| | 180,500 | | | Bank of America Corp. (a) | | | 2,221,955 | |
| | 61,000 | | | Citigroup, Inc. | | | 2,846,260 | |
| | | | | | | | 5,068,215 | |
| | | | Security | | | |
| Shares | | | Description | | Value | |
| | | | | | | |
| Common Stocks—continued |
| Diversified Telecommunication Services—1.3% |
| | 64,000 | | | Verizon Communications,
Inc. (a) | | $ | 3,450,240 | |
| Electric Utilities—1.9% |
| | 519,500 | | | EDP - Energias do Brasil SA | | | 3,185,938 | |
| | 22,000 | | | ITC Holdings Corp. (a) | | | 2,028,840 | |
| | | | | | | | 5,214,778 | |
| Energy Equipment & Services—3.4% |
| | 140,000 | | | Petrofac, Ltd. | | | 2,935,831 | |
| | 163,000 | | | Petroleum Geo-Services ASA | | | 2,385,711 | |
| | 179,000 | | | Subsea 7 SA | | | 3,855,337 | |
| | | | | | | | 9,176,879 | |
| Food & Staples Retailing—2.5% |
| | 27,000 | | | Costco Wholesale Corp. | | | 2,927,610 | |
| | 77,000 | | | Walgreen Co. | | | 3,812,270 | |
| | | | | | | | 6,739,880 | |
| Food Products—2.7% |
| | 13,591,000 | | | Daqing Dairy Holdings,
Ltd. (b)(c)(d) | | | 17,514 | |
| | 85,000 | | | Mondelez International, Inc.—
Class A | | | 2,673,250 | |
| | 67,500 | | | Nestle SA | | | 4,820,391 | |
| | | | | | | | 7,511,155 | |
| Health Care Equipment & Supplies—1.3% |
| | 54,000 | | | Covidien PLC | | | 3,447,360 | |
| Health Care Providers & Services—3.0% |
| | 85,000 | | | HCA Holdings, Inc. | | | 3,390,650 | |
| | 30,000 | | | McKesson Corp. (a) | | | 3,174,600 | |
| | 25,500 | | | UnitedHealth Group, Inc. (a) | | | 1,528,215 | |
| | | | | | | | 8,093,465 | |
| Hotels, Restaurants & Leisure—1.2% |
| | 56,500 | | | Las Vegas Sands Corp. | | | 3,178,125 | |
| Household Durables—1.0% |
| | 101,000 | | | Electrolux AB—Series B | | | 2,859,645 | |
| Household Products—2.4% |
| | 31,500 | | | Colgate-Palmolive Co. (a) | | | 3,761,415 | |
| | 29,000 | | | Energizer Holdings, Inc. | | | 2,801,110 | |
| | | | | | | | 6,562,525 | |
| Insurance—3.4% |
| | 392,000 | | | BB Seguridade Participacoes
SA (b) | | | 3,340,547 | |
| | 3,746 | | | Muenchener
Rueckversicherungs AG | | | 749,121 | |
| | 47,500 | | | Validus Holdings, Ltd. | | | 1,833,975 | |
| | 12,000 | | | Zurich Insurance Group AG (b) | | | 3,350,398 | |
| | | | | | | | 9,274,041 | |
| IT Services—3.3% | | | | |
| | 59,000 | | | Accenture PLC—Class A | | | 4,804,960 | |
| | 21,500 | | | International Business
Machines Corp. (a) | | | 4,354,610 | |
| | | | | | | | 9,159,570 | |
| Machinery—1.4% | | | | |
| | 20,000 | | | GEA Group AG | | | 676,517 | |
| | 36,000 | | | Snap-On, Inc. (a) | | | 3,103,200 | |
| | | | | | | | 3,779,717 | |
The accompanying notes are an integral part of these financial statements.
51
Alpine Dynamic Dividend Fund
Schedule of Portfolio Investments—Continued
April 30, 2013 (Unaudited)
| | | | Security | | | |
| Shares | | | Description | | Value | |
| | | | | | | |
| Common Stocks—continued |
| Media—4.2% |
| | 323,000 | | | British Sky Broadcasting
Group PLC | | $ | 4,234,618 | |
| | 110,000 | | | Comcast Corp.—Class A (a) | | | 4,543,000 | |
| | 43,500 | | | The Walt Disney Co. | | | 2,733,540 | |
| | | | | | | | 11,511,158 | |
| Multi-Utilities—1.2% |
| | 110,000 | | | CMS Energy Corp. | | | 3,293,400 | |
| Oil, Gas & Consumable Fuels—4.8% |
| | 40,000 | | | Cenovus Energy, Inc. | | | 1,197,600 | |
| | 34,000 | | | Enbridge, Inc. | | | 1,618,400 | |
| | 88,000 | | | HollyFrontier Corp. (a) | | | 4,351,600 | |
| | 57,500 | | | Statoil ASA | | | 1,402,974 | |
| | 82,500 | | | The Williams Cos., Inc. | | | 3,145,725 | |
| | 27,000 | | | Total SA | | | 1,360,792 | |
| | | | | | | | 13,077,091 | |
| Pharmaceuticals—5.2% |
| | 64,000 | | | Novartis AG—ADR (a) | | | 4,720,640 | |
| | 83,000 | | | Pfizer, Inc. | | | 2,412,810 | |
| | 18,000 | | | Roche Holding AG | | | 4,499,032 | |
| | 49,500 | | | Sanofi—ADR | | | 2,640,825 | |
| | | | | | | | 14,273,307 | |
| Real Estate Investment Trusts—3.4% |
| | 37,000 | | | American Tower Corp. (a) | | | 3,107,630 | |
| | — | | | Silver Bay Realty Trust Corp. | | | 7 | |
| | 219,492 | | | Two Harbors Investment Corp. | | | 2,629,514 | |
| | 195,000 | | | Westfield Group | | | 2,355,124 | |
| | 373,000 | | | Westfield Retail Trust | | | 1,276,074 | |
| | | | | | | | 9,368,349 | |
| Real Estate Management & Development—2.2% |
| | 160,000 | | | BR Malls Participacoes SA | | | 1,899,288 | |
| | 93,691 | | | Cheung Kong Holdings, Ltd. | | | 1,412,582 | |
| | 309,000 | | | Wharf Holdings, Ltd. | | | 2,761,435 | |
| | | | | | | | 6,073,305 | |
| Road & Rail—4.0% |
| | 644,000 | | | All America Latina Logistica SA | | | 3,279,950 | |
| | 39,000 | | | Canadian Pacific Railway, Ltd. | | | 4,860,180 | |
| | 35,000 | | | East Japan Railway Co. | | | 2,951,223 | |
| | | | | | | | 11,091,353 | |
| Semiconductors & Semiconductor Equipment—2.7% |
| | 130,000 | | | Avago Technologies, Ltd. (a) | | | 4,154,800 | |
| | 134,000 | | | Intel Corp. (a) | | | 3,209,300 | |
| | | | | | | | 7,364,100 | |
| Specialty Retail—1.2% | | | | |
| | 162,000 | | | American Eagle Outfitters, Inc. | | | 3,150,900 | |
| | | | Security | | | |
| Shares | | | Description | | Value | |
| | | | | | | |
| Common Stocks—continued |
| Textiles, Apparel & Luxury Goods—1.5% |
| | 72,029 | | | Coach, Inc. (a) | | $ | 4,239,627 | |
| Tobacco—1.3% |
| | 65,500 | | | British American Tobacco PLC | | | 3,628,206 | |
| Trading Companies & Distributors—1.2% |
| | 67,500 | | | Wolseley PLC | | | 3,337,411 | |
| Transportation Infrastructure—1.8% |
| | 24,500 | | | Koninklijke Vopak NV | | | 1,357,078 | |
| | 517,000 | | | TAV Havalimanlari Holding AS | | | 3,648,055 | |
| | | | | | | | 5,005,133 | |
| Water Utilities—1.3% |
| | 82,500 | | | American Water Works Co., Inc. | | | 3,455,100 | |
| Wireless Telecommunication Services—2.1% |
| | 187,000 | | | Vodafone Group PLC—ADR | | | 5,720,330 | |
| | | | | Total Common Stocks
(Cost $240,891,603) | | | 261,837,197 | |
| Equity-Linked Structured Notes—0.7% |
| Machinery—0.1% |
| | 13,271 | | | SKF AB-B Shares-Merrill
Lynch & Co., Inc. | | | 308,788 | |
| Wireless Telecommunication Services—0.6% |
| | 49,000 | | | Tele2 AB-B Shares-Merrill
Lynch & Co., Inc. | | | 839,972 | |
| | 54,856 | | | Tele2 AB-B Shares-Merrill
Lynch & Co., Inc. | | | 940,357 | |
| | | | | | | | 1,780,329 | |
| | | | | Total Equity-Linked Structured
Notes (Cost $2,096,178) | | | 2,089,117 | |
| Principal | | | | | | | |
| Amount | | | | | | | |
| Convertible Bonds—0.1% | | | | |
| Consumer Discretionary—0.1% | | | | |
| | 791,393 | | | PDG Realty SA Empreendimentos
e Participacoes—Series 8,
0.000%, 9/19/16
(Brazilian Real) (e) | | | 176,019 | |
| | | | | Total Convertible Bonds
(Cost $283,909) | | | 176,019 | |
Total Investments
(Cost $243,271,690)—96.4% | | | 264,102,333 | |
Other Assets in
Excess of Liabilities—3.6% | | | 9,882,712 | |
| TOTAL NET ASSETS 100.0% | | $ | 273,985,045 | |
The accompanying notes are an integral part of these financial statements.
52
Alpine Dynamic Dividend Fund
Schedule of Portfolio Investments—Continued
April 30, 2013 (Unaudited)
Percentages are stated as a percent of net assets.
| (a) | All or a portion of the security is available to serve as collateral on the line of credit. |
| | | |
| (b) | Non-income producing security. |
| | | |
| (c) | Security fair valued in accordance with procedures approved by the Board of Trustees. These securities comprised 0.0% of the Fund’s net assets. |
| | | |
| (e) | Represents a zero-coupon bond. Rate shown reflects the current yield as of the report date. |
| | | |
AB—Aktiebolag is the Swedish equivalent of a corporation.
ADR—American Depositary Receipt
AG—Aktiengesellschaft is a German term that refers to a corporation that is limited by shares, i.e., owned by shareholders.
AS—Anonim Sirketi is the Turkish term for joint stock company.
ASA—Allmennaksjeselskap is the Norwegian term for a public limited company.
BHD—Malaysian equivalent to incorporated.
NV—Naamloze Vennootschap is the Dutch term for a public limited liability corporation.
PCL—Public Company Limited
PLC—Public Limited Company
SA—Generally designates corporations in various countries, mostly those employing the civil law.
SAB de CV—Sociedad Anonima Bursátil de Capital Variable is the Spanish equivalent to Variable Capital Company.
The accompanying notes are an integral part of these financial statements.
53
Alpine Accelerating Dividend Fund
Schedule of Portfolio Investments
April 30, 2013 (Unaudited)
| Shares | | | Security
Description | | | Value | |
| | | | | | | | |
| Common Stocks—91.7% | | | | |
| Aerospace & Defense—1.0% | | | | |
| 350 | | | United Technologies Corp. (a) | | $ | 31,952 | |
| Beverages—3.0% | | | | |
| 525 | | | Anheuser-Busch InBev NV—ADR (a) | | | 50,201 | |
| 600 | | | PepsiCo, Inc. (a) | | | 49,482 | |
| | | | | | | 99,683 | |
| Biotechnology—1.3% | | | | |
| 400 | | | Amgen, Inc. (a) | | | 41,684 | |
| Capital Markets—1.8% | | | | |
| 4,000 | | | Och-Ziff Capital Management
Group, LLC—Class A (a) | | | 41,040 | |
| 1,500 | | | WisdomTree Investments, Inc. (b) | | | 17,400 | |
| | | | | | | 58,440 | |
| Chemicals—2.1% | | | | |
| 400 | | | Air Products & Chemicals,
Inc. (a) | | | 34,784 | |
| 800 | | | Potash Corp. of Saskatchewan,
Inc. (a) | | | 33,680 | |
| | | | | | | 68,464 | |
| Commercial Banks—3.9% | | | | |
| 2,000 | | | Financial Institutions, Inc. | | | 38,260 | |
| 1,400 | | | Lakeland Financial Corp. | | | 37,520 | |
| 550 | | | PNC Financial Services Group, Inc. | | | 37,334 | |
| 1,500 | | | Sterling Bancorp | | | 16,920 | |
| | | | | | | 130,034 | |
| Commercial Services & Supplies—1.2% | | | | |
| 1,100 | | | Corrections Corp. of America | | | 39,820 | |
| Communications Equipment—3.0% | | | | |
| 2,200 | | | Cisco Systems, Inc. (a) | | | 46,024 | |
| 850 | | | QUALCOMM, Inc. (a) | | | 52,377 | |
| | | | | | | 98,401 | |
| Computers & Peripherals—2.9% | | | | |
| 120 | | | Apple, Inc. | | | 53,130 | |
| 1,850 | | | EMC Corp. (b) | | | 41,496 | |
| | | | | | | 94,626 | |
| Construction & Engineering—0.9% | | | | |
| 2,500 | | | Aecon Group, Inc. | | | 30,771 | |
| Diversified Financial Services—0.8% | | | | |
| 600 | | | Citigroup, Inc. (a) | | | 27,996 | |
| Diversified Telecommunication Services—0.5% | | | | |
| 950 | | | Tele2 AB-B Shares | | | 16,285 | |
| Energy Equipment & Services—2.8% | | | | |
| 700 | | | Bristow Group, Inc. (a) | | | 44,240 | |
| 650 | | | Schlumberger, Ltd. (a) | | | 48,380 | |
| | | | | | | 92,620 | |
| Food & Staples Retailing—1.6% | | | | |
| 1,100 | | | Walgreen Co. (a) | | | 54,461 | |
| Food Products—2.8% | | | | |
| 800 | | | General Mills, Inc. (a) | | | 40,336 | |
| 500 | | | The J.M. Smucker Co. (a) | | | 51,615 | |
| | | | | | | 91,951 | |
| Gas Utilities—1.3% | | | | |
| 1,000 | | | Atmos Energy Corp. | | | 44,370 | |
| Health Care Equipment & Supplies—1.1% | | | | |
| 400 | | | Becton, Dickinson & Co. (a) | | | 37,720 | |
| Shares | | | Security
Description | | | Value | |
| | | | | | | | |
| Common Stocks—continued | | | | |
| Health Care Providers & Services—3.3% | | | | |
| 750 | | | Aetna, Inc. (a) | | $ | 43,080 | |
| 800 | | | AmerisourceBergen Corp. | | | 43,296 | |
| 550 | | | Patterson Cos., Inc. | | | 20,872 | |
| | | | | | | 107,248 | |
| Household Products—2.6% | | | | |
| 475 | | | Energizer Holdings, Inc. | | | 45,880 | |
| 500 | | | The Procter & Gamble Co. (a) | | | 38,385 | |
| | | | | | | 84,265 | |
| Industrial Conglomerates—1.0% | | | | |
| 300 | | | 3M Co. (a) | | | 31,413 | |
| Insurance—2.6% | | | | |
| 2,500 | | | Tower Group International, Ltd. | | | 47,300 | |
| 1,000 | | | Validus Holdings, Ltd. | | | 38,610 | |
| | | | | | | 85,910 | |
| IT Services—2.8% | | | | |
| 250 | | | International Business | | | | |
| | | | Machines Corp. (a) | | | 50,635 | |
| 250 | | | Visa, Inc.—Class A (a) | | | 42,115 | |
| | | | | | | 92,750 | |
| Life Sciences Tools & Services—1.6% | | | | |
| 1,250 | | | Agilent Technologies, Inc. | | | 51,800 | |
| Machinery—2.2% | | | | |
| 500 | | | Dover Corp. (a) | | | 34,490 | |
| 430 | | | Snap-On, Inc. (a) | | | 37,066 | |
| | | | | | | 71,556 | |
| Media—4.4% | | | | |
| 1,050 | | | CBS Corp.—Class B (a) | | | 48,069 | |
| 1,300 | | | Comcast Corp.—Class A (a) | | | 53,690 | |
| 1,400 | | | SES SA | | | 43,715 | |
| | | | | | | 145,474 | |
| Metals & Mining—0.5% | | | | |
| 1,000 | | | Vale SA—ADR (a) | | | 17,090 | |
| Multi-Utilities—3.2% | | | | |
| 1,750 | | | CMS Energy Corp. | | | 52,395 | |
| 1,650 | | | Xcel Energy, Inc. (a) | | | 52,453 | |
| | | | | | | 104,848 | |
| Oil, Gas & Consumable Fuels—5.8% | | | | |
| 370 | | | Chevron Corp. (a) | | | 45,144 | |
| 780 | | | Devon Energy Corp. | | | 42,947 | |
| 570 | | | Occidental Petroleum Corp. (a) | | | 50,878 | |
| 1,650 | | | Suncor Energy, Inc. (a) | | | 51,397 | |
| | | | | | | 190,366 | |
| Pharmaceuticals—3.4% | | | | |
| 1,000 | | | AbbVie, Inc. | | | 46,050 | |
| 1,100 | | | Mylan, Inc. (b) | | | 32,021 | |
| 925 | | | Teva Pharmaceutical Industries, | | | | |
| | | | Ltd.—ADR (a) | | | 35,418 | |
| | | | | | | 113,489 | |
| Professional Services—0.9% | | | | |
| 1,000 | | | VSE Corp. (a) | | | 30,490 | |
The accompanying notes are an integral part of these financial statements.
54
Alpine Accelerating Dividend Fund
Schedule of Portfolio Investments—Continued
April 30, 2013 (Unaudited)
| Shares | | | Security
Description | | | Value | |
| | | | | | | | |
| Common Stocks—continued | | | | |
| Real Estate Investment Trusts—6.4% | | | | |
| 700 | | | American Tower Corp. (a) | | $ | 58,793 | |
| 2,000 | | | Apollo Commercial Real Estate
Finance, Inc. | | | 35,480 | |
| 1,600 | | | Colony Financial, Inc. (a) | | | 35,680 | |
| 3,200 | | | Newcastle Investment Corp. | | | 36,256 | |
| 1 | | | Silver Bay Realty Trust Corp. | | | 11 | |
| 3,700 | | | Two Harbors Investment Corp. | | | 44,326 | |
| | | | | | | 210,546 | |
| Real Estate Management & Development—1.2% | | | | |
| 2,000 | | | Altisource Residential Corp. (b) | | | 38,000 | |
| Road & Rail—1.1% | | | | |
| 1,800 | | | Marten Transport, Ltd. (a) | | | 36,666 | |
| Semiconductors & Semiconductor Equipment—4.2% | | | | |
| 1,450 | | | Avago Technologies, Ltd. (a) | | | 46,342 | |
| 2,000 | | | Intel Corp. (a) | | | 47,900 | |
| 1,250 | | | Linear Technology Corp. (a) | | | 45,625 | |
| | | | | | | 139,867 | |
| Software—4.0% | | | | |
| 531 | | | Mail.ru Group, Ltd.—GDR (c) | | | 14,098 | |
| 1,350 | | | Microsoft Corp. (a) | | | 44,685 | |
| 1,500 | | | Oracle Corp. (a) | | | 49,170 | |
| 1,300 | | | Totvs SA | | | 24,561 | |
| | | | | | | 132,514 | |
| Specialty Retail—3.1% | | | | |
| 1,100 | | | Dick’s Sporting Goods, Inc. (a) | | | 52,910 | |
| 1,400 | | | Rent-A-Center, Inc. | | | 48,902 | |
| | | | | | | 101,812 | |
| Shares | | | Security
Description | | | Value | |
| | | | | | | | | |
| Common Stocks—continued | | | | |
| Textiles, Apparel & Luxury Goods—2.8% | | | | |
| | 720 | | | NIKE, Inc.—Class B (a) | | $ | 45,792 | |
| | 270 | | | VF Corp. (a) | | | 48,119 | |
| | | | | | | | 93,911 | |
| Thrifts & Mortgage Finance—1.2% | | | | |
| | 1,500 | | | Berkshire Hills Bancorp, Inc. | | | 38,790 | |
| Water Utilities—1.4% | | | | |
| | 1,100 | | | American Water Works Co., Inc. | | | 46,068 | |
| | | | | Total Common Stocks
(Cost $2,499,537) | | | 3,024,151 | |
| Equity-Linked Structured Notes—0.5% | | | | |
| Aerospace & Defense—0.5% | | | | |
| | 619 | | | Mail.ru Group, Ltd.—Morgan
Stanley BV | | | 16,713 | |
|
|
|
| Total Equity-Linked Structured
Notes (Cost $21,294) |
|
|
16,713 |
|
| | | | | | | | | |
| Principal | | | | | | | |
| Amount | | | | | | | |
| Short-Term Investments—9.3% | | | | |
| $ | 306,000 | | | State Street Eurodollar
Time Deposit, 0.01% | | | 306,000 | |
| | | | | Total Short-Term Investments
(Cost $306,000) | | | 306,000 | |
Total Investments
(Cost $2,826,831)—101.5% | | | 3,346,864 | |
Liabilities in Excess of
Other Assets—(1.5)% | | | (49,210 | ) |
| TOTAL NET ASSETS 100.0% | | $ | 3,297,654 | |
Percentages are stated as a percent of net assets.
| (a) | All or a portion of the security is available to serve as collateral on the line of credit. |
| | |
| (b) | Non-income producing security. |
| | |
| (c) | Restricted under Rule 144A of the Securities Act of 1933. These securities may be resold in transactions exempt from registration, normally to qualified institutional buyers. These securities have been determined to be liquid under guidelines established by the Board of Trustees. Liquid securities restricted under Rule 144A comprised 0.4% of the Fund’s net assets. |
| | |
| AB—Aktiebolag is the Swedish equivalent of a term corporation. |
| |
| ADR—American Depositary Receipt |
| |
| BV— Besloten Vennootschap is the Dutch equivalent of a private limited liability company. |
| |
| GDR—Global Depositary Receipt |
| |
| NV—Naamloze Vennootschap is the Dutch term for a public limited liability corporation. |
| |
| SA—Generally designates corporations in various countries, mostly those employing the civil law. |
The accompanying notes are an integral part of these financial statements.
55
Alpine Financial Services Fund
Schedule of Portfolio Investments
April 30, 2013 (Unaudited)
| Shares | | | Security
Description | | | Value | |
| | | | | | | | |
| Common Stocks—92.6% | | | | |
| Capital Markets—16.4% | | | | |
| 520 | | | Artisan Partners Asset
Management, Inc. (a) | | $ | 19,396 | |
| 25,000 | | | BGC Partners, Inc.—Class A (b) | | | 143,000 | |
| 52,033 | | | Cowen Group, Inc.—Class A (a)(b) | | | 133,205 | |
| 1,651 | | | Deutsche Bank AG | | | 75,904 | |
| 18,500 | | | GFI Group, Inc. (b) | | | 74,185 | |
| 89,037 | | | Gleacher & Co., Inc. (a) | | | 61,231 | |
| 13,603 | | | JMP Group, Inc. | | | 87,875 | |
| 17,900 | | | KKR & Co. LP | | | 375,900 | |
| 4,869 | | | LPL Financial Holdings, Inc. | | | 168,273 | |
| 4,443 | | | Manning & Napier, Inc. | | | 77,797 | |
| 13,200 | | | Och-Ziff Capital Management
Group, LLC—Class A (b) | | | 135,432 | |
| 1,705 | | | SWS Group, Inc. (a) | | | 9,701 | |
| 20,000 | | | The Blackstone Group LP (b) | | | 411,000 | |
| 15,000 | | | The Carlyle Group LP | | | 487,200 | |
| 26,340 | | | WisdomTree Investments, Inc. (a) | | | 305,544 | |
| | | | | | | 2,565,643 | |
| Commercial Banks—37.6% | | | | |
| 4,150 | | | 1st Constitution Bancorp (a) | | | 36,312 | |
| 45,165 | | | 1st United Bancorp, Inc. (b) | | | 299,444 | |
| 3,316 | | | American River Bankshares (a)(b) | | | 25,865 | |
| 15,000 | | | Bancorp, Inc. (a) | | | 195,000 | |
| 52,381 | | | Bank of Commerce Holdings | | | 265,048 | |
| 5,000 | | | Bank of Georgia Holdings PLC | | | 125,122 | |
| 13,428 | | | Barclays PLC | | | 59,665 | |
| 8,244 | | | BNC Bancorp | | | 83,677 | |
| 106,783 | | | Carolina Trust Bank (a) | | | 295,789 | |
| 12,493 | | | Centerstate Banks, Inc. | | | 103,942 | |
| 2,000 | | | CIT Group, Inc. (a) | | | 85,020 | |
| 36,627 | | | Citizens First Corp. (a) | | | 306,202 | |
| 7,095 | | | Comerica, Inc. | | | 257,194 | |
| 6,700 | | | Community National Bank of
the Lakeway Area (a)(b)(c) | | | 15,343 | |
| 5,000 | | | ConnectOne Bancorp, Inc. (a) | | | 145,000 | |
| 9,787 | | | Cordia Bancorp, Inc. (a) | | | 49,129 | |
| 4,000 | | | County Commerce Bank (a) | | | 65,500 | |
| 15,000 | | | CU Bancorp (a) | | | 210,000 | |
| 20,000 | | | First Business Financial
Services, Inc. | | | 550,400 | |
| 1,000 | | | FirstMerit Corp. (b) | | | 17,130 | |
| 1,000 | | | Hancock Holding Co. | | | 27,270 | |
| 15,600 | | | Intervest Bancshares Corp.— | | | | |
| | | | Class A (a) | | | 91,728 | |
| 500 | | | Manhattan Bancorp (a) | | | 2,000 | |
| 10,200 | | | New Century Bancorp, Inc. (a)(b) | | | 65,280 | |
| 400 | | | North Valley Bancorp (a) | | | 7,036 | |
| 4,000 | | | OFG Bancorp | | | 64,280 | |
| 2,375 | | | Old Point Financial Corp. | | | 29,070 | |
| 22,539 | | | Pacific Mercantile Bancorp (a)(b) | | | 135,234 | |
| 48,276 | | | Pacific Premier Bancorp, Inc. (a)(b) | | | 586,553 | |
| 2,500 | | | Plaza Bank (a)(c) | | | 6,888 | |
| 5,555 | | | Powszechna Kasa Oszczednosci
Bank Polski SA | | | 57,838 | |
| 75,000 | | | Republic First Bancorp, Inc. (a)(b) | | | 203,250 | |
| 3,120 | | | SB Financial Group, Inc. (b) | | | 27,144 | |
| 5,000 | | | Seacoast Commerce Bank (a) | | | 24,775 | |
| 2,000 | | | Security California Bancorp (a) | | | 19,450 | |
| 2,000 | | | Shore Bancshares, Inc. | | | 14,000 | |
| 38,750 | | | Southern National Bancorp of
Virginia, Inc. (b) | | | 390,212 | |
| Shares | | | Security
Description | | | Value | |
| | | | | | | | |
| Common Stocks—continued | | | | |
| Commercial Banks—continued | | | | |
| 2,000 | | | Stonegate Bank | | $ | 35,700 | |
| 8,000 | | | Summit State Bank (b) | | | 69,200 | |
| 152,347 | | | Synovus Financial Corp. (b) | | | 409,813 | |
| 3,000 | | | Texas Capital Bancshares, Inc. (a) | | | 124,980 | |
| 2,551 | | | Valley Commerce Bancorp (c) | | | 31,888 | |
| 62,000 | | | VTB Bank OJSC—GDR (d) | | | 195,300 | |
| 2,000 | | | Westamerica BanCorp. | | | 86,780 | |
| 1,974 | | | Yadkin Valley Financial
Corp. (a)(b) | | | 7,916 | |
| | | | | | | 5,904,367 | |
| Commercial Services & Supplies—0.5% | | | | |
| 5,000 | | | Multiplus SA | | | 82,069 | |
| Consumer Finance—5.3% | | | | |
| 7,158 | | | Capital One Financial Corp. | | | 413,589 | |
| 2,000 | | | Credit Acceptance Corp. (a) | | | 200,660 | |
| 500 | | | DFC Global Corp. (a) | | | 6,750 | |
| 1,000 | | | Discover Financial Services | | | 43,740 | |
| 2,591 | | | Ezcorp, Inc.—Class A (a) | | | 43,788 | |
| 1,000 | | | Green Dot Corp.—Class A (a)(b) | | | 15,710 | |
| 25,000 | | | Imperial Holdings, Inc. (a)(b) | | | 100,500 | |
| | | | | | | 824,737 | |
| Diversified Financial Services—7.6% | | | | |
| 7,124 | | | BM&F Bovespa SA | | | 49,458 | |
| 1,100 | | | BTG Pactual Participations, Ltd. | | | 18,270 | |
| 3,325 | | | CME Group, Inc. (b) | | | 202,359 | |
| 162,000 | | | Dubai Financial Market (a) | | | 55,132 | |
| 3,115 | | | IntercontinentalExchange, Inc. (a) | | | 507,527 | |
| 4,000 | | | NYSE Euronext (b) | | | 155,240 | |
| 7,000 | | | The NASDAQ OMX
Group, Inc. (b) | | | 206,360 | |
| | | | | | | 1,194,346 | |
| Insurance—6.7% | | | | |
| 30,000 | | | Atlas Financial Holdings, Inc. (a) | | | 219,000 | |
| 58,272 | | | BB Seguridade Participacoes SA (a) | | | 496,583 | |
| 2,000 | | | eHealth, Inc. (a) | | | 41,880 | |
| 26,515 | | | esure Group PLC (a) | | | 122,428 | |
| 5,700 | | | The Phoenix Co., Inc. (a) | | | 165,927 | |
| | | | | | | 1,045,818 | |
| IT Services—1.4% | | | | |
| 1,818 | | | EVERTEC, Inc. (a) | | | 36,451 | |
| 1,000 | | | VeriFone Systems, Inc. (a) | | | 21,480 | |
| 1,000 | | | Visa, Inc.—Class A | | | 168,460 | |
| | | | | | | 226,391 | |
| Real Estate Investment Trusts—5.3% | | | | |
| 12,500 | | | Government Properties
Income Trust | | | 325,625 | |
| 28,125 | | | Kite Realty Group Trust | | | 185,625 | |
| 6,557 | | | Silver Bay Realty Trust Corp. | | | 125,107 | |
| 7,122 | | | Starwood Property Trust, Inc. | | | 195,784 | |
| | | | | | | 832,141 | |
| Thrifts & Mortgage Finance—11.1% | | | | |
| 17,105 | | | Alliance Bancorp, Inc. of
Pennsylvania (b) | | | 232,457 | |
| 4,000 | | | Astoria Financial Corp. | | | 38,360 | |
| 10,000 | | | Bank Mutual Corp. | | | 51,800 | |
| 2,000 | | | Cape Bancorp, Inc. | | | 18,020 | |
| 126,234 | | | Central Federal Corp. (a) | | | 188,089 | |
| 2,500 | | | Dime Community Bancshares, Inc. | | | 35,675 | |
| 500 | | | First Defiance Financial Corp. | | | 11,320 | |
The accompanying notes are an integral part of these financial statements.
56
Alpine Financial Services Fund
Schedule of Portfolio Investments—Continued
April 30, 2013 (Unaudited)
| Shares | | | Security
Description | | | Value | |
| | | | | | | | |
| Common Stocks—continued | | | | |
| Thrifts & Mortgage Finance—continued | | | | |
| 5,895 | | | First Pactrust Bancorp, Inc. | | $ | 66,967 | |
| 6,000 | | | Flagstar Bancorp, Inc. (a) | | | 74,460 | |
| 8,823 | | | HopFed Bancorp, Inc. | | | 96,259 | |
| 15,000 | | | Jefferson Bancshares, Inc. (a) | | | 82,350 | |
| 4,466 | | | Meta Financial Group, Inc. | | | 118,706 | |
| 31,121 | | | MGIC Investment Corp. (a) | | | 168,054 | |
| 1,000 | | | Nationstar Mortgage
Holdings, Inc. (a) | | | 36,770 | |
| 1,000 | | | Ocean Shore Holding Co. | | | 14,960 | |
| 23,751 | | | Provident Financial | | | | |
| | | | Holdings, Inc. (b) | | | 384,766 | |
| 5,000 | | | Provident New York Bancorp | | | 45,200 | |
| 11,000 | | | Riverview Bancorp, Inc. (a) | | | 26,950 | |
| 1,000 | | | TF Financial Corp. | | | 25,050 | |
| 6,370 | | | United Community Financial
Corp. (a) | | | 26,372 | |
| | | | | | | 1,742,585 | |
| Trading Companies & Distributors—0.7% | | | | |
| 2,769 | | | Textainer Group Holdings, Ltd. | | | 107,077 | |
| | | | Total Common Stocks
(Cost $14,455,412) | | | 14,525,174 | |
| Preferred Stocks—0.2% | | | | |
| Commercial Banks—0.2% | | | | |
| 13,000 | | | Banco Industrial e
Comercial SA, 8.850% | | | 35,736 | |
| | | | Total Preferred Stocks
(Cost $92,416) | | | 35,736 | |
| Shares | | | Security
Description | | Value | |
| | | | | | | |
| Investment Companies—1.2% | | | | |
| | 3,300 | | | Direxion Daily Financial Bear
3X Shares (a) | | $ | 126,522 | |
| | 2,200 | | | ProShares UltraShort Financials (a) | | | 55,044 | |
| | | | | Total Investment Companies
(Cost $435,845) | | | 181,566 | |
| Rights—0.0%* | | | | |
| Thrifts & Mortgage Finance—0.0% | | | | |
| | 6,370 | | | United Community Financial (a)
Expiration: December, 2013
Exercise Price: 2.75 | | | 446 | |
| | | | | Total Rights (Cost $0) | | | 446 | |
| | | | | | | | | |
Principal
Amount | | | | | | | |
| Short-Term Investments—7.9% | | | | |
| $ | 1,243,000 | | | State Street Eurodollar
Time Deposit, 0.01% | | | 1,243,000 | |
| | | | | Total Short-Term Investments
(Cost $1,243,000) | | | 1,243,000 | |
Total Investments
(Cost $16,226,673)—101.9% | | | 15,985,922 | |
Liabilities in Excess of
Other Assets—(1.9)% | | | (293,037 | ) |
| TOTAL NET ASSETS 100.0% | | $ | 15,692,885 | |
Percentages are stated as a percent of net assets.
| * | Less than 0.05% of Net Assets. |
| | |
| (a) | Non-income producing security. |
| | |
| (b) | All or a portion of the security is available to serve as collateral on the line of credit. |
| | |
| (c) | Illiquid security. |
| | |
| (d) | Restricted under Rule 144A of the Securities Act of 1933. These securities may be resold in transactions exempt from registration, normally to qualified institutional buyers. These securities have been determined to be liquid under guidelines established by the Board of Trustees. Liquid securities restricted under Rule 144A comprised 1.2% of the Fund’s net assets. |
| | |
| AG—Aktiengesellschaft is a German term that refers to a corporation that is limited by shares, i.e., owned by shareholders. |
| |
| GDR—Global Depositary Receipt |
| |
| OJSC—Open Joint Stock Company |
| |
| PLC—Public Limited Company |
| |
| SA—Generally designates corporations in various countries, mostly those employing the civil law. |
The accompanying notes are an integral part of these financial statements.
57
Alpine Innovators Fund
Schedule of Portfolio Investments
April 30, 2013 (Unaudited)
| Shares | | | Security
Description | | | Value | |
| | | | | | | | |
| Common Stocks—83.3% | | | | |
| Aerospace & Defense—1.7% | | | | |
| 10,000 | | | Aerovironment, Inc. (a) | | $ | 193,600 | |
| Biotechnology—3.2% | | | | |
| 12,500 | | | ARIAD Pharmaceuticals, Inc. (a) | | | 223,375 | |
| 5,000 | | | Myriad Genetics, Inc. (a)(b) | | | 139,250 | |
| | | | | | | 362,625 | |
| Commercial Banks—2.0% | | | | |
| 8,000 | | | SunTrust Banks, Inc. | | | 234,000 | |
| Commercial Services & Supplies—1.9% | | | | |
| 15,000 | | | Abtech Holdings, Inc. (a) | | | 10,500 | |
| 6,000 | | | Copart, Inc. (a) | | | 211,500 | |
| | | | | | | 222,000 | |
| Communications Equipment—1.4% | | | | |
| 2,500 | | | QUALCOMM, Inc. | | | 154,050 | |
| Computers & Peripherals—4.0% | | | | |
| 800 | | | Apple, Inc. | | | 354,200 | |
| 5,000 | | | Hewlett-Packard Co. (b) | | | 103,000 | |
| | | | | | | 457,200 | |
| Diversified Financial Services—2.1% | | | | |
| 4,000 | | | CME Group, Inc. (b) | | | 243,440 | |
| Diversified Telecommunication Services—0.6% | | | | |
| 4,000 | | | magicJack VocalTec, Ltd. (a) | | | 66,120 | |
| | | | | | | | |
| Electronic Equipment, Instruments & Components—6.3% | | | | |
| 11,000 | | | FLIR Systems, Inc. (b) | | | 267,410 | |
| 12,434 | | | InvenSense, Inc. (a) | | | 115,885 | |
| 3,000 | | | IPG Photonics Corp. | | | 191,040 | |
| 6,000 | | | Oxford Instruments PLC | | | 143,529 | |
| | | | | | | 717,864 | |
| Energy Equipment & Services—0.4% | | | | |
| 25,000 | | | Electromagnetic GeoServices (a) | | | 36,200 | |
| 10,833 | | | Polarcus, Ltd. (a) | | | 9,788 | |
| | | | | | | 45,988 | |
| Health Care Equipment & Supplies—3.6% | | | | |
| 10,000 | | | Endologix, Inc. (a) | | | 150,200 | |
| 400 | | | Intuitive Surgical, Inc. (a) | | | 196,916 | |
| 5,000 | | | MAKO Surgical Corp. (a) | | | 52,950 | |
| 5,000 | | | Synergetics U.S.A., Inc. (a) | | | 14,750 | |
| | | | | | | 414,816 | |
| Health Care Providers & Services—4.7% | | | | |
| 6,000 | | | MEDNAX, Inc. (a) | | | 532,380 | |
| Health Care Technology—1.0% | | | | |
| 3,228 | | | Allscripts Healthcare
Solutions, Inc. (a) | | | 44,676 | |
| 4,000 | | | Quality Systems, Inc. (b) | | | 71,480 | |
| | | | | | | 116,156 | |
| Household Durables—1.5% | | | | |
| 25,000 | | | Zagg, Inc. (a) | | | 169,250 | |
| Shares | | | Security
Description | | Value | |
| | | | | | | |
| Common Stocks—continued | | | | |
| Internet & Catalog Retail—9.2% | | | | |
| | 40 | | | Amazon.com, Inc. (a) | | $ | 10,152 | |
| | 1,500 | | | priceline.com, Inc. (a) | | | 1,043,985 | |
| | | | | | | | 1,054,137 | |
| Internet Software & Services—5.8% | | | | |
| | 700 | | | Google, Inc.—Class A (a) | | | 577,199 | |
| | 2,500 | | | Liquidity Services, Inc. (a) | | | 82,250 | |
| | | | | | | | 659,449 | |
| Life Sciences Tools & Services—8.1% | | | | |
| | 1,000 | | | Bio-Rad Laboratories,
Inc.—Class A (a)(b) | | | 119,750 | |
| | 11,000 | | | Life Technologies Corp. (a) | | | 810,590 | |
| | | | | | | | 930,340 | |
| Machinery—8.7% | | | | |
| | 1,500 | | | Chart Industries, Inc. (a) | | | 127,215 | |
| | 2,700 | | | Flowserve Corp. | | | 426,924 | |
| | 5,000 | | | Proto Labs, Inc. (a) | | | 255,400 | |
| | 6,000 | | | Westport Innovations, Inc. (a) | | | 186,420 | |
| | | | | | | | 995,959 | |
| Personal Products—0.1% | | | | |
| | 400 | | | Herbalife, Ltd. | | | 15,884 | |
| Pharmaceuticals—2.1% | | | | |
| | 7,000 | | | The Medicines Co. (a) | | | 236,320 | |
| Semiconductors & Semiconductor Equipment—2.0% | | | | |
| | 6,000 | | | Veeco Instruments, Inc. (a) | | | 228,420 | |
| Software—12.9% | | | | |
| | 16,400 | | | ANSYS, Inc. (a)(b) | | | 1,326,104 | |
| | 10,000 | | | Callidus Software, Inc. (a) | | | 42,900 | |
| | 20,600 | | | Mitek Systems, Inc. (a) | | | 109,592 | |
| | | | | | | | 1,478,596 | |
| | | | | Total Common Stocks
(Cost $7,081,473) | | | 9,528,594 | |
| | | | | | | | | |
Principal
Amount | | | | | | | |
| Short-Term Investments—17.3% | | | | |
| $ | 1,979,000 | | | State Street Eurodollar | | | | |
| | | | | Time Deposit, 0.01% | | | 1,979,000 | |
Total Short-Term Investments
(Cost $1,979,000) | | | 1,979,000 | |
Total Investments
(Cost $9,060,473)—100.6% | | | 11,507,594 | |
Liabilities in Excess of
Other Assets—(0.6)% | | | (71,056 | ) |
| TOTAL NET ASSETS 100.0% ` | | $ | 11,436,538 | |
Percentages are stated as a percent of net assets.
| (a) | Non-income producing security. |
| | |
| (b) | All or a portion of the security is available to serve as collateral on the line of credit. |
| | |
PLC—Public Limited Company |
The accompanying notes are an integral part of these financial statements.
58
Alpine Transformations Fund
Schedule of Portfolio Investments
April 30, 2013 (Unaudited)
| Shares | | | Security
Description | | Value | |
| | |
| Common Stocks—85.0% | | | | |
| Aerospace & Defense—1.5% | | | | |
| | 5,000 | | | Aerovironment, Inc. (a)(b) | | $ | 96,800 | |
| Chemicals—8.3% | | | | |
| | 10,000 | | | Clariant AG (a) | | | 146,268 | |
| | 2,500 | | | Eastman Chemical Co. | | | 166,625 | |
| | 13,000 | | | Flotek Industries, Inc. (a) | | | 208,520 | |
| | | | | | | | 521,413 | |
| Commercial Banks—1.2% | | | | |
| | 1,991 | | | Wells Fargo & Co. | | | 75,618 | |
| Commercial Services & Supplies—2.5% | | | | |
| | 15,000 | | | Abtech Holdings, Inc. (a) | | | 10,500 | |
| | 12,000 | | | RR Donnelley & Sons Co. | | | 147,720 | |
| | | | | | | | 158,220 | |
| Computers & Peripherals—9.8% | | | | |
| | 700 | | | Apple, Inc. | | | 309,925 | |
| | 14,758 | | | Cray, Inc. (a)(b) | | | 312,279 | |
| | | | | | | | 622,204 | |
| Diversified Financial Services—1.9% | | | | |
| | 10,000 | | | Bank of America Corp. (b) | | | 123,100 | |
| Electronic Equipment, Instruments & Components—1.3% | | | | |
| | 3,500 | | | Oxford Instruments PLC | | | 83,726 | |
| Energy Equipment & Services—5.0% | | | | |
| | 2,000 | | | CARBO Ceramics, Inc. | | | 141,300 | |
| | 25,000 | | | Electromagnetic GeoServices (a) | | | 36,200 | |
| | 2,000 | | | National Oilwell Varco, Inc. | | | 130,440 | |
| | 10,833 | | | Polarcus, Ltd. (a) | | | 9,788 | |
| | | | | | | | 317,728 | |
| Health Care Equipment & Supplies—3.3% | | | | |
| | 2,000 | | | Edwards Lifesciences Corp. (a)(b) | | | 127,580 | |
| | 100 | | | Intuitive Surgical, Inc. (a) | | | 49,229 | |
| | 10,000 | | | Synergetics U.S.A., Inc. (a) | | | 29,500 | |
| | | | | | | | 206,309 | |
| Household Durables—6.7% | | | | |
| | 5,000 | | | Garmin, Ltd. | | | 175,400 | |
| | 3,200 | | | Helen of Troy, Ltd. (a) | | | 111,616 | |
| | 3,000 | | | Jarden Corp. (a) | | | 135,030 | |
| | | | | | | | 422,046 | |
| Internet & Catalog Retail—4.4% | | | | |
| | 400 | | | priceline.com, Inc. (a) | | | 278,396 | |
| Internet Software & Services—4.2% | | | | |
| | 200 | | | Google, Inc.—Class A (a) | | | 164,914 | |
| | 3,000 | | | Liquidity Services, Inc. (a) | | | 98,700 | |
| | | | | | | | 263,614 | |
| Machinery—16.2% | | | | |
| | 2,500 | | | Chart Industries, Inc. (a) | | | 212,025 | |
| | 1,500 | | | Gardner Denver, Inc. | | | 112,635 | |
| | 2,000 | | | GEA Group AG | | | 67,652 | |
| | 7,000 | | | Manitex International, Inc. (a) | | | 70,910 | |
| Shares | | | Security
Description | | Value | |
| | | | | | | | | |
| Common Stocks—continued | | | | |
| Machinery—continued | | | | |
| | 3,500 | | | Proto Labs, Inc. (a) | | $ | 178,780 | |
| | 3,000 | | | Snap-On, Inc. | | | 258,600 | |
| | 13,000 | | | Wabash National Corp. (a) | | | 122,590 | |
| | | | | | | | 1,023,192 | |
| Metals & Mining—0.4% | | | | |
| | 1,500 | | | Walter Energy, Inc. | | | 26,880 | |
| Multi-Utilities—1.1% | | | | |
| | 10,000 | | | Just Energy Group, Inc. | | | 67,100 | |
| Oil, Gas & Consumable Fuels—1.9% | | | | |
| | 372 | | | Apache Corp. (b) | | | 27,483 | |
| | 1,500 | | | Murphy Oil Corp. | | | 93,135 | |
| | | | | | | | 120,618 | |
| Paper & Forest Products—3.7% | | | | |
| | 1,300 | | | Domtar Corp. | | | 90,363 | |
| | 3,000 | | | International Paper Co. | | | 140,940 | |
| | | | | | | | 231,303 | |
| Real Estate Investment Trusts (REITs)—0.6% | | | | |
| | 1,102 | | | Walter Investment
Management Corp. (a) | | | 36,983 | |
| Road & Rail—1.3% | | | | |
| | 500 | | | AMERCO | | | 80,350 | |
| Software—6.0% | | | | |
| | 15,000 | | | Callidus Software, Inc. (a) | | | 64,350 | |
| | 20,600 | | | Mitek Systems, Inc. (a) | | | 109,592 | |
| | 4,000 | | | SolarWinds, Inc. (a) | | | 203,400 | |
| | | | | | | | 377,342 | |
| Specialty Retail—2.5% | | | |
| | 3,500 | | | Best Buy Co., Inc. | | | 90,965 | |
| | 2,000 | | | Rent-A-Center, Inc. | | | 69,860 | |
| | | | | | | | 160,825 | |
| Trading Companies & Distributors—1.2% | | | | |
| | 1,500 | | | United Rentals, Inc. (a) | | | 78,915 | |
| | | | | Total Common Stocks
(Cost $4,776,798) | | | 5,372,682 | |
| | | | | | | | | |
Principal
Amount | | | | | | | |
| Short-Term Investments—14.4% | | | | |
| $ | 910,000 | | | State Street Eurodollar
Time Deposit, 0.01% | | | 910,000 | |
| | | | | Total Short-Term Investments
(Cost $910,000) | | | 910,000 | |
Total Investments
(Cost $5,686,798)—99.4% | | | 6,282,682 | |
Other Assets in Excess
of Liabilities—0.6% | | | 36,194 | |
| TOTAL NET ASSETS 100.0% | | $ | 6,318,876 | |
Percentages are stated as a percent of net assets.
| (a) | Non-income producing security. |
| | |
| (b) | All or a portion of the security is available to serve as collateral on the line of credit. |
AG—Aktiengesellschaft is a German term that refers to a corporation that is limited by shares, i.e., owned by shareholders.
PLC—Public Limited Company
The accompanying notes are an integral part of these financial statements.
59
Alpine Foundation Fund
Schedule of Portfolio Investments
April 30, 2013 (Unaudited)
| Shares | | | Security
Description | | Value | |
| | | | |
| Common Stocks—67.3% | | | | |
| Aerospace & Defense—1.9% | | | | |
| | 15,000 | | | The Boeing Co. | | $ | 1,371,150 | |
| Auto Components—0.6% | | | | |
| | 16,800 | | | Cooper Tire & Rubber Co. | | | 418,152 | |
| Chemicals—3.4% | | | | |
| | 6,265 | | | Ashland, Inc. | | | 533,841 | |
| | 20,000 | | | E.I. duPont de Nemours & Co. | | | 1,090,200 | |
| | 12,000 | | | Eastman Chemical Co. | | | 799,800 | |
| | | | | | | | 2,423,841 | |
| Commercial Banks—3.6% | | | | |
| | 5,000 | | | PNC Financial Services Group, Inc. | | | 339,400 | |
| | 8,675 | | | Southside Bancshares, Inc. | | | 185,474 | |
| | 35,000 | | | Sun Bancorp, Inc. (a) | | | 112,700 | |
| | 7,293 | | | Susquehanna Bancshares, Inc. | | | 85,109 | |
| | 34,728 | | | Valley National Bancorp | | | 312,205 | |
| | 10,000 | | | Washington Trust Bancorp, Inc. | | | 267,500 | |
| | 34,501 | | | Webster Financial Corp. | | | 806,288 | |
| | 10,432 | | | Wells Fargo & Co. | | | 396,207 | |
| | | | | | | | 2,504,883 | |
| Commercial Services & Supplies—1.7% | | | | |
| | 20,000 | | | Deluxe Corp. | | | 762,800 | |
| | 10,888 | | | Iron Mountain, Inc. | | | 412,220 | |
| | | | | | | | 1,175,020 | |
| Computers & Peripherals—1.7% | | | | |
| | 2,000 | | | Apple, Inc. | | | 885,500 | |
| | 14,000 | | | Hewlett-Packard Co. | | | 288,400 | |
| | | | | | | | 1,173,900 | |
| Diversified Financial Services—6.5% | | | | |
| | 63,041 | | | Bank of America Corp. | | | 776,035 | |
| | 14,367 | | | Citigroup, Inc. | | | 670,364 | |
| | 10,000 | | | CME Group, Inc. | | | 608,600 | |
| | 45,600 | | | JPMorgan Chase & Co. | | | 2,234,856 | |
| | 20,406 | | | Medallion Financial Corp. | | | 304,866 | |
| | | | | | | | 4,594,721 | |
| Diversified Telecommunication Services—0.6% | | | | |
| | 66,185 | | | TeliaSonera AB | | | 455,357 | |
| Electric Utilities—1.4% | | | | |
| | 10,000 | | | First Energy Corp. | | | 466,000 | |
| | 17,800 | | | Hawaiian Electric Industries, Inc. | | | 503,740 | |
| | | | | | | | 969,740 | |
| Electrical Equipment—0.5% | | | | |
| | 4,300 | | | Preformed Line Products Co. | | | 346,150 | |
| Food & Staples Retailing—2.3% | | |
| | 15,000 | | | CVS Caremark Corp. | | | 872,700 | |
| | 15,000 | | | Walgreen Co. | | | 742,650 | |
| | | | | | | | 1,615,350 | |
| Food Products—1.0% | | | | |
| | 10,000 | | | H.J. Heinz Co. | | | 724,200 | |
| Gas Utilities—0.3% | | | | |
| | 5,400 | | | Northwest Natural Gas Co. | | | 240,138 | |
| Health Care Equipment & Supplies—1.2% | | | | |
| | 8,600 | | | Becton, Dickinson & Co. | | | 810,980 | |
| Health Care Providers & Services—0.6% | | | | |
| | 4,000 | | | McKesson Corp. | | | 423,280 | |
| Household Durables—1.6% | | | | |
| | 28,000 | | | Lennar Corp.—Class A | | | 1,154,160 | |
| Shares | | | Security
Description | | Value | |
| | | | | | | |
| Common Stocks—continued | | | | |
| Household Products—1.0% | | | | |
| | 4,000 | | | Colgate-Palmolive Co. | | $ | 477,640 | |
| | 3,000 | | | The Clorox Co. | | | 258,750 | |
| | | | | | | | 736,390 | |
| Industrial Conglomerates—2.4% | | | | |
| | 74,600 | | | General Electric Co. | | | 1,662,834 | |
| Insurance—1.2% | | | | |
| | 5,000 | | | The Chubb Corp. | | | 440,350 | |
| | 10,000 | | | Validus Holdings, Ltd. | | | 386,100 | |
| | | | | | | | 826,450 | |
| IT Services—3.4% | | | | |
| | 5,000 | | | Accenture PLC—Class A | | | 407,200 | |
| | 10,000 | | | International Business
Machines Corp. | | | 2,025,400 | |
| | | | | | | | 2,432,600 | |
| Machinery—1.5% | | | | |
| | 5,000 | | | Caterpillar, Inc. | | | 423,350 | |
| | 9,000 | | | Joy Global, Inc. | | | 508,680 | |
| | 10,000 | | | Wabash National Corp. (a) | | | 94,300 | |
| | | | | | | | 1,026,330 | |
| Media—1.4% | | | | |
| | 7,692 | | | CBS Corp.-Class B | | | 352,140 | |
| | 20,000 | | | Cinemark Holdings, Inc. | | | 617,800 | |
| | | | | | | | 969,940 | |
| Multi-Utilities—0.5% | | | | |
| | 50,000 | | | Just Energy Group, Inc. | | | 335,500 | |
| Multiline Retail—0.6% | | | | |
| | 10,000 | | | Macy’s, Inc. | | | 446,000 | |
| Oil, Gas & Consumable Fuels—4.3% | | | | |
| | 9,000 | | | Cenovus Energy, Inc. | | | 269,460 | |
| | 51,500 | | | CONSOL Energy, Inc. | | | 1,732,460 | |
| | 5,000 | | | Murphy Oil Corp. | | | 310,450 | |
| | 17,547 | | | World Fuel Services Corp. | | | 711,531 | |
| | | | | | | | 3,023,901 | |
| Paper & Forest Products—0.5% | | | | |
| | 5,000 | | | Domtar Corp. | | | 347,550 | |
| Pharmaceuticals—4.5% | | | | |
| | 7,000 | | | Abbott Laboratories | | | 258,440 | |
| | 7,000 | | | AbbVie, Inc. | | | 322,350 | |
| | 27,000 | | | Johnson & Johnson | | | 2,301,210 | |
| | 8,000 | | | Teva Pharmaceutical
Industries, Ltd.—ADR | | | 306,320 | |
| | | | | | | | 3,188,320 | |
| Real Estate Investment Trusts—13.0% | | | | |
| | 10,000 | | | American Capital Agency Corp. | | | 333,100 | |
| | 13,000 | | | Boston Properties, Inc. | | | 1,422,590 | |
| | 100,000 | | | CBL & Associates Properties, Inc. | | | 2,414,000 | |
| | 13,804 | | | DDR Corp. | | | 253,165 | |
| | 5,669 | | | ProLogis, Inc. | | | 237,814 | |
| | 977 | | | Silver Bay Realty Trust Corp. | | | 18,632 | |
| | 23,823 | | | Simon Property Group, Inc. | | | 4,242,162 | |
| | 20,000 | | | Two Harbors Investment Corp. | | | 239,600 | |
| | | | | | | | 9,161,063 | |
| Road & Rail—0.3% | | | | |
| | 1,500 | | | AMERCO | | | 241,050 | |
The accompanying notes are an integral part of these financial statements.
60
Alpine Foundation Fund
Schedule of Portfolio Investments—Continued
April 30, 2013 (Unaudited)
| Shares | | | Security
Description | | Value | |
| | | | | | | | | |
| Common Stocks—continued | | | | |
| Specialty Retail—0.8% | | | | |
| | 5,000 | | | Brown Shoe Co., Inc. | | $ | 84,550 | |
| | 9,000 | | | Williams-Sonoma, Inc. | | | 483,120 | |
| | | | | | | | 567,670 | |
| Textiles, Apparel & Luxury Goods—1.8% | | | | |
| | 5,000 | | | PVH Corp. | | | 577,050 | |
| | 4,000 | | | VF Corp. | | | 712,880 | |
| | | | | | | | 1,289,930 | |
| Thrifts & Mortgage Finance—0.1% | | | | |
| | 6,500 | | | New York Community Bancorp, Inc. | | | 88,075 | |
| Trading Companies & Distributors—1.1% | | | | |
| | 3,000 | | | WW Grainger, Inc. | | | 739,410 | |
| | | | | Total Common Stocks
(Cost $38,408,315) | | | 47,484,035 | |
Principal
Amount | | | Security
Description | | Value | |
| | | | | | | | | |
| Bonds—24.5% | | | | |
| U.S. Treasury Bonds—24.5% | | | | |
| $ | 6,000,000 | | | 6.000%, 02/15/2026 | | $ | 8,699,064 | |
| | 4,000,000 | | | 5.250%, 11/15/2028 | | | 5,551,248 | |
| | 3,000,000 | | | 3.000%, 05/15/2042 | | | 3,071,718 | |
| | | | | | | | 17,322,030 | |
| | | | | Total Bonds
(Cost $14,868,116) | | | 17,322,030 | |
| Short-Term Investments—8.5% | | | | |
| $ | 5,996,000 | | | State Street Eurodollar
Time Deposit, 0.01% | | | 5,996,000 | |
| | | | | Total Short-Term Investments
(Cost $5,996,000) | | | 5,996,000 | |
Total Investments
(Cost $59,272,431)—100.3% | | | 70,802,065 | |
Liabilities in Excess of
Other Assets—(0.3)% | | | (193,004 | ) |
| TOTAL NET ASSETS 100.0% | | $ | 70,609,061 | |
Percentages are stated as a percent of net assets.
| (a) | Non-income producing security. |
AB—Aktiebolag is the Swedish equivalent of a corporation.
ADR—American Depositary Receipt
PLC—Public Limited Company
The accompanying notes are an integral part of these financial statements.
61
Alpine Ultra Short Tax Optimized Income Fund
Schedule of Portfolio Investments
April 30, 2013 (Unaudited)
Principal
Amount | | | Security
Description | | Value | |
| | | | | | |
| Municipal Bonds—103.7% | | | | |
| Alabama—1.9% | | | | |
| $ | 4,900,000 | | | Chatom Industrial Development
Board Gulf Opportunity Zone
Revenue, Powersouth Energy
Cooperative-Series A, VRDN
0.550%, 11/15/2038
(Putable on 05/15/2013) (a) | | $ | 4,900,049 | |
| | 2,000,000 | | | Chatom Industrial Development
Board Pollution Control Revenue,
Electric-Series C, VRDN
0.550%, 12/01/2024
(Putable on 06/01/2013) (a) | | | 2,000,020 | |
| | 5,750,000 | | | Mobile Downtown Redevelopment
Authority Revenue, Lafayette
Plaza Hotel Project-Series A,
VRDN (LOC: Regions Bank)
0.680%, 05/01/2032
(Putable on 05/07/2013) (a) | | | 5,750,000 | |
| | 3,952,000 | | | State Housing Finance Authority
Revenue, Multi-Family Housing
Revenue, Phoenix Apartments
Project-Series A, VRDN
(LOC: Regions Bank)
0.870%, 01/01/2036
(Putable on 05/07/2013) (a) | | | 3,952,000 | |
| | 8,365,000 | | | State Port Authority Docks
Facilities Revenue, VRDN
(CS: NATL-RE)
0.750%, 10/01/2024
(Putable on 05/07/2013) (a) | | | 8,365,000 | |
| | 1,795,000 | | | The Medical Clinic Board of the
City of Gulf Shores Revenue,
Colonial Pinnacle MOB Project,
VRDN (LOC: Regions Bank)
0.600%, 07/01/2034
(Putable on 05/07/2013) (a) | | | 1,795,000 | |
| | | | | | | | 26,762,069 | |
| Arizona—6.2% | | | | |
| | 19,000,000 | | | Cochise County Pollution Control
Corp. Revenue, Arizona Electric
Power Cooperative, Inc. Project,
VRDN
(CS: National Rural Utilities Corp.)
0.600%, 09/01/2024
(Putable on 09/01/2013) (a) | | | 19,000,000 | |
| | 4,120,000 | | | Coconino County Pollution Control
Corp. Revenue, Arizona Public
Services Navajo-Series A, VRDN
(CS: Arizona Public Service Corp.)
3.625%, 10/01/2029
(Putable on 07/13/2013) (a) | | | 4,135,903 | |
| | 40,000,000 | | | Phoenix Industrial Development
Authority Solid Waste Revenue,
Republic Services, Inc. Project,
VRDN 0.580%, 12/01/2035
(Putable on 05/01/2013) (a) | | | 40,000,000 | |
| | 850,000 | | | State Health Facilities Authority
Hospital System Revenue,
Phoenix Children’s Hospital,
Series A
(CS: Phoenix Children’s Hospital)
2.000%, 02/01/2015 | | | 861,110 | |
Principal
Amount | | | Security
Description | | Value | |
| | | | | | | |
| Municipal Bonds—continued | | | | |
| Arizona—continued | | | | |
| $ | 16,520,000 | | | State Health Facilities Authority
Revenue, The Terraces, VRDN
(LOC: Sovereign Bank N.A.)
0.910%, 12/01/2037
(Putable on 05/07/2013) (a) | | $ | 16,520,000 | |
| | 5,140,000 | | | Yavapai County Industrial
Development Authority Solid
Waste Disposal Revenue,
Waste Management, Inc.
Project, Series A-2, VRDN
0.850%, 03/01/2028
(Putable on 03/03/2014) (a) | | | 5,141,285 | |
| | | | | | | | 85,658,298 | |
| Arkansas—0.7% | | | | |
| | 4,910,000 | | | Pulaski County Public Facilities
Board Revenue, Anthony School,
VRDN (LOC: Regions Bank)
0.680%, 06/01/2033
(Putable on 05/07/2013) (a) | | | 4,910,000 | |
| | 5,200,000 | | | State Development Finance
Authority, Capri Apartments—
Series F, VRDN
(LOC: Regions Bank)
0.870%, 10/01/2030
(Putable on 05/07/2013) (a) | | | 5,200,000 | |
| | | | | | | | 10,110,000 | |
| California—9.2% | | | | |
| | | | | ABAG Finance Authority for
Nonprofit Corp., Episcopal Senior
Communities-Series B | | | | |
| | 275,000 | | | 2.000%, 07/01/2013 | | | 275,643 | |
| | 670,000 | | | 2.000%, 07/01/2014 | | | 679,661 | |
| | 820,000 | | | 3.000%, 07/01/2015 | | | 855,326 | |
| | 2,825,000 | | | California Infrastructure & Economic
Development Bank Revenue,
Westside Waldorf School Project,
VRDN (LOC: California Bank & Trust)
0.570%, 10/01/2028
(Putable on 05/07/2013) (a) | | | 2,825,000 | |
| | 5,500,000 | | | City of Los Angeles Multifamily
Housing Revenue, Masselin
Manor Project-Series J, VRDN
(LOC: Bank of America N.A.)
0.540%, 07/01/2015
(Putable on 05/07/2013) (a) | | | 5,500,000 | |
| | 6,700,000 | | | Oak Park Unified School District,
Tax & Revenue Anticipation
Notes—Series A
3.500%, 05/01/2013 | | | 6,700,000 | |
| | 2,875,000 | | | Palomar Pomerado Health Care—
Series A, ARN
(CS: Assured Guaranty Municipal)
0.650%, 11/01/2036 (a) | | | 2,875,000 | |
| | 2,950,000 | | | Palomar Pomerado Health Care—
Series B, ARN
(CS: Assured Guaranty Municipal)
0.650%, 11/01/2036 (a) | | | 2,950,000 | |
The accompanying notes are an integral part of these financial statements.
62
Alpine Ultra Short Tax Optimized Income Fund
Schedule of Portfolio Investments—Continued
April 30, 2013 (Unaudited)
Principal
Amount | | | Security
Description | | Value | |
| | | | | | | |
| Municipal Bonds—continued | | | | |
| California—continued | | | | |
| $ | 2,050,000 | | | Palomar Pomerado Health Care—
Series C, ARN
(CS: Assured Guaranty Municipal)
0.600%, 11/01/2036 (a) | | $ | 2,050,000 | |
| | 645,000 | | | Riverside County Public Financing
Authority Lease Revenue,
County Facilities Projects
3.000%, 05/01/2013 | | | 645,000 | |
| | 27,610,000 | | | State Community College Financing
Authority Tax & Revenue
Anticipation Notes—Series C
2.500%, 06/28/2013 | | | 27,672,951 | |
| | 370,000 | | | State Health Facilities Financing
Authority Revenue, Children’s
Hospital of Los Angeles—Series A
5.000%, 11/15/2015 | | | 404,299 | |
| | 22,000,000 | | | State Pollution Control Finance
Authority Solid Waste Revenue,
Republic Services, Inc.—Series A, VRDN
(CS: Republic Services, Inc.)
0.600%, 08/01/2023
(Putable on 08/01/2013) (a) | | | 22,000,000 | |
| | 2,000,000 | | | State Pollution Control Financing
Authority, Solid Waste Disposal
Revenue—Series A, VRDN
(CS: Waste Management, Inc.)
0.850%, 11/01/2038
(Putable on 05/01/2014) (a) | | | 2,000,000 | |
| | 3,000,000 | | | State Pollution Control Financing
Authority, Solid Waste Disposal
Revenue, P & D Dairy and Poso
Creek Family Dairy, LLC Project,
VRDN (LOC: Bank of the West)
1.420%, 05/01/2028
(Putable on 05/07/2013) (a) | | | 3,000,000 | |
| | | | | State Statewide Communities
Development Authority Ltd.
Obligation Revenue,
Bakersfield Reassessment
District | | | | |
| | 2,000,000 | | | 2.000%, 09/02/2013 | | | 2,006,240 | |
| | 1,935,000 | | | 2.000%, 09/02/2014 | | | 1,946,668 | |
| | | | | State Statewide Communities
Development Authority Revenue,
Episcopal Communities & Services | | | | |
| | 200,000 | | | 2.000%, 05/15/2013 | | | 200,068 | |
| | 540,000 | | | 2.000%, 05/15/2014 | | | 544,477 | |
| | 545,000 | | | 3.000%, 05/15/2015 | | | 562,865 | |
| | 20,500,000 | | | Stockton Public Financing Authority
Water Revenue, Delta Water
Supply Project-Series A, VRDN
(LOC: Union Bank)
0.700%, 10/01/2040
(Putable on 05/07/2013) (a) | | | 20,500,000 | |
| | 6,000,000 | | | Twin Rivers Unified School District,
Certificate of Participation,
School Facility Bridge Program
(CS: Assured Guaranty)
3.500%, 06/01/2035
(Putable on 05/31/2013) (a) | | | 6,014,160 | |
Principal
Amount | | | Security
Description | | Value | |
| | | | | | | |
| Municipal Bonds—continued | | | | |
| California—continued | | | | |
| $ | 10,000,000 | | | Twin Rivers Unified School District,
School Facilities Boarding Program
(CS: Assured Guaranty)
3.500%, 06/01/2027
(Putable on 05/31/2013) (a) | | $ | 10,023,600 | |
| | 4,000,000 | | | Twin Rivers Unified School District,
School Facilities Boarding Program,
VRDN (CS: Assured Guaranty)
3.500%, 06/01/2041
(Putable on 05/31/2013) (a) | | | 4,009,440 | |
| | | | | | | | 126,240,398 | |
| Colorado—2.1% | | | | |
| | 9,490,000 | | | Arkansas River Power Authority
Power Revenue, VRDN
(CS: XLCA, LIQ FAC: Dexia Credit)
0.700%, 10/01/2026
(Putable on 05/07/2013) (a) | | | 9,490,000 | |
| | 1,355,000 | | | State Health Facilities Authority
Revenue, Covenant Retirement
Communities, Inc.—Series C
2.000%, 12/01/2013 | | | 1,362,940 | |
| | 350,000 | | | State Health Facilities Authority
Revenue, National Jewish
Health Project
4.000%, 01/01/2014 | | | 355,565 | |
| | 17,165,000 | | | Traer Creek Metropolitan District
Revenue, In the Town of Avon,
VRDN (LOC: BNP Paribas)
1.000%, 10/01/2021
(Putable on 05/07/2013) (a) | | | 17,165,000 | |
| | | | | | | | 28,373,505 | |
| Connecticut—0.2% | | | | |
| | | | | City of West Haven, General
Obligation Bond | | | | |
| | 550,000 | | | 4.000%, 08/01/2013 | | | 553,245 | |
| | 145,000 | | | 4.000%, 08/01/2014 | | | 149,122 | |
| | 2,050,000 | | | City of West Haven, General
Obligation Bond, Anticipation
Notes 3.000%, 05/30/2013 | | | 2,051,702 | |
| | | | | | | | 2,754,069 | |
| Florida—5.2% | | | | |
| | 1,000,000 | | | Citizens Property Insurance Corp.
Revenue, High-Risk Account
Senior Secured Bonds-Series A3,
VRDN
1.970%, 06/01/2013 (a) | | | 1,001,190 | |
| | | | | City of Tampa Hospital Refunding
Revenue, H. Lee Moffitt Cancer
Center Project-Series B | | | | |
| | 140,000 | | | 2.500%, 07/01/2013 | | | 140,419 | |
| | 250,000 | | | 3.000%, 07/01/2014 | | | 255,785 | |
| | | | | Cityplace Community Development
District Special Assessment Revenue | | | | |
| | 250,000 | | | 5.000%, 05/01/2013 | | | 250,000 | |
| | 34,075,000 | | | Miami-Dade County Expressway
Authority Toll System Revenue,
Series DCL-2012-005,
VRDN (CS: AMBAC)
0.850%, 05/20/2029
(Putable on 06/13/2013) (a) | | | 34,075,000 | |
The accompanying notes are an integral part of these financial statements.
63
Alpine Ultra Short Tax Optimized Income Fund
Schedule of Portfolio Investments—Continued
April 30, 2013 (Unaudited)
| Principal Amount | | | Security
Description | | Value | |
| | | | | | | |
| Municipal Bonds—continued |
| Florida—continued |
| $ | 1,000,000 | | | Miami-Dade County Industrial
Development Authority Revenue,
Waste Management, Inc., VRDN
(CS: Waste Management, Inc.)
2.625%, 08/01/2023
(Putable on 08/01/2014) (a) | | $ | 1,021,670 | |
| | 400,000 | | | Palm Beach County Health Facilities
Authority Revenue, Jupiter
Medical Center, Inc. Project—
Series A (CS: Jupiter Medical
Center Obligation Group)
2.000%, 11/01/2013 | | | 402,524 | |
| | 33,290,000 | | | Puttable Floating Option Tax-Exempt
Receipts, Certificate of Participation,
Series 4615, VRDN
(CS: Dexia Credit Local;
LIQ FAC: Dexia Credit Local)
0.670%, 08/01/2029
(Putable on 05/07/2013) (a) | | | 33,290,000 | |
| | 700,000 | | | Saint Johns County Industrial
Development Authority,
Coastal Health Care Investor,
VRDN (LOC: SunTrust Bank)
2.750%, 12/01/2016
(Putable on 05/07/2013) (a) | | | 700,000 | |
| | 155,000 | | | State Higher Educational Facilities
Financial Authority Revenue,
Nova Southeastern University
Project—Series A
(CS: Nova Southeastern University)
3.000%, 04/01/2014 | | | 157,520 | |
| | 300,000 | | | State Higher Educational Facilities
Financing Authority Revenue,
The University of Tampa
Project—Series A
4.000%, 04/01/2014 | | | 308,058 | |
| | | | | | | 71,602,166 | |
| Georgia—1.8% |
| | 1,100,000 | | | Douglas County Development
Authority Revenue, Electrical
Fiber Systems, VRDN
(LOC: Regions Bank)
0.980%, 12/01/2021
(Putable on 05/07/2013) (a) | | | 1,100,000 | |
| | 11,200,000 | | | Gwinnett County Housing
Authority Multi-Family Housing
Revenue, Palisades Apartments
Project, VRDN
(LOC: SunTrust Bank)
0.510%, 03/01/2041
(Putable on 05/07/2013) (a) | | | 11,200,000 | |
| | 500,000 | | | Main Street Natural Gas, Inc.,
Gas Project Revenue—Series
B 5.000%, 03/15/2014 | | | 518,320 | |
| | 1,725,000 | | | Rome-Floyd County Development
Authority Revenue, Steel King
Industries, Inc., VRDN
(LOC: Bank of Montreal)
0.860%, 07/01/2020
(Putable on 05/07/2013) (a) | | | 1,725,000 | |
Principal
Amount | | | Security
Description | | Value | |
| | | | | | | | | |
| Municipal Bonds—continued |
| Georgia—continued |
| $ | 215,000 | | | Union City Water & Sewerage
Revenue
2.000%, 07/01/2013 | | $ | 215,396 | |
| | 9,430,000 | | | Walker Dade & Catoosa Counties
Hospital Authority, Anticipation
Certificates, Hutcheson Medical,
VRDN (LOC: Regions Bank)
0.600%, 10/01/2028
(Putable on 05/07/2013) (a) | | | 9,430,000 | |
| | | | | | | | 24,188,716 | |
| Hawaii—0.2% |
| | 2,750,000 | | | State Housing Finance &
Development Corp., Multifamily
Housing Revenue, Wilikina
Apartments Project—Series B
1.000%, 06/01/2014
(Putable on 06/01/2013) | | | 2,750,083 | |
| Illinois—10.8% |
| | 35,480,000 | | | Chicago Board of Education,
Series—DCL-2012-001, VRDN
(LOC: Dexia Credit Local)
0.953%, 12/01/2034 (a) | | | 35,480,000 | |
| | 800,000 | | | Chicago Transit Authority Capital
Grant Receipts Revenue
(CS: AMBAC)
5.000%, 06/01/2013 | | | 802,744 | |
| | 2,515,000 | | | City of Granite City Solid Waste
Disposal Revenue, Waste
Management, Inc. Project, VRDN
(CS: Waste Management, Inc.)
0.850%, 05/01/2027
(Putable on 05/01/2014) (a) | | | 2,515,000 | |
| | 4,400,000 | | | Springfield Airport Authority,
Allied-Signal, Inc., VRDN
(CS: Honeywell Int.)
5.000%, 09/01/2018
(Putable on 05/07/2013) (a) | | | 4,400,000 | |
| | 2,350,000 | | | State Development Finance
Authority Industrial Development
Revenue, Durex Industries Project,
VRDN (LOC: RBS Citizens N.A.)
0.670%, 12/01/2023
(Putable on 05/07/2013) (a) | | | 2,350,000 | |
| | 2,700,000 | | | State Finance Authority Industrial
Development Revenue, Metform,
LLC Project, VRDN
(LOC: Bank of America N.A.)
0.510%, 05/01/2014
(Putable on 05/07/2013) (a) | | | 2,700,000 | |
| | 1,100,000 | | | State Finance Authority Revenue
(CS: Assured Guaranty Municipal)
5.000%, 08/15/2013 | | | 1,111,792 | |
| | 1,700,000 | | | State Finance Authority Revenue,
Silver Cross Hospital and Medical
Centers—Series A
(CS: Assured Guaranty Municipal)
5.000%, 08/15/2013 | | | 1,718,224 | |
The accompanying notes are an integral part of these financial statements.
64
Alpine Ultra Short Tax Optimized Income Fund
Schedule of Portfolio Investments—Continued
April 30, 2013 (Unaudited)
Principal
Amount | | | Security
Description | | Value | |
| | | | | | | | | |
| Municipal Bonds—continued |
| Illinois—continued |
| $ | 10,460,000 | | | State Finance Authority Revenue,
The Landing at Plymouth Place
Project—Series B, VRDN
(LOC: Sovereign Bank N.A.)
0.910%, 05/15/2037
(Putable on 05/07/2013) (a) | | $ | 10,460,000 | |
| | 68,300,000 | | | State General Obligation
Unlimited—Series B, VRDN
(SPA: DEPFA Bank PLC)
2.000%, 10/01/2033
(Putable on 05/07/2013) (a) | | | 68,300,000 | |
| | 12,400,000 | | | State Toll Highway Authority
Revenue,—Series A-1B, VRDN
(SPA: PNC Bank NA)
0.510%, 01/01/2031
(Putable on 05/07/2013) (a) | | | 12,400,000 | |
| | 7,000,000 | | | State Toll Highway Authority
Revenue,—Series A-2, VRDN
(CS: Assured Guaranty Municipal)
0.550%, 01/01/2031
(Putable on 05/07/2013) (a) | | | 7,000,000 | |
| | | | | | | | 149,237,760 | |
| Indiana—5.7% | |
| | 1,000,000 | | | City of Indianapolis Industrial
Development Revenue,
Joint Clutch Service, VRDN
(LOC: PNC Bank N.A.)
1.390%, 12/01/2014 (a) | | | 1,000,000 | |
| | | | | City of Terre Haute Sanitation District | | | | |
| | 3,005,000 | | | 4.000%, 07/01/2013 | | | 3,018,462 | |
| | 3,065,000 | | | 4.000%, 01/01/2014 | | | 3,115,787 | |
| | 60,000,000 | | | Reset Optional Certificates
Trust II-R Revenue, VRDN
(LIQ FAC; Guaranty Agreement:
CitiGroup Financial)
1.000%, 10/26/2017
(Putable on 05/07/2013) (a) | | | 60,000,000 | |
| | 5,000,000 | | | State Finance Authority Economic
Development Revenue, Republic
Services, Inc.—Series A, VRDN
0.500%, 05/01/2034
(Putable on 06/03/2013) (a) | | | 4,999,550 | |
| | 6,235,000 | | | State Finance Authority
Environmental Improvement
Revenue, Mittal Steel USA, Inc.,
Project, VRDN
(LOC: Bano Bilbao Vizcaya)
0.600%, 08/01/2030
(Putable on 05/07/2013) (a) | | | 6,235,000 | |
| | | | | | | | 78,368,799 | |
| Iowa—0.2% |
| | 1,180,000 | | | Coralville General Obligation
Annual Appropriation Urban
Renewal Refunding Bond—
Series D-1
2.000%, 06/01/2013 | | | 1,180,755 | |
Principal
Amount | | | Security
Description | | Value | |
| | | | | | | | | |
| Municipal Bonds—continued |
| Iowa—continued |
| $ | 1,500,000 | | | State Higher Education Loan
Authority Revenue, Anticipation
Notes, Private Education Working
Capital Loan Program, Dubuque
University—Series A
3.000%, 05/16/2013 | | $ | 1,500,975 | |
| | | | | | | | 2,681,730 | |
| Kansas—0.1% |
| | 1,000,000 | | | City of Dodge City Industrial
Development Revenue, Farmland
National Beef Packing Co.,
L.P. Project, VRDN
(LOC: Rabobank Int.)
1.420%, 03/01/2027
(Putable on 05/07/2013) (a) | | | 1,000,000 | |
| | 1,000,000 | | | City of Liberal Industrial
Development Revenue, Farmland
National Beef Packing Co.,
L.P. Project, VRDN
(LOC: Rabobank Int.)
1.420%, 02/01/2029
(Putable on 05/07/2013) (a) | | | 1,000,000 | |
| | | | | | | | 2,000,000 | |
| Kentucky—1.7% |
| | 2,000,000 | | | Lexington-Fayette Urban County
Government Revenue, Richmond
Place Associates, L.P Project, VRDN
(LOC: Bank of America N.A.)
0.650%, 04/01/2015
(Putable on 04/01/2014) (a) | | | 2,000,000 | |
| | 5,000,000 | | | Pikeville Educational Facilities
Revenue, Bond Anticipation Notes
(CS: USDA) 4.000%, 05/01/2013 | | | 5,000,000 | |
| | 6,500,000 | | | Pulaski County Solid Waste
Disposal Revenue, National Rural
Utilities—East Kentucky Power—
Series B, VRDN
(CS: National Rural Utilities Corp.)
0.600%, 08/15/2023
(Putable on 08/15/2013) (a) | | | 6,500,000 | |
| | 9,300,000 | | | Warren County Hospital Refunding
and Revenue, Bowling Green-
Warren County Community Hospital
Corporation Project, VRDN
(CS: Bowling Green-Warren Hospital,
SPA: Branch Banking & Trust)
0.450%, 04/01/2037
(Putable on 05/07/2013) (a) | | | 9,300,000 | |
| | | | | | | | 22,800,000 | |
| Louisiana—3.5% |
| | 15,000,000 | | | Ascension Parish Industrial
Development Board, Inc. Revenue,
Impala Warehousing (US)
LLC Project, VRDN
(LOC: Natixis)
0.530%, 12/01/2041
(Putable on 05/07/2013) (a) | | | 15,000,000 | |
The accompanying notes are an integral part of these financial statements.
65
Alpine Ultra Short Tax Optimized Income Fund
Schedule of Portfolio Investments—Continued
April 30, 2013 (Unaudited)
Principal
Amount | | | Security
Description | | Value | |
| | | | | | | | | |
| Municipal Bonds—continued |
| Louisiana—continued |
| $ | 4,750,000 | | | Donaldsonville Industrial
Development Revenue,
Chef John Folse & Co., Inc.—
Series A, VRDN
(LOC: Regions Bank)
2.480%, 02/01/2027
(Putable on 05/07/2013) (a) | | $ | 4,750,000 | |
| | 1,785,000 | | | North Webster Parish Industrial
Development Revenue,
CSP Project, VRDN
(LOC: Regions Bank)
2.720%, 09/01/2021
(Putable on 05/07/2013) (a) | | | 1,785,000 | |
| | 1,720,000 | | | Ouachita Parish Industrial
Development Board, Garrett
Manufacturing LLC, VRDN
(LOC: Regions Bank)
0.980%, 12/01/2016
(Putable on 05/07/2013) (a) | | | 1,720,000 | |
| | 18,500,000 | | | Plaquemines Port Harbor & Terminal
District Revenue, International
Marine Terminal Project—Series A,
VRDN (LOC: Wells Fargo Bank N.A.)
1.000%, 03/15/2025
(Putable on 03/17/2014) (a) | | | 18,501,480 | |
| | 250,000 | | | State Citizens Property Insurance
Corp. Assessment Revenue,
2.000%, 06/01/2014 | | | 252,593 | |
| | 2,050,000 | | | State Housing Finance Agency
Revenue, Multifamily Housing
Restoration—Series A, VRDN
(LOC: Regions Bank)
0.920%, 12/01/2032
(Putable on 05/07/2013) (a) | | | 2,050,000 | |
| | 2,740,000 | | | State Public Facilities Authority
Revenue, Equipment & Capital
Facilities Pooled—Loan B, VRDN
(CS: Capital One; LOC:
Hibernia National Bank)
0.800%, 07/01/2033
(Putable on 05/07/2013) (a) | | | 2,740,000 | |
| | 1,200,000 | | | State Public Facilities Authority
Revenue, Equipment & Capital
Facilities Pooled—Series B, VRDN
(CS: Capital One; LOC:
Hibernia National Bank)
0.800%, 07/01/2033
(Putable on 05/07/2013) (a) | | | 1,200,000 | |
| | | | | | | | 47,999,073 | |
| Maryland—0.0%* |
| | | | | Maryland Economic Development
Corp. Student Housing Revenue,
Morgan State University Project | | | | |
| | 200,000 | | | 2.000%, 07/01/2013 | | | 200,250 | |
| | 250,000 | | | 3.000%, 07/01/2014 | | | 254,240 | |
| | 100,000 | | | State Economic Development Corp.,
Student Housing Revenue,
Salisbury University Project
2.000%, 06/01/2013 | | | 100,047 | |
| | | | | | | | 554,537 | |
Principal
Amount | | | Security
Description | | Value | |
| | | | | | | | | |
| Municipal Bonds—continued |
| Massachusetts—0.1% | |
| $ | 1,000,000 | | | State Development Finance Agency,
Waste Management, Inc.—
Series B, VRDN
(CS: Waste Management, Inc.)
2.125%, 12/01/2029
(Putable on 12/01/2015) (a) | | $ | 1,030,620 | |
| Michigan—-1.5% |
| | 1,240,000 | | | City of Detroit School District,
School Building and Site
Improvement Refunding—Series A
(CS: Qualified School Board
Loan Fund)
3.000%, 05/01/2013 | | | 1,240,000 | |
| | 1,000,000 | | | City of Detroit Sewage Disposal
System Revenue—Series A
5.000%, 07/01/2014 | | | 1,038,580 | |
| | 620,000 | | | City of Detroit Water Supply
System Revenue,
Senior Lien Bond—Series A
5.000%, 07/01/2013 | | | 623,893 | |
| | 250,000 | | | Detroit Wayne County Stadium
Authority Revenue, Wayne
County Limited Tax General
Obligation
5.000%, 10/01/2014 | | | 260,380 | |
| | | | | State Finance Authority Revenue,
Crittenton Hospital Medical
Center—Series A | | | | |
| | 300,000 | | | 3.000%, 06/01/2013 | | | 300,393 | |
| | 1,000,000 | | | 4.000%, 06/01/2014 | | | 1,029,120 | |
| | | | | State Finance Authority Revenue,
Detroit School District | | | | |
| | 500,000 | | | 4.000%, 06/01/2014 | | | 517,630 | |
| | 1,200,000 | | | 5.000%, 06/01/2014 | | | 1,255,164 | |
| | 10,355,000 | | | State Finance Authority Revenue,
Detroit School District,
(CS: Detroit CSD)
5.000%, 06/01/2013 | | | 10,389,586 | |
| | 800,000 | | | State Strategic Fund Limited
Obligations Revenue,
Press-Way, Inc., VRDN
(LOC: Bank One Michigan)
0.610%, 05/01/2018
(Putable on 05/07/2013) (a) | | | 800,000 | |
| | 2,800,000 | | | State Strategic Fund Limited
Obligations Revenue,
Waste Management, Inc.
3.200%, 08/01/2027
(Putable on 08/01/2013) (a) | | | 2,818,088 | |
| | | | | | | | 20,272,834 | |
| Mississippi—1.0% |
| | 2,500,000 | | | State Business Finance Corp.,
Gulf Opportunity Zone Revenue,
Coast Electric Power
Association—Series C, VRDN
(SPA: National Rural Utilities
Cooperative Finance Corp.)
0.500%, 05/01/2037
(Putable on 05/01/2013) (a) | | | 2,500,000 | |
The accompanying notes are an integral part of these financial statements.
66
Alpine Ultra Short Tax Optimized Income Fund
Schedule of Portfolio Investments—Continued
April 30, 2013 (Unaudited)
Principal
Amount |
|
| Security
Description |
|
Value |
|
| | | | | | | |
| Municipal Bonds—continued | |
| Mississippi—continued | | |
| $ | 6,495,000 | | | State Business Finance Corp.,
Hattiesburg Clinic Professional
Association Project, VRDN
(LOC: Regions Bank)
0.600%, 11/01/2026
(Putable on 05/07/2013) (a) | | $ | 6,495,000 | |
| | 4,800,000 | | | State Business Finance Corp.,
Tri-State Truck Center, Inc.
Project, VRDN
(LOC: Regions Bank)
0.680%, 03/01/2033
(Putable on 05/07/2013) (a) | | | 4,800,000 | |
| | | | | | | | 13,795,000 | |
| Missouri—0.1% | | | |
| | 1,245,000 | | | State Health & Educational
Facilities Authority Health
Facilities Revenue,
Freeman Health System
5.000%, 02/15/2015 | | | 1,324,780 | |
| Nebraska—0.1% | | | |
| |
| | | Central Plains Energy Project,
Gas Project Revenue
(Project No. 3) | | |
| |
| | 500,000 | | | 3.000%, 09/01/2013 | | | 503,855 | |
| | 655,000 | | | 4.000%, 09/01/2014 | | | 680,938 | |
| | | | | | | | 1,184,793 | |
| Nevada—1.7% | | | |
| | 24,005,000 | | | Clark County, General Obligation
Bond—Series A, VRDN
(SPA: Landesbank
Baden-Wurttemberg)
0.510%, 07/01/2027
(Putable on 05/07/2013) (a) | | | 24,005,000 | |
| New Hampshire—0.1% | | | |
| |
| | | State Health & Education Facilities
Authority Revenue,
Catholic Medical Center | | |
| |
| | 450,000 | | | 3.000%, 07/01/2013 | | | 451,422 | |
| | 1,000,000 | | | 4.000%, 07/01/2014 | | | 1,030,300 | |
| | | | | | | | 1,481,722 | |
| New Jersey—7.8% | | | |
| | 5,000,000 | | | City of Newark, General Obligation
Bond—Series D
2.000%, 12/11/2013 | | | 5,019,200 | |
| | 4,000,000 | | | City of Newark, General Obligation
Notes—Series B
(CS: State Aid Withholding)
2.500%, 06/28/2013 | | | 4,008,560 | |
| | 1,080,000 | | | City of Newark, Special Emergency
Notes—Series G
2.000%, 12/11/2013 | | | 1,085,854 | |
| | 6,000,000 | | | City of Newark, Tax Anticipation
Notes—Series A
1.500%, 02/20/2014 | | | 6,018,180 | |
| | 20,000,000 | | | Hudson County Improvement
Authority Revenue
(CS: Hudson County Guaranty)
1.500%, 08/07/2013 | | | 20,055,600 | |
Principal
Amount |
|
| Security
Description |
|
Value |
|
| | | | | | | |
| Municipal Bonds—continued | | |
| New Jersey—continued | | |
| $ | 3,000,000 | | | State Economic Development
Authority Cigarette Tax Revenue,
5.000%, 06/15/2013 | | $ | 3,016,050 | |
| | 9,890,000 | | | State Economic Development
Authority Revenue, Arbor Glen
of Bridgewater Project, VRDN
(LOC: Sovereign Bank N.A.)
0.880%, 05/15/2033
(Putable on 05/07/2013) (a) | | | 9,890,000 | |
| | 36,300,000 | | | State Economic Development
Authority Revenue, Port Newark
Container Terminal LLC
Project—Series-B, VRDN
(LOC: Sovereign Bank N.A.)
1.600%, 07/01/2030
(Putable on 05/07/2013) (a) | | | 36,300,000 | |
| 480,000
|
|
| State Health Care Facilities
Financing Authority Revenue,
Barnabas Health—Series A
4.000%, 07/01/2015 |
|
|
506,890 |
|
| | 3,035,000 | | | State Health Care Facilities
Financing Authority Revenue,
Barnabas Health Issues—Series A
5.000%, 07/01/2013 | | | 3,057,307 | |
| | 500,000 | | | State Health Care Facilities
Financing Authority Revenue,
Meridian Health System
Obligated Group Issue
4.000%, 07/01/2013 | | | 502,850 | |
| |
| | | State Higher Education Student
Assistance Authority Senior
Student Loan Revenue—Series-1A | | |
| |
| | 300,000 | | | 3.000%, 12/01/2013 | | | 303,480 | |
| | 500,000 | | | 4.000%, 12/01/2014 | | | 521,730 | |
| |
| | | Township of Lyndhurst,
Bond Anticipation Notes | | |
| |
| | 12,954,000 | | | 1.500%, 09/20/2013 | | | 12,984,312 | |
| | 3,320,000 | | | 1.750%, 03/20/2014 | | | 3,342,111 | |
| |
| | | Trenton Parking Authority Revenue,
City Guaranteed-Series A
(CS: Assured Guaranty) | | |
| |
| | 425,000 | | | 1.500%, 04/01/2014 | | | 426,959 | |
| | | | | | | | 107,039,083 | |
| New York—11.0% | | | |
| | 2,945,000 | | | Broome County Industrial
Development Agency Civic
Facility Revenue, Elizabeth
Church Manor Nursing Home
Project, VRDN
(LOC: Sovereign Bank N.A.)
1.700%, 02/01/2029
(Putable on 05/07/2013) (a) | | | 2,945,000 | |
| | 1,185,000 | | | Broome County Industrial
Development Agency Civic
Facility Revenue, Methodist
Homes for the Aging of the
Wyoming Project, VRDN
(LOC: Sovereign Bank N.A.)
1.700%, 02/01/2029
(Putable on 05/07/2013) (a) | | | 1,185,000 | |
The accompanying notes are an integral part of these financial statements.
67
Alpine Ultra Short Tax Optimized Income Fund
Schedule of Portfolio Investments—Continued
April 30, 2013 (Unaudited)
Principal
Amount |
|
| Security
Description |
|
Value |
|
| | | | | | | |
| Municipal Bonds—continued | | |
| New York—continued | | |
| $ | 3,020,000 | | | City of Long Beach General
Obligation Bond
3.000%, 12/20/2013 | | $ | 3,034,707 | |
| |
| | | City of Yonkers General
Obligation Bond-Series A | | |
| |
| | 720,000 | | | 2.000%, 07/01/2013 | | | 721,577 | |
| | 500,000 | | | 2.000%, 07/01/2014 | | | 505,695 | |
| | 1,530,000 | | | 4.000%, 07/01/2015 | | | 1,621,785 | |
| |
| | | City of Yonkers General
Obligation Bond-Series C | | |
| |
| | 1,000,000 | | | 2.000%, 08/15/2014 | | | 1,012,590 | |
| | 1,000,000 | | | 4.000%, 08/15/2015 | | | 1,063,330 | |
| | 2,900,000 | | | Freeport Bond Anticipation | | | | |
| |
| | | Notes—Series A
1.500%, 05/08/2013 | | | 2,900,464 | |
| |
| | | Nassau County Local Economic
Assistance Corp. Revenue,
South Nassau Communities
Hospital Project | | |
| |
| | 620,000 | | | 3.000%, 07/01/2013 | | | 622,133 | |
| | 385,000 | | | 4.000%, 07/01/2014 | | | 399,160 | |
| 1,000,000
|
|
| Nassau County Local Economic
Assistance Corp. Revenue,
Winthrop University Hospital
Association Project
4.000%, 07/01/2014 |
|
|
1,033,000 |
|
| |
| | | New York City Industrial
Development Agency Airport
Facilities Revenue, TrIPs
Obligated Group—Series A | | |
| |
| | 750,000 | | | 5.000%, 07/01/2013 | | | 754,215 | |
| | 1,000,000 | | | 5.000%, 07/01/2014 | | | 1,034,240 | |
| 1,000,000
|
|
| New York City Industrial
Development Agency Civic Facility
Revenue, Cong. Machne Chaim,
Inc. d/b/a Bais Sarah Educational
Center for Girls Project, VRDN
(LOC: Sovereign Bank N.A.)
0.770%, 05/01/2036
(Putable on 05/07/2013) (a) |
|
|
1,000,000 |
|
| | 23,100,000 | | | New York City Municipal Water
Finance Authority, Water and
Sewer System, Second General
Resolution Revenue Bonds—
Series AA-2, VRDN
(SPA: Dexia Credit Local)
0.400%, 06/15/2032
(Putable on 05/01/2013) (a) | | | 23,100,000 | |
| | 2,150,000 | | | Rockland County, Bond
Anticipation Notes—Series A
2.000%, 04/09/2014 | | | 2,154,472 | |
| | 500,000 | | | Rockland County, General
Obligation Bond—Series B
3.000%, 12/15/2014 | | | 512,175 | |
| | 8,000,000 | | | Rockland County, General
Obligation Revenue
Anticipation Notes—Series B
3.750%, 06/28/2013 | | | 8,028,320 | |
| | 6,560,000 | | | Rockland County, Revenue
Anticipation Notes—Series C
2.500%, 09/24/2013 | | | 6,586,109 | |
Principal
Amount |
|
| Security
Description |
|
Value |
|
| | | | | | | |
| Municipal Bonds—continued | | |
| New York—continued | | |
| $ | 18,000,000 | | | Rockland County,
Tax Anticipation Notes
2.250%, 03/14/2014 | | $ | 18,116,820 | |
| |
| | | State Dormitory Authority Revenue,
Long Island University | | |
| |
| | 1,475,000 | | | 3.000%, 09/01/2013 | | | 1,485,251 | |
| | 1,285,000 | | | 3.000%, 09/01/2014 | | | 1,315,879 | |
| | 4,000,000 | | | State Environmental Facilities Corp.
Solid Waste Disposal Revenue,
Waste Management, Inc.
Project, VRDN
1.000%, 05/01/2030
(Putable on 08/01/2013) (a) | | | 4,000,000 | |
| | 2,000,000 | | | Suffolk County,
Bond Anticipation Notes
1.250%, 10/25/2013 | | | 2,008,280 | |
| | 40,000,000 | | | Suffolk County,
Tax Anticipation Notes
2.000%, 08/14/2013 | | | 40,183,600 | |
| | 5,000,000 | | | Suffolk County,
Tax Anticipation Notes—Series III
2.000%, 09/12/2013 | | | 5,029,150 | |
| | 1,250,000 | | | Town of Fishkill, Bond Anticipation
Notes—Series A
3.250%, 07/19/2013 | | | 1,255,812 | |
| | 7,000,000 | | | Town of Oyster Bay,
Budget Notes—Series A
1.250%, 12/13/2013 | | | 7,027,860 | |
| | 5,500,000 | | | Town of Ramapo, Bond Anticipation
Notes—Series B
2.000%, 07/01/2013 | | | 5,512,870 | |
| | 4,345,000 | | | Ulster County Industrial
Development Agency, Civic
Facility Revenue, Kingston
Regional Senior Living Corp.—
Woodland Pond At New Paltz
Project-Series C, VRDN
(LOC: Sovereign Bank N.A.)
0.890%, 09/15/2037
(Putable on 05/07/2013) (a) | | | 4,345,000 | |
| | 500,000 | | | Westchester Tobacco Asset
Securitization Corp.
(CS: Westchester Tobacco)
5.000%, 06/01/2026 | | | 505,680 | |
| | | | | | | | 151,000,174 | |
| North Carolina—0.5% | | | |
| | 6,500,000 | | | Davidson County Industrial
Facilities & Pollution Control
Financing Authority Revenue,
Dieboid, Inc., VRDN
(LOC: Bank of America N.A.)
0.510%, 06/01/2017
(Putable on 05/07/2013) (a) | | | 6,500,000 | |
| Ohio—3.1% | | | |
| | 3,205,000 | | | City of Marysville, Bond
Anticipation Notes, Coleman’s
Crossing Development
2.250%, 08/28/2013 | | | 3,212,852 | |
The accompanying notes are an integral part of these financial statements.
68
Alpine Ultra Short Tax Optimized Income Fund
Schedule of Portfolio Investments—Continued
April 30, 2013 (Unaudited)
Principal
Amount |
|
| Security
Description |
|
Value |
|
| | | | | | | |
| Municipal Bonds—continued | | |
| Ohio—continued | | |
| $ | 1,525,000 | | | City of Marysville, Bond
Anticipation Notes, Roadway
Improvement—City Gate
Development
2.250%, 08/28/2013 | | $ | 1,528,736 | |
| | 7,490,000 | | | Columbus Regional Airport
Authority Revenue, West Bay
Apartments Project, VRDN
(LOC: Sovereign Bank N.A.)
1.200%, 12/01/2034
(Putable on 05/07/2013) (a) | | | 7,490,000 | |
| | 400,000 | | | Lorain Port Authority Revenue,
Bond Anticipation Notes,
Land Reutilization Project
2.500%, 11/06/2013 | | | 403,608 | |
| | 555,000 | | | Ohio University Revenue,
State University of Ohio, VRDN
(SPA: Dexia Credit Local)
1.250%, 12/01/2026
(Putable on 05/07/2013) (a) | | | 555,000 | |
| | 2,500,000 | | | State Air Quality Development
Authority Revenue,
Columbus Southern Power Co.,
VRDN (CS: NATL-RE)
5.100%, 11/01/2042
(Putable on 05/01/2013) (a) | | | 2,500,000 | |
| | 4,000,000 | | | State Air Quality Development
Authority Revenue, Columbus
Southern Power Co.—Series A
(CS: FirstEnergy Generation Corp.)
5.700%, 02/01/2014 | | | 4,128,680 | |
| | 9,075,000 | | | State Air Quality Development
Authority Revenue,
Ohio Power Co. Project—Series C
(CS: Ohio Power Company)
5.150%, 05/01/2026 | | | 9,097,778 | |
| | 4,250,000 | | | State Air Quality Development
Authority Revenue, Pollution
Control Revenue Refunding
Bonds, FirstEnergy Generation
Corp. Project—Series A
(CS: FirstEnergy Generation Corp.)
2.250%, 12/01/2023
(Putable on 06/03/2013) (a) | | | 4,256,843 | |
| | 9,000,000 | | | State Water Development
Authority, Solid Waste
Revenue, VRDN
(CS: Waste Management, Inc.)
2.250%, 11/01/2022
(Putable on 11/02/2015) (a) | | | 9,294,840 | |
| | | | | | | | 42,468,337 | |
| Oklahoma—0.0%* | | | |
| | 250,000 | | | Comanche County Hospital
Authority Revenue,—Series A
4.000%, 07/01/2014 | | | 256,695 | |
Principal
Amount |
|
| Security
Description |
|
Value |
|
| | | | | | | |
| Municipal Bonds—continued | | |
| Oregon—0.0%* | | |
| | | | | Multnomah County Hospital
Facilities Authority Revenue,
Terwilliger Plaza, Inc. | | | | |
| $ | 400,000 | | | 2.000%, 12/01/2013 | | $ | 402,368 | |
| | 150,000 | | | 2.000%, 12/01/2014 | | | 151,611 | |
| | | | | | | | 553,979 | |
| Pennsylvania—2.7% | | | |
| | 5,250,000 | | | Allegheny County Airport
Authority Revenue, VRDN
(CS: NATL-RE)
0.750%, 01/01/2021
(Putable on 05/07/2013) (a) | | | 5,250,000 | |
| | 250,000 | | | Allegheny County Higher
Education Building Authority
University Revenue, Chatham
University—Series A
(CS: Chatham University)
3.000%, 09/01/2013 | | | 251,827 | |
| | 750,000 | | | City of Philadelphia Airport
Revenue—Series A
4.000%, 06/15/2013 | | | 753,135 | |
| | 345,000 | | | Delaware County Authority
Revenue, Eastern University
3.000%, 10/01/2013 | | | 347,122 | |
| | 270,000 | | | Northampton County Industrial
Development Authority
Revenue, Morningstar Senior
Living, Inc. Project
2.400%, 07/01/2014 | | | 269,873 | |
| | | | | Puttable Floating Option
Tax-Exempt Receipts Revenue,
Allegheny County Airport
Authority, VRDN (CS: NATL-RE) | | | | |
| | 10,485,000 | | | 0.720%, 01/01/2020
(Putable on 05/07/2013) (a) | | | 10,485,000 | |
| | 5,085,000 | | | 0.750%, 01/01/2022
(Putable on 05/07/2013) (a) | | | 5,085,000 | |
| | 2,000,000 | | | State Economic Development
Financing Authority Revenue,
Waste Management, Inc., VRDN
(CS: Waste Management, Inc.)
1.750%, 12/01/2033
(Putable on 12/01/2015) (a) | | | 2,040,120 | |
| | 12,500,000 | | | State Economic Development
Financing Authority Solid Waste
Disposal Revenue, Republic
Services, Inc. Project—Series A,
VRDN (CS: Republic Services, Inc.)
0.550%, 04/01/2019
(Putable on 07/01/2013) (a) | | | 12,500,000 | |
| | | | | | | | 36,982,077 | |
The accompanying notes are an integral part of these financial statements.
69
Alpine Ultra Short Tax Optimized Income Fund
Schedule of Portfolio Investments—Continued
April 30, 2013 (Unaudited)
Principal
Amount | | | Security
Description | | Value | |
| | | | | | | |
| Municipal Bonds—continued | | | | |
| Puerto Rico—10.7% | | | | |
| $ | 8,000,000 | | | Government Development Bank
for Puerto Rico Revenue,
VRDN (CS: NATL-RE)
4.750%, 12/01/2015 (a) | | $ | 8,105,040 | |
| | | | | Puerto Rico Industrial Tourist
Educational Medical &
Environmental Control Facilities
Financing Authority Revenue,
Universidad Sacred Heart Project | | | | |
| | 250,000 | | | 3.000%, 10/01/2013 | | | 252,190 | |
| | 250,000 | | | 3.000%, 10/01/2014 | | | 256,595 | |
| | 250,000 | | | 4.000%, 10/01/2015 | | | 265,050 | |
| | 1,075,000 | | | Puerto Rico Municipal Finance
Agency Revenue,—Series A
5.000%, 08/01/2013 | | | 1,084,084 | |
| | 4,905,000 | | | Puerto Rico Public Buildings
Authority Revenue,
Government Facilities—Series M
(CS: Commonwealth of Puerto Rico)
5.750%, 07/01/2014 | | | 5,097,031 | |
| | 13,390,000 | | | Puttable Floating Option
Tax-Exempt Receipts, VRDN
(GA: Dexia Credit Local)
0.670%, 07/01/2030
(Putable on 05/07/2013) (a) | | | 13,390,000 | |
| | 745,000 | | | State Commonwealth Highway &
Transportation Authority
Revenue, Unrefunded—Series Z
(CS: NATL-RE)
6.250%, 07/01/2013 | | | 750,997 | |
| | 37,520,000 | | | State Commonwealth Highway &
Transportation Authority
Revenue, VRDN (CS: NATL-RE)
0.670%, 07/01/2035
(Putable on 05/07/2013) (a) | | | 37,520,000 | |
| | 500,000 | | | State Commonwealth Industrial
Tourist Educational Medical &
Environmental Control Facilities
Financing Authority Revenue,
International American
University Project
4.000%, 10/01/2014 | | | 515,535 | |
| | | | | State Commonwealth Public
Improvement Refunding—
Series A (CS: NATL-RE) | | | | |
| | 4,365,000 | | | 5.250%, 07/01/2014 | | | 4,511,053 | |
| | 725,000 | | | 5.500%, 07/01/2014 | | | 751,325 | |
| | 8,800,000 | | | State Highway & Transportation
Authority Transportation
Revenue, VRDN (CS: CIFG)
0.700%, 07/01/2041
(Putable on 05/07/2013) (a) | | | 8,800,000 | |
| | 47,285,000 | | | State Infrastructure Financing
Authority Revenue, Ports
Authority Project—Series C
(LOC: Government Development
Bank for Puerto Rico)
2.750%, 12/15/2026
(Putable on 06/17/2013) (a) | | | 47,317,626 | |
Principal
Amount | | | Security
Description | | Value | |
| | | | | | | |
| Municipal Bonds—continued | | | | |
| Puerto Rico—continued | | | | |
| $ | 2,425,000 | | | State Public Buildings Authority
Revenue, Government
Facilities—Series H
(CS: FGIC, Commonwealth of
Puerto Rico)
5.250%, 07/01/2014 | | $ | 2,506,140 | |
| | 5,000,000 | | | University of Puerto Rico
Revenue—Series P
5.000%, 06/01/2014 | | | 5,142,250 | |
| | | | | University of Puerto Rico
Revenue—Series Q | | | | |
| | 5,585,000 | | | 5.000%, 06/01/2014 | | | 5,743,893 | |
| | 4,835,000 | | | 5.000%, 06/01/2015 | | | 4,983,870 | |
| | | | | | | | 146,992,679 | |
| Rhode Island—0.1% | | | | |
| | 900,000 | | | Rhode Island Health & Educational
Building Corp. Revenue, Hospital
Financing Revenue, Lifespan
Obligated Group Issue—Series A
(CS: Assured Guaranty Municipal)
5.000%, 05/15/2015 | | | 977,616 | |
| South Carolina—0.1% | | | | |
| | 1,000,000 | | | State Jobs—Economic Development
Authority Industrial Revenue,
Waste Management Project, VRDN
(CS: Waste Management, Inc.)
2.250%, 11/01/2016
(Putable on 11/01/2013) (a) | | | 1,007,140 | |
| Tennessee—2.7% | | | | |
| | 555,000 | | | City of Jackson Health Educational
& Housing Facility Board
Multifamily Revenue, Creekside
Apartments Project, VRDN
(LOC: First Tennessee Bank)
2.000%, 12/01/2017
(Putable on 12/01/2013) (a) | | | 555,000 | |
| | 12,050,000 | | | Franklin Public Building Authority
Revenue, Local Government
Public Improvement—
Series-101-A-1, VRDN
(SPA: DEPFA Bank PLC)
0.450%, 06/01/2037
(Putable on 05/01/2013) (a) | | | 12,050,000 | |
| | 12,000,000 | | | Lewisburg Industrial Development
Board Solid Waste Disposal
Revenue, Waste Management, Inc.
of Tennessee Project, VRDN
(CS: Waste Management, Inc.)
0.550%, 07/02/2035
(Putable on 07/01/2013) (a) | | | 11,999,760 | |
| | | | | Metropolitan Government
Nashville & Davidson County
Health & Educational Facilities
Board Revenue, The Blakeford
at Green Hills, | | | | |
| | 200,000 | | | 1.750%, 07/01/2013 | | | 200,056 | |
| | 170,000 | | | 2.000%, 07/01/2014 | | | 170,485 | |
The accompanying notes are an integral part of these financial statements.
70
Alpine Ultra Short Tax Optimized Income Fund
Schedule of Portfolio Investments—Continued
April 30, 2013 (Unaudited)
Principal
Amount | | | Security
Description | | Value | |
| | | | | | | |
| Municipal Bonds—continued | | | | |
| Tennessee—continued | | | | |
| $ | 3,285,000 | | | Metropolitan Government
Nashville & Davidson County
Health & Educational Facilities
Board Revenue, Wedgewood—
Series A, VRDN
(LOC: Regions Bank)
0.920%, 06/01/2034
(Putable on 05/07/2013) (a) | | $ | 3,285,000 | |
| | 4,250,000 | | | Metropolitan Government
Nashville & Davidson County
Industrial Development Board
Revenue, Rodgers Welch Venture,
VRDN (LOC: Regions Bank)
2.340%, 12/01/2014
(Putable on 05/07/2013) (a) | | | 4,250,000 | |
| | 5,000,000 | | | Shelby County, Health Educational
& Housing Facilities Board
Revenue, Methodist Le Bonheur
Healthcare-Series A, VRDN
(CS: Methodist Le Bonheur
Obligation; SPA: U.S. Bank NA)
0.420%, 06/01/2042
(Putable on 05/01/2013) (a) | | | 5,000,000 | |
| | | | | | | | 37,510,301 | |
| Texas—4.6% | | | | |
| | 10,165,000 | | | Love Field Airport Modernization
Corp. Special Facilities Revenue,
Southwest Airlines Co. Projects,
2.000%, 05/01/2013 | | | 10,165,000 | |
| | 20,000,000 | | | Mission Economic Development
Corp. Solid Waste Disposal
Revenue, Republic Services, Inc.,
VRDN 0.600%, 01/01/2026
(Putable on 08/01/2013) (a) | | | 20,000,000 | |
| | | | | State Municipal Gas Acquisition &
Supply Corp. III Gas Supply
Revenue,—Series 2012 (CS: Bank
of New York Mellon Trust Co.) | | | | |
| | 1,500,000 | | | 3.000%, 12/15/2013 | | | 1,521,285 | |
| | 1,500,000 | | | 5.000%, 12/15/2014 | | | 1,602,495 | |
| | 2,000,000 | | | 5.000%, 12/15/2015 | | | 2,196,800 | |
| | 9,000,000 | | | Texas Transportation Commission
Turnpike System Revenue,
—Series B, VRDN
1.250%, 08/15/2042
(Putable on 02/15/2015) (a) | | | 9,069,930 | |
| | 13,785,000 | | | Weslaco Health Facilities
Development Corp., Knapp
Medical Center-Series A,
VRDN (LOC: Compass Bank)
0.930%, 06/01/2038
(Putable on 05/07/2013) (a) | | | 13,785,000 | |
| | 4,310,000 | | | Weslaco Health Facilities
Development Corp., Knapp
Medical Center-Series B,
VRDN (LOC: Compass Bank)
0.930%, 06/01/2031
(Putable on 05/07/2013) (a) | | | 4,310,000 | |
| | | | | | | | 62,650,510 | |
Principal
Amount | | | Security
Description | | Value | |
| | | | | | | |
| Municipal Bonds—continued | | | | |
| Virginia—4.1% | | | | |
| $ | 55,350,000 | | | Capital Beltway Funding Corp.,
Hot Lanes-Series B, VRDN
(LOC: Banco Espirito Santo SA)
2.280%, 12/31/2047
(Putable on 05/07/2013) (a) | | $ | 55,350,000 | |
| | 1,000,000 | | | Gloucester County Industrial
Development Authority Solid
Waste Disposal Revenue,
Waste Management, Inc.
(CS: Waste Management, Inc.)
5.125%, 09/01/2038
(Putable on 05/01/2014) (a) | | | 1,042,350 | |
| | | | | | | | 56,392,350 | |
| Washington—1.5% | | | | |
| | 21,285,000 | | | State Health Care Facilities
Authority Revenue, Kadlec
Medical Center-Series B, VRDN
(CS: Kadlec Medical Center;
SPA: KeyBank N.A.)
0.550%, 12/01/2036
(Putable on 05/07/2013) (a) | | | 21,285,000 | |
| West Virginia—0.5% | | | | |
| | 6,500,000 | | | State Economic Development
Authority, Pollution Control
Revenue, Appalachian Power Co.
—Amos Project, Series C-Series C,
VRDN (CS: Appalachian Power Co.)
4.850%, 05/01/2019
(Putable on 09/04/2013) (a) | | | 6,591,195 | |
| Wyoming—0.2% | | | | |
| | 2,855,000 | | | Gillette Environmental Improvement
Revenue, Black Hills Power and
Light Co.-Series A, VRDN
(CS: Black Hills Power and Light Co.)
1.000%, 06/01/2024
(Putable on 05/07/2013) (a) | | | 2,855,000 | |
| | | | | Total Municipal Bonds
(Cost $1,425,560,655) | | | 1,426,238,088 | |
| Shares | | | | | | |
| Money Market Funds—0.0%* | | | | |
| | 32,990 | | | BlackRock Liquidity Funds:
MuniCash Portfolio, 0.12% | | | 32,990 | |
| | | | | Total Money Market Funds
(Cost $32,990) | | | 32,990 | |
| | | | | | | | | |
Total Investments
(Cost $1,425,593,645)—103.7% | | | 1,426,271,078 | |
Liabilities in Excess of
Other Assets—(3.7)% | | | (51,437,269 | ) |
| TOTAL NET ASSETS 100.0% | | $ | 1,374,833,809 | |
The accompanying notes are an integral part of these financial statements.
71
Alpine Ultra Short Tax Optimized Income Fund
Schedule of Portfolio Investments—Continued
April 30, 2013 (Unaudited)
Percentages are stated as a percent of net assets.
| * | Amount is less than 0.05%. |
| | |
| (a) | Variable Rate Security-The rate reported is the rate in effect as of April 30, 2013. |
AMBAC—American Municipal Bond Assurance Corp.
ARN—Auction Rate Note
CS—Credit Support
CSP—Continental Structural Plastics
FGIC—Federal Guaranty Insurance Co.
LIQ FAC—Liquidity Facility
LOC—Letter of Credit
NA—North America
PLC—Public Limited Company
SA—Generally designates corporations in various countries, mostly those employing the civil law.
SPA—Standby Purchase Agreement
VRDN—Variable Rate Demand Note
XLCA—XI Capital Assurance, Inc.
The accompanying notes are an integral part of these financial statements.
72
Alpine Municipal Money Market Fund
Schedule of Portfolio Investments
April 30, 2013 (Unaudited)
Principal
Amount | | | Security
Description | | Value | |
| | | | | | | | | |
| Municipal Bonds—100.0% | | | | |
| Alabama—2.5% | | | | |
| $ | 5,000,000 | | | Mobile Industrial Development
Board Pollution Control
Revenue, Alabama Power Co.,
Barry Plant Project, VRDN
(CS: Alabama Power Co.)
0.580%, 07/15/2034
(Putable on 09/13/2013) (a) | | $ | 5,000,000 | |
| California—1.5% | | | | |
| | 350,000 | | | Los Angeles Regional Airports
Improvement Corp. Lease
Revenue, Los Angeles
International Airport, VRDN
(LOC: Societe Generale)
0.500%, 12/01/2015
(Putable on 05/07/2013) (a) | | | 350,000 | |
| | 2,565,000 | | | Pollution Control Financing
Authority Solid Waste Disposal
Revenue, Alameda County
Industries AR, Inc. Project, VRDN
(LOC: Bank of West)
0.450%, 06/01/2037
(Putable on 05/07/2013) (a) | | | 2,565,000 | |
| | | | | | | | 2,915,000 | |
| Colorado—3.6% | | | | |
| | 1,530,000 | | | Housing & Finance Authority
Economic Development
Revenue, Corey Building
LLC—Series A, VRDN
(LOC: Wells Fargo Bank N.A.)
0.370%, 02/01/2029
(Putable on 05/07/2013) (a) | | | 1,530,000 | |
| | 2,940,000 | | | Housing & Finance Authority
Economic Development Revenue,
Monaco LLC—Series A, VRDN
(LOC: UMB Bank N.A.)
0.370%, 12/01/2027
(Putable on 05/07/2013) (a) | | | 2,940,000 | |
| | 1,050,000 | | | Housing & Finance Authority
Economic Development Revenue,
Top Shop—Series A, VRDN
(LOC: JPMorgan Chase Bank)
0.420%, 09/01/2035
(Putable on 05/07/2013) (a) | | | 1,050,000 | |
| | 1,407,000 | | | Jefferson County Industrial
Development Revenue,
Epi-Center LLC, VRDN
(LOC: JPMorgan Chase Bank)
0.420%, 12/01/2025
(Putable on 05/07/2013) (a) | | | 1,407,000 | |
| | 200,000 | | | Midcities Metropolitan District
No. 1 Special Revenue—Series B,
VRDN
(LOC: BNP Paribas)
0.540%, 12/01/2031
(Putable on 05/07/2013) (a) | | | 200,000 | |
| | | | | | | | 7,127,000 | |
Principal
Amount | | | Security
Description | | Value | |
| | | | | | | | | |
| Municipal Bonds—continued | | | | |
| Connecticut—2.3% | | | | |
| $ | 4,500,000 | | | Town of Hamden, General
Obligation Bond—Series B
(CS: Hamden CT)
2.000%, 08/22/2013 | | $ | 4,519,472 | |
| Florida—3.8% | | | | |
| | 1,000,000 | | | Alachua County Industrial
Development Revenue,
Florida Rock Industries, Inc.
Project, VRDN
(LOC: Bank of America N.A.)
0.470%, 11/01/2022
Putable on 05/07/2013) (a) | | | 1,000,000 | |
| | 750,000 | | | Broward County Housing Finance
Authority Multi Revenue,
Sailboat Bend Artist Lofts Project,
VRDN
(LOC: Citibank N.A.)
0.330%, 04/15/2038
(Putable on 05/07/2013) (a) | | | 750,000 | |
| | 3,465,000 | | | Manatee County Industrial
Development Revenue,
Gaemmerler U.S. Corp., VRDN
(LOC: Wells Fargo Bank N.A.)
0.410%, 10/01/2035
(Putable on 05/07/2013) (a) | | | 3,465,000 | |
| | 2,400,000 | | | Sarasota County Industrial
Development Revenue,
Tervis Tumbler Co., VRDN
(LOC: Bank of America N.A.)
0.510%, 11/01/2024
(Putable on 05/07/2013) (a) | | | 2,400,000 | |
| | | | | | | | 7,615,000 | |
| Georgia—2.0% | | | | |
| | 4,000,000 | | | Fulton County Development
Authority Industrial
Development Revenue,
Leggett & Platt, Inc., VRDN
(LOC: Wells Fargo Bank N.A.)
0.330%, 06/01/2027
(Putable on 05/07/2013) (a) | | | 4,000,000 | |
| Illinois—8.3% | | | | |
| | 1,000,000 | | | City of Chicago Industrial
Development Revenue,
Enterprise Center VII, VRDN
(LOC: Bank of America N.A.)
0.360%, 06/01/2022
(Putable on 05/07/2013) (a) | | | 1,000,000 | |
| | 2,450,000 | | | City of Chicago Industrial
Development Revenue,
Victoria Limited, LLC, VRDN
(LOC: Bank of America N.A.)
0.360%, 03/01/2034
(Putable on 05/07/2013) (a) | | | 2,450,000 | |
| | 1,120,000 | | | City of East Moline, Rock Island
County Industrial Development
Revenue, Elliott Aviation, VRDN
(LOC: U.S. Bank N.A.)
0.360%, 12/01/2019
(Putable on 05/07/2013) (a) | | | 1,120,000 | |
The accompanying notes are an integral part of these financial statements.
73
Alpine Municipal Money Market Fund
Schedule of Portfolio Investments—Continued
April 30, 2013 (Unaudited)
Principal
Amount | | | Security
Description | | Value | |
| | | | | | | | | |
| Municipal Bonds—continued | | | | |
| Illinois—continued | | | | |
| $ | 500,000 | | | Des Plaines Industrial
Development Revenue, MMP
Properties LLC, VRDN
(LOC: JPMorgan Chase Bank)
0.460%, 10/01/2018
(Putable on 05/07/2013) (a) | | $ | 500,000 | |
| | 1,100,000 | | | Elmhurst Industrial Development
Revenue, John Sakash Co., Inc.
Project, VRDN
(LOC: Bank of America N.A.)
0.510%, 02/01/2025
(Putable on 05/07/2013) (a) | | | 1,100,000 | |
| | 1,000,000 | | | Finance Authority Industrial
Development Revenue, 2500
DevelGroup LLC—Series A, VRDN
(LOC: JPMorgan Chase Bank)
0.460%, 01/01/2021
(Putable on 05/07/2013) (a) | | | 1,000,000 | |
| | 1,070,000 | | | Finance Authority Industrial
Development Revenue, Alpha
Beta Press, Inc.—Series A, VRDN
(LOC: JPMorgan Chase Bank)
0.460%, 06/01/2020
(Putable on 05/07/2013) (a) | | | 1,070,000 | |
| | 345,000 | | | Finance Authority Industrial
Development Revenue, Church
Road Partnership, VRDN
(LOC: JPMorgan Chase Bank)
0.460%, 10/01/2017
(Putable on 05/07/2013) (a) | | | 345,000 | |
| | 2,175,000 | | | Finance Authority Industrial
Development Revenue, Industrial
Steel Construction, Inc., VRDN
(LOC: JPMorgan Chase Bank)
0.460%, 07/15/2023
(Putable on 05/07/2013) (a) | | | 2,175,000 | |
| | 600,000 | | | Finance Authority Industrial
Development Revenue,
Merug LLC—Series B, VRDN
(LOC: JPMorgan Chase Bank)
0.460%, 12/01/2018
(Putable on 05/07/2013) (a) | | | 600,000 | |
| | 2,000,000 | | | Phoenix Realty Special Account-U
LP MultiFamily Housing Revenue,
Brightons Mark, VRDN
(LOC: Northern Trust Co.)
0.340%, 04/01/2020
(Putable on 05/07/2013) (a) | | | 2,000,000 | |
| | 425,000 | | | Village of Hanover Park Industrial
Development Revenue,
Spectra-Tech, Inc. Project, VRDN
(LOC: BMO Harris Bank N.A.)
0.690%, 08/01/2017
(Putable on 05/07/2013) (a) | | | 425,000 | |
| | 450,000 | | | Village of Wheeling Industrial
Project Revenue, V-S Industries,
Inc. Project, VRDN
(LOC: JPMorgan Chase Bank)
0.630%, 12/01/2015
(Putable on 05/07/2013) (a) | | | 450,000 | |
Principal
Amount | | | Security
Description | | Value | |
| | | | | | | | | |
| Municipal Bonds—continued | | | | |
| Illinois—continued | | | | |
| $ | 2,250,000 | | | Village of Woodridge Du Page
Will & Cook Counties Industrial
Development Revenue, Home
Run Inn Frozen Food, VRDN
(LOC: JPMorgan Chase Bank)
0.460%, 10/01/2025
(Putable on 05/07/2013) (a) | | $ | 2,250,000 | |
| | | | | | | | 16,485,000 | |
| Indiana—1.3% | | | | |
| | 645,000 | | | City of South Bend Economic
Development Revenue,
Dynamic R.E.H.C., Inc. Project,
VRDN
(LOC: KeyBank N.A.)
0.750%, 09/01/2020 (Putable on 05/07/2013) (a) | | | 645,000 | |
| | 1,970,000 | | | State Development Finance
Authority Development
Revenue, TTP, Inc. Project, VRDN
(LOC: Bank of America N.A.)
0.410%, 02/01/2026
(Putable on 05/07/2013) (a) | | | 1,970,000 | |
| | | | | | | | 2,615,000 | |
| Kansas—0.6% | | | | |
| | 1,110,000 | | | State Development Finance
Authority Multifamily Housing
Revenue, Four Seasons
Apartments, VRDN
(LOC: U.S. Bank N.A.)
0.390%, 04/01/2036
(Putable on 05/07/2013) (a) | | | 1,110,000 | |
| Kentucky—0.7% | | | | |
| | 1,410,000 | | | Montgomery County Industrial
Building Revenue, Connecticut
Fineblanking Corp., VRDN
(LOC: Bank of America N.A.)
0.360%, 08/01/2015
(Putable on 05/07/2013) (a) | | | 1,410,000 | |
| Louisiana—2.1% | | | | |
| | 2,755,000 | | | Caddo-Bossier Parishes Port
Commission Revenue, Oakley
Louisiana, Inc., VRDN
(LOC: Bank of America N.A.)
0.610%, 01/01/2028
(Putable on 05/07/2013) (a) | | | 2,755,000 | |
| | 1,500,000 | | | Plaquemines Port Harbor &
Terminal District Revenue,
International Marine Terminal
Project—Series A, VRDN
(LOC: Wells Fargo Bank N.A.)
1.000%, 03/15/2025
(Putable on 03/17/2014) (a) | | | 1,500,000 | |
| | | | | | | | 4,255,000 | |
| Michigan—7.7% | | | | |
| | 200,000 | | | Sterling Heights Economic
Development Corp. Revenue,
Kunath Enterprises LLC, VRDN
(LOC: JPMorgan Chase Bank)
0.660%, 02/01/2016
(Putable on 05/07/2013) (a) | | | 200,000 | |
The accompanying notes are an integral part of these financial statements.
74
Alpine Municipal Money Market Fund
Schedule of Portfolio Investments—Continued
April 30, 2013 (Unaudited)
Principal
Amount | | | Security
Description | | Value | |
| | | | | | | |
| Municipal Bonds—continued | | | | |
| Michigan—continued | | | | |
| $ | 1,005,000 | | | Strategic Fund Limited Obligation
Revenue, Dawnbreakers LLC,
VRDN
(LOC: Fifth Third Bank)
0.380%, 05/01/2018
(Putable on 05/07/2013) (a) | | $ | 1,005,000 | |
| | 1,400,000 | | | Strategic Fund Limited Obligation
Revenue, Envelope Printery, Inc.,
VRDN
(LOC: Fifth Third Bank)
0.380%, 03/01/2027
(Putable on 05/07/2013) (a) | | | 1,400,000 | |
| | 6,430,000 | | | Strategic Fund Limited Obligation
Revenue, Glastender, Inc.,
VRDN
(LOC: JPMorgan Chase Bank)
0.450%, 11/01/2023
(Putable on 05/07/2013) (a) | | | 6,430,000 | |
| | 5,600,000 | | | Strategic Fund Limited Obligation
Revenue, Sacred Heart
Rehabilitation Center, VRDN
(LOC: Fifth Third Bank)
0.360%, 03/01/2037
(Putable on 05/07/2013) (a) | | | 5,600,000 | |
| | 300,000 | | | Strategic Fund Limited Obligations
Revenue, Blair Equipment Co.
Project, VRDN
(LOC: JP Morgan Chase Bank)
0.660%, 08/01/2016
(Putable on 05/07/2013) (a) | | | 300,000 | |
| | 300,000 | | | Strategic Fund Limited Obligations
Revenue, Warren Screw Products,
Inc., VRDN
(LOC: JPMorgan Chase Bank)
0.660%, 09/01/2016
(Putable on 05/07/2013) (a) | | | 300,000 | |
| | | | | | | | 15,235,000 | |
| New Jersey—3.6% | | | | |
| | 7,081,600 | | | Hudson County Improvement
Authority, Guaranteed Pooled
Notes, Local Unit Loan
Program—Series L-1
(CS: Hudson County, NJ)
2.000%, 06/05/2013 | | | 7,089,341 | |
| New Mexico—2.8% | | | | |
| | 565,000 | | | Albuquerque Industrial
Development Revenue,
Karsten Co.—Series A, VRDN
(LOC: U.S. Bank N.A.)
0.360%, 12/01/2017
(Putable on 05/07/2013) (a) | | | 565,000 | |
| | 5,000,000 | | | Santa Fe County Education Facility
Revenue, Archdioceses of Santa
Fe School Project—Series A, VRDN
(LOC: U.S. Bank N.A.)
0.370%, 06/01/2028
(Putable on 05/07/2013) (a) | | | 5,000,000 | |
| | | | | | | | 5,565,000 | |
| Principal Amount | | | Security
Description | | Value | |
| | | | | | | |
| Municipal Bonds—continued | | | | |
| New York—8.1% | | | | |
| $ | 1,020,000 | | | Erie County Industrial
Development Agency Revenue,
Heritage Centers Project, VRDN
(LOC: KeyBank N.A.)
0.390%, 09/01/2018
(Putable on 05/07/2013) (a) | | $ | 1,020,000 | |
| | 7,000,000 | | | Metropolitan Transportation
Authority Dedicated Tax Fund
Refunding Revenue—Subseries
B-4, VRDN
(LOC: KBC Bank NV)
0.430%, 11/01/2025
(Putable on 05/07/2013) (a) | | | 7,000,000 | |
| | 1,845,000 | | | Monroe County Industrial
Development Agency, Hillside
Children’s Center, VRDN
(LOC: KeyBank N.A.)
0.340%, 08/01/2018
(Putable on 05/07/2013) (a) | | | 1,845,000 | |
| | 3,500,000 | | | New York City Industrial
Development Agency Revenue,
Brooklyn United Methodist
Church Home Project, VRDN
(LOC: TD Bank N.A.)
0.210%, 07/01/2022
(Putable on 05/07/2013) (a) | | | 3,500,000 | |
| | 685,000 | | | New York City Industrial
Development Agency, Allway
Tools, Inc., VRDN
(LOC: CitiBank N.A.)
0.570%, 08/01/2017
(Putable on 05/07/2013) (a) | | | 685,000 | |
| | 1,995,000 | | | Niagara County Industrial
Development Agency Revenue,
NYSARC, Inc., Opportunities
Unlimited of Niagara
Project—Series A, VRDN
(LOC: KeyBank N.A.)
0.340%, 09/01/2021
(Putable on 05/07/2013) (a) | | | 1,995,000 | |
| | | | | | | | 16,045,000 | |
| North Carolina—2.2% | | | | |
| | 1,000,000 | | | Davidson County Industrial
Facilities & Pollution Control
Financing Authority Revenue,
Dieboid, Inc., VRDN
(LOC: Bank of America N.A.)
0.510%, 06/01/2017
(Putable on 05/07/2013) (a) | | | 1,000,000 | |
| | 3,400,000 | | | North Carolina Educational
Facilities Finance Agency
Revenue, Elon College, VRDN
(LOC: TD Bank N.A.)
0.210%, 01/01/2021
(Putable on 05/07/2013) (a) | | | 3,400,000 | |
| | | | | | | | 4,400,000 | |
The accompanying notes are an integral part of these financial statements.
75
Alpine Municipal Money Market Fund
Schedule of Portfolio Investments—Continued
April 30, 2013 (Unaudited)
| Principal Amount | | | Security
Description | | Value | |
| | | | | | | |
| Municipal Bonds—continued | | | | |
| Ohio—2.0% | | | | |
| $ | 1,735,000 | | | City of Parma Health Care
Facilities Revenue, Catholic
Charities Facilities Corp., VRDN
(LOC: RBS Citizens N.A.)
0.380%, 10/01/2029
(Putable on 05/07/2013) (a) | | $ | 1,735,000 | |
| | 2,275,000 | | | Stark County Industrial
Development Authority,
H-P Products, Inc., VRDN
(LOC: KeyBank N.A.)
0.390%, 06/01/2018
(Putable on 05/07/2013) (a) | | | 2,275,000 | |
| | | | | | | | 4,010,000 | |
| Oklahoma—3.9% | | | | |
| | 7,805,000 | | | State Development Finance
Authority Continuing Care
Retirement Community
Revenue, Inverness Village
Project—Series A, VRDN
(LOC: KBC Bank NV)
0.410%, 01/01/2042
(Putable on 05/07/2013) (a) | | | 7,805,000 | |
| Oregon—0.5% | | | | |
| | 925,000 | | | State Economic Development
Revenue, Oregon Precision
Industries, Inc. Project—
Series 204A, VRDN
(LOC: Bank of America N.A.)
0.380%, 12/01/2026
(Putable on 05/07/2013) (a) | | | 925,000 | |
| Pennsylvania—3.9% | | | | |
| | 2,200,000 | | | Beaver County Industrial
Development Authority,
BASF Corp., VRDN
(CS: BASF Corp.)
0.370%, 09/01/2032
(Putable on 05/07/2013) (a) | | | 2,200,000 | |
| | 5,545,000 | | | Washington County Hospital
Authority Revenue, Washington
Hospital—Series A, VRDN
(LOC: PNC Bank N.A.)
0.450%, 07/01/2037
(Putable on 07/01/2013) (a) | | | 5,545,000 | |
| | | | | | | | 7,745,000 | |
| South Carolina—2.7% | | | | |
| | 3,000,000 | | | Cherokee County Industrial
Revenue, Oshkosh Truck Corp.
Project, VRDN
(LOC: Bank of America N.A.)
0.410%, 08/01/2019
(Putable on 05/07/2013) (a) | | | 3,000,000 | |
| | 2,400,000 | | | State Jobs-Economic
Development Authority, Dorris
Properties LLC Project, VRDN
(LOC: TD Bank N.A.)
0.340%, 07/01/2032
(Putable on 05/07/2013) (a) | | | 2,400,000 | |
| | | | | | | | 5,400,000 | |
| Principal Amount | | | Security
Description | | Value | |
| | | | | | | |
| Municipal Bonds—continued | | | | |
| Tennessee—3.8% | | | | |
| $ | 7,500,000 | | | Hendersonville Industrial
Development Board-Series A,
VRDN
(LOC: Fifth Third Bank)
0.360%, 05/01/2036
(Putable on 05/07/2013) (a) | | | 7,500,000 | |
| Texas—15.9% | | | | |
| | 2,600,000 | | | Dallam County Industrial
Development Corp., Rick & Janice
Van Ryan, VRDN
(LOC: Wells Fargo Bank N.A.)
0.420%, 07/01/2037
(Putable on 05/07/2013) (a) | | | 2,600,000 | |
| | 3,250,000 | | | Fort Bend County Industrial
Development Corp., Aaron
Rents, Inc., VRDN
(LOC: Wells Fargo Bank N.A.)
0.410%, 01/01/2026
(Putable on 05/07/2013) (a) | | | 3,250,000 | |
| | 870,000 | | | Jefferson County Industrial
Development Corp. Hurricane
Ike Disaster Area Revenue,
Jefferson Refinery LLC Project,
VRDN
(CS: Branch Bank & Trust,
Jefferson Refinery LLC)
0.450%, 12/01/2040
(Putable on 06/25/2013) (a) | | | 870,000 | |
| | 9,000,000 | | | Jefferson County Industrial
Development Corp. Revenue,
Jefferson Refinery LLC-Series A,
VRDN
(CS: Branch Bank & Trust,
Jefferson Refinery LLC)
0.450%, 12/01/2040
(Putable on 06/25/2013) (a) | | | 9,000,000 | |
| | 1,600,000 | | | Parmer County Industrial
Development Corp. Revenue,
Visser Family Trust Project, VRDN
(LOC: Wells Fargo Bank N.A.)
0.670%, 10/01/2033
(Putable on 05/07/2013) (a) | | | 1,600,000 | |
| | 5,600,000 | | | Port Arthur Navigation District
Revenue, BASF Corp., VRDN
(CS: BASF Corp.)
0.370%, 04/01/2033
(Putable on 05/07/2013) (a) | | | 5,600,000 | |
| | 8,600,000 | | | Port of Corpus Christi Authority
of Nueces County, Solid Waste
Disposal Revenue, Flint Hills
Resources LP, West Plant
Project—Series A, VRDN
(CS: Flint Hills Resources LP)
0.220%, 07/01/2029
(Putable on 05/07/2013) (a) | | | 8,600,000 | |
| | | | | | | | 31,520,000 | |
The accompanying notes are an integral part of these financial statements.
76
Alpine Municipal Money Market Fund
Schedule of Portfolio Investments—Continued
April 30, 2013 (Unaudited)
Principal
Amount | | | Security
Description | | Value | |
| | | | | | | |
| Municipal Bonds—continued | | | | |
| Utah—0.9% | | | | |
| $ | 1,860,000 | | | City of West Jordan Industrial
Development Revenue,
PenCo Products, Inc., VRDN
(LOC: KeyBank N.A.)
0.710%, 04/01/2019
(Putable on 05/07/2013) (a) | | $ | 1,860,000 | |
| Vermont—1.7% | | | | |
| | 3,295,000 | | | Vermont Educational & Health
Buildings Financing Agency,
Hospital Revenue, Springfield
Hospital Project-Series A, VRDN
(LOC: TD Bank N.A.)
0.210%, 09/01/2031
(Putable on 05/07/2013) (a) | | | 3,295,000 | |
| Virginia—0.7% | | | | |
| | 1,500,000 | | | City of Emporia Industrial
Development Authority
Revenue, Toll VA III, L.P.
Project, VRDN
(LOC: Bank of America N.A.)
0.370%, 11/01/2023
(Putable on 05/07/2013) (a) | | | 1,500,000 | |
| Washington—5.5% | | | | |
| | 1,030,000 | | | Economic Development Finance
Authority, Art & Theresa
Mensonides—Series I, VRDN
(LOC: Wells Fargo Bank N.A.)
0.420%, 10/01/2016
(Putable on 05/07/2013) (a) | | | 1,030,000 | |
| | 1,400,000 | | | Economic Development Finance
Authority, Belina Interiors,
Inc.—Series E, VRDN
(LOC: KeyBank N.A.)
1.000%, 08/01/2033
(Putable on 05/07/2013) (a) | | | 1,400,000 | |
| | 1,110,000 | | | Economic Development Finance
Authority, Belina Interiors,
Inc.—Series F, VRDN
(LOC: KeyBank N.A.)
1.000%, 11/01/2023
(Putable on 05/07/2013) (a) | | | 1,110,000 | |
| | 2,745,000 | | | Economic Development Finance
Authority, Wesmar Co., Inc.
Project—Series F, VRDN
(LOC: U.S. Bank N.A.)
0.370%, 07/01/2032
(Putable on 05/07/2013) (a) | | | 2,745,000 | |
| | 2,680,000 | | | Port Bellingham Industrial
Development Corp., Wood
Stone Corp., VRDN
(LOC: KeyBank N.A.)
0.390%, 02/01/2027
(Putable on 05/07/2013) (a) | | | 2,680,000 | |
| | 1,930,000 | | | Seattle Housing Authority Revenue,
Douglas Apartments, VRDN
(LOC: KeyBank N.A.)
0.360%, 06/01/2040
(Putable on 05/07/2013) (a) | | | 1,930,000 | |
| | | | | | | | 10,895,000 | |
| Principal Amount | | | Security
Description | | Value | |
| | | | | | | |
| Municipal Bonds—continued | | | | |
| Wisconsin—5.4% | | | | |
| $ | 2,645,000 | | | City of Baraboo, Industrial
Development Revenue,
Series 2007, Teel Plastics, Inc.,
Project, VRDN
(LOC: BMO Harris Bank N.A.)
0.590%, 11/01/2042
(Putable on 05/07/2013) (a) | | $ | 2,645,000 | |
| | 1,000,000 | | | Mequon Industrial Development
Revenue, Gateway Plastics,
Inc.—Series A, VRDN
(LOC: JPMorgan Chase Bank)
0.460%, 08/01/2026
(Putable on 05/07/2013) (a) | | | 1,000,000 | |
| | 1,695,000 | | | Mequon Industrial Development
Revenue, SPI Lighting, VRDN
(LOC: BMO Harris Bank N.A.)
0.590%, 12/01/2023
(Putable on 05/07/2013) (a) | | | 1,695,000 | |
| | 500,000 | | | Milwaukee Redevelopment
Authority, Kubin Nicholson Corp
Project—Series A, VRDN
(LOC: BMO Harris Bank N.A.)
0.590%, 08/01/2020
(Putable on 05/07/2013) (a) | | | 500,000 | |
| | 1,025,000 | | | Rhinelander Industrial
Development Revenue, Super
Diesel/SDI Properties, VRDN
(LOC: JPMorgan Chase Bank)
0.530%, 07/01/2021
(Putable on 05/07/2013) (a) | | | 1,025,000 | |
| | 2,925,000 | | | Village of Menomonee Falls
Industrial Development Revenue,
AJ Die-Namics Project, VRDN
(LOC: BMO Harris Bank N.A.)
0.590%, 11/01/2036
(Putable on 05/07/2013) (a) | | | 2,925,000 | |
| | 1,000,000 | | | Wausau Industrial Development
Revenue, Apogee Enterprises,
Inc., VRDN
(LOC: Comerica Bank)
0.450%, 03/01/2022
(Putable on 05/07/2013) (a) | | | 1,000,000 | |
| | | | | | | | 10,790,000 | |
| | | | | Total Municipal Bonds
(Cost $198,630,813) | | | 198,630,813 | |
| | | | | | | | | |
| Shares | | | | | | | |
| Money Market Funds—0.1% | | | | |
| | 89,804 | | | BlackRock Liquidity Funds:
MuniCash Portfolio, 0.12% | | | 89,804 | |
| | | | | | | | | |
| | | | | Total Money Market Funds
(Cost $89,804) | | | 89,804 | |
Total Investments
(Cost $198,720,617)—100.1% |
|
|
198,720,617 |
|
| | | | | | | | | |
Liabilities in Excess
of Other Assets—(0.1)% | | | (178,414 | ) |
| TOTAL NET ASSETS 100.0% | | $ | 198,542,203 | |
The accompanying notes are an integral part of these financial statements.
77
Alpine Municipal Money Market Fund
Schedule of Portfolio Investments—Continued
April 30, 2013 (Unaudited)
Percentages are stated as a percent of net assets.
| (a) | Variable Rate Security-The rate reported is the rate in effect as of April 30, 2013. |
CS—Credit Support
LIQ FAC—Liquidity Facility
LOC—Letter of Credit
NV—Naamloze Vennootschap is the Dutch term for a public limited liability corporation.
VRDN—Variable Rate Demand Note
The accompanying notes are an integral part of these financial statements.
78
Alpine Mutual Funds
Statements of Assets and Liabilities
April 30, 2013 (Unaudited)
| | | Dynamic | | | Accelerating | | | Financial | |
| | | Dividend | | | Dividend | | | Services | |
| | | Fund | | | Fund | | | Fund | |
| ASSETS: | | | | | | | | | | | | |
| Investments, at value(1) | | $ | 264,102,333 | | | $ | 3,346,864 | | | $ | 15,985,922 | |
| Foreign currencies, at value(2) | | | 1,092,712 | | | | — | | | | 6,078 | |
| Cash | | | — | | | | 351 | | | | 66 | |
| Receivable from investment securities sold | | | 16,574,270 | | | | 42,377 | | | | 398,457 | |
| Dividends and interest receivable | | | 7,107,957 | | | | 13,420 | | | | 6,538 | |
| Receivable from capital shares issued | | | 46,070 | | | | 351 | | | | 4,720 | |
| Due from Adviser | | | 14,185 | | | | 7,783 | | | | — | |
| Prepaid expenses and other assets | | | 76,612 | | | | 8,249 | | | | 14,448 | |
| Total assets | | | 289,014,139 | | | | 3,419,395 | | | | 16,416,229 | |
| | | | | | | | | | | | | |
| LIABILITIES: | | | | | | | | | | | | |
| Payable for investment securities purchased | | | 9,655,675 | | | | 98,839 | | | | 660,390 | |
| Payable for distributions to shareholders | | | 493,593 | | | | 1,426 | | | | — | |
| Unrealized depreciation on forward currency contracts | | | 452,813 | | | | — | | | | — | |
| Payable for capital shares redeemed | | | 978,885 | | | | 75 | | | | 27,259 | |
| Accrued expenses and other liabilities: | | | | | | | | | | | | |
| Investment advisory fees | | | 227,053 | | | | 2,659 | | | | 18,462 | |
| Line of credit | | | 2,969,628 | | | | — | | | | — | |
| Distribution fees | | | 1,560 | | | | 467 | | | | 1,259 | |
| Other | | | 249,887 | | | | 18,275 | | | | 15,974 | |
| Total liabilities | | | 15,029,094 | | | | 121,741 | | | | 723,344 | |
| Net Assets | | $ | 273,985,045 | | | $ | 3,297,654 | | | $ | 15,692,885 | |
| | | | | | | | | | | | | |
| Net assets represented by: | | | | | | | | | | | | |
| Capital stock | | $ | 1,385,755,535 | | | $ | 2,690,911 | | | $ | 17,251,099 | |
| Accumulated net investment income (loss) | | | 5,610,853 | | | | 15,911 | | | | (9,126 | ) |
| Accumulated net realized gains (losses) from investments and foreign currency transactions | | | (1,137,834,411 | ) | | | 70,816 | | | | (1,309,245 | ) |
| Net unrealized appreciation/depreciation on: | | | | | | | | | | | | |
| Investments | | | 20,830,643 | | | | 520,033 | | | | (240,751 | ) |
| Foreign currency translation | | | (377,575 | ) | | | (17 | ) | | | 908 | |
| Total Net Assets | | $ | 273,985,045 | | | $ | 3,297,654 | | | $ | 15,692,885 | |
| | | | | | | | | | | | | |
| Net asset value | | | | | | | | | | | | |
| Class A | | | | | | | | | | | | |
| Net assets | | $ | 2,126,387 | | | $ | 657,027 | | | $ | 4,675,401 | |
| Shares outstanding | | | 581,499 | | | | 46,547 | | | | 449,717 | |
| Net asset value per share | | $ | 3.66 | | | $ | 14.12 | | | $ | 10.40 | |
| Maximum offering price per share (net asset value plus sales charge of 5.50% of offering price) | | $ | 3.87 | | | $ | 14.94 | | | $ | 11.01 | |
| Institutional Class | | | | | | | | | | | | |
| Net assets | | $ | 271,858,658 | | | $ | 2,640,627 | | | $ | 11,017,484 | |
| Shares outstanding | | | 74,372,845 | | | | 187,026 | | | | 1,056,330 | |
| Net asset value, offering price and redemption price per share* | | $ | 3.66 | | | $ | 14.12 | | | $ | 10.43 | |
| * If applicable, redemption price per share may be reduced by a redemption fee. | | | | | | | | | | | | |
| (1) Total cost of investments | | $ | 243,271,690 | | | $ | 2,826,831 | | | $ | 16,226,673 | |
| (2) Cost of foreign currencies | | $ | 1,094,028 | | | $ | — | | | $ | 6,039 | |
The accompanying notes are an integral part of these financial statements.
79
Alpine Mutual Funds
Statements of Assets and Liabilities—Continued
April 30, 2013 (Unaudited)
| | | Innovators | | | Transformations | | | Foundation | |
| | | Fund | | | Fund | | | Fund | |
| ASSETS: | | | | | | | | | | | | |
| Investments, at value(1) | | $ | 11,507,594 | | | $ | 6,282,682 | | | $ | 70,802,065 | |
| Foreign currencies, at value(2) | | | — | | | | 589 | | | | 2,953 | |
| Cash | | | 8 | | | | 372 | | | | 200 | |
| Receivable from investment securities sold | | | 189,737 | | | | 85,583 | | | | — | |
| Dividends and interest receivable | | | 1 | | | | 3,735 | | | | 241,341 | |
| Prepaid expenses and other assets | | | 1,305 | | | | 11,055 | | | | 16,297 | |
| Total assets | | | 11,698,645 | | | | 6,384,016 | | | | 71,062,856 | |
| | | | | | | | | | | | | |
| LIABILITIES: | | | | | | | | | | | | |
| Payable for investment securities purchased | | | 222,491 | | | | 42,495 | | | | 385,121 | |
| Payable for capital shares redeemed | | | 5,463 | | | | — | | | | — | |
| Accrued expenses and other liabilities: | | | | | | | | | | | | |
| Investment advisory fees | | | 17,084 | | | | 8,358 | | | | 57,216 | |
| Distribution fees | | | 410 | | | | 364 | | | | 361 | |
| Other | | | 16,659 | | | | 13,923 | | | | 11,097 | |
| Total liabilities | | | 262,107 | | | | 65,140 | | | | 453,795 | |
| Net Assets | | $ | 11,436,538 | | | $ | 6,318,876 | | | $ | 70,609,061 | |
| | | | | | | | | | | | | |
| Net assets represented by: | | | | | | | | | | | | |
| Capital stock | | $ | 21,666,408 | | | $ | 4,950,578 | | | $ | 60,989,259 | |
| Accumulated net investment income (loss) | | | (160,031 | ) | | | (40,534 | ) | | | 46,341 | |
| Accumulated net realized gains (losses) from investments and foreign currency transactions | | | (12,516,960 | ) | | | 812,950 | | | | (1,956,164 | ) |
| Net unrealized appreciation/depreciation on: | | | | | | | | | | | | |
| Investments | | | 2,447,121 | | | | 595,884 | | | | 11,529,634 | |
| Foreign currency translation | | | — | | | | (2 | ) | | | (9 | ) |
| Total Net Assets | | $ | 11,436,538 | | | $ | 6,318,876 | | | $ | 70,609,061 | |
| | | | | | | | | | | | | |
| Net asset value | | | | | | | | | | | | |
| Class A | | | | | | | | | | | | |
| Net assets | | $ | 124,102 | | | $ | 112,933 | | | $ | 118,880 | |
| Shares outstanding | | | 9,833 | | | | 8,971 | | | | 9,597 | |
| Net asset value per share | | $ | 12.62 | | | $ | 12.59 | | | $ | 12.39 | |
| Maximum offering price per share (net asset value plus sales charge of 5.50% of offering price) | | $ | 13.35 | | | $ | 13.32 | | | $ | 13.11 | |
| Institutional Class | | | | | | | | | | | | |
| Net assets | | $ | 11,312,436 | | | $ | 6,205,943 | | | $ | 70,490,181 | |
| Shares outstanding | | | 892,734 | | | | 491,182 | | | | 5,686,901 | |
| Net asset value, offering price and redemption price per share* | | $ | 12.67 | | | $ | 12.63 | | | $ | 12.40 | |
| * If applicable, redemption price per share may be reduced by a redemption fee. | | | | | | | | | | | | |
| (1) Total cost of investments | | $ | 9,060,473 | | | $ | 5,686,798 | | | $ | 59,272,431 | |
| (2) Cost of foreign currencies | | $ | — | | | $ | 587 | | | $ | 2,941 | |
The accompanying notes are an integral part of these financial statements.
80
Alpine Mutual Funds
Statements of Assets and Liabilities—Continued
April 30, 2013 (Unaudited)
| | | Ultra Short | | | | |
| | | Tax Optimized | | | Municipal | |
| | | Income | | | Money Market | |
| | | Fund | | | Fund | |
| ASSETS: | | | | | | | | |
| Investments, at value(1) | | $ | 1,426,271,078 | | | $ | 198,720,617 | |
| Receivable from investment securities sold | | | 600,000 | | | | — | |
| Dividends and interest receivable | | | 6,477,283 | | | | 259,483 | |
| Receivable from capital shares issued | | | 9,433,218 | | | | 11,771 | |
| Due from Adviser | | | 308,843 | | | | 36,684 | |
| Prepaid expenses and other assets | | | 48,464 | | | | 10,810 | |
| Total assets | | | 1,443,138,886 | | | | 199,039,365 | |
| | | | | | | | | |
| LIABILITIES: | | | | | | | | |
| Payable for investment securities purchased | | | 64,350,497 | | | | 375,000 | |
| Payable for capital shares redeemed | | | 2,514,083 | | | | 5,465 | |
| Accrued expenses and other liabilities: | | | | | | | | |
| Investment advisory fees | | | 866,762 | | | | 70,619 | |
| Distribution fees | | | 198,765 | | | | — | |
| Other | | | 374,970 | | | | 46,078 | |
| Total liabilities | | | 68,305,077 | | | | 497,162 | |
| Net Assets | | $ | 1,374,833,809 | | | $ | 198,542,203 | |
| | | | | | | | | |
| Net assets represented by: | | | | | | | | |
| Capital stock | | $ | 1,374,650,427 | | | $ | 198,542,203 | |
| Accumulated net investment income | | | 87 | | | | — | |
| Accumulated net realized losses from investments | | | (494,138 | ) | | | — | |
| Net unrealized appreciation on investments | | | 677,433 | | | | — | |
| Total Net Assets | | $ | 1,374,833,809 | | | $ | 198,542,203 | |
| | | | | | | | | |
| Net asset value | | | | | | | | |
| Class A | | | | | | | | |
| Net assets | | $ | 355,792,605 | | | $ | — | |
| Shares outstanding | | | 35,233,936 | | | | — | |
| Net asset value per share | | $ | 10.10 | | | $ | — | |
| Maximum offering price per share (net asset value plus sales charge of 0.50% of offering price) | | $ | 10.15 | | | | | |
| Institutional Class | | | | | | | | |
| Net assets | | $ | 1,019,041,204 | | | $ | — | |
| Shares outstanding | | | 101,488,534 | | | | — | |
| Net asset value, offering price and redemption price per share* | | $ | 10.04 | | | $ | — | |
| Investor Class | | | | | | | | |
| Net assets | | $ | — | | | $ | 198,542,203 | |
| Shares outstanding | | | — | | | | 198,544,872 | |
| Net asset value, offering price and redemption price per share* | | $ | — | | | $ | 1.00 | |
| * If applicable, redemption price per share may be reduced by a redemption fee. | | | | | | | | |
| (1) Total cost of investments | | $ | 1,425,593,645 | | | $ | 198,720,617 | |
The accompanying notes are an integral part of these financial statements.
81
Alpine Mutual Funds
Statements of Operations
For the six months ended April 30, 2013 (Unaudited)
| | | Dynamic | | | Accelerating | | | Financial | |
| | | Dividend | | | Dividend | | | Services | |
| | | Fund | | | Fund | | | Fund | |
| INVESTMENT INCOME: | | | | | | | | | | | | |
| Dividend income | | $ | 16,064,652 | | | $ | 82,703 | | | $ | 83,724 | |
| Less: Foreign taxes withheld | | | (409,113 | ) | | | (2,569 | ) | | | (296 | ) |
| Interest income | | | 109 | | | | 11 | | | | 79 | |
| Total investment income | | | 15,655,648 | | | | 80,145 | | | | 83,507 | |
| | | | | | | | | | | | | |
| EXPENSES: | | | | | | | | | | | | |
| Investment advisory fee (Note 6) | | | 1,575,640 | | | | 13,691 | | | | 64,629 | |
| Transfer agent fees | | | 252,480 | | | | 4,267 | | | | 8,409 | |
| Distribution fees—Class A (Note 5) | | | 2,337 | | | | 443 | | | | 3,507 | |
| Administrative fee (Note 6) | | | 31,917 | | | | 274 | | | | 1,294 | |
| Legal fees | | | 80,100 | | | | 3,356 | | | | 1,457 | |
| Registration and filing fees | | | 16,893 | | | | 14,989 | | | | 16,206 | |
| Accounting and custody fees | | | 23,912 | | | | 2,205 | | | | 3,147 | |
| Printing and mailing fees | | | 69,303 | | | | 1,854 | | | | 2,871 | |
| Audit and tax fees | | | 37,096 | | | | 3,737 | | | | 4,407 | |
| Trustee fees | | | 29,765 | | | | 212 | | | | 938 | |
| Interest (Note 2) | | | 24,876 | | | | — | | | | 62 | |
| Other fees | | | 24,110 | | | | 497 | | | | 814 | |
| Total expenses | | | 2,168,429 | | | | 45,525 | | | | 107,741 | |
| Less: Fee waivers and/or expense reimbursements (Note 6) | | | (14,185 | ) | | | (26,600 | ) | | | (16,927 | ) |
| Net expenses | | | 2,154,244 | | | | 18,925 | | | | 90,814 | |
| Net investment income (loss) | | | 13,501,404 | | | | 61,220 | | | | (7,307 | ) |
| | | | | | | | | | | | | |
| REALIZED AND UNREALIZED ON INVESTMENTS AND FOREIGN CURRENCY: | | | | | | | | | | | | |
| Net realized gain (loss) on: | | | | | | | | | | | | |
| Investments | | | 22,735,894 | | | | 75,005 | | | | 439,779 | |
| Foreign currency transactions | | | (93,665 | ) | | | 38 | | | | (8,664 | ) |
| Net realized gain (loss) on investments and foreign currency | | | 22,642,229 | | | | 75,043 | | | | 431,115 | |
| Change in net unrealized appreciation/depreciation on: | | | | | | | | | | | | |
| Investments | | | (6,763,646 | ) | | | 254,146 | | | | 1,673,677 | |
| Foreign currency translations | | | (445,414 | ) | | | (17 | ) | | | 9,038 | |
| Net change in unrealized appreciation/depreciation on investments and foreign currency | | | (7,209,060 | ) | | | 254,129 | | | | 1,682,715 | |
| Net gain (loss) on investments and foreign currency | | | 15,433,169 | | | | 329,172 | | | | 2,113,830 | |
| Increase in net assets from operations | | $ | 28,934,573 | | | $ | 390,392 | | | $ | 2,106,523 | |
The accompanying notes are an integral part of these financial statements.
82
Alpine Mutual Funds
Statements of Operations—Continued
For the six months ended April 30, 2013 (Unaudited)
| | | Innovators | | | Transformations | | | Foundation | |
| | | Fund | | | Fund | | | Fund | |
| INVESTMENT INCOME: | | | | | | | | | | | | |
| Dividend income | | $ | 22,482 | | | $ | 38,252 | | | $ | 717,585 | |
| Less: Foreign taxes withheld | | | — | | | | (879 | ) | | | (10,109 | ) |
| Interest income | | | 90 | | | | 49 | | | | 264,077 | |
| Total investment income | | | 22,572 | | | | 37,422 | | | | 971,553 | |
| | | | | | | | | | | | | |
| EXPENSES: | | | | | | | | | | | | |
| Investment advisory fee (Note 6) | | | 56,394 | | | | 31,684 | | | | 333,227 | |
| Transfer agent fees | | | 8,288 | | | | 4,946 | | | | 8,714 | |
| Distribution fees—Class A (Note 5) | | | 147 | | | | 138 | | | | 140 | |
| Administrative fee (Note 6) | | | 1,128 | | | | 634 | | | | 6,665 | |
| Legal fees | | | 1,881 | | | | 1,578 | | | | 11,045 | |
| Registration and filing fees | | | 15,253 | | | | 15,856 | | | | 17,267 | |
| Accounting and custody fees | | | 2,181 | | | | 2,146 | | | | 4,666 | |
| Printing and mailing fees | | | 3,245 | | | | 2,206 | | | | 7,170 | |
| Audit and tax fees | | | 4,557 | | | | 4,101 | | | | 10,176 | |
| Trustee fees | | | 960 | | | | 535 | | | | 5,637 | |
| Other fees | | | 998 | | | | 671 | | | | 4,271 | |
| Total expenses | | | 95,032 | | | | 64,495 | | | | 408,978 | |
| Less: Fee waivers and/or expense reimbursements (Note 6) | | | (18,757 | ) | | | (21,585 | ) | | | — | |
| Net expenses | | | 76,275 | | | | 42,910 | | | | 408,978 | |
| Net investment income (loss) | | | (53,703 | ) | | | (5,488 | ) | | | 562,575 | |
| | | | | | | | | | | | |
| REALIZED AND UNREALIZED ON INVESTMENTS AND FOREIGN CURRENCY: | | | | | | | | | | | | |
| Net realized gain on: | | | | | | | | | | | | |
| Investments | | | 1,438,888 | | | | 812,937 | | | | 1,959,944 | |
| Foreign currency transactions | | | 4 | | | | 13 | | | | 502 | |
| Net realized gain on investments and foreign currency | | | 1,438,892 | | | | 812,950 | | | | 1,960,446 | |
| Change in unrealized appreciation/depreciation on: | | | | | | | | | | | | |
| Investments | | | (112,245 | ) | | | (290,621 | ) | | | 3,270,986 | |
| Foreign currency translations | | | — | | | | 1 | | | | 5 | |
| Net change in unrealized appreciation/depreciation on investments and foreign currency | | | (112,245 | ) | | | (290,620 | ) | | | 3,270,991 | |
| Net gain (loss) on investments and foreign currency | | | 1,326,647 | | | | 522,330 | | | | 5,231,437 | |
| Increase in net assets from operations | | $ | 1,272,944 | | | $ | 516,842 | | | $ | 5,794,012 | |
The accompanying notes are an integral part of these financial statements.
83
Alpine Mutual Funds
Statements of Operations—Continued
For the six months ended April 30, 2013 (Unaudited)
| | | Ultra Short | | | | |
| | | Tax Optimized | | | Municipal | |
| | | Income | | | Money Market | |
| | | Fund | | | Fund | |
| INVESTMENT INCOME: | | | | | | | | |
| Interest income | | $ | 9,747,461 | | | $ | 384,137 | |
| Total investment income | | | 9,747,461 | | | | 384,137 | |
| | | | | | | | | |
| EXPENSES: | | | | | | | | |
| Investment advisory fee (Note 6) | | | 5,993,789 | | | | 462,991 | |
| Transfer agent fees | | | 320,302 | | | | 20,621 | |
| Distribution fees—Class A (Note 5) | | | 502,997 | | | | — | |
| Administration fee (Note 6) | | | 159,834 | | | | 20,472 | |
| Legal fees | | | 68,758 | | | | 13,829 | |
| Registration and filing fees | | | 60,007 | | | | 21,246 | |
| Accounting and custody fees | | | 88,754 | | | | 16,257 | |
| Printing and mailing fees | | | 47,103 | | | | 7,261 | |
| Audit and tax fees | | | 25,297 | | | | 6,557 | |
| Trustee fees | | | 29,482 | | | | 3,500 | |
| Insurance fees | | | 35,213 | | | | 5,680 | |
| Compliance fees | | | 9,933 | | | | 1,239 | |
| Other fees | | | 1,288 | | | | 517 | |
| Total expenses | | | 7,342,757 | | | | 580,170 | |
| Less: Fee waivers and/or expense reimbursements (Note 6) | | | (1,700,956 | ) | | | (254,733 | ) |
| Net expenses | | | 5,641,801 | | | | 325,437 | |
| Net investment income | | | 4,105,660 | | | | 58,700 | |
| | | | | | | | | |
| REALIZED AND UNREALIZED ON INVESTMENTS: | | | | | | | | |
| Net realized loss on: | | | | | | | | |
| Investments | | | (426,910 | ) | | | — | |
| Change in unrealized appreciation/depreciation on: | | | | | | | | |
| Investments | | | (360,887 | ) | | | — | |
| Net loss on investments and foreign currency | | | (787,797 | ) | | | — | |
| Increase in net assets from operations | | $ | 3,317,863 | | | $ | 58,700 | |
The accompanying notes are an integral part of these financial statements.
84
Alpine Mutual Funds
Statements of Changes in Net Assets
| | | Dynamic Dividend Fund |
| | | Six Months Ended | | Year Ended |
| | | April 30, 2013 | | October 31, 2012 |
| | | (Unaudited) | | | | | |
| OPERATIONS: | | | | | | | | | | |
| Net investment income | | | $ | 13,501,404 | | | | $ | 51,963,751 | |
| Net realized gain (loss) on: | | | | | | | | | | |
| Investments | | | | 22,735,894 | | | | | (48,992,235 | ) |
| Foreign currency transactions | | | | (93,665 | ) | | | | (31,786 | ) |
| Change in unrealized appreciation/(depreciation) on: | | | | | | | | | | |
| Investments | | | | (6,763,646 | ) | | | | 12,442,961 | |
| Foreign currency translations | | | | (445,414 | ) | | | | (435,742 | ) |
| Increase in net assets from operations | | | | 28,934,573 | | | | | 14,946,949 | |
| | | | | | | | | | | |
| DISTRIBUTIONS TO SHAREHOLDERS: | | | | | | | | | | |
| Distributions to Class A Shareholders: | | | | | | | | | | |
| From net investment income | | | | (84,607 | ) | | | | (51,261 | ) |
| From net realized gain on investments | | | | — | | | | | — | |
| Distributions to Institutional Class Shareholders: | | | | | | | | | | |
| From net investment income | | | | (14,865,683 | ) | | | | (53,985,717 | ) |
| From net realized gain on investments | | | | — | | | | | — | |
| Decrease in net assets from distributions to shareholders | | | | (14,950,290 | ) | | | | (54,036,978 | ) |
| | | | | | | | | | | |
| CAPITAL SHARE TRANSACTIONS (NOTE 3): | | | | | | | | | | |
| Net proceeds from shares sold | | | | 11,754,564 | | | | | 33,652,844 | |
| Dividends reinvested | | | | 9,816,188 | | | | | 34,379,418 | |
| Redemption fees | | | | 14,781 | | | | | 39,100 | |
| Cost of shares redeemed | | | | (116,697,136 | ) | | | | (134,334,741 | ) |
| Decrease in net assets from capital share transactions | | | | (95,111,603 | ) | | | | (66,263,379 | ) |
| Total decrease in net assets | | | | (81,127,320 | ) | | | | (105,353,408 | ) |
| | | | | | | | | | | |
| NET ASSETS: | | | | | | | | | | |
| Beginning of period | | | | 355,112,365 | | | | | 460,465,773 | |
| End of period* | | | $ | 273,985,045 | | | | $ | 355,112,365 | |
| * Including undistributed net investment income of: | | | $ | 5,610,853 | | | | $ | 7,059,739 | |
The accompanying notes are an integral part of these financial statements.
85
Alpine Mutual Funds
Statements of Changes in Net Assets—Continued
| | | Accelerating Dividend Fund |
| | | Six Months Ended | | Year Ended |
| | | April 30, 2013 | | October 31, 2012 |
| | | (Unaudited) | | | | |
| OPERATIONS: | | | | | | | | | | |
| Net investment income | | | $ | 61,220 | | | | $ | 117,447 | |
| Net realized gain (loss) on: | | | | | | | | | | |
| Investments | | | | 75,005 | | | | | 45,689 | |
| Foreign currency transactions | | | | 38 | | | | | (407 | ) |
| Change in unrealized appreciation/(depreciation) on: | | | | | | | | | | |
| Investments | | | | 254,146 | | | | | 162,663 | |
| Foreign currency translations | | | | (17 | ) | | | | 137 | |
| Increase in net assets from operations | | | | 390,392 | | | | | 325,529 | |
| | | | | | | | | | | |
| DISTRIBUTIONS TO SHAREHOLDERS: | | | | | | | | | | |
| Distributions to Class A Shareholders: | | | | | | | | | | |
| From net investment income | | | | (9,745 | ) | | | | (4,787 | ) |
| From net realized gain on investments | | | | (4,715 | ) | | | | — | |
| Distributions to Institutional Class Shareholders: | | | | | | | | | | |
| From net investment income | | | | (72,176 | ) | | | | (99,402 | ) |
| From net realized gain on investments | | | | (42,591 | ) | | | | (197,496 | ) |
| Decrease in net assets from distributions to shareholders | | | | (129,227 | ) | | | | (301,685 | ) |
| | | | | | | | | | | |
| CAPITAL SHARE TRANSACTIONS (NOTE 3): | | | | | | | | | | |
| Net proceeds from shares sold | | | | 576,583 | | | | | 575,695 | |
| Dividends reinvested | | | | 117,888 | | | | | 198,183 | |
| Cost of shares redeemed | | | | (70,167 | ) | | | | (1,603,733 | ) |
| Increase (decrease) in net assets from capital share transactions | | | | 624,304 | | | | | (829,855 | ) |
| Net Increase (decrease) in net assets | | | | 885,469 | | | | | (806,011 | ) |
| | | | | | | | | | | |
| NET ASSETS: | | | | | | | | | | |
| Beginning of period | | | | 2,412,185 | | | | | 3,218,196 | |
| End of period* | | | $ | 3,297,654 | | | | $ | 2,412,185 | |
| * Including undistributed net investment income of: | | | $ | 15,911 | | | | $ | 36,612 | |
The accompanying notes are an integral part of these financial statements.
86
Alpine Mutual Funds
Statements of Changes in Net Assets—Continued
| | | Financial Services Fund |
| | | Six Months Ended | | Year Ended |
| | | April 30, 2013 | | October 31, 2012 |
| | | (Unaudited) | | |
| OPERATIONS: | | | | | | | | | | |
| Net investment loss | | | $ | (7,307 | ) | | | $ | (14,068 | ) |
| Net realized gain (loss) on: | | | | | | | | | | |
| Investments | | | | 439,779 | | | | | 45,081 | |
| Foreign currency transactions | | | | (8,664 | ) | | | | (3,648 | ) |
| Change in unrealized appreciation/(depreciation) on: | | | | | | | | | | |
| Investments | | | | 1,673,677 | | | | | 1,484,702 | |
| Foreign currency translations | | | | 9,038 | | | | | (8,059 | ) |
| Increase in net assets from operations | | | | 2,106,523 | | | | | 1,504,008 | |
| |
| DISTRIBUTIONS TO SHAREHOLDERS: | | | | | | | | | | |
| Distributions to Class A Shareholders: | | | | | | | | | | |
| From net investment income | | | | — | | | | | — | |
| From net realized gain on investments | | | | — | | | | | — | |
| Distributions to Institutional Class Shareholders: | | | | | | | | | | |
| From net investment income | | | | — | | | | | — | |
| From net realized gain on investments | | | | — | | | | | — | |
| From tax return of capital | | | | — | | | | | (13,524 | ) |
| Decrease in net assets from distributions to shareholders | | | | — | | | | | (13,524 | ) |
| |
| CAPITAL SHARE TRANSACTIONS (NOTE 3): | | | | | | | | | | |
| Net proceeds from shares sold | | | | 7,995,622 | | | | | 3,612,158 | |
| Dividends reinvested | | | | — | | | | | 11,966 | |
| Redemption fees | | | | 32,848 | | | | | 2,282 | |
| Cost of shares redeemed | | | | (4,690,683 | ) | | | | (1,119,207 | ) |
| Increase in net assets from capital share transactions | | | | 3,337,787 | | | | | 2,507,199 | |
| Total increase in net assets | | | | 5,444,310 | | | | | 3,997,683 | |
| |
| NET ASSETS: | | | | | | | | | | |
| Beginning of period | | | | 10,248,575 | | | | | 6,250,892 | |
| End of period* | | | $ | 15,692,885 | | | | $ | 10,248,575 | |
| * Including accumulated net investment loss of: | | | $ | (9,126 | ) | | | $ | (1,819 | ) |
The accompanying notes are an integral part of these financial statements.
87
Alpine Mutual Funds
Statements of Changes in Net Assets—Continued
| | | Innovators Fund |
| | | Six Months Ended | | Year Ended |
| | | April 30, 2013 | | October 31, 2012 |
| | | (Unaudited) | | |
| OPERATIONS: | | | | | | | | | | |
| Net investment loss | | | $ | (53,703 | ) | | | $ | (122,459 | ) |
| Net realized gain (loss) on: | | | | | | | | | | |
| Investments | | | | 1,438,888 | | | | | 20,875 | |
| Foreign currency transactions | | | | 4 | | | | | (4,288 | ) |
| Change in unrealized appreciation/(depreciation) on investments | | | | (112,245 | ) | | | | 925,282 | |
| Increase in net assets from operations | | | | 1,272,944 | | | | | 819,410 | |
| |
| DISTRIBUTIONS TO SHAREHOLDERS: | | | | | | | | | | |
| Distributions to Class A Shareholders: | | | | | | | | | | |
| From net investment income | | | | — | | | | | — | |
| From net realized gain on investments | | | | — | | | | | — | |
| Distributions to Institutional Class Shareholders: | | | | | | | | | | |
| From net investment income | | | | — | | | | | — | |
| From net realized gain on investments | | | | — | | | | | — | |
| |
| CAPITAL SHARE TRANSACTIONS (NOTE 3): | | | | | | | | | | |
| Net proceeds from shares sold | | | | 149,654 | | | | | 1,635,064 | |
| Redemption fees | | | | 3 | | | | | 769 | |
| Cost of shares redeemed | | | | (974,461 | ) | | | | (1,850,248 | ) |
| Decrease in net assets from capital share transactions | | | | (824,804 | ) | | | | (214,415 | ) |
| Total increase in net assets | | | | 448,140 | | | | | 604,995 | |
| |
| NET ASSETS: | | | | | | | | | | |
| Beginning of period | | | | 10,988,398 | | | | | 10,383,403 | |
| End of period* | | | $ | 11,436,538 | | | | $ | 10,988,398 | |
| * Including accumulated net investment loss of: | | | $ | (160,031 | ) | | | $ | (106,328 | ) |
The accompanying notes are an integral part of these financial statements.
88
Alpine Mutual Funds
Statements of Changes in Net Assets—Continued
| | | Transformations Fund |
| | | Six Months Ended | | Year Ended |
| | | April 30, 2013 | | October 31, 2012 |
| | | (Unaudited) | | |
| OPERATIONS: | | | | | | | | | | |
| Net investment loss | | | $ | (5,488 | ) | | | $ | (39,568 | ) |
| Net realized gain (loss) on: | | | | | | | | | | |
| Investments | | | | 812,937 | | | | | 327,441 | |
| Foreign currency transactions | | | | 13 | | | | | (312 | ) |
| Change in unrealized appreciation/(depreciation) on: | | | | | | | | | | |
| Investments | | | | (290,621 | ) | | | | (334,488 | ) |
| Foreign currency translations | | | | 1 | | | | | 113 | |
| Increase (decrease) in net assets from operations | | | | 516,842 | | | | | (46,814 | ) |
| |
| DISTRIBUTIONS TO SHAREHOLDERS: | | | | | | | | | | |
| Distributions to Class A Shareholders: | | | | | | | | | | |
| From net investment income | | | | — | | | | | — | |
| From net realized gain on investments | | | | (722 | ) | | | | — | |
| Distributions to Institutional Class Shareholders: | | | | | | | | | | |
| From net investment income | | | | — | | | | | — | |
| From net realized gain on investments | | | | (41,395 | ) | | | | — | |
| Decrease in net assets from distributions to shareholders | | | | (42,117 | ) | | | | — | |
| |
| CAPITAL SHARE TRANSACTIONS (NOTE 3): | | | | | | | | | | |
| Net proceeds from shares sold | | | | 40,172 | | | | | 1,399,604 | |
| Dividends reinvested | | | | 41,872 | | | | | — | |
| Redemption fees | | | | 1 | | | | | 805 | |
| Cost of shares redeemed | | | | (411,905 | ) | | | | (1,446,510 | ) |
| Decrease in net assets from capital share transactions | | | | (329,860 | ) | | | | (46,101 | ) |
| Net Increase (decrease) in net assets | | | | 144,865 | | | | | (92,915 | ) |
| |
| NET ASSETS: | | | | | | | | | | |
| Beginning of period | | | | 6,174,011 | | | | | 6,266,926 | |
| End of period* | | | $ | 6,318,876 | | | | $ | 6,174,011 | |
| * Including accumulated net investment loss of: | | | $ | (40,534 | ) | | | $ | (35,046 | ) |
The accompanying notes are an integral part of these financial statements.
89
Alpine Mutual Funds
Statements of Changes in Net Assets—Continued
| | | Foundation Fund |
| | | Six Months Ended | | Year Ended |
| | | April 30, 2013 | | October 31, 2012 |
| | | (Unaudited) | | |
| OPERATIONS: | | | | | | | | | | |
| Net investment income | | | $ | 562,575 | | | | $ | 1,153,572 | |
| Net realized gain (loss) on: | | | | | | | | | | |
| Investments | | | | 1,959,944 | | | | | (3,613,947 | ) |
| Foreign currency transactions | | | | 502 | | | | | (1,028 | ) |
| Change in unrealized appreciation/(depreciation) on: | | | | | | | | | | |
| Investments | | | | 3,270,986 | | | | | 8,539,941 | |
| Foreign currency translations | | | | 5 | | | | | (14 | ) |
| Increase in net assets from operations | | | | 5,794,012 | | | | | 6,078,524 | |
| |
| DISTRIBUTIONS TO SHAREHOLDERS: | | | | | | | | | | |
| Distributions to Class A Shareholders: | | | | | | | | | | |
| From net investment income | | | | (770 | ) | | | | (1,213 | ) |
| From net realized gain on investments | | | | — | | | | | — | |
| Distributions to Institutional Class Shareholders: | | | | | | | | | | |
| From net investment income | | | | (539,535 | ) | | | | (1,083,670 | ) |
| From net realized gain on investments | | | | — | | | | | — | |
| Decrease in net assets from distributions to shareholders | | | | (540,305 | ) | | | | (1,084,883 | ) |
| |
| CAPITAL SHARE TRANSACTIONS (NOTE 3): | | | | | | | | | | |
| Net proceeds from shares sold | | | | 69,275 | | | | | 179,210 | |
| Dividends reinvested | | | | 527,523 | | | | | 1,057,319 | |
| Redemption fees | | | | 1 | | | | | — | |
| Cost of shares redeemed | | | | (747,385 | ) | | | | (2,425,427 | ) |
| Decrease in net assets from capital share transactions | | | | (150,586 | ) | | | | (1,188,898 | ) |
| Total increase in net assets | | | | 5,103,121 | | | | | 3,804,743 | |
| |
| NET ASSETS: | | | | | | | | | | |
| Beginning of period | | | | 65,505,940 | | | | | 61,701,197 | |
| End of period* | | | $ | 70,609,061 | | | | $ | 65,505,940 | |
| * Including undistributed net investment income of: | | | $ | 46,341 | | | | $ | 24,071 | |
The accompanying notes are an integral part of these financial statements.
90
Alpine Mutual Funds
Statements of Changes in Net Assets—Continued
| | | Ultra Short |
| | | Tax Optimized Income Fund |
| | | Six Months Ended | | Year Ended |
| | | April 30, 2013 | | October 31, 2012 |
| | | (Unaudited) | | |
| OPERATIONS: | | | | | | | | | | |
| Net investment income | | | $ | 4,105,660 | | | | $ | 15,890,877 | |
| Net realized gain (loss) on investments | | | | (426,910 | ) | | | | 106,992 | |
| Change in unrealized depreciation on investments | | | | (360,887 | ) | | | | (381,155 | ) |
| Increase in net assets from operations | | | | 3,317,863 | | | | | 15,616,714 | |
| |
| DISTRIBUTIONS TO SHAREHOLDERS: | | | | | | | | | | |
| Distributions to Class A Shareholders: | | | | | | | | | | |
| From net investment income | | | | (657,569 | ) | | | | (2,909,048 | ) |
| From net realized gain on investments | | | | — | | | | | — | |
| Distributions to Institutional Class Shareholders: | | | | | | | | | | |
| From net investment income | | | | (3,448,083 | ) | | | | (12,981,750 | ) |
| From net realized gain on investments | | | | — | | | | | — | |
| Decrease in net assets from distributions to shareholders | | | | (4,105,652 | ) | | | | (15,890,798 | ) |
| |
| CAPITAL SHARE TRANSACTIONS (NOTE 3): | | | | | | | | | | |
| Net proceeds from shares sold | | | | 294,207,390 | | | | | 1,341,370,692 | |
| Dividends reinvested | | | | 2,997,732 | | | | | 10,377,482 | |
| Redemption fees | | | | 33,055 | | | | | 37,617 | |
| Cost of shares redeemed | | | | (740,703,808 | ) | | | | (1,156,537,109 | ) |
| Increase (decrease) in net assets from capital share transactions | | | | (443,465,631 | ) | | | | 195,248,682 | |
| Total increase (decrease) in net assets | | | | (444,253,420 | ) | | | | 194,974,598 | |
| |
| NET ASSETS: | | | | | | | | | | |
| Beginning of period | | | | 1,819,087,229 | | | | | 1,624,112,631 | |
| End of period* | | | $ | 1,374,833,809 | | | | $ | 1,819,087,229 | |
| * Including undistributed net investment income of: | | | $ | 87 | | | | $ | 79 | |
The accompanying notes are an integral part of these financial statements.
91
Alpine Mutual Funds
Statements of Changes in Net Assets—Continued
| | | Municipal Money Market Fund |
| | | Six Months Ended | | Year Ended |
| | | April 30, 2013 | | October 31, 2012 |
| | | (Unaudited) | | |
| OPERATIONS: | | | | | | | | | | |
| Net investment income | | | $ | 58,700 | | | | $ | 264,781 | |
| Increase in net assets from operations | | | | 58,700 | | | | | 264,781 | |
| | | | | | | | | | | |
| DISTRIBUTIONS TO SHAREHOLDERS: | | | | | | | | | | |
| From net investment income | | | | (58,700 | ) | | | | (264,781 | ) |
| From net realized gain on investments | | | | — | | | | | — | |
| Decrease in net assets from distributions to shareholders | | | | (58,700 | ) | | | | (264,781 | ) |
| | | | | | | | | | | |
| CAPITAL SHARE TRANSACTIONS (NOTE 3): | | | | | | | | | | |
| Net proceeds from shares sold | | | | 82,563,012 | | | | | 209,368,876 | |
| Dividends reinvested | | | | 45,018 | | | | | 190,228 | |
| Cost of shares redeemed | | | | (112,707,367 | ) | | | | (290,975,342 | ) |
| Decrease in net assets from capital share transactions | | | | (30,099,337 | ) | | | | (81,416,238 | ) |
| Total decrease in net assets | | | | (30,099,337 | ) | | | | (81,416,238 | ) |
| | | | | | | | | | | |
| NET ASSETS: | | | | | | | | | | |
| Beginning of period | | | | 228,641,540 | | | | | 310,057,778 | |
| End of period* | | | $ | 198,542,203 | | | | $ | 228,641,540 | |
| * Including undistributed net investment income of: | | | $ | — | | | | $ | — | |
The accompanying notes are an integral part of these financial statements.
92
Alpine Mutual Funds
Financial Highlights
(For a share outstanding throughout each period)
| | | Dynamic Dividend Fund |
| | | Six Months | | Period |
| | | Ended | | Ended |
| | | April 30, | | October 31, |
| | | 2013 | | 2012 (a) |
| | | (Unaudited) | | |
| Class A: | | | | | | | | | | |
| Net asset value per share, beginning of period | | | $ | 3.49 | | | | $ | 3.61 | |
| Income from investment operations: | | | | | | | | | | |
| Net investment income | | | | 0.17 | | | | | 0.35 | |
| Net realized and unrealized gain (loss) on investments | | | | 0.16 | | | | | (0.06 | ) |
| Total from investment operations | | | | 0.33 | | | | | 0.29 | |
| Redemption fees | | | | 0.00 | (b) | | | | 0.00 | (b) |
| Less distributions: | | | | | | | | | | |
| From net investment income | | | | (0.16 | ) | | | | (0.41 | ) |
| Total distributions | | | | (0.16 | ) | | | | (0.41 | ) |
| Net asset value per share, end of period | | | $ | 3.66 | | | | $ | 3.49 | |
| | | | | | | | | | | |
| Total return | | | | 9.74 | %(c) | | | | 8.36 | %(c) |
| Ratios/Supplemental Data | | | | | | | | | | |
| Net Assets at end of period (000) | | | $ | 2,126 | | | | $ | 1,612 | |
| Ratio of total expenses to average net assets | | | | | | | | | | |
| Before waivers and/or expense reimbursements (d) | | | | 1.63 | %(e) | | | | 1.56 | %(e) |
| After waivers and/or expense reimbursements (f) | | | | 1.62 | %(e) | | | | —% | |
| Ratio of net investment income to average net assets | | | | 9.05 | %(e) | | | | 8.02 | %(e) |
| Portfolio turnover (g) | | | | 137 | %(c) | | | | 258 | % |
| (a) | Class A commenced operations on December 30, 2011. |
| | |
| (b) | The amount is less than $0.005 per share. |
| | |
| (c) | Not annualized. |
| | |
| (d) | Ratio of total expenses to average net assets excluding interest expense before waiver was 1.61% for the six months ended April 30, 2013, and 1.55% for the period ended October 31, 2012. |
| | |
| (e) | Annualized. |
| | |
| (f) | Ratio of total expenses to average net assets excluding interest expense after waiver was 1.60% for the six months ended April 30, 2013. |
| | |
| (g) | Portfolio turnover is calculated on the basis of the Fund as a whole, without distinguishing between classes of shares issued. |
The accompanying notes are an integral part of these financial statements.
93
Alpine Mutual Funds
Financial Highlights—Continued
(For a share outstanding throughout each period)
| | | Dynamic Dividend Fund |
| | | Six Months | | | | | | | | | | | | | | |
| | | Ended | | | | | | | | Year Ended | | | | | | |
| | | April 30, | | October 31, |
| | | 2013 | | 2012 | | 2011 | | 2010 | | 2009 | | 2008 |
| | | (Unaudited) | | | | | | | | | | | | | | | |
| Institutional Class: | | | | | | | | | | | | | | | | | | | | | | | | | | | | | | |
| Net asset value per share, beginning of period | | | $ | 3.49 | | | | $ | 3.84 | | | | $ | 4.48 | | | | $ | 4.78 | | | | $ | 5.72 | | | | $ | 13.32 | |
| Income from investment operations: | | | | | | | | | | | | | | | | | | | | | | | | | | | | | | |
| Net investment income | | | | 0.17 | | | | | 0.50 | | | | | 0.49 | | | | | 0.56 | | | | | 1.37 | (a) | | | | 1.33 | (a) |
| Net realized and unrealized gains (losses) on investments | | | | 0.16 | | | | | (0.35 | ) | | | | (0.59 | ) | | | | 0.00 | (b) | | | | (1.14 | ) | | | | (7.29 | ) |
| Total from investment operations | | | | 0.33 | | | | | 0.15 | | | | | (0.10 | ) | | | | 0.56 | | | | | 0.23 | | | | | (5.96 | ) |
| Redemption fees | | | | 0.00 | (b) | | | | 0.00 | (b) | | | | 0.00 | (b) | | | | 0.00 | (b) | | | | 0.00 | (b) | | | | 0.00 | (b) |
| Less distributions: | | | | | | | | | | | | | | | | | | | | | | | | | | | | | | |
| From net investment income | | | | (0.16 | ) | | | | (0.50 | ) | | | | (0.54 | ) | | | | (0.86 | ) | | | | (1.17 | ) | | | | (1.58 | ) |
| From tax return of capital | | | | — | | | | | — | | | | | — | | | | | — | | | | | — | | | | | (0.06 | ) |
| Total distributions | | | | (0.16 | ) | | | | (0.50 | ) | | | | (0.54 | ) | | | | (0.86 | ) | | | | (1.17 | ) | | | | (1.64 | ) |
| Net asset value per share, end of period | | | $ | 3.66 | | | | $ | 3.49 | | | | $ | 3.84 | | | | $ | 4.48 | | | | $ | 4.78 | | | | $ | 5.72 | |
| | | | | | | | | | | | | | | | | | | | | | | | | | | | | | | |
| Total return | | | | 9.88 | %(c) | | | | 4.46 | % | | | | (3.48 | )% | | | | 12.72 | % | | | | 6.64 | % | | | | (49.05 | )% |
| Ratios/Supplemental Data: | | | | | | | | | | | | | | | | | | | | | | | | | | | | | | |
| Net Assets at end of period (000) | | | $ | 271,859 | | | | $ | 353,501 | | | | $ | 460,466 | | | | $ | 628,844 | | | | $ | 572,151 | | | | $ | 598,759 | |
| Ratio of total expenses to average net assets | | | | | | | | | | | | | | | | | | | | | | | | | | | | | | |
| Before waivers and/or expense reimbursements (d) | | | | 1.37 | %(e) | | | | 1.28 | % | | | | 1.21 | % | | | | 1.21 | % | | | | 1.20 | % | | | | 1.18 | % |
| After waivers and/or expense reimbursements (f) | | | | 1.37 | %(e) | | | | — | % | | | | — | % | | | | — | % | | | | — | % | | | | — | % |
| Ratio of net investment income to average net assets | | | | 8.57 | %(e) | | | | 13.17 | % | | | | 10.39 | % | | | | 12.85 | % | | | | 26.04 | % | | | | 15.32 | % |
| Portfolio turnover (g) | | | | 137 | %(c) | | | | 258 | % | | | | 358 | % | | | | 506 | % | | | | 656 | % | | | | 323 | % |
| (a) | Net investment income per share is calculated using ending balances after consideration of adjustments for permanent book and tax differences. |
| (b) | The amount is less than $0.005 per share. |
| (d) | Ratio of total expenses to average net assets excluding interest expense before waivers and/or expense reimbursements was 1.36% for the six months ended April 30, 2013, and 1.27%, 1.18%, 1.18%, 1.18% and 1.16% for the years ended October 31, 2012, 2011, 2010, 2009, and 2008 respectively. |
| (f) | Ratio of total expenses to average net assets excluding interest expense after waivers and/or expense reimbursements was 1.35% for the six months ended April 30, 2013. |
| (g) | Portfolio turnover is calculated on the basis of the Fund as a whole, without distinguishing between classes of shares issued. |
The accompanying notes are an integral part of these financial statements.
94
Alpine Mutual Funds
Financial Highlights—Continued
(For a share outstanding throughout each period)
| | | Accelerating Dividend Fund |
| | | Six Months | | Period |
| | | Ended | | Ended |
| | | April 30, | | October 31, |
| | | 2013 | | 2012 (a) |
| | | (Unaudited) | | | |
| Class A: | | | | | | | | | | |
| Net asset value per share, beginning of period | | | $ | 12.88 | | | | $ | 12.02 | |
| Income from investment operations: | | | | | | | | | | |
| Net investment income | | | | 0.39 | | | | | 0.31 | |
| Net realized and unrealized gain on investments | | | | 1.47 | | | | | 0.92 | |
| Total from investment operations | | | | 1.86 | | | | | 1.23 | |
| Redemption fees | | | | — | | | | | — | |
| Less distributions: | | | | | | | | | | |
| From net investment income | | | | (0.38 | ) | | | | (0.37 | ) |
| From net realized gains on investments | | | | (0.24 | ) | | | | — | |
| Total distributions | | | | (0.62 | ) | | | | (0.37 | ) |
| Net asset value per share, end of period | | | $ | 14.12 | | | | $ | 12.88 | |
| | | | | | | | | | | |
| Total return | | | | 14.98 | %(b) | | | | 10.29 | %(b) |
| Net Assets at end of period (000) | | | $ | 657 | | | | $ | 257 | |
| Ratio of total expenses to average net assets: | | | | | | | | | | |
| Before waivers and/or expense reimbursements (c) | | | | 3.54 | %(d) | | | | 3.83 | %(d) |
| After waivers and/or expense reimbursements (e) | | | | 1.60 | %(d) | | | | 1.60 | %(d) |
| Ratio of net investment income to average net assets | | | | 5.06 | %(d) | | | | 2.71 | %(d) |
| Portfolio turnover (f) | | | | 44 | %(b) | | | | 73 | % |
| (a) | Class A commenced operations on December 30, 2011. |
| (c) | Ratio of total expenses to average net assets excluding interest expense before waivers and/or expense reimbursements was 3.54% for the six months ended April 30, 2013, and 3.83% for the period ended October 31, 2012. |
| (e) | Ratio of total expenses to average net assets excluding interest expense after waivers and/or expense reimbursements was 1.60% for the six months ended April 30, 2013, and 1.60% for the period ended October 31, 2012. |
| (f) | Portfolio turnover is calculated on the basis of the Fund as a whole, without distinguishing between classes of shares issued. |
The accompanying notes are an integral part of these financial statements.
95
Alpine Mutual Funds
Financial Highlights—Continued
(For a share outstanding throughout each period)
| | | | | | Accelerating Dividend Fund | | | | |
| | | Six Months | | | | | | Period | |
| | | Ended | | | Year Ended | | | Ended | |
| | | April 30, | | | October 31, | | | October 31, | |
| | | 2013 | | | 2012 | | | 2011 | | | 2010 | | | 2009 (a) | |
| | | (Unaudited) | | | | | | | | | | | | | |
| Institutional Class: | | | | | | | | | | | | | | | | | | | | |
| Net asset value per share, beginning of period | | $ | 12.88 | | | $ | 12.83 | | | $ | 12.80 | | | $ | 11.48 | | | $ | 10.00 | |
| Income from investment operations: | | | | | | | | | | | | | | | | | | | | |
| Net investment income | | | 0.27 | | | | 0.62 | | | | 0.51 | | | | 0.51 | | | | 0.12 | (b) |
| Net realized and unrealized gains on investments | | | 1.61 | | | | 0.73 | | | | 0.32 | | | | 1.29 | | | | 1.36 | |
| Total from investment operations | | | 1.88 | | | | 1.35 | | | | 0.83 | | | | 1.80 | | | | 1.48 | |
| Redemption fees | | | — | | | | — | | | | 0.00 | (c) | | | 0.00 | (c) | | | — | |
| Less distributions: | | | | | | | | | | | | | | | | | | | | |
| From net investment income | | | (0.40 | ) | | | (0.50 | ) | | | (0.58 | ) | | | (0.45 | ) | | | — | |
| From net realized gains on investments | | | (0.24 | ) | | | (0.80 | ) | | | (0.22 | ) | | | (0.03 | ) | | | — | |
| Total distributions | | | (0.64 | ) | | | (1.30 | ) | | | (0.80 | ) | | | (0.48 | ) | | | — | |
| Net asset value per share, end of period | | $ | 14.12 | | | $ | 12.88 | | | $ | 12.83 | | | $ | 12.80 | | | $ | 11.48 | |
| | | | | | | | | | | | | | | | | | | | | |
| Total return | | | 15.11 | %(d) | | | 11.28 | % | | | 6.43 | % | | | 16.06 | % | | | 14.80 | %(d) |
| Net Assets at end of period (000) | | $ | 2,641 | | | $ | 2,155 | | | $ | 3,218 | | | $ | 2,393 | | | $ | 1,215 | |
| Ratio of total expenses to average net assets: | | | | | | | | | | | | | | | | | | | | |
| Before waivers and/or expense reimbursements (e) | | | 3.29 | %(g) | | | 3.26 | % | | | 2.64 | % | | | 2.70 | % | | | 5.26 | %(g) |
| After waivers and/or expense reimbursements (f) | | | 1.35 | %(g) | | | 1.35 | % | | | 1.35 | % | | | 1.35 | % | | | 1.35 | %(g) |
| Ratio of net investment income to average net assets | | | 4.38 | %(g) | | | 4.52 | % | | | 4.09 | % | | | 4.85 | % | | | 1.19 | %(g) |
| Portfolio turnover (h) | | | 44 | %(d) | | | 73 | % | | | 137 | % | | | 225 | % | | | 104 | %(d) |
| (a) | For the period from November 5, 2008 (inception of fund) to October 31, 2009. |
| | |
| (b) | Net investment income per share is calculated using ending balances after consideration of adjustments for permanent book and tax differences. |
| | |
| (c) | The amount is less than $0.005 per share or 0.005%. |
| | |
| (d) | Not annualized. |
| | |
| (e) | Ratio of total expenses to average net assets excluding interest expense before waivers and/or expense reimbursements was 3.29% for the six months ended April 30, 2013, and 3.26%, 2.64%, 2.70% and 5.26% for the periods ended October 31, 2012, 2011, 2010 and 2009 respectively. |
| | |
| (f) | Ratio of total expenses to average net assets excluding interest expense After waivers and/or expense reimbursements was 1.35% for the six months ended April 30, 2013, and 1.33%, 1.35%, 1.35%, 1.35% and 1.35% for the periods ended October 31, 2012, 2011, 2010 and 2009 respectively. |
| | |
| (g) | Annualized. |
| | |
| (h) | Portfolio turnover is calculated on the basis of the Fund as a whole, without distinguishing between classes of shares issued. |
The accompanying notes are an integral part of these financial statements.
96
Alpine Mutual Funds
Financial Highlights—Continued
(For a share outstanding throughout each period)
| | | | Financial Services Fund | |
| | | | Six Months | | | | Period | |
| | | | Ended | | | | Ended | |
| | | | April 30, | | | | October 31, | |
| | | | 2013 | | | | 2012 (a) | |
| | | | (Unaudited) | | | | | |
| Class A: | | | | | | | | |
| Net asset value per share, beginning of period | | $ | 8.75 | | | $ | 6.90 | |
| Income from investment operations: | | | | | | | | |
| Net investment loss | | | (0.02 | ) | | | (0.01 | ) |
| Net realized and unrealized gain (loss) on investments | | | 1.64 | | | | 1.86 | |
| Total from investment operations | | | 1.62 | | | | 1.85 | |
| Redemption fees | | | 0.03 | | | | 0.00 | (d) |
| Less distributions: | | | | | | | | |
| From net investment income | | | — | | | | — | |
| From net realized gains on investments | | | — | | | | — | |
| From tax return of capital | | | — | | | | — | |
| Total distributions | | | — | | | | — | |
| Net asset value per share, end of period | | $ | 10.40 | | | $ | 8.75 | |
| | | | | | | | | |
| Total return | | | 18.86 | %(b) | | | 26.81 | %(b) |
| Ratios/Supplemental Data | | | | | | | | |
| Net Assets at end of period (000) | | $ | 4,675 | | | $ | 1,375 | |
| Ratio of total expenses to average net assets | | | | | | | | |
| Before waivers and/or expense reimbursements (e) | | | 1.86 | %(c) | | | 2.05 | %(c) |
| After waivers and/or expense reimbursements (f) | | | 1.60 | %(c) | | | 1.53 | %(c) |
| Ratio of net investment income to average net assets | | | (0.48 | )%(c) | | | (0.50 | )%(c) |
| Portfolio turnover (g) | | | 46 | %(b) | | | 120 | % |
| (a) | Class A commenced operations on December 30, 2011. |
| | |
| (b) | Not annualized. |
| | |
| (c) | Annualized. |
| | |
| (d) | The amount is less than $0.005 per share. |
| | |
| (e) | Ratio of total expenses to average net assets excluding interest expense before waivers and/or expense reimbursements was 1.86% for the six months ended April 30, 2013, and 2.05% for the period ended October 31, 2012. |
| | |
| (f) | Ratio of total expenses to average net assets excluding interest expense after waivers and/or expense reimbursements was 1.60% for the six months ended April 30, 2013, and 1.53% for the period ended October 31, 2012. |
| | |
| (g) | Portfolio turnover is calculated on the basis of the Fund as a whole, without distinguishing between classes of shares issued. |
The accompanying notes are an integral part of these financial statements.
97
Alpine Mutual Funds
Financial Highlights—Continued
(For a share outstanding throughout each period)
| | | Financial Services Fund | |
| | | Six Months | | | | | | | | | | | | | | | | |
| | | Ended | | | Year Ended | |
| | | April 30, | | | October 31, | |
| | | 2013 | | | 2012 | | | 2011 | | | 2010 | | | 2009 | | | 2008 | |
| | | (Unaudited) | | | | | | | | | | | | | | | | |
| Institutional Class: | | | | | | | | | | | | | | | | | | | | | | | | |
| Net asset value per share, beginning of period | | $ | 8.77 | | | $ | 7.15 | | | $ | 7.69 | | | $ | 6.86 | | | $ | 6.24 | | | $ | 13.89 | |
| Income from investment operations: | | | | | | | | | | | | | | | | | | | | | | | | |
| Net investment income (loss) | | | (0.00 | )(b) | | | 0.00 | (b) | | | 0.02 | | | | (0.01 | ) | | | 0.03 | (a) | | | 0.07 | (a) |
| Net realized and unrealized gains (losses) on investments | | | 1.64 | | | | 1.64 | | | | (0.54 | ) | | | 0.84 | | | | 1.10 | | | | (4.40 | ) |
| Total from investment operations | | | 1.64 | | | | 1.64 | | | | (0.52 | ) | | | 0.83 | | | | 1.13 | | | | (4.33 | ) |
| Redemption fees | | | 0.02 | | | | 0.00 | (b) | | | 0.00 | (b) | | | 0.00 | (b) | | | 0.00 | (b) | | | 0.01 | |
| Less distributions: | | | | | | | | | | | | | | | | | | | | | | | | |
| From net investment income | | | — | | | | — | | | | (0.01 | ) | | | — | | | | (0.10 | ) | | | — | |
| From net realized gains on investments | | | — | | | | — | | | | — | | | | — | | | | (0.41 | ) | | | (3.33 | ) |
| From tax return of capital | | | — | | | | (0.02 | ) | | | (0.01 | ) | | | — | | | | 0.00 | (b) | | | — | |
| Total distributions | | | — | | | | (0.02 | ) | | | (0.02 | ) | | | — | | | | (0.51 | ) | | | (3.33 | ) |
| Net asset value per share, end of period | | $ | 10.43 | | | $ | 8.77 | | | $ | 7.15 | | | $ | 7.69 | | | $ | 6.86 | | | $ | 6.24 | |
| | | | | | | | | | | | | | | | | | | | | | | | | |
| Total return | | | 18.93 | %(c) | | | 22.95 | % | | | (6.77 | )% | | | 12.26 | % | | | 21.83 | % | | | (41.16 | )% |
| Ratios/Supplemental Data: | | | | | | | | | | | | | | | | | | | | | | | | |
| Net Assets at end of period (000) | | $ | 11,017 | | | $ | 8,874 | | | $ | 6,251 | | | $ | 7,718 | | | $ | 7,895 | | | $ | 6,677 | |
| Ratio of total expenses to average net assets: | | | | | | | | | | | | | | | | | | | | | | | | |
| Before waivers and/or expense reimbursements (e) | | | 1.61 | %(d) | | | 1.94 | % | | | 1.85 | % | | | 1.85 | % | | | 2.06 | % | | | 1.94 | % |
| After waivers and/or expense reimbursements (f) | | | 1.35 | %(d) | | | 1.38 | % | | | 1.44 | % | | | 1.43 | % | | | 1.44 | % | | | 1.35 | % |
| Ratio of net investment income to average net assets | | | (0.01 | )%(d) | | | (0.16 | )% | | | 0.30 | % | | | (0.09 | )% | | | 0.39 | % | | | 1.32 | % |
| Portfolio turnover (g) | | | 46 | %(c) | | | 120 | % | | | 73 | % | | | 133 | % | | | 437 | % | | | 455 | % |
| (a) | Net investment income (loss) per share is calculated using ending balances after consideration of adjustments for permanent book and tax differences. |
| | |
| (b) | The amount is less than $0.005 per share. |
| | |
| (c) | Not annualized. |
| | |
| (d) | Annualized. |
| | |
| (e) | Ratio of total expenses to average net assets excluding interest expense before waivers and/or expense reimbursements was 1.61% for the six months ended April 30, 2013, and 1.91%, 1.75%, 1.77%, 1.97% and 1.57% for the years ended October 31, 2012, 2011, 2010, 2009 and 2008 respectively. |
| | |
| (f) | Ratio of total expenses to average net assets excluding interest expense after waivers and/or expense reimbursements was 1.35% for the six months ended April 30, 2013, and 1.35%, 1.35%, 1.35%, 1.35% and 0.98% for the years ended October 31, 2012, 2011, 2010, 2009 and 2008 respectively. |
| | |
| (g) | Portfolio turnover is calculated on the basis of the Fund as a whole, without distinguishing between classes of shares issued. |
The accompanying notes are an integral part of these financial statements.
98
Alpine Mutual Funds
Financial Highlights—Continued
(For a share outstanding throughout each period)
| | | Innovators Fund | |
| | | Six Months | | | Period | |
| | | Ended | | | Ended | |
| | | April 30, | | | October 31, | |
| | | 2013 | | | 2012 (a) | |
| | | (Unaudited) | | | | |
| Class A: | | | | | | | | |
| Net asset value per share, beginning of period | | $ | 11.30 | | | $ | 10.17 | |
| Income from investment operations: | | | | | | | | |
| Net investment loss | | | (0.07 | ) | | | (0.14 | ) |
| Net realized and unrealized gain on investments | | | 1.39 | | | | 1.27 | |
| Total from investment operations | | | 1.32 | | | | 1.13 | |
| Redemption fees | | | — | | | | — | |
| Less distributions: | | | | | | | | |
| From net investment income | | | — | | | | — | |
| Total distributions | | | — | | | | — | |
| Net asset value per share, end of period | | $ | 12.62 | | | $ | 11.30 | |
| | | | | | | | | |
| Total return | | | 11.68 | %(b) | | | 11.11 | %(b) |
| Ratios/Supplemental Data | | | | | | | | |
| Net Assets at end of period (000) | | $ | 124 | | | $ | 111 | |
| Ratio of total expenses to average net assets: | | | | | | | | |
| Before waivers and/or expense reimbursements | | | 1.94 | %(c) | | | 1.92 | %(c) |
| After waivers and/or expense reimbursements | | | 1.60 | %(c) | | | 1.60 | %(c) |
| Ratio of net investment loss to average net assets | | | (1.21 | )%(c) | | | (1.34 | )%(c) |
| Portfolio turnover (d) | | | 10 | %(b) | | | 29 | % |
| (a) | Class A commenced operations on December 30, 2011. |
| | |
| (b) | Not annualized. |
| | |
| (c) | Annualized. |
| | |
| (d) | Portfolio turnover is calculated on the basis of the Fund as a whole, without distinguishing between classes of shares issued. |
The accompanying notes are an integral part of these financial statements.
99
Alpine Mutual Funds
Financial Highlights—Continued
(For a share outstanding throughout each period)
| | | Innovators Fund | |
| | | Six Months | | | | | | | | | | | | | | | | |
| | | Ended | | | Year Ended | |
| | | April 30, | | | October 31, | |
| | | 2013 | | | 2012 | | | 2011 | | | 2010 | | | 2009 | | | 2008 | |
| | | (Unaudited) | | | | | | | | | | | | | | | | |
| Institutional Class: | | | | | | | | | | | | | | | | | | | | | | | | |
| Net asset value per share, beginning of period | | $ | 11.33 | | | $ | 10.48 | | | $ | 10.14 | | | $ | 8.13 | | | $ | 6.83 | | | $ | 14.08 | |
| Income from investment operations: | | | | | | | | | | | | | | | | | | | | | | | | |
| Net investment loss | | | (0.07 | ) | | | (0.13 | ) | | | (0.11 | ) | | | (0.10 | ) | | | — | (a) | | | (0.01 | )(a) |
| Net realized and unrealized gains (losses) on investments | | | 1.41 | | | | 0.98 | | | | 0.45 | | | | 2.11 | | | | 1.30 | | | | (6.84 | ) |
| Total from investment operations | | | 1.34 | | | | 0.85 | | | | 0.34 | | | | 2.01 | | | | 1.30 | | | | (6.85 | ) |
| Redemption fees | | | 0.00 | (b) | | | 0.00 | (b) | | | 0.00 | (b) | | | 0.00 | (b) | | | 0.00 | (b) | | | 0.03 | |
| Less distributions: | | | | | | | | | | | | | | | | | | | | | | | | |
| From net investment income | | | — | | | | — | | | | — | | | | — | | | | — | | | | (0.02 | ) |
| From net realized gains on investments | | | — | | | | — | | | | — | | | | — | | | | — | | | | (0.41 | ) |
| Total distributions | | | — | | | | — | | | | — | | | | — | | | | — | | | | (0.43 | ) |
| Net asset value per share, end of period | | $ | 12.67 | | | $ | 11.33 | | | $ | 10.48 | | | $ | 10.14 | | | $ | 8.13 | | | $ | 6.83 | |
| | | | | | | | | | | | | | | | | | | | | | | | | |
| Total return | | | 11.83 | %(c) | | | 8.11 | % | | | 3.35 | % | | | 24.72 | % | | | 19.03 | % | | | (49.95 | )% |
| Ratios/Supplemental Data: | | | | | | | | | | | | | | | | | | | | | | | | |
| Net Assets at end of period (000) | | $ | 11,312 | | | $ | 10,877 | | | $ | 10,383 | | | $ | 11,847 | | | $ | 11,108 | | | $ | 15,383 | |
| Ratio of total expenses to average net assets: | | | | | | | | | | | | | | | | | | | | | | | | |
| Before waivers and/or expense reimbursements (e) | | | 1.68 | %(d) | | | 1.67 | % | | | 1.59 | % | | | 1.70 | % | | | 1.86 | % | | | 1.31 | % |
| After waivers and/or expense reimbursements (f) | | | 1.35 | %(d) | | | 1.36 | % | | | 1.41 | % | | | 1.44 | % | | | 1.54 | % | | | 1.35 | % |
| Ratio of net investment loss to average net assets | | | (0.95 | )%(d) | | | (1.07 | )% | | | (0.97 | )% | | | (1.01 | )% | | | (0.92 | )% | | | (0.18 | )% |
| Portfolio turnover (g) | | | 10 | %(c) | | | 29 | % | | | 18 | % | | | 22 | % | | | 20 | % | | | 76 | % |
| (a) | Net investment income (loss) per share is calculated using ending balances after consideration of adjustments for permanent book and tax differences. |
| | |
| (b) | The amount is less than $0.005 per share. |
| | |
| (c) | Not annualized. |
| | |
| (d) | Annualized. |
| | |
| (e) | Ratio of total expenses to average net assets excluding interest expense before waivers and/or expense reimbursements was 1.68% for the six months ended April 30, 2013, and 1.66%, 1.53%, 1.61%, 1.67% and 1.27% for the years ended October 31, 2012, 2011, 2010, 2009 and 2008 respectively. |
| | |
| (f) | Ratio of total expenses to average net assets excluding interest expense after waivers and/or expense reimbursements was 1.35% for the six months ended April 30, 2013, and 1.35%, 1.35%, 1.35%, 1.35% and 1.31% for the years ended October 31, 2012, 2011, 2010, 2009 and 2008 respectively. |
| | |
| (g) | Portfolio turnover is calculated on the basis of the Fund as a whole, without distinguishing between classes of shares issued. |
The accompanying notes are an integral part of these financial statements.
100
Alpine Mutual Funds
Financial Highlights—Continued
(For a share outstanding throughout each period)
| | | Transformations Fund | |
| | | Six Months | | | Period | |
| | | Ended | | | Ended | |
| | | April 30, | | | October 31, | |
| | | 2013 | | | 2012 (a) | |
| | | (Unaudited) | | | | |
| Class A: | | | | | | | | |
| Net asset value per share, beginning of period | | $ | 11.70 | | | $ | 11.22 | |
| Income from investment operations: | | | | | | | | |
| Net investment loss | | | (0.03 | ) | | | (0.09 | ) |
| Net realized and unrealized gain on investments | | | 1.00 | | | | 0.57 | |
| Total from investment operations | | | 0.97 | | | | 0.48 | |
| Redemption fees | | | — | | | | 0.00 | (b) |
| Less distributions: | | | | | | | | |
| Net investment income | | | — | | | | — | |
| Net realized gains on investments | | | (0.08 | ) | | | — | |
| Total distributions | | | (0.08 | ) | | | — | |
| Net asset value per share, end of period | | $ | 12.59 | | | $ | 11.70 | |
| | | | | | | | | |
| Total return | | | 8.32 | %(c) | | | 4.28 | %(c) |
| Ratios/Supplemental Data | | | | | | | | |
| Net Assets at end of period (000) | | $ | 113 | | | $ | 104 | |
| Ratio of total expenses to average net assets: | | | | | | | | |
| Before waivers and/or expense reimbursements (d) | | | 2.28 | %(e) | | | 2.27 | %(e) |
| After waivers and/or expense reimbursements (f) | | | 1.60 | %(e) | | | 1.60 | %(e) |
| Ratio of net investment loss to average net assets | | | (0.42 | )%(e) | | | (0.85 | )%(e) |
| Portfolio turnover (g) | | | 26 | %(c) | | | 63 | % |
| (a) | Class A commenced operations on December 30, 2011. |
| | |
| (b) | The amount is less than $0.005 per share. |
| | |
| (c) | Not annualized. |
| | |
| (d) | Ratio of total expenses to average net assets excluding interest expense before waivers and/or expense reimbursements was 2.28% for the six months ended April 30, 2013, and 2.27% for the period ended October 31, 2012. |
| | |
| (e) | Annualized. |
| | |
| (f) | Ratio of total expenses to average net assets excluding interest expense after waivers and/or expense reimbursements was 1.60% for the six months ended April 30, 2013, and 1.60% for the period ended October 31, 2012. |
| | |
| (g) | Portfolio turnover is calculated on the basis of the Fund as a whole, without distinguishing between classes of shares issued. |
The accompanying notes are an integral part of these financial statements.
101
Alpine Mutual Funds
Financial Highlights—Continued
(For a share outstanding throughout each period)
| | | Transformations Fund | |
| | | Six Months | | | | | | | | | | | | | | | |
| | | Ended | | Period Ended | |
| | | April 30, | | October 31, | |
| | | 2013 | | 2012 | | | 2011 | | | 2010 | | | 2009 | | | 2008(a) | |
| | | (Unaudited) | | | | | | | | | | | | | | | |
| Institutional Class: | | | | | | | | | | | | | | | | | | | | | | | | | |
| Net asset value per share, beginning of period | | | $ | 11.73 | | | $ | 11.75 | | | $ | 10.30 | | | $ | 7.68 | | | $ | 5.79 | | | $ | 10.00 | |
| Income from investment operations: | | | | | | | | | | | | | | | | | | | | | | | | | |
| Net investment income (loss) | | | | (0.01 | ) | | | (0.07 | ) | | | (0.07 | ) | | | (0.06 | ) | | | 0.01 | (b) | | | 0.03 | (b) |
| Net realized and unrealized gains (losses) on investments | | | | 0.99 | | | | 0.05 | | | | 1.52 | | | | 2.68 | | | | 1.92 | | | | (4.24 | ) |
| Total from investment operations | | | | 0.98 | | | | (0.02 | ) | | | 1.45 | | | | 2.62 | | | | 1.93 | | | | (4.21 | ) |
| Redemption fees | | | | 0.00 | (c) | | | 0.00 | (c) | | | 0.00 | (c) | | | 0.00 | (c) | | | 0.00 | (c) | | | 0.00 | (c) |
| Less distributions: | | | | | | | | | | | | | | | | | | | | | | | | | |
| From net investment income | | | | — | | | | — | | | | — | | | | — | | | | (0.03 | ) | | | — | |
| From net realized gains on investments | | | | (0.08 | ) | | | — | | | | — | | | | — | | | | — | | | | — | |
| From tax return of capital | | | | — | | | | — | | | | — | | | | — | | | | (0.01 | ) | | | — | |
| Total distributions | | | | (0.08 | ) | | | — | | | | — | | | | — | | | | (0.04 | ) | | | — | |
| Net asset value per share, end of period | | | $ | 12.63 | | | $ | 11.73 | | | $ | 11.75 | | | $ | 10.30 | | | $ | 7.68 | | | $ | 5.79 | |
| | | | | | | | | | | | | | | | | | | | | | | | | | |
| Total return | | | | 8.38 | %(d) | | | (0.17 | )% | | | 14.08 | % | | | 34.11 | % | | | 33.61 | % | | | (42.10 | )%(d) |
| Ratios/Supplemental Data: | | | | | | | | | | | | | | | | | | | | | | | | | |
| Net Assets at end of period (000) | | | $ | 6,206 | | | $ | 6,070 | | | $ | 6,267 | | | $ | 5,294 | | | $ | 3,514 | | | $ | 2,649 | |
| Ratio of total expense to average net assets: | | | | | | | | | | | | | | | | | | | | | | | | | |
| Before waivers and/or expense reimbursements (e) | | | | 2.03 | %(f) | | | 1.98 | % | | | 1.68 | % | | | 2.17 | % | | | 2.86 | % | | | 2.95 | %(f) |
| After waivers and/or expense reimbursements (g) | | | | 1.35 | %(f) | | | 1.35 | % | | | 1.35 | % | | | 1.37 | % | | | 1.35 | % | | | 1.35 | %(f) |
| Ratio of net investment income (loss) to average net assets | | | | (0.17 | )%(f) | | | (0.58 | )% | | | (0.60 | )% | | | (0.68 | )% | | | (0.16 | )% | | | 0.44 | %(f) |
| Portfolio turnover (h) | | | | 26 | %(d) | | | 63 | % | | | 72 | % | | | 52 | % | | | 57 | % | | | 108 | %(d) |
| (a) | For the period from December 31, 2007 (inception of the Fund) to October 31, 2008. |
| | |
| (b) | Net investment income (loss) per share is calculated using ending balances after consideration of adjustments for permanent book and tax differences. |
| | |
| (c) | The amount is less than $0.005 per share. |
| |
| (d) | Not annualized. |
| | |
| (e) | Ratio of total expenses to average net assets excluding interest expense before waivers and/or expense reimbursements was 2.03% for the six months ended April 30, 2013, and 1.98%, 1.68%, 2.15%, 2.86% and 2.95% for the periods ended October 31, 2012, 2011, 2010, 2009 and 2008 respectively. |
| | |
| (f) | Annualized. |
| | |
| (g) | Ratio of total expenses to average net assets excluding interest expense after waivers and/or expense reimbursements was 1.35% for the six months ended April 30, 2013, and 1.35%, 1.35%, 1.35%, 1.35% and 1.35% for the periods ended October 31, 2012, 2011, 2010, 2009 and 2008 respectively. |
| | |
| (h) | Portfolio turnover is calculated on the basis of the Fund as a whole, without distinguishing between classes of shares issued. |
The accompanying notes are an integral part of these financial statements.
102
Alpine Mutual Funds
Financial Highlights—Continued
(For a share outstanding throughout each period)
| | | Foundation Fund | |
| | | Six Months
Ended
April 30,
2013 | | Period
Ended
October 31,
2012 (a) | |
| | | (Unaudited) | | | |
| Class A: | | | | | | | | |
| Net asset value per share, beginning of period | | $ | 11.47 | | | $ | 10.61 | |
| Income from investment operations: | | | | | | | | |
| Net investment income | | | 0.08 | | | | 0.14 | |
| Net realized and unrealized gain on investments | | | 0.92 | | | | 0.85 | |
| Total from investment operations | | | 1.00 | | | | 0.99 | |
| Redemption fees | | | — | | | | — | |
| Less distributions: | | | | | | | | |
| From net investment income | | | (0.08 | ) | | | (0.13 | ) |
| Total distributions | | | (0.08 | ) | | | (0.13 | ) |
| Net asset value per share, end of period | | $ | 12.39 | | | $ | 11.47 | |
| | | | | | | | | |
| Total return | | | 8.76 | %(b) | | | 9.33 | %(b) |
| Ratios/Supplemental Data | | | | | | | | |
| Net Assets at end of period (000) | | $ | 119 | | | $ | 109 | |
| Ratio of total expenses to average net assets | | | 1.48 | %(c) | | | 1.47 | %(c) |
| Ratio of net investment income to average net assets | | | 1.44 | %(c) | | | 1.49 | %(c) |
| Portfolio turnover (d) | | | 13 | %(b) | | | 36 | % |
| (a) | Class A commenced operations on December 30, 2011. |
| | |
| (b) | Not annualized. |
| | |
| (c) | Annualized. |
| | |
| (d) | Portfolio turnover is calculated on the basis of the Fund as a whole, without distinguishing between classes of shares issued. |
The accompanying notes are an integral part of these financial statements.
103
Alpine Mutual Funds
Financial Highlights—Continued
(For a share outstanding throughout each period)
| | | Foundation Fund | |
| | | Six Months
Ended | | | Year Ended | |
| | | April 30, | | | October 31, | |
| | | 2013 | | | 2012 | | | 2011 | | | 2010 | | | 2009 | | | 2008 | |
| | | (Unaudited) | | | | | | | | | | | | | | | | | | | | | |
| Institutional Class: | | | | | | | | | | | | | | | | | | | | | | | | | | |
| Net asset value per share, beginning of period | | | $ | 11.47 | | | | $ | 10.61 | | | $ | 10.16 | | | $ | 8.88 | | | $ | 8.15 | | | $ | 13.55 | |
| Income from investment operations: | | | | | | | | | | | | | | | | | | | | | | | | | | |
| Net investment income | | | | 0.10 | | | | | 0.20 | | | | 0.16 | | | | 0.12 | | | | 0.13 | (a) | | | 0.26 | (a) |
| Net realized and unrealized gains (losses) on investments | | | | 0.93 | | | | | 0.85 | | | | 0.47 | | | | 1.27 | | | | 0.75 | | | | (4.47 | ) |
| Total from investment operations | | | | 1.03 | | | | | 1.05 | | | | 0.63 | | | | 1.39 | | | | 0.88 | | | | (4.21 | ) |
| Redemption fees | | | | 0.00 | (b) | | | | — | | | | 0.00 | (b) | | | 0.00 | (b) | | | 0.00 | (b) | | | 0.00 | (b) |
| Less distributions: | | | | | | | | | | | | | | | | | | | | | | | | | | |
| Net investment income | | | | (0.10 | ) | | | | (0.19 | ) | | | (0.18 | ) | | | (0.11 | ) | | | (0.13 | ) | | | (0.25 | ) |
| From net realized gains on investments | | | | — | | | | | — | | | | — | | | | — | | | | — | | | | (0.93 | ) |
| From tax return of capital | | | | — | | | | | — | | | | — | | | | — | | | | (0.02 | ) | | | (0.01 | ) |
| Total distributions | | | | (0.10 | ) | | | | (0.19 | ) | | | (0.18 | ) | | | (0.11 | ) | | | (0.15 | ) | | | (1.19 | ) |
| Net asset value per share, end of period | | | $ | 12.40 | | | | $ | 11.47 | | | $ | 10.61 | | | $ | 10.16 | | | $ | 8.88 | | | $ | 8.15 | |
| | | | | | | | | | | | | | | | | | | | | | | | | | | |
| Total return | | | | 8.98 | %(c) | | | | 9.95 | % | | | 6.19 | % | | | 15.77 | % | | | 11.03 | % | | | (33.63 | )% |
| Ratios/Supplemental Data: | | | | | | | | | | | | | | | | | | | | | | | | | | |
| Net Assets at end of period (000) | | | $ | 70,490 | | | | $ | 65,397 | | | $ | 61,701 | | | $ | 62,934 | | | $ | 55,230 | | | $ | 53,097 | |
| Ratio of total expenses to average net assets (d) | | | | 1.23 | %(e) | | | | 1.21 | % | | | 1.16 | % | | | 1.23 | % | | | 1.26 | % | | | 1.24 | % |
| Ratio of net investment income to average net assets | | | | 1.69 | %(e) | | | | 1.79 | % | | | 1.46 | % | | | 1.22 | % | | | 1.65 | % | | | 2.35 | % |
| Portfolio turnover (f) | | | | 13 | %(c) | | | | 36 | % | | | 34 | % | | | 16 | % | | | 41 | % | | | 34 | % |
| (a) | Net investment income per share is calculated using ending balances after consideration of adjustments for permanent book and tax differences. |
| | |
| (b) | The amount is less than $0.005 per share. |
| | |
| (c) | Not annualized. |
| | |
| (d) | Ratio of total expenses to average net assets excluding interest expense was 1.23% for the six months ended April 30, 2013, and 1.21%, 1.16%, 1.23%, 1.26% and 1.15% for the years ended October 31, 2012, 2011, 2010, 2009, and 2008 respectively. |
| | |
| (e) | Annualized. |
| | |
| (f) | Portfolio turnover is calculated on the basis of the Fund as a whole, without distinguishing between classes of shares issued. |
The accompanying notes are an integral part of these financial statements.
104
Alpine Mutual Funds
Financial Highlights—Continued
(For a share outstanding throughout each period)
| | | Ultra Short Tax Optimized Income Fund | |
| | | Six Months | | | |
| | | Ended | | Year Ended | |
| | | April 30, | | October 31, | |
| | | 2013 | | 2012 | | | 2011 | | | 2010 | | | 2009 | | | 2008 | |
| | | (Unaudited) | | | | | | | | | | | | | | | | | | | | |
| Class A: | | | | | | | | | | | | | | | | | | | | | | | | | |
| Net asset value per share, beginning of period | | | $ | 10.10 | | | $ | 10.10 | | | $ | 10.10 | | | $ | 10.10 | | | $ | 10.05 | | | $ | 10.10 | |
| Income from investment operations: | | | | | | | | | | | | | | | | | | | | | | | | | |
| Net investment income | | | | 0.02 | | | | 0.07 | | | | 0.16 | | | | 0.10 | | | | 0.30 | (a) | | | 0.38 | (a) |
| Net realized and unrealized gain (loss) on investments | | | | (0.00) | (b) | | | (0.00) | (b) | | | (0.00) | (b) | | | 0.01 | | | | 0.04 | | | | (0.04 | ) |
| Total from investment operations | | | | 0.02 | | | | 0.07 | | | | 0.16 | | | | 0.11 | | | | 0.34 | | | | 0.34 | |
| Redemption fees | | | | (0.00) | (b) | | | (0.00) | (b) | | | (0.00) | (b) | | | (0.00) | (b) | | | (0.00) | (b) | | | (0.00) | (b) |
| Less distributions: | | | | | | | | | | | | | | | | | | | | | | | | | |
| Net investment income | | | | (0.02 | ) | | | (0.07 | ) | | | (0.16 | ) | | | (0.11 | ) | | | (0.29 | ) | | | (0.39 | ) |
| Total distributions | | | | (0.02 | ) | | | (0.07 | ) | | | (0.16 | ) | | | (0.11 | ) | | | (0.29 | ) | | | (0.39 | ) |
| Net asset value per share, end of period | | | $ | 10.10 | | | $ | 10.10 | | | $ | 10.10 | | | $ | 10.10 | | | $ | 10.10 | | | $ | 10.05 | |
| | | | | | | | | | | | | | | | | | | | | | | | | | |
| Total return | | | | 0.17 | %(c) | | | 0.70 | % | | | 1.61 | % | | | 1.05 | % | | | 3.40 | % | | | 3.39 | % |
| Ratios/Supplemental Data | | | | | | | | | | | | | | | | | | | | | | | | | |
| Net Assets at end of period (000) | | | $ | 355,793 | | | $ | 443,598 | | | $ | 358,284 | | | $ | 292,565 | | | $ | 211,643 | | | $ | 11,568 | |
| Ratio of total expenses to average net assets | | | | | | | | | | | | | | | | | | | | | | | | | |
| Before waivers and/or expense reimbursements | | | | 1.11 | %(d) | | | 1.09 | % | | | 1.07 | % | | | 1.03 | % | | | 1.05 | % | | | 1.08 | % |
| After waivers and/or expense reimbursements | | | | 0.89 | %(d) | | | 0.90 | % | | | 0.88 | % | | | 0.78 | % | | | 0.85 | % | | | 0.85 | % |
| Ratio of net investment income to average net assets | | | | 0.33 | %(d) | | | 0.67 | % | | | 1.61 | % | | | 1.04 | % | | | 2.75 | % | | | 4.12 | % |
| Portfolio turnover (e) | | | | 77 | %(c) | | | 192 | % | | | 174 | % | | | 19 | % | | | 16 | % | | | 129 | % |
| (a) | Net investment income per share is calculated using ending balances after consideration of adjustments for permanent book and tax differences. |
| | |
| (b) | The amount is less than $0.005 per share. |
| | |
| (c) | Not annualized. |
| | |
| (d) | Annualized. |
| | |
| (e) | Portfolio turnover is calculated on the basis of the Fund as a whole, without distinguishing between classes of shares issued. Effective January 3, 2012, the share class was renamed Class A. |
The accompanying notes are an integral part of these financial statements.
105
Alpine Mutual Funds
Financial Highlights—Continued
(For a share outstanding throughout each period)
| | | Ultra Short Tax Optimized Income Fund | |
| | | Six Months | | | |
| | | Ended | | Year Ended | |
| | | April 30, | | October 31, | |
| | | 2013 | | 2012 | | | 2011 | | | 2010 | | | 2009 | | | 2008 | |
| | | (Unaudited) | | | | | | | | | | | | | | | |
| Institutional Class: | | | | | | | | | | | | | | | | | | | | | | | | | |
| Net asset value per share, beginning of period | | | $ | 10.05 | | | $ | 10.05 | | | $ | 10.05 | | | $ | 10.05 | | | $ | 10.00 | | | $ | 10.04 | |
| Income from investment operations: | | | | | | | | | | | | | | | | | | | | | | | | | |
| Net investment income | | | | 0.03 | | | | 0.10 | | | | 0.19 | | | | 0.13 | | | | 0.31 | (a) | | | 0.41 | (a) |
| Net realized and unrealized gains (losses) on investments | | | | (0.01 | ) | | | (0.00) | (b) | | | (0.00) | (b) | | | (0.00) | (b) | | | 0.05 | | | | (0.04 | ) |
| Total from investment operations | | | | 0.02 | | | | 0.10 | | | | 0.19 | | | | 0.13 | | | | 0.36 | | | | 0.37 | |
| Redemption fees | | | | 0.00 | (b) | | | 0.00 | (b) | | | 0.00 | (b) | | | 0.00 | (b) | | | 0.00 | (b) | | | 0.00 | (b) |
| Less distributions: | | | | | | | | | | | | | | | | | | | | | | | | | |
| Net investment income | | | | (0.03 | ) | | | (0.10 | ) | | | (0.19 | ) | | | (0.13 | ) | | | (0.31 | ) | | | (0.41 | ) |
| Total distributions | | | | (0.03 | ) | | | (0.10 | ) | | | (0.19 | ) | | | (0.13 | ) | | | (0.31 | ) | | | (0.41 | ) |
| Net asset value per share, end of period | | | $ | 10.04 | | | $ | 10.05 | | | $ | 10.05 | | | $ | 10.05 | | | $ | 10.05 | | | $ | 10.00 | |
| | | | | | | | | | | | | | | | | | | | | | | | | | |
| Total return | | | | 0.19 | %(c) | | | 0.95 | % | | | 1.87 | % | | | 1.31 | % | | | 3.65 | % | | | 3.75 | % |
| Ratios/Supplemental Data: | | | | | | | | | | | | | | | | | | | | | | | | | |
| Net Assets at end of period (000) | | | $ | 1,019,041 | | | $ | 1,375,490 | | | $ | 1,265,829 | | | $ | 1,146,333 | | | $ | 1,462,217 | | | $ | 231,679 | |
| Ratio of total expenses to average net assets | | | | | | | | | | | | | | | | | | | | | | | | | |
| Before waivers and/or expense reimbursements | | | | 0.86 | %(d) | | | 0.84 | % | | | 0.82 | % | | | 0.78 | % | | | 0.80 | % | | | 0.83 | % |
| After waivers and/or expense reimbursements | | | | 0.64 | %(d) | | | 0.65 | % | | | 0.63 | % | | | 0.53 | % | | | 0.60 | % | | | 0.60 | % |
| Ratio of net investment income to average net assets | | | | 0.58 | %(d) | | | 0.95 | % | | | 1.86 | % | | | 1.29 | % | | | 3.00 | % | | | 4.37 | % |
| Portfolio turnover (e) | | | | 77 | %(c) | | | 192 | % | | | 174 | % | | | 19 | % | | | 16 | % | | | 129 | % |
| (a) | Net investment income per share is calculated using ending balances after consideration of adjustments for permanent book and tax differences. |
| | |
| (b) | The amount is less than $0.005 per share. |
| | |
| (c) | Not annualized. |
| | |
| (d) | Annualized. |
| | |
| (e) | Portfolio turnover is calculated on the basis of the Fund as a whole, without distinguishing between classes of shares issued. Effective January 3, 2012, the share class was renamed the Institutional Class. |
The accompanying notes are an integral part of these financial statements.
106
Alpine Mutual Funds
Financial Highlights—Continued
(For a share outstanding throughout each period)
| | | Municipal Money Market Fund | |
| | | Six Months | | | | | | | |
| | | Ended | | | Year Ended | |
| | | April 30, | | | October 31, | |
| | | 2013 | | | 2012 | | | 2011 | | | 2010 | | | 2009 | | | 2008 | |
| | | (Unaudited) | | | | | | | | | | | | | | | | |
| Investor Class: | | | | | | | | | | | | | | | | | | | | | | | | |
| Net asset value per share, beginning of period | | $ | 1.00 | | | $ | 1.00 | | | $ | 1.00 | | | $ | 1.00 | | | $ | 1.00 | | | $ | 1.00 | |
| Income from investment operations: | | | | | | | | | | | | | | | | | | | | | | | | |
| Net investment income | | | 0.00 | (a) | | | 0.00 | (a) | | | 0.00 | (a) | | | 0.00 | (a) | | | 0.01 | (b) | | | 0.03 | (b) |
| Total from investment operations | | | 0.00 | (a) | | | 0.00 | (a) | | | 0.00 | (a) | | | 0.00 | (a) | | | 0.01 | | | | 0.03 | |
| Less distributions: | | | | | | | | | | | | | | | | | | | | | | | | |
| From net investment income | | | (0.00 | )(a) | | | (0.00 | )(a) | | | (0.00 | )(a) | | | (0.00 | )(a) | | | (0.01 | ) | | | (0.03 | ) |
| From net realized gains on investments | | | — | | | | — | | | | (0.00 | )(a) | | | — | | | | — | | | | — | |
| Tax return of capital | | | — | | | | — | | | | — | | | | — | | | | (0.00 | )(a) | | | — | |
| Total distributions | | | (0.00 | )(a) | | | (0.00 | )(a) | | | (0.00 | )(a) | | | (0.00 | )(a) | | | (0.01 | ) | | | (0.03 | ) |
| Net asset value per share, end of period | | $ | 1.00 | | | $ | 1.00 | | | $ | 1.00 | | | $ | 1.00 | | | $ | 1.00 | | | $ | 1.00 | |
| | | | | | | | | | | | | | | | | | | | | | | | | |
| Total return | | | 0.03 | %(c) | | | 0.10 | % | | | 0.18 | % | | | 0.20 | % | | | 1.03 | % | | | 2.94 | % |
| Ratios/Supplemental Data: | | | | | | | | | | | | | | | | | | | | | | | | |
| Net Assets at end of period (000) | | $ | 198,542 | | | $ | 228,642 | | | $ | 310,058 | | | $ | 470,169 | | | $ | 789,832 | | | $ | 664,401 | |
| Ratio of total expenses to average net assets | | | | | | | | | | | | | | | | | | | | | | | | |
| Before waivers and/or expense reimbursements (e) | | | 0.57 | %(d) | | | 0.56 | % | | | 0.52 | % | | | 0.48 | % | | | 0.53 | % | | | 0.49 | % |
| After waivers and/or expense reimbursements (f) | | | 0.32 | %(d) | | | 0.32 | % | | | 0.38 | % | | | 0.43 | % | | | 0.53 | % | | | 0.35 | % |
| Ratio of net investment income to average net assets | | | 0.06 | %(d) | | | 0.10 | % | | | 0.18 | % | | | 0.20 | % | | | 0.99 | % | | | 2.93 | % |
| (a) | The amount is less than $0.005. |
| | |
| (b) | Net investment income per share is calculated using ending balances after consideration of adjustments for permanent book and tax differences. |
| | |
| (c) | Not annualized. |
| | |
| (d) | Annualized. |
| | |
| (e) | Ratio of total expenses to average net assets excluding interest expense before waivers and/or expense reimbursements was 0.57% for the six months ended April 30, 2013, and 0.56%, 0.52%, 0.48%, 0.53% and 0.49% for the years ended October 31, 2012, 2011, 2010, 2009 and 2008 respectively. |
| | |
| (f) | Ratio of total expenses to average net assets excluding interest expense after waivers and/or expense reimbursements was 0.32% for the six months ended April 30, 2013, and 0.32%, 0.38%, 0.43%, 0.53% and 0.35% for the years ended October 31, 2012, 2011, 2010, 2009 and 2008 respectively. |
| | |
| | Effective January 3, 2012, the Investor Class was renamed the Institutional Class and subsequently reverted to the Investor Class effective July 26, 2012. |
The accompanying notes are an integral part of these financial statements.
107
Alpine Mutual Funds
Notes to Financial Statements
April 30, 2013 (Unaudited)
1. Organization:
Alpine Series Trust (the “Series Trust”) was organized in 2001 as a Delaware Statutory Trust, and is registered under the Investment Company Act of 1940, as amended (the “1940 Act”), as an open-end management investment company. Alpine Income Trust (the “Income Trust”) was organized in 2002 as a Delaware statutory trust, and is registered under the 1940 Act, as an open-end management investment company. The Alpine Dynamic Dividend Fund, Alpine Accelerating Dividend Fund, Alpine Financial Services Fund, Alpine Innovators Fund, Alpine Transformations Fund and Alpine Foundation Fund are six separate funds of the Series Trust. The Alpine Ultra Short Tax Optimized Income Fund and Alpine Municipal Money Market Fund are two separate funds of the Income Trust. The Alpine Dynamic Dividend Fund, Alpine Accelerating Dividend Fund, Alpine Financial Services Fund, Alpine Innovators Fund, Alpine Transformations Fund, Alpine Foundation Fund, Alpine Ultra Short Tax Optimized Income Fund and Alpine Municipal Money Market Fund (individually referred to as a “Fund” and collectively, “the Funds”) are diversified funds. Alpine Woods Capital Investors, LLC (the “Adviser”) is a Delaware limited liability company and serves as the investment manager to the Funds.
2. Significant Accounting Policies:
The following is a summary of significant accounting policies consistently followed by the Funds in the preparation of their financial statements. The policies are in conformity with accounting principles generally accepted in the United States of America (“GAAP”), which require management to make estimates and assumptions that affect amounts reported herein. Actual results could differ from those estimates. Changes in the economic environment, financial markets and any other parameters used in determining these estimates could cause actual results to differ.
A. Valuation of Securities:
The net asset value (“NAV”) of shares of the Funds are calculated by dividing the value of the Funds’ net assets by the number of outstanding shares. NAV is determined each day the New York Stock Exchange (“NYSE”) is open as of the close of regular trading (normally, 4:00 p.m., Eastern time). In computing NAV, portfolio securities of the Funds are valued at their current market values determined on the basis of market quotations or if market quotations are not available or determined to be reliable, through procedures and/or guidelines established by the Board of Trustees. In computing the Funds’ net asset values, equity securities that are traded on a securities exchange in the United States are valued at the last reported sale price as of the time of valuation, or lacking any current reported sale at the time of valuation, at the mean between the most recent bid and asked quotations. Each option security traded on a securities exchange in the United States is valued at the last current reported sale price as of the time of valuation, or lacking any current reported sale at the time of valuation, the option is valued at the mid-point of the consolidated bid/ask quote for the option security. Forward currency contracts are valued based on third-party vendor quotations. Each security traded in the over-the-counter market and quoted on the NASDAQ National Market System, is valued at the NASDAQ Official Closing Price (“NOCP”), as determined by NASDAQ, or lacking an NOCP, the last current reported sale price as of the time of valuation by NASDAQ, or lacking any current reported sale on NASDAQ at the time of valuation, at the mean between the most recent bid and asked quotations. Each over-the-counter option that is not traded through the Options Clearing Corporation is valued by the counterparty, or if the counterparty’s price is not readily available then by using the Black-Scholes method. Debt securities are valued based on an evaluated mean price as furnished by pricing services approved by the Board of Trustees, which may be based on market transactions for comparable securities and various relationships between securities that are generally recognized by institutional traders, a computerized matrix system, or appraisals derived from information concerning the securities or similar securities received from recognized dealers in those securities. Short-term securities with maturities of 60 days or less are valued at amortized cost, which approximates fair value.
Equity securities that are principally traded in a foreign market are valued at the last current sale price at the time of valuation or lacking any current or reported sale, at the time of valuation, at the mean between the most recent bid and asked quotations as of the close of the appropriate exchange or other designated time.
Trading in securities on European and Far Eastern securities exchanges and over-the-counter markets is normally completed at various times before the close of business on each day on which the NYSE is open. Trading of these securities may not take place on every NYSE business day. In addition, trading may take place in various foreign markets on Saturdays or on other days when the NYSE is not open and on which the Funds’ net asset values are not calculated. As stated above, if the market prices are not readily available or not reflective of the fair value of the
108
Alpine Mutual Funds
Notes to Financial Statements—Continued
April 30, 2013 (Unaudited)
security, as of the close of the regular trading on the NYSE, the security will be priced at fair value following procedures approved by the Board of Trustees.
When market quotations are not readily available or when the valuation methods mentioned above are not reflective of a fair value of the security, the security is valued at fair value following procedures and/or guidelines approved by the Board of Trustees. The Board has approved the use of Interactive Data’s proprietary fair value pricing model to assist in determining current valuation for foreign securities traded in markets that close prior to the NYSE. When fair value pricing is employed, the value of the portfolio security used to calculate the Fund’s net asset values may differ from quoted or official closing prices.
As of April 30, 2013, the Dynamic Dividend Fund held a security that is fair valued, which comprised 0.0% of the Fund’s net assets.
The Municipal Money Market Fund values its investments at amortized cost, which approximates market value. Pursuant to Rule 2a-7 under the 1940 Act, amortized cost, as defined, is a method of valuing securities at acquisition cost, adjusted for amortization of premium or accretion of discount rather than at their value based on current market factors.
The Funds’ have adopted Financial Accounting Standards Board (“FASB”) Codification Topic 820 (“ASC Topic 820”). ASC Topic 820 establishes a single definition of fair value, creates a three-tier hierarchy as a framework for measuring fair value based on inputs used to value the Funds’ investments, and requires additional disclosure about fair value. The hierarchy of inputs is summarized below.
| • Level 1 — | quoted prices in active markets for identical investments |
| • Level 2 — | other significant observable inputs (including quoted prices for similar investments, interest rates, prepayment speeds, credit risk, etc.) |
| • Level 3 — | significant unobservable inputs (including the Fund’s own assumptions in determining the fair value of investments) |
The inputs or methodology used for valuing securities are not necessarily an indication of the risk associated with investing in those securities.
The Funds use valuation techniques to measure fair value that are consistent with the market approach and/or income approach, depending on the type of security and the particular circumstance. The market approach uses prices and other relevant information generated by market transactions involving identical or comparable securities. The income approach uses valuation techniques to discount estimated future cash flows to present value.
The following is a summary of the inputs used in valuing the Fund’s assets and liabilities carried at fair value:
| | | | Valuation Inputs | | | | | |
| Dynamic Dividend Fund | | | Level 1 | | | | Level 2 | | | | Level 3 | | | | Total Value | |
| Common Stocks | | | | | | | | | | | | | | | | |
| Consumer Discretionary | | $ | 32,778,005 | | | $ | — | | | $ | — | | | $ | 32,778,005 | |
| Consumer Staples | | | 29,489,724 | | | | — | | | | 17,514 | | | | 29,507,238 | |
| Energy | | | 22,253,969 | | | | — | | | | — | | | | 22,253,969 | |
| Financials | | | 57,203,536 | | | | 1,424,531 | | | | — | | | | 58,628,067 | |
| Health Care | | | 25,814,132 | | | | — | | | | — | | | | 25,814,132 | |
| Industrials | | | 35,280,511 | | | | — | | | | — | | | | 35,280,511 | |
| Information Technology | | | 31,775,453 | | | | — | | | | — | | | | 31,775,453 | |
| Materials | | | 4,665,974 | | | | — | | | | — | | | | 4,665,974 | |
| Telecommunication Services | | | 9,170,570 | | | | — | | | | — | | | | 9,170,570 | |
| Utilities | | | 11,963,278 | | | | — | | | | — | | | | 11,963,278 | |
| Equity-Linked Structured Notes | | | — | | | | 2,089,117 | | | | — | | | | 2,089,117 | |
| Convertible Bonds | | | — | | | | 176,019 | | | | — | | | | 176,019 | |
| Total | | $ | 260,395,152 | | | $ | 3,689,667 | | | $ | 17,514 | | | $ | 264,102,333 | |
109
Alpine Mutual Funds
Notes to Financial Statements—Continued
April 30, 2013 (Unaudited)
| | | | Valuation Inputs | | | | | |
| Other Financial Instruments | | | Level 1 | | | | Level 2 | | | | Level 3 | | | Total Value | |
| Liabilities | | | | | | | | | | | | | | | | |
| Forward Currency Contracts | | $ | — | | | $ | (452,813 | ) | | $ | — | | | $ | (452,813 | ) |
| Total | | $ | — | | | $ | (452,813 | ) | | $ | — | | | $ | (452,813 | ) |
| | | | | | | | | | | | | | | | | |
| | | | Valuation Inputs | | | | | |
| Accelerating Dividend Fund* | | | Level 1 | | | | Level 2 | | | | Level 3 | | | Total Value | |
| Common Stocks | | $ | 3,024,151 | | | $ | — | | | $ | — | | | $ | 3,024,151 | |
| Equity-Linked Structured Notes | | | — | | | | 16,713 | | | | — | | | | 16,713 | |
| Short-Term Investments | | | — | | | | 306,000 | | | | — | | | | 306,000 | |
| Total | | $ | 3,024,151 | | | $ | 322,713 | | | $ | — | | | $ | 3,346,864 | |
| | | | | | | | | | | | | | | | | |
| | | | Valuation Inputs | | | | | |
| Financial Services Fund | | | Level 1 | | | | Level 2 | | | | Level 3 | | | Total Value | |
| Common Stocks | | | | | | | | | | | | | | | | |
| Capital Markets | | $ | 2,565,643 | | | $ | — | | | $ | — | | | $ | 2,565,643 | |
| Commercial Banks | | | 5,709,067 | | | | 195,300 | | | | — | | | | 5,904,367 | |
| Commercial Services & Supplies | | | 82,069 | | | | — | | | | — | | | | 82,069 | |
| Consumer Finance | | | 824,737 | | | | — | | | | — | | | | 824,737 | |
| Diversified Financial Services | | | 1,194,346 | | | | — | | | | — | | | | 1,194,346 | |
| Insurance | | | 1,045,818 | | | | — | | | | — | | | | 1,045,818 | |
| IT Services | | | 226,391 | | | | — | | | | — | | | | 226,391 | |
| Real Estate Investment Trusts | | | 832,141 | | | | — | | | | — | | | | 832,141 | |
| Thrifts & Mortgage Finance | | | 1,742,585 | | | | — | | | | — | | | | 1,742,585 | |
| Trading Companies & Distributors | | | 107,077 | | | | — | | | | — | | | | 107,077 | |
| Preferred Stocks | | | 35,736 | | | | — | | | | — | | | | 35,736 | |
| Investment Companies | | | 181,566 | | | | — | | | | — | | | | 181,566 | |
| Rights | | | — | | | | 446 | | | | — | | | | 446 | |
| Short-Term Investments | | | — | | | | 1,243,000 | | | | — | | | | 1,243,000 | |
| Total | | $ | 14,547,176 | | | $ | 1,438,746 | | | $ | — | | | $ | 15,985,922 | |
| | | | | | | | | | | | | | | | | |
| | | | Valuation Inputs | | | | | |
| Innovators Fund* | | | Level 1 | | | | Level 2 | | | | Level 3 | | | Total Value | |
| Common Stocks | | $ | 9,528,594 | | | $ | — | | | $ | — | | | $ | 9,528,594 | |
| Short-Term Investments | | | — | | | | 1,979,000 | | | | — | | | | 1,979,000 | |
| Total | | $ | 9,528,594 | | | $ | 1,979,000 | | | $ | — | | | $ | 11,507,594 | |
| | | | | | | | | | | | | | | | | |
| | | | Valuation Inputs | | | | | |
| Transformations Fund* | | | Level 1 | | | | Level 2 | | | | Level 3 | | | Total Value | |
| Common Stocks | | $ | 5,372,682 | | | $ | — | | | $ | — | | | $ | 5,372,682 | |
| Short-Term Investments | | | — | | | | 910,000 | | | | — | | | | 910,000 | |
| Total | | $ | 5,372,682 | | | $ | 910,000 | | | $ | — | | | $ | 6,282,682 | |
110
Alpine Mutual Funds
Notes to Financial Statements—Continued
April 30, 2013 (Unaudited)
| | | Valuation Inputs | | | | |
| Foundation Fund* | | Level 1 | | | Level 2 | | | Level 3 | | | Total Value | |
| Common Stocks | | $ | 47,484,035 | | | $ | — | | | $ | — | | | $ | 47,484,035 | |
| Bonds | | | — | | | | 17,322,030 | | | | — | | | | 17,322,030 | |
| Short-Term Investments | | | — | | | | 5,996,000 | | | | — | | | | 5,996,000 | |
| Total | | $ | 47,484,035 | | | $ | 23,318,030 | | | $ | — | | | $ | 70,802,065 | |
| | | Valuation Inputs | | | | |
| Ultra Short Tax Optimized Income Fund* | | Level 1 | | | Level 2 | | | Level 3 | | | Total Value | |
| Municipal Bonds | | $ | — | | | $ | 1,426,238,088 | | | $ | — | | | $ | 1,426,238,088 | |
| Money Market Funds | | | — | | | | 32,990 | | | | — | | | | 32,990 | |
| Total | | $ | — | | | $ | 1,426,271,078 | | | $ | — | | | $ | 1,426,271,078 | |
| | | Valuation Inputs | | | | |
| Municipal Money Market Fund* | | Level 1 | | | Level 2 | | | Level 3 | | | Total Value | |
| Municipal Bonds | | $ | — | | | $ | 198,630,813 | | | $ | — | | | $ | 198,630,813 | |
| Money Market Funds | | | — | | | | 89,804 | | | | — | | | | 89,804 | |
| Total | | $ | — | | | $ | 198,720,617 | | | $ | — | | | $ | 198,720,617 | |
| * | For detailed country, sector, and state descriptions, see accompanying Schedule of Portfolio Investments. |
For the period ended April 30, 2013, there were no transfers between Level 1, Level 2 and Level 3.
Following is a reconciliation of Level 3 assets for which significant unobservable inputs were used to determine fair value:
| | | Dynamic
Dividend
Fund | |
| Balance as of October 31, 2012 | | $ | 287,601 | |
| Realized loss | | | — | |
| Change in unrealized depreciation* | | | (270,087 | ) |
| Purchases | | | — | |
| Sales | | | — | |
| Transfers in to Level 3** | | | — | |
| Transfers out of Level 3** | | | — | |
| Balance as of April 30, 2013 | | $ | 17,514 | |
| | | | | |
| Change in net unrealized depreciation on Level 3 holdings held at year end | | $ | (270,087 | ) |
| * | Statements of Operations Location: Changes in net unrealized appreciation/depreciation on investments. |
| | |
| ** | The Funds recognize transfers as of the beginning of the year. |
111
Alpine Mutual Funds
Notes to Financial Statements—Continued
April 30, 2013 (Unaudited)
B. Security Transactions and Investment Income:
Security transactions are accounted for on a trade date basis. Realized gains and losses are computed on the identified cost basis. Interest income is recorded on the accrual basis and includes accretion of discounts and amortization of premiums, where applicable. To the extent any issuer defaults or a credit event occurs that impacts the issuer, the Funds’ may halt any additional interest income accruals and consider the realizability of interest accrued up to the date of default or credit event. Dividend income is recorded on the ex-dividend date or in the case of some foreign securities, on the date thereafter when the Funds are made aware of the dividend. Foreign income may be subject to foreign withholding taxes, which are accrued as applicable. Capital gains realized on some foreign securities are subject to foreign taxes, which are accrued as applicable. Dividends and interest from non-U.S. sources received by the Funds are generally subject to non-U.S. withholding taxes at rates ranging up to 30%. Such withholding taxes may be reduced or eliminated under the terms of applicable U.S. income tax treaties, and the Funds intend to undertake procedural steps to claim the benefits of such treaties.
C. Line of Credit and Custody Overdrafts:
On December 1, 2010 the Series Trust entered into a lending agreement with BNP Paribas through its New York branch (“BNPP NY”). Loans in aggregate, whether to cover overdrafts or for investment purposes, may not exceed the maximum amount that is permitted under the 1940 Act. The terms of the lending agreement indicate the rate to be the Fed Funds rate plus 0.95% per annum on amounts borrowed. The BNP Paribas Facility provides for secured, uncommitted lines of credit for the Funds where selected Funds assets are pledged against advances made to the respective Fund. Each Fund is permitted to borrow up to 33.33% of its total assets for extraordinary or emergency purposes. Additionally, the following Funds are permitted to borrow up to 10% of its total assets for investment purposes but in no case shall any Fund’s total outstanding borrowings exceed 33.33% of its total assets: Dynamic Dividend Fund, Accelerating Dividend Fund, Financial Services Fund, Innovators Fund, Transformations Fund and Foundation Fund. Either BNPP NY or the Funds may terminate this agreement upon delivery of written notice. For the period ended April 30, 2013, the average interest rate paid on outstanding borrowings under the line of credit was 1.10% and 1.13%, for the Dynamic Dividend Fund and Financial Services Fund, respectively. The Funds may also incur interest expense on custody overdraft charges.
| | | Dynamic | | | Accelerating | | | Financial | | | | |
| | | Dividend | | | Dividend | | | Services | | | Innovators | |
| | | Fund | | | Fund | | | Fund | | | Fund | |
| Total line of credit amount available for investment purposes at April 30, 2013 | | | $28,901,363 | | | | $341,939 | | | | $1,641,623 | | | | $1,169,865 | |
| Line of credit outstanding at April 30, 2013 | | | 2,969,628 | | | | — | | | | — | | | | — | |
| Line of credit amount unused at April 30, 2013 | | | 25,931,735 | | | | 341,939 | | | | 1,641,623 | | | | 1,169,865 | |
| Average balance outstanding during the period | | | 4,479,071 | | | | — | | | | 10,934 | | | | — | |
| Interest expense incurred on line of credit during the period | | | 24,876 | | | | — | | | | 62 | | | | — | |
| Interest expense incurred on custody overdrafts during the period | | | 463 | | | | — | | | | 4 | | | | — | |
| | | Transformations | | | Foundation | |
| | | Fund | | | Fund | |
| Total line of credit amount available for investment purposes at April 30, 2013 | | | $638,402 | | | | $7,106,286 | |
| Line of credit outstanding at April 30, 2013 | | | — | | | | — | |
| Line of credit amount unused at April 30, 2013 | | | 638,402 | | | | 7,106,286 | |
| Average balance outstanding during the period | | | — | | | | — | |
| Interest expense incurred on line of credit during the period | | | — | | | | — | |
| Interest expense incurred on custody overdrafts during the period | | | — | | | | 3 | |
The line of credit outstanding as of April 30, 2013 approximates its fair value and would be categorized at Level 2.
112
Alpine Mutual Funds
Notes to Financial Statements—Continued
April 30, 2013 (Unaudited)
D. Federal and Other Income Taxes:
It is each Fund’s policy to comply with the Federal income and excise tax requirements of the Internal Revenue Code of 1986 (the “Code”), as amended applicable to regulated investment companies and to distribute timely, all of its investment company taxable income and net realized capital gains to shareholders in accordance with the timing requirements imposed by the Code. Therefore, no Federal income tax provision is recorded. Under applicable foreign tax laws, a withholding tax may be imposed on interest, dividends, and capital gains earned on foreign investments. Where available, the Funds will file refund claims for foreign taxes withheld.
Management has analyzed the Funds’ tax positions taken on income tax returns for all open tax years and has concluded that as of April 30, 2013, no provision for income tax is required in the Funds’ financial statements. The Fund’s Federal and state income and Federal excise tax returns for tax years for which the applicable statutes of limitations have not expired are subject to examination by Internal Revenue Service and state departments of revenue.
GAAP requires that certain components of net assets be reclassified to reflect permanent differences between financial and tax reporting. These reclassifications have no effect on net assets or net asset values per share.
E. Distributions to Shareholders:
Each of the Dynamic Dividend, Accelerating Dividend, Financial Services, Innovators, Transformations, Foundation and Ultra Short Tax Optimized Income Funds intends to distribute all of its net investment income and net realized capital gains, if any, throughout the year to its shareholders in the form of dividends. The Municipal Money Market Fund declares and accrues dividends daily on each business day based upon the Fund’s net income, and pays dividends monthly. Distributions to shareholders are recorded at the close of business on the ex-dividend date. All dividends are automatically reinvested in full and fractional shares of the Fund at net asset value per share, unless otherwise requested.
The amounts of dividends from net investment income and of distributions from net realized gains are determined in accordance with Federal income tax regulations, which may differ from GAAP. These differences are either considered temporary or permanent in nature. To the extent these differences are permanent in nature, such amounts are reclassified within the composition of net assets based on their Federal tax-basis treatment; temporary differences do not require reclassification. In the event dividends and distributions to shareholders exceed net investment income and net realized gains for tax purposes they are reported as returns of capital.
F. Class Allocations:
Income, expenses (other than class specific expenses) and realized and unrealized gains and losses are allocated among the classes of the Fund based on the relative net assets of each class. Class specific expenses are allocated to the class to which they relate. Currently, class specific expenses are limited to those incurred under the Distribution Plan for Class A shares.
G. Foreign Currency Translation Transactions:
Each of the Dynamic Dividend, Accelerating Dividend, Financial Services and Transformations Funds may invest without limitation in foreign securities. The Innovators Fund and Foundation Fund may invest up to 20% and 15%, respectively, of the value of its net assets in foreign securities. The books and records of each Fund are maintained in U.S. dollars. Non-U.S. dollar-denominated amounts are translated into U.S. dollars as follows, with the resultant translation gains and losses recorded in the Statements of Operations:
| | i) | market value of investment securities and other assets and liabilities at the exchange rate on the valuation date, |
| | | |
| | ii) | purchases and sales of investment securities, income and expenses at the exchange rate prevailing on the respective date of such transactions. |
H. Risk Associated with Foreign Securities and Currencies:
Investments in securities of foreign issuers carry certain risks not ordinarily associated with investments in securities of domestic issuers. Such risks include future political and economic developments and the possible imposition of exchange controls or other foreign governmental laws and restrictions. In addition, with respect to certain countries,
113
Alpine Mutual Funds
Notes to Financial Statements—Continued
April 30, 2013 (Unaudited)
there is a possibility of expropriation of assets, confiscatory taxation, political or social instability or diplomatic developments, which could adversely affect investments in those countries. Certain countries may also impose substantial restrictions on investments in their capital markets by foreign entities, including restrictions on investments in issuers or industries deemed sensitive to relevant national interests. These factors may limit the investment opportunities available to the Funds or result in a lack of liquidity and high price volatility with respect to securities of issuers from developing countries.
I. Forward Currency Contracts:
The Funds are subject to foreign currency exchange rate risk in the normal course of pursuing their investment objective. The Funds may use forward currency contracts to gain exposure to or economically hedge against changes in the value of foreign currencies. A forward currency contract (“forward”) is an agreement between two parties to buy and sell a currency at a set price on a future date. The market value of the forward contract fluctuates with changes in forward currency exchange rates. The forward contract is marked-to-market daily and the change in market value is recorded by each Fund as unrealized appreciation or depreciation. When the forward contract is closed, a Fund records a realized gain or loss equal to the fluctuation in value during the period the forward contract was open. A Fund could be exposed to risk if a counterparty is unable to meet the terms of a forward or if the value of the currency changes unfavorably. During the period ended April 30, 2013, the Dynamic Dividend Fund entered into 3 forward currency contracts.
The following forward currency contracts were held at April 30, 2013:
Dynamic Dividend Fund
| Description | | Settlement
Date | | Currency | | | Settlement
Value | | | Current
Value | | | Unrealized
Loss | |
| Contracts Sold: | | | | | | | | | | | | | | | | | | |
| Swiss Franc | | 06/19/13 | | | 10,000,000 CHF | | | $ | 10,590,416 | | | $ | 10,759,977 | | | $ | (169,561 | ) |
| British Pound | | 06/19/13 | | | 6,500,000 GBP | | | | 9,816,969 | | | | 10,093,696 | | | | (276,727 | ) |
| Japanese Yen | | 07/30/13 | | | 535,000,000 JPY | | | | 5,484,226 | | | | 5,490,751 | | | | (6,525 | ) |
| | | | | | | | | | | | | $ | 26,344,424 | | | $ | (452,813 | ) |
J. Derivative Instruments and Hedging Activities:
The following tables provide information about the effect of derivatives and hedging activities on the Funds’ Statements of Assets and Liabilities and Statements of Operations as of and for the period ended April 30, 2013. The first table provides additional detail about the amounts and sources of unrealized appreciation/depreciation on derivatives at the end of the period. The second table provides additional information about the amounts and sources of net realized gain and the change in unrealized appreciation/depreciation resulting from the Funds’ derivatives and hedging activities during the period.
The effect of derivative instruments on the Statements of Assets and Liabilities as of April 30, 2013:
Dynamic Dividend Fund
| Derivatives | | Statements of Assets
and Liabilities Location | | | Unrealized
Depreciation | |
| Foreign Exchange Risk | | Unrealized depreciation on | | | | |
| | | forward currency contracts | | | $(452,813) | |
The effect of derivative instruments on the Statements of Operations for the period ended April 30, 2013:
Dynamic Dividend Fund
| Derivatives | | Statements of
Operations Location | | Net Realized Gain | | | Change in
Unrealized Depreciation | |
| Foreign Exchange Risk | | Change in net unrealized | | | | | | |
| | | appreciation/depreciation on | | | | | | |
| | | foreign currency translations | | $ — | | | $ (452,813) | |
114
Alpine Mutual Funds
Notes to Financial Statements—Continued
April 30, 2013 (Unaudited)
| 3. | Capital Share Transactions: |
The Funds have an unlimited number of shares of beneficial interest, with $0.0001 par value, authorized. Transactions in shares and dollars of the Funds were as follows:
Dynamic Dividend Fund
| | | | Period Ended
April 30, 2013 | | | | Year Ended
October 31, 2012* | |
| | | | Shares | | | Amount | | | | Shares | | | Amount | |
| Class A | | | | | | | | | | | | | | | | |
| Shares sold | | | 159,248 | | | $ | 560,516 | | | | 456,050 | | | $ | 1,637,308 | |
| Shares issued in reinvestment of dividends | | | 8,383 | | | | 29,446 | | | | 6,286 | | | | 22,331 | |
| Redemption fees | | | — | | | | 97 | | | | — | | | | 5 | |
| Shares redeemed | | | (48,450 | ) | | | (170,491 | ) | | | (18) | | | | (64 | ) |
| Total net change | | | 119,181 | | | $ | 419,568 | | | | 462,318 | | | $ | 1,659,580 | |
| | | | | | | | | | | | | | | | | |
| Institutional Class | | | | | | | | | | | | | | | | |
| Shares sold | | | 3,190,690 | | | $ | 11,194,048 | | | | 8,777,004 | | | $ | 32,015,536 | |
| Shares issued in reinvestment of dividends | | | 2,802,481 | | | | 9,786,742 | | | | 9,535,812 | | | | 34,357,087 | |
| Redemption fees | | | — | | | | 14,684 | | | | — | | | | 39,095 | |
| Shares redeemed | | | (33,029,632 | ) | | | (116,526,645 | ) | | | (36,781,852 | ) | | | (134,334,677 | ) |
| Total net change | | | (27,036,461 | ) | | $ | (95,531,171 | ) | | | (18,469,036 | ) | | $ | (67,922,959 | ) |
Accelerating Dividend Fund
| | | | Period Ended
April 30, 2013 | | | | Year Ended
October 31, 2012* | |
| | | | Shares | | | Amount | | | | Shares | | | Amount | |
| Class A | | | | | | | | | | | | | | | | |
| Shares sold | | | 26,837 | | | $ | 370,555 | | | | 19,671 | | | $ | 241,728 | |
| Shares issued in reinvestment of dividends | | | 534 | | | | 6,976 | | | | 261 | | | | 3,324 | |
| Redemption fees | | | — | | | | — | | | | — | | | | — | |
| Shares redeemed | | | (755 | ) | | | (9,872 | ) | | | — | | | | — | |
| Total net change | | | 26,616 | | | $ | 367,659 | | | | 19,932 | | | $ | 245,052 | |
| | | | | | | | | | | | | | | | | |
| Institutional Class | | | | | | | | | | | | | | | | |
| Shares sold | | | 15,703 | | | $ | 206,028 | | | | 26,137 | | | $ | 333,967 | |
| Shares issued in reinvestment of dividends | | | 8,516 | | | | 110,912 | | | | 15,818 | | | | 194,859 | |
| Redemption fees | | | — | | | | — | | | | — | | | | — | |
| Shares redeemed | | | (4,517 | ) | | | (60,295 | ) | | | (125,455 | ) | | | (1,603,733 | ) |
| Total net change | | | 19,702 | | | $ | 256,645 | | | | (83,500 | ) | | $ | (1,074,907 | ) |
115
Alpine Mutual Funds
Notes to Financial Statements—Continued
April 30, 2013 (Unaudited)
Financial Services Fund
| | | | Period Ended
April 30, 2013 | | | | Year Ended
October 31, 2012* | |
| | | | Shares | | | Amount | | | | Shares | | | Amount | |
| Class A | | | | | | | | | | | | | | | | |
| Shares sold | | | 298,592 | | | $ | 2,894,252 | | | | 160,783 | | | $ | 1,333,401 | |
| Shares issued in reinvestment of dividends | | | — | | | | — | | | | — | | | | — | |
| Redemption fees | | | — | | | | 9,250 | | | | — | | | | 98 | |
| Shares redeemed | | | (6,014 | ) | | | (55,579 | ) | | | (3,644 | ) | | | (30,725 | ) |
| Total net change | | | 292,578 | | | $ | 2,847,923 | | | | 157,139 | | | $ | 1,302,774 | |
| | | | | | | | | | | | | | | | | |
| Institutional Class | | | | | | | | | | | | | | | | |
| Shares sold | | | 517,041 | | | $ | 5,101,370 | | | | 277,896 | | | $ | 2,278,757 | |
| Shares issued in reinvestment of dividends | | | — | | | | — | | | | 1,755 | | | | 11,966 | |
| Redemption fees | | | — | | | | 23,598 | | | | — | | | | 2,184 | |
| Shares redeemed | | | (472,616 | ) | | | (4,635,104 | ) | | | (141,591 | ) | | | (1,088,482 | ) |
| Total net change | | | 44,425 | | | $ | 489,864 | | | | 138,060 | | | $ | 1,204,425 | |
Innovators Fund
| | | | Period Ended
April 30, 2013 | | | | Year Ended
October 31, 2012* | |
| | | | Shares | | | Amount | | | | Shares | | | Amount | |
| Class A | | | | | | | | | | | | | | | | |
| Shares sold | | | — | | | $ | — | | | | 12,839 | | | $ | 137,564 | |
| Shares issued in reinvestment of dividends | | | — | | | | — | | | | — | | | | — | |
| Redemption fees | | | — | | | | — | | | | — | | | | — | |
| Shares redeemed | | | — | | | | — | | | | (3,006 | ) | | | (33,972 | ) |
| Total net change | | | — | | | $ | — | | | | 9,833 | | | $ | 103,592 | |
| | | | | | | | | | | | | | | | | |
| Institutional Class | | | | | | | | | | | | | | | | |
| Shares sold | | | 12,594 | | | $ | 149,654 | | | | 126,183 | | | $ | 1,497,500 | |
| Shares issued in reinvestment of dividends | | | — | | | | — | | | | — | | | | — | |
| Redemption fees | | | — | | | | 3 | | | | — | | | | 769 | |
| Shares redeemed | | | (79,908 | ) | | | (974,461 | ) | | | (156,924 | ) | | | (1,816,276 | ) |
| Total net change | | | (67,314 | ) | | $ | (824,804 | ) | | | (30,741 | ) | | $ | (318,007 | ) |
116
Alpine Mutual Funds
Notes to Financial Statements—Continued
April 30, 2013 (Unaudited)
Transformations Fund
| | | | Period Ended
April 30, 2013 | | | | Year Ended
October 31, 2012* | |
| | | | Shares | | | Amount | | | | Shares | | | Amount | |
| Class A | | | | | | | | | | | | | | | | |
| Shares sold | | | — | | | $ | — | | | | 8,913 | | | $ | 100,000 | |
| Shares issued in reinvestment of dividends | | | 58 | | | | 722 | | | | — | | | | — | |
| Redemption fees | | | — | | | | — | | | | — | | | | 11 | |
| Shares redeemed | | | — | | | | — | | | | — | | | | — | |
| Total net change | | | 58 | | | $ | 722 | | | | 8,913 | | | | 100,011 | |
| | | | | | | | | | | | | | | | | |
| Institutional Class | | | | | | | | | | | | | | | | |
| Shares sold | | | 3,269 | | | $ | 40,172 | | | | 104,367 | | | $ | 1,299,604 | |
| Shares issued in reinvestment of dividends | | | 3,340 | | | | 41,150 | | | | — | | | | — | |
| Redemption fees | | | — | | | | 1 | | | | — | | | | 794 | |
| Shares redeemed | | | (32,997 | ) | | | (411,905 | ) | | | (120,219 | ) | | | (1,446,510 | ) |
| Total net change | | | (26,388 | ) | | $ | (330,582 | ) | | | (15,852 | ) | | $ | (146,112 | ) |
Foundation Fund
| | | | Period Ended
April 30, 2013 | | | | Year Ended
October 31, 2012* | |
| | | | Shares | | | Amount | | | | Shares | | | Amount | |
| Class A | | | | | | | | | | | | | | | | |
| Shares sold | | | — | | | $ | — | | | | 9,431 | | | $ | 100,066 | |
| Shares issued in reinvestment of dividends | | | 65 | | | | 770 | | | | 107 | | | | 1,213 | |
| Redemption fees | | | — | | | | — | | | | — | | | | — | |
| Shares redeemed | | | — | | | | — | | | | (6 | ) | | | (65 | ) |
| Total net change | | | 65 | | | $ | 770 | | | | 9,532 | | | $ | 101,214 | |
| | | | | | | | | | | | | | | | | |
| Institutional Class | | | | | | | | | | | | | | | | |
| Shares sold | | | 5,925 | | | $ | 69,275 | | | | 7,258 | | | $ | 79,144 | |
| Shares issued in reinvestment of dividends | | | 44,789 | | | | 526,753 | | | | 94,587 | | | | 1,056,106 | |
| Redemption fees | | | — | | | | 1 | | | | — | | | | — | |
| Shares redeemed | | | (63,691 | ) | | | (747,385 | ) | | | (218,815 | ) | | | (2,425,362 | ) |
| Total net change | | | (12,977 | ) | | $ | (151,356 | ) | | | (116,970 | ) | | $ | (1,290,112 | ) |
117
Alpine Mutual Funds
Notes to Financial Statements—Continued
April 30, 2013 (Unaudited)
Ultra Short Tax Optimized Income Fund
| | | | Period Ended
April 30, 2013 | | | | Year Ended
October 31, 2012** | |
| | | | Shares | | | Amount | | | | Shares | | | Amount | |
| Class A | | | | | | | | | | | | | | | | |
| Shares sold | | | 7,512,305 | | | $ | 75,875,430 | | | | 35,181,739 | | | $ | 355,543,788 | |
| Shares issued in reinvestment of dividends | | | 56,276 | | | | 568,388 | | | | 228,067 | | | | 2,303,615 | |
| Redemption fees | | | — | | | | 8,371 | | | | — | | | | 7,888 | |
| Shares redeemed | | | (16,243,473 | ) | | | (164,061,342 | ) | | | (26,962,596 | ) | | | (272,476,288 | ) |
| Total net change | | | (8,674,892 | ) | | $ | (87,609,153 | ) | | | 8,447,210 | | | $ | 85,379,003 | |
| | | | | | | | | | | | | | | | | |
| Institutional Class | | | | | | | | | | | | | | | | |
| Shares sold | | | 21,737,198 | | | $ | 218,331,960 | | | | 98,084,023 | | | $ | 985,826,904 | |
| Shares issued in reinvestment of dividends | | | 241,918 | | | | 2,429,344 | | | | 803,370 | | | | 8,073,867 | |
| Redemption fees | | | — | | | | 24,684 | | | | — | | | | 29,729 | |
| Shares redeemed | | | (57,412,768 | ) | | | (576,642,466 | ) | | | (87,961,885 | ) | | | (884,060,821 | ) |
| Total net change | | | (35,433,652 | ) | | $ | (355,856,478 | ) | | | 10,925,508 | | | $ | 109,869,679 | |
Municipal Money Market Fund
| | | | Period Ended
April 30, 2013 | | | | Year Ended
October 31, 2012*** | |
| | | | Shares | | | Amount | | | | Shares | | | Amount | |
| Investor Class | | | | | | | | | | | | | | | | |
| Shares sold | | | 82,563,013 | | | $ | 82,563,012 | | | | 209,368,876 | | | $ | 209,368,876 | |
| Shares issued in reinvestment of dividends | | | 45,018 | | | | 45,018 | | | | 190,228 | | | | 190,228 | |
| Shares redeemed | | | (112,707,367 | ) | | | (112,707,367 | ) | | | (290,975,342 | ) | | | (290,975,342 | ) |
| Total net change | | | (30,099,336 | ) | | $ | (30,099,337 | ) | | | (81,416,238 | ) | | $ | (81,416,238 | ) |
| * | Class A commenced operations on December 30, 2011. |
| ** | Effective January 3, 2012, the Adviser share class was renamed to Class A and the Investor share class was renamed to Institutional Class. |
| *** | Effective January 3, 2012, the Investor Class was renamed the Institutional Class and subsequently reverted back to the Investor Class effective July 26, 2012. |
| 4. | | Purchases and Sales of Securities: |
Purchases and sales of securities (excluding short-term securities) for the period ended April 30, 2013 are as follows:
| | | Purchases | | | Sales | |
| Dynamic Dividend Fund | | $ | 421,532,543 | | | $ | 509,726,806 | |
| Accelerating Dividend Fund | | | 1,595,827 | | | | 1,130,464 | |
| Financial Services Fund | | | 9,299,006 | | | | 5,306,381 | |
| Innovators Fund | | | 1,003,576 | | | | 3,347,576 | |
| Transformations Fund | | | 1,418,287 | | | | 2,493,515 | |
| Foundation Fund | | | 8,108,591 | | | | 9,845,011 | |
| Ultra Short Tax Optimized Income Fund | | | 1,234,083,855 | | | | 1,552,714,998 | |
Purchases and sales of U.S. Government obligations (excluding short-term securities) for the period ended April 30, 2013 are as follows:
| | | Purchases | | Sales | |
| Foundation Fund | | $ 3,026,250 | | $ — | |
118
Alpine Mutual Funds
Notes to Financial Statements—Continued
April 30, 2013 (Unaudited)
Quasar Distributors, LLC (“Quasar”) serves as each Funds’ distributor. Certain of the Funds have adopted distribution and servicing plans (the “Plans”) for their Class A shares (in the case of the Ultra Short Tax Optimized Income Fund formerly known as the Adviser Class) as allowed by Rule 12b-1 under the 1940 Act. The Plans authorize payments by the Funds in connection with the distribution and servicing of their Class A shares at an annual rate, as determined from time to time by the Board of Trustees, of up to 0.25% of the average daily net assets of the Class A shares of the Funds. Amounts paid under the Plans by the Funds may be spent by the Funds on any activities or expenses primarily intended to result in the sale of Class A shares of the Funds, including but not limited to advertising, compensation for sales and marketing activities of financial institutions and others such as dealers and distributors, shareholder account servicing, the printing and mailing of prospectuses to other than current shareholders and the printing and mailing of sales literature. Dynamic Dividend Fund, Accelerating Dividend Fund, Financial Services Fund, Innovators Fund, Transformations Fund, Foundation Fund and Ultra Short Tax Optimized Income Fund incurred $2,337, $443, $3,507, $147, $138, $140 and $502,997, respectively, pursuant to the Plans for the period ended April 30, 2013.
The Plans for the Funds may be terminated at any time by vote of the Trustees of the Trusts who are not “interested persons,” as defined by the 1940 Act, of the Trusts, or by vote of a majority of the outstanding voting shares of the respective class.
Alpine Woods Capital Investors, LLC (the “Adviser”) makes payments to intermediaries that provide omnibus account services, sub-accounting services and/or networking services with respect to the Funds. The Board of Trustees approved, subject to certain limitations, the reimbursement to the Adviser by the appropriate Fund, of up to a certain percentage of such fees paid by the Adviser to intermediaries that provide omnibus account services, sub-accounting services, and/or networking services. Reimbursement of these fees are subject to review by the Board of Trustees and are included in the transfer agent fees in the Statements of Operations.
| 6. | Investment Advisory Agreement and Other Affiliated Transactions: |
The Adviser provides investment advisory services to each of the Funds. Pursuant to the advisory agreements with the Funds, the Adviser is entitled to an annual fee based on 1.00% of each Fund’s average daily net assets for the Dynamic Dividend Fund, Accelerating Dividend Fund, Financial Services Fund, Innovators Fund, Transformations Fund and Foundation Fund. The Adviser is entitled to an annual fee based on 0.75% of the Ultra Short Tax Optimized Income Fund’s average daily net assets and an annual fee based on 0.45% of the Municipal Money Market Fund’s average daily net assets.
The Adviser agreed to reimburse the Dynamic Dividend Fund, Accelerating Dividend Fund, Financial Services Fund, Innovators Fund, Transformations Fund and Foundation Fund to the extent necessary to ensure that ordinary operating expenses (including 12b-1 fees, but excluding interest, brokerage commissions, acquired fund fees and extraordinary expenses) do not exceed annually 1.60% of each Fund’s Class A Shares average daily net assets, and 1.35% of each Fund’s Institutional Class Shares average daily net assets. The expense cap for the Ultra Short Tax Optimized Income Fund—Class A Shares (formerly, Adviser Class) and Ultra Short Tax Optimized Income Fund—Institutional Class Shares (formerly Investor Class) is 0.95% and 0.70%, respectively, at April 30, 2013. The Adviser voluntarily agreed to reimburse the Ultra Short Tax Optimized Income Fund to the extent necessary to ensure that the Fund’s total operating expenses (including 12-b1 fees, where applicable, but excluding interest, brokerage commissions, acquired fund fees and extraordinary expenses) did not exceed certain limits. These limits ranged from 0.60% to 0.65% of the Fund’s average daily net assets for the Institutional Class Shares and from 0.85% to 0.90% of the Fund’s average daily net assets for the Class A Shares. The Adviser may recover expenses paid in excess of the cap on expenses for the three previous years, as long as the recovery does not cause the Fund to exceed such cap on expenses. For the period ended April 30, 2013, the Adviser waived investment advisory fees and other expenses totaling $14,185, $26,600, $16,927, $18,757, $21,585 and $1,700,956 for the Dynamic Dividend, Accelerating Dividend Fund, Financial Services Fund, Innovators Fund, Transformations Fund and Ultra Short Tax Optimized Income Fund, respectively. The expense limitations will remain in effect for each Fund through February 28, 2014 unless and until the Board of Trustees of the Series and Income Trusts approves their modification or termination with respect to each Fund. Waived expenses subject to potential recovery by year of expiration are as follows:
119
Alpine Mutual Funds
Notes to Financial Statements—Continued
April 30, 2013 (Unaudited)
| | | | | | | | | | | | | Ultra Short |
| | | Dynamic | | Accelerating | | Financial | | | | | | Tax Optimized |
| | | Dividend | | Dividend | | Services | | Innovators | | Transformations | | Income |
| Year of Expiration | | Fund | | Fund | | Fund | | Fund | | Fund | | Fund |
| 10/31/2013 | | | $ | — | | | $ | 28,493 | | | $ | 34,708 | | | $ | 29,521 | | | $ | 37,330 | | | $ | 3,894,496 | |
| 10/31/2014 | | | | — | | | | 35,094 | | | | 32,910 | | | | 20,239 | | | | 21,099 | | | | 2,722,733 | |
| 10/31/2015 | | | | — | | | | 51,048 | | | | 42,851 | | | | 35,981 | | | | 42,826 | | | | 3,353,608 | |
| 10/31/2016 | | | | 14,185 | | | | 26,600 | | | | 16,927 | | | | 18,757 | | | | 21,585 | | | | 1,700,956 | |
For the period ended April 30, 2013, the Adviser voluntarily agreed to reimburse the Municipal Money Market Fund to the extent necessary to ensure that the Fund’s total operating expenses (excluding interest, brokerage commissions, acquired fund fees and extraordinary expenses) did not exceed certain limits. The limits ranged from 0.31% to 0.34% of the Fund’s average daily net assets during the period ended April 30, 2013. For the period ended April 30, 2013 the Adviser waived investment advisory fees and other expenses totaling $254,733 for the Municipal Money Market Fund.
State Street Bank and Trust (“SSBT”) serves as the Funds’ Administrator pursuant to an Administration Agreement with the Funds. As compensation for its services to the Funds, SSBT receives an annual administration fee of 0.02% of total net assets on the first $5 billion and 0.015% on total net assets exceeding $5 billion, computed daily and payable monthly.
| 7. | Federal Income Tax Information |
As of April 30, 2013, net unrealized appreciation/depreciation of investments, excluding foreign currency, based on Federal tax costs was as follows:
| | | Dynamic
Dividend Fund | | Accelerating
Dividend Fund | | Financial
Services Fund | | Innovators Fund |
| Cost of investments | | $ | 243,271,690 | | | | $ | 2,826,831 | | | $ | 16,226,673 | | | | $ | 9,060,473 | |
| Gross unrealized appreciation | | | 33,086,032 | | | | 572,755 | | | | 2,054,003 | | | | 3,244,420 | |
| Gross unrealized depreciation | | | (12,255,389 | ) | | | (52,722 | ) | | | (2,294,754 | ) | | | | (797,299 | ) |
| Net unrealized appreciation (depreciation) | | $ | 20,830,643 | | | | $ | 520,033 | | | $ | (240,751 | ) | | | $ | 2,447,121 | |
| | | Transformations
Fund | | Foundation
Fund | | Ultra Short
Tax Optimized
Income Fund | | Municipal
Money
Market Fund |
| Cost of investments | | $ | 5,686,798 | | | | $ | 59,272,431 | | | $ | 1,425,593,645 | | | | $ | 198,720,617 | |
| Gross unrealized appreciation | | | 1,160,394 | | | | 16,707,662 | | | | 852,835 | | | | — | |
| Gross unrealized depreciation | | | (564,510 | ) | | | | (5,178,028 | ) | | | (175,402 | ) | | | | — | |
| Net unrealized appreciation | | $ | 595,884 | | | | $ | 11,529,634 | | | $ | 677,433 | | | | $ | — | |
120
Alpine Mutual Funds
Notes to Financial Statements—Continued
April 30, 2013 (Unaudited)
The tax basis of investments for tax and financial reporting purposes differs principally due to the deferral of losses on wash sales, partnership tax adjustments, and mark-to-market cost basis adjustments for investments in passive foreign investment companies (PFICs) for tax purposes.
The tax character of distributions paid during the year ended October 31, 2012 were as follows:
| | | 2012 | |
| Dynamic Dividend Fund | | | | |
| Ordinary income | | $ | 54,036,978 | |
| Long-term capital gain | | | — | |
| | | $ | 54,036,978 | |
| | | | | |
| Accelerating Dividend Fund | | | | |
| Ordinary income | | $ | 103,200 | |
| Long-term capital gain | | | 198,485 | |
| | | $ | 301,685 | |
| | | | | |
| Financial Services Fund | | | | |
| Ordinary income | | $ | — | |
| Long-term capital gain | | | — | |
| Return of capital | | | 13,524 | |
| | | $ | 13,524 | |
| | | | | |
| Innovators Fund | | | | |
| Ordinary income | | $ | — | |
| Long-term capital gain | | | — | |
| | | $ | — | |
| | | | | |
| Transformations Fund | | | | |
| Ordinary income | | $ | — | |
| Long-term capital gain | | | — | |
| | | $ | — | |
| | | | | |
| Foundation Fund | | | | |
| Ordinary income | | $ | 1,084,883 | |
| Long-term capital gain | | | — | |
| | | $ | 1,084,883 | |
| | | | | |
| Ultra Short Tax Optimized Income Fund | | | | |
| Ordinary income | | $ | — | |
| Exempt interest dividends | | | 15,890,798 | |
| | | $ | 15,890,798 | |
| | | | | |
| Municipal Money Market Fund | | | | |
| Ordinary income | | $ | — | |
| Exempt interest dividends | | | 264,781 | |
| Long-term capital gain | | | — | |
| | | $ | 264,781 | |
121
Alpine Mutual Funds
Notes to Financial Statements—Continued
April 30, 2013 (Unaudited)
During the year ended October 31, 2012, the Innovators Fund, Transformations Fund and Ultra Short Tax Optimized Income Fund utilized $20,875, $285,429 and $106,992 of capital loss carryovers, respectively. Capital loss carryovers as of October 31, 2012 are as follows:
| Expiration Date | | Dynamic
Dividend Fund | | Accelerating
Dividend Fund | | Financial
Services Fund | | Innovators Fund |
| 10/31/2013 | | $ | — | | | $ | — | | | $ | — | | | $ | — | |
| 10/31/2014 | | $ | — | | | $ | — | | | $ | — | | | $ | — | |
| 10/31/2015 | | $ | 25,935,421 | | | $ | — | | | $ | — | | | $ | — | |
| 10/31/2016 | | $ | 536,971,822 | | | $ | — | | | $ | — | | | $ | 6,395,101 | |
| 10/31/2017 | | $ | 388,131,987 | | | $ | — | | | $ | 115,243 | | | $ | 5,637,266 | |
| 10/31/2018 | | $ | 154,525,095 | | | $ | — | | | $ | 143,772 | | | $ | 1,581,056 | |
| 10/31/2019 | | $ | — | | | $ | — | | | $ | 1,216,158 | | | $ | 342,429 | |
| Expiration Date | | Transformations
Fund | | Foundation
Fund | | Ultra Short
Tax Optimized
Income Fund | | Municipal
Money
Market Fund |
| 10/31/2013 | | $ | — | | | $ | — | | | $ | — | | | $ | — | |
| 10/31/2014 | | $ | — | | | $ | — | | | $ | — | | | $ | — | |
| 10/31/2015 | | $ | — | | | $ | — | | | $ | — | | | $ | — | |
| 10/31/2016 | | $ | — | | | $ | — | | | $ | — | | | $ | — | |
| 10/31/2017 | | $ | — | | | $ | — | | | $ | — | | | $ | — | |
| 10/31/2018 | | $ | — | | | $ | 353,585 | | | $ | — | | | $ | — | |
| 10/31/2019 | | $ | — | | | $ | — | | | $ | 67,228 | | | $ | — | |
Under the Regulated Investment Company (“RIC”) Modernization Act of 2010 (the “Modernization Act”), post-enactment capital losses that are carried forward will retain their character as either short-term or long-term capital losses rather than being considered all short-term as under previous law. However, any losses incurred during those future taxable years will be required to be utilized prior to the losses incurred in pre-enactment taxable years, which carry an expiration date. As a result of this ordering rule, preenactment capital loss carryovers may be more likely to expire unused.
Capital loss carryovers as of October 31, 2012 with no expiration are as follows:
| Fund | | Short Term | | | Long Term | |
| Dynamic Dividend Fund | | $ | 54,009,069 | | | $ | — | |
| Financial Services Fund | | | — | | | | 32,393 | |
| Foundation Fund | | | — | | | | 3,563,021 | |
Certain ordinary losses incurred after December 31 and within the taxable year are deemed to arise on the first day of the Funds’ next taxable year, if the Funds so elect. For the year ended October 31,2012, the following Funds elected to defer late-year ordinary losses:
| | | Late Year |
| Fund | | Ordinary Losses |
| Innovators Fund | | $ | 106,328 | |
| Transformations Fund | | $ | 35,046 | |
In accordance with U.S. GAAP, the Funds have previously adopted accounting standards related to the accounting for uncertain tax positions. In accordance with this guidance, the Funds analyzed all open tax years, as defined by the Statute of Limitations, for all major jurisdiction. Open tax years are those that are open for exam by taxing authorities. Major jurisdictions for the Funds included Federal and the state of New York. As of April 30, 2013, open Federal and New York tax years include the tax years ended October 31, 2009 through 2012. The Funds have no examination in progress.
122
Alpine Mutual Funds
Notes to Financial Statements—Continued
April 30, 2013 (Unaudited)
The Funds have reviewed all open tax years and major jurisdictions and concluded that there is no impact on the Funds’ net assets and no tax liability resulting from unrecognized tax benefits relating to uncertain income tax positions taken in previous years or expected to be taken on the tax return for the fiscal year-end October 31, 2012 or 2013.
Also, the Funds have recognized no interest and penalties related to uncertain tax benefits. The Funds are also not aware of any tax positions for which it is reasonably possible that the total amounts of unrecognized tax benefits will significantly change in the next twelve months.
| 8. | Recent Accounting Pronouncement: |
On December 16, 2011, the Financial Accounting Standards Board (“FASB”) issued Accounting Standards Update No. 2011-11, “Disclosures about Offsetting Assets and Liabilities” (“ASU 2011-11”), as clarified with ASU 2013-01 “Clarifying the Scope of Disclosures about Offsetting Assets and Liabilities” issued in January 2013. ASU 2011-11 amends FASB Accounting Standards Codification Topic 210, specifically requiring an entity to disclose information about offsetting and related arrangements and the effect those arrangements have on the financial position. ASU 2011-11 is effective in annual reporting periods beginning on or after January 1, 2013, and for interim periods within those annual reporting periods. Management is currently evaluating the implications of these changes and their impact on the financial statements.
Distributions: The Dynamic Dividend Fund—Institutional Class and Class A paid a distribution from net investment income of $1,441,458 and $10,293 or $0.02 and $0.0192 per share, respectively, on May 31, 2013 to shareholders of record on May 30, 2013. The Accelerating Dividend Fund—Institutional Class and Class A paid a distribution from net investment income of $7,735 and $1,703 or $0.0404 and $0.0373 per share, respectively, on May 31, 2013 to shareholders of record on May 30, 2013. The Ultra Short Tax Optimized Income Fund—Class A and Institutional Class paid a distribution from net investment income of $83,563 and $475,200 or $0.00242473 and $0.00438445 per share, respectively, on May 31, 2013 to shareholders of record on May 30, 2013.
123
Alpine Mutual Funds
Information about your Funds Expenses (Unaudited)
April 30, 2013
Fund expenses (unaudited)
Example
As a shareholder of the Fund, you may incur two types of costs: (1) transaction costs, including front-end on purchase payments; and (2) ongoing costs, including management fees; service and/or distribution (12b-1) fees; and other Fund expenses. This example is intended to help you understand your ongoing costs (in dollars) of investing in the Fund and to compare these costs with the ongoing costs of investing in other mutual funds. This example is based on an investment of $1,000 invested on November 1, 2012 and held for the six months ended April 30, 2013.
Actual Expenses
The table below titled “Based on Actual Total Return” provides information about actual account values and actual expenses. You may use the information provided in this table, together with the amount you invested, to estimate the expenses that you paid over the period. To estimate the expenses you paid on your account, divide your ending account value by $1,000 (for example, an $8,600 ending account value divided by $1,000 = 8.6), then multiply the result by the number under the heading entitled “Expenses Paid During the Period”.
Hypothetical Example for Comparison Purposes
The table below titled “Based on Hypothetical Total Return” provides information about hypothetical account values and hypothetical expenses based on the actual expense ratio and an assumed rate of return of 5.00% per year before expenses, which is not the Fund’s actual return. The hypothetical account values and expenses may not be used to estimate the actual ending account balance or expenses you paid for the period. You may use the information provided in this table to compare the ongoing costs of investing in the Fund and other funds. To do so, compare the 5.00% hypothetical example relating to the Fund with the 5.00% hypothetical examples that appear in the shareholder reports of the other funds.
Please note that the expenses shown in the table below are meant to highlight your ongoing costs only and do not reflect any transactional costs, such as front-end or back-end sales charges (loads). Therefore, the table is useful in comparing ongoing costs only, and will not help you determine the relative total costs of owning different funds. In addition, if these transaction costs were included, your costs would have been higher.
Dynamic Dividend Fund
Based on actual total return (1)
| Class | | Actual Total
Return Without
Sales Charges (2) | | Beginning
Account Value | | Ending
Account Value | | Annualized
Expense
Ratio | | Expenses
Paid During
the Period (3) |
| | | | | | | | | | | |
| Class A | | 9.74% | | $1,000.00 | | $1,097.40 | | 1.62% | | $8.42 |
| | | | | | | | | | | |
| Institutional | | 9.88% | | $1,000.00 | | $1,098.80 | | 1.37% | | $7.13 |
Based on hypothetical total return (1)
| Class | | Hypothetical
Annualized
Total Return | | Beginning
Account Value | | Ending
Account Value | | Annualized
Expense Ratio | | Expenses
Paid During
the Period (4) |
| | | | | | | | | | | |
| Class A | | 5.00% | | $1,000.00 | | $1,016.76 | | 1.62% | | $8.10 |
| | | | | | | | | | | |
| Institutional | | 5.00% | | $1,000.00 | | $1,018.00 | | 1.37% | | $6.85 |
124
Alpine Mutual Funds
Information about your Funds Expenses (Unaudited)—Continued
April 30, 2013
Accelerating Dividend Fund
Based on actual total return(1)
| Class | | Actual Total
Return Without
Sales Charges (2) | | Beginning
Account Value | | Ending
Account Value | | Annualized
Expense
Ratio | | Expenses
Paid During
the Period (3) |
| | | | | | | | | | | |
| Class A | | 14.98% | | $1,000.00 | | $1,149.80 | | 1.60% | | $8.53 |
| | | | | | | | | | | |
| Institutional | | 15.11% | | $1,000.00 | | $1,151.10 | | 1.35% | | $7.20 |
Based on hypothetical total return (1)
| Class | | Hypothetical
Annualized
Total Return | | Beginning
Account Value | | Ending
Account Value | | Annualized
Expense
Ratio | | Expenses
Paid During
the Period (4) |
| | | | | | | | | | | |
| Class A | | 5.00% | | $1,000.00 | | $1,016.86 | | 1.60% | | $8.00 |
| | | | | | | | | | | |
| Institutional | | 5.00% | | $1,000.00 | | $1,018.10 | | 1.35% | | $6.76 |
Financial Services Fund
Based on actual total return(1)
| Class | | Actual Total
Return Without
Sales Charges (2) | | Beginning
Account Value | | Ending
Account Value | | Annualized
Expense
Ratio | | Expenses
Paid During
the Period (3) |
| | | | | | | | | | | |
| Class A | | 18.86% | | $1,000.00 | | $1,188.60 | | 1.60% | | $8.68 |
| | | | | | | | | | | |
| Institutional | | 18.93% | | $1,000.00 | | $1,189.30 | | 1.35% | | $7.33 |
Based on hypothetical total return (1)
| Class | | Hypothetical
Annualized
Total Return | | Beginning
Account Value | | Ending
Account Value | | Annualized
Expense
Ratio | | Expenses
Paid During
the Period (4) |
| | | | | | | | | | | |
| Class A | | 5.00% | | $1,000.00 | | $1,016.86 | | 1.60% | | $8.00 |
| | | | | | | | | | | |
| Institutional | | 5.00% | | $1,000.00 | | $1,018.10 | | 1.35% | | $6.76 |
Innovators Fund
Based on actual total return (1)
| Class | | Actual Total
Return Without
Sales Charges (2) | | Beginning
Account Value | | Ending
Account Value | | Annualized
Expense
Ratio | | Expenses
Paid During
the Period (3) |
| | | | | | | | | | | |
| Class A | | 11.68% | | $1,000.00 | | $1,116.80 | | 1.60% | | $8.40 |
| | | | | | | | | | | |
| Institutional | | 11.83% | | $1,000.00 | | $1,118.30 | | 1.35% | | $7.09 |
Based on hypothetical total return (1)
| Class | | Hypothetical
Annualized
Total Return | | Beginning
Account Value | | Ending
Account Value | | Annualized
Expense
Ratio | | Expenses
Paid During
the Period (4) |
| | | | | | | | | | | |
| Class A | | 5.00% | | $1,000.00 | | $1,016.86 | | 1.60% | | $8.00 |
| | | | | | | | | | | |
| Institutional | | 5.00% | | $1,000.00 | | $1,018.10 | | 1.35% | | $6.76 |
125
Alpine Mutual Funds
Information about your Funds Expenses (Unaudited)—Continued
April 30, 2013
Transformations Fund
Based on actual total return(1)
| Class | | Actual Total
Return Without
Sales Charges (2) | | Beginning
Account Value | | Ending
Account Value | | Annualized
Expense
Ratio | | Expenses
Paid During
the Period (3) |
| | | | | | | | | | | |
| Class A | | 8.32% | | $1,000.00 | | $1,083.20 | | 1.60% | | $8.26 |
| | | | | | | | | | | |
| Institutional | | 8.38% | | $1,000.00 | | $1,083.80 | | 1.35% | | $6.98 |
Based on hypothetical total return (1)
| Class | | Hypothetical
Annualized
Total Return | | Beginning
Account Value | | Ending
Account Value | | Annualized
Expense
Ratio | | Expenses
Paid During
the Period (4) |
| | | | | | | | | | | |
| Class A | | 5.00% | | $1,000.00 | | $1,016.86 | | 1.60% | | $8.00 |
| | | | | | | | | | | |
| Institutional | | 5.00% | | $1,000.00 | | $1,018.10 | | 1.35% | | $6.76 |
Foundation Fund
Based on actual total return (1)
| Class | | Actual Total
Return Without
Sales Charges (2) | | Beginning
Account Value | | Ending
Account Value | | Annualized
Expense
Ratio | | Expenses
Paid During
the Period (3) |
| | | | | | | | | | | |
| Class A | | 8.76% | | $1,000.00 | | $1,087.60 | | 1.48% | | $7.66 |
| | | | | | | | | | | |
| Institutional | | 8.98% | | $1,000.00 | | $1,089.80 | | 1.23% | | $6.37 |
Based on hypothetical total return (1)
| Class | | Hypothetical
Annualized
Total Return | | Beginning
Account Value | | Ending
Account Value | | Annualized
Expense
Ratio | | Expenses
Paid During
the Period (4) |
| | | | | | | | | | | |
| Class A | | 5.00% | | $1,000.00 | | $1,017.46 | | 1.48% | | $7.40 |
| | | | | | | | | | | |
| Institutional | | 5.00% | | $1,000.00 | | $1,018.70 | | 1.23% | | $6.16 |
Ultra Short Tax Optimized Income Fund
Based on actual total return (1)
| Class | | Actual Total
Return Without
Sales Charges (2) | | Beginning
Account Value | | Ending
Account Value | | Annualized
Expense
Ratio | | Expenses
Paid During
the Period (3) |
| | | | | | | | | | | |
| Class A | | 0.17% | | $1,000.00 | | $1,001.70 | | 0.89% | | $4.42 |
| | | | | | | | | | | |
| Institutional | | 0.19% | | $1,000.00 | | $1,001.90 | | 0.64% | | $3.18 |
Based on hypothetical total return (1)
| Class | | Hypothetical
Annualized
Total Return | | Beginning
Account Value | | Ending
Account Value | | Annualized
Expense
Ratio | | Expenses
Paid During
the Period (4) |
| | | | | | | | | | | |
| Class A | | 5.00% | | $1,000.00 | | $1,020.38 | | 0.89% | | $4.46 |
| | | | | | | | | | | |
| Institutional | | 5.00% | | $1,000.00 | | $1,021.62 | | 0.64% | | $3.21 |
126
Alpine Mutual Funds
Information about your Funds Expenses (Unaudited)—Continued
April 30, 2013
Municipal Money Market Fund
Based on actual total return (1)
| Class | | Actual Total
Return Without
Sales Charges (2) | | Beginning
Account Value | | Ending
Account Value | | Annualized
Expense
Ratio | | Expenses
Paid During
the Period (3) |
| | | | | | | | | | | |
| Investor Class | | 0.03% | | $1,000.00 | | $1,000.30 | | 0.32% | | $1.59 |
Based on hypothetical total return (1)
| Class | | Hypothetical
Annualized
Total Return | | Beginning
Account Value | | Ending
Account Value | | Annualized
Expense
Ratio | | Expenses
Paid During
the Period (4) |
| | | | | | | | | | | |
| Investor Class | | 5.00% | | $1,000.00 | | $1,023.21 | | 0.32% | | $1.61 |
| (1) | For the six months ended April 30, 2013. |
| (2) | Assumes the reinvestment of all distributions, including returns of capital, if any, at net asset value and does not reflect the deduction of the applicable sales charge. Total return is not annualized, as it may not be representative of the total return for the year. Performance figures may reflect fee waivers and/or expense reimbursements. In the absence of fee waivers and/or expense reimbursements, the total return would have been lower. Past performance is no guarantee of future results. |
| (3) | Expenses (net of fee waivers and/or expense reimbursements) are equal to each class’ respective annualized expense ratio multiplied by the average account value over the period, multiplied by the number of days in the most recent fiscal half-year, then divided by 365. |
| (4) | Hypothetical expense examples assume a 5% return over a hypothetical 181 day period. |
127
Alpine Mutual Funds
Additional Information (Unaudited)
April 30, 2013
Tax Information
The Funds designated the following percentages of dividends declared from net investment income for the fiscal year ended October 31, 2012 as qualified dividend income under the Jobs & Growth Tax Relief Reconciliation Act of 2003.
| Dynamic Dividend Fund | | | 54 | % |
| Accelerating Dividend Fund | | | 40 | % |
| Financial Services Fund | | | 0 | % |
| Innovators Fund | | | 0 | % |
| Transformations Fund | | | 0 | % |
| Foundation Fund | | | 93 | % |
| Ultra Short Tax Optimized Income Fund | | | 0 | % |
| Municipal Money Market Fund | | | 0 | % |
The Funds designated the following percentages of dividends declared during the fiscal year ended October 31, 2012 as dividends qualifying for the dividends received deduction available to corporate shareholders.
| Dynamic Dividend Fund | | | 31 | % |
| Accelerating Dividend Fund | | | 35 | % |
| Financial Services Fund | | | 0 | % |
| Innovators Fund | | | 0 | % |
| Transformations Fund | | | 0 | % |
| Foundation Fund | | | 82 | % |
| Ultra Short Tax Optimized Income Fund | | | 0 | % |
| Municipal Money Market Fund | | | 0 | % |
The Funds designated the following percentages of taxable ordinary income distributions as short-term capital gain distributions under Internal Revenue Section 871(k)(2)(C).
| Dynamic Dividend Fund | | | 0 | % |
| Accelerating Dividend Fund | | | 0 | % |
| Financial Services Fund | | | 0 | % |
| Innovators Fund | | | 0 | % |
| Transformations Fund | | | 0 | % |
| Foundation Fund | | | 0 | % |
| Ultra Short Tax Optimized Income Fund | | | 0 | % |
| Municipal Money Market Fund | | | 0 | % |
The Fund designated as long-term capital gain dividend, pursuant to Internal Revenue Cose Section 852(b)(3), the amount necessary to reduce the earnings and profits of the Fund related to net capital gain to zero for the tax year ended October 31, 2012.
Approval of Investment Management Agreements
In the weeks leading up to the Meeting of the Board of Trustees on March 12-13, 2013, the Independent Trustees reviewed materials (“15(c) Materials”) provided by the Adviser relating to the Advisory Contracts. The 15(c) Materials responded to information requested by the Independent Trustees, through independent legal counsel, which the Trustees discussed with the Adviser at the meeting. In reviewing the Agreements, the Independent Trustees considered various factors, including among other things (i) the nature, extent and quality of the services provided by the Adviser under the Agreements, (ii) the investment performance of the Funds, (iii) the costs to the Adviser of its services and the profits realized by the Adviser, from its relationship with the Funds, and (iv) the extent to which economies of scale would be realized if and as a Fund grows and whether the fee levels in the Agreements reflect these economies of scale.
In considering the nature, extent and quality of the services provided by the Adviser, the Independent Trustees relied on their prior experience as Independent Trustees of the Funds, the 15(c) Materials provided at and prior to the meeting, as well as on materials and updates provided at Board meetings throughout the year. They noted that under the Agreements, the Adviser is responsible for managing the Funds’ investments in accordance with each Fund’s investment objectives and policies, applicable legal and regulatory requirements, and the oversight of the Independent Trustees, for providing necessary and appropriate reports and information to the Independent Trustees, and for furnishing the Funds with the
128
Alpine Mutual Funds
Additional Information (Unaudited)—Continued
April 30, 2013
assistance, cooperation, and information necessary for the Funds to meet various legal requirements regarding registration and reporting. They also noted the experience and expertise of the Adviser as appropriate as an adviser to the Funds.
The Independent Trustees reviewed the background and experience of the Adviser’s Senior Management, including those individuals responsible for the investment, operations and compliance with respect to the Funds’ investments, and the responsibilities of the investment, operations and compliance personnel with respect to the Funds. They also considered the resources, operational structures and practices of the Adviser in managing the Funds’ portfolios, in monitoring and securing the Funds’ compliance with investment objectives and policies and with applicable laws and regulations, and in seeking best execution of portfolio transactions. Drawing upon all the materials provided throughout the year, including the 15(c) Materials, and their knowledge of the business of the Adviser formed through meetings with Portfolio Managers among others, the Independent Trustees took into account that the Adviser’s experience, resources and strength in these areas are deep, extensive and of high quality. On the basis of this review, the Independent Trustees determined that the nature and extent of the services provided by the Adviser to the Fund were appropriate, had been of high quality, and could be expected to remain so.
The Independent Trustees discussed the Fund performance metrics in the 15(c) Materials that were compiled by Morningstar. The Chief Financial Officer directed the Trustees to the summary of the Morningstar Report and noted the performance and expense highlights of the Funds. In assessing the quality of the portfolio management, the Independent Trustees were able to compare the short-term and long-term performance of each Fund on both an absolute basis and in comparison to its peer group, as set forth in the Morningstar Report. The Board recognized the steps that management has taken over the past year with respect to the performance of the Funds and specifically to address the bottom quartile performance of certain of the Funds for the three and five years ended December 31, 2012, including, depending on the Fund, changes to the portfolio management team, increased investment in analytical, investment and research tools for portfolio management and enhancements to the risk management process. The Independent Trustees noted that the performance of certain of these Funds had recently improved, but acknowledged that they will continue to closely monitor these Funds for further improvement. The Independent Trustees also reviewed a summary of certain Fund expenses against those of peer and category groups. For certain of the Funds, they noted that higher expenses relative to peer and category groups were due to the small size of a Fund or its decline in assets. In other instances, the net expenses exceeded the peer group and category medians largely due to an advisory fee higher than the category median. The Independent Trustees considered the use of Adviser assets to potentially benefit shareholders over time through the hiring of additional analysts, operations and compliance staff over the past five years, enhancements to portfolio management and research teams and provision of additional risk and analytic tools for portfolio management. The Independent Trustees concluded on balance that the fees to the Adviser were fair and equitable.
The Independent Trustees also considered the profitability of the advisory arrangements with the Adviser. The Independent Trustees were provided with data on the Funds’ profitability generally and on the profitability of each Fund. The Independent Trustees also examined the expense limitation agreements in place and any other expense subsidization undertaken by the Adviser, as well as each Funds’ brokerage and commissions, commission sharing agreements and the open-end Funds’ payments to intermediaries whose customers invest in the Funds. After discussion and analysis, the Independent Trustees concluded that the profitability was in no instance such as to render any advisory fee excessive.
The Independent Trustees also had an opportunity to review and discuss the other 15(c) Materials provided by Alpine in response to the request of their Counsel, including, among others, expense information, organization charts and advisory fee breakpoints. Further, the Independent Trustees had the opportunity to consider whether the management of the Funds resulted in any “fall-out” benefits to the Adviser. In considering whether the Adviser benefits in other ways from its relationship with the Funds, the Independent Trustees concluded that, to the extent that Adviser derives other benefits from its relationship with the Funds, those benefits are not so significant as to render the Adviser’s fees excessive.
On the basis of their ongoing discussions with Management and their analysis of information provided prior to and at the meeting, the Independent Trustees determined that the nature of the Funds and their operations, particularly the open-end Funds, is such that economies of scale may be realized as the Funds grow in size.
The Independent Trustees approved the continuance of the Funds’ Agreements with Adviser after weighing the foregoing factors. They reasoned that the nature and extent of the services provided by the Adviser were appropriate and that the Adviser had and was taking appropriate steps to address performance issues affecting certain Funds. As to the Adviser’s fees, the Independent Trustees determined that the fees, considered in relation to the services provided, were fair and reasonable. Accordingly, the Trustees, including a majority of the Independent Trustees, agreed to approve the continuation of the Agreements for one year.
129
Alpine Mutual Funds
Additional Information (Unaudited)—Continued
April 30, 2013
Availability of Proxy Voting Information
Information regarding how each Fund votes proxies relating to portfolio securities is available without charge upon request by calling toll-free at 1-888-785-5578 and on the SEC’s website at www.sec.gov. Information regarding how each Fund voted proxies relating to portfolio securities during the most recent twelve month period ended June 30 is available on the SEC’s website at www.sec.gov or by calling the toll-free number listed above.
Availability of Quarterly Portfolio Schedule
Each Fund files Form N-Q for the first and third quarters of each fiscal year on Form N-Q. Each Fund’s Form N-Q is available on the SEC’s website at www.sec.gov and may be reviewed and copied at the SEC’s Public Reference Room in Washington, DC. Information on the operation of the Public Reference Room may be obtained by calling 1-202-551-8090.
Privacy Policy
The Funds collect non-public information about you from the following sources:
• information we receive about you on applications or other forms;
• information you give us orally; and
• information about your transactions with others or us.
The Funds do not disclose any non-public personal information about our customers or former customers without the customer’s authorization, except as required by law or in response to inquiries from governmental authorities. The Funds restrict access to your personal and account information to those employees who need to know that information to provide products and services to you. The Funds also may disclose that information to unaffiliated third parties (such as to brokers or custodians) only as permitted by law and only as needed for us to provided agreed services to you. The Funds maintain physical, electronic and procedural safeguards to guard your non-public personal information.
In the event that you hold shares of the Funds through a financial intermediary, including, but not limited to a broker dealer, bank or trust company, the privacy policy of your financial intermediary would govern how your non-public personal information would be shared with unaffiliated third parties.
130
TRUSTEES
Samuel A. Lieber
EleanorT.M. Hoagland
James A. Jacobson
H. Guy Leibler
Jeffrey E. Wacksman
CUSTODIAN &
ADMINISTRATOR
State Street Bank & Trust Company
One Lincoln Street
Boston, MA 02111
INDEPENDENT REGISTERED
PUBLIC ACCOUNTING FIRM
Deloitte & Touche LLP
500 College Road East
Princeton, NJ 08540
FUND COUNSEL
Wilkie Farr & Gallagher LLP
787 7th Avenue
NewYork, NY 10019
DISTRIBUTOR
Quasar Distributors, LLC
615 East Michigan Street
Milwaukee,WI 53202
INVESTMENT ADVISER
Alpine Woods Capital Investors, LLC
2500 Westchester Ave., Suite 215
Purchase, NY 10577
TRANSFER AGENT
Boston Financial Data Services
Two Heritage Drive
North Quincy, MA 02171

SHAREHOLDER | INVESTOR INFORMATION
1(888)785.5578
www.alpinefunds.com
This material must be preceded or accompanied by a current prospectus.
Item 2. Code of Ethics
Not applicable to semi-annual reports.
Item 3. Audit Committee Financial Expert
Not applicable to semi-annual reports.
Item 4. Principal Accountant Fees and Services
Not applicable to semi-annual reports.
Item 5. Audit Committee of Listed Registrants
Not applicable to registrants who are not listed issuers (as defined in Rule 10A-3 under the Securities Exchange Act of 1934).
Item 6. Schedule of Investments
| (a) | Schedule of Investments is included as part of Item 1 of the Form N-CSR. |
Item 7. Disclosure of Proxy Voting Policies and Procedures for Closed-End Management Investment Companies.
Not applicable to open-end investment management companies.
Item 8. Portfolio Managers of Closed-End Management Investment Companies.
Not applicable to open-end investment management companies.
Item 9. Purchases of Equity Securities by Closed-End Management Investment Company and Affiliated Purchasers.
Not applicable to open-end investment management companies.
Item 10. Submission of Matters to a Vote of Security Holders.
There were no material changes to the procedures by which shareholders may recommend nominees to the Registrant’s Board of Trustees.
Item 11. Controls and Procedures.
(a) The Registrant’s principal executive officer and principal financial officer have evaluated the registrant’s disclosure controls and procedures (as defined in Rule 30a-3(c) under the Investment Company Act of 1940, as amended) within 90 days of this filing and have concluded that the Registrant’s disclosure controls and procedures were effective, as of that date.
(b) There was no change in the Registrant’s internal control over financial reporting (as defined in Rule 30a-3(d) under the Investment Company Act of 1940, as amended) during the second fiscal quarter of the period covered by this report that has materially affected, or is reasonably likely to materially affect, the Registrant’s internal control over financial reporting.
Item 12. Exhibits
(a)(1) Not applicable to semi-annual reports.
(a)(2) The certifications required by Rule 30a-2(a) of the Investment Company Act of 1940, as amended, and Section 302 of the Sarbanes-Oxley Act of 2002 are attached hereto as Ex99.Cert.
(a)(3) Not applicable.
(b) The certifications by the Registrant’s Principal Executive Officer and Principal Financial Officer, as required by Rule 30a-2(b) of the Investment Company Act of 1940, as amended, and Section 906 of the Sarbanes-Oxley Act of 2002 are attached hereto as Ex99.906Cert.
SIGNATURES
Pursuant to the requirements of the Securities Exchange Act of 1934 and the Investment Company Act of 1940, the registrant has duly caused this report to be signed on its behalf by the undersigned, thereunto duly authorized.
Alpine Income Trust
| By: | /s/ Samuel A. Lieber | |
| Samuel A. Lieber | |
| Chief Executive Officer (Principal Executive Officer) |
| | |
| Date: | July 1, 2013 |
Pursuant to the requirements of the Securities Exchange Act of 1934 and the Investment Company Act of 1940, this report has been signed below by the following persons on behalf of the registrant and in the capacities and on the dates indicated.
| By: | /s/ Samuel A. Lieber | |
| | Samuel A. Lieber | |
| | Chief Executive Officer (Principal Executive Officer) |
| By: | /s/ Ronald G. Palmer, Jr. | |
| | Ronald G. Palmer, Jr. | |
| | Chief Financial Officer (Principal Financial Officer) |
| | |
| Date: | July 1, 2013 |