UNITED STATES
SECURITIES AND EXCHANGE COMMISSION
Washington, D.C. 20549
FORM N-CSR
CERTIFIED SHAREHOLDER REPORT OF REGISTERED
MANAGEMENT INVESTMENT COMPANIES
Investment Company Act file number: 811-21210
Alpine Income Trust
(Exact name of registrant as specified in charter)
2500 Westchester Avenue, Suite 215
Purchase, New York 10577
(Address of principal executive offices)(Zip code)
(Name and Address of Agent for
Service) | Copy to: |
| | |
Samuel A. Lieber
Alpine Woods Capital Investors, LLC
2500 Westchester Avenue, Suite 215
Purchase, New York 10577 | Rose DiMartino
Attorney at Law
Willkie Farr & Gallagher
787 7th Avenue, 40th Floor
New York, New York 10019 |
Registrant’s telephone number, including area code: (914) 251-0880
Date of fiscal year end: October 31
Date of reporting period: November 1, 2015 – April 30, 2016
Item 1: Shareholder Report

Table of Contents
| Additional Alpine Funds are offered in the Alpine Equity Trust. These Funds include: |
| Alpine International Real Estate Equity Fund | Alpine Emerging Markets Real Estate Fund |
| Alpine Realty Income & Growth Fund | Alpine Global Infrastructure Fund |
| | Alpine Global Realty Growth & Income Fund |
Alpine’s Real Estate Funds’ investment objectives, risks, charges and expenses must be considered carefully before investing in funds of the Alpine Equity Trust. The statutory and summary prospectuses contain this and other important information about the investment company, and it may be obtained by calling 1-888-785-5578, or visiting www.alpinefunds.com. Read it carefully before investing.
Mutual fund investing involves risk. Principal loss is possible.
Alpine’s Investment Outlook

Dear Shareholders:
Welcome to the Alpine Funds’ fiscal 2016 semi-annual report covering the period from November 1, 2015 through April 30, 2016. The current environment is similar to the one we commented on in our prior annual report to shareholders. Once again, there was a rapid sell down in global equities mid-period, followed by a gradual recovery. The principal cross-currents influencing global capital markets continue to be weak economic growth, volatile commodity prices weakened by excess supply, and monetary policy biased towards tightening in the United States versus virtually all foreign central banks which seek looser monetary policy. During the period under review, the U.S. Federal Reserve Bank (Fed) raised rates modestly in December and this was followed notably by both the Bank of Japan (BOJ) and the European Central Bank (ECB) taking their short-term rates below zero. Of the 56 countries on which Bloomberg tracks fixed income market data, 12 currently have negative interest rates going out as far as five years, while 18 have been negative for two years. Needless to say, this is unprecedented. The data suggests that inflation expectations remain low for much of the world.
Other issues which have continued to influence the markets are the relatively weak performance of the Chinese economy and intertwined with it the price volatility of many commodity markets. The most prominent commodity, oil, became a proxy for economic sentiment during a few months this Spring, as West Texas Intermediate (WTI) crude oil declined from $50 to a low of $32.50 per barrel in January before rallying to over $46 by end of the period. Much of the fear that whips oil prices reflected concerns beyond supply and demand imbalances. Rather, other factors, such as corporate earnings and ability to repay debt have weighed heavily on many of the sector’s companies. While the recent rebound in prices has no doubt stabilized the situation somewhat, there has been an increase in mortgage and auto loan delinquencies in oil producing regions. The impact of such pressures may increase if the prices decline for an extended period of time, although, most analysts believe that oil prices will be centered around $50 for another 12 to 18 months.
Economic prospects vary widely both inside and outside the United States, where pockets of relative strength and notable weakness are geographically dispersed. This could lead to an increase in national or regional concerns, heightening tensions along religious or ethnic divides as well as economic class conflicts between the “haves” and the “have nots”. Nowhere is this more stark than in
Europe where the flood of migrants from the Middle East and Africa last year has lead the European Union (EU) into negotiations with Turkey to constrain and contain many of the displaced Syrian and Iraqi refugees. Meanwhile, protests in France are flaring over economic issues and nationalist movements are growing in Austria and the Netherlands, as well as in France and Germany. Of course, similar issues have been brought forward during this U.S. Presidential season in America as anti-Muslim/Hispanic/Chinese sentiment have been given voice by Presidential candidate Donald Trump. As economic prospects stagnate, there is a natural tendency to seek political change. Indeed, populist candidates have made political inroads around the world. Alas, people forget that globalization, trade treaties and economic unions have been a de facto response to prior periods of nationalism and protectionism. So, populist proclamations can be a seductive rallying cry for those who seek or cling to power, yet offer few solutions.
Another type of push/pull force affecting the markets has been economic data. Some data reflects improved business prospects, while other reports reveal deteriorating fundamentals. In the United States, we continue to have solid housing performance, for both rental and for sale properties, as well as a high level of auto sales. Meanwhile, retail sales have been relatively stagnant with prominent declines in large department stores which have been losing market share to e-commerce vendors. It is notable that the level of continuing jobless claims is approaching the lowest level that the economy experienced during the 70’s, 80’s and 90’s. However, average hourly wages and other measures of income growth, including the level of output in terms of gross domestic profit (GDP) per worker, has declined in recent years, reflecting stagnant productivity. Nevertheless, consumer expectations recently hit an eight year high. Such conflicting data has partially been responsible for the Fed’s tentative moves to raise interest rates since May of 2013, with initial success only occurring in December of 2015. If the Fed is successful in modestly raising interest rates this summer and perhaps again, once or twice, over the following 12 months, then they would have accomplished a milestone for other central banks to focus their respective interest rate normalization policies in ensuing years. While Alpine believes that this will be the case, some observers fear that even such modest interest rate increases as one quarter of one percent could trip up the economy and lead to a recession. This concern combines with limited supplies of long rated treasury bonds to keep the long end of the yield curve flat. While demand for yield is strong, the asset buying (i.e. Quantitative Easing) programs
1
of the Fed, ECB and BOJ have reportedly absorbed a range from 20% to 70% of potential supply. In this manner, central banks have both provided liquidity and raised benchmark asset prices through global capital markets.
It is notable that neither significant fiscal stimulus nor broad based capital investment have yet been deployed during this economic recovery. Even though the U.S. was the epicenter of the cascading collapse of global capital markets back in 2008, almost bringing about the demise of our credit based financial system, America’s economy is now slowly leading the world back to normalcy. We concur with recent proclamations by some prominent economists that the best way to stimulate economic activity will be through significant infrastructure spending. Indeed, both Hillary Clinton and Donald Trump have already raised this as a key element to their economic plans. It is likely that the U.S. will lead a global shift from austerity towards focused fiscal spending. Japan has already begun to spend significant sums on rebuilding after the recent earthquake and in advance of hosting the Olympics in 2020. A number of European cities also have significant long-term transportation projects which can be expanded. China has described new infrastructure investments to connect Western China with the Middle East and to South Asia as ‘One belt, two suspenders’, while other emerging economies, from United Arab Emirates to India are moving forward with large projects.
If consumer spending can be sustained through this year, with the prospect of significant increases in infrastructure projects in future years, then we believe the corporate capital expenditure cycle could ramp up rather quickly. This in turn could create a very strong economic prospect for 2018 and beyond. Typically, in anticipation, this could produce a strong equity market toward the end of this year and into 2017. In turn, this increase in investment would continue to boost employment and over time, wage growth, which could lead to faster consumption growth and the maturation of the economic cycle, including higher interest rates. By that time (2018), we believe that Europe could also be signaling higher interest rates and some improvement in GDP. China will also likely follow the rise U.S. economic demand and we believe that Japan, while still focused on domestic demand, will also benefit from our tail wind. Historically, Latin America has been greatly influenced by the U.S. economy and we believe that this will also be the case over the next few years.
So what does this mean for the debt and equity markets? Significant liquidity provided by Federal Reserve policy has helped to drive liquidity into the capital markets while the market place has responded with innovation triggered by new regulations and technology. Floor traders, position traders, order clerks, market makers and many arbitrageurs have been made redundant, inefficient or too slow in a market dominated by algorithmic factor based or index trading strategies. Since many of these algorithms are dependent on a variety of economic influences, the market’s sensitivity to such data has at times been disproportionate with its significance. Thus, some of the volatility experienced amongst sectors or index groupings has often been greater than that of the
overall market. The nature of many of these quantitative models is that the rate or level of change recorded by various influences, be they internal factors such as prospective sales growth, or external inputs such as interest rates or economic growth, tend to favor companies which can generate internal growth despite the slow cyclical economy. It is notable, however, that during the six months under review, we saw a shift in performance towards cyclical growth situations. This could be a foreshadowing of improving economic prospects, if not merely a recognition of relative undervaluation.
Fundamentally, the tone of the market reflects the outlook for revenue and profit growth and the cross currents which we have described appear to have created a shift in the markets current tone. Specifically, corporate earnings in the S&P 500® Index fell by 6% during the first quarter of 2016, but analyst aggregate expectations are for some improvement in the second quarter with a positive uptick in the second half of the year. It is anticipated that many of the cyclical industries which were most heavily hurt by the strong dollar at the end of last year and the slowdown in the natural resource sector may have bottomed and the related fallout in the financial sector is not as significant as feared. As a result, this shift in market focus may be the beginning of a change in the structural and sectoral leadership of the market. If indeed we are correct that an economic recovery will take hold in 2017 and 2018, then we would expect a significant increase in the prospects of cyclical companies and a reversal of the decline in investment flows to equities versus bonds. We are not suggesting this will be strong enough to produce an exodus from fixed income investing, but we do believe that new capital deployed will shift increasingly into the equity markets with positive impact.
We look forward to reporting on our progress through this challenging and changing environment at the end of the year. Thank you for your interest and support.
Sincerely,

Samuel A. Lieber
President
Past performance is not a guarantee of future results. The specific market, sector or investment conditions that contribute to a Fund’s performance may not be replicated in future periods.
Mutual fund investing involves risk. Principal loss is possible. Please refer to individual letters for risks specific to that fund.
This letter and the letters that follow represent the opinions of the Funds’ management and are subject to change, are not guaranteed and should not be considered recommendations to buy or sell any security. The information provided is not intended to be, and is not, a forecast of future events, a guarantee of results, or investment advice.
2
| Disclosures and Definitions |  |
Please refer to the Schedule of Portfolio Investments for each Fund’s holding information. Fund holdings and sector allocations are subject to change and should not be considered a recommendation to buy or sell any security.
Favorable tax treatment of Fund distributions may be adversely affected, changed or repealed by future changes in tax laws. Alpine may not be able to anticipate the level of dividends that companies will pay in any given timeframe.
The Funds’ monthly distributions may consist of net investment income, net realized capital gains and/or a return of capital. If a distribution includes anything other than net investment income, the Funds will provide a notice of the best estimate of its distribution sources when distributed, which will be posted on the Funds’ website: www.alpinefunds.com, or can be obtained by calling 1-800-617-7616. We estimate that each series of the Alpine Series and Income Trusts did not pay any distributions during the fiscal semi-annual period ending April 30, 2016 through a return of capital. A return of capital distribution does not necessarily reflect the Funds’ performance and should not be confused with “yield” or “income.” Final determination of the Federal income tax characteristics of distributions paid during the calendar year will be provided on U.S. Form 1099-DIV, which will be mailed to shareholders. Please consult your tax advisor for further information.
All investments involve risk. Principal loss is possible. A small portion of the S&P 500 yield may include return of capital; the 10-year Treasury yield does not include return of capital; Corporate bonds and High Yield Bonds generally do not have return of capital; a portion of the dividend paid by REITs and REIT preferred stock may be deemed a return of capital for tax purposes in the event the company pays a dividend greater than its taxable income. A stock may trade with more or less liquidity than a bond depending on the number of shares and bonds outstanding, the size of the company, and the demand for the securities. The REIT and REIT preferred stock market are smaller than the broader equity and bond markets and often trade with less liquidity than these markets depending upon the size of the individual issue and the demand of the securities. Treasury notes are guaranteed by the U.S. Government and thus they are considered to be safer than other asset classes. Tax features of a Treasury Note, Corporate bond, Stock, High Yield bond, REITs and REIT preferred stock may vary based on an individual circumstances. Consult a tax professional for additional information. Neither the Fund nor any of its representatives may give tax advice.
Investors should consult their tax advisor for information concerning their particular situation.
Standard & Poor’s Financial Services LLC (S&P) is a financial services company, a division of McGraw Hill Financial that publishes financial research and analysis on stocks and bonds. S&P is considered one of the big three credit-rating agencies, which also include Moody’s Investor Service and Fitch Ratings.
S&P assigns ratings on a scale of ‘D’ to ‘AAA’, with ‘D’ the lowest/weakest rating, indicating a default, and ‘AAA’ the highest/strongest rating, indicating the strongest credit quality in S&P’s spectrum of credit ratings.
S&P incorporates a broad number of credit areas of each entity/municipality when assigning a bond rating to an entity’s debt instrument, including: (a) financial position, which encompasses liquidity metrics, cash reserves, non-liquid assets, liabilities, and other financial metrics; (b) debt position, which includes long and short-term bonded debt and other privately-placed notes/bonds, leases and other off-balance sheet liabilities; (c) pension and Other Post-Employment Benefits (OPEB); (d) socio-economic indices; and (e) the aptitude and sophistication of management.
Earnings Growth and EPS Growth are not measures of the Funds’ future performance.
Diversification does not assure a profit or protect against loss in a declining market.
Must be preceded or accompanied by a prospectus.
Quasar Distributors, LLC, distributor.
Definitions
Barclays Municipal Bond: High Yield (non-Investment Grade) Index is the Municipal High Yield component of the Barclays Municipal Bond Index. The Barclays Municipal Bond Index is a rules-based, market-value-weighted index engineered for the long-term tax-exempt bond market.
Barclays Municipal Bond: 1 Year (1-2) Index is a total return benchmark of BAA3 ratings or better designed to measure returns for tax exempt assets.
Basis Point is a value equaling one one-hundredth of a percent (1/100 of 1%).
BVAL Muni Benchmark 10 Year Index is the baseline curve for BVAL tax-exempt munis at the ten year spot on the curve. It is populated with high quality U.S. municipal bonds with an average rating of AAA from Moody’s and S&P. The yield curve is built using non-parametric fit of market data obtained from the Municipal Securities
3
| Disclosures and Definitions (Continued) | |
Rulemaking Board, new issues calendars and other proprietary contributed prices.
BVAL Muni Benchmark 1T Index is the baseline curve for BVAL tax-exempt munis at the one year spot on the curve. It is populated with high quality U.S. municipal bonds with an average rating of AAA from Moody’s and S&P. The yield curve is built using non-parametric fit of market data obtained from the Municipal Securities Rulemaking Board, new issues calendars and other proprietary contributed prices.
BVAL Muni Benchmark 6M Index is the baseline curve for BVAL tax-exempt munis at the six month spot on the curve. It is populated with high quality U.S. municipal bonds with an average rating of AAA from Moody’s and S&P. The yield curve is built using non-parametric fit of market data obtained from the Municipal Securities Rulemaking Board, new issues calendars and other proprietary contributed prices.
Cash Flow measures the cash generating capability of a company by adding non-cash charges (e.g., depreciation) and interest expense to pretax income.
Debt-To-Capital Ratio is the proportion of a company’s total capital that is debt.
Distribution Yield is calculated by taking the most recent distribution, annualizing it, and dividing by the NAV of the Fund at the period end.
Dividend Yield is yield a company pays out to its shareholders in the form of dividends. It is calculated by taking the amount of dividends paid per share over a specific period of time and dividing by the stock’s price.
Dow Jones Industrial Average is a price-weighted average of 30 blue-chip stocks that are generally the leaders in their industry.
Duration is a commonly used measure of the potential volatility of the price of a debt securities, prior to maturity. Securities with a longer duration generally have more volatile prices than securities of comparable quality with a shorter duration.
Earnings Growth is the annual rate of growth of earnings from investments.
Effective Average Maturity is the weighted average of the maturities of the underlying bonds in a portfolio of bonds.
Effective Duration is a duration calculation for bonds with embedded options. Effective duration takes into account that expected cash flows will fluctuate as interest
rates change. Please note, duration measures the sensitivity of price (the value of principal) of a fixed-income investment to a change in interest rates.
Fed Funds Rate in the U.S. is the interest rate at which depository institutions lend reserve balances to other depository institutions overnight on an uncollateralized basis.
Ibovespa is a total return index weighted by traded volume and is comprised of the most liquid stocks traded on the Sao Paulo Stock Exchange.
KBW Nasdaq Bank Index is designed to track the performance of the leading banks and thrifts that are publicly-traded in the U.S. The Index includes 24 banking stocks representing the large U.S. national money centers, regional banks and thrift institutions.
Markit Eurozone Manufacturing PMI measures the performance of the manufacturing sector and is derived from a survey of 600 industrial companies.
MSCI All Country World Index is a total return, free-float adjusted market capitalization weighted index that captures large and mid-cap representation across 24 Developed and 21 Emerging Markets countries. With 2,483 constituents, the index covers approximately 85% of the global investable equity opportunity set. Net total return indices reinvest dividends after the deduction of withholding taxes, using (for international indices) a tax rate applicable to non-resident institutional investors who do not benefit from double taxation treaties.
MSCI Europe Index is a free float-adjusted market capitalization weighted index that is designed to measure the equity market performance of the developed markets in Europe.
Source: MSCI. MSCI makes no express or implied warranties or representations and shall have no liability whatsoever with respect to any MSCI data contained herein. The MSCI data may not be further redistributed or used as a basis for other indices or any securities or financial products. This report is not approved, reviewed or produced by MSCI.
NASDAQ Financial 100 Total Return Index is a total return index that includes 100 of the largest domestic and international financial securities listed on The NASDAQ Stock Market based on market capitalization. They include companies classified according to the Industry Classification Benchmark as Financials, which are included within the NASDAQ Bank, NASDAQ Insurance, and NASDAQ Other Finance Indexes.
4
| | |
Net Lease is a provision that requires the tenant to pay a portion or all of the taxes, fees and maintenance costs for the property in addition to rent.
Par is the face value of a stock or other security as distinct from its market value.
Price/Earnings Ratio (P/E) is a valuation ratio of a company’s current share price compared to its per-share earnings. Normalized earnings – earnings metric that shows you want earnings look like smoothed out in the long run, taking into account the cyclical changes in an economy or stock.
Return on Equity (ROE) is the amount of net income returned as a percentage of shareholders equity. Return on equity measures a corporation’s profitability by revealing how much profit a company generates with the money shareholders have invested.
Russell 2000® Index measures the performance of the small-cap segment of the U.S. equity universe and includes approximately 2000 of the smallest securities based on a combination of their market cap and current index membership.
Russell 2000 Financial Services Index serves as a benchmark for all financial services sector small cap stocks in the US specifically those with the Russell 2000® Index.
Source: FTSE Russell Indexes. “FTSE®”, “Russell®”, “MTS®”, “FTSE TMX®” and “FTSE Russell” and other service marks and trademarks related to the FTSE or Russell indexes are trademarks of the London Stock Exchange Group companies and are used by FTSE, MTS, FTSE TMX and Russell under license.
S&P 500® Financials Index is comprised of those companies included in the S&P 500® that are classified as members of the GICS® financials sector.
S&P 500® Index is a total return, float-adjusted market capitalization-weighted index of 500 common stocks chosen for market size, liquidity, and industry group representation to represent U.S. equity performance. Total return indexes include reinvestments of all dividends.
S&P 500® Utilities Index comprises those companies included in the S&P 500® that are classified as members of the GICS utilities sector.
S&P 500® Telecommunication Services Index comprises those companies included in the S&P 500® that are classified as members of the GICS telecommunications services sector.
S&P 600® Index measures the small-cap segment of the U.S. equity market. The index is designed to track companies that meet specific inclusion criteria to ensure that they are liquid and financially viable.
S&P Banks Select Industry Index is comprised of the stocks in the S&P Total Market Index that are classified in the GICS asset management & custody banks, diversified banks, regional banks, other diversified financial services and thrifts & mortgage finance sub-industries.
S&P Biotechnology Select Index is comprised of the stocks in the S&P Total Market Index that are classified in the GICS biotechnology sub-industry.
S&P Metals & Mining Select Index is comprised of the stocks in the S&P Total Market Index that are classified in the GICS metal and mining sub-industries.
S&P Municipal Bond Short Intermediate Index consists of bonds in the S&P Municipal Bond Index with a min maturity of 1 year and a max of 8 years.
The S&P 500® Index, S&P 600® Index, S&P Banks Select Industry Index, S&P Metals & Mining Select Industry Index, S&P Biotechnology Select Index, S&P 500® Telecommunications Services Index, S&P 500® Utilities Index, S&P 500® Financials Index and the S&P Municipal Bond Short Intermediate Index (the “Indices”) are products of S&P Dow Jones Indices LLC and have been licensed for use by Alpine Woods Capital Investors, LLC. Copyright © 2015 by S&P Dow Jones Indices LLC. All rights reserved. Redistribution or reproductions in whole or in part are prohibited without written the permission of S&P Dow Jones Indices LLC. S&P Dow Jones Indices LLC, its affiliates, and third party licensors make no representation or warranty, express or implied, with respect to the Index and none of such parties shall have any liability for any errors, omissions, or interruptions in the Index or the data included therein.
Weighted Average Maturity is the average time it takes for securities in a portfolio to mature, weighted in proportion to the dollar amount that is invested in the portfolio. Weighted average maturity (WAM) measures the sensitivity of fixed-income portfolios to interest rate changes. Portfolios with longer WAMs are more sensitive to changes in interest rates because the longer a bond is held, the greater the opportunity for interest rates to move up or down and affect the performance of the bonds in the portfolio.
An investor cannot invest directly in an index.
5
Equity Manager Reports

| | Alpine Dynamic Dividend Fund |
| | |
| | Alpine Rising Dividend Fund |
| | |
| | Alpine Financial Services Fund |
| | |
| | Alpine Small Cap Fund |
6
| Alpine Dynamic Dividend Fund |  |
| Comparative Annualized Returns as of 4/30/16 (Unaudited) |
| | | 6 Months(1) | | 1 Year | | 3 Years | | 5 Years | | 10 Years | | Since Inception(2) |
| Alpine Dynamic Dividend Fund — Institutional Class | | | -2.33% | | | | -6.95% | | | | 5.22% | | | | 1.17% | | | | -0.21% | | | | 4.29% | |
| Alpine Dynamic Dividend Fund — Class A (Without Load) | | | -2.45% | | | | -7.19% | | | | 4.96% | | | | N/A | | | | N/A | | | | 7.62% | |
| Alpine Dynamic Dividend Fund — Class A (With Load) | | | -7.88% | | | | -12.39% | | | | 3.02% | | | | N/A | | | | N/A | | | | 6.22% | |
| MSCI All Country World Index | | | -0.94% | | | | -5.66% | | | | 5.06% | | | | 4.69% | | | | 3.89% | | | | 6.78% | |
| Lipper Global Equity Income Funds Average(3) | | | 0.65% | | | | -4.05% | | | | 3.72% | | | | 4.37% | | | | 3.08% | | | | 6.17% | |
| Lipper Global Equity Income Funds Ranking(3) | | | N/A(4) | | | | 120/161 | | | | 39/135 | | | | 79/81 | | | | 36/36 | | | | 30/30 | |
| Gross Expense Ratio (Institutional Class): 1.27%(5) | | | | | | | | | | | | | | | | | | | | | | | | |
| Net Expense Ratio (Institutional Class): 1.27%(5) | | | | | | | | | | | | | | | | | | | | | | | | |
| Gross Expense Ratio (Class A): 1.52%(5) | | | | | | | | | | | | | | | | | | | | | | | | |
| Net Expense Ratio (Class A): 1.52%(5) | | | | | | | | | | | | | | | | | | | | | | | | |
| | (1) | Not annualized. |
| | (2) | Institutional Class shares commenced on September 22, 2003 and Class A shares commenced on December 30, 2011. Returns for indices are since September 22, 2003. |
| | (3) | The since inception return represents the period beginning September 25, 2003 (Institutional Class only). |
| | (4) | FINRA does not recognize rankings for less than one year. |
| | (5) | As disclosed in the prospectus dated February 29, 2016 as amended April 4, 2016. |
Performance data quoted represents past performance and is not predictive of future results. Investment return and principal value of the Fund fluctuate, so that the shares, when redeemed, may be worth more or less than their original cost. Performance current to the most recent month end may be lower or higher than performance quoted and may be obtained by calling 1-888-785-5578. Performance data shown does not reflect the 1.00% redemption fee imposed on shares held for fewer than 60 days. If it did, total returns would be reduced. Returns for the Class A shares with sales charge reflect a maximum sales charge of 5.50%. Performance for the Class A shares without sales charges does not reflect this load.
MSCI All Country World Index is a total return, free-float adjusted market capitalization weighted index that captures large and mid-cap representation across 24 Developed and 21 Emerging Markets countries. With 2,483 constituents, the index covers approximately 85% of the global investable equity opportunity set. Net total return indices reinvest dividends after the deduction of withholding taxes, using (for international indices) a tax rate applicable to non-resident institutional investors who do not benefit from double taxation treaties. Source: MSCI. MSCI data may not be reproduced or used for any other purpose. MSCI provides no warranties, has not prepared or approved this report, and has no liability hereunder. The Lipper Global Equity Income Funds Average is an average of funds that by prospectus language and portfolio practice seek relatively high current income and growth of income by investing at least 65% of their portfolio in dividend-paying securities of domestic and foreign companies. Lipper rankings for the periods shown are based on fund total returns with dividends and distributions reinvested and do not reflect sales charges. The Lipper Global Equity Income Funds Average are unmanaged and do not reflect the deduction of direct fees associated with a mutual fund, such as investment adviser fees; however, the Lipper Global Equity Income Funds Average reflects fees charged by the underlying funds. The performance for the Alpine Dynamic Dividend Fund reflects the deduction of fees for these value-added services. Investors cannot directly invest in an index.
Expense Ratios reflect the ratios reported in the Fund’s most recent prospectus. The Alpine Dynamic Dividend Fund has a contractual expense waiver that continues through April 1, 2017. Where a Fund’s gross and net expense ratios are the same for the period reported, the contractual expense reimbursement level was not reached as of the end of that period. To the extent the Fund’s expenses were reduced by waivers, the Fund’s total returns were increased. In these cases, in the absence of the expense waivers, the Fund’s total returns would have been lower.
To the extent that the Fund’s historical performance resulted from gains derived from participation in Initial Public Offerings (“IPOs”) and/or Secondary Offerings, there is no guarantee that these results can be replicated in future periods or that the Fund will be able to participate to the same degree in IPO/Secondary Offerings in the future.
7
| Alpine Dynamic Dividend Fund (Continued) | |
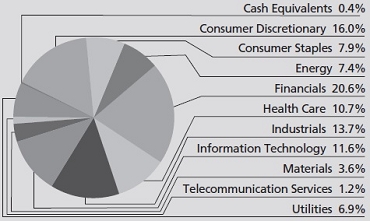
Portfolio Distributions* (Unaudited)
| Top 10 Holdings* (Unaudited) | |
| 1. | | Asciano, Ltd. | 1.94 | % |
| 2. | | CVS Health Corp. | 1.67 | % |
| 3. | | Dollar General Corp. | 1.61 | % |
| 4. | | Apple, Inc. | 1.42 | % |
| 5. | | EMC Corp. | 1.40 | % |
| 6. | | Veolia Environnement SA | 1.35 | % |
| 7. | | CMS Energy Corp. | 1.34 | % |
| 8. | | Svenska Cellulosa AB SCA-B Shares | 1.30 | % |
| 9. | | Harris Corp. | 1.27 | % |
| 10. | | Snap-on, Inc. | 1.25 | % |
| * | Portfolio Distributions percentages are based on total net investments. Top 10 Holdings do not include short-term investments and percentages are based on total net assets. Portfolio holdings sector distributions are as of 04/30/16 and are subject to change. Portfolio holdings are not recommendations to buy or sell any securities. |
Value of a $1,000,000 Investment (Unaudited)
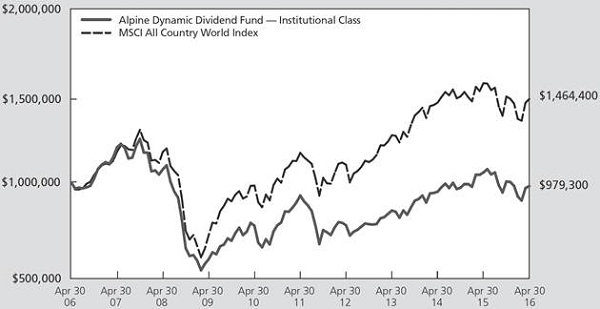
This chart represents a comparison of a hypothetical $1,000,000 investment in the Fund versus a similar investment in the Fund’s benchmarks. The graph and the table do not reflect the deduction of taxes that a shareholder would pay on Fund distributions or the redemption of Fund shares. Investment performance reflects the waiver and recovery of certain fees, if applicable. Without the waiver and recovery of fees, the Fund’s total return would have differed.
Performance data quoted represents past performance and is not predictive of future results. Investment return and principal value of the Fund fluctuate, so that shares, when redeemed, may be worth more or less than their original cost.
8
| Alpine Dynamic Dividend Fund (Continued) | |
Commentary
Dear Shareholders:
In the six month period ended April 30, 2016, the Alpine Dynamic Dividend Fund (ADVDX) generated a total return of -2.33% versus the MSCI All Country World Index, which had a total return of -0.94%. All returns include reinvestment of all distributions. The Fund distributed $0.12 per share during the period. All references in this letter to the Fund’s performance relate to the performance of the Fund’s Institutional Class.
ECONOMIC ANALYSIS
Despite a bout of turbulence, global equities exhibited remarkable resiliency in the six month period ended April 30, 2016, recovering sharply from a 15.62% peak-to-trough decline. Investors in the U.S. were taken for a particularly wild ride as the first six weeks of calendar 2016 brought relentless selling of stocks over intensifying concerns of a recession. Such fears faded quickly, however, and the S&P 500® Index ended the first quarter of 2016 in positive territory as macroeconomic data improved.
The recovery was not just limited to stocks; several important commodities rebounded, with oil prices bouncing from a low of $26 per barrel in February to $46 per barrel just two months later. Iron ore, a key raw material in the production of steel, reversed a precipitous decline, bouncing from $38 per ton in December to $70 per ton in April.
Perhaps the most notable attribute of the six month period was the dramatic rotation into asset classes and investment styles that were significantly out of favor in recent years: cyclical stocks, emerging markets stocks, and value stocks. To add context, the S&P Metals & Mining Select Industry Index increased by 35.03% while the S&P Biotechnology Select Index declined by 10.29% in the period.
In another anomalous twist, the rally was not accompanied by rising interest rates; the U.S. 10 Year Treasury Yield actually fell from 2.14% to 1.83% during the period as the U.S. Federal Reserve (the “Fed”) shifted to a more dovish stance. So instead of fleeing from interest rate-sensitive safe havens, investors flocked to them as evidenced by the impressive returns of the S&P 500 Utilities Index and the S&P 500 Telecommunication Services Index, up 12.75% and 14.68%, respectively, during the period.
Partly as a result of the improvement in commodity markets, stocks of several emerging market countries performed quite well, with The Ibovespa leading the charge with a total return of 31.57% in U.S. dollars as investors cheered the prospect of a political regime change due to the impeachment of Brazil’s President Dilma Rousseff.
On the other side of the ledger, Europe struggled as the increasingly dovish bias by the Fed led to a strengthening of the Euro against the U.S. Dollar. This headwind, as well as a slight deterioration in the Markit Eurozone Manufacturing PMI from 53.2 in December 2015 to 51.2 in February 2016, led to underperformance of the MSCI Europe Index, which was down 4.02% in U.S. Dollars in the six month period.
PORTFOLIO ANALYSIS
For the six month period ending April 30, 2016, the utilities, consumer staples and consumer discretionary sectors had the greatest positive effect on the Fund’s absolute total return. The financials, information technology and energy sectors had the greatest negative contribution to the Fund’s absolute total return. On a relative basis, the healthcare sector generated the largest outperformance versus the MSCI All Country World Index, followed by the utilities and consumer discretionary sectors. The energy, materials and consumer staples sectors were the worst relative performers.
The top five contributors to the Fund’s performance for the six month period ended April 30, 2016 based on contribution to total return were Four Corners Property Trust, Dollar General Corp, Broadcom Limited, CBS Corp, and Nexity SA.
| | • | Four Corners Property Trust is a real estate investment trust (“REIT”) that was formed in a tax-free spin-off from restaurant owner and operator Darden Restaurants in November 2015. The portfolio consists of over 25% of Darden’s 1,500 restaurants with brands including Olive Garden and Longhorn Steakhouse, the vast majority of which are leased to Darden. The company paid a special dividend of $8.12 per share in January 2016 as part of the REIT conversion process whereby a company must distribute all earnings and profits accumulated prior to achieving REIT status. The stock performed well as investors were attracted to its high quality portfolio with one of the highest internal growth rates across the net lease sector. |
9
| Alpine Dynamic Dividend Fund (Continued) | |
| | • | Dollar General is the nation’s largest small-box discount retailer, with about 12,000 stores in 43 states offering over 11,000 stock-keeping units (SKUs) including national brands and private label products. The stock performed well as investors cheered the company’s well executed, highly visible earnings algorithm of 10-15% per-share earnings growth through 6-8% square footage growth, 2-4% same-store sales growth, stable margins and 5% share buybacks, as communicated in the company’s Investor Day in March 2016, its first since June 2012. Investors also welcomed the testing of a smaller 6,000 square foot store format that will allow the company to enter urban and smaller rural areas that were previously off limits. |
| | | |
| | • | Broadcom Limited is a semiconductor “powerhouse” created through the merger of Avago Technologies and Broadcom Limited that was completed in February 2016. The company has a well-diversified portfolio of products with strong access to multiple secular growth industries including mobile connectivity and data centers through its exposure to wired/wireless communication, enterprise storage, and industrials. The stock outperformed as the company exceeded earnings estimates in the January 2016 quarter and issued upbeat guidance with revenues and margins above estimates. The company also made significant progress in the integration of the Avago/Broadcom merger, hinting at upside to its targeted cost synergies and building on its excellent track record on the acquisition front. |
| | | |
| | • | Mass media company CBS Corp outperformed as advertising on their television network increased partially due to the company’s solid exposure to Super Bowl 50, as well as the benefit of three extra NFL playoff games. In addition, the news environment was quite strong, with an unusually interesting primary season ahead of the upcoming Presidential election. Investors also welcomed CBS’ announcement that it is exploring strategic alternatives for its radio station assets. We believe that the stock should continue to perform well as revenue is ramping up in areas with better visibility including retransmission licensing fees from pay-TV operators, “reverse compensation” fees from broadcast stations for the rights to air its programming, and over-the-top-content. |
| | | |
| | • | Nexity is a market leader in the French residential real estate development market. Combined with its strong presence in commercial real estate development, urban renewal via its “Villes et Projets” arm and the development in services and franchises, |
| | | the company offers a unique integrated real estate platform. The majority of Nexity’s earnings stem from the French residential market, which is benefitting from a low interest rate environment and favorable policies by the French government to stimulate the housing market, such as the Pinel buy-to-let scheme. The stock has also been boosted by a two-fold increase in commercial launches in the first quarter of 2016. |
The following companies had the largest adverse impact on the performance of the Fund based on contribution to return for the six month period ended April 30, 2016: The Williams Companies, Apple, Western Digital Corp, NorthStar Realty Finance Corp and Nokia Oyj.
| | • | The Williams Companies is a midstream company with an extensive network of natural gas and natural gas liquids infrastructure. The company’s underlying fundamentals deteriorated due to declining olefin fiber margins and the financial distress of a key customer, Chesapeake Energy, which suffered from its exposure to declining natural gas prices. Investors also soured on the merger between Energy Transfer Equity and Williams, implying that the low price paid for Williams suggested a bearish statement regarding midstream valuations. The Fund has since exited the position. |
| | | |
| | • | Iconic consumer electronics innovator Apple underperformed as it reported the first year-over-year decline in iPhone shipments in the device’s history. Investors worried that Apple is not immune to the lengthening of the replacement cycle across the smartphone market, as well as broader macro-economic weakness in emerging economies. Lack of compelling new features, combined with fewer carrier subsidies mean consumers are likely to replace their phones less frequently, and there is a growing concern that Apple will not provide a compelling reason to upgrade until 2017. The Fund remains committed to this stock due to its strong cash flow, iron-clad balance sheet, shareholder-friendly management team and attractive valuation. |
| | | |
| | • | Western Digital is a leading player in the oligopolistic hard disk drive (HDD) market. The industry is arguably in secular decline, delivering mid-teens unit volume declines in 2015, among the worst in the past 40 years as the personal computer (PC) market shifts to solutions using solid state drives (SSDs) instead of HDDs. Western Digital is attempting to position itself for this transition through its announced acquisition of Sandisk, which has strong positions in NAND and SSD markets which continue to grow. Western Digital |
10
| Alpine Dynamic Dividend Fund (Continued) | |
| | | stock suffered amidst the deteriorating fundamental backdrop in the HDD market, as well as uncertainty around the merger with Sandisk. |
| | | |
| | • | NorthStar Realty Finance is a REIT that originates, acquires and manages portfolios of commercial real estate properties as well as related securities. The stock came under pressure in part because some investors may have been caught off guard by the company’s shift to an externally managed structure along with capital management actions tied to recent acquisitions. In addition, the spinoff of its European assets into NorthStar Europe brought with it some uncertainty as there are few U.S. listed stocks holding European real estate assets. The Fund is encouraged by the company’s plans to monetize assets across several asset classes, reduce leverage and buy back shares, but credibility in the management team remains low. |
| | | |
| | • | Telecom equipment supplier Nokia owns two main businesses: Nokia Networks, which is a network infrastructure equipment supplier to global wireless and wireline operators, and Technologies, its intellectual property licensing activities. The stock underperformed amidst the deteriorating telecom capital spending environment. Investors also struggled with uncertainty around the integration of the recently completed merger with Alcatel-Lucent. One potential issue is that customers may not want to purchase equipment that could later be scrapped, resulting in a temporary market share shift towards competitors Ericsson and Huawei. The Fund is encouraged by the company’s strong net cash position, management’s commitment to return cash to shareholders including a healthy dividend, and the potential for significant cost synergies from the merger. |
We have hedged a portion of our currency exposures to the Euro, Japanese Yen, and British Pound in an effort to reduce our net currency exposure.
SUMMARY
As we look towards the balance of 2016, we see a market environment that remains fairly uncertain. The U.S. economy continues on a path of modestly positive growth while contending with a partisan environment in Washington D.C. and an election year. While the S&P 500® Index has now seen four consecutive quarters of year-on-year earnings declines due largely to severe weakness in the energy sector, there is reason for optimism. U.S. manufacturing PMI data has improved, construction spending has perked up, and unemployment indicators appear favorable.
Europe, on the other hand, is going through a soft patch, as the Markit Eurozone Manufacturing PMI has slipped below 52 and corporate earnings expectations have softened amidst a strengthening Euro. The near-term outlook may be more positive, however, as policy stimulus historically takes up to 18 months to impact the economy, so policy actions such as the European Central Bank’s early 2015 quantitative easing program are just beginning to be felt.
The same could be said of the Chinese fiscal stimulus which, when combined with its increasingly accommodative monetary and exchange-rate policies, could smooth its transition to a consumer-led economy.
Finally, Brazil’s stock market is showing signs of life as investors look forward to the potential for meaningful political change. There are still numerous headwinds with fiscal deficits and lingering inflation concerns but green shoots are emerging.
Beyond the macroeconomic environment, the Fund continues to emphasize its focus on companies with a commitment to return cash through dividends. We believe that over the long term, this strategy will offer a compelling risk-adjusted return.
Sincerely,
Brian Hennessey
Joshua E. Duitz
Portfolio Managers
11
| Alpine Dynamic Dividend Fund (Continued) | |
This letter represents the opinions of the Fund’s management and is subject to change, is not guaranteed and should not be considered a recommendation to buy or sell any security. The information provided is not intended to be, and is not, a forecast of future events, a guarantee of future results, or investment advice. Views expressed may vary from those of the firm as a whole.
Past performance is no guarantee of future results.
Mutual fund investing involves risk. Principal loss is possible. The Fund is subject to risks, including the following:
Credit Risk – Credit risk refers to the possibility that the issuer of a security will not be able to make payments of interest and principal when due. Changes in an issuer’s credit rating or the market’s perception of an issuer’s creditworthiness may also affect the value of the Fund’s investment in that issuer. The degree of credit risk depends on both the financial condition of the issuer and the terms of the obligation.
Currency Risk – The value of investments in securities denominated in foreign currencies increases or decreases as the rates of exchange between those currencies and the U.S. dollar change. Currency conversion costs and currency fluctuations could erase investment gains or add to investment losses. Currency exchange rates can be volatile, and are affected by factors such as general economic conditions, the actions of the U.S. and foreign governments or central banks, the imposition of currency controls and speculation.
Cybersecurity Risk – Cybersecurity incidents may allow an unauthorized party to gain access to Fund assets, customer data (including private shareholder information), or proprietary information, or cause the Fund, the Adviser and/or its service providers (including, but not limited to, Fund accountants, custodians, sub-custodians, transfer agents and financial intermediaries) to suffer data breaches, data corruption or lose operational functionality.
Dividend Strategy Risk – There is no guarantee that the issuers of the stocks held by the fund will declare dividends in the future or that, if dividends are declared, they will remain at their current levels or increase over time. The fund’s emphasis on dividend-paying stocks could cause the fund to underperform similar funds that invest without consideration of a company’s track record of paying dividends or ability to pay dividends in the future. Dividend-paying stocks may not participate in a broad market advance to the same degree as other stocks, and a sharp rise in interest rates or economic downturn could cause a company to unexpectedly reduce or eliminate its dividend. The Fund may hold securities for short periods of time related to the dividend payment periods and may experience loss during these periods.
Equity Securities Risk – The stock or other security of a company may not perform as well as expected, and may decrease in value, because of factors related to the company (such as poorer than expected earnings or certain management decisions) or to the industry in which the company is engaged (such as a reduction in the demand for products or services in a particular industry).
Foreign and Emerging Market Securities Risk – The Fund’s investments in securities of foreign issuers or issuers with significant exposure to foreign markets involve additional risk. Foreign countries in which the Fund may invest may have markets that are less liquid, less regulated and more volatile than U.S. markets. The value of the Fund’s investments may decline because of factors affecting the particular issuer as well as foreign markets and issuers generally, such as unfavorable or unsuccessful government actions, reduction of government or central bank support and political or financial instability. Lack of information may also affect the value of these securities. To the extent the Fund focuses its investments in a single country or only a few countries in a particular geographic region, economic, political, regulatory or other conditions affecting such country or region may have a greater impact on Fund performance relative to a more geographically diversified fund. The risks of foreign investments are heightened when investing in issuers in emerging market countries. Emerging market countries tend to have economic, political and legal systems that are less fully developed and are less stable than those of more developed countries. They are often particularly sensitive to market movements because their market prices tend to reflect speculative expectations. Low trading volumes may result in a lack of liquidity and in extreme price volatility.
12
| Alpine Dynamic Dividend Fund (Continued) | |
Foreign Currency Transactions Risk – Foreign securities are often denominated in foreign currencies. As a result, the value of the Fund’s shares is affected by changes in exchange rates. The Fund may enter into foreign currency transactions to try to manage this risk. The Fund’s ability to use foreign currency transactions successfully depends on a number of factors, including the foreign currency transactions being available at prices that are not too costly, the availability of liquid markets and the ability of the Adviser to accurately predict the direction of changes in currency exchange rates. The Fund may enter into forward foreign currency exchange contracts in order to protect against possible losses on foreign investments resulting from adverse changes in the relationship between the U.S. dollar and foreign currencies. Although this method attempts to protect the value of the Fund’s portfolio securities against a decline in the value of a currency, it does not eliminate fluctuations in the underlying prices of the securities and while such contracts tend to minimize the risk of loss due to a decline in the value of the hedged currency, they tend to limit any potential gain which might result should the value of such currency increase.
Growth Stock Risk – Growth stocks typically are very sensitive to market movements because their market prices tend to reflect future expectations. When it appears those expectations will not be met, the prices of growth stocks typically fall. Growth stocks as a group may be out of favor and underperform the overall equity market while the market concentrates on undervalued stocks.
Initial Public Offerings and Secondary Offerings Risk – The Fund may invest a portion of its assets in shares of IPOs or secondary offerings of an issuer. IPOs and secondary offerings may have a magnified impact on the performance of a fund with a small asset base. The impact of IPOs and secondary offerings on the Fund’s performance likely will decrease as the Fund’s asset size increases, which could reduce the Fund’s returns. IPOs and secondary offerings may not be consistently available to the Fund for investing. IPO and secondary offering shares frequently are volatile in price due to the absence of a prior public market, the small number of shares available for trading and limited information about the issuer. Therefore, the Fund may hold IPO and secondary offering shares for a very short period of time. This may increase the turnover of the Fund and may lead to increased expenses for the Fund, such as commissions and transaction costs. In addition, IPO and secondary offering shares can experience an immediate drop in value if the demand for the securities does not continue to support the offering price.
Leverage Risk – The Fund may use leverage to purchase securities. Increases and decreases in the value of the Fund’s portfolio will be magnified when the Fund uses leverage.
Liquidity Risk – Some assets held by the Fund may be impossible or difficult to sell, particularly during times of market turmoil. These illiquid assets may also be difficult to value. If the Fund is forced to sell an illiquid asset to meet redemption requests or other cash needs, the Fund may be forced to sell at a loss.
Management Risk – The Adviser’s judgment about the quality, relative yield or value of, or market trends affecting, a particular security or sector, or about interest rates generally, may be incorrect. The Adviser’s security selections and other investment decisions might produce losses or cause the Fund to underperform when compared to other funds with similar investment objectives and strategies.
Market Risk – The price of a security held by the Fund may fall due to changing market, economic or political conditions.
Portfolio Turnover Risk – High portfolio turnover necessarily results in greater transaction costs which may reduce Fund performance.
Qualified Dividend Tax Risk – Favorable U.S. federal tax treatment of Fund distributions may be adversely affected, changed or repealed by future changes in tax laws.
Small and Medium Capitalization Company Risk – Securities of small or medium capitalization companies are more likely to experience sharper swings in market values, less liquid markets, in which it may be more difficult for the Adviser to sell at times and at prices that the Adviser believes appropriate and generally are more volatile than those of larger companies.
13
| Alpine Dynamic Dividend Fund (Continued) | |
Swaps Risk – Swap agreements are derivative instruments that can be individually negotiated and structured to address exposure to a variety of different types of investments or market factors. Depending on their structure, swap agreements may increase or decrease the Fund’s exposure to long- or short-term interest rates, foreign currency values, mortgage securities, corporate borrowing rates, or other factors such as security prices or inflation rates. The Fund also may enter into swaptions, which are options to enter into a swap agreement. Since these transactions generally do not involve the delivery of securities or other underlying assets or principal, the risk of loss with respect to swap agreements and swaptions generally is limited to the net amount of payments that the Fund is contractually obligated to make. There is also a risk of a default by the other party to a swap agreement or swaption, in which case the Fund may not receive the net amount of payments that the Fund contractually is entitled to receive.
Undervalued Stock Risk – The Fund may pursue strategies that may include investing in securities, which, in the opinion of the Adviser, are undervalued. The identification of investment opportunities in undervalued securities is a difficult task and there is no assurance that such opportunities will be successfully recognized or acquired. While investments in undervalued securities offer opportunities for above-average capital appreciation, these investments involve a high degree of financial risk and can result in substantial losses.
Please refer to pages 3-5 for other important disclosures and definitions.
14
| Alpine Rising Dividend Fund(1) | |
| Comparative Annualized Returns as of 04/30/16 (Unaudited) | | |
| | | 6 Months(2) | | 1 Year | | 3 Years | | 5 Years | | Since Inception(3) |
| Alpine Rising Dividend Fund — Institutional Class | | | -0.68% | | | | -5.50% | | | | 7.61% | | | | 7.85% | | | | 11.53% | |
| Alpine Rising Dividend Fund — Class A (Without Load) | | | -0.87% | | | | -5.77% | | | | 7.32% | | | | N/A | | | | 10.92% | |
| Alpine Rising Dividend Fund — Class A (With Load) | | | -6.35% | | | | -10.94% | | | | 5.32% | | | | N/A | | | | 9.48% | |
| S&P 500® Index | | | 0.43% | | | | 1.21% | | | | 11.26% | | | | 11.02% | | | | 12.52% | |
| Dow Jones Industrial Average | | | 1.98% | | | | 2.25% | | | | 8.82% | | | | 9.52% | | | | 11.41% | |
| Lipper Equity Income Funds Average(4) | | | 1.52% | | | | -1.47% | | | | 7.42% | | | | 8.22% | | | | 11.90% | |
| Lipper Equity Income Funds Ranking(4) | | | N/A(5) | | | | 421/513 | | | | 217/415 | | | | 188/309 | | | | 171/267 | |
| Gross Expense Ratio (Institutional Class): 1.94%(6) | | | | | | | | | | | | | | | | | | | | |
| Net Expense Ratio (Institutional Class): 1.26%(6) | | | | | | | | | | | | | | | | | | | | |
| Gross Expense Ratio (Class A): 2.19%(6) | | | | | | | | | | | | | | | | | | | | |
| Net Expense Ratio (Class A): 1.51%(6) | | | | | | | | | | | | | | | | | | | | |
| | (1) | Effective September 9, 2015 the Fund’s name was changed from Alpine Accelerating Dividend Fund to Alpine Rising Dividend Fund. |
| | (2) | Not annualized. |
| | (3) | Institutional Class shares commenced on November 5, 2008 and Class A shares commenced on December 30, 2011. Returns for indices are since November 5, 2008. |
| | (4) | The since inception data represents the period beginning November 6, 2008 (Institutional Class only). |
| | (5) | FINRA does not recognize rankings for less than one year. |
| | (6) | As disclosed in the prospectus dated February 29, 2016 as amended April 4, 2016. |
Performance data quoted represents past performance and is not predictive of future results. Investment return and principal value of the Fund fluctuate, so that the shares, when redeemed, may be worth more or less than their original cost. Performance current to the most recent month end may be lower or higher than performance quoted and may be obtained by calling 1-888-785-5578. Performance data shown does not reflect the 1.00% redemption fee imposed on shares held for fewer than 60 days. If it did, total returns would be reduced. Returns for the Class A shares with sales charge reflect a maximum sales charge of 5.50%. Performance for the Class A shares without sales charges does not reflect this load.
S&P 500® Index is a total return, float-adjusted market capitalization-weighted index of 500 common stocks chosen for market size, liquidity, and industry group representation to represent U.S. equity performance. Total return indexes include reinvestments of all dividends. The Dow Jones Industrial Average is a price-weighted average of 30 blue chip stocks that are generally the leaders in their industry. The Lipper Equity Income Funds Average is an average of funds that seek relatively high current income and income growth through investing 60% or more of their respective portfolios in equities. Lipper rankings for the periods shown are based on fund total returns with dividends and distributions reinvested and do not reflect sales charges. The S&P 500® Index, the Dow Jones Industrial Average, and the Lipper Equity Income Funds Average are unmanaged and do not reflect direct fees associated with a mutual fund, such as investment adviser fees; however, the Lipper Equity Income Funds Average reflects fees charged by the underlying funds. The performance for the Alpine Rising Dividend Fund reflects the deduction of fees for these value-added services. Investors cannot directly invest in an index.
Expense Ratios reflect the ratios reported in the Fund’s most recent prospectus. The Alpine Rising Dividend Fund has a contractual expense waiver that continues through April 1, 2017. Where a Fund’s gross and net expense ratios are the same for the period reported, the contractual expense reimbursement level was not reached as of the end of that period. To the extent the Fund’s expenses were reduced by waivers, the Fund’s total returns were increased. In these cases, in the absence of the expense waivers, the Fund’s total returns would have been lower.
To the extent that the Fund’s historical performance resulted from gains derived from participation in Initial Public Offerings (“IPOs”) and/or Secondary Offerings, there is no guarantee that these results can be replicated in future periods or that the Fund will be able to participate to the same degree in IPO/Secondary Offerings in the future.
15
| Alpine Rising Dividend Fund (Continued) | |
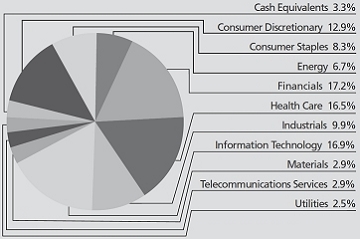
Portfolio Distributions* (Unaudited)
Top 10 Holdings* (Unaudited)
| 1. | | Apple, Inc. | 3.14 | % |
| 2. | | JPMorgan Chase & Co. | 2.36 | % |
| 3. | | CVS Health Corp. | 2.35 | % |
| 4. | | Discover Financial Services | 2.13 | % |
| 5. | | Pfizer, Inc. | 2.12 | % |
| 6. | | Zimmer Biomet Holdings, Inc. | 2.07 | % |
| 7. | | CBS Corp.-Class B | 2.06 | % |
| 8. | | Teva Pharmaceutical Industries, Ltd.-SP ADR | 2.00 | % |
| 9. | | Raytheon Co. | 1.83 | % |
| 10. | | Exxon Mobil Corp. | 1.78 | % |
| * | Portfolio Distributions percentages are based on total net investments. Top 10 Holdings do not include short-term investments and percentages are based on total net assets. Portfolio holdings sector distributions are as of 04/30/16 and are subject to change. Portfolio holdings are not recommendations to buy or sell any securities. |
| Value of a $1,000,000 Investment (Unaudited) |
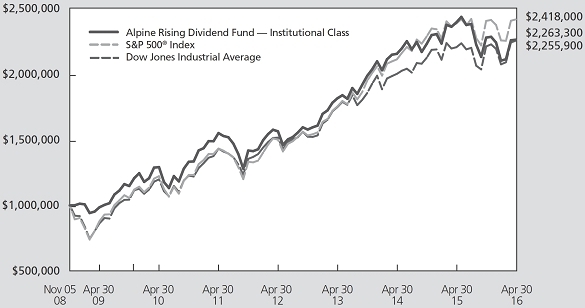 |
This chart represents a comparison of a hypothetical $1,000,000 investment in the Fund versus a similar investment in the Fund’s benchmark. The graph and the table do not reflect the deduction of taxes that a shareholder would pay on Fund distributions or the redemption of Fund shares. Investment performance reflects the waiver and recovery of certain fees, if applicable. Without the waiver and recovery of fees, the Fund’s total return would have differed.
Performance data quoted represents past performance and is not predictive of future results. Investment return and principal value of the Fund fluctuate, so that shares, when redeemed, may be worth more or less than their original cost.
16
| Alpine Rising Dividend Fund (Continued) | | |
Commentary
Dear Shareholders:
The Alpine Rising Dividend Fund generated a -0.68% total return in the first half of fiscal year 2016 compared to the S&P 500® Index total return of 0.43%. The Fund distributed $0.26 per share during the semi-annual period. All references in this letter to the Fund’s performance relate to the performance of the Fund’s Institutional Class.
PERFORMANCE DRIVERS
U.S. equity markets began the period wrestling with the possibility that the Federal Reserve would raise the Federal Funds Rate for the first time since the financial crisis as it attempted to transition from its zero interest rate policy to a more normalized one that would better reflect an economy no longer in need of an emergency-like monetary policy. The initial Federal Funds Rate hike of 25 basis points came in December and shortly thereafter, fears of slowing economic growth that could lead to a recession and commodity deflation negatively impacted stock prices. From the beginning of the period, November 1, 2015, through the middle of January 2016, the S&P 500® Index (S&P) fell 13% and bounced around that level through the middle of February. Price stability in the oil and commodity markets, improved economic data in employment and housing, and negative earnings revisions that became overly bearish set the stage for a rebound in stocks to levels near where they began the period. For the six month period, the S&P ended up eking out a gain of 0.43%.
With the Federal Reserve’s interest rate policy seemingly on hold after its initial hike in December amid its concerns about a sustainable U.S. recovery and global market volatility, U.S. 10-year Treasury bonds rallied, falling from a yield of 2.14% at the beginning of the period to 1.83% by period’s end.
On a sector basis, industrials, telecommunications services, and utilities had the largest positive impact on the absolute performance of the Fund. The information technology, financials, and health care sectors had the largest negative impact. On a relative basis, consumer discretionary, industrials, and telecommunication services generated the largest outperformance versus the S&P 500®, while financials, information technology, and energy were the worst relative performers.
PORTFOLIO ANALYSIS
The top five contributors to performance for the period included the two major telecommunication companies – Verizon Communications and AT&T. Both stocks carry a large dividend yield with generally stable top-line growth – two attributes that were sought after by investors in a volatile first quarter. CBS Corp. also contributed positively to the Fund as advertising revenues performed better than expected and its programming strength continues. CBS Corp. also named its long-time CEO, Les Moonves, to the additional role of Chairman, settling a long speculated transition from founder Sumner Redstone. Shares of semiconductor equipment manufacturer Applied Materials were a positive contributor to the Fund’s performance for the period as the market’s bearish outlook for equipment orders proved overly pessimistic with orders from Chinese customers and demand for the company’s newest equipment for use in manufacturing organic light-emitting diode (OLED) screens coming in better than expected. Diversified healthcare company Johnson & Johnson was also a positive contributor the Fund for the period as a good earnings report and full year outlook for the company drove the shares.
The top five detractors from performance included Apple Inc. which reported its first down quarter in many years and provided a disappointing outlook for sales and earnings during a product transition period. Shares of disk drive maker Western Digital also hurt the Fund for the quarter. Shares suffered due to a weak PC market, a withdrawn investment of $3.8 billion from Unisplendour of China, and the perception that the price it is paying in the acquisition of rival SanDisk is too high. We thought Western Digital’s shares were attractive at those levels as the planned acquisition could add considerable value to shareholders and continued to hold the shares through the period’s end. Since the end of the period, the shares have recovered somewhat and we took that opportunity to sell the position. Prudential Financial results suffered from a continuously low interest rate environment. We grew increasingly concerned that a turnaround in its results was farther off than we had hoped and the shares were subsequently sold in their entirety. Biotech company, Gilead Sciences reported results that were slightly disappointing as pricing competition negatively impacted sales of its largest selling drug franchise that treats the hepatitis C virus (HCV). We believe the shares overreacted to the downside and we took the opportunity to add to our position in the Fund. Diversified chemical manufacturer Eastman Chemical reported disappointing earnings as a
17
| Alpine Rising Dividend Fund (Continued) | | |
result of weaker global demand. We did not expect a rebound in demand for its products to materialize for a number of quarters so, in turn, sold our position in the stock.
SUMMARY & OUTLOOK
Although economic data suggests the U.S. recovery is on track to grow gross domestic product and increase employment, a host of global economic and geopolitical factors could negatively impact share prices and continue to increase market volatility going forward. Our guess is that interest rate policy will be benign, with an elongated rate cycle consisting of incremental moves over a long period of time as recent Federal Reserve commentary suggests it is being deliberate in this tightening cycle. Low and volatile oil prices should continue to put some pressure on already depressed energy related companies but will benefit consumers in increased disposable income due to lower gasoline expenditures. U.S.-based multinational corporations may also continue to struggle with negative foreign exchange rate translation due the
strong US dollar versus both developed and emerging market currencies. Market valuation measures that have returned to near cycle highs in spite of lackluster earnings growth is also a reason for concern. We have constructed our portfolio with a lower risk mindset due to global economic growth concerns, especially in China, emerging markets, and the potential spill-over to Asia/Pacific nations, as well as increasing geopolitical incidents, and an uncertain U.S. political election cycle.
While we continue to be prudently cautious, we believe opportunities will continue to present themselves to purchase stocks with a history and consistency of raising their dividends, as we believe these companies have the potential to outperform through a market cycle. We aim to make these stocks with continuous dividend increases the foundation of the Fund.
Sincerely,
Andrew Kohl
Mark Spellman
Portfolio Managers
18
| Alpine Rising Dividend Fund (Continued) | | |
This letter represents the opinions of the Fund’s management and is subject to change, is not guaranteed and should not be considered a recommendation to buy or sell any security. The information provided is not intended to be, and is not, a forecast of future events, a guarantee of future results, or investment advice. Views expressed may vary from those of the firm as a whole.
Past performance is no guarantee of future results.
Mutual fund investing involves risk. Principal loss is possible. The Fund is subject to risks, including the following:
Currency Risk – The value of investments in securities denominated in foreign currencies increases or decreases as the rates of exchange between those currencies and the U.S. dollar change. Currency conversion costs and currency fluctuations could erase investment gains or add to investment losses. Currency exchange rates can be volatile, and are affected by factors such as general economic conditions, the actions of the U.S. and foreign governments or central banks, the imposition of currency controls and speculation.
Cybersecurity Risk – Cybersecurity incidents may allow an unauthorized party to gain access to Fund assets, customer data (including private shareholder information), or proprietary information, or cause the Fund, the Adviser and/or its service providers (including, but not limited to, Fund accountants, custodians, sub-custodians, transfer agents and financial intermediaries) to suffer data breaches, data corruption or lose operational functionality.
Dividend Strategy Risk – There is no guarantee that the issuers of the stocks held by the fund will declare dividends in the future or that, if dividends are declared, they will remain at their current levels or increase over time. The fund’s emphasis on dividend-paying stocks could cause the fund to underperform similar funds that invest without consideration of a company’s track record of paying dividends or ability to pay dividends in the future. Dividend-paying stocks may not participate in a broad market advance to the same degree as other stocks, and a sharp rise in interest rates or economic downturn could cause a company to unexpectedly reduce or eliminate its dividend. The Fund may hold securities for short periods of time related to the dividend payment periods and may experience loss during these periods.
Equity Securities Risk – The stock or other security of a company may not perform as well as expected, and may decrease in value, because of factors related to the company (such as poorer than expected earnings or certain management decisions) or to the industry in which the company is engaged (such as a reduction in the demand for products or services in a particular industry).
Foreign Currency Transactions Risk – Foreign securities are often denominated in foreign currencies. As a result, the value of the Fund’s shares is affected by changes in exchange rates. The Fund may enter into foreign currency transactions to try to manage this risk. The Fund’s ability to use foreign currency transactions successfully depends on a number of factors, including the foreign currency transactions being available at prices that are not too costly, the availability of liquid markets and the ability of the Adviser to accurately predict the direction of changes in currency exchange rates.
Foreign Securities Risk – The Fund’s investments in securities of foreign issuers or issuers with significant exposure to foreign markets involve additional risk. Foreign countries in which the Fund may invest may have markets that are less liquid, less regulated and more volatile than U.S. markets. The value of the Fund’s investments may decline because of factors affecting the particular issuer as well as foreign markets and issuers generally, such as unfavorable or unsuccessful government actions, reduction of government or central bank support and political or financial instability. Lack of information may also affect the value of these securities. To the extent the Fund focuses its investments in a single country or only a few countries in a particular geographic region, economic, political, regulatory or other conditions affecting such country or region may have a greater impact on Fund performance relative to a more geographically diversified fund. The risks of foreign investments are heightened when investing in issuers of emerging market countries.
Growth Stock Risk – Growth stocks typically are very sensitive to market movements because their market prices tend to reflect future expectations. When it appears those expectations will not be met, the prices of growth stocks typically fall. Growth stocks as a group may be out of favor and underperform the overall equity market while the market concentrates on undervalued stocks. Although the Fund will not concentrate its investments in any one industry or industry group, it may, like many growth funds, weight its investments toward certain industries, thus increasing its exposure to factors adversely affecting issuers within those industries.
Initial Public Offerings and Secondary Offerings Risk – The Fund may invest a portion of its assets in shares of IPOs or secondary offerings of an issuer. IPOs and secondary offerings may have a magnified impact on the performance of a
19
| Alpine Rising Dividend Fund (Continued) | | |
fund with a small asset base. The impact of IPOs and secondary offerings on the Fund’s performance likely will decrease as the Fund’s asset size increases, which could reduce the Fund’s returns. IPOs and secondary offerings may not be consistently available to the Fund for investing. IPO and secondary offering shares frequently are volatile in price due to the absence of a prior public market, the small number of shares available for trading and limited information about the issuer. Therefore, the Fund may hold IPO and secondary offering shares for a very short period of time. This may increase the turnover of the Fund and may lead to increased expenses for the Fund, such as commissions and transaction costs. In addition, IPO and secondary offering shares can experience an immediate drop in value if the demand for the securities does not continue to support the offering price.
Liquidity Risk – Some assets held by the Fund may be impossible or difficult to sell, particularly during times of market turmoil. These illiquid assets may also be difficult to value. If the Fund is forced to sell an illiquid asset to meet redemption requests or other cash needs, the Fund may be forced to sell at a loss.
Management Risk – The Adviser’s judgment about the quality, relative yield or value of, or market trends affecting, a particular security or sector, or about interest rates generally, may be incorrect. The Adviser’s security selections and other investment decisions might produce losses or cause the Fund to underperform when compared to other funds with similar investment objectives and strategies.
Market Risk – The price of a security held by the Fund may fall due to changing market, economic or political conditions.
Micro Capitalization Company Risk – Stock prices of micro capitalization companies are significantly more volatile, and more vulnerable to adverse business and economic developments than those of larger companies. Micro capitalization companies often have narrower markets for their goods and/or services and more limited managerial and financial resources than larger, more established companies, including small or medium capitalization companies.
20
| Alpine Financial Services Fund | |
| Comparative Annualized Returns as of 04/30/16 (Unaudited) | | |
| | | 6 Months(1) | | 1 Year | | 3 Years | | 5 Years | | 10 Years | | Since Inception(2) |
| Alpine Financial Services Fund — Institutional Class | | | -2.47% | | | | -8.39% | | | | 7.12% | | | | 6.45% | | | | 5.66% | | | | 6.79% | |
| Alpine Financial Services Fund — Class A (Without Load) | | | -2.60% | | | | -8.63% | | | | 6.84% | | | | N/A | | | | N/A | | | | 15.07% | |
| Alpine Financial Services Fund — Class A (With Load) | | | -7.96% | | | | -13.65% | | | | 4.83% | | | | N/A | | | | N/A | | | | 13.58% | |
| Russell 2000® Financial Services Index | | | 0.30% | | | | 2.73% | | | | 8.91% | | | | 10.30% | | | | 3.59% | | | | 4.56% | |
| KBW Nasdaq Bank Index | | | -3.75% | | | | -4.16% | | | | 8.90% | | | | 8.23% | | | | -2.48% | | | | -1.02% | |
| NASDAQ Financial 100 Total Return Index | | | -0.62% | | | | 3.48% | | | | 11.20% | | | | 10.27% | | | | 3.12% | | | | 3.66% | |
| Lipper Financial Services Funds Average(3) | | | -2.23% | | | | -1.81% | | | | 8.45% | | | | 8.24% | | | | 0.32% | | | | 1.34% | |
| Lipper Financial Services Funds Ranking(3) | | | N/A(4) | | | | 75/87 | | | | 46/76 | | | | 52/71 | | | | 3/53 | | | | 2/50 | |
| Gross Expense Ratio (Institutional Class): 2.07%(5) | | | | | | | | | | | | | | | | | | | | | | | | |
| Net Expense Ratio (Institutional Class): 1.50%(5) | | | | | | | | | | | | | | | | | | | | | | | | |
| Gross Expense Ratio (Class A): 2.32%(5) | | | | | | | | | | | | | | | | | | | | | | | | |
| Net Expense Ratio (Class A): 1.75%(5) | | | | | | | | | | | | | | | | | | | | | | | | |
| | (1) | Not annualized. |
| | (2) | Institutional Class shares commenced on November 1, 2005 and Class A shares commenced on December 30, 2011. Returns for indices are since November 1, 2005. |
| | (3) | The since inception data represents the period beginning November 1, 2005 (Institutional Class only). |
| | (4) | FINRA does not recognize rankings for less than one year. |
| | (5) | As disclosed in the prospectus dated February 29, 2016 as amended April 4, 2016. |
Performance data quoted represents past performance and is not predictive of future results. Investment return and principal value of the Fund fluctuate, so that the shares, when redeemed, may be worth more or less than their original cost. Performance current to the most recent month end may be lower or higher than performance quoted and may be obtained by calling 1-888-785-5578. Performance data shown does not reflect the 1.00% redemption fee imposed on shares held for fewer than 60 days. If it did, total returns would be reduced. Returns for the Class A shares with sales charge reflect a maximum sales charge of 5.50%. Performance for the Class A shares without sales charges does not reflect this load.
Russell 2000® Financial Services Index serves as a benchmark for all financial services sector small cap stocks in the U.S., specifically those with the Russell 2000® Index. KBW Nasdaq Bank Index is designed to track the performance of the leading banks and thrifts that are publicly-traded in the U.S. The Index includes 24 banking stocks representing the large U.S. national money centers, regional banks and thrift institutions. NASDAQ Financial 100 Total Return Index is a total return index that includes 100 of the largest domestic and international financial securities listed on The NASDAQ Stock Market based on market capitalization. They include companies classified according to the Industry Classification Benchmark as Financials, which are included within the NASDAQ Bank, NASDAQ Insurance, and NASDAQ Other Finance Indexes. S&P 500® Index is a total return, float-adjusted market capitalization-weighted index of 500 common stocks chosen for market size, liquidity, and industry group representation to represent U.S. equity performance. Total return indexes include reinvestments of all dividends. The Lipper Financial Services Funds Average is an average of funds whose primary objective is to invest primarily in equity securities of companies engaged in providing financial services. Lipper rankings for the periods shown are based on fund total returns with dividends and distributions reinvested and do not reflect sales charges. The Russell 2000® Financial Services Index, KBW Nasdaq Bank Index, the NASDAQ Financial 100 Total Return Index, the S&P 500® Index and the Lipper Financial Services Funds Average are unmanaged and do not reflect the deduction of direct fees associated with a mutual fund, such as investment adviser fees; however, the Lipper Financial Services Fund Average reflects fees charged by the underlying funds. The performance for the Alpine Financial Services Fund reflects the deduction of fees for these value-added services. Investors cannot directly invest in an index.
Expense Ratios reflect the ratios reported in the Fund’s most recent prospectus. The Alpine Financial Services Fund has a contractual expense waiver that continues through April 1, 2017. Where a Fund’s gross and net expense ratios are the same for the period reported, the contractual expense reimbursement level was not reached as of the end of that period. To the extent the Fund’s expenses were reduced by waivers, the Fund’s total returns were increased. In these cases, in the absence of the expense waivers, the Fund’s total returns would have been lower.
The Fund’s past performance benefitted significantly from Initial Public Offerings (“IPOs”) and Secondary Offerings of certain issuers, and there is no assurance that the Fund can replicate this performance in the future or that the Fund will be able to participate to the same degree in IPO/Secondary Offerings in the future.
21
| Alpine Financial Services Fund (Continued) | |
Portfolio Distributions* (Unaudited)
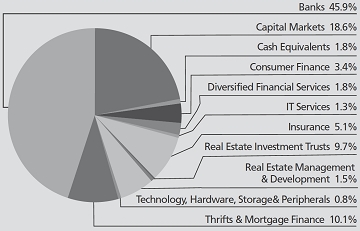
Top 10 Holdings* (Unaudited)
| 1. | | FCB Financial Holdings, Inc.-Class A | 2.08 | % |
| 2. | | Citigroup, Inc. | 1.93 | % |
| 3. | | Citizens Financial Group, Inc. | 1.91 | % |
| 4. | | Discover Financial Services | 1.85 | % |
| 5. | | Ally Financial, Inc. | 1.59 | % |
| 6. | | Kennedy-Wilson Holdings, Inc. | 1.55 | % |
| 7. | | Affiliated Managers Group, Inc. | 1.52 | % |
| 8. | | JPMorgan Chase & Co. | 1.51 | % |
| 9. | | NMI Holdings, Inc.-Class A | 1.50 | % |
| 10. | | The Blackstone Group LP | 1.47 | % |
| * | Portfolio Distributions percentages are based on total net investments. Top 10 Holdings do not include short-term investments and percentages are based on total net assets. Portfolio holdings sector distributions are as of 04/30/16 and are subject to change. Portfolio holdings are not recommendations to buy or sell any securities. |
| Value of a $1,000,000 Investment (Unaudited) |
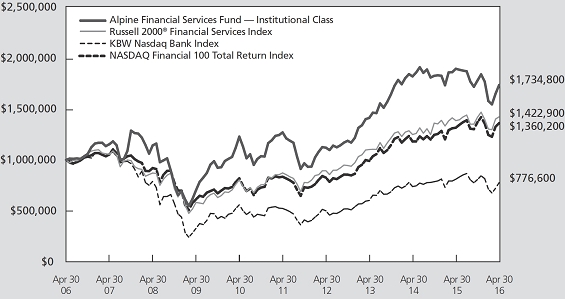 |
This chart represents a comparison of a hypothetical $1,000,000 investment in the Fund versus a similar investment in the Fund’s benchmarks. The graph and the table do not reflect the deduction of taxes that a shareholder would pay on Fund distributions or the redemption of Fund shares. Investment performance reflects the waiver and recovery of certain fees, if applicable. Without the waiver and recovery of fees, the Fund’s total return would have differed.
Performance data quoted represents past performance and is not predictive of future results. Investment return and principal value of the Fund fluctuate, so that shares, when redeemed, may be worth more or less than their original cost.
22
| Alpine Financial Services Fund (Continued) | | |
Commentary
Dear Shareholders:
The Alpine Financial Services Fund generated a -2.47% total return for the six months ended April 30, 2016. This compares to the Fund’s benchmarks that showed total returns of 0.30% for the Russell 2000® Financial Services Index, -3.75% for the KBW Nasdaq Bank Index, and -0.62% for the NASDAQ Financial 100 Total Return Index during the same period. All references in this letter to the Fund’s performance relate to the performance for the Fund’s Institutional Class.
SEMI-ANNUAL YEAR IN REVIEW
The six months ended April 30, 2016 were a challenging time for the financials sector, with most financial indices trailing the broader market. For example, the S&P 500® Financials Index fell 2.13% as compared to a slightly positive total return for the S&P 500® Index. Banks in particular were hard hit, with the S&P Banks Select Industry Index falling 5.51%. REITs were the clear exception, enjoying strong support from the “lower for longer” interest rate environment that permeated much of the developed world during the semi-annual period. Ironically, this period of financials underperformance occurred concurrent with the Federal Reserve finally raising interest rates for the first time since the financial crisis. Many investors had expected this to be a catalyst for the financials to begin outperforming. Instead, international developments, such as slowing growth in China, and plunging crude oil prices led the market to reduce consensus expectations for additional interest rate hikes, pushing interest rate normalizing farther out into the future. Indeed, US 10-year Treasury yields fell from 2.14% on October 30, 2015 to 1.83% on April 30, 2016. This shift in interest rate expectations created negative sentiment for business models that are levered to higher rates, including banks and insurance companies. Additionally, crude oil prices fell below $30/barrel in January and February, forcing banks that lend to the oil patch to take large provisions for loan losses in the fourth quarter of 2015 and the first quarter of 2016. Fortunately, crude prices have recently rallied back over $40/barrel, a level that could be associated with much less stress in energy loan books.
PORTFOLIO ANALYSIS
The top five stocks contributing to the Fund’s performance during the six months ended April 30, 2016 were Banc of California, Resource America, Health Insurance Innovations, East West Bancorp, and Great Western Bancorp.
| • | Banc of California has been growing strongly while undergoing a transformation from its roots as a thrift bank offering primarily single family mortgages to a full service community bank offering a complete range of banking products to consumers and businesses. The company has enjoyed several quarters of strong earnings as a result of its robust loan growth and improved profitability. Additionally, the bank was included in the S&P 600® Index in March, triggering institutional demand for the shares. |
| | |
| • | The Fund opportunistically purchased shares of Resource America, an alternative asset manager, near the end of December after a more than 50% sell-off from the end of October. The stock fell out of favor as sales of its investment products were expected to be impacted by the recently released fiduciary standards rule promulgated by the Department of Labor. Shortly after the Fund bought the stock, famed hedge fund investor Leon Cooperman disclosed a nearly 13% stake in the company via a 13D filing with the U.S. Securities and Exchange Commission. Subsequent to that, the company announced it would review its strategic alternatives, a process that culminated in a sale at a favorable price. |
| | |
| • | Shares of Health Insurance Innovations, a distributor of health insurance plans mainly via the Internet, enjoyed a modest recovery in November and December after suffering a significant sell-off earlier in 2015 on the back of disappointing quarterly results. |
| | |
| • | East West Bancorp is one of the largest commercial banks headquartered in California. The Fund purchased shares of the bank in the beginning of March 2016 after a more than 20% sell-off in January and February 2016. Fears over China’s slowing growth in combination with disappointing 2016 earnings guidance related mostly to higher expenses associated with investments in IT and regulatory compliance triggered a sell-off in the stock. We viewed these issues as transitory and used the sell-off to accumulate shares of this well-run institution that caters to the Asian-American community. |
| | |
| • | Great Western Bancorp, is a Sioux Falls, SD based commercial bank that was previously a wholly-owned subsidiary of National Australia Bank (NAB). NAB listed a portion of Great Western in a 2014 IPO and completely exited the stock in July 2015. With the overhang from NAB’s exit removed, the P/E ratio of the stock rose at the same time earnings estimates have been increasing, triggering a rally in the shares. |
23
| Alpine Financial Services Fund (Continued) | | |
The five largest detractors from the Fund’s performance during the six months ended April 30, 2016 were Mitsubishi UFJ Financial Group, LPL Financial Holdings, Mizuho Financial Group, NorthStar Realty Finance, and Sumitomo Mitsui Financial Group.
| • | Three of the five largest detractors from the Fund’s performance were Japanese mega-banks: Mitsubishi UFJ Financial Group, Mizuho Financial Group, and Sumitomo Mitsui Financial Group. All three banks suffered a sharp sell-off from the middle of November 2015 to the middle of February 2016. The catalyst for the sell-off was the Bank of Japan’s (BOJ) surprise decision to implement a negative interest rate policy framework in an effort to jumpstart the economy and raise inflation expectations. The market had been expecting the BOJ to embark on more quantitative easing as opposed to taking interest rates into negative territory. The earnings outlook for Japanese banks took a hit as the impact of the BOJs actions is likely to be negative. As a result of this negative sentiment, the Fund hedged a portion of its Japanese yen. |
| | |
| • | LPL Financial Holdings, an independent broker-dealer for retail investors, suffered a sell-off triggered by its high financial leverage, above average exposure to the Department of Labor’s fiduciary standards rule, and leverage to higher interest rates. In addition, a disappointing fourth quarter report in February 2016 reinforced the negative sentiment around the stock. |
| | |
| • | Shares of NorthStar Realty Finance, a diversified REIT, came under significant selling pressure during the semi-annual period as its above average debt-to-capital and external management structure fell out of favor with investors. Additionally, its hedge-fund heavy shareholder base exacerbated the sell-off as redemption requests from certain hedge fund investors forced the company to sell its stock. |
SUMMARY & OUTLOOK
While the Federal Reserve has struck a more dovish tone of late and international developments continue to create asymmetric downside risk, we still think the Fed pushes forward with additional interest rate hikes this year and next if the U.S. economy continues to show resilience and inflation gradually rises back near the Fed’s 2% target. While global macro-economic uncertainty has likely slowed the trajectory of interest rate normalization, we don’t ascribe a high likelihood to negative or zero interest rates in the U.S. despite such conditions in Europe and Japan. As such, the Fund continues to invest in financial equities that benefit from higher rates, especially those in which upside earnings from higher rates is not currently reflected in the valuation of the stock. We note however, that there is no guarantee that a rise in interest rates will occur. In the U.S., we strongly believe that small and mid-cap bank merger & acquisition activity will continue in 2016 as the pressure from years of low interest rates and increasing regulatory compliance costs weigh on banks’ return on equity. The Fund owns a variety of banks that we consider either attractive acquirers or potential take-outs. In conclusion, while volatility and macro-economic uncertainty may be with us during 2016, we think a bottom-up approach to stock picking should allow the Fund to successfully navigate through these challenging markets. We would like to take this opportunity to thank you for your ongoing support.
Sincerely,
Andrew Kohl
Portfolio Manager
This letter represents the opinions of the Fund’s management and is subject to change, is not guaranteed and should not be considered a recommendation to buy or sell any security. The information provided is not intended to be, and is not, a forecast of future events, a guarantee of future results, or investment advice. Views expressed may vary from those of the firm as a whole.
Past performance is no guarantee of future results.
Mutual fund investing involves risk. Principal loss is possible. The Fund is subject to risks, including the following:
Concentration Risk – The Fund’s strategy of concentrating in companies in a specific industry means that its performance will be closely tied to the performance of a particular market segment. The Fund’s concentration in these companies may present more risks than if it were broadly diversified over numerous industries and sectors of the economy. A downturn in these companies would have a larger impact on the Fund than on a mutual fund that does not concentrate in such companies. At times, the performance of these companies will lag the performance of other industries or the broader market as a whole.
24
| Alpine Financial Services Fund (Continued) | | |
Currency Risk – The value of investments in securities denominated in foreign currencies increases or decreases as the rates of exchange between those currencies and the U.S. dollar change. Currency conversion costs and currency fluctuations could erase investment gains or add to investment losses. Currency exchange rates can be volatile, and are affected by factors such as general economic conditions, the actions of the U.S. and foreign governments or central banks, the imposition of currency controls and speculation.
Cybersecurity Risk – Cybersecurity incidents may allow an unauthorized party to gain access to Fund assets, customer data (including private shareholder information), or proprietary information, or cause the Fund, the Adviser and/or its service providers (including, but not limited to, Fund accountants, custodians, sub-custodians, transfer agents and financial intermediaries) to suffer data breaches, data corruption or lose operational functionality.
Equity Securities Risk – The stock or other security of a company may not perform as well as expected, and may decrease in value, because of factors related to the company (such as poorer than expected earnings or certain management decisions) or to the industry in which the company is engaged (such as a reduction in the demand for products or services in a particular industry).
Financial Services Industry Concentration Risk – The Fund is subject to the risk of concentrating investments in financial services companies, which makes it more susceptible to factors adversely affecting issuers within that industry than would a fund investing in a more diversified portfolio of securities. Economic downturns, credit losses and severe price competition can negatively affect this industry. The profitability of financial services companies is dependent on the availability and cost of capital and can fluctuate significantly when interest rates change. Financial services companies are also subject to extensive government regulation. The impact of recent legislation on any individual company or on the industry as a whole cannot be predicted.
Foreign Currency Transactions Risk – Foreign securities are often denominated in foreign currencies. As a result, the value of the Fund’s shares is affected by changes in exchange rates. The Fund may enter into foreign currency transactions to try to manage this risk. The Fund’s ability to use foreign currency transactions successfully depends on a number of factors, including the foreign currency transactions being available at prices that are not too costly, the availability of liquid markets and the ability of the Adviser to accurately predict the direction of changes in currency exchange rates.
Foreign Securities Risk – The Fund’s investments in securities of foreign issuers or issuers with significant exposure to foreign markets involve additional risk. Foreign countries in which the Fund may invest may have markets that are less liquid, less regulated and more volatile than U.S. markets. The value of the Fund’s investments may decline because of factors affecting the particular issuer as well as foreign markets and issuers generally, such as unfavorable or unsuccessful government actions, reduction of government or central bank support and political or financial instability. Lack of information may also affect the value of these securities. To the extent the Fund focuses its investments in a single country or only a few countries in a particular geographic region, economic, political, regulatory or other conditions affecting such country or region may have a greater impact on Fund performance relative to a more geographically diversified fund. The risks of foreign investments are heightened when investing in issuers of emerging market countries.
Growth Stock Risk – Growth stocks typically are very sensitive to market movements because their market prices tend to reflect future expectations. When it appears those expectations will not be met, the prices of growth stocks typically fall. Growth stocks as a group may be out of favor and underperform the overall equity market while the market concentrates on undervalued stocks.
Initial Public Offerings and Secondary Offerings Risk – The Fund may invest a portion of its assets in shares of IPOs or secondary offerings of an issuer. IPOs and secondary offerings may have a magnified impact on the performance of a fund with a small asset base. The impact of IPOs and secondary offerings on the Fund’s performance likely will decrease as the Fund’s asset size increases, which could reduce the Fund’s returns. IPOs and secondary offerings may not be consistently available to the Fund for investing. IPO and secondary offering shares frequently are volatile in price due to the absence of a prior public market, the small number of shares available for trading and limited information about the issuer. Therefore, the Fund may hold IPO and secondary offering shares for a very short period of time. This may increase the turnover of the Fund and may lead to increased expenses for the Fund, such as commissions and transaction costs. In addition, IPO and secondary offering shares can experience an immediate drop in value if the demand for the securities does not continue to support the offering price.
25
| Alpine Financial Services Fund (Continued) | | |
Leverage Risk – The Fund may use leverage to purchase securities. Increases and decreases in the value of the Fund’s portfolio will be magnified when the Fund uses leverage.
Liquidity Risk – Some assets held by the Fund may be impossible or difficult to sell, particularly during times of market turmoil. These illiquid assets may also be difficult to value. If the Fund is forced to sell an illiquid asset to meet redemption requests or other cash needs, the Fund may be forced to sell at a loss.
Management Risk – The Adviser’s judgment about the quality, relative yield or value of, or market trends affecting, a particular security or sector, or about interest rates generally, may be incorrect. The Adviser’s security selections and other investment decisions might produce losses or cause the Fund to underperform when compared to other funds with similar investment objectives and strategies.
Market Risk – The price of a security held by the Fund may fall due to changing market, economic or political conditions.
Micro Capitalization Company Risk – Stock prices of micro capitalization companies are significantly more volatile, and more vulnerable to adverse business and economic developments than those of larger companies. Micro capitalization companies often have narrower markets for their goods and/or services and more limited managerial and financial resources than larger, more established companies, including small or medium capitalization companies.
Portfolio Turnover Risk – High portfolio turnover necessarily results in greater transaction costs which may reduce Fund performance.
Small and Medium Capitalization Company Risk – Securities of small or medium capitalization companies are more likely to experience sharper swings in market values, less liquid markets, in which it may be more difficult for the Adviser to sell at times and at prices that the Adviser believes appropriate and generally are more volatile than those of larger companies.
Undervalued Stock Risk – The Fund may pursue strategies that may include investing in securities, which, in the opinion of the Adviser, are undervalued. The identification of investment opportunities in undervalued securities is a difficult task and there is no assurance that such opportunities will be successfully recognized or acquired. While investments in undervalued securities offer opportunities for above-average capital appreciation, these investments involve a high degree of financial risk and can result in substantial losses.
Please refer to pages 3-5 for other important disclosures and definitions.
26
| Alpine Small Cap Fund(1) | |
| Comparative Annualized Returns as of 04/30/16 (Unaudited) | |
| | | | | | | | | | | |
| | | 6 Months(1) | | 1 Year | | 3 Years | | 5 Years | | Since Inception(2) |
| Alpine Small Cap Fund — Institutional Class | | | -1.97% | | | | -3.28% | | | | 4.50% | | | | 3.89% | | | | 4.39% | |
| Alpine Small Cap Fund — Class A (Without Load) | | | -2.12% | | | | -3.58% | | | | 4.23% | | | | N/A | | | | 8.16% | |
| Alpine Small Cap Fund — Class A (With Load) | | | -7.51% | | | | -8.86% | | | | 2.29% | | | | N/A | | | | 6.76% | |
| Russell 2000® Index | | | -1.90% | | | | -5.94% | | | | 7.53% | | | | 6.98% | | | | 6.32% | |
| Russell 3000® Index | | | 0.06% | | | | -0.18% | | | | 10.77% | | | | 10.50% | | | | 7.38% | |
| Russell 2000® Growth Index | | | -4.96% | | | | -8.27% | | | | 8.50% | | | | 7.15% | | | | 7.40% | |
| S&P 500® Index | | | 0.43% | | | | 1.21% | | | | 11.26% | | | | 11.02% | | | | 7.37% | |
| Lipper Small Cap Growth Funds Average(3) | | | -4.94% | | | | -8.62% | | | | 7.21% | | | | 5.92% | | | | 6.99% | |
| Lipper Small Cap Growth Funds Ranking(3) | | | N/A(4) | | | | 89/546 | | | | 420/488 | | | | 363/434 | | | | 298/313 | |
| Gross Expense Ratio (Institutional Class): 1.90%(5) | | | | | | | | | | | | | | | | | | | | |
| Net Expense Ratio (Institutional Class): 1.25%(5) | | | | | | | | | | | | | | | | | | | | |
| Gross Expense Ratio (Class A): 2.15%(5) | | | | | | | | | | | | | | | | | | | | |
| Net Expense Ratio (Class A): 1.50%(5) | | | | | | | | | | | | | | | | | | | | |
| | (1) | Not annualized. |
| | (2) | Institutional Class shares commenced on July 11, 2006 and Class A shares commenced on December 30, 2011. Returns for indices are since July 11, 2006. |
| | (3) | The since inception data represents the period beginning July 13, 2006 (Institutional Class only). |
| | (4) | FINRA does not recognize rankings for less than one year. |
| | (5) | As disclosed in the prospectus dated February 29, 2016 as amended April 4, 2016. |
Performance data quoted represents past performance and is not predictive of future results. Investment return and principal value of the Fund fluctuate, so that the shares, when redeemed, may be worth more or less than their original cost. Performance current to the most recent month end may be lower or higher than performance quoted and may be obtained by calling 1-888-785-5578. Performance data shown does not reflect the 1.00% redemption fee imposed on shares held for fewer than 60 days. If it did, total returns would be reduced. Returns for the Class A shares with sales charge reflect a maximum sales charge of 5.50%. Performance for the Class A shares without sales charges does not reflect this load.
Russell 2000® Index measures the performance of the small-cap segment of the U.S. equity universe and includes approximately 2000 of the smallest securities based on a combination of their market cap and current index membership. Russell 3000® Index measures the performance of the largest 3000 U.S. companies representing approximately 98% of the investable U.S. equity market. Russell 2000® Growth Index measures the performance of the small-cap growth segment of the U.S. equity universe. It includes those Russell 2000 Index companies with higher price-to-value ratios and higher forecasted growth values. Source: FTSE Russell Indexes. “FTSE®”, “Russell®”, “MTS®”, “FTSE TMX®” and “FTSE Russell” and other service marks and trademarks related to the FTSE or Russell indexes are trademarks of the London Stock Exchange Group companies and are used by FTSE, MTS, FTSE TMX and Russell under license. S&P 500® Index is a total return, float-adjusted market capitalization-weighted index of 500 common stocks chosen for market size, liquidity, and industry group representation to represent U.S. equity performance. The Russell 2000® Index, the Russell 3000® Index, the Russell 2000® Growth Index, the S&P 500® Index and the Lipper Small-Cap Growth Funds Average are unmanaged and do not reflect the deduction of direct fees associated with a mutual fund, such as investment adviser fees; however, the Lipper Small-Cap Growth Funds Average reflects fees charged by the underlying funds. The performance for the Alpine Small Cap Fund reflects the deduction of fees for these value-added services. Investors cannot directly invest in an index. Total return indexes include reinvestments of all dividends.
Expense Ratios reflect the ratios reported in the Fund’s most recent prospectus. The Alpine Small Cap Fund has a contractual expense waiver that continues through April 1, 2017. Where a Fund’s gross and net expense ratios are the same for the period, the contractual expense reimbursement level was not reached as of the end of that period. To the extent the Fund’s expenses were reduced by waivers, the Fund’s total returns were increased. In these cases, in the absence of the expense waivers, the Fund’s total returns would have been lower.
The Fund’s past performance benefitted significantly from Initial Public Offerings (“IPOs”) of certain issuers, and there is no assurance that the Fund can replicate this performance in the future. To the extent that the Fund’s historical performance resulted from gains derived from participation in Secondary Offerings, there is no guarantee that these results can be replicated or that the Fund will be able to participate to the same degree in IPO/Secondary Offerings in the future.
27
| Alpine Small Cap Fund (Continued) |  |
Portfolio Distributions* (Unaudited)
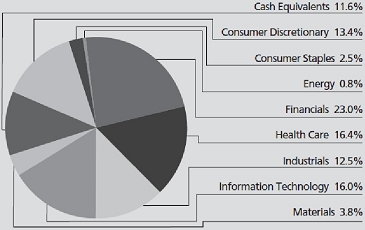
Top 10 Holdings* (Unaudited)
| 1. | | Dycom Industries, Inc. | 4.35 | % |
| 2. | | Fair Isaac Corp. | 4.21 | % |
| 3. | | Nexstar Broadcasting Group, Inc.-Class A | 4.18 | % |
| 4. | | Cardtronics, Inc. | 4.15 | % |
| 5. | | Patrick Industries, Inc. | 3.98 | % |
| 6. | | Kennedy-Wilson Holdings, Inc. | 3.86 | % |
| 7. | | Popeyes Louisiana Kitchen, Inc. | 3.55 | % |
| 8. | | HEICO Corp.-Class A | 3.26 | % |
| 9. | | Primerica, Inc. | 3.22 | % |
| 10. | | PRA Group, Inc. | 3.16 | % |
| * | Portfolio Distributions percentages are based on total net investments. Top 10 Holdings do not include short-term investments and percentages are based on total net assets. Portfolio holdings sector distributions are as of 04/30/16 and are subject to change. Portfolio holdings are not recommendations to buy or sell any securities. |
Value of a $1,000,000 Investment (Unaudited)
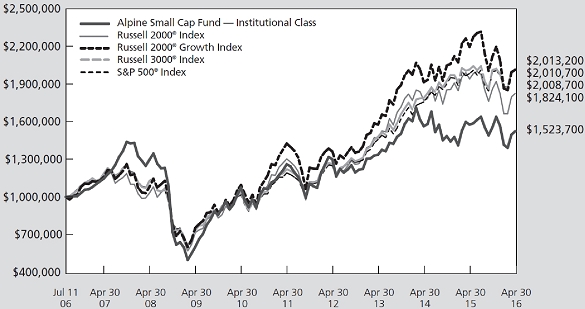
This chart represents a comparison of a hypothetical $1,000,000 investment in the Fund versus a similar investment in the Fund’s benchmarks. The graph and the table do not reflect the deduction of taxes that a shareholder would pay on Fund distributions or the redemption of Fund shares. Investment performance reflects the waiver and recovery of certain fees, if applicable. Without the waiver and recovery of fees, the Fund’s total return would have differed.
Performance data quoted represents past performance and is not predictive of future results. Investment return and principal value of the Fund fluctuate, so that shares, when redeemed, may be worth more or less than their original cost.
28
| Alpine Small Cap Fund (Continued) | |
Commentary
Dear Shareholders:
The Alpine Small Cap Fund invests at least 80% of its net assets in the equity securities of small capitalization companies. The portfolio return for the Fund for the six month period ended April 30, 2016 was -1.97% compared with the Russell 2000® Index at -1.90%. All references to the Fund’s performance relate to the performance of the Fund’s Institutional Class.
The top five stocks based on contribution to the Fund’s total return during the six months ended April 30, 2016, were ExamWorks, Patrick Industries, Rogers Corp., Fair Isaac and Select Comfort.
| | • | ExamWorks a provider of independent medical examinations, peer reviews, bill reviews, Medicare compliance, case management, document management, record retrieval and related services, received an acquisition offer in 2016 that drove the stock price increase. |
| | | |
| | • | Patrick Industries is an recreational vehicle (RV) component supplier that is gaining market share and strong end market demand for RV’s. |
| | | |
| | • | Rogers Corp, a specialty materials company, saw a pickup in end markets served. |
| | | |
| | • | Fair Isaac is benefiting from strong customer demand for predictive analytics products to financial services customers. |
| | | |
| | • | Select Comfort, a premium mattress retailer, saw business stabilize after a difficult enterprise resource planning (ERP) implementation. |
Liberty Tax, PRA Group, Nomad Foods, Live Nation Entertainment, and Advisory Board were the stocks that had the largest adverse impact on the performance of the Fund over the first half of this fiscal year ended April 30, 2016.
| | • | Liberty Tax, a paid assisted tax preparation company, was negatively impacted by a slow tax filing season due to complications with Obamacare. |
| | | |
| | • | PRA Group, a large debt collection company, had collection problems with a recent large European acquisition. |
| | | |
| | • | Nomad Foods, a food products company, was impacted by declining customer demand. |
| | | |
| | • | Live Nation Entertainment, a live concert promotion company, was impacted by concerns of slowing consumer demand. |
| | | |
| | • | Advisory Board, a provider of best practice research to the healthcare and education industry, was negatively impacted by a slowing education market. |
The Fund’s positions in Liberty Tax and Advisory Board were sold prior to the end of the period.
Financial markets continue to worry about the Fed’s expected increase in interest rates. Small cap stocks, as usual, continue to be volatile in the short-run, but offer long-term compelling return opportunities. While financial markets have recovered, economies worldwide are still struggling to grow at pre-crisis levels possibly creating the backdrop for further volatility.
Small cap stocks tend to have more domestic focused business and have been benefitting from a decent U.S. economy.
Sincerely,
Michael T. Smith
Portfolio Manager
29
| Alpine Small Cap Fund (Continued) | |
This letter represents the opinions of the Fund’s management and is subject to change, is not guaranteed and should not be considered a recommendation to buy or sell any security. The information provided is not intended to be, and is not, a forecast of future events, a guarantee of future results, or investment advice. Views expressed may vary from those of the firm as a whole.
Past performance is no guarantee of future results.
Mutual fund investing involves risk. Principal loss is possible. The Fund is subject to risks, including the following:
Currency Risk – The value of investments in securities denominated in foreign currencies increases or decreases as the rates of exchange between those currencies and the U.S. dollar change. Currency conversion costs and currency fluctuations could erase investment gains or add to investment losses. Currency exchange rates can be volatile, and are affected by factors such as general economic conditions, the actions of the U.S. and foreign governments or central banks, the imposition of currency controls and speculation.
Cybersecurity Risk – Cybersecurity incidents may allow an unauthorized party to gain access to Fund assets, customer data (including private shareholder information), or proprietary information, or cause the Fund, the Adviser and/or its service providers (including, but not limited to, Fund accountants, custodians, sub-custodians, transfer agents and financial intermediaries) to suffer data breaches, data corruption or lose operational functionality.
Equity Securities Risk – The stock or other security of a company may not perform as well as expected, and may decrease in value, because of factors related to the company (such as poorer than expected earnings or certain management decisions) or to the industry in which the company is engaged (such as a reduction in the demand for products or services in a particular industry).
Foreign Currency Transactions Risk – Foreign securities are often denominated in foreign currencies. As a result, the value of the Fund’s shares is affected by changes in exchange rates. The Fund may enter into foreign currency transactions to try to manage this risk. The Fund’s ability to use foreign currency transactions successfully depends on a number of factors, including the foreign currency transactions being available at prices that are not too costly, the availability of liquid markets and the ability of the Adviser to accurately predict the direction of changes in currency exchange rates.
Foreign Securities Risk – The Fund’s investments in securities of foreign issuers or issuers with significant exposure to foreign markets involve additional risk. Foreign countries in which the Fund may invest may have markets that are less liquid, less regulated and more volatile than U.S. markets. The value of the Fund’s investments may decline because of factors affecting the particular issuer as well as foreign markets and issuers generally, such as unfavorable or unsuccessful government actions, reduction of government or central bank support and political or financial instability. Lack of information may also affect the value of these securities. To the extent the Fund focuses its investments in a single country or only a few countries in a particular geographic region, economic, political, regulatory or other conditions affecting such country or region may have a greater impact on Fund performance relative to a more geographically diversified fund. The risks of foreign investments are heightened when investing in issuers in emerging market countries.
Growth Stock Risk – Growth stocks typically are very sensitive to market movements because their market prices tend to reflect future expectations. When it appears those expectations will not be met, the prices of growth stocks typically fall. Growth stocks as a group may be out of favor and underperform the overall equity market while the market concentrates on undervalued stocks.
Initial Public Offerings and Secondary Offerings Risk – The Fund may invest a portion of its assets in shares of IPOs or secondary offerings of an issuer. IPOs and secondary offerings may have a magnified impact on the performance of a fund with a small asset base. The impact of IPOs and secondary offerings on the Fund’s performance likely will decrease as the Fund’s asset size increases, which could reduce the Fund’s returns. IPOs and secondary offerings may not be consistently available to the Fund for investing. IPO and secondary offering shares frequently are volatile in price due to the absence of a prior public market, the small number of shares available for trading and limited information about the issuer. Therefore, the Fund may hold IPO and secondary offering shares for a very short period of time. This may increase the turnover of the Fund and may lead to increased expenses for the Fund, such as commissions and transaction costs. In addition, IPO and secondary offering shares can experience an immediate drop in value if the demand for the securities does not continue to support the offering price.
30
| Alpine Small Cap Fund (Continued) | |
Leverage Risk – The Fund may use leverage to purchase securities. Increases and decreases in the value of the Fund’s portfolio will be magnified when the Fund uses leverage.
Liquidity Risk – Some assets held by the Fund may be impossible or difficult to sell, particularly during times of market turmoil.
These illiquid assets may also be difficult to value. If the Fund is forced to sell an illiquid asset to meet redemption requests or other cash needs, the Fund may be forced to sell at a loss.
Management Risk – The Adviser’s judgment about the quality, relative yield or value of, or market trends affecting, a particular security or sector, or about interest rates generally, may be incorrect. The Adviser’s security selections and other investment decisions might produce losses or cause the Fund to underperform when compared to other funds with similar investment objectives and strategies.
Market Risk – The price of a security held by the Fund may fall due to changing market, economic or political conditions.
Real Estate Investment Trusts (“REITs”) Risk – REITs’ share prices may decline because of adverse developments affecting the real estate industry including changes in interest rates. The returns from REITs may trail returns from the overall market. Additionally, there is always a risk that a given REIT will fail to qualify for favorable tax treatment.
Small Capitalization Company Risk – Securities of small capitalization companies are more likely to experience sharper swings in market values, less liquid markets, in which it may be more difficult for the Adviser to sell at times and at prices that the Adviser believes appropriate and generally are more volatile than those of larger companies.
Undervalued Stock Risk – The Fund may pursue strategies that may include investing in securities, which, in the opinion of the Adviser, are undervalued. The identification of investment opportunities in undervalued securities is a difficult task and there is no assurance that such opportunities will be successfully recognized or acquired. While investments in undervalued securities offer opportunities for above-average capital appreciation, these investments involve a high degree of financial risk and can result in substantial losses. By combining both growth and value styles, the Adviser seeks to diversify these risks and lower the volatility, but there is no assurance that this strategy will achieve that result.
Please refer to pages 3-5 for other important disclosures and definitions.
31
Fixed Income Manager Reports

| | Alpine Ultra Short Municipal Income Fund |
| | |
| | Alpine High Yield Managed Duration Municipal Fund |
32
| Alpine Ultra Short Municipal Income Fund | |
| Comparative Annualized Returns as of 04/30/16 (Unaudited) | | |
| | | | | | | | | | | | | |
| | | 6 Months(1) | | 1 Year | | 3 Years | | 5 Years | | 10 Years | | Since Inception(2) |
| Alpine Ultra Short Municipal Income Fund — | | | | | | | | | | | | | | | | | | | | | | | | |
| Institutional Class | | | 0.27% | | | | 0.56% | | | | 0.53% | | | | 0.77% | | | | 1.93% | | | | 2.19% | |
| Alpine Ultra Short Municipal Income Fund — Class A | | | -0.35% | | | | -0.19% | | | | 0.11% | | | | 0.42% | | | | 1.65% | | | | 1.70% | |
| Barclays Municipal Bond: 1 Year (1-2) Index | | | 0.29% | | | | 0.82% | | | | 0.70% | | | | 0.83% | | | | 2.09% | | | | 1.96% | |
| Lipper Short Municipal Debt Funds Average(3) | | | 0.44% | | | | 0.78% | | | | 0.54% | | | | 1.14% | | | | 1.86% | | | | 1.75% | |
| Lipper Short Municipal Debt Funds Ranking — | | | | | | | | | | | | | | | | | | | | | | | | |
| Institutional Class(3) | | | N/A(4) | | | | 73/105 | | | | 52/94 | | | | 59/81 | | | | 25/47 | | | | 10/36 | |
| Gross Expense Ratio (Institutional Class): 0.68%(5) | | | | | | | | | | | | | | | | | | | | | | | | |
| Net Expense Ratio (Institutional Class): 0.45%(5) | | | | | | | | | | | | | | | | | | | | | | | | |
| Gross Expense Ratio (Class A): 0.93%(5) | | | | | | | | | | | | | | | | | | | | | | | | |
| Net Expense Ratio (Class A): 0.70%(5) | | | | | | | | | | | | | | | | | | | | | | | | |
| | (1) | Not annualized. |
| | (2) | Institutional Class shares commenced on December 5, 2002 and Class A shares commenced on March 30, 2004. Returns for indices are since December 5, 2002. |
| | (3) | The since inception data represents the period beginning December 31, 2002. |
| | (4) | FINRA does not recognize rankings for less than one year. |
| | (5) | As disclosed in the prospectus dated February 29, 2016 as amended April 4, 2016. |
Performance data quoted represents past performance and is not predictive of future results. Investment return and principal value of the Fund fluctuate, so that the shares, when redeemed, may be worth more or less than their original cost. Performance current to the most recent month end may be lower or higher than performance quoted and may be obtained by calling 1-888-785-5578. Performance data shown does not reflect the 0.25% redemption fee imposed on shares held for fewer than 30 days. If it did, total returns would be reduced. Effective 10/12/07, Alpine Ultra Short Municipal Income Fund - Class A began imposing a maximum sales charge of 0.50% on purchases. Performance data shown for time period beginning with dates after October 12, 2007 reflect the sales charge.
Barclays Municipal Bond: 1 Year (1-2) Index is a total return benchmark of BAA3 ratings or better designed to measure returns for tax exempt assets. The Lipper Short Municipal Debt Funds Average is an unmanaged index that tracks funds that invest in municipal debt issues with dollar-weighted average maturities of less than three years. Lipper rankings for the periods shown are based on fund total returns with dividends and distributions reinvested and do not reflect sales charges. The Barclays Municipal Bond: 1 Year (1-2) Index and the Lipper Short Municipal Debt Funds Average are unmanaged and do not reflect the deduction of direct fees associated with a mutual fund, such as investment adviser fees; however, the Lipper Short Municipal Debt Funds Average reflects fees charged by the underlying funds. The performance for the Alpine Ultra Short Municipal Income Fund reflects the deduction of fees for these value-added services. Investors cannot directly invest in an index.
Expense Ratios reflect the ratios reported in the Fund’s most recent prospectus. The Alpine Ultra Short Municipal Income Fund has a contractual expense waiver that continues through April 1, 2017. Where a Fund’s gross and net expense ratios are the same for the period reported, the contractual expense reimbursement level was not reached as of the end of that period. To the extent the Fund’s expenses were reduced by waivers, the Fund’s total returns were increased. In these cases, in the absence of the expense waivers, the Fund’s total returns would have been lower. The Adviser has also voluntarily waived a portion of the expenses for the Alpine Ultra Short Municipal Income Fund. To the extent the Fund’s expenses were reduced by waivers, the Fund’s total returns were increased. In these cases, in the absence of the expense waivers, the Fund’s total returns would have been lower.
33
| Alpine Ultra Short Municipal Income Fund (Continued) | |
Portfolio Distributions* (Unaudited)
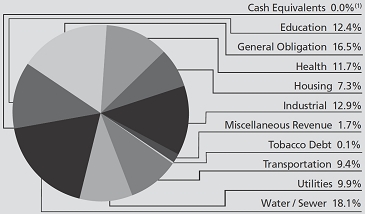
Top 10 Holdings* (Unaudited)
| 1. | | Mississippi Business Finance Corp. Revenue, PSL-North America LLC Project, 2.95%, 11/01/2032 (Putable on 05/05/2016) | 6.74 | % |
| 2. | | Phoenix Industrial Development Authority, Solid Waste Revenue, Republic Services, Inc. Project, 0.65%, 12/01/2035 (Putable on 05/02/2016) | 6.14 | % |
| 3. | | Indiana Finance Authority, Multifamily HSG Revenue, 0.90%, 10/26/2017 (Putable on 05/05/2016) | 5.85 | % |
| 4. | | New Jersey Economic Development Authority, Port Newark Container Terminal LLC Project, 0.70%, 07/01/2030 (Putable on 05/04/2016) | 3.60 | % |
| 5. | | Town of Oyster Bay, Bond Anticipation Notes, 2.00%, 07/08/2016 | 3.47 | % |
| 6. | | Chicago Board of Education, 1.00%, 12/01/2034 (Putable on 05/05/2016) | 3.32 | % |
| 7. | | Lewisburg Industrial Development Board Solid Waste Disposal Revenue, Waste Management, Inc. of Tennessee Project, 0.60%, 07/02/2035 (Putable on 05/02/2016) | 2.97 | % |
| 8. | | Florida Development Finance Corp., Healthcare Facilities Revenue, UF Health-Jacksonville Project, 1.05%, 02/01/2029 (Putable on 05/05/2016) | 2.68 | % |
| 9. | | West Virginia Economic Development Authority, Appalachian Power Co., 0.79%, 02/01/2036 (Putable on 05/05/2016) | 2.38 | % |
| 10. | | New York Environmental Facilities Corp. Solid Waste Disposal Revenue, Waste Management, Inc. Project, 0.60%, 05/01/2030 (Putable on 05/02/2016) | 2.00 | % |
| * | Portfolio holdings and sector distributions are as of 04/30/16 and are subject to change. Portfolio holdings are not recommendations to buy or sell any securities. Portfolio Distributions percentages are based on total investments and Top 10 Holdings percentages are based on total net assets. |
| (1) | Amount is less than 0.05%. |
34
| Alpine Ultra Short Municipal Income Fund (Continued) | |
Value of a $250,000 Investment (Unaudited)
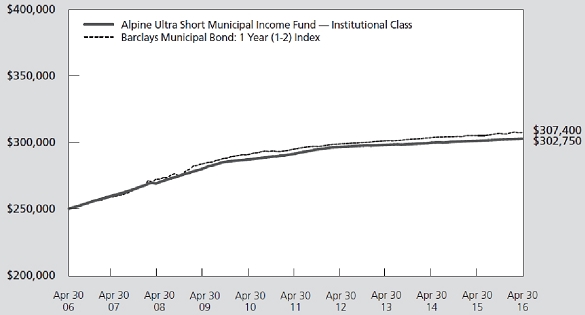
This chart represents a comparison of a hypothetical $250,000 investment in the Fund versus a similar investment in the Fund’s benchmark. The graph and the table do not reflect the deduction of taxes that a shareholder would pay on Fund distributions or the redemption of Fund shares. Investment performance reflects the waiver and recovery of certain fees, if applicable. Without the waiver and recovery of fees, the Fund’s total return would have differed.
Performance data quoted represents past performance and is not predictive of future results. Investment return and principal value of the Fund fluctuate, so that shares, when redeemed, may be worth more or less than their original cost.
Credit Quality Allocation (As of 4/30/2016)
| | | | | |
| AAA | | | 0.6 | % |
| AA | | | 14.1 | % |
| A | | | 30.1 | % |
| BBB | | | 29.1 | % |
| Below BBB | | | 0.1 | % |
| Not Rated | | | 26.0 | % |
Bond Credit Quality-Reflects the higher of the ratings of Standards & Poor’s Corporation; Moody’s Investors Service, Inc. or Fitch, Inc. Ratings are relative, subjective and not absolute standards of quality, represent the opinions of the independent Nationally Recognized Statistical Rating Organizations (NRSRO), and are adjusted to the Standards and Poors scale shown. Ratings are measured using a scale that typically ranges from AAA (highest) to D (lowest). The security’s credit rating does not eliminate risk. The table excludes equity securities, cash and cash equivalents. For more information about securities ratings, please see the Fund’s Statement of Additional Information. Additional information on ratings methodologies are available by visiting the NRSRO websites; www.standardandpoors.com, www.moodys.com, and www.fitchratings.com.
35
| Alpine High Yield Managed Duration Municipal Fund | |
| Comparative Annualized Returns as of 04/30/16 (Unaudited) | |
| | | | | | | |
| | | 6 Months(1) | | 1 Year | | Since Inception(2) |
| Alpine High Yield Managed Duration Municipal Fund — Institutional Class | | | 2.35% | | | | 3.65% | | | | 4.59% | |
| Alpine High Yield Managed Duration Municipal Fund — Class A (Without Load) | | | 2.23% | | | | 3.41% | | | | 4.34% | |
| Alpine High Yield Managed Duration Municipal Fund — Class A (With Load) | | | -0.29% | | | | 0.87% | | | | 3.43% | |
| S&P Municipal Bond Short Intermediate Index | | | 1.54% | | | | 2.81% | | | | 2.24% | |
| Barclays Municipal Bond: High Yield (non-Investment Grade) Index | | | 3.94% | | | | 4.51% | | | | 3.23% | |
| Lipper High Yield Municipal Debt Funds Average(3) | | | 4.58% | | | | 6.20% | | | | 4.59% | |
| Lipper High Yield Municipal Debt Funds Ranking(3) | | | N/A(4) | | | | 137/144 | | | | 58/126 | |
| Gross Expense Ratio (Institutional Class): 1.02%(5) | | | | | | | | | | | | |
| Net Expense Ratio (Institutional Class): 0.67%(5) | | | | | | | | | | | | |
| Gross Expense Ratio (Class A): 1.27%(5) | | | | | | | | | | | | |
| Net Expense Ratio (Class A): 0.92%(5) | | | | | | | | | | | | |
| | (1) | Not annualized. |
| | (2) | The Fund commenced operations on May 31, 2013. Returns for indices are since May 31, 2013. |
| | (3) | The since inception data represents the period beginning May 31, 2013. |
| | (4) | FINRA does not recognize rankings for less than one year. |
| | (5) | As disclosed in the prospectus dated February 29, 2016 as amended April 4, 2016. |
Performance data quoted represents past performance and is not predictive of future results. Investment return and principal value of the Fund fluctuate, so that shares, when redeemed, may be worth more or less than their original cost. Performance current to the most recent month end may be lower or higher than the performance quoted and may be obtained by calling 1-888-785-5578. Performance data shown does not reflect the 0.75% redemption fee imposed on shares held for fewer than 60 days. If it did, total returns would be reduced. Returns for the Class A shares with sales charge reflect a maximum sales charge of 2.50%. Performance for the Class A shares without sales charges does not reflect this load.
The S&P Municipal Bond Short Intermediate Index consists of bonds in the S&P Municipal Bond Index with a minimum maturity of one year and a maximum maturity of up to, but not including, eight years as measured from the Rebalancing Date. The Barclays Municipal Bond: High Yield (non-Investment Grade) Index is the Municipal High Yield component of the Barclays Municipal Bond Index. The Barclays Municipal Bond Index is a rules-based, market-value-weighted index engineered for the long-term tax-exempt bond market. The Lipper High Yield Municipal Debt Funds Average is an unmanaged index that tracks funds that invest in funds that typically invest 50% or more of their assets in municipal debt issues rated BBB or less. Lipper rankings for the period shown are based on fund total returns with dividends and distributions reinvested and do not reflect sales charges. The Barclays Municipal Bond: High Yield (non-Investment Grade) Index and the Lipper High Yield Municipal Debt Funds Average are unmanaged and do not reflect the deduction of direct fees associated with a mutual fund, such as investment adviser fees; however, the Lipper High Yield Municipal Debt Funds Average reflects fees charged by the underlying funds. The performance for the Alpine High Yield Managed Duration Municipal Fund reflects the deduction of fees for these value-added services. Investors cannot directly invest in an index.
Expense ratios reflect the ratios reported in the Fund’s most recent prospectus. The Alpine High Yield Managed Duration Municipal Fund has a contractual expense waiver that continues through April 1, 2017. Where a Fund’s gross and net expense ratios are the same for the period reported, the contractual expense reimbursement level was not reached as of the end of that period. To the extent the Fund’s expenses were reduced by waivers, the Fund’s total returns were increased. In these cases, in the absence of the expense waivers, the Fund’s total returns would have been lower. The Adviser has also voluntarily waived a portion of the expenses for the Alpine High Yield Managed Duration Municipal Fund. To the extent the Fund’s expenses were reduced by waivers, the Fund’s total returns were increased. In these cases, in the absence of the expense waivers, the Fund’s total returns would have been lower.
36
| Alpine High Yield Managed Duration Municipal Fund (Continued) | |
Portfolio Distributions* (Unaudited)
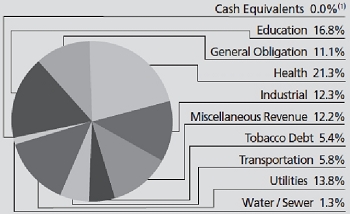
| | | Top 10 Holdings* (unaudited) | | | |
| 1. | | Sevier County Public Building Authority, Local Government Public Improvement, 2.70%, 06/01/2026 (Putable on 05/05/2016) | | 3.22 | % |
| 2. | | Campbell County Industrial Development Authority, Solid Waste Disposal Facility Revenue, Georgia Pacific Corp. Project, 0.59%, 12/01/2019 (Putable on 05/04/2016) | | 2.72 | % |
| 3. | | Jefferson County Ltd. Obligation School Warrants, 4.75%, 01/01/2025 | | 2.70 | % |
| 4. | | East Baton Rouge Parish Industrial Development Board, Solid Waste Disposal, Georgia Pacific Corp. Project, 0.59%, 06/01/2029 (Putable on 05/04/2016) | | 2.25 | % |
| 5. | | Texas Municipal Gas Acquisition & Supply Corp. I Revenue, Sr. Lien, 6.25%, 12/15/2026 | | 2.02 | % |
| 6. | | Jefferson Parish Industrial Development Board, Sara Lee Corp. Project, 0.72%, 06/01/2024 (Putable on 05/02/2016) | | 1.97 | % |
| 7. | | Allegheny County Industrial Development Authority, Environmental Improvement Revenue, United States Steel Corp., 5.50%, 11/01/2016 | | 1.79 | % |
| 8. | | Allegheny County Industrial Development Authority, Environmental Improvement Revenue, United States Steel Corp., 6.50%, 05/01/2017 | | 1.68 | % |
| 9. | | Ohio County Revenue, Big Rivers Electric Project, 6.00%, 07/15/2031 | | 1.42 | % |
| 10. | | Indiana Finance Authority Revenue, Private Activity OH River Bridge, 5.00%, 01/01/2019 | | 1.37 | % |
| * | Portfolio Distributions percentages are based on total net investments. Top 10 Holdings do not include short-term investments and percentages are based on total net assets. Portfolio holdings sector distributions are as of 04/30/16 and are subject to change. Portfolio holdings are not recommendations to buy or sell any securities. |
| (1) | Amount is less than 0.05%. |
Value of a $250,000 Investment (Unaudited)
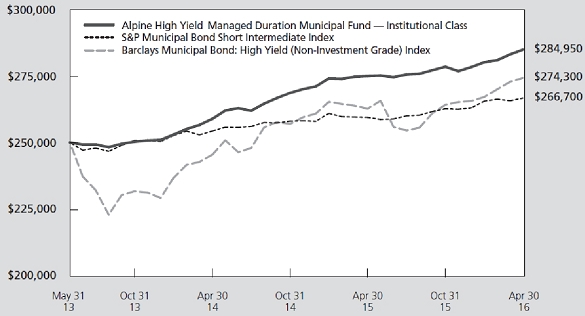
This chart represents a comparison of a hypothetical $250,000 investment in the Fund versus a similar investment in the Fund’s benchmark. The graph and the table do not reflect the deduction of taxes that a shareholder would pay on Fund distributions or the redemption of Fund shares. Investment performance reflects the waiver and recovery of certain fees, if applicable. Without the waiver and recovery of fees, the Fund’s total return would have differed.
Performance data quoted represents past performance and is not predictive of future results. Investment return and principal value of the Fund fluctuate, so that shares, when redeemed, may be worth more or less than their original cost.
37
| Alpine High Yield Managed Duration Municipal Fund (Continued) | |
| Credit Quality Allocation (As of 4/30/2016) | | | | |
| | | | | |
| AA | | | 13.6 | % |
| A | | | 14.9 | % |
| BBB | | | 13.4 | % |
| BB | | | 19.0 | % |
| B | | | 11.0 | % |
| CCC | | | 0.2 | % |
| CC | | | 0.3 | % |
| Not Rated | | | 27.6 | % |
Bond Credit Quality-Reflects the higher of the ratings of Standards & Poor’s Corporation; Moody’s Investors Service, Inc. or Fitch, Inc. Ratings are relative, subjective and not absolute standards of quality, represent the opinions of the independent Nationally Recognized Statistical Rating Organizations (NRSRO), and are adjusted to the Standards and Poors scale shown. Ratings are measured using a scale that typically ranges from AAA (highest) to D (lowest). The security’s credit rating does not eliminate risk. The table excludes equity securities, cash and cash equivalents. For more information about securities ratings, please see the Fund’s Statement of Additional Information. Additional information on ratings methodologies are available by visiting the NRSRO websites; www.standardandpoors.com, www.moodys.com, and www.fitchratings.com.
38
Alpine Ultra Short Municipal Income Fund /
Alpine High Yield Managed Duration Municipal Fund | |
Commentary
Dear Shareholders:
During the first half of fiscal 2016 ended April 30, 2016, the 10-year U.S. Treasury bond yield decreased 31 basis points from 2.14% on 10/31/15 to 1.83% at period end, with moderate volatility during the period. The yield decrease during the period reflected, in part, the market discounting the likelihood of another U.S. Federal Reserve (Fed) funds increase until June at the earliest. Following the Fed increase of 25 basis points in December of 2015, the Federal Open Market Committee (FOMC) statement in March took a more dovish tone; indicating a slower rate increase path for 2016. The statement noted that “global economic and financial developments continue to pose risks,” and policymakers projections now imply only two rate increases in 2016 versus a projected four increases in the statement by the FOMC in December. Despite domestic growth expanding at a moderate pace and strengthening in the labor markets, inflation expectations remained unchanged and a diverging economic policy outside the United States does put more pressure on Fed Chair Yellen to strike a more dovish tone.
Over the same period, the Municipal yield curve flattened. Ten-year Municipal bond yields reacted similarly to its treasury counterpart, as the BVAL Muni Benchmark 10 Year Index decreased 42 basis points from 2.07% on 10/31/15 to 1.65% by 4/30/16, and prices increased commensurately. The Municipal market rally seen in the ten-year space was primarily driven by continued lower Municipal bond issuance coupled with increased demand for tax exempt securities.
In contrast to the rally seen in ten-year maturities in the first half of fiscal 2016, Municipal bonds maturing in 1 year or less performed quite differently. Over the period, the BVAL Muni Benchmark 1T Index (1 Year Index) and BVAL Muni Benchmark 6M Index (6 Month Index) saw their yields increase. With the 1 Year Index increasing 31 basis points from 0.26% on 10/31/15 to 0.57% at 4/30/16, and the 6 Month Index increasing a significant 40 basis points from 0.11% on 10/31/15 to 0.51% at 4/30/16. The increased yields at the front end of the curve coupled with its volatility was driven by lack of demand for such maturities as Municipal money market funds continued to shorten their portfolio maturities with money market fund reform deadlines approaching in late 2016.
Total Municipal issuance for the first four months of the calendar year ending April 30, 2016, declined 11.1% to $132.6 billion from $149.2 billion in the same period in 2015. The decrease in issuance was driven mostly by reduced refunding activity. As of April 30, 2016, new money Municipal volume increased over 24% year over year, to $52.9 billion, while refunding issuance declined
over 25% to $79.6 billion, as fewer issuers saw the need to refinance outstanding bonds according to the April 2016 SIFMA U.S. Municipal issuance statistics.
ALPINE ULTRA SHORT MUNICIPAL INCOME FUND
Alpine Ultra Short Municipal Income Fund Institutional Class had a total return for the six month period ended April 30, 2016 of 0.27% which trailed slightly the Barclays Municipal Bond: 1 Year (1-2) Index (Benchmark) return of 0.29%.
During the first half of the fiscal year our effective average maturity stayed relatively unchanged at 67 days versus the previous reporting period that ended with an average maturity of 63 days. Given market volatility on the short end of the municipal bond curve, this low average maturity compared to the benchmark’s 1.4 years allowed the Fund to maintain a relatively stable NAV. In addition, the Fund was able to add to its exposure in high quality Municipal Notes, from 11.5% at the beginning of the period to 18.20% end of period, in order to take advantage of more attractive yields in the space. As a result, the distribution yield of the Fund ended the period at 0.74% compared to 0.57% to start.
In a shift from prior reporting periods, a growing percentage of the Fund’s performance can be attributed to solid A-rated securities in the portfolio compared with intermediate investment grade credits, a trend that should continue for the foreseeable future. A portion of the Fund’s performance came from our exposure to BBB rated bonds but as credit spreads have tightened and continue to tighten, the value added of intermediate investment grade securities will diminish. The relative attractiveness in yields of A-rated bonds had little effect on the market value of the Fund given its ultra short duration of 0.18. As the yield on the BVAL Muni Benchmark 6M Index increased from 0.11% on October 31 to 0.52% on May 29, the Fund did not have any material movement in NAV. A major contributor to the stability of the Fund over the quarter was the holdings of variable rate demand notes, which comprised 42% of the portfolio as these trade at par and do not fluctuate in value.
We continue to invest in three- to twelve-month put bonds and have been concentrating more on the three-month part of the curve. The largest holdings in these types of securities continue to be from the obligors Republic Services and Waste Management. Both issuers offer attractive yields and have been of improving credit quality over the past few years.
As of April 30th, our holdings in Puerto Rico represent less than 1% of the Fund, and all of our exposure benefits from bond insurance from either Assured Guaranty or
39
Alpine Ultra Short Municipal Income Fund /
Alpine High Yield Managed Duration Municipal Fund | |
Nat Re. Both of these insurers are of high quality that fall in the AA ratings category and are well capitalized for our maturity profile of 2017 or earlier.
ALPINE HIGH YIELD MANAGED DURATION MUNICIPAL FUND
Alpine High Yield Managed Duration Municipal Institutional Class had a total return for the first half of fiscal 2016 ended April 30th of 2.35%. For the same period, the Fund outperformed the S&P Municipal Bond Short Intermediate Index (S&P) which returned 1.54% but underperformed the Barclays Municipal Bond: High Yield (Non-Investment Grade) Index (Barclays) which returned 3.94%.
During the period, our average weighted maturity increased from 4.90 years to 4.97 years and our effective duration increased from 2.57 years to 2.84 years. Both our effective duration and weighted average maturity are shorter than the S&P and Barclays. We maintained our barbell strategy this quarter and currently expect to stay the course with this Fund structure during the balance of the fiscal year. We believe this strategy potentially allows the Fund to deliver an attractive income stream while minimizing duration risk in this currently volatile market.
Positive contributors during the first half of the fiscal year ended April 30, 2016 to total return included short duration bonds and notes. We believe that investing in these types of securities provides the potential to both maximize our yield and soften volatility to the extent such bonds are not redeemed early by the obligor. Other positive contributors to performance this half included our exposure to continuing care retirement communities (CCRCs) and not-for-profit hospitals. We continued to look for bonds that had call provisions that allow us to receive some or all of our principal back prior to maturity.
Tobacco bonds also continued to contribute to performance during the semi-annual period. These bonds have lately been one of the most attractive areas of the high yield sector because investors are attracted to both their high level of liquidity and relatively high yield. Despite this excitement, we have been cautious when adding to our existing positions since the sector historically has a tendency to be quite volatile and has become more expensive in recent months.
The Fund’s exposure to bonds from the Commonwealth of Puerto Rico increased during the first half of fiscal 2016 to 5.3% from less than 4% at calendar year end as we found significant value in some ‘AA’ rated securities enhanced by bond insurance from financially strong bond insurers. Importantly, all of the Fund’s holdings from this territory are fully insured by Assured Guaranty or Nat Re, both of which have very strong financial claims paying reserves in our opinion.
A developing Fed policy and Fed Funds roadmap, coupled with money market fund reform deadlines looming in October 2016 will, in our opinion, continue to make the markets a volatile place on the short end of the Municipal curve. For this reason, we remain cautious in our investment approach going forward. We are monitoring the markets closely and will continue to invest in ways that minimize the impact to NAV while at the same time providing our investors with a high level of tax exempt income.
Sincerely,
Jonathan Mondillo
Mark Taylor
Portfolio Managers
This letter represents the opinions of the Fund’s management and is subject to change, is not guaranteed and should not be considered a recommendation to buy or sell any security. The information provided is not intended to be, and is not, a forecast of future events, a guarantee of future results, or investment advice. Views expressed may vary from those of the firm as a whole.
Past performance is no guarantee of future results.
Diversification does not assure a profit nor protect against loss in a declining market.
Mutual fund investing involves risk. Principal loss is possible.
The Alpine Ultra Short Municipal Income Fund is subject to risks, including the following:
Credit Risk – The credit quality and liquidity of the Fund’s investments in municipal obligations and other debt securities may be dependent in part on the credit quality of third parties, such as banks and other financial institutions, which provide credit and liquidity enhancements to the Fund’s investments. Adverse changes in the credit quality of these third parties could cause losses to the Fund and affect its share price.
Cybersecurity Risk – Cybersecurity incidents may allow an unauthorized party to gain access to Fund assets, customer data (including private shareholder information), or proprietary information, or cause the Fund, the Adviser and/or its
40
Alpine Ultra Short Municipal Income Fund /
Alpine High Yield Managed Duration Municipal Fund | |
service providers (including, but not limited to, Fund accountants, custodians, sub-custodians, transfer agents and financial intermediaries) to suffer data breaches, data corruption or lose operational functionality.
Fixed Income Securities Risk – Fixed income securities are subject to issuer risk, interest rate risk and market risk.
Interest Rate Risk – Interest rates may rise resulting in a decrease in the value of the securities held by the Fund, or may fall resulting in an increase in the value of such securities. Securities having longer maturities generally involve a greater risk of fluctuations in the value resulting from changes in interest rates. Securities having shorter maturities generally involve less risk of fluctuation in value resulting from changes in interest rates, but generally have yields lower than securities having longer maturities. Securities having shorter maturities are also subject to reinvestment risk, which is the risk that if interest rates fall the Fund may need to invest the proceeds of redeemed securities in securities with lower interest rates.
Issuer Risk – Changes in the financial condition of the issuer of an obligation, changes in general economic conditions, or changes in economic conditions that affect the issuer may impact its actual or perceived willingness or ability to make timely payments of interest or principal.
Liquidity Risk – Some assets held by the Fund may be impossible or difficult to sell, particularly during times of market turmoil. These illiquid assets may also be difficult to value. If the Fund is forced to sell an illiquid asset to meet redemption requests or other cash needs, the Fund may be forced to sell at a loss.
Management Risk – The Adviser’s judgment about the quality, relative yield or value of, or market trends affecting, a particular security or sector, or about interest rates generally, may be incorrect. The Adviser’s security selections and other investment decisions might produce losses or cause the Fund to underperform when compared to other funds with similar investment objectives and strategies.
Market Risk – General market conditions, such as real or perceived adverse economic or political conditions, inflation, changes in interest rates, lack of liquidity in the bond markets or adverse investor sentiment could cause the value of your investment in the fund, or its yield, to decline.
Municipal Securities Concentration Risk – From time to time the Fund may invest a substantial amount of its assets in municipal securities whose interest is paid solely from revenues of similar projects. If the Fund concentrates its investments in this manner, it assumes the economic risks relating to such projects and this may have a significant impact on the Fund’s investment performance.
Municipal Securities Risk – Municipal securities risks include the ability of the issuer to repay the obligation, the relative lack of information about certain issuers of municipal securities, and the possibility of future legislative changes which could affect the market for and value of municipal securities. Certain municipal securities, including private activity bonds, are not backed by the full faith, credit and taxing power of the issuer. Additionally, if events occur after the security is acquired that impact the security’s tax-exempt status, the Fund and its shareholders could be subject to substantial tax liabilities.
Portfolio Turnover Risk – High portfolio turnover necessarily results in greater transaction costs which may reduce Fund performance.
Redemption Risk – The Fund may experience heavy redemptions that could cause the Fund to liquidate its assets at inopportune times or at a loss or depressed value, which could cause the value of your investment to decline.
Tax Risk – Changes in tax laws or adverse determinations by the Internal Revenue Service may make the income from some municipal obligations taxable. Additionally, maximizing after-tax income may require trade-offs that reduce pre-tax income. The Fund’s tax-efficient strategies may reduce the taxable income of the Fund’s shareholders, but will not eliminate it. There can be no assurance that taxable distributions can always be avoided or that the Fund will achieve its investment objective.
Variable Rate Demand Obligations Risk – Variable rate demand obligations (“VRDOs”) are floating rate securities that combine an interest in a long term municipal bond with a right to demand payment before maturity from a bank or other financial institution. If the bank or financial institution is unable to pay, the Fund may lose money. In addition, the interest rates on variable rate demand obligations are short-term and may, for example, be reset daily, weekly or monthly. During periods of declining interest rates, the Fund’s yield on a VRDO will decrease and its shareholders will forego the opportunity for capital appreciation. During periods of rising interest rates, however, the Fund’s yield on a VRDO will increase and the Fund’s shareholders will have a reduced risk of capital depreciation.
41
Alpine Ultra Short Municipal Income Fund /
Alpine High Yield Managed Duration Municipal Fund | |
Yield Risk – The amount of income received by the Fund will go up or down depending on day-to-day variations in short-term interest rates, and when interest rates are very low the Fund’s expenses could absorb all or a significant portion of the fund’s income. If interest rates increase, the Fund’s yield may not increase proportionately. For example, the Adviser may discontinue any temporary voluntary fee limitation or recoup amounts previously waived and/or reimbursed.
The Alpine High Yield Managed Duration Municipal Fund is subject to risks, including the following:
Borrowing and Leverage Risk – When the Fund borrows for leverage, changes in the value of the Fund’s investments will have a larger effect on its share price than if it did not borrow. Borrowing results in interest payments to the lenders and related expenses. The costs of borrowing for investment purposes might reduce the Fund’s return if the yield on the securities purchased is less than the borrowing costs.
Credit Risk – The credit quality and liquidity of the Fund’s investments in municipal obligations and other debt securities may be dependent in part on the credit quality of third parties, such as banks and other financial institutions, which provide credit and liquidity enhancements to the Fund’s investments. Adverse changes in the credit quality of these third parties could cause losses to the Fund and affect its share price.
Cybersecurity Risk – Cybersecurity incidents may allow an unauthorized party to gain access to Fund assets, customer data (including private shareholder information), or proprietary information, or cause the Fund, the Adviser and/or its service providers (including, but not limited to, Fund accountants, custodians, sub-custodians, transfer agents and financial intermediaries) to suffer data breaches, data corruption or lose operational functionality.
Debt Securities Risk – Debt securities, such as bonds, involve credit risk and interest rate risk. In general, the market price of debt securities with longer maturities will go up or down more in response to changes in interest rates than the market price of shorter term securities.
Fixed Income Securities Risk – Fixed income securities are subject to issuer risk, interest rate risk and market risk.
Interest Rate Risk – Interest rates may rise resulting in a decrease in the value of the securities held by the Fund, or may fall resulting in an increase in the value of such securities. Securities having longer maturities generally involve a greater risk of fluctuations in the value resulting from changes in interest rates. Securities having shorter maturities generally involve less risk of fluctuations in the value resulting from changes in interest rates, but generally have lower yields than securities having longer maturities. Securities having shorter maturities are also subject to reinvestment risk, which is the risk that if interest rates fall the Fund may need to invest the proceeds of redeemed securities in securities with lower interest rates.
Issuer Risk – Changes in the financial condition of the issuer of an obligation, changes in general economic conditions, or changes in economic conditions that affect the issuer may impact its actual or perceived willingness or ability to make timely payments of interest or principal.
Junk Bond Risk – Junk bonds involve a greater risk of default or price changes due to changes in the credit quality of the issuer. The values of junk bonds fluctuate more than those of high-quality bonds in response to company, political, regulatory or economic developments. Values of junk bonds can decline significantly over short periods of time.
Land-Secured or “Dirt” Bonds Risk – These special assessment or special tax bonds are issued to promote residential, commercial or industrial growth and redevelopment. They are exposed to real estate development-related risks. The bonds could default if the developments failed to progress as anticipated or if taxpayers failed to pay the assessments, fees and taxes specified in the financing plans for a project.
Liquidity Risk – Some assets held by the Fund may be impossible or difficult to sell, particularly during times of market turmoil. These illiquid assets may also be difficult to value. If the Fund is forced to sell an illiquid asset to meet redemption requests or other cash needs, the Fund may be forced to sell at a loss
Management Risk – The Adviser’s judgment about the quality, relative yield or value of, or market trends affecting, a particular security or sector, or about interest rates generally, may be incorrect. The Adviser’s security selections and other investment decisions might produce losses or cause the Fund to underperform when compared to other funds with similar investment goals.
Market Risk – General market conditions, such as real or perceived adverse economic or political conditions, inflation, changes in interest rates, lack of liquidity in the bond markets or adverse investor sentiment could cause the value of your investment in the fund, or its yield, to decline.
42
Alpine Ultra Short Municipal Income Fund /
Alpine High Yield Managed Duration Municipal Fund | |
Medium- and Lower-Grade Municipal Securities Risk – Securities which are in the medium- and lower-grade categories generally offer higher yields than are offered by higher-grade securities of similar maturity, but they also generally involve more volatility and greater risks, such as greater credit risk, market risk, liquidity risk, management risk, and regulatory risk. Furthermore, many medium- and lower-grade securities are not listed for trading on any national securities exchange and many issuers of medium- and lower-grade securities choose not to have a rating assigned to their obligations by any nationally recognized statistical rating organization.
Municipal Market Volatility and Illiquidity Risk – The municipal bond market can be susceptible to unusual volatility, particularly for lower-rated and unrated securities. Liquidity can be reduced unpredictably in response to overall economic conditions or credit tightening. During times of reduced market liquidity, the Fund may not be able to readily sell bonds at the prices at which they are carried on the Fund’s books. If the Fund needed to sell large blocks of bonds to meet shareholder redemption requests or to raise cash, those sales could further reduce the bonds’ prices.
Municipal Sector Concentration Risk – From time to time the Fund may invest a substantial amount of its assets in municipal securities whose interest is paid solely from revenues of similar projects. If the Fund concentrates its investments in this manner, it assumes the economic risks relating to such projects and this may have a significant impact on the Fund’s investment performance.
Municipal Securities Risk – Municipal securities risks include the ability of the issuer to repay the obligation, the relative lack of information about certain issuers of municipal securities, and the possibility of future legislative changes which could affect the market for and value of municipal securities. Certain municipal securities, including private activity bonds, are not backed by the full faith, credit and taxing power of the issuer. Additionally, if events occur after the security is acquired that impact the security’s tax-exempt status, the Fund and its shareholders could be subject to substantial tax liabilities.
Puerto Rico and U.S. Territories Risk – Because the Fund invests in the municipal securities of U.S. territories, and currently invests in Puerto Rican municipal securities, events in Puerto Rico are likely to affect the Fund’s investments and its performance. These events may include economic or political policy changes, tax base erosion, territory constitutional limits on tax increases, budget deficits and other financial difficulties, and changes in the credit ratings assigned to Puerto Rico’s municipal issuers. As with Puerto Rican municipal securities, events in any of the other territories where the Fund is invested may affect the Fund’s investments and its performance.
Redemption Risk – The Fund may experience heavy redemptions that could cause the Fund to liquidate its assets at inopportune times or at a loss or depressed value, which could cause the value of your investment to decline.
Tax Risk – To be tax-exempt, municipal obligations generally must meet certain regulatory requirements. If any such municipal obligation fails to meet these regulatory requirements, the interest received by the Fund from its investment in such obligations and distributed to Fund shareholders will be taxable. There is no guarantee that all of the Fund’s income will remain exempt from federal or state income taxes. Income from municipal bonds held by a Fund could be declared taxable because of unfavorable changes in tax laws, adverse interpretations by the Internal Revenue Service or state tax authorities, or noncompliant conduct of a bond issuer.
Tender Option Bonds Risk – Tender option bonds are synthetic floating-rate or variable-rate securities issued when long-term bonds are purchased in the primary or secondary market and then deposited into a trust. Tender option bonds may be considered derivatives, and may expose the Fund to the same risks as investments in derivatives, as well as risks associated with leverage, especially the risk of increased volatility.
Tobacco Related Bonds Risk – In 1998, the largest U.S. tobacco manufacturers reached an out of court agreement, known as the Master Settlement Agreement (the “MSA”), to settle claims against them by 46 states and six other U.S. jurisdictions. The tobacco manufacturers agreed to make annual payments to the government entities in exchange for the release of all litigation claims. A number of the states have sold bonds that are backed by those future payments. The Fund may invest in two types of those bonds: (i) bonds that make payments only from a state’s interest in the MSA and (ii) bonds that make payments from both the MSA revenue and from an “appropriation pledge” by the state. An “appropriation pledge” requires the state to pass a specific periodic appropriation to make the payments and is generally not an unconditional guarantee of payment by a state. The settlement payments are based on factors, including, but not limited to, annual domestic cigarette shipments, cigarette consumption, inflation and the financial capability of participating tobacco companies. Payments could be reduced if consumption decreases, if market share is lost to non-MSA manufacturers, or if there is a negative outcome in litigation regarding the MSA.
Please refer to pages 3-5 for other important disclosures and definitions.
43
Alpine Dynamic Dividend Fund
Schedule of Portfolio Investments
April 30, 2016 (Unaudited)
| Shares | | Security
Description | | Value |
| | | | | |
| Common Stocks—99.6% | | | | |
| Aerospace & Defense—1.3% | | | | |
| | 20,000 | | | B/E Aerospace, Inc. | | $ | 972,600 | |
| | 5,000 | | | Orbital ATK, Inc. | | | 435,000 | |
| | 6,100 | | | Raytheon Co. | | | 770,735 | |
| | | | | | | | 2,178,335 | |
| Air Freight & Logistics—1.0% | | | | |
| | 10,500 | | | FedEx Corp. | | | 1,733,655 | |
| Airlines—1.4% | | | | |
| | 38,000 | | | Delta Air Lines, Inc. | | | 1,583,460 | |
| | 22,000 | | | Japan Airlines Co., Ltd. | | | 817,350 | |
| | | | | | | | 2,400,810 | |
| Auto Components—1.4% | | | | |
| | 11,500 | | | Delphi Automotive PLC | | | 846,745 | |
| | 347,000 | | | GKN PLC | | | 1,413,063 | |
| | | | | | | | 2,259,808 | |
| Automobiles—1.0% | | | | |
| | 117,000 | | | Ford Motor Co. | | | 1,586,520 | |
| Banks—6.2% | | | | |
| | 130,783 | | | Banco Bilbao Vizcaya Argentaria SA | | | 895,970 | |
| | 86,000 | | | Bangkok Bank PCL—NVDR | | | 403,779 | |
| | 107,000 | | | Bank of America Corp. | | | 1,557,920 | |
| | 27,000 | | | Citigroup, Inc. | | | 1,249,560 | |
| | 70,000 | | | Citizens Financial Group, Inc. | | | 1,599,500 | |
| | 35,000 | | | Hana Financial Group, Inc. | | | 787,915 | |
| | 86,000 | | | Mitsubishi UFJ Financial Group, Inc. | | | 420,381 | |
| | 193,000 | | | Regions Financial Corp. | | | 1,810,340 | |
| | 10,000 | | | Sumitomo Mitsui Financial Group, Inc. | | | 320,771 | |
| | 23,400 | | | Wells Fargo & Co. | | | 1,169,532 | |
| | | | | | | | 10,215,668 | |
| Beverages—0.7% | | | | |
| | 10,000 | | | Anheuser-Busch InBev NV—SP ADR | | | 1,241,800 | |
| Biotechnology—0.5% | | | | |
| | 9,000 | | | Gilead Sciences, Inc. | | | 793,890 | |
| Capital Markets—4.0% | | | | |
| | 20,000 | | | Amundi SA (a)(b) | | | 920,392 | |
| | 55,000 | | | Daiwa Securities Group, Inc. | | | 334,032 | |
| | 157,000 | | | Fortress Investment Group LLC—Class A | | | 780,290 | |
| | 21,000 | | | Lazard, Ltd.—Class A | | | 757,050 | |
| | 115,000 | | | Mediobanca SpA | | | 944,810 | |
| | 85,000 | | | OM Asset Management PLC | | | 1,140,700 | |
| | 25,000 | | | Schroders PLC | | | 918,333 | |
| | 13,500 | | | State Street Corp. | | | 841,050 | |
| | | | | | | | 6,636,657 | |
| Chemicals—2.1% | | | | |
| | 69,000 | | | Clariant AG (a) | | | 1,305,483 | |
| | 21,000 | | | Johnson Matthey PLC | | | 885,852 | |
| | 18,500 | | | Symrise AG | | | 1,225,674 | |
| | | | | | | | 3,417,009 | |
| Commercial Services & Supplies—0.5% | | | | |
| | 20,500 | | | ISS A/S | | | 778,405 | |
| Communications Equipment—3.1% | | | | |
| | 62,000 | | | Cisco Systems, Inc. | | | 1,704,380 | |
| | 26,300 | | | Harris Corp. | | | 2,104,263 | |
| | 237,000 | | | Nokia OYJ | | | 1,397,591 | |
| | | | | | | | 5,206,234 | |
| Shares | | Security
Description | | Value |
| | | | | |
| Common Stocks—continued | | | | |
| Construction & Engineering—3.6% | | | | |
| | 47,375 | | | Bouygues SA | | $ | 1,579,666 | |
| | 789,000 | | | China Railway Construction Corp., Ltd.—Class H | | | 1,010,039 | |
| | 75,500 | | | Ferrovial SA | | | 1,624,420 | |
| | 22,700 | | | Vinci SA | | | 1,695,760 | |
| | | | | | | | 5,909,885 | |
| Consumer Finance—1.1% | | | | |
| | 32,000 | | | Discover Financial Services | | | 1,800,640 | |
| Diversified Financial Services—0.7% | | | | |
| | 152,968 | | | Cerved Information Solutions SpA | | | 1,230,471 | |
| Electric Utilities—1.2% | | | | |
| | 17,000 | | | NextEra Energy, Inc. | | | 1,998,860 | |
| Electronic Equipment, Instruments & Components—1.0% | | | | |
| | 27,000 | | | TE Connectivity, Ltd. | | | 1,605,960 | |
| Energy Equipment & Services—0.6% | | | | |
| | 19,500 | | | Baker Hughes, Inc. | | | 943,020 | |
| Food & Staples Retailing—1.7% | | | | |
| | 27,500 | | | CVS Health Corp. | | | 2,763,750 | |
| Food Products—2.9% | | | | |
| | 26,000 | | | Mondelez International, Inc.—Class A | | | 1,116,960 | |
| | 23,500 | | | Nestle SA | | | 1,751,538 | |
| | 47,500 | | | Nomad Foods, Ltd. (a) | | | 386,650 | |
| | 20,500 | | | The Kraft Heinz Co. | | | 1,600,435 | |
| | | | | | | | 4,855,583 | |
| Gas Utilities—0.8% | | | | |
| | 322,000 | | | Infraestructura Energetica Nova SAB de CV | | | 1,256,022 | |
| Health Care Equipment & Supplies—2.2% | | | | |
| | 20,500 | | | Medtronic PLC | | | 1,622,575 | |
| | 17,500 | | | Zimmer Biomet Holdings, Inc. | | | 2,025,975 | |
| | | | | | | | 3,648,550 | |
| Health Care Providers & Services—3.4% | | | | |
| | 12,400 | | | HCA Holdings, Inc. (a) | | | 999,688 | |
| | 8,100 | | | Humana, Inc. | | | 1,434,267 | |
| | 7,185 | | | McKesson Corp. | | | 1,205,787 | |
| | 7,000 | | | UnitedHealth Group, Inc. | | | 921,760 | |
| | 7,800 | | | Universal Health Services, Inc.—Class B | | | 1,042,704 | |
| | | | | | | | 5,604,206 | |
| Hotels, Restaurants & Leisure—3.1% | | | | |
| | 36,000 | | | Aramark | | | 1,206,360 | |
| | 16,000 | | | Darden Restaurants, Inc. | | | 996,000 | |
| | 11,000 | | | InterContinental Hotels Group PLC | | | 438,623 | |
| | 10,000 | | | McDonald’s Corp. | | | 1,264,900 | |
| | 15,500 | | | Royal Caribbean Cruises, Ltd. | | | 1,199,700 | |
| | | | | | | | 5,105,583 | |
| Household Durables—0.8% | | | | |
| | 31,000 | | | Lennar Corp.—Class A | | | 1,404,610 | |
| Household Products—1.3% | | | | |
| | 68,558 | | | Svenska Cellulosa AB SCA—B Shares | | | 2,159,072 | |
The accompanying notes are an integral part of these financial statements.
44
Alpine Dynamic Dividend Fund
Schedule of Portfolio Investments—Continued
April 30, 2016 (Unaudited)
| Shares | | Security
Description | | Value |
| | | | | |
| Common Stocks—continued | | | | |
| Independent Power and Renewables—2.1% | | | | |
| | 45,619 | | | Abengoa Yield PLC | | $ | 822,511 | |
| | 105,500 | | | NRG Yield, Inc.—Class A | | | 1,596,215 | |
| | 51,000 | | | Pattern Energy Group, Inc. | | | 1,071,000 | |
| | | | | | | | 3,489,726 | |
| Industrial Conglomerates—0.4% | | | | |
| | 58,000 | | | CK Hutchison Holdings, Ltd. | | | 695,007 | |
| Insurance—1.4% | | | | |
| | 8,700 | | | Allianz SE | | | 1,476,857 | |
| | 13,000 | | | Endurance Specialty Holdings, Ltd. | | | 831,740 | |
| | | | | | | | 2,308,597 | |
| Internet Software & Services—0.5% | | | | |
| | 1,200 | | | Alphabet, Inc.—Class C (a) | | | 831,612 | |
| Life Sciences Tools & Services—1.0% | | | | |
| | 11,000 | | | Thermo Fisher Scientific, Inc. | | | 1,586,750 | |
| Machinery—1.4% | | | | |
| | 318,450 | | | CRRC Corp., Ltd.—Class H | | | 311,598 | |
| | 13,000 | | | Snap-on, Inc. | | | 2,070,640 | |
| | | | | | | | 2,382,238 | |
| Media—4.5% | | | | |
| | 34,500 | | | CBS Corp.—Class B | | | 1,928,895 | |
| | 15,500 | | | Comcast Corp.—Class A | | | 941,780 | |
| | 423,000 | | | ITV PLC | | | 1,391,886 | |
| | 265,193 | | | NOS SGPS SA | | | 1,902,426 | |
| | 164,000 | | | UBM PLC | | | 1,363,488 | |
| | | | | | | | 7,528,475 | |
| Multi-Utilities—2.7% | | | | |
| | 54,500 | | | CMS Energy Corp. | | | 2,217,060 | |
| | 91,000 | | | Veolia Environnement SA | | | 2,235,602 | |
| | | | | | | | 4,452,662 | |
| Multiline Retail—1.6% | | | | |
| | 32,500 | | | Dollar General Corp. | | | 2,662,075 | |
| Oil, Gas & Consumable Fuels—6.9% | | | | |
| | 18,000 | | | Anadarko Petroleum Corp. | | | 949,680 | |
| | 46,000 | | | BP PLC—SP ADR | | | 1,544,680 | |
| | 11,000 | | | Chevron Corp. | | | 1,123,980 | |
| | 34,000 | | | Enbridge, Inc. | | | 1,412,360 | |
| | 19,500 | | | EOG Resources, Inc. | | | 1,611,090 | |
| | 11,500 | | | Exxon Mobil Corp. | | | 1,016,600 | |
| | 65,000 | | | Kinder Morgan, Inc. | | | 1,154,400 | |
| | 43,500 | | | Marathon Petroleum Corp. | | | 1,699,980 | |
| | 12,500 | | | Occidental Petroleum Corp. | | | 958,125 | |
| | | | | | | | 11,470,895 | |
| Paper & Forest Products—1.6% | | | | |
| | 96,000 | | | Stora Enso OYJ—R Shares | | | 837,627 | |
| | 93,000 | | | UPM-Kymmene OYJ | | | 1,776,248 | |
| | | | | | | | 2,613,875 | |
| Personal Products—0.5% | | | | |
| | 20,000 | | | Unilever NV | | | 878,597 | |
| Pharmaceuticals—3.9% | | | | |
| | 28,500 | | | AstraZeneca PLC—SP ADR | | | 825,360 | |
| | 10,100 | | | Bayer AG | | | 1,165,175 | |
| | 17,300 | | | Novartis AG—SP ADR | | | 1,314,281 | |
| | 33,000 | | | Pfizer, Inc. | | | 1,079,430 | |
| | 37,300 | | | Teva Pharmaceutical Industries, Ltd.—SP ADR | | | 2,030,985 | |
| | | | | | | | 6,415,231 | |
| Shares | | Security
Description | | Value |
| | | | | |
| Common Stocks—continued | | | | |
| Real Estate Investment Trusts—5.4% | | | | |
| | 18,000 | | | American Tower Corp. | | $ | 1,887,840 | |
| | 1,700 | | | LaSalle Logiport REIT (a) | | | 1,623,308 | |
| | 62,500 | | | NorthStar Realty Europe Corp. | | | 745,625 | |
| | 77,500 | | | NorthStar Realty Finance Corp. | | | 991,225 | |
| | 646,000 | | | Prologis Property Mexico SA de CV | | | 1,020,555 | |
| | 55,500 | | | The Geo Group, Inc. | | | 1,777,665 | |
| | 113,000 | | | Westfield Corp. | | | 867,787 | |
| | | | | | | | 8,914,005 | |
| Real Estate Management & Development—2.1% | | | | |
| | 65,000 | | | Mitsui Fudosan Co., Ltd. | | | 1,664,708 | |
| | 35,000 | | | Nexity SA | | | 1,876,795 | |
| | | | | | | | 3,541,503 | |
| Road & Rail—3.5% | | | | |
| | 478,500 | | | Asciano, Ltd. | | | 3,212,596 | |
| | 5,700 | | | Canadian Pacific Railway, Ltd. | | | 822,225 | |
| | 8,500 | | | Kansas City Southern | | | 805,375 | |
| | 713,021 | | | Rumo Logistica Operadora Multimodal SA (a) | | | 887,324 | |
| | | | | | | | 5,727,520 | |
| Semiconductors & Semiconductor Equipment—2.6% | | | | |
| | 48,500 | | | Applied Materials, Inc. | | | 992,795 | |
| | 11,200 | | | Broadcom, Ltd. | | | 1,632,400 | |
| | 30,500 | | | Intel Corp. | | | 923,540 | |
| | 34,000 | | | SK Hynix, Inc. | | | 840,003 | |
| | | | | | | | 4,388,738 | |
| Specialty Retail—2.0% | | | | |
| | 21,000 | | | Dick’s Sporting Goods, Inc. | | | 973,140 | |
| | 9,400 | | | The Home Depot, Inc. | | | 1,258,566 | |
| | 13,600 | | | TJX Cos., Inc. | | | 1,031,152 | |
| | | | | | | | 3,262,858 | |
| Technology, Hardware, Storage & Peripherals—4.5% | | | | |
| | 25,000 | | | Apple, Inc. | | | 2,343,500 | |
| | 89,000 | | | EMC Corp. | | | 2,323,790 | |
| | 1,700 | | | Samsung Electronics Co., Ltd. | | | 1,857,557 | |
| | 21,500 | | | Western Digital Corp. | | | 878,597 | |
| | | | | | | | 7,403,444 | |
| Textiles, Apparel & Luxury Goods—0.7% | | | | |
| | 196,000 | | | ANTA Sports Products, Ltd. | | | 501,314 | |
| | 6,900 | | | Carter’s, Inc. | | | 736,023 | |
| | | | | | | | 1,237,337 | |
| Tobacco—0.5% | | | | |
| | 24,500 | | | Swedish Match AB | | | 777,061 | |
| Transportation Infrastructure—0.7% | | | | |
| | 345,300 | | | Adani Ports & Special Economic Zone, Ltd. | | | 1,238,197 | |
| Water Utilities—0.3% | | | | |
| | 5,900 | | | American Water Works Co., Inc. | | | 429,284 | |
| Wireless Telecommunication Services—1.2% | | | | |
| | 61,000 | | | Vodafone Group PLC—SP ADR | | | 1,997,140 | |
| | | | | Total Common Stocks
(Cost $161,753,660) | | | 164,967,830 | |
The accompanying notes are an integral part of these financial statements.
45
Alpine Dynamic Dividend Fund
Schedule of Portfolio Investments—Continued
April 30, 2016 (Unaudited)
| Shares | | Security
Description | | Value |
| | | | | |
| Equity-Linked Structured Notes—1.5% | | | | |
| Hotels, Restaurants & Leisure—0.5% | | | | |
| | 21,000 | | | InterContinental Hotels Group PLC—Morgan Stanley BV | | $ | 837,371 | |
| Media—0.6% | | | | |
| | 313,858 | | | ITV PLC— Merrill Lynch | | | 1,032,753 | |
| Tobacco—0.4% | | | | |
| | 19,342 | | | Swedish Match AB-Morgan Stanley BV | | | 613,466 | |
| | | | | Total Equity-Linked Structured Notes (Cost $2,574,756) | | | 2,483,590 | |
Principal
Amount | | Security
Description | | Value |
| | | | | | | | | |
| Convertible Bonds—0.0% (c) | | | | |
| Household Durables—0.0% (c) | | | | |
| $ | 791,393 | | | PDG Realty SA Empreendimentos e Participacoes—Series 8, 0.000%, 9/19/16 (Brazilian Real) (d)(e) | | $ | 2,301 | |
| | | | | Total Convertible Bonds
(Cost $283,909) | | | 2,301 | |
| Short-Term Investments—0.4% | | | | |
| | 695,000 | | | State Street Eurodollar Time Deposit, 0.01% | | | 695,000 | |
| | | | | Total Short-Term Investments
(Cost $695,000) | | | 695,000 | |
Total Investments
(Cost $165,307,325) (f) —101.5% | | | 168,148,721 | |
| Liabilities in Excess of Other Assets—(1.5)% | | | (2,543,133 | ) |
| TOTAL NET ASSETS 100.0% | | $ | 165,605,588 | |
Percentages are stated as a percent of net assets.
| (a) | Non-income producing security. |
| (b) | Restricted under Rule 144A of the Securities Act of 1933. These securities may be resold in transactions exempt from registration, normally to qualified institutional buyers. These securities have been determined to be liquid under guidelines established by the Board of Trustees. Liquid securities restricted under Rule 144A comprised 0.6% of the Fund’s net assets. |
| (c) | Amount is less than 0.05%. |
| (d) | Represents a zero-coupon bond. |
| (e) | Security fair valued in accordance with procedures approved by the Board of Trustees. These securities comprised 0.0% of the Fund’s net assets. |
| (f) | See Note 7 for the cost of investments for federal tax purposes. |
AB—Aktiebolag is the Swedish equivalent of a corporation.
AG—Aktiengesellschaft is a German term that refers to a corporation that is limited by shares, i.e., owned by shareholders.
A/S—Aktieselskab is the Danish term for a stock-based corporation.
BV—Besloten Vennootschap is the Dutch equivalent of a private limited liability company.
NV—Naamloze Vennootschap is the Dutch term for a public limited liability corporation.
NVDR—Non-Voting Depositary Receipts
PCL—Public Company Limited
PLC—Public Limited Company
SA—Generally designates corporations in various countries, mostly those employing the civil law.
SA de CV—Sociedad Anonima de Capital Variable is the Spanish equivalent to Variable Capital Company.
SCA—Societe en Commandite par actions is the French equivalent of a limited partnership.
SP ADR—Sponsored American Depositary Receipt
SpA—Societa’ Per Azioni is an Italian shared company.
The accompanying notes are an integral part of these financial statements.
46
Alpine Rising Dividend Fund
Schedule of Portfolio Investments
April 30, 2016 (Unaudited)
| Shares | | Security
Description | | Value |
| | | | | |
| Common Stocks—96.6% | | | | |
| Aerospace & Defense—2.7% | | | | |
| | 13,000 | | | Raytheon Co. | | $ | 1,642,550 | |
| | 7,000 | | | United Technologies Corp. | | | 730,590 | |
| | | | | | | | 2,373,140 | |
| Air Freight & Logistics—1.5% | | | | |
| | 8,000 | | | FedEx Corp. | | | 1,320,880 | |
| Auto Components—0.9% | | | | |
| | 20,000 | | | Magna International, Inc. | | | 840,400 | |
| Automobiles—1.5% | | | | |
| | 100,000 | | | Ford Motor Co. | | | 1,356,000 | |
| Banks—5.1% | | | | |
| | 22,500 | | | Citigroup, Inc. | | | 1,041,300 | |
| | 43,500 | | | Citizens Financial Group, Inc. | | | 993,975 | |
| | 33,500 | | | JPMorgan Chase & Co. | | | 2,117,200 | |
| | 3,000 | | | Signature Bank | | | 413,490 | |
| | | | | | | | 4,565,965 | |
| Beverages—1.0% | | | | |
| | 8,500 | | | PepsiCo, Inc. | | | 875,160 | |
| Biotechnology—3.1% | | | | |
| | 9,000 | | | Amgen, Inc. | | | 1,424,700 | |
| | 15,000 | | | Gilead Sciences, Inc. | | | 1,323,150 | |
| | | | | | | | 2,747,850 | |
| Capital Markets—3.3% | | | | |
| | 9,000 | | | Ameriprise Financial, Inc. | | | 863,100 | |
| | 25,000 | | | Lazard, Ltd.—Class A | | | 901,250 | |
| | 25,000 | | | NorthStar Asset Management Group, Inc. | | | 311,000 | |
| | 18,000 | | | Oaktree Capital Group LLC | | | 869,580 | |
| | | | | | | | 2,944,930 | |
| Chemicals—2.9% | | | | |
| | 5,000 | | | Air Products & Chemicals, Inc. | | | 729,450 | |
| | 10,000 | | | E.I. du Pont de Nemours & Co. | | | 659,100 | |
| | 11,000 | | | PPG Industries, Inc. | | | 1,214,290 | |
| | | | | | | | 2,602,840 | |
| Commercial Services & Supplies—2.4% | | | | |
| | 18,500 | | | Deluxe Corp. | | | 1,161,430 | |
| | 17,000 | | | Waste Management, Inc. | | | 999,430 | |
| | | | | | | | 2,160,860 | |
| Communications Equipment—2.2% | | | | |
| | 25,000 | | | Cisco Systems, Inc. | | | 687,250 | |
| | 18,000 | | | Juniper Networks, Inc. | | | 421,200 | |
| | 150,000 | | | Nokia OYJ—SP ADR | | | 880,500 | |
| | | | | | | | 1,988,950 | |
| Consumer Finance—2.1% | | | | |
| | 34,000 | | | Discover Financial Services | | | 1,913,180 | |
| Diversified Financial Services—1.0% | | | | |
| | 10,000 | | | CME Group, Inc. | | | 919,100 | |
| Diversified Telecommunication Services—2.9% | | | | |
| | 36,000 | | | AT&T, Inc. | | | 1,397,520 | |
| | 24,000 | | | Verizon Communications, Inc. | | | 1,222,560 | |
| | | | | | | | 2,620,080 | |
| Electric Utilities—1.5% | | | | |
| | 5,500 | | | NextEra Energy, Inc. | | | 646,690 | |
| | 9,000 | | | Pinnacle West Capital Corp. | | | 653,850 | |
| | | | | | | | 1,300,540 | |
| Electronic Equipment, Instruments & Components—1.3% | | | | |
| | 19,000 | | | TE Connectivity, Ltd. | | | 1,130,120 | |
| Shares | | Security
Description | | Value |
| | | | | |
| Common Stocks—continued | | | | |
| Energy Equipment & Services—1.1% | | | | |
| | 12,000 | | | Schlumberger, Ltd. | | $ | 964,080 | |
| Food & Staples Retailing—5.4% | | | | |
| | 6,000 | | | Casey’s General Stores, Inc. | | | 672,000 | |
| | 21,000 | | | CVS Health Corp. | | | 2,110,500 | |
| | 50,000 | | | Safeway, Inc. (a)(b) | | | 23,933 | |
| | 19,000 | | | The Kroger Co. | | | 672,410 | |
| | 17,000 | | | Walgreens Boots Alliance, Inc. | | | 1,347,760 | |
| | | | | | | | 4,826,603 | |
| Food Products—0.7% | | | | |
| | 15,000 | | | ConAgra Foods, Inc. | | | 668,400 | |
| Health Care Equipment & Supplies—4.1% | | | | |
| | 22,000 | | | Abbott Laboratories | | | 855,800 | |
| | 6,000 | | | Becton, Dickinson & Co. | | | 967,560 | |
| | 16,000 | | | Zimmer Biomet Holdings, Inc. | | | 1,852,320 | |
| | | | | | | | 3,675,680 | |
| Health Care Providers & Services—3.3% | | | | |
| | 10,500 | | | Aetna, Inc. | | | 1,178,835 | |
| | 10,000 | | | AmerisourceBergen Corp. | | | 851,000 | |
| | 5,600 | | | McKesson Corp. | | | 939,792 | |
| | | | | | | | 2,969,627 | |
| Hotels, Restaurants & Leisure—2.1% | | | | |
| | 55,000 | | | Hilton Worldwide Holdings, Inc. | | | 1,212,750 | |
| | 5,000 | | | McDonald’s Corp. | | | 632,450 | |
| | | | | | | | 1,845,200 | |
| Household Products—1.2% | | | | |
| | 13,000 | | | The Procter & Gamble Co. | | | 1,041,560 | |
| Insurance—3.0% | | | | |
| | 27,000 | | | MetLife, Inc. | | | 1,217,700 | |
| | 34,000 | | | The Hartford Financial Services Group, Inc. | | | 1,508,920 | |
| | | | | | | | 2,726,620 | |
| Internet Software & Services—1.7% | | | | |
| | 1,100 | | | Alphabet, Inc.—Class A | | | 778,668 | |
| | 1,100 | | | Alphabet, Inc.—Class C | | | 762,311 | |
| | | | | | | | 1,540,979 | |
| IT Services—0.6% | | | | |
| | 3,500 | | | International Business Machines Corp. | | | 510,790 | |
| Machinery—1.3% | | | | |
| | 10,000 | | | Ingersoll-Rand PLC | | | 655,400 | |
| | 3,000 | | | Snap-on, Inc. | | | 477,840 | |
| | | | | | | | 1,133,240 | |
| Media—4.8% | | | | |
| | 33,000 | | | CBS Corp.—Class B | | | 1,845,030 | |
| | 31,000 | | | Cinemark Holdings, Inc. | | | 1,074,150 | |
| | 22,300 | | | Comcast Corp.—Class A | | | 1,354,948 | |
| | | | | | | | 4,274,128 | |
| Multi-Utilities—1.0% | | | | |
| | 11,000 | | | CMS Energy Corp. | | | 447,480 | |
| | 8,000 | | | WEC Energy Group, Inc. | | | 465,680 | |
| | | | | | | | 913,160 | |
| Oil, Gas & Consumable Fuels—5.6% | | | | |
| | 23,000 | | | BP PLC—SP ADR | | | 772,340 | |
| | 12,000 | | | Enbridge, Inc. | | | 498,480 | |
| | 18,000 | | | Exxon Mobil Corp. | | | 1,591,200 | |
| | 30,000 | | | Marathon Petroleum Corp. | | | 1,172,400 | |
| | 13,000 | | | Occidental Petroleum Corp. | | | 996,450 | |
| | | | | | | | 5,030,870 | |
The accompanying notes are an integral part of these financial statements.
47
Alpine Rising Dividend Fund
Schedule of Portfolio Investments—Continued
April 30, 2016 (Unaudited)
| Shares | | Security
Description | | Value |
| | | | | |
| Common Stocks—continued | | | | |
| Pharmaceuticals—6.0% | | | | |
| | 1,000 | | | Allergan PLC | | $ | 216,560 | |
| | 13,000 | | | Johnson & Johnson | | | 1,457,040 | |
| | 58,000 | | | Pfizer, Inc. | | | 1,897,180 | |
| | 33,000 | | | Teva Pharmaceutical Industries, Ltd.—SP ADR | | | 1,796,850 | |
| | | | | | | | 5,367,630 | |
| Real Estate Investment Trusts—2.6% | | | | |
| | 3,000 | | | Boston Properties, Inc. | | | 386,580 | |
| | 20,000 | | | Colony Starwood Homes | | | 487,400 | |
| | 30,000 | | | NorthStar Realty Europe Corp. | | | 357,900 | |
| | 30,000 | | | NorthStar Realty Finance Corp. | | | 383,700 | |
| | 3,500 | | | Simon Property Group, Inc. | | | 704,095 | |
| | | | | | | | 2,319,675 | |
| Road & Rail—2.1% | | | | |
| | 2,700 | | | AMERCO | | | 950,400 | |
| | 35,000 | | | CSX Corp. | | | 954,450 | |
| | | | | | | | 1,904,850 | |
| Semiconductors & Semiconductor Equipment—4.0% | | | | |
| | 42,000 | | | Applied Materials, Inc. | | | 859,740 | |
| | 6,000 | | | Broadcom, Ltd. | | | 874,500 | |
| | 28,000 | | | Intel Corp. | | | 847,840 | |
| | 20,000 | | | QUALCOMM, Inc. | | | 1,010,400 | |
| | | | | | | | 3,592,480 | |
| Software—2.1% | | | | |
| | 33,000 | | | Oracle Corp. | | | 1,315,380 | |
| | 36,500 | | | Symantec Corp. | | | 607,543 | |
| | | | | | | | 1,922,923 | |
| Specialty Retail—3.6% | | | | |
| | 15,000 | | | Lowe’s Cos., Inc. | | | 1,140,300 | |
| | 11,500 | | | TJX Cos., Inc. | | | 871,930 | |
| | 21,000 | | | Williams-Sonoma, Inc. | | | 1,234,380 | |
| | | | | | | | 3,246,610 | |
| Shares | | Security
Description | | Value |
| | | | | |
| Common Stocks—continued | | | |
| Technology, Hardware, Storage & Peripherals—4.9% | | | | |
| | 30,000 | | | Apple, Inc. | | $ | 2,812,200 | |
| | 33,000 | | | EMC Corp. | | | 861,630 | |
| | 18,000 | | | Western Digital Corp. | | | 735,570 | |
| | | | | | | | 4,409,400 | |
| | | | | Total Common Stocks
(Cost $78,570,510) | | | 86,544,500 | |
| | | | | | | | | |
| Contract | | | | | | |
| Amount | | | | | | |
| Put Options Purchased—0.0% (c) | | | | |
| Diversified Financials—0.0% (c) | | | | |
| | 23,500 | | | SPDR S&P 500 ETF Trust, Expiration Date 05/20/2016, Strike Price $202.00 | | | 31,490 | |
| | | | | Total Put Options Purchased
(Cost $70,745) | | | 31,490 | |
| | | | | | | | | |
| Principal | | | | | | |
| Amount | | | | | | |
| Short-Term Investments—3.3% | | | | |
| $ | 2,936,000 | | | State Street Eurodollar Time Deposit, 0.01% | | | 2,936,000 | |
| | | | | Total Short-Term Investments
(Cost $2,936,000) | | | 2,936,000 | |
| Total Investments | | | | |
| (Cost $81,577,255) (d)—99.9% | | | 89,511,990 | |
| Other Assets in Excess of Liabilities—0.1% | | | 128,445 | |
| TOTAL NET ASSETS 100.0% | | $ | 89,640,435 | |
Percentages are stated as a percent of net assets.
| (a) | Non-income producing security. |
| (b) | Security fair valued in accordance with procedures approved by the Board of Trustees. These securities comprised 0.0% of the Fund’s net assets. |
| (c) | Amount is less than 0.05%. |
| (d) | See Note 7 for the cost of investments for federal tax purposes. |
OYJ—Osakeyhtio is the Finnish equivalent of a limited company.
PLC—Public Limited Company
SP ADR—Sponsored American Depositary Receipt
The accompanying notes are an integral part of these financial statements.
48
Alpine Financial Services Fund
Schedule of Portfolio Investments
April 30, 2016 (Unaudited)
| Shares | | | Security
Description | | Value | |
| | | | | | | | | |
| Common Stocks—99.4% | | | | |
| Banks—46.5% | | |
| | 3,500 | | | 1st Constitution Bancorp (a) | | $ | 43,890 | |
| | 4,000 | | | Banc of California, Inc. | | | 81,400 | |
| | 16,000 | | | Bank of Commerce Holdings | | | 100,480 | |
| | 2,000 | | | Bankwell Financial Group, Inc. | | | 41,400 | |
| | 8,000 | | | BNC Bancorp | | | 178,880 | |
| | 8,000 | | | Bryn Mawr Bank Corp. | | | 227,360 | |
| | 5,000 | | | Carolina Trust Bank (a) | | | 30,500 | |
| | 13,000 | | | CenterState Banks, Inc. | | | 211,770 | |
| | 5,000 | | | CIT Group, Inc. | | | 172,850 | |
| | 7,000 | | | Citigroup, Inc. | | | 323,960 | |
| | 14,000 | | | Citizens Financial Group, Inc. | | | 319,900 | |
| | 3,000 | | | Citizens First Corp. | | | 42,405 | |
| | 4,000 | | | Comerica, Inc. | | | 177,600 | |
| | 5,000 | | | ConnectOne Bancorp, Inc. | | | 86,050 | |
| | 7,000 | | | CU Bancorp (a) | | | 161,280 | |
| | 6,000 | | | East West Bancorp, Inc. | | | 224,940 | |
| | 10,000 | | | FCB Financial Holdings, Inc.—Class A (a) | | | 349,500 | |
| | 5,000 | | | First Business Financial Services, Inc. | | | 126,550 | |
| | 5,000 | | | First Internet Bancorp | | | 124,000 | |
| | 9,000 | | | First Merchants Corp. | | | 230,850 | |
| | 15,000 | | | FNB Corp. | | | 198,300 | |
| | 5,500 | | | Great Western Bancorp, Inc. | | | 173,360 | |
| | 10,000 | | | Green Bancorp, Inc. (a) | | | 81,600 | |
| | 3,500 | | | IBERIABANK Corp. | | | 206,465 | |
| | 9,000 | | | Investar Holding Corp. | | | 136,710 | |
| | 4,000 | | | JPMorgan Chase & Co. | | | 252,800 | |
| | 20,000 | | | KeyCorp | | | 245,800 | |
| | 20,000 | | | Mitsubishi UFJ Financial Group, Inc. | | | 97,763 | |
| | 30,000 | | | Mizuho Financial Group, Inc. | | | 47,312 | |
| | 8,000 | | | National Bank Holdings Corp.—Class A | | | 159,920 | |
| | 5,000 | | | Pacific Mercantile Bancorp (a) | | | 37,550 | |
| | 9,000 | | | Pacific Premier Bancorp, Inc. (a) | | | 209,340 | |
| | 3,000 | | | Popular, Inc. | | | 89,160 | |
| | 5,000 | | | Preferred Bank | | | 158,800 | |
| | 1,500 | | | Prosperity Bancshares, Inc. | | | 79,155 | |
| | 20,000 | | | Regions Financial Corp. | | | 187,600 | |
| | 10,000 | | | Republic First Bancorp, Inc. (a) | | | 46,500 | |
| | 4,000 | | | SB Financial Group, Inc. | | | 42,680 | |
| | 4,500 | | | Shore Bancshares, Inc. | | | 52,830 | |
| | 1,000 | | | Southeastern Bank Financial Corp. | | | 33,340 | |
| | 4,950 | | | Southern National Bancorp of Virginia, Inc. | | | 60,885 | |
| | 1,500 | | | Southside Bancshares, Inc. | | | 43,815 | |
| | 12,000 | | | Sterling Bancorp | | | 196,080 | |
| | 4,000 | | | Stonegate Bank | | | 126,000 | |
| | 1,500 | | | Sumitomo Mitsui Financial Group, Inc. | | | 48,116 | |
| | 4,000 | | | Summit State Bank | | | 56,500 | |
| | 1,500 | | | SVB Financial Group (a) | | | 156,420 | |
| | 6,000 | | | Synovus Financial Corp. | | | 186,960 | |
| | 15,000 | | | TCF Financial Corp. | | | 204,600 | |
| | 12,000 | | | United Community Banks, Inc. | | | 241,560 | |
| | 17,000 | | | Valley National Bancorp | | | 160,820 | |
| | 3,000 | | | Washington Trust Bancorp, Inc. | | | 109,890 | |
| | 5,000 | | | Webster Financial Corp. | | | 183,200 | |
| | 4,500 | | | Wells Fargo & Co. | | | 224,910 | |
| | | | | | | | 7,792,306 | |
| Shares | | | Security
Description | | Value | |
| | | | | | | | | |
| Common Stocks—continued | | | | |
| Capital Markets—18.8% | | | |
| | 1,500 | | | Affiliated Managers Group, Inc. (a) | | $ | 255,480 | |
| | 5,500 | | | American Capital, Ltd. (a) | | | 86,900 | |
| | 2,300 | | | Ameriprise Financial, Inc. | | | 220,570 | |
| | 10,000 | | | Apollo Global Management LLC—Class A | | | 169,100 | |
| | 20,000 | | | BGC Partners, Inc.—Class A | | | 181,600 | |
| | 8,000 | | | Garrison Capital, Inc. | | | 84,000 | |
| | 7,500 | | | Invesco, Ltd. | | | 232,575 | |
| | 12,000 | | | KKR & Co. LP | | | 163,200 | |
| | 5,000 | | | Lazard, Ltd.—Class A | | | 180,250 | |
| | 5,000 | | | Moelis & Co.—Class A | | | 140,550 | |
| | 9,000 | | | Morgan Stanley | | | 243,540 | |
| | 10,000 | | | NorthStar Asset Management Group, Inc. | | | 124,400 | |
| | 13,000 | | | OM Asset Management PLC | | | 174,460 | |
| | 4,000 | | | PJT Partners, Inc.—Class A | | | 89,280 | |
| | 4,000 | | | Raymond James Financial, Inc. | | | 208,680 | |
| | 5,000 | | | Solar Capital, Ltd. | | | 88,150 | |
| | 1,500 | | | State Street Corp. | | | 93,450 | |
| | 9,000 | | | The Blackstone Group LP | | | 246,960 | |
| | 6,000 | | | The Charles Schwab Corp. | | | 170,460 | |
| | | | | | | | 3,153,605 | |
| Consumer Finance—3.4% | | | |
| | 15,000 | | | Ally Financial, Inc. (a) | | | 267,150 | |
| | 5,500 | | | Discover Financial Services | | | 309,485 | |
| | | | | | | | 576,635 | |
| Diversified Financial Services—1.8% | | | |
| | 700 | | | Intercontinental Exchange, Inc. | | | 168,021 | |
| | 3,000 | | | Marlin Business Services Corp. | | | 44,370 | |
| | 15,000 | | | Resource America, Inc.—Class A | | | 94,800 | |
| | | | | | | | 307,191 | |
| Insurance—5.2% | | |
| | 3,000 | | | American International Group, Inc. | | | 167,460 | |
| | 5,000 | | | CNA Financial Corp. | | | 158,000 | |
| | 6,000 | | | FNF Group | | | 191,400 | |
| | 4,000 | | | MetLife, Inc. | | | 180,400 | |
| | 5,000 | | | Unum Group | | | 171,050 | |
| | | | | | | | 868,310 | |
| IT Services—1.3% | | | | |
| | 2,500 | | | Fidelity National Information Services, Inc. | | | 164,500 | |
| | 8,000 | | | MoneyGram International, Inc. (a) | | | 49,200 | |
| | | | | | | | 213,700 | |
| Real Estate Investment Trusts—9.8% | | | | |
| | 17,000 | | | Anworth Mortgage Asset Corp. | | | 80,240 | |
| | 7,000 | | | Blackstone Mortgage Trust, Inc.—Class A | | | 192,360 | |
| | 12,500 | | | Colony Capital, Inc.—Class A | | | 221,000 | |
| | 10,000 | | | Colony Starwood Homes | | | 243,700 | |
| | 22,000 | | | Five Oaks Investment Corp. | | | 133,100 | |
| | 7,000 | | | Ladder Capital Corp. | | | 83,370 | |
| | 8,000 | | | New Residential Investment Corp. | | | 96,800 | |
| | 8,000 | | | NorthStar Realty Europe Corp. | | | 95,440 | |
| | 10,000 | | | NorthStar Realty Finance Corp. | | | 127,900 | |
| | 9,000 | | | Owens Realty Mortgage, Inc. | | | 147,960 | |
| | 6,000 | | | PennyMac Mortgage Investment Trust | | | 81,540 | |
| | 7,500 | | | Starwood Property Trust, Inc. | | | 145,200 | |
| | | | | | | | 1,648,610 | |
The accompanying notes are an integral part of these financial statements.
49
Alpine Financial Services Fund
Schedule of Portfolio Investments—Continued
April 30, 2016 (Unaudited)
| Shares | | | Security
Description | | Value | |
| | | | | | | | | |
| Common Stocks—continued | | | | |
| Real Estate Management & Development—1.5% | | | | |
| | 12,000 | | | Kennedy-Wilson Holdings, Inc. | | $ | 259,320 | |
| Technology, Hardware, Storage & Peripherals—0.8% | | | | |
| | 16,000 | | | CPI Card Group, Inc. | | | 126,880 | |
| Thrifts & Mortgage Finance—10.3% | | | | |
| | 7,500 | | | Atlantic Coast Financial Corp. (a) | | | 48,150 | |
| | 5,500 | | | BankUnited, Inc. | | | 189,750 | |
| | 7,000 | | | Berkshire Hills Bancorp, Inc. | | | 189,980 | |
| | 18,000 | | | Brookline Bancorp, Inc. | | | 204,840 | |
| | 35,000 | | | Central Federal Corp. (a) | | | 48,650 | |
| | 8,000 | | | Dime Community Bancshares, Inc. | | | 144,880 | |
| | 8,823 | | | HopFed Bancorp, Inc. | | | 99,259 | |
| | 40,000 | | | NMI Holdings, Inc.—Class A (a) | | | 251,600 | |
| | 9,000 | | | OceanFirst Financial Corp. | | | 175,320 | |
| | 12,000 | | | PennyMac Financial Services, Inc.—Class A (a) | | | 152,880 | |
| | 4,500 | | | Provident Financial Holdings, Inc. | | | 77,850 | |
| | 7,000 | | | Radian Group, Inc. | | | 89,530 | |
| | 11,000 | | | Riverview Bancorp, Inc. | | | 47,960 | |
| | | | | | | | 1,720,649 | |
| | | | | Total Common Stocks
(Cost $15,414,075) | | | 16,667,206 | |
Percentages are stated as a percent of net assets.
| (a) | Non-income producing security. |
| (b) | See Note 7 for the cost of investments for federal tax purposes. |
| PLC—Public Limited Company |
| | Principal
Amount | | | Security
Description | | Value | |
| | | | | | | | | |
| Short-Term Investments—1.8% | | | | |
| $ | 297,000 | | | State Street Eurodollar Time Deposit, 0.01% | | $ | 297,000 | |
| | | | | Total Short-Term Investments
(Cost $297,000) | | | 297,000 | |
Total Investments
(Cost $15,711,075) (b)—101.2% | | | 16,964,206 | |
| Liabilities in Excess of Other Assets—(1.2)% | | | (194,058 | ) |
| TOTAL NET ASSETS 100.0% | | $ | 16,770,148 | |
The accompanying notes are an integral part of these financial statements.
50
Alpine Small Cap Fund
Schedule of Portfolio Investments
April 30, 2016 (Unaudited)
| Shares | | | Security
Description | | Value | |
| | | | | | | | | |
| Common Stocks—89.3% | | | | |
| Aerospace & Defense—3.3% | | | | |
| | 8,009 | | | HEICO Corp.—Class A | | $ | 409,901 | |
| Banks—2.4% | | | | |
| | 11,236 | | | Enterprise Financial Services Corp. | | | 307,529 | |
| Biotechnology—2.0% | | | | |
| | 2,082 | | | Ligand Pharmaceuticals, Inc. (a) | | | 251,651 | |
| Building Products—4.0% | | | | |
| | 10,892 | | | Patrick Industries, Inc. (a) | | | 499,398 | |
| Chemicals—1.6% | | | | |
| | 33,008 | | | AgroFresh Solutions, Inc. (a) | | | 205,640 | |
| Construction & Engineering—4.3% | | | | |
| | 7,732 | | | Dycom Industries, Inc. (a) | | | 545,879 | |
| Construction Materials—2.2% | | | | |
| | 4,513 | | | U.S. Concrete, Inc. (a) | | | 278,723 | |
| Consumer Finance—3.2% | | | | |
| | 11,978 | | | PRA Group, Inc. (a) | | | 397,430 | |
| Diversified Consumer Services—0.6% | | | | |
| | 6,458 | | | Liberty Tax, Inc. | | | 77,173 | |
| Electronic Equipment, Instruments & Components—2.5% | | | | |
| | 5,514 | | | Rogers Corp. (a) | | | 316,283 | |
| Food Products—2.5% | | | | |
| | 38,025 | | | Nomad Foods, Ltd. (a) | | | 309,523 | |
| Health Care Equipment & Supplies—2.2% | | | | |
| | 2,736 | | | ICU Medical, Inc. (a) | | | 271,794 | |
| Health Care Providers & Services—6.6% | | | | |
| | 5,334 | | | ExamWorks Group, Inc. (a) | | | 192,291 | |
| | 10,595 | | | National Research Corp.—Class B | | | 394,664 | |
| | 4,968 | | | The Providence Service Corp. (a) | | | 247,605 | |
| | | | | | | | 834,560 | |
| Health Care Technology—1.3% | | | | |
| | 5,165 | | | Press Ganey Holdings, Inc. (a) | | | 157,378 | |
| Hotels, Restaurants & Leisure—3.5% | | | | |
| | 8,287 | | | Popeyes Louisiana Kitchen, Inc. (a) | | | 445,509 | |
| Household Durables—2.3% | | | | |
| | 3,281 | | | Cavco Industries, Inc. (a) | | | 287,711 | |
| Insurance—6.1% | | | | |
| | 17,025 | | | Greenlight Capital Re, Ltd.—Class A (a) | | | 366,548 | |
| | 8,165 | | | Primerica, Inc. | | | 404,658 | |
| | | | | | | | 771,206 | |
| Internet Software & Services—1.0% | | | | |
| | 7,159 | | | NIC, Inc. | | | 126,786 | |
| IT Services—4.1% | | | |
| | 13,218 | | | Cardtronics, Inc. (a) | | | 521,054 | |
| Shares | | | Security
Description | | Value | |
| | | | | | | | | |
| Life Sciences Tools & Services—2.4% | | | | |
| | 6,156 | | | INC Research Holdings, Inc.—Class A (a) | | $ | 296,288 | |
| Media—7.1% | | | | |
| | 17,058 | | | Live Nation Entertainment, Inc. (a) | | | 366,406 | |
| | 10,222 | | | Nexstar Broadcasting Group, Inc.—Class A | | | 524,695 | |
| | | | | | | | 891,101 | |
| Oil, Gas & Consumable Fuels—0.8% | | | | |
| | 16,601 | | | Scorpio Tankers, Inc. | | | 103,922 | |
| Pharmaceuticals—2.2% | | | | |
| | 15,677 | | | Depomed, Inc. (a) | | | 272,466 | |
| Real Estate Investment Trusts—2.4% | | | | |
| | 25,897 | | | Altisource Residential Corp. | | | 300,923 | |
| Real Estate Management & Development—3.9% | | | | |
| | 22,460 | | | Kennedy-Wilson Holdings, Inc. | | | 485,361 | |
| Road & Rail—1.0% | | | | |
| | 4,782 | | | Knight Transportation, Inc. | | | 127,058 | |
| Software—8.5% | | | | |
| | 4,954 | | | Fair Isaac Corp. | | | 528,641 | |
| | 7,654 | | | Fleetmatics Group PLC (a) | | | 277,458 | |
| | 14,232 | | | The Descartes Systems Group, Inc. (a) | | | 262,153 | |
| | | | | | | | 1,068,252 | |
| Thrifts & Mortgage Finance—5.3% | | | | |
| | 15,490 | | | Essent Group, Ltd. (a) | | | 316,306 | |
| | 6,934 | | | Meta Financial Group, Inc. | | | 344,065 | |
| | | | | | | | 660,371 | |
| | | | | Total Common Stocks
(Cost $11,166,485) | | | 11,220,870 | |
| | | | | | | | | |
Principal
Amount | | | | | | | |
| Short-Term Investments—11.8% | | | | |
| $ | 1,475,000 | | | State Street Eurodollar Time Deposit, 0.01% | | | 1,475,000 | |
| | | | | Total Short-Term Investments
(Cost $1,475,000) | | | 1,475,000 | |
Total Investments
(Cost $12,641,485) (b)—101.1% | | | 12,695,870 | |
| Liabilities in Excess of Other Assets—(1.1)% | | | (134,179 | ) |
| TOTAL NET ASSETS 100.0% | | $ | 12,561,691 | |
Percentages are stated as a percent of net assets.
(a) Non-income producing security.
(b) See Note 7 for the cost of investments for federal tax purposes.
PLC—Public Limited Company
The accompanying notes are an integral part of these financial statements.
51
Alpine Ultra Short Municipal Income Fund
Schedule of Portfolio Investments
April 30, 2016 (Unaudited)
Principal
Amount | | | Security
Description | | Value | |
| | | | | | | | | |
| Municipal Bonds—106.9% | | | | |
| Alabama—3.5% | | | | |
| $ | 3,781,000 | | | Alabama Housing Finance Authority, Multi-Family Housing, Phoenix Apartments Project—Series A
(LOC: Regions Bank)
0.800%, 01/01/2036
(Putable on 05/05/2016) (a) | | $ | 3,781,000 | |
| | 7,030,000 | | | Chatom Industrial Development Board Gulf Opportunity Zone Revenue, National Rural Utilities Finance—Series A
0.850%, 11/15/2038
(Putable on 05/15/2016) (a) | | | 7,029,648 | |
| | 2,000,000 | | | Chatom Industrial Development Board Pollution Control Revenue, National Rural Utilities Finance—Series C
0.850%, 12/01/2024
(Putable on 06/01/2016) (a) | | | 1,999,620 | |
| | 1,650,000 | | | Chatom Industrial Development Board Revenue, National Rural Utilities Finance—Series A
1.000%, 08/01/2037
(Putable on 08/01/2016) (a) | | | 1,649,390 | |
| | 12,000,000 | | | Health Care Authority for Baptist Health Revenue—Series B
0.700%, 11/01/2042
(Putable on 05/05/2016) (a) | | | 12,000,000 | |
| | 1,900,000 | | | Health Care Authority for Baptist Health Revenue—Series B
(CS: Assured Guaranty Municipal)
1.250%, 11/15/2037
(Putable on 05/06/2016) (a) | | | 1,900,000 | |
| | 7,300,000 | | | Tuscaloosa County Industrial Development Authority
0.830%, 09/01/2020
(Putable on 05/04/2016) (a) | | | 7,300,000 | |
| | | | | | | | 35,659,658 | |
| Arizona—7.8% | | | | |
| | 15,400,000 | | | Cochise County Pollution Control Corp. Revenue, Arizona Electric Power Cooperative, Inc. Project
1.050%, 09/01/2024
(Putable on 09/01/2016) (a) | | | 15,389,990 | |
| | 62,000,000 | | | Phoenix Industrial Development Authority, Solid Waste Revenue, Republic Services, Inc. Project
0.650%, 12/01/2035
(Putable on 05/02/2016) (a) | | | 62,000,000 | |
| | 1,400,000 | | | Scottsdale Industrial Development Authority, Hospital Revenue Bonds, Scottsdale Healthcare—Series F
(CS: Assured Guaranty Municipal)
0.600%, 09/01/2045
(Putable on 05/03/2016) (a) | | | 1,400,000 | |
| | | | | | | | 78,789,990 | |
Principal
Amount | | | Security
Description | | Value | |
| | | | | | | | | |
| Municipal Bonds—continued | | | | |
| Arkansas—0.8% | | | | |
| $ | 8,500,000 | | | City of Blytheville Revenue, Nucor Corp. Project
0.750%, 01/02/2033
(Putable on 05/04/2016) (a) | | $ | 8,500,000 | |
| California—5.9% | | | | |
| | 3,500,000 | | | California Pollution Control Financing Authority, Solid Waste Disposal Revenue, Waste Management Inc. Project—Series A
1.650%, 07/01/2031
(Putable on 05/01/2017) (a) | | | 3,505,005 | |
| | 10,000,000 | | | California Pollution Control Financing Authority, Solid Waste Disposal Revenue, Waste Management, Inc. Project—Series A
0.750%, 11/01/2038
(Putable on 05/02/2016) (a) | | | 10,000,000 | |
| | 750,000 | | | California State Public Works Board Lease Revenue, Department of Corrections—Series A
5.250%, 09/01/2016 | | | 752,662 | |
| | 655,000 | | | California Statewide Communities Development Authority Industrial Development Revenue- Spratling-Cranor Properties LLC—Series A
(LOC: City National Bank)
1.650%, 06/01/2020
(Putable on 05/04/2016) (a) | | | 655,000 | |
| | 560,000 | | | City of La Verne, Brethren Hillcrest Homes
3.000%, 05/15/2016 | | | 560,291 | |
| | 15,300,000 | | | Palomar Pomerado Health Care—Series A, ARN
(CS: Assured Guaranty Municipal)
1.500%, 11/01/2036
(Putable on 05/03/2016) (a) | | | 15,300,000 | |
| | 14,300,000 | | | Palomar Pomerado Health Care—Series B, ARN
(CS: Assured Guaranty Municipal)
1.750%, 11/01/2036
(Putable on 05/04/2016) (a) | | | 14,300,000 | |
| | 13,900,000 | | | Palomar Pomerado Health Care—Series C, ARN
(CS: Assured Guaranty Municipal)
1.700%, 11/01/2036
(Putable on 05/05/2016) (a) | | | 13,900,000 | |
| | 440,000 | | | Washington Township Health Care District Revenue—Series A
4.000%, 07/01/2016 | | | 442,108 | |
| | 150,000 | | | Yuba City Redevelopment Agency, Refunding Tax Allocation
2.000%, 09/01/2016 | | | 150,474 | |
| | | | | | | | 59,565,540 | |
| Colorado—0.1% | | | | |
| | 550,000 | | | Colorado Health Facilities Authority, Covenant Retire Community Obligation
2.000%, 12/01/2016 | | | 552,920 | |
The accompanying notes are an integral part of these financial statements.
52
Alpine Ultra Short Municipal Income Fund
Schedule of Portfolio Investments—Continued
April 30, 2016 (Unaudited)
Principal
Amount | | | Security
Description | | Value | |
| | | | | | | | | |
| Municipal Bonds—continued | | | | |
| Colorado—continued | | | | |
| $ | 235,000 | | | E-470 Public Highway Authority— Series D1
(CS: NATL-RE)
5.250%, 09/01/2016 | | $ | 238,556 | |
| | | | | | | | 791,476 | |
| Connecticut—0.4% | | | | |
| | 1,000,000 | | | City of Groton, Bond Anticipation Notes
2.000%, 10/05/2016 | | | 1,004,490 | |
| | 3,465,000 | | | City of New Britain, Bond Anticipation Notes
2.000%, 03/23/2017 | | | 3,500,828 | |
| | | | | | | | 4,505,318 | |
| Delaware—1.1% | | | | |
| | 11,400,000 | | | Delaware State Economic Development Authority, VAR-Gas Facilities-Delmarva Power & Light
0.710%, 10/01/2029
(Putable on 05/02/2016) (a) | | | 11,400,000 | |
| Florida—3.9% | | | | |
| | 300,000 | | | City of Tallahassee Revenue, Tallahassee Memorial Healthcare, Inc. Project—Series A
5.000%, 12/01/2016 | | | 307,020 | |
| | 27,100,000 | | | Florida Development Finance Corp., Healthcare Facilities Revenue, UF Health-Jacksonville Project—Series B
1.050%, 02/01/2029
(Putable on 05/05/2016) (a) | | | 27,100,000 | |
| | 11,355,000 | | | Miami-Dade County Expressway Authority Toll System Revenue—Series DCL-2012-005
(CS: AMBAC; LOC: Dexia Credit Local)
0.837%, (US0001M*1+ 40.000 bps) 05/20/2029
(Putable on 05/02/2016) (a)(b) | | | 11,355,000 | |
| | 200,000 | | | Mid-Bay Bridge Authority—Series C
5.000%, 10/01/2016 | | | 203,208 | |
| | | | | | | | 38,965,228 | |
| Georgia—0.1% | | | | |
| | 800,000 | | | Douglas County Development Authority, Electrical Fiber Systems Project
(LOC: Regions Bank)
0.890%, 12/01/2021
(Putable on 05/05/2016) (a) | | | 800,000 | |
| Illinois—5.9% | | | | |
| | 33,470,000 | | | Chicago Board of Education—Series-DCL-2012-001
(LOC: Dexia Credit Local)
1.000%, 12/01/2034
(Putable on 05/05/2016) (a)(b) | | | 33,470,000 | |
| | 2,285,000 | | | Chicago Board of Education, General Obligation—Series B
(CS: Assured Guaranty Municipal)
5.000%, 12/01/2016 | | | 2,343,153 | |
Principal
Amount | | | Security
Description | | Value | |
| | | | | | | | | |
| Municipal Bonds—continued | | | | |
| Illinois—continued | | | | |
| $ | 200,000 | | | City of Chicago
5.500%, 01/01/2017 | | $ | 205,256 | |
| | 1,250,000 | | | City of Chicago IL Wastewater Transmission Revenue, Second Lien—Series C
4.000%, 01/01/2017 | | | 1,271,625 | |
| | 140,000 | | | Cook County, High School District No. 202, Evanston Township
4.000%, 12/01/2016 | | | 142,523 | |
| | 80,000 | | | Elk Grove Village Industrial Development Revenue, Rainbow Fish House, Inc. Project
(LOC: JPMorgan Chase Bank N.A.)
0.870%, 05/01/2016
(Putable on 05/05/2016) (a) | | | 80,000 | |
| | 535,000 | | | Illinois Finance Authority Educational Revenue, Noble Network of Charter Schools
2.000%, 09/01/2016 | | | 536,257 | |
| | 230,000 | | | Illinois Finance Authority Industrial Development Revenue, Church Road Partnership
(LOC: JPMorgan Chase Bank)
0.870%, 10/01/2017
(Putable on 05/05/2016) (a) | | | 230,000 | |
| | 500,000 | | | Illinois Finance Authority, Lifespace Communities—Series A
2.000%, 05/15/2016 | | | 500,210 | |
| | 250,000 | | | Illinois Finance Authority, Silver Cross Hospital & Medical
5.000%, 08/15/2016 | | | 252,755 | |
| | 210,000 | | | Joilet Park District, General Obligation—Series A
3.000%, 02/01/2017 | | | 212,906 | |
| | 4,400,000 | | | Springfield Airport Authority, Allied-Signal, Inc. Project
5.000%, 09/01/2018
(Putable on 05/04/2016) (a) | | | 4,400,000 | |
| | 2,550,000 | | | State of Illinois, General Obligation
5.000%, 01/01/2018 | | | 2,557,446 | |
| | 2,250,000 | | | Town of Cicero, General Obligation—Series A
4.000%, 01/01/2017 | | | 2,295,653 | |
| | 10,000,000 | | | University of Illinois, VAR-Util Infrastructure Project
1.000%, 08/15/2021
(Putable on 05/05/2016) (a) | | | 10,000,000 | |
| | 155,000 | | | Village of Hanover Park Industrial Development Revenue, Spectra-Tech, Inc. Project
(LOC: BMO Harris Bank N.A.)
0.780%, 08/01/2017
(Putable on 05/05/2016) (a) | | | 155,000 | |
| | 500,000 | | | Village of Oak Lawn, General Obligation
(CS: Assured Guaranty Municipal)
2.500%, 12/01/2016 | | | 505,240 | |
| | | | | | | | 59,158,024 | |
The accompanying notes are an integral part of these financial statements.
53
Alpine Ultra Short Municipal Income Fund
Schedule of Portfolio Investments—Continued
April 30, 2016 (Unaudited)
Principal
Amount | | | Security
Description | | Value | |
| | | | | | | | | |
| Municipal Bonds—continued | | | | |
| Indiana—7.9% | | | | |
| $ | 370,000 | | | City of South Bend Economic Development Revenue, Dynamic R.E.H.C., Inc. Project
(LOC: KeyBank N.A.)
0.750%, 09/01/2020
(Putable on 05/04/2016) (a) | | $ | 370,000 | |
| | 6,880,000 | | | Elkhart County Revenue
(CS: Pedcor Invts-2000-xli LP)
0.740%, 01/01/2035
(Putable on 05/05/2016) (a) | | | 6,880,000 | |
| | 400,000 | | | Gary Chicago International Airport Authority
5.000%, 02/01/2017 | | | 409,708 | |
| | 4,694,500 | | | Hammond Local Public Improvement Bond Bank, Advance Program Notes—Series A-1
1.250%, 06/30/2016 | | | 4,695,580 | |
| | 7,000,000 | | | Indiana Finance Authority Economic Development, Republic Services, Inc. Project—Series A
0.700%, 05/01/2034
(Putable on 06/01/2016) (a) | | | 6,999,440 | |
| | 59,060,000 | | | Indiana Finance Authority, Multifamily HSG Revenue
(LIQ FAC: CitiGroup)
0.900%, 10/26/2017
(Putable on 05/05/2016) (a) | | | 59,060,000 | |
| | 1,500,000 | | | Indiana Health Facility Financing Authority, Ascension Health—Series CR-A-1
5.000%, 10/01/2027
(Putable on 06/01/2017) (a) | | | 1,566,795 | |
| | | | | | | | 79,981,523 | |
| Iowa—0.1% | | | | |
| | 1,090,000 | | | Iowa Finance Authority, Pella Regional Health Center Project
5.000%, 12/01/2017 | | | 1,115,888 | |
| Kansas—0.2% | | | | |
| | 1,000,000 | | | City of Dodge City Industrial Development Revenue, Farmland National Beef Packing Co., L.P. Project
(LOC: Rabobank Int.)
1.100%, 03/01/2027
(Putable on 05/05/2016) (a) | | | 1,000,000 | |
| | 1,000,000 | | | City of Liberal KS Industrial Development Revenue, Farmland National Beef Packing Co., L.P. Project
(LOC: Rabobank Int.)
1.150%, 02/01/2029
(Putable on 05/05/2016) (a) | | | 1,000,000 | |
| | | | | | | | 2,000,000 | |
| Kentucky—0.5% | | | | |
| | 5,000,000 | | | Pulaski County Solid Waste Disposal Revenue, National Rural Utilities-East Kentucky Power—Series B
1.050%, 08/15/2023
(Putable on 08/15/2016) (a) | | | 4,997,600 | |
Principal
Amount | | | Security
Description | | Value | |
| | | | | | | | | |
| Municipal Bonds—continued | | | | |
| Louisiana—4.2% | | | | |
| $ | 8,700,000 | | | East Baton Rouge Parish Industrial Development Board, Solid Waste Disposal, Georgia Pacific Corp. Project
0.590%, 06/01/2029
(Putable on 05/04/2016) (a)(b) | | $ | 8,700,000 | |
| | 2,500,000 | | | Jefferson Parish Industrial Development Board, Sara Lee Corp. Project
0.720%, 06/01/2024
(Putable on 05/02/2016) (a) | | | 2,500,000 | |
| | 1,735,000 | | | Louisiana Housing Finance Agency Revenue, Multifamily Housing Restoration—Series A
(LOC: Regions Bank)
0.820%, 12/01/2032
(Putable on 05/05/2016) (a) | | | 1,735,000 | |
| | 5,000,000 | | | Louisiana Local Government Environmental Facilities & Community Development Authority, VAR-Sub Lien-East Baton Rouge
1.004%, (US0001M*0.7+ 70.000 bps)02/01/2049
(Putable on 05/01/2016) (a) | | | 4,943,150 | |
| | 495,000 | | | Louisiana Offshore Terminal Authority, Loop LLC Project—Series B-1A1
(CS: Loop LLC)
1.375%, 10/01/2037
(Putable on 10/01/2016) (a) | | | 495,653 | |
| | 480,000 | | | Louisiana Public Facilities Authority, Equipment & Capital Facilities Pooled—Series B
(LOC: Capital One Bank NA)
0.940%, 07/01/2033
(Putable on 05/05/2016) (a) | | | 480,000 | |
| | 2,000,000 | | | New Orleans Aviation Board—Series B2
5.000%, 01/01/2017 | | | 2,054,760 | |
| | 1,290,000 | | | North Webster Parish Industrial Development Revenue, CSP Project
(LOC: Regions Bank)
2.430%, 09/01/2021
(Putable on 05/05/2016) (a) | | | 1,290,000 | |
| | 460,000 | | | Ouachita Parish Industrial Development Board, Garrett Manufacturing LLC
(LOC: Regions Bank)
0.890%, 12/01/2016
(Putable on 05/05/2016) (a) | | | 460,000 | |
| | 20,000,000 | | | Plaquemines Port Harbor & Terminal District Revenue, International Marine Terminal Project—Series A
(LOC: Wells Fargo Bank N.A.)
0.850%, 03/15/2025
(Putable on 03/15/2017) (a) | | | 20,000,000 | |
| | | | | | | | 42,658,563 | |
The accompanying notes are an integral part of these financial statements.
54
Alpine Ultra Short Municipal Income Fund
Schedule of Portfolio Investments—Continued
April 30, 2016 (Unaudited)
Principal
Amount | | | Security
Description | | Value | |
| | | | | | | | | |
| Municipal Bonds—continued | | | | |
| Maryland—0.0% (c) | | | | |
| $ | 300,000 | | | Maryland State Health & Educational Facilities Authority, Meritus Medical Center
5.000%, 07/01/2016 | | $ | 302,151 | |
| Massachusetts—0.4% | | | | |
| | 2,500,000 | | | Massachusetts Development Finance Agency
0.900%, 05/26/2016 | | | 2,500,025 | |
| | 1,165,000 | | | Massachusetts Development Finance Agency, Seven Hills Obligated Group
3.000%, 09/01/2016 | | | 1,171,000 | |
| | | | | | | | 3,671,025 | |
| Michigan—1.3% | | | | |
| | 3,000,000 | | | Michigan Finance Authority, Detroit School District
4.750%, 06/01/2016 (b) | | | 3,002,880 | |
| | 1,600,000 | | | Michigan Finance Authority, Detroit School District
5.000%, 06/01/2016 | | | 1,604,992 | |
| | 6,605,000 | | | Michigan Finance Authority, Detroit School District—Series A
3.000%, 05/01/2016 | | | 6,605,000 | |
| | 125,000 | | | Michigan Finance Authority, Refunding College for Studies
3.000%, 12/01/2016 | | | 126,436 | |
| | 1,690,000 | | | Michigan State Housing Development Authority—Series A
(CS: Assured Guaranty Municipal)
0.560%, 04/01/2042
(Putable on 05/02/2016) (a) | | | 1,690,000 | |
| | 600,000 | | | Ypsilanti School District, General Obligation—Series A
4.000%, 05/01/2016 | | | 600,000 | |
| | | | | | | | 13,629,308 | |
| Mississippi—8.8% | | | | |
| | 68,000,000 | | | Mississippi Business Finance Corp. Revenue, PSL-North America LLC Project—Series A
(LOC: ICICI Bank)
2.950%, 11/01/2032
(Putable on 05/05/2016) (a) | | | 68,000,000 | |
| | 6,495,000 | | | Mississippi Business Finance Corp., Hattiesburg Clinic Professional Association Project
(LOC: Regions Bank)
0.700%, 11/01/2026
(Putable on 05/05/2016) (a) | | | 6,495,000 | |
| | 4,080,000 | | | Mississippi Business Finance Corp., Tri-State Truck Center, Inc. Project
(LOC: Regions Bank)
0.710%, 03/01/2033
(Putable on 05/05/2016) (a) | | | 4,080,000 | |
| | 10,000,000 | | | Mississippi Hospital Equipment & Facilities Authority, Baptist Member Health—Series B2
0.750%, 09/01/2022
(Putable on 07/07/2016) (a)(b) | | | 9,997,200 | |
| | | | | | | | 88,572,200 | |
Principal
Amount | | | Security
Description | | Value | |
| | | | | | | | | |
| Municipal Bonds—continued | | | | |
| New Hampshire—1.0% | | | | |
| $ | 995,000 | | | New Hampshire Business Finance Authority, Pennichuck Water Works, Inc. Project—Series A
4.000%, 01/01/2017 | | $ | 1,012,940 | |
| | 2,500,000 | | | New Hampshire State Business Financing Authority Poll Control Revenue
0.900%, 05/24/2016 | | | 2,500,025 | |
| | 6,200,000 | | | New Hampshire State Business Financing Authority Poll Control Revenue
0.900%, 05/26/2016 | | | 6,200,062 | |
| | | | | | | | 9,713,027 | |
| New Jersey—9.4% | | | | |
| | 4,632,928 | | | Borough of Union Beach, Bond Anticipation Notes
2.000%, 03/01/2017 | | | 4,671,752 | |
| | 3,830,000 | | | Casino Reinvestment Development Authority—Series A
(CS: NATL-RE)
5.000%, 06/01/2016 | | | 3,839,958 | |
| | 500,000 | | | Casino Reinvestment Development Authority—Series D
4.000%, 11/01/2016 | | | 504,105 | |
| | 7,855,000 | | | City of Marysville, Bond Anticipation Notes
2.000%, 07/19/2016 | | | 7,869,532 | |
| | 8,799,000 | | | City of Newark, General Obligation
2.500%, 12/06/2016 | | | 8,846,338 | |
| | 36,300,000 | | | New Jersey Economic Development Authority, Port Newark Container Terminal LLC Project—Series B
(LOC: Sovereign Bank N.A.)
0.700%, 07/01/2030
(Putable on 05/04/2016) (a) | | | 36,300,000 | |
| | 4,200,000 | | | New Jersey Higher Education Student Assistance Authority, AMT-Student Loan Recovery—Series 1A
5.000%, 12/01/2016 | | | 4,293,996 | |
| | 17,650,905 | | | Township of Berkeley, Bond Anticipation Notes
1.500%, 05/25/2016 | | | 17,653,729 | |
| | 7,400,000 | | | Township of Irvington, Bond Anticipation Notes
3.250%, 06/17/2016 | | | 7,402,368 | |
| | 3,971,393 | | | Township of Jackson, Bond Anticipation Notes—Series A
2.000%, 08/03/2016 | | | 3,981,163 | |
| | | | | | | | 95,362,941 | |
| New York—18.8% | | | | |
| | 1,000,000 | | | Addison Central School District, General Obligation Bond Anticipation Notes
1.500%, 06/28/2016 | | | 1,001,000 | |
| | 8,350,000 | | | City of Dunkirk, Bond Anticipation Notes
2.000%, 03/23/2017 | | | 8,417,635 | |
| | 14,570,000 | | | City of Long Beach, Revenue Anticipation Notes—Series A
1.500%, 06/30/2016 | | | 14,582,676 | |
The accompanying notes are an integral part of these financial statements.
55
Alpine Ultra Short Municipal Income Fund
Schedule of Portfolio Investments—Continued
April 30, 2016 (Unaudited)
Principal
Amount | | | Security
Description | | Value | |
| | | | | | | | | |
| Municipal Bonds—continued | | | | |
| New York—continued | | | | |
| $ | 5,000,000 | | | City of Syracuse, Revenue Anticipation Notes—Series B
1.500%, 06/30/2016 | | $ | 5,005,100 | |
| | 596,000 | | | County of Rockland, Bond Anticipation Notes—Series A
2.000%, 12/01/2016 | | | 600,023 | |
| | 7,000,000 | | | County of Rockland, Tax Anticipation Notes
2.000%, 03/16/2017 | | | 7,064,050 | |
| | 6,825,000 | | | Lackawanna City School District, Bond Anticipation Notes
2.000%, 03/02/2017 | | | 6,876,119 | |
| | 6,000,000 | | | Lafayette Central School District, Bond Anticipation Notes
1.500%, 07/22/2016 | | | 6,008,640 | |
| | 1,070,000 | | | Minisink Valley Central School District, General Obligation
2.000%, 06/15/2016 | | | 1,071,680 | |
| | 5,000,000 | | | Nassau Health Care Corp., Revenue Anticipation Notes
2.000%, 01/17/2017 | | | 5,024,350 | |
| | 1,450,000 | | | New York City Housing Development Corp.—Series B1
5.000%, 07/01/2016 | | | 1,460,513 | |
| | 1,145,000 | | | New York City Housing Development Corp.—Series E-1-A
0.750%, 11/01/2016 | | | 1,145,011 | |
| | 295,000 | | | New York City Industrial Development Agency, Allway Tools, Inc.
(LOC: Citibank N.A.)
1.110%, 08/01/2017
(Putable on 05/05/2016) (a) | | | 295,000 | |
| | 810,000 | | | New York City Industrial Development Agency, Allway Tools, Inc.
(LOC: Citibank N.A.)
1.110%, 08/01/2020
(Putable on 05/05/2016) (a) | | | 810,000 | |
| | 9,750,000 | | | New York City Municipal Water Finance Authority, Water and Sewer System, Second General Resolution Revenue Bonds—Series AA-2
(SPA: Dexia Credit Local)
0.550%, 06/15/2032
(Putable on 05/02/2016) (a) | | | 9,750,000 | |
| | 20,200,000 | | | New York Environmental Facilities Corp. Solid Waste Disposal Revenue, Waste Management, Inc. Project—Series
2012 0.600%, 05/01/2030
(Putable on 05/02/2016) (a) | | | 20,200,000 | |
| | 7,415,000 | | | New York State Dormitory Authority Revenue, Fordham University—Series B
5.000%, 07/01/2041
(Putable on 07/01/2016) (a) | | | 7,466,015 | |
| | 3,475,000 | | | Niagara Falls City School District
2.000%, 06/15/2016 | | | 3,478,371 | |
Principal
Amount | | | Security
Description | | Value | |
| | | | | | | | | |
| Municipal Bonds—continued | | | | |
| New York—continued | | | | |
| $ | 300,000 | | | Otsego County Capital Resource Corp.
3.000%, 10/01/2016 | | $ | 302,376 | |
| | 4,715,000 | | | Port Authority of New York & New Jersey—Series
188 5.000%, 05/01/2017 | | | 4,917,886 | |
| | 3,500,000 | | | Sayville Union Free School District, Bond Anticipation Notes
1.500%, 09/29/2016 | | | 3,505,705 | |
| | 20,000,000 | | | Suffolk County, Tax Anticipation Notes
2.000%, 07/27/2016 | | | 20,061,000 | |
| | 35,000,000 | | | Town of Oyster Bay, Bond Anticipation Notes—Series B
2.000%, 07/08/2016 | | | 35,063,000 | |
| | 3,000,000 | | | Town of Oyster Bay, Bond Anticipation Notes General Obligation—Series A
2.750%, 02/03/2017 | | | 3,018,180 | |
| | 560,000 | | | Town of Ramapo, General Obligation
2.000%, 05/01/2016 | | | 560,000 | |
| | 370,000 | | | Town of Ramapo, General Obligation—Series B
3.000%, 05/01/2016 | | | 370,000 | |
| | 900,000 | | | Town of Ramapo, Public Improvement—Series A
4.000%, 05/15/2016 | | | 900,927 | |
| | 5,304,000 | | | Union Endicott Central School District, Bond Anticipation Notes
1.500%, 07/22/2016 | | | 5,309,410 | |
| | 5,000,000 | | | Utica School District, Bond Anticipation Notes
2.000%, 07/22/2016 | | | 5,004,500 | |
| | 10,170,000 | | | Village of Johnson City, Bond Anticipation Notes—Series A
2.000%, 05/27/2016 | | | 10,177,628 | |
| | 500,000 | | | Westchester Tobacco Asset Securitization Corp.
5.000%, 06/01/2026 | | | 500,625 | |
| | | | | | | | 189,947,420 | |
| North Carolina—4.1% | | | | |
| | 18,900,000 | | | Hertford County Industrial Facilities & Pollution Control Financing Authority, Nucor Corp. Project—Series A
0.750%, 11/01/2033
(Putable on 05/04/2016) (a) | | | 18,900,000 | |
| | 13,100,000 | | | Hertford County Industrial Facilities & Pollution Control Financing Authority, Nucor Corp. Project—Series B
0.670%, 11/01/2033
(Putable on 05/04/2016) (a) | | | 13,100,000 | |
| | 9,500,000 | | | North Carolina Capital Facilities Finance Agency, Solid Waste Disposal Revenue, Republic Services, Inc. Project—Series B
0.700%, 12/01/2020
(Putable on 06/01/2016) (a) | | | 9,500,000 | |
| | | | | | | | 41,500,000 | |
The accompanying notes are an integral part of these financial statements.
56
Alpine Ultra Short Municipal Income Fund
Schedule of Portfolio Investments—Continued
April 30, 2016 (Unaudited)
| Principal | | | Security | | | |
| Amount | | | Description | | Value | |
| | | | | | | | | |
| Municipal Bonds—continued | | |
| North Dakota—0.1% | | | |
| $ | 1,375,000 | | | Ward County Healthcare Revenue, Trinity Obligated Group
5.250%, 07/01/2016 | | $ | 1,385,203 | |
| Ohio—1.6% | | |
| | 4,125,000 | | | Cleveland-Cuyahoga County Port Authority, CBT Project
0.710%, 06/01/2031
(Putable on 05/05/2016) (a) | | | 4,125,000 | |
| | 1,000,000 | | | Licking County, General Obligation Bond Anticipation Notes
2.000%, 05/31/2016 | | | 1,000,870 | |
| | 2,400,000 | | | Ohio Water Development Authority, FirstEnergy Generation Project—Series A
2.250%, 08/01/2029
(Putable on 09/15/2016) (a) | | | 2,408,040 | |
| | 9,000,000 | | | State of Ohio, University Hospital Health
0.750%, 01/15/2045
(Putable on 05/02/2016) (a) | | | 9,000,000 | |
| | | | | | | | 16,533,910 | |
| Oklahoma—0.2% | | |
| | 710,000 | | | Comanche County Hospital Authority
5.000%, 07/01/2016 | | | 714,359 | |
| | 500,000 | | | Tulsa Airports Improvement Trust Revenue—Series A
3.000%, 06/01/2016 | | | 500,735 | |
| | 300,000 | | | Tulsa Airports Improvement Trust Revenue—Series B
3.000%, 06/01/2016 | | | 300,441 | |
| | | | | | | | 1,515,535 | |
| Oregon—2.0% | | | |
| | 460,000 | | | City of Forest Grove, Pacific University
3.000%, 05/01/2016 | | | 460,000 | |
| | 250,000 | | | City of Forest Grove, Pacific University
3.000%, 05/01/2017 | | | 254,323 | |
| | 8,650,000 | | | Gilliam County, Solid Waste Disposal Revenue, Waste Management, Inc. Project—Series A
0.800%, 08/01/2025
(Putable on 05/02/2016) (a)(b) | | | 8,650,000 | |
| | 2,000,000 | | | State of Oregon Housing & Community Services Department Revenue, Holiday Garden Apartments Project—Series D
0.800%, 08/01/2018
(Putable on 08/01/2016) (a) | | | 1,998,660 | |
| | 8,500,000 | | | State of Oregon, Adjustable Refunding, Georgia-Pacific Corp. Project
0.590%, 12/01/2025
(Putable on 05/04/2016) (a) | | | 8,500,000 | |
| | | | | | | | 19,862,983 | |
| Principal | | | Security | | | |
| Amount | | | Description | | Value | |
| | | | | | | | | |
| Municipal Bonds—continued | | |
| Pennsylvania—4.5% | | | | |
| $ | 3,000,000 | | | Beaver County Industrial Development Authority, FirstEnergy Generation Project—Series A
2.200%, 01/01/2035
(Putable on 07/01/2016) (a) | | $ | 3,004,500 | |
| | 5,000,000 | | | Beaver County Industrial Development Authority, FirstEnergy Generation Project—Series B
2.500%, 12/01/2041
(Putable on 06/01/2017) (a) | | | 5,043,450 | |
| | 435,000 | | | Clarion County Industrial Development Authority, Clarion University Foundation, Inc. Housing Project—Series D
3.000%, 07/01/2016 | | | 436,383 | |
| | 4,000,000 | | | Cumberland County, Municipal Authority, AICUP Financing Program, Messiah College
3.000%, 05/01/2044
(Putable on 05/01/2017) (a) | | | 4,069,160 | |
| | 200,000 | | | Dallas Area Municipal Authority, Misericordia University Project—Series 2014
4.000%, 05/01/2016 | | | 200,000 | |
| | 10,000,000 | | | Dallastown Area School District
1.500%, 04/14/2017
(Putable on 07/01/2016) (a) | | | 10,065,700 | |
| | 165,000 | | | East Hempfield Township Industrial Development Authority, Willow Valley Communities
1.000%, 12/01/2016 | | | 164,985 | |
| | 8,000,000 | | | Pennsylvania Economic Development Financing Authority, Solid Waste Disposal Revenue, Waste Management, Inc.
0.600%, 08/01/2045
(Putable on 05/02/2016) (a) | | | 8,000,000 | |
| | 6,305,000 | | | Pennsylvania Higher Educational Facilities Authority, VAR-AICUP Financing Program
3.000%, 05/01/2033
(Putable on 05/01/2017) (a) | | | 6,402,728 | |
| | 1,300,000 | | | Pennsylvania Higher Educational Facilities Authority, Variable AICUP Financing Program—Series T2
0.550%, 05/01/2030
(Putable on 05/01/2017) (a) | | | 1,300,000 | |
| | 3,075,000 | | | Philadelphia School District General Obligation—Series B
(CS: State Aid Withholding)
5.000%, 09/01/2016 | | | 3,113,130 | |
| | 3,400,000 | | | Philadelphia School District General Obligation—Series D
(CS: State Aid Withholding)
5.000%, 09/01/2016 | | | 3,442,160 | |
| | 195,000 | | | West Shore Area Authority, Messiah Village Project—Series A
2.000%, 07/01/2016 | | | 195,267 | |
| | | | | | | | 45,437,463 | |
The accompanying notes are an integral part of these financial statements.
57
Alpine Ultra Short Municipal Income Fund
Schedule of Portfolio Investments—Continued
April 30, 2016 (Unaudited)
| Principal | | | Security | | | |
| Amount | | | Description | | Value | |
| | | | | | | | | |
| Municipal Bonds—continued | | |
| Puerto Rico—0.9% | | | |
| $ | 120,000 | | | Commonwealth of Puerto Rico— Series A
(CS: Assured Guaranty Municipal)
4.000%, 07/01/2016 | | $ | 120,536 | |
| | 500,000 | | | Commonwealth of Puerto Rico, Public Improvement—Series A
(CS: Assured Guaranty Municipal)
5.000%, 07/01/2017 | | | 515,620 | |
| | 820,000 | | | Commonwealth of Puerto Rico, Public Improvement—Series A
(CS: NATL-RE)
5.500%, 07/01/2016 | | | 825,601 | |
| | 2,590,000 | | | Commonwealth of Puerto Rico, Public Improvement Bonds
(CS: Assured Guaranty Municipal)
5.500%, 07/01/2017 | | | 2,685,623 | |
| | 670,000 | | | Commonwealth of Puerto Rico, Public Improvement Bonds—Series A
(CS: NATL-RE)
5.500%, 07/01/2017 | | | 686,582 | |
| | 1,725,000 | | | Puerto Rico Commonwealth Aqueduct & Sewer Authority, Senior Lien—Series A
(CS: Assured Guaranty Municipal)
5.000%, 07/01/2016 | | | 1,735,471 | |
| | 140,000 | | | Puerto Rico Electric Power Authority—Series LL
(CS: NATL-RE)
5.500%, 07/01/2017 | | | 143,471 | |
| | 250,000 | | | Puerto Rico Electric Power Authority—Series SS
(CS: NATL-RE)
5.000%, 07/01/2017 | | | 253,000 | |
| | 1,100,000 | | | Puerto Rico Highways & Transportation Authority—Series E
(CS: Assured Guaranty Municipal)
5.500%, 07/01/2017 | | | 1,140,689 | |
| | 550,000 | | | Puerto Rico Municipal Finance Agency—Series A
(CS: Assured Guaranty Municipal)
5.000%, 08/01/2016 | | | 552,073 | |
| | | | | | | | 8,658,666 | |
| Rhode Island—0.1% | | | |
| | 500,000 | | | Providence Redevelopment Agency Revenue—Series A
3.000%, 04/01/2017 | | | 507,285 | |
| Tennessee—3.3% | | | |
| | 30,000,000 | | | Lewisburg Industrial Development Board Solid Waste Disposal Revenue, Waste Management, Inc. of Tennessee Project
0.600%, 07/02/2035
(Putable on 05/02/2016) (a) | | | 30,000,000 | |
| | 3,000,000 | | | Sevier County Public Building Authority, Local Government Public Improvement
(CS: AMBAC, LOC: KBC Bank NV)
2.700%, 06/01/2026
(Putable on 05/05/2016) (a) | | | 3,000,000 | |
| | | | | | | | 33,000,000 | |
| Principal | | | Security | | | |
| Amount | | | Description | | Value | |
| | | | | | | | | |
| Municipal Bonds—continued | | |
| Texas—3.6% | | | |
| $ | 15,000,000 | | | Calhoun County Navigation Industrial Development Authority, British Petroleum Co.
0.700%, 01/01/2024
(Putable on 05/04/2016) (a) | | $ | 15,000,000 | |
| | 2,000,000 | | | Dallas Independent School District, Multi-Modal School Building—Series B-1
3.000%, 02/15/2036
(Putable on 02/15/2017) (a) | | | 2,036,680 | |
| | 4,680,000 | | | Dallas Independent School District, Multi-Modal School Building—Series B-2
4.000%, 02/15/2036
(Putable on 02/15/2018) (a) | | | 4,919,429 | |
| | 220,000 | | | Mesquite Health Facility Development Corp., Christian Care Centers, Inc.
1.400%, 02/15/2017 | | | 219,998 | |
| | 14,000,000 | | | Mission Economic Development Corp. Solid Waste Disposal Revenue, Republic Services, Inc. Project
0.650%, 01/01/2026
(Putable on 05/02/2016) (a) | | | 14,000,000 | |
| | | | | | | | 36,176,107 | |
| Utah—0.0% (c) | | | | |
| | 220,000 | | | Salt County Lake Revenue, Westminster College
2.000%, 10/01/2016 | | | 220,631 | |
| Virginia—0.8% | | | | |
| | 7,800,000 | | | Campbell County Industrial Development Authority, Solid Waste Disposal Facility Revenue, Georgia Pacific Corp. Project
0.590%, 12/01/2019
(Putable on 05/04/2016) (a)(b) | | | 7,800,000 | |
| Washington—0.2% | | |
| | 1,400,000 | | | Washington Economic Development Finance Authority, Belina Interiors, Inc.—Series E (LOC: KeyBank N.A.)
0.910%, 08/01/2033
(Putable on 05/05/2016) (a) | | | 1,400,000 | |
| | 1,110,000 | | | Washington Economic Development Finance Authority, Belina Interiors, Inc.—Series F (LOC: KeyBank N.A.)
0.910%, 11/01/2023
(Putable on 05/05/2016) (a) | | | 1,110,000 | |
| | | | | | | | 2,510,000 | |
| West Virginia—2.4% | | | |
| | 24,000,000 | | | West Virginia Economic Development Authority, Appalachian Power Co.—Series A
0.790%, 02/01/2036
(Putable on 05/05/2016) (a) | | | 24,000,000 | |
The accompanying notes are an integral part of these financial statements.
58
Alpine Ultra Short Municipal Income Fund
Schedule of Portfolio Investments—Continued
April 30, 2016 (Unaudited)
| Principal | | | Security | | | |
| Amount | | | Description | | Value | |
| | | | | | | | | |
| Municipal Bonds—continued | | | |
| Wisconsin—0.7% | | | | |
| $ | 2,165,000 | | | City of Baraboo, Industrial Development Revenue, Series 2007, Teel Plastics, Inc. Project
(LOC: BMO Harris Bank N.A.)
0.660%, 11/01/2042
(Putable on 05/05/2016) (a) | | $ | 2,165,000 | |
| | 1,575,000 | | | Mequon Industrial Development Revenue, SPI Lighting
(LOC: BMO Harris Bank N.A.)
0.660%, 12/01/2023
(Putable on 05/05/2016) (a) | | | 1,575,000 | |
| | 500,000 | | | Milwaukee Redevelopment Authority, Kubin Nicholson Corp. Project—Series A
(LOC: BMO Harris Bank N.A.)
0.660%, 08/01/2020
(Putable on 05/05/2016) (a) | | | 500,000 | |
| | 2,610,000 | | | Village of Menomonee Falls Industrial Development Revenue, AJ Die-Namics Project
(LOC: BMO Harris Bank N.A.)
0.660%, 11/01/2036
(Putable on 05/05/2016) (a) | | | 2,610,000 | |
| | 245,000 | | | Wisconsin Health & Educational Facilities Authority, Fort Healthcare, Inc. Obligation
4.000%, 05/01/2016 | | | 245,000 | |
| | | | | | | | 7,095,000 | |
| Principal | | | Security | | | |
| Amount | | | Description | | Value | |
| | | | | | | | | |
| Municipal Bonds—continued | | |
| Wyoming—0.3% | | | | |
| $ | 2,855,000 | | | Gillette Environmental Improvement Revenue, Black Hills Power and Light Co.—Series A
0.750%, 06/01/2024
(Putable on 05/04/2016) (a) | | $ | 2,855,000 | |
| | | | | Total Municipal Bonds
(Cost $1,079,163,816) | | | 1,079,144,663 | |
| | | | | | | | | |
| Shares | | | | | | | |
| Money Market Funds—0.0% (c) | | | |
| | 55,351 | | | BlackRock Liquidity Funds:
MuniCash Portfolio, Institutional Shares, 0.19% | | | 55,351 | |
| | | | | Total Money Market Funds
(Cost $55,351) | | | 55,351 | |
Total Investments
(Cost $1,079,219,167) (d)—106.9% | | 1,079,200,014 | |
| Liabilities in Excess of Other Assets—(6.9)% | | (69,596,024 | ) |
| TOTAL NET ASSETS 100.0% | $ | 1,009,603,990 | |
Percentages are stated as a percent of net assets.
| (a) | Variable Rate Security-The rate reported is the rate in effect as of April 30, 2016. |
| | |
| (b) | Restricted under Rule 144A of the Securities Act of 1933. These securities may be resold in transactions exempt from registration, normally to qualified institutional buyers. These securities have been determined to be liquid under guidelines established by the Board of Trustees. Liquid securities restricted under Rule 144A comprised 8.2% of the Fund’s net assets. |
| | |
| (c) | Amount is less than 0.05%. |
| | |
| (d) | See Note 7 for the cost of investments for federal tax purposes. |
AMBAC—American Municipal Bond Assurance Corp.
ARN—Auction Rate Note
CS—Credit Support
CSP—Continental Structural Plastics
LIQ FAC—Liquidity Facility
NA—North America
NATL-RE—Reinsurance provided by National Public Finance Guarantee Corp.
NV—Naamloze Vennootschap is the Dutch term for a public limited liability corporation.
SPA—Standby Purchase Agreement
The accompanying notes are an integral part of these financial statements.
59
Alpine High Yield Managed Duration Municipal Fund
Schedule of Portfolio Investments
April 30, 2016 (Unaudited)
| Principal | | | Security | | | |
| Amount | | | Description | | Value | |
| | | | | | | |
| Municipal Bonds—102.5% | | | | |
| Alabama—5.5% | | | | |
| $ | 750,000 | | | Alabama Industrial Development Solid Waste Disposal Revenue
(CS: OfficeMax, Inc.)
6.450%, 12/01/2023 | | $ | 751,200 | |
| | 500,000 | | | Alabama Special Care Facilities Financing Authority-Birmingham Revenue, Methodist Homes for the Aging—Series 2015-1
5.250%, 06/01/2025 | | | 513,785 | |
| | 850,000 | | | Health Care Authority for Baptist Health Revenue—Series D
5.000%, 11/15/2021 | | | 852,916 | |
| | 2,855,000 | | | Jefferson County Ltd. Obligation School Warrants—Series A
4.750%, 01/01/2025 | | | 2,877,355 | |
| | 250,000 | | | Jefferson County Ltd. Obligation School Warrants—Series A
5.250%, 01/01/2017 | | | 251,385 | |
| | 160,000 | | | Jefferson County, Capital Improvement Warrants—Series A
(CS: NATL-RE)
5.000%, 04/01/2023 | | | 162,739 | |
| | 460,000 | | | Selma Industrial Development Board Revenue, Zilkha Biomass Selma LLC Project
7.500%, 05/01/2025 (a) | | | 459,503 | |
| | | | | | | | 5,868,883 | |
| Arizona—1.5% | | | | |
| | 225,000 | | | Industrial Development Authority of the City of Phoenix Revenue, Freedom Academy, Inc.
(CS: Freedom Academy, Inc.)
3.875%, 07/01/2021 (a) | | | 225,252 | |
| | 225,000 | | | La Paz County Industrial Development Authority Revenue, Charter School Solutions-Harmony Public School Project—Series A
5.000%, 02/15/2021 | | | 249,534 | |
| | 500,000 | | | La Paz County Industrial Development Authority Revenue, Charter School Solutions-Harmony Public School Project—Series A
5.000%, 02/15/2026 | | | 575,480 | |
| | 200,000 | | | Phoenix Industrial Development Authority, AZ GFF Tiyan LLC
(Guam annual appropriation)
5.000%, 02/01/2018 | | | 207,074 | |
| | 200,000 | | | Phoenix Industrial Development Authority, Basis School, Inc.
3.000%, 07/01/2020 (a) | | | 204,400 | |
| | 180,000 | | | Phoenix Industrial Development Authority, Legacy Traditional Schools Project—Series A
4.750%, 07/01/2019 (a) | | | 189,362 | |
| | | | | | | | 1,651,102 | |
| California—5.6% | | | | |
| | 1,000,000 | | | California Municipal Finance Authority Revenue, Palmdale Aerospace Academy Project
5.000%, 07/01/2031 (a) | | | 1,105,630 | |
| Principal | | | Security | | | |
| Amount | | | Description | | Value | |
| | | | | | | | | |
| Municipal Bonds—continued | | | | |
| California—continued | | | | |
| $ | 250,000 | | | California Municipal Finance Authority, Julian Charter School Project—Series A
5.000%, 03/01/2025 (a) | | $ | 259,005 | |
| | 450,000 | | | City of Roseville, HP Campus Oaks, Community Facilities District
4.000%, 09/01/2026 | | | 447,719 | |
| | 190,000 | | | Inland Empire Tobacco Securitization Authority, Tobacco Settlement—Series A
4.625%, 06/01/2021 | | | 191,571 | |
| | 145,000 | | | Inland Empire Tobacco Securitization Authority, Tobacco Settlement—Series A
5.000%, 06/01/2021 | | | 146,263 | |
| | 1,175,000 | | | Palomar Pomerado Health Care—Series A, ARN
(CS: Assured Guaranty Municipal)
1.500%, 11/01/2036
(Putable on 05/03/2016) (b) | | | 1,175,000 | |
| | 775,000 | | | Palomar Pomerado Health Care—Series B, ARN
(CS: Assured Guaranty Municipal)
1.750%, 11/01/2036
(Putable on 05/04/2016) (b) | | | 775,000 | |
| | 875,000 | | | Palomar Pomerado Health Care—Series C, ARN
(CS: Assured Guaranty Municipal)
1.700%, 11/01/2036
(Putable on 05/05/2016) (b) | | | 875,000 | |
| | 985,000 | | | Tobacco Securitization Authority of Northern California Revenue—Series A-2
5.400%, 06/01/2027
(Putable on 06/01/2016) (a)(b) | | | 991,905 | |
| | | | | | | | 5,967,093 | |
| Colorado—0.6% | | | | |
| | 110,000 | | | Colorado Health Facilities Authority, Covenant Retirement Communities, Inc.—Series B
3.150%, 12/01/2018 | | | 110,139 | |
| | 500,000 | | | Lambertson Farms Metropolitan District No. 1, General Obligation
5.000%, 12/15/2025 | | | 505,865 | |
| | | | | | | | 616,004 | |
| Connecticut—1.8% | | | | |
| | 1,400,000 | | | Connecticut State Health & Educational Facility Authority Revenue, Church Home Of Hartford, Inc. Project—Series B-1
(CS: Church Home Of Hartford)
3.250%, 09/01/2021 (a) | | | 1,408,862 | |
| | 500,000 | | | Mohegan Tribe of Indians of Connecticut Revenue—Series C
4.750%, 02/01/2020 (a) | | | 502,170 | |
| | | | | | | | 1,911,032 | |
The accompanying notes are an integral part of these financial statements.
60
Alpine High Yield Managed Duration Municipal Fund
Schedule of Portfolio Investments—Continued
April 30, 2016 (Unaudited)
| Principal | | | Security | | | |
| Amount | | | Description | | Value | |
| | | | | | | | | |
| Municipal Bonds—continued | | | | |
| District of Columbia—1.0% | | | | |
| $ | 250,000 | | | District of Columbia Revenue, National Law Enforcement officers Memorial Fund, Inc.—Series B
5.750%, 07/01/2025 | | $ | 251,208 | |
| | 475,000 | | | District of Columbia, Howard University—Series A
5.250%, 10/01/2022 | | | 517,992 | |
| | 240,000 | | | District of Columbia, Methodist Home
4.500%, 01/01/2025 | | | 244,644 | |
| | | | | | | | 1,013,844 | |
| Florida—3.3% | | | | |
| | 250,000 | | | Capital Trust Agency, Inc. Revenue, First Mortgage Revenue-Silver Creek St. Augustine Project—Series A
6.500%, 01/01/2024 | | | 236,378 | |
| | 170,000 | | | Capital Trust Agency, Inc. Revenue, River City Education Services, Inc. Project—Series A
4.625%, 02/01/2025 | | | 172,865 | |
| | 100,000 | | | Celebration Pointe Community Development District No.1, Special Assessment Revenue
4.750%, 05/01/2024 | | | 103,838 | |
| | 200,000 | | | City of Atlantic Beach, Health Care Facilities Revenue Naval CCRC—Series A
5.000%, 11/15/2021 | | | 228,004 | |
| | 200,000 | | | City Of Tampa, Solid Waste System Revenue
5.000%, 10/01/2020 | | | 228,098 | |
| | 300,000 | | | Collier County Industrial Development Authority CCRC, Arlington of Naples Project—Series B-1
6.875%, 05/15/2021 (a) | | | 300,306 | |
| | 340,000 | | | Florida Development Finance Corp. Revenue, Tuscan Isle Champions Gate Project—Series A
6.000%, 06/01/2030 (a) | | | 343,563 | |
| | 100,000 | | | Florida Development Finance Corp., Educational Facilities Revenue Bonds, Miami Arts Charter School Project—Series A
5.000%, 06/15/2024 (a) | | | 102,203 | |
| | 400,000 | | | Liberty County, Industrial Development Revenue, Georgia Pacific Corp. Project
0.620%, 10/01/2028
(Putable on 05/05/2016) (b) | | | 400,000 | |
| | 1,000,000 | | | Palm Beach County Health Facilities Authority, Sinai Residences Boca Raton Project—Series C
6.000%, 06/01/2021 | | | 1,042,380 | |
| | 290,000 | | | State Development Finance Corp. Revenue, Tuscan Isle Obligated Group—Series A
6.500%, 06/01/2025 (a) | | | 300,657 | |
| Principal | | | Security | | | |
| Amount | | | Description | | Value | |
| | | | | | | | | |
| Municipal Bonds—continued | | | | |
| Florida—continued | | | | |
| $ | 100,000 | | | Village Community Development District #11, Special Assessment Revenue
3.250%, 05/01/2019 | | $ | 100,312 | |
| | | | | | | | 3,558,604 | |
| Georgia—1.1% | | | | |
| | 997,000 | | | Georgia Local Government, Certificate Participation—Series A
4.750%, 06/01/2028 | | | 1,121,994 | |
| Guam—0.3% | | | | |
| | 250,000 | | | Guam International Airport Authority—Series C
5.000%, 10/01/2021 | | | 282,487 | |
| Idaho—0.3% | | | | |
| | 360,000 | | | Idaho Health Facilities Authority, The Terraces Boise Project—Series B-2
6.000%, 10/01/2021 | | | 360,407 | |
| Illinois—7.7% | | | | |
| | 100,000 | | | Chicago Board of Education—Series A
5.500%, 12/01/2018 | | | 103,980 | |
| | 155,000 | | | Chicago Board of Education, Dedicated Revenues
(CS: Assured Guaranty Municipal)
5.000%, 12/01/2022 | | | 158,887 | |
| | 225,000 | | | Chicago Board of Education, General Obligation—Series A
(CS: NATL-RE)
5.000%, 12/01/2020 | | | 225,733 | |
| | 100,000 | | | Chicago Board of Education, General Obligation—Series A
(CS: NATL-RE)
5.000%, 12/01/2021 | | | 100,326 | |
| | 75,000 | | | Chicago Board of Education, General Obligation—Series A
(CS: NATL-RE)
5.250%, 12/01/2018 | | | 80,034 | |
| | 725,000 | | | Chicago Board of Education, General Obligation—Series A
(CS: NATL-RE)
5.250%, 12/01/2019 | | | 727,487 | |
| | 500,000 | | | Chicago Board of Education, General Obligation—Series B
(CS: Assured Guaranty Municipal)
5.000%, 12/01/2016 | | | 512,725 | |
| | 200,000 | | | Chicago Board of Education, Refunding—Series G
4.410%, (MUNIPSA*1+400.000 bps) 03/01/2032
(Putable on 05/05/2016) (b) | | | 190,238 | |
| | 150,000 | | | City of Chicago—Series A
4.000%, 01/01/2019 | | | 151,427 | |
| | 210,000 | | | City of Chicago—Series A
4.000%, 01/01/2020 | | | 210,659 | |
| | 100,000 | | | City of Chicago, General Obligation
(CS: AMBAC)
5.000%, 12/01/2024 | | | 101,746 | |
| | 135,000 | | | City of Chicago, General Obligation—Series A
5.000%, 01/01/2018 | | | 138,514 | |
The accompanying notes are an integral part of these financial statements.
61
Alpine High Yield Managed Duration Municipal Fund
Schedule of Portfolio Investments—Continued
April 30, 2016 (Unaudited)
| Principal | | | Security | | | |
| Amount | | | Description | | Value | |
| | | | | | | | | |
| Municipal Bonds—continued | | | | |
| Illinois—continued | | | | |
| $ | 10,000 | | | City of Chicago, General Obligation—Series A
(CS: Assured Guaranty Municipal)
5.000%, 01/01/2023 | | $ | 10,032 | |
| | 70,000 | | | City of Chicago, General Obligation—Series B
(CS: Assured Guaranty Municipal)
5.000%, 01/01/2018 | | | 71,152 | |
| | 40,000 | | | City of Chicago, General Obligation—Series B
(CS: Assured Guaranty Municipal)
5.000%, 01/01/2026 | | | 40,127 | |
| | 1,000,000 | | | City of Chicago, General Obligation—Series B
(CS: Assured Guaranty Municipal)
5.000%, 01/01/2027 | | | 1,011,970 | |
| | 600,000 | | | Cook County School District No. 144, Prairie Hills—Series A
4.000%, 12/01/2033 | | | 622,176 | |
| | 310,000 | | | Illinois Finance Authority Educational Facility Revenue, Senior Rogers Park Montessori School Project
5.000%, 02/01/2024 | | | 322,394 | |
| | 685,000 | | | Illinois Finance Authority Revenue, Refunding Christian Homes
(CS: Christian Homes, Inc. Obligation)
5.000%, 05/15/2031 | | | 765,131 | |
| | 440,000 | | | Illinois Finance Authority, Belmont School Project
4.500%, 12/01/2020 (a) | | | 447,080 | |
| | 635,000 | | | Macon & De Witt Counties Community Unit School District No. 2 Maroa-Forsyth, General Obligation
4.500%, 10/01/2018 | | | 645,560 | |
| | 150,000 | | | Southwestern Development Authority, Memorial Group, Inc.
5.750%, 11/01/2019 | | | 169,564 | |
| | 700,000 | | | State of Illinois, General Obligation
(CS: AMBAC)
5.000%, 04/01/2021 | | | 701,414 | |
| | 100,000 | | | State of Illinois, General Obligation
(CS: AMBAC)
5.000%, 11/01/2024 | | | 100,199 | |
| | 380,000 | | | State of Illinois, General Obligation—Series A
5.000%, 03/01/2017 | | | 381,201 | |
| | 50,000 | | | State of Illinois, General Obligation Refunding Bond
5.000%, 08/01/2021 | | | 55,532 | |
| | 180,000 | | | Stephenson County Revenue
(CS: AMBAC)
4.500%, 12/01/2020 | | | 188,660 | |
| | | | | | | | 8,233,948 | |
| Indiana—3.2% | | | | |
| | 100,000 | | | City of Anderson, Economic Development Revenue, Anderson University Project
5.000%, 10/01/2024 | | | 100,871 | |
| Principal | | | Security | | | |
| Amount | | | Description | | Value | |
| | | | | | | | | |
| Municipal Bonds—continued | | | | |
| Indiana—continued | | | | |
| $ | 250,000 | | | City of Valparaiso Exempt Facilities Revenue, Pratt Paper LLC Project
5.875%, 01/01/2024 | | $ | 295,650 | |
| | 1,000,000 | | | Hammond Local Public Improvement Bond Bank—Series B
3.250%, 05/01/2016 | | | 1,000,000 | |
| | 1,425,000 | | | Indiana Finance Authority Revenue, Private Activity OH River Bridge—Series B
(CS: Wvb East End Partners LLC)
5.000%, 01/01/2019 | | | 1,462,677 | |
| | 250,000 | | | Indiana Finance Authority, Educational Facilities Authority- Discovery Charter School Project
5.500%, 12/01/2025 | | | 250,183 | |
| | 225,000 | | | Indiana Finance Authority, King’s Daughters Hospital & Health Services
5.000%, 08/15/2020 | | | 251,174 | |
| | 50,000 | | | Indiana Finance Authority, United States Steel Corp.
6.000%, 12/01/2019 | | | 48,439 | |
| | | | | | | | 3,408,994 | |
| Iowa—2.2% | | | | |
| | 100,000 | | | City of Coralville, Certificate of Participation—Series D
5.250%, 06/01/2022 | | | 100,093 | |
| | 525,000 | | | City of Coralville, General Obligation
4.500%, 06/01/2034 | | | 540,094 | |
| | 1,150,000 | | | Iowa Finance Authority, Midwestern Disaster Area Revenue, Iowa Fert. Co.
5.000%, 12/01/2019 | | | 1,211,812 | |
| | 520,000 | | | Iowa Higher Education Loan Authority, Wartburg College Project
2.500%, 10/01/2020 | | | 513,568 | |
| | | | | | | | 2,365,567 | |
| Kansas—2.0% | | | | |
| | 800,000 | | | Kansas Independent College Finance Authority, Revenue Anticipation Notes, Bethany College—Series A
5.250%, 05/01/2016 | | | 800,000 | |
| | 1,000,000 | | | Kansas Independent College Finance Authority, Revenue Anticipation Notes, Ottawa University—Series C
4.850%, 05/01/2016 | | | 1,000,000 | |
| | 235,000 | | | Overland Park Development Corp. Revenue, Second Tier Convention Center Hotel—Series B
(CS: AMBAC)
5.125%, 01/01/2022 | | | 239,197 | |
| | 110,000 | | | Wichita Health Care Facilities Revenue, Temps-80-Presbyterian Manors—Series IV-B-1
4.250%, 11/15/2021 | | | 110,213 | |
| | | | | | | | 2,149,410 | |
The accompanying notes are an integral part of these financial statements.
62
Alpine High Yield Managed Duration Municipal Fund
Schedule of Portfolio Investments—Continued
April 30, 2016 (Unaudited)
| Principal | | | Security | | | |
| Amount | | | Description | | Value | |
| | | | | | | | | |
| Municipal Bonds—continued | | | | |
| Kentucky—1.4% | | | | |
| $ | 1,500,000 | | | Ohio County Revenue, Big Rivers Electric Project—Series A
(CS: Big Rivers Electric Corp.)
6.000%, 07/15/2031 | | $ | 1,513,095 | |
| Louisiana—4.7% | | | | |
| | 2,400,000 | | | East Baton Rouge Parish Industrial Development Board, Solid Waste Disposal, Georgia Pacific Corp. Project
0.590%, 06/01/2029
(Putable on 05/04/2016) (a)(b) | | | 2,400,000 | |
| | 2,100,000 | | | Jefferson Parish Industrial Development Board, Sara Lee Corp. Project
0.720%, 06/01/2024
(Putable on 05/02/2016) (b) | | | 2,100,000 | |
| | 250,000 | | | Louisiana Local Government Environmental Facilities & Community Development Authority, St James Place of Baton Rouge—Series A
5.500%, 11/15/2025 | | | 258,390 | |
| | 250,000 | | | Parish of St. Charles, Gulf Opportunity Zone Revenue, Valero Energy Corp.
4.000%, 12/01/2040
(Putable on 06/01/2022) (b) | | | 272,040 | |
| | | | | | | | 5,030,430 | |
| Maryland—2.4% | | | | |
| | 110,000 | | | Anne Arundel County, Consolidated Special Taxing District Bonds, Villages at Two Rivers Project
4.200%, 07/01/2024 | | | 113,159 | |
| | 500,000 | | | City of Westminster, Lutheran Village at Miller’s Grant, Inc.—Series C
4.375%, 07/01/2021 | | | 526,985 | |
| | 500,000 | | | City of Westminster, Lutheran Village at Miller’s Grant, Inc.—Series D
3.875%, 07/01/2019 | | | 514,445 | |
| | 1,445,000 | | | Maryland Economic Development Corp., CNX Marine Terminal, Inc.
5.750%, 09/01/2025 | | | 1,390,553 | |
| | | | | | | | 2,545,142 | |
| Massachusetts—0.5% | | | | |
| | 450,000 | | | Massachusetts Port Authority Facilities Revenue, Delta Air Lines, Inc. Project—Series A
(CS: AMBAC)
5.000%, 01/01/2021 | | | 450,954 | |
| | 30,000 | | | Massachusetts Port Authority Facilities Revenue, Delta Air Lines, Inc. Project—Series A
(CS: AMBAC)
5.500%, 01/01/2017 | | | 30,108 | |
| Principal | | | Security | | | |
| Amount | | | Description | | Value | |
| | | | | | | | | |
| Municipal Bonds—continued | | | | |
| Massachusetts—continued | | | | |
| $ | 50,000 | | | Massachusetts Port Authority Facilities Revenue, Delta Air Lines, Inc. Project—Series A
(CS: AMBAC)
5.500%, 01/01/2022 | | $ | 50,124 | |
| | | | | | | | 531,186 | |
| Michigan—3.6% | | | | |
| | 125,000 | | | Charyl Stockwell Academy Revenue
4.875%, 10/01/2023 | | | 126,506 | |
| | 385,000 | | | Jackson College Dormitories, College Housing Revenue
5.000%, 05/01/2021 | | | 403,022 | |
| | 700,000 | | | Michigan Finance Authority, Detroit School District
4.750%, 06/01/2016 (a) | | | 700,672 | |
| | 1,000,000 | | | Michigan Municipal Bond Authority, Local Government Public Improvement—Series A
(CS: AMBAC)
5.000%, 12/01/2018 | | | 1,026,280 | |
| | 790,000 | | | Michigan Strategic Fund Revenue, Genesee Power Station Project
7.500%, 01/01/2021 | | | 783,791 | |
| | 200,000 | | | Michigan Strategic Fund Revenue, United Methodist Retirement Communities, Inc. Project
5.125%, 11/15/2025 | | | 207,164 | |
| | 625,000 | | | Michigan Tobacco Settlement Finance Authority—Series A
5.125%, 06/01/2022 | | | 613,006 | |
| | | | | | | | 3,860,441 | |
| Minnesota—1.7% | | | | |
| | 540,000 | | | City of Blaine Revenue, Crest View Senior Community Project—Series A
5.125%, 07/01/2025 | | | 566,309 | |
| | 145,000 | | | City of Hugo, Charter School Lease Revenue, Noble Academy Project—Series A
4.000%, 07/01/2020 | | | 151,549 | |
| | 200,000 | | | City of International Falls Revenue, Boise Cascade Corp. Project
(CS: Officemax, Inc.)
5.650%, 12/01/2022 | | | 200,712 | |
| | 300,000 | | | City of Oak Park Heights, Nursing Home Revenue, Boutwells Landing Care Center Project
4.000%, 02/01/2020 | | | 312,042 | |
| | 500,000 | | | Rice County Revenue, St. Mary’s School—Series A
5.000%, 08/01/2022 (a) | | | 539,105 | |
| | | | | | | | 1,769,717 | |
| Mississippi—0.5% | | | | |
| | 500,000 | | | Mississippi Business Finance Corp., Northrop Grumman Ship System
4.550%, 12/01/2028
(Putable on 06/01/2016) (b) | | | 502,055 | |
The accompanying notes are an integral part of these financial statements.
63
Alpine High Yield Managed Duration Municipal Fund
Schedule of Portfolio Investments—Continued
April 30, 2016 (Unaudited)
| Principal | | | Security | | | |
| Amount | | | Description | | Value | |
| | | | | | | | | |
| Municipal Bonds—continued | | | | |
| Missouri—1.2% | | | | |
| $ | 250,000 | | | Saint Louis County Industrial Development Authority, Nazareth Living Center—Series B
3.850%, 08/15/2020 | | $ | 250,390 | |
| | 1,000,000 | | | State Louis County Industrial Development Authority, St. Andrews Resources for Seniors Obligated Group—Series B
3.125%, 12/01/2019 | | | 1,004,970 | |
| | | | | | | | 1,255,360 | |
| Nevada—0.2% | | | | |
| | 250,000 | | | City of North Las Vegas, Refunding Bonds, Water and Sewer System—Series B
(CS: AMBAC)
4.000%, 08/01/2017 | | | 250,007 | |
| New Hampshire—0.2% | | | | |
| | 250,000 | | | New Hampshire Business Finance Authority, Casella Waste Systems, Inc. Project
4.000%, 04/01/2029
(Putable on 10/01/2019) (a)(b) | | | 256,240 | |
| New Jersey—2.8% | | | | |
| | 415,000 | | | Atlantic City Municipal Utilities Authority, Refunding Water System—Series 2007
(CS: AMBAC)
4.000%, 06/01/2018 | | | 414,253 | |
| | 700,000 | | | New Jersey Economic Development Authority Revenue, Continental Airlines, Inc. Project
(CS: United Airlines, Inc.)
4.875%, 09/15/2019 | | | 741,216 | |
| | 100,000 | | | New Jersey Economic Development Authority, Charter School Revenue, Greater Brunswick Charter School Project—Series A
4.750%, 08/01/2024 (a) | | | 104,004 | |
| | 500,000 | | | New Jersey Economic Development Authority, Lions Gate Project—Series 2014
4.375%, 01/01/2024 | | | 521,380 | |
| | 125,000 | | | New Jersey Economic Development Authority, Private Activity-The Goethals Bridge Replacement Project
5.250%, 01/01/2025 | | | 145,411 | |
| | 55,000 | | | New Jersey Economic Development Authority, United Airlines, Inc. Project
5.500%, 04/01/2028 | | | 55,179 | |
| | 420,000 | | | New Jersey Tobacco Settlement Financing Corp. Revenue—Series A
4.500%, 06/01/2023 | | | 427,682 | |
| | 5,000 | | | Tobacco Settlement Financing Corp. Revenue—Series 1-A
4.625%, 06/01/2026 | | | 5,043 | |
| | 586,167 | | | Township of Irvington, Bond Anticipation Notes
3.250%, 06/17/2016 | | | 586,355 | |
| | | | | | | | 3,000,523 | |
| Principal | | | Security | | | |
| Amount | | | Description | | Value | |
| | | | | | | | | |
| Municipal Bonds—continued | | | | |
| New York—6.1% | | | | |
| $ | 240,000 | | | Broome County Industrial Development Agency Revenue, Parlor City Paper Bax
(CS: Parlor City Paper Box Co)
0.800%, 10/01/2016
(Putable on 05/05/2016) (b) | | $ | 240,000 | |
| | 1,150,000 | | | Nassau County Tobacco Settlement Corp. Revenue, Asset Brookfield—Series A-2
5.250%, 06/01/2026
(Putable on 06/01/2016) | | | 1,151,081 | |
| | 340,000 | | | New York City Industrial Development Agency Revenue, American Airlines, Inc.
7.500%, 08/01/2016 | | | 345,270 | |
| | 500,000 | | | New York City Industrial Development Agency Revenue, American Airlines, Inc.—Series B
2.000%, 08/01/2028
(Putable on 08/01/2016) (b) | | | 500,825 | |
| | 300,000 | | | New York State Dormitory Authority, Orange Regional Medical Center
6.000%, 12/01/2016 | | | 308,646 | |
| | 100,000 | | | New York State Dormitory Authority, Pace University— Series A
4.000%, 05/01/2016 | | | 100,000 | |
| | 165,000 | | | New York State Dormitory Authority, Yeshiva University
3.500%, 09/01/2016 | | | 166,139 | |
| | 15,000 | | | New York State Dormitory Authority, Yeshiva University
(CS: Yeshiva University)
5.000%, 09/01/2017 | | | 15,690 | |
| | 440,000 | | | New York State Dormitory Authority, Yeshiva University— Series A
5.000%, 11/01/2018 | | | 472,408 | |
| | 95,000 | | | New York State Dormitory Authority, Yeshiva University— Series A
(CS: Yeshiva University)
5.000%, 11/01/2019 | | | 102,102 | |
| | 100,000 | | | Onondaga Civic Development Corp., St Joseph’s Hospital Health Center Project—Series A
4.625%, 07/01/2022 | | | 111,572 | |
| | 100,000 | | | Onondaga Civic Development Corp., St Joseph’s Hospital Health Center Project—Series A
5.000%, 07/01/2019 | | | 110,021 | |
| | 115,000 | | | Suffolk Tobacco Asset Securitization Corp., General Obligation—Series A
5.000%, 06/01/2018 | | | 122,097 | |
| | 1,075,000 | | | Town of Oyster Bay, Bond Anticipation Notes General Obligation—Series A
2.750%, 02/03/2017 | | | 1,081,514 | |
The accompanying notes are an integral part of these financial statements.
64
Alpine High Yield Managed Duration Municipal Fund
Schedule of Portfolio Investments—Continued
April 30, 2016 (Unaudited)
| Principal | | | Security | | | |
| Amount | | | Description | | Value | |
| | | | | | | | | |
| Municipal Bonds—continued | | | | |
| New York—continued | | | | |
| $ | 425,000 | | | Town of Oyster Bay, General Obligation Public Improvement
3.000%, 08/15/2017 | | $ | 423,389 | |
| | 975,000 | | | Town of Oyster Bay, General Obligation Public Improvement—Series A
3.500%, 03/15/2017 | | | 977,360 | |
| | 300,000 | | | TSASC, Inc.—Series 1
5.000%, 06/01/2026 | | | 300,675 | |
| | | | | | | | 6,528,789 | |
| North Carolina—0.5% | | | | |
| | 500,000 | | | North Carolina Capital Facilities Finance Agency, Solid Waste Disposal Revenue, Republic Services, Inc. Project—Series B
0.700%, 12/01/2020
(Putable on 06/01/2016) (b) | | | 500,000 | |
| North Dakota—0.8% | | | | |
| | 300,000 | | | City of Bowman, Southwest Healthcare Services Project, Revenue Anticipation Notes—Series A
2.500%, 02/15/2017 | | | 300,099 | |
| | 500,000 | | | City of Hazen Revenue, Sakakawea Medical Center Project
2.500%, 07/01/2017 | | | 500,350 | |
| | | | | | | | 800,449 | |
| Ohio—3.7% | | | | |
| | 910,000 | | | Buckeye Tobacco Settlement Financing Authority—Series A
5.125%, 06/01/2024 | | | 875,902 | |
| | 1,100,000 | | | Buckeye Tobacco Settlement Financing Authority—Series A-2
5.375%, 06/01/2024 | | | 1,064,635 | |
| | 400,000 | | | City of Cleveland, Airport Special Revenue, United Airlines, Inc.
5.375%, 09/15/2027 | | | 401,216 | |
| | 255,000 | | | Licking County Revenue, Kendal Granville Obligation Group—Series B
3.750%, 07/01/2020 | | | 255,253 | |
| | 200,000 | | | Ohio Air Quality Development Authority, AK Steel Corp. Project
6.750%, 06/01/2024 | | | 164,538 | |
| | 400,000 | | | Ohio Air Quality Development Authority, First Energy Nuclear Generation Project—Series C
3.950%, 11/01/2032
(Putable on 05/01/2020) (b) | | | 415,264 | |
| | 300,000 | | | Ohio State Water Development Authority—Series B
4.000%, 01/01/2034
(Putable on 07/01/2021) (b) | | | 317,910 | |
| | 125,000 | | | Ohio Water Development Authority Revenue, Refunding First Energy—Series A
(CS: Firstenergy Nuclear Gnrtn)
5.875%, 06/01/2033
(Putable on 06/01/2016) (b) | | | 125,431 | |
| Principal | | | Security | | | |
| Amount | | | Description | | Value | |
| | | | | | | | | |
| Municipal Bonds—continued | | | | |
| Ohio—continued | | | | |
| $ | 265,000 | | | Southeastern Ohio Port Authority, Memorial Health System
5.000%, 12/01/2016 | | $ | 269,288 | |
| | | | | | | | 3,889,437 | |
| Oklahoma—0.0% (c) | | | | |
| | 50,000 | | | Tulsa Industrial Authority—Series A
(CS: NATL-RE)
6.000%, 10/01/2016 | | | 51,127 | |
| Oregon—0.2% | | | | |
| | 80,000 | | | Hospital Facilities Authority of Multnomah County Oregon, Mirabella At South Waterfront Project—Series A
5.000%, 10/01/2019 | | | 85,211 | |
| | 100,000 | | | Hospital Facilities Authority of Multnomah County Oregon, Mirabella At South Waterfront Project—Series A
5.000%, 10/01/2024 | | | 114,924 | |
| | | | | | | | 200,135 | |
| Pennsylvania—11.3% | | | | |
| | 1,890,000 | | | Allegheny County Industrial Development Authority, Environmental Improvement Revenue, United States Steel Corp.
5.500%, 11/01/2016 | | | 1,903,646 | |
| | 1,750,000 | | | Allegheny County Industrial Development Authority, Environmental Improvement Revenue, United States Steel Corp.
6.500%, 05/01/2017 | | | 1,783,565 | |
| | 325,000 | | | Chester County Health & Education Facilities Authority, Simpson Senior Services Project
5.000%, 12/01/2025 | | | 351,708 | |
| | 1,000,000 | | | Delaware County Authority Revenue, Eastern University
5.000%, 10/01/2027 | | | 1,020,270 | |
| | 505,000 | | | Delaware County Authority Revenue, Eastern University
(CS: Eastern University)
4.000%, 10/01/2019 | | | 517,277 | |
| | 800,000 | | | Fulton County Industrial Development Authority Revenue, Medical Center Project
4.000%, 07/01/2028 | | | 799,968 | |
| | 100,000 | | | Indiana County Hospital Authority, Regional Medical Center—Series A
5.000%, 06/01/2023 | | | 114,444 | |
| | 235,000 | | | Lancaster Industrial Development Authority, Davco Family—Series A
(SPA: Fulton Bank)
0.850%, 01/15/2023
(Putable on 05/05/2016) (b) | | | 235,000 | |
| | 1,000,000 | | | Luzerne County, Tax Revenue Anticipation Notes
3.375%, 06/30/2016 | | | 999,590 | |
The accompanying notes are an integral part of these financial statements.
65
Alpine High Yield Managed Duration Municipal Fund
Schedule of Portfolio Investments—Continued
April 30, 2016 (Unaudited)
| Principal | | | Security | | | |
| Amount | | | Description | | Value | |
| | | | | | | | | |
| Municipal Bonds—continued | | | | |
| Pennsylvania—continued | | | | |
| $ | 400,000 | | | Moon Industrial Development Authority, Baptist Homes Society Obligation
5.000%, 07/01/2020 | | $ | 418,676 | |
| | 1,400,000 | | | Pennsylvania Economic Development Financing Authority, Colver Project
5.000%, 12/01/2037
(Putable on 09/01/2020) (b) | | | 1,433,222 | |
| | 325,000 | | | Pennsylvania Economic Development Financing Authority, Shippingport Project—Series A
(CS: Firstenergy Solutions)
2.550%, 11/01/2041
(Putable on 12/03/2018) (b) | | | 326,615 | |
| | 695,000 | | | Philadelphia Authority for Industrial Development Revenue, Discovery Charter School Project
(CS: Discovery Charter School)
5.000%, 04/01/2022 | | | 685,200 | |
| | 800,000 | | | Philadelphia Authority for Industrial Development Revenue, Kipp Philadelphia Charter School Project—Series A
(CS: Kipp Philadelphia Charter)
4.000%, 04/01/2026 | | | 794,800 | |
| | 70,000 | | | Philadelphia Authority for Industrial Development, Discovery Charter School Project
4.000%, 04/01/2017 | | | 69,237 | |
| | 380,000 | | | Philadelphia Hospitals & Higher Education Facilities Authority, Refunding-Temple University Health System—Series B
5.500%, 07/01/2026 | | | 390,762 | |
| | 200,000 | | | Pottsville Hospital Facilities Authority, Schuylkill Health System Project
5.750%, 07/01/2022 | | | 216,768 | |
| | | | | | | | 12,060,748 | |
| Puerto Rico—5.2% | | | | |
| | 210,000 | | | Commonwealth of Puerto Rico
(CS: Assured Guaranty Municipal)
5.500%, 07/01/2018 | | | 219,763 | |
| | 500,000 | | | Commonwealth of Puerto Rico—Series A
(CS: NATL-RE)
5.500%, 07/01/2020 | | | 528,415 | |
| | 15,000 | | | Commonwealth of Puerto Rico, General Obligation Bonds
(CS: Assured Guaranty Municipal)
5.250%, 07/01/2016 | | | 15,097 | |
| | 175,000 | | | Commonwealth of Puerto Rico, General Obligation Bonds
(CS: NATL-RE)
6.000%, 07/01/2016 | | | 176,333 | |
| Principal | | | Security | | | |
| Amount | | | Description | | Value | |
| | | | | | | | | |
| Municipal Bonds—continued | | | | |
| Puerto Rico—continued | | | | |
| $ | 1,030,000 | | | Commonwealth of Puerto Rico, General Obligation Bonds—Series A
(CS: NATL-RE)
5.500%, 07/01/2020 | | $ | 1,088,535 | |
| | 115,000 | | | Commonwealth of Puerto Rico, Public Improvement
(CS: Assured Guaranty Municipal)
5.500%, 07/01/2019 | | | 120,935 | |
| | 300,000 | | | Commonwealth of Puerto Rico, Public Improvement—Series A
(CS: Assured Guaranty Municipal)
5.000%, 07/01/2017 | | | 309,372 | |
| | 475,000 | | | Commonwealth of Puerto Rico, Public Improvement—Series A
(CS: NATL-RE)
5.500%, 07/01/2016 | | | 478,244 | |
| | 150,000 | | | Commonwealth of Puerto Rico, Public Improvement—Series A
(CS: NATL-RE)
5.500%, 07/01/2018 | | | 156,336 | |
| | 580,000 | | | Commonwealth of Puerto Rico, Public Improvement—Series A
5.500%, 07/01/2019 | | | 609,934 | |
| | 125,000 | | | Commonwealth of Puerto Rico, Public Improvement—Series A
5.500%, 07/01/2021 | | | 132,146 | |
| | 100,000 | | | Puerto Rico Electric Power Authority—Series A
(CS: Assured Guaranty Municipal)
5.000%, 08/01/2020 | | | 100,958 | |
| | 200,000 | | | Puerto Rico Electric Power Authority—Series LL
(CS: NATL-RE)
5.500%, 07/01/2017 | | | 204,958 | |
| | 155,000 | | | Puerto Rico Electric Power Authority—Series SS
(CS: NATL-RE)
5.000%, 07/01/2020 | | | 156,488 | |
| | 250,000 | | | Puerto Rico Electric Power Authority—Series UU
(CS: Assured Guaranty Municipal)
5.000%, 07/01/2020 | | | 252,790 | |
| | 205,000 | | | Puerto Rico Electric Power Authority Revenue—Series PP
5.000%, 07/01/2023 | | | 206,501 | |
| | 260,000 | | | Puerto Rico Electric Power Authority Revenue—Series SS
5.000%, 07/01/2022 | | | 262,213 | |
| | 235,000 | | | Puerto Rico Electric Power Authority Revenue—Series SS
4.000%, 07/01/2019 | | | 235,023 | |
| | 200,000 | | | Puerto Rico Highways & Transportation Authority Revenue—Series E
5.500%, 07/01/2023 | | | 208,496 | |
| | 80,000 | | | Puerto Rico Industrial Development Company Revenue—Series B
(CS: NATL-RE)
5.375%, 07/01/2016 | | | 80,216 | |
| | | | | | | | 5,542,753 | |
The accompanying notes are an integral part of these financial statements.
66
Alpine High Yield Managed Duration Municipal Fund
Schedule of Portfolio Investments—Continued
April 30, 2016 (Unaudited)
| Principal | | | Security | | | |
| Amount | | | Description | | Value | |
| | | | | | | | | |
| Municipal Bonds—continued | | | | |
| Rhode Island—0.1% | | | | |
| $ | 100,000 | | | Rhode Island Health & Educational Building Corp. Revenue, Hospital Financing-Care New England— Series A
5.000%, 09/01/2021 | | $ | 108,540 | |
| South Carolina—0.2% | | | | |
| | 85,000 | | | Clarendon Hospital District, General Obligation
4.250%, 04/01/2017 | | | 84,872 | |
| | 85,000 | | | Clarendon Hospital District, General Obligation
4.500%, 04/01/2018 | | | 85,429 | |
| | 65,000 | | | South Carolina Jobs-Economic Development Authority, Palmetto Health
5.000%, 08/01/2019 | | | 71,909 | |
| | | | | | | | 242,210 | |
| Tennessee—3.6% | | | | |
| | 3,430,000 | | | Sevier County Public Building Authority, Local Government Public Improvement
(CS: AMBAC, LOC: KBC Bank NV)
2.700%, 06/01/2026
(Putable on 05/05/2016) (b) | | | 3,430,000 | |
| | 345,000 | | | Tennessee Energy Acquisition Corp. Revenue—Series A
(CS: Goldman Sachs & Co.)
5.250%, 09/01/2018 | | | 376,685 | |
| | | | | | | | 3,806,685 | |
| Texas—8.7% | | | | |
| | 650,000 | | | Arlington Higher Education Finance Corp. Revenue, Newman International Academy—Series A
4.375%, 08/15/2026 | | | 651,300 | |
| | 500,000 | | | Board of Managers Joint Guadalupe County-City of Seguin Hospital Revenue
5.000%, 12/01/2021 | | | 558,320 | |
| | 150,000 | | | City of Houston Airport System, United Airlines, Inc.—Series C
5.000%, 07/15/2020 | | | 165,226 | |
| | 200,000 | | | City of Houston Airport System, United Airlines, Inc. Terminal E Project
4.500%, 07/01/2020 | | | 219,264 | |
| | 215,000 | | | City of Rowlett, Bayside Public Improvement District
4.900%, 09/15/2024 | | | 215,866 | |
| | 1,300,000 | | | Dallas-Fort Worth International Airport Facilities Improvement Corp. Revenue, Airport Facility, FlightSafety Texas, Inc. Project
(CS: Obh LLC)
0.420%, 07/01/2032
(Putable on 05/05/2016) (b) | | | 1,300,000 | |
| | 75,000 | | | Decatur Hospital Authority, Wise Regional Health System.—Series A
5.000%, 09/01/2023 | | | 83,543 | |
| Principal | | | Security | | | |
| Amount | | | Description | | Value | |
| | | | | | | | | |
| Municipal Bonds—continued | | | | |
| Texas—continued | | | | |
| $ | 50,000 | | | Gulf Coast Waste Disposal Authority, U.S. Steel Corp. Project
5.750%, 09/01/2017 | | $ | 50,792 | |
| | 170,000 | | | Harris County Cultural Education Facilities Finance Corp. Revenue, Willow Winds Project—Series A
5.000%, 10/01/2023 | | | 189,074 | |
| | 570,000 | | | Hidalgo County Health Services Corp., Hospital Revenue, Mission Hospital, Inc.—Series 2008
5.000%, 08/15/2016 | | | 571,801 | |
| | 500,000 | | | Mission Economic Development Corp. Revenue, Senior Lien Natgasoline Project—Series B
5.750%, 10/01/2031 (a) | | | 520,875 | |
| | 210,000 | | | Orchard Higher Education Finance Corp. Revenue, Nyos Charter School, Inc.—Series A
4.875%, 02/15/2023 | | | 210,139 | |
| | 1,200,000 | | | Port Beaumont Navigation District Revenue, Jefferson Energy Co. Project
(CS: Jefferson Railport Llc; SPA: See Notes)
7.250%, 02/01/2036
(Putable on 02/13/2020) (a)(b) | | | 1,238,100 | |
| | 320,000 | | | Red River Health Facilities Development Corp. Revenue, TEMPS-MRC Crossings Project—Series B-1
6.125%, 11/15/2020 | | | 320,819 | |
| | 80,000 | | | SA Energy Acquisition Public Facility Corp. Revenue, Gas Supply Revenue
(CS: Goldman Sachs & Co.)
5.500%, 08/01/2022 | | | 96,142 | |
| | 50,000 | | | SA Energy Acquisition Public Facility Corp. Revenue, Gas Supply Revenue
(CS: Goldman Sachs & Co.)
5.500%, 08/01/2023 | | | 60,727 | |
| | 500,000 | | | Tarrant County Cultural Education Facilities Finance Corp. Revenue, Buckingham Senior Living Project
3.875%, 11/15/2020 | | | 505,370 | |
| | 1,700,000 | | | Texas Municipal Gas Acquisition & Supply Corp. I Revenue, Sr. Lien—Series D
(CS: Merrill Lynch)
6.250%, 12/15/2026 | | | 2,149,412 | |
| | 100,000 | | | Texas Public Finance Authority, Refunding, Southern University Financing System
5.000%, 11/01/2021 | | | 114,298 | |
| | | | | | | | 9,221,068 | |
| Utah—0.2% | | | | |
| | 160,000 | | | Utah Charter School Finance, George Washington Academy—Series A
6.375%, 07/15/2018 | | | 165,040 | |
The accompanying notes are an integral part of these financial statements.
67
Alpine High Yield Managed Duration Municipal Fund
Schedule of Portfolio Investments—Continued
April 30, 2016 (Unaudited)
| Principal | | | Security | | | |
| Amount | | | Description | | Value | |
| | | | | | | | | |
| Municipal Bonds—continued | | | | |
| Vermont—0.4% | | | | |
| $ | 400,000 | | | Vermont Student Assistance Corp. Education Loan Revenue—Series A
3.000%, 06/15/2019 | | $ | 407,516 | |
| Virginia—2.7% | | | | |
| | 2,900,000 | | | Campbell County Industrial Development Authority, Solid Waste Disposal Facility Revenue, Georgia Pacific Corp. Project
0.590%, 12/01/2019
(Putable on 05/04/2016) (a)(b) | | | 2,900,000 | |
| Washington—1.7% | | | | |
| | 425,000 | | | Chelan County Development Corp., Pollution Control Alcoa Project
5.850%, 12/01/2031 | | | 425,905 | |
| | 180,000 | | | Washington Housing Finance Commission Revenue, Presbyterian Retirement Communities Northwest Project
5.000%, 01/01/2023 | | | 190,510 | |
| | 400,000 | | | Washington Housing Finance Commission, Rockwood Retirement Communities Project—Series B-1
5.875%, 01/01/2021 (a) | | | 400,604 | |
| | 800,000 | | | Washington Housing Finance Commission, TEMPS 65-Heron’s Key Senior Living
4.875%, 01/01/2022 (a) | | | 810,888 | |
| | | | | | | | 1,827,907 | |
| Principal | | | Security | | | |
| Amount | | | Description | | Value | |
| | | | | | | | | |
| Municipal Bonds—continued | | | | |
| West Virginia—1.0% | | | | |
| $ | 1,000,000 | | | Ohio County WV Special District Excise Tax Revenue—Series B
4.375%, 03/01/2035 | | $ | 1,013,320 | |
| Wisconsin—0.8% | | | | |
| | 380,000 | | | Public Finance Authority Revenue, Glenridge Palmer Ranch—Series A
(CS: Glenridge On Palmer Ranch)
7.000%, 06/01/2020 | | | 420,006 | |
| | 200,000 | | | Public Finance Authority, Church Home Of Hartford
5.000%, 09/01/2025 (a) | | | 223,178 | |
| | 180,000 | | | Wisconsin Public Finance Authority, Roseman University of Health Sciences Project
5.000%, 04/01/2022 | | | 189,441 | |
| | | | | | | | 832,625 | |
| | | | | Total Municipal Bonds
(Cost $107,679,837) | | | 109,121,914 | |
| Short-Term Investments—0.1% | | | | |
| | 32,553 | | | Federated Municipal Obligation Fund, 0.31% | | | 32,553 | |
| | | | | Total Short-Term Investments
(Cost $32,553) | | | 32,553 | |
Total Investments
(Cost $107,712,390) (d)—102.6% | | | 109,154,467 | |
| Liabilities in Excess of Other Assets—(2.6)% | | | (2,719,100 | ) |
| TOTAL NET ASSETS 100.0% | | $ | 106,435,367 | |
Percentages are stated as a percent of net assets. |
| (a) | Restricted under Rule 144A of the Securities Act of 1933. These securities may be resold in transactions exempt from registration, normally to qualified institutional buyers. These securities have been determined to be liquid under guidelines established by the Board of Trustees. Liquid securities restricted under Rule 144A comprised 15.9% of the Fund’s net assets. |
| | |
| (b) | Variable Rate Security-The rate reported is the rate in effect as of April 30, 2016. |
| | |
| (c) | Amount is less than 0.05%. |
| | |
| (d) | See Note 7 for the cost of investments for federal tax purposes. |
| | |
AMBAC—American Municipal Bond Assurance Corp.
ARN—Auction Rate Note
CS—Credit Support
NATL-RE—Reinsurance provided by National Public Finance Guarantee Corp.
NV—Naamloze Vennootschap is the Dutch term for a public limited liability corporation.
SPA—Standby Purchase Agreement
XLCA—XL Capital Assurance, Inc.
The accompanying notes are an integral part of these financial statements.
68
Alpine Mutual Funds
Statements of Assets and Liabilities
April 30, 2016 (Unaudited)
| | | Dynamic | | | Rising | | Financial |
| | | Dividend | | | Dividend | | Services |
| | | Fund | | | Fund | | Fund |
| ASSETS: | | | | | | | | | | | | | | | | |
| Investments, at value(1) | | $ | 168,148,721 | | | | $ | 89,511,990 | | | | | $ | 16,964,206 | | |
| Foreign currencies, at value(2) | | | 880,307 | | | | | 20 | | | | | | 544 | | |
| Cash | | | 321 | | | | | 515 | | | | | | 22,046 | | |
| Receivable from investment securities sold | | | 790,242 | | | | | 760,860 | | | | | | 372,281 | | |
| Dividends and interest receivable | | | 858,181 | | | | | 123,100 | | | | | | 9,701 | | |
| Receivable from capital shares issued | | | 40,451 | | | | | 241 | | | | | | 255 | | |
| Unrealized appreciation on forward currency contracts | | | 167,965 | | | | | — | | | | | | 37,996 | | |
| Due from Adviser | | | 14,199 | | | | | 35 | | | | | | 9,222 | | |
| Prepaid expenses and other assets | | | 6,053 | | | | | 8,250 | | | | | | 1,329 | | |
| Total assets | | | 170,906,440 | | | | | 90,405,011 | | | | | | 17,417,580 | | |
| | | | | | | | | | | | | | | | | |
| LIABILITIES: | | | | | | | | | | | | | | | | |
| Payable for investment securities purchased | | | 3,927,356 | | | | | 615,596 | | | | | | 445,483 | | |
| Payable for distributions to shareholders | | | 272,084 | | | | | — | | | | | | — | | |
| Unrealized depreciation on forward currency contracts | | | 363,945 | | | | | — | | | | | | 76,241 | | |
| Payable for capital shares redeemed | | | 232,806 | | | | | — | | | | | | 11,435 | | |
| Accrued expenses and other liabilities: | | | | | | | | | | | | | | | | |
| Investment advisory fees (Note 6) | | | 135,597 | | | | | 74,369 | | | | | | 13,501 | | |
| Distribution fees (Note 5) | | | 6,786 | | | | | 16,847 | | | | | | 3,107 | | |
| Trustee fees | | | 5,807 | | | | | 752 | | | | | | 819 | | |
| Other | | | 356,471 | | | | | 57,012 | | | | | | 96,846 | | |
| Total liabilities | | | 5,300,852 | | | | | 764,576 | | | | | | 647,432 | | |
| Net Assets | | $ | 165,605,588 | | | | $ | 89,640,435 | | | | | $ | 16,770,148 | | |
| | | | | | | | | | | | | | | | | |
| NET ASSETS REPRESENTED BY: | | | | | | | | | | | | | | | | |
| Paid-in-capital | | $ | 1,255,458,459 | | | | $ | 78,979,999 | | | | | $ | 15,636,001 | | |
| Undistributed net investment income | | | 1,883,141 | | | | | 908,295 | | | | | | 24,838 | | |
| Accumulated net realized gain (loss) from investments and foreign currency transactions | | | (1,094,368,983 | ) | | | | 1,817,429 | | | | | | (105,133 | ) | |
| Net unrealized appreciation/(depreciation) on: | | | | | | | | | | | | | | | | |
| Investments | | | 2,841,396 | | | | | 7,934,735 | | | | | | 1,253,131 | | |
| Foreign currency translations | | | (208,425 | ) | | | | (23 | ) | | | | | (38,689 | ) | |
| Net Assets | | $ | 165,605,588 | | | | $ | 89,640,435 | | | | | $ | 16,770,148 | | |
| | | | | | | | | | | | | | | | | |
| Net asset value | | | | | | | | | | | | | | | | |
| Institutional Class | | | | | | | | | | | | | | | | |
| Net assets | | $ | 162,772,096 | | | | $ | 88,267,645 | | | | | $ | 13,958,927 | | |
| Shares outstanding | | | 46,301,868 | | | | | 6,051,897 | | | | | | 1,118,874 | | |
| Net asset value, offering price and redemption price per share* | | $ | 3.52 | | | | $ | 14.59 | | | | | $ | 12.48 | | |
| Class A | | | | | | | | | | | | | | | | |
| Net assets | | $ | 2,833,492 | | | | $ | 1,372,790 | | | | | $ | 2,811,221 | | |
| Shares outstanding | | | 805,034 | | | | | 94,137 | | | | | | 226,769 | | |
| Net asset value per share | | $ | 3.52 | | | | $ | 14.58 | | | | | $ | 12.40 | | |
| Maximum offering price per share (net asset value plus sales charge of 5.50% of offering price) | | $ | 3.72 | | | | $ | 15.43 | | | | | $ | 13.12 | | |
| * If applicable, redemption price per share may be reduced by a redemption fee. | | | | | | | | | | | | | | | | |
| (1) Total cost of investments | | $ | 165,307,325 | | | | $ | 81,577,255 | | | | | $ | 15,711,075 | | |
| (2) Total cost of foreign currencies | | $ | 880,307 | | | | $ | 19 | | | | | $ | 939 | | |
The accompanying notes are an integral part of these financial statements.
69
Alpine Mutual Funds
Statements of Assets and Liabilities—Continued
April 30, 2016 (Unaudited)
| | | | | | | | Ultra Short | | | | | | |
| | | | | | | | Municipal | | | High Yield |
| | | Small Cap | | Income | | | Managed Duration |
| | | Fund | | Fund | | | Municipal Fund |
| ASSETS: | | | | | | | | | | | | | | | | |
| Investments, at value(1) | | | $ | 12,695,870 | | | | $ | 1,079,200,014 | | | | $ | 109,154,467 | | |
| Cash | | | | 648 | | | | | — | | | | | — | | |
| Receivable from investment securities sold | | | | 173,238 | | | | | — | | | | | — | | |
| Dividends and interest receivable | | | | — | | | | | 4,307,804 | | | | | 1,426,291 | | |
| Receivable from capital shares issued | | | | 1,399 | | | | | 12,356,889 | | | | | 876,725 | | |
| Due from Adviser | | | | 4,454 | | | | | 223,292 | | | | | 14,282 | | |
| Prepaid expenses and other assets | | | | 6,203 | | | | | 42,656 | | | | | 6,680 | | |
| Total assets | | | | 12,881,812 | | | | | 1,096,130,655 | | | | | 111,478,445 | | |
| | | | | | | | | | | | | | | | | |
| LIABILITIES: | | | | | | | | | | | | | | | | |
| Payable for investment securities purchased | | | | 224,394 | | | | | 82,141,189 | | | | | 4,809,990 | | |
| Payable for distributions to shareholders | | | | — | | | | | — | | | | | 66,057 | | |
| Payable for capital shares redeemed | | | | 49,656 | | | | | 2,693,616 | | | | | 23,178 | | |
| Accrued expenses and other liabilities: | | | | | | | | | | | | | | | | |
| Investment advisory fees (Note 6) | | | | 10,259 | | | | | 412,612 | | | | | 51,953 | | |
| Distribution fees (Note 5) | | | | 1,620 | | | | | 81,026 | | | | | 20,768 | | |
| Trustee fees | | | | 398 | | | | | 25,532 | | | | | 564 | | |
| Other | | | | 33,794 | | | | | 1,172,690 | | | | | 70,568 | | |
| Total liabilities | | | | 320,121 | | | | | 86,526,665 | | | | | 5,043,078 | | |
| Net Assets | | | $ | 12,561,691 | | | | $ | 1,009,603,990 | | | | $ | 106,435,367 | | |
| | | | | | | | | | | | | | | | | |
| NET ASSETS REPRESENTED BY: | | | | | | | | | | | | | | | | |
| Paid-in-capital | | | $ | 21,030,013 | | | | $ | 1,009,834,355 | | | | $ | 105,174,303 | | |
| Undistributed (accumulated) net investment income (loss) | | | | (67,275 | ) | | | | (13 | ) | | | | 261 | | |
| Accumulated net realized gain (loss) from investments | | | | (8,455,432 | ) | | | | (211,199 | ) | | | | (181,274 | ) | |
| Net unrealized appreciation/(depreciation) on: | | | | | | | | | | | | | | | | |
| Investments | | | | 54,385 | | | | | (19,153 | ) | | | | 1,442,077 | | |
| Net Assets | | | $ | 12,561,691 | | | | $ | 1,009,603,990 | | | | $ | 106,435,367 | | |
| | | | | | | | | | | | | | | | | |
| Net asset value | | | | | | | | | | | | | | | | |
| Institutional Class | | | | | | | | | | | | | | | | |
| Net assets | | | $ | 11,758,200 | | | | $ | 824,452,156 | | | | $ | 79,497,069 | | |
| Shares outstanding | | | | 813,380 | | | | | 82,119,918 | | | | | 7,675,061 | | |
| Net asset value, offering price and redemption price per share* | | | $ | 14.46 | | | | $ | 10.04 | | | | $ | 10.36 | | |
| Class A | | | | | | | | | | | | | | | | |
| Net assets | | | $ | 803,491 | | | | $ | 185,151,834 | | | | $ | 26,938,298 | | |
| Shares outstanding | | | | 56,229 | | | | | 18,339,329 | | | | | 2,600,864 | | |
| Net asset value per share | | | $ | 14.29 | | | | $ | 10.10 | | | | $ | 10.36 | | |
| Maximum offering price per share (net asset value plus sales charge of 5.50%, 0.50% and 2.50%, respectively, of offering price) | | | $ | 15.12 | | | | $ | 10.15 | | | | $ | 10.63 | | |
| * If applicable, redemption price per share may be reduced by a redemption fee. | | | | | | | | | | | | | | | | |
| (1) Total cost of investments | | | $ | 12,641,485 | | | | $ | 1,079,219,167 | | | | $ | 107,712,390 | | |
The accompanying notes are an integral part of these financial statements.
70
Alpine Mutual Funds
Statements of Operations
For the six months ended April 30, 2016 (Unaudited)
| | | Dynamic | | Rising | | Financial |
| | | Dividend | | Dividend | | Services |
| | | Fund | | Fund | | Fund |
| INVESTMENT INCOME: | | | | | | | | | | | | | | | | | | |
| Dividend income | | | $ | 9,285,627 | | | | | $ | 3,027,523 | | | | | $ | 301,784 | | |
| Less: Foreign taxes withheld | | | | (155,822 | ) | | | | | (4,991 | ) | | | | | (574 | ) | |
| Interest income | | | | — | | | | | | 93 | | | | | | 13 | | |
| Total investment income | | | | 9,129,805 | | | | | | 3,022,625 | | | | | | 301,223 | | |
| | | | | | | | | | | | | | | | | | | |
| EXPENSES: | | | | | | | | | | | | | | | | | | |
| Investment advisory fee (Note 6) | | | | 836,861 | | | | | | 440,023 | | | | | | 104,381 | | |
| Transfer agent fees | | | | 143,906 | | | | | | 11,645 | | | | | | 29,298 | | |
| Distribution fees - Class A (Note 5) | | | | 3,903 | | | | | | 2,702 | | | | | | 5,427 | | |
| Administration fee (Note 6) | | | | 19,676 | | | | | | 10,292 | | | | | | 2,478 | | |
| Audit and tax fees | | | | 19,956 | | | | | | 13,721 | | | | | | 13,950 | | |
| Registration and filing fees | | | | 15,169 | | | | | | 10,460 | | | | | | 14,466 | | |
| Accounting and custody fees | | | | 23,955 | | | | | | 8,873 | | | | | | 6,490 | | |
| Printing and mailing fees | | | | 30,298 | | | | | | 5,689 | | | | | | 7,947 | | |
| Trustee fees | | | | 13,896 | | | | | | 4,906 | | | | | | 1,934 | | |
| Legal fees | | | | 5,179 | | | | | | 4,789 | | | | | | 2,501 | | |
| Interest (Note 2) | | | | 15,493 | | | | | | 11 | | | | | | 1,196 | | |
| Other fees | | | | 33,552 | | | | | | 5,725 | | | | | | 4,826 | | |
| Total expenses | | | | 1,161,844 | | | | | | 518,836 | | | | | | 194,894 | | |
| Less: Fee waivers and/or expense reimbursements (Note 6) | | | | (26,246 | ) | | | | | — | | | | | | (48,704 | ) | |
| Net expenses | | | | 1,135,598 | | | | | | 518,836 | | | | | | 146,190 | | |
| Net investment income | | | | 7,994,207 | | | | | | 2,503,789 | | | | | | 155,033 | | |
| | | | | | | | | | | | | | | | | | | |
| NET REALIZED AND UNREALIZED GAIN/(LOSS) ON INVESTMENTS AND FOREIGN CURRENCY: | | | | | | | | | | | | | | | | | | |
| Net realized gain/(loss) from: | | | | | | | | | | | | | | | | | | |
| Investments | | | | (4,719,376 | ) | | | | | 1,866,354 | | | | | | 395,473 | | |
| Foreign currency transactions | | | | 852,912 | | | | | | 1,824 | | | | | | 608 | | |
| Written options contracts | | | | — | | | | | | 35,626 | | | | | | — | | |
| Net realized gain/(loss) from investments and foreign currency | | | | (3,866,464 | ) | | | | | 1,903,804 | | | | | | 396,081 | | |
| Change in net unrealized depreciation on: | | | | | | | | | | | | | | | | | | |
| Investments | | | | (8,320,527 | ) | | | | | (5,151,999 | ) | | | | | (1,908,339 | ) | |
| Foreign currency translations | | | | (728,392 | ) | | | | | (28 | ) | | | | | (38,495 | ) | |
| Written options contracts | | | | — | | | | | | (13,026 | ) | | | | | — | | |
| Change in net unrealized depreciation on investments and foreign currency | | | | (9,048,919 | ) | | | | | (5,165,053 | ) | | | | | (1,946,834 | ) | |
| Net gain/(loss) on investments and foreign currency | | | | (12,915,383 | ) | | | | | (3,261,249 | ) | | | | | (1,550,753 | ) | |
| Increase (decrease) in net assets from operations | | | $ | (4,921,176 | ) | | | | $ | (757,460 | ) | | | | $ | (1,395,720 | ) | |
The accompanying notes are an integral part of these financial statements.
71
Alpine Mutual Funds
Statements of Operations—Continued
For the six months ended April 30, 2016 (Unaudited)
| | | | | | | | Ultra Short | | | | | |
| | | | | | | | Municipal | | High Yield |
| | | Small Cap | | Income | | Managed Duration |
| | | Fund | | Fund | | Municipal Fund |
| INVESTMENT INCOME: | | | | | | | | | | | | | | | | | | |
| Dividend income | | | $ | 80,967 | | | | | $ | — | | | | | $ | — | | |
| Interest income | | | | 39 | | | | | | 4,914,714 | | | | | | 1,571,736 | | |
| Total investment income | | | | 81,006 | | | | | | 4,914,714 | | | | | | 1,571,736 | | |
| | | | | | | | | | | | | | | | | | | |
| EXPENSES: | | | | | | | | | | | | | | | | | | |
| Investment advisory fee (Note 6) | | | | 63,465 | | | | | | 3,457,522 | | | | | | 279,654 | | |
| Transfer agent fees | | | | 7,822 | | | | | | 299,061 | | | | | | 5,002 | | |
| Distribution fees - Class A (Note 5) | | | | 1,286 | | | | | | 238,575 | | | | | | 19,282 | | |
| Administration fee (Note 6) | | | | 1,488 | | | | | | 114,340 | | | | | | 8,826 | | |
| Audit and tax fees | | | | 13,453 | | | | | | 47,674 | | | | | | 13,982 | | |
| Registration and filing fees | | | | 13,047 | | | | | | 41,406 | | | | | | 27,304 | | |
| Accounting and custody fees | | | | 2,197 | | | | | | 63,447 | | | | | | 3,617 | | |
| Printing and mailing fees | | | | 1,204 | | | | | | 62,485 | | | | | | — | | |
| Trustee fees | | | | 1,036 | | | | | | 72,995 | | | | | | 3,955 | | |
| Legal fees | | | | 1,230 | | | | | | 52,259 | | | | | | 679 | | |
| Compliance fees | | | | — | | | | | | 20,380 | | | | | | — | | |
| Other fees | | | | 1,607 | | | | | | 79,624 | | | | | | 12,968 | | |
| Total expenses | | | | 107,835 | | | | | | 4,549,768 | | | | | | 375,269 | | |
| Less: Fee waivers and/or expense reimbursements (Note 6) | | | | (21,897 | ) | | | | | (2,035,698 | ) | | | | | (72,373 | ) | |
| Net expenses | | | | 85,938 | | | | | | 2,514,070 | | | | | | 302,896 | | |
| Net investment income (loss) | | | | (4,932 | ) | | | | | 2,400,644 | | | | | | 1,268,840 | | |
| | | | | | | | | | | | | | | | | | | |
| NET REALIZED AND UNREALIZED GAIN/(LOSS) ON INVESTMENTS: | | | | | | | | | | | | | | | | | | |
| Net realized gain/(loss) from: | | | | | | | | | | | | | | | | | | |
| Investments | | | | (404,401 | ) | | | | | 63,200 | | | | | | (177,963 | ) | |
| Net realized gain/(loss) from investments | | | | (404,401 | ) | | | | | 63,200 | | | | | | (177,963 | ) | |
| Change in net unrealized appreciation/(depreciation) on: | | | | | | | | | | | | | | | | | | |
| Investments | | | | 98,982 | | | | | | (117,005 | ) | | | | | 867,953 | | |
| Net gain/(loss) on investments | | | | (305,419 | ) | | | | | (53,805 | ) | | | | | 689,990 | | |
| Increase (decrease) in net assets from operations | | | $ | (310,351 | ) | | | | $ | 2,346,839 | | | | | $ | 1,958,830 | | |
The accompanying notes are an integral part of these financial statements.
72
Alpine Mutual Funds
Statements of Changes in Net Assets
| | | Dynamic Dividend Fund |
| | | Six Months Ended | | Year Ended |
| | | April 30, 2016 | | October 31, 2015 |
| | | (Unaudited) | | | | | |
| OPERATIONS: | | | | | | | | | | | | |
| Net investment income | | | $ | 7,994,207 | | | | | $ | 12,676,067 | | |
| Net realized gain (loss) from: | | | | | | | | | | | | |
| Investments | | | | (4,719,376 | ) | | | | | 2,094,877 | | |
| Foreign currency transactions | | | | 852,912 | | | | | | 5,177,818 | | |
| Change in net unrealized appreciation/(depreciation) on: | | | | | | | | | | | | |
| Investments | | | | (8,320,527 | ) | | | | | (9,954,704 | ) | |
| Foreign currency translations | | | | (728,392 | ) | | | | | (2,274,026 | ) | |
| Increase (decrease) in net assets from operations | | | | (4,921,176 | ) | | | | | 7,720,032 | | |
| | | | | | | | | | | | | |
| DISTRIBUTIONS TO SHAREHOLDERS: | | | | | | | | | | | | |
| Distributions to Institutional Class Shareholders: | | | | | | | | | | | | |
| From net investment income | | | | (5,654,173 | ) | | | | | (12,083,554 | ) | |
| Distributions to Class A Shareholders: | | | | | | | | | | | | |
| From net investment income | | | | (102,945 | ) | | | | | (244,816 | ) | |
| Decrease in net assets from distributions to shareholders | | | | (5,757,118 | ) | | | | | (12,328,370 | ) | |
| | | | | | | | | | | | | |
| CAPITAL SHARE TRANSACTIONS (NOTE 3): | | | | | | | | | | | | |
| Net proceeds from shares sold | | | | 3,859,068 | | | | | | 14,993,760 | | |
| Dividends reinvested | | | | 4,065,246 | | | | | | 8,502,088 | | |
| Redemption fees (Note 2) | | | | 1,903 | | | | | | 2,198 | | |
| Cost of shares redeemed | | | | (17,691,476 | ) | | | | | (47,494,989 | ) | |
| Decrease in net assets from capital share transactions | | | | (9,765,259 | ) | | | | | (23,996,943 | ) | |
| Net decrease in net assets | | | | (20,443,553 | ) | | | | | (28,605,281 | ) | |
| | | | | | | | | | | | | |
| NET ASSETS: | | | | | | | | | | | | |
| Beginning of period | | | | 186,049,141 | | | | | | 214,654,422 | | |
| End of period* | | | $ | 165,605,588 | | | | | $ | 186,049,141 | | |
| * Including undistributed (accumulated) net investment income (loss) of: | | | $ | 1,883,141 | | | | | $ | (353,948 | ) | |
The accompanying notes are an integral part of these financial statements.
73
Alpine Mutual Funds
Statements of Changes in Net Assets—Continued
| | | Rising Dividend Fund |
| | | Six Months Ended | | Year Ended |
| | | April 30, 2016 | | October 31, 2015 |
| | | (Unaudited) | | | | | |
| OPERATIONS: | | | | | | | | | | | | |
| Net investment income | | | $ | 2,503,789 | | | | | $ | 206,199 | | |
| Net realized gain from: | | | | | | | | | | | | |
| Investments | | | | 1,901,980 | | | | | | 506,148 | | |
| Foreign currency transactions | | | | 1,824 | | | | | | 882 | | |
| Change in net unrealized appreciation/(depreciation) on: | | | | | | | | | | | | |
| Investments | | | | (5,151,999 | ) | | | | | (657,874 | ) | |
| Foreign currency translations | | | | (28 | ) | | | | | 75 | | |
| Written options contracts | | | | (13,026 | ) | | | | | 13,026 | | |
| Increase (decrease) in net assets from operations | | | | (757,460 | ) | | | | | 68,456 | | |
| | | | | | | | | | | | | |
| DISTRIBUTIONS TO SHAREHOLDERS: | | | | | | | | | | | | |
| Distributions to Institutional Class Shareholders: | | | | | | | | | | | | |
| From net investment income | | | | (1,568,816 | ) | | | | | (170,683 | ) | |
| From net realized gain on investments | | | | (570,498 | ) | | | | | (199,861 | ) | |
| Distributions to Class A Shareholders: | | | | | | | | | | | | |
| From net investment income | | | | (37,628 | ) | | | | | (59,375 | ) | |
| From net realized gain on investments | | | | (14,980 | ) | | | | | (84,793 | ) | |
| Decrease in net assets from distributions to shareholders | | | | (2,191,922 | ) | | | | | (514,712 | ) | |
| | | | | | | | | | | | | |
| CAPITAL SHARE TRANSACTIONS (NOTE 3): | | | | | | | | | | | | |
| Net proceeds from shares sold | | | | 590,548 | | | | | | 3,356,210 | | |
| Proceeds from shares issued in connection with the tax-free transfer of assets from Alpine Transformation Fund (Note 8) | | | | — | | | | | | 7,799,629 | | |
| Proceeds from shares issued in connection with the tax-free transfer of assets from Alpine Equity Income Fund (Note 8) | | | | — | | | | | | 77,440,536 | | |
| Dividends reinvested | | | | 2,168,023 | | | | | | 468,937 | | |
| Redemption fees (Note 2) | | | | 70 | | | | | | — | | |
| Cost of shares redeemed | | | | (2,652,541 | ) | | | | | (1,485,856 | ) | |
| Increase in net assets from capital share transactions | | | | 106,100 | | | | | | 87,579,456 | | |
| Net increase (decrease) in net assets | | | | (2,843,282 | ) | | | | | 87,133,200 | | |
| | | | | | | | | | | | | |
| NET ASSETS: | | | | | | | | | | | | |
| Beginning of period | | | | 92,483,717 | | | | | | 5,350,517 | | |
| End of period* | | | $ | 89,640,435 | | | | | $ | 92,483,717 | | |
| * Including undistributed net investment income of: | | | $ | 908,295 | | | | | $ | 10,950 | | |
The accompanying notes are an integral part of these financial statements.
74
Alpine Mutual Funds
Statements of Changes in Net Assets—Continued
| | | Financial Services Fund |
| | | Six Months Ended | | Year Ended |
| | | April 30, 2016 | | October 31, 2015 |
| | | (Unaudited) | | | | | |
| OPERATIONS: | | | | | | | | | | | | |
| Net investment income | | | $ | 155,033 | | | | | $ | 165,951 | | |
| Net realized gain (loss) from: | | | | | | | | | | | | |
| Investments | | | | 395,473 | | | | | | (16,039 | ) | |
| Foreign currency transactions | | | | 608 | | | | | | (41,924 | ) | |
| Change in net unrealized appreciation/(depreciation) on: | | | | | | | | | | | | |
| Investments | | | | (1,908,339 | ) | | | | | (896,534 | ) | |
| Foreign currency translations | | | | (38,495 | ) | | | | | 187 | | |
| Decrease in net assets from operations | | | | (1,395,720 | ) | | | | | (788,359 | ) | |
| | | | | | | | | | | | | |
| DISTRIBUTIONS TO SHAREHOLDERS: | | | | | | | | | | | | |
| Distributions to Institutional Class Shareholders: | | | | | | | | | | | | |
| From net investment income | | | | (285,431 | ) | | | | | (15,838 | ) | |
| From net realized gain on investments | | | | — | | | | | | (291,458 | ) | |
| Distributions to Class A Shareholders: | | | | | | | | | | | | |
| From net investment income | | | | (70,527 | ) | | | | | (4,306 | ) | |
| From net realized gain on investments | | | | — | | | | | | (79,233 | ) | |
| Decrease in net assets from distributions to shareholders | | | | (355,958 | ) | | | | | (390,835 | ) | |
| | | | | | | | | | | | | |
| CAPITAL SHARE TRANSACTIONS (NOTE 3): | | | | | | | | | | | | |
| Net proceeds from shares sold | | | | 1,350,820 | | | | | | 5,873,328 | | |
| Dividends reinvested | | | | 207,008 | | | | | | 218,645 | | |
| Redemption fees (Note 2) | | | | 261 | | | | | | 2,385 | | |
| Cost of shares redeemed | | | | (8,331,419 | ) | | | | | (15,882,712 | ) | |
| Decrease in net assets from capital share transactions | | | | (6,773,330 | ) | | | | | (9,788,354 | ) | |
| Net decrease in net assets | | | | (8,525,008 | ) | | | | | (10,967,548 | ) | |
| | | | | | | | | | | | | |
| NET ASSETS: | | | | | | | | | | | | |
| Beginning of period | | | | 25,295,156 | | | | | | 36,262,704 | | |
| End of period* | | | $ | 16,770,148 | | | | | $ | 25,295,156 | | |
| * Including undistributed net investment income of: | | | $ | 24,838 | | | | | $ | 225,763 | | |
The accompanying notes are an integral part of these financial statements.
75
Alpine Mutual Funds
Statements of Changes in Net Assets—Continued
| | | Small Cap Fund |
| | | Six Months Ended | | Year Ended |
| | | April 30, 2016 | | October 31, 2015 |
| | | (Unaudited) | | | | | |
| OPERATIONS: | | | | | | | | | | | | |
| Net investment loss | | | $ | (4,932 | ) | | | | $ | (52,056 | ) | |
| Net realized gain (loss) from: | | | | | | | | | | | | |
| Investments | | | | (404,401 | ) | | | | | (227,094 | ) | |
| Foreign currency transactions | | | | — | | | | | | 77 | | |
| Change in net unrealized appreciation on: | | | | | | | | | | | | |
| Investments | | | | 98,982 | | | | | | 926,881 | | |
| Foreign currency translations | | | | — | | | | | | 9 | | |
| Increase (decrease) in net assets from operations | | | | (310,351 | ) | | | | | 647,817 | | |
| | | | | | | | | | | | | |
| CAPITAL SHARE TRANSACTIONS (NOTE 3): | | | | | | | | | | | | |
| Net proceeds from shares sold | | | | 278,551 | | | | | | 913,271 | | |
| Redemption fees (Note 2) | | | | — | | | | | | 892 | | |
| Cost of shares redeemed | | | | (1,235,191 | ) | | | | | (2,544,087 | ) | |
| Decrease in net assets from capital share transactions | | | | (956,640 | ) | | | | | (1,629,924 | ) | |
| Net decrease in net assets | | | | (1,266,991 | ) | | | | | (982,107 | ) | |
| NET ASSETS: | | | | | | | | | | | | |
| Beginning of period | | | | 13,828,682 | | | | | | 14,810,789 | | |
| End of period* | | | $ | 12,561,691 | | | | | $ | 13,828,682 | | |
| * Including accumulated net investment loss of: | | | $ | (67,275 | ) | | | | $ | (62,343 | ) | |
The accompanying notes are an integral part of these financial statements.
76
Alpine Mutual Funds
Statements of Changes in Net Assets—Continued
| | | Ultra Short Municipal Income Fund |
| | | Six Months Ended | | Year Ended |
| | | April 30, 2016 | | October 31, 2015 |
| | | (Unaudited) | | |
| OPERATIONS: | | | | | | | | | | | | |
| Net investment income | | | $ | 2,400,644 | | | | | $ | 4,629,271 | | |
| Net realized gain from investments | | | | 63,200 | | | | | | 149,302 | | |
| Change in unrealized depreciation on investments | | | | (117,005 | ) | | | | | (14,807 | ) | |
| Increase in net assets from operations | | | | 2,346,839 | | | | | | 4,763,766 | | |
| | | | | | | | | | | | | |
| DISTRIBUTIONS TO SHAREHOLDERS: | | | | | | | | | | | | |
| Distributions to Institutional Class Shareholders: | | | | | | | | | | | | |
| From net investment income | | | | (2,125,554 | ) | | | | | (4,076,167 | ) | |
| Distributions to Class A Shareholders: | | | | | | | | | | | | |
| From net investment income | | | | (275,082 | ) | | | | | (553,131 | ) | |
| Decrease in net assets from distributions to shareholders | | | | (2,400,636 | ) | | | | | (4,629,298 | ) | |
| | | | | | | | | | | | | |
| CAPITAL SHARE TRANSACTIONS (NOTE 3): | | | | | | | | | | | | |
| Net proceeds from shares sold | | | | 301,507,173 | | | | | | 366,438,670 | | |
| Dividends reinvested | | | | 1,900,476 | | | | | | 3,637,200 | | |
| Redemption fees (Note 2) | | | | 19,250 | | | | | | 16,215 | | |
| Cost of shares redeemed | | | | (269,549,313 | ) | | | | | (473,550,338 | ) | |
| Increase (decrease) in net assets from capital share transactions | | | | 33,877,586 | | | | | | (103,458,253 | ) | |
| Net increase (decrease) in net assets | | | | 33,823,789 | | | | | | (103,323,785 | ) | |
| | | | | | | | | | | | | |
| NET ASSETS: | | | | | | | | | | | | |
| Beginning of period | | | | 975,780,201 | | | | | | 1,079,103,986 | | |
| End of period* | | | $ | 1,009,603,990 | | | | | $ | 975,780,201 | | |
| * Including accumulated net investment loss of: | | | $ | (13 | ) | | | | $ | (21 | ) | |
The accompanying notes are an integral part of these financial statements.
77
Alpine Mutual Funds
Statements of Changes in Net Assets—Continued
| | | High Yield Managed Duration |
| | | Municipal Fund |
| | | Six Months Ended | | Year Ended |
| | | April 30, 2016 | | October 31, 2015 |
| | | (Unaudited) | | | | | | |
| OPERATIONS: | | | | | | | | | | | | |
| Net investment income | | | $ | 1,268,840 | | | | | $ | 1,364,631 | | |
| Net realized loss from investments | | | | (177,963 | ) | | | | | (3,311 | ) | |
| Change in net unrealized appreciation/(depreciation) on investments | | | | 867,953 | | | | | | (47,109 | ) | |
| Increase in net assets from operations | | | | 1,958,830 | | | | | | 1,314,211 | | |
| | | | | | | | | | | | | |
| DISTRIBUTIONS TO SHAREHOLDERS: | | | | | | | | | | | | |
| Distributions to Institutional Class Shareholders: | | | | | | | | | | | | |
| From net investment income | | | | (1,027,400 | ) | | | | | (1,240,090 | ) | |
| From net realized gain on investments | | | | — | | | | | | (14,739 | ) | |
| Distributions to Class A Shareholders: | | | | | | | | | | | | |
| From net investment income | | | | (241,431 | ) | | | | | (124,386 | ) | |
| From net realized gain on investments | | | | — | | | | | | (1,479 | ) | |
| Decrease in net assets from distributions to shareholders | | | | (1,268,831 | ) | | | | | (1,380,694 | ) | |
| | | | | | | | | | | | | |
| CAPITAL SHARE TRANSACTIONS (NOTE 3): | | | | | | | | | | | | |
| Net proceeds from shares sold | | | | 54,309,524 | | | | | | 35,898,673 | | |
| Dividends reinvested | | | | 943,398 | | | | | | 1,136,399 | | |
| Redemption fees (Note 2) | | | | 15,208 | | | | | | 4,830 | | |
| Cost of shares redeemed | | | | (7,953,194 | ) | | | | | (4,216,056 | ) | |
| Increase in net assets from capital share transactions | | | | 47,314,936 | | | | | | 32,823,846 | | |
| Net increase in net assets | | | | 48,004,935 | | | | | | 32,757,363 | | |
| | | | | | | | | | | | | |
| NET ASSETS: | | | | | | | | | | | | |
| Beginning of period | | | | 58,430,432 | | | | | | 25,673,069 | | |
| End of period* | | | $ | 106,435,367 | | | | | $ | 58,430,432 | | |
| * Including undistributed net investment income of: | | | $ | 261 | | | | | $ | 252 | | |
The accompanying notes are an integral part of these financial statements.
78
Alpine Mutual Funds
Financial Highlights
(For a share outstanding throughout each period)
| | | Dynamic Dividend Fund | |
| | | Six Months | | | | | | | | | | | | | | | |
| | | Ended | | | | | | | | | | | | | | | |
| | | April 30, | | Years Ended October 31, | |
| | | 2016 | | 2015 | | 2014† | | 2013† | | 2012† | | 2011† | |
| | | (Unaudited) | | | | | | | | | | | | | | | |
| Institutional Class: | | | | | | | | | | | | | | | | | | | | | | | | | |
| Net asset value per share, beginning of period | | | $ | 3.73 | | | $ | 3.83 | | | $ | 3.77 | | | $ | 3.49 | | | $ | 3.84 | | | $ | 4.48 | |
| Income from investment operations: | | | | | | | | | | | | | | | | | | | | | | | | | |
| Net investment income | | | | 0.17 | | | | 0.25 | | | | 0.21 | | | | 0.22 | | | | 0.50 | | | | 0.49 | |
| Net realized and unrealized gain (loss) | | | | (0.26 | ) | | | (0.11 | ) | | | 0.09 | | | | 0.34 | | | | (0.35 | ) | | | (0.59 | ) |
| Total from investment operations | | | | (0.09 | ) | | | 0.14 | | | | 0.30 | | | | 0.56 | | | | 0.15 | | | | (0.10 | ) |
| Redemption fees | | | | 0.00 | (a) | | | 0.00 | (a) | | | 0.00 | (a) | | | 0.00 | (a) | | | 0.00 | (a) | | | 0.00 | (a) |
| Less distributions: | | | | | | | | | | | | | | | | | | | | | | | | | |
| From net investment income | | | | (0.12 | ) | | | (0.24 | ) | | | (0.24 | ) | | | (0.28 | ) | | | (0.50 | ) | | | (0.54 | ) |
| From net realized gains | | | | — | | | | (0.00 | )(a) | | | — | | | | — | | | | — | | | | — | |
| Total distributions | | | | (0.12 | ) | | | (0.24 | ) | | | (0.24 | ) | | | (0.28 | ) | | | (0.50 | ) | | | (0.54 | ) |
| Net asset value per share, end of period | | | $ | 3.52 | | | $ | 3.73 | | | $ | 3.83 | | | $ | 3.77 | | | $ | 3.49 | | | $ | 3.84 | |
| Total return | | | | (2.33 | )%(b) | | | 3.59 | % | | | 8.09 | % | | | 17.02 | % | | | 4.46 | % | | | (3.48 | )% |
| Ratios/Supplemental Data: | | | | | | | | | | | | | | | | | | | | | | | | | |
| Net Assets at end of period (000) | | | $ | 162,772 | | | $ | 182,039 | | | $ | 210,436 | | | $ | 247,276 | | | $ | 353,501 | | | $ | 460,466 | |
| Ratio of total expenses to average net assets: | | | | | | | | | | | | | | | | | | | | | | | | | |
| Before waivers and/or expense reimbursements (c) | | | | 1.38 | %(d) | | | 1.27 | % | | | 1.44 | % | | | 1.43 | % | | | 1.28 | % | | | 1.21 | % |
| After waivers and/or expense reimbursements (e) | | | | 1.35 | %(d) | | | 1.27 | % | | | 1.38 | % | | | 1.38 | % | | | — | % | | | — | % |
| Ratio of net investment income to average net assets | | | | 9.57 | %(d) | | | 6.28 | % | | | 5.30 | % | | | 5.78 | % | | | 13.17 | % | | | 10.39 | % |
| Portfolio turnover (f) | | | | 50 | %(b) | | | 111 | % | | | 81 | % | | | 197 | % | | | 258 | % | | | 358 | % |
| † | Beginning with the year ended October 31, 2015, the Fund was audited by Ernst & Young LLP. The previous year was audited by another independent registered public accounting firm. |
| | |
| (a) | The amount is less than $0.005 per share. |
| | |
| (b) | Not annualized. |
| | |
| (c) | Ratio of total expenses to average net assets excluding interest expense before waivers and/or expense reimbursements was 1.37% for the six months ended April 30, 2016, and 1.24%, 1.41%, 1.40%, 1.27% and 1.18% for the years ended October 31, 2015, 2014, 2013, 2012 and 2011, respectively. |
| | |
| (d) | Annualized. |
| | |
| (e) | Ratio of total expenses to average net assets excluding interest expense after waivers and/or expense reimbursements was 1.33% for the six months ended April 30, 2016, and 1.24%, 1.35%, 1.35%, 1.35% and 1.35% for the years ended October 31, 2015, 2014, 2013, 2012 and 2011, respectively. |
| | |
| (f) | Portfolio turnover is calculated on the basis of the Fund as a whole, without distinguishing between classes of shares issued. |
The accompanying notes are an integral part of these financial statements.
79
Alpine Mutual Funds
Financial Highlights—Continued
(For a share outstanding throughout each period)
| | | Dynamic Dividend Fund | |
| | | Six Months | | | | | | | | | | | Period | |
| | | Ended | | | | | | | | | | | Ended | |
| | | April 30, | | Years Ended October 31, | | October 31, | |
| | | 2016 | | 2015 | | 2014† | | 2013† | | 2012†(a) | |
| | | (Unaudited) | | | | | | | | | | | | |
| Class A: | | | | | | | | | | | | | | | | | | | | | | | | | |
| Net asset value per share, beginning of period | | | $ | 3.73 | | | | $ | 3.83 | | | | $ | 3.77 | | | | $ | 3.49 | | | | $ | 3.61 | |
| Income from investment operations: | | | | | | | | | | | | | | | | | | | | | | | | | |
| Net investment income | | | | 0.14 | | | | | 0.24 | | | | | 0.17 | | | | | 0.23 | | | | | 0.35 | |
| Net realized and unrealized gain (loss) | | | | (0.23 | ) | | | | (0.11 | ) | | | | 0.12 | | | | | 0.33 | | | | | (0.06 | ) |
| Total from investment operations | | | | (0.09 | ) | | | | 0.13 | | | | | 0.29 | | | | | 0.56 | | | | | 0.29 | |
| Redemption fees | | | | 0.00 | (b) | | | | 0.00 | (b) | | | | 0.00 | (b) | | | | 0.00 | (b) | | | | 0.00 | (b) |
| Less distributions: | | | | | | | | | | | | | | | | | | | | | | | | | |
| From net investment income | | | | (0.12 | ) | | | | (0.23 | ) | | | | (0.23 | ) | | | | (0.28 | ) | | | | (0.41 | ) |
| From net realized gains | | | | — | | | | | (0.00 | )(b) | | | | — | | | | | — | | | | | — | |
| Total distributions | | | | (0.12 | ) | | | | (0.23 | ) | | | | (0.23 | ) | | | | (0.28 | ) | | | | (0.41 | ) |
| Net asset value per share, end of period | | | $ | 3.52 | | | | $ | 3.73 | | | | $ | 3.83 | | | | $ | 3.77 | | | | $ | 3.49 | |
| Total return (c) | | | | (2.45 | )%(d) | | | | 3.34 | % | | | | 7.83 | % | | | | 16.73 | % | | | | 8.36 | %(d) |
| Ratios/Supplemental Data | | | | | | | | | | | | | | | | | | | | | | | | | |
| Net Assets at end of period (000) | | | $ | 2,833 | | | | $ | 4,010 | | | | $ | 4,219 | | | | $ | 2,479 | | | | $ | 1,612 | |
| Ratio of total expenses to average net assets: | | | | | | | | | | | | | | | | | | | | | | | | | |
| Before waivers and/or expense reimbursements (e) | | | | 1.63 | %(f) | | | | 1.52 | % | | | | 1.69 | % | | | | 1.68 | % | | | | 1.56 | %(f) |
| After waivers and/or expense reimbursements (g) | | | | 1.60 | %(f) | | | | 1.52 | % | | | | 1.63 | % | | | | 1.63 | % | | | | — | % |
| Ratio of net investment income to average net assets | | | | 8.40 | %(f) | | | | 5.95 | % | | | | 4.51 | % | | | | 5.38 | % | | | | 8.02 | %(f) |
| Portfolio turnover (h) | | | | 50 | %(d) | | | | 111 | % | | | | 81 | % | | | | 197 | % | | | | 258 | % |
| † | Beginning with the year ended October 31, 2015, the Fund was audited by Ernst & Young LLP. The previous year was audited by another independent registered public accounting firm. |
| | |
| (a) | Class A commenced operations on December 30, 2011. |
| | |
| (b) | The amount is less than $0.005 per share. |
| | |
| (c) | Total returns would be reduced if a sales or redemption charge was taken into account. |
| | |
| (d) | Not annualized. |
| | |
| (e) | Ratio of total expenses to average net assets excluding interest expense before waivers and/or expense reimbursements was 1.62% for the six months ended April 30, 2016, 1.49%, 1.66% and 1.65% for the years ended October 31, 2015, 2014 and 2013, respectively, and 1.55% for the period ended October 31, 2012. |
| | |
| (f) | Annualized. |
| | |
| (g) | Ratio of total expenses to average net assets excluding interest expense after waivers and/or expense reimbursements was 1.58% for the six months ended April 30, 2016, 1.49%, 1.60% and 1.60% for the years ended October 31, 2015, 2014 and 2013, respectively. |
| | |
| (h) | Portfolio turnover is calculated on the basis of the Fund as a whole, without distinguishing between classes of shares issued. |
The accompanying notes are an integral part of these financial statements.
80
Alpine Mutual Funds
Financial Highlights—Continued
(For a share outstanding throughout each period)
| | | Rising Dividend Fund | |
| | | Six Months | | | | | | | | | | | | | | | |
| | | Ended | | | | | | | | | | | | | | | |
| | | April 30, | | Years Ended October 31, | |
| | | 2016 | | 2015 | | 2014† | | 2013† | | 2012† | | 2011† | |
| | | (Unaudited) | | | | | | | | | | | | | | | |
| Institutional Class: | | | | | | | | | | | | | | | | | | | | | | | | | | | | | | |
| Net asset value per share, beginning of period | | | $ | 15.05 | | | | $ | 15.88 | | | | $ | 15.19 | | | | $ | 12.88 | | | | $ | 12.83 | | | | $ | 12.80 | |
| Income from investment operations: | | | | | | | | | | | | | | | | | | | | | | | | | | | | | | |
| Net investment income | | | | 0.40 | | | | | 0.38 | | | | | 0.49 | | | | | 0.51 | | | | | 0.62 | | | | | 0.51 | |
| Net realized and unrealized gain (loss) | | | | (0.50 | ) | | | | (0.02 | ) | | | | 1.29 | | | | | 2.65 | | | | | 0.73 | | | | | 0.32 | |
| Total from investment operations | | | | (0.10 | ) | | | | 0.36 | | | | | 1.78 | | | | | 3.16 | | | | | 1.35 | | | | | 0.83 | |
| Redemption fees | | | | 0.00 | (a) | | | | — | | | | | 0.01 | | | | | 0.03 | | | | | — | | | | | 0.00 | (a) |
| Less distributions: | | | | | | | | | | | | | | | | | | | | | | | | | | | | | | |
| From net investment income | | | | (0.26 | ) | | | | (0.50 | ) | | | | (0.51 | ) | | | | (0.64 | ) | | | | (0.50 | ) | | | | (0.58 | ) |
| From net realized gains | | | | (0.10 | ) | | | | (0.69 | ) | | | | (0.59 | ) | | | | (0.24 | ) | | | | (0.80 | ) | | | | (0.22 | ) |
| Total distributions | | | | (0.36 | ) | | | | (1.19 | ) | | | | (1.10 | ) | | | | (0.88 | ) | | | | (1.30 | ) | | | | (0.80 | ) |
| Net asset value per share, end of period | | | $ | 14.59 | | | | $ | 15.05 | | | | $ | 15.88 | | | | $ | 15.19 | | | | $ | 12.88 | | | | $ | 12.83 | |
| Total return | | | | (0.68 | )%(b) | | | | 2.16 | % | | | | 12.25 | % | | | | 25.94 | % | | | | 11.28 | % | | | | 6.43 | % |
| Ratios/Supplemental Data: | | | | | | | | | | | | | | | | | | | | | | | | | | | | | | |
| Net Assets at end of period (000) | | | $ | 88,268 | | | | $ | 90,126 | | | | $ | 4,486 | | | | $ | 3,418 | | | | $ | 2,155 | | | | $ | 3,218 | |
| Ratio of total expenses to average net assets: | | | | | | | | | | | | | | | | | | | | | | | | | | | | | | |
| Before waivers and/or expense reimbursements (c) | | | | 1.17 | %(d) | | | | 1.93 | % | | | | 2.25 | % | | | | 3.43 | % | | | | 3.26 | % | | | | 2.64 | % |
| After waivers and/or expense reimbursements (e) | | | | 1.17 | %(d) | | | | 1.35 | % | | | | 1.35 | % | | | | 1.35 | % | | | | 1.35 | % | | | | 1.35 | % |
| Ratio of net investment income to average net assets | | | | 5.69 | %(d) | | | | 2.14 | % | | | | 3.33 | % | | | | 3.94 | % | | | | 4.52 | % | | | | 4.09 | % |
| Portfolio turnover (f) | | | | 43 | %(b) | | | | 97 | % | | | | 78 | % | | | | 86 | % | | | | 73 | % | | | | 137 | % |
| † | Beginning with the year ended October 31, 2015, the Fund was audited by Ernst & Young LLP. The previous year was audited by another independent registered public accounting firm. |
| | |
| (a) | The amount is less than $0.005 per share. |
| | |
| (b) | Not annualized. |
| | |
| (c) | Ratio of total expenses to average net assets excluding interest expense before waivers and/or expense reimbursements was 1.17% for the six months ended April 30, 2016, and 1.93%, 2.25%, 3.43%, 3.26% and 2.64% for the years ended October 31, 2015, 2014, 2013, 2012 and 2011, respectively. |
| | |
| (d) | Annualized. |
| | |
| (e) | Ratio of total expenses to average net assets excluding interest expense after waivers and/or expense reimbursements was 1.17% for the six months ended April 30, 2016, and 1.35%, 1.35%, 1.35%, 1.35%, and 1.35% for the years ended October 31, 2015, 2014, 2013, 2012 and 2011, respectively. |
| | |
| (f) | Portfolio turnover is calculated on the basis of the Fund as a whole, without distinguishing between classes of shares issued. |
The accompanying notes are an integral part of these financial statements.
81
Alpine Mutual Funds
Financial Highlights—Continued
(For a share outstanding throughout each period)
| | | Rising Dividend Fund | |
| | | Six Months | | | | | | | | | | | Period | |
| | | Ended | | | | | | | | | | | Ended | |
| | | April 30, | | Years Ended October 31, | | October 31, | |
| | | 2016 | | 2015 | | 2014† | | 2013† | | 2012†(a) | |
| | | (Unaudited) | | | | | | | | | | | | |
| Class A: | | | | | | | | | | | | | | | | | | | | | | | | | |
| Net asset value per share, beginning of period | | | $ | 15.05 | | | | $ | 15.88 | | | | $ | 15.18 | | | | $ | 12.88 | | | | $ | 12.02 | |
| Income from investment operations: | | | | | | | | | | | | | | | | | | | | | | | | | |
| Net investment income | | | | 0.45 | | | | | 0.43 | | | | | 0.38 | | | | | 0.63 | | | | | 0.31 | |
| Net realized and unrealized gain (loss) | | | | (0.58 | ) | | | | (0.10 | ) | | | | 1.37 | | | | | 2.48 | | | | | 0.92 | |
| Total from investment operations | | | | (0.13 | ) | | | | 0.33 | | | | | 1.75 | | | | | 3.11 | | | | | 1.23 | |
| Redemption fees | | | | 0.00 | (b) | | | | — | | | | | 0.01 | | | | | 0.04 | | | | | — | |
| Less distributions: | | | | | | | | | | | | | | | | | | | | | | | | | |
| From net investment income | | | | (0.24 | ) | | | | (0.47 | ) | | | | (0.47 | ) | | | | (0.61 | ) | | | | (0.37 | ) |
| From net realized gains | | | | (0.10 | ) | | | | (0.69 | ) | | | | (0.59 | ) | | | | (0.24 | ) | | | | — | |
| Total distributions | | | | (0.34 | ) | | | | (1.16 | ) | | | | (1.06 | ) | | | | (0.85 | ) | | | | (0.37 | ) |
| Net asset value per share, end of period | | | $ | 14.58 | | | | $ | 15.05 | | | | $ | 15.88 | | | | $ | 15.18 | | | | $ | 12.88 | |
| Total return (c) | | | | (0.87 | )%(d) | | | | 1.93 | % | | | | 12.04 | % | | | | 25.55 | % | | | | 10.29 | %(d) |
| Ratios/Supplemental Data | | | | | | | | | | | | | | | | | | | | | | | | | |
| Net Assets at end of period (000) | | | $ | 1,373 | | | | $ | 2,358 | | | | $ | 865 | | | | $ | 917 | | | | $ | 257 | |
| Ratio of total expenses to average net assets: | | | | | | | | | | | | | | | | | | | | | | | | | |
| Before waivers and/or expense reimbursements (e) | | | | 1.42 | %(f) | | | | 2.18 | % | | | | 2.50 | % | | | | 3.68 | % | | | | 3.83 | %(f) |
| After waivers and/or expense reimbursements (g) | | | | 1.42 | %(f) | | | | 1.60 | % | | | | 1.60 | % | | | | 1.60 | % | | | | 1.60 | %(f) |
| Ratio of net investment income to average net assets | | | | 5.61 | %(f) | | | | 2.65 | % | | | | 2.41 | % | | | | 3.72 | % | | | | 2.71 | %(f) |
| Portfolio turnover (h) | | | | 43 | %(d) | | | | 97 | % | | | | 78 | % | | | | 86 | % | | | | 73 | % |
| † | Beginning with the year ended October 31, 2015, the Fund was audited by Ernst & Young LLP. The previous year was audited by another independent registered public accounting firm. |
| | |
| (a) | Class A commenced operations on December 30, 2011. |
| | |
| (b) | The amount is less than $0.005 per share or 0.005%. |
| | |
| (c) | Total returns would be reduced if a sales or redemption charge was taken into account. |
| | |
| (d) | Not annualized. |
| | |
| (e) | Ratio of total expenses to average net assets excluding interest expense before waivers and/or expense reimbursements was 1.42% for the six months ended April 30, 2016, 2.18%, 2.50% and 3.68% for the years ended October 31, 2015, 2014 and 2013, respectively, and 3.83% for the period ended October 31, 2012. |
| | |
| (f) | Annualized. |
| | |
| (g) | Ratio of total expenses to average net assets excluding interest expense after waivers and/or expense reimbursements was 1.42% for the six months ended April 30, 2016, 1.60%, 1.60% and 1.60% for the years ended October 31, 2015, 2014 and 2013, respectively, and 1.60% for the period ended October 31, 2012. |
| | |
| (h) | Portfolio turnover is calculated on the basis of the Fund as a whole, without distinguishing between classes of shares issued. |
The accompanying notes are an integral part of these financial statements.
82
Alpine Mutual Funds
Financial Highlights—Continued
(For a share outstanding throughout each period)
| | | Financial Services Fund | |
| | | Six Months | | | | | | | | | | | | | | | |
| | | Ended | | | | | | | | | | | | | | | |
| | | April 30, | | Years Ended October 31, | |
| | | 2016 | | 2015 | | 2014† | | 2013† | | 2012† | | 2011† | |
| | | (Unaudited) | | | | | | | | | | | | | | | |
| Institutional Class: | | | | | | | | | | | | | | | | | | | | | | | | | | | | | | |
| Net asset value per share, beginning of period | | | $ | 12.99 | | | | $ | 13.48 | | | | $ | 12.13 | | | | $ | 8.77 | | | | $ | 7.15 | | | | $ | 7.69 | |
| Income from investment operations: | | | | | | | | | | | | | | | | | | | | | | | | | | | | | | |
| Net investment income (loss) | | | | 0.08 | | | | | 0.10 | | | | | (0.01 | ) | | | | (0.02 | ) | | | | (0.00 | )(a) | | | | 0.02 | |
| Net realized and unrealized gain (loss) | | | | (0.40 | ) | | | | (0.43 | ) | | | | 1.36 | | | | | 3.36 | | | | | 1.64 | | | | | (0.54 | ) |
| Total from investment operations | | | | (0.32 | ) | | | | (0.33 | ) | | | | 1.35 | | | | | 3.34 | | | | | 1.64 | | | | | (0.52 | ) |
| Redemption fees | | | | 0.00 | (a) | | | | 0.00 | (a) | | | | 0.00 | (a) | | | | 0.02 | | | | | 0.00 | (a) | | | | 0.00 | (a) |
| Less distributions: | | | | | | | | | | | | | | | | | | | | | | | | | | | | | | |
| From net investment income | | | | (0.19 | ) | | | | (0.16 | ) | | | | (0.00 | )(a) | | | | — | | | | | — | | | | | (0.01 | ) |
| From net realized gains | | | | — | | | | | (0.00 | )(a) | | | | — | | | | | — | | | | | — | | | | | — | |
| Tax return of capital | | | | — | | | | | — | | | | | — | | | | | — | | | | | (0.02 | ) | | | | (0.01 | ) |
| Total distributions | | | | (0.19 | ) | | | | (0.16 | ) | | | | — | | | | | — | | | | | (0.02 | ) | | | | (0.02 | ) |
| Net asset value per share, end of period | | | $ | 12.48 | | | | $ | 12.99 | | | | $ | 13.48 | | | | $ | 12.13 | | | | $ | 8.77 | | | | $ | 7.15 | |
| Total return | | | | (2.47 | )%(b) | | | | (2.51 | )% | | | | 11.16 | % | | | | 38.31 | % | | | | 22.95 | % | | | | (6.77 | )% |
| Ratios/Supplemental Data: | | | | | | | | | | | | | | | | | | | | | | | | | | | | | | |
| Net Assets at end of period (000) | | | $ | 13,959 | | | | $ | 19,452 | | | | $ | 27,995 | | | | $ | 13,561 | | | | $ | 8,874 | | | | $ | 6,251 | |
| Ratio of total expenses to average net assets: | | | | | | | | | | | | | | | | | | | | | | | | | | | | | | |
| Before waivers and/or expense reimbursements (c) | | | | 1.82 | %(d) | | | | 1.86 | % | | | | 1.36 | % | | | | 1.72 | % | | | | 1.94 | % | | | | 1.85 | % |
| After waivers and/or expense reimbursements (e) | | | | 1.35 | %(d) | | | | 1.38 | % | | | | 1.36 | % | | | | 1.36 | % | | | | 1.38 | % | | | | 1.44 | % |
| Ratio of net investment income (loss) to average net assets | | | | 1.54 | %(d) | | | | 0.63 | % | | | | (0.08 | )% | | | | (0.20 | )% | | | | (0.16 | )% | | | | 0.30 | % |
| Portfolio turnover (f) | | | | 45 | %(b) | | | | 80 | % | | | | 131 | % | | | | 108 | % | | | | 120 | % | | | | 73 | % |
| † | Beginning with the year ended October 31, 2015, the Fund was audited by Ernst & Young LLP. The previous year was audited by another independent registered public accounting firm. |
| | |
| (a) | The amount is less than $0.005 per share. |
| | |
| (b) | Not annualized. |
| | |
| (c) | Ratio of total expenses to average net assets excluding interest expense before waivers and/or expense reimbursements was 1.80% for the six months ended April 30, 2016, and 1.82%, 1.33%, 1.71%, 1.91% and 1.75% for the years ended October 31, 2015, 2014, 2013, 2012 and 2011, respectively. |
| | |
| (d) | Annualized. |
| | |
| (e) | Ratio of total expenses to average net assets excluding interest expense after waivers and/or expense reimbursements was 1.34% for the six months ended April 30, 2016, and 1.35%, 1.33%, 1.35%, 1.35%, and 1.35% for the years ended October 31, 2015, 2014, 2013, 2012 and 2011, respectively. |
| | |
| (f) | Portfolio turnover is calculated on the basis of the Fund as a whole, without distinguishing between classes of shares issued. |
The accompanying notes are an integral part of these financial statements.
83
Alpine Mutual Funds
Financial Highlights—Continued
(For a share outstanding throughout each period)
| | | Financial Services Fund | |
| | | Six Months | | | | | | | | | | | Period | |
| | | Ended | | | | | | | | | | | Ended | |
| | | April 30, | | Years Ended October 31, | | October 31, | |
| | | 2016 | | 2015 | | 2014† | | 2013† | | 2012†(a) | |
| | | (Unaudited) | | | | | | | | | | | | |
| Class A: | | | | | | | | | | | | | | | | | | | | | | | | | |
| Net asset value per share, beginning of period | | | $ | 12.89 | | | | $ | 13.39 | | | | $ | 12.08 | | | | $ | 8.75 | | | | $ | 6.90 | |
| Income from investment operations: | | | | | | | | | | | | | | | | | | | | | | | | | |
| Net investment income (loss) | | | | (0.03 | ) | | | | 0.04 | | | | | (0.06 | ) | | | | (0.04 | ) | | | | (0.01 | ) |
| Net realized and unrealized gain (loss) | | | | (0.30 | ) | | | | (0.40 | ) | | | | 1.37 | | | | | 3.35 | | | | | 1.86 | |
| Total from investment operations | | | | (0.33 | ) | | | | (0.36 | ) | | | | 1.31 | | | | | 3.31 | | | | | 1.85 | |
| Redemption fees | | | | 0.00 | (b) | | | | 0.00 | (b) | | | | 0.00 | (b) | | | | 0.02 | | | | | 0.00 | (b) |
| Less distributions: | | | | | | | | | | | | | | | | | | | | | | | | | |
| From net investment income | | | | (0.16 | ) | | | | (0.14 | ) | | | | — | | | | | — | | | | | — | |
| From net realized gains | | | | — | | | | | (0.00 | )(b) | | | | — | | | | | — | | | | | — | |
| Total distributions | | | | (0.16 | ) | | | | (0.14 | ) | | | | — | | | | | — | | | | | — | |
| Net asset value per share, end of period | | | $ | 12.40 | | | | $ | 12.89 | | | | $ | 13.39 | | | | $ | 12.08 | | | | $ | 8.75 | |
| Total return (c) | | | | (2.60 | )%(d) | | | | (2.75 | )% | | | | 10.84 | % | | | | 38.06 | % | | | | 26.81 | %(d) |
| Ratios/Supplemental Data | | | | | | | | | | | | | | | | | | | | | | | | | |
| Net Assets at end of period (000) | | | $ | 2,811 | | | | $ | 5,844 | | | | $ | 8,268 | | | | $ | 7,318 | | | | $ | 1,375 | |
| Ratio of total expenses to average net assets: | | | | | | | | | | | | | | | | | | | | | | | | | |
| Before waivers and/or expense reimbursements (e) | | | | 2.06 | %(f) | | | | 2.10 | % | | | | 1.61 | % | | | | 1.97 | % | | | | 2.05 | %(f) |
| After waivers and/or expense reimbursements (g) | | | | 1.60 | %(f) | | | | 1.63 | % | | | | 1.61 | % | | | | 1.61 | % | | | | 1.53 | %(f) |
| Ratio of net investment income (loss) to average net assets | | | | 1.29 | %(f) | | | | 0.36 | % | | | | (0.36 | )% | | | | (0.44 | )% | | | | (0.50 | )%(f) |
| Portfolio turnover (h) | | | | 45 | %(d) | | | | 80 | % | | | | 131 | % | | | | 108 | % | | | | 120 | % |
| † | Beginning with the year ended October 31, 2015, the Fund was audited by Ernst & Young LLP. The previous year was audited by another independent registered public accounting firm. |
| | |
| (a) | Class A commenced operations on December 30, 2011. |
| | |
| (b) | The amount is less than $0.005 per share. |
| | |
| (c) | Total returns would be reduced if a sales or redemption charge was taken into account. |
| | |
| (d) | Not annualized. |
| | |
| (e) | Ratio of total expenses to average net assets excluding interest expense before waivers and/or expense reimbursements was 2.05% for the six months ended April 30, 2016, 2.07%, 1.61% and 1.96% for the years ended October 31, 2015, 2014 and 2013, respectively, and 2.05% for the period ended October 31, 2012. |
| | |
| (f) | Annualized. |
| | |
| (g) | Ratio of total expenses to average net assets excluding interest expense after waivers and/or expense reimbursements was 1.59% for the six months ended April 30, 2016, 1.60%, 1.61% and 1.60% for the years ended October 31, 2015, 2014 and 2013, respectively, and 1.53% for the period ended October 31, 2012. |
| | |
| (h) | Portfolio turnover is calculated on the basis of the Fund as a whole, without distinguishing between classes of shares issued. |
The accompanying notes are an integral part of these financial statements.
84
Alpine Mutual Funds
Financial Highlights—Continued
(For a share outstanding throughout each period)
| | | Small Cap Fund | |
| | | Six Months | | | | | | | | | | | | | | | |
| | | Ended | | | | | | | | | | | | | | | |
| | | April 30, | | Years Ended October 31, | |
| | | 2016 | | 2015 | | 2014† | | 2013† | | 2012† | | 2011† | |
| | | (Unaudited) | | | | | | | | | | | | | | | |
| Institutional Class: | | | | | | | | | | | | | | | | | | | | | | | | | | | | | | |
| Net asset value per share, beginning of period | | | $ | 14.75 | | | | $ | 14.08 | | | | $ | 14.25 | | | | $ | 11.33 | | | | $ | 10.48 | | | | $ | 10.14 | |
| Income from investment operations: | | | | | | | | | | | | | | | | | | | | | | | | | | | | | | |
| Net investment loss | | | | (0.01 | ) | | | | (0.06 | ) | | | | (0.09 | ) | | | | (0.14 | ) | | | | (0.13 | ) | | | | (0.11 | ) |
| Net realized and unrealized gain (loss) | | | | (0.28 | ) | | | | 0.73 | | | | | (0.08 | ) | | | | 3.06 | | | | | 0.98 | | | | | 0.45 | |
| Total from investment operations | | | | (0.29 | ) | | | | 0.67 | | | | | (0.17 | ) | | | | 2.92 | | | | | 0.85 | | | | | 0.34 | |
| Redemption fees | | | | — | | | | | 0.00 | (a) | | | | 0.00 | (a) | | | | 0.00 | (a) | | | | 0.00 | (a) | | | | 0.00 | (a) |
| Net asset value per share, end of period | | | $ | 14.46 | | | | $ | 14.75 | | | | $ | 14.08 | | | | $ | 14.25 | | | | $ | 11.33 | | | | $ | 10.48 | |
| Total return | | | | (1.97 | )%(b) | | | | 4.76 | % | | | | (1.19 | )% | | | | 25.77 | % | | | | 8.11 | % | | | | 3.35 | % |
| Ratios/Supplemental Data: | | | | | | | | | | | | | | | | | | | | | | | | | | | | | | |
| Net Assets at end of period (000) | | | $ | 11,758 | | | | $ | 12,673 | | | | $ | 13,589 | | | | $ | 12,263 | | | | $ | 10,877 | | | | $ | 10,383 | |
| Ratio of total expenses to average net assets: | | | | | | | | | | | | | | | | | | | | | | | | | | | | | | |
| Before waivers and/or expense reimbursements (c) | | | | 1.68 | %(d) | | | | 1.90 | % | | | | 1.62 | % | | | | 1.80 | % | | | | 1.67 | % | | | | 1.59 | % |
| After waivers and/or expense reimbursements (e) | | | | 1.33 | %(d) | | | | 1.35 | % | | | | 1.35 | % | | | | 1.35 | % | | | | 1.36 | % | | | | 1.41 | % |
| Ratio of net investment loss to average net assets | | | | (0.06 | )%(d)(b) | | | | (0.35 | )% | | | | (0.73 | )% | | | | (0.97 | )% | | | | (1.07 | )% | | | | (0.97 | )% |
| Portfolio turnover (f) | | | | 41 | % | | | | 96 | % | | | | 171 | % | | | | 39 | % | | | | 29 | % | | | | 18 | % |
| † | Beginning with the year ended October 31, 2015, the Fund was audited by Ernst & Young LLP. The previous year was audited by another independent registered public accounting firm. |
| | |
| (a) | The amount is less than $0.005 per share. |
| | |
| (b) | Not annualized. |
| | |
| (c) | Ratio of total expenses to average net assets excluding interest expense before waivers and/or expense reimbursements was 1.68% for the six months ended April 30, 2016, and 1.90%, 1.62%, 1.80%, 1.66% and 1.53% for the years ended October 31, 2015, 2014, 2013, 2012 and 2011, respectively. |
| | |
| (d) | Annualized. |
| | |
| (e) | Ratio of total expenses to average net assets excluding interest expense after waivers and/or expense reimbursements was 1.33% for the six months ended April 30, 2016, and 1.35%, 1.35%, 1.35%, 1.35%, and 1.35% for the years ended October 31, 2015, 2014, 2013, 2012 and 2011, respectively. |
| | |
| (f) | Portfolio turnover is calculated on the basis of the Fund as a whole, without distinguishing between classes of shares issued. |
The accompanying notes are an integral part of these financial statements.
85
Alpine Mutual Funds
Financial Highlights—Continued
(For a share outstanding throughout each period)
| | | Small Cap Fund | |
| | | Six Months | | | | | | | | | | | Period | |
| | | Ended | | | | | | | | | | | Ended | |
| | | April 30, | | Years Ended October 31, | | October 31, | |
| | | 2016 | | 2015 | | 2014† | | 2013† | | 2012†(a) | |
| | | (Unaudited) | | | | | | | | | | | | |
| Class A: | | | | | | | | | | | | | | | | | | | | | | | | | |
| Net asset value per share, beginning of period | | | $ | 14.60 | | | | $ | 13.98 | | | | $ | 14.18 | | | | $ | 11.30 | | | | $ | 10.17 | |
| Income from investment operations: | | | | | | | | | | | | | | | | | | | | | | | | | |
| Net investment income (loss) | | | | (0.07 | ) | | | | (0.09 | ) | | | | 0.07 | | | | | (0.16 | ) | | | | (0.14 | ) |
| Net realized and unrealized gain (loss) | | | | (0.24 | ) | | | | 0.71 | | | | | (0.27 | ) | | | | 3.04 | | | | | 1.27 | |
| Total from investment operations | | | | (0.31 | ) | | | | 0.62 | | | | | (0.20 | ) | | | | 2.88 | | | | | 1.13 | |
| Redemption fees | | | | — | | | | | 0.00 | (b) | | | | 0.00 | (b) | | | | 0.00 | (b) | | | | — | |
| Net asset value per share, end of period | | | $ | 14.29 | | | | $ | 14.60 | | | | $ | 13.98 | | | | $ | 14.18 | | | | $ | 11.30 | |
| Total return (c) | | | | (2.12 | )%(d) | | | | 4.43 | % | | | | (1.41 | )% | | | | 25.49 | % | | | | 11.11 | %(d) |
| Ratios/Supplemental Data | | | | | | | | | | | | | | | | | | | | | | | | | |
| Net Assets at end of period (000) | | | $ | 803 | | | | $ | 1,155 | | | | $ | 1,221 | | | | $ | 139 | | | | $ | 111 | |
| Ratio of total expenses to average net assets: | | | | | | | | | | | | | | | | | | | | | | | | | |
| Before waivers and/or expense reimbursements (e) | | | | 1.93 | %(f) | | | | 2.15 | % | | | | 1.87 | % | | | | 2.05 | % | | | | 1.92 | %(f) |
| After waivers and/or expense reimbursements (g) | | | | 1.58 | %(f) | | | | 1.60 | % | | | | 1.60 | % | | | | 1.60 | % | | | | 1.60 | %(f) |
| Ratio of net investment loss to average net assets | | | | (0.29 | )%(f) | | | | (0.59 | )% | | | | (0.92 | )% | | | | (1.22 | )% | | | | (1.34 | )%(f) |
| Portfolio turnover (h) | | | | 41 | %(d) | | | | 96 | % | | | | 171 | % | | | | 39 | % | | | | 29 | % |
| † | Beginning with the year ended October 31, 2015, the Fund was audited by Ernst & Young LLP. The previous year was audited by another independent registered public accounting firm. |
| | |
| (a) | Class A commenced operations on December 30, 2011. |
| | |
| (b) | The amount is less than $0.005 per share. |
| | |
| (c) | Total returns would be reduced if a sales or redemption charge was taken into account. |
| | |
| (d) | Not annualized. |
| | |
| (e) | Ratio of total expenses to average net assets excluding interest expense before waivers and/or expense reimbursements was 1.93% for the six months ended April 30, 2016, 2.15%, 1.87% and 2.05% for the years ended October 31, 2015, 2014 and 2013, respectively, and 1.92% for the period ended October 31, 2012. |
| | |
| (f) | Annualized. |
| | |
| (g) | Ratio of total expenses to average net assets excluding interest expense after waivers and/or expense reimbursements was 1.58% for the six months ended April 30, 2016, 1.60%, 1.60% and 1.60% for the years ended October 31, 2015, 2014 and 2013, respectively, and 1.60% for the period ended October 31, 2012. |
| | |
| (h) | Portfolio turnover is calculated on the basis of the Fund as a whole, without distinguishing between classes of shares issued. |
The accompanying notes are an integral part of these financial statements.
86
Alpine Mutual Funds
Financial Highlights—Continued
(For a share outstanding throughout each period)
| | | Ultra Short Municipal Income Fund | |
| | | Six Months | | | | | | | | | | | | | | | |
| | | Ended | | | | | | | | | | | | | | | |
| | | April 30, | | Years Ended October 31, | |
| | | 2016 | | 2015 | | 2014† | | 2013† | | 2012† | | 2011† | |
| | | (Unaudited) | | | | | | | | | | | | | | | |
| Institutional Class: (a) | | | | | | | | | | | | | | | | | | | | | | | | | |
| Net asset value per share, beginning of period | | | $ | 10.04 | | | $ | 10.04 | | | $ | 10.03 | | | $ | 10.05 | | | $ | 10.05 | | | $ | 10.05 | |
| Income from investment operations: | | | | | | | | | | | | | | | | | | | | | | | | | |
| Net investment income | | | | 0.03 | | | | 0.05 | | | | 0.05 | | | | 0.06 | | | | 0.10 | | | | 0.19 | |
| Net realized and unrealized gain (loss) | | | | (0.00 | )(b) | | | (0.00 | )(b) | | | 0.01 | | | | (0.02 | ) | | | 0.00 | (b) | | | 0.00 | (b) |
| Total from investment operations | | | | 0.03 | | | | 0.05 | | | | 0.06 | | | | 0.04 | | | | 0.10 | | | | 0.19 | |
| Redemption fees | | | | 0.00 | (b) | | | 0.00 | (b) | | | 0.00 | (b) | | | 0.00 | (b) | | | 0.00 | (b) | | | 0.00 | (b) |
| Less distributions: | | | | | | | | | | | | | | | | | | | | | | | | | |
| From net investment income | | | | (0.03 | ) | | | (0.05 | ) | | | (0.05 | ) | | | (0.06 | ) | | | (0.10 | ) | | | (0.19 | ) |
| From net realized gains | | | | — | | | | (0.00 | )(b) | | | — | | | | — | | | | — | | | | — | |
| Total distributions | | | | (0.03 | ) | | | (0.05 | ) | | | (0.05 | ) | | | (0.06 | ) | | | (0.10 | ) | | | (0.19 | ) |
| Net asset value per share, end of period | | | $ | 10.04 | | | $ | 10.04 | | | $ | 10.04 | | | $ | 10.03 | | | $ | 10.05 | | | $ | 10.05 | |
| Total return | | | | 0.27 | %(c) | | | 0.52 | % | | | 0.63 | % | | | 0.36 | % | | | 0.95 | % | | | 1.87 | % |
| Ratios/Supplemental Data: | | | | | | | | | | | | | | | | | | | | | | | | | |
| Net Assets at end of period (000) | | | $ | 824,452 | | | $ | 772,308 | | | $ | 831,505 | | | $ | 933,294 | | | $ | 1,375,490 | | | $ | 1,265,829 | |
| Ratio of total expenses to average net assets: | | | | | | | | | | | | | | | | | | | | | | | | | |
| Before waivers and/or expense reimbursements | | | | 0.88 | %(d) | | | 0.93 | % | | | 0.90 | % | | | 0.89 | % | | | 0.84 | % | | | 0.82 | % |
| After waivers and/or expense reimbursements | | | | 0.47 | %(d) | | | 0.50 | % | | | 0.53 | % | | | 0.61 | % | | | 0.65 | % | | | 0.63 | % |
| Ratio of net investment income to average net assets | | | | 0.54 | %(d) | | | 0.51 | % | | | 0.53 | % | | | 0.55 | % | | | 0.95 | % | | | 1.86 | % |
| Portfolio turnover (e) | | | | 69 | %(c) | | | 155 | % | | | 168 | % | | | 185 | % | | | 192 | % | | | 174 | % |
| † | Beginning with the year ended October 31, 2015, the Fund was audited by Ernst & Young LLP. The previous year was audited by another independent registered public accounting firm. |
| | |
| (a) | Effective January 3, 2012, the share class was renamed Institutional Class. |
| | |
| (b) | The amount is less than $0.005 per share. |
| | |
| (c) | Not annualized. |
| | |
| (d) | Annualized. |
| | |
| (e) | Portfolio turnover is calculated on the basis of the Fund as a whole, without distinguishing between classes of shares issued. |
The accompanying notes are an integral part of these financial statements.
87
Alpine Mutual Funds
Financial Highlights—Continued
(For a share outstanding throughout each period)
| | | Ultra Short Municipal Income Fund | |
| | | Six Months | | | | | | | | | | | | | | | |
| | | Ended | | | | | | | | | | | | | | | |
| | | April 30, | | Years Ended October 31, | |
| | | 2016 | | 2015 | | 2014† | | 2013† | | 2012† | | 2011† | |
| | | (Unaudited) | | | | | | | | | | | | | | | |
| Class A: (a) | | | | | | | | | | | | | | | | | | | | | | | | | |
| Net asset value per share, beginning of period | | | $ | 10.10 | | | $ | 10.10 | | | $ | 10.09 | | | $ | 10.10 | | | $ | 10.10 | | | $ | 10.10 | |
| Income from investment operations: | | | | | | | | | | | | | | | | | | | | | | | | | |
| Net investment income | | | | 0.01 | | | | 0.03 | | | | 0.03 | | | | 0.03 | | | | 0.07 | | | | 0.16 | |
| Net realized and unrealized gain (loss) | | | | (0.00 | )(b) | | | (0.00 | )(b) | | | 0.01 | | | | (0.01 | ) | | | 0.00 | (b) | | | 0.00 | (b) |
| Total from investment operations | | | | 0.01 | | | | 0.03 | | | | 0.04 | | | | 0.02 | | | | 0.07 | | | | 0.16 | |
| Redemption fees | | | | 0.00 | (b) | | | 0.00 | (b) | | | 0.00 | (b) | | | 0.00 | (b) | | | 0.00 | (b) | | | 0.00 | (b) |
| Less distributions: | | | | | | | | | | | | | | | | | | | | | | | | | |
| From net investment income | | | | (0.01 | ) | | | (0.03 | ) | | | (0.03 | ) | | | (0.03 | ) | | | (0.07 | ) | | | (0.16 | ) |
| From net realized gains | | | | — | | | | (0.00 | )(b) | | | — | | | | — | | | | — | | | | — | |
| Total distributions | | | | (0.01 | ) | | | (0.03 | ) | | | (0.03 | ) | | | (0.03 | ) | | | (0.07 | ) | | | (0.16 | ) |
| Net asset value per share, end of period | | | $ | 10.10 | | | $ | 10.10 | | | $ | 10.10 | | | $ | 10.09 | | | $ | 10.10 | | | $ | 10.10 | |
| Total return (c) | | | | 0.14 | %(d) | | | 0.26 | % | | | 0.38 | % | | | 0.21 | % | | | 0.70 | % | | | 1.61 | % |
| Ratios/Supplemental Data | | | | | | | | | | | | | | | | | | | | | | | | | |
| Net Assets at end of period (000) | | | $ | 185,152 | | | $ | 203,472 | | | $ | 247,599 | | | $ | 305,193 | | | $ | 443,598 | | | $ | 358,284 | |
| Ratio of total expenses to average net assets: | | | | | | | | | | | | | | | | | | | | | | | | | |
| Before waivers and/or expense reimbursements | | | | 1.13 | %(e) | | | 1.18 | % | | | 1.15 | % | | | 1.14 | % | | | 1.09 | % | | | 1.07 | % |
| After waivers and/or expense reimbursements | | | | 0.72 | %(e) | | | 0.75 | % | | | 0.78 | % | | | 0.86 | % | | | 0.90 | % | | | 0.88 | % |
| Ratio of net investment income to average net assets | | | | 0.29 | %(e) | | | 0.26 | % | | | 0.28 | % | | | 0.30 | % | | | 0.67 | % | | | 1.61 | % |
| Portfolio turnover (f) | | | | 69 | %(d) | | | 155 | % | | | 168 | % | | | 185 | % | | | 192 | % | | | 174 | % |
| † | Beginning with the year ended October 31, 2015, the Fund was audited by Ernst & Young LLP. The previous year was audited by another independent registered public accounting firm. |
| | |
| (a) | Effective January 3, 2012, the share class was renamed Class A. |
| | |
| (b) | The amount is less than $0.005 per share. |
| | |
| (c) | Total returns would be reduced if a sales or redemption charge was taken into account. |
| | |
| (d) | Not annualized. |
| | |
| (e) | Annualized. |
| | |
| (f) | Portfolio turnover is calculated on the basis of the Fund as a whole, without distinguishing between classes of shares issued. |
The accompanying notes are an integral part of these financial statements.
88
Alpine Mutual Funds
Financial Highlights—Continued
(For a share outstanding throughout each period)
| | | High Yield Managed Duration Municipal Fund | |
| | | Six Months | | | | | | | | Period | |
| | | Ended | | Years Ended | | Ended | |
| | | April 30, | | October 31, | | October 31, | |
| | | 2016 | | 2015 | | 2014† | | 2013†(a) | |
| | | (Unaudited) | | | | | | | | | |
| Institutional Class: | | | | | | | | | | | | | | | | | | | | |
| Net asset value per share, beginning of period | | | $ | 10.29 | | | | $ | 10.29 | | | | $ | 9.95 | | | | $ | 10.00 | |
| Net investment income | | | | 0.17 | | | | | 0.36 | | | | | 0.37 | | | | | 0.06 | |
| Net realized and unrealized gain (loss) | | | | 0.07 | | | | | (0.00 | )(b) | | | | 0.34 | | | | | (0.05 | ) |
| Total from investment operations | | | | 0.24 | | | | | 0.36 | | | | | 0.71 | | | | | 0.01 | |
| Redemption fees | | | | 0.00 | (b) | | | | — | | | | | — | | | | | — | |
| Less distributions: | | | | | | | | | | | | | | | | | | | | |
| From net investment income | | | | (0.17 | ) | | | | (0.36 | ) | | | | (0.37 | ) | | | | (0.06 | ) |
| From net realized gains | | | | — | | | | | (0.00 | )(b) | | | | — | | | | | — | |
| Total distributions | | | | (0.17 | ) | | | | (0.36 | ) | | | | (0.37 | ) | | | | (0.06 | ) |
| Net asset value per share, end of period | | | $ | 10.36 | | | | $ | 10.29 | | | | $ | 10.29 | | | | $ | 9.95 | |
| Total return | | | | 2.35 | %(c) | | | | 3.65 | % | | | | 7.32 | % | | | | 0.11 | %(c) |
| Net Assets at end of period (000) | | | $ | 79,497 | | | | $ | 48,261 | | | | $ | 25,566 | | | | $ | 19,915 | |
| Ratio of total expenses to average net assets: | | | | | | | | | | | | | | | | | | | | |
| Before waivers and/or expense reimbursements (d) | | | | 0.93 | %(e) | | | | 1.12 | % | | | | 1.30 | % | | | | 1.66 | %(e) |
| After waivers and/or expense reimbursements (f) | | | | 0.74 | %(e) | | | | 0.82 | % | | | | 0.81 | % | | | | 0.74 | %(e) |
| Ratio of net investment income to average net assets | | | | 3.35 | %(e) | | | | 3.49 | % | | | | 3.75 | % | | | | 1.47 | %(e) |
| Portfolio turnover (g) | | | | 39 | %(c) | | | | 58 | % | | | | 62 | % | | | | 117 | % |
| † | Beginning with the year ended October 31, 2015, the Fund was audited by Ernst & Young LLP. The previous year was audited by another independent registered public accounting firm. |
| | |
| (a) | Institutional Class commenced operations on June 3, 2013. |
| | |
| (b) | The amount is less than $0.005 per share. |
| | |
| (c) | Not annualized. |
| | |
| (d) | Ratio of total expenses to average net assets excluding interest expense before waivers and/or expense reimbursements was 0.93% for the six months ended April 30, 2016, and 1.12% and 1.30% for the years ended October 31, 2015 and 2014, respectively, and 1.66% for the period ended October 31, 2013. |
| | |
| (e) | Annualized. |
| | |
| (f) | Ratio of total expenses to average net assets excluding interest expense after waivers and/or expense reimbursements was 0.74% for the six months ended April 30, 2016, and 0.80% and 0.80% for the years ended October 31, 2015 and 2014, respectively and 0.74% for the period ended October 31, 2013. |
| | |
| (g) | Portfolio turnover is calculated on the basis of the Fund as a whole, without distinguishing between classes of shares issued. |
The accompanying notes are an integral part of these financial statements.
89
Alpine Mutual Funds
Financial Highlights—Continued
(For a share outstanding throughout each period)
| | | High Yield Managed Duration Municipal Fund | |
| | | Six Months | | | | | | | | Period | |
| | | Ended | | Years Ended | | Ended | |
| | | April 30, | | October 31, | | October 31, | |
| | | 2016 | | 2015 | | 2014† | | 2013†(a) | |
| | | (Unaudited) | | | | | | | | | |
| Class A: | | | | | | | | | | | | | | | | | | | | |
| Net asset value per share, beginning of period | | | $ | 10.29 | | | | $ | 10.29 | | | | $ | 9.95 | | | | $ | 10.00 | |
| Income from investment operations: | | | | | | | | | | | | | | | | | | | | |
| Net investment income | | | | 0.16 | | | | | 0.34 | | | | | 0.35 | | | | | 0.05 | |
| Net realized and unrealized gain (loss) | | | | 0.07 | | | | | 0.00 | (b) | | | | 0.34 | | | | | (0.05 | ) |
| Total from investment operations | | | | 0.23 | | | | | 0.34 | | | | | 0.69 | | | | | 0.00 | |
| Redemption fees | | | | 0.00 | (b) | | | | — | | | | | — | | | | | — | |
| Less distributions: | | | | | | | | | | | | | | | | | | | | |
| From net investment income | | | | (0.16 | ) | | | | (0.34 | ) | | | | (0.35 | ) | | | | (0.05 | ) |
| From net realized gains | | | | — | | | | | (0.00 | )(b) | | | | — | | | | | — | |
| Total distributions | | | | (0.16 | ) | | | | (0.34 | ) | | | | (0.35 | ) | | | | (0.05 | ) |
| Net asset value per share, end of period | | | $ | 10.36 | | | | $ | 10.29 | | | | $ | 10.29 | | | | $ | 9.95 | |
| Total return (c) | | | | 2.23 | %(d) | | | | 3.42 | % | | | | 7.08 | % | | | | 0.01 | %(d) |
| Ratios/Supplemental Data | | | | | | | | | | | | | | | | | | | | |
| Net Assets at end of period (000) | | | $ | 26,938 | | | | $ | 10,170 | | | | $ | 107 | | | | $ | 100 | |
| Ratio of total expenses to average net assets: | | | | | | | | | | | | | | | | | | | | |
| Before waivers and/or expense reimbursements (e) | | | | 1.18 | %(f) | | | | 1.37 | % | | | | 1.55 | % | | | | 1.91 | %(f) |
| After waivers and/or expense reimbursements (g) | | | | 0.98 | %(f) | | | | 1.07 | % | | | | 1.06 | % | | | | 0.99 | %(f) |
| Ratio of net investment income to average net assets | | | | 3.13 | %(f) | | | | 3.16 | % | | | | 3.49 | % | | | | 1.21 | %(f) |
| Portfolio turnover (h) | | | | 39 | %(d) | | | | 58 | % | | | | 62 | % | | | | 117 | % |
| † | Beginning with the year ended October 31, 2015, the Fund was audited by Ernst & Young LLP. The previous year was audited by another independent registered public accounting firm. |
| | |
| (a) | Class A commenced operations on December 30, 2011. |
| | |
| (b) | The amount is less than $0.005 per share. |
| | |
| (c) | Total returns would be reduced if a sales or redemption charge was taken into account. |
| | |
| (d) | Not annualized. |
| | |
| (e) | Ratio of total expenses to average net assets excluding interest expense before waivers and/or expense reimbursements was 1.18% for the six months ended April 30, 2016, 1.37% and 1.55% for the years ended October 31, 2015 and 2014, respectively, and 1.91% for the period ended October 31, 2013. |
| | |
| (f) | Annualized. |
| | |
| (g) | Ratio of total expenses to average net assets excluding interest expense after waivers and/or expense reimbursements was 0.98% for the six months ended April 30, 2016, 1.05% and 1.05% for the years ended October 31, 2015 and 2014, respectively, and 0.99% for the period ended October 31, 2013. |
| | |
| (h) | Portfolio turnover is calculated on the basis of the Fund as a whole, without distinguishing between classes of shares issued. |
The accompanying notes are an integral part of these financial statements.
90
Alpine Mutual Funds
Notes to Financial Statements
April 30, 2016 (Unaudited)
| | Alpine Series Trust (the “Series Trust”) was organized in 2001 as a Delaware statutory trust, and is registered under the Investment Company Act of 1940, as amended (the “1940 Act”), as an open-end management investment company. Alpine Income Trust (the “Income Trust”) was organized in 2002 as a Delaware statutory trust and is registered under the 1940 Act, as an open-end management investment company. The Alpine Dynamic Dividend Fund, Alpine Rising Dividend Fund, Alpine Financial Services Fund and Alpine Small Cap Fund are four separate series of the Series Trust. The Alpine Ultra Short Municipal Income Fund and Alpine High Yield Managed Duration Municipal Fund are two separate series of the Income Trust. The Alpine Dynamic Dividend Fund, Alpine Rising Dividend Fund, Alpine Financial Services Fund, Alpine Small Cap Fund, Alpine Ultra Short Municipal Income Fund and Alpine High Yield Managed Duration Municipal Fund (individually referred to as a “Fund” and collectively, “the Funds”) are diversified funds. Alpine Dynamic Dividend Fund seeks high current dividend income that qualifies for the reduced U.S. federal income tax rates created by the “Jobs and Growth Tax Relief Reconciliation Act of 2003,” while also focusing on total return for long-term growth of capital. Alpine Rising Dividend Fund seeks income. Long-term growth of capital is a secondary objective. Alpine Financial Services Fund seeks long-term growth of capital and consistent above average total returns as compared to those typical of investments made in public equities. Alpine Small Cap Fund seeks capital appreciation. Alpine Ultra Short Municipal Income Fund seeks high after-tax current income consistent with preservation of capital. Alpine High Yield Managed Duration Municipal Fund seeks a high level of current income exempt from federal income tax. |
| | |
| | Alpine Woods Capital Investors, LLC (the “Adviser”) is a Delaware limited liability company and serves as the investment manager to the Funds. The Funds offer Institutional Class and Class A shares. Institutional Class shares are sold without a sales charge. Class A shares have an initial sales charge which may be waived under certain conditions as described in the Funds’ prospectus. Class A shares may be subject to contingent deferred sales charges (“CDSC”) for certain redemptions where no initial sales charge was paid at the time of purchase. All shares of the Funds have equal rights and privileges. Each share of a Fund is entitled to one vote on all matters as to which shares are entitled to vote, to participate equally with other shares in dividends and distributions declared by the Funds and on liquidation to their proportionate share of the assets remaining after satisfaction of outstanding liabilities, except that Class A shares bear certain expenses related to the distribution fee of such shares. Each class has exclusive voting rights with respect to the distribution fee of such class. Each class has exclusive voting rights with respect to matters relating to its shareholders servicing and distribution expenditures. |
| | |
| | The Funds are each an investment company and accordingly follow the investment company accounting and reporting guidance of the Financial Accounting Standards Board (“FASB”) Accounting Standards Codification Topic (“ASC”) 946 Financial Services - Investment Companies. |
| | |
| 2. | Significant Accounting Policies: |
| | |
| | The following is a summary of significant accounting policies consistently followed by the Funds in the preparation of their financial statements. The policies are in conformity with accounting principles generally accepted in the United States of America (“GAAP”), which require management to make estimates and assumptions that affect amounts reported herein. Actual results could differ from those estimates. Changes in the economic environment, financial markets and any other parameters used in determining these estimates could cause actual results to differ. |
| | |
| | A. | Valuation of Securities: |
| | |
| | The net asset value (“NAV”) of shares of the Funds are calculated by dividing the value of the Funds’ net assets by the number of outstanding shares. NAV is determined each day the New York Stock Exchange (“NYSE”) is open as of the close of regular trading (normally, 4:00 p.m., Eastern Time). In computing NAV, portfolio securities of the Funds are valued at their current fair values determined on the basis of market quotations or if market quotations are not readily available or determined to be unreliable, through procedures and/or guidelines established by the Board. In computing the Funds’ NAV, equity securities that are traded on a securities exchange in the United States, except for those listed on NASDAQ Global Market, NASDAQ Global Select Market and NASDAQ Capital Market exchanges (collectively, “NASDAQ”) and option securities are valued at the last reported sale price as of the time of valuation. Securities traded on NASDAQ will be valued at the NASDAQ Official Closing Prices (“NOCP”). If, on a particular day, an exchange traded or NASDAQ security does not trade, then the mean between the most recent quoted bid and asked prices will be used. For equity investments traded on more than one exchange, the last reported sale price on |
91
Alpine Mutual Funds
Notes to Financial Statements—Continued
April 30, 2016 (Unaudited)
the exchange where the stock is primarily traded is used. Equity-linked structured notes are valued by referencing the last reported sale or settlement price of the underlying security on the day of valuation. Foreign exchange adjustments are applied to the last reported price to convert the underlying security’s trading currency to the equity-linked structured note’s settlement currency. Each option security traded on a securities exchange in the United States is valued at the last current reported sales price as of the time of valuation if the last current reported sales price falls within the consolidated bid/ask quote. If the last current reported sale price does not fall within the consolidated bid/ask quote, the security is valued at the mid-point of the consolidated bid/ask quote for the option security. Forward currency contracts are valued based on third-party vendor quotations. Each security traded in the over-the-counter market and quoted on the NASDAQ National Market System is valued at the NOCP, as determined by NASDAQ, or lacking an NOCP, the last current reported sale price as of the time of valuation by NASDAQ, or lacking any current reported sale on NASDAQ at the time of valuation, at the mean between the most recent bid and asked quotations. Each over-the-counter option that is not traded through the Options Clearing Corporation is valued by the counterparty of the option, or if the counterparty’s price is not readily available, then by using the Black-Scholes method. Debt and short-term securities are valued based on an evaluated bid price as furnished by pricing services approved by the Board, which may be based on market transactions for comparable securities and various relationships between securities that are generally recognized by institutional traders, a computerized matrix system, or appraisals derived from information concerning the securities or similar securities received from recognized dealers in those securities. Each other security traded over-the-counter is valued at the mean between the most recent bid and asked quotations.
Securities that are principally traded in a foreign market are valued at the last current sale price at the time of valuation or lacking any current or reported sale, at the time of valuation, at the mean between the most recent bid and asked quotations as of the close of the appropriate exchange or other designated time. Trading in securities on European and Far Eastern securities exchanges and over-the-counter markets is normally completed at various times before the close of business on each day on which the NYSE is open. Trading of these securities may not take place on every NYSE business day. In addition, trading may take place in various foreign markets on Saturdays or on other days when the NYSE is not open and on which the Funds’ NAVs are not calculated.
When market quotations are not readily available or when the valuation methods mentioned above are not reflective of a fair value of the security, the security is valued at fair value following procedures and/or guidelines approved by the Board. The Funds may also use fair value pricing, if the value of a security it holds is, pursuant to the Board guidelines, materially affected by events occurring before the Funds’ NAVs are calculated but after the close of the primary market or market transactions for comparable securities and various relationships between securities that are generally recognized by institutional traders, a computerized matrix system, or appraisals derived from information concerning the securities or similar securities received from recognized dealers in those securities. The Board has approved the use of a third-party pricing vendor’s proprietary fair value pricing model to assist in determining current valuation for foreign equities and OTC derivatives traded in markets that close prior to the NYSE. When fair value pricing is employed, the value of the portfolio security used to calculate the Funds’ NAVs may differ from quoted or official closing prices. The Fund may also fair value a security if the Fund or Adviser believes that the market price is stale. Other types of securities that the Funds may hold for which fair value pricing might be required include illiquid securities including restricted securities and private placements for which there is no public market.
For securities valued by the Funds, valuation techniques are used to measure fair value that are consistent with the market approach and/or income approach, depending on the type of security and the particular circumstance. The market approach uses prices and other relevant information generated by market transactions involving identical or comparable securities. The income approach uses valuation techniques to discount estimated future cash flows to present value.
The Board of Trustees adopted procedures which utilize fair value procedures when any assets for which reliable market quotations are not readily available or for which the Funds’ pricing service does not provide a valuation or provides a valuation that in the judgment of the Adviser does not represent fair value. The Board of Trustees has established a Valuation Committee which is responsible for (1) monitoring the valuation of Fund securities and other investments; and (2) as required, when the Board of Trustees is not in session, reviewing and approving the fair value of illiquid and other holdings after consideration of all relevant factors, which determinations are reported to the Board of Trustees.
92
Alpine Mutual Funds
Notes to Financial Statements—Continued
April 30, 2016 (Unaudited)
Fair Value Measurement:
In accordance with FASB ASC, “Fair Value Measurement” (“ASC 820”), defines fair value as the value that the Funds would receive to sell an investment or pay to transfer a liability in a timely transaction with an independent buyer in the principal market, or in the absence of a principal market the most advantageous market for the investment or liability. ASC 820 uses a three-tier hierarchy to establish classification of fair value measurements for disclosure purposes. Inputs refer broadly to the assumptions that market participants would use in pricing the asset or liability, including assumptions about risk. Inputs may be observable or unobservable. Observable inputs are inputs that reflect the assumptions market participants would use in pricing the asset or liability that are developed based on market data obtained from sources independent of the reporting entity. Unobservable inputs are inputs that reflect the reporting entities’ own assumptions about the assumptions market participants would use in pricing the asset or liability that are developed based on the best information available.
| | • | Level 1 — | Unadjusted quoted prices in active markets for identical investments. |
| | | |
| | • | Level 2 — | Other significant observable inputs (including quoted prices for similar instruments, interest rates, prepayment speeds, credit risk, yield curves, default rates, etc.). |
| | | |
| | • | Level 3 — | Significant unobservable inputs (including the Funds’ own assumptions in determining the fair value of investments). |
The availability of observable inputs can vary from security to security and is affected by a wide variety of factors, including, for example, the type of security, whether the security is new and not yet established in the marketplace, the liquidity of markets, and other characteristics particular to the security. To the extent that valuation is based on models or inputs that are less observable or unobservable in the market, the determination of fair value requires more judgment. Accordingly, the degree of judgment exercised in determining fair value is greatest for instruments categorized in Level 3.
The inputs used to measure fair value may fall into different levels of the fair value hierarchy. In such cases, for disclosure purposes, the level in the fair value hierarchy within which the fair value measurement falls, is determined based on the lowest level input that is significant to the fair value measurement in its entirety.
Various inputs are used in determining the value of the Funds’ investments as of the reporting period end. The designated input levels are not necessarily an indication of the risk or liquidity associated with these investments. These inputs are categorized in the following hierarchy under ASC 820.
The following is a summary of the inputs used to value the Funds’ assets and liabilities carried at fair value as of April 30, 2016:
| | | Valuation Inputs | | | | |
| Dynamic Dividend Fund* | | Level 1 | | | Level 2 | | | Level 3 | | | Total Value | |
| Common Stocks | | | | | | | | | | | | | | | | |
| Aerospace & Defense | | $ | 2,178,335 | | | $ | — | | | $ | — | | | $ | 2,178,335 | |
| Air Freight & Logistics | | | 1,733,655 | | | | — | | | | — | | | | 1,733,655 | |
| Airlines | | | 2,400,810 | | | | — | | | | — | | | | 2,400,810 | |
| Auto Components | | | 2,259,808 | | | | — | | | | — | | | | 2,259,808 | |
| Automobiles | | | 1,586,520 | | | | — | | | | — | | | | 1,586,520 | |
| Banks | | | 9,811,889 | | | | 403,779 | | | | — | | | | 10,215,668 | |
| Beverages | | | 1,241,800 | | | | — | | | | — | | | | 1,241,800 | |
| Biotechnology | | | 793,890 | | | | — | | | | — | | | | 793,890 | |
| Capital Markets | | | 6,636,657 | | | | — | | | | — | | | | 6,636,657 | |
| Chemicals | | | 3,417,009 | | | | — | | | | — | | | | 3,417,009 | |
| Commercial Services & Supplies | | | 778,405 | | | | — | | | | — | | | | 778,405 | |
| Communications Equipment | | | 5,206,234 | | | | — | | | | — | | | | 5,206,234 | |
| Construction & Engineering | | | 5,909,885 | | | | — | | | | — | | | | 5,909,885 | |
| Consumer Finance | | | 1,800,640 | | | | — | | | | — | | | | 1,800,640 | |
| Diversified Financial Services | | | 1,230,471 | | | | — | | | | — | | | | 1,230,471 | |
93
Alpine Mutual Funds
Notes to Financial Statements—Continued
April 30, 2016 (Unaudited)
| | | Valuation Inputs | | | | |
| Dynamic Dividend Fund*—continued | | Level 1 | | | Level 2 | | | Level 3 | | | Total Value | |
| Common Stocks—continued | | | | | | | | | | | | | | | | |
| Electric Utilities | | $ | 1,998,860 | | | $ | — | | | $ | — | | | $ | 1,998,860 | |
| Electronic Equipment, Instruments & Components | | | 1,605,960 | | | | — | | | | — | | | | 1,605,960 | |
| Energy Equipment & Services | | | 943,020 | | | | — | | | | — | | | | 943,020 | |
| Food & Staples Retailing | | | 2,763,750 | | | | — | | | | — | | | | 2,763,750 | |
| Food Products | | | 4,855,583 | | | | — | | | | — | | | | 4,855,583 | |
| Gas Utilities | | | 1,256,022 | | | | — | | | | — | | | | 1,256,022 | |
| Health Care Equipment & Supplies | | | 3,648,550 | | | | — | | | | — | | | | 3,648,550 | |
| Health Care Providers & Services | | | 5,604,206 | | | | — | | | | — | | | | 5,604,206 | |
| Hotels, Restaurants & Leisure | | | 5,105,583 | | | | — | | | | — | | | | 5,105,583 | |
| Household Durables | | | 1,404,610 | | | | — | | | | — | | | | 1,404,610 | |
| Household Products | | | 2,159,072 | | | | — | | | | — | | | | 2,159,072 | |
| Independent Power and Renewables | | | 3,489,726 | | | | — | | | | — | | | | 3,489,726 | |
| Industrial Conglomerates | | | 695,007 | | | | — | | | | — | | | | 695,007 | |
| Insurance | | | 2,308,597 | | | | — | | | | — | | | | 2,308,597 | |
| Internet Software & Services | | | 831,612 | | | | — | | | | — | | | | 831,612 | |
| Life Sciences Tools & Services | | | 1,586,750 | | | | — | | | | — | | | | 1,586,750 | |
| Machinery | | | 2,382,238 | | | | — | | | | — | | | | 2,382,238 | |
| Media | | | 7,528,475 | | | | — | | | | — | | | | 7,528,475 | |
| Multi-Utilities | | | 4,452,662 | | | | — | | | | — | | | | 4,452,662 | |
| Multiline Retail | | | 2,662,075 | | | | — | | | | — | | | | 2,662,075 | |
| Oil, Gas & Consumable Fuels | | | 11,470,895 | | | | — | | | | — | | | | 11,470,895 | |
| Paper & Forest Products | | | 2,613,875 | | | | — | | | | — | | | | 2,613,875 | |
| Personal Products | | | 878,597 | | | | — | | | | — | | | | 878,597 | |
| Pharmaceuticals | | | 6,415,231 | | | | — | | | | — | | | | 6,415,231 | |
| Real Estate Investment Trusts | | | 8,914,005 | | | | — | | | | — | | | | 8,914,005 | |
| Real Estate Management & Development | | | 3,541,503 | | | | — | | | | — | | | | 3,541,503 | |
| Road & Rail | | | 5,727,520 | | | | — | | | | — | | | | 5,727,520 | |
| Semiconductors & Semiconductor Equipment | | | 4,388,738 | | | | — | | | | — | | | | 4,388,738 | |
| Specialty Retail | | | 3,262,858 | | | | — | | | | — | | | | 3,262,858 | |
| Technology, Hardware, Storage & Peripherals | | | 7,403,444 | | | | — | | | | — | | | | 7,403,444 | |
| Textiles, Apparel & Luxury Goods | | | 1,237,337 | | | | — | | | | — | | | | 1,237,337 | |
| Tobacco | | | 777,061 | | | | — | | | | — | | | | 777,061 | |
| Transportation Infrastructure | | | 1,238,197 | | | | — | | | | — | | | | 1,238,197 | |
| Water Utilities | | | 429,284 | | | | — | | | | — | | | | 429,284 | |
| Wireless Telecommunication Services | | | 1,997,140 | | | | — | | | | — | | | | 1,997,140 | |
| Equity-Linked Structured Notes | | | — | | | | 2,483,590 | | | | — | | | | 2,483,590 | |
| Convertible Bonds | | | — | | | | 2,301 | | | | — | | | | 2,301 | |
| Short-Term Investments | | | — | | | | 695,000 | | | | — | | | | 695,000 | |
| Total | | $ | 164,564,051 | | | $ | 3,584,670 | | | $ | — | | | $ | 168,148,721 | |
94
Alpine Mutual Funds
Notes to Financial Statements—Continued
April 30, 2016 (Unaudited)
| | | Valuation Inputs | | | | |
| Other Financial Instruments | | Level 1 | | | Level 2 | | | Level 3 | | | Total Value | |
| Assets | | | | | | | | | | | | | | | | |
| Forward Currency Contracts | | $ | — | | | $ | 167,965 | | | $ | — | | | $ | 167,965 | |
| Liabilities | | | | | | | | | | | | | | | | |
| Forward Currency Contracts | | | — | | | | (363,945 | ) | | | — | | | | (363,945 | ) |
| Total | | $ | — | | | $ | (195,980 | ) | | $ | — | | | $ | (195,980 | ) |
| | | | | | | | | | | | | | | | | |
| | | Valuation Inputs | | | | | |
| Rising Dividend Fund* | | Level 1 | | | Level 2 | | | Level 3 | | | Total Value | |
| Common Stocks | | | | | | | | | | | | | | | | |
| Aerospace & Defense | | $ | 2,373,140 | | | $ | — | | | $ | — | | | $ | 2,373,140 | |
| Air Freight & Logistics | | | 1,320,880 | | | | — | | | | — | | | | 1,320,880 | |
| Auto Components | | | 840,400 | | | | — | | | | — | | | | 840,400 | |
| Automobiles | | | 1,356,000 | | | | — | | | | — | | | | 1,356,000 | |
| Banks | | | 4,565,965 | | | | — | | | | — | | | | 4,565,965 | |
| Beverages | | | 875,160 | | | | — | | | | — | | | | 875,160 | |
| Biotechnology | | | 2,747,850 | | | | — | | | | — | | | | 2,747,850 | |
| Capital Markets | | | 2,944,930 | | | | — | | | | — | | | | 2,944,930 | |
| Chemicals | | | 2,602,840 | | | | — | | | | — | | | | 2,602,840 | |
| Commercial Services & Supplies | | | 2,160,860 | | | | — | | | | — | | | | 2,160,860 | |
| Communications Equipment | | | 1,988,950 | | | | — | | | | — | | | | 1,988,950 | |
| Consumer Finance | | | 1,913,180 | | | | — | | | | — | | | | 1,913,180 | |
| Diversified Financial Services | | | 919,100 | | | | — | | | | — | | | | 919,100 | |
| Diversified Telecommunication Services | | | 2,620,080 | | | | — | | | | — | | | | 2,620,080 | |
| Electric Utilities | | | 1,300,540 | | | | — | | | | — | | | | 1,300,540 | |
| Electronic Equipment, Instruments & Components | | | 1,130,120 | | | | — | | | | — | | | | 1,130,120 | |
| Energy Equipment & Services | | | 964,080 | | | | — | | | | — | | | | 964,080 | |
| Food & Staples Retailing | | | 4,802,670 | | | | — | | | | 23,933 | | | | 4,826,603 | |
| Food Products | | | 668,400 | | | | — | | | | — | | | | 668,400 | |
| Health Care Equipment & Supplies | | | 3,675,680 | | | | — | | | | — | | | | 3,675,680 | |
| Health Care Providers & Services | | | 2,969,627 | | | | — | | | | — | | | | 2,969,627 | |
| Hotels, Restaurants & Leisure | | | 1,845,200 | | | | — | | | | — | | | | 1,845,200 | |
| Household Products | | | 1,041,560 | | | | — | | | | — | | | | 1,041,560 | |
| Insurance | | | 2,726,620 | | | | — | | | | — | | | | 2,726,620 | |
| Internet Software & Services | | | 1,540,979 | | | | — | | | | — | | | | 1,540,979 | |
| IT Services | | | 510,790 | | | | — | | | | — | | | | 510,790 | |
| Machinery | | | 1,133,240 | | | | — | | | | — | | | | 1,133,240 | |
| Media | | | 4,274,128 | | | | — | | | | — | | | | 4,274,128 | |
| Multi-Utilities | | | 913,160 | | | | — | | | | — | | | | 913,160 | |
| Oil, Gas & Consumable Fuels | | | 5,030,870 | | | | — | | | | — | | | | 5,030,870 | |
| Pharmaceuticals | | | 5,367,630 | | | | — | | | | — | | | | 5,367,630 | |
| Real Estate Investment Trusts | | | 2,319,675 | | | | — | | | | — | | | | 2,319,675 | |
| Road & Rail | | | 1,904,850 | | | | — | | | | — | | | | 1,904,850 | |
| Semiconductors & Semiconductor Equipment | | | 3,592,480 | | | | — | | | | — | | | | 3,592,480 | |
| Software | | | 1,922,923 | | | | — | | | | — | | | | 1,922,923 | |
| Specialty Retail | | | 3,246,610 | | | | — | | | | — | | | | 3,246,610 | |
95
Alpine Mutual Funds
Notes to Financial Statements—Continued
April 30, 2016 (Unaudited)
| | | Valuation Inputs | | | | |
| Rising Dividend Fund*—continued | | Level 1 | | | Level 2 | | | Level 3 | | | Total Value | |
| Common Stocks—continued | | | | | | | | | | | | | | | | |
| Technology, Hardware, Storage & Peripherals | | $ | 4,409,400 | | | $ | — | | | $ | — | | | $ | 4,409,400 | |
| Put Options Purchased | | | 31,490 | | | | — | | | | — | | | | 31,490 | |
| Short-Term Investments | | | — | | | | 2,936,000 | | | | — | | | | 2,936,000 | |
| Total | | $ | 86,552,057 | | | $ | 2,936,000 | | | $ | 23,933 | | | $ | 89,511,990 | |
| | | | | | | | | | | | | | | | | |
| | | Valuation Inputs | | | | | |
| Financial Services Fund* | | Level 1 | | | Level 2 | | | Level 3 | | | Total Value | |
| Common Stocks | | $ | 16,667,206 | | | $ | — | | | $ | — | | | $ | 16,667,206 | |
| Short-Term Investments | | | — | | | | 297,000 | | | | — | | | | 297,000 | |
| Total | | $ | 16,667,206 | | | $ | 297,000 | | | $ | — | | | $ | 16,964,206 | |
| | | | | | | | | | | | | | | | | |
| | | Valuation Inputs | | | | | |
| Other Financial Instruments | | Level 1 | | | Level 2 | | | Level 3 | | | Total Value | |
| Assets | | | | | | | | | | | | | | | | |
| Forward Currency Contracts | | $ | — | | | $ | 40,596 | | | $ | — | | | $ | 40,596 | |
| Liabilities | | | | | | | | | | | | | | | | |
| Forward Currency Contracts | | | — | | | | (78,841 | ) | | | — | | | | (78,841 | ) |
| Total | | $ | — | | | $ | (38,245 | ) | | $ | — | | | $ | (38,245 | ) |
| | | | | | | | | | | | | | | | | |
| | | Valuation Inputs | | | | | |
| Small Cap Fund* | | Level 1 | | | Level 2 | | | Level 3 | | | Total Value | |
| Common Stocks | | $ | 11,220,870 | | | $ | — | | | $ | — | | | $ | 11,220,870 | |
| Short-Term Investments | | | — | | | | 1,475,000 | | | | — | | | | 1,475,000 | |
| Total | | $ | 11,220,870 | | | $ | 1,475,000 | | | $ | — | | | $ | 12,695,870 | |
| | | | | | | | | | | | | | | | | |
| | | Valuation Inputs | | | | | |
| Ultra Short Municipal Income Fund* | | Level 1 | | | Level 2 | | | Level 3 | | | Total Value | |
| Municipal Bonds | | $ | — | | | $ | 1,079,144,663 | | | $ | — | | | $ | 1,079,144,663 | |
| Money Market Funds | | | — | | | | 55,351 | | | | — | | | | 55,351 | |
| Total | | $ | — | | | $ | 1,079,200,014 | | | $ | — | | | $ | 1,079,200,014 | |
| | | | | | | | | | | | | | | | | |
| | | Valuation Inputs | | | | | |
| High Yield Managed Duration Municipal Fund* | | Level 1 | | | Level 2 | | | Level 3 | | | Total Value | |
| Municipal Bonds | | $ | — | | | $ | 109,121,914 | | | $ | — | | | $ | 109,121,914 | |
| Short-Term Investments | | | — | | | | 32,553 | | | | — | | | | 32,553 | |
| Total | | $ | — | | | $ | 109,154,467 | | | $ | — | | | $ | 109,154,467 | |
* For detailed sector, country and state descriptions, see accompanying Schedule of Portfolio Investments.
For the period ended April 30, 2016, there were no transfers between Level 1, Level 2 and Level 3.
96
Alpine Mutual Funds
Notes to Financial Statements—Continued
April 30, 2016 (Unaudited)
The following is a reconciliation of Level 3 assets for which significant unobservable inputs were used to determine fair value:
| | | Rising
Dividend
Fund | |
| Balance as of October 31, 2015 | | $ | 23,933 | |
| Realized gain (loss) | | | — | |
| Change in unrealized depreciation* | | | — | |
| Purchases | | | — | |
| Sales | | | — | |
| Transfers in to Level 3** | | | — | |
| Transfers out of Level 3** | | | — | |
| Balance as of April 30, 2016 | | $ | 23,933 | |
| Change in net unrealized appreciation/(depreciation) on Level 3 assets held at period end | | $ | — | |
| * | | Statements of Operations Location: Change in net unrealized appreciation/(depreciation) on investments and foreign currency. |
| ** | | The Funds recognize transfers as of the beginning of the period. |
| B. | Security Transactions and Investment Income: |
Security transactions are accounted for on a trade date basis. Realized gains and losses are computed on the identified cost basis. Dividend income is recorded on the ex-dividend date or in the case of some foreign securities, on the date thereafter when the Funds are made aware of the dividend. Upon notification from issuers, some of the dividend income received from a real estate investment trust may be redesignated as a reduction of cost of the related investment and/or realized gain. Interest income is recorded on the accrual basis and includes accretion of discounts and amortization of premiums, where applicable. To the extent any issuer defaults or a credit event occurs that impacts the issuer, the Funds may halt any additional interest income accruals and consider the realizability of interest accrued up to the date of default or credit event.
| C. | Line of Credit and Custody Overdrafts: |
On December 1, 2010, each of the Series Trust and Income Trust entered into a lending agreement with BNP Paribas through its New York branch (“BNPP NY”) on behalf of each of the Funds. Loans in aggregate, whether to cover overdrafts or for investment purposes may not exceed the maximum amount that is permitted under the 1940 Act. The terms of the lending agreement indicate the rate to be the Federal Funds rate plus 0.95% per annum on amounts borrowed. The BNPP NY facility provides secured, uncommitted lines of credit for the Funds where selected Funds’ assets are pledged against advances made to the respective Fund. Each Fund has granted a security interest in all pledged assets used as collateral to the BNPP NY facility. Each Fund is permitted to borrow up to 33.33% of its total assets for extraordinary or emergency purposes. Additionally, each of the following Funds is permitted to borrow up to 10% of its total assets for investment purposes but in no case shall any Fund’s total outstanding borrowings exceed 33.33% of their respective total assets. Either BNPP NY or the Funds may terminate this agreement upon delivery of written notice. For the period ended April 30, 2016, the average interest rate paid on outstanding borrowings under the line of credit was 1.39%, 1.41% and 1.38% for the Dynamic Dividend Fund, Rising Dividend Fund and Financial Services Fund, respectively. The Funds may also incur interest expense on custody overdraft charges.
97
Alpine Mutual Funds
Notes to Financial Statements—Continued
April 30, 2016 (Unaudited)
| | | Dynamic
Dividend
Fund | | | Rising
Dividend
Fund | | | Financial
Services
Fund | | | Small Cap
Fund | |
| Total line of credit amount available for investment purposes at April 30, 2016 | | $ | 17,090,966 | | | $ | 9,040,501 | | | $ | 1,741,758 | | | $ | 1,288,181 | |
| Line of credit outstanding at April 30, 2016 | | | — | | | | — | | | | — | | | | — | |
| Line of credit amount unused at April 30, 2016 | | | 17,090,966 | | | | 9,040,501 | | | | 1,741,758 | | | | 1,288,181 | |
| Average balance outstanding during the period | | | 2,199,468 | | | | 1,543 | | | | 171,129 | | | | — | |
| Maximum balance outstanding during the period | | | 11,941,995 | | | | 280,758 | | | | 2,094,819 | | | | — | |
| Interest expense incurred on line of credit during the period | | | 15,493 | | | | 11 | | | | 1,196 | | | | — | |
| Interest expense incurred on custody overdrafts during the period | | | — | | | | — | | | | 37 | | | | — | |
| | | | | | | | | | | | | | | | | |
| | | Ultra Short
Municipal
Income Fund | | | High Yield
Managed
Duration
Municipal Fund | | | | | | | | | |
| Total line of credit amount available for investment purposes at April 30, 2016 | | $ | — | | | $ | — | | | | | | | | | |
| Line of credit outstanding at April 30, 2016 | | | — | | | | — | | | | | | | | | |
| Line of credit amount unused at April 30, 2016 | | | — | | | | — | | | | | | | | | |
| Average balance outstanding during the period | | | — | | | | — | | | | | | | | | |
| Maximum balance outstanding during the period | | | — | | | | — | | | | | | | | | |
| Interest expense incurred on line of credit during the period | | | — | | | | — | | | | | | | | | |
| Interest expense incurred on custody overdrafts during the period | | | 55 | | | | 80 | | | | | | | | | |
| D. | Federal and Other Income Taxes: |
It is each Fund’s policy to comply with the Federal income and excise tax requirements of the Internal Revenue Code of 1986 (the “Code”), as amended, applicable to regulated investment companies and to timely distribute all of its investment company taxable income and net realized capital gains to shareholders in accordance with the timing requirements imposed by the Code. Therefore, no Federal income tax provision is required. Capital gains realized on some foreign securities are subject to foreign taxes. Dividends and interest from non-U.S. sources received by the Funds are generally subject to non-U.S. withholding taxes at rates ranging up to 30%. Such capital gains and withholding taxes, which are accrued as applicable, may be reduced or eliminated under the terms of applicable U.S. income tax treaties, and the Funds intend to undertake procedural steps to claim the benefits of such treaties. Where available, the Funds will file refund claims for foreign taxes withheld.
FASB ASC 740-10 “Income Taxes” - Overall sets forth a minimum threshold for financial statement recognition of the benefit of a tax position taken or expected to be taken in a tax return. Management has analyzed the Funds’ tax positions taken on income tax returns for all open tax years and has concluded that as of April 30, 2016, no provision for income tax is required in the Funds’ financial statements. The Funds’ Federal and state income and Federal excise tax returns for tax years for which the applicable statutes of limitations have not expired are subject to examination by the Internal Revenue Service and state departments of revenue. As of April 30, 2016, open Federal and New York tax years include the tax years ended October 31, 2012 through 2015. Also, the Funds have recognized no interest and penalties related to uncertain tax benefits. The Funds are also not aware of any tax positions for which it is reasonably possible that the total amounts of unrecognized tax benefits will significantly change in the next twelve months.
Foreign taxes withheld, if any, represent amounts withheld by foreign tax authorities, net of refunds recoverable. Foreign capital gains on certain foreign securities may be subject to foreign taxes, which are accrued as applicable. As of April 30, 2016, there were no outstanding balances of accrued capital gains taxes for the Funds.
98
Alpine Mutual Funds
Notes to Financial Statements—Continued
April 30, 2016 (Unaudited)
| E. | Distributions to Shareholders: |
Each Fund intends to distribute all of its net investment income and net realized capital gains, if any, throughout the year to its shareholders in the form of dividends. Distributions to shareholders are recorded at the close of business on the ex-dividend date. All dividends are automatically reinvested in full and fractional shares of the respective Funds at net asset value per share, unless otherwise requested.
The amounts of dividends from net investment income and of distributions from net realized gains are determined in accordance with Federal income tax regulations, which may differ from GAAP. These differences are either considered temporary or permanent in nature. To the extent these differences are permanent in nature, such amounts are reclassified within the composition of net assets based on their Federal tax-basis treatment; temporary differences do not require reclassification. In the event dividends and distributions to shareholders exceed net investment income and net realized gains for tax purposes, they are reported as returns of capital.
Income, expenses (other than class specific expenses) and realized and unrealized gains and losses are allocated among the classes of the Funds based on the relative net assets of each class. Class specific expenses are allocated to the class to which they relate. Currently, class specific distribution expenses are limited to those incurred under the Distribution Plan for Class A shares (See Note 5).
| G. | Foreign Currency Translation Transactions: |
Each of the Dynamic Dividend Fund, Rising Dividend Fund and Financial Services Fund may invest without limitation in foreign securities. The Small Cap Fund may invest up to 30% of the value of its net assets in foreign securities. The Funds do not isolate that portion of their net realized and unrealized gains and losses on investments resulting from changes in foreign exchange rates from the impact arising from changes in market process. Such fluctuations are included with net realized and unrealized gain or loss from investments. Net realized foreign currency transaction gains and losses arise from sales of foreign currencies, currency gains or losses realized between the trade and settlement dates on securities transactions, and the differences between the amounts of dividends, interest and foreign withholding taxes recorded on the Funds’ books and the U.S. dollar equivalent of the amounts actually received or paid. Net unrealized foreign currency transactions gains and losses arise from changes in the value of assets and liabilities, other than investments in securities, resulting from changes in the exchange rates. The books and records of each Fund are maintained in U.S. dollars. Non-U.S. dollar-denominated amounts are translated into U.S. dollars as follows, with the resultant translations gains and losses recorded in the Statements of Operations.
| | i) | fair value of investment securities and other assets and liabilities at the exchange rate on the valuation date. |
| | | |
| | ii) | purchases and sales of investment securities, income and expenses at the exchange rate prevailing on the respective date of such transactions. |
| | | |
| H. | Risks Associated with Foreign Securities and Currencies: |
Investments in securities of foreign issuers carry certain risks not ordinarily associated with investments in securities of domestic issuers. Such risks include future political and economic developments and the possible imposition of exchange controls or other foreign governmental laws and restrictions. In addition, with respect to certain countries, there is a possibility of expropriation of assets, confiscatory taxation, political or social instability or diplomatic developments, which could adversely affect investments in those countries. Generally, when the U.S. dollar rises in value against a foreign currency, the Funds’ investments denominated in that currency will lose value because that currency is worth fewer U.S. dollars; the opposite effect occurs if the U.S. dollar falls in relative value.
Certain countries may also impose substantial restrictions on investments in their capital markets by foreign entities, including restrictions on investments in issuers or industries deemed sensitive to relevant national interests. These factors may limit the investment opportunities available to the Funds or result in a lack of liquidity and high price volatility with respect to securities of issuers from developing countries.
| I. | Equity-Linked Structured Notes: |
The Funds may invest in equity-linked structured notes. Equity-linked structured notes are securities which are specially designed to combine the characteristics of one or more underlying securities and their equity derivatives in a single note form. The return and/or yield or income component may be based on the performance of the
99
Alpine Mutual Funds
Notes to Financial Statements—Continued
April 30, 2016 (Unaudited)
underlying equity securities, and equity index, and/or option positions. Equity-linked structured notes are typically offered in limited transactions by financial institutions in either registered or non-registered form. An investment in equity-linked structured notes creates exposure to the credit risk of the issuing financial institution, as well as to the market risk of the underlying securities. There is no guaranteed return of principal with these securities and the appreciation potential of these securities may be limited by a maximum payment or call right. In certain cases, equity-linked structured notes may be more volatile and less liquid than complex securities or other types of fixed-income securities. Such securities may exhibit price behavior that does not correlate with other fixed-income securities. The Dynamic Dividend Fund held three equity-linked structured notes as of April 30, 2016.
The Funds may engage in option transactions and in doing so achieve similar objectives to what they would achieve through the sale or purchase of individual securities. A call option, upon payment of a premium, gives the purchaser of the option the right to buy, and the seller of the option the obligation to sell, the underlying security, index or other instrument at the exercise price. A put option gives the purchaser of the option, upon payment of a premium, the right to sell, and the seller the obligation to buy, the underlying security, index, or other instrument at the exercise price.
To seek to offset some of the risk of a potential decline in value of certain long positions, the Funds may also purchase put options on individual securities. The Funds may also seek to generate income from option premiums by writing (selling) options on a portion of the equity securities in the Funds’ portfolio.
When a Fund purchases an option, it pays a premium and an amount equal to that premium is recorded as an asset. When a Fund writes an option, it receives a premium and an amount equal to that premium is recorded as a liability. The asset or liability is adjusted daily to reflect the current market value of the option. If an option expires unexercised, the Fund realizes a gain or loss to the extent of the premium received or paid. If an option is exercised, the premium received or paid is recorded as an adjustment to the proceeds from the sale or the cost basis of the purchase. The difference between the premium and the amount received or paid on a closing purchase or sale transaction is also treated as a realized gain or loss. The cost of securities acquired through the exercise of call options is increased by premiums paid. The proceeds from securities sold through the exercise of put options are decreased by the premiums paid. Gain or loss on written options and purchased options is presented separately as net realized gain or loss on written options and net realized gain or loss on purchased options, respectively. The Rising Dividend Fund held options contracts during the reporting period to seek to offset some of the risk of a potential decline in value of certain long positions and to generate income from option premiums by writing (selling) options on a portion of the equity securities in the Funds’ portfolio. There were no written options contracts held as of April 30, 2016.
Written options transactions for the period ended April 30, 2016 were as follows in the Rising Dividend Fund:
| | | Number of
Contracts | | Premiums
Received |
| Written Options, outstanding as of October 31, 2015 | | | 240 | | | | $ | 14,226 | |
| Options written | | | 180 | | | | | 29,518 | |
| Options exercised | | | 25 | | | | | (3,174 | ) |
| Options expired | | | (210 | ) | | | | (20,135 | ) |
| Options bought back | | | (235 | ) | | | | (20,435 | ) |
| Written Options, outstanding as of April 30, 2016 | | | — | | | | $ | — | |
| K. | Forward Currency Contracts: |
The Funds are subject to foreign currency exchange rate risk in the normal course of pursuing their investment objectives. The Funds may use forward currency contracts to gain exposure to or economically hedge against changes in the value of foreign currencies. A forward currency contract (“forward”) is an agreement between two parties to buy and sell a currency at a set price on a future date. The market value of the forward contract fluctuates with changes in forward currency exchange rates. The forward contract is marked-to-market daily and the change in market value is recorded by each Fund as unrealized appreciation or depreciation. When the forward contract is closed, a Fund records a realized gain or loss equal to the fluctuation in value during the period the forward contract was open. A Fund could be exposed to risk if a counterparty is unable to meet the terms of a forward or if the value
100
Alpine Mutual Funds
Notes to Financial Statements—Continued
April 30, 2016 (Unaudited)
of the currency changes unfavorably. The Funds’ forward contracts are not subject to an enforceable master netting agreement or similar agreement. The Dynamic Dividend Fund and the Financial Services Fund entered into forward currency contracts during the reporting period to economically hedge against changes in the value of foreign currencies. During the period ended April 30, 2016, the Dynamic Dividend Fund and Financial Services Fund entered into ten and nineteen forward contracts, respectively. The average monthly principal amount for forward contracts held by the Dynamic Dividend Fund and Financial Services Fund throughout the period were $15,804,692 and $1,344,657, respectively. This is based on amounts held as of each month-end throughout the period.
The following forward currency contracts were held as of April 30, 2016:
Dynamic Dividend Fund
| Description | | Counterparty | | Settlement
Date | | Currency | | Settlement
Value | | | Current
Value | | | Unrealized
Appreciation/
(Depreciation) | |
| Contracts Sold: | | | | | | | | | | | | | | | | | | |
| Euro | | State Street Bank and Trust Company | | 06/09/16 | | 7,000,000 EUR | | $ | 7,660,135 | | | $ | 8,024,080 | | | $ | (363,945 | ) |
| British Pound | | State Street Bank and Trust Company | | 06/09/16 | | 4,300,000 GBP | | | 6,451,462 | | | | 6,283,497 | | | | 167,965 | |
| | | | | | | | | | | | | $ | 14,307,577 | | | $ | (195,980 | ) |
| | | | | | | | | | | | | | | | | | | |
| Financial Services Fund | | | | | | | | | | | | | | | | |
| Description | | Counterparty | | Settlement
Date | | Currency | | Settlement
Value | | | Current
Value | | | Unrealized
Appreciation/
(Depreciation) | |
| Contracts Purchased: | | | | | | | | | | | | | | |
| Euro | | State Street Bank and Trust Company | | 06/09/16 | | 50,000 EUR | | $ | 56,412 | | | $ | 57,315 | | | $ | 903 | |
| Euro | | State Street Bank and Trust Company | | 06/09/16 | | 50,000 EUR | | | 55,330 | | | | 57,315 | | | | 1,985 | |
| Euro | | State Street Bank and Trust Company | | 06/09/16 | | 25,000 EUR | | | 27,821 | | | | 28,657 | | | | 836 | |
| British Pound | | State Street Bank and Trust Company | | 06/09/16 | | 50,000 GBP | | | 69,637 | | | | 73,064 | | | | 3,427 | |
| Japanese Yen | | State Street Bank and Trust Company | | 06/09/16 | | 35,000,000 JPY | | | 308,681 | | | | 329,213 | | | | 20,532 | |
| Japanese Yen | | State Street Bank and Trust Company | | 06/09/16 | | 15,000,000 JPY | | | 133,297 | | | | 141,092 | | | | 7,795 | |
| Japanese Yen | | State Street Bank and Trust Company | | 06/09/16 | | 5,000,000 JPY | | | 44,513 | | | | 47,031 | | | | 2,518 | |
| | | | | | | | | | | | | $ | 733,687 | | | $ | 37,996 | |
| Contracts Sold: | | | | | | | | | | | | | | | | | | |
| Euro | | State Street Bank and Trust Company | | 06/09/16 | | 125,000 EUR | | $ | 138,615 | | | $ | 143,287 | | | $ | (4,672 | ) |
| British Pound | | State Street Bank and Trust Company | | 06/09/16 | | 50,000 GBP | | | 75,664 | | | | 73,064 | | | | 2,600 | |
| Japanese Yen | | State Street Bank and Trust Company | | 06/09/16 | | 70,000,000 JPY | | | 584,259 | | | | 658,428 | | | | (74,169 | ) |
| | | | | | | | | | | | | $ | 874,779 | | | $ | (76,241 | ) |
101
Alpine Mutual Funds
Notes to Financial Statements—Continued
April 30, 2016 (Unaudited)
| L. | Derivative Instruments: |
The following tables provide information about the effect of derivatives on the Funds’ Statements of Assets and Liabilities and Statements of Operations as of and for the period ended April 30, 2016. The first table provides additional detail about the amounts and sources of unrealized appreciation/(depreciation) on derivatives at the end of the period. The second table provides additional information about the amounts and sources of net realized gain/(loss) and the change in net unrealized appreciation/(depreciation) resulting from the Funds’ derivatives during the period.
The effect of derivative instruments in the Statements of Assets and Liabilities as of April 30, 2016:
| Dynamic Dividend Fund | | | | | |
| Derivatives | | Statements of Assets
and Liabilities Location | | Unrealized
Appreciation/(Depreciation) |
| Foreign exchange risk | | Unrealized appreciation on forward currency contract | | | $ | 167,965 | | |
| Foreign exchange risk | | Unrealized depreciation on forward currency contract | | | | (363,945 | ) | |
| | | | | | $ | (195,980 | ) | |
| Rising Dividend Fund | | | | | | |
| Derivatives | | Statements of Assets
and Liabilities Location | | Unrealized
Appreciation |
| Equity Contracts | | Investments in securities, at value (includes purchased options) | | | $ | 31,490 | | |
| Financial Services Fund | | | | | | |
| Derivatives | | Statements of Assets
and Liabilities Location | | Unrealized
Appreciation/(Depreciation) |
| Foreign exchange risk | | Unrealized appreciation on forward currency contract | | | $ | 40,596 | | |
| Foreign exchange risk | | Unrealized depreciation on forward currency contract | | | | (78,841 | ) | |
| | | | | | $ | (38,245 | ) | |
The effect of derivative instruments in the Statements of Operations for the period ended April 30, 2016:
| Dynamic Dividend Fund | | | | | | |
| Derivatives | | Statements of
Operations Location | | Net Realized
Gain | | Changes in Net
Unrealized Depreciation |
| Foreign exchange risk | | Net realized gain/(loss) from foreign currency transactions | | $ | 948,070 | | | | | |
| Foreign exchange risk | | Change in net unrealized appreciation/(depreciation) on foreign currency translations | | | | | | $ | (768,783 | ) |
102
Alpine Mutual Funds
Notes to Financial Statements—Continued
April 30, 2016 (Unaudited)
| Rising Dividend Fund | | | | | | | | | | |
| Derivatives | | Statements of
Operations Location | | Net Realized
Gain (Loss) | | Change in Net Unrealized
Appreciation/(Depreciation) |
| Equity risk | | Net realized gain/(loss) from investments | | $ | (53,561 | ) | | | | | | |
| Equity risk | | Change in net unrealized appreciation/(depreciation) on investments | | | | | | | $ | 9,147 | | |
| Equity risk | | Net realized gain/(loss) from written options contracts | | $ | 35,626 | | | | | | | |
| Equity risk | | Change in net unrealized appreciation/(depreciation) on written options contracts | | | | | | | $ | (13,026 | ) | |
| | | | | | | | | | | | | |
| Financial Services Fund | | | | | | | | | | |
| | | | | | | | | | | | | |
| Derivatives | | Statements of
Operations Location | | Net Realized
Gain | | Changes in Net
Unrealized Depreciation |
| Foreign exchange risk | | Net realized gain/(loss) from foreign currency transactions | | $ | 10,084 | | | | | | | |
| Foreign exchange risk | | Change in net unrealized appreciation/(depreciation) on foreign currency translations | | | | | | | $ | (40,665 | ) | |
The Funds of the Alpine Series Trust impose a redemption fee of 1% of the total redemption amount on all Fund shares redeemed or exchanged within 60 days of buying them, either by purchase or exchange. This fee is assessed and retained by the Funds for the benefit of the remaining shareholders. The redemption fee is accounted for as an increase to paid-in-capital. The Alpine Ultra Short Municipal Income Fund imposes a 0.25% redemption fee for shares redeemed or exchanged within 30 days of buying them and the High Yield Managed Duration Municipal Fund imposes a 0.75% redemption fee for shares redeemed or exchanged within 60 days of buying them, of the total redemption amount on all Fund shares redeemed or exchanged. This fee is assessed and retained by the Funds for the benefit of the remaining shareholders. The redemption fee is accounted for as an increase to paid-in-capital.
| 3. | Capital Share Transactions: |
The Funds have an unlimited number of shares of beneficial interest, with $0.001 par value, authorized. Transactions in shares and dollars of the Funds were as follows:
| Dynamic Dividend Fund | | | | | | | | | | | | |
| | | Six Months Ended
April 30, 2016 | | | Year Ended
October 31, 2015 | |
| | | Shares | | | Amount | | | Shares | | | Amount | |
| Institutional Class | | | | | | | | | | | | | | | | |
| Shares sold | | | 991,411 | | | $ | 3,418,155 | | | | 3,466,999 | | | $ | 13,621,647 | |
| Shares issued in reinvestment of dividends | | | 1,150,901 | | | | 4,009,089 | | | | 2,162,374 | | | | 8,384,107 | |
| Redemption fees | | | — | | | | 1,863 | | | | — | | | | 2,152 | |
| Shares redeemed | | | (4,706,216 | ) | | | (16,232,229 | ) | | | (11,756,955 | ) | | | (45,912,677 | ) |
| Total net change | | | (2,563,904 | ) | | $ | (8,803,122 | ) | | | (6,127,582 | ) | | $ | (23,904,771 | ) |
| Class A | | | | | | | | | | | | | | | | |
| Shares sold | | | 125,433 | | | $ | 440,913 | | | | 347,585 | | | $ | 1,372,113 | |
| Shares issued in reinvestment of dividends | | | 16,108 | | | | 56,157 | | | | 30,404 | | | | 117,981 | |
| Redemption fees | | | — | | | | 40 | | | | — | | | | 46 | |
| Shares redeemed | | | (411,921 | ) | | | (1,459,247 | ) | | | (404,030 | ) | | | (1,582,312 | ) |
| Total net change | | | (270,380 | ) | | $ | (962,137 | ) | | | (26,041 | ) | | $ | (92,172 | ) |
103
Alpine Mutual Funds
Notes to Financial Statements—Continued
April 30, 2016 (Unaudited)
| Rising Dividend Fund | | | | | | | | | | | | |
| | | Six Months Ended
April 30, 2016 | | | Year Ended
October 31, 2015 | |
| | | Shares | | | Amount | | | Shares | | | Amount | |
| Institutional Class | | | | | | | | | | | | | | | | |
| Shares sold | | | 41,630 | | | $ | 588,185 | | | | 118,489 | | | $ | 1,905,372 | |
| Proceeds from shares issued in connection with the tax-free transfer of assets from Alpine Transformations Fund (Note 8) | | | — | | | | — | | | | 507,899 | | | | 7,643,926 | |
| Proceeds from shares issued in connection with the tax-free transfer of assets from Alpine Equity Income Fund (Note 8) | | | 5,123,760 | | | | 77,113,107 | | | | | | | | | |
| Shares issued in reinvestment of dividends | | | 144,581 | | | | 2,124,641 | | | | 22,856 | | | | 357,891 | |
| Redemption fees | | | — | | | | 69 | | | | — | | | | — | |
| Shares redeemed | | | (121,293 | ) | | | (1,687,817 | ) | | | (68,404 | ) | | | (1,092,652 | ) |
| Total net change | | | 64,918 | | | $ | 1,025,078 | | | | 5,704,600 | | | $ | 85,927,644 | |
| Class A | | | | | | | | | | | | | | | | |
| Shares sold | | | 159 | | | $ | 2,363 | | | | 89,014 | | | $ | 1,450,839 | |
| Shares sold-Merger | | | — | | | | — | | | | 32,102 | | | | 483,131 | |
| Shares issued in reinvestment of dividends | | | 2,951 | | | | 43,382 | | | | 7,101 | | | | 111,046 | |
| Redemption fees | | | — | | | | 1 | | | | — | | | | — | |
| Shares redeemed | | | (65,666 | ) | | | (964,724 | ) | | | (25,995 | ) | | | (393,204 | ) |
| Total net change | | | (62,556 | ) | | $ | (918,978 | ) | | | 102,222 | | | $ | 1,651,812 | |
| Financial Services Fund | | | | | | | | | | | | | | |
| | | Six Months Ended
April 30, 2016 | | | Year Ended
October 31, 2015 | |
| | | Shares | | | Amount | | | Shares | | | Amount | |
| Institutional Class | | | | | | | | | | | | | | | | |
| Shares sold | | | 98,453 | | | $ | 1,176,616 | | | | 369,389 | | | $ | 4,998,497 | |
| Shares issued in reinvestment of dividends | | | 13,575 | | | | 172,672 | | | | 12,761 | | | | 171,655 | |
| Redemption fees | | | — | | | | 203 | | | | — | | | | 1,836 | |
| Shares redeemed | | | (490,829 | ) | | | (5,699,504 | ) | | | (962,004 | ) | | | (12,790,683 | ) |
| Total net change | | | (378,801 | ) | | $ | (4,350,013 | ) | | | (579,854 | ) | | $ | (7,618,695 | ) |
| Class A | | | | | | | | | | | | | | | | |
| Shares sold | | | 15,244 | | | $ | 174,204 | | | | 66,509 | | | $ | 874,831 | |
| Shares issued in reinvestment of dividends | | | 2,714 | | | | 34,336 | | | | 3,511 | | | | 46,990 | |
| Redemption fees | | | — | | | | 58 | | | | — | | | | 549 | |
| Shares redeemed | | | (244,569 | ) | | | (2,631,915 | ) | | | (234,275 | ) | | | (3,092,029 | ) |
| Total net change | | | (226,611 | ) | | $ | (2,423,317 | ) | | | (164,255 | ) | | $ | (2,169,659 | ) |
104
Alpine Mutual Funds
Notes to Financial Statements—Continued
April 30, 2016 (Unaudited)
| Small Cap Fund | | | | | | | | | | | | |
| | | Six Months Ended
April 30, 2016 | | | Year Ended
October 31, 2015 | |
| | | Shares | | | Amount | | | Shares | | | Amount | |
| Institutional Class | | | | | | | | | | | | | | | | |
| Shares sold | | | 18,948 | | | $ | 269,760 | | | | 33,543 | | | $ | 472,343 | |
| Shares issued in reinvestment of dividends | | | — | | | | — | | | | — | | | | — | |
| Redemption fees | | | — | | | | — | | | | — | | | | 822 | |
| Shares redeemed | | | (64,557 | ) | | | (904,590 | ) | | | (139,381 | ) | | | (1,991,521 | ) |
| Total net change | | | (45,609 | ) | | $ | (634,830 | ) | | | (105,838 | ) | | $ | (1,518,356 | ) |
| Class A | | | | | | | | | | | | | | | | |
| Shares sold | | | 604 | | | $ | 8,791 | | | | 30,976 | | | $ | 440,928 | |
| Shares issued in reinvestment of dividends | | | — | | | | — | | | | — | | | | — | |
| Redemption fees | | | — | | | | — | | | | — | | | | 70 | |
| Shares redeemed | | | (23,491 | ) | | | (330,601 | ) | | | (39,243 | ) | | | (552,566 | ) |
| Total net change | | | (22,887 | ) | | $ | (321,810 | ) | | | (8,267 | ) | | $ | (111,568 | ) |
| Ultra Short Municipal Income Fund | | | | | | | | | | | | |
| | | Six Months Ended
April 30, 2016 | | | Year Ended
October 31, 2015 | |
| | | Shares | | | Amount | | | Shares | | | Amount | |
| Institutional Class | | | | | | | | | | | | | | | | |
| Shares sold | | | 26,795,088 | | | $ | 269,022,684 | | | | 27,287,282 | | | $ | 273,964,312 | |
| Shares issued in reinvestment of dividends | | | 166,719 | | | | 1,673,860 | | | | 315,186 | | | | 3,164,465 | |
| Redemption fees | | | — | | | | 15,568 | | | | — | | | | 12,623 | |
| Shares redeemed | | | (21,765,347 | ) | | | (218,524,081 | ) | | | (33,510,389 | ) | | | (336,444,301 | ) |
| Total net change | | | 5,196,460 | | | $ | 52,188,031 | | | | (5,907,921 | ) | | $ | (59,302,901 | ) |
| Class A | | | | | | | | | | | | | | | | |
| Shares sold | | | 3,216,608 | | | $ | 32,484,489 | | | | 9,158,022 | | | $ | 92,474,358 | |
| Shares issued in reinvestment of dividends | | | 22,442 | | | | 226,616 | | | | 46,820 | | | | 472,735 | |
| Redemption fees | | | — | | | | 3,682 | | | | — | | | | 3,592 | |
| Shares redeemed | | | (5,052,138 | ) | | | (51,025,232 | ) | | | (13,577,730 | ) | | | (137,106,037 | ) |
| Total net change | | | (1,813,088 | ) | | $ | (18,310,445 | ) | | | (4,372,888 | ) | | $ | (44,155,352 | ) |
105
Alpine Mutual Funds
Notes to Financial Statements—Continued
April 30, 2016 (Unaudited)
| High Yield Managed Duration Municipal Fund | | | | | | | | | | | | |
| | | Six Months Ended
April 30, 2016 | | | Year Ended
October 31, 2015 | |
| | | Shares | | | Amount | | | Shares | | | Amount | |
| Institutional Class | | | | | | | | | | | | | | | | |
| Shares sold | | | 3,649,159 | | | $ | 37,528,592 | | | | 2,437,080 | | | $ | 25,137,443 | |
| Shares issued in reinvestment of dividends | | | 78,159 | | | | 803,763 | | | | 103,944 | | | | 1,071,225 | |
| Redemption fees | | | — | | | | 12,145 | | | | — | | | | 4,190 | |
| Shares redeemed | | | (741,637 | ) | | | (7,635,992 | ) | | | (336,237 | ) | | | (3,457,415 | ) |
| Total net change | | | 2,985,681 | | | $ | 30,708,508 | | | | 2,204,787 | | | $ | 22,755,443 | |
| Class A | | | | | | | | | | | | | | | | |
| Shares sold | | | 1,629,909 | | | $ | 16,780,932 | | | | 1,045,193 | | | $ | 10,761,230 | |
| Shares issued in reinvestment of dividends | | | 13,559 | | | | 139,635 | | | | 6,339 | | | | 65,174 | |
| Redemption fees | | | — | | | | 3,063 | | | | — | | | | 640 | |
| Shares redeemed | | | (30,795 | ) | | | (317,202 | ) | | | (73,749 | ) | | | (758,641 | ) |
| Total net change | | | 1,612,673 | | | $ | 16,606,428 | | | | 977,783 | | | $ | 10,068,403 | |
| 4. | Purchases and Sales of Securities: |
Purchases and sales of securities (excluding short-term securities) for the period ended April 30, 2016 are as follows:
| | | Purchases | | | Sales | |
| Dynamic Dividend Fund | | $ | 85,973,700 | | | $ | 83,478,079 | |
| Rising Dividend Fund | | | 37,386,696 | | | | 37,489,688 | |
| Financial Services Fund | | | 9,313,131 | | | | 14,820,235 | |
| Small Cap Fund | | | 4,965,645 | | | | 6,708,356 | |
| Ultra Short Municipal Income Fund | | | 634,317,084 | | | | 606,159,728 | |
| High Yield Managed Duration Municipal Fund | | | 79,899,153 | | | | 29,084,600 | |
The Funds did not have purchases and sales of U.S. Government Obligations during the period ended April 30, 2016.
Quasar Distributors, LLC (“Quasar”) serves as each Fund’s distributor. Each of the Funds have adopted a distribution and servicing plan (the “Plan”) for their Class A shares as allowed by Rule 12b-1 under the 1940 Act. The Plan authorizes payments by the Funds in connection with the distribution and servicing of their Class A shares at an annual rate, as determined from time to time by the Board, of up to 0.25% of the average daily net assets of the Class A shares of the Funds. Amounts paid under the Plan by the Funds may be spent by the Funds on any activities or expenses primarily intended to result in the sale of Class A shares of the Funds, including but not limited to advertising, compensation for sales and marketing activities of financial institutions and others such as dealers and distributors, shareholder account servicing, the printing and mailing of prospectuses to other than current shareholders and the printing and mailing of sales literature. Dynamic Dividend Fund, Rising Dividend Fund, Financial Services Fund, Small Cap Fund, Ultra Short Municipal Income Fund and High Yield Managed Duration Municipal Fund incurred $3,903, $2,702, $5,427, $1,286, $238,575 and $19,282, respectively, pursuant to the Plan for the period ended April 30, 2016.
The Plan for the Funds may be terminated at any time by a majority vote of the Trustees of the Trusts who are not “interested persons,” as defined by the 1940 Act, or by vote of a majority of the outstanding voting shares of the respective Fund.
106
Alpine Mutual Funds
Notes to Financial Statements—Continued
April 30, 2016 (Unaudited)
| 6. | Investment Advisory Agreement, Administration Agreement and Other Affiliated Transactions: |
The Adviser provides investment advisory services to each of the Funds. Pursuant to the advisory agreements with the Funds, the Adviser is entitled to an annual fee based on 1.00% of each Fund’s average daily net assets for the Dynamic Dividend Fund (until March 31, 2016), Rising Dividend Fund (until March 31, 2016), Financial Services Fund and Small Cap Fund. From April 1, 2016 to April 1, 2017, the Adviser shall waive 0.05% of the Small Cap Fund’s Advisory Fee at an annualized rate. Effective April 1, 2016, the Adviser is entitled to an annual fee based on each Fund’s average daily net asset for the Dynamic Dividend Fund and Rising Dividend Fund, in accordance with the following schedule:
| First $250 million | 1.00% |
| Over $250 million | 0.95% |
The Adviser was entitled to an annual fee based on 0.75% of each of the Fund’s average net assets for the Ultra Short Municipal Income Fund and High Yield Managed Duration Municipal Fund until March 31, 2016.
Effective April 1, 2016, the Adviser is entitled to an annual fee based on the Ultra Short Municipal Income Fund’s average daily net asset, in accordance with the following schedule:
| First $2.5 billion | 0.50% |
| Over $2.5 billion | 0.45% |
Effective April 1, 2016, the Adviser is entitled to an annual fee based on the High Yield Managed Duration Municipal Fund’s average daily net asset, in accordance with the following schedule:
| First $250 million | 0.65% |
| Over $250 million | 0.60% |
The Adviser agreed to waive fees and/or reimburse the Dynamic Dividend Fund, Rising Dividend Fund, Financial Services Fund and Small Cap Fund to the extent necessary to ensure that ordinary operating expenses (including 12b-1 fees, but excluding interest, brokerage commissions, acquired fund fees and extraordinary expenses) do not exceed annually 1.60% of each Fund’s Class A shares average daily net assets, and 1.35% of each Fund’s Institutional Class shares average daily net assets (until March 31, 2016). Effective April 1, 2016, the Adviser agreed to waive fees and/or reimburse the Dynamic Dividend Fund, Rising Dividend Fund, Financial Services Fund and Small Cap Fund to the extent necessary to ensure that ordinary operating expenses (including 12b-1 fees, but excluding interest, brokerage commissions, acquired fund fees and extraordinary expenses) do not exceed annually 1.50% of each Fund’s Class A shares average daily net assets and 1.25% of each Fund’s Institutional Class shares average daily net assets. The contractual expense cap for the Ultra Short Municipal Income Fund Class A shares and Institutional Class shares is 0.95% and 0.70% (until March 31, 2016). Effective April 1, 2016, the Adviser agreed to waive fees and/or reimburse the Ultra Short Municipal Income Fund to the extent necessary to ensure that ordinary operating expenses (including 12b-1 fees, but excluding interest, brokerage commissions, acquired fund fees and extraordinary expenses) do not exceed annually 0.70%, respectively, of the Fund’s Class A shares average daily net assets and 0.45% of the Fund’s Institutional Class shares average daily net assets. The Adviser may recover expenses paid in excess of the cap on expenses for the three previous years, as long as the recovery does not cause the Fund to exceed such cap on expenses. The contractual expense cap for High Yield Managed Duration Municipal Fund Class A shares and Institutional Class shares is 1.05% and 0.80%, respectively (until March 31, 2016). Effective April 1, 2016, the Adviser agreed to waive fees and/or reimburse the High Yield Managed Duration Municipal Fund to the extent necessary to ensure that ordinary operating expenses (including 12b-1 fees, but excluding interest, brokerage commissions, acquired fund fees and extraordinary expenses) do not exceed annually 0.90% of the Fund’s Class A shares average daily net assets and 0.65% of the Fund’s Institutional Class shares average daily net assets. For the period ended April 30, 2016, the Adviser waived investment advisory fees and other expenses totaling $26,246, $48,704, $21,897, $2,035,698 and $72,373 for the Dynamic Dividend Fund, Financial Services Fund, Small Cap Fund, Ultra Short Municipal Income Fund and High Yield Managed Duration Municipal Fund, respectively. The expense limitations will remain in effect for each Fund through April 1, 2017 unless and until the Board of the Series and Income Trusts approve its modification or termination with respect to each Fund. Waived expenses subject to potential recovery by year of expiration are as follows:
107
Alpine Mutual Funds
Notes to Financial Statements—Continued
April 30, 2016 (Unaudited)
Years of
Expiration | | Dynamic
Dividend
Fund | | Rising
Dividend
Fund | | Financial
Services
Fund | | Small Cap
Fund | | Ultra Short
Municipal
Income
Fund | | High Yield
Managed
Duration
Municipal
Fund |
| 10/31/2016 | | | $ | 144,069 | | | | $ | 67,570 | | | | $ | 58,369 | | | | $ | 52,638 | | | | $ | 2,162,530 | | | | $ | 76,676 | |
| 10/31/2017 | | | | 146,717 | | | | | 44,557 | | | | | — | | | | | 37,668 | | | | | 2,325,098 | | | | | 106,330 | |
| 10/31/2018 | | | | — | | | | | 55,991 | | | | | 137,078 | | | | | 77,751 | | | | | 2,283,138 | | | | | 115,543 | |
| 10/31/2019 | | | | 26,246 | | | | | — | | | | | 48,704 | | | | | 20,871 | | | | | 1,111,498 | | | | | 61,258 | |
For the period ended April 30, 2016, the Adviser voluntarily agreed to reimburse the Ultra Short Municipal Income Fund to the extent necessary to ensure that the Fund’s total operating expenses (including 12b-1 fees, where applicable, but excluding interest, brokerage commissions and extraordinary expenses) were within the range 0.65%-0.75% and 40%-0.50% of the average daily net assets of the Class A shares and Institutional Class shares, respectively, during the period ended April 30, 2016. Expenses voluntarily waived by a Fund are not subject to recoupment.
The Adviser makes payments to intermediaries that provide omnibus account services, sub-accounting services and/or networking services with respect to the Funds. On February 2, 2012, the Board approved, subject to certain limitations, the reimbursement to the Adviser by the appropriate Fund, of up to a certain percentage of such fees paid by the Adviser to intermediaries that provide omnibus account services, sub-accounting services, and/or networking services. Reimbursement of these fees are subject to review by the Board and are included in the transfer agent fees in the Statements of Operations. The Dynamic Dividend Fund, Rising Dividend Fund, Financial Services Fund, Small Cap Fund, Ultra Short Municipal Income Fund and High Yield Managed Duration Municipal Fund incurred $75,241, $644, $16,580, $2,897, $244,579 and $109, respectively, in reimbursements to the Adviser.
State Street Bank and Trust Company (“SSBT”) serves as the fund accounting agent and custodian. The custodian is responsible for the safekeeping of the assets of the Funds and the fund accounting agent is responsible for calculating the Funds’ NAVs. SSBT, as the Funds’ custodian and fund accounting agent, is paid on the basis of net assets and transaction costs of the Funds. SSBT also serves as the administrator for the Series Trust and Income Trust. SSBT, as the Funds’ administrator, is paid on the basis of net assets of the Funds which are allocated among the series of the Series Trust and Income Trust, on the basis of relative net assets.
Boston Financial Data Services, Inc. (“BFDS”) serves as the transfer agent to the Equity Trust. BFDS is paid on the basis of net assets, per account fees and certain transaction costs.
During the period ended April 30, 2016, the Funds engaged in purchase and sale transactions with funds that have a common investment adviser (or affiliated investment advisers), common Directors/Trustees and/or common Officers. These purchase and sale transactions complied with Rule 17a-7 under the 1940 Act and were as follows:
| | | Purchases | | Sales |
| Ultra Short Municipal Income Fund | | $ | — | | | $ | 575,000 | |
| High Yield Managed Duration Municipal Fund | | | 575,000 | | | | — | |
| 7. | Federal Income Tax Information: |
GAAP requires that certain components of net assets be reclassified to reflect permanent differences between financial and tax reporting. These reclassifications have no effect on net assets or net asset values per share of the Funds.
As of October 31, 2015, the components of distributable earnings on a tax basis were as follows:
| | | Dynamic | | | Rising Dividend | | Financial | | Small Cap | |
| | | Dividend Fund | | | Fund | | Services Fund | | Fund | |
| Undistributed ordinary income | | $ | 575,543 | | | | $ | 12,799 | | | | $ | 247,738 | | | $ | — | |
| Undistributed long-term capital gain | | | — | | | | | 588,858 | | | | | — | | | | — | |
| Late year ordinary loss deferral | | | — | | | | | — | | | | | — | | | | (62,343 | ) |
| Accumulated capital loss | | | (1,086,574,414 | ) | | | | — | | | | | (208,443 | ) | | | (8,038,502 | ) |
| Unrealized appreciation/(depreciation) | | | 7,231,621 | | | | | 13,008,162 | | | | | 2,846,530 | | | | (57,125 | ) |
| Total | | $ | (1,078,867,250 | ) | | | $ | 13,609,819 | | | | $ | 2,885,825 | | | $ | (8,157,970 | ) |
108
Alpine Mutual Funds
Notes to Financial Statements—Continued
April 30, 2016 (Unaudited)
| | | Ultra Short
Municipal
Income Fund | | High Yield
Managed
Duration
Municipal Fund |
| Undistributed tax exempt income | | | $ | 90,395 | | | | | $ | 45,625 | | |
| Accumulated capital loss | | | | (274,399 | ) | | | | | (3,311 | ) | |
| Unrealized appreciation/(depreciation) | | | | 97,852 | | | | | | 574,124 | | |
| Total | | | $ | (86,152 | ) | | | | $ | 616,438 | | |
Tax components of distributable earnings are determined in accordance with income tax regulations which may differ from the composition of net assets reported under GAAP. These permanent differences are primarily due to the differing treatment of gains (losses) related to foreign currency transactions, basis adjustments on certain equity securities designated as passive foreign investment companies, acquired capital loss carryforwards, distribution redesignations. Accordingly, for the year ended October 31, 2015, the effects of certain differences were reclassified as follows:
| Fund | | Capital stock | | Accumulated
net investment
income (loss) | | Accumulated
net realized
gains (losses) |
| Dynamic Dividend Fund | | $ | (25,935,315 | ) | | $ | 104,409 | | | $ | 25,830,906 | |
| Rising Dividend Fund | | | 11 | | | | (2,358 | ) | | | 2,347 | |
| Financial Services Fund | | | 17 | | | | 83,731 | | | | (83,748 | ) |
| Small Cap Fund | | | (96,234 | ) | | | 85,745 | | | | 10,489 | |
As of April 30, 2016, net unrealized appreciation/(depreciation) of investments, excluding foreign currency, based on Federal tax costs was as follows:
| Fund | | Cost of
investments | | Gross
unrealized
appreciation | | Gross
unrealized
depreciation | | Net unrealized
appreciation/
(depreciation) |
| Dynamic Dividend Fund | | $ | 165,307,325 | | | $ | 16,267,528 | | | $ | (13,426,132 | ) | | $ | 2,841,396 | |
| Rising Dividend Fund | | | 81,577,255 | | | | 10,568,118 | | | | (2,633,383 | ) | | | 7,934,735 | |
| Financial Services Fund | | | 15,711,075 | | | | 2,093,095 | | | | (839,964 | ) | | | 1,253,131 | |
| Small Cap Fund | | | 12,641,485 | | | | 1,252,617 | | | | (1,198,232 | ) | | | 54,385 | |
| Ultra Short Municipal Income Fund | | | 1,079,219,167 | | | | 168,618 | | | | (187,771 | ) | | | (19,153 | ) |
| High Yield Managed Duration Municipal Fund | | | 107,712,390 | | | | 1,596,538 | | | | (154,461 | ) | | | 1,442,077 | |
The tax basis of investments for tax and financial reporting purposes differs principally due to the deferral of losses on wash sales, partnership tax adjustments, and mark-to-market cost basis adjustments for investments in passive foreign investment companies (PFICs) for tax purposes.
The tax character of distributions paid during the year ended October 31, 2015 were as follows:
| | | 2015 | |
| Dynamic Dividend Fund | | | |
| Ordinary income | | $ | 12,328,370 | |
| Total | | $ | 12,328,370 | |
| Rising Dividend Fund | | | | |
| Ordinary income | | $ | 230,058 | |
| Long-term capital gain | | | 284,654 | |
| Total | | $ | 514,712 | |
| Financial Services Fund | | | | |
| Ordinary income | | $ | 390,835 | |
| Total | | $ | 390,835 | |
109
Alpine Mutual Funds
Notes to Financial Statements—Continued
April 30, 2016 (Unaudited)
| Small Cap Fund | | | |
| Long-term capital gain | | $ | — | |
| Total | | $ | — | |
| Ultra Short Municipal Income Fund | | | | |
| Ordinary income | | $ | 4,685 | |
| Exempt interest dividends | | | 4,624,613 | |
| Total | | $ | 4,629,298 | |
| High Yield Managed Duration Municipal Fund | | | | |
| Ordinary income | | $ | 34,949 | |
| Exempt interest dividends | | | 1,345,745 | |
| Total | | $ | 1,380,694 | |
During the year ended October 31, 2015, the Ultra Short Municipal Income Fund utilized $149,302 of capital loss carryovers. Capital loss carryovers as of October 31, 2015 are as follows:
| Expiration Date | | Dynamic
Dividend Fund | | Rising
Dividend Fund | | Financial
Services Fund |
| 10/31/2016 | | | $ | 536,971,822 | | | $ | — | | | $ | — | |
| 10/31/2017 | | | $ | 388,131,987 | | | $ | — | | | $ | — | |
| 10/31/2018 | | | $ | 154,525,095 | | | $ | — | | | $ | — | |
| Expiration Date | | Small Cap
Fund | | Ultra Short
Municipal
Income Fund | | High Yield
Managed
Duration
Municipal Fund |
| 10/31/2016 | | | $ | 113,385 | | | $ | — | | | $ | — | |
| 10/31/2017 | | | $ | 5,637,266 | | | $ | — | | | $ | — | |
| 10/31/2018 | | | $ | 1,581,056 | | | $ | — | | | $ | — | |
| 10/31/2019 | | | $ | 342,429 | | | $ | 67,228 | | | $ | — | |
During the year ended October 31, 2015, the Dynamic Dividend Fund expired $25,935,421 of capital loss carryovers.
Under the Regulated Investment Company (“RIC”) Modernization Act of 2010 (“the Modernization Act”), post-enactment capital losses that are carried forward will retain their character as either short-term or long-term capital losses rather than being considered all short-term as under previous law. However, any losses incurred during those future taxable years will be required to be utilized prior to the losses incurred in pre-enactment taxable years, which carry an expiration date. As a result of this ordering rule, pre-enactment capital loss carryovers may be more likely to expire unused. Capital loss carryover as of October 31, 2015 with no expiration are as follows:
| Fund | | Short-Term | | Long-Term |
| Dynamic Dividend Fund | | $ | 6,945,510 | | | $ | — | |
| Financial Services Fund | | $ | — | | | $ | 208,443 | |
| Small Cap Fund | | $ | 364,366 | | | $ | — | |
| Ultra Short Municipal Income Fund | | $ | 207,171 | | | $ | — | |
| High Yield Managed Duration Municipal Fund | | $ | 1,864 | | | $ | 1,447 | |
Certain ordinary losses incurred after December 31 and within the taxable year are deemed to arise on the first day of the Funds’ next taxable year, if the Funds so elect. For the year ended October 31, 2015, the following Funds elected to defer late-year ordinary losses:
| | | Late Year |
| Fund | | Ordinary Losses |
| Small Cap Fund | | $ | (62,343 | ) |
110
Alpine Mutual Funds
Notes to Financial Statements—Continued
April 30, 2016 (Unaudited)
At a meeting held on July 31, 2015, the Board, unanimously approved the tax free reorganization of the Alpine Transformations Fund and the Alpine Equity Income Fund (the “Target Funds”) into the Alpine Accelerating Dividend Fund (the “Acquiring Fund”), a separate series of the Trust. On September 9, 2015, the Acquiring Fund was renamed Alpine Rising Dividend Fund and on October 23, 2015, acquired all of the net assets of the Target Funds in a tax-free exchange of shares pursuant to an Agreement and Plan of Reorganization approved by the Target Funds shareholders. The purpose of the reorganization was to combine two portfolios with comparable investment objectives and strategies.
Alpine
Transformations
Fund | | Shares Prior to
Reorganization | | Shares Issued by
the Acquiring
Fund | | Net Assets Prior
to Reorganization |
| Institutional Class | | | 664,477 | | | | 507,899 | | | $ | 7,643,926 | |
| Class A | | | 13,727 | | | | 10,346 | | | $ | 155,703 | |
Alpine
Equity Income
Fund | | Shares Prior to
Reorganization | | Shares Issued by
the Acquiring
Fund | | Net Assets Prior
to Reorganization |
| Institutional Class | | | 6,042,454 | | | | 5,123,760 | | | $ | 77,113,107 | |
| Class A | | | 25,724 | | | | 21,756 | | | $ | 327,429 | |
The appreciation of the Transformations Fund and Equity Income Fund were $779,528 and $12,159,650, respectively, as of the date of the reorganization. The combined net assets of the Acquiring Fund immediately after the reorganization were $92,462,283.
Assuming the reorganization had been completed on November 1, 2014, the beginning of the reporting period of the Acquiring Fund, the Acquiring Fund’s pro forma results of operations for the period ended October 31, 2015, were as follows:
| Net Investment Income (Loss) | | $ | 1,329,773 | |
| Net Realized and Unrealized Gains/Losses on Investments and Foreign Currency Transactions | | $ | (603,933 | ) |
| Net Increase/Decrease in Net Assets resulting from Operations | | $ | 725,840 | |
Because the combined investment portfolios have been managed as a single integrated portfolio since the reorganization was completed, it is not practicable to separate the amounts of revenue and earnings of the Target Funds that have been included in the Acquiring Fund’s Statement of Operations as of October 31, 2015.
| 9. | Recently Issued Accounting Pronouncements: |
In May 2015, the Financial Accounting Standards Board (“FASB”) issued Accounting Standards Update (“ASU”) No. 2015-07 Disclosure for Investments in Certain Entities that Calculate Net Asset Value per Share (or Its Equivalent). The amendments in ASU No. 2015-07 remove the requirement to categorize within the fair value hierarchy investments measured using the net asset value per share (“NAV”) practical expedient. The ASU also removes certain disclosure requirements for investments that qualify, but do not utilize, the NAV practical expedient. The amendments in the ASU are effective for fiscal years beginning after December 15, 2015, and interim periods within those fiscal years. Management is currently evaluating the impact these changes will have on the Funds’ financial statements and related disclosures.
Distributions: The Dynamic Dividend Fund - Institutional Class and Class A paid a distribution from net investment income of $919,626 and $15,392 or $0.02 and $0.02 per share, respectively, on May 31, 2016 to shareholders of record on May 27, 2016.
111
Alpine Mutual Funds
Information about your Funds Expenses
April 30, 2016
Fund expenses (Unaudited)
Example
As a shareholder of the Fund, you may incur two types of costs: (1) transaction costs, including front-end on purchase payments; and (2) ongoing costs, including management fees; service and/or distribution (12b-1) fees; and other Fund expenses. This example is intended to help you understand your ongoing costs (in dollars) of investing in the Fund and to compare these costs with the ongoing costs of investing in other mutual funds. This example is based on an investment of $1,000 invested on November 1, 2015 and held for the six months ended April 30, 2016.
Actual Expenses
The table below titled “Based on Actual Total Return” provides information about actual account values and actual expenses. You may use the information provided in this table, together with the amount you invested, to estimate the expenses that you paid over the period. To estimate the expenses you paid on your account, divide your ending account value by $1,000 (for example, an $8,600 ending account value divided by $1,000 = 8.6), then multiply the result by the number under the heading entitled “Expenses Paid During the Period”.
Hypothetical Example for Comparison Purposes
The table below titled “Based on Hypothetical Total Return” provides information about hypothetical account values and hypothetical expenses based on the actual expense ratio and an assumed rate of return of 5.00% per year before expenses, which is not the Fund’s actual return. The hypothetical account values and expenses may not be used to estimate the actual ending account balance or expenses you paid for the period. You may use the information provided in this table to compare the ongoing costs of investing in the Fund and other funds. To do so, compare the 5.00% hypothetical example relating to the Fund with the 5.00% hypothetical examples that appear in the shareholder reports of the other funds.
Please note that the expenses shown in the table below are meant to highlight your ongoing costs only and do not reflect any transactional costs, such as front-end or back-end sales charges (loads). Therefore, the table is useful in comparing ongoing costs only, and will not help you determine the relative total costs of owning different funds. In addition, if these transaction costs were included, your costs would have been higher.
Dynamic Dividend Fund
Based on actual total return(1)
| Class | | Actual Total
Return Without
Sales Charges(2) | | Beginning
Account Value | | Ending
Account Value | | Annualized
Expense
Ratio | | Expenses
Paid During
the Period(3) |
| | | | | | | | | | | |
| Institutional | | (2.33)% | | $1,000.00 | | $976.70 | | 1.35% | | $6.63 |
| | | | | | | | | | | |
| Class A | | (2.45)% | | $1,000.00 | | $975.50 | | 1.60% | | $7.86 |
| Based on hypothetical total return(1) | | | | | | | | | | |
| Class | | Hypothetical
Annualized
Total Return | | Beginning
Account Value | | Ending
Account Value | | Annualized
Expense
Ratio | | Expenses
Paid During
the Period(4) |
| | | | | | | | | | | |
| Institutional | | 5.00% | | $1,000.00 | | $1,018.15 | | 1.35% | | $6.77 |
| | | | | | | | | | | |
| Class A | | 5.00% | | $1,000.00 | | $1,016.91 | | 1.60% | | $8.02 |
112
Alpine Mutual Funds
Information about your Funds Expenses—Continued
April 30, 2016
| Rising Dividend Fund | | | | | | | | | | | | | | | |
| | | | | | | | | | | | | | | | |
| Based on actual total return(1) | | | | | | | | | | |
| Class | | Actual Total
Return Without
Sales Charges(2) | | Beginning
Account Value | | Ending
Account Value | | Annualized
Expense
Ratio | | Expenses
Paid During
the Period(3) |
| | | | | | | | | | | |
| Institutional | | | (0.68 | )% | | $ | 1,000.00 | | | $ | 993.20 | | | | 1.17 | % | | $ | 5.80 | |
| | | | | | | | | | | | | | | | | | | | | |
| Class A | | | (0.87 | )% | | $ | 1,000.00 | | | $ | 991.30 | | | | 1.42 | % | | $ | 7.03 | |
| Based on hypothetical total return(1) | | | | | | | |
| Class | | Hypothetical
Annualized
Total Return | | Beginning
Account Value | | Ending
Account Value | | Annualized
Expense
Ratio | | Expenses
Paid During
the Period(4) |
| | | | | | | | | | | |
| Institutional | | | 5.00 | % | | $ | 1,000.00 | | | $ | 1,019.05 | | | | 1.17 | % | | $ | 5.87 | |
| | | | | | | | | | | | | | | | | | | | | |
| Class A | | | 5.00 | % | | $ | 1,000.00 | | | $ | 1,017.80 | | | | 1.42 | % | | $ | 7.12 | |
Financial Services Fund
Based on actual total return(1)
| Class | | Actual Total
Return Without
Sales Charges(2) | | Beginning
Account Value | | Ending
Account Value | | Annualized
Expense
Ratio | | Expenses
Paid During
the Period(3) |
| | | | | | | | | | | |
| Institutional | | | (2.47 | )% | | $ | 1,000.00 | | | $ | 975.30 | | | | 1.35 | % | | $ | 6.63 | |
| | | | | | | | | | | | | | | | | | | | | |
| Class A | | | (2.60 | )% | | $ | 1,000.00 | | | $ | 974.00 | | | | 1.60 | % | | $ | 7.85 | |
| | | | | | | | | | | | | | | | | | | | | |
| Based on hypothetical total return(1) | | | | | | | | | | | | | | |
| Class | | Hypothetical
Annualized
Total Return | | Beginning
Account Value | | Ending
Account Value | | Annualized
Expense
Ratio | | Expenses
Paid During
the Period(4) |
| | | | | | | | | | | |
| Institutional | | | 5.00 | % | | $ | 1,000.00 | | | $ | 1,018.15 | | | | 1.35 | % | | $ | 6.77 | |
| | | | | | | | | | | | | | | | | | | | | |
| Class A | | | 5.00 | % | | $ | 1,000.00 | | | $ | 1,016.91 | | | | 1.60 | % | | $ | 8.02 | |
| | | | | | | | | | | | | | | | | | | | | |
| Small Cap Fund | | | | | | | | | | | | |
| | | | | | | | | | | | | | | | | | | | | |
| Based on actual total return(1) | | | | | | | | | | | | |
| Class | | Actual Total
Return Without
Sales Charges(2) | | Beginning
Account Value | | Ending
Account Value | | Annualized
Expense
Ratio | | Expenses
Paid During
the Period(3) |
| | | | | | | | | | | |
| Institutional | | | (1.97 | )% | | $ | 1,000.00 | | | $ | 980.30 | | | | 1.33 | % | | $ | 6.55 | |
| | | | | | | | | | | | | | | | | | | | | |
| Class A | | | (2.12 | )% | | $ | 1,000.00 | | | $ | 978.80 | | | | 1.58 | % | | $ | 7.77 | |
| | | | | | | | | | | | | | | | | | | | | |
| Based on hypothetical total return(1) | | | | | | | | | | | | | | | |
| Class | | Hypothetical
Annualized
Total Return | | Beginning
Account Value | | Ending
Account Value | | Annualized
Expense
Ratio | | Expenses
Paid During
the Period(4) |
| | | | | | | | | | | |
| Institutional | | | 5.00 | % | | $ | 1,000.00 | | | $ | 1,018.25 | | | | 1.33 | % | | $ | 6.67 | |
| | | | | | | | | | | | | | | | | | | | | |
| Class A | | | 5.00 | % | | $ | 1,000.00 | | | $ | 1,017.01 | | | | 1.58 | % | | $ | 7.92 | |
113
Alpine Mutual Funds
Information about your Funds Expenses—Continued
April 30, 2016
| Ultra Short Municipal Income Fund | | | | | | | |
| Class | | Actual Total
Return Without
Sales Charges(2) | | Beginning
Account Value | | Ending
Account Value | | Annualized
Expense
Ratio | | Expenses
Paid During
the Period(3) |
| | | | | | | | | | | |
| Institutional | | | 0.27 | % | | $ | 1,000.00 | | | $ | 1,002.70 | | | | 0.47 | % | | $ | 2.34 | |
| | | | | | | | | | | | | | | | | | | | | |
| Class A | | | 0.14 | % | | $ | 1,000.00 | | | $ | 1,001.40 | | | | 0.72 | % | | $ | 3.58 | |
Based on hypothetical total return(1)
| Class | | Hypothetical
Annualized
Total Return | | Beginning
Account Value | | Ending
Account Value | | Annualized
Expense
Ratio | | Expenses
Paid During
the Period(4) |
| | | | | | | | | | | |
| Institutional | | | 5.00 | % | | $ | 1,000.00 | | | $ | 1,022.53 | | | | 0.47 | % | | $ | 2.36 | |
| | | | | | | | | | | | | | | | | | | | | |
| Class A | | | 5.00 | % | | $ | 1,000.00 | | | $ | 1,021.28 | | | | 0.72 | % | | $ | 3.62 | |
| High Yield Managed Duration Municipal Fund | | | | |
| |
| Based on actual total return(1) | | | | | |
| Class | | Actual Total
Return Without
Sales Charges(2) | | Beginning
Account Value | | Ending
Account Value | | Annualized
Expense
Ratio | | Expenses
Paid During
the Period(3) |
| | | | | | | | | | | |
| Institutional | | | 2.35 | % | | $ | 1,000.00 | | | $ | 1,023.50 | | | | 0.74 | % | | $ | 3.72 | |
| | | | | | | | | | | | | | | | | | | | | |
| Class A | | | 2.23 | % | | $ | 1,000.00 | | | $ | 1,022.30 | | | | 0.98 | % | | $ | 4.93 | |
| |
| Based on hypothetical total return(1) | | | | | |
| Class | | Hypothetical
Annualized
Total Return | | Beginning
Account Value | | Ending
Account Value | | Annualized
Expense
Ratio | | Expenses
Paid During
the Period(4) |
| | | | | | | | | | | |
| Institutional | | | 5.00 | % | | $ | 1,000.00 | | | $ | 1,021.18 | | | | 0.74 | % | | $ | 3.72 | |
| | | | | | | | | | | | | | | | | | | | | |
| Class A | | | 5.00 | % | | $ | 1,000.00 | | | $ | 1,019.99 | | | | 0.98 | % | | $ | 4.92 | |
| (1) | For the six months ended April 30, 2016. |
| (2) | Assumes the reinvestment of all distributions, including returns of capital, if any, at net asset value and does not reflect the deduction of the applicable sales charge. Total return is not annualized, as it may not be representative of the total return for the year. Performance figures may reflect fee waivers and/or expense reimbursements. In the absence of fee waivers and/or expense reimbursements, the total return would have been lower. Past performance is no guarantee of future results. |
| (3) | Expenses (net of fee waivers and/or expense reimbursements) are equal to each class’ respective annualized expense ratio multiplied by the average account value over the period, multiplied by the number of days in the most recent fiscal half-year then divided by 366. |
| (4) | Hypothetical expense examples assume a 5% return over a hypothetical 182 day period. |
114
Alpine Mutual Funds
Additional Information (Unaudited)
April 30, 2016
Approval of Investment Management Agreement
In the weeks leading up to the Meeting, the Board Members reviewed 15(c) Materials responsive to their information request and specifically relating to the Agreements provided by the Adviser. The Board members had the opportunity to, and, directly and through counsel, did ask specific questions of the Adviser relating to the 15(c) Materials. In deciding whether to continue the Agreements, the Independent Trustees considered various factors, including (i) the nature, extent and quality of the services provided by the Adviser under the Agreements, (ii) the investment performance of the Funds, (iii) the costs to the Adviser of its services and the profits realized by the Adviser, from its relationship with the Funds, and (iv) the extent to which economies of scale would be realized if and as a Fund grows and whether the fee levels in the Agreements reflect these economies of scale. The Independent Trustees evaluated a variety of information they deemed relevant on a Fund by Fund basis. No one particular factor was identified as determinative, but rather it was a combination of all the factors and conclusions that formed the basis for the determinations made by the Independent Trustees, and different Independent Trustees may have placed greater weight on certain factors than did other Independent Trustees.
In considering the nature, extent and quality of the services provided by the Adviser, the Independent Trustees relied on, among other things, their prior experience as Independent Trustees of the Funds, the materials provided at and prior to the Meeting, as well as on materials and updates provided at Board meetings throughout the year. They noted that under the Agreements, the Adviser is responsible for managing the Funds’ investments in accordance with each Fund’s investment objectives and policies, applicable legal and regulatory requirements, and the oversight of the Independent Trustees. The Independent Trustees also noted that the Adviser is responsible for providing necessary and appropriate reports and information to the Independent Trustees, and for furnishing the Funds with the assistance, cooperation, and information necessary for the Funds to meet various legal requirements regarding registration and reporting. Finally, they noted the experience and expertise of the Adviser as a fund adviser to the Funds.
The Independent Trustees reviewed the background and experience of the Adviser’s senior management, including those individuals responsible for the investment, operations and compliance activities with respect to the Funds’ investments, and the responsibilities of the investment and compliance personnel with respect to the Funds. They also considered the resources, operational structures and practices of the Adviser in managing the Funds’ portfolios, in monitoring and securing the Funds’ compliance with investment objectives and policies and with applicable laws and regulations, and in seeking best execution of portfolio transactions. Drawing upon the materials provided both at the Meeting and throughout the year, and their general knowledge of the business of the Adviser, which has been formed through meetings with members of the Adviser, including the Portfolio Managers of the Funds, the Independent Trustees took into account the Adviser’s experience, resources and strength in these areas. On the basis of this review, the Independent Trustees determined that the nature and extent of the services provided by the Adviser to the Funds were appropriate and could be expected to remain so.
The Independent Trustees discussed the Fund performance metrics in the 15(c) Materials that were compiled by Morningstar. In assessing the quality of the portfolio management, the Independent Trustees were able to review and compare the short-term and long-term performance of each Fund on both an absolute basis and in comparison both to its peer group and relevant index as set forth in the Morningstar Report. The Board recognized the steps that management has taken over the past year with respect to the performance of the Funds, including changes to the portfolio management and research teams and the implementation of distribution and fund performance recommendations from a third party consulting firm. They noted the product rationalization measures taken, including the mergers of certain funds, the liquidation of another fund and the launch of Alpine Global Realty Growth & Income Fund, and the Adviser’s ongoing commitment to continue to consider actions to rationalize the Fund complex, particularly with respect to smaller Funds. The Independent Trustees also reviewed a summary of Fund performance and expenses against those of their peer and category groups. For certain of the Funds, they noted that higher expenses as compared to the peer and category groups were accounted for by the small size of a Fund or a decline in the assets of a Fund. In this connection, the Independent Trustees noted the steps taken by the Adviser to reduce management fees and overall expenses of the Funds. The Board also considered the infrastructure and technology services provided by the Adviser. The Independent Trustees concluded that the fees to the Adviser, as proposed to be reduced or waived for certain Funds at this Meeting, were appropriate.
Based on the presentation previously made by the Adviser regarding profitability, the Independent Trustees also considered the profitability of the advisory agreements with the Adviser. The Independent Trustees were provided with general data on the Funds’ profitability and with respect to the profitability of each Fund. The Independent Trustees also examined the level of profits that could be expected to accrue to the Adviser from the fees payable under the
115
Alpine Mutual Funds
Additional Information (Unaudited)—Continued
April 30, 2016
Agreements and any expense subsidization undertaken by the Adviser, including pursuant to the expense limitation agreements in place, as well as each Funds’ brokerage and commissions, commission sharing agreements and the Open-End Trusts’ payments to intermediaries whose customers invest in the Funds. After receiving the Adviser’s presentation and having had time for discussion and analysis, including plans for potential modification or enhancement of existing products, as well as commitments by the Adviser to continue to seek to improve the distribution of the Funds through a review of the Adviser’s business, the Independent Trustees concluded that, to the extent that the Adviser’s relationship with the Funds had been profitable, the profitability was in no instance excessive.
The Independent Trustees also had an opportunity to review and discuss the other 15(c) Materials provided by Alpine in response to the request of their counsel, including, among others, comparative performance, expense information, organization charts, advisory fee breakpoints and profitability data. The Independent Trustees also had the opportunity to consider whether the management of the Funds resulted in any “fall-out” benefits to the Adviser. In considering whether the Adviser benefits in other ways from its relationship with the Funds, the Independent Trustees concluded that, to the extent that Adviser derives other benefits from its relationship with the Funds, any such benefits do not render the Adviser’s fees excessive.
The Independent Trustees approved the continuance of the Funds’ Agreements for one year with the Adviser after weighing, among others, the foregoing factors. They reasoned that the nature and extent of the services provided by the Adviser were appropriate and that the Adviser was continuing to take appropriate steps to address performance issues affecting certain Funds, including by taking steps to add and change investment personnel. As to the Adviser’s fees for the Funds, the Independent Trustees determined that the fees, after considering certain additional proposed contractual waivers, were appropriate, that the Funds’ relationship with the Adviser was not so profitable as to render the fees excessive and that any additional benefits to the Adviser were not of a magnitude that resulted in excessive fees.
Availability of Proxy Voting Information
The policies and procedures used in determining how to vote proxies relating to portfolio securities are available without a charge, upon request, by contacting the Funds at 1(800) 617.7616 and on the SEC's web site at http://www.sec.gov.
Information regarding how the Funds voted proxies relating to portfolio securities during the most recent twelve-month period ended June 30 is available without charge, upon request, by contacting the Fund at 1(800) 617.7616 and on the SEC's web site at http://www.sec.gov.
Availability of Quarterly Portfolio Schedule
Beginning with each Fund’s fiscal quarter ended July 31, 2004, each Fund filed its complete schedule of portfolio holdings on Form N-Q with the SEC. Going forward, each Fund will file Form N-Q for the first and third quarters of each fiscal year on Form N-Q. Each Fund’s Form N-Q is available on the SEC’s website at www.sec.gov and may be reviewed and copied at the SEC’s Public Reference Room in Washington, DC. Information on the operation of the Public Reference Room may be obtained by calling 1-202-551-8090.
Privacy Policy
The Funds collect non-public information about you from the following sources:
| | • | information we receive about you on applications or other forms; |
| | • | information you give us orally; and |
| | • | information about your transactions with others or us. |
The Funds do not disclose any non-public personal information about our customers or former customers without the customer’s authorization, except as required by law or in response to inquiries from governmental authorities. The Funds restrict access to your personal and account information to those employees who need to know that information to provide products and services to you. The Funds also may disclose that information to unaffiliated third parties (such as to brokers or custodians) only as permitted by law and only as needed for us to provided agreed services to you. The Funds maintain physical, electronic and procedural safeguards to guard your non-public personal information.
In the event that you hold shares of the Funds through a financial intermediary, including, but not limited to a broker dealer, bank or trust company, the privacy policy of your financial intermediary would govern how your non-public personal information would be shared with unaffiliated third parties.
116
TRUSTEES
Samuel A. Lieber
Eleanor T.M. Hoagland
James A. Jacobson
H. Guy Leibler
Jeffrey E. Wacksman
CUSTODIAN &
ADMINISTRATOR
State Street Bank & Trust Company
One Lincoln Street
Boston, MA 02111
INDEPENDENT REGISTERED
PUBLIC ACCOUNTING FIRM
Ernst & Young
5 Times Square
New York, NY 10019
FUND COUNSEL
Willkie Farr & Gallagher LLP
787 7th Avenue
New York, NY 10019
DISTRIBUTOR
Quasar Distributors, LLC
615 East Michigan Street
Milwaukee, WI 53202
INVESTMENT ADVISER
Alpine Woods Capital Investors, LLC
2500 Westchester Ave., Suite 215
Purchase, NY 10577
TRANSFER AGENT
Boston Financial Data Services
2000 Crown Colony Drive
Quincy, MA 02169

SHAREHOLDER | INVESTOR INFORMATION
1(888)785.5578
www.alpinefunds.com
This material must be preceded or accompanied by a current prospectus.
Item 2. Code of Ethics
Not applicable to semi-annual reports.
Item 3. Audit Committee Financial Expert
Not applicable to semi-annual reports.
Item 4. Principal Accountant Fees and Services
Not applicable to semi-annual reports.
Item 5. Audit Committee of Listed Registrants
Not applicable to registrants who are not listed issuers (as defined in Rule 10A-3 under the Securities Exchange Act of 1934).
Item 6. Schedule of Investments
| (a) | Schedule of Investments is included as part of Item 1 of the Form N-CSR. |
Item 7. Disclosure of Proxy Voting Policies and Procedures for Closed-End Management Investment Companies.
Not applicable to open-end investment management companies.
Item 8. Portfolio Managers of Closed-End Management Investment Companies.
Not applicable to open-end investment management companies.
Item 9. Purchases of Equity Securities by Closed-End Management Investment Company and Affiliated Purchasers.
Not applicable to open-end investment management companies.
Item 10. Submission of Matters to a Vote of Security Holders.
There were no material changes to the procedures by which shareholders may recommend nominees to the Registrant’s Board of Trustees.
Item 11. Controls and Procedures.
(a) The Registrant’s principal executive officer and principal financial officer have evaluated the registrant’s disclosure controls and procedures (as defined in Rule 30a-3(c) under the Investment Company Act of 1940, as amended) within 90 days of this filing and have concluded that the Registrant’s disclosure controls and procedures were effective, as of that date.
(b) There was no change in the Registrant’s internal control over financial reporting (as defined in Rule 30a-3(d) under the Investment Company Act of 1940, as amended) during the second fiscal quarter of the period covered by this report that has materially affected, or is reasonably likely to materially affect, the Registrant’s internal control over financial reporting.
Item 12. Exhibits
(a)(1) Not applicable to semi-annual reports.
(a)(2) The certifications required by Rule 30a-2(a) of the Investment Company Act of 1940, as amended, and Section 302 of the Sarbanes-Oxley Act of 2002 are attached hereto as Ex99.Cert.
(a)(3) Not applicable.
(b) The certifications by the Registrant’s Principal Executive Officer and Principal Financial Officer, as required by Rule 30a-2(b) of the Investment Company Act of 1940, as amended, and Section 906 of the Sarbanes-Oxley Act of 2002 are attached hereto as Ex99.906Cert.
SIGNATURES
Pursuant to the requirements of the Securities Exchange Act of 1934 and the Investment Company Act of 1940, the registrant has duly caused this report to be signed on its behalf by the undersigned, thereunto duly authorized.
Alpine Income Trust
| By: | /s/ Samuel A. Lieber |
| | Samuel A. Lieber |
| | Chief Executive Officer (Principal Executive Officer) |
| | |
| Date: | July 7, 2016 |
Pursuant to the requirements of the Securities Exchange Act of 1934 and the Investment Company Act of 1940, this report has been signed below by the following persons on behalf of the registrant and in the capacities and on the dates indicated.
| By: | /s/ Samuel A. Lieber |
| | Samuel A. Lieber |
| | Chief Executive Officer (Principal Executive Officer) |
| | |
| By: | /s/ Ronald G. Palmer, Jr. |
| | Ronald G. Palmer, Jr. |
| | Chief Financial Officer (Principal Financial Officer) |
| | |
| Date: | July 7, 2016 |