UNITED STATES
SECURITIES AND EXCHANGE COMMISSION
Washington, D.C. 20549
FORM N-CSR
CERTIFIED SHAREHOLDER REPORT OF REGISTERED
MANAGEMENT INVESTMENT COMPANIES
Investment Company Act file number 811-21213
Nuveen Insured Tax-Free Advantage Municipal Fund
(Exact name of registrant as specified in charter)
Nuveen Investments
333 West Wacker Drive
Chicago, IL 60606
(Address of principal executive offices) (Zip code)
Kevin J. McCarthy
Nuveen Investments
333 West Wacker Drive
Chicago, IL 60606
(Name and address of agent for service)
Registrant's telephone number, including area code: (312) 917-7700
Date of fiscal year end: October 31
Date of reporting period: April 30, 2011
Form N-CSR is to be used by management investment companies to file reports with the Commission not later than 10 days after the transmission to stockholders of any report that is required to be transmitted to stockholders under Rule 30e-1 under the Investment Company Act of 1940 (17 CFR 270.30e-1). The Commission may use the information provided on Form N-CSR in its regulatory, disclosure review, inspection, and policymaking roles.
A registrant is required to disclose the information specified by Form N-CSR, and the Commission will make this information public. A registrant is not required to respond to the collection of information contained in Form N-CSR unless the Form displays a currently valid Office of Management and Budget ("OMB") control number. Please direct comments concerning the accuracy of the information collection burden estimate and any suggestions for reducing the burden to Secretary, Securities and Exchange Commission, 450 Fifth Street, NW, Washington, DC 20549-0609. The OMB has reviewed this collection of information under the clearance requirements of 44 U.S.C. ss. 3507.
ITEM 1. REPORTS TO STOCKHOLDERS.
INVESTMENT ADVISER NAME CHANGE
Effective January 1, 2011, Nuveen Asset Management, the Funds’ investment adviser, changed its name to Nuveen Fund Advisors, Inc. (“Nuveen Fund Advisors”).Concurrently, Nuveen Fund Advisors formed a wholly-owned subsidiary, Nuveen Asset Management, LLC, to house its portfolio management capabilities.
NUVEEN INVESTMENTS COMPLETES STRATEGIC COMBINATION WITH FAF ADVISORS
On December 31, 2010, Nuveen Investments completed the strategic combination between Nuveen Asset Management, LLC, the largest investment affiliate of Nuveen Investments, and FAF Advisors. As part of this transaction, U.S. Bancorp – the parent of FAF Advisors – received cash consideration and a 9.5% stake in Nuveen Investments in exchange for the long-term investment business of FAF Advisors, including investment management responsibilities for the non-money market mutual funds of the First American Funds family.
The approximately $27 billion of mutual fund and institutional assets managed by FAF Advisors, along with the investment professionals managing these assets and other key personnel, have become part of Nuveen Asset Management, LLC. With these additions to Nuveen Asset Management, LLC, this affiliate now manages more than $100 billion of assets across a broad range of strategies from municipal and taxable fixed income to traditional and specialized equity investments.
This combination does not affect the investment objectives or strategies of the Funds in this report. Over time, Nuveen Investments expects that the combination will provide even more ways to meet the needs of investors who work with financial advisors and consultants by enhancing the multi-boutique model of Nuveen Investments, which also includes highly respected investment teams at HydePark, NWQ Investment Management, Santa Barbara Asset Management, Symphony Asset Management, Tradewinds Global Investors and Winslow Capital. Nuveen Investments managed approximately $206 billion of assets as of March 31, 2011.
Table of Contents
| Chairman’s Letter to Shareholders | 4 |
| Portfolio Managers’ Comments | 5 |
| Common Share Dividend and Share Price Information | 12 |
| Performance Overviews | 14 |
| Portfolios of Investments | 20 |
| Statement of Assets and Liabilities | 79 |
| Statement of Operations | 81 |
| Statement of Changes in Net Assets | 83 |
| Statement of Cash Flows | 86 |
| Financial Highlights | 88 |
| Notes to Financial Statements | 94 |
| Board Approval of Sub-Advisory Arrangements | 108 |
| Reinvest Automatically, Easily and Conveniently | 109 |
| Glossary of Terms Used in this Report | 111 |
| Other Useful Information | 115 |
Chairman’s
Letter to Shareholders

Dear Shareholders,
In 2010, the global economy recorded another year of recovery from the financial and economic crises of 2008, but many of the factors that caused the downturn still weigh on the prospects for continued improvement. In the U.S., ongoing weakness in housing values has put pressure on homeowners and mortgage lenders. Similarly, the strong earnings recovery for corporations and banks is only slowly being translated into increased hiring or more active lending. Globally, deleveraging by private and public borrowers has inhibited economic growth and that process is far from complete.
Encouragingly, constructive actions are being taken by governments around the world to deal with economic issues. In the U.S., the recent passage of a stimulatory tax bill relieved some of the pressure on the Federal Reserve to promote economic expansion through quantitative easing and offers the promise of sustained economic growth. A number of European governments are undertaking programs that could significantly reduce their budget deficits. Governments across the emerging markets are implementing various steps to deal with global capital flows without undermining international trade and investment.
The success of these government actions could determine whether 2011 brings further economic recovery and financial market progress. One risk associated with the extraordinary efforts to strengthen U.S. economic growth is that the debt of the U.S. government will continue to grow to unprecedented levels. Another risk is that over time there could be inflationary pressures on asset values in the U.S. and abroad, because what happens in the U.S. impacts the rest of the world economy. Also, these various actions are being taken in a setting of heightened global economic uncertainty, primarily about the supplies of energy and other critical commodities. In this challenging environment, your Nuveen investment team continues to seek sustainable investment opportunities and to remain alert to potential risks in a recovery still facing many headwinds. On your behalf, we monitor their activities to assure they maintain their investment disciplines.
As you will note elsewhere in this report, on December 31, 2010, Nuveen Investments completed a strategic combination with FAF Advisors, Inc., the manager of the First American Funds. The combination adds highly respected and distinct investment teams to meet the needs of investors and their advisors and is designed to benefit all fund shareholders by creating a fund organization with the potential for further economies of scale and the ability to draw from even greater talent and expertise to meet those investor needs.
As of the end of June 2011, Nuveen Investments had completed the refinancing of all of the Auction Rate Preferred Securities issued by its taxable closed-end funds and 91% of the MuniPreferred shares issued by its tax-exempt closed-end funds. Please consult the Nuveen Investments web site, www.Nuveen.com, for the current status of this important refinancing program.
As always, I encourage you to contact your financial consultant if you have any questions about your investment in a Nuveen Fund. On behalf of the other members of your Fund Board, we look forward to continuing to earn your trust in the months and years ahead.
Sincerely,

Robert P. Bremner
Chairman of the Board
June 21, 2011
| 4 | Nuveen Investments |
Portfolio Managers’ Comments
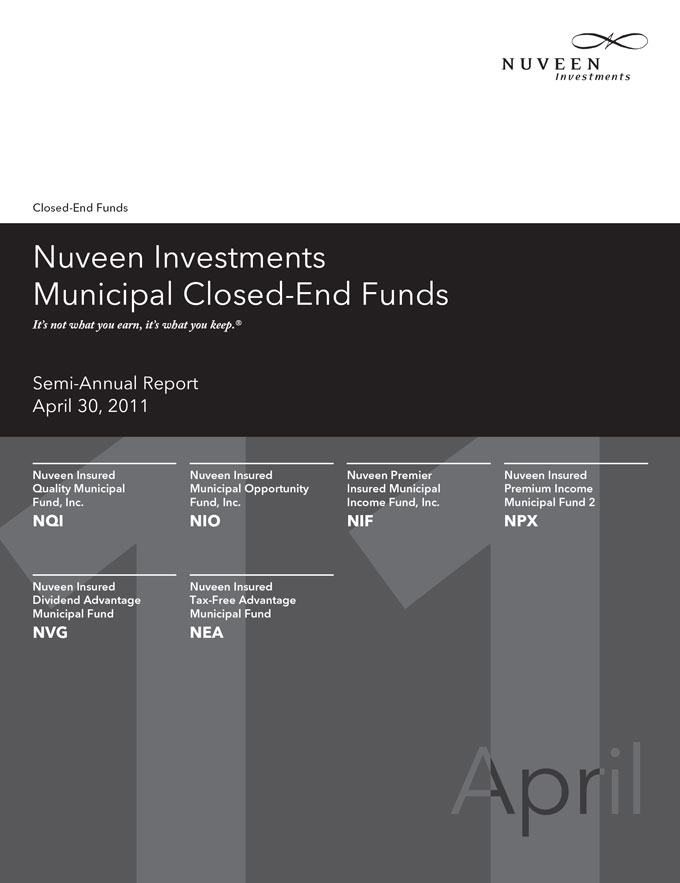
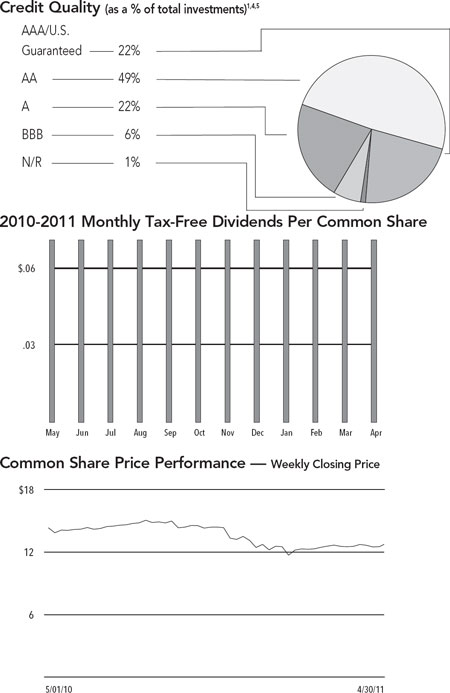
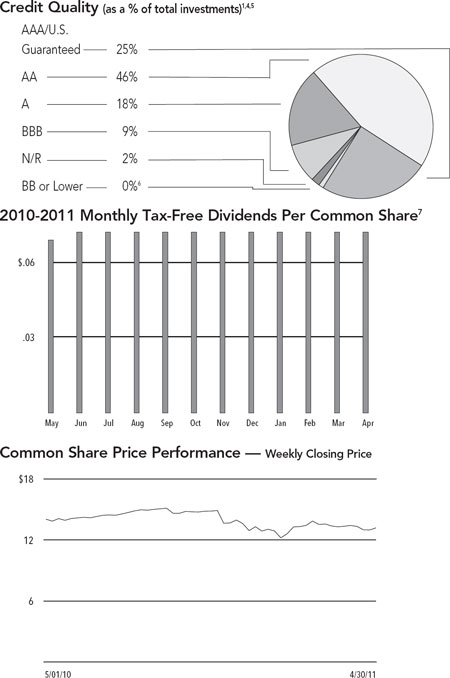
Nuveen Insured Quality Municipal Fund, Inc. (NQI)
Nuveen Insured Municipal Opportunity Fund, Inc. (NIO)
Nuveen Premier Insured Municipal Income Fund, Inc. (NIF)
Nuveen Insured Premium Income Municipal Fund 2 (NPX)
Nuveen Insured Dividend Advantage Municipal Fund (NVG)
Nuveen Insured Tax-Free Advantage Municipal Fund (NEA)
Portfolio managers Paul Brennan and Douglas White review key investment strategies and the six-month performance of these six national insured Funds. With 20 years of industry experience, including 14 years at Nuveen, Paul has managed NIO, NIF, NVG and NEA since 2006. Douglas, who has 28 years of financial industry experience, assumed portfolio management responsibility for NQI and NPX from Paul in January 2011.
What key strategies were used to manage these Funds during the six-month reporting period ended April 30, 2011?
After rallying through most of 2010, municipal bond prices declined during this six-month period, impacted by investor concerns about inflation, the federal deficit and the deficit’s impact on demand for U.S. Treasury securities. Adding to this market pressure was media coverage of the strained finances of many state and local governments. As a result, money began to flow out of municipal bond funds, as yields rose and valuations declined. Toward the end of this period, we saw the environment in the municipal market improve, as some buyers were attracted by municipal bond valuations and yields, resulting in declining yields and rising valuations.
The municipal bond market also was affected by a significant decline in new tax-exempt issuance during this period. One reason for this decrease was the heavy issuance of taxable municipal debt at the end of 2010 under the Build America Bond (BAB) program. During November and December 2010, taxable BABs issuance nationwide totaled $31.5 billion, accounting for 34.5% of new bonds in the municipal market. Since interest payments from BABs represent taxable income, we did not view these bonds as appropriate investment opportunities for these Funds. The BAB program expired December 31, 2010, after Congress failed to include legislation extending the program in the tax bill it passed earlier that month. In addition to the BAB program’s impact on tax-exempt issuance during the November-December period, borrowers trying to take advantage of the program’s favorable terms before its termination at year end accelerated issuance that potentially would have come to market as tax-exempt bonds in 2011, choosing instead to issue taxable BABs during the last two months of 2010. Due in part to this, national municipal issuance was down 49% for the first four months of 2011 compared with the same period in 2010. The tight supply situation was further compounded for
Certain statements in this report are forward-looking statements. Discussions of specific investments are for illustration only and are not intended as recommendations of individual investments. The forward-looking statements and other views expressed herein are those of the portfolio managers as of the date of this report. Actual future results or occurrences may differ significantly from those anticipated in any forward-looking statements, and the views expressed herein are subject to change at any time, due to numerous market and other factors. The Funds disclaim any obligation to update publicly or revise any forward-looking statements or views expressed herein.
Any reference to credit ratings for portfolio holdings denotes the highest rating assigned by a Nationally Recognized Statistical Rating Organization (NRSRO) such as Standard & Poor’s (S&P), Moody’s or Fitch. AAA, AA, A and BBB ratings are investment grade; BB, B, CCC, CC, C and D ratings are below investment grade. Holdings and ratings may change over time.
| Nuveen Investments | 5 |
these Funds by the continued decline in issuance of AAA rated insured bonds. Over the six-month period, new insured paper accounted for approximately 6% to 10% of national issuance, compared with recent historical levels of approximately 50%.
In this environment of constrained tax-exempt municipal bond issuance, our primary focus was on value, quality and maturity. Due to changes to their investment policies in May 2010, these six Funds may now invest up to 20% of their managed assets in uninsured investment-grade credits rated BBB- or higher. Although we did purchase high-quality uninsured bonds during this period, with an emphasis on credits carrying strong AA ratings, we also found attractive opportunities to buy insured bonds despite the limit of insured supply. The Funds also focused on purchasing longer bonds in order to take advantage of attractive yields at the longer end of the municipal yield curve. In addition, the purchase of longer bonds provided protection for the Funds’ duration and yield curve positioning.
We continued to take a bottom-up approach to discovering undervalued sectors and individual credits with the potential to perform well over the long term. During this period, we found value in essential services sectors such as health care, transportation (specifically toll roads and airports), school districts, and general obligation and other tax-supported bonds issued by state and local governments for infrastructure projects. The Funds also purchased higher education credits, including those issued for higher quality private universities such as Cornell. During the last months of 2010, some of this investment activity resulted from opportunities created by the provisions of the BAB program. For example, tax-exempt supply was more plentiful in the health care and higher education sectors because, as 501(c)(3) (nonprofit) organizations, hospitals and private universities generally did not qualify for the BAB program and continued to issue bonds in the tax-exempt municipal market. In addition, bonds with proceeds earmarked for refundings, working capital and private activities were not covered by the BAB program, and this resulted in attractive opportunities in other sectors of the market, such as airports.
Cash for new purchases during this period was generated primarily by the proceeds from bond calls and maturing bonds, which we worked to redeploy to keep the Funds as fully invested as possible. In addition, due to extremely low short-term interest rates, NQI and NPX liquidated all of their positions in short-term floating rate securities and reinvested the proceeds in areas of the market that we believed offered better opportunities, primarily health care and higher education bonds with longer maturities.
As of April 30, 2011, all six of these Funds continued to use inverse floating rate securities. We employ inverse floaters as a form of leverage for a variety of reasons, including duration management, income enhancement and total return enhancement.
| 6 | Nuveen Investments |
How did the Funds perform?
Individual results for these Funds, as well as relevant index and peer group information, are presented in the accompanying table.
Average Annual Total Returns on Common Share Net Asset Value*
For periods ended 4/30/11
| Fund | 6-Month | 1-Year | 5-Year | 10-Year | ||||||||||||
| NQI | -4.66 | % | -0.01 | % | 2.95 | % | 4.93 | % | ||||||||
| NIO | -4.72 | % | 0.56 | % | 3.45 | % | 5.17 | % | ||||||||
| NIF | -4.52 | % | 0.70 | % | 3.75 | % | 5.20 | % | ||||||||
| NPX | -4.37 | % | 0.69 | % | 3.34 | % | 5.01 | % | ||||||||
| NVG | -2.89 | % | 1.43 | % | 4.29 | % | N/A | |||||||||
| NEA | -3.36 | % | 1.34 | % | 4.65 | % | N/A | |||||||||
Standard & Poor’s (S&P) National Insured Municipal Bond Index1 | -2.32 | % | 1.73 | % | 4.12 | % | 5.00 | % | ||||||||
Lipper Insured Municipal Debt Funds Average2 | -4.30 | % | 0.85 | % | 3.57 | % | 5.06 | % | ||||||||
For the six months ended April 30, 2011, the cumulative returns on common share net asset value (NAV) for these six Funds underperformed the return for the Standard & Poor’s (S&P) National Insured Municipal Bond Index. For the same period, NVG and NEA exceeded the average return for the Lipper Insured Municipal Debt Funds Average, NPX performed in line with this benchmark, and NQI, NIO and NIF trailed the Lipper average.
Key management factors that influenced the Funds’ returns during this period included duration and yield curve positioning, credit exposure and sector allocation. In addition, our liquidation of NQI and NPX’s positions in floating rate securities benefited these two Funds through our reinvestment of these proceeds in higher yielding bonds. The use of leverage also had an impact on the Funds’ performance. Leverage is discussed in more detail on page eight.
During this period, municipal bonds with shorter maturities generally outperformed other maturity categories, with credits at the longest end of the yield curve posting the weakest returns. The underperformance of longer bonds was due in part to the rise in municipal yields at the longer end of the curve. Among these six Funds, NVG and NEA were the most advantageously situated in terms of duration and yield curve positioning, with more exposure to the outperforming shorter end of the yield curve. The other four Funds had longer durations, and their greater exposure to the underperforming long part of the curve detracted from their performance for this period. Overall, variations in duration and yield curve positioning among the Funds accounted for the majority of the differences in performance.
Credit exposure also played an important role in performance. During the market reversal of late 2010, as the redemption activity in municipal bond funds and, especially, high-yield funds increased, lower-rated credits were negatively impacted. For the period as a whole, bonds rated BBB generally underperformed those rated AAA. As insured Funds, all of these Funds had large weightings in the insured and higher credit quality sectors, with NVG having the greatest exposure to AAA rated bonds and NQI having the smallest AAA exposure as of April 30, 2011.
| * | Six-month returns are cumulative; all other returns are annualized. |
| Past performance is not predictive of future results. Current performance may be higher or lower than the data shown. Returns do not reflect the deduction of taxes that shareholders may have to pay on Fund distributions or upon the sale of Fund shares. | |
| For additional information, see the individual Performance Overview for your Fund in this report. | |
| 1 | The Standard & Poor’s (S&P) National Insured Municipal Bond Index is an unleveraged, market value-weighted index designed to measure the performance of the tax-exempt insured U.S. municipal bond market. This index does not reflect any initial or ongoing expenses and is not available for direct investment. |
| 2 | The Lipper Insured Municipal Debt Funds Average is calculated using the returns of all closed-end funds in this category for each period as follows: 6-month, 10 funds; 1-year, 10 funds; 5-year, 10 funds; and 10-year, 8 funds. Lipper returns account for the effects of management fees and assume reinvestment of dividends, but do not reflect any applicable sales charges. The Lipper average is not available for direct investment. |
| Nuveen Investments | 7 |
Holdings that generally helped the Funds’ returns included housing, resource recovery, and general obligation and other tax-supported bonds. In general, these Funds had relatively light exposures to housing, which limited their participation in the performance of this sector. During this period, pre-refunded bonds, which are often backed by U.S. Treasury securities, also were among the strongest performers, primarily due to their shorter effective maturities and higher credit quality. As of April 30, 2011, NVG and NEA had the largest exposures to pre-refunded bonds, while NQI and NPX had the smallest allocations. In contrast, the industrial development revenue, health care and transportation sectors turned in relatively weaker performance. NEA and NQI, in particular, had heavier weightings in the health care sector, which hampered their performance.
IMPACT OF THE FUNDS’ LEVERAGE STRATEGIES ON PERFORMANCE
One important factor impacting the returns of all these Funds relative to the comparative indexes was the Funds’ use of leverage. The Funds use leverage because their managers believe that, over time, leveraging provides opportunities for additional income and total return for common shareholders. However, use of leverage also can expose common shareholders to additional volatility. For example, as the prices of securities held by a Fund decline, the negative impact of these valuation changes on common share net asset value and common shareholder total return is magnified by the use of leverage. This is what happened in these Funds during the period, as the use of structural leverage hurt their overall performance.
RECENT DEVELOPMENTS REGARDING THE FUNDS’ REDEMPTION OF AUCTION RATE PREFERRED SHARES
Shortly after their respective inceptions, each of the Funds issued auction rate preferred shares (ARPS) to create structural leverage. As noted in past shareholder reports, the ARPS issued by many closed-end funds, including these Funds, have been hampered by a lack of liquidity since February 2008. Since that time, more ARPS have been submitted for sale in each of their regularly scheduled auctions than there have been offers to buy. In fact, offers to buy have been almost completely nonexistent since late February 2008. This means that these auctions have “failed to clear,” and that many, or all, of the ARPS shareholders who wanted to sell their shares in these auctions were unable to do so. This lack of liquidity in ARPS did not lower the credit quality of these shares, and ARPS shareholders unable to sell their shares continued to receive distributions at the “maximum rate” applicable to failed auctions, as calculated in accordance with the pre-established terms of the ARPS. In the recent market, with short term rates at multi-generational lows, those maximum rates also have been low.
One continuing implication for common shareholders from the auction failures is that each Fund’s cost of leverage likely has been incrementally higher at times than it otherwise might have been had the auctions continued to be successful. As a result, each Fund’s common share earnings likely have been incrementally lower at times than they otherwise might have been.
As noted in past shareholder reports, the Nuveen funds’ Board of Directors/Trustees authorized several methods that can be used separately or in combination to refinance
| 8 | Nuveen Investments |
a portion of the Nuveen funds’ outstanding ARPS. Some funds have utilized tender option bonds (TOBs), also known as inverse floating rate securities, for leverage purposes. The amount of TOBs that a fund may use varies according to the composition of each fund’s portfolio. Some funds have a greater ability to use TOBs than others. Some funds have issued Variable Rate Demand Preferred (VRDP) Shares or Variable MuniFund Term Preferred (VMTP) Shares, which are a floating rate form of preferred stock with a mandatory term redemption. Some funds have issued MuniFund Term Preferred (MTP) Shares, a fixed rate form of preferred stock with a mandatory redemption period of three to five years.
While all these efforts have reduced the total amount of outstanding ARPS issued by the Nuveen funds, the funds cannot provide any assurance on when the remaining outstanding ARPS might be redeemed.
During 2010 and 2011, certain Nuveen leveraged closed-end funds (including NQI, NIO, NIF, NVG and NEA) received a demand letter from a law firm on behalf of purported holders of common shares of each such fund, alleging that Nuveen and the funds’ officers and Board of Directors/Trustees breached their fiduciary duties related to the redemption at par of the funds’ ARPS. In response, the Board established an ad hoc Demand Committee consisting of certain of its disinterested and independent Board members to investigate the claims. The Demand Committee retained independent counsel to assist it in conducting an extensive investigation. Based upon its investigation, the Demand Committee found that it was not in the best interests of each fund or its shareholders to take the actions suggested in the demand letters, and recommended that the full Board reject the demands made in the demand letters. After reviewing the findings and recommendation of the Demand Committee, the full Board of each fund unanimously adopted the Demand Committee’s recommendation.
Subsequently, the funds that received demand letters (including NQI, NIF, NVG and NEA) were named in a consolidated complaint as nominal defendants in a putative shareholder derivative action captioned Martin Safier, et al. v. Nuveen Asset Management, et al. that was filed in the Circuit Court of Cook County, Illinois, Chancery Division (the “Cook County Chancery Court”) on February 18, 2011 (the “Complaint”). The Complaint, filed on behalf of purported holders of each fund’s common shares, also name Nuveen Fund Advisors, Inc. as a defendant, together with current and former Officers and interested Director/Trustees of each of the funds (together with the nominal defendants, collectively, the “Defendants”). The Complaint contains the same basic allegations contained in the demand letters. The suits seek a declaration that the Defendants have breached their fiduciary duties, an order directing the Defendants not to redeem any ARPS at their liquidation value using fund assets, indeterminate monetary damages in favor of the funds and an award of plaintiffs’ costs and disbursements in pursuing the action. Nuveen Fund Advisors, Inc. believes that the Complaint is without merit, and is defending vigorously against these charges.
| Nuveen Investments | 9 |
As of April 30, 2011, the amount of ARPS redeemed at par by the Funds is as shows in the accompanying table.
| Fund | ARPS Redeemed | % of Original ARPS | ||||||
| NQI | $ | 318,000,000 | 100.0 | % | ||||
| NIO | $ | 791,000,000 | 100.0 | % | ||||
| NIF | $ | 161,000,000 | 100.0 | % | ||||
| NPX | $ | 268,900,000 | 100.0 | % | ||||
| NVG | $ | 141,050,000 | 60.5 | % | ||||
| NEA | $ | 105,625,000 | 61.1 | % | ||||
MTP Shares
As of April 30, 2011, and as noted in a previous shareholder report, the following Funds have issued and outstanding MTP Shares, at liquidation value, as shown in the accompanying table.
| Fund | MTP Shares at Liquidation Value | |||
| NVG | $ | 108,000,000 | ||
| NEA | $ | 83,000,000 | ||
VMTP Shares
During the current reporting period, the following Fund completed the issuance of VMTP Shares as shown in the accompanying table. The net proceeds from this offerings was used to refinance the Fund’s remaining outstanding ARPS at par.
| Fund | VMTP Series | VMTP Shares Issued at Liquidation Value | |||
| NQI | 2014 | $ | 240,400,000 | ||
As noted previously, VMTP is a newly-developed instrument that essentially replaces all or a portion of the ARPS used as leverage and potentially could be used to refinance all or a portion of the ARPS of other funds. VMTP is offered only to qualified institutional buyers, defined pursuant to Rule 144A under the Securities Act of 1933.
VRDP Shares
As of April 30, 2011, the following Funds have issued and outstanding VRDP Shares, at liquidation value, as shown in the accompanying table.
| Fund | VRDP Shares at Liquidation Value | |||
| NIO | $ | 667,000,000 | ||
| NIF | $ | 130,900,000 | ||
| NPX | $ | 219,000,000 | ||
During the current reporting period, the following Funds completed the issuance of VRDP Shares as shown in the accompanying table. The net proceeds from these offerings were used to refinance the Funds’ remaining outstanding ARPS at par. These VRDP Shares are included in the total amount of VRDP Shares outstanding in the preceding table.
| 10 | Nuveen Investments |
| Fund | VRDP Shares Issued at Liquidation Value | |||
| NIO | $ | 667,000,000 | ||
| NIF | $ | 130,900,000 | ||
(Refer to Notes to Financial Statements, Footnote 1 – General Information and Significant Accounting Policies and Footnote 4 – Fund Shares for further details on MTP, VMTP and VRDP Shares.)
At the time this report was prepared, all 84 of the Nuveen closed-end municipal funds that had issued ARPS have redeemed at par all or a portion of these shares. These redemptions bring the total amount of Nuveen’s municipal closed-end funds’ ARPS redemptions to approximately $10.0 billion of the approximately $11.0 billion originally outstanding.
For up-to-date information, please visit the Nuveen CEF Auction Rate Preferred Resource Center at: http://www.nuveen.com/arps.
Regulatory Matters
During May 2011, Nuveen Securities, LLC entered into a settlement with the Financial Industry Regulatory Authority (FINRA) with respect to certain allegations regarding Nuveen-sponsored closed-end fund ARPS marketing brochures. As part of this settlement, Nuveen Securities, LLC neither admitted to nor denied FINRA’s allegations. Nuveen is the broker-dealer subsidiary of Nuveen Investments.
The settlement with FINRA concludes an investigation that followed the widespread failure of auctions for ARPS and other auction rate securities, which generally began in mid-February 2008. In the settlement, FINRA alleged that certain marketing materials provided by Nuveen Securities, LLC were false and misleading. Nuveen Securities, LLC agreed to a censure and the payment of a $3 million fine.
| Nuveen Investments | 11 |
Common Share Dividend and
Share Price Information
The monthly dividends of all six Funds in this report remained stable throughout the six-month reporting period ended April 30, 2011.
Due to normal portfolio activity, common shareholders of the following Funds received capital gains and/or net ordinary income distributions in December 2010 as follows:
| Fund | Long-Term Capital Gains (per share) | Short-Term Capital Gains and/or Ordinary Income (per share) | ||||||
| NIO | — | $ | 0.0044 | |||||
| NVG | $ | 0.0029 | — | |||||
All of the Funds in this report seek to pay stable dividends at rates that reflect each Fund’s past results and projected future performance. During certain periods, each Fund may pay dividends at a rate that may be more or less than the amount of net investment income actually earned by the Fund during the period. If a Fund has cumulatively earned more than it has paid in dividends, it holds the excess in reserve as undistributed net investment income (UNII) as part of the Fund’s NAV. Conversely, if a Fund has cumulatively paid dividends in excess of its earnings, the excess constitutes negative UNII that is likewise reflected in the Fund’s NAV. Each Fund will, over time, pay all of its net investment income as dividends to shareholders. As of April 30, 2011, all six of the Funds in this report had positive UNII balances, based upon our best estimate, for tax purposes and positive UNII balances for financial reporting purposes.
COMMON SHARE REPURCHASES AND SHARE PRICE INFORMATION
As of April 30, 2011, and since the inception of the Funds’ repurchase program, the Funds have cumulatively repurchased and retired their common shares as shown in the accompanying table. Since the inception of the Funds’ repurchase program, NQI, NIF, and NPX have not repurchased any of their outstanding common shares.
| Fund | Common Shares Repurchased and Retired | % of Outstanding Common Shares | ||||||
| NQI | — | — | % | |||||
| NIO | 2,900 | 0.0 | % | |||||
| NIF | — | — | % | |||||
| NPX | — | — | % | |||||
| NVG | 10,400 | 0.0 | % | |||||
| NEA | 19,300 | 0.1 | % | |||||
During the six-month reporting period, the Funds did not repurchase any of their outstanding common shares.
| 12 | Nuveen Investments |
As of April 30, 2011, and during the six-month reporting period, the Funds’ common share prices were trading at (+) premiums or (-)discounts to their common share NAVs as shown in the accompanying table.
| Fund | 4/30/11 (+)Premium/(-)Discount | Six-Month Average (-)Discount | ||||||
| NQI | (-)2.58 | % | (-)3.19 | % | ||||
| NIO | (-)4.28 | % | (-)2.52 | % | ||||
| NIF | (+)5.69 | % | (-)1.04 | % | ||||
| NPX | (-)6.53 | % | (-)5.26 | % | ||||
| NVG | (-)5.58 | % | (-)5.38 | % | ||||
| NEA | (-)5.90 | % | (-)4.81 | % | ||||
| Nuveen Investments | 13 |
| NQI | Nuveen Insured | |
| Performance | Quality Municipal | |
OVERVIEW | Fund, Inc. | |
| as of April 30, 2011 |
| Fund Snapshot | ||||
| Common Share Price | $ | 12.82 | ||
| Common Share Net Asset Value (NAV) | $ | 13.16 | ||
| Premium/(Discount) to NAV | -2.58 | % | ||
| Market Yield | 6.65 | % | ||
Taxable-Equivalent Yield2 | 9.24 | % | ||
| Net Assets Applicable to Common Shares ($000) | $ | 505,535 |
Leverage (as a % of total Managed Assets) | ||||
| Structural Leverage | 30.55 | % | ||
| Effective Leverage | 44.75 | % |
Average Annual Total Return (Inception 12/19/90) | ||||||||
| On Share Price | On NAV | |||||||
| 6-Month (Cumulative) | -7.95 | % | -4.66 | % | ||||
| 1-Year | -3.82 | % | -0.01 | % | ||||
| 5-Year | 3.30 | % | 2.95 | % | ||||
| 10-Year | 4.99 | % | 4.93 | % | ||||
States5 (as a % of total investments) | ||||
| California | 17.5 | % | ||
| Texas | 10.9 | % | ||
| New York | 7.7 | % | ||
| Washington | 7.5 | % | ||
| Illinois | 7.5 | % | ||
| Florida | 6.5 | % | ||
| Kentucky | 4.0 | % | ||
| Pennsylvania | 4.0 | % | ||
| Arizona | 3.5 | % | ||
| Massachusetts | 3.0 | % | ||
| New Jersey | 2.5 | % | ||
| Louisiana | 2.4 | % | ||
| Colorado | 2.4 | % | ||
| Ohio | 2.3 | % | ||
| Other | 18.3 | % |
Portfolio Composition5 (as a % of total investments) | ||||
| Tax Obligation/Limited | 23.2 | % | ||
| Transportation | 18.7 | % | ||
| U.S. Guaranteed | 14.4 | % | ||
| Tax Obligation/General | 13.0 | % | ||
| Health Care | 9.3 | % | ||
| Water and Sewer | 7.1 | % | ||
| Utilities | 5.2 | % | ||
| Other | 9.1 | % |
Insurers5 (as a % of total Insured investments) | ||||
NPFG3 | 30.3 | % | ||
| AGM | 24.2 | % | ||
| FGIC | 21.0 | % | ||
| AMBAC | 20.6 | % | ||
| Other | 3.9 | % |
| Refer to the Glossary of Terms Used in this Report for further definition of the terms used within this Fund’s Performance Overview page. | |
| 1 | The Fund intends to invest at least 80% of its managed assets in municipal securities that are covered by insurance guaranteeing the timely payment of principal and interest. See Notes to Financial Statements, Footnote 2 – General Information and Significant Accounting Policies, Insurance for more information. At the end of the reporting period, 92% of the Fund’s total investments are invested in Insured securities. |
| 2 | Taxable-Equivalent Yield represents the yield that must be earned on a fully taxable investment in order to equal the yield of the Fund on an after-tax basis. It is based on a federal income tax rate of 28%. When comparing this Fund to investments that generate qualified dividend income, the Taxable-Equivalent Yield is lower. |
| 3 | MBIA’s public finance subsidiary. |
| 4 | Ratings shown are the highest of Standard & Poor’s Group, Moody’s Investor Service, Inc. or Fitch, Inc. AAA includes bonds with an implied AAA rating since they are backed by U.S. Government or agency securities. AAA, AA, A and BBB ratings are investment grade; BB, B, CCC, CC, C and D ratings are below-investment grade. Holdings designated N/R are not rated by any of these national rating agencies. |
| 5 | Holdings are subject to change. |
| 14 | Nuveen Investments |
| NIO | Nuveen Insured | |
| Performance | Municipal Opportunity | |
OVERVIEW | Fund, Inc. | |
| as of April 30, 2011 |
| Fund Snapshot | ||||
| Common Share Price | $ | 13.18 | ||
| Common Share Net Asset Value (NAV) | $ | 13.77 | ||
| Premium/(Discount) to NAV | -4.28 | % | ||
| Market Yield | 6.56 | % | ||
Taxable-Equivalent Yield2 | 9.11 | % | ||
| Net Assets Applicable to Common Shares ($000) | $ | 1,316,511 |
Leverage (as a % of total Managed Assets) | ||||
| Structural Leverage | 31.97 | % | ||
| Effective Leverage | 41.58 | % |
Average Annual Total Return (Inception 9/19/91) | ||||||||
| On Share Price | On NAV | |||||||
| 6-Month (Cumulative) | -8.18 | % | -4.72 | % | ||||
| 1-Year | 0.37 | % | 0.56 | % | ||||
| 5-Year | 3.74 | % | 3.45 | % | ||||
| 10-Year | 5.49 | % | 5.17 | % | ||||
States5 (as a % of total investments) | ||||
| Florida | 16.7 | % | ||
| California | 16.0 | % | ||
| Texas | 6.0 | % | ||
| New York | 5.0 | % | ||
| Illinois | 4.5 | % | ||
| Nevada | 4.4 | % | ||
| South Carolina | 3.6 | % | ||
| Massachusetts | 3.5 | % | ||
| Pennsylvania | 3.3 | % | ||
| Louisiana | 3.0 | % | ||
| Washington | 2.9 | % | ||
| Indiana | 2.8 | % | ||
| New Jersey | 2.8 | % | ||
| Ohio | 2.5 | % | ||
| Colorado | 2.1 | % | ||
| Kentucky | 2.0 | % | ||
| Other | 18.9 | % |
Portfolio Composition5 (as a % of total investments) | ||||
| Tax Obligation/Limited | 25.8 | % | ||
| U.S. Guaranteed | 16.8 | % | ||
| Transportation | 14.2 | % | ||
| Tax Obligation/General | 12.4 | % | ||
| Water and Sewer | 12.1 | % | ||
| Utilities | 7.8 | % | ||
| Other | 10.9 | % |
Insurers5 (as a % of total Insured investments) | ||||
NPFG3 | 29.5 | % | ||
| AGM | 22.3 | % | ||
| FGIC | 21.0 | % | ||
| AMBAC | 17.3 | % | ||
| Other | 9.9 | % |
| Refer to the Glossary of Terms Used in this Report for further definition of the terms used within this Fund’s Performance Overview page. | |
| 1 | The Fund intends to invest at least 80% of its managed assets in municipal securities that are covered by insurance guaranteeing the timely payment of principal and interest. See Notes to Financial Statements, Footnote 1 – General Information and Significant Accounting Policies, Insurance for more information. At the end of the reporting period, 94% of the Fund’s total investments are invested in Insured securities. |
| 2 | Taxable-Equivalent Yield represents the yield that must be earned on a fully taxable investment in order to equal the yield of the Fund on an after-tax basis. It is based on a federal income tax rate of 28%. When comparing this Fund to investments that generate qualified dividend income, the Taxable-Equivalent Yield is lower. |
| 3 | MBIA’s public finance subsidiary. |
| 4 | Ratings shown are the highest of Standard & Poor’s Group, Moody’s Investor Service, Inc. or Fitch, Inc. AAA includes bonds with an implied AAA rating since they are backed by U.S. Government or agency securities. AAA, AA, A and BBB ratings are investment grade; BB, B, CCC, CC, C and D ratings are below-investment grade. Holdings designated N/R are not rated by any of these national rating agencies. |
| 5 | Holdings are subject to change. |
| 6 | Rounds to less than 1%. |
| 7 | The Fund paid shareholders an ordinary income distribution in December 2010 of $0.0044. |
| Nuveen Investments | 15 |
| NIF | Nuveen Premier | |
| Performance | Insured Municipal | |
OVERVIEW | Income Fund, Inc. | |
| as of April 30, 2011 |
| Fund Snapshot | ||||
| Common Share Price | $ | 14.67 | ||
| Common Share Net Asset Value (NAV) | $ | 13.88 | ||
| Premium/(Discount) to NAV | 5.69 | % | ||
| Market Yield | 6.05 | % | ||
Taxable-Equivalent Yield2 | 8.40 | % | ||
| Net Assets Applicable to Common Shares ($000) | $ | 270,117 |
Leverage (as a % of total Managed Assets) | ||||
| Structural Leverage | 30.82 | % | ||
| Effective Leverage | 43.24 | % |
Average Annual Total Return (Inception 12/19/91) | ||||||||
| On Share Price | On NAV | |||||||
| 6-Month (Cumulative) | -2.26 | % | -4.52 | % | ||||
| 1-Year | 6.45 | % | 0.70 | % | ||||
| 5-Year | 6.02 | % | 3.75 | % | ||||
| 10-Year | 6.24 | % | 5.20 | % | ||||
States5 (as a % of total investments) | ||||
| California | 16.5 | % | ||
| Washington | 10.4 | % | ||
| Illinois | 9.5 | % | ||
| Texas | 8.8 | % | ||
| Colorado | 4.8 | % | ||
| Pennsylvania | 4.8 | % | ||
| New York | 4.5 | % | ||
| Nevada | 4.0 | % | ||
| Florida | 3.9 | % | ||
| Massachusetts | 3.0 | % | ||
| Oregon | 2.8 | % | ||
| Indiana | 2.8 | % | ||
| Arizona | 2.6 | % | ||
| North Carolina | 1.9 | % | ||
| Other | 19.7 | % |
Portfolio Composition5 (as a % of total investments) | ||||
| U.S. Guaranteed | 24.4 | % | ||
| Tax Obligation/Limited | 17.1 | % | ||
| Transportation | 16.7 | % | ||
| Tax Obligation/General | 14.9 | % | ||
| Water and Sewer | 8.9 | % | ||
| Health Care | 6.9 | % | ||
| Utilities | 6.6 | % | ||
| Other | 4.5 | % |
Insurers5 (as a % of total Insured investments) | ||||
NPFG3 | 32.3 | % | ||
| AGM | 27.1 | % | ||
| FGIC | 23.0 | % | ||
| AMBAC | 14.2 | % | ||
| Other | 3.4 | % |
| Refer to the Glossary of Terms Used in this Report for further definition of the terms used within this Fund’s Performance Overview page. | |
| 1 | The Fund intends to invest at least 80% of its managed assets in municipal securities that are covered by insurance guaranteeing the timely payment of principal and interest. See Notes to Financial Statements, Footnote 1 – General Information and Significant Accounting Policies, Insurance for more information. At the end of the reporting period, 86% of the Fund’s total investments are invested in Insured securities. |
| 2 | Taxable-Equivalent Yield represents the yield that must be earned on a fully taxable investment in order to equal the yield of the Fund on an after-tax basis. It is based on a federal income tax rate of 28%. When comparing this Fund to investments that generate qualified dividend income, the Taxable-Equivalent Yield is lower. |
| 3 | MBIA’s public finance subsidiary. |
| 4 | Ratings shown are the highest of Standard & Poor’s Group, Moody’s Investor Service, Inc. or Fitch, Inc. AAA includes bonds with an implied AAA rating since they are backed by U.S. Government or agency securities. AAA, AA, A and BBB ratings are investment grade; BB, B, CCC, CC, C and D ratings are below-investment grade. Holdings designated N/R are not rated by any of these national rating agencies. |
| 5 | Holdings are subject to change. |
| 16 | Nuveen Investments |
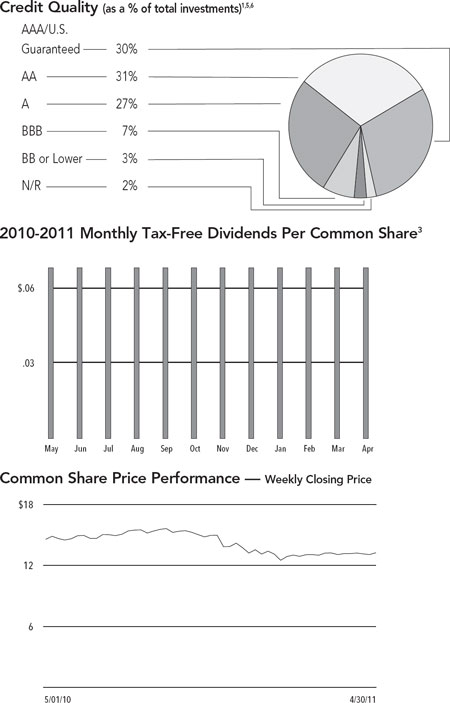
| NPX | Nuveen Insured | |
| Performance | Premium Income | |
OVERVIEW | Municipal Fund 2 | |
| as of April 30, 2011 |
| Fund Snapshot | ||||
| Common Share Price | $ | 11.74 | ||
| Common Share Net Asset Value (NAV) | $ | 12.56 | ||
| Premium/(Discount) to NAV | -6.53 | % | ||
| Market Yield | 6.34 | % | ||
Taxable-Equivalent Yield2 | 8.81 | % | ||
| Net Assets Applicable to Common Shares ($000) | $ | 468,982 |
Leverage (as a % of total Managed Assets) | ||||
| Structural Leverage | 29.80 | % | ||
| Effective Leverage | 40.35 | % |
Average Annual Total Return (Inception 7/22/93) | ||||||||
| On Share Price | On NAV | |||||||
| 6-Month (Cumulative) | -9.61 | % | -4.37 | % | ||||
| 1-Year | -1.67 | % | 0.69 | % | ||||
| 5-Year | 4.13 | % | 3.34 | % | ||||
| 10-Year | 5.01 | % | 5.01 | % | ||||
States5 (as a % of total investments) | ||||
| California | 15.1 | % | ||
| Texas | 7.6 | % | ||
| Colorado | 6.6 | % | ||
| New York | 6.6 | % | ||
| New Jersey | 6.1 | % | ||
| Pennsylvania | 6.1 | % | ||
| Washington | 4.7 | % | ||
| Louisiana | 4.0 | % | ||
| Illinois | 3.9 | % | ||
| Florida | 3.7 | % | ||
| Georgia | 3.4 | % | ||
| Arizona | 3.3 | % | ||
| Hawaii | 3.1 | % | ||
| Indiana | 3.1 | % | ||
| Massachusetts | 2.5 | % | ||
| Alabama | 2.4 | % | ||
| Other | 17.8 | % |
Portfolio Composition5 (as a % of total investments) | ||||
| Tax Obligation/Limited | 20.2 | % | ||
| Utilities | 16.2 | % | ||
| Transportation | 12.5 | % | ||
| U.S. Guaranteed | 11.6 | % | ||
| Water and Sewer | 11.2 | % | ||
| Tax Obligation/General | 10.6 | % | ||
| Education and Civic Organizations | 9.3 | % | ||
| Health Care | 6.7 | % | ||
| Other | 1.7 | % |
Insurers5 (as a % of total Insured investments) | ||||
| AGM | 27.5 | % | ||
| AMBAC | 24.5 | % | ||
NPFG3 | 24.3 | % | ||
| FGIC | 15.7 | % | ||
| Other | 8.0 | % |
| Refer to the Glossary of Terms Used in this Report for further definition of the terms used within this Fund’s Performance Overview page. | |
| 1 | The Fund intends to invest at least 80% of its managed assets in municipal securities that are covered by insurance guaranteeing the timely payment of principal and interest. See Notes to Financial Statements, Footnote 1 – General Information and Significant Accounting Policies, Insurance for more information. At the end of the reporting period, 93% of the Fund’s total investments are invested in Insured securities. |
| 2 | Taxable-Equivalent Yield represents the yield that must be earned on a fully taxable investment in order to equal the yield of the Fund on an after-tax basis. It is based on a federal income tax rate of 28%. When comparing this Fund to investments that generate qualified dividend income, the Taxable-Equivalent Yield is lower. |
| 3 | MBIA’s public finance subsidiary. |
| 4 | Ratings shown are the highest of Standard & Poor’s Group, Moody’s Investor Service, Inc. or Fitch, Inc. AAA includes bonds with an implied AAA rating since they are backed by U.S. Government or agency securities. AAA, AA, A and BBB ratings are investment grade; BB, B, CCC, CC, C and D ratings are below-investment grade. Holdings designated N/R are not rated by any of these national rating agencies. |
| 5 | Holdings are subject to change. |
| 6 | Rounds to less than 1%. |
| Nuveen Investments | 17 |
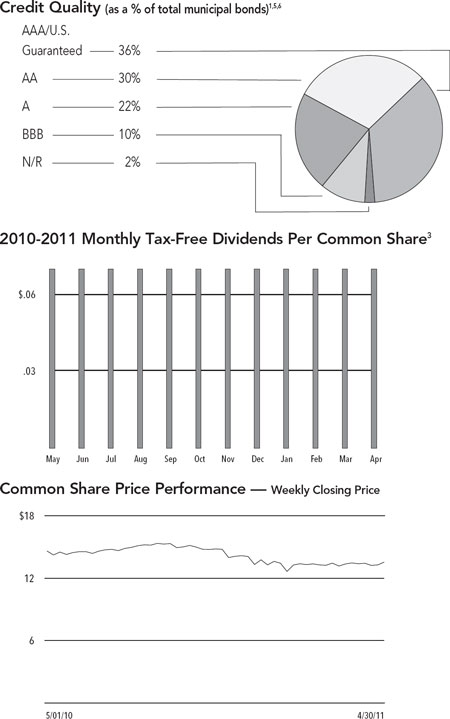
| NVG | Nuveen Insured | |
| Performance | Dividend Advantage | |
OVERVIEW | Municipal Fund | |
| as of April 30, 2011 |
| Fund Snapshot | ||||
| Common Share Price | $ | 13.53 | ||
| Common Share Net Asset Value (NAV) | $ | 14.33 | ||
| Premium/(Discount) to NAV | -5.58 | % | ||
| Market Yield | 6.21 | % | ||
Taxable-Equivalent Yield2 | 8.63 | % | ||
| Net Assets Applicable to Common Shares ($000) | $ | 427,189 |
Leverage (as a % of total Managed Assets) | ||||
| Structural Leverage | 30.20 | % | ||
| Effectve Leverage | 40.50 | % |
Average Annual Total Return (Inception 3/25/02) | ||||||||
| On Share Price | On NAV | |||||||
| 6-Month (Cumulative) | -5.70 | % | -2.89 | % | ||||
| 1-Year | -1.20 | % | 1.43 | % | ||||
| 5-Year | 3.51 | % | 4.29 | % | ||||
| Since Inception | 5.01 | % | 5.86 | % | ||||
States6 (as a % of total municipal bonds) | ||||
| Texas | 16.1 | % | ||
| Washington | 10.5 | % | ||
| Indiana | 9.6 | % | ||
| California | 8.5 | % | ||
| Florida | 8.0 | % | ||
| Illinois | 7.8 | % | ||
| Tennessee | 6.6 | % | ||
| New York | 3.9 | % | ||
| Colorado | 3.7 | % | ||
| Pennsylvania | 3.2 | % | ||
| Louisiana | 2.8 | % | ||
| Other | 19.3 | % |
Portfolio Composition6 (as a % of total investments) | ||||
| U.S. Guaranteed | 25.2 | % | ||
| Tax Obligation/Limited | 17.3 | % | ||
| Transportation | 17.0 | % | ||
| Health Care | 8.8 | % | ||
| Utilities | 8.6 | % | ||
| Tax Obligation/General | 7.8 | % | ||
| Water and Sewer | 5.5 | % | ||
| Education and Civic Organizations | 5.0 | % | ||
| Other | 4.8 | % |
Insurers6 (as a % of total Insured investments) | ||||
NPFG4 | 30.7 | % | ||
| AMBAC | 25.2 | % | ||
| AGM | 24.8 | % | ||
| FGIC | 15.8 | % | ||
| Other | 3.5 | % |
| Refer to the Glossary of Terms Used in this Report for further definition of the terms used within this Fund’s Performance Overview page. | |
| 1 | The Fund intends to invest at least 80% of its managed assets in municipal securities that are covered by insurance guaranteeing the timely payment of principal and interest. See Notes to Financial Statements, Footnote 1 – General Information and Significant Accounting Policies, Insurance for more information. At the end of the reporting period, 90% of the Fund’s total investments are invested in Insured securities. |
| 2 | Taxable-Equivalent Yield represents the yield that must be earned on a fully taxable investment in order to equal the yield of the Fund on an after-tax basis. It is based on a federal income tax rate of 28%. When comparing this Fund to investments that generate qualified dividend income, the Taxable-Equivalent Yield is lower. |
| 3 | The Fund paid shareholders a capital gains distribution in December 2010 of $0.0029 per share. |
| 4 | MBIA’s public finance subsidiary. |
| 5 | Ratings shown are the highest of Standard & Poor’s Group, Moody’s Investor Service, Inc. or Fitch, Inc. AAA includes bonds with an implied AAA rating since they are backed by U.S. Government or agency securities. AAA, AA, A and BBB ratings are investment grade; BB, B, CCC, CC, C and D ratings are below-investment grade. Holdings designated N/R are not rated by any of these national rating agencies. |
| 6 | Holdings are subject to change. |
| 18 | Nuveen Investments |
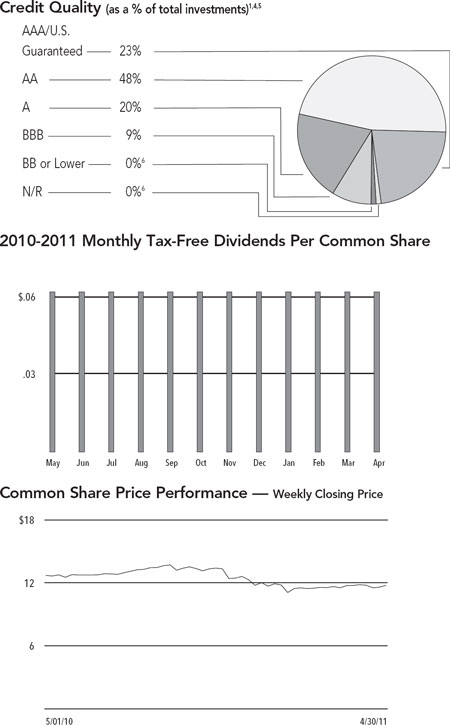
| NEA | Nuveen Insured | |
| Performance | Tax-Free Advantage | |
OVERVIEW | Municipal Fund | |
| as of April 30, 2011 |
| Fund Snapshot | ||||
| Common Share Price | $ | 13.23 | ||
| Common Share Net Asset Value (NAV) | $ | 14.06 | ||
| Premium/(Discount) to NAV | -5.90 | % | ||
| Market Yield | 6.17 | % | ||
Taxable-Equivalent Yield2 | 8.57 | % | ||
| Net Assets Applicable to Common Shares ($000) | $ | 312,784 |
Leverage (as a % of total Managed Assets) | ||||
| Structural Leverage | 30.85 | % | ||
| Effective Leverage | 40.91 | % |
Average Annual Total Return (Inception 11/21/02) | ||||||||
| On Share Price | On NAV | |||||||
| 6-Month (Cumulative) | -8.75 | % | -3.36 | % | ||||
| 1-Year | -3.46 | % | 1.34 | % | ||||
| 5-Year | 4.84 | % | 4.65 | % | ||||
| Since Inception | 4.20 | % | 5.34 | % | ||||
States6 (as a % of total investments) | ||||
| Florida | 15.8 | % | ||
| California | 14.0 | % | ||
| New York | 6.7 | % | ||
| Michigan | 6.5 | % | ||
| Washington | 6.5 | % | ||
| Texas | 5.5 | % | ||
| Pennsylvania | 5.2 | % | ||
| Indiana | 4.9 | % | ||
| Alabama | 4.8 | % | ||
| South Carolina | 3.8 | % | ||
| Wisconsin | 3.7 | % | ||
| Arizona | 3.5 | % | ||
| Other | 19.1 | % |
Portfolio Composition6 (as a % of total investments) | ||||
| Tax Obligation/Limited | 27.4 | % | ||
| U.S. Guaranteed | 27.0 | % | ||
| Health Care | 10.2 | % | ||
| Water and Sewer | 8.7 | % | ||
| Transportation | 8.2 | % | ||
| Utilities | 8.2 | % | ||
| Tax Obligation/General | 6.4 | % | ||
| Other | 3.9 | % |
Insurers6 (as a % of total Insured investments) | ||||
NPFG4 | 32.0 | % | ||
| AMBAC | 26.5 | % | ||
| AGM | 22.2 | % | ||
| FGIC | 10.6 | % | ||
| Other | 8.7 | % |
| Refer to the Glossary of Terms Used in this Report for further definition of the terms used within this Fund’s Performance Overview page. | |
| 1 | The Fund intends to invest at least 80% of its managed assets in municipal securities that are covered by insurance guaranteeing the timely payment of principal and interest. See Notes to Financial Statements, Footnote 1 – General Information and Significant Accounting Policies, Insurance for more information. At the end of the reporting period, 89% of the Fund’s total investments are invested in Insured securities. |
| 2 | Taxable-Equivalent Yield represents the yield that must be earned on a fully taxable investment in order to equal the yield of the Fund on an after-tax basis. It is based on a federal income tax rate of 28%. When comparing this Fund to investments that generate qualified dividend income, the Taxable-Equivalent Yield is lower. |
| 3 | The Fund paid shareholders a net ordinary income distribution in December 2010 of $0.0044. |
| 4 | MBIA’s public finance subsidiary. |
| 5 | Ratings shown are the highest of Standard & Poor’s Group, Moody’s Investor Service, Inc. or Fitch, Inc. AAA includes bonds with an implied AAA rating since they are backed by U.S. Government or agency securities. AAA, AA, A and BBB ratings are investment grade; BB, B, CCC, CC, C and D ratings are below-investment grade. Holdings designated N/R are not rated by any of these national rating agencies. |
| 6 | Holdings are subject to change. |
| Nuveen Investments | 19 |
| Nuveen Insured Quality Municipal Fund, Inc. | ||
| NQI | Portfolio of Investments |
April 30, 2011 (Unaudited)
| Principal | Optional Call | |||||||
| Amount (000) | Description (1) | Provisions (2) | Ratings (3) | Value | ||||
| Alabama – 1.6% (1.0% of Total Investments) | ||||||||
| $ | 1,135 | Birmingham Waterworks and Sewerage Board, Alabama, Water and Sewerage Revenue Bonds, Series 2002B, 5.250%, 1/01/20 (Pre-refunded 1/01/13) – NPFG Insured | 1/13 at 100.00 | AAA | $ | 1,223,768 | ||
| 7,000 | Huntsville Healthcare Authority, Alabama, Revenue Bonds, Series 2005A, 5.000%, 6/01/24 – NPFG Insured | 6/15 at 100.00 | A1 | 7,004,550 | ||||
| 8,135 | Total Alabama | 8,228,318 | ||||||
| Arizona – 5.5% (3.5% of Total Investments) | ||||||||
| Arizona State, Certificates of Participation, Series 2010A: | ||||||||
| 1,200 | 5.250%, 10/01/28 – AGM Insured | 10/19 at 100.00 | AA+ | 1,234,908 | ||||
| 1,500 | 5.000%, 10/01/29 – AGM Insured | 10/19 at 100.00 | AA+ | 1,509,675 | ||||
| 7,065 | Arizona State, State Lottery Revenue Bonds, Series 2010A, 5.000%, | 1/20 at 100.00 | AA+ | 7,089,162 | ||||
| 7/01/29 – AGC Insured | ||||||||
| 2,750 | Mesa, Arizona, Utility System Revenue Bonds, Reset Option Longs, Series 11033, 14.835%, 7/01/26 – AGM Insured (IF) | 7/17 at 100.00 | AA+ | 1,605,450 | ||||
| 9,200 | Phoenix Civic Improvement Corporation, Arizona, Senior Lien Airport Revenue Bonds, Series 2002B, 5.250%, 7/01/32 – FGIC Insured (Alternative Minimum Tax) | 7/12 at 100.00 | AA– | 8,874,688 | ||||
| 8,755 | Phoenix, Arizona, Civic Improvement Revenue Bonds, Civic Plaza, Series 2005B, 0.000%, 7/01/39 – FGIC Insured | No Opt. Call | AA | 7,408,569 | ||||
| 30,470 | Total Arizona | 27,722,452 | ||||||
| Arkansas – 0.5% (0.3% of Total Investments) | ||||||||
| 2,250 | University of Arkansas, Fayetteville, Revenue Bonds, Medical Sciences Campus, Series 2004B, 5.000%, 11/01/24 – NPFG Insured | 11/14 at 100.00 | Aa2 | 2,372,220 | ||||
| California – 27.4% (17.5% of Total Investments) | ||||||||
| California Department of Water Resources, Water System Revenue Bonds, Central Valley Project, Series 2005AC: | ||||||||
| 4,010 | 5.000%, 12/01/24 – NPFG Insured (UB) | 12/14 at 100.00 | AAA | 4,313,557 | ||||
| 3,965 | 5.000%, 12/01/26 – NPFG Insured (UB) | 12/14 at 100.00 | AAA | 4,224,192 | ||||
| 13,445 | California State, General Obligation Bonds, Series 2002, 5.000%, 4/01/27 – AMBAC Insured | 4/12 at 100.00 | A1 | 13,467,857 | ||||
| 7,055 | California State, General Obligation Bonds, Series 2002, 5.000%, 4/01/27 (Pre-refunded 4/01/12) – AMBAC Insured | 4/12 at 100.00 | AAA | 7,361,116 | ||||
| 5 | California State, General Obligation Bonds, Series 2004, 5.000%, 4/01/31 – AMBAC Insured | 4/14 at 100.00 | A1 | 4,916 | ||||
| 3,745 | California State, General Obligation Bonds, Series 2004, 5.000%, 4/01/31 (Pre-refunded 4/01/14) – AMBAC Insured | 4/14 at 100.00 | AAA | 4,182,229 | ||||
| 7,000 | California Statewide Communities Development Authority, Revenue Bonds, Sutter Health, Series 2011A, 6.000%, 8/15/42 | 8/20 at 100.00 | AA– | 7,123,900 | ||||
| 8,000 | California, General Obligation Bonds, Series 2002, 5.000%, 10/01/32 – NPFG Insured | 10/12 at 100.00 | A1 | 7,779,280 | ||||
| 2,340 | Cerritos Public Financing Authority, California, Tax Allocation Revenue Bonds, Los Cerritos Redevelopment Projects, Series 2002A, 5.000%, 11/01/24 – AMBAC Insured | 11/17 at 102.00 | A– | 2,100,875 | ||||
| 5,000 | Clovis Unified School District, Fresno County, California, General Obligation Bonds, Series 2001A, 0.000%, 8/01/25 – FGIC Insured (ETM) | No Opt. Call | AA+ (4) | 2,798,800 | ||||
| Foothill/Eastern Transportation Corridor Agency, California, Toll Road Revenue Refunding Bonds, Series 1999: | ||||||||
| 22,985 | 0.000%, 1/15/24 – NPFG Insured | 7/11 at 48.16 | Baa1 | 8,185,418 | ||||
| 22,000 | 0.000%, 1/15/31 – NPFG Insured | 7/11 at 31.52 | AAA | 3,961,320 | ||||
| 50,000 | 0.000%, 1/15/37 – NPFG Insured | 7/11 at 21.87 | Baa1 | 5,148,500 | ||||
| 5,000 | Garden Grove, California, Certificates of Participation, Financing Project, Series 2002A, 5.125%, 3/01/32 – AMBAC Insured | 3/12 at 101.00 | A | 4,350,250 | ||||
| 8,500 | Golden State Tobacco Securitization Corporation, California, Enhanced Tobacco Settlement Asset-Backed Revenue Bonds, Series 2005A, 5.000%, 6/01/35 – FGIC Insured | 6/15 at 100.00 | A2 | 7,260,615 | ||||
| 5,795 | Kern Community College District, California, General Obligation Bonds, Series 2006, 0.000%, 11/01/25 – AGM Insured | No Opt. Call | AA+ | 2,324,432 |
| 20 | Nuveen Investments |
| Principal | Optional Call | |||||||
| Amount (000) | Description (1) | Provisions (2) | Ratings (3) | Value | ||||
California (continued) | ||||||||
| $ | 5,243 | Moreno Valley Public Finance Authority, California, GNMA Collateralized Assisted Living Housing Revenue Bonds, CDC Assisted Living Project, Series 2000A, 7.500%, 1/20/42 | 1/12 at 105.00 | Aaa | $ | 5,666,949 | ||
| 4,675 | Ontario Redevelopment Financing Authority, San Bernardino County, California, Revenue Bonds, Redevelopment Project 1, Series 1993, 5.850%, 8/01/22 – NPFG Insured (ETM) | 7/11 at 100.00 | BBB (4) | 5,294,671 | ||||
| 2,590 | Riverside County Public Financing Authority, California, Tax Allocation Bonds, Multiple Projects, Series 2004, 5.000%, 10/01/25 – SYNCORA GTY Insured | 10/14 at 100.00 | BBB | 2,157,263 | ||||
| 2,000 | San Diego Redevelopment Agency, California, Subordinate Lien Tax Allocation Bonds, Centre City Project, Series 2004A, 5.000%, 9/01/21 – SYNCORA GTY Insured | 9/14 at 100.00 | A | 2,016,860 | ||||
| San Francisco Airports Commission, California, Revenue Refunding Bonds, San Francisco International Airport, Second Series 2001, Issue 27A: | ||||||||
| 7,200 | 5.125%, 5/01/21 – NPFG Insured (Alternative Minimum Tax) | 11/11 at 100.00 | A1 | 7,204,320 | ||||
| 12,690 | 5.250%, 5/01/31 – NPFG Insured (Alternative Minimum Tax) | 11/11 at 100.00 | A1 | 11,721,753 | ||||
| San Francisco Bay Area Rapid Transit District, California, Sales Tax Revenue Bonds, Refunding Series 2005A: | ||||||||
| 2,000 | 5.000%, 7/01/21 – NPFG Insured | 7/15 at 100.00 | AA+ | 2,119,160 | ||||
| 3,655 | 5.000%, 7/01/22 – NPFG Insured | 7/15 at 100.00 | AA+ | 3,890,930 | ||||
| 8,965 | San Jose Redevelopment Agency, California, Tax Allocation Bonds, Merged Area Redevelopment Project, Series 2006C, 4.250%, 8/01/30 – NPFG Insured | 8/17 at 100.00 | BBB+ | 6,217,407 | ||||
| 3,500 | Saugus Union School District, Los Angeles County, California, General Obligation Bonds, Series 2006, 0.000%, 8/01/23 – FGIC Insured | No Opt. Call | Aa2 | 1,667,540 | ||||
| 1,000 | Sierra Joint Community College District, Tahoe Truckee, California, General Obligation Bonds, School Facilities Improvement District 1, Series 2005A, 5.000%, 8/01/27 – FGIC Insured | 8/14 at 100.00 | Aa2 | 1,006,490 | ||||
| 1,525 | Sierra Joint Community College District, Western Nevada, California, General Obligation Bonds, School Facilities Improvement District 2, Series 2005A, 5.000%, 8/01/27 – FGIC Insured | 8/14 at 100.00 | Aa2 | 1,534,897 | ||||
| 3,170 | Ventura County Community College District, California, General Obligation Bonds, Series 2005B, 5.000%, 8/01/28 – NPFG Insured | 8/15 at 100.00 | AA | 3,181,792 | ||||
| 227,058 | Total California | 138,267,289 | ||||||
| Colorado – 3.7% (2.4% of Total Investments) | ||||||||
| 2,015 | Board of Trustees of the University of Northern Colorado, Revenue Bonds, Series 2005, 5.000%, 6/01/22 – AGM Insured | 6/15 at 100.00 | AA+ | 2,120,687 | ||||
| 1,000 | Denver City and County, Colorado, Airport Revenue Bonds, Series 2006, 5.000%, 11/15/24 – FGIC Insured | 11/16 at 100.00 | A+ | 1,035,630 | ||||
| 5,365 | Denver City and County, Colorado, Airport Revenue Bonds, Series 2006A, 5.000%, 11/15/23 – FGIC Insured (UB) | 11/16 at 100.00 | A+ | 5,594,354 | ||||
| 1,085 | Denver City and County, Colorado, Airport Revenue Bonds, Trust 2365, 13.779%, 11/15/25 – FGIC Insured (IF) | 11/16 at 100.00 | A+ | 1,209,612 | ||||
| 9,780 | E-470 Public Highway Authority, Colorado, Senior Revenue Bonds, Series 2000B, 0.000%, 9/01/32 – NPFG Insured | No Opt. Call | Baa1 | 1,871,990 | ||||
| 10,000 | E-470 Public Highway Authority, Colorado, Toll Revenue Bonds, Series 2004A, 0.000%, 9/01/27 – NPFG Insured | No Opt. Call | Baa1 | 2,937,500 | ||||
| 1,250 | Jefferson County School District R1, Colorado, General Obligation Bonds, Series 2004, 5.000%, 12/15/24 (Pre-refunded 12/15/14) – AGM Insured (UB) | 12/14 at 100.00 | AA+ (4) | 1,427,350 | ||||
| 880 | Park Creek Metropolitan District, Colorado, Senior Limited Property Tax Supported Revenue Refunding Bonds, Series 2011, 6.125%, 12/01/41 (WI/DD, Settling 5/12/11) – AGM Insured | 12/20 at 100.00 | Aa3 | 872,846 | ||||
| 1,100 | Poudre Tech Metro District, Colorado, Unlimited Property Tax Supported Revenue Bonds, Refunding & Improvement Series 2010A, 5.000%, | 12/20 at 100.00 | AA+ | 1,088,065 | ||||
| 12/01/39 – AGM Insured | ||||||||
| 500 | University of Colorado, Enterprise System Revenue Bonds, Series 2005, 5.000%, 6/01/30 – FGIC Insured | 6/15 at 100.00 | Aa2 | 507,320 | ||||
| 32,975 | Total Colorado | 18,665,354 | ||||||
| Connecticut – 0.2% (0.1% of Total Investments) | ||||||||
| 1,000 | Connecticut Health and Educational Facilities Authority, Revenue Bonds, Wesleyan University, Series 2010G, 5.000%, 7/01/39 | 7/20 at 100.00 | AA | 1,010,560 |
| Nuveen Investments | 21 |
Nuveen Insured Quality Municipal Fund, Inc. (continued) | ||
| NQI | Portfolio of Investments |
April 30, 2011 (Unaudited)
| Principal | Optional Call | |||||||
| Amount (000) | Description (1) | Provisions (2) | Ratings (3) | Value | ||||
| District of Columbia – 1.3% (0.9% of Total Investments) | ||||||||
| $ | 1,335 | Washington Convention Center Authority, District of Columbia, Senior Lien Dedicated Tax Revenue Bonds, Series 2007, Residuals 1606, 11.376%, 10/01/30 – AMBAC Insured (IF) | 10/16 at 100.00 | AA+ | $ | 1,107,796 | ||
| 3,920 | Washington Convention Center Authority, District of Columbia, Dedicated Tax Revenue Bonds, Residual Series 1731, 1736, 11.348%, 10/01/36 – AMBAC Insured (IF) | 10/16 at 100.00 | AA+ | 5,648,132 | ||||
| 5,255 | Total District of Columbia | 6,755,928 | ||||||
| Florida – 10.1% (6.5% of Total Investments) | ||||||||
| 4,455 | Broward County School Board, Florida, Certificates of Participation, Series 2005A, 5.000%, 7/01/28 – AGM Insured | 7/15 at 100.00 | AA+ | 4,361,712 | ||||
| 3,000 | Citizens Property Insurance Corporation, Florida, High-Risk Account Senior Secured Bonds Series 2010A-1, 5.000%, 6/01/16 – AGM Insured | No Opt. Call | AA+ | 3,195,900 | ||||
| 3,450 | Collier County, Florida, Capital Improvement Revenue Bonds, Series 2005, 5.000%, 10/01/24 – NPFG Insured | 10/14 at 100.00 | AA– | 3,549,981 | ||||
| 2,750 | Florida State Board of Education, Full Faith and Credit Public Education Capital Outlay Bonds, Series 2003J, 5.000%, 6/01/22 – AMBAC Insured | 6/13 at 101.00 | AAA | 2,863,768 | ||||
| 2,550 | Florida State Board of Education, Public Education Capital Outlay Bonds, Series 2008, Trust 2929, 16.907%, 12/01/16 – AGC Insured (IF) | No Opt. Call | AAA | 2,674,746 | ||||
| 20,000 | Lee County, Florida, Airport Revenue Bonds, Series 2000A, 5.750%, | 10/11 at 100.00 | AA+ | 20,080,600 | ||||
| 10/01/25 – AGM Insured (Alternative Minimum Tax) | ||||||||
| 4,115 | Miami-Dade County Housing Finance Authority, Florida, Multifamily Housing Revenue Bonds, Monterey Pointe Apartments, Series 2001-2A, 5.850%, 7/01/37 – AGM Insured (Alternative Minimum Tax) | 7/11 at 100.00 | AA+ | 4,116,769 | ||||
| 7,000 | Miami-Dade County, Florida, Aviation Revenue Bonds, Miami International Airport, Series 2002, 5.375%, 10/01/32 – FGIC Insured (Alternative Minimum Tax) | 10/12 at 100.00 | A2 | 6,471,990 | ||||
| 3,730 | Palm Beach County School Board, Florida, Certificates of Participation, Series 2003A, 5.000%, 8/01/16 – AMBAC Insured | 8/13 at 100.00 | AA– | 3,944,848 | ||||
| 51,050 | Total Florida | 51,260,314 | ||||||
| Georgia – 2.0% (1.3% of Total Investments) | ||||||||
| 1,000 | Atlanta, Georgia, Water and Wastewater Revenue Bonds, Series 2004, 5.000%, 11/01/22 – AGM Insured | 11/14 at 100.00 | AA+ | 1,035,880 | ||||
| 7,000 | Atlanta, Georgia, Water and Wastewater Revenue Bonds, Series 2009B, 5.375%, 11/01/39 – AGM Insured | 11/19 at 100.00 | AA+ | 7,040,320 | ||||
| 2,000 | City of Fairburn, Georgia, General Obligation Bonds, Series 2011, 5.750%, 12/01/31 – AGM Insured | 12/21 at 100.00 | AA+ | 2,035,600 | ||||
| 10,000 | Total Georgia | 10,111,800 | ||||||
| Hawaii – 0.3% (0.2% of Total Investments) | ||||||||
| 1,620 | Hawaii County, Hawaii, General Obligation Bonds, Series 2003A, 5.000%, 7/15/21 – AGM Insured | 7/13 at 100.00 | AA+ | 1,735,117 | ||||
| Illinois – 11.8% (7.5% of Total Investments) | ||||||||
| 9,500 | Chicago, Illinois, Second Lien General Airport Revenue Refunding Bonds, O’Hare International Airport, Series 1999, 5.500%, 1/01/15 – AMBAC Insured (Alternative Minimum Tax) | 7/11 at 100.50 | AA– | 9,573,720 | ||||
| 1,775 | Chicago, Illinois, Third Lien General Airport Revenue Bonds, O’Hare International Airport, Series 2005A, 5.250%, 1/01/24 – NPFG Insured | 1/16 at 100.00 | A1 | 1,830,788 | ||||
| 13,275 | Illinois, General Obligation Bonds, Illinois FIRST Program, Series 2001, 5.250%, 5/01/26 – AGM Insured | 7/11 at 100.00 | AA+ | 13,274,469 | ||||
| 15,785 | Illinois, General Obligation Bonds, Illinois FIRST Program, Series 2002, 5.250%, 4/01/27 – AGM Insured | 4/12 at 100.00 | AA+ | 15,767,479 | ||||
| 5,000 | Metropolitan Pier and Exposition Authority, Illinois, Revenue Bonds, McCormick Place Expansion Project, Capital Appreciation Refunding Series 2010B-1, 0.000%, 6/15/45 – AGM Insured | No Opt. Call | AAA | 502,000 |
| 22 | Nuveen Investments |
| Principal | Optional Call | |||||||
| Amount (000) | Description (1) | Provisions (2) | Ratings (3) | Value | ||||
Illinois (continued) | ||||||||
| $ | 18,000 | Metropolitan Pier and Exposition Authority, Illinois, Revenue Bonds, McCormick Place Expansion Project, Series 2002A, 0.000%, 12/15/24 – NPFG Insured | No Opt. Call | AAA | $ | 8,369,460 | ||
| 10,000 | University of Illinois, Certificates of Participation, Utility Infrastructure Projects, Series 2001B, 5.250%, 8/15/21 (Pre-refunded 8/15/11) – AMBAC Insured | 8/11 at 100.00 | Aa2 (4) | 10,143,900 | ||||
| 73,335 | Total Illinois | 59,461,816 | ||||||
| Indiana – 2.2% (1.4% of Total Investments) | ||||||||
| 3,680 | Indiana Municipal Power Agency, Power Supply Revenue Bonds, Series 2007A, 5.000%, 1/01/42 – NPFG Insured | 1/17 at 100.00 | A+ | 3,423,946 | ||||
| 6,905 | Indiana Transportation Finance Authority, Highway Revenue Bonds, Series 1990A, 7.250%, 6/01/15 – AMBAC Insured | No Opt. Call | AA+ | 7,700,180 | ||||
| 10,585 | Total Indiana | 11,124,126 | ||||||
| Kansas – 1.5% (0.9% of Total Investments) | ||||||||
| 5,500 | Kansas Development Finance Authority, Revenue Bonds, Sisters of Charity of Leavenworth Health Services Corporation, Series 2010A, 5.000%, 1/01/40 | No Opt. Call | AA | 5,289,075 | ||||
| 2,000 | Wichita, Kansas, Water and Sewerage Utility Revenue Bonds, Series 2003, 5.000%, 10/01/21 – FGIC Insured | 10/13 at 100.00 | Aa2 | 2,079,940 | ||||
| 7,500 | Total Kansas | 7,369,015 | ||||||
| Kentucky – 6.3% (4.0% of Total Investments) | ||||||||
| 3,015 | Kentucky Asset/Liability Commission, General Fund Revenue Project Notes, First Series 2005, 5.000%, 5/01/25 – NPFG Insured | 5/15 at 100.00 | Aa3 | 3,094,355 | ||||
| Kentucky Economic Development Finance Authority, Health System Revenue Bonds, Norton Healthcare Inc., Series 2000C: | ||||||||
| 2,530 | 6.150%, 10/01/27 – NPFG Insured | 10/13 at 101.00 | Baa1 | 2,572,656 | ||||
| 12,060 | 6.150%, 10/01/28 – NPFG Insured | 10/13 at 101.00 | Baa1 | 12,252,116 | ||||
| Kentucky Economic Development Finance Authority, Health System Revenue Bonds, Norton Healthcare Inc., Series 2000C: | ||||||||
| 3,815 | 6.150%, 10/01/27 (Pre-refunded 10/01/13) – NPFG Insured | 10/13 at 101.00 | BBB (4) | 4,345,514 | ||||
| 6,125 | 6.150%, 10/01/28 (Pre-refunded 10/01/13) – NPFG Insured | 10/13 at 101.00 | BBB (4) | 6,976,743 | ||||
| 2,230 | Kentucky State Property and Buildings Commission, Revenue Bonds, Project 85, Series 2005, 5.000%, 8/01/23 (Pre-refunded 8/01/15) – AGM Insured | 8/15 at 100.00 | AA+ (4) | 2,584,325 | ||||
| 29,775 | Total Kentucky | 31,825,709 | ||||||
| Louisiana – 3.8% (2.4% of Total Investments) | ||||||||
| Louisiana State, Gasoline and Fuels Tax Revenue Bonds, Series 2006A: | ||||||||
| 11,325 | 4.750%, 5/01/39 - AGM Insured (UB) | 5/16 at 100.00 | AA+ | 10,942,102 | ||||
| 8,940 | 4.500%, 5/01/41 - FGIC Insured (UB) | 5/16 at 100.00 | Aa1 | 8,177,865 | ||||
| 10 | Louisiana State, Gasoline and Fuels Tax Revenue Bonds, Series 2006, Residuals 660-1, 15.745%, 5/01/34 - FGIC Insured (IF) | 5/16 at 100.00 | Aa1 | 6,590 | ||||
| 5 | Louisiana State, Gasoline and Fuels Tax Revenue Bonds, Series 2006, Residuals 660-1, 16.646%, 5/01/34 - FGIC Insured (IF) | 5/16 at 100.00 | Aa1 | 3,299 | ||||
| 20,280 | Total Louisiana | 19,129,856 | ||||||
| Maine – 0.1% (0.1% of Total Investments) | ||||||||
| 555 | Maine Health and Higher Educational Facilities Authority, Revenue Bonds, Series 1999B, 6.000%, 7/01/29 – NPFG Insured | 7/11 at 100.00 | Aaa | 558,341 | ||||
| Maryland – 1.8% (1.2% of Total Investments) | ||||||||
| 2,030 | Maryland Health and Higher Educational Facilities Authority, Revenue Bonds, Western Maryland Health, Series 2006A, 4.750%, 7/01/36 – NPFG Insured | 7/16 at 100.00 | Baa1 | 1,819,854 | ||||
| 7,335 | Maryland Transportation Authority, Airport Parking Revenue Bonds, Baltimore-Washington International Airport Passenger Facility, Series 2002B, 5.500%, 3/01/18 – AMBAC Insured (Alternative Minimum Tax) | 3/12 at 101.00 | A2 | 7,523,069 | ||||
| 9,365 | Total Maryland | 9,342,923 |
| Nuveen Investments | 23 |
Nuveen Insured Quality Municipal Fund, Inc. (continued) | ||
| NQI | Portfolio of Investments |
April 30, 2011 (Unaudited)
| Principal | Optional Call | |||||||
| Amount (000) | Description (1) | Provisions (2) | Ratings (3) | Value | ||||
| Massachusetts – 4.6% (3.0% of Total Investments) | ||||||||
| $ | 5,000 | Massachusetts Bay Transportation Authority, Sales Tax Revenue Bonds, Senior Lien Series 2002A, 5.000%, 7/01/27 (Pre-refunded 7/01/12) – FGIC Insured | 7/12 at 100.00 | AAA | $ | 5,270,800 | ||
| 4,000 | Massachusetts Department of Transportation, Metropolitan Highway System Revenue Bonds, Commonwealth Contract Assistance Secured, Refunding Series 2010B, 5.000%, 1/01/35 | 1/20 at 100.00 | AA | 4,060,200 | ||||
| 3,335 | Massachusetts Health and Educational Facilities Authority, Revenue Bonds, Massachusetts Institute of Technology, Tender Option Bond Trust 11824, 13.425%, 1/01/16 (IF) | No Opt. Call | AAA | 3,539,069 | ||||
| Massachusetts State, Special Obligation Dedicated Tax Revenue Bonds, Series 2004: | ||||||||
| 1,250 | 5.250%, 1/01/21 (Pre-refunded 1/01/14) – FGIC Insured | 1/14 at 100.00 | A1 (4) | 1,391,300 | ||||
| 1,000 | 5.250%, 1/01/22 (Pre-refunded 1/01/14) – FGIC Insured | 1/14 at 100.00 | A1 (4) | 1,113,040 | ||||
| 1,195 | 5.250%, 1/01/23 (Pre-refunded 1/01/14) – FGIC Insured | 1/14 at 100.00 | A1 (4) | 1,330,083 | ||||
| 2,000 | 5.250%, 1/01/24 (Pre-refunded 1/01/14) – FGIC Insured | 1/14 at 100.00 | A1 (4) | 2,226,080 | ||||
| 3,465 | Massachusetts Water Resources Authority, General Revenue Bonds, Series 2007A, 4.500%, 8/01/46 – AGM Insured (UB) (5) | 2/17 at 100.00 | AA+ | 3,166,733 | ||||
| 1,245 | Springfield Water and Sewerage Commission, Massachusetts, General Revenue Bonds, Refunding Series 2010B, 5.000%, 11/15/30 – AGC Insured | No Opt. Call | AA+ | 1,297,265 | ||||
| 22,490 | Total Massachusetts | 23,394,570 | ||||||
| Michigan – 1.3% (0.8% of Total Investments) | ||||||||
| 1,825 | Marysville Public School District, St. Clair County, Michigan, General Obligation Bonds, Series 2007, 5.000%, 5/01/28 – AGM Insured | 5/17 at 100.00 | AA+ | 1,854,784 | ||||
| 4,750 | Michigan Strategic Fund, Collateralized Limited Obligation Pollution Control Revenue Refunding Bonds, Detroit Edison Company, Series 1999A, 5.550%, 9/01/29 – NPFG Insured (Alternative Minimum Tax) | 9/11 at 100.00 | A | 4,751,045 | ||||
| 6,575 | Total Michigan | 6,605,829 | ||||||
| Minnesota – 0.2% (0.1% of Total Investments) | ||||||||
| 1,000 | Minneapolis-Saint Paul Housing and Redevelopment Authority, Minnesota, Health Care Revenue Bonds, Children’s Health Care, Series 2004A-1 Remarketed, 4.625%, 8/15/29 – AGM Insured | 8/20 at 100.00 | AA+ | 979,380 | ||||
| Mississippi – 2.3% (1.5% of Total Investments) | ||||||||
| 2,715 | Harrison County Wastewater Management District, Mississippi, Revenue Refunding Bonds, Wastewater Treatment Facilities, Series 1991B, 7.750%, 2/01/14 – FGIC Insured (ETM) | No Opt. Call | BBB (4) | 3,222,026 | ||||
| 2,545 | Harrison County Wastewater Management District, Mississippi, Wastewater Treatment Facilities Revenue Refunding Bonds, Series 1991A, 8.500%, 2/01/13 – FGIC Insured (ETM) | No Opt. Call | N/R (4) | 2,775,984 | ||||
| 5,445 | Mississippi Development Bank, Special Obligation Bonds, Gulfport Water and Sewer System Project, Series 2005, 5.250%, 7/01/24 – AGM Insured | No Opt. Call | AA+ | 5,764,839 | ||||
| 10,705 | Total Mississippi | 11,762,849 | ||||||
| Nebraska – 2.3% (1.4% of Total Investments) | ||||||||
| 12,155 | Lincoln, Nebraska, Electric System Revenue Bonds, Series 2007A, 4.500%, 9/01/37 – FGIC Insured (UB) | 9/17 at 100.00 | AA | 11,374,406 | ||||
| Nevada – 2.6% (1.6% of Total Investments) | ||||||||
| 27,700 | Director of Nevada State Department of Business and Industry, Revenue Bonds, Las Vegas Monorail Project, First Tier, Series 2000, 5.375%, 1/01/40 – AMBAC Insured (6) | 7/11 at 100.00 | N/R | 6,946,606 | ||||
| 5,720 | Reno, Nevada, Senior Lien Sales and Room Tax Revenue Bonds, Reno Transportation Rail Access Corridor Project, Series 2002, 5.125%, 6/01/32 (Pre-refunded 6/01/12) – AMBAC Insured | 6/12 at 100.00 | N/R (4) | 6,015,324 | ||||
| 33,420 | Total Nevada | 12,961,930 |
| 24 | Nuveen Investments |
| Principal | Optional Call | |||||||
| Amount (000) | Description (1) | Provisions (2) | Ratings (3) | Value | ||||
| New Jersey – 3.8% (2.5% of Total Investments) | ||||||||
| New Jersey Economic Development Authority, Revenue Bonds, Motor Vehicle Surcharge, Series 2004A: | ||||||||
| $ | 1,700 | 5.000%, 7/01/22 – NPFG Insured | 7/14 at 100.00 | A | $ | 1,727,030 | ||
| 1,700 | 5.000%, 7/01/23 – NPFG Insured | 7/14 at 100.00 | A | 1,718,496 | ||||
| 7,000 | New Jersey Transportation Trust Fund Authority, Transportation System Bonds, Series 2010D, 5.000%, 12/15/23 | No Opt. Call | A+ | 7,220,850 | ||||
| 6,000 | New Jersey Turnpike Authority, Revenue Bonds, Refunding Series 2005D-1, 5.250%, 1/01/26 – AGM Insured | No Opt. Call | AA+ | 6,546,660 | ||||
| 2,100 | New Jersey Turnpike Authority, Revenue Bonds, Series 2003A, 5.000%, 1/01/19 – FGIC Insured | 7/13 at 100.00 | A+ | 2,225,139 | ||||
| 18,500 | Total New Jersey | 19,438,175 | ||||||
| New Mexico – 1.3% (0.8% of Total Investments) | ||||||||
| New Mexico Finance Authority, Public Project Revolving Fund Revenue Bonds, Series 2004C: | ||||||||
| 1,345 | 5.000%, 6/01/22 – AMBAC Insured | 6/14 at 100.00 | AAA | 1,453,905 | ||||
| 3,290 | 5.000%, 6/01/23 – AMBAC Insured | 6/14 at 100.00 | AAA | 3,527,505 | ||||
| 1,330 | New Mexico State University, Revenue Bonds, Series 2004, 5.000%, | 4/14 at 100.00 | AA | 1,376,869 | ||||
| 4/01/23 – AMBAC Insured | ||||||||
| 5,965 | Total New Mexico | 6,358,279 | ||||||
| New York – 12.1% (7.7% of Total Investments) | ||||||||
| 10,000 | Dormitory Authority of the State of New York, Revenue Bonds, Columbia University, Series 2011A, 5.000%, 10/01/41 | 4/21 at 100.00 | AAA | 10,343,600 | ||||
| 15,000 | Dormitory Authority of the State of New York, Revenue Bonds, School Districts Financing Program, Series 2002D, 5.500%, 10/01/17 – NPFG Insured | 10/12 at 100.00 | A+ | 15,775,050 | ||||
| 4,080 | Hudson Yards Infrastructure Corporation, New York, Revenue Bonds, Series 2006A, 4.500%, 2/15/47 – NPFG Insured | 2/17 at 100.00 | A | 3,105,043 | ||||
| 2,890 | Long Island Power Authority, New York, Electric System General Revenue Bonds, Series 2006A, 5.000%, 12/01/25 – FGIC Insured | 6/16 at 100.00 | A– | 2,986,815 | ||||
| 3,300 | Long Island Power Authority, New York, Electric System Revenue Bonds, Series 2006F, 4.250%, 5/01/33 – NPFG Insured | 11/16 at 100.00 | A– | 2,965,446 | ||||
| 7,800 | Metropolitan Transportation Authority, New York, State Service Contract Refunding Bonds, Series 2002A, 5.000%, 7/01/25 – FGIC Insured | 7/12 at 100.00 | AA– | 7,828,548 | ||||
| 1,290 | Monroe County Industrial Development Corporation, New York, FHA Insured Mortgage Revenue Bonds, Unity Hospital of Rochestor Project, Series 2010, 5.500%, 8/15/40 | 2/21 at 100.00 | Aa2 | 1,297,740 | ||||
| 1,740 | New York Convention Center Development Corporation, Hotel Unit Fee Revenue Bonds, Series 2005, 17.016%, 11/15/44 – AMBAC Insured (IF) | 11/15 at 100.00 | AA+ | 1,758,026 | ||||
| 595 | New York State Housing Finance Agency, Mortgage Revenue Refunding Bonds, Housing Project, Series 1996A, 6.125%, 11/01/20 – AGM Insured | 11/11 at 100.00 | AA+ | 595,672 | ||||
| 4,200 | New York State Mortgage Agency, Homeowner Mortgage Revenue Bonds, Series 82, 5.550%, 10/01/19 – NPFG Insured (Alternative Minimum Tax) | 10/11 at 100.00 | Aa1 | 4,203,696 | ||||
| New York State Urban Development Corporation, Service Contract Revenue Bonds, Series 2005B: | ||||||||
| 2,460 | 5.000%, 3/15/24 – AGM Insured (UB) | 3/15 at 100.00 | AAA | 2,618,990 | ||||
| 2,465 | 5.000%, 3/15/25 – AGM Insured (UB) | 3/15 at 100.00 | AAA | 2,601,660 | ||||
| 5,000 | Triborough Bridge and Tunnel Authority, New York, Subordinate Lien General Purpose Revenue Bonds, Series 2003A, 5.000%, 11/15/32 – FGIC Insured | 11/13 at 100.00 | Aa3 | 5,025,350 | ||||
| 60,820 | Total New York | 61,105,636 | ||||||
| Ohio – 3.6% (2.3% of Total Investments) | ||||||||
| 7,000 | Cleveland State University, Ohio, General Receipts Bonds, Series 2004, 5.250%, 6/01/19 – FGIC Insured | 6/14 at 100.00 | A+ | 7,427,350 | ||||
| 9,045 | Hamilton County, Ohio, Sales Tax Bonds, Subordinate Lien, Series 2006, 4.250%, 12/01/32 – AMBAC Insured | 12/16 at 100.00 | A1 | 7,821,483 |
| Nuveen Investments | 25 |
Nuveen Insured Quality Municipal Fund, Inc. (continued) | ||
| NQI | Portfolio of Investments |
April 30, 2011 (Unaudited)
| Principal | Optional Call | |||||||
| Amount (000) | Description (1) | Provisions (2) | Ratings (3) | Value | ||||
Ohio (continued) | ||||||||
| $ | 3,065 | Oak Hills Local School District, Hamilton County, Ohio, General Obligation Bonds, Refunding Series 2005, 5.000%, 12/01/24 – AGM Insured | 12/15 at 100.00 | AA+ | $ | 3,197,960 | ||
| 19,110 | Total Ohio | 18,446,793 | ||||||
| Pennsylvania – 6.3% (4.0% of Total Investments) | ||||||||
| 3,000 | Allegheny County Sanitary Authority, Pennsylvania, Sewerage Revenue Bonds, Series 2005A, 5.000%, 12/01/23 – NPFG Insured | 12/15 at 100.00 | A1 | 3,103,800 | ||||
| 1,165 | Allegheny County Sanitary Authority, Pennsylvania, Sewerage Revenue Bonds, Series 2010, 5.000%, 6/01/40 – AGM Insured | No Opt. Call | AA+ | 1,149,121 | ||||
| 6,000 | Chester County Health and Educational Facilities Authority, Pennsylvania, Health System Revenue Bonds, Jefferson Health System, Series 2010A, 5.000%, 5/15/40 | 5/20 at 100.00 | AA | 5,518,380 | ||||
| 1,600 | Delaware County Authority, Pennsylvania, Revenue Bonds, Villanova University, Series 2006, 5.000%, 8/01/24 – AMBAC Insured | 8/16 at 100.00 | A+ | 1,667,280 | ||||
| 2,450 | Delaware River Port Authority, New Jersey and Pennsylvania, Revenue Bonds, Series 2010E, 5.000%, 1/01/40 – AGM Insured | 1/20 at 100.00 | AA+ | 2,420,404 | ||||
| 735 | Montgomery County Industrial Development Authority, Pennsylvania, FHA Insured Mortgage Revenue Bonds, New Regional Medical Center Project, Series 2010, 5.375%, 8/01/38 | 8/20 at 100.00 | AA | 739,461 | ||||
| 5,400 | Pennsylvania Public School Building Authority, Lease Revenue Bonds, School District of Philadelphia, Series 2006B, 4.500%, 6/01/32 – AGM Insured (UB) | 12/16 at 100.00 | AA+ | 5,070,438 | ||||
| 7,850 | Philadelphia, Pennsylvania, Airport Revenue Bonds, Series 2010A, 5.000%, 6/15/40 – AGM Insured | 6/20 at 100.00 | AA+ | 7,626,746 | ||||
| 2,500 | Pittsburgh and Allegheny County Sports and Exhibition Authority, Pennsylvania, Hotel Room Excise Tax Revenue Bonds, Refunding Series 2010, 5.000%, 2/01/35 – AGC Insured | 8/20 at 100.00 | AA+ | 2,382,900 | ||||
| 2,000 | Pittsburgh Public Parking Authority, Pennsylvania, Parking Revenue Bonds, Series 2005B, 5.000%, 12/01/23 – FGIC Insured | 12/15 at 100.00 | BBB | 1,998,420 | ||||
| 32,700 | Total Pennsylvania | 31,676,950 | ||||||
| Puerto Rico – 2.2% (1.4% of Total Investments) | ||||||||
| 2,500 | Puerto Rico Electric Power Authority, Power Revenue Bonds, Series 2005RR, 5.000%, 7/01/22 – FGIC Insured | 7/15 at 100.00 | A3 | 2,519,475 | ||||
| 25,000 | Puerto Rico Sales Tax Financing Corporation, Sales Tax Revenue Bonds, Series 2007A, 0.000%, 8/01/42 – NPFG Insured | No Opt. Call | Aa2 | 3,146,750 | ||||
| 5,000 | Puerto Rico, Highway Revenue Bonds, Highway and Transportation Authority, Series 2003AA, 5.500%, 7/01/16 – FGIC Insured | No Opt. Call | A2 | 5,393,000 | ||||
| 32,500 | Total Puerto Rico | 11,059,225 | ||||||
| South Carolina – 2.3% (1.5% of Total Investments) | ||||||||
| 2,425 | Charleston County School District, South Carolina, General Obligation Bonds, Series 2004A, 5.000%, 2/01/22 – AMBAC Insured | 2/14 at 100.00 | Aa1 | 2,578,236 | ||||
| 9,950 | South Carolina Transportation Infrastructure Bank, Revenue Bonds, Series 2007A, 4.500%, 10/01/34 – SYNCORA GTY Insured | 10/16 at 100.00 | A1 | 9,025,148 | ||||
| 12,375 | Total South Carolina | 11,603,384 | ||||||
| Tennessee – 1.4% (0.9% of Total Investments) | ||||||||
| Knox County Health, Educational and Housing Facilities Board, Tennessee, Hospital Revenue Refunding Bonds, Covenant Health, Series 2002A: | ||||||||
| 7,500 | 0.000%, 1/01/24 – AGM Insured | 1/13 at 52.75 | AA+ | 3,643,800 | ||||
| 5,000 | 0.000%, 1/01/25 – AGM Insured | 1/13 at 49.71 | AA+ | 2,284,100 | ||||
| 2,750 | 0.000%, 1/01/26 – AGM Insured | 1/13 at 46.78 | AA+ | 1,179,310 | ||||
| 15,250 | Total Tennessee | 7,107,210 |
| 26 | Nuveen Investments |
| Principal | Optional Call | |||||||
| Amount (000) | Description (1) | Provisions (2) | Ratings (3) | Value | ||||
| Texas – 17.0% (10.9% of Total Investments) | ||||||||
| $ | 2,280 | Bexar County, Texas, Venue Project Revenue Bonds, Refunding Series 2010, 5.500%, 8/15/49 – AGM Insured | 8/19 at 100.00 | AA+ | $ | 2,284,309 | ||
| 3,135 | Corpus Christi, Texas, Utility System Revenue Bonds, Series 2004, 5.250%, 7/15/20 – AGM Insured (UB) | 7/14 at 100.00 | AA+ | 3,395,080 | ||||
| 3,000 | Dallas-Ft. Worth International Airport, Texas, Joint Revenue Refunding and Improvement Bonds, Series 2001A, 5.750%, 11/01/13 – NPFG Insured (Alternative Minimum Tax) | 11/11 at 100.00 | A+ | 3,072,000 | ||||
| 3,735 | Grand Prairie Independent School District, Dallas County, Texas, General Obligation Bonds, Series 2003, 5.125%, 2/15/31 (Pre-refunded 2/15/13) – AGM Insured | 2/13 at 100.00 | AA+ (4) | 4,036,863 | ||||
| 4,700 | Houston, Texas, First Lien Combined Utility System Revenue Bonds, Series 2004A, 5.250%, 5/15/24 – FGIC Insured | 5/14 at 100.00 | AA | 5,025,099 | ||||
| 17,000 | Houston, Texas, Junior Lien Water and Sewerage System Revenue Refunding Bonds, Series 2002A, 5.750%, 12/01/32 – AGM Insured (ETM) | No Opt. Call | AA+ (4) | 20,110,830 | ||||
| 4,685 | Houston, Texas, Subordinate Lien Airport System Revenue Bonds, Series 2000A, 5.500%, 7/01/19 – AGM Insured (Alternative Minimum Tax) | 7/11 at 100.00 | AA+ | 4,697,322 | ||||
| 19,200 | Jefferson County Health Facilities Development Corporation, Texas, FHA-Insured Mortgage Revenue Bonds, Baptist Hospital of Southeast Texas, Series 2001, 5.400%, 8/15/31 (Pre-refunded 8/15/11) – AMBAC Insured | 8/11 at 100.00 | N/R (4) | 19,460,928 | ||||
| 2,000 | Laredo Independent School District Public Facilities Corporation, Texas, Lease Revenue Bonds, Series 2004A, 5.000%, 8/01/24 – AMBAC Insured | 8/11 at 100.00 | A | 2,003,060 | ||||
| 22,045 | North Central Texas Health Facilities Development Corporation, Revenue Bonds, Children’s Medical Center of Dallas, Series 2002, 5.250%, 8/15/32 – AMBAC Insured | 8/12 at 101.00 | Aa3 | 21,847,917 | ||||
| 81,780 | Total Texas | 85,933,408 | ||||||
| Utah – 0.7% (0.5% of Total Investments) | ||||||||
| 3,615 | Utah Transit Authority, Sales Tax Revenue Bonds, Tender Option Bond Trust R-11752-1, 12.604%, 6/15/27 – AGM Insured (IF) | 6/18 at 100.00 | AAA | 3,702,519 | ||||
| Washington – 11.8% (7.5% of Total Investments) | ||||||||
| 10,730 | Chelan County Public Utility District 1, Washington, Hydro Consolidated System Revenue Refunding Bonds, Series 2001C, 5.650%, 7/01/32 – NPFG Insured (Alternative Minimum Tax) (UB) | 7/11 at 101.00 | AA | 10,754,894 | ||||
| 8,000 | King County, Washington, Sewer Revenue Bonds, Series 2007, 5.000%, 1/01/42 – AGM Insured | 7/17 at 100.00 | AA+ | 8,001,520 | ||||
| 1,665 | King County, Washington, Sewer Revenue Bonds, Tender Option Bond Trust 3090, 13.326%, 7/01/32 – AGM Insured (IF) | 7/17 at 100.00 | AA+ | 1,671,244 | ||||
| 14,960 | Seattle Housing Authority, Washington, GNMA Collateralized Mortgage Loan Low Income Housing Assistance Revenue Bonds, Park Place Project, Series 2000A, 7.000%, 5/20/42 | 11/11 at 105.00 | AA+ | 15,394,588 | ||||
| 4,430 | Seattle Housing Authority, Washington, GNMA Collateralized Mortgage Loan Low Income Housing Assistance Revenue Bonds, RHF/Esperanza Apartments Project, Series 2000A, 6.125%, 3/20/42 (Alternative Minimum Tax) | 9/11 at 102.00 | AA+ | 4,487,989 | ||||
| 10,000 | Washington State, General Obligation Bonds, Series 2002A-R-03, 5.000%, 1/01/19 – NPFG Insured | 1/12 at 100.00 | AA+ | 10,252,100 | ||||
| 21,510 | Washington State, Motor Vehicle Fuel Tax General Obligation Bonds, Series 2002-03C, 0.000%, 6/01/28 – NPFG Insured (UB) | No Opt. Call | AA+ | 9,148,418 | ||||
| 71,295 | Total Washington | 59,710,753 |
| Nuveen Investments | 27 |
Nuveen Insured Quality Municipal Fund, Inc. (continued) | ||
| NQI | Portfolio of Investments |
April 30, 2011 (Unaudited)
| Principal | Optional Call | |||||||
| Amount (000) | Description (1) | Provisions (2) | Ratings (3) | Value | ||||
| Wisconsin – 0.6% (0.4% of Total Investments) | ||||||||
| $ | 1,635 | Green Bay, Wisconsin, Water System Revenue Bonds, Series 2004, 5.000%, 11/01/26 (Pre-refunded 11/01/14) – AGM Insured | 11/14 at 100.00 | Aa2 (4) | $ | 1,868,919 | ||
| 1,000 | Wisconsin Public Power Incorporated System, Power Supply System Revenue Bonds, Series 2005A, 5.000%, 7/01/30 – AMBAC Insured | 7/15 at 100.00 | A+ | 1,003,662 | ||||
| 2,635 | Total Wisconsin | 2,872,581 | ||||||
| $ | 964,098 | Total Investments (cost $821,208,674) – 156.5% | 791,035,015 | |||||
| Floating Rate Obligations – (11.8)% | (59,540,000 | ) | ||||||
| Variable MuniFund Term Preferred Shares, at Liquidation Value – (47.6)% (7) | (240,400,000 | ) | ||||||
| Other Assets Less Liabilities – 2.9% | 14,439,548 | |||||||
| Net Assets Applicable to Common Shares – 100% | $ | 505,534,563 |
| The Fund intends to invest at least 80% of its managed assets in municipal securities that are covered by insurance guaranteeing the timely payment of principal and interest. See Notes to Financial Statements, Footnote 1 – General Information and Significant Accounting Policies, Insurance for more information. | ||
| (1) | All percentages shown in the Portfolio of Investments are based on net assets applicable to Common shares unless otherwise noted. | |
| (2) | Optional Call Provisions: Dates (month and year) and prices of the earliest optional call or redemption. There may be other call provisions at varying prices at later dates. Certain mortgage-backed securities may be subject to periodic principal paydowns. | |
| (3) | Ratings: Using the highest of Standard & Poor’s Group (“Standard & Poor’s”), Moody’s Investor Service, Inc. (“Moody’s”) or Fitch, Inc. (“Fitch”) rating. Ratings below BBB by Standard & Poor’s, Baa by Moody’s or BBB by Fitch are considered to be below investment grade. Holdings designated N/R are not rated by any of these national rating agencies. | |
| (4) | Backed by an escrow or trust containing sufficient U.S. Government or U.S. Government agency securities, which ensure the timely payment of principal and interest. Such investments are normally considered to be equivalent to AAA rated securities. | |
| (5) | Investment, or portion of investment, has been pledged to collateralize the net payment obligations for investments in inverse floating rate transactions. | |
| (6) | At or subsequent to the end of the reporting period, this security is non-income producing. Non-income producing security, in the case of a bond, generally denotes that the issuer has (1) defaulted on the payment of principal or interest, (2) is under the protection of the Federal Bankruptcy Court or (3) the Fund’s Adviser has concluded that the issue is not likely to meet its future interest payment obligations and has directed the Fund’s custodian to cease accruing additional income on the Fund’s records. | |
| (7) | Variable MuniFund Term Preferred Shares, at Liquidation Value as a percentage of Total Investments is 30.4%. | |
| N/R | Not rated. | |
| WI/DD | Purchased on a when-issued or delayed delivery basis. | |
| (ETM) | Escrowed to maturity. | |
| (IF) | Inverse floating rate investment. | |
| (UB) | Underlying bond of an inverse floating rate trust reflected as a financing transaction. See Notes to Financial Statements, Footnote 1 – General Information and Significant Accounting Policies, Inverse Floating Rate Securities for more information. |
See accompanying notes to financial statements.
| 28 | Nuveen Investments |
| Nuveen Insured Municipal Opportunity Fund, Inc. | ||
| NIO | Portfolio of Investments |
April 30, 2011 (Unaudited)
| Principal | Optional Call | |||||||
| Amount (000) | Description (1) | Provisions (2) | Ratings (3) | Value | ||||
| Alabama – 2.6% (1.7% of Total Investments) | ||||||||
| $ | 10,500 | Birmingham Waterworks and Sewerage Board, Alabama, Water and Sewerage Revenue Bonds, Series 2007A, 4.500%, 1/01/43 – BHAC Insured | 1/17 at 100.00 | AA+ | $ | 9,180,465 | ||
| 2,500 | Jefferson County, Alabama, Sewer Revenue Capital Improvement Warrants, Series 2002B, 5.125%, 2/01/42 (Pre-refunded 8/01/12) – FGIC Insured | 8/12 at 100.00 | AAA | 2,642,275 | ||||
| Jefferson County, Alabama, Sewer Revenue Capital Improvement Warrants, Series 2002D: | ||||||||
| 425 | 5.000%, 2/01/38 (Pre-refunded 8/01/12) – FGIC Insured | 8/12 at 100.00 | AAA | 447,419 | ||||
| 14,800 | 5.000%, 2/01/42 (Pre-refunded 8/01/12) – FGIC Insured | 8/12 at 100.00 | AAA | 15,619,180 | ||||
| 10,195 | Jefferson County, Alabama, Sewer Revenue Refunding Warrants, Series 1997A, 5.375%, 2/01/27 – FGIC Insured | 7/11 at 100.00 | Caa3 | 6,246,171 | ||||
| 38,420 | Total Alabama | 34,135,510 | ||||||
| Arizona – 2.1% (1.3% of Total Investments) | ||||||||
| Arizona State University, Certificates of Participation, Resh Infrastructure Projects, Series 2005A: | ||||||||
| 2,000 | 5.000%, 9/01/25 – AMBAC Insured | 3/15 at 100.00 | AA– | 2,034,080 | ||||
| 2,000 | 5.000%, 9/01/27 – AMBAC Insured | 3/15 at 100.00 | AA– | 2,020,720 | ||||
| 1,000 | Arizona State University, System Revenue Bonds, Series 2005, 5.000%, 7/01/27 – AMBAC Insured | 7/15 at 100.00 | Aa3 | 1,008,920 | ||||
| 3,000 | Arizona State, Certificates of Participation, Department of Administration Series 2010B, 5.000%, 10/01/29 – AGC Insured | 4/20 at 100.00 | AA+ | 3,020,280 | ||||
| 1,000 | Maricopa County Union High School District 210, Phoenix, Arizona, General Obligation Bonds, Series 2004A, 5.000%, 7/01/22 (Pre-refunded 7/01/14) – AGM Insured | 7/14 at 100.00 | AA+ (4) | 1,132,470 | ||||
| 5,200 | Mesa, Arizona, Utility System Revenue Bonds, Reset Option Longs, Series 11032, 14.835%, 7/01/26 – AGM Insured (IF) | 7/17 at 100.00 | AA+ | 3,035,760 | ||||
| 1,150 | Phoenix Civic Improvement Corporation, Arizona, Junior Lien Wastewater System Revenue Bonds, Series 2004, 5.000%, 7/01/27 – NPFG Insured | 7/14 at 100.00 | AA+ | 1,172,023 | ||||
| 13,490 | Phoenix Civic Improvement Corporation, Arizona, Junior Lien Water System Revenue Bonds, Series 2005, 4.750%, 7/01/25 – NPFG Insured | 7/15 at 100.00 | AAA | 13,799,056 | ||||
| 28,840 | Total Arizona | 27,223,309 | ||||||
| Arkansas – 0.2% (0.1% of Total Investments) | ||||||||
| 2,660 | Arkansas State University, Student Fee Revenue Bonds, Beebe Campus, Series 2006, 5.000%, 9/01/35 – AMBAC Insured | 9/15 at 100.00 | A1 | 2,648,695 | ||||
| California – 24.8% (16.0% of Total Investments) | ||||||||
| 5,600 | Alameda Corridor Transportation Authority, California, Subordinate Lien Revenue Bonds, Series 2004A, 0.000%, 10/01/20 – AMBAC Insured | No Opt. Call | A– | 3,014,312 | ||||
| California Department of Water Resources, Power Supply Revenue Bonds, Series 2002A: | ||||||||
| 30,000 | 5.375%, 5/01/17 (Pre-refunded 5/01/12) – SYNCORA GTY Insured | 5/12 at 101.00 | Aaa | 31,776,899 | ||||
| 20,000 | 5.375%, 5/01/18 (Pre-refunded 5/01/12) – AMBAC Insured | 5/12 at 101.00 | Aaa | 21,184,600 | ||||
| California Department of Water Resources, Water System Revenue Bonds, Central Valley Project, Series 2005AC: | ||||||||
| 30 | 5.000%, 12/01/24 (Pre-refunded 12/01/14) – NPFG Insured | 12/14 at 100.00 | AAA | 34,363 | ||||
| 25 | 5.000%, 12/01/27 (Pre-refunded 12/01/14) – NPFG Insured | 12/14 at 100.00 | AAA | 28,636 | ||||
| California Department of Water Resources, Water System Revenue Bonds, Central Valley Project, Series 2005AC: | ||||||||
| 3,670 | 5.000%, 12/01/24 – NPFG Insured (UB) | 12/14 at 100.00 | AAA | 3,947,819 | ||||
| 2,795 | 5.000%, 12/01/27 – NPFG Insured (UB) | 12/14 at 100.00 | AAA | 2,949,843 | ||||
| 10,150 | California State, General Obligation Bonds, Series 2004, 5.000%, 6/01/31 – AMBAC Insured | 12/14 at 100.00 | A1 | 9,979,074 | ||||
| 3,500 | Coachella Valley Unified School District, Riverside County, California, General Obligation Bonds, Series 2005A, 5.000%, 8/01/26 – FGIC Insured | 8/15 at 100.00 | A1 | 3,501,050 |
| Nuveen Investments | 29 |
Nuveen Insured Municipal Opportunity Fund, Inc. (continued) | ||
| NIO | Portfolio of Investments |
April 30, 2011 (Unaudited)
| Principal | Optional Call | |||||||
| Amount (000) | Description (1) | Provisions (2) | Ratings (3) | Value | ||||
California (continued) | ||||||||
| $ | 20,000 | Cucamonga County Water District, San Bernardino County, California, Certificates of Participation, Water Shares Purchase, Series 2001, 5.125%, 9/01/35 – FGIC Insured | 9/11 at 101.00 | AA– | $ | 18,986,000 | ||
| 5,750 | East Bay Municipal Utility District, Alameda and Contra Costa Counties, California, Water System Subordinated Revenue Bonds, Series 2005A, 5.000%, 6/01/27 – NPFG Insured | 6/15 at 100.00 | AAA | 5,871,153 | ||||
| 10,000 | Golden State Tobacco Securitization Corporation, California, Enhanced Tobacco Settlement Asset-Backed Revenue Bonds, Series 2005A, 5.000%, 6/01/38 – FGIC Insured | 6/15 at 100.00 | A2 | 8,422,700 | ||||
| 1,520 | Hayward Redevelopment Agency, California, Downtown Redevelopment Project Tax Allocation Bonds, Series 2006, 5.000%, 3/01/36 – SYNCORA GTY Insured | 3/16 at 100.00 | A– | 1,210,011 | ||||
| 5,600 | Kern Community College District, California, General Obligation Bonds, Series 2006, 0.000%, 11/01/24 – AGM Insured | No Opt. Call | AA+ | 2,493,624 | ||||
| 5,000 | Long Beach Bond Financing Authority, California, Lease Revenue Refunding Bonds, Long Beach Aquarium of the South Pacific, Series 2001, 5.250%, 11/01/30 – AMBAC Insured | 11/11 at 101.00 | BBB | 4,484,900 | ||||
| 2,740 | Los Angeles Harbors Department, California, Revenue Bonds, Series 2006A, 5.000%, 8/01/22 – FGIC Insured (Alternative Minimum Tax) | 8/16 at 102.00 | AA | 2,828,612 | ||||
| 20,000 | Los Angeles Unified School District, California, General Obligation Bonds, Series 2003A, 5.000%, 7/01/21 – AGM Insured | 7/13 at 100.00 | AA+ | 21,180,800 | ||||
| 3,000 | Los Angeles Unified School District, California, General Obligation Bonds, Series 2006F, 5.000%, 7/01/24 – FGIC Insured | 7/16 at 100.00 | Aa2 | 3,112,620 | ||||
| 5,200 | Palomar Pomerado Health, California, General Obligation Bonds, Series 2009A, 0.000%, 8/01/38 – AGC Insured | 8/29 at 100.00 | AA+ | 3,202,680 | ||||
| 5,515 | Port of Oakland, California, Revenue Bonds, Series 2002L, 5.000%, | 11/12 at 100.00 | A | 5,429,738 | ||||
| 11/01/22 – FGIC Insured (Alternative Minimum Tax) | ||||||||
| 690 | Port of Oakland, California, Revenue Bonds, Series 2002L, 5.000%, 11/01/22 (Pre-refunded 11/01/12) – FGIC Insured | 11/12 at 100.00 | A (4) | 737,293 | ||||
| Poway Redevelopment Agency, California, Tax Allocation Bonds, Paguay Redevelopment Project, Series 2001: | ||||||||
| 15,000 | 5.200%, 6/15/30 – AMBAC Insured | 12/11 at 101.00 | N/R | 12,779,250 | ||||
| 5,000 | 5.125%, 6/15/33 – AMBAC Insured | 12/11 at 101.00 | N/R | 4,068,000 | ||||
| 2,035 | Redding, California, Electric System Revenue Certificates of Participation, Series 2005, 5.000%, 6/01/30 – FGIC Insured | 6/15 at 100.00 | BBB | 1,678,610 | ||||
| 6,000 | Redlands Unified School District, San Bernardino County, California, General Obligation Bonds, Series 2003, 5.000%, 7/01/26 – AGM Insured | 7/13 at 100.00 | AA+ | 6,040,680 | ||||
| 2,970 | Riverside Community College District, California, General Obligation Bonds, Series 2005, 5.000%, 8/01/22 – AGM Insured | 8/15 at 100.00 | AA+ | 3,154,704 | ||||
| 2,500 | Sacramento County Sanitation District Financing Authority, California, Revenue Bonds, Series 2005B, 4.750%, 12/01/21 – FGIC Insured | 12/15 at 100.00 | AA | 2,610,100 | ||||
| 13,710 | San Francisco Airports Commission, California, Revenue Refunding Bonds, San Francisco International Airport, Second Series 2001, Issue 27A, 5.250%, 5/01/26 – NPFG Insured (Alternative Minimum Tax) | 11/11 at 100.00 | A1 | 13,710,000 | ||||
| 1,220 | San Francisco Bay Area Rapid Transit District, California, Sales Tax Revenue Bonds, Refunding Series 2005A, 5.000%, 7/01/22 – NPFG Insured | 7/15 at 100.00 | AA+ | 1,298,751 | ||||
| 3,030 | San Francisco Bay Area Rapid Transit District, California, Sales Tax Revenue Bonds, Series 2001, 5.125%, 7/01/36 – AMBAC Insured | 7/11 at 100.00 | AA+ | 3,029,849 | ||||
| 8,470 | San Francisco Bay Area Rapid Transit District, California, Sales Tax Revenue Bonds, Series 2001, 5.125%, 7/01/36 (Pre-refunded 7/01/11) – AMBAC Insured | 7/11 at 100.00 | AA+ (4) | 8,539,454 | ||||
| 2,105 | San Francisco Unified School District, California, General Obligation Bonds, Series 2007A, 3.000%, 6/15/27 – AGM Insured | 6/17 at 100.00 | AA+ | 1,672,086 | ||||
| 66,685 | San Joaquin Hills Transportation Corridor Agency, Orange County, California, Senior Lien Toll Road Revenue Bonds, Series 1993, 0.000%, 1/01/21 (ETM) | No Opt. Call | AAA | 48,682,046 |
| 30 | Nuveen Investments |
| Principal | Optional Call | |||||||
| Amount (000) | Description (1) | Provisions (2) | Ratings (3) | Value | ||||
California (continued) | ||||||||
| San Joaquin Hills Transportation Corridor Agency, Orange County, California, Toll Road Revenue Refunding Bonds, Series 1997A: | ||||||||
| $ | 31,615 | 5.250%, 1/15/30 – NPFG Insured | 7/11 at 100.00 | Baa1 | $ | 23,588,900 | ||
| 21,500 | 0.000%, 1/15/32 – NPFG Insured | No Opt. Call | Baa1 | 2,969,795 | ||||
| 21,255 | San Jose Redevelopment Agency, California, Tax Allocation Bonds, Merged Area Redevelopment Project, Series 2006C, 4.250%, 8/01/30 – NPFG Insured | 8/17 at 100.00 | BBB+ | 14,740,768 | ||||
| 11,250 | Santa Ana Financing Authority, California, Lease Revenue Bonds, Police Administration and Housing Facility, Series 1994A, 6.250%, 7/01/24 – NPFG Insured | No Opt. Call | Baa1 | 11,924,888 | ||||
| 6,785 | Santa Clara Valley Water District, California, Water Revenue Bonds, Series 2006A, 3.750%, 6/01/25 – AGM Insured | 6/16 at 100.00 | AA+ | 6,373,693 | ||||
| 5,000 | Walnut Energy Center Authority, California, Electric Revenue Bonds, Turlock Irrigation District, Series 2004A, 5.000%, 1/01/34 – AMBAC Insured | 1/14 at 100.00 | A+ | 4,671,800 | ||||
| 386,915 | Total California | 325,910,101 | ||||||
| Colorado – 3.2% (2.1% of Total Investments) | ||||||||
| 1,080 | Arkansas River Power Authority, Colorado, Power Revenue Bonds, Series 2006, 5.250%, 10/01/40 – SYNCORA GTY Insured | 10/16 at 100.00 | BBB | 888,732 | ||||
| 1,900 | Aspen, Colorado, Sales Tax Revenue Bonds, Parks and Open Space, Series 2005B, 5.250%, 11/01/24 – AGM Insured | 11/15 at 100.00 | AA+ | 2,001,042 | ||||
| 1,000 | Colorado Department of Transportation, Certificates of Participation, Series 2004, 5.000%, 6/15/25 – NPFG Insured | 6/14 at 100.00 | AA– | 1,025,530 | ||||
| 4,950 | Denver Convention Center Hotel Authority, Colorado, Senior Revenue Bonds, Convention Center Hotel, Series 2003A, 5.000%, 12/01/33 (Pre-refunded 12/01/13) – SYNCORA GTY Insured | 12/13 at 100.00 | N/R (4) | 5,447,376 | ||||
| 1,740 | Douglas County School District RE1, Douglas and Elbert Counties, Colorado, General Obligation Bonds, Series 2005B, 5.000%, 12/15/28 – AGM Insured | 12/14 at 100.00 | Aa1 | 1,790,738 | ||||
| 35,995 | E-470 Public Highway Authority, Colorado, Senior Revenue Bonds, Series 1997B, 0.000%, 9/01/23 – NPFG Insured | No Opt. Call | Baa1 | 15,419,178 | ||||
| 10,000 | E-470 Public Highway Authority, Colorado, Toll Revenue Bonds, Series 2004A, 0.000%, 9/01/27 – NPFG Insured | No Opt. Call | Baa1 | 2,937,500 | ||||
| 4,520 | Jefferson County School District R1, Colorado, General Obligation Bonds, Series 2004, 5.000%, 12/15/24 (Pre-refunded 12/15/14) – AGM Insured (UB) | 12/14 at 100.00 | AA+ (4) | 5,161,298 | ||||
| 4,335 | Poudre Tech Metro District, Colorado, Unlimited Property Tax Supported Revenue Bonds, Refunding & Improvement Series 2010A, 5.000%, | 12/20 at 100.00 | AA+ | 4,287,965 | ||||
| 12/01/39 – AGM Insured | ||||||||
| 2,500 | Summit County School District RE-1, Summit, Colorado, General Obligation Bonds, Series 2004B, 5.000%, 12/01/24 – FGIC Insured | 12/14 at 100.00 | Aa2 | 2,607,775 | ||||
| 1,000 | University of Colorado, Enterprise System Revenue Bonds, Series 2005, 5.000%, 6/01/30 – FGIC Insured | 6/15 at 100.00 | Aa2 | 1,014,640 | ||||
| 69,020 | Total Colorado | 42,581,774 | ||||||
| Connecticut – 0.2% (0.2% of Total Investments) | ||||||||
| 3,250 | Connecticut Health and Educational Facilities Authority, Revenue Bonds, Wesleyan University, Series 2010G, 5.000%, 7/01/39 | 7/20 at 100.00 | AA | 3,284,320 | ||||
| District of Columbia – 1.0% (0.6% of Total Investments) | ||||||||
| District of Columbia Water and Sewerage Authority, Subordinate Lien Public Utility Revenue Bonds, Series 2003: | ||||||||
| 5,000 | 5.125%, 10/01/24 – FGIC Insured | 10/13 at 100.00 | AA– | 5,279,550 | ||||
| 5,000 | 5.125%, 10/01/25 – FGIC Insured | 10/13 at 100.00 | AA– | 5,229,500 | ||||
| 2,670 | Washington Convention Center Authority, District of Columbia, Senior Lien Dedicated Tax Revenue Bonds, Series 2007, Residual 1606, 11.376%, 10/01/30 – AMBAC Insured (IF) | 10/16 at 100.00 | AA+ | 2,215,593 | ||||
| 12,670 | Total District of Columbia | 12,724,643 |
| Nuveen Investments | 31 |
Nuveen Insured Municipal Opportunity Fund, Inc. (continued) | ||
| NIO | Portfolio of Investments |
April 30, 2011 (Unaudited)
| Principal | Optional Call | |||||||
| Amount (000) | Description (1) | Provisions (2) | Ratings (3) | Value | ||||
| Florida – 25.9% (16.7% of Total Investments) | ||||||||
| $ | 1,250 | Bay County, Florida, Water System Revenue Bonds, Series 2005, 5.000%, 9/01/24 – AMBAC Insured | 9/15 at 100.00 | A1 | $ | 1,282,388 | ||
| 975 | Broward County Housing Finance Authority, Florida, GNMA Collateralized Multifamily Housing Revenue Refunding Bonds, Pompano Oaks Apartments, Series 1997, 6.000%, 12/01/27 (Alternative Minimum Tax) | 6/11 at 100.00 | Aaa | 975,536 | ||||
| 3,820 | Broward County School Board, Florida, Certificates of Participation, Series 2003, 5.250%, 7/01/19 – NPFG Insured | 7/13 at 100.00 | Aa3 | 4,056,076 | ||||
| 2,150 | Broward County, Florida, Airport System Revenue Bonds, Series 2004L, 5.000%, 10/01/23 – AMBAC Insured | 10/14 at 100.00 | A+ | 2,214,737 | ||||
| 4,500 | Broward County, Florida, Water and Sewer Utility Revenue Bonds, Series 2003, 5.000%, 10/01/24 – NPFG Insured | 10/13 at 100.00 | AA | 4,631,670 | ||||
| Clay County, Florida, Utility System Revenue Bonds, Series 2007: | ||||||||
| 5,110 | 5.000%, 11/01/27 – SYNCORA Insured (UB) | 11/17 at 100.00 | AAA | 5,200,805 | ||||
| 12,585 | 5.000%, 11/01/32 – SYNCORA Insured (UB) | 11/17 at 100.00 | AAA | 12,502,946 | ||||
| Collier County Housing Finance Authority, Florida, Multifamily Housing Revenue Bonds, Saxon Manor Isles Project, Series 1998B: | ||||||||
| 1,260 | 5.350%, 9/01/18 – AGM Insured (Alternative Minimum Tax) | 9/11 at 100.00 | AAA | 1,260,958 | ||||
| 1,000 | 5.400%, 9/01/23 – AGM Insured (Alternative Minimum Tax) Collier County Housing Finance Authority, Florida, Multifamily Housing Revenue Refunding | 9/11 at 100.00 | AAA | 1,000,430 | ||||
| Bonds, Saxon Manor Isles Project, Series 1998A, Subseries 1: | ||||||||
| 1,040 | 5.350%, 9/01/18 – AGM Insured (Alternative Minimum Tax) | 9/11 at 100.00 | AAA | 1,040,790 | ||||
| 1,400 | 5.400%, 9/01/23 – AGM Insured (Alternative Minimum Tax) | 9/11 at 100.00 | AAA | 1,400,602 | ||||
| 1,500 | Collier County, Florida, Capital Improvement Revenue Bonds, Series 2005, 5.000%, 10/01/23 – NPFG Insured | 10/14 at 100.00 | AA– | 1,549,575 | ||||
| 3,000 | Collier County, Florida, Gas Tax Revenue Bonds, Series 2005, 5.000%, 6/01/22 – AMBAC Insured | 6/15 at 100.00 | A1 | 3,091,230 | ||||
| Dade County Housing Finance Authority, Florida, Multifamily Mortgage Revenue Bonds, Siesta Pointe Apartments Project, Series 1997A: | ||||||||
| 1,230 | 5.650%, 9/01/17 – AGM Insured (Alternative Minimum Tax) | 9/11 at 100.00 | AAA | 1,231,341 | ||||
| 1,890 | 5.750%, 9/01/29 – AGM Insured (Alternative Minimum Tax) | 9/11 at 100.00 | AAA | 1,890,302 | ||||
| 1,100 | Dade County, Florida, Seaport Revenue Refunding Bonds, Series 1995, 5.750%, 10/01/15 – NPFG Insured | 10/11 at 100.00 | A2 | 1,104,312 | ||||
| Davie, Florida, Water and Sewerage Revenue Refunding and Improvement Bonds, Series 2003: | ||||||||
| 910 | 5.250%, 10/01/17 – AMBAC Insured | 10/13 at 100.00 | N/R | 981,262 | ||||
| 475 | 5.250%, 10/01/18 – AMBAC Insured | 10/13 at 100.00 | N/R | 501,947 | ||||
| Deltona, Florida, Utility Systems Water and Sewer Revenue Bonds, Series 2003: | ||||||||
| 1,250 | 5.250%, 10/01/22 – NPFG Insured | 10/13 at 100.00 | A1 | 1,282,113 | ||||
| 1,095 | 5.000%, 10/01/23 – NPFG Insured | 10/13 at 100.00 | A1 | 1,120,185 | ||||
| 1,225 | 5.000%, 10/01/24 – NPFG Insured | 10/13 at 100.00 | A1 | 1,248,214 | ||||
| 1,555 | DeSoto County, Florida, Capital Improvement Revenue Bonds, Series 2002, 5.250%, 10/01/20 (Pre-refunded 4/01/12) – NPFG Insured | 4/12 at 101.00 | A1 (4) | 1,640,370 | ||||
| 2,500 | Escambia County School Board, Florida, Certificates of Participation, Series 2004, 5.000%, 2/01/22 – NPFG Insured | 2/15 at 100.00 | Baa1 | 2,548,375 | ||||
| 2,500 | Flagler County School Board, Florida, Certificates of Participation, Master Lease Revenue Program, Series 2005A, 5.000%, 8/01/30 – AGM Insured | 8/15 at 100.00 | AA+ | 2,492,150 | ||||
| 1,200 | Flagler County, Florida, Capital Improvement Revenue Bonds, Series 2005, 5.000%, 10/01/30 – NPFG Insured | 10/15 at 100.00 | A | 1,194,780 | ||||
| 3,945 | Florida Governmental Utility Authority, Utility System Revenue Bonds, Citrus Project, Series 2003, 5.000%, 10/01/23 (Pre-refunded 10/01/13) – AMBAC Insured | 10/13 at 100.00 | N/R (4) | 4,358,239 | ||||
| 1,000 | Florida Governmental Utility Authority, Utility System Revenue Bonds, Golden Gate Project, Series 1999, 5.000%, 7/01/29 – AMBAC Insured | 7/11 at 100.00 | N/R | 906,100 |
| 32 | Nuveen Investments |
| Principal | Optional Call | |||||||
| Amount (000) | Description (1) | Provisions (2) | Ratings (3) | Value | ||||
Florida (continued) | ||||||||
| Florida Municipal Loan Council, Revenue Bonds, Series 2000B: | ||||||||
| $ | 1,825 | 5.375%, 11/01/25 – NPFG Insured | 11/11 at 100.00 | A– | $ | 1,830,585 | ||
| 1,840 | 5.375%, 11/01/30 – NPFG Insured | 11/11 at 100.00 | A– | 1,841,895 | ||||
| 1,000 | Florida Municipal Loan Council, Revenue Bonds, Series 2001A, 5.250%, 11/01/18 – NPFG Insured | 11/11 at 101.00 | A– | 1,018,040 | ||||
| 2,230 | Florida Ports Financing Commission, Revenue Bonds, State Transportation Trust Fund – Intermodal Program, Series 1999, 5.500%, 10/01/23 – NPFG Insured (Alternative Minimum Tax) | 10/11 at 100.00 | AA+ | 2,234,705 | ||||
| 940 | Florida State Board of Education, Full Faith and Credit, Public Education Capital Outlay Bonds, Series 2001C, 5.125%, 6/01/29 (Pre-refunded 6/01/11) – FGIC Insured | 6/11 at 101.00 | AAA | 953,414 | ||||
| 2,000 | Greater Orlando Aviation Authority, Florida, Airport Facilities Revenue Refunding Bonds, Series 2003A, 5.000%, 10/01/17 – AGM Insured | 10/13 at 100.00 | AA+ | 2,140,900 | ||||
| 5,200 | Gulf Breeze, Florida, Local Government Loan Program, Remarketed 6-1-2001, Series 1985E, 4.750%, 12/01/20 (Mandatory put 12/01/11) – FGIC Insured | 12/11 at 101.00 | N/R | 5,234,580 | ||||
| 1,500 | Gulf Breeze, Florida, Local Government Loan Program, Remarketed 7-3-2000, Series 1985E, 5.750%, 12/01/20 (Mandatory put 12/01/19) – FGIC Insured | 12/11 at 100.00 | N/R | 1,510,635 | ||||
| 1,915 | Halifax Hospital Medical Center, Florida, Revenue Bonds, Series 2006, 5.500%, 6/01/38 – AGM Insured | 6/18 at 100.00 | AA+ | 1,840,679 | ||||
| 2,500 | Hillsborough County Industrial Development Authority, Florida, Industrial Development Revenue Bonds, University Community Hospital, Series 1994, 6.500%, 8/15/19 – NPFG Insured | No Opt. Call | Aaa | 3,060,750 | ||||
| 1,000 | Hillsborough County School Board, Florida, Certificates of Participation, Master Lease Program, Series 2005A, 5.000%, 7/01/26 – NPFG Insured | 7/15 at 100.00 | Aa2 | 1,017,240 | ||||
| 6,000 | Hillsborough County School Board, Florida, Certificates of Participation, Series 2003, 5.000%, 7/01/29 – NPFG Insured | 7/13 at 100.00 | Aa2 | 6,021,600 | ||||
| 2,000 | Hillsborough County, Florida, Community Investment Tax Revenue Bonds, Series 2004, 5.000%, 5/01/23 – AMBAC Insured | 11/13 at 101.00 | AA | 2,080,260 | ||||
| 1,000 | Hillsborough County, Florida, Revenue Refunding Bonds, Tampa Bay Arena, Series 2005, 5.000%, 10/01/25 – FGIC Insured | 10/15 at 100.00 | AA+ | 1,029,390 | ||||
| 2,595 | Indian River County School Board, Florida, Certificates of Participation, Series 2005, 5.000%, 7/01/22 – NPFG Insured | 7/15 at 100.00 | A+ | 2,657,072 | ||||
| Indian Trace Development District, Florida, Water Management Special Benefit Assessment Bonds, Series 2005: | ||||||||
| 1,645 | 5.000%, 5/01/25 – NPFG Insured | 5/15 at 102.00 | Baa1 | 1,510,357 | ||||
| 1,830 | 5.000%, 5/01/27 – NPFG Insured | 5/15 at 102.00 | Baa1 | 1,628,700 | ||||
| 4,425 | Jacksonville Economic Development Commission, Florida, Healthcare Facilities Revenue Bonds, Mayo Clinic, Series 2001C, 5.500%, 11/15/36 – NPFG Insured | 11/12 at 100.00 | Aa2 | 4,429,381 | ||||
| 1,480 | Jacksonville, Florida, Better Jacksonville Sales Tax Revenue Bonds, Series 2003, 5.250%, 10/01/20 – NPFG Insured | 10/13 at 100.00 | A1 | 1,569,244 | ||||
| 1,500 | JEA, Florida, Water and Sewerage System Revenue Bonds, Crossover Refunding Series 2007B, 5.000%, 10/01/24 – NPFG Insured | 10/14 at 100.00 | Aa2 | 1,543,470 | ||||
| 1,000 | JEA, Florida, Water and Sewerage System Revenue Bonds, Series 2004A, 5.000%, 10/01/14 – FGIC Insured | 10/13 at 100.00 | Aa2 | 1,079,580 | ||||
| 1,450 | Jupiter, Florida, Water Revenue Bonds, Series 2003, 5.000%, 10/01/22 – AMBAC Insured | 10/13 at 100.00 | AA+ | 1,511,219 | ||||
| Lakeland, Florida, Utility Tax Revenue Bonds, Series 2003B: | ||||||||
| 1,730 | 5.000%, 10/01/18 – AMBAC Insured | 10/12 at 100.00 | N/R | 1,756,140 | ||||
| 2,000 | 5.000%, 10/01/19 – AMBAC Insured | 10/12 at 100.00 | N/R | 2,022,580 | ||||
| 1,230 | Lee County, Florida, Local Option Gas Tax Revenue Bonds, Series 2004, 5.000%, 10/01/20 – FGIC Insured | 10/14 at 100.00 | A2 | 1,262,288 | ||||
| 1,505 | Lee County, Florida, Transportation Facilities Revenue Bonds, Series 2004B, 5.000%, 10/01/21 – AMBAC Insured | 10/14 at 100.00 | A– | 1,540,398 |
| Nuveen Investments | 33 |
Nuveen Insured Municipal Opportunity Fund, Inc. (continued) | ||
| NIO | Portfolio of Investments |
April 30, 2011 (Unaudited)
| Principal | Optional Call | |||||||
| Amount (000) | Description (1) | Provisions (2) | Ratings (3) | Value | ||||
Florida (continued) | ||||||||
| $ | 1,000 | Lee Memorial Health System, Florida, Hospital Revenue Bonds, Series 2007A, 5.000%, 4/01/32 – NPFG Insured | 4/17 at 100.00 | A | $ | 871,980 | ||
| 3,000 | Leesburg, Florida, Utility Revenue Bonds, Series 2007, 5.000%, 10/01/37 – NPFG Insured | 10/17 at 100.00 | Aa3 | 2,823,990 | ||||
| 2,000 | Manatee County, Florida, Public Utilities Revenue Bonds, Series 2003, 5.125%, 10/01/20 – NPFG Insured | 10/13 at 100.00 | Aa2 | 2,146,540 | ||||
| Marco Island, Florida, Water Utility System Revenue Bonds, Series 2003: | ||||||||
| 1,350 | 5.250%, 10/01/17 – NPFG Insured | 10/13 at 100.00 | Aa3 | 1,470,137 | ||||
| 1,000 | 5.250%, 10/01/18 – NPFG Insured | 10/13 at 100.00 | Aa3 | 1,076,210 | ||||
| 2,000 | 5.000%, 10/01/27 – NPFG Insured | 10/13 at 100.00 | Aa3 | 2,014,420 | ||||
| 1,425 | Miami-Dade County Housing Finance Authority, Florida, Multifamily Mortgage Revenue Bonds, Country Club Villas II Project, Series 2001-1A, 5.750%, 7/01/27 – AGM Insured (Alternative Minimum Tax) | 6/11 at 100.00 | AA+ | 1,425,869 | ||||
| 2,200 | Miami-Dade County, Florida, Aviation Revenue Bonds, Miami International Airport, Series 2002A, 5.125%, 10/01/35 – AGM Insured (Alternative Minimum Tax) | 10/12 at 100.00 | AA+ | 2,013,924 | ||||
| Miami-Dade County, Florida, Aviation Revenue Bonds, Miami International Airport, Series 2002: | ||||||||
| 5,615 | 5.750%, 10/01/19 – FGIC Insured (Alternative Minimum Tax) | 10/12 at 100.00 | A2 | 5,789,233 | ||||
| 35,920 | 5.375%, 10/01/32 – FGIC Insured (Alternative Minimum Tax) | 10/12 at 100.00 | A2 | 33,210,553 | ||||
| 12,930 | Miami-Dade County, Florida, Public Facilities Revenue Bonds, Jackson Health System, Series 2005A, 5.000%, 6/01/32 – NPFG Insured | 12/15 at 100.00 | Aa3 | 11,650,835 | ||||
| 5,320 | Miami-Dade County, Florida, Public Facilities Revenue Bonds, Jackson Health System, Series 2005B, 5.000%, 6/01/25 – NPFG Insured | 6/15 at 100.00 | Aa3 | 5,168,912 | ||||
| 18,000 | Miami-Dade County, Florida, Subordinate Special Obligation Bonds, Series 1997A, 0.000%, 10/01/21 – NPFG Insured | 10/11 at 59.17 | A+ | 9,745,020 | ||||
| 3,000 | Miami-Dade County, Florida, Transit System Sales Surtax Revenue Bonds, Series 2008, 5.000%, 7/01/35 – AGM Insured | 7/18 at 100.00 | AA+ | 2,897,730 | ||||
| 2,000 | Miami-Dade County, Florida, Water and Sewer System Revenue Bonds, Refunding Series 2008B, 5.250%, 10/01/22 – AGM Insured | No Opt. Call | AA+ | 2,267,240 | ||||
| Northern Palm Beach County Improvement District, Florida, Revenue Bonds, Water Control and Improvement Development Unit 9B, Series 2005: | ||||||||
| 1,290 | 5.000%, 8/01/23 – NPFG Insured | 8/15 at 102.00 | Baa1 | 1,292,167 | ||||
| 2,145 | 5.000%, 8/01/29 – NPFG Insured | 8/15 at 102.00 | Baa1 | 2,030,521 | ||||
| 2,000 | Okaloosa County, Florida, Water and Sewer Revenue Bonds, Series 2006, 5.000%, 7/01/36 – AGM Insured | 7/16 at 100.00 | AA+ | 1,967,500 | ||||
| 1,000 | Orange County School Board, Florida, Certificates of Participation, Series 2007A, 5.000%, 8/01/27 – FGIC Insured | 8/17 at 100.00 | AA– | 1,012,780 | ||||
| 3,180 | Orange County, Florida, Sales Tax Revenue Bonds, Series 2002B, 5.125%, 1/01/19 – FGIC Insured | 1/13 at 100.00 | AA | 3,346,314 | ||||
| 2,500 | Orange County, Florida, Tourist Development Tax Revenue Bonds, Series 2006, 5.000%, 10/01/31 – SYNCORA GTY Insured | 10/16 at 100.00 | A+ | 2,420,650 | ||||
| Osceola County, Florida, Transportation Revenue Bonds, Osceola Parkway, Series 2004: | ||||||||
| 2,500 | 5.000%, 4/01/21 – NPFG Insured | 4/14 at 100.00 | Aa3 | 2,576,075 | ||||
| 7,820 | 5.000%, 4/01/23 – NPFG Insured | 4/14 at 100.00 | Aa3 | 7,984,298 | ||||
| 1,750 | Palm Bay, Florida, Utility System Revenue Bonds, Palm Bay Utility Corporation, Series 2003, 5.000%, 10/01/20 – NPFG Insured | 10/13 at 100.00 | Aa3 | 1,784,580 | ||||
| 1,065 | Palm Beach County Housing Finance Authority, Florida, Multifamily Housing Revenue Bonds, Westlake Apartments Phase II, Series 2002, 5.150%, 7/01/22 – AGM Insured (Alternative Minimum Tax) | 7/12 at 100.00 | AA+ | 1,070,389 | ||||
| 2,150 | Palm Beach County School Board, Florida, Certificates of Participation, Series 2004A, 5.000%, 8/01/24 – FGIC Insured | 8/14 at 100.00 | AA– | 2,185,905 |
| 34 | Nuveen Investments |
| Principal | Optional Call | |||||||
| Amount (000) | Description (1) | Provisions (2) | Ratings (3) | Value | ||||
Florida (continued) | ||||||||
| $ | 3,000 | Palm Beach County School Board, Florida, Certificates of Participation, Series 2007E, 5.000%, 8/01/27 – NPFG Insured | 8/17 at 100.00 | AA– | $ | 3,023,820 | ||
| 8,000 | Palm Beach County Solid Waste Authority, Florida, Revenue Bonds, Series 2002B, 0.000%, 10/01/14 – AMBAC Insured | No Opt. Call | AA | 7,372,800 | ||||
| 1,470 | Palm Beach County, Florida, Administrative Complex Revenue Refunding Bonds, Series 1993, 5.250%, 6/01/11 – FGIC Insured | No Opt. Call | Aa1 | 1,473,896 | ||||
| Palm Coast, Florida, Water Utility System Revenue Bonds, Series 2003: | ||||||||
| 1,000 | 5.250%, 10/01/19 – NPFG Insured | 10/13 at 100.00 | Aa3 | 1,070,810 | ||||
| 500 | 5.250%, 10/01/20 – NPFG Insured | 10/13 at 100.00 | Aa3 | 532,840 | ||||
| 500 | 5.250%, 10/01/21 – NPFG Insured | 10/13 at 100.00 | Aa3 | 524,470 | ||||
| 3,000 | Pasco County, Florida, Water and Sewer Revenue Bonds, Series 2006 Refunding, 5.000%, 10/01/36 – AGM Insured | 4/16 at 100.00 | AA+ | 2,972,160 | ||||
| Plantation, Florida, Non-Ad Valorem Revenue Refunding and Improvement Bonds, Series 2003: | ||||||||
| 2,225 | 5.000%, 8/15/18 – AGM Insured | 8/13 at 100.00 | Aa3 | 2,288,791 | ||||
| 1,300 | 5.000%, 8/15/21 – AGM Insured | 8/13 at 100.00 | Aa3 | 1,321,216 | ||||
| 1,170 | Polk County, Florida, Utility System Revenue Bonds, Series 2004A, 5.000%, 10/01/24 – FGIC Insured | 10/14 at 100.00 | Aa3 | 1,194,161 | ||||
| 1,000 | Port Saint Lucie, Florida, Special Assessment Revenue Bonds, Southwest Annexation District 1B, Series 2007, 5.000%, 7/01/33 – NPFG Insured | 7/17 at 100.00 | Baa1 | 825,020 | ||||
| Port St. Lucie, Florida, Stormwater Utility System Revenue Refunding Bonds, Series 2002: | ||||||||
| 1,190 | 5.250%, 5/01/15 – NPFG Insured | 5/12 at 100.00 | Aa3 | 1,233,483 | ||||
| 1,980 | 5.250%, 5/01/17 – NPFG Insured | 5/12 at 100.00 | Aa3 | 2,052,349 | ||||
| Port St. Lucie, Florida, Utility System Revenue Bonds, Refunding Series 2009: | ||||||||
| 8,500 | 5.000%, 9/01/35 – AGC Insured | 9/18 at 100.00 | AA+ | 8,340,965 | ||||
| 5,450 | 5.250%, 9/01/35 – AGC Insured | 9/18 at 100.00 | AA+ | 5,467,713 | ||||
| 10,000 | Port St. Lucie, Florida, Utility System Revenue Bonds, Series 2001, 0.000%, 9/01/29 (Pre-refunded 9/01/11) – NPFG Insured | 9/11 at 34.97 | AA– (4) | 3,491,000 | ||||
| 1,830 | Port St. Lucie, Florida, Utility System Revenue Bonds, Series 2003, 5.000%, 9/01/21 (Pre-refunded 9/01/13) – NPFG Insured | 9/13 at 100.00 | BBB (4) | 2,015,727 | ||||
| 1,000 | Port St. Lucie, Florida, Utility System Revenue Bonds, Series 2004, 5.000%, 9/01/21 – NPFG Insured | 9/14 at 100.00 | Aa3 | 1,040,050 | ||||
| 1,895 | Reedy Creek Improvement District, Orange and Osceola Counties, Florida, General Obligation Bonds, Series 2005B, 5.000%, 6/01/25 – AMBAC Insured | 6/15 at 100.00 | Aa3 | 1,942,034 | ||||
| Sebring, Florida, Water and Wastewater Revenue Refunding Bonds, Series 2002: | ||||||||
| 1,360 | 5.250%, 1/01/17 – FGIC Insured | 1/13 at 100.00 | BBB | 1,437,846 | ||||
| 770 | 5.250%, 1/01/18 – FGIC Insured | 1/13 at 100.00 | BBB | 807,545 | ||||
| 500 | 5.250%, 1/01/20 – FGIC Insured | 1/13 at 100.00 | BBB | 524,380 | ||||
| 5,740 | Seminole County, Florida, Water and Sewer Revenue Refunding and Improvement Bonds, Series 1992, 6.000%, 10/01/19 – NPFG Insured (ETM) | No Opt. Call | Baa1 (4) | 6,795,299 | ||||
| 3,530 | Seminole County, Florida, Water and Sewer Revenue Refunding and Improvement Bonds, Series 1992, 6.000%, 10/01/19 – NPFG Insured | No Opt. Call | Baa1 | 4,042,697 | ||||
| 4,260 | St. Lucie County School Board, Florida, Certificates of Participation, Master Lease Program, Series 2004A, 5.000%, 7/01/24 – AGM Insured | 7/14 at 100.00 | AA+ | 4,323,943 | ||||
| St. Lucie County, Florida, Utility System Revenue Refunding Bonds, Series 1993: | ||||||||
| 5,000 | 5.500%, 10/01/15 – FGIC Insured (ETM) | No Opt. Call | N/R (4) | 5,557,500 | ||||
| 1,200 | 5.500%, 10/01/21 – FGIC Insured (ETM) | No Opt. Call | N/R (4) | 1,437,288 | ||||
| St. Petersburg, Florida, Sales Tax Revenue Bonds, Professional Sports Facility, Series 2003: | ||||||||
| 1,475 | 5.125%, 10/01/20 – AGM Insured | 10/13 at 100.00 | Aa3 | 1,586,702 | ||||
| 1,555 | 5.125%, 10/01/21 – AGM Insured | 10/13 at 100.00 | Aa3 | 1,664,270 |
| Nuveen Investments | 35 |
Nuveen Insured Municipal Opportunity Fund, Inc. (continued) | ||
| NIO | Portfolio of Investments |
April 30, 2011 (Unaudited)
| Principal | Optional Call | |||||||
| Amount (000) | Description (1) | Provisions (2) | Ratings (3) | Value | ||||
Florida (continued) | ||||||||
| $ | 2,500 | Tallahassee, Florida, Energy System Revenue Bonds, Series 2005, 5.000%, 10/01/29 – NPFG Insured | 10/15 at 100.00 | AA | $ | 2,517,625 | ||
| 1,245 | Tamarac, Florida, Sales Tax Revenue Bonds, Series 2002, 5.000%, 4/01/22 (Pre-refunded 4/01/12) – FGIC Insured | 4/12 at 100.00 | A+ (4) | 1,298,435 | ||||
| 400 | Tamarac, Florida, Utility System Revenue Bonds, Series 2009, 5.000%, 10/01/39 – AGC Insured | 10/19 at 100.00 | AA+ | 400,392 | ||||
| 1,500 | Tampa, Florida, Healthcare System Revenue Bonds, Allegany Health | 6/11 at 100.00 | Aaa | 1,520,040 | ||||
| System – St. Joseph’s Hospital, Series 1993, 5.125%, 12/01/23 – NPFG | ||||||||
| Insured (ETM) | ||||||||
| 10,335 | Tampa, Florida, Revenue Bonds, University of Tampa, Series 2006, 5.000%, 4/01/35 – CIFG Insured | 4/16 at 100.00 | N/R | 8,930,990 | ||||
| 1,390 | Venice, Florida, General Obligation Bonds, Series 2004, 5.000%, 2/01/24 – AMBAC Insured | 2/14 at 100.00 | Aa2 | 1,424,528 | ||||
| 4,275 | Volusia County School Board, Florida, Certificates of Participation, Series 2005B, 5.000%, 8/01/24 – AGM Insured | 8/15 at 100.00 | Aa3 | 4,307,918 | ||||
| 2,000 | Volusia County, Florida, Gas Tax Revenue Bonds, Series 2004, 5.000%, 10/01/21 – AGM Insured | 10/14 at 100.00 | AA+ | 2,073,540 | ||||
| 12,000 | Volusia County, Florida, School Board Certificates of Participation, Master Lease Program Series 2007, 5.000%, 8/01/32 – AGM Insured | 8/17 at 100.00 | Aa3 | 11,242,320 | ||||
| 1,785 | Volusia County, Florida, Tax Revenue Bonds, Tourist Development, Series 2004, 5.000%, 12/01/24 – AGM Insured | 12/14 at 100.00 | Aa3 | 1,826,430 | ||||
| 356,795 | Total Florida | 341,179,300 | ||||||
| Georgia – 2.0% (1.3% of Total Investments) | ||||||||
| 1,000 | Atlanta, Georgia, Water and Wastewater Revenue Bonds, Series 2004, 5.000%, 11/01/22 – AGM Insured | 11/14 at 100.00 | AA+ | 1,035,880 | ||||
| 10,000 | Atlanta, Georgia, Water and Wastewater Revenue Bonds, Series 2009B, 5.375%, 11/01/39 – AGM Insured | 11/19 at 100.00 | AA+ | 10,057,600 | ||||
| 2,825 | Cherokee County Water and Sewerage Authority, Georgia, Water and Sewerage Revenue Refunding Bonds, Series 2010, 4.000%, 8/01/26 | 8/20 at 100.00 | AA | 2,788,332 | ||||
| 1,520 | College Park Business and Industrial Development Authority, Georgia, Revenue Bonds, Public Safety Project, Series 2004, 5.250%, 9/01/23 – NPFG Insured | 9/14 at 102.00 | AA– | 1,631,431 | ||||
| Fulton County Development Authority, Georgia, Revenue Bonds, Georgia Tech Molecular Science Building, Series 2004: | ||||||||
| 1,695 | 5.250%, 5/01/19 – NPFG Insured | 5/14 at 100.00 | Aa3 | 1,828,854 | ||||
| 1,135 | 5.250%, 5/01/20 – NPFG Insured | 5/14 at 100.00 | Aa3 | 1,214,961 | ||||
| 4,500 | 5.000%, 5/01/36 – NPFG Insured | 5/14 at 100.00 | Aa3 | 4,311,135 | ||||
| 960 | Glynn-Brunswick Memorial Hospital Authority, Georgia, Revenue Bonds, Southeast Georgia Health Systems, Series 1996, 5.250%, 8/01/13 – NPFG Insured | 7/11 at 100.00 | A– | 962,045 | ||||
| 2,250 | Gwinnett County Hospital Authority, Georgia, Revenue Anticipation Certificates, Gwinnett Hospital System Inc. Project, Series 2007C, 5.500%, 7/01/39 – AGM Insured (Alternative Minimum Tax) | 7/19 at 100.00 | Aa3 | 2,138,738 | ||||
| 25,885 | Total Georgia | 25,968,976 | ||||||
| Idaho – 0.2% (0.1% of Total Investments) | ||||||||
| 50 | Idaho Housing Agency, Single Family Mortgage Senior Bonds, Series 1994B-1, 6.750%, 7/01/22 | No Opt. Call | Aaa | 52,368 | ||||
| 30 | Idaho Housing Agency, Single Family Mortgage Senior Bonds, Series 1994B-2, 6.900%, 7/01/26 (Alternative Minimum Tax) | No Opt. Call | Aaa | 30,468 | ||||
| 125 | Idaho Housing Agency, Single Family Mortgage Senior Bonds, Series 1995B, 6.600%, 7/01/27 (Alternative Minimum Tax) | 7/11 at 100.00 | Aaa | 125,670 | ||||
| Idaho Housing and Finance Association, Grant and Revenue Anticipation Bonds, Federal Highway Trust Funds, Series 2006: | ||||||||
| 1,000 | 5.000%, 7/15/23 – NPFG Insured | 7/16 at 100.00 | Aa2 | 1,056,290 | ||||
| 1,065 | 5.000%, 7/15/24 – NPFG Insured | 7/16 at 100.00 | Aa2 | 1,115,204 | ||||
| 2,270 | Total Idaho | 2,380,000 |
| 36 | Nuveen Investments |
| Principal | Optional Call | |||||||
| Amount (000) | Description (1) | Provisions (2) | Ratings (3) | Value | ||||
| Illinois – 7.0% (4.5% of Total Investments) | ||||||||
| $ | 1,050 | Bedford Park, Illinois, General Obligation Bonds, Series 2004A, 5.250%, 12/15/20 – AGM Insured | 12/14 at 100.00 | AA+ | $ | 1,135,932 | ||
| 7,000 | Chicago, Illinois, General Airport Revenue Bonds, O’Hare International Airport, Third Lien Refunding Series 2010C, 5.250%, 1/01/35 – AGC Insured | No Opt. Call | AA+ | 6,943,230 | ||||
| Chicago, Illinois, Second Lien Passenger Facility Charge Revenue Refunding Bonds, O’Hare International Airport, Series 2001E: | ||||||||
| 4,615 | 5.500%, 1/01/17 (Pre-refunded 6/09/11) – AMBAC Insured (Alternative Minimum Tax) | 6/11 at 101.00 | A2 (4) | 4,664,611 | ||||
| 4,870 | 5.500%, 1/01/18 (Pre-refunded 6/09/11) – AMBAC Insured (Alternative Minimum Tax) | 6/11 at 101.00 | A2 (4) | 4,912,369 | ||||
| 7,200 | Chicago, Illinois, Third Lien General Airport Revenue Bonds, O’Hare International Airport, Series 2005A, 5.250%, 1/01/24 – NPFG Insured | 1/16 at 100.00 | A1 | 7,426,296 | ||||
| 7,025 | De Witt, Ford, Livingston, Logan, Mc Lean and Tazewell Community College District 540, Illinois, General Obligation Bonds, Series 2007, 3.000%, 12/01/26 – AGM Insured | 12/17 at 100.00 | Aa2 | 5,480,413 | ||||
| 10,330 | Illinois Development Finance Authority, Revenue Bonds, Provena Health, Series 1998A, 5.500%, 5/15/21 – NPFG Insured | 5/11 at 100.00 | Baa1 | 10,329,277 | ||||
| 2,095 | Illinois Educational Facilities Authority, Revenue Bonds, Robert Morris College, Series 2000, 5.800%, 6/01/30 – NPFG Insured | 6/11 at 100.00 | Baa1 | 2,062,821 | ||||
| 22,610 | Illinois, General Obligation Bonds, Illinois FIRST Program, Series 2002, 5.125%, 2/01/27 – FGIC Insured | 2/12 at 100.00 | A+ | 22,236,483 | ||||
| 20,000 | Metropolitan Pier and Exposition Authority, Illinois, Revenue Bonds, McCormick Place Expansion Project, Capital Appreciation Refunding Series 2010B-1, 0.000%, 6/15/45 – AGM Insured | No Opt. Call | AAA | 2,008,000 | ||||
| 20,045 | Metropolitan Pier and Exposition Authority, Illinois, Revenue Bonds, McCormick Place Expansion Project, Series 2002A, 0.000%, 12/15/35 – NPFG Insured | No Opt. Call | AAA | 3,936,036 | ||||
| 5,920 | Metropolitan Pier and Exposition Authority, Illinois, Revenue Bonds, McCormick Place Expansion Project, Series 2010B-1, 13.454%, 6/15/42 (IF) (5) | 6/20 at 100.00 | AAA | 3,381,741 | ||||
| Schaumburg, Illinois, General Obligation Bonds, Series 2004B: | ||||||||
| 4,260 | 5.000%, 12/01/22 – FGIC Insured | 12/14 at 100.00 | Aaa | 4,422,476 | ||||
| 2,365 | 5.000%, 12/01/23 – FGIC Insured | 12/14 at 100.00 | Aaa | 2,442,619 | ||||
| 4,000 | Southwestern Illinois Development Authority, School Revenue Bonds, Triad School District 2, Madison County, Illinois, Series 2006, 0.000%, 10/01/25 – NPFG Insured | No Opt. Call | AAA | 1,615,800 | ||||
| Williamson & Johnson Counties Community Unit School District 2, Marion, Illinois, General Obligation Bonds, Series 2011: | ||||||||
| 930 | 7.000%, 12/01/21 – AGM Insured | 12/20 at 100.00 | AA+ | 1,070,337 | ||||
| 1,035 | 7.000%, 12/01/22 – AGM Insured | 12/20 at 100.00 | AA+ | 1,163,392 | ||||
| 1,155 | 7.000%, 12/01/23 – AGM Insured | 12/20 at 100.00 | AA+ | 1,287,432 | ||||
| 1,065 | 7.000%, 12/01/26 – AGM Insured | 12/20 at 100.00 | AA+ | 1,166,526 | ||||
| 2,085 | 7.250%, 12/01/29 – AGM Insured | 12/20 at 100.00 | AA+ | 2,287,620 | ||||
| 2,295 | 7.250%, 12/01/30 – AGM Insured | 12/20 at 100.00 | AA+ | 2,502,583 | ||||
| 131,950 | Total Illinois | 92,475,994 | ||||||
| Indiana – 4.3% (2.8% of Total Investments) | ||||||||
| 2,030 | Decatur Township-Marion County Multi-School Building Corporation, Indiana, First Mortgage Bonds, Series 2003, 5.000%, 7/15/20 (Pre-refunded | 7/13 at 100.00 | AA+ (4) | 2,217,836 | ||||
| 7/15/13) – FGIC Insured | ||||||||
| 5,000 | Indiana Finance Authority, Revenue Bonds, Trinity Health Care Group, Refunding Series 2010B., 5.000%, 12/01/37 | 12/20 at 100.00 | AA | 4,454,700 | ||||
| 8,000 | Indiana Municipal Power Agency, Power Supply Revenue Bonds, Series 2007A, 5.000%, 1/01/42 – NPFG Insured | 1/17 at 100.00 | A+ | 7,443,360 | ||||
| 5,000 | Indianapolis Local Public Improvement Bond Bank Bonds, Indiana, PILOT Infrastructure Project Revenue Bonds, Series 2010F, 5.000%, 1/01/35 – AGM Insured | No Opt. Call | AA+ | 5,003,150 | ||||
| 20,000 | Indianapolis Local Public Improvement Bond Bank, Indiana, Series 1999E, 0.000%, 2/01/28 – AMBAC Insured | No Opt. Call | AA | 7,901,600 |
| Nuveen Investments | 37 |
Nuveen Insured Municipal Opportunity Fund, Inc. (continued) | ||
| NIO | Portfolio of Investments |
April 30, 2011 (Unaudited)
| Principal | Optional Call | |||||||
| Amount (000) | Description (1) | Provisions (2) | Ratings (3) | Value | ||||
Indiana (continued) | ||||||||
| $ | 5,300 | Indianapolis Local Public Improvement Bond Bank, Indiana, Waterworks Project Series 2009A, 5.500%, 1/01/38 – AGC Insured | 1/19 at 100.00 | AA+ | $ | 5,395,771 | ||
| 3,250 | Indianapolis Local Public Improvement Bond Bank, Indiana, Waterworks Project, Series 2002A, 5.250%, 7/01/33 (Pre-refunded 7/01/12) – NPFG Insured | 7/12 at 100.00 | AAA | 3,435,510 | ||||
| 1,340 | Monroe-Gregg Grade School Building Corporation, Morgan County, Indiana, First Mortgage Bonds, Series 2004, 5.000%, 1/15/25 (Pre-refunded | 1/14 at 100.00 | AA+ (4) | 1,490,241 | ||||
| 1/15/14) – AGM Insured | ||||||||
| 5,000 | Noblesville Redevelopment Authority, Indiana, Economic Development Lease Rental Bonds, Exit 10 Project, Series 2003, 5.000%, 1/15/28 – AMBAC Insured | 7/13 at 100.00 | AA– | 5,013,600 | ||||
| 10,000 | Purdue University, Indiana, Student Fee Bonds, Series 2002O, 5.000%, 7/01/19 (Pre-refunded 1/01/12) – NPFG Insured | 1/12 at 100.00 | Aaa | 10,317,800 | ||||
| 3,705 | Whitley County Middle School Building Corporation, Columbia City, Indiana, First Mortgage Bonds, Series 2003, 5.000%, 7/15/16 (Pre-refunded | 7/13 at 100.00 | Aa3 (4) | 4,062,421 | ||||
| 7/15/13) – AGM Insured | ||||||||
| 68,625 | Total Indiana | 56,735,989 | ||||||
| Kansas – 0.7% (0.5% of Total Investments) | ||||||||
| 2,055 | Kansas Turnpike Authority, Revenue Bonds, Series 2004A-2, 5.000%, | 9/14 at 101.00 | AA+ | 2,179,430 | ||||
| 9/01/23 – AGM Insured | ||||||||
| Neosho County Unified School District 413, Kansas, General Obligation Bonds, Series 2006: | ||||||||
| 2,145 | 5.000%, 9/01/27 – AGM Insured | 9/14 at 100.00 | Aa3 | 2,172,799 | ||||
| 4,835 | 5.000%, 9/01/29 – AGM Insured | 9/14 at 100.00 | Aa3 | 4,861,979 | ||||
| 9,035 | Total Kansas | 9,214,208 | ||||||
| Kentucky – 3.1% (2.0% of Total Investments) | ||||||||
| 3,870 | Kenton County School District Finance Corporation, Kentucky, School Building Revenue Bonds, Series 2004, 5.000%, 6/01/20 – NPFG Insured | 6/14 at 100.00 | Aa3 | 4,123,369 | ||||
| Kentucky State Property and Buildings Commission, Revenue Bonds, Project 93, Refunding Series 2009: | ||||||||
| 3,860 | 5.250%, 2/01/20 – AGC Insured | 2/19 at 100.00 | AA+ | 4,349,487 | ||||
| 10,000 | 5.250%, 2/01/24 – AGC Insured | 2/19 at 100.00 | AA+ | 10,785,700 | ||||
| 7,500 | Kentucky Turnpike Authority, Economic Development Road Revenue Bonds, Revitalization Project, Series 2006B, 5.000%, 7/01/25 – AMBAC Insured | 7/16 at 100.00 | AA+ | 7,827,975 | ||||
| 12,980 | Louisville and Jefferson County Metropolitan Sewer District, Kentucky, Sewer and Drainage System Revenue Bonds, Series 2001A, 5.500%, 5/15/34 – NPFG Insured | 11/11 at 101.00 | AA– | 13,272,569 | ||||
| 38,210 | Total Kentucky | 40,359,100 | ||||||
| Louisiana – 4.6% (3.0% of Total Investments) | ||||||||
| 5,000 | DeSoto Parish, Louisiana, Pollution Control Revenue Refunding Bonds, Cleco Utility Group Inc. Project, Series 1999, 5.875%, 9/01/29 – AMBAC Insured | 9/11 at 100.00 | BBB | 4,999,750 | ||||
| 3,025 | Lafayette City and Parish, Louisiana, Utilities Revenue Bonds, Series 2004, 5.250%, 11/01/22 – NPFG Insured | 11/14 at 100.00 | A+ | 3,238,535 | ||||
| 4,530 | Louisiana Public Facilities Authority, Revenue Bonds, Baton Rouge General Hospital, Series 2004, 5.250%, 7/01/24 – NPFG Insured | 7/14 at 100.00 | Baa1 | 4,595,006 | ||||
| Louisiana State, Gasoline and Fuels Tax Revenue Bonds, Series 2005A: | ||||||||
| 2,400 | 5.000%, 5/01/25 – FGIC Insured | 5/15 at 100.00 | Aa1 | 2,496,840 | ||||
| 4,415 | 5.000%, 5/01/26 – FGIC Insured | 5/15 at 100.00 | Aa1 | 4,571,114 | ||||
| 5,000 | 5.000%, 5/01/27 – FGIC Insured | 5/15 at 100.00 | Aa1 | 5,156,300 | ||||
| Louisiana State, Gasoline and Fuels Tax Revenue Bonds, Series 2006A: | ||||||||
| 3,300 | 4.750%, 5/01/39 – AGM Insured (UB) | 5/16 at 100.00 | AA+ | 3,188,427 | ||||
| 35,725 | 4.500%, 5/01/41 – FGIC Insured (UB) | 5/16 at 100.00 | Aa1 | 32,679,444 | ||||
| 38 | Louisiana State, Gasoline and Fuels Tax Revenue Bonds, Series 2006, Residuals 660-1, 15.745%, 5/01/34 – FGIC Insured (IF) | 5/16 at 100.00 | Aa1 | 25,262 | ||||
| 63,433 | Total Louisiana | 60,950,678 |
| 38 | Nuveen Investments |
| Principal | Optional Call | |||||||
| Amount (000) | Description (1) | Provisions (2) | Ratings (3) | Value | ||||
| Maine – 0.2% (0.2% of Total Investments) | ||||||||
| $ | 3,000 | Maine Health and Higher Educational Facilities Authority, Revenue Bonds, Series 2003B, 5.000%, 7/01/28 (Pre-refunded 7/01/13) – AGM Insured | 7/13 at 100.00 | Aaa | $ | 3,250,740 | ||
| Maryland – 0.4% (0.2% of Total Investments) | ||||||||
| 5,345 | Baltimore, Maryland, Senior Lien Convention Center Hotel Revenue Bonds, Series 2006A, 5.250%, 9/01/28 – SYNCORA GTY Insured | 9/16 at 100.00 | Baa3 | 4,635,665 | ||||
| Massachusetts – 5.4% (3.5% of Total Investments) | ||||||||
| 4,500 | Massachusetts Department of Transportation, Metropolitan Highway System Revenue Bonds, Commonwealth Contract Assistance Secured, Refunding Series 2010B, 5.000%, 1/01/35 | 1/20 at 100.00 | AA | 4,567,725 | ||||
| 22,500 | Massachusetts Development Finance Authority, Revenue Bonds, WGBH Educational Foundation, Series 2002A, 5.375%, 1/01/42 (Pre-refunded 1/01/12) – AMBAC Insured | 1/12 at 101.00 | A (4) | 23,441,175 | ||||
| 5,330 | Massachusetts Health and Educational Facilities Authority, Revenue Bonds, Harvard University, Tender Option Bond Trust 2010-20W, 13.313%, 12/15/34 (IF) (5) | 12/19 at 100.00 | AAA | 6,052,908 | ||||
| 11,000 | Massachusetts School Building Authority, Dedicated Sales Tax Revenue Bonds, Series 2005A, 5.000%, 8/15/23 – AGM Insured (UB) | 8/15 at 100.00 | AA+ | 11,774,840 | ||||
| 15,000 | Massachusetts State, Special Obligation Dedicated Tax Revenue Bonds, Series 2004, 5.250%, 1/01/23 (Pre-refunded 1/01/14) – FGIC Insured | 1/14 at 100.00 | A1 (4) | 16,695,600 | ||||
| 7,255 | Massachusetts Water Resources Authority, General Revenue Bonds, Series 2007A, 4.500%, 8/01/46 – AGM Insured (UB) (5) | 2/17 at 100.00 | AA+ | 6,630,490 | ||||
| 1,500 | University of Massachusetts Building Authority, Senior Lien Project Revenue Bonds, Series 2004-1, 5.375%, 11/01/20 (Pre-refunded 11/01/14) – AMBAC Insured | 11/14 at 100.00 | A+ (4) | 1,721,655 | ||||
| 67,085 | Total Massachusetts | 70,884,393 | ||||||
| Michigan – 2.2% (1.4% of Total Investments) | ||||||||
| 5,490 | Detroit City School District, Wayne County, Michigan, Unlimited Tax School Building and Site Improvement Bonds, Series 2001A, 6.000%, 5/01/29 – AGM Insured (UB) | No Opt. Call | AA+ | 5,626,536 | ||||
| 6,000 | Detroit, Michigan, General Obligation Bonds, Series 2001A-1, 5.375%, 4/01/18 – NPFG Insured | 10/11 at 100.00 | Baa1 | 5,698,620 | ||||
| 7,420 | Detroit, Michigan, Senior Lien Water Supply System Revenue Bonds, Series 1997A, 5.000%, 7/01/27 – NPFG Insured | 7/11 at 100.00 | A+ | 6,809,260 | ||||
| 1,085 | Grand Rapids Community College, Kent County, Michigan, General Obligation Refunding Bonds, Series 2003, 5.250%, 5/01/20 – AMBAC Insured | 5/13 at 100.00 | Aa1 | 1,159,746 | ||||
| 10,000 | Wayne County, Michigan, Limited Tax General Obligation Airport Hotel Revenue Bonds, Detroit Metropolitan Wayne County Airport, Series 2001A, 5.250%, 12/01/25 – NPFG Insured | 12/11 at 101.00 | A– | 9,746,000 | ||||
| 29,995 | Total Michigan | 29,040,162 | ||||||
| Minnesota – 2.2% (1.4% of Total Investments) | ||||||||
| 5,000 | Minneapolis, Minnesota, Health Care System Revenue Bonds, Fairview Health Services, Series 2008B, 6.500%, 11/15/38 – AGC Insured | 11/18 at 100.00 | AA+ | 5,335,400 | ||||
| 5,000 | Minnesota State, General Obligation Bonds, Various Purpose, Refunding Series 2010D, 5.000%, 8/01/18 | No Opt. Call | AAA | 5,940,950 | ||||
| 4,000 | Northern Municipal Power Agency, Minnesota, Electric System Revenue Bonds, Refunding Series 2009A, 5.000%, 1/01/15 – AGC Insured | No Opt. Call | AA+ | 4,416,760 | ||||
| 12,950 | Saint Paul Housing and Redevelopment Authority, Minnesota, Multifamily Housing Revenue Bonds, Marian Center Project, Series 2001A, 6.450%, 6/20/43 (Pre-refunded 12/20/11) | 12/11 at 102.00 | N/R (4) | 13,714,180 | ||||
| 26,950 | Total Minnesota | 29,407,290 | ||||||
| Montana – 0.2% (0.1% of Total Investments) | ||||||||
| 3,000 | Montana Facility Finance Authority, Hospital Revenue Bonds, Benefis Health System Obligated Group, Series 2011A, 5.750%, 1/01/31 – AGM Insured | 1/21 at 100.00 | AA+ | 3,016,290 |
| Nuveen Investments | 39 |
Nuveen Insured Municipal Opportunity Fund, Inc. (continued) | ||
| NIO | Portfolio of Investments |
April 30, 2011 (Unaudited)
| Principal | Optional Call | |||||||
| Amount (000) | Description (1) | Provisions (2) | Ratings (3) | Value | ||||
| Nebraska – 2.4% (1.5% of Total Investments) | ||||||||
| $ | 27,125 | Lincoln, Nebraska, Electric System Revenue Bonds, Series 2007A, 4.500%, 9/01/37 – FGIC Insured (UB) | 9/17 at 100.00 | AA | $ | 25,383,033 | ||
| 5,000 | Municipal Energy Agency of Nebraska, Power Supply System Revenue and Refunding Bonds, Series 2009A, 5.375%, 4/01/39 – BHAC Insured | 4/19 at 100.00 | AA+ | 5,142,600 | ||||
| 1,000 | Nebraska Public Power District, General Revenue Bonds, Series 2005A, 5.000%, 1/01/25 – AGM Insured | 1/15 at 100.00 | AA+ | 1,036,100 | ||||
| 33,125 | Total Nebraska | 31,561,733 | ||||||
| Nevada – 6.9% (4.4% of Total Investments) | ||||||||
| 8,475 | Clark County, Nevada, General Obligation Bank Bonds, Southern Nevada Water Authority Loan, Series 2002, 5.000%, 6/01/32 – NPFG Insured | 12/12 at 100.00 | AA+ | 8,487,458 | ||||
| 3,630 | Clark County, Nevada, General Obligation Bank Bonds, Southern Nevada Water Authority Loan, Series 2002, 5.000%, 6/01/32 (Pre-refunded 12/01/12) – NPFG Insured | 12/12 at 100.00 | AA+ (4) | 3,891,650 | ||||
| 14,140 | Clark County, Nevada, Passenger Facility Charge Revenue Bonds, Las Vegas-McCarran International Airport, Series 2010A, 5.250%, 7/01/39 – AGM Insured | 1/20 at 100.00 | AA+ | 13,327,091 | ||||
| 7,370 | Clark County, Nevada, Subordinate Lien Airport Revenue Bonds, Series 2004A-2, 5.125%, 7/01/25 – FGIC Insured | 7/14 at 100.00 | Aa3 | 7,423,064 | ||||
| Director of Nevada State Department of Business and Industry, Revenue Bonds, Las Vegas Monorail Project, First Tier, Series 2000: | ||||||||
| 15,000 | 5.625%, 1/01/34 – AMBAC Insured (6) | 1/12 at 100.00 | N/R | 3,762,300 | ||||
| 11,400 | 5.375%, 1/01/40 – AMBAC Insured (6) | 7/11 at 100.00 | N/R | 2,858,892 | ||||
| 14,985 | Reno, Nevada, Capital Improvement Revenue Bonds, Series 2002, 5.375%, 6/01/32 – FGIC Insured | 6/12 at 100.00 | A | 13,650,136 | ||||
| 25,300 | Reno, Nevada, Capital Improvement Revenue Bonds, Series 2002, 5.375%, 6/01/32 (Pre-refunded 6/01/12) – FGIC Insured | 6/12 at 100.00 | A3 (4) | 26,666,452 | ||||
| 10,000 | Reno, Nevada, Senior Lien Sales and Room Tax Revenue Bonds, Reno Transportation Rail Access Corridor Project, Series 2002, 5.125%, 6/01/27 (Pre-refunded 6/01/12) – AMBAC Insured | 6/12 at 100.00 | N/R (4) | 10,516,300 | ||||
| 110,300 | Total Nevada | 90,583,343 | ||||||
| New Jersey – 4.3% (2.8% of Total Investments) | ||||||||
| Essex County Improvement Authority, New Jersey, Guaranteed Revenue Bonds, Project Consolidation, Series 2004: | ||||||||
| 2,000 | 5.125%, 10/01/21 – NPFG Insured | 10/14 at 100.00 | Aa2 | 2,088,020 | ||||
| 2,250 | 5.125%, 10/01/22 – NPFG Insured | 10/14 at 100.00 | Aa2 | 2,337,863 | ||||
| New Jersey Economic Development Authority, Revenue Bonds, Motor Vehicle Surcharge, Series 2004A: | ||||||||
| 3,850 | 5.000%, 7/01/22 – NPFG Insured | 7/14 at 100.00 | A | 3,911,215 | ||||
| 3,850 | 5.000%, 7/01/23 – NPFG Insured | 7/14 at 100.00 | A | 3,891,888 | ||||
| 26,000 | New Jersey Turnpike Authority, Revenue Bonds, Refunding Series 2005D-1, 5.250%, 1/01/26 – AGM Insured | No Opt. Call | AA+ | 28,368,859 | ||||
| New Jersey Turnpike Authority, Revenue Bonds, Series 2003A: | ||||||||
| 8,250 | 5.000%, 1/01/19 – FGIC Insured | 7/13 at 100.00 | A+ | 8,741,618 | ||||
| 2,000 | 5.000%, 1/01/23 – AGM Insured | 7/13 at 100.00 | AA+ | 2,050,960 | ||||
| 3,320 | New Jersey Turnpike Authority, Revenue Bonds, Series 2005A, 5.000%, 1/01/21 – AGM Insured | 1/15 at 100.00 | AA+ | 3,484,207 | ||||
| 1,330 | Washington Township Board of Education, Mercer County, New Jersey, General Obligation Bonds, Series 2005, 5.250%, 1/01/26 – AGM Insured | No Opt. Call | Aa2 | 1,533,118 | ||||
| 52,850 | Total New Jersey | 56,407,748 | ||||||
| New Mexico – 1.3% (0.9% of Total Investments) | ||||||||
| 3,660 | San Juan County, New Mexico, Subordinate Gross Receipts Tax Revenue Bonds, Series 2005, 5.000%, 6/15/25 – NPFG Insured | 6/15 at 100.00 | Aa3 | 3,757,319 | ||||
| 13,600 | University of New Mexico, System Improvement Subordinated Lien Revenue Bonds, Series 2007A, 5.000%, 6/01/36 – AGM Insured | 6/17 at 100.00 | AA+ | 13,570,488 | ||||
| 17,260 | Total New Mexico | 17,327,807 |
| 40 | Nuveen Investments |
| Principal | Optional Call | |||||||
| Amount (000) | Description (1) | Provisions (2) | Ratings (3) | Value | ||||
| New York – 7.8% (5.0% of Total Investments) | ||||||||
| $ | 1,880 | Dormitory Authority of the State of New York, FHA-Insured Mortgage Revenue Bonds, Montefiore Hospital, Series 2004, 5.000%, 8/01/23 – FGIC Insured | 2/15 at 100.00 | BBB | $ | 1,926,906 | ||
| 7,225 | Dormitory Authority of the State of New York, Revenue Bonds, Non State Supported Debt, Cornell University, Series 2010A, 5.000%, 7/01/35 | 7/20 at 100.00 | Aa1 | 7,414,295 | ||||
| 3,335 | Dormitory Authority of the State of New York, State Personal Income Tax Revenue Bonds, Series 2005F, 5.000%, 3/15/24 – AMBAC Insured | 3/15 at 100.00 | AAA | 3,550,541 | ||||
| 3,820 | Hudson Yards Infrastructure Corporation, New York, Revenue Bonds, Series 2006A, 4.500%, 2/15/47 – NPFG Insured | 2/17 at 100.00 | A | 2,907,173 | ||||
| 12,500 | Long Island Power Authority, New York, Electric System General Revenue Bonds, Series 2006A, 5.000%, 12/01/25 – FGIC Insured | 6/16 at 100.00 | A– | 12,918,750 | ||||
| 6,900 | Long Island Power Authority, New York, Electric System Revenue Bonds, Series 2006F, 4.250%, 5/01/33 – NPFG Insured | 11/16 at 100.00 | A– | 6,200,478 | ||||
| Metropolitan Transportation Authority, New York, State Service Contract Refunding Bonds, Series 2002A: | ||||||||
| 1,500 | 5.000%, 7/01/21 – FGIC Insured | 7/12 at 100.00 | AA– | 1,556,280 | ||||
| 5,000 | 5.000%, 7/01/25 – FGIC Insured | 7/12 at 100.00 | AA– | 5,018,300 | ||||
| 3,025 | Monroe County Industrial Development Corporation, New York, FHA Insured Mortgage Revenue Bonds, Unity Hospital of Rochestor Project, Series 2010, 5.500%, 8/15/40 | 2/21 at 100.00 | Aa2 | 3,043,150 | ||||
| 2,615 | New York City Industrial Development Agency, New York, Revenue Bonds, Yankee Stadium Project PILOT, Series 2009A, 7.000%, 3/01/49 – AGC Insured | 3/19 at 100.00 | AA+ | 2,844,283 | ||||
| 5,000 | New York City, New York, General Obligation Bonds, Fiscal Series 2005F-1, 5.000%, 9/01/21 – AMBAC Insured | 9/15 at 100.00 | AA | 5,392,200 | ||||
| 10,000 | New York City, New York, General Obligation Bonds, Fiscal Series 2005M, 5.000%, 4/01/26 – FGIC Insured | 4/15 at 100.00 | AA | 10,244,400 | ||||
| 5,000 | New York State Thruway Authority, General Revenue Bonds, Series 2005F, 5.000%, 1/01/26 – AMBAC Insured | 1/15 at 100.00 | A+ | 5,048,050 | ||||
| 14,000 | New York State Thruway Authority, General Revenue Bonds, Series 2005G, 5.000%, 1/01/30 – AGM Insured | 7/15 at 100.00 | AA+ | 14,143,360 | ||||
| New York State Urban Development Corporation, State Personal Income Tax Revenue Bonds, Series 2004A-1: | ||||||||
| 1,000 | 5.000%, 3/15/23 – FGIC Insured | 3/14 at 100.00 | AAA | 1,062,530 | ||||
| 5,000 | 5.000%, 3/15/25 – FGIC Insured | 3/14 at 100.00 | AAA | 5,233,600 | ||||
| 3,650 | New York State Urban Development Corporation, Service Contract Revenue Bonds, 2005B, 5.000%, 3/15/25 – AGM Insured (UB) | 3/15 at 100.00 | AAA | 3,852,356 | ||||
| 10,000 | Triborough Bridge and Tunnel Authority, New York, Subordinate Lien General Purpose Revenue Refunding Bonds, Series 2002E, 5.000%, 11/15/32 – NPFG Insured | 11/12 at 100.00 | Aa3 | 10,031,400 | ||||
| 101,450 | Total New York | 102,388,052 | ||||||
| North Carolina – 1.3% (0.8% of Total Investments) | ||||||||
| Mooresville, North Carolina, Enterprise System Revenue Bonds, Series 2004: | ||||||||
| 2,115 | 5.000%, 5/01/22 – FGIC Insured | 5/14 at 100.00 | AA– | 2,234,201 | ||||
| 2,575 | 5.000%, 5/01/26 – FGIC Insured | 5/14 at 100.00 | AA– | 2,618,054 | ||||
| 5,250 | North Carolina Municipal Power Agency 1, Catawba Electric Revenue Bonds, Series 2003A, 5.250%, 1/01/16 – AGM Insured | 1/13 at 100.00 | AA+ | 5,577,390 | ||||
| Raleigh Durham Airport Authority, North Carolina, Airport Revenue Bonds, Series 2005A: | ||||||||
| 3,205 | 5.000%, 5/01/23 – AMBAC Insured | 5/15 at 100.00 | Aa3 | 3,338,200 | ||||
| 3,295 | 5.000%, 5/01/24 – AMBAC Insured | 5/15 at 100.00 | Aa3 | 3,414,213 | ||||
| 16,440 | Total North Carolina | 17,182,058 |
| Nuveen Investments | 41 |
Nuveen Insured Municipal Opportunity Fund, Inc. (continued) | ||
| NIO | Portfolio of Investments |
April 30, 2011 (Unaudited)
| Principal | Optional Call | |||||||
| Amount (000) | Description (1) | Provisions (2) | Ratings (3) | Value | ||||
| North Dakota – 0.5% (0.3% of Total Investments) | ||||||||
| Grand Forks, North Dakota, Sales Tax Revenue Bonds, Alerus Project, Series 2005A: | ||||||||
| $ | 2,195 | 5.000%, 12/15/22 – NPFG Insured | 12/15 at 100.00 | Aa3 | $ | 2,324,834 | ||
| 1,355 | 5.000%, 12/15/23 – NPFG Insured | 12/15 at 100.00 | Aa3 | 1,424,051 | ||||
| 3,000 | 5.000%, 12/15/24 – NPFG Insured | 12/15 at 100.00 | Aa3 | 3,130,350 | ||||
| 6,550 | Total North Dakota | 6,879,235 | ||||||
| Ohio – 3.8% (2.5% of Total Investments) | ||||||||
| 2,650 | Cleveland State University, Ohio, General Receipts Bonds, Series 2004, 5.250%, 6/01/24 – FGIC Insured | 6/14 at 100.00 | A+ | 2,733,290 | ||||
| 2,000 | Columbus City School District, Franklin County, Ohio, General Obligation Bonds, Series 2004, 5.250%, 12/01/25 (Pre-refunded 12/01/14) – AGM Insured | 12/14 at 100.00 | AA+ (4) | 2,293,620 | ||||
| 2,385 | Columbus, Ohio, Tax Increment Financing Bonds, Easton Project, Series 2004A, 5.000%, 12/01/22 – AMBAC Insured | 6/14 at 100.00 | BBB+ | 2,446,032 | ||||
| 2,205 | Hamilton City School District, Ohio, General Obligation Bonds, Series 2005, 5.000%, 12/01/24 – NPFG Insured | 6/15 at 100.00 | Baa1 | 2,263,565 | ||||
| 19,595 | Hamilton County, Ohio, Sales Tax Bonds, Subordinate Lien, Series 2006, 4.250%, 12/01/32 – AMBAC Insured | 12/16 at 100.00 | A1 | 16,944,384 | ||||
| 20,100 | Lucas County, Ohio, Hospital Revenue Bonds, ProMedica Healthcare Obligated Group, Series 1999, 5.375%, 11/15/39 – AMBAC Insured | 5/11 at 100.50 | AA– | 18,367,380 | ||||
| 3,000 | Ross Local School District, Butler County, Ohio, General Obligation Bonds, Series 2003, 5.000%, 12/01/28 (Pre-refunded 12/01/13) – AGM Insured | 12/13 at 100.00 | Aa2 (4) | 3,334,290 | ||||
| 2,000 | University of Akron, Ohio, General Receipts Bonds, Federally Taxable Build America Bonds, Series 2010B, 5.000%, 1/01/29 – AGM Insured | 1/20 at 100.00 | AA+ | 2,024,440 | ||||
| 53,935 | Total Ohio | 50,407,001 | ||||||
| Oklahoma – 2.3% (1.5% of Total Investments) | ||||||||
| 3,500 | Oklahoma Capitol Improvement Authority, State Facilities Revenue Bonds, Series 2005F, 5.000%, 7/01/24 – AMBAC Insured | 7/15 at 100.00 | AA | 3,637,165 | ||||
| Oklahoma City Water Utilities Trust, Oklahoma, Water and Sewer Revenue Bonds, Series 2010: | ||||||||
| 1,500 | 5.000%, 7/01/40 | 7/21 at 100.00 | AAA | 1,545,135 | ||||
| 1,000 | 5.375%, 7/01/40 | No Opt. Call | AAA | 1,066,100 | ||||
| 1,445 | Oklahoma Housing Finance Agency, GNMA Collateralized Single Family Mortgage Revenue Bonds, Series 1987A, 7.997%, 8/01/18 (Alternative Minimum Tax) | No Opt. Call | AAA | 1,456,878 | ||||
| 21,000 | Oklahoma Municipal Power Authority, Power Supply System Revenue Bonds, Series 2007, 4.500%, 1/01/47 – FGIC Insured | 1/17 at 100.00 | A | 18,259,080 | ||||
| 4,880 | University of Oklahoma, Student Housing Revenue Bonds, Series 2004, 5.000%, 7/01/22 – AMBAC Insured | 7/14 at 100.00 | Aa3 | 4,963,497 | ||||
| 33,325 | Total Oklahoma | 30,927,855 | ||||||
| Oregon – 0.5% (0.3% of Total Investments) | ||||||||
| 2,535 | Oregon Department of Administrative Services, Certificates of Participation, Series 2005A, 5.000%, 5/01/25 – AGM Insured | 5/15 at 100.00 | AA+ | 2,615,841 | ||||
| 4,000 | Oregon Department of Administrative Services, State Lottery Revenue Bonds, Series 2011A, 5.250%, 4/01/31 | 4/21 at 100.00 | AAA | 4,299,160 | ||||
| 6,535 | Total Oregon | 6,915,001 | ||||||
| Pennsylvania – 5.2% (3.3% of Total Investments) | ||||||||
| 2,165 | Allegheny County Sanitary Authority, Pennsylvania, Sewerage Revenue Bonds, Series 2010, 5.000%, 6/01/40 – AGM Insured | No Opt. Call | AA+ | 2,135,491 | ||||
| 7,925 | Commonwealth Financing Authority, Pennsylvania, State Appropriation Lease Bonds, Series 2006A, 5.000%, 6/01/26 – AGM Insured (UB) | 6/16 at 100.00 | AA+ | 8,177,649 | ||||
| 5,250 | Delaware River Port Authority, New Jersey and Pennsylvania, Revenue Bonds, Series 2010E, 5.000%, 1/01/40 – AGM Insured | 1/20 at 100.00 | AA+ | 5,186,580 |
| 42 | Nuveen Investments |
| Principal | Optional Call | |||||||
| Amount (000) | Description (1) | Provisions (2) | Ratings (3) | Value | ||||
Pennsylvania (continued) | ||||||||
| $ | 1,565 | Montgomery County Industrial Development Authority, Pennsylvania, FHA Insured Mortgage Revenue Bonds, New Regional Medical Center Project, Series 2010, 5.375%, 8/01/38 | 8/20 at 100.00 | AA | $ | 1,574,500 | ||
| 1,800 | Pennsylvania Higher Educational Facilities Authority, Revenue Bonds, Drexel University, Series 2005A, 5.000%, 5/01/28 – NPFG Insured | 5/15 at 100.00 | A | 1,817,532 | ||||
| Pennsylvania Public School Building Authority, Lease Revenue Bonds, School District of Philadelphia, Series 2006B: | ||||||||
| 5,000 | 4.500%, 6/01/32 – AGM Insured | 12/16 at 100.00 | AA+ | 4,694,850 | ||||
| 6,740 | 4.500%, 6/01/32 – AGM Insured (UB) | 12/16 at 100.00 | AA+ | 6,328,658 | ||||
| 2,625 | Pennsylvania Turnpike Commission, Turnpike Revenue Bonds, Series 2006A, 5.000%, 12/01/26 – AMBAC Insured | 6/16 at 100.00 | Aa3 | 2,712,938 | ||||
| 10,000 | Philadelphia, Pennsylvania, Airport Revenue Bonds, Series 2010A, 5.000%, 6/15/40 – AGM Insured | 6/20 at 100.00 | AA+ | 9,715,600 | ||||
| 7,055 | Pittsburgh and Allegheny County Sports and Exhibition Authority, Pennsylvania, Hotel Room Excise Tax Revenue Bonds, Refunding Series 2010, 5.000%, 2/01/35 – AGC Insured | 8/20 at 100.00 | AA+ | 6,724,544 | ||||
| 5,180 | Pittsburgh and Allegheny County Sports and Exhibition Authority, Pennsylvania, Sales Tax Revenue Bonds, Refunding Series 2010, 5.000%, 2/01/31 – AGM Insured | 8/20 at 100.00 | AA+ | 5,166,687 | ||||
| 6,335 | Radnor Township School District, Delaware County, Pennsylvania, General Obligation Bonds, Series 2005B, 5.000%, 2/15/30 – AGM Insured | 8/15 at 100.00 | Aa2 | 6,495,592 | ||||
| 3,285 | Reading School District, Berks County, Pennsylvania, General Obligation Bonds, Series 2005, 5.000%, 1/15/22 – AGM Insured | 1/16 at 100.00 | AA+ | 3,487,323 | ||||
| 3,450 | Reading School District, Berks County, Pennsylvania, General Obligation Bonds, Series 2005, 5.000%, 1/15/23 – AGM Insured (UB) | 1/16 at 100.00 | AA+ | 3,642,407 | ||||
| 68,375 | Total Pennsylvania | 67,860,351 | ||||||
| Puerto Rico – 0.8% (0.5% of Total Investments) | ||||||||
| 2,500 | Puerto Rico Electric Power Authority, Power Revenue Bonds, Series 2005RR, 5.000%, 7/01/30 (Pre-refunded 7/01/15) – SYNCORA GTY Insured | 7/15 at 100.00 | AAA | 2,876,075 | ||||
| 2,000 | Puerto Rico Highway and Transportation Authority, Highway Revenue Bonds, Series 2003G, 5.250%, 7/01/19 – FGIC Insured | 7/13 at 100.00 | A3 | 2,016,980 | ||||
| 1,550 | Puerto Rico Municipal Finance Agency, Series 2005C, 5.250%, 8/01/21 – CIFG Insured | No Opt. Call | A3 | 1,563,454 | ||||
| 36,000 | Puerto Rico Sales Tax Financing Corporation, Sales Tax Revenue Bonds, Series 2007A, 0.000%, 8/01/42 – NPFG Insured | No Opt. Call | Aa2 | 4,531,320 | ||||
| 42,050 | Total Puerto Rico | 10,987,829 | ||||||
| Rhode Island – 0.3% (0.2% of Total Investments) | ||||||||
| 2,195 | Providence Housing Development Corporation, Rhode Island, FHA-Insured Section 8 Assisted Mortgage Revenue Refunding Bonds, Barbara Jordan Apartments, Series 1994A, 6.750%, 7/01/25 – NPFG Insured | 7/11 at 100.00 | Baa1 | 2,198,336 | ||||
| 1,405 | Rhode Island Health & Educational Building Corporation, Higher Education Auxiliary Enterprise Revenue Bonds, Series 2004A, 5.500%, 9/15/24 – AMBAC Insured | 9/14 at 100.00 | A1 | 1,469,995 | ||||
| 3,600 | Total Rhode Island | 3,668,331 | ||||||
| South Carolina – 5.5% (3.6% of Total Investments) | ||||||||
| 14,650 | Anderson County School District 5, South Carolina, General Obligation Bonds, Series 2008, Trust 1181, 9.658%, 8/01/15 – AGM Insured (IF) | No Opt. Call | AA+ | 15,155,718 | ||||
| 10,000 | Beaufort County, South Carolina, Tax Increment Bonds, New River Redevelopment Project, Series 2002, 5.000%, 6/01/27 – NPFG Insured | 12/12 at 100.00 | A+ | 10,049,600 | ||||
| Medical University Hospital Authority, South Carolina, FHA-Insured Mortgage Revenue Bonds, Series 2004A: | ||||||||
| 2,000 | 5.250%, 8/15/22 – NPFG Insured | 8/14 at 100.00 | Baa1 | 2,088,380 | ||||
| 2,605 | 5.250%, 8/15/23 – NPFG Insured | 8/14 at 100.00 | Baa1 | 2,700,421 | ||||
| 2,385 | 5.250%, 8/15/25 – NPFG Insured | 8/14 at 100.00 | Baa1 | 2,425,450 |
| Nuveen Investments | 43 |
Nuveen Insured Municipal Opportunity Fund, Inc. (continued) | ||
| NIO | Portfolio of Investments |
April 30, 2011 (Unaudited)
| Principal | Optional Call | |||||||
| Amount (000) | Description (1) | Provisions (2) | Ratings (3) | Value | ||||
South Carolina (continued) | ||||||||
| $ | 375 | Piedmont Municipal Power Agency, South Carolina, Electric Revenue Bonds, Series 1988, 0.000%, 1/01/13 – AMBAC Insured (ETM) | No Opt. Call | Aaa | $ | 334,084 | ||
| 5,880 | Piedmont Municipal Power Agency, South Carolina, Electric Revenue Bonds, Series 1988, 0.000%, 1/01/13 – AMBAC Insured | No Opt. Call | N/R | 5,425,770 | ||||
| 8,000 | South Carolina JOBS Economic Development Authority, Industrial Revenue Bonds, South Carolina Electric and Gas Company, Series 2002A, 5.200%, 11/01/27 – AMBAC Insured | 11/12 at 100.00 | A | 8,100,960 | ||||
| 10,000 | South Carolina JOBS Economic Development Authority, Industrial Revenue Bonds, South Carolina Electric and Gas Company, Series 2002B, 5.450%, 11/01/32 – AMBAC Insured (Alternative Minimum Tax) | 11/12 at 100.00 | A | 9,369,000 | ||||
| 1,250 | South Carolina Jobs-Economic Development Authority, Hospital Revenue Bonds, Palmetto Health, Refunding Series 2011A, 6.500%, 8/01/39 (WI/DD, Settling 5/02/11) – AGM Insured | 8/21 at 100.00 | AA+ | 1,273,250 | ||||
| 17,500 | South Carolina Transportation Infrastructure Bank, Revenue Bonds, Series 2007A, 4.500%, 10/01/34 – SYNCORA GTY Insured | 10/16 at 100.00 | A1 | 15,873,375 | ||||
| 74,645 | Total South Carolina | 72,796,008 | ||||||
| Texas – 9.3% (6.0% of Total Investments) | ||||||||
| 4,405 | Bexar County, Texas, Venue Project Revenue Bonds, Refunding Series 2010, 5.500%, 8/15/49 – AGM Insured | 8/19 at 100.00 | AA+ | 4,413,325 | ||||
| 421 | Capital Area Housing Finance Corporation, Texas, FNMA Backed Single Family Mortgage Revenue Refunding Bonds, Series 2002A-2, 6.300%, 4/01/35 – AMBAC Insured (Alternative Minimum Tax) | 4/12 at 106.00 | Aaa | 439,710 | ||||
| 12,500 | Dallas-Ft. Worth International Airport, Texas, Joint Revenue Bonds, Series 2000A, 6.125%, 11/01/35 – NPFG Insured (Alternative Minimum Tax) | 11/11 at 100.00 | A+ | 12,507,375 | ||||
| 25,000 | Harris County-Houston Sports Authority, Texas, Junior Lien Revenue Refunding Bonds, Series 2001B, 5.250%, 11/15/40 – NPFG Insured | 11/11 at 100.00 | Baa1 | 18,122,000 | ||||
| 4,671 | Houston Housing Finance Corporation, Texas, GNMA Collateralized Mortgage Multifamily Housing Revenue Bonds, RRG Apartments Project, Series 2001, 6.350%, 3/20/42 | 9/11 at 105.00 | Aaa | 4,751,855 | ||||
| Houston, Texas, First Lien Combined Utility System Revenue Bonds, Series 2004A: | ||||||||
| 4,000 | 5.250%, 5/15/24 – FGIC Insured | 5/14 at 100.00 | AA | 4,276,680 | ||||
| 5,000 | 5.250%, 5/15/25 – NPFG Insured | 5/14 at 100.00 | AA | 5,300,700 | ||||
| 17,500 | Houston, Texas, Hotel Occupancy Tax and Special Revenue Bonds, Convention and Entertainment Project, Series 2001B, 5.250%, 9/01/33 – AMBAC Insured | 9/11 at 100.00 | A2 | 15,746,150 | ||||
| 900 | Houston, Texas, Subordinate Lien Airport System Revenue Bonds, Series 2000A, 5.625%, 7/01/30 – AGM Insured (Alternative Minimum Tax) | 7/11 at 100.00 | AA+ | 900,018 | ||||
| 23,865 | Jefferson County Health Facilities Development Corporation, Texas, FHA-Insured Mortgage | 8/11 at 100.00 | N/R (4) | 24,196,485 | ||||
| Revenue Bonds, Baptist Hospital of Southeast Texas, Series 2001, 5.500%, 8/15/41 (Pre-refunded 8/15/11) – AMBAC Insured | ||||||||
| Lower Colorado River Authority, Texas, Revenue Refunding and Improvement Bonds, Series 2001A: | ||||||||
| 140 | 5.000%, 5/15/21 (Pre-refunded 5/15/11) – NPFG Insured | 5/11 at 100.00 | A1 (4) | 140,291 | ||||
| 5,105 | 5.000%, 5/15/21 (Pre-refunded 5/15/11) – NPFG Insured | 5/11 at 100.00 | A1 (4) | 5,115,618 | ||||
| 2,960 | Lower Colorado River Authority, Texas, Revenue Refunding and Improvement Bonds, Series 2001A, 5.000%, 5/15/21 – NPFG Insured | 5/11 at 100.00 | A1 | 2,967,459 | ||||
| Port of Houston Authority, Harris County, Texas, General Obligation Port Improvement Bonds, Series 2001B: | ||||||||
| 3,205 | 5.500%, 10/01/18 – FGIC Insured (Alternative Minimum Tax) | 10/11 at 100.00 | AAA | 3,234,710 | ||||
| 3,375 | 5.500%, 10/01/19 – FGIC Insured (Alternative Minimum Tax) | 10/11 at 100.00 | AAA | 3,431,126 | ||||
| 7,205 | San Antonio, Texas, Airport System Improvement Revenue Bonds, Series 2001, 5.375%, 7/01/15 (Pre-refunded 7/01/11) – FGIC Insured (Alternative Minimum Tax) | 7/11 at 101.00 | A+ (4) | 7,329,430 |
| 44 | Nuveen Investments |
| Principal | Optional Call | |||||||
| Amount (000) | Description (1) | Provisions (2) | Ratings (3) | Value | ||||
Texas (continued) | ||||||||
| $ | 7,550 | Waco Health Facilities Development Corporation, Texas, Hillcrest Health System Project, FHA Insured Mortgage Revenue Bonds, Series 2006A, 5.000%, 8/01/31 – NPFG Insured | 8/16 at 100.00 | Baa1 | $ | 7,109,307 | ||
| 1,840 | Ysleta Independent School District Public Facility Corporation, Texas, Lease Revenue Refunding Bonds, Series 2001, 5.375%, 11/15/24 – AMBAC Insured | 5/11 at 100.00 | AA– | 1,874,353 | ||||
| 129,642 | Total Texas | 121,856,592 | ||||||
| Utah – 1.3% (0.9% of Total Investments) | ||||||||
| 2,000 | Clearfield City, Utah, Sales Tax Revenue Bonds, Series 2003, 5.000%, 7/01/28 (Pre-refunded 7/01/13) – FGIC Insured | 7/13 at 100.00 | AA– (4) | 2,186,660 | ||||
| 15,000 | Utah Transit Authority, Sales Tax Revenue Bonds, 2008A, 5.000%, 6/15/32 – AGM Insured (UB) | 6/18 at 100.00 | AAA | 15,530,850 | ||||
| 17,000 | Total Utah | 17,717,510 | ||||||
| Virginia – 1.3% (0.8% of Total Investments) | ||||||||
| 1,035 | Loudoun County Industrial Development Authority, Virginia, Lease Revenue Bonds, Public Safety Facilities, Series 2003A, 5.250%, 12/15/20 – AGM Insured | 6/14 at 100.00 | AA+ | 1,135,581 | ||||
| 4,840 | Metropolitan Washington D.C. Airports Authority, Airport System Revenue Bonds, Series 2001A, 5.500%, 10/01/19 – NPFG Insured (Alternative Minimum Tax) | 10/11 at 101.00 | AA– | 4,966,663 | ||||
| 1,000 | Roanoke Industrial Development Authority, Virginia, Hospital Revenue Bonds, Carillion Health System Obligated Group, Series 2005B, 5.000%, 7/01/38 – AGM Insured | 7/20 at 100.00 | AA+ | 950,770 | ||||
| 10,000 | Virginia Housing Development Authority, Commonwealth Mortgage Bonds, Series 2001H-1, 5.375%, 7/01/36 – NPFG Insured (UB) | 7/11 at 100.00 | AAA | 10,004,900 | ||||
| 16,875 | Total Virginia | 17,057,914 | ||||||
| Washington – 4.6% (2.9% of Total Investments) | ||||||||
| 2,500 | Grant County Public Utility District 2, Washington, Revenue Bonds, Wanapum Hydroelectric Development, Series 2005A, 5.000%, 1/01/29 – FGIC Insured | 1/15 at 100.00 | AA– | 2,522,775 | ||||
| 3,500 | King County School District 401, Highline, Washington, General Obligation Bonds, Series 2004, 5.000%, 10/01/24 – FGIC Insured | 12/14 at 100.00 | AA+ | 3,696,455 | ||||
| 7,500 | King County, Washington, General Obligation Sewer Bonds, Series 2009, Trust 1W, 9.516%, 1/01/39 – AGC Insured (IF) (5) | 1/19 at 100.00 | AA+ | 7,971,600 | ||||
| 17,000 | King County, Washington, Sewer Revenue Bonds, Series 2007, 5.000%, 1/01/42 – AGM Insured | 7/17 at 100.00 | AA+ | 17,003,230 | ||||
| 4,345 | King County, Washington, Sewer Revenue Bonds, Tender Option Bond Trust 3090, 13.326%, 7/01/32 – AGM Insured (IF) | 7/17 at 100.00 | AA+ | 4,361,294 | ||||
| 4,250 | Snohomish County Public Utility District 1, Washington, Generation System Revenue Bonds, Series 1989, 6.650%, 1/01/16 – FGIC Insured (ETM) | No Opt. Call | Aaa | 5,241,100 | ||||
| Tacoma, Washington, Solid Waste Utility Revenue Refunding Bonds, Series 2006: | ||||||||
| 3,890 | 5.000%, 12/01/24 – SYNCORA GTY Insured | 12/16 at 100.00 | AA | 4,072,247 | ||||
| 4,085 | 5.000%, 12/01/25 – SYNCORA GTY Insured | 12/16 at 100.00 | AA | 4,246,153 | ||||
| 4,290 | 5.000%, 12/01/26 – SYNCORA GTY Insured | 12/16 at 100.00 | AA | 4,433,329 | ||||
| 5,945 | Washington State, General Obligation Bonds, Series 2006, Trust 1212, 13.293%, 7/01/14 – AGM Insured (IF) | No Opt. Call | AA+ | 6,421,730 | ||||
| 57,305 | Total Washington | 59,969,913 | ||||||
| West Virginia – 0.7% (0.5% of Total Investments) | ||||||||
| 10,000 | West Virginia Economic Development Authority, State Lottery Revenue Bonds, Series 2010A, 5.000%, 6/15/40 | 6/20 at 100.00 | AAA | 9,671,900 |
| Nuveen Investments | 45 |
Nuveen Insured Municipal Opportunity Fund, Inc. (continued) | ||
| NIO | Portfolio of Investments |
April 30, 2011 (Unaudited)
| Principal | Optional Call | |||||||
| Amount (000) | Description (1) | Provisions (2) | Ratings (3) | Value | ||||
| Wisconsin – 2.3% (1.5% of Total Investments) | ||||||||
| $ | 15,000 | Wisconsin Health and Educational Facilities Authority, Revenue Bonds, Marshfield Clinic, Series 1997, 5.750%, 2/15/27 – NPFG Insured | 8/11 at 100.00 | Baa1 | $ | 14,619,150 | ||
| 290 | Wisconsin State, General Obligation Bonds, Series 2004-3, 5.250%, | 5/14 at 100.00 | AA | 316,152 | ||||
| 5/01/20 – FGIC Insured | ||||||||
| 2,600 | Wisconsin State, General Obligation Bonds, Series 2004-3, 5.250%, 5/01/20 (Pre-refunded 5/01/14) – FGIC Insured | 5/14 at 100.00 | Aa2 (4) | 2,939,196 | ||||
| 10,945 | Wisconsin State, General Obligation Bonds, Series 2004-4, 5.000%, | 5/14 at 100.00 | AA | 11,775,615 | ||||
| 5/01/20 – NPFG Insured | ||||||||
| 28,835 | Total Wisconsin | 29,650,113 | ||||||
| $ | 2,253,450 | Total Long-Term Investments (cost $2,070,629,148) – 154.9% | 2,039,823,431 | |||||
| Short-Term Investments – 0.2% (0.1% of Total Investments) | ||||||||
| $ | 2,500 | Sampson County, North Carolina, Certificates of Participation, Series 2006, Variable Rate Demand Obligations Series 112, 0.360%, 6/01/34 (7) | No Opt. Call | A-1 | 2,500,000 | |||
| Total Short-Term Investments (cost $2,500,000) | 2,500,000 | |||||||
| Total Investments (cost $2,073,129,148) – 155.1% | 2,042,323,431 | |||||||
| Floating Rate Obligations – (8.7)% | (114,193,333 | ) | ||||||
| Variable Rate Demand Preferred Shares, at Liquidation Value – (50.7)% (8) | (667,200,000 | ) | ||||||
| Other Assets Less Liabilities – 4.3% | 55,581,186 | |||||||
| Net Assets Applicable to Common Shares – 100% | $ | 1,316,511,284 |
| The Fund intends to invest at least 80% of its managed assets in municipal securities that are covered by insurance guaranteeing the timely payment of principal and interest. See Notes to Financial Statements, Footnote 1 – General Information and Significant Accounting Policies, Insurance for more information. | ||
| (1) | All percentages shown in the Portfolio of Investments are based on net assets applicable to Common shares unless otherwise noted. | |
| (2) | Optional Call Provisions: Dates (month and year) and prices of the earliest optional call or redemption. There may be other call provisions at varying prices at later dates. Certain mortgage-backed securities may be subject to periodic principal paydowns. | |
| (3) | Ratings: Using the highest of Standard & Poor’s Group (“Standard & Poor’s”), Moody’s Investor Service, Inc. (“Moody’s”) or Fitch, Inc. (“Fitch”) rating. Ratings below BBB by Standard & Poor’s, Baa by Moody’s or BBB by Fitch are considered to be below investment grade. Holdings designated N/R are not rated by any of these national rating agencies. | |
| (4) | Backed by an escrow or trust containing sufficient U.S. Government or U.S. Government agency securities, which ensure the timely payment of principal and interest. Such investments are normally considered to be equivalent to AAA rated securities. | |
| (5) | Investment, or portion of investment, has been pledged to collateralize the net payment obligations for investments in inverse floating rate transactions. | |
| (6) | At or subsequent to the end of the reporting period, this security is non-income producing. Non-income producing security, in the case of a bond, generally denotes that the issuer has (1) defaulted on the payment of principal or interest, (2) is under the protection of the Federal Bankruptcy Court or (3) the Fund’s Adviser has concluded that the issue is not likely to meet its future interest payment obligations and has directed the Fund’s custodian to cease accruing additional income on the Fund’s records. | |
| (7) | Investment has a maturity of more than one year, but has variable rate and demand features which qualify it as a short-term investment. The rate disclosed is that in effect at the end of the reporting period. This rate changes periodically based on market conditions or a specified market index. | |
| (8) | Variable Rate Demand Preferred Shares, at Liquidation Value as a percentage of Total Investments is 32.7%. | |
| N/R | Not rated. | |
| WI/DD | Purchased on a when-issued or delayed delivery basis. | |
| (ETM) | Escrowed to maturity. | |
| (IF) | Inverse floating rate investment. | |
| (UB) | Underlying bond of an inverse floating rate trust reflected as a financing transaction. See Notes to Financial Statements, Footnote 1 – General Information and Significant Accounting Policies, Inverse Floating Rate Securities for more information. |
See accompanying notes to financial statements.
| 46 | Nuveen Investments |
| Nuveen Premier Insured Municipal Income Fund, Inc. | ||
| NIF | Portfolio of Investments |
April 30, 2011 (Unaudited)
| Principal | Optional Call | |||||||
| Amount (000) | Description (1) | Provisions (2) | Ratings (3) | Value | ||||
| Alabama – 0.8% (0.5% of Total Investments) | ||||||||
| $ | 2,200 | Auburn, Alabama, General Obligation Warrants, Series 2005, 5.000%, | 8/15 at 100.00 | AA+ | $ | 2,230,536 | ||
| 8/01/30 – AMBAC Insured | ||||||||
| Arizona – 4.0% (2.6% of Total Investments) | ||||||||
| 2,000 | Arizona State, State Lottery Revenue Bonds, Series 2010A, 5.000%, | 1/20 at 100.00 | AA+ | 2,006,840 | ||||
| 7/01/29 – AGC Insured | ||||||||
| 4,370 | Phoenix Civic Improvement Corporation, Arizona, Junior Lien Water System Revenue Bonds, Series 2005, 4.750%, 7/01/25 – NPFG Insured | 7/15 at 100.00 | AAA | 4,470,117 | ||||
| 5,000 | Phoenix, Arizona, Civic Improvement Revenue Bonds, Civic Plaza, Series 2005B, 0.000%, 7/01/40 – FGIC Insured | No Opt. Call | AA | 4,221,350 | ||||
| 11,370 | Total Arizona | 10,698,307 | ||||||
| Arkansas – 1.6% (1.0% of Total Investments) | ||||||||
| 4,020 | Northwest Community College District, Arkansas, General Obligation Bonds, Series 2005, 5.000%, 5/15/23 – AMBAC Insured | 5/15 at 100.00 | A+ | 4,194,146 | ||||
| California – 25.4% (16.5% of Total Investments) | ||||||||
| 10 | California Department of Water Resources, Water System Revenue Bonds, Central Valley Project, Series 2005AC, 5.000%, 12/01/26 (Pre-refunded 12/01/14) – NPFG Insured | 12/14 at 100.00 | AAA | 11,454 | ||||
| 990 | California Department of Water Resources, Water System Revenue Bonds, Central Valley Project, Series 2005AC, 5.000%, 12/01/26 – NPFG Insured (UB) | 12/14 at 100.00 | AAA | 1,054,716 | ||||
| 1,250 | California Pollution Control Financing Authority, Remarketed Revenue Bonds, Pacific Gas and Electric Company, Series 1996A, 5.350%, 12/01/16 – NPFG Insured (Alternative Minimum Tax) | 10/11 at 102.00 | A3 | 1,276,000 | ||||
| 1,890 | Ceres Unified School District, Stanislaus County, California, General Obligation Bonds, Series 2002B, 0.000%, 8/01/30 – FGIC Insured | 8/12 at 34.89 | A+ | 491,362 | ||||
| 4,775 | Clovis Unified School District, Fresno County, California, General Obligation Bonds, Series 2001A, 0.000%, 8/01/25 – FGIC Insured (ETM) | No Opt. Call | AA+ (4) | 2,672,854 | ||||
| 1,005 | Folsom Cordova Unified School District, Sacramento County, California, General Obligation Bonds, School Facilities Improvement District 2, Series 2004B, 5.000%, 10/01/26 – AGM Insured | 10/14 at 100.00 | AA+ | 1,019,975 | ||||
| 1,150 | Kern Community College District, California, General Obligation Bonds, Series 2006, 0.000%, 11/01/23 – AGM Insured | No Opt. Call | AA+ | 559,096 | ||||
| 45 | Kern County Housing Authority, California, GNMA Guaranteed Tax-Exempt Mortgage Obligation Bonds, Series 1994A-I, 7.150%, 12/30/24 (Alternative Minimum Tax) | No Opt. Call | AAA | 46,665 | ||||
| 30 | Kern County Housing Authority, California, GNMA Guaranteed Tax-Exempt Mortgage Obligation Bonds, Series 1994A-III, 7.450%, 6/30/25 (Alternative Minimum Tax) | No Opt. Call | AAA | 31,178 | ||||
| 3,410 | La Verne-Grand Terrace Housing Finance Agency, California, Single Family Residential Mortgage Revenue Bonds, Series 1984A, 10.250%, 7/01/17 (ETM) | No Opt. Call | AAA | 4,343,794 | ||||
| 5,000 | Ontario Redevelopment Financing Authority, San Bernardino County, California, Revenue Refunding Bonds, Redevelopment Project 1, Series 1995, 7.400%, 8/01/25 – NPFG Insured | No Opt. Call | Baa1 | 5,657,500 | ||||
| 8,675 | Pomona, California, GNMA/FHLMC Collateralized Single Family Mortgage Revenue Refunding Bonds, Series 1990B, 7.500%, 8/01/23 (ETM) | No Opt. Call | AAA | 11,295,284 | ||||
| 6,525 | San Bernardino County, California, GNMA Mortgage-Backed Securities Program Single Family Home Mortgage Revenue Bonds, Series 1988A, 8.300%, 9/01/14 (Alternative Minimum Tax) (ETM) | No Opt. Call | AAA | 7,315,439 | ||||
| 8,355 | San Bernardino, California, GNMA Mortgage-Backed Securities Program Single Family Mortgage Revenue Refunding Bonds, Series 1990A, 7.500%, 5/01/23 (ETM) | No Opt. Call | AAA | 10,786,973 | ||||
| 4,300 | San Francisco Airports Commission, California, Revenue Refunding Bonds, San Francisco International Airport, Second Series 2001, Issue 27A, 5.125%, 5/01/19 – NPFG Insured (Alternative Minimum Tax) | 11/11 at 100.00 | A1 | 4,303,741 | ||||
| 29,000 | San Joaquin Hills Transportation Corridor Agency, Orange County, California, Toll Road Revenue Refunding Bonds, Series 1997A, 0.000%, 1/15/31 – NPFG Insured | No Opt. Call | Baa1 | 4,449,180 | ||||
| 2,000 | San Jose Redevelopment Agency, California, Tax Allocation Bonds, Merged Area Redevelopment Project, Series 2004A, 5.250%, 8/01/19 – NPFG Insured | 8/14 at 100.00 | BBB+ | 1,902,020 |
| Nuveen Investments | 47 |
Nuveen Premier Insured Municipal Income Fund, Inc. (continued) | ||
| NIF | Portfolio of Investments |
April 30, 2011 (Unaudited)
| Principal | Optional Call | |||||||
| Amount (000) | Description (1) | Provisions (2) | Ratings (3) | Value | ||||
California (continued) | ||||||||
| $ | 4,725 | San Jose Redevelopment Agency, California, Tax Allocation Bonds, Merged Area Redevelopment Project, Series 2006C, 4.250%, 8/01/30 – NPFG Insured | 8/17 at 100.00 | BBB+ | $ | 3,276,882 | ||
| 4,455 | San Mateo County Community College District, California, General Obligation Bonds, Series 2006B, 0.000%, 9/01/21 – NPFG Insured | No Opt. Call | Aaa | 2,626,356 | ||||
| 1,815 | University of California, General Revenue Bonds, Series 2005G, 4.750%, 5/15/31 – NPFG Insured | 5/13 at 101.00 | Aa1 | 1,745,703 | ||||
| 3,600 | Ventura County Community College District, California, General Obligation Bonds, Series 2005B, 5.000%, 8/01/28 – NPFG Insured | 8/15 at 100.00 | AA | 3,613,392 | ||||
| 93,005 | Total California | 68,479,564 | ||||||
| Colorado – 7.4% (4.8% of Total Investments) | ||||||||
| 3,000 | Colorado Health Facilities Authority, Colorado, Revenue Bonds, Catholic Health Initiatives, Series 2006C-1, Trust 1090, 14.832%, 10/01/41 – AGM Insured (IF) (5) | 4/18 at 100.00 | AA+ | 2,405,370 | ||||
| 2,500 | Denver City and County, Colorado, Airport System Revenue Refunding Bonds, Series 2002E, 5.500%, 11/15/18 – FGIC Insured (Alternative Minimum Tax) | 11/12 at 100.00 | A+ | 2,603,075 | ||||
| 20,000 | E-470 Public Highway Authority, Colorado, Senior Revenue Bonds, Series 2000B, 0.000%, 9/01/30 – NPFG Insured | No Opt. Call | Baa1 | 4,511,600 | ||||
| 4,405 | Garfield, Eagle and Pitkin Counties School District RE-1, Roaring Fork, Colorado, General Obligation Bonds, Series 2005A, 5.000%, 12/15/24 – AGM Insured | 12/14 at 100.00 | AA+ | 4,595,428 | ||||
| 2,065 | Jefferson County School District R1, Colorado, General Obligation Bonds, Series 2004, 5.000%, 12/15/24 (Pre-refunded 12/15/14) – AGM Insured (UB) | 12/14 at 100.00 | AA+ (4) | 2,357,982 | ||||
| 1,390 | Teller County School District RE-2, Woodland Park, Colorado, General Obligation Bonds, Series 2004, 5.000%, 12/01/22 (Pre-refunded 12/01/14) – NPFG Insured | 12/14 at 100.00 | Aa2 (4) | 1,587,102 | ||||
| 1,000 | University of Colorado, Enterprise System Revenue Bonds, Series 2002A, 5.000%, 6/01/19 (Pre-refunded 6/01/12) – FGIC Insured | 6/12 at 100.00 | Aa2 (4) | 1,050,580 | ||||
| 1,000 | University of Colorado, Enterprise System Revenue Bonds, Series 2005, 5.000%, 6/01/30 – FGIC Insured | 6/15 at 100.00 | Aa2 | 1,014,640 | ||||
| 35,360 | Total Colorado | 20,125,777 | ||||||
| District of Columbia – 0.2% (0.1% of Total Investments) | ||||||||
| 665 | Washington Convention Center Authority, District of Columbia, Senior Lien Dedicated Tax Revenue Bonds, Series 2007, Residuals 1606, 11.376%, 10/01/30 – AMBAC Insured (IF) | 10/16 at 100.00 | AA+ | 551,824 | ||||
| Florida – 5.3% (3.5% of Total Investments) | ||||||||
| 2,285 | Florida Municipal Loan Council, Revenue Bonds, Series 2005A, 5.000%, 2/01/23 – NPFG Insured | 2/15 at 100.00 | A– | 2,335,567 | ||||
| 1,500 | JEA, Florida, Water and Sewerage System Revenue Bonds, Series 2004A, 5.000%, 10/01/19 – FGIC Insured | 10/13 at 100.00 | Aa2 | 1,593,075 | ||||
| 4,000 | Miami-Dade County, Florida, Aviation Revenue Bonds, Miami International Airport, Series 2010B, 5.000%, 10/01/35 – AGM Insured | 10/20 at 100.00 | AA+ | 3,879,160 | ||||
| 4,240 | Reedy Creek Improvement District, Florida, Utility Revenue Bonds, Series 2003-1, 5.250%, 10/01/17 – NPFG Insured | 10/13 at 100.00 | A1 | 4,546,764 | ||||
| 2,000 | Tallahassee, Florida, Energy System Revenue Bonds, Series 2005, 5.000%, 10/01/28 – NPFG Insured | 10/15 at 100.00 | AA | 2,021,240 | ||||
| 14,025 | Total Florida | 14,375,806 | ||||||
| Georgia – 2.0% (1.3% of Total Investments) | ||||||||
| 2,700 | Atlanta, Georgia, Airport General Revenue Bonds, Series 2004G, 5.000%, 1/01/25 – AGM Insured | 1/15 at 100.00 | AA+ | 2,753,298 | ||||
| 1,250 | Atlanta, Georgia, Airport General Revenue Refunding Bonds, Series 2010A, 5.000%, 1/01/40 – AGM Insured | 1/20 at 100.00 | AA+ | 1,193,175 | ||||
| 1,350 | Henry County Water and Sewerage Authority, Georgia, Revenue Bonds, Series 2005, 5.250%, 2/01/27 – BHAC Insured | No Opt. Call | AA+ | 1,534,707 | ||||
| 5,300 | Total Georgia | 5,481,180 |
| 48 | Nuveen Investments |
| Principal | Optional Call | |||||||
| Amount (000) | Description (1) | Provisions (2) | Ratings (3) | Value | ||||
| Hawaii – 0.8% (0.5% of Total Investments) | ||||||||
| $ | 2,250 | Hawaii Department of Budget and Finance, Special Purpose Revenue Bonds, Hawaiian Electric Company Inc., Series 1999D, 6.150%, 1/01/20 – AMBAC Insured (Alternative Minimum Tax) | 7/11 at 100.00 | Baa1 | $ | 2,252,385 | ||
| Illinois – 14.5% (9.5% of Total Investments) | ||||||||
| 4,000 | Bridgeview, Illinois, General Obligation Bonds, Series 2002, 5.000%, | 12/12 at 100.00 | A– | 4,053,880 | ||||
| 12/01/22 – FGIC Insured | ||||||||
| 8,200 | Chicago Board of Education, Illinois, General Obligation Lease Certificates, Series 1992A, 6.250%, 1/01/15 – NPFG Insured | No Opt. Call | Aa2 | 8,791,958 | ||||
| 1,450 | Chicago, Illinois, Third Lien General Airport Revenue Bonds, O’Hare International Airport, Series 2005A, 5.250%, 1/01/24 – NPFG Insured | 1/16 at 100.00 | A1 | 1,495,574 | ||||
| 21,860 | Illinois Development Finance Authority, Local Government Program Revenue Bonds, Kane, Cook and DuPage Counties School District U46 – Elgin, Series 2002, 0.000%, 1/01/17 – AGM Insured | No Opt. Call | Aa3 | 17,364,925 | ||||
| 2,500 | Illinois Municipal Electric Agency, Power Supply System Revenue Bonds, Series 2007A, 5.000%, 2/01/35 – FGIC Insured | 2/17 at 100.00 | A+ | 2,405,650 | ||||
| 200 | Metropolitan Pier and Exposition Authority, Illinois, Revenue Bonds, McCormick Place Expansion Project, Series 2002A, 5.250%, 6/15/42 – NPFG Insured | 6/12 at 101.00 | AAA | 186,530 | ||||
| 5,010 | Metropolitan Pier and Exposition Authority, Illinois, Revenue Refunding Bonds, McCormick Place Expansion Project, Series 1996A, 0.000%, 12/15/21 – NPFG Insured | No Opt. Call | AA– | 2,880,550 | ||||
| 1,895 | Williamson & Johnson Counties Community Unit School District 2, Marion, Illinois, General Obligation Bonds, Series 2011, 7.250%, 12/01/28 – AGM Insured | 12/20 at 100.00 | AA+ | 2,089,654 | ||||
| 45,115 | Total Illinois | 39,268,721 | ||||||
| Indiana – 4.2% (2.8% of Total Investments) | ||||||||
| 2,540 | Indiana Municipal Power Agency, Power Supply Revenue Bonds, Series 2007A, 5.000%, 1/01/42 – NPFG Insured | 1/17 at 100.00 | A+ | 2,363,267 | ||||
| Indiana University, Parking Facility Revenue Bonds, Series 2004: | ||||||||
| 1,015 | 5.250%, 11/15/19 – AMBAC Insured | 11/14 at 100.00 | Aaa | 1,119,261 | ||||
| 1,060 | 5.250%, 11/15/20 – AMBAC Insured | 11/14 at 100.00 | Aaa | 1,168,883 | ||||
| 1,100 | 5.250%, 11/15/21 – AMBAC Insured | 11/14 at 100.00 | Aaa | 1,200,694 | ||||
| 9,255 | Indianapolis Local Public Improvement Bond Bank, Indiana, Series 1999E, 0.000%, 2/01/25 – AMBAC Insured | No Opt. Call | AA | 4,560,401 | ||||
| 1,000 | Metropolitan School District Steuben County K-5 Building Corporation, Indiana, First Mortgage Bonds, Series 2003, 5.250%, 1/15/21 – AGM Insured | 7/14 at 102.00 | AA+ | 1,070,930 | ||||
| 15,970 | Total Indiana | 11,483,436 | ||||||
| Iowa – 1.3% (0.8% of Total Investments) | ||||||||
| 3,345 | Ames, Iowa, Hospital Revenue Refunding Bonds, Mary Greeley Medical Center, Series 2003, 5.000%, 6/15/17 – AMBAC Insured | 6/13 at 100.00 | N/R | 3,401,698 | ||||
| Kansas – 0.4% (0.2% of Total Investments) | ||||||||
| 985 | Neosho County Unified School District 413, Kansas, General Obligation Bonds, Series 2006, 5.000%, 9/01/31 – AGM Insured | 9/14 at 100.00 | Aa3 | 980,577 | ||||
| Louisiana – 2.9% (1.9% of Total Investments) | ||||||||
| 885 | Louisiana Public Facilities Authority, Revenue Bonds, Baton Rouge General Hospital, Series 2004, 5.250%, 7/01/24 – NPFG Insured | 7/14 at 100.00 | Baa1 | 897,700 | ||||
| 7,160 | Louisiana State, Gasoline and Fuels Tax Revenue Bonds, Series 2006A, 4.750%, 5/01/39 – AGM Insured (UB) | 5/16 at 100.00 | AA+ | 6,917,920 | ||||
| 8,045 | Total Louisiana | 7,815,620 | ||||||
| Maryland – 2.3% (1.5% of Total Investments) | ||||||||
| 1,200 | Maryland Economic Development Corporation, Student Housing Revenue Refunding Bonds, University of Maryland College Park Projects, Series 2006, 5.000%, 6/01/28 – CIFG Insured | 6/16 at 100.00 | Baa2 | 1,102,824 | ||||
| 5,000 | Maryland Transportation Authority, Airport Parking Revenue Bonds, Baltimore-Washington International Airport Passenger Facility, Series 2002B, 5.125%, 3/01/21 – AMBAC Insured (Alternative Minimum Tax) | 3/12 at 101.00 | A2 | 5,086,650 | ||||
| 6,200 | Total Maryland | 6,189,474 |
| Nuveen Investments | 49 |
Nuveen Premier Insured Municipal Income Fund, Inc. (continued) | ||
| NIF | Portfolio of Investments |
April 30, 2011 (Unaudited)
| Principal | Optional Call | |||||||
| Amount (000) | Description (1) | Provisions (2) | Ratings (3) | Value | ||||
| Massachusetts – 4.6% (3.0% of Total Investments) | ||||||||
| $ | 2,500 | Massachusetts Department of Transportation, Metropolitan Highway System Revenue Bonds, Commonwealth Contract Assistance Secured, Refunding Series 2010B, 5.000%, 1/01/35 | 1/20 at 100.00 | AA | $ | 2,537,625 | ||
| 3,335 | Massachusetts Health and Education Facilities Authority, Revenue Bonds, Partners HealthCare System, Tender Option Bond Trust 3627, 13.536%, 7/01/29 (IF) | 7/19 at 100.00 | AA | 3,014,240 | ||||
| 4,400 | Massachusetts School Building Authority, Dedicated Sales Tax Revenue Bonds, Series 2005A, 5.000%, 8/15/23 – AGM Insured (UB) | 8/15 at 100.00 | AA+ | 4,709,936 | ||||
| 1,725 | Massachusetts Water Resources Authority, General Revenue Bonds, Series 2007A, 4.500%, 8/01/46 – AGM Insured (UB) (5) | 2/17 at 100.00 | AA+ | 1,576,512 | ||||
| 500 | Springfield Water and Sewerage Commission, Massachusetts, General Revenue Bonds, Refunding Series 2010B, 5.000%, 11/15/30 – AGC Insured | No Opt. Call | AA+ | 520,990 | ||||
| 12,460 | Total Massachusetts | 12,359,303 | ||||||
| Michigan – 1.4% (0.9% of Total Investments) | ||||||||
| 3,810 | Michigan Housing Development Authority, GNMA Collateralized Limited Obligation Multifamily Housing Revenue Bonds, Cranbrook Apartments, Series 2001A, 5.500%, 2/20/43 (Alternative Minimum Tax) | 8/12 at 102.00 | Aaa | 3,786,988 | ||||
| Minnesota – 0.5% (0.3% of Total Investments) | ||||||||
| 130 | Minnesota Housing Finance Agency, Rental Housing Bonds, Series 1995D, 5.950%, 2/01/18 – NPFG Insured | 8/11 at 100.00 | AA+ | 130,523 | ||||
| 1,000 | Minnesota State, General Obligation Bonds, Various Purpose, Refunding Series 2010D, 5.000%, 8/01/18 | No Opt. Call | AAA | 1,188,190 | ||||
| 1,130 | Total Minnesota | 1,318,713 | ||||||
| Missouri – 0.8% (0.5% of Total Investments) | ||||||||
| 2,000 | Missouri Western State College, Auxiliary System Revenue Bonds, Series 2003, 5.000%, 10/01/21 – NPFG Insured | 10/13 at 100.00 | A– | 2,087,200 | ||||
| Nevada – 6.1% (4.0% of Total Investments) | ||||||||
| 2,100 | Clark County, Nevada, General Obligation Bank Bonds, Southern Nevada Water Authority Loan, Series 2002, 5.000%, 6/01/32 – NPFG Insured | 12/12 at 100.00 | AA+ | 2,103,087 | ||||
| 900 | Clark County, Nevada, General Obligation Bank Bonds, Southern Nevada Water Authority Loan, Series 2002, 5.000%, 6/01/32 (Pre-refunded 12/01/12) – NPFG Insured | 12/12 at 100.00 | AA+ (4) | 964,872 | ||||
| 4,715 | Clark County, Nevada, Passenger Facility Charge Revenue Bonds, Las Vegas-McCarran International Airport, Series 2010A, 5.250%, 7/01/39 – AGM Insured | 1/20 at 100.00 | AA+ | 4,443,935 | ||||
| Director of Nevada State Department of Business and Industry, Revenue Bonds, Las Vegas Monorail Project, First Tier, Series 2000: | ||||||||
| 160 | 0.000%, 1/01/28 – AMBAC Insured | No Opt. Call | N/R | 14,632 | ||||
| 2,000 | 5.375%, 1/01/40 – AMBAC Insured (6) | 7/11 at 100.00 | N/R | 501,560 | ||||
| 7,990 | Reno, Nevada, Senior Lien Sales and Room Tax Revenue Bonds, Reno Transportation Rail Access Corridor Project, Series 2002, 5.250%, 6/01/41 (Pre-refunded 6/01/12) – AMBAC Insured | 6/12 at 100.00 | N/R (4) | 8,413,390 | ||||
| 17,865 | Total Nevada | 16,441,476 | ||||||
| New Jersey – 2.5% (1.6% of Total Investments) | ||||||||
| New Jersey Economic Development Authority, Revenue Bonds, Motor Vehicle Surcharge, Series 2004A: | ||||||||
| 1,200 | 5.000%, 7/01/22 – NPFG Insured | 7/14 at 100.00 | A | 1,219,080 | ||||
| 1,200 | 5.000%, 7/01/23 – NPFG Insured | 7/14 at 100.00 | A | 1,213,056 | ||||
| 4,000 | New Jersey Turnpike Authority, Revenue Bonds, Refunding Series 2005D-1, 5.250%, 1/01/26 – AGM Insured | No Opt. Call | AA+ | 4,364,440 | ||||
| 6,400 | Total New Jersey | 6,796,576 |
| 50 | Nuveen Investments |
| Principal | Optional Call | |||||||
| Amount (000) | Description (1) | Provisions (2) | Ratings (3) | Value | ||||
| New Mexico – 1.1% (0.7% of Total Investments) | ||||||||
| $ | 2,725 | Rio Rancho, New Mexico, Water and Wastewater Revenue Bonds, Refunding Series 2009, 5.000%, 5/15/21 – AGM Insured | 5/19 at 100.00 | AA+ | $ | 3,042,163 | ||
| New York – 6.9% (4.5% of Total Investments) | ||||||||
| 1,000 | Dormitory Authority of the State of New York, FHA-Insured Mortgage Revenue Bonds, Montefiore Hospital, Series 2004, 5.000%, 8/01/23 – FGIC Insured | 2/15 at 100.00 | BBB | 1,024,950 | ||||
| 2,185 | Hudson Yards Infrastructure Corporation, New York, Revenue Bonds, Series 2006A, 4.500%, 2/15/47 – NPFG Insured | 2/17 at 100.00 | A | 1,662,872 | ||||
| 5,000 | Long Island Power Authority, New York, Electric System General Revenue Bonds, Series 2006A, 5.000%, 12/01/25 – FGIC Insured | 6/16 at 100.00 | A– | 5,167,500 | ||||
| 10,000 | Metropolitan Transportation Authority, New York, Transportation Revenue Refunding Bonds, Series 2002F, 5.250%, 11/15/27 (Pre-refunded | 11/12 at 100.00 | AAA | 10,745,200 | ||||
| 11/15/12) – NPFG Insured | ||||||||
| 18,185 | Total New York | 18,600,522 | ||||||
| North Carolina – 3.0% (1.9% of Total Investments) | ||||||||
| 1,775 | Charlotte, North Carolina, Water and Sewer System Refunding Bonds, Tender Option Bond Trust 2009-43W, 13.305%, 7/01/38 (IF) (5) | 7/20 at 100.00 | AAA | 1,902,534 | ||||
| 3,100 | North Carolina Medical Care Commission, FHA-Insured Mortgage Revenue Bonds, Betsy Johnson Regional Hospital Project, Series 2003, 5.125%, 10/01/32 – AGM Insured | 10/13 at 100.00 | AA+ | 2,926,679 | ||||
| 3,050 | Raleigh Durham Airport Authority, North Carolina, Airport Revenue Bonds, Series 2005A, 5.000%, 5/01/22 – AMBAC Insured | 5/15 at 100.00 | Aa3 | 3,197,498 | ||||
| 7,925 | Total North Carolina | 8,026,711 | ||||||
| Ohio – 1.5% (1.0% of Total Investments) | ||||||||
| 4,605 | Hamilton County, Ohio, Sales Tax Bonds, Subordinate Lien, Series 2006, 4.250%, 12/01/32 – AMBAC Insured (UB) | 12/16 at 100.00 | A1 | 3,982,082 | ||||
| Oklahoma – 1.5% (1.0% of Total Investments) | ||||||||
| 3,500 | Oklahoma Capitol Improvement Authority, State Facilities Revenue Bonds, Series 2005F, 5.000%, 7/01/24 – AMBAC Insured | 7/15 at 100.00 | AA | 3,637,165 | ||||
| 310 | Oklahoma Housing Finance Agency, GNMA Collateralized Single Family Mortgage Revenue Bonds, Series 1987A, 7.997%, 8/01/18 (Alternative Minimum Tax) | No Opt. Call | AAA | 312,548 | ||||
| 3,810 | Total Oklahoma | 3,949,713 | ||||||
| Oregon – 4.4% (2.8% of Total Investments) | ||||||||
| Oregon Health Sciences University, Revenue Bonds, Series 2002A: | ||||||||
| 5,000 | 5.000%, 7/01/26 – NPFG Insured | 1/13 at 100.00 | A1 | 5,021,950 | ||||
| 7,000 | 5.000%, 7/01/32 – NPFG Insured | 1/13 at 100.00 | A1 | 6,760,040 | ||||
| 12,000 | Total Oregon | 11,781,990 | ||||||
| Pennsylvania – 6.9% (4.5% of Total Investments) | ||||||||
| 1,500 | Allegheny County Sanitary Authority, Pennsylvania, Sewerage Revenue Bonds, Series 2005A, 5.000%, 12/01/23 – NPFG Insured | 12/15 at 100.00 | A1 | 1,551,900 | ||||
| 6,000 | Chester County Health and Educational Facilities Authority, Pennsylvania, Health System Revenue Bonds, Jefferson Health System, Series 2010A, 5.000%, 5/15/40 | 5/20 at 100.00 | AA | 5,518,380 | ||||
| 4,000 | Commonwealth Financing Authority, Pennsylvania, State Appropriation Lease Bonds, Series 2006A, 5.000%, 6/01/26 – AGM Insured (UB) | 6/16 at 100.00 | AA+ | 4,127,520 | ||||
| 1,750 | Delaware River Port Authority, New Jersey and Pennsylvania, Revenue Bonds, Series 2010E, 5.000%, 1/01/40 – AGM Insured | 1/20 at 100.00 | AA+ | 1,728,860 | ||||
| 2,680 | Pennsylvania Public School Building Authority, Lease Revenue Bonds, School District of Philadelphia, Series 2006B, 4.500%, 6/01/32 – AGM Insured (UB) | 12/16 at 100.00 | AA+ | 2,516,440 | ||||
| 1,050 | Pennsylvania Turnpike Commission, Turnpike Revenue Bonds, Series 2006A, 5.000%, 12/01/26 – AMBAC Insured | 6/16 at 100.00 | Aa3 | 1,085,175 | ||||
| 2,065 | Pittsburgh and Allegheny County Sports and Exhibition Authority, Pennsylvania, Sales Tax Revenue Bonds, Refunding Series 2010, 5.000%, 2/01/31 – AGM Insured | 8/20 at 100.00 | AA+ | 2,059,693 | ||||
| 19,045 | Total Pennsylvania | 18,587,968 |
| Nuveen Investments | 51 |
Nuveen Premier Insured Municipal Income Fund, Inc. (continued) | ||
| NIF | Portfolio of Investments |
April 30, 2011 (Unaudited)
| Principal | Optional Call | |||||||
| Amount (000) | Description (1) | Provisions (2) | Ratings (3) | Value | ||||
| Puerto Rico – 2.7% (1.8% of Total Investments) | ||||||||
| $ | 2,500 | Puerto Rico Electric Power Authority, Power Revenue Bonds, Series 2005RR, 5.000%, 7/01/22 – FGIC Insured | 7/15 at 100.00 | A3 | $ | 2,519,475 | ||
| 1,000 | Puerto Rico Municipal Finance Agency, Series 2005C, 5.250%, 8/01/21 – CIFG Insured | No Opt. Call | A3 | 1,008,680 | ||||
| 1,175 | Puerto Rico Sales Tax Financing Corporation, Sales Tax Revenue Bonds, First Subordinate Series 2010C, 5.125%, 8/01/42 – AGM Insured | 8/20 at 100.00 | AA+ | 1,117,883 | ||||
| 5,000 | Puerto Rico Sales Tax Financing Corporation, Sales Tax Revenue Bonds, Series 2007A, 0.000%, 8/01/42 – NPFG Insured | No Opt. Call | Aa2 | 629,350 | ||||
| 2,000 | Puerto Rico, Highway Revenue Bonds, Highway and Transportation Authority, Series 2003AA, 5.500%, 7/01/17 – NPFG Insured | No Opt. Call | A2 | 2,143,320 | ||||
| 11,675 | Total Puerto Rico | 7,418,708 | ||||||
| South Carolina – 0.1% (0.1% of Total Investments) | ||||||||
| 375 | South Carolina Jobs-Economic Development Authority, Hospital Revenue Bonds, Palmetto Health, Refunding Series 2011A, 6.500%, 8/01/39 (WI/DD, Settling 5/02/11) – AGM Insured | 8/21 at 100.00 | AA+ | 381,975 | ||||
| Tennessee – 2.0% (1.3% of Total Investments) | ||||||||
| 3,000 | Blount County Public Building Authority, Tennessee, Local Government Improvement Loans, Oak Ridge General Obligation, 2005 Series B9A, Variable Rate Demand Obligations, 5.000%, 6/01/24 – AMBAC Insured | 6/15 at 100.00 | AA | 3,116,730 | ||||
| 2,055 | Memphis, Tennessee, Sanitary Sewerage System Revenue Bonds, Series 2004, 5.000%, 10/01/22 – AGM Insured | 10/14 at 100.00 | AA+ | 2,191,473 | ||||
| 5,055 | Total Tennessee | 5,308,203 | ||||||
| Texas – 13.5% (8.8% of Total Investments) | ||||||||
| 1,150 | Bexar County, Texas, Venue Project Revenue Bonds, Refunding Series 2010, 5.500%, 8/15/49 – AGM Insured | 8/19 at 100.00 | AA+ | 1,152,174 | ||||
| 12,500 | Dallas-Ft. Worth International Airport, Texas, Joint Revenue Refunding and Improvement Bonds, Series 2001A, 5.500%, 11/01/35 – NPFG Insured (Alternative Minimum Tax) | 7/11 at 100.00 | A+ | 11,957,625 | ||||
| 4,040 | Harris County, Texas, Subordinate Lien Unlimited Tax Toll Road Revenue Bonds, Tender Options Bond Trust 3028, 14.050%, 8/15/28 – AGM Insured (IF) | No Opt. Call | AAA | 5,664,807 | ||||
| North Harris County Regional Water Authority, Texas, Senior Water Revenue Bonds, Series 2003: | ||||||||
| 4,565 | 5.250%, 12/15/20 – FGIC Insured | 12/13 at 100.00 | A+ | 4,911,073 | ||||
| 4,800 | 5.250%, 12/15/21 – FGIC Insured | 12/13 at 100.00 | A+ | 5,084,112 | ||||
| 7,600 | San Antonio, Texas, Airport System Improvement Revenue Bonds, Series 2001, 5.375%, 7/01/16 (Pre-refunded 7/01/11) – FGIC Insured (Alternative Minimum Tax) | 7/11 at 101.00 | A+ (4) | 7,731,252 | ||||
| 34,655 | Total Texas | 36,501,043 | ||||||
| Utah – 2.1% (1.4% of Total Investments) | ||||||||
| 5,760 | Central Weber Sewer Improvement District, Utah, Sewer Revenue Bonds, Refunding Series 2010A, 5.000%, 3/01/33 – AGC Insured | 3/20 at 100.00 | AA+ | 5,810,803 | ||||
| Vermont – 1.8% (1.2% of Total Investments) | ||||||||
| 5,000 | University of Vermont and State Agricultural College, Revenue Bonds, Refunding Series 2007, 5.000%, 10/01/43 – AGM Insured | 10/17 at 100.00 | AA+ | 4,917,000 | ||||
| Virginia – 0.1% (0.1% of Total Investments) | ||||||||
| 250 | Roanoke Industrial Development Authority, Virginia, Hospital Revenue Bonds, Carillion Health System Obligated Group, Series 2005B, 5.000%, 7/01/38 – AGM Insured | 7/20 at 100.00 | AA+ | 237,693 | ||||
| Washington – 16.0% (10.4% of Total Investments) | ||||||||
| 5,000 | Chelan County Public Utility District 1, Washington, Hydro Consolidated System Revenue Bonds, Series 2001B, 5.600%, 1/01/36 – NPFG Insured (Alternative Minimum Tax) (UB) | 7/11 at 101.00 | AA | 4,924,000 | ||||
| King County School District 405, Bellevue, Washington, General Obligation Bonds, Series 2002: | ||||||||
| 9,285 | 5.000%, 12/01/19 (Pre-refunded 12/01/12) – FGIC Insured | 12/12 at 100.00 | Aaa | 9,954,263 | ||||
| 12,785 | 5.000%, 12/01/20 (Pre-refunded 12/01/12) – FGIC Insured | 12/12 at 100.00 | Aaa | 13,706,543 | ||||
| Pierce County School District 343, Dieringer, Washington, General Obligation Refunding Bonds, Series 2003: | ||||||||
| 2,755 | 5.250%, 12/01/18 (Pre-refunded 6/01/13) – FGIC Insured | 6/13 at 100.00 | Aa1 (4) | 3,021,243 | ||||
| 2,990 | 5.250%, 12/01/19 (Pre-refunded 6/01/13) – FGIC Insured | 6/13 at 100.00 | Aa1 (4) | 3,278,954 |
| 52 | Nuveen Investments |
| Principal | Optional Call | |||||||
| Amount (000) | Description (1) | Provisions (2) | Ratings (3) | Value | ||||
Washington (continued) | ||||||||
| $ | 4,715 | Port of Seattle, Washington, Revenue Bonds, Series 2001B, 5.625%, | 10/11 at 100.00 | Aa2 | $ | 4,794,636 | ||
| 4/01/17 – FGIC Insured (Alternative Minimum Tax) | ||||||||
| 895 | Port of Seattle, Washington, Special Facility Revenue Bonds, Terminal 18, Series 1999C, 6.000%, 9/01/29 – NPFG Insured (Alternative Minimum Tax) | 7/11 at 100.00 | Baa1 | 892,449 | ||||
| 1,265 | Tacoma, Washington, General Obligation Bonds, Series 2002, 5.000%, 12/01/18 (Pre-refunded 12/01/12) – FGIC Insured | 12/12 at 100.00 | AA (4) | 1,356,181 | ||||
| 1,250 | University of Washington, General Revenue Bonds, Tender Option Bond Trust 3005, 17.425%, 6/01/31 – AMBAC Insured (IF) | 6/17 at 100.00 | Aaa | 1,313,900 | ||||
| 40,940 | Total Washington | 43,242,169 | ||||||
| $ | 463,525 | Total Long-Term Investments (cost $414,968,372) – 152.6% | 412,108,050 | |||||
| Short-Term Investments – 1.0% (0.7% of Investments) | ||||||||
| Florida – 0.6% (0.4% of Total Investments) | ||||||||
| $ | 1,760 | Pinellas County, Florida, Sewer Revenue Bonds, Variable Rate Demand Obligations, Tender Option Bond Trust 2917Z, 0.280%, 10/01/32 – AGM Insured (7) | No Opt. Call | N/R | 1,760,000 | |||
| Pennsylvania – 0.4% (0.3% of Total Investments) | ||||||||
| 1,125 | State Public School Building Authority, Pennsylvania, Lease Revenue Bonds, Variable Rate Demand Obligations, Philadelphia School District, Tender Option Trust 371, 0.230%, 6/01/27 – AGM Insured (7) | No Opt. Call | VMIG-1 | 1,125,000 | ||||
| $ | 2,885 | Total Short-Term Investments (cost $2,885,000) | 2,885,000 | |||||
| Total Investments (cost $417,853,372) – 153.6% | 414,993,050 | |||||||
| Floating Rate Obligations – (8.3)% | (22,365,000 | ) | ||||||
| Variable Rate Demand Preferred Shares, at Liquidation Value – (48.5)% (8) | (130,900,000 | ) | ||||||
| Other Assets Less Liabilities – 3.2% | 8,388,600 | |||||||
| Net Assets Applicable to Common Shares – 100% | $ | 270,116,650 |
| The Fund intends to invest at least 80% of its managed assets in municipal securities that are covered by insurance guaranteeing the timely payment of principal and interest. See Notes to Financial Statements, Footnote 1 – General Information and Significant Accounting Policies, Insurance for more information. | ||
| (1) | All percentages shown in the Portfolio of Investments are based on net assets applicable to Common shares unless otherwise noted. | |
| (2) | Optional Call Provisions: Dates (month and year) and prices of the earliest optional call or redemption. There may be other call provisions at varying prices at later dates. Certain mortgage-backed securities may be subject to periodic principal paydowns. | |
| (3) | Ratings: Using the highest of Standard & Poor’s Group (“Standard & Poor’s”), Moody’s Investor Service, Inc. (“Moody’s”) or Fitch, Inc. (“Fitch”) rating. Ratings below BBB by Standard & Poor’s, Baa by Moody’s or BBB by Fitch are considered to be below investment grade. Holdings designated N/R are not rated by any of these national rating agencies. | |
| (4) | Backed by an escrow or trust containing sufficient U.S. Government or U.S. Government agency securities, which ensure the timely payment of principal and interest. Such investments are normally considered to be equivalent to AAA rated securities. | |
| (5) | Investment, or portion of investment, has been pledged to collateralize the net payment obligations for investments in inverse floating rate transactions. | |
| (6) | At or subsequent to the end of the reporting period, this security is non-income producing. Non-income producing security, in the case of a bond, generally denotes that the issuer has (1) defaulted on the payment of principal or interest, (2) is under the protection of the Federal Bankruptcy Court or (3) the Fund’s Adviser has concluded that the issue is not likely to meet its future interest payment obligations and has directed the Fund’s custodian to cease accruing additional income on the Fund’s records. | |
| (7) | Investment has a maturity of more than one year, but has variable rate and demand features which qualify it as a short-term investment. The rate disclosed is that in effect at the end of the reporting period. This rate changes periodically based on market conditions or a specified market index. | |
| (8) | Variable Rate Demand Preferred Shares, at Liquidation Value as a percentage of Total Investments is 31.5%. | |
| N/R | Not rated. | |
| WI/DD | Purchased on a when-issued or delayed delivery basis. | |
| (ETM) | Escrowed to maturity. | |
| (IF) | Inverse floating rate investment. | |
| (UB) | Underlying bond of an inverse floating rate trust reflected as a financing transaction. See Notes to Financial Statements, Footnote 1 – General Information and Significant Accounting Policies, Inverse Floating Rate Securities for more information. |
See accompanying notes to financial statements.
| Nuveen Investments | 53 |
| Nuveen Insured Premium Income Municipal Fund 2 | ||
| NPX | Portfolio of Investments |
April 30, 2011 (Unaudited)
| Principal | Optional Call | |||||||
| Amount (000) | Description (1) | Provisions (2) | Ratings (3) | Value | ||||
| Alabama – 3.8% (2.4% of Total Investments) | ||||||||
| $ | 3,750 | Huntsville Healthcare Authority, Alabama, Revenue Bonds, Series 2005A, 5.000%, 6/01/24 – NPFG Insured | 6/15 at 100.00 | A1 | $ | 3,752,438 | ||
| Jefferson County, Alabama, General Obligation Warrants, Series 2004A: | ||||||||
| 1,395 | 5.000%, 4/01/22 – NPFG Insured | 4/14 at 100.00 | Baa1 | 1,084,459 | ||||
| 1,040 | 5.000%, 4/01/23 – NPFG Insured | 4/14 at 100.00 | Baa1 | 789,110 | ||||
| 11,135 | Limestone County Water and Sewer Authority, Alabama, Water Revenue Bonds, Series 2007, 4.500%, 12/01/37 – SYNCORA GTY Insured | 3/17 at 100.00 | A+ | 9,336,252 | ||||
| 2,590 | Montgomery Water and Sewerage Board, Alabama, Water and Sewerage Revenue Bonds, Series 2005, 5.000%, 3/01/25 – AGM Insured | 3/15 at 100.00 | AAA | 2,670,290 | ||||
| 19,910 | Total Alabama | 17,632,549 | ||||||
| Arizona – 5.1% (3.3% of Total Investments) | ||||||||
| Arizona State, Certificates of Participation, Series 2010A: | ||||||||
| 2,800 | 5.250%, 10/01/28 – AGM Insured | 10/19 at 100.00 | AA+ | 2,881,452 | ||||
| 3,500 | 5.000%, 10/01/29 – AGM Insured | 10/19 at 100.00 | AA+ | 3,522,575 | ||||
| 5,000 | Arizona State, State Lottery Revenue Bonds, Series 2010A, 5.000%, | 1/20 at 100.00 | AA+ | 5,017,100 | ||||
| 7/01/29 – AGC Insured | ||||||||
| 12,365 | Phoenix Civic Improvement Corporation, Arizona, Junior Lien Water System Revenue Bonds, Series 2005, 4.750%, 7/01/27 – NPFG Insured (UB) | 7/15 at 100.00 | AAA | 12,567,662 | ||||
| 23,665 | Total Arizona | 23,988,789 | ||||||
| Arkansas – 2.7% (1.7% of Total Investments) | ||||||||
| 5,745 | Arkansas Development Finance Authority, State Facility Revenue Bonds, Donaghey Plaza Project, Series 2004, 5.250%, 6/01/25 – AGM Insured | 6/14 at 100.00 | AA+ | 6,127,847 | ||||
| University of Arkansas, Fayetteville, Revenue Bonds, Medical Sciences Campus, Series 2004B: | ||||||||
| 2,000 | 5.000%, 11/01/27 – NPFG Insured | 11/14 at 100.00 | Aa2 | 2,035,720 | ||||
| 2,000 | 5.000%, 11/01/28 – NPFG Insured | 11/14 at 100.00 | Aa2 | 2,049,680 | ||||
| 2,480 | University of Arkansas, Monticello Campus, Revenue Bonds, Series 2005, 5.000%, 12/01/35 – AMBAC Insured | 12/13 at 100.00 | Aa2 | 2,492,425 | ||||
| 12,225 | Total Arkansas | 12,705,672 | ||||||
| California – 23.5% (15.1% of Total Investments) | ||||||||
| 22,880 | Alameda Corridor Transportation Authority, California, Senior Lien Revenue Bonds, Series 1999A, 0.000%, 10/01/32 – NPFG Insured | No Opt. Call | A | 4,454,736 | ||||
| 20 | California Department of Water Resources, Water System Revenue Bonds, Central Valley Project, Series 2005AC, 5.000%, 12/01/24 (Pre-refunded 12/01/14) – NPFG Insured | 12/14 at 100.00 | AAA | 22,908 | ||||
| 1,980 | California Department of Water Resources, Water System Revenue Bonds, Central Valley Project, Series 2005AC, 5.000%, 12/01/24 – NPFG Insured | 12/14 at 100.00 | AAA | 2,129,886 | ||||
| 1,300 | California Educational Facilities Authority, Revenue Bonds, Occidental College, Series 2005A, 5.000%, 10/01/33 – NPFG Insured | 10/15 at 100.00 | Aa3 | 1,280,136 | ||||
| 10,000 | California Statewide Communities Development Authority, Revenue Bonds, Sutter Health, Series 2011A, 6.000%, 8/15/42 | 8/20 at 100.00 | AA– | 10,177,000 | ||||
| 3,175 | Ceres Unified School District, Stanislaus County, California, General Obligation Bonds, Series 2002B, 0.000%, 8/01/35 – FGIC Insured | 8/12 at 26.19 | A+ | 539,814 | ||||
| 31,200 | Foothill/Eastern Transportation Corridor Agency, California, Toll Road Revenue Refunding Bonds, Series 1999, 0.000%, 1/15/34 – NPFG Insured | 7/11 at 26.24 | Baa1 | 4,234,464 | ||||
| 1,735 | Fullerton Public Financing Authority, California, Tax Allocation Revenue Bonds, Series 2005, 5.000%, 9/01/27 – AMBAC Insured | 9/15 at 100.00 | A | 1,543,317 | ||||
| 7,000 | Golden State Tobacco Securitization Corporation, California, Enhanced Tobacco Settlement Asset-Backed Revenue Bonds, Series 2005A, 5.000%, 6/01/35 – FGIC Insured | 6/15 at 100.00 | A2 | 5,979,330 | ||||
| 1,870 | Kern Community College District, California, General Obligation Bonds, Series 2006, 0.000%, 11/01/23 – AGM Insured | No Opt. Call | AA+ | 909,138 |
| 54 | Nuveen Investments |
| Principal | Optional Call | |||||||
| Amount (000) | Description (1) | Provisions (2) | Ratings (3) | Value | ||||
California (continued) | ||||||||
| $ | 6,520 | Los Angeles Unified School District, California, General Obligation Bonds, Series 2005E, 5.000%, 7/01/22 – AMBAC Insured | 7/15 at 100.00 | Aa2 | $ | 6,840,458 | ||
| 4,000 | Los Angeles Unified School District, California, General Obligation Bonds, Series 2006F, 5.000%, 7/01/24 – FGIC Insured | 7/16 at 100.00 | Aa2 | 4,150,160 | ||||
| 3,500 | Newport Beach, California, Revenue Bonds, Hoag Memorial Hospital Presybterian, Series 2011A, 5.875%, 12/01/30 | 12/21 at 100.00 | AA | 3,623,970 | ||||
| 15,000 | Orange County Sanitation District, California, Certificates of Participation, Series 2003, 5.250%, 2/01/30 (Pre-refunded 8/01/13) – FGIC Insured | 8/13 at 100.00 | AAA | 16,554,748 | ||||
| 1,750 | Orange County Water District, California, Revenue Certificates of Participation, Series 2003B, 5.000%, 8/15/34 – NPFG Insured (ETM) | 8/13 at 100.00 | AAA | 1,829,573 | ||||
| 8,250 | Orange County Water District, California, Revenue Certificates of Participation, Series 2003B, 5.000%, 8/15/34 – NPFG Insured | 8/13 at 100.00 | AAA | 8,276,895 | ||||
| 1,435 | Pasadena Area Community College District, Los Angeles County, California, General Obligation Bonds, Series 2003A, 5.000%, 6/01/22 (Pre-refunded 6/01/13) – FGIC Insured | 6/13 at 100.00 | AA+ (4) | 1,568,541 | ||||
| 1,800 | Rialto Unified School District, San Bernardino County, California, General Obligation Bonds, Series 2011A, 0.000%, 8/01/28 – AGM Insured | No Opt. Call | AA+ | 578,268 | ||||
| 735 | Sacramento City Financing Authority, California, Capital Improvement Revenue Bonds, Solid Waste and Redevelopment Projects, Series 1999, 5.800%, 12/01/19 – AMBAC Insured | 6/11 at 101.00 | N/R | 735,669 | ||||
| San Diego County, California, Certificates of Participation, Edgemoor Facility Project and Regional System, Series 2005: | ||||||||
| 1,675 | 5.000%, 2/01/24 – AMBAC Insured | 2/15 at 100.00 | AA+ | 1,716,440 | ||||
| 720 | 5.000%, 2/01/25 – AMBAC Insured | 2/15 at 100.00 | AA+ | 732,362 | ||||
| San Joaquin Hills Transportation Corridor Agency, Orange County, California, Toll Road Revenue Refunding Bonds, Series 1997A: | ||||||||
| 3,825 | 0.000%, 1/15/32 – NPFG Insured | No Opt. Call | Baa1 | 528,347 | ||||
| 26,900 | 0.000%, 1/15/34 – NPFG Insured | No Opt. Call | Baa1 | 3,036,203 | ||||
| 2,000 | San Jose Redevelopment Agency, California, Tax Allocation Bonds, Merged Area Redevelopment Project, Series 2004A, 5.250%, 8/01/19 – NPFG Insured | 8/14 at 100.00 | BBB+ | 1,902,020 | ||||
| 7,845 | San Jose Redevelopment Agency, California, Tax Allocation Bonds, Merged Area Redevelopment Project, Series 2006C, 4.250%, 8/01/30 – NPFG Insured | 8/17 at 100.00 | BBB+ | 5,440,664 | ||||
| 5,000 | Torrance, California, Certificates of Participation, Refunding Series 2005B, 5.000%, 6/01/24 – AMBAC Insured | No Opt. Call | AA | 5,017,650 | ||||
| 12,500 | University of California, Revenue Bonds, Multi-Purpose Projects, Series 2003A, 5.000%, 5/15/33 – AMBAC Insured (UB) | 5/13 at 100.00 | AA+ | 12,392,500 | ||||
| 3,900 | West Hills Community College District, California, General Obligation Bonds, School Facilities Improvement District 3, 2008 Election Series 2011, 6.500%, 8/01/41 – AGM Insured | 8/21 at 100.00 | AA+ | 4,105,296 | ||||
| 188,515 | Total California | 110,300,493 | ||||||
| Colorado – 10.3% (6.6% of Total Investments) | ||||||||
| 1,940 | Colorado Educational and Cultural Facilities Authority, Charter School Revenue Bonds, Adams School District 12 – Pinnacle School, Series 2003, 5.250%, 6/01/23 – SYNCORA GTY Insured | 6/13 at 100.00 | A | 1,952,397 | ||||
| 3,405 | Colorado Educational and Cultural Facilities Authority, Revenue Bonds, Classical Academy Charter School, Series 2003, 5.250%, 12/01/23 – SYNCORA GTY Insured | 12/13 at 100.00 | A | 3,427,882 | ||||
| 16,095 | Denver Convention Center Hotel Authority, Colorado, Senior Revenue Bonds, Convention Center Hotel, Series 2003A, 5.000%, 12/01/33 (Pre-refunded 12/01/13) – SYNCORA GTY Insured | 12/13 at 100.00 | N/R (4) | 17,712,224 | ||||
| 125 | Denver School District 1, Colorado, General Obligation Bonds, Series 2004, 5.000%, 12/01/18 – AGM Insured | 12/13 at 100.00 | AA+ | 135,761 | ||||
| 5,600 | Denver School District 1, Colorado, General Obligation Bonds, Series 2004, 5.000%, 12/01/18 (Pre-refunded 12/01/13) – AGM Insured | 12/13 at 100.00 | AA+ (4) | 6,217,456 | ||||
| 12,000 | E-470 Public Highway Authority, Colorado, Senior Revenue Bonds, Series 2000B, 0.000%, 9/01/30 – NPFG Insured | No Opt. Call | Baa1 | 2,706,960 |
| Nuveen Investments | 55 |
Nuveen Insured Premium Income Municipal Fund 2 (continued) | ||
| NPX | Portfolio of Investments |
April 30, 2011 (Unaudited)
| Principal | Optional Call | |||||||
| Amount (000) | Description (1) | Provisions (2) | Ratings (3) | Value | ||||
Colorado (continued) | ||||||||
| $ | 1,325 | El Paso County, Colorado, Certificates of Participation, Detention Facility Project, Series 2002B, 5.000%, 12/01/27 – AMBAC Insured | 12/12 at 100.00 | AA– | $ | 1,332,977 | ||
| Jefferson County School District R1, Colorado, General Obligation Bonds, Series 2004: | ||||||||
| 2,500 | 5.000%, 12/15/22 (Pre-refunded 12/15/14) – AGM Insured (UB) | 12/14 at 100.00 | AA+ (4) | 2,854,700 | ||||
| 5,125 | 5.000%, 12/15/23 (Pre-refunded 12/15/14) – AGM Insured (UB) | 12/14 at 100.00 | AA+ (4) | 5,852,135 | ||||
| 2,000 | 5.000%, 12/15/24 (Pre-refunded 12/15/14) – AGM Insured (UB) | 12/14 at 100.00 | AA+ (4) | 2,283,760 | ||||
| 2,640 | Park Creek Metropolitan District, Colorado, Senior Limited Property Tax Supported Revenue Refunding Bonds, Series 2011, 6.125%, 12/01/41 (WI/DD, Settling 5/12/11) – AGM Insured | 12/20 at 100.00 | Aa3 | 2,618,537 | ||||
| 1,000 | University of Colorado, Enterprise System Revenue Bonds, Series 2005, 5.000%, 6/01/30 – FGIC Insured | 6/15 at 100.00 | Aa2 | 1,014,640 | ||||
| 53,755 | Total Colorado | 48,109,429 | ||||||
| District of Columbia – 0.2% (0.1% of Total Investments) | ||||||||
| 1,065 | Washington Convention Center Authority, District of Columbia, Senior Lien Dedicated Tax Revenue Bonds, Series 2007, Residuals 1606, 11.376%, 10/01/30 – AMBAC Insured (IF) | 10/16 at 100.00 | AA+ | 883,748 | ||||
| Florida – 5.8% (3.7% of Total Investments) | ||||||||
| 1,000 | Citizens Property Insurance Corporation, Florida, High-Risk Account Senior Secured Bonds Series 2010A-1, 5.000%, 6/01/16 – AGM Insured | No Opt. Call | AA+ | 1,065,300 | ||||
| 4,000 | Florida State Board of Education, Full Faith and Credit Public Education Capital Outlay Bonds, Series 2003J, 5.000%, 6/01/22 – AMBAC Insured | 6/13 at 101.00 | AAA | 4,165,480 | ||||
| 10,000 | Miami-Dade County Expressway Authority, Florida, Toll System Revenue Bonds, Series 2010A, 5.000%, 7/01/35 | No Opt. Call | AA+ | 9,699,100 | ||||
| 6,350 | Miami-Dade County School Board, Florida, Certificates of Participation, Series 2006A, 5.000%, 11/01/31 – AGM Insured | 11/16 at 100.00 | AA+ | 6,333,808 | ||||
| 5,720 | Miami-Dade County, Florida, General Obligation Bonds, Series 2005, 5.000%, 7/01/33 – AGM Insured | 7/15 at 100.00 | AA+ | 5,726,006 | ||||
| 27,070 | Total Florida | 26,989,694 | ||||||
| Georgia – 5.3% (3.4% of Total Investments) | ||||||||
| 5,600 | Atlanta, Georgia, Airport General Revenue Refunding Bonds, Series 2010A, 5.000%, 1/01/40 – AGM Insured | 1/20 at 100.00 | AA+ | 5,345,424 | ||||
| 1,535 | Cherokee County Water and Sewerage Authority, Georgia, Water and Sewerage Revenue Refunding Bonds, Series 2010, 4.000%, 8/01/26 | 8/20 at 100.00 | Aa2 | 1,515,076 | ||||
| 4,000 | Cobb County Development Authority, Georgia, Parking Revenue Bonds, Kennesaw State University, Series 2004, 5.000%, 7/15/24 – NPFG Insured | 7/14 at 100.00 | A1 | 4,038,880 | ||||
| 1,475 | Columbus, Georgia, Water and Sewerage Revenue Bonds, Series 2005, 5.000%, 5/01/23 – NPFG Insured | 5/14 at 100.00 | Aa2 | 1,535,549 | ||||
| Municipal Electric Authority of Georgia, Combustion Turbine Revenue Bonds, Series 2003A: | ||||||||
| 1,775 | 5.000%, 11/01/21 – NPFG Insured | 11/13 at 100.00 | A1 | 1,837,906 | ||||
| 2,580 | 5.000%, 11/01/22 – NPFG Insured | 11/13 at 100.00 | A1 | 2,666,301 | ||||
| 4,500 | South Fulton Municipal Regional Water and Sewerage Authority, Georgia, Water Revenue Bonds, Refunding Series 2003, 5.000%, 1/01/33 (Pre-refunded 1/01/13) – NPFG Insured | 1/13 at 100.00 | N/R (4) | 4,833,225 | ||||
| 3,000 | Valdosta and Lowndes County Hospital Authority, Georgia, Revenue Certificates, South Georgia Medical Center, Series 2002, 5.200%, | 10/12 at 101.00 | A+ | 3,036,240 | ||||
| 10/01/22 – AMBAC Insured | ||||||||
| 24,465 | Total Georgia | 24,808,601 | ||||||
| Hawaii – 4.8% (3.1% of Total Investments) | ||||||||
| 2,375 | Hawaii County, Hawaii, General Obligation Bonds, Series 2003A, 5.000%, 7/15/19 – AGM Insured | 7/13 at 100.00 | AA+ | 2,543,768 | ||||
| 20,000 | Hawaii Department of Budget and Finance, Special Purpose Revenue Refunding Bonds, Hawaiian Electric Company Inc., Series 2000, 5.700%, 7/01/20 – AMBAC Insured (Alternative Minimum Tax) | 7/11 at 100.00 | Baa1 | 19,952,995 | ||||
| 22,375 | Total Hawaii | 22,496,763 |
| 56 | Nuveen Investments |
| Principal | Optional Call | |||||||
| Amount (000) | Description (1) | Provisions (2) | Ratings (3) | Value | ||||
| Idaho – 0.0% (0.0% of Total Investments) | ||||||||
| $ | 210 | Idaho Housing and Finance Association, Single Family Mortgage Bonds, Series 1998E, 5.450%, 7/01/18 – AMBAC Insured (Alternative Minimum Tax) | 7/11 at 100.00 | Aaa | $ | 215,634 | ||
| Illinois – 6.0% (3.9% of Total Investments) | ||||||||
| 1,015 | Chicago Park District, Illinois, Limited Tax General Obligation Park Bonds, Series 2001C, 5.500%, 1/01/18 – FGIC Insured | 7/11 at 100.00 | AA | 1,022,085 | ||||
| 8,000 | Chicago, Illinois, General Airport Revenue Bonds, O’Hare International Airport, Third Lien Refunding Series 2010C, 5.250%, 1/01/35 – AGC Insured | No Opt. Call | AA+ | 7,935,120 | ||||
| Illinois Health Facilities Authority, Revenue Bonds, Lutheran General Health System, Series 1993A: | ||||||||
| 670 | 6.125%, 4/01/12 – AGM Insured (ETM) | No Opt. Call | AA+ (4) | 698,736 | ||||
| 5,045 | 6.250%, 4/01/18 – AGM Insured (ETM) | No Opt. Call | AA+ (4) | 6,073,726 | ||||
| 1,950 | Illinois Health Facilities Authority, Revenue Refunding Bonds, SSM Healthcare System, Series 1992AA, 6.550%, 6/01/14 – NPFG Insured (ETM) | No Opt. Call | AAA (4) | 2,273,232 | ||||
| 4,000 | Illinois Municipal Electric Agency, Power Supply System Revenue Bonds, Series 2007A, 5.000%, 2/01/35 – FGIC Insured | 2/17 at 100.00 | A+ | 3,849,040 | ||||
| 19,700 | Metropolitan Pier and Exposition Authority, Illinois, Revenue Bonds, McCormick Place Expansion Project, Capital Appreciation Refunding Series 2010B-1, 0.000%, 6/15/45 – AGM Insured | No Opt. Call | AAA | 1,977,880 | ||||
| 5,725 | Metropolitan Pier and Exposition Authority, Illinois, Revenue Bonds, McCormick Place Expansion Project, Series 2002A, 0.000%, 6/15/27 – NPFG Insured | 6/22 at 101.00 | AAA | 4,194,765 | ||||
| 110 | Peoria, Moline and Freeport, Illinois, GNMA Collateralized Single Family Mortgage Revenue Bonds, Series 1995A, 7.600%, 4/01/27 (Alternative Minimum Tax) | 10/11 at 100.00 | AA+ | 111,671 | ||||
| 46,215 | Total Illinois | 28,136,255 | ||||||
| Indiana – 4.8% (3.1% of Total Investments) | ||||||||
| Hamilton County Public Building Corporation, Indiana, First Mortgage Bonds, Series 2004: | ||||||||
| 2,105 | 5.000%, 8/01/23 – AGM Insured | 8/14 at 100.00 | Aaa | 2,235,763 | ||||
| 2,215 | 5.000%, 8/01/24 – AGM Insured | 8/14 at 100.00 | Aaa | 2,337,933 | ||||
| 10,000 | Indiana Finance Authority, Revenue Bonds, Trinity Health Care Group, Refunding Series 2009A, 5.250%, 12/01/38 | 12/19 at 100.00 | AA | 9,298,900 | ||||
| 3,730 | Indiana Municipal Power Agency, Power Supply Revenue Bonds, Series 2007A, 5.000%, 1/01/42 – NPFG Insured | 1/17 at 100.00 | A+ | 3,470,467 | ||||
| 5,000 | Indianapolis Local Public Improvement Bond Bank, Indiana, Waterworks Project Series 2009A, 5.500%, 1/01/38 – AGC Insured | 1/19 at 100.00 | AA+ | 5,090,350 | ||||
| 23,050 | Total Indiana | 22,433,413 | ||||||
| Kansas – 0.3% (0.2% of Total Investments) | ||||||||
| 1,250 | Kansas Turnpike Authority, Revenue Bonds, Series 2004A-2, 5.000%, | 9/14 at 101.00 | AA+ | 1,302,588 | ||||
| 9/01/27 – AGM Insured | ||||||||
| Kentucky – 1.1% (0.7% of Total Investments) | ||||||||
| 6,010 | Kentucky Economic Development Finance Authority, Health System Revenue Bonds, Norton Healthcare Inc., Series 2000B, 0.000%, 10/01/28 – NPFG Insured | No Opt. Call | A– | 1,935,641 | ||||
| 3,040 | Kentucky Turnpike Authority, Economic Development Road Revenue Bonds, Revitalization Project, Series 2005B, 5.000%, 7/01/25 – AMBAC Insured | 7/15 at 100.00 | AA+ | 3,070,552 | ||||
| 9,050 | Total Kentucky | 5,006,193 | ||||||
| Louisiana – 6.2% (4.0% of Total Investments) | ||||||||
| 5,000 | Lafayette Public Trust Financing Authority, Louisiana, Revenue Bonds, Ragin’ Cajun Facilities Inc. Project, Series 2010, 5.500%, 10/01/41 – AGM Insured | 10/20 at 100.00 | AA+ | 4,923,500 | ||||
| 3,940 | Louisiana Public Facilities Authority, Revenue Bonds, Baton Rouge General Hospital, Series 2004, 5.250%, 7/01/24 – NPFG Insured | 7/14 at 100.00 | Baa1 | 3,996,539 |
| Nuveen Investments | 57 |
Nuveen Insured Premium Income Municipal Fund 2 (continued) | ||
| NPX | Portfolio of Investments |
April 30, 2011 (Unaudited)
| Principal | Optional Call | |||||||
| Amount (000) | Description (1) | Provisions (2) | Ratings (3) | Value | ||||
Louisiana (continued) | ||||||||
| Louisiana State, Gasoline and Fuels Tax Revenue Bonds, Series 2005A: | ||||||||
| $ | 1,010 | 5.000%, 5/01/25 – FGIC Insured | 5/15 at 100.00 | Aa1 | $ | 1,050,754 | ||
| 2,210 | 5.000%, 5/01/26 – FGIC Insured | 5/15 at 100.00 | Aa1 | 2,288,146 | ||||
| 2,500 | 5.000%, 5/01/27 – FGIC Insured | 5/15 at 100.00 | Aa1 | 2,578,150 | ||||
| Louisiana State, Gasoline and Fuels Tax Revenue Bonds, Series 2006A: | ||||||||
| 1,320 | 4.750%, 5/01/39 – AGM Insured (UB) | 5/16 at 100.00 | AA+ | 1,275,371 | ||||
| 14,265 | 4.500%, 5/01/41 – FGIC Insured (UB) | 5/16 at 100.00 | AA | 13,048,909 | ||||
| 30,245 | Total Louisiana | 29,161,369 | ||||||
| Maryland – 0.8% (0.5% of Total Investments) | ||||||||
| 1,865 | Baltimore, Maryland, Senior Lien Convention Center Hotel Revenue Bonds, Series 2006A, 5.250%, 9/01/26 – SYNCORA GTY Insured | 9/16 at 100.00 | Baa3 | 1,650,562 | ||||
| 2,495 | Maryland Health and Higher Educational Facilities Authority, Revenue Bonds, Western Maryland Health, Series 2006A, 4.750%, 7/01/36 – NPFG Insured | 7/16 at 100.00 | Baa1 | 2,236,718 | ||||
| 4,360 | Total Maryland | 3,887,280 | ||||||
| Massachusetts – 3.8% (2.5% of Total Investments) | ||||||||
| 3,000 | Massachusetts Department of Transportation, Metropolitan Highway System Revenue Bonds, Commonwealth Contract Assistance Secured, Refunding Series 2010B, 5.000%, 1/01/35 | 1/20 at 100.00 | AA | 3,045,150 | ||||
| 3,000 | Massachusetts Development Finance Authority, Revenue Bonds, WGBH Educational Foundation, Series 2002A, 5.750%, 1/01/42 – AMBAC Insured | No Opt. Call | A | 2,925,900 | ||||
| 290 | Massachusetts Port Authority, Special Facilities Revenue Bonds, Delta Air Lines Inc., Series 2001A, 5.000%, 1/01/27 – AMBAC Insured (Alternative Minimum Tax) | 7/11 at 101.00 | N/R | 211,451 | ||||
| 3,335 | Massachusetts School Building Authority, Dedicated Sales Tax Revenue Bonds, Tender Option Bond Trust 3091, 13.300%, 8/15/37 – AMBAC Insured (IF) | 8/17 at 100.00 | AA+ | 3,412,139 | ||||
| Massachusetts State, Special Obligation Dedicated Tax Revenue Bonds, Series 2004: | ||||||||
| 3,650 | 5.250%, 1/01/22 (Pre-refunded 1/01/14) – FGIC Insured | 1/14 at 100.00 | A1 (4) | 4,062,596 | ||||
| 2,000 | 5.250%, 1/01/24 (Pre-refunded 1/01/14) – FGIC Insured | 1/14 at 100.00 | A1 (4) | 2,226,080 | ||||
| 2,050 | Springfield Water and Sewerage Commission, Massachusetts, General Revenue Bonds, Refunding Series 2010B, 5.000%, 11/15/30 – AGC Insured | No Opt. Call | AA+ | 2,136,059 | ||||
| 17,325 | Total Massachusetts | 18,019,375 | ||||||
| Michigan – 0.7% (0.4% of Total Investments) | ||||||||
| 3,170 | Michigan Housing Development Authority, Rental Housing Revenue Bonds, Series 1997A, 6.000%, 4/01/16 – AMBAC Insured (Alternative Minimum Tax) | 10/11 at 100.00 | AA | 3,174,533 | ||||
| Minnesota – 0.2% (0.1% of Total Investments) | ||||||||
| 795 | Minnesota Housing Finance Agency, Rental Housing Bonds, Series 1995D, 5.950%, 2/01/18 – NPFG Insured | 8/11 at 100.00 | AA+ | 798,196 | ||||
| Missouri – 0.5% (0.3% of Total Investments) | ||||||||
| 1,000 | Jackson County Reorganized School District R-7, Lees Summit, Missouri, General Obligation Bonds, Series 2006, 5.250%, 3/01/25 – NPFG Insured | 3/16 at 100.00 | Aa1 | 1,084,410 | ||||
| 355 | Missouri Housing Development Commission, Multifamily Housing Revenue Bonds, Brookstone Village Apartments, Series 1996A, 6.000%, 12/01/16 – AGM Insured (Alternative Minimum Tax) | 6/11 at 100.00 | AAA | 355,543 | ||||
| 750 | Missouri Western State College, Auxiliary System Revenue Bonds, Series 2003, 5.000%, 10/01/33 – NPFG Insured | 10/13 at 100.00 | A– | 742,988 | ||||
| 2,105 | Total Missouri | 2,182,941 |
| 58 | Nuveen Investments |
| Principal | Optional Call | |||||||
| Amount (000) | Description (1) | Provisions (2) | Ratings (3) | Value | ||||
| Nebraska – 0.5% (0.3% of Total Investments) | ||||||||
| $ | 1,000 | Nebraska Public Power District, General Revenue Bonds, Series 2005A, 5.000%, 1/01/25 – AGM Insured | 1/15 at 100.00 | AA+ | $ | 1,036,100 | ||
| 865 | Omaha Public Power District, Nebraska, Separate Electric System Revenue Bonds, Nebraska City 2, Series 2006A, 19.815%, 8/01/40 – AMBAC Insured (IF) | 2/17 at 100.00 | AA+ | 1,143,617 | ||||
| 1,865 | Total Nebraska | 2,179,717 | ||||||
| Nevada – 3.7% (2.4% of Total Investments) | ||||||||
| 5,000 | Clark County, Nevada, Industrial Development Revenue Bonds, Southwest Gas Corporation, Series 2000C, 5.950%, 12/01/38 – AMBAC Insured (Alternative Minimum Tax) | 7/11 at 101.00 | Baa2 | 4,946,200 | ||||
| 7,545 | Clark County, Nevada, Passenger Facility Charge Revenue Bonds, Las Vegas-McCarran International Airport, Series 2010A, 5.250%, 7/01/39 – AGM Insured | 1/20 at 100.00 | AA+ | 7,111,238 | ||||
| 3,280 | Clark County, Nevada, Subordinate Lien Airport Revenue Bonds, Series 2004A-2, 5.125%, 7/01/24 – FGIC Insured | 7/14 at 100.00 | Aa3 | 3,318,507 | ||||
| Director of Nevada State Department of Business and Industry, Revenue Bonds, Las Vegas Monorail Project, First Tier, Series 2000: | ||||||||
| 5,055 | 0.000%, 1/01/27 – AMBAC Insured | No Opt. Call | D | 490,032 | ||||
| 5,500 | 5.625%, 1/01/32 – AMBAC Insured (5) | 1/12 at 100.00 | N/R | 1,379,785 | ||||
| 26,380 | Total Nevada | 17,245,762 | ||||||
| New Jersey – 9.6% (6.1% of Total Investments) | ||||||||
| Essex County Improvement Authority, New Jersey, Guaranteed Revenue Bonds, Project Consolidation, Series 2004: | ||||||||
| 1,275 | 5.125%, 10/01/21 – NPFG Insured | 10/14 at 100.00 | Aa2 | 1,331,113 | ||||
| 2,250 | 5.125%, 10/01/22 – NPFG Insured | 10/14 at 100.00 | Aa2 | 2,337,863 | ||||
| 1,560 | Mount Olive Township Board of Education, Morris County, New Jersey, General Obligation Bonds, Series 2004, 5.000%, 1/15/22 – NPFG Insured | 1/15 at 100.00 | Aa2 | 1,630,356 | ||||
| New Jersey Economic Development Authority, Revenue Bonds, Motor Vehicle Surcharge, Series 2004A: | ||||||||
| 1,475 | 5.000%, 7/01/22 – NPFG Insured | 7/14 at 100.00 | A | 1,498,453 | ||||
| 1,475 | 5.000%, 7/01/23 – NPFG Insured | 7/14 at 100.00 | A | 1,491,048 | ||||
| 3,075 | New Jersey Transit Corporation, Certificates of Participation Refunding, Series 2003, 5.500%, 10/01/15 – AGM Insured | No Opt. Call | AA+ | 3,466,140 | ||||
| New Jersey Transportation Trust Fund Authority, Transportation System Bonds, Series 2006C: | ||||||||
| 25,000 | 0.000%, 12/15/35 – AMBAC Insured | No Opt. Call | AA– | 4,645,250 | ||||
| 10,000 | 0.000%, 12/15/36 – AMBAC Insured | No Opt. Call | AA– | 1,719,900 | ||||
| 12,500 | New Jersey Transportation Trust Fund Authority, Transportation System Bonds, Series 2007A, 5.000%, 12/15/34 – AMBAC Insured | 12/17 at 100.00 | AA+ | 12,379,498 | ||||
| 10,000 | New Jersey Turnpike Authority, Revenue Bonds, Refunding Series 2005D-1, 5.250%, 1/01/26 – AGM Insured | No Opt. Call | AA+ | 10,911,100 | ||||
| 3,315 | New Jersey Turnpike Authority, Revenue Bonds, Series 2005A, 5.000%, 1/01/25 – AGM Insured (UB) | 1/15 at 100.00 | AA+ | 3,403,046 | ||||
| 71,925 | Total New Jersey | 44,813,767 | ||||||
| New Mexico – 1.0% (0.6% of Total Investments) | ||||||||
| New Mexico Finance Authority, Public Project Revolving Fund Revenue Bonds, Series 2004C: | ||||||||
| 1,415 | 5.000%, 6/01/22 – AMBAC Insured | 6/14 at 100.00 | AAA | 1,529,573 | ||||
| 1,050 | 5.000%, 6/01/24 – AMBAC Insured | 6/14 at 100.00 | AAA | 1,093,953 | ||||
| 2,000 | New Mexico Finance Authority, Public Project Revolving Fund Revenue Bonds, Series 2005E, 5.000%, 6/15/25 – NPFG Insured | 6/15 at 100.00 | Aa2 | 2,080,420 | ||||
| 4,465 | Total New Mexico | 4,703,946 |
| Nuveen Investments | 59 |
Nuveen Insured Premium Income Municipal Fund 2 (continued) | ||
| NPX | Portfolio of Investments |
April 30, 2011 (Unaudited)
| Principal | Optional Call | |||||||
| Amount (000) | Description (1) | Provisions (2) | Ratings (3) | Value | ||||
| New York – 10.2% (6.6% of Total Investments) | ||||||||
| $ | 1,120 | Dormitory Authority of the State of New York, FHA-Insured Mortgage Revenue Bonds, Montefiore Hospital, Series 2004, 5.000%, 8/01/23 – FGIC Insured | 2/15 at 100.00 | BBB | $ | 1,147,944 | ||
| 5,000 | Dormitory Authority of the State of New York, Revenue Bonds, Columbia University, Series 2011A, 5.000%, 10/01/41 | 4/21 at 100.00 | AAA | 5,171,800 | ||||
| 7,435 | Dormitory Authority of the State of New York, Revenue Bonds, New School University, Series 2010, 5.500%, 7/01/43 – AGM Insured | 7/20 at 100.00 | AA+ | 7,562,956 | ||||
| 1,000 | Dormitory Authority of the State of New York, State Personal Income Tax Revenue Bonds, Series 2005F, 5.000%, 3/15/24 – AMBAC Insured | 3/15 at 100.00 | AAA | 1,064,630 | ||||
| 4,055 | Hudson Yards Infrastructure Corporation, New York, Revenue Bonds, Series 2006A, 4.500%, 2/15/47 – NPFG Insured | 2/17 at 100.00 | A | 3,086,017 | ||||
| Long Island Power Authority, New York, Electric System General Revenue Bonds, Series 2006A: | ||||||||
| 10,675 | 5.000%, 12/01/23 – FGIC Insured | 6/16 at 100.00 | A– | 11,150,251 | ||||
| 5,000 | 5.000%, 12/01/25 – FGIC Insured | 6/16 at 100.00 | A– | 5,167,500 | ||||
| 2,700 | Long Island Power Authority, New York, Electric System Revenue Bonds, Series 2006F, 4.250%, 5/01/33 – NPFG Insured | 11/16 at 100.00 | A– | 2,426,274 | ||||
| 5,000 | New York City, New York, General Obligation Bonds, Fiscal Series 2004E, 5.000%, 11/01/21 – AGM Insured | 11/14 at 100.00 | AA+ | 5,365,050 | ||||
| 1,540 | New York Convention Center Development Corporation, Hotel Unit Fee Revenue Bonds, Series 2005, Trust 2364, 17.016%, 11/15/44 – AMBAC Insured (IF) | 11/15 at 100.00 | AA+ | 1,555,954 | ||||
| 495 | New York State Housing Finance Agency, Mortgage Revenue Refunding Bonds, Housing Project, Series 1996A, 6.125%, 11/01/20 – AGM Insured | 11/11 at 100.00 | AA+ | 495,559 | ||||
| 3,770 | New York State Thruway Authority, General Revenue Bonds, Series 2005G, 5.000%, 1/01/25 – AGM Insured | 7/15 at 100.00 | AA+ | 3,893,581 | ||||
| 47,790 | Total New York | 48,087,516 | ||||||
| North Carolina – 2.3% (1.5% of Total Investments) | ||||||||
| 1,250 | Appalachian State University, North Carolina, Revenue Bonds, Series 2005, 5.000%, 7/15/30 – NPFG Insured | 7/15 at 100.00 | Aa3 | 1,264,800 | ||||
| 1,780 | Charlotte, North Carolina, Water and Sewer System Refunding Bonds, Tender Option Bond Trust 2009-43W, 13.305%, 7/01/38 (IF) (6) | 7/20 at 100.00 | AAA | 1,907,893 | ||||
| Mooresville, North Carolina, Enterprise System Revenue Bonds, Series 2004: | ||||||||
| 2,225 | 5.000%, 5/01/23 – FGIC Insured | 5/14 at 100.00 | AA– | 2,289,970 | ||||
| 2,335 | 5.000%, 5/01/24 – FGIC Insured | 5/14 at 100.00 | AA– | 2,393,655 | ||||
| 2,900 | Raleigh Durham Airport Authority, North Carolina, Airport Revenue Bonds, Series 2005A, 5.000%, 5/01/21 – AMBAC Insured | 5/15 at 100.00 | Aa3 | 3,055,382 | ||||
| 10,490 | Total North Carolina | 10,911,700 | ||||||
| Ohio – 1.6% (1.0% of Total Investments) | ||||||||
| 7,825 | Hamilton County, Ohio, Sales Tax Bonds, Subordinate Lien, Series 2006, 4.250%, 12/01/32 – AMBAC Insured | 12/16 at 100.00 | A1 | 6,766,512 | ||||
| 700 | Shaker Heights, Ohio, General Obligation Bonds, Series 2003, 5.250%, 12/01/26 – AMBAC Insured | 12/13 at 100.00 | AA+ | 741,265 | ||||
| 8,525 | Total Ohio | 7,507,777 | ||||||
| Oklahoma – 0.3% (0.2% of Total Investments) | ||||||||
| 1,500 | Oklahoma Capitol Improvement Authority, State Facilities Revenue Bonds, Series 2005F, 5.000%, 7/01/24 – AMBAC Insured | 7/15 at 100.00 | AA | 1,558,785 | ||||
| Oregon – 0.3% (0.2% of Total Investments) | ||||||||
| 1,520 | Portland Housing Authority, Oregon, Multifamily Housing Revenue Bonds, Lovejoy Station Apartments, Series 2000, 6.000%, 7/01/33 – NPFG Insured (Alternative Minimum Tax) | 7/11 at 100.00 | Baa1 | 1,520,547 |
| 60 | Nuveen Investments |
| Principal | Optional Call | |||||||
| Amount (000) | Description (1) | Provisions (2) | Ratings (3) | Value | ||||
| Pennsylvania – 9.5% (6.1% of Total Investments) | ||||||||
| $ | 2,000 | Allegheny County Sanitary Authority, Pennsylvania, Sewerage Revenue Bonds, Series 2005A, 5.000%, 12/01/23 – NPFG Insured | 12/15 at 100.00 | A1 | $ | 2,069,200 | ||
| 4,235 | Delaware County Authority, Pennsylvania, Revenue Bonds, Villanova University, Series 2006, 5.000%, 8/01/24 – AMBAC Insured | 8/16 at 100.00 | A+ | 4,413,082 | ||||
| 1,750 | Delaware River Port Authority, New Jersey and Pennsylvania, Revenue Bonds, Series 2010E, 5.000%, 1/01/40 – AGM Insured | 1/20 at 100.00 | AA+ | 1,728,860 | ||||
| 1,015 | Montgomery County Industrial Development Authority, Pennsylvania, FHA Insured Mortgage Revenue Bonds, New Regional Medical Center Project, Series 2010, 5.375%, 8/01/38 | 8/20 at 100.00 | AA | 1,021,161 | ||||
| 5,235 | Pennsylvania Higher Educational Facilities Authority, Revenue Bonds, Drexel University, Series 2005A, 5.000%, 5/01/28 – NPFG Insured | 5/15 at 100.00 | A | 5,285,989 | ||||
| 4,585 | Pennsylvania Public School Building Authority, Lease Revenue Bonds, School District of Philadelphia, Series 2006B, 4.500%, 6/01/32 – AGM Insured (UB) | 12/16 at 100.00 | AA+ | 4,305,178 | ||||
| 1,050 | Pennsylvania Turnpike Commission, Turnpike Revenue Bonds, Series 2006A, 5.000%, 12/01/26 – AMBAC Insured | 6/16 at 100.00 | Aa3 | 1,085,175 | ||||
| Philadelphia Gas Works, Pennsylvania, Revenue Bonds, General Ordinance, Fifth Series 2004A-1: | ||||||||
| 5,235 | 5.000%, 9/01/24 – AGM Insured | 9/14 at 100.00 | AA+ | 5,309,808 | ||||
| 3,000 | 5.000%, 9/01/25 – AGM Insured | 9/14 at 100.00 | AA+ | 3,037,020 | ||||
| 2,985 | Philadelphia Hospitals and Higher Education Facilities Authority, Pennsylvania, Health System Revenue Bonds, Jefferson Health System, Series 2010B, 5.000%, 5/15/40 | 5/20 at 100.00 | AA | 2,765,603 | ||||
| 1,425 | Philadelphia, Pennsylvania, General Obligation Bonds, Refunding Series 2011, 6.500%, 8/01/41 | 8/20 at 100.00 | A2 | 1,483,596 | ||||
| 2,360 | Philadelphia, Pennsylvania, Water and Wastewater Revenue Bonds, Series 1997A, 5.125%, 8/01/27 – AMBAC Insured (ETM) | 7/11 at 100.00 | AAA | 2,423,130 | ||||
| 3,785 | Reading School District, Berks County, Pennsylvania, General Obligation Bonds, Series 2005, 5.000%, 1/15/25 – AGM Insured (UB) | 1/16 at 100.00 | AA+ | 3,930,193 | ||||
| 1,455 | Solebury Township, Pennsylvania, General Obligation Bonds, Series 2005, 5.000%, 12/15/25 – AMBAC Insured | 6/15 at 100.00 | Aa3 | 1,503,917 | ||||
| 3,650 | State Public School Building Authority, Pennsylvania, Lease Revenue Bonds, Philadelphia School District, Series 2003, 5.000%, 6/01/29 (Pre-refunded 6/01/13) – AGM Insured | 6/13 at 100.00 | AAA | 3,974,704 | ||||
| 43,765 | Total Pennsylvania | 44,336,616 | ||||||
| Puerto Rico – 1.5% (1.0% of Total Investments) | ||||||||
| 2,500 | Puerto Rico Electric Power Authority, Power Revenue Bonds, Series 2005RR, 5.000%, 7/01/22 – FGIC Insured | 7/15 at 100.00 | A3 | 2,519,475 | ||||
| 4,705 | Puerto Rico Sales Tax Financing Corporation, Sales Tax Revenue Bonds, First Subordinate Series 2010C, 5.125%, 8/01/42 – AGM Insured | 8/20 at 100.00 | AA+ | 4,476,290 | ||||
| 7,205 | Total Puerto Rico | 6,995,765 | ||||||
| South Carolina – 0.4% (0.3% of Total Investments) | ||||||||
| 1,955 | Greenville County School District, South Carolina, Installment Purchase Revenue Bonds, Series 2006, 5.000%, 12/01/28 – AGM Insured | 12/16 at 100.00 | AA+ | 1,999,359 | ||||
| Texas – 11.9% (7.6% of Total Investments) | ||||||||
| Corpus Christi, Texas, Utility System Revenue Bonds, Series 2004: | ||||||||
| 3,475 | 5.000%, 7/15/22 – AGM Insured (UB) | 7/14 at 100.00 | AA+ | 3,711,821 | ||||
| 3,645 | 5.000%, 7/15/23 – AGM Insured (UB) | 7/14 at 100.00 | AA+ | 3,867,345 | ||||
| 10,000 | Dallas, Texas, Waterworks and Sewer System Revenue Bonds, Series 2007, 4.375%, 10/01/32 – AMBAC Insured (UB) | 10/17 at 100.00 | AAA | 9,999,700 | ||||
| 12,500 | Dallas-Ft. Worth International Airport, Texas, Joint Revenue Refunding and Improvement Bonds, Series 2001A, 5.500%, 11/01/35 – NPFG Insured (Alternative Minimum Tax) | 5/11 at 100.00 | A+ | 11,957,623 | ||||
| 5,000 | Harris County Hospital District, Texas, Revenue Bonds, Series 2007A, 5.250%, 2/15/42 – NPFG Insured | 2/17 at 100.00 | A1 | 4,698,850 |
| Nuveen Investments | 61 |
Nuveen Insured Premium Income Municipal Fund 2 (continued) | ||
| NPX | Portfolio of Investments |
April 30, 2011 (Unaudited)
| Principal | Optional Call | |||||||
| Amount (000) | Description (1) | Provisions (2) | Ratings (3) | Value | ||||
Texas (continued) | ||||||||
| $ | 500 | Houston, Texas, Subordinate Lien Airport System Revenue Bonds, Series 2000B, 5.450%, 7/01/24 – AGM Insured | No Opt. Call | AA+ | $ | 532,380 | ||
| 4,485 | Lower Colorado River Authority, Texas, Contract Revenue Refunding Bonds, Transmission Services Corporation, Series 2003B, 5.000%, 5/15/21 – AGM Insured | 5/12 at 100.00 | AA+ | 4,622,017 | ||||
| 10,000 | Lower Colorado River Authority, Texas, Contract Revenue Refunding Bonds, Transmission Services Corporation, Series 2003C, 5.000%, 5/15/33 – AMBAC Insured | 5/13 at 100.00 | A | 9,752,000 | ||||
| 4,151 | Panhandle Regional Housing Finance Corporation, Texas, GNMA Collateralized Multifamily Housing Mortgage Revenue Bonds, Renaissance of Amarillo Apartments, Series 2001A, 6.650%, 7/20/42 | 7/12 at 105.00 | Aaa | 4,276,360 | ||||
| 85 | Texas State University System, Financing Revenue Refunding Bonds, Series 2002, 5.000%, 3/15/18 – AGM Insured | No Opt. Call | AA+ | 87,827 | ||||
| 2,215 | Texas State University System, Financing Revenue Refunding Bonds, Series 2002, 5.000%, 3/15/18 (Pre-refunded 3/15/12) – AGM Insured | 3/12 at 100.00 | AA+ (4) | 2,300,654 | ||||
| 56,056 | Total Texas | 55,806,577 | ||||||
| Utah – 2.4% (1.6% of Total Investments) | ||||||||
| 8,600 | Intermountain Power Agency, Utah, Power Supply Revenue Refunding Bonds, Series 2003A, 5.000%, 7/01/18 – AGM Insured (UB) | 7/13 at 100.00 | AA+ | 9,164,676 | ||||
| 2,385 | Mountain Regional Water Special Service District, Utah, Water Revenue Bonds, Series 2003, 5.000%, 12/15/33 – NPFG Insured | 12/13 at 100.00 | A+ | 2,243,307 | ||||
| 10,985 | Total Utah | 11,407,983 | ||||||
| Vermont – 0.3% (0.2% of Total Investments) | ||||||||
| 1,320 | Vermont Educational and Health Buildings Financing Agency, Revenue Bonds, Fletcher Allen Health Care Inc., Series 2000A, 6.000%, 12/01/23 – AMBAC Insured | 6/11 at 101.00 | Baa1 | 1,331,986 | ||||
| Virginia – 2.8% (1.8% of Total Investments) | ||||||||
| Greater Richmond Convention Center Authority, Virginia, Hotel Tax Revenue Bonds, Series 2005: | ||||||||
| 5,880 | 5.000%, 6/15/20 – NPFG Insured | 6/15 at 100.00 | A | 6,137,838 | ||||
| 5,000 | 5.000%, 6/15/22 – NPFG Insured | 6/15 at 100.00 | A | 5,163,100 | ||||
| Loudoun County Industrial Development Authority, Virginia, Lease Revenue Bonds, Public Safety Facilities, Series 2003A: | ||||||||
| 1,150 | 5.250%, 12/15/22 – AGM Insured | 6/14 at 100.00 | AA+ | 1,246,715 | ||||
| 500 | 5.250%, 12/15/23 – AGM Insured | 6/14 at 100.00 | AA+ | 542,050 | ||||
| 12,530 | Total Virginia | 13,089,703 | ||||||
| Washington – 7.3% (4.7% of Total Investments) | ||||||||
| 10,000 | Chelan County Public Utility District 1, Washington, Hydro Consolidated System Revenue Bonds, Series 2001B, 5.600%, 1/01/36 – NPFG Insured (Alternative Minimum Tax) | 7/11 at 101.00 | AA | 9,848,000 | ||||
| 1,370 | Clark County School District 101, La Center, Washington, General Obligation Bonds, Series 2002, 5.000%, 12/01/22 (Pre-refunded 12/01/12) – AGM Insured | 12/12 at 100.00 | Aa1 (4) | 1,468,750 | ||||
| 3,000 | King County, Washington, Sewer Revenue Bonds, Series 2007, 5.000%, 1/01/42 – AGM Insured | 7/17 at 100.00 | AA+ | 3,000,570 | ||||
| 1,545 | Tacoma, Washington, General Obligation Bonds, Series 2004, 5.000%, 12/01/19 – NPFG Insured | 12/14 at 100.00 | AA | 1,640,744 | ||||
| 3,950 | Washington State Health Care Facilities Authority, Revenue Bonds, Swedish Health Services, Series 1998, 5.125%, 11/15/22 – AMBAC Insured | 5/11 at 100.00 | A2 | 3,950,830 | ||||
| 6,200 | Washington State, General Obligation Purpose Bonds, Series 2003A, 5.000%, 7/01/20 (Pre-refunded 7/01/12) – FGIC Insured | 7/12 at 100.00 | AA+ (4) | 6,534,304 | ||||
| 10,855 | Washington, General Obligation Bonds, Series 2000S-5, 0.000%, 1/01/20 – FGIC Insured | No Opt. Call | AA+ | 8,027,490 | ||||
| 36,920 | Total Washington | 34,470,688 |
| 62 | Nuveen Investments |
| Principal | Optional Call | |||||||
| Amount (000) | Description (1) | Provisions (2) | Ratings (3) | Value | ||||
| West Virginia – 1.7% (1.1% of Total Investments) | ||||||||
| $ | 8,000 | Pleasants County, West Virginia, Pollution Control Revenue Bonds, Monongahela Power Company Pleasants Station Project, Series 1995C, 6.150%, 5/01/15 – AMBAC Insured | 11/11 at 100.00 | BBB– | $ | 8,012,000 | ||
| Wisconsin – 2.4% (1.6% of Total Investments) | ||||||||
| 7,000 | La Crosse, Wisconsin, Resource Recovery Revenue Refunding Bonds, Northern States Power Company Project, Series 1996, 6.000%, 11/01/21 – NPFG Insured (Alternative Minimum Tax) | No Opt. Call | Aaa | 7,501,620 | ||||
| 3,775 | Wisconsin State, General Obligation Bonds, Series 2006A, 4.750%, 5/01/25 – FGIC Insured | 5/16 at 100.00 | AA | 3,914,072 | ||||
| 10,775 | Total Wisconsin | 11,415,692 | ||||||
| $ | 874,791 | Total Investments (cost $748,473,452) – 155.6% | 729,629,401 | |||||
| Floating Rate Obligations – (12.4)% | (57,980,000 | ) | ||||||
| Variable Rate Demand Preferred Shares, at Liquidation Value – (46.7)% (7) | (219,000,000 | ) | ||||||
| Other Assets Less Liabilities – 3.5% | 16,333,012 | |||||||
| Net Assets Applicable to Common Shares – 100% | $ | 468,982,413 |
| The Fund intends to invest at least 80% of its managed assets in municipal securities that are covered by insurance guaranteeing the timely payment of principal and interest. See Notes to Financial Statements, Footnote 1 – General Information and Significant Accounting Policies, Insurance for more information. | ||
| (1) | All percentages shown in the Portfolio of Investments are based on net assets applicable to Common shares unless otherwise noted. | |
| (2) | Optional Call Provisions: Dates (month and year) and prices of the earliest optional call or redemption. There may be other call provisions at varying prices at later dates. Certain mortgage-backed securities may be subject to periodic principal paydowns. | |
| (3) | Ratings: Using the highest of Standard & Poor’s Group (“Standard & Poor’s”), Moody’s Investor Service, Inc. (“Moody’s”) or Fitch, Inc. (“Fitch”) rating. | |
| Ratings below BBB by Standard & Poor’s, Baa by Moody’s or BBB by Fitch are considered to be below investment grade. Holdings designated N/R are not rated by any of these national rating agencies. | ||
| (4) | Backed by an escrow or trust containing sufficient U.S. Government or U.S. Government agency securities, which ensure the timely payment of principal and interest. Such investments are normally considered to be equivalent to AAA rated securities. | |
| (5) | At or subsequent to the end of the reporting period, this security is non-income producing. Non-income producing security, in the case of a bond, generally denotes that the issuer has (1) defaulted on the payment of principal or interest, (2) is under the protection of the Federal Bankruptcy Court or (3) the Fund’s Adviser has concluded that the issue is not likely to meet its future interest payment obligations and has directed the Fund’s custodian to cease accruing additional income on the Fund’s records. | |
| (6) | Investment, or portion of investment, has been pledged to collateralize the net payment obligations for investments in inverse floating rate transactions. | |
| (7) | Variable Rate Demand Preferred Shares, at Liquidation Value as a percentage of Total Investments is 30.0%. | |
| N/R | Not rated. | |
| WI/DD | Purchased on a when-issued or delayed delivery basis. | |
| (ETM) | Escrowed to maturity. | |
| (IF) | Inverse floating rate investment. | |
| (UB) | Underlying bond of an inverse floating rate trust reflected as a financing transaction. See Notes to Financial Statements, Footnote 1 – General Information and Significant Accounting Policies, Inverse Floating Rate Securities for more information. |
See accompanying notes to financial statements.
| Nuveen Investments | 63 |
| Nuveen Insured Dividend Advantage Municipal Fund | ||
| NVG | Portfolio of Investments |
April 30, 2011 (Unaudited)
| Principal | Optional Call | |||||||
| Amount (000) | Description (1) | Provisions (2) | Ratings (3) | Value | ||||
| Municipal Bonds – 150.6% (99.8% of Total Investments) | ||||||||
| Alabama – 2.1% (1.4% of Total Investments) | ||||||||
| $ | 5,310 | Athens, Alabama, Water and Sewerage Revenue Warrants, Series 2002, 5.300%, 5/01/32 (Pre-refunded 5/01/12) – NPFG Insured | 5/12 at 101.00 | A+ (4) | $ | 5,620,316 | ||
| 3,045 | Hoover, Alabama, General Obligation Bonds, Series 2003, 5.000%, 3/01/20 (Pre-refunded 3/01/12) – NPFG Insured | 3/12 at 101.00 | AA+ (4) | 3,194,449 | ||||
| 8,355 | Total Alabama | 8,814,765 | ||||||
| Alaska – 3.8% (2.5% of Total Investments) | ||||||||
| 15,000 | Alaska, International Airport System Revenue Bonds, Series 2002B, 5.250%, 10/01/27 (Pre-refunded 10/01/12) – AMBAC Insured | 10/12 at 100.00 | Aa3 (4) | 16,011,750 | ||||
| Arizona – 2.3% (1.5% of Total Investments) | ||||||||
| 5,000 | Phoenix Civic Improvement Corporation, Arizona, Senior Lien Airport Revenue Bonds, Series 2002B, 5.250%, 7/01/32 – FGIC Insured (Alternative Minimum Tax) | 7/12 at 100.00 | AA– | 4,823,200 | ||||
| 6,000 | Phoenix, Arizona, Civic Improvement Revenue Bonds, Civic Plaza, Series 2005B, 0.000%, 7/01/37 – FGIC Insured | No Opt. Call | AA | 5,108,340 | ||||
| 11,000 | Total Arizona | 9,931,540 | ||||||
| California – 12.8% (8.5% of Total Investments) | ||||||||
| 2,000 | Alameda Corridor Transportation Authority, California, Subordinate Lien Revenue Bonds, Series 2004A, 0.000%, 10/01/20 – AMBAC Insured | No Opt. Call | A– | 1,076,540 | ||||
| 6,160 | Alhambra Unified School District, Los Angeles County, California, General Obligation Bonds, Capital Appreciation Series 2009B, 0.000%, 8/01/30 – AGC Insured | No Opt. Call | AA+ | 1,702,870 | ||||
| California Educational Facilities Authority, Revenue Bonds, Occidental College, Series 2005A: | ||||||||
| 1,485 | 5.000%, 10/01/26 – NPFG Insured | 10/15 at 100.00 | Aa3 | 1,509,354 | ||||
| 1,565 | 5.000%, 10/01/27 – NPFG Insured | 10/15 at 100.00 | Aa3 | 1,583,185 | ||||
| 2,000 | Ceres Unified School District, Stanislaus County, California, General Obligation Bonds, Series 2002B, 0.000%, 8/01/33 – FGIC Insured | 8/12 at 29.17 | A+ | 408,160 | ||||
| 2,425 | Fullerton Public Financing Authority, California, Tax Allocation Revenue Bonds, Series 2005, 5.000%, 9/01/27 – AMBAC Insured | 9/15 at 100.00 | A | 2,157,086 | ||||
| 18,665 | Golden State Tobacco Securitization Corporation, California, Enhanced Tobacco Settlement Asset-Backed Revenue Bonds, Series 2005A, 5.000%, 6/01/35 – FGIC Insured | 6/15 at 100.00 | A2 | 15,943,456 | ||||
| Golden State Tobacco Securitization Corporation, California, Tobacco Settlement Asset-Backed Bonds, Series 2007A-1: | ||||||||
| 365 | 5.125%, 6/01/47 | 6/17 at 100.00 | Baa3 | 222,705 | ||||
| 1,000 | 5.750%, 6/01/47 | 6/17 at 100.00 | Baa3 | 678,860 | ||||
| 1,990 | Kern Community College District, California, General Obligation Bonds, Series 2006, 0.000%, 11/01/25 – AGM Insured | No Opt. Call | AA+ | 798,209 | ||||
| 7,935 | Los Angeles, California, Certificates of Participation, Series 2002, 5.300%, 4/01/32 – AMBAC Insured | 4/12 at 100.00 | A+ | 7,894,928 | ||||
| 2,220 | Northern California Power Agency, Revenue Refunding Bonds, Hydroelectric Project 1, Series 1998A, 5.200%, 7/01/32 – NPFG Insured | 7/11 at 100.00 | A | 2,130,423 | ||||
| Oceanside Unified School District, San Diego County, California, General Obligation Bonds, Series 2009A: | ||||||||
| 5,905 | 0.000%, 8/01/26 – AGC Insured | No Opt. Call | AA+ | 2,235,338 | ||||
| 2,220 | 0.000%, 8/01/28 – AGC Insured | No Opt. Call | AA+ | 713,197 | ||||
| 2,675 | Palomar Pomerado Health, California, General Obligation Bonds, Series 2009A, 0.000%, 8/01/38 – AGC Insured | 8/29 at 100.00 | AA+ | 1,647,533 | ||||
| 2,320 | Sacramento Municipal Utility District, California, Electric Revenue Bonds, Series 2001P, 5.250%, 8/15/18 – AGM Insured | 8/11 at 100.00 | AA+ | 2,345,566 |
| 64 | Nuveen Investments |
| Principal | Optional Call | |||||||
| Amount (000) | Description (1) | Provisions (2) | Ratings (3) | Value | ||||
California (continued) | ||||||||
| San Francisco Unified School District, California, General Obligation Bonds, Series 2007A: | ||||||||
| $ | 1,000 | 3.000%, 6/15/25 – AGM Insured | 6/17 at 100.00 | AA+ | $ | 836,940 | ||
| 1,180 | 3.000%, 6/15/26 – AGM Insured | 6/17 at 100.00 | AA+ | 962,833 | ||||
| 6,820 | San Jose Redevelopment Agency, California, Tax Allocation Bonds, Merged Area Redevelopment Project, Series 2006C, 4.250%, 8/01/30 – NPFG Insured | 8/17 at 100.00 | BBB+ | 4,729,806 | ||||
| 4,275 | Sequoia Union High School District, San Mateo County, California, General Obligation Bonds, Series 2006, 3.500%, 7/01/29 – AGM Insured | 7/14 at 102.00 | Aa1 | 3,494,129 | ||||
| 1,690 | Ventura County Community College District, California, General Obligation Bonds, Series 2005B, 5.000%, 8/01/28 – NPFG Insured | 8/15 at 100.00 | AA | 1,696,287 | ||||
| 75,895 | Total California | 54,767,405 | ||||||
| Colorado – 5.7% (3.7% of Total Investments) | ||||||||
| 17,300 | Adams County, Colorado, FHA-Insured Mortgage Revenue Bonds, Platte Valley Medical Center, Series 2005, 5.000%, 8/01/24 – NPFG Insured | 8/15 at 100.00 | BBB | 17,452,932 | ||||
| 750 | Arkansas River Power Authority, Colorado, Power Revenue Bonds, Series 2006, 5.250%, 10/01/32 – SYNCORA GTY Insured | 10/16 at 100.00 | BBB | 661,260 | ||||
| 17,000 | E-470 Public Highway Authority, Colorado, Senior Revenue Bonds, Series 2000B, 0.000%, 9/01/25 – NPFG Insured | No Opt. Call | Baa1 | 5,999,640 | ||||
| 35,050 | Total Colorado | 24,113,832 | ||||||
| District of Columbia – 1.6% (1.0% of Total Investments) | ||||||||
| 6,805 | District of Columbia, Revenue Bonds, Georgetown University, Series 2007A, 4.500%, 4/01/42 – AMBAC Insured | 4/17 at 100.00 | A– | 5,861,555 | ||||
| 935 | Washington Convention Center Authority, District of Columbia, Senior Lien Dedicated Tax Revenue Bonds, Series 2007, Residuals 1601, 11.376%, 10/01/30 – AMBAC Insured (IF) | 10/16 at 100.00 | AA+ | 775,872 | ||||
| 7,740 | Total District of Columbia | 6,637,427 | ||||||
| Florida – 12.0% (8.0% of Total Investments) | ||||||||
| Florida Municipal Loan Council, Revenue Bonds, Series 2003B: | ||||||||
| 2,305 | 5.250%, 12/01/17 – NPFG Insured | 12/13 at 100.00 | A– | 2,413,773 | ||||
| 1,480 | 5.250%, 12/01/18 – NPFG Insured | 12/13 at 100.00 | A– | 1,539,659 | ||||
| 11,600 | Greater Orlando Aviation Authority, Florida, Airport Facilities Revenue Bonds, Series 2002B, 5.125%, 10/01/21 – AGM Insured (Alternative Minimum Tax) | 10/12 at 100.00 | AA+ | 11,719,596 | ||||
| 8,155 | Lee County, Florida, Solid Waste System Revenue Refunding Bonds, Series 2001, 5.625%, 10/01/13 – NPFG Insured (Alternative Minimum Tax) | 10/11 at 100.00 | A3 | 8,278,222 | ||||
| Miami-Dade County, Florida, Aviation Revenue Bonds, Miami International Airport, Series 2002: | ||||||||
| 7,165 | 5.625%, 10/01/15 – FGIC Insured (Alternative Minimum Tax) | 10/12 at 100.00 | A2 | 7,496,310 | ||||
| 5,600 | 5.750%, 10/01/16 – FGIC Insured (Alternative Minimum Tax) | 10/12 at 100.00 | A2 | 5,839,792 | ||||
| 10,000 | 5.125%, 10/01/21 – FGIC Insured (Alternative Minimum Tax) | 10/12 at 100.00 | A2 | 10,176,300 | ||||
| 2,000 | 5.250%, 10/01/22 – FGIC Insured (Alternative Minimum Tax) | 10/12 at 100.00 | A2 | 2,033,000 | ||||
| 1,000 | South Miami Health Facilities Authority, Florida, Hospital Revenue, Baptist Health System Obligation Group, Series 2007, 5.000%, 8/15/42 (UB) | 8/17 at 100.00 | AA | 891,610 | ||||
| 1,000 | Tallahassee, Florida, Energy System Revenue Bonds, Series 2005, 5.000%, 10/01/28 – NPFG Insured | 10/15 at 100.00 | AA | 1,010,620 | ||||
| 50,305 | Total Florida | 51,398,882 | ||||||
| Georgia – 2.3% (1.5% of Total Investments) | ||||||||
| 6,925 | Atlanta and Fulton County Recreation Authority, Georgia, Guaranteed Revenue Bonds, Park Improvement, Series 2005A, 5.000%, 12/01/30 – NPFG Insured | 12/15 at 100.00 | Aa2 | 6,989,680 | ||||
| 1,000 | Atlanta, Georgia, Water and Wastewater Revenue Bonds, Series 2004, 5.000%, 11/01/22 – AGM Insured | 11/14 at 100.00 | AA+ | 1,035,880 | ||||
| 1,695 | Georgia Housing and Finance Authority, Single Family Mortgage Bonds, Series 2002B-2, 5.500%, 6/01/32 (Alternative Minimum Tax) | 12/11 at 100.00 | AAA | 1,695,492 | ||||
| 9,620 | Total Georgia | 9,721,052 |
| Nuveen Investments | 65 |
Nuveen Insured Dividend Advantage Municipal Fund (continued) | ||
| NVG | Portfolio of Investments |
April 30, 2011 (Unaudited)
| Principal | Optional Call | |||||||
| Amount (000) | Description (1) | Provisions (2) | Ratings (3) | Value | ||||
| Idaho – 1.0% (0.7% of Total Investments) | ||||||||
| Idaho Housing and Finance Association, Grant and Revenue Anticipation Bonds, Federal Highway Trust Funds, Series 2006: | ||||||||
| $ | 3,000 | 5.000%, 7/15/23 – NPFG Insured | 7/16 at 100.00 | Aa2 | $ | 3,168,870 | ||
| 1,130 | 5.000%, 7/15/24 – NPFG Insured | 7/16 at 100.00 | Aa2 | 1,183,268 | ||||
| 4,130 | Total Idaho | 4,352,138 | ||||||
| Illinois – 11.8% (7.8% of Total Investments) | ||||||||
| 10,000 | Bolingbrook, Illinois, General Obligation Bonds, Series 2002A, 5.375%, 1/01/38 (Pre-refunded 1/01/12) – FGIC Insured | 1/12 at 100.00 | Aa3 (4) | 10,342,900 | ||||
| 1,305 | Chicago, Illinois, General Obligation Bonds, Series 2001A, 5.500%, 1/01/38 – NPFG Insured | 1/12 at 100.00 | Aa3 | 1,222,707 | ||||
| Chicago, Illinois, Second Lien Passenger Facility Charge Revenue Bonds, O’Hare International Airport, Series 2001C: | ||||||||
| 4,250 | 5.500%, 1/01/16 – AMBAC Insured (Alternative Minimum Tax) | 1/12 at 100.00 | A2 | 4,304,188 | ||||
| 4,485 | 5.500%, 1/01/17 – AMBAC Insured (Alternative Minimum Tax) | 1/12 at 100.00 | A2 | 4,533,214 | ||||
| 4,730 | 5.500%, 1/01/18 – AMBAC Insured (Alternative Minimum Tax) | 1/12 at 100.00 | A2 | 4,771,151 | ||||
| 2,930 | 5.500%, 1/01/19 – AMBAC Insured (Alternative Minimum Tax) | 1/12 at 100.00 | A2 | 2,951,418 | ||||
| 3,600 | Chicago, Illinois, Third Lien General Airport Revenue Bonds, O’Hare International Airport, Series 2005A, 5.250%, 1/01/24 – NPFG Insured | 1/16 at 100.00 | A1 | 3,713,148 | ||||
| 3,000 | Chicago, Illinois, Third Lien General Airport Revenue Refunding Bonds, O’Hare International Airport, Series 2002A, 5.750%, 1/01/17 – NPFG Insured (Alternative Minimum Tax) | 1/12 at 100.00 | A1 | 3,037,170 | ||||
| 4,000 | Cicero, Cook County, Illinois, General Obligation Corporate Purpose Bonds, Series 2002, 5.000%, 12/01/21 – NPFG Insured | 12/12 at 101.00 | Baa1 | 4,055,120 | ||||
| 480 | DuPage County Community School District 200, Wheaton, Illinois, General Obligation Bonds, Series 2003C, 5.250%, 10/01/22 – AGM Insured | 10/13 at 100.00 | Aa3 | 511,176 | ||||
| DuPage County Community School District 200, Wheaton, Illinois, General Obligation Bonds, Series 2003C: | ||||||||
| 770 | 5.250%, 10/01/22 (Pre-refunded 10/01/13) – AGM Insured | 10/13 at 100.00 | Aa3 (4) | 853,899 | ||||
| 250 | 5.250%, 10/01/22 (Pre-refunded 10/01/13) – AGM Insured | 10/13 at 100.00 | Aa3 (4) | 277,240 | ||||
| 3,500 | Illinois Municipal Electric Agency, Power Supply System Revenue Bonds, Series 2007A, 5.000%, 2/01/35 – FGIC Insured | 2/17 at 100.00 | A+ | 3,367,910 | ||||
| Metropolitan Pier and Exposition Authority, Illinois, Revenue Bonds, McCormick Place Expansion Project, Capital Appreciation Refunding Series 2010B-1: | ||||||||
| 25,000 | 0.000%, 6/15/44 – AGM Insured | No Opt. Call | AAA | 2,693,500 | ||||
| 17,465 | 0.000%, 6/15/45 – AGM Insured | No Opt. Call | AAA | 1,753,486 | ||||
| 3,335 | Metropolitan Pier and Exposition Authority, Illinois, Revenue Bonds, McCormick Place Expansion Project, Series 2010B-2, Tender Option Bond Trust 3861, 13.454%, 6/15/42 (IF) (5) | 6/20 at 100.00 | AAA | 1,905,085 | ||||
| 89,100 | Total Illinois | 50,293,312 | ||||||
| Indiana – 14.5% (9.6% of Total Investments) | ||||||||
| 3,380 | Evansville, Indiana, Sewerage Works Revenue Refunding Bonds, Series 2003A, 5.000%, 7/01/20 – AMBAC Insured | 7/13 at 100.00 | A1 | 3,512,969 | ||||
| Indiana Bond Bank, Special Program Bonds, Hendricks County Redevelopment District, Series 2002D: | ||||||||
| 5,075 | 5.250%, 4/01/26 (Pre-refunded 4/01/12) – AMBAC Insured | 4/12 at 100.00 | AA (4) | 5,305,456 | ||||
| 7,000 | 5.250%, 4/01/30 (Pre-refunded 4/01/12) – AMBAC Insured | 4/12 at 100.00 | AA (4) | 7,317,870 | ||||
| 10,000 | Indiana Health Facility Financing Authority, Hospital Revenue Bonds, Marion General Hospital, Series 2002, 5.250%, 7/01/32 – AMBAC Insured | 7/12 at 100.00 | A+ | 9,520,700 | ||||
| 3,215 | Indiana Municipal Power Agency, Power Supply Revenue Bonds, Series 2007A, 5.000%, 1/01/42 – NPFG Insured | 1/17 at 100.00 | A+ | 2,991,300 | ||||
| 5,000 | Indianapolis Local Public Improvement Bond Bank, Indiana, Waterworks Project Series 2009A, 5.500%, 1/01/38 – AGC Insured | 1/19 at 100.00 | AA+ | 5,090,350 | ||||
| 20,000 | Indianapolis Local Public Improvement Bond Bank, Indiana, Waterworks Project, Series 2002A, 5.250%, 7/01/33 (Pre-refunded 7/01/12) – NPFG Insured | 7/12 at 100.00 | AAA | 21,141,597 | ||||
| 6,960 | Valparaiso Middle School Building Corporation, Indiana, First Mortgage Refunding Bonds, Series 2002, 5.000%, 7/15/24 – NPFG Insured | 1/13 at 100.00 | AA+ | 7,187,592 | ||||
| 60,630 | Total Indiana | 62,067,834 |
| 66 | Nuveen Investments |
| Principal | Optional Call | |||||||
| Amount (000) | Description (1) | Provisions (2) | Ratings (3) | Value | ||||
| Kansas – 0.8% (0.5% of Total Investments) | ||||||||
| $ | 3,500 | Kansas Development Finance Authority, Revenue Bonds, Sisters of Charity of Leavenworth Health Services Corporation, Series 2010A, 5.000%, 1/01/40 | No Opt. Call | AA | $ | 3,365,775 | ||
| Kentucky – 0.6% (0.4% of Total Investments) | ||||||||
| 2,415 | Kentucky State Property and Buildings Commission, Revenue Bonds, Project 93, Refunding Series 2009, 5.250%, 2/01/20 – AGC Insured | 2/19 at 100.00 | AA+ | 2,721,246 | ||||
| Louisiana – 4.2% (2.8% of Total Investments) | ||||||||
| 5,000 | Lafayette Public Trust Financing Authority, Louisiana, Revenue Bonds, Ragin’ Cajun Facilities Inc. Project, Series 2010, 5.500%, 10/01/41 – AGM Insured | 10/20 at 100.00 | AA+ | 4,923,500 | ||||
| 1,325 | Louisiana Public Facilities Authority, Revenue Bonds, Baton Rouge General Hospital, Series 2004, 5.250%, 7/01/24 – NPFG Insured | 7/14 at 100.00 | Baa1 | 1,344,014 | ||||
| Louisiana State, Gasoline and Fuels Tax Revenue Bonds, Series 2006A: | ||||||||
| 770 | 4.750%, 5/01/39 – AGM Insured (UB) | 5/16 at 100.00 | AA+ | 743,966 | ||||
| 8,270 | 4.500%, 5/01/41 – FGIC Insured (UB) | 5/16 at 100.00 | Aa1 | 7,564,983 | ||||
| 3 | Louisiana State, Gasoline and Fuels Tax Revenue Bonds, Series 2006, Residuals 660-3, 16.646%, 5/01/34 – FGIC Insured (IF) | 5/16 at 100.00 | Aa1 | 2,199 | ||||
| 3,085 | New Orleans, Louisiana, General Obligation Refunding Bonds, Series 2002, 5.125%, 9/01/21 – NPFG Insured | 9/12 at 100.00 | A3 | 3,122,329 | ||||
| 18,453 | Total Louisiana | 17,700,991 | ||||||
| Massachusetts – 0.8% (0.6% of Total Investments) | ||||||||
| 1,000 | Massachusetts Department of Transportation, Metropolitan Highway System Revenue Bonds, Commonwealth Contract Assistance Secured, Refunding Series 2010B, 5.000%, 1/01/35 | 1/20 at 100.00 | AA | 1,015,050 | ||||
| 2,775 | Massachusetts Water Resources Authority, General Revenue Bonds, Series 2007A, 4.500%, 8/01/46 – AGM Insured (UB) (5) | 2/17 at 100.00 | AA+ | 2,536,128 | ||||
| 3,775 | Total Massachusetts | 3,551,178 | ||||||
| Michigan – 0.3% (0.2% of Total Investments) | ||||||||
| 1,500 | Michigan State Hospital Finance Authority, Revenue Bonds, Trinity Health Care Group, Series 2006A, 5.000%, 12/01/31 (UB) | 12/16 at 100.00 | AA | 1,406,430 | ||||
| Minnesota – 0.5% (0.3% of Total Investments) | ||||||||
| 1,970 | Northern Municipal Power Agency, Minnesota, Electric System Revenue Bonds, Refunding Series 2009A, 5.000%, 1/01/15 – AGC Insured | No Opt. Call | AA+ | 2,175,254 | ||||
| Missouri – 0.4% (0.3% of Total Investments) | ||||||||
| 1,600 | St. Louis County Pattonville School District R3, Missouri, General Obligation Bonds, Series 2004, 5.250%, 3/01/19 – AGM Insured | 3/14 at 100.00 | AA+ | 1,748,896 | ||||
| Nebraska – 2.0% (1.3% of Total Investments) | ||||||||
| 6,360 | Lincoln, Nebraska, Electric System Revenue Bonds, Series 2005, 5.000%, 9/01/32 | 9/15 at 100.00 | AA | 6,484,974 | ||||
| Municipal Energy Agency of Nebraska, Power Supply System Revenue Bonds, Series 2003A: | ||||||||
| 1,000 | 5.250%, 4/01/20 – AGM Insured | 4/13 at 100.00 | AA+ | 1,063,900 | ||||
| 1,000 | 5.250%, 4/01/21 – AGM Insured | 4/13 at 100.00 | AA+ | 1,051,860 | ||||
| 8,360 | Total Nebraska | 8,600,734 | ||||||
| Nevada – 1.5% (1.0% of Total Investments) | ||||||||
| 6,600 | Clark County, Nevada, Passenger Facility Charge Revenue Bonds, Las Vegas-McCarran International Airport, Series 2010A, 5.250%, 7/01/39 – AGM Insured | 1/20 at 100.00 | AA+ | 6,220,566 | ||||
| New Jersey – 0.9% (0.6% of Total Investments) | ||||||||
| 2,150 | New Jersey Transportation Trust Fund Authority, Transportation System Bonds, Refunding Series 2006A, 5.250%, 12/15/20 | No Opt. Call | A+ | 2,324,322 | ||||
| 1,200 | New Jersey Turnpike Authority, Revenue Bonds, Refunding Series 2005D-1, 5.250%, 1/01/26 – AGM Insured | No Opt. Call | AA+ | 1,309,332 | ||||
| 3,350 | Total New Jersey | 3,633,654 |
| Nuveen Investments | 67 |
Nuveen Insured Dividend Advantage Municipal Fund (continued) | ||
| NVG | Portfolio of Investments |
April 30, 2011 (Unaudited)
| Principal | Optional Call | |||||||
| Amount (000) | Description (1) | Provisions (2) | Ratings (3) | Value | ||||
| New York – 5.9% (3.9% of Total Investments) | ||||||||
| $ | 1,120 | Dormitory Authority of the State of New York, FHA-Insured Mortgage Revenue Bonds, Montefiore Hospital, Series 2004, 5.000%, 8/01/23 – FGIC Insured | 2/15 at 100.00 | BBB | $ | 1,147,944 | ||
| 3,660 | Dormitory Authority of the State of New York, Revenue Bonds, Mental Health Services Facilities Improvements, Series 2005B, 5.000%, 2/15/23 – AMBAC Insured | 2/15 at 100.00 | AA– | 3,799,080 | ||||
| Dormitory Authority of the State of New York, State Personal Income Tax Revenue Bonds, Tender Option Bond Trust 3518: | ||||||||
| 1,335 | 13.315%, 2/15/33 (IF) | 2/19 at 100.00 | AAA | 1,346,254 | ||||
| 2,000 | 13.326%, 2/15/33 (IF) | 2/19 at 100.00 | AAA | 2,016,860 | ||||
| 3,130 | Hudson Yards Infrastructure Corporation, New York, Revenue Bonds, Series 2006A, 4.500%, 2/15/47 – NPFG Insured | 2/17 at 100.00 | A | 2,382,055 | ||||
| 2,400 | Long Island Power Authority, New York, Electric System Revenue Bonds, Series 2006F, 4.250%, 5/01/33 – NPFG Insured | 11/16 at 100.00 | A– | 2,156,688 | ||||
| 480 | Metropolitan Transportation Authority, New York, Transportation Revenue Bonds, Series 2005B, 5.000%, 11/15/30 – AMBAC Insured | 11/15 at 100.00 | A | 477,322 | ||||
| 10,265 | Metropolitan Transportation Authority, New York, Transportation Revenue Refunding Bonds, Series 2002A, 5.000%, 11/15/30 – AGM Insured | 11/12 at 100.00 | AA+ | 10,267,772 | ||||
| 1,435 | New York City Industrial Development Agency, New York, Revenue Bonds, Yankee Stadium Project PILOT, Series 2009A, 7.000%, 3/01/49 – AGC Insured | 3/19 at 100.00 | AA+ | 1,560,821 | ||||
| 25,825 | Total New York | 25,154,796 | ||||||
| North Carolina – 0.6% (0.4% of Total Investments) | ||||||||
| 2,080 | North Carolina Medical Care Commission, FHA-Insured Mortgage Revenue Bonds, Betsy Johnson Regional Hospital Project, Series 2003, 5.375%, 10/01/24 – AGM Insured | 10/13 at 100.00 | AA+ | 2,112,760 | ||||
| 540 | Oak Island, North Carolina, Enterprise System Revenue Bonds, Series 2009A, 6.000%, 6/01/34 – AGC Insured | 6/19 at 100.00 | AA+ | 559,548 | ||||
| 2,620 | Total North Carolina | 2,672,308 | ||||||
| Ohio – 0.5% (0.3% of Total Investments) | ||||||||
| Buckeye Tobacco Settlement Financing Authority, Ohio, Tobacco Settlement Asset-Backed Revenue Bonds, Senior Lien, Series 2007A-2: | ||||||||
| 65 | 5.125%, 6/01/24 | 6/17 at 100.00 | Baa3 | 50,223 | ||||
| 710 | 5.875%, 6/01/30 | 6/17 at 100.00 | Baa3 | 512,364 | ||||
| 685 | 5.750%, 6/01/34 | 6/17 at 100.00 | Baa3 | 471,965 | ||||
| 1,570 | 5.875%, 6/01/47 | 6/17 at 100.00 | Baa3 | 1,059,263 | ||||
| 3,030 | Total Ohio | 2,093,815 | ||||||
| Oklahoma – 0.4% (0.3% of Total Investments) | ||||||||
| 2,000 | Oklahoma Development Finance Authority, Revenue Bonds, Saint John Health System, Series 2007, 5.000%, 2/15/37 | 2/17 at 100.00 | A | 1,878,580 | ||||
| Oregon – 1.6% (1.1% of Total Investments) | ||||||||
| 3,000 | Oregon State Department of Transportation, Highway User Tax Revenue Bonds, Series 2009A, 5.000%, 11/15/33 | 5/19 at 100.00 | AAA | 3,095,130 | ||||
| Oregon, General Obligation Veterans Welfare Bonds, Series 82: | ||||||||
| 2,605 | 5.375%, 12/01/31 | 12/11 at 100.00 | AA+ | 2,616,097 | ||||
| 1,235 | 5.500%, 12/01/42 | 12/11 at 100.00 | AA+ | 1,238,446 | ||||
| 6,840 | Total Oregon | 6,949,673 | ||||||
| Pennsylvania – 4.9% (3.2% of Total Investments) | ||||||||
| 4,500 | Allegheny County, Pennsylvania, Airport Revenue Refunding Bonds, Pittsburgh International Airport, Series 1997A, 5.750%, 1/01/13 – NPFG Insured (Alternative Minimum Tax) | No Opt. Call | BBB+ | 4,675,860 | ||||
| 1,050 | Delaware River Port Authority, New Jersey and Pennsylvania, Revenue Bonds, Series 2010E, 5.000%, 1/01/40 – AGM Insured | 1/20 at 100.00 | AA+ | 1,037,316 | ||||
| 4,130 | Pennsylvania Public School Building Authority, Lease Revenue Bonds, School District of Philadelphia, Series 2006B, 4.500%, 6/01/32 – AGM Insured (UB) | 12/16 at 100.00 | AA+ | 3,877,946 | ||||
| 1,050 | Pennsylvania Turnpike Commission, Turnpike Revenue Bonds, Series 2006A, 5.000%, 12/01/26 – AMBAC Insured | 6/16 at 100.00 | Aa3 | 1,085,175 |
| 68 | Nuveen Investments |
| Principal | Optional Call | |||||||
| Amount (000) | Description (1) | Provisions (2) | Ratings (3) | Value | ||||
Pennsylvania (continued) | ||||||||
| $ | 6,000 | Pennsylvania Turnpike Commission, Turnpike Subordinate Revenue Bonds, Series 2009C, 0.000%, 6/01/33 – AGM Insured | 6/26 at 100.00 | AA+ | $ | 4,753,140 | ||
| 2,000 | Philadelphia Municipal Authority, Pennsylvania, Lease Revenue Bonds, Series 2003B, 5.250%, 11/15/18 – AGM Insured | 11/13 at 100.00 | AA+ | 2,109,360 | ||||
| 2,000 | Reading School District, Berks County, Pennsylvania, General Obligation Bonds, Series 2005, 5.000%, 1/15/19 – AGM Insured (UB) | 1/16 at 100.00 | AA+ | 2,183,440 | ||||
| 1,000 | State Public School Building Authority, Pennsylvania, Lease Revenue Bonds, Philadelphia School District, Series 2003, 5.000%, 6/01/23 (Pre-refunded 6/01/13) – AGM Insured | 6/13 at 100.00 | AAA | 1,088,960 | ||||
| 21,730 | Total Pennsylvania | 20,811,197 | ||||||
| Puerto Rico – 0.4% (0.3% of Total Investments) | ||||||||
| 1,225 | Puerto Rico Municipal Finance Agency, Series 2005C, 5.250%, 8/01/21 – CIFG Insured | No Opt. Call | A3 | 1,235,633 | ||||
| 5,000 | Puerto Rico Sales Tax Financing Corporation, Sales Tax Revenue Bonds, Series 2007A, 0.000%, 8/01/42 – NPFG Insured | No Opt. Call | Aa2 | 629,350 | ||||
| 6,225 | Total Puerto Rico | 1,864,983 | ||||||
| South Carolina – 1.5% (1.0% of Total Investments) | ||||||||
| 1,950 | Greenville County School District, South Carolina, Installment Purchase Revenue Bonds, Series 2006, 5.000%, 12/01/28 – AGM Insured | 12/16 at 100.00 | AA+ | 1,994,246 | ||||
| Greenville, South Carolina, Tax Increment Revenue Improvement Bonds, Series 2003: | ||||||||
| 1,000 | 5.500%, 4/01/17 – NPFG Insured | 4/13 at 100.00 | A– | 1,077,000 | ||||
| 2,300 | 5.000%, 4/01/21 – NPFG Insured | 4/13 at 100.00 | A– | 2,396,186 | ||||
| 1,000 | Scago Educational Facilities Corporation, South Carolina, Installment Purchase Revenue Bonds, Spartanburg County School District 5, Series 2005, 5.000%, 4/01/21 – AGM Insured | 10/15 at 100.00 | AA+ | 1,050,600 | ||||
| 6,250 | Total South Carolina | 6,518,032 | ||||||
| Tennessee – 10.0% (6.6% of Total Investments) | ||||||||
| Memphis, Tennessee, Sanitary Sewerage System Revenue Bonds, Series 2004: | ||||||||
| 1,495 | 5.000%, 10/01/19 – AGM Insured | 10/14 at 100.00 | AA+ | 1,633,796 | ||||
| 1,455 | 5.000%, 10/01/20 – AGM Insured | 10/14 at 100.00 | AA+ | 1,582,851 | ||||
| 1,955 | 5.000%, 10/01/21 – AGM Insured | 10/14 at 100.00 | AA+ | 2,099,807 | ||||
| 10,000 | Memphis-Shelby County Sports Authority, Tennessee, Revenue Bonds, Memphis Arena, Series 2002A, 5.125%, 11/01/28 (Pre-refunded 11/01/12) – AMBAC Insured | 11/12 at 100.00 | Aa2 (4) | 10,694,700 | ||||
| 10,000 | Memphis-Shelby County Sports Authority, Tennessee, Revenue Bonds, Memphis Arena, Series 2002B, 5.125%, 11/01/29 (Pre-refunded 11/01/12) – AMBAC Insured | 11/12 at 100.00 | Aa2 (4) | 10,679,100 | ||||
| 15,195 | Tennessee State School Bond Authority, Higher Educational Facilities Second Program Bonds, Series 2002A, 5.250%, 5/01/32 (Pre-refunded 5/01/12) – AGM Insured | 5/12 at 100.00 | AA+ (4) | 15,944,721 | ||||
| 40,100 | Total Tennessee | 42,634,975 | ||||||
| Texas – 24.2% (16.1% of Total Investments) | ||||||||
| 3,500 | Dallas-Ft. Worth International Airport, Texas, Joint Revenue Refunding and Improvement Bonds, Series 2001A, 5.750%, 11/01/13 – NPFG Insured (Alternative Minimum Tax) | 11/11 at 100.00 | A+ | 3,584,000 | ||||
| 10,000 | Gainesville Hospital District, Texas, Limited Tax General Obligation Bonds, Series 2002, 5.375%, 8/15/32 (Pre-refunded 8/15/11) – NPFG Insured | 8/11 at 100.00 | A3 (4) | 10,146,300 | ||||
| 1,210 | Galveston, Texas, General Obligation Bonds, Series 2001, 5.250%, 5/01/21 – AMBAC Insured | 7/11 at 100.00 | Aa3 | 1,213,461 | ||||
| Harris County Health Facilities Development Corporation, Texas, Thermal Utility Revenue Bonds, TECO Project, Series 2003: | ||||||||
| 2,240 | 5.000%, 11/15/16 – NPFG Insured | 11/13 at 100.00 | AA | 2,354,330 | ||||
| 2,355 | 5.000%, 11/15/17 – NPFG Insured | 11/13 at 100.00 | AA | 2,449,035 | ||||
| 4,080 | Harris County, Texas, General Obligation Toll Road Revenue Bonds, Series 2007C, Trust 3418, 13.871%, 8/15/27 – AGM Insured (IF) | No Opt. Call | AAA | 5,248,553 | ||||
| 13,000 | Houston Area Water Corporation, Texas, Contract Revenue Bonds, Northeast Water Purification Plant, Series 2002, 5.125%, 3/01/32 (Pre-refunded 3/01/12) – FGIC Insured | 3/12 at 100.00 | N/R (4) | 13,525,330 | ||||
| 1,000 | Houston, Texas, First Lien Combined Utility System Revenue Bonds, Series 2004A, 5.250%, 5/15/24 – FGIC Insured | 5/14 at 100.00 | AA | 1,069,170 |
| Nuveen Investments | 69 |
Nuveen Insured Dividend Advantage Municipal Fund (continued) | ||
| NVG | Portfolio of Investments |
April 30, 2011 (Unaudited)
| Principal | Optional Call | |||||||
| Amount (000) | Description (1) | Provisions (2) | Ratings (3) | Value | ||||
Texas (continued) | ||||||||
| North Texas Tollway Authority, Special Projects System Revenue Bonds, Series 2011C: | ||||||||
| $ | 2,590 | 0.000%, 9/01/43 | 9/31 at 100.00 | AA | $ | 1,215,150 | ||
| 3,910 | 0.000%, 9/01/45 | 9/31 at 100.00 | AA | 2,116,288 | ||||
| 4,345 | San Antonio, Texas, Water System Senior Lien Revenue Refunding Bonds, Series 2002, 5.500%, 5/15/17 – AGM Insured | 5/12 at 100.00 | AA+ | 4,522,319 | ||||
| 4,925 | Texas Department of Housing and Community Affairs, Residential Mortgage Revenue Bonds, Series 2001A, 5.350%, 7/01/33 (Alternative Minimum Tax) | 7/11 at 100.00 | AAA | 4,836,793 | ||||
| 6,985 | Texas Department of Housing and Community Affairs, Single Family Mortgage Bonds, Series 2002B, 5.550%, 9/01/33 – NPFG Insured (Alternative Minimum Tax) | 3/12 at 100.00 | AAA | 6,990,448 | ||||
| Texas Public Finance Authority, Revenue Bonds, Texas Southern University Financing System, Series 2002: | ||||||||
| 3,520 | 5.125%, 11/01/20 – NPFG Insured | 5/12 at 100.00 | Baa1 | 3,270,362 | ||||
| 3,520 | 5.125%, 11/01/21 – NPFG Insured | 5/12 at 100.00 | Baa1 | 3,193,062 | ||||
| Texas Student Housing Authority, Revenue Bonds, Austin Project, Senior Series 2001A: | ||||||||
| 9,400 | 5.375%, 1/01/23 – NPFG Insured | 1/12 at 102.00 | Baa1 | 7,096,060 | ||||
| 11,665 | 5.500%, 1/01/33 – NPFG Insured | 1/12 at 102.00 | Baa1 | 7,727,479 | ||||
| 5,000 | Texas Water Development Board, Senior Lien State Revolving Fund Revenue Bonds, Series 1999B, 5.250%, 7/15/17 | 7/11 at 100.00 | AAA | 5,018,400 | ||||
| 9,145 | Texas, General Obligation Bonds, Veterans Housing Assistance Program Fund II, Series 2002A-1, 5.250%, 12/01/22 (Pre-refunded 6/01/12) (Alternative Minimum Tax) (UB) | 6/12 at 100.00 | Aaa | 9,551,587 | ||||
| Williamson County, Texas, General Obligation Bonds, Series 2002: | ||||||||
| 3,000 | 5.250%, 2/15/22 (Pre-refunded 2/15/12) – AGM Insured | 2/12 at 100.00 | AAA | 3,118,230 | ||||
| 5,000 | 5.250%, 2/15/25 (Pre-refunded 2/15/12) – AGM Insured | 2/12 at 100.00 | AAA | 5,197,050 | ||||
| 110,390 | Total Texas | 103,443,407 | ||||||
| Utah – 1.2% (0.8% of Total Investments) | ||||||||
| 4,865 | Utah Transit Authority, Sales Tax Revenue Bonds, Series 2008, Trust 1193, 13.226%, 12/15/15 – AGM Insured (IF) | No Opt. Call | AAA | 5,051,816 | ||||
| Washington – 15.8% (10.5% of Total Investments) | ||||||||
| 5,265 | Energy Northwest, Washington Public Power, Nine Canyon Wind Project Revenue Bonds, Series 2006A, 4.500%, 7/01/30 – AMBAC Insured | 7/16 at 100.00 | A | 5,113,157 | ||||
| 3,235 | Energy Northwest, Washington, Electric Revenue Refunding Bonds, Columbia Generating Station – Nuclear Project 2, Series 2002B, 5.350%, 7/01/18 (Pre-refunded 7/01/12) – AGM Insured | 7/12 at 100.00 | AA+ (4) | 3,422,662 | ||||
| 3,365 | Energy Northwest, Washington, Electric Revenue Refunding Bonds, Columbia Generating Station – Nuclear Project 2, Series 2002B, 5.350%, 7/01/18 – AGM Insured | 7/12 at 100.00 | AA+ | 3,531,433 | ||||
| 7,675 | Energy Northwest, Washington, Electric Revenue Refunding Bonds, Nuclear Project 1, Series 2002A, 5.500%, 7/01/15 – NPFG Insured | 7/12 at 100.00 | Aaa | 8,097,279 | ||||
| 2,500 | Port of Seattle, Washington, Revenue Refunding Bonds, Series 2002D, 5.750%, 11/01/15 – FGIC Insured (Alternative Minimum Tax) | 11/12 at 100.00 | Aa2 | 2,625,500 | ||||
| 2,200 | Snohomish County School District 2, Everett, Washington, General Obligation Bonds, Series 2003B, 5.000%, 6/01/17 – AGM Insured | 12/13 at 100.00 | AA+ | 2,394,656 | ||||
| 3,255 | Thurston and Pierce Counties School District, Washington, General Obligation Bonds, Yelm Community Schools, Series 2003, 5.250%, 12/01/16 (Pre-refunded 6/01/13) – AGM Insured | 6/13 at 100.00 | Aa1 (4) | 3,565,006 | ||||
| 10,000 | University of Washington, General Revenue Bonds, Refunding Series 2007, 5.000%, 6/01/37 – AMBAC Insured (UB) | 6/17 at 100.00 | Aaa | 10,127,800 | ||||
| Washington State Economic Development Finance Authority, Wastewater Revenue Bonds, LOTT Project, Series 2002: | ||||||||
| 2,000 | 5.500%, 6/01/17 – AMBAC Insured | 6/12 at 100.00 | Aa3 | 2,092,580 | ||||
| 4,325 | 5.125%, 6/01/22 – AMBAC Insured | 6/12 at 100.00 | Aa3 | 4,436,369 | ||||
| 15,000 | Washington State Health Care Facilities Authority, Revenue Bonds, Harrison Memorial Hospital, Series 1998, 5.000%, 8/15/28 – AMBAC Insured | 8/13 at 102.00 | N/R | 13,119,750 | ||||
| 3,335 | Washington State, General Obligation Bonds, Series 2009, Trust 1212, 13.293%, 7/01/14 – AGM Insured (IF) | No Opt. Call | AA+ | 3,602,434 | ||||
| 5,170 | Whitman County School District 267, Pullman, Washington, General Obligation Bonds, Series 2002, 5.000%, 12/01/20 (Pre-refunded 6/01/12) – AGM Insured | 6/12 at 100.00 | Aa1 (4) | 5,428,190 | ||||
| 67,325 | Total Washington | 67,556,816 |
| 70 | Nuveen Investments |
| Principal | Optional Call | |||||||
| Amount (000) | Description (1) | Provisions (2) | Ratings (3) | Value | ||||
| Wisconsin – 1.7% (1.1% of Total Investments) | ||||||||
| $ | 6,950 | Wisconsin, Transportation Revenue Refunding Bonds, Series 2002-1, 5.125%, 7/01/18 (Pre-refunded 7/01/12) – AMBAC Insured | 7/12 at 100.00 | AA+ (4) | $ | 7,336,559 | ||
| $ | 722,498 | Total Municipal Bonds (cost $640,257,374) | 643,201,618 |
| Shares | Description (1) | Value | ||||||
| Investment Companies – 0.3% (0.2% of Total Investments) | ||||||||
| 13,600 | BlackRock MuniEnhanced Fund Inc. | $ | 135,864 | |||||
| 8,134 | BlackRock MuniHoldings Fund Inc. | 118,024 | ||||||
| 7,920 | Dreyfus Strategic Municipal Fund | 62,251 | ||||||
| 3,500 | DWS Municipal Income Trust | 40,985 | ||||||
| 9,668 | Morgan Stanley Quality Municipal Income Trust | 115,243 | ||||||
| 26,280 | PIMCO Municipal Income Fund II | 265,429 | ||||||
| 9,500 | Van Kampen Advantage Municipal Income Fund II | 106,305 | ||||||
| 28,980 | Van Kampen Investment Grade Municipal Trust | 381,667 | ||||||
| Total Investment Companies (cost $1,353,712) | 1,225,768 | |||||||
| Total Investments (cost $641,611,086) – 150.9% | 644,427,386 | |||||||
| Floating Rate Obligations – (6.7)% | (28,413,334 | ) | ||||||
| MuniFund Term Preferred Shares, at Liquidation Value – (25.3)% (6) | (108,000,000 | ) | ||||||
| Other Assets Less Liabilities – 2.6% | 11,125,202 | |||||||
| Auction Rate Preferred Shares, at Liquidation Value – (21.5)% (6) | (91,950,000) | |||||||
| Net Assets Applicable to Common Shares – 100% | $ | 427,189,254 |
| The Fund intends to invest at least 80% of its managed assets in municipal securities that are covered by insurance guaranteeing the timely payment of principal and interest. See Notes to Financial Statements, Footnote 1 – General Information and Significant Accounting Policies, Insurance for more information. | ||
| (1) | All percentages shown in the Portfolio of Investments are based on net assets applicable to Common shares unless otherwise noted. | |
| (2) | Optional Call Provisions: Dates (month and year) and prices of the earliest optional call or redemption. There may be other call provisions at varying prices at later dates. Certain mortgage-backed securities may be subject to periodic principal paydowns. | |
| (3) | Ratings: Using the highest of Standard & Poor’s Group (“Standard & Poor’s”), Moody’s Investor Service, Inc. (“Moody’s”) or Fitch, Inc. (“Fitch”) rating. Ratings below BBB by Standard & Poor’s, Baa by Moody’s or BBB by Fitch are considered to be below investment grade. Holdings designated N/R are not rated by any of these national rating agencies. | |
| (4) | Backed by an escrow or trust containing sufficient U.S. Government or U.S. Government agency securities, which ensure the timely payment of principal and interest. Such investments are normally considered to be equivalent to AAA rated securities. | |
| (5) | Investment, or portion of investment, has been pledged to collateralize the net payment obligations for investments in inverse floating rate transactions. | |
| (6) | MuniFund Term Preferred Shares and Auction Rate Preferred Shares, at Liquidation Value as a percentage of Total Investments are 16.8% and 14.3%, respectively. | |
| N/R | Not rated. | |
| (IF) | Inverse floating rate investment. | |
| (UB) | Underlying bond of an inverse floating rate trust reflected as a financing transaction. See Notes to Financial Statements, Footnote 1 – General Information and Significant Accounting Policies, Inverse Floating Rate Securities for more information. |
See accompanying notes to financial statements.
| Nuveen Investments | 71 |
| Nuveen Insured Tax-Free Advantage Municipal Fund | ||
| NEA | Portfolio of Investments |
April 30, 2011 (Unaudited)
| Principal | Optional Call | |||||||
| Amount (000) | Description (1) | Provisions (2) | Ratings (3) | Value | ||||
| Alabama – 7.2% (4.8% of Total Investments) | ||||||||
| $ | 1,000 | Alabama Special Care Facilities Financing Authority, Revenue Bonds, Ascension Health, Series 2006C-2, 5.000%, 11/15/36 (UB) | 11/16 at 100.00 | AA+ | $ | 967,070 | ||
| 5,655 | Colbert County-Northwest Health Care Authority, Alabama, Revenue Bonds, Helen Keller Hospital, Series 2003, 5.750%, 6/01/27 | 6/13 at 101.00 | Ba1 | 5,224,655 | ||||
| 3,100 | Huntsville Healthcare Authority, Alabama, Revenue Bonds, Series 1998A, 5.400%, 6/01/22 (Pre-refunded 5/14/12) – NPFG Insured | 5/12 at 102.00 | A2 (4) | 3,316,938 | ||||
| 6,280 | Jefferson County, Alabama, Sewer Revenue Capital Improvement Warrants, Series 2002D, 5.000%, 2/01/32 (Pre-refunded 8/01/12) – FGIC Insured | 8/12 at 100.00 | AAA | 6,627,598 | ||||
| 1,750 | Montgomery, Alabama, General Obligation Warrants, Series 2003, 5.000%, 5/01/21 – AMBAC Insured | 5/12 at 101.00 | AA+ | 1,828,505 | ||||
| 4,500 | Sheffield, Alabama, Electric Revenue Bonds, Series 2003, 5.500%, 7/01/29 – AMBAC Insured | 7/13 at 100.00 | Aa3 | 4,611,330 | ||||
| 22,285 | Total Alabama | 22,576,096 | ||||||
| Arizona – 5.2% (3.5% of Total Investments) | ||||||||
| 10,000 | Maricopa County Pollution Control Corporation, Arizona, Revenue Bonds, Arizona Public Service Company – Palo Verde Project, Series 2002A, 5.050%, 5/01/29 – AMBAC Insured | 11/12 at 100.00 | Baa2 | 9,605,700 | ||||
| 6,545 | Phoenix, Arizona, Civic Improvement Revenue Bonds, Civic Plaza, Series 2005B, 0.000%, 7/01/37 – FGIC Insured | No Opt. Call | AA | 5,572,348 | ||||
| 1,250 | Scottsdale Industrial Development Authority, Arizona, Hospital Revenue Bonds, Scottsdale Healthcare, Series 2006C. Re-offering, 5.000%, | 9/20 at 100.00 | AA+ | 1,193,213 | ||||
| 9/01/35 – AGC Insured | ||||||||
| 17,795 | Total Arizona | 16,371,261 | ||||||
| California – 21.0% (14.0% of Total Investments) | ||||||||
| 26,300 | California State Public Works Board, Lease Revenue Bonds, Department of General Services, Capital East End Project, Series 2002A, 5.000%, 12/01/27 – AMBAC Insured | 12/12 at 100.00 | A2 | 24,920,823 | ||||
| 250 | California State, General Obligation Bonds, Series 2002, 5.250%, 4/01/30 – SYNCORA GTY Insured | 4/12 at 100.00 | A1 | 250,400 | ||||
| 5 | California State, General Obligation Bonds, Series 2004, 5.000%, 4/01/31 – AMBAC Insured | 4/14 at 100.00 | A1 | 4,916 | ||||
| 7,495 | California State, General Obligation Bonds, Series 2004, 5.000%, 4/01/31 (Pre-refunded 4/01/14) – AMBAC Insured | 4/14 at 100.00 | AAA | 8,370,041 | ||||
| 2,910 | Cathedral City Public Financing Authority, California, Tax Allocation Bonds, Housing Set-Aside, Series 2002D, 5.000%, 8/01/26 – NPFG Insured | 8/12 at 102.00 | A | 2,546,221 | ||||
| 8,060 | Golden State Tobacco Securitization Corporation, California, Enhanced Tobacco Settlement Asset-Backed Revenue Bonds, Series 2005A, 5.000%, 6/01/35 – FGIC Insured | 6/15 at 100.00 | A2 | 6,884,771 | ||||
| 250 | Golden State Tobacco Securitization Corporation, California, Tobacco Settlement Asset-Backed Bonds, Series 2007A-1, 5.125%, 6/01/47 | 6/17 at 100.00 | Baa3 | 152,538 | ||||
| 2,500 | Irvine Public Facilities and Infrastructure Authority, California, Assessment Revenue Bonds, Series 2003C, 5.000%, 9/02/23 – AMBAC Insured | 9/13 at 100.00 | N/R | 2,410,575 | ||||
| 4,000 | Montara Sanitation District, California, General Obligation Bonds, Series 2003, 5.000%, 8/01/28 – FGIC Insured | 8/11 at 101.00 | AA– | 4,010,680 | ||||
| Plumas County, California, Certificates of Participation, Capital Improvement Program, Series 2003A: | ||||||||
| 1,130 | 5.250%, 6/01/19 – AMBAC Insured | 6/13 at 101.00 | A | 1,160,499 | ||||
| 1,255 | 5.250%, 6/01/21 – AMBAC Insured | 6/13 at 101.00 | A | 1,274,427 | ||||
| 1,210 | Redding Joint Powers Financing Authority, California, Lease Revenue Bonds, Capital Improvement Projects, Series 2003A, 5.000%, 3/01/23 – AMBAC Insured | 3/13 at 100.00 | A | 1,210,121 | ||||
| 3,750 | Sacramento Municipal Utility District, California, Electric Revenue Bonds, Series 2003R, 5.000%, 8/15/28 – NPFG Insured | 8/13 at 100.00 | A+ | 3,756,975 | ||||
| 1,500 | San Diego Community College District, California, General Obligation Bonds, Series 2003A, 5.000%, 5/01/28 – AGM Insured | 5/13 at 100.00 | AA+ | 1,507,095 | ||||
| 1,055 | Turlock Irrigation District, California, Certificates of Participation, Series 2003A, 5.000%, 1/01/28 – NPFG Insured | 1/13 at 100.00 | A | 1,013,961 | ||||
| 6,300 | University of California, General Revenue Bonds, Multi-Purpose Projects, Series 2003A, 5.000%, 5/15/33 – AMBAC Insured (UB) | 5/13 at 100.00 | Aa1 | 6,245,820 | ||||
| 67,970 | Total California | 65,719,863 |
| 72 | Nuveen Investments |
| Principal | Optional Call | |||||||
| Amount (000) | Description (1) | Provisions (2) | Ratings (3) | Value | ||||
| Colorado – 4.7% (3.1% of Total Investments) | ||||||||
| Bowles Metropolitan District, Colorado, General Obligation Bonds, Series 2003: | ||||||||
| $ | 4,300 | 5.500%, 12/01/23 – AGM Insured | 12/13 at 100.00 | AA+ | $ | 4,528,072 | ||
| 3,750 | 5.500%, 12/01/28 – AGM Insured | 12/13 at 100.00 | AA+ | 3,824,438 | ||||
| 1,450 | Colorado Educational and Cultural Facilities Authority, Charter School Revenue Bonds, Peak-to-Peak Charter School, Series 2004, 5.250%, 8/15/24 – SYNCORA GTY Insured | 8/14 at 100.00 | A | 1,458,193 | ||||
| 4,500 | Colorado Health Facilities Authority, Colorado, Revenue Bonds, Catholic Health Initiatives, Series 2006C-1, Trust 1090, 14.832%, 10/01/41 – AGM Insured (IF) (5) | 4/18 at 100.00 | AA+ | 3,608,055 | ||||
| 3,000 | E-470 Public Highway Authority, Colorado, Senior Revenue Bonds, Series 2000B, 0.000%, 9/01/30 – NPFG Insured | No Opt. Call | Baa1 | 676,740 | ||||
| 2,900 | E-470 Public Highway Authority, Colorado, Toll Revenue Bonds, Series 2004A, 0.000%, 9/01/34 – NPFG Insured | No Opt. Call | Baa1 | 468,727 | ||||
| 19,900 | Total Colorado | 14,564,225 | ||||||
| District of Columbia – 0.6% (0.4% of Total Investments) | ||||||||
| 7,000 | Metropolitan Washington Airports Authority, Virginia, Dulles Toll Road Revenue Bonds, Capital Appreciation Series 2009B-2, 0.000%, 10/01/36 – AGC Insured | No Opt. Call | AA+ | 1,272,530 | ||||
| 665 | Washington Convention Center Authority, District of Columbia, Senior Lien Dedicated Tax Revenue Bonds, Series 2007, Residuals 1606, 11.376%, 10/01/30 – AMBAC Insured (IF) | 10/16 at 100.00 | AA+ | 551,824 | ||||
| 7,665 | Total District of Columbia | 1,824,354 | ||||||
| Florida – 23.7% (15.8% of Total Investments) | ||||||||
| 1,000 | Bay County, Florida, Water System Revenue Bonds, Series 2005, 5.000%, 9/01/25 – AMBAC Insured | 9/15 at 100.00 | A1 | 1,020,240 | ||||
| Clay County, Florida, Utility System Revenue Bonds, Series 2007: | ||||||||
| 1,500 | 5.000%, 11/01/27 – SYNCORA GTY Insured (UB) | 11/17 at 100.00 | AAA | 1,526,655 | ||||
| 3,000 | 5.000%, 11/01/32 – SYNCORA GTY Insured (UB) | 11/17 at 100.00 | AAA | 2,980,440 | ||||
| 400 | Collier County, Florida, Capital Improvement Revenue Bonds, Series 2005, 5.000%, 10/01/23 – NPFG Insured | 10/14 at 100.00 | AA– | 413,220 | ||||
| 1,000 | Escambia County, Florida, Sales Tax Revenue Refunding Bonds, Series 2002, 5.250%, 10/01/17 – AMBAC Insured | 10/12 at 101.00 | A+ | 1,066,650 | ||||
| 1,525 | Fernandina Beach, Florida, Utility Acquisition and Improvement Revenue Bonds, Series 2003, 5.000%, 9/01/23 – FGIC Insured | 9/13 at 100.00 | BBB | 1,418,418 | ||||
| 500 | Flagler County, Florida, Capital Improvement Revenue Bonds, Series 2005, 5.000%, 10/01/30 – NPFG Insured | 10/15 at 100.00 | A | 497,825 | ||||
| 135 | Florida Housing Finance Agency, GNMA Collateralized Home Ownership Revenue Refunding Bonds, Series 1987G-1, 8.595%, 11/01/17 | No Opt. Call | AAA | 146,418 | ||||
| 2,500 | Florida State Board of Education, Public Education Capital Outlay Bonds, Series 2008, Trust 2929, 16.907%, 12/01/16 – AGC Insured (IF) | No Opt. Call | AAA | 2,622,300 | ||||
| 2,240 | FSU Financial Assistance Inc., Florida, General Revenue Bonds, Educational and Athletic Facilities Improvements, Series 2004, 5.000%, 10/01/14 – AMBAC Insured | No Opt. Call | Aa3 | 2,469,779 | ||||
| 2,000 | Greater Orlando Aviation Authority, Florida, Airport Facilities Revenue Bonds, Series 2002A, 5.125%, 10/01/32 – AGM Insured | 10/12 at 100.00 | AA+ | 2,002,620 | ||||
| 105 | Greater Orlando Aviation Authority, Florida, Airport Facilities Revenue Refunding Bonds, Series 2003A, 5.000%, 10/01/17 – AGM Insured | 10/13 at 100.00 | AA+ | 112,397 | ||||
| 350 | Halifax Hospital Medical Center, Florida, Revenue Bonds, Series 2006, 5.500%, 6/01/38 – AGM Insured | 6/18 at 100.00 | AA+ | 336,417 | ||||
| 1,765 | Highlands County Health Facilities Authority, Florida, Hospital Revenue Bonds, Adventist Health System, Series 2005D, 5.000%, 11/15/35 – NPFG Insured | 11/15 at 100.00 | AA– | 1,607,085 | ||||
| 180 | Highlands County Health Facilities Authority, Florida, Hospital Revenue Bonds, Adventist Health System, Series 2005D, 5.000%, 11/15/35 (Pre-refunded 11/15/15) – NPFG Insured | 11/15 at 100.00 | AA– (4) | 208,433 | ||||
| 3,500 | Highlands County Health Facilities Authority, Florida, Hospital Revenue Bonds, Adventist Health System/Sunbelt Obligated Group, Series 2003D, 5.875%, 11/15/29 (Pre-refunded 11/15/13) | 11/13 at 100.00 | N/R (4) | 3,918,670 | ||||
| 1,500 | Hillsborough County School Board, Florida, Certificates of Participation, Series 2003, 5.000%, 7/01/29 – NPFG Insured | 7/13 at 100.00 | Aa2 | 1,505,400 |
| Nuveen Investments | 73 |
Nuveen Insured Tax-Free Advantage Municipal Fund (continued) | ||
| NEA | Portfolio of Investments |
April 30, 2011 (Unaudited)
| Principal | Optional Call | |||||||
| Amount (000) | Description (1) | Provisions (2) | Ratings (3) | Value | ||||
Florida (continued) | ||||||||
| $ | 2,270 | Jacksonville, Florida, Local Government Sales Tax Revenue Refunding and Improvement Bonds, Series 2002, 5.375%, 10/01/18 – FGIC Insured | 10/12 at 100.00 | AA+ | $ | 2,384,726 | ||
| 2,265 | Lakeland, Florida, Utility Tax Revenue Bonds, Series 2003B, 5.000%, 10/01/20 – AMBAC Insured | 10/12 at 100.00 | N/R | 2,283,211 | ||||
| 1,730 | Lee County, Florida, Transportation Facilities Revenue Bonds, Series 2004B, 5.000%, 10/01/22 – AMBAC Insured | 10/14 at 100.00 | A– | 1,763,251 | ||||
| 500 | Lee Memorial Health System, Florida, Hospital Revenue Bonds, Series 2007A, 5.000%, 4/01/32 – NPFG Insured | 4/17 at 100.00 | A | 435,990 | ||||
| 3,000 | Marco Island, Florida, Water Utility System Revenue Bonds, Series 2003, 5.000%, 10/01/27 – NPFG Insured | 10/13 at 100.00 | Aa3 | 3,021,630 | ||||
| 500 | Miami-Dade County, Florida, Water and Sewer System Revenue Bonds, Refunding Series 2008B, 5.250%, 10/01/22 – AGM Insured | No Opt. Call | AA+ | 566,810 | ||||
| 2,000 | Miami-Dade County, Florida, Water and Sewer System Revenue Bonds, Series 1999A, 5.000%, 10/01/29 – FGIC Insured | 10/11 at 100.00 | Aa2 | 2,001,340 | ||||
| 2,000 | Orange County, Florida, Sales Tax Revenue Bonds, Series 2002A, 5.125%, 1/01/17 – FGIC Insured | 1/13 at 100.00 | AA | 2,104,600 | ||||
| 1,500 | Orange County, Florida, Sales Tax Revenue Bonds, Series 2002B, 5.125%, 1/01/32 – FGIC Insured | 1/13 at 100.00 | AA | 1,483,860 | ||||
| 3,370 | Osceola County School Board, Florida, Certificates of Participation, Series 2002A, 5.125%, 6/01/20 (Pre-refunded 6/01/12) – AMBAC Insured | 6/12 at 101.00 | Aa3 (4) | 3,572,571 | ||||
| 3,335 | Palm Bay, Florida, Local Optional Gas Tax Revenue Bonds, Series 2004, 5.250%, 10/01/20 – NPFG Insured | 10/14 at 100.00 | AA– | 3,627,446 | ||||
| 1,095 | Palm Bay, Florida, Utility System Revenue Bonds, Series 2004, 5.250%, 10/01/20 – NPFG Insured | 10/14 at 100.00 | Aa3 | 1,191,021 | ||||
| 2,670 | Palm Beach County School Board, Florida, Certificates of Participation, Series 2002D, 5.000%, 8/01/28 – AGM Insured | 8/12 at 100.00 | AA+ | 2,675,580 | ||||
| 1,950 | Palm Beach County School Board, Florida, Certificates of Participation, Series 2002D, 5.250%, 8/01/20 (Pre-refunded 8/01/12) – AGM Insured | 8/12 at 100.00 | AA+ (4) | 2,068,599 | ||||
| Pinellas County Health Facilities Authority, Florida, Revenue Bonds, Baycare Health System, Series 2003: | ||||||||
| 3,000 | 5.500%, 11/15/27 (Pre-refunded 5/15/13) | 5/13 at 100.00 | Aa3 (4) | 3,295,410 | ||||
| 2,800 | 5.750%, 11/15/27 (Pre-refunded 5/15/13) | 5/13 at 100.00 | Aa3 (4) | 3,089,912 | ||||
| 1,000 | Port Saint Lucie, Florida, Special Assessment Revenue Bonds, Southwest Annexation District 1B, Series 2007, 5.000%, 7/01/33 – NPFG Insured | 7/17 at 100.00 | Baa1 | 825,020 | ||||
| 2,115 | Port St. Lucie, Florida, Sales Tax Revenue Bonds, Series 2003, 5.000%, 9/01/23 – NPFG Insured | 9/13 at 100.00 | A+ | 2,159,288 | ||||
| 1,500 | Port St. Lucie, Florida, Stormwater Utility System Revenue Refunding Bonds, Series 2002, 5.000%, 5/01/23 – NPFG Insured | 5/12 at 100.00 | Aa3 | 1,522,095 | ||||
| 450 | Port St. Lucie, Florida, Utility System Revenue Bonds, Refunding Series 2009, 5.250%, 9/01/35 – AGC Insured | 9/18 at 100.00 | AA+ | 451,463 | ||||
| 1,500 | South Miami Health Facilities Authority, Florida, Hospital Revenue Bonds, Baptist Health Systems of South Florida, Series 2003, 5.200%, 11/15/28 (Pre-refunded 2/01/13) | 2/13 at 100.00 | Aaa | 1,620,990 | ||||
| 1,730 | St. John’s County, Florida, Sales Tax Revenue Bonds, Series 2004A, 5.000%, 10/01/24 – AMBAC Insured | 10/14 at 100.00 | A+ | 1,769,046 | ||||
| 4,000 | St. Lucie County School Board, Florida, Certificates of Participation, Master Lease Program, Series 2004A, 5.000%, 7/01/24 – AGM Insured | 7/14 at 100.00 | AA+ | 4,060,040 | ||||
| 1,200 | Tamarac, Florida, Utility System Revenue Bonds, Series 2009, 5.000%, 10/01/39 – AGC Insured | 10/19 at 100.00 | AA+ | 1,201,176 | ||||
| 1,250 | Volusia County Educational Facilities Authority, Florida, Revenue Refunding Bonds, Embry-Riddle Aeronautical University, Series 2003, 5.200%, 10/15/33 – RAAI Insured | 10/13 at 100.00 | Baa2 | 1,113,363 | ||||
| 71,930 | Total Florida | 74,141,405 | ||||||
| Georgia – 2.0% (1.4% of Total Investments) | ||||||||
| 3,000 | Atlanta, Georgia, Water and Wastewater Revenue Bonds, Series 2009B, 5.375%, 11/01/39 – AGM Insured | 11/19 at 100.00 | AA+ | 3,017,280 | ||||
| 1,410 | DeKalb County, Georgia, Water and Sewer Revenue Bonds, Series 2006A, 5.000%, 10/01/35 – AGM Insured | 10/16 at 100.00 | AA+ | 1,342,179 | ||||
| 1,825 | Metropolitan Atlanta Rapid Transit Authority, Georgia, Sales Tax Revenue Bonds, Second Indenture Series 2002, 5.000%, 7/01/32 (Pre-refunded 1/01/13) – NPFG Insured | 1/13 at 100.00 | AA+ (4) | 1,960,141 | ||||
| 6,235 | Total Georgia | 6,319,600 |
| 74 | Nuveen Investments |
| Principal | Optional Call | |||||||
| Amount (000) | Description (1) | Provisions (2) | Ratings (3) | Value | ||||
| Illinois – 4.9% (3.3% of Total Investments) | ||||||||
| $ | 5,000 | Chicago, Illinois, General Airport Revenue Bonds, O’Hare International Airport, Third Lien Refunding Series 2010C, 5.250%, 1/01/35 – AGC Insured | No Opt. Call | AA+ | $ | 4,959,450 | ||
| Cook County School District 145, Arbor Park, Illinois, General Obligation Bonds, Series 2004: | ||||||||
| 1,635 | 5.125%, 12/01/20 – AGM Insured | 12/14 at 100.00 | Aa3 | 1,704,030 | ||||
| 1,465 | 5.125%, 12/01/23 – AGM Insured | 12/14 at 100.00 | Aa3 | 1,509,258 | ||||
| Cook County School District 145, Arbor Park, Illinois, General Obligation Bonds, Series 2004: | ||||||||
| 1,650 | 5.125%, 12/01/20 – AGM Insured (ETM) | 12/14 at 100.00 | Aa3 (4) | 1,760,121 | ||||
| 1,475 | 5.125%, 12/01/23 – AGM Insured (ETM) | 12/14 at 100.00 | Aa3 (4) | 1,553,706 | ||||
| 2,500 | Illinois Health Facilities Authority, Revenue Bonds, Lake Forest Hospital, Series 2003, 5.250%, 7/01/23 | 7/13 at 100.00 | AA+ | 2,524,300 | ||||
| 13,300 | Metropolitan Pier and Exposition Authority, Illinois, Revenue Bonds, McCormick Place Expansion Project, Capital Appreciation Refunding Series 2010B-1, 0.000%, 6/15/45 – AGM Insured | No Opt. Call | AAA | 1,335,320 | ||||
| 27,025 | Total Illinois | 15,346,185 | ||||||
| Indiana – 7.3% (4.9% of Total Investments) | ||||||||
| 2,500 | Evansville, Indiana, Sewerage Works Revenue Refunding Bonds, Series 2003A, 5.000%, 7/01/23 – AMBAC Insured | 7/13 at 100.00 | A1 | 2,519,775 | ||||
| 2,190 | Indiana Bond Bank, Advance Purchase Funding Bonds, Common School Fund, Series 2003B, 5.000%, 8/01/19 – NPFG Insured | 8/13 at 100.00 | Baa1 | 2,260,014 | ||||
| 1,860 | Indiana Municipal Power Agency, Power Supply Revenue Bonds, Series 2007A, 5.000%, 1/01/42 – NPFG Insured | 1/17 at 100.00 | A+ | 1,730,581 | ||||
| 1,000 | Indiana University, Student Fee Revenue Bonds, Series 2003O, 5.000%, 8/01/22 – FGIC Insured | 8/13 at 100.00 | Aaa | 1,058,750 | ||||
| IPS Multi-School Building Corporation, Indiana, First Mortgage Revenue Bonds, Series 2003: | ||||||||
| 11,020 | 5.000%, 7/15/19 (Pre-refunded 7/15/13) – NPFG Insured | 7/13 at 100.00 | AA (4) | 12,052,353 | ||||
| 3,000 | 5.000%, 7/15/20 (Pre-refunded 7/15/13) – NPFG Insured | 7/13 at 100.00 | AA (4) | 3,281,040 | ||||
| 21,570 | Total Indiana | 22,902,513 | ||||||
| Kansas – 1.7% (1.1% of Total Investments) | ||||||||
| 5,000 | Kansas Development Finance Authority, Board of Regents, Revenue Bonds, Scientific Research and Development Facilities Projects, Series 2003C, Reg S, 5.000%, 10/01/22 – AMBAC Insured | 4/13 at 102.00 | AA | 5,210,500 | ||||
| Kentucky – 0.3% (0.2% of Total Investments) | ||||||||
| 985 | Kentucky State Property and Buildings Commission, Revenue Refunding Bonds, Project 77, Series 2003, 5.000%, 8/01/23 (Pre-refunded 8/01/13) – NPFG Insured | 8/13 at 100.00 | Aa3 (4) | 1,081,057 | ||||
| Louisiana – 2.5% (1.7% of Total Investments) | ||||||||
| 2,000 | Louisiana State, Gasoline and Fuels Tax Revenue Bonds, Second Lien Series 2010B, 5.000%, 5/01/45 | 5/20 at 100.00 | AA | 1,966,260 | ||||
| 5,785 | New Orleans, Louisiana, General Obligation Refunding Bonds, Series 2002, 5.300%, 12/01/27 – FGIC Insured | 12/12 at 100.00 | A3 | 5,800,851 | ||||
| 7,785 | Total Louisiana | 7,767,111 | ||||||
| Massachusetts – 0.4% (0.2% of Total Investments) | ||||||||
| 1,125 | Massachusetts Development Finance Authority, Revenue Bonds, Middlesex School, Series 2003, 5.125%, 9/01/23 | 9/13 at 100.00 | A1 | 1,151,460 | ||||
| Michigan – 9.8% (6.5% of Total Investments) | ||||||||
| 6,130 | Detroit, Michigan, Senior Lien Water Supply System Revenue Bonds, Series 2003A, 5.000%, 7/01/23 (Pre-refunded 7/01/13) – NPFG Insured | 7/13 at 100.00 | A+ (4) | 6,688,137 | ||||
| 4,465 | Detroit, Michigan, Senior Lien Water Supply System Revenue Refunding Bonds, Series 2003C, 5.000%, 7/01/22 – NPFG Insured | 7/13 at 100.00 | A+ | 4,453,346 | ||||
| 1,000 | Michigan State Hospital Finance Authority, Revenue Bonds, Trinity Health Care Group, Series 2006A, 5.000%, 12/01/31 (UB) | 12/16 at 100.00 | AA | 937,620 | ||||
| 10,800 | Michigan Strategic Fund, Limited Obligation Resource Recovery Revenue Refunding Bonds, Detroit Edison Company, Series 2002D, 5.250%, 12/15/32 – SYNCORA GTY Insured | 12/12 at 100.00 | BBB+ | 10,466,820 | ||||
| 2,250 | Romulus Community Schools, Wayne County, Michigan, General Obligation Refunding Bonds, Series 2001, 5.250%, 5/01/25 | 11/11 at 100.00 | Aa2 | 2,252,093 |
| Nuveen Investments | 75 |
Nuveen Insured Tax-Free Advantage Municipal Fund (continued) | ||
| NEA | Portfolio of Investments |
April 30, 2011 (Unaudited)
| Principal | Optional Call | |||||||
| Amount (000) | Description (1) | Provisions (2) | Ratings (3) | Value | ||||
Michigan (continued) | ||||||||
| $ | 6,500 | Wayne County, Michigan, Limited Tax General Obligation Airport Hotel Revenue Bonds, Detroit Metropolitan Wayne County Airport, Series 2001A, 5.000%, 12/01/30 – NPFG Insured | 12/11 at 101.00 | A– | $ | 5,815,160 | ||
| 31,145 | Total Michigan | 30,613,176 | ||||||
| Missouri – 1.0% (0.7% of Total Investments) | ||||||||
| 240 | Clay County Public School District 53, Liberty, Missouri, General Obligation Bonds, Series 2004, 5.250%, 3/01/24 – AGM Insured | 3/14 at 100.00 | AA+ | 258,382 | ||||
| 215 | Clay County Public School District 53, Liberty, Missouri, General Obligation Bonds, Series 2004, 5.250%, 3/01/23 – AGM Insured | 3/14 at 100.00 | AA+ | 231,467 | ||||
| Clay County Public School District 53, Liberty, Missouri, General Obligation Bonds, Series 2004: | ||||||||
| 1,110 | 5.250%, 3/01/23 (Pre-refunded 3/01/14) – AGM Insured | 3/14 at 100.00 | AA+ (4) | 1,247,529 | ||||
| 1,260 | 5.250%, 3/01/24 (Pre-refunded 3/01/14) – AGM Insured | 3/14 at 100.00 | AA+ (4) | 1,416,114 | ||||
| 2,825 | Total Missouri | 3,153,492 | ||||||
| Nebraska – 1.6% (1.1% of Total Investments) | ||||||||
| 5,000 | Lincoln, Nebraska, Sanitary Sewerage System Revenue Refunding Bonds, Series 2003, 5.000%, 6/15/28 – NPFG Insured | 6/13 at 100.00 | AA+ | 5,071,900 | ||||
| New Mexico – 0.7% (0.5% of Total Investments) | ||||||||
| 1,975 | New Mexico State University, Revenue Bonds, Series 2004, 5.000%, | 4/14 at 100.00 | AA | 2,135,311 | ||||
| 4/01/19 – AMBAC Insured | ||||||||
| New York – 10.0% (6.7% of Total Investments) | ||||||||
| 2,020 | Hudson Yards Infrastructure Corporation, New York, Revenue Bonds, Series 2006A, 4.500%, 2/15/47 – NPFG Insured | 2/17 at 100.00 | A | 1,537,301 | ||||
| 25,000 | Metropolitan Transportation Authority, New York, Transportation Revenue Refunding Bonds, Series 2002F, 5.000%, 11/15/31 – NPFG Insured | 11/12 at 100.00 | A | 24,449,999 | ||||
| 1,850 | New York State Urban Development Corporation, Service Contract Revenue Bonds, Series 2005B, 5.000%, 3/15/25 – AGM Insured (UB) | 3/15 at 100.00 | AAA | 1,952,564 | ||||
| 3,335 | New York State Urban Development Corporation, State Personal Income Tax Revenue Bonds, Tender Option Bond Trust 09-6W, 13.076%, 3/15/37 (IF) (5) | 3/17 at 100.00 | AAA | 3,352,109 | ||||
| 32,205 | Total New York | 31,291,973 | ||||||
| North Carolina – 2.2% (1.5% of Total Investments) | ||||||||
| 8,700 | North Carolina Medical Care Commission, Revenue Bonds, Maria Parham Medical Center, Series 2003, 5.375%, 10/01/33 – RAAI Insured | 10/13 at 100.00 | BB | 6,801,312 | ||||
| Ohio – 0.7% (0.5% of Total Investments) | ||||||||
| Buckeye Tobacco Settlement Financing Authority, Ohio, Tobacco Settlement Asset-Backed Revenue Bonds, Senior Lien, Series 2007A-2: | ||||||||
| 65 | 5.125%, 6/01/24 | 6/17 at 100.00 | Baa3 | 50,223 | ||||
| 710 | 5.875%, 6/01/30 | 6/17 at 100.00 | Baa3 | 512,364 | ||||
| 685 | 5.750%, 6/01/34 | 6/17 at 100.00 | Baa3 | 471,965 | ||||
| 1,570 | 5.875%, 6/01/47 | 6/17 at 100.00 | Baa3 | 1,059,263 | ||||
| 3,030 | Total Ohio | 2,093,815 | ||||||
| Oklahoma – 0.3% (0.2% of Total Investments) | ||||||||
| 1,000 | Oklahoma Capitol Improvement Authority, State Facilities Revenue Bonds, Series 2005F, 5.000%, 7/01/24 – AMBAC Insured | 7/15 at 100.00 | AA | 1,039,190 | ||||
| Oregon – 2.6% (1.7% of Total Investments) | ||||||||
| 8,350 | Oregon Health Sciences University, Revenue Bonds, Series 2002A, 5.000%, 7/01/32 – NPFG Insured | 1/13 at 100.00 | A1 | 8,063,762 | ||||
| Pennsylvania – 7.8% (5.2% of Total Investments) | ||||||||
| 3,000 | Lehigh County General Purpose Authority, Pennsylvania, Hospital Revenue Bonds, St. Luke’s Hospital of Bethlehem, Series 2003, 5.375%, 8/15/33 (Pre-refunded 8/15/13) | 8/13 at 100.00 | AAA | 3,319,740 | ||||
| 3,500 | Pennsylvania Turnpike Commission, Turnpike Subordinate Revenue Bonds, Series 2009C, 0.000%, 6/01/33 – AGM Insured | 6/26 at 100.00 | AA+ | 2,772,665 | ||||
| 2,000 | Philadelphia Gas Works, Pennsylvania, Revenue Bonds, General Ordinance, Fourth Series 1998, 5.000%, 8/01/32 – AGM Insured | 8/13 at 100.00 | AA+ | 1,987,680 |
| 76 | Nuveen Investments |
| Principal | Optional Call | |||||||
| Amount (000) | Description (1) | Provisions (2) | Ratings (3) | Value | ||||
Pennsylvania (continued) | ||||||||
| $ | 925 | Philadelphia, Pennsylvania, Water and Wastewater Revenue Bonds, Series 1997A, 5.125%, 8/01/27 – AMBAC Insured (ETM) | 7/11 at 100.00 | AAA | $ | 949,744 | ||
| 1,350 | Pittsburgh and Allegheny County Sports and Exhibition Authority, Pennsylvania, Sales Tax Revenue Bonds, Refunding Series 2010, 5.000%, 2/01/31 – AGM Insured | 8/20 at 100.00 | AA+ | 1,346,531 | ||||
| 13,000 | State Public School Building Authority, Pennsylvania, Lease Revenue Bonds, Philadelphia School District, Series 2003, 5.000%, 6/01/33 (Pre-refunded 6/01/13) – AGM Insured | 6/13 at 100.00 | AAA | 14,156,479 | ||||
| 23,775 | Total Pennsylvania | 24,532,839 | ||||||
| Puerto Rico – 0.7% (0.5% of Total Investments) | ||||||||
| 1,000 | Puerto Rico Electric Power Authority, Power Revenue Bonds, Series 2002II, 5.125%, 7/01/26 (Pre-refunded 7/01/12) – AGM Insured | 7/12 at 101.00 | AA+ (4) | 1,065,700 | ||||
| 10,350 | Puerto Rico Sales Tax Financing Corporation, Sales Tax Revenue Bonds, Series 2007A, 0.000%, 8/01/43 – NPFG Insured | No Opt. Call | Aa2 | 1,213,434 | ||||
| 11,350 | Total Puerto Rico | 2,279,134 | ||||||
| South Carolina – 5.8% (3.8% of Total Investments) | ||||||||
| 5,000 | Florence County, South Carolina, Hospital Revenue Bonds, McLeod Regional Medical Center, Series 2004A, 5.250%, 11/01/23 – AGM Insured | 11/14 at 100.00 | AA+ | 5,145,350 | ||||
| Greenville County School District, South Carolina, Installment Purchase Revenue Bonds, Series 2003: | ||||||||
| 3,000 | 5.000%, 12/01/22 (UB) | 12/13 at 100.00 | AA | 3,081,690 | ||||
| 1,785 | 5.000%, 12/01/23 (UB) | 12/13 at 100.00 | AA | 1,826,091 | ||||
| 8,000 | South Carolina Transportation Infrastructure Bank, Revenue Bonds, Series 2002A, 5.000%, 10/01/33 – AMBAC Insured | 10/12 at 100.00 | A1 | 7,946,320 | ||||
| 17,785 | Total South Carolina | 17,999,451 | ||||||
| Texas – 8.2% (5.5% of Total Investments) | ||||||||
| 1,885 | Bexar County, Texas, Venue Project Revenue Bonds, Refunding Series 2010, 5.500%, 8/15/49 – AGM Insured | 8/19 at 100.00 | AA+ | 1,888,563 | ||||
| Grand Prairie Independent School District, Dallas County, Texas, General Obligation Bonds, Series 2003: | ||||||||
| 1,660 | 5.375%, 2/15/26 (Pre-refunded 2/15/13) – AGM Insured | 2/13 at 100.00 | AA+ (4) | 1,801,565 | ||||
| 12,500 | 5.125%, 2/15/31 (Pre-refunded 2/15/13) – AGM Insured | 2/13 at 100.00 | AA+ (4) | 13,510,249 | ||||
| 2,000 | Houston, Texas, First Lien Combined Utility System Revenue Bonds, Series 2004A, 5.250%, 5/15/25 – NPFG Insured | 5/14 at 100.00 | AA | 2,120,280 | ||||
| 1,160 | Houston, Texas, General Obligation Refunding Bonds, Series 2002, 5.250%, 3/01/20 – NPFG Insured | 3/12 at 100.00 | AA | 1,197,039 | ||||
| 4,355 | Houston, Texas, General Obligation Refunding Bonds, Series 2002, 5.250%, 3/01/20 (Pre-refunded 3/01/12) – NPFG Insured | 3/12 at 100.00 | AA (4) | 4,525,368 | ||||
| 465 | Katy Independent School District, Harris, Fort Bend and Waller Counties, Texas, General Obligation Bonds, Series 2002A, 5.125%, 2/15/18 (Pre-refunded 2/15/12) | 2/12 at 100.00 | AAA | 482,823 | ||||
| 24,025 | Total Texas | 25,525,887 | ||||||
| Virginia – 0.5% (0.3% of Total Investments) | ||||||||
| 1,500 | Hampton, Virginia, Revenue Bonds, Convention Center Project, Series 2002, 5.125%, 1/15/28 – AMBAC Insured | 1/13 at 100.00 | Aa3 | 1,512,465 | ||||
| Washington – 9.7% (6.5% of Total Investments) | ||||||||
| 4,945 | Broadway Office Properties, King County, Washington, Lease Revenue Bonds, Washington Project, Series 2002, 5.000%, 12/01/31 – NPFG Insured | 12/12 at 100.00 | AAA | 4,960,132 | ||||
| 5,250 | Chelan County Public Utility District 1, Washington, Hydro Consolidated System Revenue Bonds, Series 2002C, 5.125%, 7/01/33 – AMBAC Insured | 7/12 at 100.00 | AA | 5,262,653 | ||||
| 5,000 | King County, Washington, Sewer Revenue Bonds, Series 2006-2, Trust 1200, 13.291%, 1/01/26 – AGM Insured (IF) | 1/17 at 100.00 | AA+ | 5,314,400 | ||||
| 2,135 | Kitsap County Consolidated Housing Authority, Washington, Revenue Bonds, Bremerton Government Center, Series 2003, 5.000%, 7/01/23 – NPFG Insured | 7/13 at 100.00 | Aa3 | 2,171,978 | ||||
| 1,935 | Pierce County School District 343, Dieringer, Washington, General Obligation Refunding Bonds, Series 2003, 5.250%, 12/01/17 (Pre-refunded 6/01/13) – FGIC Insured | 6/13 at 100.00 | Aa1 (4) | 2,121,998 |
| Nuveen Investments | 77 |
Nuveen Insured Tax-Free Advantage Municipal Fund (continued) | ||
| NEA | Portfolio of Investments |
April 30, 2011 (Unaudited)
| Principal | Optional Call | |||||||
| Amount (000) | Description (1) | Provisions (2) | Ratings (3) | Value | ||||
Washington (continued) | ||||||||
| $ | 9,670 | Washington State, General Obligation Bonds, Series 2003D, 5.000%, 12/01/21 (Pre-refunded 6/01/13) – NPFG Insured | 6/13 at 100.00 | AA+ (4) | $ | 10,540,880 | ||
| 28,935 | Total Washington | 30,372,041 | ||||||
| West Virginia – 1.0% (0.7% of Total Investments) | ||||||||
| 3,000 | West Virginia State Building Commission, Lease Revenue Refunding Bonds, Regional Jail and Corrections Facility, Series 1998A, 5.375%, 7/01/21 – AMBAC Insured | No Opt. Call | N/R | 3,247,830 | ||||
| Wisconsin – 5.5% (3.7% of Total Investments) | ||||||||
| 1,190 | Sun Prairie Area School District, Dane County, Wisconsin, General Obligation Bonds, Series 2004C, 5.250%, 3/01/24 – AGM Insured | 3/14 at 100.00 | Aa2 | 1,296,493 | ||||
| 4,605 | Wisconsin Health and Educational Facilities Authority, Revenue Bonds, Franciscan Sisters of Christian Charity Healthcare Ministry, Series 2003A, 5.875%, 9/01/33 (Pre-refunded 9/01/13) | 9/13 at 100.00 | BBB+ (4) | 5,140,608 | ||||
| 2,840 | Wisconsin Health and Educational Facilities Authority, Revenue Bonds, Meriter Hospital Inc., Series 1992A, 6.000%, 12/01/22 – FGIC Insured | No Opt. Call | A1 | 3,086,058 | ||||
| 3,600 | Wisconsin Health and Educational Facilities Authority, Revenue Bonds, Wheaton Franciscan Services Inc., Series 2003A, 5.125%, 8/15/33 | 8/13 at 100.00 | BBB+ | 3,054,744 | ||||
| 4,750 | Wisconsin Health and Educational Facilities Authority, Revenue Refunding Bonds, Wausau Hospital Inc., Series 1998A, 5.125%, 8/15/20 – AMBAC Insured | 7/11 at 100.00 | A | 4,752,043 | ||||
| 16,985 | Total Wisconsin | 17,329,946 | ||||||
| $ | 498,855 | Total Investments (cost $465,933,797) – 149.6% | 468,039,154 | |||||
| Floating Rate Obligations – (4.2)% | (13,040,000 | ) | ||||||
| MuniFund Term Preferred Shares, at Liquidation Value – (26.5)% (6) | (83,000,000 | ) | ||||||
| Other Assets Less Liabilities – 2.6% | 8,159,728 | |||||||
| Auction Rate Preferred Shares, at Liquidation Value – (21.5)% (6) | (67,375,000) | |||||||
| Net Assets Applicable to Common Shares – 100% | $ | 312,783,882 |
| The Fund intends to invest at least 80% of its managed assets in municipal securities that are covered by insurance guaranteeing the timely payment of principal and interest. See Notes to Financial Statements, Footnote 1 – General Information and Significant Accounting Policies, Insurance for more information. | ||
| (1) | All percentages shown in the Portfolio of Investments are based on net assets applicable to Common shares unless otherwise noted. | |
| (2) | Optional Call Provisions: Dates (month and year) and prices of the earliest optional call or redemption. There may be other call provisions at varying prices at later dates. Certain mortgage-backed securities may be subject to periodic principal paydowns. | |
| (3) | Ratings: Using the highest of Standard & Poor’s Group (“Standard & Poor’s”), Moody’s Investor Service, Inc. (“Moody’s”) or Fitch, Inc. (“Fitch”) rating. Ratings below BBB by Standard & Poor’s, Baa by Moody’s or BBB by Fitch are considered to be below investment grade. Holdings designated N/R are not rated by any of these national rating agencies. | |
| (4) | Backed by an escrow or trust containing sufficient U.S. Government or U.S. Government agency securities, which ensure the timely payment of principal and interest. Such investments are normally considered to be equivalent to AAA rated securities. | |
| (5) | Investment, or portion of investment, has been pledged to collateralize the net payment obligations for investments in inverse floating rate transactions. | |
| (6) | MuniFund Term Preferred Shares and Auction Rate Preferred Shares, at Liquidation Value as a percentage of Total Investments are 17.7% and 14.4%, respectively. | |
| N/R | Not rated. | |
| (ETM) | Escrowed to maturity. | |
| (IF) | Inverse floating rate investment. | |
| (UB) | Underlying bond of an inverse floating rate trust reflected as a financing transaction. See Notes to Financial Statements, Footnote 1 – General Information and Significant Accounting Policies, Inverse Floating Rate Securities for more information. |
See accompanying notes to financial statements.
| 78 | Nuveen Investments |
| Statement of | ||
| Assets & Liabilities | ||
April 30, 2011 (Unaudited) |
| Insured Quality (NQI | ) | Insured Opportunity (NIO | ) | Premier Insured Income (NIF | ) | |||||||
| Assets | ||||||||||||
| Investments, at value (cost $821,208,674, $2,073,129,148, $417,853,372, respectively) | $ | 791,035,015 | $ | 2,042,323,431 | $ | 414,993,050 | ||||||
| Cash | 1,486,952 | 20,438,254 | 3,033,644 | |||||||||
| Receivables: | ||||||||||||
| Dividends and interest | 11,846,402 | 32,872,358 | 6,544,750 | |||||||||
| Investments sold | 4,168,326 | 8,174,983 | 215,000 | |||||||||
| Deferred offering costs | 1,154,895 | 2,615,477 | 745,617 | |||||||||
| Other assets | 105,308 | 722,622 | 147,185 | |||||||||
| Total assets | 809,796,898 | 2,107,147,125 | 425,679,246 | |||||||||
| Liabilities | ||||||||||||
| Floating rate obligations | 59,540,000 | 114,193,333 | 22,365,000 | |||||||||
| Payables: | ||||||||||||
| Auction Rate Preferred share dividends | — | — | — | |||||||||
| Common share dividends | 2,354,573 | 6,165,314 | 1,291,789 | |||||||||
| Interest | 296,581 | — | — | |||||||||
| Investments purchased | 859,188 | 1,229,988 | 368,996 | |||||||||
| Offering costs | 219,898 | 67,024 | 307,861 | |||||||||
| MuniFund Term Preferred (MTP) shares, at liquidation value | — | — | — | |||||||||
| Variable MuniFund Term Preferred (VMTP) shares, at liquidation value | 240,400,000 | — | — | |||||||||
| Variable Rate Demand Preferred (VRDP) shares, at liquidation value | — | 667,200,000 | 130,900,000 | |||||||||
| Accrued expenses: | ||||||||||||
| Management fees | 387,133 | 999,783 | 212,749 | |||||||||
| Other | 204,962 | 780,399 | 116,201 | |||||||||
| Total liabilities | 304,262,335 | 790,635,841 | 155,562,596 | |||||||||
| Auction Rate Preferred Shares (ARPS), at liquidation value | — | — | — | |||||||||
| Net assets applicable to Common shares | $ | 505,534,563 | $ | 1,316,511,284 | $ | 270,116,650 | ||||||
| Common shares outstanding | 38,420,394 | 95,610,971 | 19,467,626 | |||||||||
| Net asset value per Common share outstanding (net assets applicable to Common shares, divided by Common shares outstanding) | $ | 13.16 | $ | 13.77 | $ | 13.88 | ||||||
| Net assets applicable to Common shares consist of: | ||||||||||||
| Common Shares, $.01 par value per share | $ | 384,204 | $ | 956,110 | $ | 194,676 | ||||||
| Paid-in surplus | 538,880,409 | 1,333,982,731 | 270,807,425 | |||||||||
| Undistributed (Over-distribution of) net investment income | 8,526,438 | 23,953,641 | 4,537,367 | |||||||||
| Accumulated net realized gain (loss) | (12,082,829 | ) | (11,575,481 | ) | (2,562,496 | ) | ||||||
| Net unrealized appreciation (depreciation) | (30,173,659 | ) | (30,805,717 | ) | (2,860,322 | ) | ||||||
| Net assets applicable to Common shares | $ | 505,534,563 | $ | 1,316,511,284 | $ | 270,116,650 | ||||||
| Authorized shares: | ||||||||||||
| Common | 200,000,000 | 200,000,000 | 200,000,000 | |||||||||
| ARPS | 1,000,000 | 1,000,000 | 1,000,000 | |||||||||
| MTP | — | — | — | |||||||||
| VMTP | Unlimited | — | — | |||||||||
| VRDP | — | Unlimited | Unlimited | |||||||||
See accompanying notes to financial statements.
| Nuveen Investments | 79 |
| Statement of | ||
Assets & Liabilities (continued) | ||
| April 30, 2011 (Unaudited) |
Insured Premium Income 2 | Insured Dividend Advantage | Insured Tax-Free Advantage | ||||||||||
| (NPX | ) | (NVG | ) | (NEA | ) | |||||||
| Assets | ||||||||||||
| Investments, at value (cost $748,473,452, $641,611,086 and $465,933,797, respectively) | $ | 729,629,401 | $ | 644,427,386 | $ | 468,039,154 | ||||||
| Cash | 6,977,490 | 2,550,411 | 1,449,056 | |||||||||
| Receivables: | ||||||||||||
| Dividends and interest | 12,085,573 | 9,830,459 | 7,674,773 | |||||||||
| Investments sold | 15,095 | 425,267 | — | |||||||||
| Deferred offering costs | 2,344,346 | 1,305,367 | 1,197,645 | |||||||||
| Other assets | 286,137 | 164,599 | 160,318 | |||||||||
| Total assets | 751,338,042 | 658,703,489 | 478,520,946 | |||||||||
| Liabilities | ||||||||||||
| Floating rate obligations | 57,980,000 | 28,413,334 | 13,040,000 | |||||||||
| Payables: | ||||||||||||
| Auction Rate Preferred share dividends | — | 6,598 | 4,584 | |||||||||
| Common share dividends | 2,116,874 | 2,030,797 | 1,471,504 | |||||||||
| Interest | — | 265,540 | 197,125 | |||||||||
| Investments purchased | 2,577,564 | — | — | |||||||||
| Offering costs | 113,518 | 377,040 | 225,575 | |||||||||
| MuniFund Term Preferred (MTP) shares, at liquidation value | — | 108,000,000 | 83,000,000 | |||||||||
| Variable MuniFund Term Preferred (VMTP) shares, at liquidation value | — | — | — | |||||||||
| Variable Rate Demand Preferred (VRDP) shares, at liquidation value | 219,000,000 | — | — | |||||||||
| Accrued expenses: | ||||||||||||
| Management fees | 362,159 | �� | 300,944 | 243,253 | ||||||||
| Other | 205,514 | 169,982 | 180,023 | |||||||||
| Total liabilities | 282,355,629 | 139,564,235 | 98,362,064 | |||||||||
| Auction Rate Preferred Shares (ARPS), at liquidation value | — | 91,950,000 | 67,375,000 | |||||||||
| Net assets applicable to Common shares | $ | 468,982,413 | $ | 427,189,254 | $ | 312,783,882 | ||||||
| Common shares outstanding | 37,353,512 | 29,802,900 | 22,241,117 | |||||||||
| Net asset value per Common share outstanding (net assets applicable to Common shares, divided by Common shares outstanding) | $ | 12.56 | $ | 14.33 | $ | 14.06 | ||||||
| Net assets applicable to Common shares consist of: | ||||||||||||
| Common Shares, $.01 par value per share | $ | 373,535 | $ | 298,029 | $ | 222,411 | ||||||
| Paid-in surplus | 499,321,157 | 424,471,672 | 315,345,343 | |||||||||
| Undistributed (Over-distribution of) net investment income | 5,458,592 | 7,033,565 | 4,341,789 | |||||||||
| Accumulated net realized gain (loss) | (17,326,820 | ) | (7,430,312 | ) | (9,231,018 | ) | ||||||
| Net unrealized appreciation (depreciation) | (18,844,051 | ) | 2,816,300 | 2,105,357 | ||||||||
| Net assets applicable to Common shares | $ | 468,982,413 | $ | 427,189,254 | $ | 312,783,882 | ||||||
| Authorized shares: | ||||||||||||
| Common | Unlimited | Unlimited | Unlimited | |||||||||
| ARPS | Unlimited | Unlimited | Unlimited | |||||||||
| MTP | — | Unlimited | Unlimited | |||||||||
| VMTP | — | — | — | |||||||||
| VRDP | Unlimited | — | — | |||||||||
See accompanying notes to financial statements.
| 80 | Nuveen Investments |
| Statement of | ||
| Operations | ||
| Six Months Ended April 30, 2011 (Unaudited) |
Insured Quality | Insured Opportunity | Premier Insured Income | ||||||||||
| (NQI | ) | (NIO | ) | (NIF | ) | |||||||
| Investment Income | $ | 20,874,797 | $ | 53,475,375 | $ | 10,832,346 | ||||||
| Expenses | ||||||||||||
| Management fees | 2,359,591 | 6,098,515 | 1,297,934 | |||||||||
| Auction fees | 81,658 | 378,523 | 58,079 | |||||||||
| Dividend disbursing agent fees | 23,178 | 44,131 | 15,726 | |||||||||
| Shareholders’ servicing agent fees and expenses | 27,303 | 52,776 | 10,943 | |||||||||
| Interest expense and amortization of offering costs | 914,777 | 1,592,477 | 333,850 | |||||||||
| Liquidity fees on VRDP shares | — | 1,727,172 | 377,744 | |||||||||
| Custodian’s fees and expenses | 63,702 | 177,975 | 36,171 | |||||||||
| Directors’/Trustees’ fees and expenses | 10,215 | 29,504 | 5,875 | |||||||||
| Professional fees | 276,838 | 253,448 | 39,084 | |||||||||
| Shareholders’ reports – printing and mailing expenses | 26,559 | 82,414 | 14,200 | |||||||||
| Stock exchange listing fees | 6,443 | 16,415 | 4,507 | |||||||||
| Investor relations expense | 15,274 | 43,699 | 9,642 | |||||||||
| Other expenses | 37,313 | 64,650 | 24,451 | |||||||||
| Total expenses before custodian fee credit and expense reimbursement | 3,842,851 | 10,561,699 | 2,228,206 | |||||||||
| Custodian fee credit | (5,645 | ) | (14,653 | ) | (4,258 | ) | ||||||
| Expense reimbursement | — | — | — | |||||||||
| Net expenses | 3,837,206 | 10,547,046 | 2,223,948 | |||||||||
| Net investment income (loss) | 17,037,591 | 42,928,329 | 8,608,398 | |||||||||
| Realized and Unrealized Gain (Loss) | ||||||||||||
| Net realized gain (loss) from investments | 141,657 | 1,483,065 | (90,928 | ) | ||||||||
| Change in net unrealized appreciation (depreciation) of investments | (42,642,336 | ) | (112,260,627 | ) | (21,836,090 | ) | ||||||
| Net realized and unrealized gain (loss) | (42,500,679 | ) | (110,777,562 | ) | (21,927,018 | ) | ||||||
| Distributions to Auction Rate Preferred Shareholders | ||||||||||||
| From net investment income | (386,864 | ) | (693,274 | ) | (111,147 | ) | ||||||
| Decrease in net assets applicable to Common shares from distributions to Auction Rate Preferred shareholders | (386,864 | ) | (693,274 | ) | (111,147 | ) | ||||||
| Net increase (decrease) in net assets applicable to Common shares from operations | $ | (25,849,952 | ) | $ | (68,542,507 | ) | $ | (13,429,767 | ) | |||
See accompanying notes to financial statements.
| Nuveen Investments | 81 |
| Statement of | ||
Operations (continued) | ||
| Six Months Ended April 30, 2011 (Unaudited) |
Insured Premium Income 2 | Insured Dividend Advantage | Insured Tax-Free Advantage | ||||||||||
| (NPX | ) | (NVG | ) | (NEA | ) | |||||||
| Investment Income | $ | 18,515,330 | $ | 17,394,145 | $ | 12,464,811 | ||||||
| Expenses | ||||||||||||
| Management fees | 2,208,706 | 1,996,468 | 1,480,461 | |||||||||
| Auction fees | 110,108 | 68,396 | 50,115 | |||||||||
| Dividend disbursing agent fees | — | 14,877 | 14,884 | |||||||||
| Shareholders’ servicing agent fees and expenses | 15,156 | 25,565 | 25,211 | |||||||||
| Interest expense and amortization of offering costs | 687,051 | 1,877,335 | 1,376,696 | |||||||||
| Liquidity fees on VRDP shares | 1,121,454 | — | — | |||||||||
| Custodian’s fees and expenses | 55,427 | 53,911 | 40,584 | |||||||||
| Directors’/Trustees’ fees and expenses | 9,804 | 9,090 | 6,705 | |||||||||
| Professional fees | 104,040 | 19,640 | 21,944 | |||||||||
| Shareholders’ reports – printing and mailing expenses | 23,392 | 21,740 | 34,276 | |||||||||
| Stock exchange listing fees | 6,263 | 2,063 | 18,293 | |||||||||
| Investor relations expense | 15,508 | 13,208 | 9,024 | |||||||||
| Other expenses | 19,315 | 27,483 | 15,650 | |||||||||
| Total expenses before custodian fee credit and expense reimbursement | 4,376,224 | 4,129,776 | 3,093,843 | |||||||||
| Custodian fee credit | (10,068 | ) | (1,228 | ) | (2,727 | ) | ||||||
| Expense reimbursement | — | (300,241 | ) | (32,818 | ) | |||||||
| Net expenses | 4,366,156 | 3,828,307 | 3,058,298 | |||||||||
| Net investment income (loss) | 14,149,174 | 13,565,838 | 9,406,513 | |||||||||
| Realized and Unrealized Gain (Loss) | ||||||||||||
| Net realized gain (loss) from investments | 1,268,768 | 788,594 | (17,475 | ) | ||||||||
| Change in net unrealized appreciation (depreciation) of investments | (37,871,844 | ) | (27,282,643 | ) | (20,483,720 | ) | ||||||
| Net realized and unrealized gain (loss) | (36,603,076 | ) | (26,494,049 | ) | (20,501,195 | ) | ||||||
| Distributions to Auction Rate Preferred Shareholders | ||||||||||||
| From net investment income | — | (186,570 | ) | (136,826 | ) | |||||||
| Decrease in net assets applicable to Common shares from distributions to Auction Rate Preferred shareholders | — | (186,570 | ) | (136,826 | ) | |||||||
| Net increase (decrease) in net assets applicable to Common shares from operations | $ | (22,453,902 | ) | $ | (13,114,781 | ) | $ | (11,231,508 | ) | |||
See accompanying notes to financial statements.
| 82 | Nuveen Investments |
| Statement of | ||
Changes in Net Assets (Unaudited) |
| Insured Quality (NQI) | Insured Opportunity (NIO) | |||||||||||||||
Six Months Ended 4/30/11 | Year Ended 10/31/10 | Six Months Ended 4/30/11 | Year Ended 10/31/10 | |||||||||||||
| Operations | ||||||||||||||||
| Net investment income (loss) | $ | 17,037,591 | $ | 36,579,223 | $ | 42,928,329 | $ | 92,297,646 | ||||||||
| Net realized gain (loss) from investments | 141,657 | (365,237 | ) | 1,483,065 | 3,248,061 | |||||||||||
| Change in net unrealized appreciation (depreciation) of investments | (42,642,336 | ) | 22,254,904 | (112,260,627 | ) | 54,668,514 | ||||||||||
| Distributions to Auction Rate Preferred Shareholders: | ||||||||||||||||
| From net investment income | (386,864 | ) | (972,939 | ) | (693,274 | ) | (2,690,399 | ) | ||||||||
| From accumulated net realized gains | — | — | — | — | ||||||||||||
| Net increase (decrease) in net assets applicable to Common shares from operations | (25,849,952 | ) | 57,495,951 | (68,542,507 | ) | 147,523,822 | ||||||||||
| Distributions to Common Shareholders | ||||||||||||||||
| From net investment income | (16,367,090 | ) | (32,559,670 | ) | (41,724,626 | ) | (79,910,850 | ) | ||||||||
| From accumulated net realized gains | — | — | — | — | ||||||||||||
| Decrease in net assets applicable to Common shares from distribution to Common shareholders | (16,367,090 | ) | (32,559,670 | ) | (41,724,626 | ) | (79,910,850 | ) | ||||||||
| Capital Share Transactions | ||||||||||||||||
| Common shares: | ||||||||||||||||
| Net proceeds issued to shareholders due to reinvestment of distributions | 153,236 | 1,445,628 | 359,108 | — | ||||||||||||
| Repurchased and retired | — | — | — | (37,551 | ) | |||||||||||
| Net increase (decrease) in net assets applicable to Common shares from capital share transactions | 153,236 | 1,445,628 | 359,108 | (37,551 | ) | |||||||||||
| Net increase (decrease) in net assets applicable to Common shares | (42,063,806 | ) | 26,381,909 | (109,908,025 | ) | 67,575,421 | ||||||||||
| Net assets applicable to Common shares at the beginning of period | 547,598,369 | 521,216,460 | 1,426,419,309 | 1,358,843,888 | ||||||||||||
| Net assets applicable to Common shares at the end of period | $ | 505,534,563 | $ | 547,598,369 | $ | 1,316,511,284 | $ | 1,426,419,309 | ||||||||
| Undistributed (Over-distribution of) net investment income at the end of period | $ | 8,526,438 | $ | 8,242,801 | $ | 23,953,641 | $ | 23,443,212 | ||||||||
See accompanying notes to financial statements.
| Nuveen Investments | 83 |
| Statement of | ||
Changes in Net Assets (Unaudited) (continued) |
Premier Insured Income (NIF) | Insured Premium Income 2 (NPX) | |||||||||||||||
Six Months Ended 4/30/11 | Year Ended 10/31/10 | Six Months Ended 4/30/11 | Year Ended 10/31/10 | |||||||||||||
| Operations | ||||||||||||||||
| Net investment income (loss) | $ | 8,608,398 | $ | 18,747,682 | $ | 14,149,174 | $ | 29,064,838 | ||||||||
| Net realized gain (loss) from investments | (90,928 | ) | 1,205,612 | 1,268,768 | 958,435 | |||||||||||
| Change in net unrealized appreciation (depreciation) of investments | (21,836,090 | ) | 9,719,823 | (37,871,844 | ) | 18,993,472 | ||||||||||
| Distributions to Auction Rate Preferred Shareholders: | ||||||||||||||||
| From net investment income | (111,147 | ) | (522,384 | ) | — | — | ||||||||||
| From accumulated net realized gains | — | — | — | — | ||||||||||||
| Net increase (decrease) in net assets applicable to Common shares from operations | (13,429,767 | ) | 29,150,733 | (22,453,902 | ) | 49,016,745 | ||||||||||
| Distributions to Common Shareholders | ||||||||||||||||
| From net investment income | (8,641,337 | ) | (16,982,257 | ) | (13,895,507 | ) | (27,753,661 | ) | ||||||||
| From accumulated net realized gains | — | — | — | — | ||||||||||||
| Decrease in net assets applicable to Common shares from distribution to Common shareholders | (8,641,337 | ) | (16,982,257 | ) | (13,895,507 | ) | (27,753,661 | ) | ||||||||
| Capital Share Transactions | ||||||||||||||||
| Common shares: | ||||||||||||||||
| Net proceeds issued to shareholders due to reinvestment of distributions | 169,946 | 537,718 | — | — | ||||||||||||
| Repurchased and retired | — | — | — | — | ||||||||||||
| Net increase (decrease) in net assets applicable to Common shares from capital share transactions | 169,946 | 537,718 | — | — | ||||||||||||
| Net increase (decrease) in net assets applicable to Common shares | (21,901,158 | ) | 12,706,194 | (36,349,409 | ) | 21,263,084 | ||||||||||
| Net assets applicable to Common shares at the beginning of period | 292,017,808 | 279,311,614 | 505,331,822 | 484,068,738 | ||||||||||||
| Net assets applicable to Common shares at the end of period | $ | 270,116,650 | $ | 292,017,808 | $ | 468,982,413 | $ | 505,331,822 | ||||||||
| Undistributed (Over-distribution of) net investment income at the end of period | $ | 4,537,367 | $ | 4,681,453 | $ | 5,458,592 | $ | 5,204,926 | ||||||||
See accompanying notes to financial statements.
| 84 | Nuveen Investments |
Insured Dividend Advantage (NVG) | Insured Tax-Free Advantage (NEA) | |||||||||||||||
Six Months Ended 4/30/11 | Year Ended 10/31/10 | Six Months Ended 4/30/11 | Year Ended 10/31/10 | |||||||||||||
| Operations | ||||||||||||||||
| Net investment income (loss) | $ | 13,565,838 | $ | 26,740,723 | $ | 9,406,513 | $ | 19,416,327 | ||||||||
| Net realized gain (loss) from investments | 788,594 | 91,467 | (17,475 | ) | 44,055 | |||||||||||
| Change in net unrealized appreciation (depreciation) of investments | (27,282,643 | ) | 11,535,902 | (20,483,720 | ) | 11,384,510 | ||||||||||
| Distributions to Auction Rate Preferred Shareholders: | ||||||||||||||||
| From net investment income | (186,570 | ) | (330,957 | ) | (136,826 | ) | (361,303 | ) | ||||||||
| From accumulated net realized gains | — | (83,568 | ) | — | — | |||||||||||
| Net increase (decrease) in net assets applicable to Common shares from operations | (13,114,781 | ) | 37,953,567 | (11,231,508 | ) | 30,483,589 | ||||||||||
| Distributions to Common Shareholders | ||||||||||||||||
| From net investment income | (12,517,218 | ) | (25,034,436 | ) | (9,074,376 | ) | (18,077,924 | ) | ||||||||
| From accumulated net realized gains | (86,428 | ) | (1,218,939 | ) | — | — | ||||||||||
| Decrease in net assets applicable to Common shares from distribution to Common shareholders | (12,603,646 | ) | (26,253,375 | ) | (9,074,376 | ) | (18,077,924 | ) | ||||||||
| Capital Share Transactions | ||||||||||||||||
| Common shares: | ||||||||||||||||
| Net proceeds issued to shareholders due to reinvestment of distributions | — | — | 16,256 | 80,971 | ||||||||||||
| Repurchased and retired | — | — | — | — | ||||||||||||
| Net increase (decrease) in net assets applicable to Common shares from capital share transactions | — | — | 16,256 | 80,971 | ||||||||||||
| Net increase (decrease) in net assets applicable to Common shares | (25,718,427 | ) | 11,700,192 | (20,289,628 | ) | 12,486,636 | ||||||||||
| Net assets applicable to Common shares at the beginning of period | 452,907,681 | 441,207,489 | 333,073,510 | 320,586,874 | ||||||||||||
| Net assets applicable to Common shares at the end of period | $ | 427,189,254 | $ | 452,907,681 | $ | 312,783,882 | $ | 333,073,510 | ||||||||
| Undistributed (Over-distribution of) net investment income at the end of period | $ | 7,033,565 | $ | 6,171,515 | $ | 4,341,789 | $ | 4,146,478 | ||||||||
See accompanying notes to financial statements.
| Nuveen Investments | 85 |
| Statement of | ||
| Cash Flows | ||
| Six Months Ended April 30, 2011 (Unaudited) |
Insured Quality | Insured Opportunity | Premier Insured Income | ||||||||||
| (NQI | ) | (NIO | ) | (NIF | ) | |||||||
| Cash Flows from Operating Activities: | ||||||||||||
| Net Increase (Decrease) in Net Assets Applicable to Common Shares from Operations | $ | (25,849,952 | ) | $ | (68,542,507 | ) | $ | (13,429,767 | ) | |||
| Adjustments to reconcile the net increase (decrease) in net assets applicable to Common shares from operations to net cash provided by (used in) operating activities: | ||||||||||||
| Purchases of investments | (23,348,571 | ) | (82,322,276 | ) | (10,703,870 | ) | ||||||
| Proceeds from sales and maturities of investments | 15,843,568 | 129,191,259 | 11,341,028 | |||||||||
| Proceeds from (Purchases of) short-term investments, net | 12,990,000 | 6,282,000 | (2,885,000 | ) | ||||||||
| Amortization (Accretion) of premiums and discounts, net | (1,379,621 | ) | (1,665,880 | ) | (713,333 | ) | ||||||
| (Increase) Decrease in: | ||||||||||||
| Receivable for interest | (371,560 | ) | (375,284 | ) | 56,870 | |||||||
| Receivable for investments sold | (4,168,326 | ) | (8,119,983 | ) | — | |||||||
| Other assets | 99,708 | (231,442 | ) | (37,171 | ) | |||||||
| Increase (Decrease) in: | ||||||||||||
| Payable for Auction Rate Preferred share dividends | (15,705 | ) | (35,229 | ) | (7,583 | ) | ||||||
| Payable for interest | 296,581 | — | — | |||||||||
| Payable for investments purchased | (8,700,439 | ) | (12,226,769 | ) | 368,996 | |||||||
| Accrued management fees | (41,108 | ) | (106,331 | ) | (21,947 | ) | ||||||
| Accrued other expenses | (113,468 | ) | (194,943 | ) | (55,715 | ) | ||||||
| Net realized (gain) loss from investments | (141,657 | ) | (1,483,065 | ) | 90,928 | |||||||
| Change in net unrealized (appreciation) depreciation of investments | 42,642,336 | 112,260,627 | 21,836,090 | |||||||||
| Taxes paid on undistributed capital gains | (58 | ) | (297 | ) | — | |||||||
| Net cash provided by (used in) operating activities | 7,741,728 | 72,429,880 | 5,839,526 | |||||||||
| Cash Flows from Financing Activities: | ||||||||||||
| (Increase) Decrease in deferred offering costs | (1,154,895 | ) | (2,615,477 | ) | (745,617 | ) | ||||||
| Increase (Decrease) in: | ||||||||||||
| Floating rate obligations | 135,000 | (20,640,000 | ) | — | ||||||||
| Payable for offering costs | 219,898 | 67,024 | 307,861 | |||||||||
| MTP shares, at liquidation value | — | — | — | |||||||||
| VMTP shares, at liquidation value | 240,400,000 | — | — | |||||||||
| VRDP shares, at liquidation value | — | 667,200,000 | 130,900,000 | |||||||||
| ARPS, at liquidation value | (239,200,000 | ) | (664,825,000 | ) | (130,125,000 | ) | ||||||
| Cash distributions paid to Common shareholders | (16,206,356 | ) | (41,337,727 | ) | (8,468,239 | ) | ||||||
| Net cash provided by (used in) financing activities | (15,806,353 | ) | (62,151,180 | ) | (8,130,995 | ) | ||||||
| Net Increase (Decrease) in Cash | (8,064,625 | ) | 10,278,700 | (2,291,469 | ) | |||||||
| Cash at the beginning of period | 9,551,577 | 10,159,554 | 5,325,113 | |||||||||
| Cash at the End of Period | $ | 1,486,952 | $ | 20,438,254 | $ | 3,033,644 | ||||||
Supplemental Disclosure of Cash Flow Information
Non-cash financing activities not included herein consists of reinvestments of Common share distributions of $153,236, $359,108 and $169,946 for Insured Quality (NQI), Insured Opportunity (NIO) and Premier Insured Income (NIF), respectively.
Insured Quality | Insured Opportunity | Premier Insured Income | ||||||||||
| (NQI | ) | (NIO | ) | (NIF | ) | |||||||
| Cash paid for interest (excluding amortization of offering costs, where applicable) | $ | 551,119 | $ | 1,562,954 | $ | 324,467 | ||||||
See accompanying notes to financial statements.
| 86 | Nuveen Investments |
Insured Premium Income 2 | Insured Dividend Advantage | Insured Tax-Free Advantage | ||||||||||
| (NPX | ) | (NVG | ) | (NEA | ) | |||||||
| Cash Flows from Operating Activities: | ||||||||||||
| Net Increase (Decrease) in Net Assets Applicable to Common Shares from Operations | $ | (22,453,902 | ) | $ | (13,114,781 | ) | $ | (11,231,508 | ) | |||
| Adjustments to reconcile the net increase (decrease) in net assets applicable to Common shares from operations to net cash provided by (used in) operating activities: | ||||||||||||
| Purchases of investments | (91,974,409 | ) | (11,944,061 | ) | (2,794,750 | ) | ||||||
| Proceeds from sales and maturities of investments | 92,704,019 | 14,010,450 | 185,000 | |||||||||
| Proceeds from (Purchases of) short-term investments, net | — | — | — | |||||||||
| Amortization (Accretion) of premiums and discounts, net | (929,305 | ) | (618,357 | ) | (170,845 | ) | ||||||
| (Increase) Decrease in: | ||||||||||||
| Receivable for interest | 551,563 | 50,827 | (71,119 | ) | ||||||||
| Receivable for investments sold | (15,095 | ) | (369,286 | ) | 5,000 | |||||||
| Other assets | (25,218 | ) | (9,759 | ) | (2,623 | ) | ||||||
| Increase (Decrease) in: | ||||||||||||
| Payable for Auction Rate Preferred share dividends | — | (1,649 | ) | (993 | ) | |||||||
| Payable for interest | — | 22 | (11,874 | ) | ||||||||
| Payable for investments purchased | 2,577,564 | (297,649 | ) | — | ||||||||
| Accrued management fees | (37,986 | ) | 2,084 | 11,365 | ||||||||
| Accrued other expenses | (24,597 | ) | (29,892 | ) | (2,499 | ) | ||||||
| Net realized (gain) loss from investments | (1,268,768 | ) | (788,594 | ) | 17,475 | |||||||
| Change in net unrealized (appreciation) depreciation of investments | 37,871,844 | 27,282,643 | 20,483,720 | |||||||||
| Taxes paid on undistributed capital gains | (36 | ) | (5,685 | ) | (1,013 | ) | ||||||
| Net cash provided by (used in) operating activities | 16,975,674 | 14,166,313 | 6,415,336 | |||||||||
| Cash Flows from Financing Activities: | ||||||||||||
| (Increase) Decrease in deferred offering costs | 40,672 | 184,443 | 157,883 | |||||||||
| Increase (Decrease) in: | ||||||||||||
| Floating rate obligations | — | — | — | |||||||||
| Payable for offering costs | — | (67,667 | ) | (48,288 | ) | |||||||
| MTP shares, at liquidation value | — | — | — | |||||||||
| VMTP shares, at liquidation value | — | — | — | |||||||||
| VRDP shares, at liquidation value | — | — | — | |||||||||
| ARPS, at liquidation value | — | — | — | |||||||||
| Cash distributions paid to Common shareholders | (13,886,247 | ) | (12,600,428 | ) | (9,058,082 | ) | ||||||
| Net cash provided by (used in) financing activities | (13,845,575 | ) | (12,483,652 | ) | (8,948,487 | ) | ||||||
| Net Increase (Decrease) in Cash | 3,130,099 | 1,682,661 | (2,533,151 | ) | ||||||||
| Cash at the beginning of period | 3,847,391 | 867,750 | 3,982,207 | |||||||||
| Cash at the End of Period | $ | 6,977,490 | $ | 2,550,411 | $ | 1,449,056 | ||||||
Supplemental Disclosure of Cash Flow Information
Non-cash financing activities not included herein consists of reinvestments of Common share distributions of $16,256 for Insured Tax-Free Advantage (NEA).
Insured Premium Income 2 | Insured Dividend Advantage | Insured Tax-Free Advantage | ||||||||||
| (NPX | ) | (NVG | ) | (NEA | ) | |||||||
| Cash paid for interest (excluding amortization of offering costs, where applicable) | $ | 646,378 | $ | 1,692,870 | $ | 1,230,688 | ||||||
See accompanying notes to financial statements.
| Nuveen Investments | 87 |
| Financial | ||
Highlights (Unaudited) | ||
| Selected data for a Common share outstanding throughout each period: |
| Investment Operations | Less Distributions | ||||||||||||||||||||||||||||||||||||
Beginning Common Share Net Asset Value | Net Investment Income (Loss | ) | Net Realized/ Unrealized Gain (Loss | ) | Distributions from Net Investment Income to Auction Rate Preferred Shareholders | (a) | Distributions from Capital Gains to Auction Rate Preferred Shareholders | (a) | Total | Net Investment Income to Common Share- holders | Capital Gains to Common Share- holders | Total | Discount from Common Shares Repurchased and Retired | Ending Common Share Net Asset Value | Ending Market Value | ||||||||||||||||||||||
| Insured Quality (NQI) | |||||||||||||||||||||||||||||||||||||
| Year Ended 10/31: | |||||||||||||||||||||||||||||||||||||
| 2011(f) | $ | 14.26 | $ | .44 | $ | (1.10 | ) | $ | (.01 | ) | $ | — | $ | (.67 | ) | $ | (.43 | ) | $ | — | $ | (.43 | ) | $ | — | $ | 13.16 | $ | 12.82 | ||||||||
| 2010 | 13.61 | .95 | .58 | (.03 | ) | — | 1.50 | (.85 | ) | — | (.85 | ) | — | 14.26 | 14.40 | ||||||||||||||||||||||
| 2009 | 11.68 | .99 | 1.76 | (.06 | ) | — | 2.69 | (.76 | ) | — | (.76 | ) | — | 13.61 | 13.30 | ||||||||||||||||||||||
| 2008 | 14.88 | .99 | (3.16 | ) | (.30 | ) | — | (2.47 | ) | (.73 | ) | — | (.73 | ) | — | 11.68 | 11.15 | ||||||||||||||||||||
| 2007 | 15.40 | .99 | (.49 | ) | (.29 | ) | — | .21 | (.73 | ) | — | (.73 | ) | — | 14.88 | 13.61 | |||||||||||||||||||||
| 2006 | 15.31 | .99 | .24 | (.25 | ) | (.01 | ) | .97 | (.80 | ) | (.08 | ) | (.88 | ) | — | 15.40 | 14.83 | ||||||||||||||||||||
| Insured Opportunity (NIO) | |||||||||||||||||||||||||||||||||||||
| Year Ended 10/31: | |||||||||||||||||||||||||||||||||||||
| 2011(f) | 14.92 | .45 | (1.15 | ) | (.01 | ) | — | (.71 | ) | (.44 | ) | — | (.44 | ) | — | 13.77 | 13.18 | ||||||||||||||||||||
| 2010 | 14.22 | .97 | .60 | (.03 | ) | — | 1.54 | (.84 | ) | — | (.84 | ) | — | * | 14.92 | 14.83 | |||||||||||||||||||||
| 2009 | 12.39 | .96 | 1.66 | (.06 | ) | — | 2.56 | (.73 | ) | — | (.73 | ) | — | 14.22 | 12.98 | ||||||||||||||||||||||
| 2008 | 15.04 | .97 | (2.62 | ) | (.30 | ) | — | * | (1.95 | ) | (.70 | ) | — | * | (.70 | ) | — | 12.39 | 11.15 | ||||||||||||||||||
| 2007 | 15.57 | .98 | (.45 | ) | (.30 | ) | (.01 | ) | .22 | (.73 | ) | (.02 | ) | (.75 | ) | — | 15.04 | 13.56 | |||||||||||||||||||
| 2006 | 15.46 | .98 | .34 | (.24 | ) | (.03 | ) | 1.05 | (.80 | ) | (.14 | ) | (.94 | ) | — | 15.57 | 14.75 | ||||||||||||||||||||
Auction Rate Preferred Shares at End of Period | Variable MuniFund Term Preferred Shares at End of Period | Variable Rate Demand Preferred Shares at End of Period | ||||||||||||||||||||||||||
Aggregate Amount Outstanding (000 | ) | Liquidation Value Per Share | Asset Coverage Per Share | Aggregate Amount Outstanding (000 | ) | Liquidation Value Per Share | Asset Coverage Per Share | Aggregate Amount Outstanding | Liquidation Value Per Share | Asset Coverage Per Share | ||||||||||||||||||
| Insured Quality (NQI) | ||||||||||||||||||||||||||||
| Year Ended 10/31: | ||||||||||||||||||||||||||||
| 2011(f) | $ | — | $ | — | $ | — | $ | 240,000 | $ | 100,000 | $ | 310,289 | $ | — | $ | — | $ | — | ||||||||||
| 2010 | 239,200 | 25,000 | 82,232 | — | — | — | — | — | — | |||||||||||||||||||
| 2009 | 245,850 | 25,000 | 78,001 | — | — | — | — | — | — | |||||||||||||||||||
| 2008 | 298,425 | 25,000 | 62,485 | — | — | — | — | — | — | |||||||||||||||||||
| 2007 | 318,000 | 25,000 | 69,808 | — | — | — | — | — | — | |||||||||||||||||||
| 2006 | 318,000 | 25,000 | 71,378 | — | — | — | — | — | — | |||||||||||||||||||
| Insured Opportunity (NIO) | ||||||||||||||||||||||||||||
| Year Ended 10/31: | ||||||||||||||||||||||||||||
| 2011(f) | — | — | — | — | — | — | 667,200 | 100,000 | 297,319 | |||||||||||||||||||
| 2010 | 664,825 | 25,000 | 78,639 | — | — | — | — | — | — | |||||||||||||||||||
| 2009 | 675,475 | 25,000 | 75,292 | — | — | — | — | — | — | |||||||||||||||||||
| 2008 | 623,350 | 25,000 | 65,315 | — | — | — | — | — | — | |||||||||||||||||||
| 2007 | 680,000 | 25,000 | 69,864 | — | — | — | — | — | — | |||||||||||||||||||
| 2006 | 680,000 | 25,000 | 71,440 | — | — | — | — | — | — | |||||||||||||||||||
| 88 | Nuveen Investments |
| Ratios/Supplemental Data | |||||||||||||||||||||
| Total Returns | Ratios to Average Net Assets Applicable to Common Shares(c)(d) | ||||||||||||||||||||
Based on Market Value | (b) | Based on Common Share Net Asset Value | (b) | Ending Net Assets Applicable to Common Shares (000) | Expenses Including Interest | (e) | Expenses Excluding Interest | Net Investment Income | Portfolio Turnover Rate | ||||||||||||
| (7.95 | )% | (4.66 | )% | $ | 505,535 | 1.54 | %** | 1.20 | %** | 6.84 | %** | 2 | % | ||||||||
| 15.03 | 11.30 | 547,598 | 1.19 | 1.12 | 6.81 | 11 | |||||||||||||||
| 26.98 | 23.65 | 521,216 | 1.32 | 1.21 | 7.86 | 4 | |||||||||||||||
| (13.35 | ) | (17.24 | ) | 447,463 | 1.49 | 1.23 | 7.03 | 7 | |||||||||||||
| (3.48 | ) | 1.38 | 569,958 | 1.52 | 1.18 | 6.53 | 5 | ||||||||||||||
| 2.76 | 6.53 | *** | 589,928 | 1.20 | 1.20 | 6.49 | 13 | ||||||||||||||
| (8.18 | ) | (4.72 | ) | 1,316,511 | 1.63 | ** | 1.39 | ** | 6.62 | ** | 4 | ||||||||||
| 21.20 | 11.08 | 1,426,419 | 1.14 | 1.08 | 6.61 | 7 | |||||||||||||||
| 23.62 | 21.18 | 1,358,844 | 1.29 | 1.18 | 7.36 | 8 | |||||||||||||||
| (13.17 | ) | (13.45 | ) | 1,005,218 | 1.43 | 1.19 | 6.76 | 9 | |||||||||||||
| (3.18 | ) | 1.49 | 1,220,297 | 1.41 | 1.16 | 6.39 | 5 | ||||||||||||||
| 8.26 | 7.05 | *** | 1,263,172 | 1.17 | 1.17 | 6.38 | 13 | ||||||||||||||
| (a) | The amounts shown are based on Common share equivalents. |
| (b) | Total Return Based on Market Value is the combination of changes in the market price per share and the effect of reinvested dividend income and reinvested capital gains distributions, if any, at the average price paid per share at the time of reinvestment. The last dividend declared in the period, which is typically paid on the first business day of the following month, is assumed to be reinvested at the ending market price. The actual reinvestment for the last dividend declared in the period may take place over several days, and in some instances may not be based on the market price, so the actual reinvestment price may be different from the price used in the calculation. Total returns are not annualized. |
| Total Return Based on Common Share Net Asset Value is the combination of changes in Common share net asset value, reinvested dividend income at net asset value and reinvested capital gains distributions at net asset value, if any. The last dividend declared in the period, which is typically paid on the first business day of the following month, is assumed to be reinvested at the ending net asset value. The actual reinvest price for the last dividend declared in the period may often be based on the Fund’s market price (and not its net asset value), and therefore may be different from the price used in the calculation. Total returns are not annualized. | |
| (c) | Ratios do not reflect the effect of dividend payments to Auction Rate Preferred shareholders, where applicable; Net Investment Income ratios reflect income earned and expenses incurred on assets attributable to ARPS, VMTP shares and/or VRDP shares, where applicable. |
| (d) | Ratios do not reflect the effect of custodian fee credits earned on the Fund’s net cash on deposit with the custodian bank, where applicable. |
| (e) | The expense ratios reflect, among other things, payments to Variable MuniFund Term Preferred shareholders, Variable Rate Demand Preferred shareholders and/or the interest expense deemed to have been paid by the Fund on the floating rate certificates issued by the special purpose trusts for the self-deposited inverse floaters held by the Fund, where applicable, each as described in Footnote 1 – General Information and Significant Accounting Policies, Variable MuniFund Term Preferred Shares, Variable Rate Demand Preferred Shares and Inverse Floating Rate Securities, respectively. |
| (f) | For the six months ended April 30, 2011. |
| * | Rounds to less than $.01 per share. |
| ** | Annualized. |
| *** | During the fiscal year ended October 31, 2006, Insured Quality (NQI) and Insured Opportunity (NIO) received payments from the Adviser of $27,762 and $42,338, respectively, to offset losses realized on the disposal of investments purchased in violation of each Fund’s investment restrictions. This reimbursement did not have an impact on the Fund’s Total Return on Common Share Net Asset Value. |
See accompanying notes to financial statements.
| Nuveen Investments | 89 |
| Financial | ||
Highlights (Unaudited) (continued) | ||
| Selected data for a Common share outstanding throughout each period: |
| Investment Operations | Less Distributions | ||||||||||||||||||||||||||||||||||||
Beginning Common Share Net Asset Value | Net Investment Income (Loss) | Net Realized/ Unrealized Gain (Loss) | Distributions from Net Investment Income to Auction Rate Preferred Shareholders | (a) | Distributions from Capital Gains to Auction Rate Preferred Shareholders | (a) | Total | Net Investment Income to Common Share- holders | Capital Gains to Common Share- holders | Total | Discount from Common Shares Repurchased and Retired | Ending Common Share Net Asset Value | Ending Market Value | ||||||||||||||||||||||||
| Premier Insured Income (NIF) | |||||||||||||||||||||||||||||||||||||
| Year Ended 10/31: | |||||||||||||||||||||||||||||||||||||
| 2011(f) | $ | 15.01 | $ | .44 | $ | (1.12 | ) | $ | (.01 | ) | $ | — | $ | (.69 | ) | $ | (.44 | ) | $ | — | $ | (.44 | ) | $ | — | $ | 13.88 | $ | 14.67 | ||||||||
| 2010 | 14.38 | .96 | .57 | (.03 | ) | — | 1.50 | (.87 | ) | — | (.87 | ) | — | 15.01 | 15.50 | ||||||||||||||||||||||
| 2009 | 12.54 | .99 | 1.64 | (.06 | ) | — | 2.57 | (.73 | ) | — | (.73 | ) | — | 14.38 | 13.10 | ||||||||||||||||||||||
| 2008 | 14.90 | .96 | (2.37 | ) | (.31 | ) | — | (1.72 | ) | (.64 | ) | — | (.64 | ) | — | 12.54 | 11.19 | ||||||||||||||||||||
| 2007 | 15.40 | .97 | (.47 | ) | (.29 | ) | — | .21 | (.71 | ) | — | (.71 | ) | — | 14.90 | 13.25 | |||||||||||||||||||||
| 2006 | 15.33 | .98 | .25 | (.25 | ) | (.02 | ) | .96 | (.79 | ) | (.10 | ) | (.89 | ) | — | 15.40 | 14.60 | ||||||||||||||||||||
| Insured Premium Income 2 (NPX) | |||||||||||||||||||||||||||||||||||||
| Year Ended 10/31: | |||||||||||||||||||||||||||||||||||||
| 2011(f) | 13.53 | .38 | (.98 | ) | — | — | (.60 | ) | (.37 | ) | — | (.37 | ) | — | 12.56 | 11.74 | |||||||||||||||||||||
| 2010 | 12.96 | .78 | .53 | — | — | 1.31 | (.74 | ) | — | (.74 | ) | — | 13.53 | 13.40 | |||||||||||||||||||||||
| 2009 | 11.39 | .80 | 1.44 | — | — | 2.24 | (.67 | ) | — | (.67 | ) | — | 12.96 | 11.86 | |||||||||||||||||||||||
| 2008 | 13.73 | .80 | (2.32 | ) | (.20 | ) | — | (1.72 | ) | (.62 | ) | — | (.62 | ) | — | 11.39 | 9.56 | ||||||||||||||||||||
| 2007 | 14.16 | .86 | (.39 | ) | (.26 | ) | — | .21 | (.64 | ) | — | (.64 | ) | — | 13.73 | 12.18 | |||||||||||||||||||||
| 2006 | 13.93 | .86 | .28 | (.23 | ) | — | .91 | (.68 | ) | — | (.68 | ) | — | 14.16 | 13.03 | ||||||||||||||||||||||
Auction Rate Prefered Shares at End of Period | Variable Rate Demand Prefered Shares at End of Period | ||||||||||||||||||
Aggregate Amount Outstanding (000) | Liquidation Value Per Share | Asset Coverage Per Share | Aggregate Amount Outstanding | Liquidation Value Per Share | Asset Coverage Per Share | ||||||||||||||
| Premier Insured Income (NIF) | |||||||||||||||||||
| Year Ended 10/31: | |||||||||||||||||||
| 2011(f) | $ | — | $ | — | $ | — | $ | 130,900 | $ | 100,000 | $ | 306,353 | |||||||
| 2010 | 130,125 | 25,000 | 81,103 | — | — | — | |||||||||||||
| 2009 | 130,125 | 25,000 | 78,662 | — | — | — | |||||||||||||
| 2008 | 154,950 | 25,000 | 64,301 | — | — | — | |||||||||||||
| 2007 | 161,000 | 25,000 | 69,938 | — | — | — | |||||||||||||
| 2006 | 161,000 | 25,000 | 71,429 | — | — | — | |||||||||||||
| Insured Premium Income 2 (NPX) | |||||||||||||||||||
| Year Ended 10/31: | |||||||||||||||||||
| 2011(f) | — | — | — | 219,000 | 100,000 | 314,147 | |||||||||||||
| 2010 | — | — | — | 219,000 | 100,000 | 330,745 | |||||||||||||
| 2009 | — | — | — | 219,000 | 100,000 | 321,036 | |||||||||||||
| 2008 | — | — | — | 219,000 | 100,000 | 294,318 | |||||||||||||
| 2007 | 268,900 | 25,000 | 72,696 | — | — | — | |||||||||||||
| 2006 | 268,900 | 25,000 | 74,180 | — | — | — | |||||||||||||
| 90 | Nuveen Investments |
| Ratios/Supplemental Data | |||||||||||||||||||||
| Total Returns | Ratios to Average Net Assets Applicable to Common Shares(c)(d) | ||||||||||||||||||||
Based on Market | Based on Common Share Net Asset | Ending Net Assets Applicable to Common | Expenses Including | Expenses Excluding | Net Investment | Portfolio Turnover | |||||||||||||||
| Value | (b) | Value | (b) | Shares (000) | Interest | (e) | Interest | Income | Rate | ||||||||||||
| (2.26 | )% | (4.52 | )% | $ | 270,117 | 1.67 | %* | 1.42 | %* | 6.44 | %* | 3 | % | ||||||||
| 25.60 | 10.74 | 292,018 | 1.20 | 1.15 | 6.56 | 12 | |||||||||||||||
| 24.07 | 20.90 | 279,312 | 1.30 | 1.23 | 7.25 | 2 | |||||||||||||||
| (11.12 | ) | (11.92 | ) | 243,589 | 1.42 | 1.25 | 6.72 | 6 | |||||||||||||
| (4.66 | ) | 1.40 | 289,400 | 1.38 | 1.21 | 6.41 | 9 | ||||||||||||||
| 7.68 | 6.46 | 299,001 | 1.22 | 1.22 | 6.44 | 8 | |||||||||||||||
| (9.61 | ) | (4.37 | ) | 468,982 | 1.89 | * | 1.61 | * | 6.12 | * | 13 | ||||||||||
| 19.70 | 10.39 | 505,332 | 1.82 | 1.59 | 5.87 | 10 | |||||||||||||||
| 31.78 | 20.15 | 484,069 | 1.98 | 1.47 | 6.56 | 7 | |||||||||||||||
| (17.17 | ) | (12.98 | ) | 425,557 | 2.13 | 1.25 | 6.12 | 8 | |||||||||||||
| (1.77 | ) | 1.55 | 513,021 | 1.76 | 1.16 | 6.19 | 5 | ||||||||||||||
| 7.11 | 6.75 | 528,984 | 1.16 | 1.16 | 6.14 | 15 | |||||||||||||||
| (a) | The amounts shown are based on Common share equivalents. |
| (b) | Total Return Based on Market Value is the combination of changes in the market price per share and the effect of reinvested dividend income and reinvested capital gains distributions, if any, at the average price paid per share at the time of reinvestment. The last dividend declared in the period, which is typically paid on the first business day of the following month, is assumed to be reinvested at the ending market price. The actual reinvestment for the last dividend declared in the period may take place over several days, and in some instances may not be based on the market price, so the actual reinvestment price may be different from the price used in the calculation. |
| Total returns are not annualized. | |
| Total Return Based on Common Share Net Asset Value is the combination of changes in Common share net asset value, reinvested dividend income at net asset value and reinvested capital gains distributions at net asset value, if any. The last dividend declared in the period, which is typically paid on the first business day of the following month, is assumed to be reinvested at the ending net asset value. The actual reinvest price for the last dividend declared in the period may often be based on the Fund’s market price (and not its net asset value), and therefore may be different from the price used in the calculation. Total returns are not annualized. | |
| (c) | Ratios do not reflect the effect of dividend payments to Auction Rate Preferred shareholders, where applicable; Net Investment Income ratios reflect income earned and expenses incurred on assets attributable to ARPS and/or VRDP shares, where applicable. |
| (d) | Ratios do not reflect the effect of custodian fee credits earned on the Fund’s net cash on deposit with the custodian bank, where applicable. |
| (e) | The expense ratios reflect, among other things, payments to Variable Rate Demand Preferred shareholders and/or the interest expense deemed to have been paid by the Fund on the floating rate certificates issued by the special purpose trusts for the self-deposited inverse floaters held by the Fund, where applicable, both as described in Footnote 1 – General Information and Significant Accounting Policies, Variable Rate Demand Preferred Shares and Inverse Floating Rate Securities, respectively. |
| (f) | For the six months ended April 30, 2011. |
| * | Annualized. |
See accompanying notes to financial statements.
| Nuveen Investments | 91 |
| Financial | ||
Highlights (Unaudited) (continued) | ||
| Selected data for a Common share outstanding throughout each period: |
| Investment Operations | Less Distributions | ||||||||||||||||||||||||||||||||||||
Beginning Common Share Net Asset | Net Investment Income | Net Realized/ Unrealized Gain | Distributions from Net Investment Income to Auction Rate Preferred | Distributions from Capital Gains to Auction Rate Preferred | Net Investment Income to Common Share- | Capital Gains to Common Share- | Discount from Common Shares Repurchased and | Ending Common Share Net Asset | Ending Market | ||||||||||||||||||||||||||||
| Value | (Loss) | (Loss) | Shareholders | (a) | Shareholders | (a) | Total | holders | holders | Total | Retired | Value | Value | ||||||||||||||||||||||||
| Insured Dividend Advantage (NVG) | |||||||||||||||||||||||||||||||||||||
| Year Ended 10/31: | |||||||||||||||||||||||||||||||||||||
| 2011(f) | $ | 15.20 | $ | .46 | $ | (.90 | ) | $ | (.01 | ) | $ | — | $ | (.45 | ) | $ | (.42 | ) | $ | — | * | $ | (.42 | ) | $ | — | $ | 14.33 | $ | 13.53 | |||||||
| 2010 | 14.80 | .90 | .39 | (.01 | ) | — | * | 1.28 | (.84 | ) | (.04 | ) | (.88 | ) | — | 15.20 | 14.80 | ||||||||||||||||||||
| 2009 | 12.85 | 1.00 | 1.77 | (.06 | ) | — | 2.71 | (.76 | ) | — | (.76 | ) | — | * | 14.80 | 13.85 | |||||||||||||||||||||
| 2008 | 15.09 | 1.00 | (2.25 | ) | (.29 | ) | — | (1.54 | ) | (.70 | ) | — | (.70 | ) | — | 12.85 | 11.42 | ||||||||||||||||||||
| 2007 | 15.50 | 1.00 | (.38 | ) | (.28 | ) | — | .34 | (.75 | ) | — | (.75 | ) | — | 15.09 | 13.71 | |||||||||||||||||||||
| 2006 | 15.23 | 1.01 | .33 | (.25 | ) | — | 1.09 | (.82 | ) | — | (.82 | ) | — | 15.50 | 14.89 | ||||||||||||||||||||||
| Insured Tax-Free Advantage (NEA) | |||||||||||||||||||||||||||||||||||||
| Year Ended 10/31: | |||||||||||||||||||||||||||||||||||||
| 2011(f) | 14.98 | .42 | (.92 | ) | (.01 | ) | — | (.51 | ) | (.41 | ) | — | (.41 | ) | — | 14.06 | 13.23 | ||||||||||||||||||||
| 2010 | 14.42 | .87 | .52 | (.02 | ) | — | 1.37 | (.81 | ) | — | (.81 | ) | — | 14.98 | 14.95 | ||||||||||||||||||||||
| 2009 | 12.37 | .98 | 1.86 | (.06 | ) | — | 2.78 | (.73 | ) | — | (.73 | ) | — | * | 14.42 | 13.48 | |||||||||||||||||||||
| 2008 | 14.71 | .95 | (2.31 | ) | (.27 | ) | — | (1.63 | ) | (.71 | ) | — | (.71 | ) | — | 12.37 | 11.40 | ||||||||||||||||||||
| 2007 | 14.93 | .97 | (.21 | ) | (.27 | ) | — | .49 | (.71 | ) | — | (.71 | ) | — | 14.71 | 14.30 | |||||||||||||||||||||
| 2006 | 14.56 | .97 | .38 | (.24 | ) | — | 1.11 | (.74 | ) | — | (.74 | ) | — | 14.93 | 14.35 | ||||||||||||||||||||||
Auction Rate Preferred Shares at End of Period | MuniFund Term Preferred Shares at End of Period | Auction Rate Preferred Shares and MuniFund Term Preferred Shares at End of Period | ||||||||||||||||||||||||||
Aggregate Amount Outstanding | Liquidation Value | Asset Coverage | Aggregate Amount Outstanding | Liquidation Value | Ending Market Value | Average Market Value | Asset Coverage | Asset Coverage Per $1 | ||||||||||||||||||||
(000) | Per Share | Per Share | (000) | Per Share | Per Share | Per Share | Per Share | Liquidation Preference | ||||||||||||||||||||
| Insured Dividend Advantage (NVG) | ||||||||||||||||||||||||||||
| Year Ended 10/31: | ||||||||||||||||||||||||||||
| 2011(f) | $ | 91,950 | $ | 25,000 | $ | 141,147 | $ | 108,000 | $ | 10 | $ | 10.07 | $ | 10.12 | $ | 31.36 | $ | 3.14 | ||||||||||
| 2010 | 91,950 | 25,000 | 81,628 | 108,000 | 10 | 10.22 | 10.19 | 32.65 | 3.27 | |||||||||||||||||||
| 2009 | 91,950 | 25,000 | 80,165 | 108,000 | 10 | 9.98 | 10.03 | ^ | 32.07 | 3.21 | ||||||||||||||||||
| 2008 | 226,975 | 25,000 | 67,189 | — | — | — | — | — | — | |||||||||||||||||||
| 2007 | 233,000 | 25,000 | 73,281 | — | — | — | — | — | — | |||||||||||||||||||
| 2006 | 233,000 | 25,000 | 74,575 | — | — | — | — | — | — | |||||||||||||||||||
| Insured Tax-Free Advantage (NEA) | ||||||||||||||||||||||||||||
| Year Ended 10/31: | ||||||||||||||||||||||||||||
| 2011(f) | 67,375 | 25,000 | 141,061 | 83,000 | 10 | 10.06 | 10.08 | 30.80 | 3.08 | |||||||||||||||||||
| 2010 | 67,375 | 25,000 | 80,374 | 83,000 | 10 | 10.14 | 10.15 | ^^ | 32.15 | 3.21 | ||||||||||||||||||
| 2009 | 148,750 | 25,000 | 78,880 | — | — | — | — | — | — | |||||||||||||||||||
| 2008 | 132,800 | 25,000 | 68,124 | — | — | — | — | — | — | |||||||||||||||||||
| 2007 | 144,000 | 25,000 | 72,290 | — | — | — | — | — | — | |||||||||||||||||||
| 2006 | 144,000 | 25,000 | 73,005 | — | — | — | — | — | — | |||||||||||||||||||
| 92 | Nuveen Investments |
| Ratios/Supplemental Data | ||||||||||||||||||||||||||||||
| Total Returns | Ratios to Average Net Assets Applicable to Common Shares Before Reimbursement(c) | Ratios to Average Net Assets Applicable to Common Shares After Reimbursement(c)(d) | ||||||||||||||||||||||||||||
Based on Market | Based on Common Share Net Asset | Ending Net Assets Applicable to Common | Expenses Including | Expenses Excluding | Net Investment | Expenses Including | Expenses Excluding | Net Investment | Portfolio Turnover | |||||||||||||||||||||
| Value | (b) | Value | (b) | Shares (000) | Interest | (e) | Interest | Income | Interest | (e) | Interest | Income | Rate | |||||||||||||||||
| (5.70 | )% | (2.89 | )% | $ | 427,189 | 1.96 | %** | 1.16 | %** | 6.30 | %** | 1.82 | %** | 1.01 | %** | 6.44 | %** | 2 | % | |||||||||||
| 13.51 | 8.89 | 452,908 | 1.89 | 1.14 | 5.79 | 1.71 | .95 | 5.98 | 2 | |||||||||||||||||||||
| 28.72 | 21.54 | 441,207 | 1.25 | 1.17 | 6.86 | .98 | .91 | 7.12 | 9 | |||||||||||||||||||||
| (12.11 | ) | (10.64 | ) | 383,035 | 1.32 | 1.17 | 6.48 | .98 | .83 | 6.82 | 7 | |||||||||||||||||||
| (3.12 | ) | 2.25 | 449,982 | 1.31 | 1.14 | 6.15 | .90 | .73 | 6.56 | 12 | ||||||||||||||||||||
| 11.09 | 7.39 | 462,037 | 1.15 | 1.15 | 6.15 | .70 | .70 | 6.60 | 15 | |||||||||||||||||||||
| (8.75 | ) | (3.36 | ) | 312,784 | 2.01 | ** | 1.22 | ** | 6.09 | ** | 1.99 | ** | 1.20 | ** | 6.11 | ** | — | *** | ||||||||||||
| 17.27 | 9.76 | 333,074 | 1.76 | 1.17 | 5.80 | 1.63 | 1.04 | 5.93 | 2 | |||||||||||||||||||||
| 25.41 | 23.05 | 320,587 | 1.24 | 1.19 | 7.14 | .99 | .94 | 7.39 | 6 | |||||||||||||||||||||
| (15.97 | ) | (11.56 | ) | 229,075 | 1.26 | 1.19 | 6.27 | .87 | .81 | 6.66 | 8 | |||||||||||||||||||
| 4.59 | 3.35 | 272,391 | 1.19 | 1.17 | 6.04 | .70 | .68 | 6.53 | 6 | |||||||||||||||||||||
| 12.82 | 7.82 | 276,506 | 1.19 | 1.19 | 6.12 | .69 | .69 | 6.61 | — | |||||||||||||||||||||
| (a) | The amounts shown are based on Common share equivalents. |
| (b) | Total Return Based on Market Value is the combination of changes in the market price per share and the effect of reinvested dividend income and reinvested capital gains distributions, if any, at the average price paid per share at the time of reinvestment. The last dividend declared in the period, which is typically paid on the first business day of the following month, is assumed to be reinvested at the ending market price. The actual reinvestment for the last dividend declared in the period may take place over several days, and in some instances may not be based on the market price, so the actual reinvestment price may be different from the price used in the calculation. |
| Total returns are not annualized. | |
| Total Return Based on Common Share Net Asset Value is the combination of changes in Common share net asset value, reinvested dividend income at net asset value and reinvested capital gains distributions at net asset value, if any. The last dividend declared in the period, which is typically paid on the first business day of the following month, is assumed to be reinvested at the ending net asset value. The actual reinvest price for the last dividend declared in the period may often be based on the Fund’s market price (and not its net asset value), and therefore may be different from the price used in the calculation. Total returns are not annualized. | |
| (c) | Ratios do not reflect the effect of dividend payments to Auction Rate Preferred shareholders, where applicable; Net Investment Income ratios reflect income earned and expenses incurred on assets attributable to ARPS and/or MTP shares, where applicable. |
| (d) | After expense reimbursement from the Adviser, where applicable. Ratios do not reflect the effect of custodian fee credits earned on the Fund’s net cash on deposit with the custodian bank, where applicable. As of November 30, 2010, the Adviser is no longer reimbursing Insured Tax-Free Advantage (NEA) for any fees or expenses. |
| (e) | The expense ratios reflect, among other things, payments to MuniFund Term Preferred shareholders and/or the interest expense deemed to have been paid by the Fund on the floating rate certificates issued by the special purpose trusts for the self-deposited inverse floaters held by the Fund, where applicable, both as described in Footnote 1 – General Information and Significant Accounting Policies, MuniFund Term Preferred Shares and Inverse Floating Rate Securities, respectively. |
| (f) | For the six months ended April 30, 2011. |
| * | Rounds to less than $.01 per share. |
| ** | Annualized. |
| *** | Rounds to less than 1%. |
| ^ | For the period October 19, 2009 (issuance date of shares) through October 31, 2009. |
| ^^ | For the period January 19, 2010 (issuance date of shares) through October 31, 2010. |
See accompanying notes to financial statements.
| Nuveen Investments | 93 |
| Notes to | ||
Financial Statements (Unaudited) |
1. General Information and Significant Accounting Policies
General Information
The funds covered in this report and their corresponding Common share stock exchange symbols are Nuveen Insured Quality Municipal Fund, Inc. (NQI), Nuveen Insured Municipal Opportunity Fund, Inc. (NIO), Nuveen Premier Insured Municipal Income Fund, Inc. (NIF), Nuveen Insured Premium Income Municipal Fund 2 (NPX), Nuveen Insured Dividend Advantage Municipal Fund (NVG) and Nuveen Insured Tax-Free Advantage Municipal Fund (NEA) (collectively, the “Funds”). Common shares of Insured Quality (NQI), Insured Opportunity (NIO), Premier Insured Income (NIF) and Insured Premium Income 2 (NPX) are traded on the New York Stock Exchange (“NYSE”) while Common shares of Insured Dividend Advantage (NVG) and Insured Tax-Free Advantage (NEA) are traded on the NYSE Amex. The Funds are registered under the Investment Company Act of 1940, as amended, as closed-end, registered investment companies.
Effective January 1, 2011, the Funds’ adviser, Nuveen Asset Management, a wholly-owned subsidiary of Nuveen Investments, Inc. (“Nuveen”), changed its name to Nuveen Fund Advisors, Inc. (the “Adviser”). Concurrently, the Adviser formed a wholly-owned subsidiary, Nuveen Asset Management, LLC (the “Sub-Adviser”), to house its portfolio management capabilities and to serve as the Funds’ sub-adviser, and the Funds’ portfolio managers became employees of the Sub-Adviser. This allocation of responsibilities between the Adviser and the Sub-Adviser affects each of the Funds. The Adviser will compensate the Sub-Adviser for the portfolio management services it provides to the Funds from each Fund’s management fee.
Each Fund seeks to provide current income exempt from regular federal income tax, and in the case of Insured Tax-Free Advantage (NEA) the alternative minimum tax applicable to individuals, by investing primarily in a portfolio of municipal obligations issued by state and local government authorities or certain U.S. territories.
Significant Accounting Policies
The following is a summary of significant accounting policies followed by the Funds in the preparation of their financial statements in accordance with U.S. generally accepted accounting principles (“U.S. GAAP”).
Investment Valuation
Common stocks and other equity-type securities are valued at the last sales price on the securities exchange on which such securities are primarily traded and are generally classified as Level 1 for fair value measurement purposes. Securities primarily traded on the NASDAQ National Market (“NASDAQ”) are valued, except as indicated below, at the NASDAQ Official Closing Price and are generally classified as Level 1. However, securities traded on a securities exchange or NASDAQ for which there were no transactions on a given day or securities not listed on a securities exchange or NASDAQ are valued at the quoted bid price.
Prices of municipal bonds are provided by a pricing service approved by the Funds’ Board of Directors/Trustees. These securities are generally classified as Level 2. When price quotes are not readily available (which is usually the case for municipal bonds) the pricing service establishes a security’s fair value using methods that may include consideration of the following: yields or prices of investments of comparable quality, type of issue, coupon, maturity and rating, market quotes or indications of value from security dealers, evaluations of anticipated cash flows or collateral, general market conditions and other information and analysis, including the obligor’s credit characteristics considered relevant. In pricing certain securities, particularly less liquid and lower quality securities, the pricing service may consider information about a security, its issuer, or market activity, provided by the Adviser. These securities are generally classified as Level 2 or Level 3 depending on the priority of the significant inputs.
Certain securities may not be able to be priced by the pre-established pricing methods as described above. Such securities may be valued by the Funds’ Board of Directors/Trustees or its designee at fair value. These securities generally include, but are not limited to, restricted securities (securities which may not be publicly sold without registration under the Securities Act of 1933, as amended) for which a pricing service is unable to provide a market price; securities whose trading has been formally suspended; debt securities that have gone into default and for which there is no current market quotation; a security whose market price is not available from a pre-established pricing source; a security with respect to which an event has occurred that is likely to materially affect the value of the security after the market has closed but before the calculation of a Fund’s net asset value (as may be the case in non-U.S. markets on which the security is primarily traded) or make it difficult or impossible to obtain a reliable market quotation;
| 94 | Nuveen Investments |
and a security whose price, as provided by the pricing service, is not deemed to reflect the security’s fair value. As a general principle, the fair value of a security would appear to be the amount that the owner might reasonably expect to receive for it in a current sale. A variety of factors may be considered in determining the fair value of such securities, which may include consideration of the following: yields or prices of investments of comparable quality, type of issue, coupon, maturity and rating, market quotes or indications of value from security dealers, evaluations of anticipated cash flows or collateral, general market conditions and other information and analysis, including the obligor’s credit characteristics considered relevant. These securities are generally classified as Level 2 or Level 3 depending on the priority of the significant inputs. Regardless of the method employed to value a particular security, all valuations are subject to review by the Funds’ Board of Directors/Trustees or its designee.
Refer to Footnote 2 – Fair Value Measurements for further details on the leveling of securities held by the Funds as of the end of the reporting period.
Investment Transactions
Investment transactions are recorded on a trade date basis. Realized gains and losses from transactions are determined on the specific identification method, which is the same basis used for federal income tax purposes. Investments purchased on a when-issued/delayed delivery basis may have extended settlement periods. Any investments so purchased are subject to market fluctuation during this period. The Funds have instructed the custodian to segregate assets with a current value at least equal to the amount of the when-issued/delayed delivery purchase commitments. At April 30, 2011, Insured Quality (NQI), Insured Opportunity (NIO), Premier Insured Income (NIF) and Insured Premium Income 2 (NPX) had outstanding when-issued/delayed delivery purchase commitments of $859,188, $1,229,988, $368,996 and $2,577,564, respectively. There were no such outstanding purchase commitments in any of the other Funds.
Investment Income
Dividend income is recorded on the ex-dividend date. Investment income, which reflects the amortization of premiums and includes accretion of discounts for financial reporting purposes, is recorded on an accrual basis. Investment income also reflects paydown gains and losses, if any.
Professional Fees
Professional fees presented on the Statement of Operations consist of legal fees incurred in the normal course of operations, audit fees, tax consulting fees and, in some cases, workout expenditures. Workout expenditures are incurred in an attempt to protect or enhance an investment, or to pursue other claims or legal actions on behalf of Fund shareholders.
Income Taxes
Each Fund is a separate taxpayer for federal income tax purposes. Each Fund intends to distribute substantially all of its net investment income and net capital gains to shareholders and to otherwise comply with the requirements of Subchapter M of the Internal Revenue Code applicable to regulated investment companies. Therefore, no federal income tax provision is required. Furthermore, each Fund intends to satisfy conditions that will enable interest from municipal securities, which is exempt from regular federal income tax, and in the case of Insured Tax-Free Advantage (NEA) the alternative minimum tax applicable to individuals, to retain such tax-exempt status when distributed to shareholders of the Funds. Net realized capital gains and ordinary income distributions paid by the Funds are subject to federal taxation.
For all open tax years and all major taxing jurisdictions, management of the Funds has concluded that there are no significant uncertain tax positions that would require recognition in the financial statements. Open tax years are those that are open for examination by taxing authorities (i.e., generally the last four tax year ends and the interim tax period since then). Furthermore, management of the Funds is also not aware of any tax positions for which it is reasonably possible that the total amounts of unrecognized tax benefits will significantly change in the next twelve months.
Dividends and Distributions to Common Shareholders
Dividends from net investment income are declared monthly. Net realized capital gains and/or market discount from investment transactions, if any, are distributed to shareholders at least annually. Furthermore, capital gains are distributed only to the extent they exceed available capital loss carryforwards.
Distributions to Common shareholders of net investment income, net realized capital gains and/or market discount, if any, are recorded on the ex-dividend date. The amount and timing of distributions are determined in accordance with federal income tax regulations, which may differ from U.S. GAAP.
| Nuveen Investments | 95 |
| Notes to | ||
Financial Statements (Unaudited) (continued) |
Auction Rate Preferred Shares
Each Fund is authorized to issue Auction Rate Preferred Shares (“ARPS”). The following Funds have issued and outstanding ARPS, $25,000 stated value per share, which approximates market value, as a means of effecting financial leverage. Each Fund’s ARPS are issued in more than one Series. The dividend rate paid by the Funds on each Series is determined every seven days, pursuant to a dutch auction process overseen by the auction agent, and is payable at the end of each rate period. As of April 30, 2011, the number of ARPS outstanding, by Series and in total, for each Fund is as follows:
Insured Dividend Advantage | Insured Tax-Free Advantage | ||||||
| (NVG | ) | (NEA | ) | ||||
| Number of shares: | |||||||
| Series M | 1,247 | — | |||||
| Series T | 1,217 | 1,104 | |||||
| Series W | — | 1,105 | |||||
| Series W2 | — | 486 | |||||
| Series TH | 1,214 | — | |||||
| Total | 3,678 | 2,695 | |||||
Beginning in February 2008, more shares for sale were submitted in the regularly scheduled auctions for the ARPS issued by the Funds than there were offers to buy. This meant that these auctions “failed to clear,’’ and that many ARPS shareholders who wanted to sell their shares in these auctions were unable to do so. ARPS shareholders unable to sell their shares received distributions at the “maximum rate’’ applicable to failed auctions as calculated in accordance with the pre-established terms of the ARPS. As of April 30, 2011, the aggregate amount of outstanding ARPS redeemed by each Fund is as follows:
Insured Quality | Insured Opportunity | Premier Insured Income | Insured Premium Income 2 | Insured Dividend Advantage | Insured Tax-Free Advantage | ||||||||||||||
| (NQI | ) | (NIO | ) | (NIF | ) | (NPX | ) | (NVG | ) | (NEA | ) | ||||||||
| ARPS redeemed, at liquidation value | $ | 318,000,000 | $ | 791,000,000 | $ | 161,000,000 | $ | 268,900,000 | $ | 141,050,000 | $ | 105,625,000 | |||||||
During the fiscal year ended October 31, 2010, lawsuits pursuing claims made in a demand letter alleging that Insured Quality (NQI), Premier Insured Income (NIF), Insured Dividend Advantage (NVG) and Insured Tax-Free Advantage’s (NEA) Board of Directors/Trustees breached their fiduciary duties related to the redemption at par of their ARPS had been filed on behalf of shareholders of Insured Quality (NQI), Premier Insured Income (NIF), Insured Dividend Advantage (NVG) and Insured Tax-Free Advantage (NEA), against the Adviser together with current and former officers and interested director/trustees of Insured Quality (NQI), Premier Insured Income (NIF), Insured Dividend Advantage (NVG) and Insured Tax-Free Advantage (NEA). Nuveen and the other named defendants believe these lawsuits to be without merit, and all named parties intend to defend themselves vigorously. Insured Quality (NQI), Premier Insured Income (NIF), Insured Dividend Advantage (NVG) and Insured Tax-Free Advantage (NEA) believe that these lawsuits will not have a material effect on them or on the Adviser’s ability to serve as investment adviser to them.
MuniFund Term Preferred Shares
The following Funds have issued and outstanding MuniFund Term Preferred (“MTP”) Shares, with a $10 stated value per share. Proceeds from the issuance of MTP Shares, net of offering expenses, were used to redeem a portion of each Fund’s outstanding ARPS. Each Fund’s MTP Shares are issued in one Series. Dividends, which are recognized as interest expense for financial reporting purposes, are paid monthly at a fixed annual rate, subject to adjustments in certain circumstances. The MTP Shares trade on the NYSE. As of April 30, 2011, the number of MTP Shares outstanding, annual interest rate and the NYSE “ticker” symbol for each Fund are as follows:
| Insured Dividend Advantage (NVG) | Insured Tax-Free Advantage (NEA) | ||||||||||||||||||
Shares Outstanding | Annual Interest Rate | NYSE Ticker | Shares Outstanding | Annual Interest Rate | NYSE Ticker | ||||||||||||||
| Series: | |||||||||||||||||||
| 2014 | 10,800,000 | 2.95 | % | NVG Pr C | — | — | % | — | |||||||||||
| 2015 | — | — | — | 8,300,000 | 2.85 | NEA Pr C | |||||||||||||
Each Fund is obligated to redeem its MTP Shares by the date as specified in its offering document (“Term Redemption Date”), unless earlier redeemed or repurchased by the Fund. MTP Shares are subject to optional and mandatory redemption in certain circumstances. MTP Shares are subject to redemption at the option of each Fund (“Optional Redemption Date”), subject to payment of a premium for one year following the
| 96 | Nuveen Investments |
Optional Redemption Date (“Premium Expiration Date”), and at par thereafter. The MTP Shares also are subject to redemption, at the option of each Fund, at par in the event of certain changes in the credit rating of the MTP Shares. Each Fund may be obligated to redeem certain of the MTP Shares if the Fund fails to maintain certain asset coverage and leverage ratio requirements and such failures are not cured by the applicable cure date. The redemption price per share is equal to the sum of the liquidation value per share plus any accumulated but unpaid dividends. The Term Redemption Date, Optional Redemption Date and Premium Expiration Date for each Fund’s MTP Shares are as follows:
| Insured | Insured | ||||||
| Dividend | Tax-Free | ||||||
| Advantage | Advantage | ||||||
| (NVG | ) | (NEA | ) | ||||
| Series 2014 | Series 2015 | ||||||
| Term Redemption Date | November 1, 2014 | February 1, 2015 | |||||
| Optional Redemption Date | November 1, 2010 | February 1, 2011 | |||||
| Premium Expiration Date | November 1, 2011 | January 31, 2012 |
The average liquidation value of MTP Shares outstanding for each Fund during the six months ended April 30, 2011, was as follows:
| Insured | Insured | ||||||
| Dividend | Tax-Free | ||||||
| Advantage | Advantage | ||||||
| (NVG | ) | (NEA | ) | ||||
| Average liquidation value of MTP Shares outstanding | $ | 108,000,000 | $ | 83,000,000 |
For financial reporting purposes only, the liquidation value of MTP Shares is recorded as a liability on the Statement of Assets and Liabilities. Unpaid dividends on MTP Shares are recognized as a component of “Interest payable” on the Statement of Assets and Liabilities. Dividends paid on MTP Shares are recognized as a component of “Interest expense and amortization of offering costs” on the Statement of Operations.
Variable Rate MuniFund Term Preferred Shares
Insured Quality (NQI) has issued and outstanding $240,400,000 Series 2014 Variable Rate MuniFund Term Preferred (“VMTP”) Shares, with $100,000 liquidation value per share. Insured Quality (NQI) issued its VMTP Shares in a privately negotiated offering in February 2011. Proceeds from the issuance of VMTP Shares, net of offering expenses, were used to redeem all of the Fund’s outstanding ARPS. The VMTP Shares were offered to qualified institutional buyers pursuant to Rule 144A under the Securities Act of 1933.
The Fund is obligated to redeem its VMTP Shares on March 1, 2014, unless earlier redeemed or repurchased by the Fund. VMTP Shares are subject to optional and mandatory redemption in certain circumstances. The VMTP Shares are subject to redemption at the option of the Fund, subject to payment of a premium until February 29, 2012, and at par thereafter. The Fund may be obligated to redeem certain of the VMTP Shares if the Fund fails to maintain certain asset coverage and leverage ratio requirements and such failures are not cured by the applicable cure date. The redemption price per share is equal to the sum of the liquidation value per share plus any accumulated but unpaid dividends.
Dividends on the VMTP Shares (which are treated as interest payments for financial reporting purposes) are set weekly.
For financial reporting purposes only, the liquidation value of VMTP Shares is recorded as a liability on the Statement of Assets and Liabilities. Unpaid dividends on VMTP Shares are recognized as a component of “Interest payable” on the Statement of Assets and Liabilities. Dividends paid on VMTP Shares are recognized as a component of “Interest expense and amortization of offering costs” on the Statement of Operations.
The average liquidation value outstanding and average annualized dividend rate of VMTP Shares for the Fund during the period February 24, 2011 (issuance date of shares) through April 30, 2011 were $240,400,000 and 1.50%, respectively.
Variable Rate Demand Preferred Shares
The following Funds have issued and outstanding Variable Rate Demand Preferred (“VRDP”) Shares, with a $100,000 liquidation value per share. Insured Opportunity (NIO), Premier Insured Income (NIF) and Insured Premium Income 2 (NPX) issued their VRDP Shares in privately negotiated offerings during December 2010, December 2010 and August 2008, respectively. Concurrent with renewing agreements with the liquidity provider for its VRDP Shares in June 2010, Insured Premium Income 2 (NPX) exchanged all its 2,190 Series 1 VRDP Shares for 2,190 Series 2 VRDP Shares. The principal difference in terms between Series 1 and Series 2 VRDP Shares is the requirement that the Fund redeem VRDP Shares owned by the liquidity provider if the VRDP Shares have been owned by the liquidity provider through six months of continuous, unsuccessful remarketing. Proceeds of each Fund’s offering were
| Nuveen Investments | 97 |
| Notes to | ||
Financial Statements (Unaudited) (continued) |
used to redeem all of each Fund’s outstanding ARPS. The VRDP Shares were offered to qualified institutional buyers pursuant to Rule 144A under the Securities Act of 1933. As of April 30, 2011, the number of VRDP Shares outstanding and maturity date for each Fund are as follows:
| Premier | Insured | |||||||||
| Insured | Insured | Premium | ||||||||
| Opportunity | Income | Income 2 | ||||||||
| (NIO | ) | (NIF | ) | (NPX | ) | |||||
| Series | 1 | 1 | 2 | |||||||
| Shares Outstanding | 6,672 | 1,309 | 2,190 | |||||||
| Maturity | December 1, 2040 | December 1, 2040 | August 1, 2038 |
VRDP Shares include a liquidity feature that allows VRDP shareholders to have their shares purchased by a liquidity provider with whom each Fund has contracted in the event that purchase orders for VRDP Shares in a remarketing are not sufficient in number to be matched with the sale orders in that remarketing. Each Fund is required to redeem any VRDP Shares that are still owned by the liquidity provider after six months of continuous, unsuccessful remarketing.
Dividends on the VRDP Shares (which are treated as interest payments for financial reporting purposes) are set weekly at a rate established by a remarketing agent; therefore, the market value of the VRDP Shares is expected to approximate its liquidation value. If remarketings for VRDP Shares are continuously unsuccessful for six months, the maximum rate is designed to escalate according to a specified schedule in order to enhance the remarketing agent’s ability to successfully remarket the VRDP Shares.
Subject to certain conditions, VRDP Shares may be redeemed, in whole or in part, at any time at the option of the Fund. The Fund may also redeem certain of the VRDP Shares if the Fund fails to maintain certain asset coverage requirements and such failures are not cured by the applicable cure date. The redemption price per share is equal to the sum of the liquidation value per share plus any accumulated but unpaid dividends.
The average liquidation value outstanding and annualized dividend rate of VRDP Shares for each Fund during the six months ended April 30, 2011, were as follows:
| Premier | Insured | |||||||||
| Insured | Insured | Premium | ||||||||
| Opportunity | Income | Income 2 | ||||||||
| (NIO | )* | (NIF | )** | (NPX | ) | |||||
| Average liquidation value outstanding | 667,200,000 | 130,900,000 | 219,000,000 | |||||||
| Annualized dividend rate | 0.51 | % | 0.52 | % | 0.44 | % |
| * | For the period December 30, 2010 (issuance date of shares) through April 30, 2011. |
| ** | For the period December 16, 2010 (issuance date of shares) through April 30, 2011. |
For financial reporting purposes only, the liquidation value of VRDP Shares is recognized as a liability on the Statement of Assets and Liabilities. Unpaid dividends on VRDP Shares are recognized as a component of “Interest payable” on the Statement of Assets and Liabilities. Dividends paid on the VRDP Shares are recognized as a component of “Interest expense and amortization of offering costs” on the Statement of Operations. In addition to interest expense, each Fund also pays a per annum liquidity fee to the liquidity provider, which is recognized as “Liquidity fees on VRDP Shares” on the Statement of Operations.
Insurance
Since 2007, the financial status of most major municipal bond insurers has deteriorated substantially, and some insurers have gone out of business, rendering worthless the insurance policies they had written. Under normal circumstances, each Fund invests at least 80% of its managed assets (as defined in Footnote 7 – Management Fees and Other Transactions with Affiliates) in municipal securities that are covered by insurance guaranteeing the timely payment of principal and interest. In addition, the municipal securities in which each Fund invests will be investment grade at the time of purchase (including (i) bonds insured by investment grade rated insurers or are rated investment grade; (ii) unrated bonds that are judged to be investment grade by the Adviser; and (iii) escrowed bonds). Ratings below BBB by one or more national rating agencies are considered to be below investment grade.
Each insured municipal security is covered by Original Issue Insurance, Secondary Market Insurance or Portfolio Insurance. Assuming that the insurer remains creditworthy, the insurance feature of a municipal security guarantees the full payment of principal and interest when due through the life of an insured obligation. Such insurance does not guarantee the market value of the insured obligation or the value of the Fund’s Common shares. Original Issue Insurance and Secondary Market Insurance remain in effect as long as the municipal securities covered thereby remain outstanding and the insurer remains in business, regardless of whether the Funds ultimately dispose of such municipal securities. Consequently, the market value of the municipal securities covered by Original Issue Insurance or Secondary Market Insurance may reflect value attributable to the insurance. Portfolio Insurance, in contrast, is effective only while the municipal securities are held by the Funds and is reflected as an expense over the term of the policy, when applicable. Accordingly, neither the prices used in determining the market value of the underlying municipal securities nor the Common share
| 98 | Nuveen Investments |
net asset value of the Funds include value, if any, attributable to the Portfolio Insurance. Each policy of the Portfolio Insurance does, however, give the Funds the right to obtain permanent insurance with respect to the municipal security covered by the Portfolio Insurance policy at the time of its sale.
Inverse Floating Rate Securities
Each Fund is authorized to invest in inverse floating rate securities. An inverse floating rate security is created by depositing a municipal bond, typically with a fixed interest rate, into a special purpose trust created by a broker-dealer. In turn, this trust (a) issues floating rate certificates, in face amounts equal to some fraction of the deposited bond’s par amount or market value, that typically pay short-term tax-exempt interest rates to third parties, and (b) issues to a long-term investor (such as one of the Funds) an inverse floating rate certificate (sometimes referred to as an “inverse floater”) that represents all remaining or residual interest in the trust. The income received by the inverse floater holder varies inversely with the short-term rate paid to the floating rate certificates’ holders, and in most circumstances the inverse floater holder bears substantially all of the underlying bond’s downside investment risk and also benefits disproportionately from any potential appreciation of the underlying bond’s value. The price of an inverse floating rate security will be more volatile than that of the underlying bond because the interest rate is dependent on not only the fixed coupon rate of the underlying bond but also on the short-term interest paid on the floating rate certificates, and because the inverse floating rate security essentially bears the risk of loss of the greater face value of the underlying bond.
A Fund may purchase an inverse floating rate security in a secondary market transaction without first owning the underlying bond (referred to as an “externally-deposited inverse floater”), or instead by first selling a fixed-rate bond to a broker-dealer for deposit into the special purpose trust and receiving in turn the residual interest in the trust (referred to as a “self-deposited inverse floater”). The inverse floater held by a Fund gives the Fund the right (a) to cause the holders of the floating rate certificates to tender their notes at par, and (b) to have the broker transfer the fixed-rate bond held by the trust to the Fund, thereby collapsing the trust. An investment in an externally-deposited inverse floater is identified in the Portfolio of Investments as “(IF) – Inverse floating rate investment.” An investment in a self-deposited inverse floater is accounted for as a financing transaction. In such instances, a fixed-rate bond deposited into a special purpose trust is identified in the Portfolio of Investments as “(UB) – Underlying bond of an inverse floating rate trust reflected as a financing transaction,” with the Fund accounting for the short-term floating rate certificates issued by the trust as “Floating rate obligations” on the Statement of Assets and Liabilities. In addition, the Fund reflects in “Investment Income” the entire earnings of the underlying bond and recognizes the related interest paid to the holders of the short-term floating rate certificates as a component of “Interest expense and amortization of offering costs” on the Statement of Operations.
During the six months ended April 30, 2011, each Fund invested in externally-deposited inverse floaters and/or self-deposited inverse floaters.
Each Fund may also enter into shortfall and forbearance agreements (sometimes referred to as a “recourse trust” or “credit recovery swap”) (such agreements referred to herein as “Recourse Trusts”) with a broker-dealer by which a Fund agrees to reimburse the broker-dealer, in certain circumstances, for the difference between the liquidation value of the fixed-rate bond held by the trust and the liquidation value of the floating rate certificates issued by the trust plus any shortfalls in interest cash flows. Under these agreements, a Fund’s potential exposure to losses related to or on inverse floaters may increase beyond the value of a Fund’s inverse floater investments as a Fund may potentially be liable to fulfill all amounts owed to holders of the floating rate certificates. At period end, any such shortfall is recognized as “Unrealized depreciation on Recourse Trusts” on the Statement of Assets and Liabilities.
At April 30, 2011, each Fund’s maximum exposure to externally-deposited Recourse Trusts, is as follows:
| Premier | Insured | Insured | Insured | ||||||||||||||||
| Insured | Insured | Insured | Premium | Dividend | Tax-Free | ||||||||||||||
| Quality | Opportunity | Income | Income 2 | Advantage | Advantage | ||||||||||||||
| (NQI | ) | (NIO | ) | (NIF | ) | (NPX | ) | (NVG | ) | (NEA | ) | ||||||||
| Maximum exposure to Recourse Trusts | $ | 26,610,000 | $ | 40,430,000 | $ | 15,375,000 | $ | 14,845,000 | $ | 6,665,000 | $ | 6,665,000 |
The average floating rate obligations outstanding and average annual interest rate and fees related to self-deposited inverse floaters during the six months ended April 30, 2011, were as follows:
| Premier | Insured | Insured | Insured | ||||||||||||||||
| Insured | Insured | Insured | Premium | Dividend | Tax-Free | ||||||||||||||
| Quality | Opportunity | Income | Income 2 | Advantage | Advantage | ||||||||||||||
| (NQI | ) | (NIO | ) | (NIF | ) | (NPX | ) | (NVG | ) | (NEA | ) | ||||||||
| Average floating rate obligations outstanding | $ | 59,517,624 | $ | 127,485,239 | $ | 22,365,000 | $ | 57,980,000 | $ | 28,413,334 | $ | 13,040,000 | |||||||
| Average annual interest rate and fees | 0.66 | % | 0.67 | % | 0.65 | % | 0.59 | % | 0.71 | % | 0.74 | % |
Derivative Financial Instruments
Each Fund is authorized to invest in certain derivative instruments, including foreign currency forwards, futures, options and swap contracts. Although each Fund is authorized to invest in such derivative instruments, and may do so in the future, they did not make any such investments during the six months ended April 30, 2011.
| Nuveen Investments | 99 |
| Notes to | ||
Financial Statements (Unaudited) (continued) |
Market and Counterparty Credit Risk
In the normal course of business each Fund may invest in financial instruments and enter into financial transactions where risk of potential loss exists due to changes in the market (market risk) or failure of the other party to the transaction to perform (counterparty credit risk). The potential loss could exceed the value of the financial assets recorded on the financial statements. Financial assets, which potentially expose each Fund to counterparty credit risk, consist principally of cash due from counterparties on forward, option and swap transactions, when applicable. The extent of each Fund’s exposure to counterparty credit risk in respect to these financial assets approximates their carrying value as recorded on the Statement of Assets and Liabilities. Futures contracts, when applicable, expose a Fund to minimal counterparty credit risk as they are exchange traded and the exchange’s clearinghouse, which is counterparty to all exchange traded futures, guarantees the futures contracts against default.
Each Fund helps manage counterparty credit risk by entering into agreements only with counterparties the Adviser believes have the financial resources to honor their obligations and by having the Adviser monitor the financial stability of the counterparties. Additionally, counterparties may be required to pledge collateral daily (based on the daily valuation of the financial asset) on behalf of each Fund with a value approximately equal to the amount of any unrealized gain above a pre-determined threshold. Reciprocally, when each Fund has an unrealized loss, the Funds have instructed the custodian to pledge assets of the Funds as collateral with a value approximately equal to the amount of the unrealized loss above a predetermined threshold. Collateral pledges are monitored and subsequently adjusted if and when the valuations fluctuate, either up or down, by at least the pre-determined threshold amount.
Zero Coupon Securities
Each Fund is authorized to invest in zero coupon securities. A zero coupon security does not pay a regular interest coupon to its holders during the life of the security. Tax-exempt income to the holder of the security comes from accretion of the difference between the original purchase price of the security at issuance and the par value of the security at maturity and is effectively paid at maturity. The market prices of zero coupon securities generally are more volatile than the market prices of securities that pay interest periodically.
Offering Costs
Costs incurred by Insured Quality (NQI) in connection with its offering of VMTP Shares ($1,120,000) were recorded as a deferred charge and will be amortized over the life of the shares. Costs incurred by Insured Opportunity (NIO), Premier Insured Income (NIF) and Insured Premium Income 2 (NPX) in connection with their offerings of VRDP Shares ($2,645,000, $755,000 and $2,535,000, respectively) were recorded as a deferred charge and will be amortized over the life of the shares. Costs incurred by Insured Dividend Advantage (NVG) and Insured Tax-Free Advantage (NEA) in connection with their offerings of MTP Shares ($1,875,000 and $1,605,000, respectively) were recorded as deferred charges and will be amortized over the life of the shares. Each Fund’s amortized deferred charges are recognized as a component of “Interest expense and amortization of offering costs” on the Statement of Operations.
Custodian Fee Credit
Each Fund has an arrangement with the custodian bank whereby certain custodian fees and expenses are reduced by net credits earned on each Fund’s cash on deposit with the bank. Such deposit arrangements are an alternative to overnight investments. Credits for cash balances may be offset by charges for any days on which a Fund overdraws its account at the custodian bank.
Indemnifications
Under the Funds’ organizational documents, their officers and directors/trustees are indemnified against certain liabilities arising out of the performance of their duties to the Funds. In addition, in the normal course of business, the Funds enter into contracts that provide general indemnifications to other parties. The Funds’ maximum exposure under these arrangements is unknown as this would involve future claims that may be made against the Funds that have not yet occurred. However, the Funds have not had prior claims or losses pursuant to these contracts and expect the risk of loss to be remote.
Use of Estimates
The preparation of financial statements in conformity with U.S. GAAP requires management to make estimates and assumptions that affect the reported amounts of assets and liabilities at the date of the financial statements and the reported amounts of increases and decreases in net assets applicable to Common shares from operations during the reporting period. Actual results may differ from those estimates.
2. Fair Value Measurements
Fair value is defined as the price that the Funds would receive upon selling an investment or transferring a liability in an orderly transaction to an independent buyer in the principal or most advantageous market of the investment. A three-tier hierarchy is used to maximize the use of observable market data and minimize the use of unobservable inputs and to establish classification of fair value measurements for disclosure purposes. Observable inputs reflect the assumptions market participants would use in pricing the asset or liability. Observable inputs are based on market data obtained from sources independent of the reporting entity. Unobservable inputs reflect the reporting entity’s own assumptions about the assumptions
| 100 | Nuveen Investments |
market participants would use in pricing the asset or liability. Unobservable inputs are based on the best information available in the circumstances. The three-tier hierarchy of inputs is summarized in the three broad levels listed below:
| Level 1 – Quoted prices in active markets for identical securities. | |
| Level 2 – Other significant observable inputs (including quoted prices for similar securities, interest rates, prepayment speeds, credit risk, etc.). | |
| Level 3 – Significant unobservable inputs (including management’s assumptions in determining the fair value of investments). |
The inputs or methodologies used for valuing securities are not an indication of the risk associated with investing in those securities. The following is a summary of each Fund’s fair value measurements as of April 30, 2011:
| Insured Quality (NQI) | Level 1 | Level 2 | Level 3 | Total | ||||||||||||
| Investments: | ||||||||||||||||
| Municipal Bonds | $ | — | $ | 791,035,015 | $ | — | $ | 791,035,015 | ||||||||
| Insured Opportunity (NIO) | Level 1 | Level 2 | Level 3 | Total | ||||||||||||
| Investments: | ||||||||||||||||
| Municipal Bonds | $ | — | $ | 2,039,823,431 | $ | — | $ | 2,039,823,431 | ||||||||
| Short-Term Investments | — | 2,500,000 | — | 2,500,000 | ||||||||||||
| Total | $ | — | $ | 2,042,323,431 | $ | — | $ | 2,042,323,431 | ||||||||
| Premier Insured Income (NIF) | Level 1 | Level 2 | Level 3 | Total | ||||||||||||
| Investments: | ||||||||||||||||
| Municipal Bonds | $ | — | $ | 412,108,050 | $ | — | $ | 412,108,050 | ||||||||
| Short-Term Investments | — | 2,885,000 | — | 2,885,000 | ||||||||||||
| Total | $ | — | $ | 414,993,050 | $ | — | $ | 414,993,050 | ||||||||
| Insured Premium Income 2 (NPX) | Level 1 | Level 2 | Level 3 | Total | ||||||||||||
| Investments: | ||||||||||||||||
| Municipal Bonds | $ | — | $ | 729,629,401 | $ | — | $ | 729,629,401 | ||||||||
| Insured Dividend Advantage (NVG) | Level 1 | Level 2 | Level 3 | Total | ||||||||||||
| Investments: | ||||||||||||||||
| Municipal Bonds | $ | — | $ | 643,201,618 | $ | — | $ | 643,201,618 | ||||||||
| Investment Companies | 1,225,768 | — | — | 1,225,768 | ||||||||||||
| Total | $ | 1,225,768 | $ | 643,201,618 | $ | — | $ | 644,427,386 | ||||||||
| Insured Tax-Free Advantage (NEA) | Level 1 | Level 2 | Level 3 | Total | ||||||||||||
| Investments: | ||||||||||||||||
| Municipal Bonds | $ | — | $ | 468,039,154 | $ | — | $ | 468,039,154 | ||||||||
During the six months ended April 30, 2011, the Funds recognized no significant transfers to/from Level 1, Level 2 or Level 3.
3. Derivative Instruments and Hedging Activities
The Funds record derivative instruments at fair value, with changes in fair value recognized on the Statement of Operations, when applicable. Even though the Funds’ investments in derivatives may represent economic hedges, they are not considered to be hedge transactions for financial reporting purposes. The Funds did not invest in derivative instruments during the six months ended April 30, 2011.
| Nuveen Investments | 101 |
| Notes to | ||
Financial Statements (Unaudited) (continued) |
4. Fund Shares
Common Shares
Transactions in Common shares were as follows:
Insured Quality (NQI) | Insured Opportunity (NIO) | Premier Insured Income (NIF) | ||||||||||||||
Six Months Ended 4/30/11 | Year Ended 10/31/10 | Six Months Ended 4/30/11 | Year Ended 10/31/10 | Six Months Ended 4/30/11 | Year Ended 10/31/10 | |||||||||||
| Common shares: | ||||||||||||||||
| Issued to shareholders due to reinvestment of distributions | 10,745 | 102,819 | 24,068 | — | 11,863 | 36,155 | ||||||||||
| Repurchased and retired | — | — | — | (2,900 | ) | — | — | |||||||||
| Weighted average Common share: | ||||||||||||||||
| Price per share repurchased and retired | — | — | — | $ | 12.93 | — | — | |||||||||
| Discount per share repurchased and retired | — | — | — | 8.57 | % | — | — | |||||||||
Insured Premium Income 2 (NPX) | Insured Dividend Advantage (NVG) | Insured Tax-Free Advantage (NEA) | |||||||||||||
Six Months Ended 4/30/11 | Year Ended 10/31/10 | Six Months Ended 4/30/11 | Year Ended 10/31/10 | Six Months Ended 4/30/11 | Year Ended 10/31/10 | ||||||||||
| Common shares issued to shareholders due to reinvestment of distributions | — | — | — | — | 1,085 | 5,430 | |||||||||
Preferred Shares
Insured Premium Income 2 (NPX) redeemed all of its outstanding ARPS during the fiscal year ended October 31, 2008. Insured Dividend Advantage (NVG) set did not redeem any of its outstanding ARPS during the six months ended April 30, 2011, or the fiscal year ended October 31, 2010.
Transactions in ARPS were as follows:
| Insured Quality (NQI) | Insured Opportunity (NIO) | |||||||||||||||||||||||||||||||
Six Months Ended 4/30/11 | Year Ended 10/31/10 | Six Months Ended 4/30/11 | Year Ended 10/31/10 | |||||||||||||||||||||||||||||
| Shares | Amount | Shares | Amount | Shares | Amount | Shares | Amount | |||||||||||||||||||||||||
| ARPS redeemed: | ||||||||||||||||||||||||||||||||
| Series M | (1,954 | ) | $ | (48,850,000 | ) | (55 | ) | $ | (1,375,000 | ) | (3,319 | ) | $ | (82,975,000 | ) | (53 | ) | $ | (1,325,000 | ) | ||||||||||||
| Series T | (1,956 | ) | (48,900,000 | ) | (54 | ) | (1,350,000 | ) | (3,319 | ) | (82,975,000 | ) | (53 | ) | (1,325,000 | ) | ||||||||||||||||
| Series W | (1,957 | ) | (48,925,000 | ) | (54 | ) | (1,350,000 | ) | (3,320 | ) | (83,000,000 | ) | (53 | ) | (1,325,000 | ) | ||||||||||||||||
| Series W2 | — | — | — | — | (2,655 | ) | (66,375,000 | ) | (43 | ) | (1,075,000 | ) | ||||||||||||||||||||
| Series W3 | — | — | — | — | (1,486 | ) | (37,150,000 | ) | (24 | ) | (600,000 | ) | ||||||||||||||||||||
| Series TH | (1,745 | ) | (43,625,000 | ) | (49 | ) | (1,225,000 | ) | (3,319 | ) | (82,975,000 | ) | (53 | ) | (1,325,000 | ) | ||||||||||||||||
| Series TH2 | — | — | — | — | (3,321 | ) | (83,025,000 | ) | (53 | ) | (1,325,000 | ) | ||||||||||||||||||||
| Series TH3 | — | — | — | — | (2,536 | ) | (63,400,000 | ) | (41 | ) | (1,025,000 | ) | ||||||||||||||||||||
| Series F | (1,956 | ) | (48,900,000 | ) | (54 | ) | (1,350,000 | ) | (3,318 | ) | (82,950,000 | ) | (53 | ) | (1,325,000 | ) | ||||||||||||||||
| Total | (9,568 | ) | $ | (239,200,000 | ) | (266 | ) | $ | (6,650,000 | ) | (26,593 | ) | $ | (664,825,000 | ) | (426 | ) | $ | (10,650,000 | ) | ||||||||||||
| Premier Insured Income (NIF) | Insured Tax-Free Advantage (NEA) | |||||||||||||||||||
Six Months Ended 4/30/11 | Year Ended 10/31/10 | Six Months Ended 4/30/11 | Year Ended 10/31/10 | |||||||||||||||||
| Shares | Amount | Shares | Amount | Shares | Amount | Shares | Amount | |||||||||||||
| ARPS redeemed: | ||||||||||||||||||||
| Series T | — | $ | — | — | $ | — | — | $ | — | (1,336 | ) | $ | (33,400,000 | ) | ||||||
| Series W | (678 | ) | (16,950,000 | ) | — | — | — | — | (1,335 | ) | (33,375,000 | ) | ||||||||
| Series W2 | — | — | — | — | — | — | (584 | ) | (14,600,000 | ) | ||||||||||
| Series TH | (2,263 | ) | (56,575,000 | ) | — | — | — | — | — | — | ||||||||||
| Series F | (2,264 | ) | (56,600,000 | ) | — | — | — | — | — | — | ||||||||||
| Total | (5,205 | ) | $ | (130,125,000 | ) | — | $ | — | — | $ | — | (3,255 | ) | $ | (81,375,000 | ) | ||||
| 102 | Nuveen Investments |
Transactions in MTP Shares were as follows:
| Insured Tax-Free Advantage (NEA) | ||||||||||||||||
Six Months Ended 4/30/11 | Year Ended 10/31/10 | |||||||||||||||
| Shares | Amount | Shares | Amount | |||||||||||||
| MTP Shares issued: | ||||||||||||||||
| Series 2015 | — | $ | — | 8,300,000 | $ | 83,000,000 | ||||||||||
| Transactions in VMTP Shares were as follows: | ||||||||||||||||
| Insured Quality (NQI) | ||||||||||
Six Months Ended 4/30/11 | Year Ended 10/31/10 | |||||||||
| Shares | Amount | Shares | Amount | |||||||
| VMTP Shares issued: | ||||||||||
| Series 2014 | 2,404 | $ | 240,400,000 | — | $ | — | ||||
| Transactions in VRDP Shares were as follows: | ||||||||||
| Insured Opportunity (NIO) | Premier Insured Income (NIF) | |||||||||||||||||||||||||||||||
Six Months Ended 4/30/11 | Year Ended 10/31/10 | Six Months Ended 4/30/11 | Year Ended 10/31/10 | |||||||||||||||||||||||||||||
| Shares | Amount | Shares | Amount | Shares | Amount | Shares | Amount | |||||||||||||||||||||||||
| VRDP Shares issued: | ||||||||||||||||||||||||||||||||
| Series 1 | 6,672 | $ | 667,200,000 | — | $ | — | 1,309 | $ | 130,900,000 | — | $ | — | ||||||||||||||||||||
During the fiscal year ended October 31, 2010, Insured Premium Income 2 (NPX) completed a private exchange offer in which all of its 2,190 Series 1 VRDP Shares were exchanged for 2,190 Series 2 VRDP Shares.
5. Investment Transactions
Purchases and sales (including maturities but excluding short-term investments, when applicable) during the six months ended April 30, 2011, were as follows:
Insured Quality (NQI) | Insured Opportunity (NIO) | Premier Insured Income (NIF) | Insured Premium Income 2 (NPX) | Insured Dividend Advantage (NVG) | Insured Tax-Free Advantage (NEA) | |||||||||||||||||||
| Purchases | $ | 23,348,571 | $ | 82,322,276 | $ | 10,703,870 | $ | 91,974,409 | $ | 11,944,061 | $ | 2,794,750 | ||||||||||||
| Sales and maturities | 15,843,568 | 129,191,259 | 11,341,028 | 92,704,019 | 14,010,450 | 185,000 | ||||||||||||||||||
6. Income Tax Information
The following information is presented on an income tax basis. Differences between amounts for financial statement and federal income tax purposes are primarily due to timing differences in recognizing taxable market discount, timing differences in recognizing certain gains and losses on investment transactions and the treatment of investments in inverse floating rate securities reflected as financing transactions, if any. To the extent that differences arise that are permanent in nature, such amounts are reclassified within the capital accounts as detailed below. Temporary differences do not require reclassification. Temporary and permanent differences do not impact the net asset values of the Funds.
At April 30, 2011, the cost and unrealized appreciation (depreciation) of investments, as determined on a federal income tax basis, were as follows:
Insured Quality (NQI) | Insured Opportunity (NIO) | Premier Insured Income (NIF) | Insured Premium Income 2 (NPX) | Insured Dividend Advantage (NVG) | Insured Tax-Free Advantage (NEA) | |||||||||||||||||||
| Cost of investments | $ | 765,074,496 | $ | 1,960,492,686 | $ | 395,799,995 | $ | 693,357,598 | $ | 619,340,831 | $ | 454,420,030 | ||||||||||||
| Gross unrealized: | ||||||||||||||||||||||||
| Appreciation | 22,095,447 | 60,852,558 | 14,529,242 | 18,855,097 | 25,085,549 | 15,726,443 | ||||||||||||||||||
| Depreciation | (55,674,946 | ) | (93,211,719 | ) | (17,703,565 | ) | (40,565,080 | ) | (28,410,447 | ) | (15,144,937 | ) | ||||||||||||
| Net unrealized appreciation (depreciation) of investments | $ | (33,579,499 | ) | $ | (32,359,161 | ) | $ | (3,174,323 | ) | $ | (21,709,983 | ) | $ | (3,324,898 | ) | $ | 581,506 | |||||||
| Nuveen Investments | 103 |
| Notes to | ||
Financial Statements (Unaudited) (continued) |
Permanent differences, primarily due to expired capital loss carryforwards, federal taxes paid, taxable market discount and distribution character reclassifications, resulted in reclassifications among the Funds’ components of Common share net assets at October 31, 2010, the Funds’ last tax year end, as follows:
Insured Quality (NQI) | Insured Opportunity (NIO) | Premier Insured Income (NIF) | Insured Premium Income 2 (NPX) | Insured Dividend Advantage (NVG) | Insured Tax-Free Advantage (NEA) | |||||||||||||||||||
| Paid-in surplus | $ | 629 | $ | (16,777 | ) | $ | 88 | $ | (802,209 | ) | $ | (369,847 | ) | $ | (977,733 | ) | ||||||||
| Undistributed (Over-distribution of) net investment income | (43,781 | ) | (3,725 | ) | (8,228 | ) | 799,330 | 369,640 | 249,362 | |||||||||||||||
| Accumulated net realized gain (loss) | 43,152 | 20,502 | 8,140 | 2,879 | 207 | 728,371 | ||||||||||||||||||
The tax components of undistributed net tax-exempt income, net ordinary income and net long-term capital gains at October 31, 2010, the Funds’ last tax year end, were as follows:
Insured Quality (NQI) | Insured Opportunity (NIO) | Premier Insured Income (NIF) | Insured Premium Income 2 (NPX) | Insured Dividend Advantage (NVG) | Insured Tax-Free Advantage (NEA) | |||||||||||||||||||
| Undistributed net tax-exempt income * | $ | 10,060,777 | $ | 27,624,417 | $ | 5,917,120 | $ | 6,876,370 | $ | 7,963,302 | $ | 5,686,189 | ||||||||||||
| Undistributed net ordinary income ** | 309 | 428,114 | — | 179 | 4,493 | 5,353 | ||||||||||||||||||
| Undistributed net long-term capital gains | — | — | — | — | 99,027 | — | ||||||||||||||||||
| * | Undistributed net tax-exempt income (on a tax basis) has not been reduced for the dividend declared on October 1, 2010, paid on November 1, 2010. |
| ** | Net ordinary income consists of taxable market discount income and net short-term capital gains, if any. |
The tax character of distributions paid during the Funds’ last tax year ended October 31, 2010, was designated for purposes of the dividends paid deduction as follows:
Insured Quality (NQI) | Insured Opportunity (NIO) | Premier Insured Income (NIF) | Insured Premium Income 2 (NPX) | Insured Dividend Advantage (NVG) | Insured Tax-Free Advantage (NEA) | |||||||||||||||||||
| Distributions from net tax-exempt income | $ | 33,407,345 | $ | 83,231,805 | $ | 17,344,874 | $ | 28,528,827 | $ | 28,392,303 | $ | 20,278,475 | ||||||||||||
| Distributions from net ordinary income ** | — | — | — | — | — | — | ||||||||||||||||||
| Distributions from net long-term capital gains | — | — | — | — | 1,302,507 | — | ||||||||||||||||||
| ** | Net ordinary income consists of taxable market discount income and net short-term capital gains, if any. |
At October 31, 2010, the Funds’ last tax year end, the following Funds had unused capital loss carryforwards available for federal income tax purposes to be applied against future capital gains, if any. If not applied, the carryforwards will expire as follows:
Insured Quality (NQI) | Insured Opportunity (NIO)* | Premier Insured Income (NIF) | Insured Premium Income 2 (NPX) | Insured Tax-Free Advantage (NEA)* | ||||||||||||||||
| Expiration: | ||||||||||||||||||||
| October 31, 2011 | $ | — | $ | — | $ | — | $ | — | $ | 97,429 | ||||||||||
| October 31, 2012 | — | — | — | — | 236,625 | |||||||||||||||
| October 31, 2013 | — | — | — | — | 4,418,633 | |||||||||||||||
| October 31, 2014 | 731,585 | — | — | — | — | |||||||||||||||
| October 31, 2015 | — | — | — | — | 174,026 | |||||||||||||||
| October 31, 2016 | 3,901,374 | 5,318,344 | 1,275,634 | 5,960,817 | 1,917,479 | |||||||||||||||
| October 31, 2017 | 217,918 | — | — | 456,587 | — | |||||||||||||||
| October 31, 2018 | 322,087 | — | — | — | — | |||||||||||||||
| Total | $ | 5,172,964 | $ | 5,318,344 | $ | 1,275,634 | $ | 6,417,404 | $ | 6,844,192 | ||||||||||
| * | A portion of Insured Opportunity’s (NIO) and Insured Tax-Free Advantage’s (NEA) capital loss carryforwards are subject to an annual limitation under the Internal Revenue Code and related regulations. |
| 104 | Nuveen Investments |
During the Funds’ last tax year ended October 31, 2010, the following Funds utilized capital loss carryforwards as follows:
Insured Opportunity (NIO) | Premier Insured Income (NIF) | Insured Premium Income 2 (NPX) | Insured Tax-Free Advantage (NEA) | |||||||||||||
| Utilized capital loss carryforwards | $ | 3,268,560 | $ | 1,213,751 | $ | 961,315 | $ | 44,123 | ||||||||
At October 31, 2010, the Funds’ last tax year end, $728,305 of Insured Tax-Free Advantage’s (NEA) capital loss carryforward expired.
7. Management Fees and Other Transactions with Affiliates
Each Fund’s management fee consists of two components – a fund-level fee, based only on the amount of assets within the Fund, and a complex-level fee, based on the aggregate amount of all eligible fund assets managed by the Adviser. This pricing structure enables Fund shareholders to benefit from growth in the assets within their Fund as well as from growth in the amount of complex-wide assets managed by the Adviser.
The annual fund-level fee for each Fund, payable monthly, is calculated according to the following schedule:
| Average Daily Managed Assets* | Insured Quality (NQI) Insured Opportunity (NIO) Premier Insured Income (NIF) Insured Premium Income 2 (NPX) Fund-Level Fee Rate | ||
| For the first $125 million | .4500 | % | |
| For the next $125 million | .4375 | ||
| For the next $250 million | .4250 | ||
| For the next $500 million | .4125 | ||
| For the next $1 billion | .4000 | ||
| For the next $3 billion | .3875 | ||
| For managed assets over $5 billion | .3750 | ||
| Average Daily Managed Assets* | Insured Dividend Advantage (NVG) Insured Tax-Free Advantage (NEA) Fund-Level Fee Rate | ||
| For the first $125 million | .4500 | % | |
| For the next $125 million | .4375 | ||
| For the next $250 million | .4250 | ||
| For the next $500 million | .4125 | ||
| For the next $1 billion | .4000 | ||
| For managed assets over $2 billion | .3750 | ||
| Nuveen Investments | 105 |
| Notes to | ||
Financial Statements (Unaudited) (continued) |
The annual complex-level fee for each Fund, payable monthly, is calculated according to the following schedule:
| Complex-Level Managed Asset Breakpoint Level* | Effective Rate at Breakpoint Level | ||
| $55 billion | .2000 | % | |
| $56 billion | .1996 | ||
| $57 billion | .1989 | ||
| $60 billion | .1961 | ||
| $63 billion | .1931 | ||
| $66 billion | .1900 | ||
| $71 billion | .1851 | ||
| $76 billion | .1806 | ||
| $80 billion | .1773 | ||
| $91 billion | .1691 | ||
| $125 billion | .1599 | ||
| $200 billion | .1505 | ||
| $250 billion | .1469 | ||
| $300 billion | .1445 | ||
| * | For the fund-level and complex-level fees, managed assets include closed-end fund assets managed by the Adviser that are attributable to financial leverage. For these purposes, financial leverage includes the funds’ use of preferred stock and borrowings and certain investments in the residual interest certificates (also called inverse floating rate securities) in tender option bond (TOB) trusts, including the portion of assets held by a TOB trust that has been effectively financed by the trust’s issuance of floating rate securities, subject to an agreement by the Adviser as to certain funds to limit the amount of such assets for determining managed assets in certain circumstances. The complex-level fee is calculated based upon the aggregate daily managed assets of all Nuveen funds that constitute “eligible assets.” Eligible assets do not include assets attributable to investments in other Nuveen funds or assets in excess of $2 billion added to the Nuveen fund complex in connection with the Adviser’s assumption of the management of the former First American Funds effective January 1, 2011. As of April 30, 2011, the complex-level fee rate for these Funds was .1785%. |
The management fee compensates the Adviser for overall investment advisory and administrative services and general office facilities. The Adviser has entered into Sub-Advisory Agreements with the Sub-Adviser under which the Sub-Adviser manages the investment portfolios of the Funds. The Sub-Adviser is compensated for its services to the Funds from the management fees paid to the Adviser.
The Funds pay no compensation directly to those of its directors/trustees who are affiliated with the Adviser or to its officers, all of whom receive remuneration for their services to the Funds from the Adviser or its affiliates. The Board of Directors/Trustees has adopted a deferred compensation plan for independent directors/trustees that enables directors/trustees to elect to defer receipt of all or a portion of the annual compensation they are entitled to receive from certain Nuveen-advised funds. Under the plan, deferred amounts are treated as though equal dollar amounts had been invested in shares of select Nuveen-advised funds.
For the first ten years of Insured Dividend Advantage’s (NVG) operations, the Adviser has agreed to reimburse the Fund, as a percentage of average daily managed assets, for fees and expenses in the amounts and for the time periods set forth below:
Year Ending March 31, | Year Ending March 31, | |||||||||
| 2002* | .30% | 2008 | .25 | % | ||||||
| 2003 | .30 | 2009 | .20 | |||||||
| 2004 | .30 | 2010 | .15 | |||||||
| 2005 | .30 | 2011 | .10 | |||||||
| 2006 | .30 | 2012 | .05 | |||||||
| 2007 | .30 |
| * | From the commencement of operations. |
The Adviser has not agreed to reimburse Insured Dividend Advantage (NVG) for any portion of its fees and expenses beyond March 31, 2012.
For the first eight years of Insured Tax-Free Advantage’s (NEA) operations, the Adviser has agreed to reimburse the Fund, as a percentage of average daily managed assets, for fees and expenses in the amounts and for the time periods set forth below:
Year Ending November 30, | Year Ending November 30, | |||||||||
| 2002* | .32% | 2007 | .32 | % | ||||||
| 2003 | .32 | 2008 | .24 | |||||||
| 2004 | .32 | 2009 | .16 | |||||||
| 2005 | .32 | 2010 | .08 | |||||||
| 2006 | .32 |
| * | From the commencement of operations. |
| 106 | Nuveen Investments |
The Adviser has not agreed to reimburse Insured Tax-Free Advantage (NEA) for any portion of its fees and expenses beyond November 30, 2010.
8. New Accounting Pronouncement
Fair Value Measurements and Disclosures
On May 12, 2011, the Financial Accounting Standards Board (“FASB”) issued an Accounting Standard Update (“ASU”) modifying Topic 820, Fair Value Measurements and Disclosures. At the same time, the International Accounting Standards Board (“IASB”) issued International Financial Reporting Standard (“IFRS”) 13, Fair Value Measurement. The objective by the FASB and IASB is convergence of their guidance on fair value measurements and disclosures. Specifically, the ASU requires reporting entities to disclose i) the amounts of any transfers between Level 1 and Level 2, and the reasons for the transfers, ii) for Level 3 fair value measurements, a) quantitative information about significant unobservable inputs used, b) a description of the valuation processes used by the reporting entity and c) a narrative description of the sensitivity of the fair value measurement to changes in unobservable inputs if a change in those inputs might result in a significantly higher or lower fair value measurement. The effective date of the ASU is for interim and annual periods beginning after December 15, 2011. At this time, management is evaluating the implications of this guidance and the impact it will have on the financial statement amounts and footnote disclosures, if any.
9. Subsequent Events
Regulatory Matters
Subsequent to the reporting period, Nuveen Securities, LLC (“Nuveen Securities”) entered into a settlement with the Financial Industry Regulatory Authority (“FINRA”) with respect to certain allegations regarding Nuveen-sponsored closed-end fund ARPS marketing brochures. As part of this settlement, Nuveen Securities neither admitted to nor denied FINRA’s allegations. Nuveen Securities is the broker-dealer subsidiary of Nuveen.
The settlement with FINRA concludes an investigation that followed the widespread failure of auctions for ARPS and other auction rate securities, which generally began in mid-February 2008. In the settlement, FINRA alleged that certain marketing materials provided by Nuveen Securities were false and misleading. Nuveen Securities agreed to a censure and the payment of a $3 million fine.
| Nuveen Investments | 107 |
Board Approval of Sub-Advisory
Arrangements (Unaudited)
At a meeting held on May 25-26, 2010 (the “May Meeting”), the Boards of Trustees or Directors (as the case may be) (each, a “Board” and each Trustee or Director, a “Board Member”) of the Funds, including a majority of the Board Members who are not parties to the advisory agreements or “interested persons” of any parties (the “Independent Board Members”), considered and approved the advisory agreements (each, an “Advisory Agreement”) between each Fund and Nuveen Asset Management (the “Adviser”). Since the May Meeting, Nuveen has engaged in an internal restructuring (the “Restructuring”) pursuant to which the portfolio management services provided by the Adviser to the Funds were transferred to Nuveen Asset Management, LLC (“NAM LLC”), a newly-organized wholly-owned subsidiary of the Adviser and the Adviser changed its name to Nuveen Fund Advisors, Inc. (“NFA”). The Adviser, under its new name NFA, continues to serve as investment adviser to the Funds and, in that capacity, will continue to provide various oversight, administrative, compliance and other services. To effectuate the foregoing, NFA entered into sub-advisory agreements with NAM LLC on behalf of the Funds (each, a “Sub-Advisory Agreement”). Under each Sub-Advisory Agreement, NAM LLC, subject to the oversight of NFA and the Board, will furnish an investment program, make investment decisions for, and place all orders for the purchase and sale of securities for the portion of the respective Fund’s investment portfolio allocated to it by NFA. There have been no changes to the advisory fees paid by the Funds; rather, NFA will pay a portion of the investment advisory fee it receives to NAM LLC for its sub-advisory services. The Independent Board Members reviewed the allocation of fees between NFA and NAM LLC. NFA and NAM LLC do not anticipate any reduction in the nature or level of services provided to the Funds following the Restructuring. The personnel of NFA who engaged in portfolio management activities prior to the spinoff of NAM LLC are not expected to materially change as a result of the spinoff. In light of the foregoing, at a meeting held on November 16-18, 2010, the Board Members, including a majority of the Independent Board Members, approved the Sub-Advisory Agreements on behalf of the Funds. Given that the Restructuring was not expected to reduce the level or nature of services provided and the advisory fees paid by the Funds were the same, the factors considered and determinations made at the May Meeting in approving the Advisory Agreements were equally applicable to the approval of the Sub-Advisory Agreements. For a discussion of these considerations, please see the shareholder report of the Funds that was first issued after the May Meeting for the period including May 2010.
| 108 | Nuveen Investments |
Reinvest Automatically,
Easily and Conveniently
Nuveen makes reinvesting easy. A phone call is all it takes to set up your reinvestment account.
Nuveen Closed-End Funds Automatic Reinvestment Plan
Your Nuveen Closed-End Fund allows you to conveniently reinvest distributions in additional Fund shares.
By choosing to reinvest, you’ll be able to invest money regularly and automatically, and watch your investment grow through the power of compounding. Just like distributions in cash, there may be times when income or capital gains taxes may be payable on distributions that are reinvested.
It is important to note that an automatic reinvestment plan does not ensure a profit, nor does it protect you against loss in a declining market.
Easy and convenient
To make recordkeeping easy and convenient, each month you’ll receive a statement showing your total distributions, the date of investment, the shares acquired and the price per share, and the total number of shares you own.
How shares are purchased
The shares you acquire by reinvesting will either be purchased on the open market or newly issued by the Fund. If the shares are trading at or above net asset value at the time of valuation, the Fund will issue new shares at the greater of the net asset value or 95% of the then-current market price. If the shares are trading at less than net asset value, shares for your account will be purchased on the open market. If the Plan Agent begins purchasing Fund shares on the open market while shares are trading below net asset value, but the Fund’s shares subsequently trade at or above their net asset value before the Plan Agent is able to complete its purchases, the Plan Agent may cease open-market purchases and may invest the uninvested portion of the distribution in newly-issued Fund shares at a price equal to the greater of the shares’ net asset value or 95% of the shares’ market value on the last business day immediately prior to the purchase date. Distributions received to purchase shares in the open market will normally be invested shortly after the distribution payment date. No interest will be paid on distributions awaiting reinvestment. Because the market price of the shares may increase before purchases are completed, the average purchase price per share may
| Nuveen Investments | 109 |
Reinvest Automatically
Easily and Conveniently (continued)
exceed the market price at the time of valuation, resulting in the acquisition of fewer shares than if the distribution had been paid in shares issued by the Fund. A pro rata portion of any applicable brokerage commissions on open market purchases will be paid by Plan participants. These commissions usually will be lower than those charged on individual transactions.
Flexible
You may change your distribution option or withdraw from the Plan at any time, should your needs or situation change.
You can reinvest whether your shares are registered in your name, or in the name of a brokerage firm, bank, or other nominee. Ask your investment advisor if his or her firm will participate on your behalf. Participants whose shares are registered in the name of one firm may not be able to transfer the shares to another firm and continue to participate in the Plan.
The Fund reserves the right to amend or terminate the Plan at any time. Although the Fund reserves the right to amend the Plan to include a service charge payable by the participants, there is no direct service charge to participants in the Plan at this time.
Call today to start reinvesting distributions
For more information on the Nuveen Automatic Reinvestment Plan or to enroll in or withdraw from the Plan, speak with your financial advisor or call us at (800) 257-8787.
| 110 | Nuveen Investments |
Glossary of Terms
Used in this Report
| ■ | Auction Rate Bond: An auction rate bond is a security whose interest payments are adjusted periodically through an auction process, which process typically also serves as a means for buying and selling the bond. Auctions that fail to attract enough buyers for all the shares offered for sale are deemed to have “failed,” with current holders receiving a formula-based interest rate until the next scheduled auction. |
| ■ | Average Annual Total Return: This is a commonly used method to express an investment’s performance over a particular, usually multi-year time period. It expresses the return that would have been necessary each year to equal the investment’s actual cumulative performance (including change in NAV or market price and reinvested dividends and capital gains distributions, if any) over the time period being considered. |
| ■ | Average Effective Maturity: The market-value-weighted average of the effective maturity dates of the individual securities including cash. In the case of a bond that has been advance-refunded to a call date, the effective maturity is the date on which the bond is scheduled to be redeemed using the proceeds of an escrow account. In most other cases the effective maturity is the stated maturity date of the security. |
| ■ | Inverse Floaters: Inverse floating rate securities, also known as inverse floaters, are created by depositing a municipal bond, typically with a fixed interest rate, into a special purpose trust created by a broker-dealer. This trust, in turn, (a) issues floating rate certificates typically paying short-term tax-exempt interest rates to third parties in amounts equal to some fraction of the deposited bond’s par amount or market value, and (b) issues an inverse floating rate certificate (sometimes referred to as an “inverse floater”) to an investor (such as a Fund) interested in gaining investment exposure to a long-term municipal bond. The income received by the holder of the inverse floater varies inversely with the short-term rate paid to the floating rate certificates’ holders, and in most circumstances the holder of the inverse floater bears substantially all of the underlying bond’s downside investment risk. The holder of the inverse floater typically also benefits disproportionately from any potential appreciation of the underlying bond’s value. Hence, an inverse floater essentially represents an investment in the underlying bond on a leveraged basis. |
| ■ | Leverage: Using borrowed money to invest in securities or other assets. |
| Nuveen Investments | 111 |
Glossary of Terms
Used in this Report (continued)
| ■ | Leverage-Adjusted Duration: Duration is a measure of the expected period over which a bond’s principal and interest will be paid, and consequently is a measure of the sensitivity of a bond’s or bond Fund’s value to changes when market interest rates change. Generally, the longer a bond’s or Fund’s duration, the more the price of the bond or Fund will change as interest rates change. Leverage-adjusted duration takes into account the leveraging process for a Fund and therefore is longer than the duration of the Fund’s portfolio of bonds. |
| ■ | Market Yield (also known as Dividend Yield or Current Yield): An investment’s current annualized dividend divided by its current market price. |
| ■ | Net Asset Value (NAV): A Fund’s NAV per common share is calculated by subtracting the liabilities of the Fund (including any Preferred shares issued in order to leverage the Fund) from its total assets and then dividing the remainder by the number of common shares outstanding. Fund NAVs are calculated at the end of each business day. |
| ■ | Pre-Refunding: Pre-Refunding, also known as advanced refundings or refinancings, is a procedure used by state and local governments to refinance municipal bonds to lower interest expenses. The issuer sells new bonds with a lower yield and uses the proceeds to buy U.S. Treasury securities, the interest from which is used to make payments on the higher-yielding bonds. Because of this collateral, pre-refunding generally raises a bond’s credit rating and thus its value. |
| ■ | Structural Leverage: Structural Leverage consists of preferred shares or debt issued by the fund. Both of these are part of a fund’s capital structure. Structural leverage is sometimes referred to as “‘40 Act Leverage” and is subject to asset coverage limits set in the Investment Company Act of 1940. |
| ■ | Taxable-Equivalent Yield: The yield necessary from a fully taxable investment to equal, on an after-tax basis, the yield of a municipal bond investment. |
| ■ | Zero Coupon Bond: A zero coupon bond does not pay a regular interest coupon to its holders during the life of the bond. Tax-exempt income to the holder of the bond comes from accretion of the difference between the original purchase price of the bond at issuance and the par value of the bond at maturity and is effectively paid at maturity. The market prices of zero coupon bonds generally are more volatile than the market prices of bonds that pay interest periodically. |
| 112 | Nuveen Investments |
Notes
| Nuveen Investments | 113 |
Notes
| 114 | Nuveen Investments |
Other Useful Information
Board of
Directors/Trustees
John P. Amboian
Robert P. Bremner
Jack B. Evans
William C. Hunter
David J. Kundert
William J. Schneider
Judith M. Stockdale
Carole E. Stone
Virginia L. Stringer
Terence J. Toth
Fund Manager
Nuveen Fund Advisors, Inc.
333 West Wacker Drive
Chicago, IL 60606
Custodian
State Street Bank
& Trust Company
Boston, MA
Transfer Agent and
Shareholder Services
State Street Bank & Trust
Company
Nuveen Funds
P.O. Box 43071
Providence, RI 02940-3071
(800) 257-8787
Legal Counsel
Chapman and Cutler LLP
Chicago, IL
Independent Registered
Public Accounting Firm
Ernst & Young LLP
Chicago, IL
Quarterly Portfolio of Investments and Proxy Voting Information
You may obtain (i) each Fund’s quarterly portfolio of investments, (ii) information regarding how the Funds voted proxies relating to portfolio securities held during the most recent twelve-month period ended June 30, and (iii) a description of the policies and procedures that the Funds used to determine how to vote proxies relating to portfolio securities without charge, upon request, by calling Nuveen Investments toll-free at (800) 257-8787 or on Nuveen’s website at www.nuveen.com.
You may also obtain this and other Fund information directly from the Securities and Exchange Commission (SEC). The SEC may charge a copying fee for this information. Visit the SEC on-line at http://www.sec.gov or in person at the SEC’s Public Reference Room in Washington, D.C. Call the SEC at (202) 942-8090 for room hours and operation. You may also request Fund information by sending an e-mail request to publicinfo@sec.gov or by writing to the SEC’s Public References Section at 100 F Street NE, Washington, D.C. 20549.
CEO Certification Disclosure
Each Fund’s Chief Executive Officer (CEO) has submitted to the New York Stock Exchange (NYSE) the annual CEO certification as required by Section 303A.12(a) of the NYSE Listed Company Manual.
Each Fund has filed with the SEC the certification of its Chief Executive Officer and Chief Financial Officer required by Section 302 of the Sarbanes-Oxley Act.
Common and Preferred Share Information
Each Fund intends to repurchase and/or redeem shares of its own common and/or auction rate preferred stock in the future at such times and in such amounts as is deemed advisable. During the period covered by this report, the Funds repurchased and/or redeemed shares of their common and/or auction rate preferred stock as shown in the accompanying table.
| Fund | Common Shares Repurchased | Auction Rate Preferred Shares Redeemed |
| NQI | — | 9,568 |
| NIO | — | 26,593 |
| NIF | — | 5,205 |
| NPX | — | — |
| NVG | — | — |
| NEA | — | — |
Any future repurchases and/or redemptions will be reported to shareholders in the next annual or semi-annual report.
| Nuveen Investments | 115 |
Nuveen Investments:
Serving Investors for Generations
Since 1898, financial advisors and their clients have relied on Nuveen Investments to provide dependable investment solutions through continued adherence to proven, long-term investing principles. Today, we offer a range of high quality equity and fixed-income solutions designed to be integral components of a well-diversified core portfolio.
Focused on meeting investor needs.
Nuveen Investments is a global investment management firm that seeks to help secure the long-term goals of institutions and high net worth investors as well as the consultants and financial advisors who serve them. We market our growing range of specialized investment solutions under the high-quality brands of HydePark, NWQ, Nuveen Asset Management, Santa Barbara, Symphony, Tradewinds and Winslow Capital. In total, Nuveen Investments managed approximately $206 billion of assets as of March 31, 2011.
Find out how we can help you.
To learn more about how the products and services of Nuveen Investments may be able to help you meet your financial goals, talk to your financial advisor, or call us at (800) 257-8787. Please read the information provided carefully before you invest. Investors should consider the investment objective and policies, risk considerations, charges and expenses of any investment carefully. Where applicable, be sure to obtain a prospectus, which contains this and other relevant information. To obtain a prospectus, please contact your securities representative or Nuveen Investments, 333 W. Wacker Dr., Chicago, IL 60606. Please read the prospectus carefully before you invest or send money.
Learn more about Nuveen Funds at: www.nuveen.com/cef
Nuveen makes things e-simple. It only takes a minute to sign up for e-Reports. Once enrolled, you’ll receive an e-mail as soon as your Nuveen Fund information is ready - no more waiting for delivery by regular mail. Just click on the link within the e-mail to see the report and save it on your computer if you wish. Free e-Reports right to your e-mail! www.investordelivery.com If you receive your Nuveen Fund distributions and statements from your financial advisor or brokerage account. OR www.nuveen.com/accountaccess If you receive your Nuveen Fund distributions and statements directly from Nuveen. |
Distributed by
Nuveen Securities, LLC
333 West Wacker Drive
Chicago, IL 60606
www.nuveen.com
ESA-D-0411D
ITEM 2. CODE OF ETHICS.
Not applicable to this filing.
ITEM 3. AUDIT COMMITTEE FINANCIAL EXPERT.
Not applicable to this filing.
ITEM 4. PRINCIPAL ACCOUNTANT FEES AND SERVICES.
Not applicable to this filing.
ITEM 5. AUDIT COMMITTEE OF LISTED REGISTRANTS.
Not applicable to this filing.
ITEM 6. SCHEDULE OF INVESTMENTS.
(a) See Portfolio of Investments in Item 1.
(b) Not applicable.
ITEM 7. DISCLOSURE OF PROXY VOTING POLICIES AND PROCEDURES FOR CLOSED-END MANAGEMENT INVESTMENT COMPANIES.
Not applicable to this filing.
ITEM 8. PORTFOLIO MANAGERS OF CLOSED-END MANAGEMENT INVESTMENT COMPANIES.
Not applicable to this filing.
ITEM 9. PURCHASES OF EQUITY SECURITIES BY CLOSED-END MANAGEMENT INVESTMENT COMPANY AND AFFILIATED PURCHASERS.
Not applicable.
ITEM 10. SUBMISSION OF MATTERS TO A VOTE OF SECURITY HOLDERS.
There have been no material changes to the procedures by which shareholders may recommend nominees to the registrant's Board of Directors or Trustees implemented after the registrant last provided disclosure in response to this Item.
ITEM 11. CONTROLS AND PROCEDURES.
| (a) | The registrant's principal executive and principal financial officers, or persons performing similar functions, have concluded that the registrant's disclosure controls and procedures (as defined in Rule 30a-3(c) under the Investment Company Act of 1940, as amended (the "1940 Act") (17 CFR 270.30a-3(c))) are effective, as of a date within 90 days of the filing date of this report that includes the disclosure required by this paragraph, based on their evaluation of the controls and procedures required by Rule 30a-3(b) under the 1940 Act (17 CFR 270.30a-3(b)) and Rules 13a-15(b) or 15d-15(b) under the Securities Exchange Act of 1934, as amended (the "Exchange Act")(17 CFR 240.13a-15(b) or 240.15d-15(b)). |
| (b) | There were no changes in the registrant's internal control over financial reporting (as defined in Rule 30a-3(d) under the 1940 Act (17 CFR 270.30a-3(d)) that occurred during the second fiscal quarter of the period covered by this report that has materially affected, or is reasonably likely to materially affect, the registrant's internal control over financial reporting. |
ITEM 12. EXHIBITS.
File the exhibits listed below as part of this Form.
| (a)(1) | Any code of ethics, or amendment thereto, that is the subject of the disclosure required by Item 2, to the extent that the registrant intends to satisfy the Item 2 requirements through filing of an exhibit: Not applicable to this filing. |
| (a)(2) | A separate certification for each principal executive officer and principal financial officer of the registrant as required by Rule 30a-2(a) under the 1940 Act (17 CFR 270.30a-2(a)) in the exact form set forth below: See Ex-99.CERT attached hereto. |
| (a)(3) | Any written solicitation to purchase securities under Rule 23c-1 under the 1940 Act (17 CFR 270.23c-1) sent or given during the period covered by the report by or on behalf of the registrant to 10 or more persons: Not applicable. |
| (b) | If the report is filed under Section 13(a) or 15(d) of the Exchange Act, provide the certifications required by Rule 30a-2(b) under the 1940 Act (17 CFR 270.30a-2(b)); Rule 13a-14(b) or Rule 15d-14(b) under the Exchange Act (17 CFR 240.13a-14(b) or 240.15d-14(b)), and Section 1350 of Chapter 63 of Title 18 of the United States Code (18 U.S.C. 1350) as an exhibit. A certification furnished pursuant to this paragraph will not be deemed "filed" for purposes of Section 18 of the Exchange Act (15 U.S.C. 78r), or otherwise subject to the liability of that section. Such certification will not be deemed to be incorporated by reference into any filing under the Securities Act of 1933 or the Exchange Act, except to the extent that the registrant specifically incorporates it by reference: See Ex-99.906 CERT attached hereto. |
SIGNATURES
Pursuant to the requirements of the Securities Exchange Act of 1934 and the Investment Company Act of 1940, the registrant has duly caused this report to be signed on its behalf by the undersigned, thereunto duly authorized.
(Registrant) Nuveen Insured Tax-Free Advantage Municipal Fund
By (Signature and Title) /s/ Kevin J. McCarthy
Kevin J. McCarthy
(Vice President and Secretary)
Date: July 8, 2011
Pursuant to the requirements of the Securities Exchange Act of 1934 and the Investment Company Act of 1940, this report has been signed below by the following persons on behalf of the registrant and in the capacities and on the dates indicated.
By (Signature and Title) /s/ Gifford R. Zimmerman
Gifford R. Zimmerman
Chief Administrative Officer
(principal executive officer)
Date: July 8, 2011
By (Signature and Title) /s/ Stephen D. Foy
Stephen D. Foy
Vice President and Controller
(principal financial officer)
Date: July 8, 2011