Washington, D.C. 20549
Kevin J. McCarthy
Form N-CSR is to be used by management investment companies to file reports with the Commission not later than 10 days after the transmission to stockholders of any report that is required to be transmitted to stockholders under Rule 30e-1 under the Investment Company Act of 1940 (17 CFR 270.30e-1). The Commission may use the information provided on Form N-CSR in its regulatory, disclosure review, inspection, and policymaking roles.
A registrant is required to disclose the information specified by Form N-CSR, and the Commission will make this information public. A registrant is not required to respond to the collection of information contained in Form N-CSR unless the Form displays a currently valid Office of Management and Budget ("OMB") control number. Please direct comments concerning the accuracy of the information collection burden estimate and any suggestions for reducing the burden to Secretary, Securities and Exchange Commission, 450 Fifth Street, NW, Washington, DC 20549-0609. The OMB has reviewed this collection of information under the clearance requirements of 44 U.S.C. ss. 3507.
ITEM 1. REPORTS TO STOCKHOLDERS.
On April 14, 2014, TIAA-CREF announced that it had entered into an agreement to acquire Nuveen Investments, the parent company of your fund’s investment adviser, Nuveen Fund Advisors, LLC (“NFAL”) and the Nuveen affiliates that act as sub-advisers to the majority of the Nuveen Funds. TIAA-CREF is a national financial services organization with approximately $569 billion in assets under management (as of March 31, 2014) and is a leading provider of retirement services in the academic, research, medical and cultural fields. Nuveen anticipates that it will operate as a separate subsidiary within TIAA-CREF’s asset management business, and that its current leadership and key investment teams will stay in place.
Your fund investment will not change as a result of Nuveen’s change of ownership. You will still own the same fund shares and the underlying value of those shares will not change as a result of the transaction. NFAL and your fund’s sub-adviser(s) will continue to manage your fund according to the same objectives and policies as before, and we do not anticipate any significant changes to your fund’s operations. Under the securities laws, the consummation of the transaction will result in the automatic termination of the investment management agreements between the funds and NFAL and the investment sub-advisory agreements between NFAL and each fund’s sub-adviser(s). New agreements will be presented to the funds’ shareholders for approval, and, if approved, will take effect upon consummation of the transaction or such later time as shareholder approval is obtained.
The transaction, expected to be completed by year end, is subject to customary closing conditions.
After significant growth in 2013, domestic and international equity markets have been less compelling during the first part of 2014. Concerns about deflation, political uncertainty in many places and the potential for more fragile economies to impact other countries have produced uncertainty in the markets.
Europe is beginning to emerge slowly from recession in mid-2013, with improved GDP and employment trends in some countries. However, Japan’s deflationary headwinds have resurfaced; and China shows signs of slowing from credit distress combined with declines in manufacturing and exports. Most recently, tensions between Russia and Ukraine may continue to hold back stocks and support government bonds in the near term.
Despite these headwinds, there are some encouraging signs of forward momentum in the markets. In the U.S., the news is more positive with financial risks slowly receding, positive GDP trends, downward trending unemployment and stronger household finances and corporate spending.
It is in such changeable markets that professional investment management is most important. Investment teams who have experienced challenging markets in the past understand how their asset class can behave in rapidly changing times. Remaining committed to their investment disciplines during these times is a critical component to achieving long-term success. In fact, many strong investment track records are established during challenging periods because experienced investment teams understand that volatile markets place a premium on companies and investment ideas that can weather the short-term volatility. By maintaining appropriate time horizons, diversification and relying on practiced investment teams, we believe that investors can achieve their long-term investment objectives.
As always, I encourage you to communicate with your financial consultant if you have any questions about your investment in a Nuveen Fund. On behalf of the other members of the Nuveen Fund Board, we look forward to continuing to earn your trust in the months and years ahead.
William J. Schneider
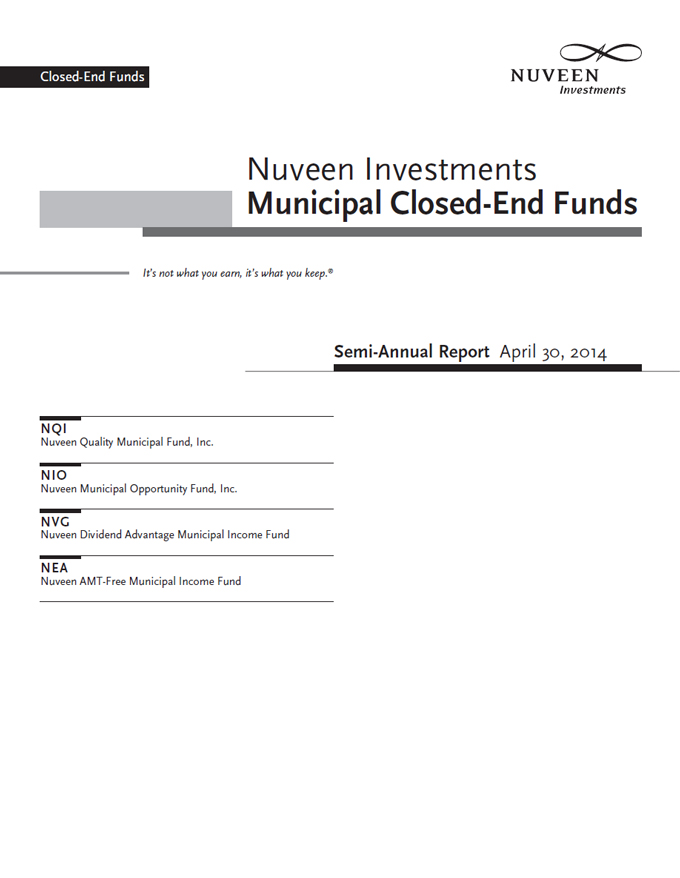
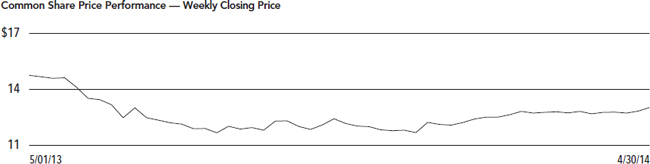
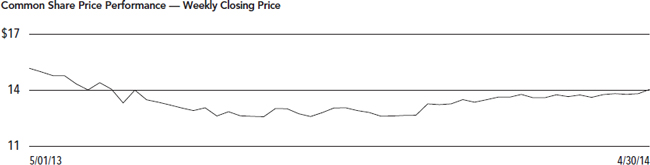
Nuveen Quality Municipal Fund, Inc. (NQI)
Nuveen Municipal Opportunity Fund, Inc. (NIO)
These Funds feature management by Nuveen Asset Management, LLC, an affiliate of Nuveen Investments. Portfolio managers Paul L. Brennan, CFA, and Douglas J. White, CFA, review key investment strategies and the six-month performance of these four national Funds. Paul has managed NIO, NVG and NEA since 2006 and Douglas assumed portfolio management responsibility for NQI in 2011.
What key strategies were used to manage these Funds during the six-month reporting period ended April 30, 2014?
During this reporting period, we saw the municipal market environment shift from volatility to a more stable atmosphere. As 2014 began, the selling pressure that had been triggered last summer by uncertainty about the Federal Reserve’s (Fed) next steps and headline credit stories involving Detroit and Puerto Rico gave way to increased flows into municipal bond funds, as the Fed remained accommodative and municipal credit fundamentals continued to improve. Municipal bonds rebounded, driven by stronger demand and declining supply. For the reporting period as a whole, municipal bonds nationwide generally produced positive total returns. During this time, we continued to take a bottom-up approach to discovering sectors that appeared undervalued as well as individual credits that had the potential to perform well over the long term and helped keep our Funds fully invested.
Despite the challenging environment created by the 20% decrease in municipal bond new issuance during this reporting period, we continued to find opportunities to purchase municipal bonds that helped achieve our goals for the Funds. During this reporting period, NIO, NVG and NEA found value in diversified areas of the market, particularly transportation, higher education, health care and general obligation (GO) bonds. One of our additions in the transportation sector was a new BBB-rated issue from the Foothill/Eastern Transportation Corridor Agency (F/ETCA) in California, which we purchased at attractive prices in December 2013. In one of the largest fixed-rate municipal transactions of 2013, F/ETCA refinanced $2.3 billion in outstanding debt originally issued in 1999. The refinancing extended the agency’s debt from 2040 to 2053, lowered annual payments through 2040 and reduced the maximum annual debt payment. Traffic and revenues on the tollroads in F/ETCA’s 36-mile network, which links major
Ratings shown are the highest rating given by one of the following national rating agencies: Standard & Poor’s (S&P), Moody’s Investors Service, Inc. (Moody’s) or Fitch, Inc. (Fitch) Credit ratings are subject to change. AAA, AA, A and BBB are investment grade ratings; BB, B, CCC, CC, C and D are below investment grade ratings. Certain bonds backed by U.S. government or agency securities are regarded as having an implied rating equal to the rating of such securities. Holdings designated N/R are not rated by these national rating agencies.
Bond insurance guarantees only the payment of principal and interest on the bond when due, and not the value of the bonds themselves, which will fluctuate with the bond market and the financial success of the issuer and the insurer. Insurance relates specifically to the bonds in the portfolio and not to the share prices of a Fund. No representation is made as to the insurers’ ability to meet their commitments.
population centers in Southern California, have increased, and the bonds have performed well for the Funds since purchase. Also in the transportation sector, these three Funds added a new BBB-rated bond offering for the Downtown Crossing bridge across the Ohio River from Indiana to Louisville, Kentucky and NIO and NEA purchased bonds for the Tampa Hillsborough County Expressway Authority in Florida. In higher education, we added bonds issued for Nova Southeastern University and Hodges University, all in Florida and St. Louis College of Pharmacy in Missouri. During this reporting period, we also purchased bonds issued by Catholic Health Initiative, a national non-profit health system that operates hospitals and long-term care facilities in 17 states, for facilities in Colorado and Tennessee. In addition, we increased our exposure to GO bonds issued by the state of Illinois in NIO and NEA. Despite the state’s well-publicized fiscal difficulties, we believe Illinois has taken small positive steps to begin addressing these problems and these holdings have performed well.
In NQI, we also were active in areas where we saw value, including transportation, essential services, education and GOs. In addition, we selectively increased our exposure to health care. Among our purchases in the essential services area were bonds issued for the Central Valley Project, a federal water management project that provides irrigation and municipal water to California’s Central Valley by regulating and storing water in the northern half of the state and transporting it to the San Joaquin Valley and surrounding areas. Overall, the additions to NQI were well diversified geographically, including education credits in Texas and Minnesota, transportation bonds in Illinois and New Jersey and GOs in California, Kansas and North Carolina. Another area of focus during this reporting period was duration management. During the prior reporting period, NQI’s duration had extended beyond its target range as a natural consequence of reinvesting the proceeds from bonds called as part of current refundings. These bonds were priced to short calls and therefore had negligible durations; consequently, reinvesting their proceeds in anything other than cash had the effect of extending NQI’s duration. As a result, many of our purchases during this reporting period involved bonds with intermediate maturities to bring NQI’s duration closer to its benchmark.
Also during this reporting period, S&P upgraded its credit rating on National Public Finance Guarantee Corp. (NPFG), the insurance subsidiary of MBIA, to AA- from A, citing NPFG’s strong operating performance and competitive position in the financial guarantee market. As a result, the ratings on the Funds’ holdings of bonds backed by insurance from NPFG were similarly upgraded to AA-rated as of mid-March 2014. This action produced an increase in the percentage of our portfolios held in the AA-rated credit quality category (and a corresponding decrease in the A-rated category), improving the overall credit quality of the Funds. During this reporting period, S&P also upgraded its rating on Assured Guaranty Municipal (AGM) as well as AGM’s municipal-only insurer Municipal Assurance Corp. to AA from AA-.
Cash for new purchases during this reporting period was generated primarily by the proceeds from called and matured bonds, which we worked to redeploy to keep the Funds fully invested and support their income streams. The Funds also engaged in some light selling for cashflow management purposes or to take advantage of attractive prices for some of the Funds’ holdings.
As of April 30, 2014, all four of these Funds continued to use inverse floating rate securities. We employ inverse floaters for a variety of reasons, including duration management, income enhancement and total return enhancement. As part of our duration management strategies, NEA also found it necessary to add an interest rate swap to reduce price volatility risk to movements in U.S. interest rates relative to the Fund’s benchmark. This derivative functioned as intended and remained in place at the end of the reporting period.
How did the Funds perform during the six-month reporting period ended April 30, 2014?
The tables in each Fund’s Performance Overview and Holding Summaries section of this report provide the Funds’ total returns for the six-month, one-year, five-year and ten-year periods ended April 30, 2014. Each Fund’s total returns at net asset value (NAV) are compared with the performance of a corresponding market index and Lipper classification average.
For the six months ended April 30, 2014, the total returns at NAV for all four of these Funds exceeded the return for the national S&P Municipal Bond Index. For the same period, the Funds underperformed the average return for the Lipper General & Insured Leveraged Municipal Debt Funds Classification Average.
Key management factors that influenced the Funds’ returns during this reporting period included duration and yield curve positioning, credit exposure and sector allocation. In addition, the use of regulatory leverage was an important positive factor affecting the Funds’ performance. Leverage is discussed in more detail in the Fund Leverage section of this report.
As interest rates on longer bonds slipped and the yield curve flattened during this period, municipal bonds with longer maturities generally outperformed those with shorter maturities. Overall, credits with long-intermediate maturities (15 years and longer) outperformed the municipal market as a whole, while bonds at the shortest end of the municipal yield curve produced the weakest results. In general, the Funds’ durations and yield curve positioning were the key contributors to their performance. Consistent with our long-term strategy, these Funds tended to have longer durations than the municipal market in general, with overweightings in the longer parts of the yield curve that performed well and underweightings in the underperforming shorter end of the curve. This was beneficial for the Funds’ performance during this reporting period. Performance differentials among the Funds can be largely ascribed to individual differences in duration and yield curve positioning. Overall, NVG was the most advantageously positioned in terms of duration and yield curve, while NIO had the shortest duration among the four Funds. In NEA, as previously described, we added an interest rate swap to reduce the Fund’s duration, which had exceeded its target. Because the swap reduced NEA’s duration, it detracted somewhat from the Fund’s performance.
Credit exposure was another key factor in the Funds’ performance during this six-month reporting period. In general, lower rated bonds were rewarded as the environment shifted from selloff to rally, investors became more risk-tolerant and credit spreads, or the difference in yield spreads between U.S. Treasury securities and comparable investments such as municipal bonds, narrowed. Overall, A-rated credits and lower outperformed those AAA and AA-rated credits. Each of these Funds benefited from its lower rated holdings during this reporting period. This was particularly true in NVG and NEA, which had the largest allocations of A-rated bonds and lower.
For the reporting period, revenue bonds generally outperformed tax-supported bonds as well as the municipal market as a whole. Top performers included the industrial development revenue (IDR) and health care sectors. In addition, transportation (especially lower rated tollroad issues), water and sewer, education and housing credits generally outperformed the municipal market return. All four Funds had double-digit weightings in the health care and transportation sectors, with NEA having the heaviest health care exposure and NIO having the heaviest exposure to transportation. Tobacco credits backed by the 1998 master tobacco settlement agreement also were among the best performing market sectors, due in part to their longer effective durations and lower credit quality. NIO, NVG and NEA were overweight in tobacco bonds, while NQI did not hold any tobacco credits.
In contrast, pre-refunded bonds, which are often backed by U.S. Treasury securities, were among the weaker performers. The underperformance of these bonds relative to the market can be attributed primarily to their shorter effective maturities and higher credit quality. Because of the quality and higher yields offered by pre-refunded bonds, we continued to hold these bonds and the Funds tended to be overweighted in this category, with NVG having the largest exposure and NEA the smallest. Utilities and GO bonds also trailed the market for the reporting period, although by a substantially smaller margin than the pre-refunded category.
Shareholders also should be aware of two events in the broader municipal bond market that continued to have an impact on the Funds’ holdings and performance: the City of Detroit’s ongoing bankruptcy proceedings and the downgrade of ratings on Puerto Rico GO bonds and related debt to below investment grade. Burdened by decades of population loss, changes in the auto manufacturing industry, and significant tax base deterioration, the City of Detroit filed for Chapter 9 in federal bankruptcy court in July 2013. Given the complexity of its debt portfolio, number of creditors, numerous union contracts, and significant legal questions that must be addressed, Detroit’s bankruptcy filing is expected to be a lengthy one. All of these Funds except NQI had allocations of Detroit water and sewer credits, which are supported by revenue streams generated by service fees. Some of these holdings also were insured. In addition, NIO held positions in insured Detroit GO bonds and insured Detroit City School District credits; the school bonds are not part of the Detroit bankruptcy.
In Puerto Rico, the commonwealth’s continued economic weakening, escalating debt service obligations and long-standing inability to deliver a balanced budget led to several downgrades on its debt. Following the most recent round of rating reductions in February 2014, Moody’s, S&P and Fitch Ratings rated Puerto Rico GO debt at Ba2/BB+/BB, respectively, with negative outlooks. Ratings on sales tax bonds issued by the Puerto Rico Sales Tax Financing Corporation (COFINA) also have been lowered, with senior sales tax revenue bonds rated Baa1/AA-/AA- and subordinate sales tax revenue bonds rated Baa2/A+/A+ by Moody’s, S&P and Fitch, respectively, as of April 2014. The COFINA bonds were able to maintain a higher credit rating than the GOs because, unlike the revenue streams supporting some Puerto Rican issues, the sales taxes supporting the COFINA bonds cannot be diverted and used to support Puerto Rico’s GO bonds.
For the reporting period ended April 30, 2014, Puerto Rico paper underperformed the municipal market as a whole. During this reporting period, these four Funds had limited exposures to Puerto Rico bonds of less than 1% to 2%. The effect on performance from their Puerto Rico holdings differed from Fund to Fund in line with the type and amount of its position, but on the whole, the small nature of our exposures limited the impact. Puerto Rico bonds were originally added to our portfolios in order to keep assets fully invested and working for the Funds. We found Puerto Rico credits attractive because they offer higher yields, added diversification and triple exemption (i.e., exemption from most federal, state and local taxes).
At period end, the majority of the Funds’ exposure to Puerto Rico consisted of COFINA sales tax credits, issues that were insured or escrowed and other bonds that Nuveen considers to be of higher quality. NQI, NIO, NVG and NEA began the reporting period with portfolio allocations of 1.0%, 0.5%, 0.7% and 1.6% to Puerto Rico, respectively and ended the reporting period with an exposure to Puerto Rico of 0.7%, 0.4%, 0.5% and 1.6%, respectively. We believe that our decision to maintain limited exposure to Puerto Rico bonds will enable us to participate in any future upside for the commonwealth’s obligations.
One important factor impacting the returns of the Funds relative to their comparative benchmarks was the Funds’ use of leverage through their issuance of preferred shares and/or investments in inverse floating rate securities, which represent leveraged investments in underlying bonds. The Funds use leverage because our research has shown that, over time, leveraging provides opportunities for additional income, particularly in the recent market environment where short-term market rates are at or near historical lows, meaning that the short-term rates the Fund has been paying on its leveraging instruments have been much lower than the interest the Fund has been earning on its portfolio of long-term bonds that it has bought with the proceeds of that leverage. However, use of leverage also can expose the Fund to additional price volatility. When a Fund uses leverage, the Fund will experience a greater increase in its net asset value if the municipal bonds acquired through the use of leverage increase in value, but it will also experience a correspondingly larger decline in its net asset value if the bonds acquired through leverage decline in value, which will make the Fund’s net asset value more volatile, and its total return performance more variable over time. In addition, income in levered funds will typically decrease in comparison to unlevered funds when short-term interest rates increase and increase when short-term interest rates decrease. Leverage made a positive contribution to the performance of these Funds over this reporting period.
As of April 30, 2014, the Funds’ percentages of effective and regulatory leverage are as shown in the accompanying table.
As of April 30, 2014, the Funds have issued and outstanding Variable Rate MuniFund Term Preferred (VMTP) Shares and Variable Rate Demand Preferred (VRDP) Shares as shown in the accompanying table.
During the current reporting period, NVG refinanced all of its outstanding MTP and VMTP Shares with the proceeds from newly issued VRDP Shares. On December 13, 2013, the Fund’s VRDP Shares and NEA refinanced all of its outstanding MTP and VMTP Shares with the proceeds from newly issued VMTP Shares.
Refer to Notes to Financial Statements, Note 1 – General Information and Significant Accounting Policies for further details on MTP, VMTP and VRDP Shares and each Fund’s respective transactions.
The following information regarding the Funds’ distributions is current as of April 30, 2014. Each Fund’s distribution levels may vary over time based on each Fund’s investment activity and portfolio investments value changes.
During the current reporting period, the Funds’ monthly dividends to common shareholders were as shown in the accompanying table.
All of the Funds in this report seek to pay stable dividends at rates that reflect each Fund’s past results and projected future performance. During certain periods, each Fund may pay dividends at a rate that may be more or less than the amount of net investment income actually earned by the Fund during the period. If a Fund has cumulatively earned more than it has paid in dividends, it holds the excess in reserve as undistributed net investment income (UNII) as part of the Fund’s NAV. Conversely, if a Fund has cumulatively paid dividends in excess of its earnings, the excess constitutes negative UNII that is likewise reflected in the Fund’s NAV. Each Fund will, over time, pay all of its net investment income as dividends to shareholders. As of April 30, 2014, all of the Funds in this report had positive UNII balances, based upon our best estimate, for tax purposes and positive UNII balances for financial reporting purposes.
As of April 30, 2014, and since the inception of the Funds’ repurchase programs, the following Funds have cumulatively repurchased and retired their common shares as shown in the accompanying table. Since the inception of the Funds’ repurchase programs, NQI has not repurchased any of its outstanding common shares.
During the current reporting period, the Funds repurchased and retired their common shares at a weighted average price per common share and a weighted average discount per common share as shown in the accompanying table.
As of April 30, 2014, and during the current reporting period, the Funds’ common share prices were trading at a premium/(discount) to their common share NAVs as shown in the accompanying table.
Fund shares are not guaranteed or endorsed by any bank or other insured depository institution, and are not federally insured by the Federal Deposit Insurance Corporation. Past performance is no guarantee of future results. Fund common shares are subject to a variety of risks, including:
Refer to the Glossary of Terms Used in this Report for further definition of the terms used within this section.
Past performance is not predictive of future results. Current performance may be higher or lower than the data shown. Returns do not reflect the deduction of taxes that shareholders may have to pay on Fund distributions or upon the sale of Fund shares. Comparative index and Lipper return information is provided for the Fund’s shares at NAV only. Indexes and Lipper averages are not available for direct investment.
This data relates to the securities held in the Fund’s portfolio of investments as of the end of the reporting period. It should not be construed as a measure of performance for the Fund itself. Holdings are subject to change.
Ratings shown are the highest rating given by one of the following national rating agencies: Standard & Poor’s Group, Moody’s Investors Service, Inc. or Fitch, Inc. Credit ratings are subject to change. AAA, AA, A and BBB are investment grade ratings; BB, B, CCC, CC, C and D are below-investment grade ratings. Certain bonds backed by U.S. Government or agency securities are regarded as having an implied rating equal to the rating of such securities. Holdings designated N/R are not rated by these national rating agencies.
Refer to the Glossary of Terms Used in this Report for further definition of the terms used within this section.
Past performance is not predictive of future results. Current performance may be higher or lower than the data shown. Returns do not reflect the deduction of taxes that shareholders may have to pay on Fund distributions or upon the sale of Fund shares. Comparative index and Lipper return information is provided for the Fund’s shares at NAV only. Indexes and Lipper averages are not available for direct investment.
This data relates to the securities held in the Fund’s portfolio of investments as of the end of the reporting period. It should not be construed as a measure of performance for the Fund itself. Holdings are subject to change.
Ratings shown are the highest rating given by one of the following national rating agencies: Standard & Poor’s Group, Moody’s Investors Service, Inc. or Fitch, Inc. Credit ratings are subject to change. AAA, AA, A and BBB are investment grade ratings; BB, B, CCC, CC, C and D are below-investment grade ratings. Certain bonds backed by U.S. Government or agency securities are regarded as having an implied rating equal to the rating of such securities. Holdings designated N/R are not rated by these national rating agencies.
| Statement of | | |
| | Assets and Liabilities | April 30, 2014 (Unaudited) |
| | | | | | | | | | Dividend | | | AMT-Free | |
| | | | Quality | | | Opportunity | | | Advantage | | | Income | |
| | | | (NQI | ) | | (NIO | ) | | (NVG | ) | | (NEA | ) |
| Assets | | | | | | | | | | | | | |
| Long-term investments, at value (cost $762,027,335, $2,039,728,456, $607,558,225 and $1,577,851,436, respectively) | | $ | 808,537,332 | | $ | 2,162,874,023 | | $ | 650,684,212 | | $ | 1,657,152,008 | |
| Short-term investments, at value (cost $3,003,437, $—, $16,695,000 and $8,485,000, respectively) | | | 3,004,470 | | | — | | | 16,695,000 | | | 8,485,000 | |
| Cash | | | 1,721,293 | | | 6,900,924 | | | 2,849,347 | | | 13,209,895 | |
| Receivable for: | | | | | | | | | | | | | |
| Dividends and interest | | | 12,339,210 | | | 32,668,258 | | | 9,276,573 | | | 24,103,501 | |
| Investments sold | | | 5,740,000 | | | 23,554,479 | | | 1,000,000 | | | 11,928,445 | |
| Deferred offering costs | | | 56,661 | | | 2,957,934 | | | 384,182 | | | 3,062,940 | |
| Other assets | | | 108,381 | | | 726,591 | | | 69,161 | | | 474,037 | |
| Total assets | | | 831,507,347 | | | 2,229,682,209 | | | 680,958,475 | | | 1,718,415,826 | |
| Liabilities | | | | | | | | | | | | | |
| Floating rate obligations | | | 29,590,000 | | | 92,198,333 | | | 18,228,334 | | | 57,495,000 | |
| Unrealized depreciation on interest rate swaps | | | — | | | — | | | — | | | 4,414,736 | |
| Payables: | | | | | | | | | | | | | |
| Common share dividends | | | 2,127,776 | | | 6,386,252 | | | 1,691,814 | | | 5,172,215 | |
| Interest | | | 244,615 | | | — | | | — | | | 128,826 | |
| Investments purchased | | | — | | | 10,454,990 | | | 60,000 | | | 7,528,708 | |
| Offering costs | | | 52,476 | | | — | | | — | | | — | |
| Variable Rate MuniFund Term Preferred (“VMTP”) Shares, at liquidation value | | | 240,400,000 | | | — | | | — | | | 151,000,000 | |
| Variable Rate Demand Preferred (“VRDP”) Shares, at liquidation value | | | — | | | 667,200,000 | | | 201,000,000 | | | 349,900,000 | |
| Accrued expenses: | | | | | | | | | | | | | |
| Management fees | | | 406,534 | | | 1,058,090 | | | 337,547 | | | 831,578 | |
| Directors/Trustees fees | | | 104,370 | | | 274,293 | | | 66,029 | | | 192,395 | |
| Other | | | 146,290 | | | 425,885 | | | 112,955 | | | 290,746 | |
| Total liabilities | | | 273,072,061 | | | 777,997,843 | | | 221,496,679 | | | 576,954,204 | |
| Net assets applicable to common shares | | $ | 558,435,286 | | $ | 1,451,684,366 | | $ | 459,461,796 | | $ | 1,141,461,622 | |
| Common shares outstanding | | | 38,461,871 | | | 95,610,971 | | | 29,641,700 | | | 78,883,061 | |
| Net asset value (“NAV”) per common share outstanding (net assets applicable to | | | | | | | | | | | | | |
| common shares, divided by common shares outstanding) | | $ | 14.52 | | $ | 15.18 | | $ | 15.50 | | $ | 14.47 | |
| Net assets applicable to common shares consist of: | | | | | | | | | | | | | |
| Common shares, $.01 par value per share | | $ | 384,619 | | $ | 956,110 | | $ | 296,417 | | $ | 788,831 | |
| Paid-in surplus | | | 538,134,449 | | | 1,333,837,341 | | | 421,480,730 | | | 1,081,749,211 | |
| Undistributed (Over-distribution of) net investment income | | | 284,591 | | | 16,975,999 | | | 2,228,717 | | | 6,436,600 | |
| Accumulated net realized gain (loss) | | | (26,879,403 | ) | | (23,230,651 | ) | | (7,670,055 | ) | | (22,398,856 | ) |
| Net unrealized appreciation (depreciation) | | | 46,511,030 | | | 123,145,567 | | | 43,125,987 | | | 74,885,836 | |
| Net assets applicable to common shares | | $ | 558,435,286 | | $ | 1,451,684,366 | | $ | 459,461,796 | | $ | 1,141,461,622 | |
| Authorized shares: | | | | | | | | | | | | | |
| Common | | | 200,000,000 | | | 200,000,000 | | | Unlimited | | | Unlimited | |
| Preferred | | | 1,000,000 | | | 1,000,000 | | | Unlimited | | | Unlimited | |
| See accompanying notes to financial statements. |
| Statement of | | |
| | Operations | Six Months Ended April 30, 2014 (Unaudited) |
| | | | | | | | | | Dividend | | | AMT-Free | |
| | | | Quality | | | Opportunity | | | Advantage | | | Income | |
| | | | (NQI | ) | | (NIO | ) | | (NVG | ) | | (NEA | ) |
| Investment Income | | $ | 17,521,474 | | $ | 52,075,444 | | $ | 14,316,501 | | $ | 40,026,340 | |
| Expenses | | | | | | | | | | | | | |
| Management fees | | | 2,408,204 | | | 6,277,280 | | | 1,994,221 | | | 4,925,879 | |
| Shareholder servicing agent fees and expenses | | | 32,359 | | | 44,636 | | | 12,119 | | | 36,494 | |
| Interest expense and amortization of offering costs | | | 1,535,425 | | | 794,692 | | | 2,014,885 | | | 2,037,384 | |
| Liquidity fees | | | — | | | 2,562,444 | | | — | | | 1,624,187 | |
| Remarketing fees | | | — | | | 335,453 | | | — | | | 175,921 | |
| Custodian fees and expenses | | | 58,340 | | | 148,764 | | | 51,699 | | | 123,032 | |
| Directors/Trustees fees and expenses | | | 10,924 | | | 28,987 | | | 9,184 | | | 22,529 | |
| Professional fees | | | 26,235 | | | 58,651 | | | 25,255 | | | 49,717 | |
| Shareholder reporting expenses | | | 29,118 | | | 71,140 | | | 26,535 | | | 61,927 | |
| Stock exchange listing fees | | | 6,217 | | | 15,423 | | | 4,224 | | | 5,709 | |
| Investor relations expenses | | | 44,316 | | | 116,272 | | | 37,393 | | | 92,004 | |
| Other expenses | | | 29,641 | | | 56,899 | | | 27,052 | | | 143,270 | |
| Total expenses | | | 4,180,779 | | | 10,510,641 | | | 4,202,567 | | | 9,298,053 | |
| Net investment income (loss) | | | 13,340,695 | | | 41,564,803 | | | 10,113,934 | | | 30,728,287 | |
| Realized and Unrealized Gain (Loss) | | | | | | | | | | | | | |
| Net realized gain (loss) from investments | | | 167,133 | | | (3,893,807 | ) | | (155,432 | ) | | (2,475,674 | ) |
| Change in net unrealized appreciation (depreciation) of: | | | | | | | | | | | | | |
| Investments | | | 30,049,055 | | | 73,697,448 | | | 27,970,807 | | | 66,721,806 | |
| Swaps | | | — | | | — | | | — | | | (4,414,736 | ) |
| Net realized and unrealized gain (loss) | | | 30,216,188 | | | 69,803,641 | | | 27,815,375 | | | 59,831,396 | |
| Net increase (decrease) in net assets applicable to common shares from operations | | $ | 43,556,883 | | $ | 111,368,444 | | $ | 37,929,309 | | $ | 90,559,683 | |
See accompanying notes to financial statements.
| Statement of | |
| | Changes in Net Assets (Unaudited) |
| | | Quality (NQI) | | Opportunity (NIO) | |
| | | | Six Months | | | | | | Six Months | | | | |
| | | | Ended | | | Year Ended | | | Ended | | | Year Ended | |
| | | | 4/30/14 | | | 10/31/13 | | | 4/30/14 | | | 10/31/13 | |
| Operations | | | | | | | | | | | | | |
| Net investment income (loss) | | $ | 13,340,695 | | $ | 27,675,201 | | $ | 41,564,803 | | $ | 81,048,214 | |
| Net realized gain (loss) from investments | | | 167,133 | | | (1,754,720 | ) | | (3,893,807 | ) | | 4,152,346 | |
| Change in net unrealized appreciation (depreciation) of: | | | | | | | | | | | | | |
| Investments | | | 30,049,055 | | | (59,994,163 | ) | | 73,697,448 | | | (145,584,412 | ) |
| Swaps | | | — | | | — | | | — | | | — | |
| Net increase (decrease) in net assets applicable to common shares from operations | | | 43,556,883 | | | (34,073,682 | ) | | 111,368,444 | | | (60,383,852 | ) |
| Distributions to Common Shareholders | | | | | | | | | | | | | |
| From net investment income | | | (14,503,972 | ) | | (32,423,362 | ) | | (42,336,541 | ) | | (83,755,216 | ) |
| From accumulated net realized gains | | | — | | | — | | | — | | | — | |
| Decrease in net assets applicable to common shares from distributions to common shareholders | | | (14,503,972 | ) | | (32,423,362 | ) | | (42,336,541 | ) | | (83,755,216 | ) |
| Capital Share Transactions | | | | | | | | | | | | | |
| Common shares: | | | | | | | | | | | | | |
| Issued in the reorganizations | | | — | | | — | | | — | | | — | |
| Net proceeds from shares issued to shareholders due to reinvestment of distributions | | | — | | | 139,159 | | | — | | | — | |
| Repurchased and retired | | | — | | | — | | | — | | | — | |
| Net increase (decrease) in net assets applicable to common | | | | | | | | | | | | | |
| shares from capital share transactions | | | — | | | 139,159 | | | — | | | — | |
| Net increase (decrease) in net assets applicable to common shares | | | 29,052,911 | | | (66,357,885 | ) | | 69,031,903 | | | (144,139,068 | ) |
| Net assets applicable to common shares at the beginning of period | | | 529,382,375 | | | 595,740,260 | | | 1,382,652,463 | | | 1,526,791,531 | |
| Net assets applicable to common shares at the end of period | | $ | 558,435,286 | | $ | 529,382,375 | | $ | 1,451,684,366 | | $ | 1,382,652,463 | |
| Undistributed (Over-distribution of) net investment income | | | | | | | | | | | | | |
| at the end of period | | $ | 284,591 | | $ | 1,447,868 | | $ | 16,975,999 | | $ | 17,747,737 | |
See accompanying notes to financial statements.
Statement of Changes in Net Assets (Unaudited) (continued)
| | | Dividend Advantage (NVG) | | AMT-Free Income (NEA) | |
| | | | Six Months | | | | | | Six Months | | | | |
| | | | Ended | | | Year Ended | | | Ended | | | Year Ended | |
| | | | 4/30/14 | | | 10/31/13 | | | 4/30/14 | | | 10/31/13 | |
| Operations | | | | | | | | | | | | | |
| Net investment income (loss) | | $ | 10,113,934 | | $ | 17,883,440 | | $ | 30,728,287 | | $ | 36,496,269 | |
| Net realized gain (loss) from investments | | | (155,432 | ) | | 1,830,780 | | | (2,475,674 | ) | | 1,511,869 | |
| Change in net unrealized appreciation (depreciation) of: | | | | | | | | | | | | | |
| Investments | | | 27,970,807 | | | (45,390,091 | ) | | 66,721,806 | | | (138,067,575 | ) |
| Swaps | | | — | | | — | | | (4,414,736 | ) | | — | |
| Net increase (decrease) in net assets applicable | | | | | | | | | | | | | |
| to common shares from operations | | | 37,929,309 | | | (25,675,871 | ) | | 90,559,683 | | | (100,059,437 | ) |
| Distributions to Common Shareholders | | | | | | | | | | | | | |
| From net investment income | | | (10,114,997 | ) | | (22,017,550 | ) | | (32,436,714 | ) | | (34,943,477 | ) |
| From accumulated net realized gains | | | (1,997,851 | ) | | (3,388,590 | ) | | — | | | — | |
| Decrease in net assets applicable to common shares | | | | | | | | | | | | | |
| from distribution to common shareholders | | | (12,112,848 | ) | | (25,406,140 | ) | | (32,436,714 | ) | | (34,943,477 | ) |
| Capital Share Transactions | | | | | | | | | | | | | |
| Common shares: | | | | | | | | | | | | | |
| Issued in the reorganizations | | | — | | | — | | | — | | | 873,836,287 | |
| Net proceeds from shares issued to shareholders due to reinvestment of distributions | | | — | | | — | | | — | | | 18,775 | |
| Repurchased and retired | | | (1,205,243 | ) | | (817,331 | ) | | — | | | — | |
| Net increase (decrease) in net assets applicable to common | | | | | | | | | | | | | |
| shares from capital share transactions | | | (1,205,243 | ) | | (817,331 | ) | | — | | | 873,855,062 | |
| Net increase (decrease) in net assets applicable to common shares | | | 24,611,218 | | | (51,899,342 | ) | | 58,122,969 | | | 738,852,148 | |
| Net assets applicable to common shares at the beginning of period | | | 434,850,578 | | | 486,749,920 | | | 1,083,338,653 | | | 344,486,505 | |
| Net assets applicable to common shares at the end of period | | $ | 459,461,796 | | $ | 434,850,578 | | $ | 1,141,461,622 | | $ | 1,083,338,653 | |
| Undistributed (Over-distribution of) net investment income at the end of period | | $ | 2,228,717 | | $ | 2,229,780 | | $ | 6,436,600 | | $ | 8,145,027 | |
See accompanying notes to financial statements.
| Statement of | | |
| | Cash Flows | Six Months Ended April 30, 2014 (Unaudited) |
| | | | | | | | | | Dividend | | | AMT-Free | |
| | | | Quality | | | Opportunity | | | Advantage | | | Income | |
| | | | (NQI | ) | | (NIO | ) | | (NVG | ) | | (NEA | ) |
| Cash Flows from Operating Activities: | | | | | | | | | | | | | |
| Net Increase (Decrease) in Net Assets Applicable to Common Shares from Operations | | $ | 43,556,883 | | $ | 111,368,444 | | $ | 37,929,309 | | $ | 90,559,683 | |
| Adjustments to reconcile the net increase (decrease) in net assets applicable to commonshares from operations to net cash provided by (used in)operating activities: | | | | | | | | | | | | | |
| Purchases of investments | | | (56,808,187 | ) | | (90,103,136 | ) | | (49,767,302 | ) | | (105,568,428 | ) |
| Proceeds from sales and maturities of investments | | | 57,861,361 | | | 115,456,459 | | | 28,579,946 | | | 126,015,340 | |
| Proceeds from (Purchases of) short-term investments, net | | | (3,004,470 | ) | | — | | | 3,015,000 | | | (4,260,000 | ) |
| Amortization (Accretion) of premiums and discounts, net | | | 992,493 | | | (517,510 | ) | | 796,605 | | | (1,334,648 | ) |
| (Increase) Decrease in: | | | | | | | | | | | | | |
| Receivable for interest | | | (690,074 | ) | | (126,460 | ) | | (491,798 | ) | | (444,105 | ) |
| Receivable for investments sold | | | (5,740,000 | ) | | (20,711,732 | ) | | 23,450,473 | | | (844,927 | ) |
| Other assets | | | (202 | ) | | (15,953 | ) | | 1,774 | | | 25,433 | |
| Increase (Decrease) in: | | | | | | | | | | | | | |
| Payable for interest | | | (6,389 | ) | | — | | | (350,325 | ) | | (133,139 | ) |
| Payable for investment purchased | | | — | | | 2,379,141 | | | (1,761,105 | ) | | (800,783 | ) |
| Accrued management fees | | | (33 | ) | | (5,182 | ) | | 231 | | | (1,911 | ) |
| Accrued Directors/Trustees fees | | | (6,496 | ) | | (18,024 | ) | | (5,355 | ) | | (12,586 | ) |
| Accrued other expenses | | | 13,228 | | | 50,077 | | | (3,696 | ) | | 20,479 | |
| Net realized (gain) loss from investments | | | (167,133 | ) | | 3,893,807 | | | 155,432 | | | 2,475,674 | |
| Change in net unrealized (appreciation) depreciation of: | | | | | | | | | | | | | |
| Investments | | | (30,049,055 | ) | | (73,697,448 | ) | | (27,970,807 | ) | | (66,721,806 | ) |
| Swaps | | | — | | | — | | | — | | | 4,414,736 | |
| Taxes paid on undistributed capital gains | | | — | | | — | | | (3,690 | ) | | — | |
| Net cash provided by (used in) operating activities | | | 5,951,926 | | | 47,952,483 | | | 13,574,692 | | | 43,389,012 | |
| Cash Flows from Financing Activities: | | | | | | | | | | | | | |
| (Increase) Decrease in deferred offering costs | | | 17,682 | | | 53,958 | | | 168,847 | | | 423,020 | |
| Increase (Decrease) in: | | | | | | | | | | | | | |
| Floating rate obligations | | | (8,330,000 | ) | | (2,475,000 | ) | | (575,000 | ) | | (9,805,000 | ) |
| MTP Shares, at liquidation value | | | — | | | — | | | (108,000,000 | ) | | (83,000,000 | ) |
| VMTP Shares, at liquidation value | | | — | | | — | | | (92,500,000 | ) | | 83,400,000 | |
| VRDP Shares, at liquidation value | | | — | | | — | | | 201,000,000 | | | — | |
| Cash distributions paid to common shareholders | | | (14,637,440 | ) | | (42,322,002 | ) | | (12,015,861 | ) | | (32,422,985 | ) |
| Cost of common shares repurchased and retired | | | — | | | — | | | (1,205,243 | ) | | — | |
| Net cash provided by (used in) financing activities | | | (22,949,758 | ) | | (44,743,044 | ) | | (13,127,257 | ) | | (41,404,965 | ) |
| Net Increase (Decrease) in Cash | | | (16,997,832 | ) | | 3,209,439 | | | 447,435 | | | 1,984,047 | |
| Cash at the beginning of period | | | 18,719,125 | | | 3,691,485 | | | 2,401,912 | | | 11,225,848 | |
| Cash at the end of period | | $ | 1,721,293 | | $ | 6,900,924 | | $ | 2,849,347 | | $ | 13,209,895 | |
| | | | | | | | | | | | | | |
| Supplemental Disclosure of Cash Flow Information | | | | | | | | | | | | | |
| | | | | | | | | | | | | | |
| | | | | | | | | | Dividend | | | AMT-Free | |
| | | | Quality | | | Opportunity | | | Advantage | | | Income | |
| | | | (NQI | ) | | (NIO | ) | | (NVG | ) | | (NEA | ) |
| Cash paid for interest (excluding amortization of offering costs) | | $ | 1,524,132 | | $ | 739,586 | | $ | 1,808,690 | | $ | 1,592,812 | |
See accompanying notes to financial statements.
| Financial | |
| | Highlights (Unaudited) |
Selected data for a common share outstanding throughout each period:
| | | | | Investment Operations | | Less Distributions | | | | | | | |
| | | Beginning Common Share NAV | | Net Investment Income (Loss) | | Net Realized/ Unrealized Gain (Loss) | | Distributions from Net Investment Income to Auction Rate Preferred Shareholders | (a) | Distributions from Accumulated Net Realized Gains to Auction Rate Preferred Shareholders | (a) | Total | | From Net Investment Income to Common Shareholders | | From Accumulated Net Realized Gains to Common Shareholders | | Total | | Discount from Common Shares Repurchased and Retired | | Ending Common Share NAV | | Ending Market Value | |
| Quality (NQI) |
| Year Ended 10/31: |
| 2014(f) | | $ | 13.76 | | $ | .35 | | $ | .79 | | $ | — | | $ | — | | $ | 1.14 | | $ | (.38 | ) | $ | — | | $ | (.38 | ) | $ | — | | $ | 14.52 | | $ | 12.99 | |
| 2013 | | | 15.49 | | | .72 | | | (1.61 | ) | | — | | | — | | | (.89 | ) | | (.84 | ) | | — | | | (.84 | ) | | — | | | 13.76 | | | 12.26 | |
| 2012 | | | 14.17 | | | .84 | | | 1.38 | | | — | | | — | | | 2.22 | | | (.90 | ) | | — | | | (.90 | ) | | — | | | 15.49 | | | 15.49 | |
| 2011 | | | 14.26 | | | .87 | | | (.08 | ) | | (.01 | ) | | — | | | .78 | | | (.87 | ) | | — | | | (.87 | ) | | — | | | 14.17 | | | 14.11 | |
| 2010 | | | 13.61 | | | .95 | | | .58 | | | (.03 | ) | | — | | | 1.50 | | | (.85 | ) | | — | | | (.85 | ) | | — | | | 14.26 | | | 14.40 | |
| 2009 | | | 11.68 | | | .99 | | | 1.76 | | | (.06 | ) | | — | | | 2.69 | | | (.76 | ) | | — | | | (.76 | ) | | — | | | 13.61 | | | 13.30 | |
| | | | | | | | | | | | | | | | | | | | | | | | | | | | | | | | | | | | | | |
| Opportunity (NIO) |
| Year Ended 10/31: |
| 2014(f) | | | 14.46 | | | .44 | | | .72 | | | — | | | — | | | 1.16 | | | (.44 | ) | | — | | | (.44 | ) | | — | | | 15.18 | | | 14.06 | |
| 2013 | | | 15.97 | | | .85 | | | (1.48 | ) | | — | | | — | | | (.63 | ) | | (.88 | ) | | — | | | (.88 | ) | | — | | | 14.46 | | | 12.99 | |
| 2012 | | | 14.69 | | | .84 | | | 1.32 | | | — | | | — | | | 2.16 | | | (.88 | ) | | — | * | | (.88 | ) | | — | | | 15.97 | | | 15.53 | |
| 2011 | | | 14.92 | | | .88 | | | (.23 | ) | | (.01 | ) | | — | | | .64 | | | (.87 | ) | | — | | | (.87 | ) | | — | | | 14.69 | | | 14.20 | |
| 2010 | | | 14.22 | | | .97 | | | .60 | | | (.03 | ) | | — | | | 1.54 | | | (.84 | ) | | — | | | (.84 | ) | | — | * | | 14.92 | | | 14.83 | |
| 2009 | | | 12.39 | | | .96 | | | 1.66 | | | (.06 | ) | | — | | | 2.56 | | | (.73 | ) | | — | | | (.73 | ) | | — | | | 14.22 | | | 12.98 | |
| (a) | The amounts shown are based on common share equivalents. |
| (b) | Total Return Based on Market Value is the combination of changes in the market price per share and the effect of reinvested dividend income and reinvested capital gains distributions, if any, at the average price paid per share at the time of reinvestment. The last dividend declared in the period, which is typically paid on the first business day of the following month, is assumed to be reinvested at the ending market price. The actual reinvestment for the last dividend declared in the period may take place over several days, and in some instances may not be based on the market price, so the actual reinvestment price may be different from the price used in the calculation. Total returns are not annualized. |
| | |
| | Total Return Based on Common Share NAV is the combination of changes in common share NAV, reinvested dividend income at NAV and reinvested capital gains distributions at NAV, if any. The last dividend declared in the period, which is typically paid on the first business day of the following month, is assumed to be reinvested at the ending NAV. The actual reinvest price for the last dividend declared in the period may often be based on the Fund’s market price (and not its NAV), and therefore may be different from the price used in the calculation. Total returns are not annualized. |
| | | | | | Ratios/Supplemental Data |
| Total Returns | | | | | Ratios to Average Net Assets Applicable to Common Shares(c) | | | | |
Based on Common Share NAV | (b) | | Based on Market Value | (b) | | Ending Net Assets Applicable to Common Shares (000) | | | Expenses | (d) | | Net Investment Income (Loss) | | | Portfolio Turnover Rate | (e) |
| | | | | | | | | | | | | | | | | |
| | | | | | | | | | | | | | | | | |
| 8.39 | % | | 9.19 | % | $ | 558,435 | | | 1.57 | %** | | 5.01 | %** | | 7 | % |
| (5.93 | ) | | (15.89 | ) | | 529,382 | | | 1.67 | | | 4.88 | | | 15 | |
| 16.06 | | | 16.65 | | | 595,740 | | | 1.69 | | | 5.55 | | | 23 | |
| 5.98 | | | 4.65 | | | 544,500 | | | 1.66 | | | 6.43 | | | 18 | |
| 11.30 | | | 15.03 | | | 547,598 | | | 1.19 | | | 6.81 | | | 11 | |
| 23.65 | | | 26.98 | | | 521,216 | | | 1.32 | | | 7.86 | | | 4 | |
| | | | | | | | | | | | | | | | | |
| | | | | | | | | | | | | | | | | |
| 8.19 | | | 11.83 | | | 1,451,684 | | | 1.52 | ** | | 6.00 | ** | | 4 | |
| (4.10 | ) | | (11.09 | ) | | 1,382,652 | | | 1.50 | | | 5.54 | | | 15 | |
| 15.03 | | | 15.92 | | | 1,526,792 | | | 1.54 | | | 5.45 | | | 18 | |
| 4.73 | | | 2.08 | | | 1,404,814 | | | 1.63 | | | 6.28 | | | 10 | |
| 11.08 | | | 21.20 | | | 1,426,419 | | | 1.14 | | | 6.61 | | | 7 | |
| 21.18 | | | 23.62 | | | 1,358,844 | | | 1.29 | | | 7.36 | | | 8 | |
| (c) | Ratios do not reflect the effect of dividend payments to Auction Rate Preferred shareholders, where applicable; Net Investment Income (Loss) ratios reflect income earned and expenses incurred on assets attributable to Auction Rate Preferred Shares (“ARPS”), VMTP Shares and/or VRDP Shares, where applicable. |
| (d) | The expense ratios reflect, among other things, all interest expense and other costs related to VMTP Shares, VRDP Shares and/or the interest expense deemed to have been paid by the Fund on the floating rate certificates issued by the special purpose trusts for the self-deposited inverse floaters held by the Fund, where applicable, each as described in Note 1 – General Information and Significant Accounting Policies, Variable Rate MuniFund Term Preferred Shares and Variable Rate Demand Preferred Shares and Note 3 – Portfolio Securities and Investments in Derivatives, Inverse Floating Rate Securities, respectively, as follows: |
| Quality (NQI) | | | |
| Year Ended 10/31: | | | |
| 2014(f) | | .58 | %** |
| 2013 | | .71 | |
| 2012 | | .70 | |
| 2011 | | .57 | |
| 2010 | | .07 | |
| 2009 | | .11 | |
| | | | |
| Opportunity (NIO) | | | |
| Year Ended 10/31: | | | |
| 2014(f) | | .53 | %** |
| 2013 | | .55 | |
| 2012 | | .57 | |
| 2011 | | .59 | |
| 2010 | | .06 | |
| 2009 | | .11 | |
| (e) | Portfolio Turnover Rate is calculated based on the lesser of long-term purchases or sales (as disclosed in Note 5 – Investment Transactions) divided by the average long-term market value during the period. |
| (f) | For the six months ended April 30, 2014. |
| * | Rounds to less than $.01 per share. |
| ** | Annualized. |
See accompanying notes to financial statements.
Financial Highlights (Unaudited) (continued)
Selected data for a share outstanding throughout each period:
| | | | | | Investment Operations | | Less Distributions | | | | | | | | | | |
| | | Beginning Common Share NAV | | Net Investment Income (Loss) | | Net Realized/ Unrealized Gain (Loss) | | Distributions from Net Investment Income to Auction Rate Preferred Shareholders | (a) | Distributions from Accumulated Net Realized Gains to Auction Rate Preferred Shareholders | (a) | Total | | From Net Investment Income to Common Shareholders | | From Accumulated Net Realized Gains to Common Shareholders | | Total | | Discount from Common Shares Repurchased and Retired | | Ending Common Share NAV | | Ending Market Value | |
| Dividend Advantage (NVG) |
| Year Ended 10/31: |
| 2014(g) | | $ | 14.62 | | $ | .34 | | $ | .95 | | $ | — | | $ | — | | $ | 1.29 | | $ | (.34 | ) | $ | (.07 | ) | $ | (.41 | ) | $ | — | * | $ | 15.50 | | $ | 13.80 | |
| 2013 | | | 16.33 | | | .60 | | | (1.46 | ) | | — | | | — | | | (.86 | ) | | (.74 | ) | | (.11 | ) | | (.85 | ) | | — | * | | 14.62 | | | 12.75 | |
| 2012 | | | 15.03 | | | .82 | | | 1.42 | | | — | | | — | | | 2.24 | | | (.90 | ) | | (.04 | ) | | (.94 | ) | | — | | | 16.33 | | | 15.82 | |
| 2011 | | | 15.20 | | | .91 | | | (.22 | ) | | (.01 | ) | | — | | | .68 | | | (.85 | ) | | — | * | | (.85 | ) | | — | | | 15.03 | | | 14.32 | |
| 2010 | | | 14.80 | | | .90 | | | .39 | | | (.01 | ) | | — | * | | 1.28 | | | (.84 | ) | | (.04 | ) | | (.88 | ) | | — | | | 15.20 | | | 14.80 | |
| 2009 | | | 12.85 | | | 1.00 | | | 1.77 | | | (.06 | ) | | — | | | 2.71 | | | (.76 | ) | | — | | | (.76 | ) | | — | * | | 14.80 | | | 13.85 | |
| | | | | | | | | | | | | | | | | | | | | | | | | | | | | | | | | | | | | | |
| AMT-Free Income (NEA) |
| Year Ended 10/31: |
| 2014(g) | | | 13.73 | | | .39 | | | .76 | | | — | | | — | | | 1.15 | | | (.41 | ) | | — | | | (.41 | ) | | — | | | 14.47 | | | 13.33 | |
| 2013 | | | 15.49 | | | .72 | | | (1.66 | ) | | — | | | — | | | (.94 | ) | | (.82 | ) | | — | | | (.82 | ) | | — | | | 13.73 | | | 12.37 | |
| 2012 | | | 14.70 | | | .78 | | | .85 | | | — | | | — | | | 1.63 | | | (.84 | ) | | — | | | (.84 | ) | | — | | | 15.49 | | | 15.80 | |
| 2011 | | | 14.98 | | | .84 | | | (.29 | ) | | (.01 | ) | | — | | | .54 | | | (.82 | ) | | — | | | (.82 | ) | | — | | | 14.70 | | | 13.85 | |
| 2010 | | | 14.42 | | | .87 | | | .52 | | | (.02 | ) | | — | | | 1.37 | | | (.81 | ) | | — | | | (.81 | ) | | — | | | 14.98 | | | 14.95 | |
| 2009 | | | 12.37 | | | .98 | | | 1.86 | | | (.06 | ) | | — | | | 2.78 | | | (.73 | ) | | — | | | (.73 | ) | | — | * | | 14.42 | | | 13.48 | |
| (a) | The amounts shown are based on common share equivalents. |
| (b) | Total Return Based on Market Value is the combination of changes in the market price per share and the effect of reinvested dividend income and reinvested capital gains distributions, if any, at the average price paid per share at the time of reinvestment. The last dividend declared in the period, which is typically paid on the first business day of the following month, is assumed to be reinvested at the ending market price. The actual reinvestment for the last dividend declared in the period may take place over several days, and in some instances may not be based on the market price, so the actual reinvestment price may be different from the price used in the calculation. Total returns are not annualized. |
| | |
| | Total Return Based on Common Share NAV is the combination of changes in common share NAV, reinvested dividend income at NAV and reinvested capital gains distributions at NAV, if any. The last dividend declared in the period, which is typically paid on the first business day of the following month, is assumed to be reinvested at the ending NAV. The actual reinvest price for the last dividend declared in the period may often be based on the Fund’s market price (and not its NAV), and therefore may be different from the price used in the calculation. Total returns are not annualized. |
| | | | | | Ratios/Supplemental Data |
| Total Returns | | | | | Ratios to Average Net Assets Applicable to Common Shares Before Reimbursement(c) | | Ratios to Average Net Assets Applicable to Common Shares After Reimbursement(c)(d) | | | | |
Based on Common Share NAV | (b) | | Based on Market Value | (b) | | Ending Net Assets Applicable to Common Shares (000 | ) | | Expenses | (e) | | Net Investment Income (Loss | ) | | Expenses | (e) | | Net Investment Income (Loss | ) | | Portfolio Turnover Rate | (f) |
| | | | | | | | | | | | | | | | | | | | | | | |
| 8.98 | % | | 11.68 | % | $ | 459,462 | | | 1.82 | %** | | 4.76 | %** | | N/A | | | N/A | | | 5 | % |
| (5.46 | ) | | (14.46 | ) | | 434,851 | | | 2.03 | | | 3.87 | | | N/A | | | N/A | | | 32 | |
| 15.30 | | | 17.44 | | | 486,750 | | | 2.08 | | | 5.17 | | | 2.05 | % | | 5.20 | % | | 29 | |
| 4.83 | | | 2.89 | | | 448,070 | | | 1.95 | | | 6.12 | | | 1.84 | | | 6.23 | | | 7 | |
| 8.89 | | | 13.51 | | | 452,908 | | | 1.89 | | | 5.79 | | | 1.71 | | | 5.98 | | | 2 | |
| 21.54 | | | 28.72 | | | 441,207 | | | 1.25 | | | 6.86 | | | .98 | | | 7.12 | | | 9 | |
| | | | | | | | | | | | | | | | | | | | | | | |
| | | | | | | | | | | | | | | | | | | | | | | |
| 8.53 | | | 11.28 | | | 1,141,462 | | | 1.66 | ** | | 5.71 | ** | | N/A | | | N/A | | | 7 | |
| (6.25 | ) | | (16.89 | ) | | 1,083,339 | | | 1.97 | | | 5.14 | | | N/A | | | N/A | | | 26 | |
| 11.32 | | | 20.64 | | | 344,487 | | | 2.13 | | | 5.13 | | | N/A | | | N/A | | | 26 | |
| 3.92 | | | (1.60 | ) | | 326,909 | | | 2.02 | | | 5.86 | | | 2.01 | | | 5.87 | | | 2 | |
| 9.76 | | | 17.27 | | | 333,074 | | | 1.76 | | | 5.80 | | | 1.63 | | | 5.93 | | | 2 | |
| 23.05 | | | 25.41 | | | 320,587 | | | 1.24 | | | 7.14 | | | .99 | | | 7.39 | | | 6 | |
| (c) | Ratios do not reflect the effect of dividend payments to Auction Rate Preferred shareholders, where applicable; Net Investment Income (Loss) ratios reflect income earned and expenses incurred on assets attributable to ARPS, MTP Shares, VMTP Shares and/or VRDP Shares, where applicable. |
| (d) | After expense reimbursement from the Adviser, where applicable. As of March 31, 2012 and November 30, 2010, the Adviser is no longer reimbursing Dividend Advantage (NVG) and ATM-Free Income (NEA), respectively, for any fees or expenses. |
| (e) | The expense ratios reflect, among other things, all interest expense and other costs related to MTP Shares, VMTP Shares, VRDP Shares and/or the interest expense deemed to have been paid by the Fund on the floating rate certificates issued by the special purpose trusts for the self-deposited inverse floaters held by the Fund, where applicable, each as described in Note 1 – General Information and Significant Accounting Policies, MuniFund Term Preferred Shares, Variable Rate MuniFund Term Preferred Shares and Variable Rate Demand Preferred Shares and Note 3 – Portfolio Securities and Investments in Derivatives, Inverse Floating Rate Securities, respectively, as follows: |
| Dividend Advantage (NVG) | | | |
| Year Ended 10/31: | | | |
| 2014(g) | | .81 | %** |
| 2013 | | 1.06 | |
| 2012 | | 1.05 | |
| 2011 | | .90 | |
| 2010 | | .84 | |
| 2009 | | .08 | |
| AMT-Free Income (NEA) | | | |
| Year Ended 10/31: | | | |
| 2014(g) | | .66 | %** |
| 2013 | | .87 | |
| 2012 | | 1.07 | |
| 2011 | | .94 | |
| 2010 | | .67 | |
| 2009 | | .05 | |
| (f) | Portfolio Turnover Rate is calculated based on the lesser of long-term purchases or sales (as disclosed in Note 5 – Investment Transactions) divided by the average long-term market value during the period. |
| (g) | For the six months ended April 30, 2014. |
| * | Rounds to less than $.01 per share. |
| ** | Annualized. |
| N/A | Fund no longer has a contractual reimbursement agreement with the Adviser. |
See accompanying notes to financial statements.
Financial Highlights (Unaudited) (continued)
| | | ARPS at the End of Period | | VMTP Shares at the End of Period | | VRDP Shares at the End of Period | |
| | | Aggregate Amount Outstanding (000 | ) | Asset Coverage Per $25,000 Share | | Aggregate Amount Outstanding (000 | ) | Asset Coverage Per $100,000 Share | | Aggregate Amount Outstanding (000 | ) | Asset Coverage Per $100,000 Share | |
| Quality (NQI) |
| Year Ended 10/31: |
| 2014(a) | | $ | — | | $ | — | | $ | 240,400 | | $ | 332,294 | | $ | — | | $ | — | |
| 2013 | | | — | | | — | | | 240,400 | | | 320,209 | | | — | | | — | |
| 2012 | | | — | | | — | | | 240,400 | | | 347,812 | | | — | | | — | |
| 2011 | | | — | | | — | | | 240,400 | | | 326,498 | | | — | | | — | |
| 2010 | | | 239,200 | | | 82,232 | | | — | | | — | | | — | | | — | |
| 2009 | | | 245,850 | | | 78,001 | | | — | | | — | | | — | | | — | |
| | | | | | | | | | | | | | | | | | | | |
| Opportunity (NIO) |
| Year Ended 10/31: |
| 2014(a) | | | — | | | — | | | — | | | — | | | 667,200 | | | 317,579 | |
| 2013 | | | — | | | — | | | — | | | — | | | 667,200 | | | 307,232 | |
| 2012 | | | — | | | — | | | — | | | — | | | 667,200 | | | 328,836 | |
| 2011 | | | — | | | — | | | — | | | — | | | 667,200 | | | 310,554 | |
| 2010 | | | 664,825 | | | 78,639 | | | — | | | — | | | — | | | — | |
| 2009 | | | 675,475 | | | 75,292 | | | — | | | — | | | — | | | — | |
| (a) | For the six months ended April 30, 2014. |
| | | ARPS at the End of Period | | MTP Shares at the End of Period (b) | | VMTP Shares at the End of Period | | VRDP Shares at the End of Period | | MTP, VMTP and/or VRDP Shares at the End of Period | |
| | | Aggregate Amount Outstanding (000) | | Asset Coverage Per $25,000 Share | | Aggregate Amount Outstanding (000) | | Asset Coverage Per $10 Share | | Aggregate Amount Outstanding (000) | | Asset Coverage Per $100,000 Share | | Aggregate Amount Outstanding (000) | | Asset Coverage Per $100,000 Share | | Asset Coverage Per $1 Liquidation Preference | |
| Dividend Advantage (NVG) |
| Year Ended 10/31: | | | | | | | | | | | | | | | | | | | | | | |
| 2014(a) | | $ | — | | $ | — | | $ | — | | $ | — | | $ | — | | $ | — | | $ | 201,000 | | $ | 328,588 | | $ | — | |
| 2013 | | | — | | | — | | | 108,000 | | | 31.69 | | | 92,500 | | | 316,883 | | | — | | | — | | | 3.17 | |
| 2012 | | | — | | | — | | | 108,000 | | | 34.28 | | | 92,500 | | | 342,768 | | | — | | | — | | | 3.43 | |
| 2011 | | | — | | | — | | | 108,000 | | | 32.35 | | | 92,500 | | | 323,476 | | | — | | | — | | | 3.23 | |
| 2010 | | | 91,950 | | | 81,628 | | | 108,000 | | | 32.65 | | | — | | | — | | | — | | | — | | | 3.27 | |
| 2009 | | | 91,950 | | | 80,165 | | | 108,000 | | | 32.07 | | | — | | | — | | | — | | | — | | | 3.21 | |
| | | | | | | | | | | | | | | | | | | | | | | | | | | | | |
| AMT-Free Income (NEA) |
| Year Ended 10/31: | | | | | | | | | | | | | | | | | | | | | | | | | |
| 2014(a) | | | — | | | — | | | — | | | — | | | 151,000 | | | 855,935 | | | 349,900 | | | 426,225 | | | 3.28 | |
| 2013 | | | — | | | — | | | 83,000 | | | 31.65 | | | 67,600 | | | 316,451 | | | 349,900 | | | 316,451 | | | 3.16 | |
| 2012 | | | — | | | — | | | 83,000 | | | 32.87 | | | 67,600 | | | 328,743 | | | — | | | — | | | 3.29 | |
| 2011 | | | — | | | — | | | 83,000 | | | 31.71 | | | 67,600 | | | 317,071 | | | — | | | — | | | 3.17 | |
| 2010 | | | 67,375 | | | 80,374 | | | 83,000 | | | 32.15 | | | — | | | — | | | — | | | — | | | 3.21 | |
| 2009 | | | 148,750 | | | 78,880 | | | — | | | — | | | — | | | — | | | — | | | — | | | — | |
| (a) | For the six months ended April 30, 2014. |
| (b) | The Ending and Average Market Value Per Share for each Series of the Fund’s MTP Shares outstanding were as follows: |
| | | | 2014 | (a) | | 2013 | | | 2012 | | | 2011 | | | 2010 | | | 2009 | |
| Dividend Advantage (NVG) | | | | | | | | | | | | | | | | | | | |
| Series 2014 (NVG PRCCL) | | | | | | | | | | | | | | | | | | | |
| Ending Market Value per Share | | $ | — | | $ | 10.09 | | $ | 10.12 | | $ | 10.10 | | $ | 10.22 | | $ | 9.98 | |
| Average Market Value per Share | | | 10.05 | ^ | | 10.11 | | | 10.16 | | | 10.12 | | | 10.19 | | | 10.03 | Ω |
| | | | | | | | | | | | | | | | | | | | |
| AMT-Free Income (NEA) | | | | | | | | | | | | | | | | | | | |
| Series 2015 (NEA PRCCL) | | | | | | | | | | | | | | | | | | | |
| Ending Market Value per Share | | $ | — | | | 10.07 | | | 10.16 | | | 10.14 | | | 10.14 | | | — | |
| Average Market Value per Share | | | 10.05 | ^^ | | 10.10 | | | 10.14 | | | 10.08 | | | 10.15 | ΩΩ | | — | |
| Ω | For the period October 19, 2009 (first issuance date of shares) through October 31, 2009. |
| ΩΩ | For the period January 19, 2010 (first issuance date of shares) through October 31, 2010. |
| ^ | For the period November 1, 2013 through December 23, 2013. |
| ^^ | For the period November 1, 2013 through December 20, 2013. |
See accompanying notes to financial statements.
Notes to Financial Statements (Unaudited)
1. General Information and Significant Accounting Policies
General Information
Fund Information
The funds covered in this report and their corresponding New York Stock Exchange (“NYSE”) or NYSE MKT symbols are as follows (each a “Fund” and collectively, the “Funds”):
| | • | Nuveen Quality Municipal Fund, Inc. (NQI) (“Quality (NQI)”) |
| | • | Nuveen Municipal Opportunity Fund, Inc. (NIO) (“Opportunity (NIO)”) |
| | • | Nuveen Dividend Advantage Municipal Income Fund (NVG) (“Dividend Advantage (NVG)”) |
| | • | Nuveen AMT-Free Municipal Income Fund (NEA) (“AMT-Free Income (NEA)”) |
The Funds are registered under the Investment Company Act of 1940, as amended, as diversified closed-end registered investment companies. Common shares of Quality (NQI), Opportunity (NIO) and AMT-Free Income (NEA) are traded on the NYSE while common shares of Dividend Advantage (NVG) are traded on the NYSE MKT. Quality (NQI) and Opportunity (NIO) were incorporated under the state laws of Minnesota on October 23, 1990 and July 25, 1991, respectively. Dividend Advantage (NVG) and AMT-Free Income (NEA) were organized as Massachusetts business trusts on July 12, 1999 and July 29, 2002, respectively.
Investment Adviser
The Funds’ investment adviser is Nuveen Fund Advisors, LLC (the “Adviser”), a wholly-owned subsidiary of Nuveen Investments, Inc. (“Nuveen”). The Adviser is responsible for each Fund’s overall investment strategy and asset allocation decisions. The Adviser has entered into sub-advisory agreements with Nuveen Asset Management, LLC (the “Sub-Adviser”), a subsidiary of the Adviser, under which the Sub-Adviser manages the investment portfolios of the Funds.
Agreement and Plan of Merger
On April 14, 2014, TIAA-CREF, a national financial services organization, announced that it had entered into an agreement (the “Purchase Agreement”) to acquire Nuveen, the parent company of the Adviser. The transaction is expected to be completed by the end of the year, subject to customary closing conditions, including obtaining necessary Nuveen Fund and client consents sufficient to satisfy the terms of the Purchase Agreement and obtaining customary regulatory approvals. There can be no assurance that the transaction described above will be consummated as contemplated or that necessary conditions will be satisfied.
The consummation of the transaction will be deemed to be an “assignment” (as defined in the Investment Company Act of 1940) of the investment management agreements between the Nuveen Funds and the Adviser and the investment sub-advisory agreements between the Adviser and each Nuveen Fund’s sub-adviser or sub-advisers, and will result in automatic termination of each agreement. It is anticipated that the Board of Directors/Trustees of the Nuveen Funds (the “Board”) will consider a new investment management agreement with the Adviser and new investment sub-advisory agreements with each sub-adviser. If approved by the Board, the new agreements will be presented to the Nuveen Funds’ shareholders for approval, and, if so approved by shareholders, will take effect upon consummation of the transaction or such later time as shareholder approval is obtained.
The transaction is not expected to result in any change in the portfolio management of the Fund or in the Fund’s investment objectives or policies.
Investment Objectives
Each Fund seeks to provide current income exempt from regular federal income tax, and in the case of AMT-Free Income (NEA) the alternative minimum tax applicable to individuals, by investing primarily in a portfolio of municipal obligations issued by state and local government authorities or certain U.S. territories.
Significant Accounting Policies
The following is a summary of significant accounting policies followed by the Funds in the preparation of their financial statements in accordance with U.S. generally accepted accounting principles (“U.S. GAAP”).
Investment Transactions
Investment transactions are recorded on a trade date basis. Realized gains and losses from investment transactions are determined on the specific identification method, which is the same basis used for federal income tax purposes. Investments purchased on a when-issued/delayed delivery basis may have extended settlement periods. Any investments so purchased are subject to market fluctuation during this period. The Funds have instructed the custodian to earmark securities in the Funds’ portfolios with a current value at least equal to the amount of the when-issued/delayed delivery purchase commitments. As of April 30, 2014, the Funds’ outstanding when-issued/delayed delivery purchase commitments were as follows:
| | | | | | | | | | Dividend | | | AMT-Free | |
| | | | Quality | | | Opportunity | | | Advantage | | | Income | |
| | | | (NQI | ) | | (NIO | ) | | (NVG | ) | | (NEA | ) |
| Outstanding when-issued/delayed delivery purchase commitments | | $ | — | | $ | 5,065,011 | | $ | 60,000 | | $ | 7,528,708 | |
Investment Income
Dividend income is recorded on the ex-dividend date. Investment income, which reflects the amortization of premiums and includes accretion of discounts for financial reporting purposes, is recorded on an accrual basis. Investment income also reflects paydown gains and losses, if any.
Professional Fees
Professional fees presented on the Statement of Operations consist of legal fees incurred in the normal course of operations, audit fees, tax consulting fees and, in some cases, workout expenditures. Workout expenditures are incurred in an attempt to protect or enhance an investment, or to pursue other claims or legal actions on behalf of Fund shareholders. If a refund is received for workout expenditures paid in a prior reporting period, such amounts will be recognized as “Legal fee refund” on the Statement of Operations.
Dividends and Distributions to Common Shareholders
Dividends from net investment income are declared monthly. Net realized capital gains and/or market discount from investment transactions, if any, are distributed to shareholders at least annually. Furthermore, capital gains are distributed only to the extent they exceed available capital loss carryforwards. Distributions to common shareholders of net investment income, net realized capital gains and/or market discount, if any, are recorded on the ex-dividend date. The amount and timing of distributions are determined in accordance with federal income tax regulations, which may differ from U.S. GAAP.
Auction Rate Preferred Shares
Each Fund is authorized to issue Auction Rate Preferred Shares (“ARPS”). During prior fiscal periods, the Funds redeemed all of their outstanding ARPS, at liquidation value.
MuniFund Term Preferred Shares
During the current fiscal period, Dividend Advantage (NVG) and AMT-Free Income (NEA) had issued and outstanding MuniFund Term Preferred (“MTP”) Shares, with a $10 liquidation value per share. Each Fund’s MTP Shares were issued in one or more Series and trade on the NYSE/NYSE MKT. Dividend Advantage (NVG) redeemed all of its outstanding Series 2014 MTP Shares on December 23, 2013. AMT-Free Income (NEA) redeemed all of its outstanding Series 2015 MTP Shares on December 20, 2013.
Dividend Advantage’s (NVG) MTP Shares were redeemed at their $10.00 liquidation value per share, plus dividend amounts owed, using proceeds from its issuance of VRDP Shares (as described below in Variable Rate Demand Preferred Shares).
AMT-Free Income’s (NEA) MTP Shares were redeemed at their $10.00 liquidation value per share, plus dividend amounts owed, using proceeds from its issuance of VMTP Shares (as described below in Variable Rate MuniFund Term Preferred Shares).
The average liquidation value of MTP Shares outstanding for each Fund during the current fiscal period were as follows:
| | | | Dividend | | | AMT-Free | |
| | | | Advantage | | | Income | |
| | | | (NVG | )* | | (NEA | )** |
| Average liquidation value of MTP Shares outstanding | | $ | 108,000,000 | | $ | 83,000,000 | |
| * | For the period November 1, 2013 through December 23, 2013. |
| ** | For the period November 1, 2013 through December 20, 2013. |
For financial reporting purposes, the liquidation value of MTP Shares was recorded as a liability and recognized as “MuniFund Term Preferred (“MTP”) Shares, at liquidation value” on the Statement of Assets and Liabilities. Unpaid dividends on MTP Shares were recognized as a component of “Interest payable” on the Statement of Assets and Liabilities. Dividends accrued on MTP Shares were recognized as a component of “Interest expense and amortization of offering costs” on the Statement of Operations. Costs incurred by the Funds in connection with their offerings of MTP Shares were recorded as a deferred charge, which were amortized over the life of the shares and are recognized as components of “Deferred offering costs” on the Statement of Assets and Liabilities and “Interest expense and amortization of offering costs” on the Statement of Operations.
Notes to Financial Statements (Unaudited) (continued)
In conjunction with Dividend Advantage’s (NVG) and AMT-Free Income’s (NEA) redemption of MTP Shares, the remaining deferred offering costs of $336,677 and $410,196, respectively, were fully expensed during the current fiscal period, as the redemptions were deemed an extinguishment of debt.
Variable Rate MuniFund Term Preferred Shares
The following Funds have issued and outstanding Variable Rate MuniFund Term Preferred (“VMTP”) Shares, with $100,000 liquidation value per share. VMTP Shares are issued via private placement and are not publicly available.
As of April 30, 2014, the details of each Fund’s VMTP Shares outstanding are as follows:
| | | | | | | | | | Shares | |
| | | | | | | | | Outstanding at | |
| | | | | | | Shares | | $100,000 Per Share | |
| Fund | | | Series | | | Outstanding | | Liquidation Value | |
| Quality (NQI) | | | 2015 | | | 2,404 | | $ | 240,400,000 | |
| AMT-Free Income (NEA) | | | 2016 | | | 1,510 | | $ | 151,000,000 | |
Dividend Advantage (NVG) redeemed all 925 shares of its outstanding Series 2014 VMTP on December 23, 2013. The Fund’s VMTP Shares were redeemed at their $100,000 liquidation value per share, plus dividend amounts owed, using proceeds from its issuance of VRDP Shares (as described below in Variable Rate Demand Preferred Shares).
AMT-Free Income (NEA) redeemed and exchanged all 676 shares of its outstanding Series 2014 VMTP for Series 2016 VMTP on December 20, 2013. Concurrent with the exchange, the Fund issued an additional 834 shares of Series 2016 VMTP Shares through a privately negotiated offering. The Fund completed the refinancing of its existing VMTP Shares with new VMTP Shares, which have a term redemption date of December 30, 2016.
Each Fund is obligated to redeem its VMTP Shares by the date as specified in its offering document (“Term Redemption Date”), unless earlier redeemed or repurchased by the Fund. VMTP Shares are subject to optional and mandatory redemption in certain circumstances. The VMTP Shares are subject to redemption at the option of the Fund (“Optional Redemption Date”), subject to payment of premium for approximately one year following the date of issuance (“Premium Expiration Date”), and at par thereafter. Each Fund may be obligated to redeem certain of the VMTP Shares if the Fund fails to maintain certain asset coverage and leverage ratio requirements and such failures are not cured by the applicable cure date. The redemption price per share is equal to the sum of the liquidation value per share plus any accumulated but unpaid dividends. The Term Redemption Date, Optional Redemption Date and Premium Expiration Date for each Fund’s series of VMTP Shares are as follows:
| | | | | | | Term | | | Optional | | | Premium | |
| Fund | | | Series | | | Redemption Date | | | Redemption Date | | | Expiration Date | |
| Quality (NQI) | | | 2015 | | | December 1, 2015 | | | December 1, 2013 | | | November 30, 2013 | |
| AMT-Free Income (NEA) | | | 2016 | | | December 30, 2016 | | | January 1, 2015 | | | December 31, 2014 | |
The average liquidation value of VMTP Shares outstanding and annualized dividend rate for each Fund during the six months ended April 30, 2014, were as follows:
| | | | | | | | | | | |
| | | | | | | Dividend | | | AMT-Free | |
| | | | Quality | | | Advantage | | | Income | |
| | | | (NQI | ) | | (NVG | )* | | (NEA | ) |
| Average liquidation value of VMTP Shares outstanding | | $ | 240,400,000 | | $ | 92,500,000 | | $ | 143,113,812 | |
| Annualized dividend rate | | | 1.20 | % | | 1.04 | % | | 1.02 | % |
| * | For the period November 1, 2013 through December 23, 2013. |
VMTP Shares generally do not trade, and market quotations are generally not available. VMTP Shares are short-term or short/intermediate-term instruments that pay a variable dividend rate tied to a short-term index, plus an additional fixed “spread” amount established at the time of issuance. The fair value of VMTP Shares is expected to be approximately their liquidation par value so long as the fixed “spread” on the VMTP Shares remains roughly in line with the “spread” rates being demanded by investors on instruments having similar terms in the current market environment. In present market conditions, the Funds’ Adviser has determined that fair value of VMTP Shares is their liquidation value, but their fair value could vary if market conditions change materially. For financial reporting purposes, the liquidation value of VMTP Shares is recorded as a liability and recognized as “Variable Rate MuniFund Term Preferred (“VMTP”) Shares, at liquidation value” on the Statement of Assets and Liabilities.
Dividends on the VMTP shares (which are treated as interest payments for financial reporting purposes) are set weekly. Unpaid dividends on VMTP Shares are recognized as a component of “Interest payable” on the Statement of Assets and Liabilities, when applicable. Dividends accrued on VMTP Shares are recognized as a component of “Interest expense and amortization of offering costs” on the Statement of Operations.
Costs incurred by the Funds in connection with their offering of VMTP Shares were recorded as a deferred charge, which are amortized over the life of the shares and are recognized as components of “Deferred offering costs” on the Statement of Assets and Liabilities and “Interest expense and amortization of offering costs” on the Statement of Operations.
In conjunction with Dividend Advantage’s (NVG) and AMT-Free Income’s (NEA) redemption of VMTP Shares, the remaining deferred offering costs of $151,055 and $49,266, respectively, were fully expensed during the current fiscal period, as the redemptions were deemed an extinguishment of debt.
AMT-Free Income (NEA) incurred offering costs of $130,000 in connection with its issuance of Series 2016 VMTP Shares, which were recorded as a deferred charge and are being amortized over the life of the shares.
Variable Rate Demand Preferred Shares
The following Funds have issued and outstanding Variable Rate Demand Preferred (“VRDP”) Shares, with a $100,000 liquidation value per share. VRDP Shares are issued via private placement and are not publicly available.
As of April 30, 2014, the details of each Fund’s VRDP Shares outstanding are as follows:
| | | | | | | | | Shares Outstanding at | | | | |
| | | | | | | Shares | | $100,000 Per Share | | | | |
| Fund | | | Series | | | Outstanding | | Liquidation Value | | | Maturity | |
| Opportunity (NIO) | | | 1 | | | 6,672 | | $ | 667,200,000 | | | December 1, 2040 | |
| | | | | | | | | | | | | | |
| Dividend Advantage (NVG) | | | 1 | | | 2,010 | | $ | 201,000,000 | | | December 1, 2043 | |
| | | | | | | | | | | | | | |
| AMT-Free Income (NEA) | | | 1 | | | 2,190 | | $ | 219,000,000 | | | June 1, 2040 | |
| | | | 2 | | | 1,309 | | $ | 130,900,000 | | | December 1, 2040 | |
Dividend Advantage (NVG) issued 2,010 Series 1 VRDP Shares on December 13, 2013 in connection with the redemption of its outstanding VMTP Shares.
VRDP Shares include a liquidity feature that allows VRDP shareholders to have their shares purchased by a liquidity provider with whom each Fund has contracted in the event that purchase orders for VRDP Shares in a remarketing are not sufficient in number to be matched with the sale orders in that remarketing. Each Fund is required to redeem any VRDP Shares that are still owned by the liquidity provider after six months of continuous, unsuccessful remarketing. Opportunity (NIO) and AMT-Free Income (NEA) pays an annual remarketing fee of .10% on the aggregate principal amount of all VRDP Shares outstanding. Each Fund’s VRDP Shares have successfully remarketed since issuance.
VRDP shares in Dividend Advantage (NVG) are considered to be Special Rate Period VRDP. Special Rate Period VRDP are sold to banks with an initial special short/intermediate rate period (typically three years) with a dividend rate set at a fixed spread to a specified short-term municipal index rate calculated weekly. Weekly remarketings do not take place during the initial special rate period. After the initial special rate period, Special Rate Period VRDP Shares will revert back to traditional VRDP Shares with dividends set at weekly remarketings, with an option to sell the shares to a designated liquidity provider, unless the Fund’s Board of Directors/Trustees approves another special rate period.
Dividends on the VRDP Shares (which are treated as interest payments for financial reporting purposes) are set weekly at a rate established by a remarketing agent; therefore, the market value of the VRDP Shares is expected to approximate its liquidation value. If remarketings for VRDP Shares are continuously unsuccessful for six months, the maximum rate is designed to escalate according to a specified schedule in order to enhance the remarketing agent’s ability to successfully remarket the VRDP Shares.
Subject to certain conditions, VRDP Shares may be redeemed, in whole or in part, at any time at the option of each Fund. Each Fund may also redeem certain of the VRDP Shares if the Fund fails to maintain certain asset coverage requirements and such failures are not cured by the applicable cure date. The redemption price per share is equal to the sum of the liquidation value per share plus any accumulated but unpaid dividends.
The average liquidation value of VRDP Shares outstanding and annualized dividend rate for each Fund during the six months ended April 30, 2014, were as follows:
| | | | | | | | | | | |
| | | | | | | Dividend | | | AMT-Free | |
| | | | Opportunity | | | Advantage | | | Income | |
| | | | (NIO | ) | | (NVG | )* | | (NEA | ) |
| Average liquidation value of VRDP Shares outstanding | | $ | 667,200,000 | | $ | 201,000,000 | | $ | 349,900,000 | |
| Annualized dividend rate | | | 0.15 | % | | 1.05 | % | | 0.14 | % |
| * | For the period December 13, 2013 (first issuance of shares) through April 30, 2014. |
For financial reporting purposes, the liquidation value of VRDP Shares is recorded as a liability and recognized as “Variable Rate Demand Preferred (“VRDP”) Shares, at liquidation value” on the Statement of Assets and Liabilities. Unpaid dividends on VRDP Shares are recognized as a component of “Interest payable” on the Statement of Assets and Liabilities, when applicable. Dividends paid on the VRDP Shares are recognized as a component of “Interest expense and amortization of offering costs” on the Statement of Operations. Costs incurred by the Funds in connection with their offerings of
Notes to Financial Statements (Unaudited) (continued)
VRDP Shares were recorded as a deferred charge, which are amortized over the life of the shares and are recognized as components of “Deferred offering costs” on the Statement of Assets and Liabilities and “Interest expense and amortization of offerings costs” on the Statement of Operations. Dividend Advantage (NVG) incurred $275,000 of offering costs in conjunction with its shares issued during the current fiscal period. In addition to interest expense, Opportunity (NIO) and AMT-Free Income (NEA) also pays a per annum liquidity fee to the liquidity provider, as well as a remarketing fee, which are recognized as “Liquidity fees” and “Remarketing fees,” respectively, on the Statement of Operations.
Indemnifications
Under the Funds’ organizational documents, their officers and directors/trustees are indemnified against certain liabilities arising out of the performance of their duties to the Funds. In addition, in the normal course of business, the Funds enter into contracts that provide general indemnifications to other parties. The Funds’ maximum exposure under these arrangements is unknown as this would involve future claims that may be made against the Funds that have not yet occurred. However, the Funds have not had prior claims or losses pursuant to these contracts and expect the risk of loss to be remote.
Netting Agreements
In the ordinary course of business, the Funds may enter into transactions subject to enforceable International Swaps and Derivative Association, Inc. (“ISDA”) master agreements or other similar arrangements (“netting agreements”). Generally, the right to offset in netting agreements allows each Fund to offset any exposure to a specific counterparty with any collateral received or delivered to that counterparty based on the terms of the agreements. Generally, a Fund manages its cash collateral and securities collateral on a counterparty basis.
As of April 30, 2014, AMT-Free Income (NEA) was invested in swap contracts that are subject to netting agreements and further described in Note 3 –Portfolio Securities and Investments in Derivatives.
Use of Estimates
The preparation of financial statements in conformity with U.S. GAAP requires management to make estimates and assumptions that affect the reported amounts of assets and liabilities at the date of the financial statements and the reported amounts of increases and decreases in net assets applicable to common shares from operations during the reporting period. Actual results may differ from those estimates.
2. Investment Valuation and Fair Value Measurements
Investment Valuation
The fair valuation input levels as described below are for fair value measurement purposes.
Prices of municipal bonds, other fixed income securities and swaps are provided by a pricing service approved by the Funds’ Board of Directors/Trustees. These securities are generally classified as Level 2. The pricing service establishes a security’s fair value using methods that may include consideration of the following: yields or prices of investments of comparable quality, type of issue, coupon, maturity and rating, market quotes or indications of value from security dealers, evaluations of anticipated cash flows or collateral, general market conditions and other information and analysis, including the obligor’s credit characteristics considered relevant. In pricing certain securities, particularly less liquid and lower quality securities, the pricing service may consider information about a security, its issuer or market activity provided by the Adviser. These securities are generally classified as Level 2 or Level 3 depending on the priority of the significant inputs.
Investments in investment companies are valued at their respective net asset values (“NAVs”) on the valuation date. These investment vehicles are generally classified as Level 1.
Certain securities may not be able to be priced by the pre-established pricing methods as described above. Such securities may be valued by the Funds’ Board of Directors/Trustees or its designee at fair value. These securities generally include, but are not limited to, restricted securities (securities which may not be publicly sold without registration under the Securities Act of 1933, as amended) for which a pricing service is unable to provide a market price; securities whose trading has been formally suspended; debt securities that have gone into default and for which there is no current market quotation; a security whose market price is not available from a pre-established pricing source; a security with respect to which an event has occurred that is likely to materially affect the value of the security after the market has closed but before the calculation of a Fund’s NAV (as may be the case in non-U.S. markets on which the security is primarily traded) or make it difficult or impossible to obtain a reliable market quotation; and a security whose price, as provided by the pricing service, is not deemed to reflect the security’s fair value. As a general principle, the fair value of a security would appear to be the amount that the owner might reasonably expect to receive for it in a current sale. A variety of factors may be considered in determining the fair value of those securities, which may include consideration of the following: yields or prices of investments of comparable quality, type of issue, coupon, maturity and rating, market quotes or indications of value from security dealers, evaluations of anticipated cash flows or collateral, general market conditions and other information and analysis, including the obligor’s credit characteristics considered relevant. These securities are generally classified as Level 2 or Level 3 depending on the priority of the significant inputs. Regardless of the method employed to value a particular security, all valuations are subject to review by the Funds’ Board of Directors/Trustees or its designee.
Fair Value Measurements
Fair value is defined as the price that the Funds would receive upon selling an investment or transferring a liability in an orderly transaction to an independent buyer in the principal or most advantageous market for the investment. A three-tier hierarchy is used to maximize the use of observable market data and minimize the use of unobservable inputs and to establish classification of fair value measurements for disclosure purposes. Observable inputs reflect the assumptions market participants would use in pricing the asset or liability. Observable inputs are based on market data obtained from sources independent of the reporting entity. Unobservable inputs reflect the reporting entity’s own assumptions about the assumptions market participants would use in pricing the asset or liability. Unobservable inputs are based on the best information available in the circumstances. The following is a summary of the three-tiered hierarchy of valuation input levels.
| Level 1 – | Inputs are unadjusted and prices are determined using quoted prices in active markets for identical securities. |
| Level 2 – | Prices are determined using other significant observable inputs (including quoted prices for similar securities, interest rates, prepayment speeds, credit risk, etc.). |
| Level 3 – | Prices are determined using significant unobservable inputs (including management’s assumptions in determining the fair value of investments). |
The inputs or methodologies used for valuing securities are not an indication of the risks associated with investing in those securities. The following is a summary of each Fund’s fair value measurements as of the end of the reporting period:
| | | | | | | | | | | | | | |
| Quality (NQI) | | | Level 1 | | | Level 2 | | | Level 3 | | | Total | |
| Long-Term Investments*: | | | | | | | | | | | | | |
| Municipal Bonds | | $ | — | | $ | 808,406,959 | | $ | — | | $ | 808,406,959 | |
| Corporate Bonds | | | — | | | — | | | 130,373 | | | 130,373 | |
| Short-Term Investments*: | | | | | | | | | | | | | |
| Municipal Bonds | | | — | | | 3,004,470 | | | — | | | 3,004,470 | |
| Total | | $ | — | | $ | 811,411,429 | | $ | 130,373 | | $ | 811,541,802 | |
| Opportunity (NIO) | | | | | | | | | | | | | |
| Long-Term Investments*: | | | | | | | | | | | | | |
| Municipal Bonds | | $ | — | | $ | 2,161,344,948 | | $ | 1,404,815 | | $ | 2,162,749,763 | |
| Corporate Bonds | | | — | | | — | | | 124,260 | | | 124,260 | |
| Total | | $ | — | | $ | 2,161,344,948 | | $ | 1,529,075 | | $ | 2,162,874,023 | |
| Dividend Advantage (NVG) | | | | | | | | | | | | | |
| Long-Term Investments*: | | | | | | | | | | | | | |
| Municipal Bonds | | $ | — | | $ | 649,382,772 | | $ | — | | $ | 649,382,772 | |
| Investment Companies | | | 1,301,440 | | | — | | | — | | | 1,301,440 | |
| Short-Term Investments*: | | | | | | | | | | | | | |
| Municipal Bonds | | | — | | | 16,695,000 | | | — | | | 16,695,000 | |
| Total | | $ | 1,301,440 | | $ | 666,077,772 | | $ | — | | $ | 667,379,212 | |
| AMT-Free Income (NEA) | | | | | | | | | | | | | |
| Long-Term Investments*: | | | | | | | | | | | | | |
| Municipal Bonds | | $ | — | | $ | 1,657,107,692 | | $ | — | | $ | 1,657,107,692 | |
| Corporate Bonds | | | — | | | — | | | 44,316 | | | 44,316 | |
| Short-Term Investments*: | | | | | | | | | | | | | |
| Municipal Bonds | | | — | | | 8,485,000 | | | — | | | 8,485,000 | |
| Derivatives: | | | | | | | | | | | | | |
| Interest Rate Swaps** | | | — | | | (4,414,736 | ) | | — | | | (4,414,736 | ) |
| Total | | $ | — | | $ | 1,661,177,956 | | $ | 44,316 | | $ | 1,661,222,272 | |
| * | Refer to the Fund’s Portfolio of Investments for state classifications of Municipal Bonds, industry classifications of Corporate Bonds and breakdown of Municipal Bonds and Corporate Bonds classified as Level 3. |
| ** | Represents net unrealized appreciation (depreciation) as reported in the Fund’s Portfolio of Investments. |
The Nuveen funds’ Board of Directors/Trustees is responsible for the valuation process and has delegated the oversight of the daily valuation process to the Adviser’s Valuation Committee. The Valuation Committee, pursuant to the valuation policies and procedures adopted by the Board of Directors/Trustees, is responsible for making fair value determinations, evaluating the effectiveness of the funds’ pricing policies and reporting to the Board of Directors/Trustees. The Valuation Committee is aided in its efforts by the Adviser’s dedicated Securities Valuation Team, which is responsible for administering the daily valuation process and applying fair value methodologies as approved by the Valuation Committee. When determining the reliability of independent pricing services for investments owned by the funds, the Valuation Committee, among other things, conducts due diligence reviews of the pricing services and monitors the quality of security prices received through various testing reports conducted by the Securities Valuation Team.
Notes to Financial Statements (Unaudited) (continued)
The Valuation Committee will consider pricing methodologies it deems relevant and appropriate when making a fair value determination, based on the facts and circumstances specific to the portfolio instrument. Fair value determinations generally will be derived as follows, using public or private market information:
| | (i) | If available, fair value determinations shall be derived by extrapolating from recent transactions or quoted prices for identical or comparable securities. |
| | | |
| | (ii) | If such information is not available, an analytical valuation methodology may be used based on other available information including, but not limited to: analyst appraisals, research reports, corporate action information, issuer financial statements and shelf registration statements. Such analytical valuation methodologies may include, but are not limited to: multiple of earnings, discount from market value of a similar freely-traded security, discounted cash flow analysis, book value or a multiple thereof, risk premium/yield analysis, yield to maturity and/or fundamental investment analysis. |
The purchase price of a portfolio instrument will be used to fair value the instrument only if no other valuation methodology is available or deemed appropriate, and it is determined that the purchase price fairly reflects the instrument’s current value.
For each portfolio security that has been fair valued pursuant to the policies adopted by the Board of Directors/Trustees, the fair value price is compared against the last available and next available market quotations. The Valuation Committee reviews the results of such testing and fair valuation occurrences are reported to the Board of Directors/Trustees.
3. Portfolio Securities and Investments in Derivatives
Portfolio Securities
Inverse Floating Rate Securities
Each Fund is authorized to invest in inverse floating rate securities. An inverse floating rate security is created by depositing a municipal bond, typically with a fixed interest rate, into a special purpose trust created by a broker-dealer. In turn, this trust (a) issues floating rate certificates, in face amounts equal to some fraction of the deposited bond’s par amount or market value, that typically pay short-term tax-exempt interest rates to third parties, and (b) issues to a long-term investor (such as one of the Funds) an inverse floating rate certificate (sometimes referred to as an “inverse floater”) that represents all remaining or residual interest in the trust. The income received by the inverse floater holder varies inversely with the short-term rate paid to the floating rate certificates’ holders, and in most circumstances the inverse floater holder bears substantially all of the underlying bond’s downside investment risk and also benefits disproportionately from any potential appreciation of the underlying bond’s value. The price of an inverse floating rate security will be more volatile than that of the underlying bond because the interest rate is dependent on not only the fixed coupon rate of the underlying bond but also on the short-term interest paid on the floating rate certificates, and because the inverse floating rate security essentially bears the risk of loss of the greater face value of the underlying bond.
The inverse floater held by a Fund gives the Fund the right (a) to cause the holders of the floating rate certificates to tender their notes at par, and (b) to have the broker transfer the fixed-rate bond held by the trust to the Fund, thereby collapsing the trust.
A Fund may purchase an inverse floating rate security in a secondary market transaction without first owning the underlying bond (referred to as an “externally-deposited inverse floater”), or instead by first selling a fixed-rate bond to a broker-dealer for deposit into the special purpose trust and receiving in turn the residual interest in the trust (referred to as a “self-deposited inverse floater”).
An investment in an externally-deposited inverse floater is identified in the Portfolio of Investments as “(IF) – Inverse floating rate investment.” The Fund’s Statement of Assets and Liabilities shows only the inverse floaters and not the underlying bonds as an asset, and does not reflect the short-term floating rate certificates as liabilities. Also, the Fund reflects in “Investment Income” only the net amount of earnings on its inverse floater investment (net of the interest paid to the holders of the short-term floating rate certificates and the expenses of the trust), and does not show the amount of that interest paid as an interest expense on the Statement of Operations.
An investment in a self-deposited inverse floater is accounted for as a financing transaction. In such instances, a fixed-rate bond deposited into a special purpose trust is identified in the Portfolio of Investments as “(UB) – Underlying bond of an inverse floating rate trust reflected as a financing transaction,” with the Fund accounting for the short-term floating rate certificates issued by the trust, at their liquidation value, as “Floating rate obligations” on the Statement of Assets and Liabilities. In addition, the Fund reflects in “Investment Income” the entire earnings of the underlying bond and recognizes the related interest paid to the holders of the short-term floating rate certificates as a component of “Interest expense and amortization of offering costs” on the Statement of Operations.
The average floating rate obligations outstanding and average annual interest rate and fees related to self-deposited inverse floaters during the six months ended April 30, 2014, were as follows:
| | | | | | | | | | Dividend | | | AMT-Free | |
| | | | Quality | | | Opportunity | | | Advantage | | | Income | |
| | | | (NQI | ) | | (NIO | ) | | (NVG | ) | | (NEA | ) |
| Average floating rate obligations outstanding | | $ | 35,144,420 | | $ | 93,825,543 | | $ | 18,606,373 | | $ | 62,283,094 | |
| Average annual interest rate and fees | | | 0.47 | % | | 0.55 | % | | 0.57 | % | | 0.54 | % |
As of April 30, 2014, the total amount of floating rate obligations issued by each Fund’s self-deposited inverse floaters and externally-deposited inverse floaters was as follows:
| | | | | | | | | | Dividend | | | AMT-Free | |
| | | | Quality | | | Opportunity | | | Advantage | | | Income | |
| | | | (NQI | ) | | (NIO | ) | | (NVG | ) | | (NEA | ) |
| Floating rate obligations: self-deposited inverse floaters | | $ | 29,590,000 | | $ | 92,198,333 | | $ | 18,228,334 | | $ | 57,495,000 | |
| Floating rate obligations: externally-deposited inverse floaters | | | 52,100,000 | | | 142,351,667 | | | 48,421,666 | | | 108,410,000 | |
| Total | | $ | 81,690,000 | | $ | 234,550,000 | | $ | 66,650,000 | | $ | 165,905,000 | |
Each Fund may also enter into shortfall and forbearance agreements (sometimes referred to as a “recourse trust” or “credit recovery swap”) (such agreements referred to herein as “Recourse Trusts”) with a broker-dealer by which a Fund agrees to reimburse the broker-dealer, in certain circumstances, for the difference between the liquidation value of the fixed-rate bond held by the trust and the liquidation value of the floating rate certificates issued by the trust plus any shortfalls in interest cash flows. Under these agreements, a Fund’s potential exposure to losses related to or on inverse floaters may increase beyond the value of a Fund’s inverse floater investments as a Fund may potentially be liable to fulfill all amounts owed to holders of the floating rate certificates. At period end, any such shortfall is recognized as “Unrealized depreciation on Recourse Trusts” on the Statement of Assets and Liabilities.
As of April 30, 2014, each Fund’s maximum exposure to the floating rate obligations issued by externally-deposited Recourse Trusts was as follows:
| | | | | | | | | | Dividend | | | AMT-Free | |
| | | | Quality | | | Opportunity | | | Advantage | | | Income | |
| | | | (NQI | ) | | (NIO | ) | | (NVG | ) | | (NEA | ) |
| Maximum exposure to Recourse Trusts | | $ | 26,610,000 | | $ | 96,535,000 | | $ | 12,240,000 | | $ | 51,845,000 | |
Zero Coupon Securities
A zero coupon security does not pay a regular interest coupon to its holders during the life of the security. Income to the holder of the security comes from accretion of the difference between the original purchase price of the security at issuance and the par value of the security at maturity and is effectively paid at maturity. The market prices of zero coupon securities generally are more volatile than the market prices of securities that pay interest periodically.
Investments in Derivatives
Each Fund is authorized to invest in certain derivative instruments such as futures, options and swap contracts. Each Fund will limit its investments in futures, options on futures and swap contracts to the extent necessary for the Adviser to claim the exclusion from registration by the Commodity Futures Trading Commission as a commodity pool operator with respect to the Fund. The Funds record derivative instruments at fair value, with changes in fair value recognized on the Statement of Operations, when applicable. Even though the Funds’ investments in derivatives may represent economic hedges, they are not considered to be hedge transactions for financial reporting purposes.
Swap Contracts
Interest rate swap contracts involve a Fund’s agreement with the counterparty to pay or receive a fixed rate payment in exchange for the counterparty receiving or paying a variable rate payment. Forward interest rate swap transactions involve a Fund’s agreement with a counterparty to pay or receive, in the future, a fixed or variable rate payment in exchange for the counterparty receiving or paying the Fund a variable or fixed rate payment, the accruals for which would begin at a specified date in the future (the “effective date”). The amount of the payment obligation is based on the notional amount of the swap contract and the termination date of the swap (which is akin to a bond’s maturity). Swap contracts do not involve the delivery of securities or other underlying assets or principal. Accordingly, the risk of loss with respect to the swap counterparty on such transactions is limited to the net amount of interest payments that each Fund is to receive. Swap contracts are valued daily. Upon entering into an interest rate swap contract (and beginning on the effective date for a forward interest rate swap contract), a Fund accrues the fixed rate payment expected to be paid or received and the variable rate payment expected to be received or paid on a daily basis, and recognizes the daily change in the fair value of the Fund’s contractual rights and obligations under the contracts. The net amount recorded for these transactions for each counterparty is recognized on the Statement of Assets and Liabilities as a component of “Unrealized appreciation or depreciation on interest rate swaps (,net)” with the change during the fiscal period recognized on the Statement of Operations as a component of “Change in net unrealized appreciation (depreciation) of swaps.” Income received or paid by a Fund is recognized as a component of “Net realized gain (loss) from swaps” on the Statement of Operations, in addition to the net realized gains or losses recognized upon the termination of a swap contract and are equal to the difference between a Fund’s basis in the swap and the proceeds from (or cost of) the closing transaction. Payments received or made at the beginning of the measurement period are recognized as a component of “Interest rate swap premiums paid and/or received” on the Statement of Assets and Liabilities, when applicable. For tax purposes, periodic payments are treated as ordinary income or expense.
During the six months ended April 30, 2014, AMT-Free Income (NEA) invested in forward interest rate swap contracts to reduce the duration of its portfolio.
Notes to Financial Statements (Unaudited) (continued)
The average notional amount of interest rate swap contracts outstanding during the six months ended April 30, 2014, was as follows:
| | | | AMT-Free | |
| | | | Income | |
| | | | (NEA | ) |
| Average notional amount of interest rate swap contracts outstanding* | | $ | 28,533,333 | |
| * | The average notional amount is calculated based on the outstanding notional at the beginning of the fiscal year and at the end of each fiscal quarter within the current fiscal year. |
The following table presents the fair value of all swap contracts held by AMT-Free Income (NEA) as of April 30, 2014, the location of these instruments on the Statement of Assets and Liabilities and the primary underlying risk exposure.
| | | | | | | Location on the Statement of Assets and Liabilities |
| Underlying | | | Derivative | | | Asset Derivatives | | | (Liability) Derivatives | |
| Risk Exposure | | | Instrument | | | Location | | | Value | | | Location | | | Value | |
| | | | | | | | | | | | | Unrealized depreciation on | | | | |
| Interest rate | | | Swaps | | | — | | $ | — | | | interest rate swaps | | $ | (4,414,736 | ) |
The following table presents the Fund’s swap contacts subject to netting agreements as of the end of the reporting period, and the collateral delivered related to those swap contracts.
| | | | | | | Gross | | | Gross | | | Amounts | | | Net Unrealized | | | | | | | |
| | | | | | | Unrealized | | | Unrealized | | | Netted on | | | Appreciation | | | Collateral | | | | |
| | | | | | | Appreciation | | | (Depreciation | ) | | Statement of | | | (Depreciation | ) | | Pledged | | | | |
| | | | | | | on Interest | | | on Interest | | | Assets and | | | on Interest | | | to (from | ) | | Net | |
| Fund | | | Counterparty | | | Rate Swaps* | | | Rate Swaps* | | | Liabilities | | | Rate Swaps | | | Counterparty | | | Exposure | |
| AMT-Free Income (NEA) | | | Barclays PLC | | $ | — | | $ | (4,414,736 | ) | $ | — | | $ | (4,414,736 | ) | $ | 4,414,736 | | $ | — | |
The following table presents the amount of net realized gain (loss) and change in net unrealized appreciation (depreciation) recognized on swap contracts on the Statement of Operations during the six months ended April 30, 2014, and the primary underlying risk exposure.
| | | | | | | | | | | | | | |
| | | | Underlying | | | Derivative | | | Net Realized | | | Change in Net Unrealized | |
| Fund | | | Risk Exposure | | | Instrument | | | Gain (Loss) from Swaps | | Appreciation (Depreciation) of Swaps | |
| AMT-Free Income (NEA) | | | Interest rate | | | Swaps | | $ | — | | $ | (4,414,736 | ) |
Market and Counterparty Credit Risk
In the normal course of business each Fund may invest in financial instruments and enter into financial transactions where risk of potential loss exists due to changes in the market (market risk) or failure of the other party to the transaction to perform (counterparty credit risk). The potential loss could exceed the value of the financial assets recorded on the financial statements. Financial assets, which potentially expose each Fund to counterparty credit risk, consist principally of cash due from counterparties on forward, option and swap transactions, when applicable. The extent of each Fund’s exposure to counterparty credit risk in respect to these financial assets approximates their carrying value as recorded on the Statement of Assets and Liabilities.
Each Fund helps manage counterparty credit risk by entering into agreements only with counterparties the Adviser believes have the financial resources to honor their obligations and by having the Adviser monitor the financial stability of the counterparties. Additionally, counterparties may be required to pledge collateral daily (based on the daily valuation of the financial asset) on behalf of each Fund with a value approximately equal to the amount of any unrealized gain above a pre-determined threshold. Reciprocally, when each Fund has an unrealized loss, the Funds have instructed the custodian to pledge assets of the Funds as collateral with a value approximately equal to the amount of the unrealized loss above a pre-determined threshold. Collateral pledges are monitored and subsequently adjusted if and when the valuations fluctuate, either up or down, by at least the pre-determined threshold amount.
4. Fund Shares
Common Shares
During the fiscal year ended October 31, 2013, AMT-Free Income (NEA) issued 56,638,035 common shares in connection with its reorganizations.
Transactions in common shares were as follows:
| | | | Quality (NQI) | | | Opportunity (NIO) | |
| | | | Six Months | | | Year | | | Six Months | | | Year | |
| | | | Ended | | | Ended | | | Ended | | | Ended | |
| | | | 4/30/14 | | | 10/31/13 | | | 4/30/14 | | | 10/31/13 | |
| Common shares issued to shareholders due to reinvestment of distributions | | | — | | | 8,989 | | | — | | | — | |
| | | | Dividend Advantage (NVG) | | | AMT-Free Income (NEA) | |
| | | | Six Months | | | Year | | | Six Months | | | Year | |
| | | | Ended | | | Ended | | | Ended | | | Ended | |
| | | | 4/30/14 | | | 10/31/13 | | | 4/30/14 | | | 10/31/13 | |
| Common shares: | | | | | | | | | | | | | |
| Issued to shareholders due to reinvestment of distributions | | | — | | | — | | | — | | | 1,212 | |
| Repurchased and retired | | | (96,342 | ) | | (64,858 | ) | | — | | | — | |
| Weighted average common share: | | | | | | | | | | | | | |
| Price per share repurchased and retired | | | 12.49 | | $ | 12.58 | | | — | | | — | |
| Discount per share repurchased and retired | | | 13.84 | % | | 13.31 | | | — | | | — | |
Preferred Shares
Transactions in preferred shares for the Funds during the six months ended April 30, 2014 and the fiscal year ended October 31, 2013, where applicable, were as noted in the following tables.
Transactions in MTP Shares for the Funds were as follows:
| | | | Six Months Ended 4/30/14 |
| | | | | | | NYSE | | | | | | | |
| Dividend Advantage (NVG) | | | Series | | | Ticker | | | Shares | | | Amount | |
| MTP Shares redeemed | | | 2014 | | | NVG PRCCL | | | (10,800,000 | ) | $ | (108,000,000 | ) |
| AMT-Free Income (NEA) | | | | | | | | | | | | | |
| MTP Shares redeemed | | | 2015 | | | NEA PRCCL | | | (8,300,000 | ) | $ | (83,000,000 | ) |
Transactions in VMTP Shares for the Funds were as follows:
| | | | Six Months Ended 4/30/14 |
| Dividend Advantage (NVG) | | | Series | | | Shares | | | Amount | |
| VMTP Shares redeemed | | | 2014 | | | (925 | ) | $ | (92,500,000 | ) |
| AMT-Free Income (NEA) | | | | | | | | | | |
| VMTP Shares issued | | | 2016 | | | 1,510 | | $ | 151,000,000 | |
| VMTP Shares redeemed | | | 2014 | | | (676 | ) | | (67,600,000 | ) |
| Net increase (decrease) | | | | | | 834 | | $ | 83,400,000 | |
| | | | Year Ended October 31, 2013 |
| Quality (NQI) | | | Series | | | Shares | | | Amount | |
| VMTP Shares issued | | | 2015 | | | 2,404 | | $ | 240,400,000 | |
| VTMP Shares exchanged | | | 2014 | | | (2,404 | ) | | (240,400,000 | ) |
| Total | | | | | | — | | $ | — | |
Transactions in VRDP Shares for the Funds were as follows:
| | | | Six Months Ended 4/30/14 |
| AMT-Free Income (NEA) | | | Series | | | Shares | | | Amount | |
| VRDP Shares issued | | | 1 | | | 2,010 | | $ | 201,000,000 | |
| | | | | | | | | | | |
| | | | Year Ended October 31, 2013 |
| AMT-Free Income (NEA) | | | Series | | | Shares | | | Amount | |
| VRDP Shares issued in connection with the reorganizations: | | | | | | | | | | |
| | | | 1 | | | 1,309 | | $ | 130,900,000 | |
| | | | 2 | | | 2,190 | | | 219,000,000 | |
| Total | | | | | | 3,499 | | $ | 349,900,000 | |
Notes to Financial Statements (Unaudited) (continued)
5. Investment Transactions
Purchases and sales (including maturities but excluding short-term investments and investments in derivatives, where applicable) during the six months ended April 30, 2014, were as follows:
| | | | | | | | | | | | | | |
| | | | | | | | | | Dividend | | | AMT-Free | |
| | | | Quality | | | Opportunity | | | Advantage | | | Income | |
| | | | (NQI | ) | | (NIO | ) | | (NVG | ) | | (NEA | ) |
| Purchases | | $ | 56,808,187 | | $ | 90,103,136 | | $ | 49,767,302 | | $ | 105,568,428 | |
| Sales and maturities | | | 57,861,361 | | | 115,456,459 | | | 28,579,946 | | | 126,015,340 | |
6. Income Tax Information
Each Fund is a separate taxpayer for federal income tax purposes. Each Fund intends to distribute substantially all of its net investment income and net capital gains to shareholders and to otherwise comply with the requirements of Subchapter M of the Internal Revenue Code applicable to regulated investment companies. Therefore, no federal income tax provision is required. Furthermore, each Fund intends to satisfy conditions that will enable interest from municipal securities, which is exempt from regular federal income tax, and in the case of AMT-Free Income (NEA) the alternative minimum tax applicable to individuals, to retain such tax-exempt status when distributed to shareholders of the Funds. Net realized capital gains and ordinary income distributions paid by the Funds are subject to federal taxation.
For all open tax years and all major taxing jurisdictions, management of the Funds has concluded that there are no significant uncertain tax positions that would require recognition in the financial statements. Open tax years are those that are open for examination by taxing authorities (i.e., generally the last four tax year ends and the interim tax period since then). Furthermore, management of the Funds is also not aware of any tax positions for which it is reasonably possible that the total amounts of unrecognized tax benefits will significantly change in the next twelve months.
The following information is presented on an income tax basis. Differences between amounts for financial statement and federal income tax purposes are primarily due to timing differences in recognizing taxable market discount, timing differences in recognizing certain gains and losses on investment transactions and the treatment of investments in inverse floating rate securities reflected as financing transactions, if any. To the extent that differences arise that are permanent in nature, such amounts are reclassified within the capital accounts as detailed below. Temporary differences do not require reclassification. Temporary and permanent differences do not impact the NAVs of the Funds.
As of April 30, 2014, the cost and unrealized appreciation (depreciation) of investments (excluding investments in derivatives, where applicable), as determined on a federal income tax basis, were as follows:
| | | | | | | | | | | | | | |
| | | | | | | | | | Dividend | | | AMT-Free | |
| | | | Quality | | | Opportunity | | | Advantage | | | Income | |
| | | | (NQI | ) | | (NIO | ) | | (NVG | ) | | (NEA | ) |
| Cost of investments | | $ | 738,130,094 | | $ | 1,949,989,869 | | $ | 611,361,309 | | $ | 1,532,330,905 | |
| Gross unrealized: | | | | | | | | | | | | | |
| Appreciation | | | 52,464,187 | | | 142,045,752 | | | 49,119,875 | | | 104,812,879 | |
| Depreciation | | | (8,642,784 | ) | | (21,359,355 | ) | | (11,330,973 | ) | | (29,000,719 | ) |
| Net unrealized appreciation (depreciation) of investments | | $ | 43,821,403 | | $ | 120,686,397 | | $ | 37,788,902 | | $ | 75,812,160 | |
Permanent differences, primarily due to federal taxes paid, taxable market discount, nondeductible offering costs, nondeductible reorganization expense and reorganization adjustments, resulted in reclassifications among the Funds’ components of common share net assets as of October 31, 2013, the Funds’ last tax year end, as follows:
| | | | | | | | | | | | | | |
| | | | | | | | | | Dividend | | | AMT-Free | |
| | | | Quality | | | Opportunity | | | Advantage | | | Income | |
| | | | (NQI | ) | | (NIO | ) | | (NVG | ) | | (NEA | ) |
| Paid-in surplus | | $ | (719,769 | ) | $ | 5,064 | | $ | (162,043 | ) | $ | 11,860,304 | |
| Undistributed (Over-distribution of) net investment income | | | 615,552 | | | (49,725 | ) | | 321,525 | | | 2,934,999 | |
| Accumulated net realized gain (loss) | | | 104,217 | | | 44,661 | | | (159,482 | ) | | (14,795,303 | ) |
The tax components of undistributed net tax-exempt income, net ordinary income and net long-term capital gains as of October 31, 2013, the Funds’ last tax year end, were as follows:
| | | | | | | | | | | | | | |
| | | | | | | | | | Dividend | | | AMT-Free | |
| | | | Quality | | | Opportunity | | | Advantage | | | Income | |
| | | | (NQI | ) | | (NIO | ) | | (NVG | ) | | (NEA | ) |
Undistributed net tax-exempt income1 | | $ | 3,112,345 | | $ | 20,879,039 | | $ | 3,100,825 | | $ | 11,158,087 | |
Undistributed net ordinary income2 | | | 46,445 | | | 463,231 | | | 591,284 | | | 16,609 | |
| Undistributed net long-term capital gains | | | — | | | — | | | 1,790,638 | | | — | |
| 1 | Undistributed net tax-exempt income (on a tax basis) has not been reduced for the dividend declared on October 1, 2013, paid on November 1, 2013. |
| 2 | Net ordinary income consists of taxable market discount income and net short-term capital gains, if any. |
The tax character of distributions paid during the Funds’ last tax year ended October 31, 2013 was designated for purposes of the dividends paid deduction as follows:
| | | | | | | | | | Dividend | | | AMT-Free | |
| | | | Quality | | | Opportunity | | | Advantage | | | Income | |
| | | | (NQI | ) | | (NIO | ) | | (NVG | ) | | (NEA | ) |
| Distributions from net tax-exempt income | | $ | 35,837,331 | | $ | 85,181,792 | | $ | 26,806,718 | | $ | 34,564,740 | |
Distributions from net ordinary income2 | | | — | | | — | | | 247,364 | | | — | |
| Distributions from net long-term capital gains | | | — | | | — | | | 3,185,930 | | | — | |
| 2 | Net ordinary income consists of taxable market discount income and net short-term capital gains, if any. |
As of October 31, 2013, the Funds’ last tax year end, the following Funds had unused capital loss carryforwards available for federal income tax purposes to be applied against future capital gains, if any. If not applied, the carryforwards will expire as shown in the following table. The losses not subject to expiration retain the character reflected and will be utilized first by a Fund, while the losses subject to expiration are considered short-term.
| | | | | | | | | | | |
| | | | | | | | | | AMT-Free | |
| | | | Quality | | | Opportunity | | | Income | |
| | | | (NQI | ) | | (NIO | ) | | (NEA | ) |
| Expiration: | | | | | | | | | | |
| October 31, 2015 | | $ | — | | $ | — | | $ | 2,809,878 | |
| October 31, 2016 | | | 2,623,034 | | | — | | | 2,374,066 | |
| October 31, 2017 | | | 217,918 | | | — | | | — | |
| October 31, 2018 | | | 322,087 | | | — | | | — | |
| Not subject to expiration: | | | | | | | | | | |
| Short-term losses | | | — | | | — | | | — | |
| Long-term losses | | | 17,643,419 | | | 9,289,619 | | | — | |
| Total | | $ | 20,806,458 | | $ | 9,289,619 | | $ | 5,183,944 | |
During the Funds’ last tax year ended October 31, 2013, the following Funds utilized capital loss carryforwards as follows:
| | | | | | | | |
| | | | | | | AMT-Free | |
| | | | Opportunity | | | Income | |
| | | | (NIO | ) | | (NEA | ) |
| Utilized capital loss carryforwards | | $ | 4,352,999 | | $ | 1,972,985 | |
As of October 31, 2013, the Funds’ last tax year end, $204,894 of AMT-Free Income’s (NEA) capital loss carryforward expired.
7. Management Fees and Other Transactions with Affiliates
Each Fund’s management fee compensates the Adviser for overall investment advisory and administrative services and general office facilities. The Sub-Adviser is compensated for its services to the Funds from the management fees paid to the Adviser.
Each Fund’s management fee consists of two components – a fund-level fee, based only on the amount of assets within the Fund, and a complex-level fee, based on the aggregate amount of all eligible fund assets managed by the Adviser. This pricing structure enables Fund shareholders to benefit from growth in the assets within their respective Fund as well as from growth in the amount of complex-wide assets managed by the Adviser.
Notes to Financial Statements (Unaudited) (continued)
The annual fund-level fee for each Fund, payable monthly, is calculated according to the following schedules:
| | | | |
| | | Quality (NQI) |
| | | Opportunity (NIO) |
| Average Daily Managed Assets* | | Fund-Level Fee Rate |
| For the first $125 million | | .4500 | % |
| For the next $125 million | | .4375 | |
| For the next $250 million | | .4250 | |
| For the next $500 million | | .4125 | |
| For the next $1 billion | | .4000 | |
| For the next $3 billion | | .3875 | |
| For managed assets over $5 billion | | .3750 | |
| | | | |
| | | Dividend Advantage (NVG) |
| | | AMT-Free Income (NEA) |
| Average Daily Managed Assets* | | Fund-Level Fee Rate |
| For the first $125 million | | .4500 | % |
| For the next $125 million | | .4375 | |
| For the next $250 million | | .4250 | |
| For the next $500 million | | .4125 | |
| For the next $1 billion | | .4000 | |
| For managed assets over $2 billion | | .3750 | |
The annual complex-level fee for each Fund, payable monthly, is calculated according to the following schedule:
| | | | |
| Complex-Level Managed Asset Breakpoint Level* | | Effective Rate at Breakpoint Level |
| $55 billion | | .2000 | % |
| $56 billion | | .1996 | |
| $57 billion | | .1989 | |
| $60 billion | | .1961 | |
| $63 billion | | .1931 | |
| $66 billion | | .1900 | |
| $71 billion | | .1851 | |
| $76 billion | | .1806 | |
| $80 billion | | .1773 | |
| $91 billion | | .1691 | |
| $125 billion | | .1599 | |
| $200 billion | | .1505 | |
| $250 billion | | .1469 | |
| $300 billion | | .1445 | |
| * | For the fund-level and complex-level fees, managed assets include closed-end fund assets managed by the Adviser that are attributable to certain types of leverage. For these purposes, leverage includes the funds’ use of preferred stock and borrowings and certain investments in the residual interest certificates (also called inverse floating rate securities) in tender option bond (TOB) trusts, including the portion of assets held by a TOB trust that has been effectively financed by the trust’s issuance of floating rate securities, subject to an agreement by the Adviser as to certain funds to limit the amount of such assets for determining managed assets in certain circumstances. The complex-level fee is calculated based upon the aggregate daily managed assets of all Nuveen Funds that constitute “eligible assets.” Eligible assets do not include assets attributable to investments in other Nuveen Funds or assets in excess of $2 billion added to the Nuveen Fund complex in connection with the Adviser‘s assumption of the management of the former First American Funds effective January 1, 2011. As of April 30, 2014, the complex-level fee rate for each of these Funds was .1661%. |
The Funds pay no compensation directly to those of its directors/trustees who are affiliated with the Adviser or to its officers, all of whom receive remuneration for their services to the Funds from the Adviser or its affiliates. The Board of Directors/Trustees has adopted a deferred compensation plan for independent directors/trustees that enables directors/trustees to elect to defer receipt of all or a portion of the annual compensation they are entitled to receive from certain Nuveen-advised funds. Under the plan, deferred amounts are treated as though equal dollar amounts had been invested in shares of select Nuveen-advised funds.
| Additional |
| | Fund Information |
| Board of Directors/Trustees | | | | | | | | |
| William Adams IV* | | Robert P. Bremner | | Jack B. Evans | | William C. Hunter | | David J. Kundert | | John K. Nelson |
| William J. Schneider | | Thomas S. Schreier, Jr.* | | Judith M. Stockdale | | Carole E. Stone | | Virginia L. Stringer | | Terence J. Toth |
| | | | | | | | | | | |
| * Interested Board Member. | | | | | | | | |
| | | | | | | | | | | |
| Fund Manager | | Custodian | | Legal Counsel | | Independent Registered | | Transfer Agent and |
| Nuveen Fund Advisors, LLC | | State Street Bank | | Chapman and Cutler LLP | | Public Accounting Firm | | Shareholder Services |
| 333 West Wacker Drive | | & Trust Company | | Chicago, IL 60603 | | Ernst & Young LLP | | State Street Bank |
| Chicago, IL 60606 | | Boston, MA 02111 | | | | Chicago, IL 60606 | | & Trust Company |
| | | | | | | | | Nuveen Funds |
| | | | | | | | | P.O. Box 43071 |
| | | | | | | | | Providence, RI 02940-3071 |
| | | | | | | | | (800) 257-8787 |
| | | | | | | | | |
Quarterly Form N-Q Portfolio of Investments Information
Each Fund is required to file its complete schedule of portfolio holdings with the Securities and Exchange Commission (SEC) for the first and third quarters of each fiscal year on Form N-Q. You may obtain this information directly from the SEC. Visit the SEC on-line at http://www.sec.gov or in person at the SEC’s Public Reference Room in Washington, D.C. Call the SEC toll-free at (800) SEC-0330 for room hours and operation.
Nuveen Funds’ Proxy Voting Information
You may obtain (i) information regarding how each fund voted proxies relating to portfolio securities held during the most recent twelve-month period ended June 30, without charge, upon request, by calling Nuveen Investments toll-free at (800) 257-8787 or on Nuveen’s website at www.nuveen.com and (ii) a description of the policies and procedures that each fund used to determine how to vote proxies relating to portfolio securities without charge, upon request, by calling Nuveen Investments toll free at (800) 257-8787. You may also obtain this information directly from the SEC. Visit the SEC on-line at http://www.sec.gov.
CEO Certification Disclosure
Each Fund’s Chief Executive Officer (CEO) has submitted to the New York Stock Exchange (NYSE) the annual CEO certification as required by Section 303A.12(a) of the NYSE Listed Company Manual. Each Fund has filed with the SEC the certification of its CEO and Chief Financial Officer required by Section 302 of the Sarbanes-Oxley Act.
Common Share Information
Each Fund intends to repurchase shares of its own common stock at such times and in such amounts as is deemed advisable. During the period covered by this report, each Fund repurchased shares of its common stock as shown in the accompanying table. Any future repurchases will be reported to shareholders in the next annual or semi-annual report.
| | | | NQI | | | NIO | | | NVG | | | NEA | |
| Common shares repurchased | | | — | | | — | | | 96,342 | | | — | |
FINRA BrokerCheck: The Financial Industry Regulatory Authority (FINRA) provides information regarding the disciplinary history of FINRA member firms and associated investment professionals. This information as well as an investor brochure describing FINRA BrokerCheck is available to the public by calling the FINRA BrokerCheck Hotline number at (800) 289-9999 or by visiting www.FINRA.org.
Glossary of Terms
Used in this Report
| ■ | Auction Rate Bond: An auction rate bond is a security whose interest payments are adjusted periodically through an auction process, which process typically also serves as a means for buying and selling the bond. Auctions that fail to attract enough buyers for all the shares offered for sale are deemed to have “failed,” with current holders receiving a formula-based interest rate until the next scheduled auction. |
| | |
| ■ | Average Annual Total Return: This is a commonly used method to express an investment’s performance over a particular, usually multi-year time period. It expresses the return that would have been necessary each year to equal the investment’s actual cumulative performance (including change in NAV or market price and reinvested dividends and capital gains distributions, if any) over the time period being considered. |
| | |
| ■ | Duration: Duration is a measure of the expected period over which a bond’s principal and interest will be paid, and consequently is a measure of the sensitivity of a bond’s or bond fund’s value to changes when market interest rates change. Generally, the longer a bond’s or fund’s duration, the more the price of the bond or fund will change as interest rates change. |
| | |
| ■ | Effective Leverage: Effective leverage is a fund’s effective economic leverage, and includes both regulatory leverage (see leverage) and the leverage effects of certain derivative investments in the fund’s portfolio. Currently, the leverage effects of Tender Option Bond (TOB) inverse floater holdings are included in effective leverage values, in addition to any regulatory leverage. |
| | |
| ■ | Forward Interest Rate Swap: A contractual agreement between two counterparties under which one party agrees to make periodic payments to the other for an agreed period of time based on a fixed rate, while the other party agrees to make periodic payments based on a floating rate of interest based on an underlying index. Alternatively, both series of cash flows to be exchanged could be calculated using floating rates of interest but floating rates that are based upon different underlying indexes. |
| | |
| ■ | Gross Domestic Product (GDP): The total market value of all final goods and services produced in a country/region in a given year, equal to total consumer, investment and government spending, plus the value of exports, minus the value of imports. |
| | |
| ■ | Inverse Floating Rate Securities: Inverse floating rate securities, also known as inverse floaters or tender option bonds (TOBs), are created by depositing a municipal bond, typically with a fixed interest rate, into a special purpose trust created by a broker-dealer. This trust, in turn, (a) issues floating rate certificates typically paying short-term tax-exempt interest rates to third parties in amounts equal to some fraction of the deposited bond’s par amount or market value, and (b) issues an inverse floating rate certificate (sometimes referred to as an “inverse floater”) to an investor (such as a fund) interested in gaining investment exposure to a long-term municipal bond. The income received by the holder of the inverse floater varies inversely with the short-term rate paid to the floating rate certificates’ holders, and in most circumstances the holder of the inverse floater bears substantially all of the underlying bond’s downside investment risk. The holder of the inverse floater typically also benefits disproportionately from any potential appreciation of the underlying bond’s value. Hence, an inverse floater essentially represents an investment in the underlying bond on a leveraged basis. |
| | |
| ■ | Leverage: Leverage is created whenever a fund has investment exposure (both reward and/or risk) equivalent to more than 100% of the investment capital. |
| | |
| ■ | Lipper General & Insured Leveraged Municipal Debt Funds Classification Average: Calculated using the returns of all closed-end funds in this category. Lipper returns account for the effects of management fees and assume reinvestment of distributions, but do not reflect any applicable sales charges. |
| ■ | Net Asset Value (NAV) Per Share: A fund’s Net Assets is equal to its total assets (securities, cash, accrued earnings and receivables) less its total liabilities. NAV per share is equal to the fund’s Net Assets divided by its number of shares outstanding. |
| | |
| ■ | Pre-Refunding: Pre-Refunding, also known as advanced refundings or refinancings, is a procedure used by state and local governments to refinance municipal bonds to lower interest expenses. The issuer sells new bonds with a lower yield and uses the proceeds to buy U.S. Treasury securities, the interest from which is used to make payments on the higher-yielding bonds. Because of this collateral, pre-refunding generally raises a bond’s credit rating and thus its value. |
| | |
| ■ | Regulatory Leverage: Regulatory leverage consists of preferred shares issued by or borrowings of a fund. Both of these are part of a fund’s capital structure. Regulatory leverage is subject to asset coverage limits set in the Investment Company Act of 1940. |
| | |
| ■ | S&P Municipal Bond Index: An unleveraged, market value-weighted index designed to measure the performance of the tax-exempt, investment-grade U.S. municipal bond market. Index returns assume reinvestment of distributions but do not reflect any applicable sales charges or management fees. |
| | |
| ■ | Total Investment Exposure: Total investment exposure is a fund’s assets managed by the Adviser that are attributable to financial leverage. For these purposes, financial leverage includes a fund’s use of preferred stock and borrowings and investments in the residual interest certificates (also called inverse floating rate securities) in tender option bond (TOB) trusts, including the portion of assets held by a TOB trust that has been effectively financed by the trust’s issuance of floating rate securities. |
| | |
| ■ | Zero Coupon Bond: A zero coupon bond does not pay a regular interest coupon to its holders during the life of the bond. Tax-exempt income to the holder of the bond comes from accretion of the difference between the original purchase price of the bond at issuance and the par value of the bond at maturity and is effectively paid at maturity. The market prices of zero coupon bonds generally are more volatile than the market prices of bonds that pay interest periodically. |
| Reinvest Automatically, |
| | Easily and Conveniently |
Nuveen makes reinvesting easy. A phone call is all it takes to set up your reinvestment account.
Nuveen Closed-End Funds Automatic Reinvestment Plan
Nuveen Closed-End Fund allows you to conveniently reinvest distributions in additional Fund shares. By choosing to reinvest, you’ll be able to invest money regularly and automatically, and watch your investment grow through the power of compounding. Just like distributions in cash, there may be times when income or capital gains taxes may be payable on distributions that are reinvested. It is important to note that an automatic reinvestment plan does not ensure a profit, nor does it protect you against loss in a declining market.
Easy and convenient
To make recordkeeping easy and convenient, each month you’ll receive a statement showing your total distributions, the date of investment, the shares acquired and the price per share, and the total number of shares you own.
How shares are purchased
The shares you acquire by reinvesting will either be purchased on the open market or newly issued by the Fund. If the shares are trading at or above net asset value at the time of valuation, the Fund will issue new shares at the greater of the net asset value or 95% of the then-current market price. If the shares are trading at less than net as -set value, shares for your account will be purchased on the open market. If the Plan Agent begins purchasing Fund shares on the open market while shares are trading below net asset value, but the Fund’s shares subsequently trade at or above their net asset value before the Plan Agent is able to complete its purchases, the Plan Agent may cease open-market purchases and may invest the uninvested portion of the distribution in newly-issued Fund shares at a price equal to the greater of the shares’ net asset value or 95% of the shares’ market value on the last business day imme -diately prior to the purchase date. Distributions received to purchase shares in the open market will normally be invested shortly after the distribution payment date. No interest will be paid on distributions awaiting reinvestment. Because the market price of the shares may increase before purchases are completed, the average purchase price per share may exceed the market price at the time of valuation, resulting in the acquisition of fewer shares than if the distribution had been paid in shares issued by the Fund. A pro rata portion of any applicable brokerage commissions on open market purchases will be paid by Plan participants. These commissions usually will be lower than those charged on individual transactions.
Flexible
You may change your distribution option or withdraw from the Plan at any time, should your needs or situation change. You can reinvest whether your shares are registered in your name, or in the name of a brokerage firm, bank, or other nominee. Ask your investment advisor if his or her firm will participate on your behalf. Participants whose shares are registered in the name of one firm may not be able to transfer the shares to another firm and continue to participate in the Plan. The Fund reserves the right to amend or terminate the Plan at any time. Although the Fund reserves the right to amend the Plan to include a service charge payable by the participants, there is no direct service charge to participants in the Plan at this time.
Call today to start reinvesting distributions
For more information on the Nuveen Automatic Reinvestment Plan or to enroll in or withdraw from the Plan, speak with your financial advisor or call us at (800) 257-8787.
| Annual Investment Management |
| | Agreement Approval Process (Unaudited) |
I. The Approval Process
The Board of Trustees or Directors (as the case may be) of each Fund (each, a “Board” and each Trustee or Director, a “Board Member”), including the Board Members who are not parties to the Funds’ advisory or sub-advisory agreements or “interested persons” of any such parties (the “Independent Board Members”), is responsible for overseeing the performance of the investment adviser and the sub-adviser to the respective Fund and determining whether to approve or continue such Fund’s advisory agreement (each, an “Original Investment Management Agreement”) between the Fund and Nuveen Fund Advisors, LLC (the “Adviser”) and sub-advisory agreement (each, an “Original Sub-Advisory Agreement” and, together with the Original Investment Management Agreement, the “Original Advisory Agreements”) between the Adviser and Nuveen Asset Management, LLC (the “Sub-Adviser”). Pursuant to the Investment Company Act of 1940, as amended (the “1940 Act”), each Board is required to consider the continuation of the respective Original Advisory Agreements on an annual basis. In addition, prior to its annual review, the Board Members were advised of the potential acquisition of Nuveen Investments, Inc. (“Nuveen”) by TIAA-CREF (the “Transaction”). For purposes of this section, references to “Nuveen” herein include all affiliates of Nuveen Investments, Inc. providing advisory, sub-advisory, distribution or other services to the Funds and references to the “Board” refer to the Board of each Fund. In accordance with the 1940 Act and the terms of the Original Advisory Agreements, the completion of the Transaction would terminate each of the Original Investment Management Agreements and the Original Sub-Advisory Agreements. Accordingly, at an in-person meeting held on April 30, 2014 (the “April Meeting”), the Board, including all of the Independent Board Members, performed its annual review of the Original Advisory Agreements and approved the continuation of the Original Advisory Agreements for the Funds. Furthermore, in anticipation of the termination of the Original Advisory Agreements that would occur upon the consummation of the Transaction, the Board also approved for each Fund a new advisory agreement (each, a “New Investment Management Agreement”) between the Fund and the Adviser and a new sub-advisory agreement (each, a “New Sub-Advisory Agreement” and, together with the New Investment Management Agreement, the “New Advisory Agreements”) between the Adviser and the Sub-Adviser, each on behalf of the respective Fund to be effective following the completion of the Transaction and the receipt of the requisite shareholder approval.
Leading up to the April Meeting, the Independent Board Members had several meetings and deliberations, with and without management from Nuveen present and with the advice of legal counsel, regarding the Original Advisory Agreements, the Transaction and its impact and the New Advisory Agreements. At its meeting held on February 25-27, 2014 (the “February Meeting”), the Board Members met with a senior executive representative of TIAA-CREF to discuss the proposed Transaction. At the February Meeting, the Independent Board Members also established an ad hoc committee comprised solely of the Independent Board Members to monitor and evaluate the Transaction and to keep the Independent Board Members updated with developments regarding the Transaction. On March 20, 2014, the ad hoc committee met telephonically to discuss with management of Nuveen, and separately with independent legal counsel, the terms of the proposed Transaction and its impact on, among other things: the governance structure of Nuveen; the strategic plans for Nuveen; the operations of the Nuveen funds (which include the Funds); the quality or level of services provided to the Nuveen funds; key personnel that service the Nuveen funds and/or the Board and the compensation or incentive arrangements to retain such personnel; Nuveen’s capital structure; the regulatory requirements applicable to Nuveen or fund operations; and the Nuveen funds’ fees and expenses, including the funds’ complex-wide fee arrangement. Following the meeting of the ad hoc committee, the Board met in person (two Independent Board Members participating telephonically) in an executive session on March 26, 2014 to further discuss the proposed Transaction. At the executive session, the Board met privately with independent legal counsel to review its duties with respect to reviewing advisory agreements, particularly in the context of a change of control, and to evaluate further the Transaction and its impact on the Nuveen funds, the Adviser and the Sub-Adviser (collectively, the “Fund Advisers” and each, a “Fund Adviser”) and the services provided. Representatives of Nuveen also met with the Board to update the Board Members on developments regarding the Transaction, to respond to questions and to
Annual Investment Management Agreement Approval Process (Unaudited) (continued)
discuss, among other things: the governance of the Fund Advisers following the Transaction; the background, culture (including with respect to regulatory and compliance matters) and resources of TIAA-CREF; the general plans and intentions of TIAA-CREF for Nuveen; the terms and conditions of the Transaction (including financing terms); any benefits or detriments the Transaction may impose on the Nuveen funds, TIAA-CREF or the Fund Advisers; the reaction from the Fund Advisers’ employees knowledgeable of the Transaction; the incentive and retention plans for key personnel of the Fund Advisers; the potential access to additional distribution platforms and economies of scale; and the impact of any additional regulatory schemes that may be applicable to the Nuveen funds given the banking and insurance businesses operated in the TIAA-CREF enterprise. As part of its review, the Board also held a separate meeting on April 15-16, 2014 to review the Nuveen funds’ investment performance and consider an analysis provided by the Adviser of each sub-adviser of the Nuveen funds (including the Sub-Adviser) and the Transaction and its implications to the Nuveen funds. During their review of the materials and discussions, the Independent Board Members presented the Adviser with questions and the Adviser responded. Further, the Independent Board Members met in an executive session with independent legal counsel on April 29, 2014 and April 30, 2014.
In connection with their review of the Original Advisory Agreements and the New Advisory Agreements, the Independent Board Members received extensive information regarding the Funds and the Fund Advisers including, among other things: the nature, extent and quality of services provided by each Fund Adviser; the organization and operations of any Fund Adviser; the expertise and background of relevant personnel of each Fund Adviser; a review of each Fund’s performance (including performance comparisons against the performance of peer groups and appropriate benchmarks); a comparison of Fund fees and expenses relative to peers; a description and assessment of shareholder service levels for the Funds; a summary of the performance of certain service providers; a review of fund initiatives and shareholder communications; and an analysis of the Adviser’s profitability with comparisons to peers in the managed fund business. In light of the proposed Transaction, the Independent Board Members, through their independent legal counsel, also requested in writing and received additional information regarding the proposed Transaction and its impact on the provision of services by the Fund Advisers.
The Independent Board Members received, well in advance of the April Meeting, materials which responded to the request for information regarding the Transaction and its impact on Nuveen and the Nuveen funds including, among other things: the structure and terms of the Transaction; the impact of the Transaction on Nuveen, its operations and the nature, quality and level of services provided to the Nuveen funds, including, in particular, any changes to those services that the Nuveen funds may experience following the Transaction; the strategic plan for Nuveen, including any financing arrangements following the Transaction and any cost-cutting efforts that may impact services; the organizational structure of TIAA-CREF, including the governance structure of Nuveen following the Transaction; any anticipated effect on each Nuveen fund’s expense ratios (including changes to advisory and sub-advisory fees) and economies of scale that may be expected; any benefits or conflicts of interest that TIAA-CREF, Nuveen or their affiliates can expect from the Transaction; any benefits or undue burdens or other negative implications that may be imposed on the Nuveen funds as a result of the Transaction; the impact on Nuveen or the Nuveen funds as a result of being subject to additional regulatory schemes that TIAA-CREF must comply with in operating its various businesses; and the costs associated with obtaining necessary shareholder approvals and the bearer of such costs. The Independent Board Members also received a memorandum describing the applicable laws, regulations and duties in approving advisory contracts, including in conjunction with a change of control, from their independent legal counsel.
The materials and information prepared in connection with the review of the Original Advisory Agreements and New Advisory Agreements supplemented the information and analysis provided to the Board during the year. In this regard, throughout the year, the Board, acting directly or through its committees, regularly reviewed the performance and various services provided by the Adviser and Sub-Adviser. The Board met at least quarterly as well as at other times as the need arose. At its quarterly meetings, the Board reviewed reports by the Adviser regarding, among other things, fund performance, fund expenses, premium and discount levels of closed-end funds, the performance of the investment teams and compliance, regulatory and risk management matters. In addition to regular reports, the Adviser provided special reports to the Board or a committee thereof from time to time to enhance
the Board’s understanding of various topics that impact some or all the Nuveen funds (such as distribution channels, oversight of omnibus accounts and leverage management topics), to update the Board on regulatory developments impacting the investment company industry or to update the Board on the business plans or other matters impacting the Adviser. The Board also met with key investment personnel managing certain Nuveen fund portfolios during the year.
In addition, the Board has created several standing committees (the Executive Committee; the Dividend Committee; the Audit Committee; the Compliance, Risk Management and Regulatory Oversight Committee; the Nominating and Governance Committee; the Open-End Funds Committee; and the Closed-End Funds Committee). The Open-End Funds Committee and Closed-End Funds Committee are intended to assist the full Board in monitoring and gaining a deeper insight into the distinctive business practices of closed-end and open-end funds. These two Committees have met prior to each quarterly Board meeting, and the Adviser provided presentations to these Committees permitting them to delve further into specific matters or initiatives impacting the respective product line.
Further, the Board continued its program of seeking to have the Board Members or a subset thereof visit each sub-adviser to the Nuveen funds and meet key investment and business personnel at least once over a multiple year rotation. In this regard, the Independent Board Members made site visits to certain equity and fixed income teams of the Sub-Adviser in September 2013 and met with the Sub-Adviser’s municipal team at the August and November 2013 quarterly meetings.
The Board considered the information provided and knowledge gained at these meetings and visits during the year when performing its annual review of the Original Advisory Agreements and its review of the New Advisory Agreements. The Independent Board Members also were assisted throughout the process by independent legal counsel. During the course of the year and during their deliberations regarding the review of advisory contracts, the Independent Board Members met with independent legal counsel in executive sessions without management present. In addition, it is important to recognize that the management arrangements for the funds are the result of many years of review and discussion between the Independent Board Members and Nuveen fund management and that the Board Members’ conclusions may be based, in part, on their consideration of fee arrangements and other factors developed in previous years.
The Board considered all factors it believed relevant with respect to each Fund, including, among other things: (a) the nature, extent and quality of the services provided by the Fund Advisers, (b) the investment performance of the Fund and the Fund Advisers, (c) the advisory fees and costs of the services to be provided to the Fund and the profitability of the Fund Advisers, (d) the extent of any economies of scale, (e) any benefits derived by the Fund Advisers from the relationship with the Fund and (f) other factors. With respect to the New Advisory Agreements, the Board also considered the Transaction and its impact on the foregoing factors. Each Board Member may have accorded different weight to the various factors in reaching his or her conclusions with respect to a Fund’s Original Advisory Agreements and New Advisory Agreements. The Independent Board Members did not identify any single factor as all-important or controlling. The Independent Board Members’ considerations were instead based on a comprehensive consideration of all the information presented. The principal factors considered by the Board and its conclusions are described below.
A. Nature, Extent and Quality of Services
1. The Original Advisory Agreements
In considering renewal of each Original Advisory Agreement, the Independent Board Members considered the nature, extent and quality of the respective Fund Adviser’s services, including portfolio management services (and the resulting Fund performance) and administrative services. The Independent Board Members further considered the overall reputation and capabilities of the Adviser and its affiliates, the commitment of the Adviser to provide high quality service to the Funds, their overall confidence in the capability and integrity of the Adviser and its staff and the Adviser’s responsiveness to questions and concerns raised by them. The Independent Board Members reviewed materials outlining, among other things: each Fund
Annual Investment Management Agreement Approval Process (Unaudited) (continued)
Adviser’s organization and business; the types of services that each Fund Adviser or its affiliates provide to each Fund; the performance record of each Fund (as described in further detail below); and any initiatives Nuveen had taken for the closed-end fund product line.
In considering the services provided by the Fund Advisers, the Board recognized that the Adviser provides a myriad of investment management, administrative, compliance, oversight and other services for the Funds, and the Sub-Adviser generally provides the portfolio advisory services to the Funds under the oversight of the Adviser. The Board considered the wide range of services provided by the Adviser to the Nuveen funds beginning with developing the fund and monitoring and analyzing its performance to providing or overseeing the services necessary to support a fund’s daily operations. The Board recognized the Adviser, among other things, provides: (a) product management (such as analyzing ways to better position a fund in the marketplace, maintaining relationships to gain access to distribution platforms and setting dividends); (b) fund administration (such as preparing a fund’s tax returns, regulatory filings and shareholder communications; managing fund budgets and expenses; overseeing a fund’s various service providers; and supporting and analyzing new and existing funds); (c) Board administration (such as supporting the Board and its committees, in relevant part, by organizing and administering the Board and committee meetings and preparing the necessary reports to assist the Board in its duties); (d) compliance (such as monitoring adherence to a fund’s investment policies and procedures and applicable law; reviewing the compliance program periodically and developing new policies or updating existing compliance policies and procedures as considered necessary or appropriate; responding to regulatory requests; and overseeing compliance testing of sub-advisers); (e) legal support (such as preparing or reviewing fund registration statements, proxy statements and other necessary materials; interpreting regulatory requirements and compliance thereof; and maintaining applicable registrations); and (f) investment services (such as overseeing and reviewing sub-advisers and their investment teams; analyzing performance of the funds; overseeing investment and risk management; overseeing the daily valuation process for portfolio securities and developing and recommending valuation policies and methodologies and changes thereto; and participating in fund development, leverage management and the development of investment policies and parameters). With respect to closed-end funds, the Adviser also monitors asset coverage levels on leveraged funds, manages leverage, negotiates the terms of leverage, evaluates alternative forms and types of leverage, promotes an orderly secondary market for common shares and maintains an asset maintenance system for compliance with certain rating agency criteria.
In its review, the Board also considered the new services, initiatives or other changes adopted since the last advisory contract review that were designed to enhance the services and support the Adviser provides to the Nuveen funds. The Board recognized that some initiatives are a multi-year process. In reviewing the activities of 2013, the Board recognized that the year reflected the Adviser’s continued focus on fund rationalization for both closed-end and open-end funds, consolidating certain funds through mergers that were designed to improve efficiencies and economies of scale for shareholders, repositioning various funds through updates in their investment policies and guidelines with the expectation of bringing greater value to shareholders, and liquidating certain funds. As in the past, the Board recognized the Adviser’s significant investment in its technology initiatives, including the continued progress toward a central repository for fund and other Nuveen product data and implementing a data system to support the risk oversight group enabling it to provide more detailed risk analysis for the Nuveen funds. The Board noted the new data system has permitted more in-depth analysis of the investment risks of the Funds and across the complex providing additional feedback and insights to the investment teams and more comprehensive risk reporting to the Board. The Adviser also conducted several workshops for the Board regarding the new data system, including explaining the risk measures being applied and their purpose. The Board also recognized the enhancements in the valuation group within the Adviser, including centralizing the fund pricing process within the valuation group, trending to more automated and expedient reviews and continuing to expand its valuation team. The Board further considered the expansion of personnel in the compliance department enhancing the collective expertise of the group, investments in additional compliance systems and the updates of various compliance policies.
In addition to the foregoing actions, the Board also considered other initiatives related to the closed-end funds, including the continued investment of considerable resources and personnel dedicated to managing and overseeing the various forms of leverage utilized by certain funds. The Board recognized the results of these efforts included the development of less expensive forms of leverage, expansion of leverage providers, the negotiation of more favorable terms for existing leverage, the enhanced ability to respond to market and regulatory developments and the enhancements to technology systems to manage and track the various forms of leverage. The Board also noted Nuveen’s continued capital management services, including executing share repurchase programs, its implementation of data systems that permit more targeted solicitation strategies for fund mergers and more targeted marketing and promotional efforts and its continued focus and efforts to address the discounts of various funds. The Board further noted Nuveen’s continued commitment to supporting the secondary market for the common shares of its closed-end funds through a comprehensive communication program designed to further educate the investor and analyst about closed-end funds. Nuveen’s support services included, among other things, maintaining and enhancing a closed-end fund website, creating marketing campaigns and educational materials, communicating with financial advisers, sponsoring and participating in conferences, providing educational seminars and programs and evaluating the results of these marketing efforts.
As noted, the Adviser also oversees the Sub-Adviser who provides the portfolio advisory services to the Funds. In reviewing the portfolio advisory services provided to each Fund, the Nuveen Investment Services Oversight Team of the Adviser analyzes the performance of the Sub-Adviser and may recommend changes to the investment team or investment strategies as appropriate. In assisting the Board’s review of the Sub-Adviser, the Adviser provides a report analyzing, among other things, the Sub-Adviser’s investment team and changes thereto, organization and history, assets under management, the investment team’s philosophy and strategies in managing each Fund, developments affecting the Sub-Adviser or the Funds and their performance. In their review of the Sub-Adviser, the Independent Board Members considered, among other things, the experience and qualifications of the relevant investment personnel, their investment philosophy and strategies, the Sub-Adviser’s organization and stability, its capabilities and any initiatives taken or planned to enhance its current capabilities or support potential growth of business and, as outlined in further detail below, the performance of the Funds. The Independent Board Members also reviewed portfolio manager compensation arrangements to evaluate each Fund Adviser’s ability to attract and retain high quality investment personnel, preserve stability, and reward performance while not providing an inappropriate incentive to take undue risks.
Given the importance of compliance, the Independent Board Members also considered Nuveen’s compliance program, including the report of the chief compliance officer regarding the Nuveen funds’ compliance policies and procedures; the resources dedicated to compliance; the record of compliance with the policies and procedures; and Nuveen’s supervision of the Funds’ service providers. The Board recognized Nuveen’s commitment to compliance and strong commitment to a culture of compliance. Given the Adviser’s emphasis on monitoring investment risk, the Board has also appointed two Independent Board Members as point persons to review and keep the Board apprised of developments in this area and work with applicable Fund Adviser personnel.
Based on their review, the Independent Board Members found that, overall, the nature, extent and quality of services provided to each Fund under the respective Original Advisory Agreement were satisfactory.
2. The New Advisory Agreements
In evaluating the nature, quality and extent of the services expected to be provided by the Fund Advisers under the New Investment Management Agreements and the New Sub-Advisory Agreements, the Board Members concluded that no diminution in the nature, quality and extent of services provided to each Fund and its shareholders by the respective Fund Advisers is expected as a result of the Transaction. In making their determination, the Independent Board Members considered, among other things: the expected impact, if any, of the Transaction on the operations, facilities, organization and personnel of each Fund Adviser; the ability of each Fund Adviser to perform its duties after the Transaction, including any changes to the level or quality of services provided to the Funds; the potential implications of any additional regulatory requirements imposed on the Fund Advisers or the Nuveen funds following the Transaction; and any anticipated changes to the investment and other practices of the Nuveen funds.
Annual Investment Management Agreement Approval Process (Unaudited) (continued)
The Board noted that the terms of each New Investment Management Agreement, including the fees payable thereunder, are substantially identical to those of the Original Investment Management Agreement relating to the same Fund. Similarly, the terms of each New Sub-Advisory Agreement, including fees payable thereunder, are substantially identical to those of the Original Sub-Advisory Agreement relating to the same Fund. The Board considered that the services to be provided and the standard of care under the New Investment Management Agreements and the New Sub-Advisory Agreements are the same as the corresponding original agreements. The Board Members noted the Transaction also does not alter the allocation of responsibilities between the Adviser and the Sub-Adviser. The Sub-Adviser will continue to furnish an investment program, make investment decisions and place all orders for the purchase and sale of securities, all on behalf of each Fund and subject to oversight of the Board and the Adviser. The Board noted that TIAA-CREF did not anticipate any material changes to the advisory, sub-advisory or other services provided to the Nuveen funds as a result of the Transaction. The Independent Board Members recognized that there were not any planned “cost cutting” measures that could be expected to reduce the nature, extent or quality of services. The Independent Board Members further noted that there were currently no plans for material changes to senior personnel at Nuveen or key personnel who provide services to the Nuveen funds and the Board following the Transaction. The key personnel who have responsibility for the Nuveen funds in each area, including portfolio management, investment oversight, fund management, fund operations, product management, legal/compliance and board support functions, are expected to be the same following the Transaction, although such personnel may have additional reporting requirements to TIAA-CREF. The Board also considered the anticipated incentive plans designed to retain such key personnel. Notwithstanding the foregoing, the Board Members recognized that personnel changes may occur in the future as a result of normal business developments or personal career decisions.
The Board Members also considered Nuveen’s proposed governance structure following the Transaction and noted that Nuveen was expected to remain a stand-alone business within the TIAA-CREF enterprise and operate relatively autonomously from the other TIAA-CREF businesses, but would receive the general support and oversight from certain TIAA-CREF functional groups (such as legal, finance, internal audit, compliance, and risk management groups). The Board recognized, however, that Nuveen may be subject to additional reporting requirements as it keeps TIAA-CREF abreast of developments affecting the Nuveen business, may be required to modify certain of its reports, policies and procedures as necessary to conform to the practices followed in the TIAA-CREF enterprise and may need to collaborate with TIAA-CREF with respect to strategic planning for its business.
In considering the implications of the Transaction, the Board Members also recognized the reputation and size of TIAA-CREF and the benefits that the Transaction may bring to the Nuveen funds and Nuveen. In this regard, the Board recognized, among other things, that the increased resources and support that may be available to Nuveen from TIAA-CREF and the improved capital structure of Nuveen Investments, Inc. (the parent of the Adviser) that would result from the significant reduction in its debt level may reinforce and enhance Nuveen’s ability to provide quality services to the Nuveen funds and to invest further into its infrastructure.
Further, with the consummation of the Transaction, the Board recognized the enhanced distribution capabilities for the Nuveen funds as the funds may gain access to TIAA-CREF’s distribution network, particularly through TIAA-CREF’s retirement platform and institutional client base. The Board also considered that investors in TIAA-CREF’s retirement platform may choose to roll their investments as they exit their retirement plans into the Nuveen funds. The Independent Board Members recognized the potential cost savings to the benefit of all shareholders of the Nuveen funds from reduced expenses as assets in the Nuveen fund complex rise pursuant to the complex-wide fee arrangement described in further detail below.
Based on their review, the Independent Board Members found that the expected nature, extent and quality of services to be provided to each Fund under its New Advisory Agreements were satisfactory and supported approval of the New Advisory Agreements.
B. The Investment Performance of the Funds and Fund Advisers
1. The Original Advisory Agreements
The Board, including the Independent Board Members, considered the performance history of each Fund over various time periods. The Board reviewed reports, including an analysis of each Fund’s performance and the applicable investment team. In considering each Fund’s performance, the Board recognized that a fund’s performance can be reviewed through various measures including the fund’s absolute return, the fund’s return compared to the performance of other peer funds and the fund’s performance compared to its respective benchmark. Accordingly, the Board reviewed, among other things, each Fund’s historic investment performance as well as information comparing the Fund’s performance information with that of other funds (the “Performance Peer Group”) and with recognized and/or customized benchmarks (i.e., generally benchmarks derived from multiple recognized benchmarks) for the quarter, one-, three- and five-year periods ending December 31, 2013, as well as performance information reflecting the first quarter of 2014. With respect to closed-end funds, the Independent Board Members also reviewed historic premium and discount levels, including a summary of actions taken to address or discuss other developments affecting the secondary market discounts of various funds. This information supplemented the Nuveen fund performance information provided to the Board at each of its quarterly meetings.
In evaluating performance, the Board recognized several factors that may impact the performance data as well as the consideration given to particular performance data.
• The performance data reflects a snapshot in time, in this case as of the end of the most recent calendar year or quarter. A different performance period, however, could generate significantly different results.
• Long-term performance can be adversely affected by even one period of significant underperformance so that a single investment decision or theme has the ability to disproportionately affect long-term performance.
• The investment experience of a particular shareholder in a fund will vary depending on when such shareholder invests in such fund, the class held (if multiple classes offered in the fund) and the performance of the fund (or respective class) during that shareholder’s investment period.
• The usefulness of comparative performance data as a frame of reference to measure a fund’s performance may be limited because the Performance Peer Group, among other things, does not adequately reflect the objectives and strategies of the fund, has a different investable universe, or the composition of the peer set may be limited in size or number as well as other factors. In this regard, the Board noted that the Adviser classified the Performance Peer Groups of the Nuveen funds from highly relevant to less relevant. For funds classified with less relevant Performance Peer Groups, the Board considered a fund’s performance compared to its benchmark to help assess the fund’s comparative performance. A fund was generally considered to have performed comparably to its benchmark if the fund’s performance was within certain thresholds compared to the performance of its benchmark and was considered to have outperformed or underperformed its benchmark if the fund’s performance was beyond these thresholds for the one- and three-year periods, subject to certain exceptions. iWhile the Board is cognizant of the relative performance of a fund’s peer set and/or benchmark(s), the Board evaluated fund performance in light of the respective fund’s investment objectives, investment parameters and guidelines and considered that the variations between the objectives and investment parameters or guidelines of the fund with its peers and/or benchmarks result in differences in performance results. Further, for funds that utilize leverage, the Board understands that leverage during different periods can provide both benefits and risks to a portfolio as compared to an unlevered benchmark.
With respect to any Nuveen funds for which the Board has identified performance concerns, the Board monitors such funds closely until performance improves, discusses with the Adviser the reasons for such results, considers those steps necessary or appropriate to address such issues and reviews the results of any efforts undertaken. The Board is aware, however, that shareholders chose to invest or remain invested in a fund knowing that the Adviser manages the fund and knowing the fund’s fee structure.
Annual Investment Management Agreement Approval Process (Unaudited) (continued)
In considering the performance data, the Independent Board Members noted that, although Nuveen Quality Municipal Fund, Inc. (“Quality Municipal Fund”), Nuveen Municipal Opportunity Fund, Inc. (“Municipal Opportunity Fund”), Nuveen AMT-Free Municipal Income Fund (“AMT-Free Municipal Income Fund”) and Nuveen Dividend Advantage Municipal Income Fund (“Dividend Advantage Municipal Income Fund”) appeared to lag their respective peers over longer periods and demonstrated more favorable performance in the shorter periods, there were some differences between the Funds and their respective Performance Peer Groups, limiting some of the usefulness of the comparative data. Such Funds, however, outperformed their respective benchmarks over the longer periods. In this regard, although Quality Municipal Fund was in the fourth quartile in the five-year period and the third quartile in the three-year period, it was in the second quartile in the one-year period, and, although such Fund underperformed its benchmark in the one-year period, it outperformed its benchmark in the three- and five-year periods. Although Municipal Opportunity Fund was in the fourth quartile in the three- and five-year periods, it was in the first quartile in the one-year period, and, although such Fund underperformed its benchmark in the one-year period, it outperformed its benchmark in the three- and five-year periods. With respect to Dividend Advantage Municipal Income Fund, although it was in the fourth quartile in the three- and five-year periods, such Fund was in the second quartile in the one-year period, and, although such Fund underperformed its benchmark in the one-year period, it outperformed its benchmark in the three- and five-year periods. Finally, although AMT-Free Municipal Income Fund was in the fourth quartile for the three- and five-year periods, it was in the third quartile for the one-year period, and, although such Fund underperformed its benchmark in the one- and three-year periods, it outperformed its benchmark in the five-year period.
Based on their review, the Independent Board Members determined that each Fund’s investment performance had been satisfactory.
2. The New Advisory Agreements
With respect to the performance of each Fund, the Board considered that the portfolio investment personnel responsible for the management of the respective Fund portfolios were expected to continue to manage such portfolios following the completion of the Transaction and the investment strategies of the Funds were not expected to change as a result of the Transaction. Accordingly, the findings regarding performance outlined above for the Original Advisory Agreements are applicable to the review of the New Advisory Agreements.
C. Fees, Expenses and Profitability
The Board evaluated the management fees and expenses of each Fund, reviewing, among other things, such Fund’s gross management fees, net management fees and net expense ratios in absolute terms as well as compared to the fees and expenses of a comparable universe of funds provided by an independent fund data provider (the “Peer Universe”) and any expense limitations.
The Independent Board Members further reviewed the methodology regarding the construction of the applicable Peer Universe. In reviewing the comparisons of fee and expense information, the Independent Board Members took into account that in certain instances various factors such as the limited size and particular composition of the Peer Universe (including the inclusion of other Nuveen funds in the peer set); expense anomalies; changes in the funds comprising the Peer Universe from year to year; levels of reimbursement or fee waivers; the timing of information used; and the differences in the type and use of leverage may impact the comparative data thereby limiting somewhat the ability to make a meaningful comparison with peers.
In reviewing the fee schedule for a fund, the Independent Board Members also considered the fund-level and complex-wide breakpoint schedules (described in further detail below) and any fee waivers and reimbursements provided by Nuveen. In reviewing fees and expenses (excluding leverage costs and leveraged assets for the closed-end funds), the Board considered the expenses and fees to be higher if they were over 10 basis points higher, slightly higher if they were approximately 6 to 10 basis points higher, in line if they were within approximately 5 basis points higher than the peer average and below if they were
below the peer average of the Peer Universe. In reviewing the reports, the Board noted that the majority of the Nuveen funds were at, close to or below their peer average based on the net total expense ratio. The Independent Board Members observed that the Funds had net management fees and net expense ratios (including fee waivers and expense reimbursements) below or in line with their peer averages, except AMT-Free Municipal Income Fund, which had a slightly higher net management fee and a higher net expense ratio compared to its peer average (generally due to one-time costs associated with being the survival fund of a merger).
Based on their review of the fee and expense information provided, the Independent Board Members determined that each Fund’s management fees (as applicable) to a Fund Adviser were reasonable in light of the nature, extent and quality of services provided to the Fund.
2. Comparisons with the Fees of Other Clients
The Board recognized that all Nuveen funds have a sub-adviser, either affiliated or non-affiliated, and therefore the overall fund management fee can be divided into two components, the fee retained by the Adviser and the fee paid to the sub-adviser. In general terms, the fee to the Adviser reflects the administrative and other services it provides to support the Nuveen fund (as described above) and, while some administrative services may occur at the sub-adviser level, the fee to the sub-adviser generally reflects the portfolio management services provided by the sub-adviser. The Independent Board Members considered the fees a Fund Adviser assesses to the Funds compared to that of other clients. With respect to municipal funds, such other clients of a Fund Adviser may include: municipal separately managed accounts and passively managed exchange traded funds (ETFs) sub-advised by the Adviser.
The Independent Board Members reviewed the nature of services provided by the Adviser, including through its affiliated sub-advisers and the average fee the affiliated sub-advisers assessed such clients as well as the range of fees assessed to the different types of separately managed accounts (such as retail, institutional or wrap accounts) to the extent applicable to the respective sub-adviser. In their review, the Independent Board Members considered the differences in the product types, including, but not limited to: the services provided, the structure and operations, product distribution and costs thereof, portfolio investment policies, investor profiles, account sizes and regulatory requirements. In evaluating the comparisons of fees, the Independent Board Members noted that the fee rates charged to the Nuveen funds and other clients vary, among other things, because of the different services involved and the additional regulatory and compliance requirements associated with registered investment companies, such as the Funds. The Independent Board Members noted that, as a general matter, higher fee levels reflect higher levels of service, increased investment management complexity, greater product management requirements and higher levels of risk or a combination of the foregoing. The Independent Board Members further noted, in particular, that the range of services provided to the Funds (as discussed above) is generally much more extensive than that provided to separately managed accounts. Many of the additional administrative services provided by the Adviser are not required for institutional clients. The Independent Board Members also recognized that the management fee rates of the foreign funds advised by the Adviser may vary due to, among other things, differences in the client base, governing bodies, operational complexities and services covered by the management fee. Given the inherent differences in the various products, particularly the extensive services provided to the Funds, the Independent Board Members believe such facts justify the different levels of fees.
3. Profitability of Fund Advisers
In conjunction with their review of fees, the Independent Board Members also considered the profitability of Nuveen for its advisory activities and its financial condition. The Independent Board Members reviewed the revenues and expenses of Nuveen’s advisory activities for the last two calendar years, the allocation methodology used in preparing the profitability data, an analysis of the key drivers behind the changes in revenues and expenses that impacted profitability in 2013 and Nuveen’s consolidated financial statements for 2013. The Independent Board Members noted this information supplemented the profitability information requested and received during the year to help keep them apprised of developments affecting
Annual Investment Management Agreement Approval Process (Unaudited) (continued)
profitability (such as changes in fee waivers and expense reimbursement commitments). In this regard, the Independent Board Members noted that two Independent Board Members served as point persons to review the profitability analysis and methodologies employed, and any changes thereto, and to keep the Board apprised of such changes. The Independent Board Members also considered Nuveen’s revenues for advisory activities, expenses and profit margin compared to that of various unaffiliated management firms.
In reviewing profitability, the Independent Board Members noted the Adviser’s continued investment in its business with expenditures to, among other things, upgrade its investment technology and compliance systems and provide for additional personnel and other resources. The Independent Board Members recognized the Adviser’s continued commitment to its business should enhance the Adviser’s capacity and capabilities in providing the services necessary to meet the needs of the Nuveen funds as they grow or change over time. In addition, in evaluating profitability, the Independent Board Members also noted the subjective nature of determining profitability which may be affected by numerous factors including the allocation of expenses and that various allocation methodologies may each be reasonable but yield different results. Further, the Independent Board Members recognized the difficulties in making comparisons as the profitability of other advisers generally is not publicly available, and the profitability information that is available for certain advisers or management firms may not be representative of the industry and may be affected by, among other things, an adviser’s particular business mix, capital costs, size, types of funds managed and expense allocations. Notwithstanding the foregoing, the Independent Board Members noted the Adviser’s adjusted operating margin appears to be reasonable in relation to other investment advisers and sufficient to operate as a viable investment management firm meeting its obligations to the Nuveen funds. Based on their review, the Independent Board Members concluded that the Adviser’s level of profitability for its advisory activities was reasonable in light of the services provided.
With respect to sub-advisers affiliated with Nuveen, including the Sub-Adviser, the Independent Board Members reviewed such sub-advisers’ revenues, expenses and profitability margins (pre- and post-tax) for their advisory activities and the methodology used for allocating expenses among the internal sub-advisers. Based on their review, the Independent Board Members were satisfied that the Sub-Adviser’s level of profitability was reasonable in light of the services provided.
In evaluating the reasonableness of the compensation, the Independent Board Members also considered other amounts paid to a Fund Adviser by the funds as well as indirect benefits (such as soft dollar arrangements), if any, the Fund Adviser and its affiliates receive or are expected to receive that are directly attributable to the management of a Nuveen fund. See Section E below for additional information on indirect benefits the Fund Advisers may receive as a result of its relationship with a Nuveen fund. Based on their review of the overall fee arrangements of each Fund, the Independent Board Members determined that the advisory fees and expenses of the Funds were reasonable.
4. The New Advisory Agreements
As noted above, the terms of the New Advisory Agreements are substantially identical to their corresponding Original Advisory Agreements. The fee schedule, including the breakpoint schedule and complex-wide fee schedule, in each New Advisory Agreement is identical to that under the corresponding Original Advisory Agreement. The Board Members also noted that Nuveen has committed for a period of two years from the date of closing the Transaction not to increase contractual management fee rates for any Nuveen fund. This commitment shall not limit or otherwise affect mergers or liquidations of any funds in the ordinary course. Based on the information provided, the Board Members did not believe that the overall expenses would increase as a result of the Transaction. In addition, the Board Members recognized that the Nuveen funds may gain access to the retirement platform and institutional client base of TIAA-CREF, and the investors in the retirement platforms may roll their investments into one or more Nuveen funds as they exit their retirement plans. The enhanced distribution access may result in additional sales of the Nuveen funds resulting in an increase in total assets under management in the complex and a corresponding decrease in overall management fees if additional breakpoints at the fund-level or complex-wide level are met. Based on its review, the Board determined that the management fees and expenses under each New Advisory Agreement were reasonable.
Further, other than from a potential reduction in the debt level of Nuveen Investments, Inc., the Board recognized that it is difficult to predict with any degree of certainty the impact of the Transaction on Nuveen’s profitability. Given the fee schedule was not expected to change under the New Advisory Agreements, however, the Independent Board Members concluded that each Fund Adviser’s level of profitability for its advisory activities under the respective New Advisory Agreements would continue to be reasonable in light of the services provided.
D. Economies of Scale and Whether Fee Levels Reflect These Economies of Scale
1. The Original Advisory Agreements
With respect to economies of scale, the Independent Board Members have recognized the potential benefits resulting from the costs of a fund being spread over a larger asset base, although economies of scale are difficult to measure and predict with precision, particularly on a fund-by-fund basis. One method to help ensure the shareholders share in these benefits is to include breakpoints in the advisory fee schedule. Generally, management fees for funds in the Nuveen complex are comprised of a fund-level component and a complex-level component, subject to certain exceptions. Accordingly, the Independent Board Members reviewed and considered the applicable fund-level breakpoints in the advisory fee schedules that reduce advisory fees as asset levels increase. Further, the Independent Board Members noted that, although closed-end funds may from time-to-time make additional share offerings, the growth of their assets would occur primarily through the appreciation of such funds’ investment portfolios.
In addition to fund-level advisory fee breakpoints, the Board also considered the Nuveen funds’ complex-wide fee arrangement. Pursuant to the complex-wide fee arrangement, the fees of the funds in the Nuveen complex are reduced as the assets in the fund complex reach certain levels. The complex-wide fee arrangement seeks to provide the benefits of economies of scale to fund shareholders when total fund complex assets increase, even if assets of a particular fund are unchanged or have decreased. The approach reflects the notion that some of Nuveen’s costs are attributable to services provided to all its funds in the complex and therefore all funds benefit if these costs are spread over a larger asset base.
Based on their review, the Independent Board Members concluded that the breakpoint schedules and complex-wide fee arrangement (as applicable) were acceptable and reflect economies of scale to be shared with shareholders when assets under management increase.
2. The New Advisory Agreements
As noted, the Independent Board Members recognized that the fund-level and complex-wide schedules will not change under the New Advisory Agreements. Assets in the funds advised by TIAA-CREF or its current affiliates will not be included in the complex-wide fee calculation. Nevertheless, the Nuveen funds may have access to TIAA-CREF’s retirement platform and institutional client base. The access to this distribution network may enhance the distribution of the Nuveen funds which, in turn, may lead to reductions in management and sub-advisory fees if the Nuveen funds reach additional fund-level and complex-wide breakpoint levels. Based on their review, including the considerations in the annual review of the Original Advisory Agreements, the Independent Board Members determined that the fund-level breakpoint schedules and complex-wide fee schedule continue to be appropriate and desirable in ensuring that shareholders participate in the benefits derived from economies of scale under the New Advisory Agreements.
E. Indirect Benefits
1. The Original Advisory Agreements
In evaluating fees, the Independent Board Members received and considered information regarding potential “fall out” or ancillary benefits the respective Fund Adviser or its affiliates may receive as a result of its relationship with each Fund. In this regard, with respect to closed-end funds, the Independent Board Members considered any revenues received by affiliates of the Adviser for serving as co-manager in initial public offerings of new closed-end funds as well as revenues received in connection with secondary offerings.
Annual Investment Management Agreement Approval Process (Unaudited) (continued)
In addition to the above, the Independent Board Members considered whether the Fund Advisers received any benefits from soft dollar arrangements whereby a portion of the commissions paid by a fund for brokerage may be used to acquire research that may be useful to a Fund Adviser in managing the assets of the fund and other clients. Each Fund’s portfolio transactions are allocated by the Sub-Adviser. Accordingly, the Independent Board Members considered that the Sub-Adviser may benefit from its soft dollar arrangements pursuant to which it receives research from brokers that execute the applicable Fund’s portfolio transactions. With respect to any fixed income securities, however, the Board recognized that such securities generally trade on a principal basis that does not generate soft dollar credits. Similarly, the Board recognized that the research received pursuant to soft dollar arrangements by the Sub-Adviser may also benefit the Funds and their shareholders to the extent the research enhances the ability of the Sub-Adviser to manage the Funds. The Independent Board Members noted that the Sub-Adviser’s profitability may be somewhat lower if it did not receive the research services pursuant to the soft dollar arrangements and had to acquire such services directly.
Based on their review, the Independent Board Members concluded that any indirect benefits received by a Fund Adviser as a result of its relationship with the Funds were reasonable and within acceptable parameters.
2. The New Advisory Agreements
The Independent Board Members noted that, as the applicable policies and operations of the Fund Advisers with respect to the Nuveen funds were not anticipated to change significantly after the Transaction, such indirect benefits should remain after the Transaction. The Independent Board Members further noted the benefits the Transaction would provide to TIAA-CREF and Nuveen, including a larger-scale fund complex, certain shared services (noted above) and a broader range of investment capabilities, distribution capabilities and product line. Further, the Independent Board Members noted that Nuveen Investments, Inc. (the parent of the Adviser) would benefit from an improved capital structure through a reduction in its debt level.
F. Other Considerations for the New Advisory Agreements
In addition to the factors above, the Board Members also considered the following with respect to the Nuveen funds:
• Nuveen would rely on the provisions of Section 15(f) of the 1940 Act. In this regard, to help ensure that an unfair burden is not imposed on the Nuveen funds, Nuveen has committed for a period of two years from the date of the closing of the Transaction not to increase contractual management fee rates for any fund. This commitment shall not limit or otherwise affect mergers or liquidations of any funds in the ordinary course.
• The Nuveen funds would not incur any costs in seeking the necessary shareholder approvals for the New Investment Management Agreements or the New Sub-Advisory Agreements (except for any costs attributed to seeking shareholder approvals of fund specific matters unrelated to the Transaction, such as election of Board Members or changes to investment policies, in which case a portion of such costs will be borne by the applicable funds).
• The reputation, financial strength and resources of TIAA-CREF.
• The long-term investment philosophy of TIAA-CREF and anticipated plans to grow Nuveen’s business to the benefit of the Nuveen funds.
• The benefits to the Nuveen funds as a result of the Transaction including: (i) increased resources and support available to Nuveen as well as an improved capital structure that may reinforce and enhance the quality and level of services it provides to the funds; (ii) potential additional distribution capabilities for the funds to access new markets and customer segments through TIAA-CREF’s distribution network, including, in particular, its retirement platforms and institutional client base; and (iii) access to TIAA-CREF’s expertise and investment capabilities in additional asset classes.
G. Other Considerations
The Independent Board Members did not identify any single factor discussed previously as all-important or controlling. The Board Members, including the Independent Board Members, unanimously concluded that the terms of each Original Advisory Agreement and New Advisory Agreement are fair and reasonable, that the respective Fund Adviser’s fees are reasonable in light of the services provided to each Fund and that the Original Advisory Agreements be renewed and the New Advisory Agreements be approved.
II. Approval of Interim Advisory Agreements
At the April Meeting, the Board Members, including the Independent Board Members, unanimously approved for each Fund an interim advisory agreement (the “Interim Investment Management Agreement”) between the respective Fund and the Adviser and an interim sub-advisory agreement (the “Interim Sub-Advisory Agreement”) between the Adviser and the Sub-Adviser. If necessary to assure continuity of advisory services, each respective Interim Investment Management Agreement and Interim Sub-Advisory Agreement will take effect upon the closing of the Transaction if shareholders have not yet approved the corresponding New Investment Management Agreement or New Sub-Advisory Agreement. The terms of each Interim Investment Management Agreement and Interim Sub-Advisory Agreement are substantially identical to those of the corresponding Original Investment Management Agreement and New Investment Management Agreement and the corresponding Original Sub-Advisory Agreement and New Sub-Advisory Agreement, respectively, except for certain term and fee escrow provisions. In light of the foregoing, the Board Members, including the Independent Board Members, unanimously determined that the scope and quality of services to be provided to the Funds under the respective Interim Investment Management Agreements and Interim Sub-Advisory Agreements are at least equivalent to the scope and quality of services provided under the applicable Original Investment Management Agreements and Original Sub-Advisory Agreements.
i | The Board recognized that the Adviser considered a fund to have outperformed or underperformed its benchmark if the fund’s performance was higher or lower than the performance of the benchmark by the following thresholds: for open-end funds (+/- 100 basis points for equity funds excluding index funds; +/- 30 basis points for tax exempt fixed income funds; +/- 40 basis points for taxable fixed income funds) and for closed-end funds (assuming 30% leverage) (+/- 130 basis points for equity funds excluding index funds; +/- 39 basis points for tax exempt funds and +/-52 basis points for taxable fixed income funds). |
Notes
Notes
| Nuveen Investments: |
| | Serving Investors for Generations |
Since 1898, financial advisors and their clients have relied on Nuveen Investments to provide dependable investment solutions through continued adherence to proven, long-term investing principles. Today, we offer a range of high quality equity and fixed-income solutions designed to be integral components of a well-diversified core portfolio.
Focused on meeting investor needs.
Nuveen Investments provides high-quality investment services designed to help secure the long-term goals of institutional and individual investors as well as the consultants and financial advisors who serve them. Nuveen Investments markets a wide range of specialized investment solutions which provide investors access to capabilities of its high-quality boutique investment affiliates—Nuveen Asset Management, Symphony Asset Management, NWQ Investment Management Company, Santa Barbara Asset Management, Tradewinds Global Investors, Winslow Capital Management and Gresham Investment Management. In total, Nuveen Investments managed approximately $225 billion as of March 31, 2014.
Find out how we can help you.
To learn more about how the products and services of Nuveen Investments may be able to help you meet your financial goals, talk to your financial advisor, or call us at (800) 257-8787. Please read the information provided carefully before you invest. Investors should consider the investment objective and policies, risk considerations, charges and expenses of any investment carefully. Where applicable, be sure to obtain a prospectus, which contains this and other relevant information. To obtain a prospectus, please contact your securities representative or Nuveen Investments, 333 W. Wacker Dr., Chicago, IL 60606. Please read the prospectus carefully before you invest or send money.
Learn more about Nuveen Funds at: www.nuveen.com/cef
Distributed by Nuveen Investments, LLC | 333 West Wacker Drive | Chicago, IL 60606 | www.nuveen.com | |
ESA-D-0414D
ITEM 2. CODE OF ETHICS.
Not applicable to this filing.
ITEM 3. AUDIT COMMITTEE FINANCIAL EXPERT.
Not applicable to this filing.
ITEM 4. PRINCIPAL ACCOUNTANT FEES AND SERVICES.
Not applicable to this filing.
ITEM 5. AUDIT COMMITTEE OF LISTED REGISTRANTS.
Not applicable to this filing.
ITEM 6. SCHEDULE OF INVESTMENTS.
(a) See Portfolio of Investments in Item 1.
(b) Not applicable.
ITEM 7. DISCLOSURE OF PROXY VOTING POLICIES AND PROCEDURES FOR CLOSED-END MANAGEMENT INVESTMENT COMPANIES.
Not applicable to this filing.
ITEM 8. PORTFOLIO MANAGERS OF CLOSED-END MANAGEMENT INVESTMENT COMPANIES.
Not applicable to this filing.
ITEM 9. PURCHASES OF EQUITY SECURITIES BY CLOSED-END MANAGEMENT INVESTMENT COMPANY AND AFFILIATED PURCHASERS.
Not applicable.
ITEM 10. SUBMISSION OF MATTERS TO A VOTE OF SECURITY HOLDERS.
There have been no material changes to the procedures by which shareholders may recommend nominees to the registrant's Board implemented after the registrant last provided disclosure in response to this Item.
ITEM 11. CONTROLS AND PROCEDURES.
ITEM 12. EXHIBITS.
File the exhibits listed below as part of this Form.
Pursuant to the requirements of the Securities Exchange Act of 1934 and the Investment Company Act of 1940, the registrant has duly caused this report to be signed on its behalf by the undersigned, thereunto duly authorized.
Kevin J. McCarthy
Pursuant to the requirements of the Securities Exchange Act of 1934 and the Investment Company Act of 1940, this report has been signed below by the following persons on behalf of the registrant and in the capacities and on the dates indicated.
Gifford R. Zimmerman
Stephen D. Foy