| UNITED STATES SECURITIES AND EXCHANGE COMMISSION WASHINGTON, D.C. 20549 |
| FORM N-CSR |
| CERTIFIED SHAREHOLDER REPORT OF REGISTERED MANAGEMENT INVESTMENT COMPANIES |
| Investment Company Act file number 811-21233 |
| PARADIGM FUNDS (Exact name of registrant as specified in charter) |
| Nine Elk Street, Albany, NY 12207-1002 (Address of principal executive offices) (Zip code) |
| Robert A. Benton Nine Elk Street, Albany, NY 12207-1002 (Name and address of agent for service) |
Registrant's telephone number, including area code: (518) 431-3500
Date of fiscal year end: December 31
Date of reporting period: December 31, 2008
Form N-CSR is to be used by management investment companies to file reports with the Commission not later than 10 days after the transmission to stockholders of any report that is required to be transmitted to stockholders under Rule 30e-1 under the Investment Company Act of 1940 (17 CFR 270.30e -1). The Commission may use the information provided on Form N-CSR in its regulatory, disclosure review, inspection and policymaking roles.
A registrant is required to disclose the information specified by Form N-CSR, and the Commission will make this information public. A registrant is not required to respond to the collection of information contained in Form N-CSR unless the Form displays a currently valid Office of Management and Budget ("OMB") control number. Please direct comments concerning the accuracy of the information collection burden estimate and any suggestions for reducing the burden to Secretary, Securities and Exchange Commission, 450 Fifth Street, NW, Washington, DC 20549-0609. The OMB has reviewed this collection of information under the clearance requirements of 44 U.S.C. § 3507.
Paradigm Funds
| Paradigm Value Fund Paradigm Select Fund Paradigm Opportunity Fund Paradigm Intrinsic Value Fund For Investors Seeking Long-Term Capital Appreciation |
| ANNUAL REPORT December 31, 2008 |
Table of Contents
| PARADIGM FUNDS | ||
| Letter to Shareholders | 2 | |
| Sector Allocation | 6 | |
| Performance Information | 8 | |
| Schedules of Investments | 12 | |
| Statements of Assets and Liabilities | 22 | |
| Statements of Operations | 22 | |
| Statements of Changes in Net Assets | 24 | |
| Financial Highlights | 26 | |
| NOTES TO FINANCIAL STATEMENTS | 28 | |
| DISCLOSURE OF EXPENSES | 33 | |
| ADDITIONAL INFORMATION | 35 | |
| REPORT OF INDEPENDENT REGISTERED PUBLIC ACCOUNTING FIRM | 36 | |
| TRUSTEES & OFFICERS | 38 | |
2008 Annual Report 1
Letter to Shareholders January 26, 2009 |
The final two quarters of 2008 saw one of the worst routs in the stock market in the past thirty years, as the failure of Lehman Brothers in September, and fears surrounding Lehman's derivatives book, led to a run on the country's remaining bulge bracket investment banks. The panic that ensued was greatly exacerbated by the lack of direction from Treasury, and by the intense bickering in Congress during the vote on Treasury's TARP proposal. Panic flourishes in a leadership vacuum.
Although the Lehman failure was the most proximate cause, how the financial system got to this point obviously goes well beyond the specific circumstances of one company. The question is: how could so many investment banks and major financial institutions (Lehman Brothers, Bear Stearns, Merrill Lynch, Freddie Mac, Fannie Mae, AIG, etc.) all have brought themselves to the brink of ruin so heedlessly? Most of the investment banks failed because money had been easy for a long time, and they had leveraged themselves up and thrown themselves into the housing bubble, through subprime mortgage securitizations and derivatives. The Basel II accords and US financial deregulation allowed investment banks to greatly increase their leverage as a function of common equity, and investment banks that used to have 10x - 12x leverage ratios had ratios as high as 30x - 40x by the end of 2007. Fannie Mae and Freddie Mac were allowed to leveraged themselves in a similar fashion by their regul ators. The two companies used their federal charter and implicit government guarantees to corner the market in prime mortgage securitizations, and then used the funds generated by their increased leverage to hold giant investment portfolios of mortgage-backed securities that they themselves guaranteed (that is, doubling their exposure on an already levered capital base.)
The investment banks ignored the tremendous risks of subprime mortgages because the profits were so big; because management got paid out with large bonuses on an annual basis, and thus didn't have to worry about the long-term consequences of their actions; because the ratings agencies blessed subprime securitizations with AAA ratings, because they themselves were making a lot of money and were compensated on a short-term basis; because the investment banks were given a free ride by the regulators, who were clearly asleep at the wheel; because the nation itself was in the thralls of the housing bubble, and was not worried about risk; and, well, because the last time the financial markets got into trouble, the Fed bailed them out.
This inferred bailout of the financial markets used to be called the "Greenspan Put." As the government finalizes its latest bailout of the financial industry, it's worth keeping in mind how many times the Treasury and Fed-how many times the Greenspan Put-had come to the rescue of the financial markets over the last twenty years, with each crisis worse than the last, and with each successful rescue serving paradoxically to increase the level of leverage and risk-taking by the financial community and the investing public, precisely because the rescue had been handled so masterfully. The Greenspan Put was a classic example of moral hazard; and moral hazard is what created the housing bubble out of the collapse of the tech bubble, and what took down the investment banking industry last fall.
Now the world is in a process of deleveraging and economic contraction. The process has been painful for investors, and will be painful for most Americans as the recession runs its course. But, the leverage we held was unsustainable, and for all of its pain, deleveraging will end up having positive effects for our country in the future. The derivatives market should have been regulated after Long Term Capital Management; we have paid the price, but it will be so going forward. Off-balance sheet financing and "shadow" banking should have been cut off at the knees after Enron. It was not; but banking regulation and leverage requirements will change as well. The cost of bailing
2008 Annual Report 2
out the financial system and stimulating the economy will be high, in the trillions. The US can handle that. One should assume, though, that the current low levels of long-term interest rates will come to an end as the Treasury continues to issue new debt.
As for the investing climate, the market (as measured by the S&P 500) is down by more than 40% since its highs in October of 2007. In every sell-off of similar magnitude in the post-war period, the market has rallied substantially in the one or two-year period afterwards. In 1973-1974, the market sold off 42% from its peak in the beginning of '73 to the end of '74. It rallied 54% in the following two years. In the crash of '87, the market fell 33% peak to trough in the fourth quarter; only to rally 60% over the next two years. In each of these cases, the markets rallied not because the world had suddenly become a better place (1975 marked the fall of Saigon; 1988 was the peak of the savings and loan crisis), but simply because markets overreact during panics. This is something we are seeing clearly in our bottom-up research of individual stocks in the small cap marketplace: valuations have fallen so low that stocks should be able to achieve above-average returns even assuming mediocre economic conditions over the next few years.
2008 was a frustrating year. But we are value investors, and we are taking advantage of the market's downturn to buy some great businesses at very cheap valuations. We do not know how long this recession will last. We firmly believe, however, that disciplined value investing in this kind of environment will ultimately lead to exceptional results well into the future.
2008 Annual Report 3
Paradigm Value Fund Portfolio Performance |
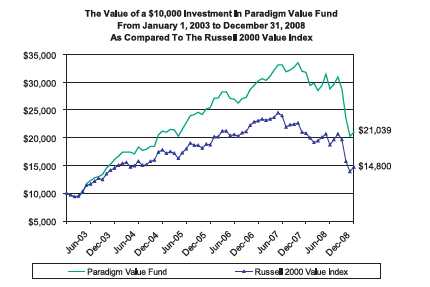
The Paradigm Value Fund declined 33.88% during 2008, compared to a 28.92% drop for its benchmark, the Russell 2000 Value Index. Over the past three years on an annualized basis, the Fund has declined 6.10% vs. a 7.49% drop for the benchmark. Since inception (1/1/03) on an annualized basis, the Fund has generated a return of 13.18% compared to 6.75% for the Russell 2000 Value Index.
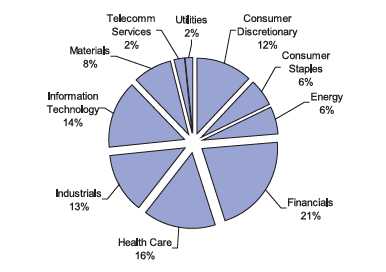
Relative to the benchmark, the Fund experienced a challenging 2008 in the Industrials and Energy sectors. These two sectors were significant drivers of Fund outperformance over the last market cycle. We reduced our exposure to both sectors as the year progressed. However, the speed and depth of the economic slowdown had a negative impact on portfolio performance.
The Fund's Consumer Staples and Health Care stocks did relatively well in 2008. Flowers Foods, a southeastern U.S. bakery, expertly navigated the volatile commodity environment and generated 26% earnings growth. The stock appreciated 6% for the year. Two of our pharmaceutical holdings also generated strong returns. Alpharma, a specialty pharmaceutical company focused on pain management, was acquired by King Pharmaceutical for a significant premium, and returned 78%. Later in the year, we took advantage of the market sell-off to acquire shares of Endo Pharmaceutical, another specialty player focused on pain management. Endo continued to generate revenue and earnings growth above expectations, and appreciated 23%.
| Paradigm Select Fund Portfolio Performance |
The Paradigm Select Fund declined 33.61% during 2008 compared to a 36.79% drop for its benchmark, the Russell 2500 Index. Over the past three years on an annualized basis, the Fund has declined 5.16% vs. a 9.37% drop for the benchmark. Since inception (1/1/05) on an annualized basis, the Fund has declined 1.13% compared to decline of 5.29% for the Russell 2500 Index.
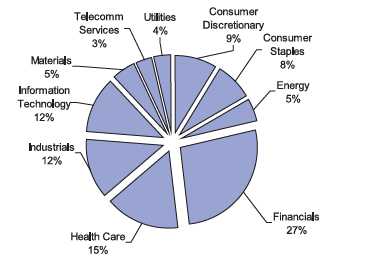
Relative to the benchmark, the Fund experienced a strong year in the Consumer Staples, Energy, and Financials sectors, driven by both stock and sector allocation decisions. In the traditionally defensive Consumer Staples sector, both Flowers Foods, a southeastern U.S. baking company, and Church & Dwight, a marketer of household products, posted strong earnings growth in 2008 of 26% and 16%, respectively. In the Energy sector, our profit-taking in the middle of the year left us with an underweight position relative to our benchmark when oil prices collapsed in the fall. Finally, our decision to underweight banks and stick with conservative balance sheets in the Financial sector was a major contributor to relative performance in the year.
The Fund experienced a challenging year in the Consumer Discretionary sector. In particular, our exposure to two auto-related names negatively impacted performance. While the two companies, Goodyear Tire and Penske Auto, are high quality businesses, neither was able dodge the tsunami that hit the industry this fall. Several retail names were also significant detractors to Fund performance this year.
2008 Annual Report 4
Paradigm Opportunity Fund Portfolio Performance |
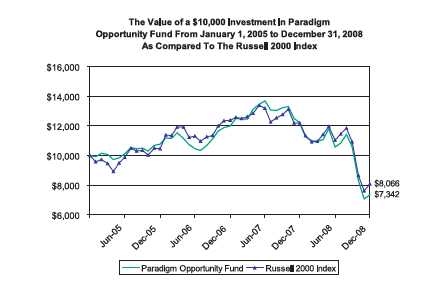
The Paradigm Opportunity Fund declined 39.89% during 2008 compared to a 33.79% drop for its benchmark, the Russell 2000 Index. Over the past three years on an annualized basis, the Fund has declined 11.97% vs. an 8.28% drop for the benchmark. Since inception (1/1/05) on an annualized basis, the Fund has declined 7.43% compared to 5.23% for the Russell 2000 Index.
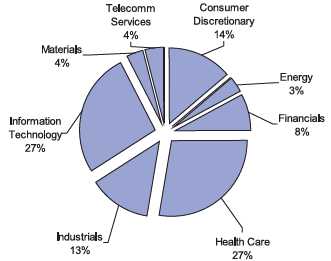
Relative to the benchmark, the Fund experienced a challenging year in cyclical Consumer Discretionary, Industrials, and Technology sectors. The Fund was overweight Technology and Consumer Discretionary, two of the three worst performing sectors in the index. Poor stock selection in Industrials also hurt relative performance.
The Fund benefited from positive stock selection in the Energy, Materials and Financials sectors. In addition, our overweight allocation to the defensive Health Care sector also helped returns. The Fund's two top performing stocks came from the Health Care sector, Endo Pharmaceutical and Cantel Medical. Endo Pharmaceutical specializes in pain management, and was purchased during the market sell-off in the fall. Cantel Medical, a niche medical device company, posted improvements in revenue, earnings and cash flows throughout the year, resulting in a 30% return for the Fund in the stock. Lastly, within the Financials sector, EZ Corp, an operator of pawn shops, returned 21%, as the recession and credit crisis led to increased demand for the company's services.
| Paradigm Intrinsic Value Fund Portfolio Performance |
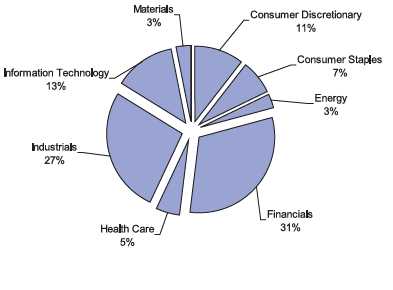
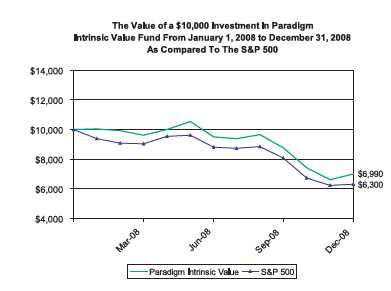
The Paradigm Intrinsic Value Fund declined 30.10% during 2008 (also the since inception period) compared to a 37.00% drop for its benchmark, the S&P 500 Index. The Fund's relative outperformance during 2008 was due to both stock selection and sector allocation, with investments in the Financial and Industrial sectors having the greatest impact on performance. Quanta Capital, a micro-cap special situation in the Financial sector, was the Fund's top performer, with a 60.3% positive return. Pacer International, in the Industrial sector, contributed a 33.67% return. Investments in gold and health-care also helped Fund performance this year.
The Consumer Discretionary sector was the largest relative detractor to Fund performance. Holdings like Coach and Phillips-Van Heusen were hit hard by the collapse in consumer spending this fall. Two investments in the Materials sector, RTI International and Innospec, also hurt performance, as the collapse in commodity prices and industrial production took its toll on these smaller capitalization, niche players.
2008 Annual Report 5
Paradigm Funds (Unaudited)
| PARADIGM VALUE FUND Sector Allocation (Unaudited) (As a Percentage of Equity Securities Held) |
| PARADIGM SELECT FUND Sector Allocation (Unaudited) (As a Percentage of Equity Securities Held) |
2008 Annual Report 6
Paradigm Funds (Unaudited)
PARADIGM OPPORTUNITY FUND
Sector Allocation (Unaudited)
(As a Percentage of Equity Securities Held)
PARADIGM INTRINSIC VALUE FUND
Sector Allocation (Unaudited)
(As a Percentage of Equity Securities Held)
2008 Annual Report 7
Paradigm Value Fund (Unaudited)
PERFORMANCE INFORMATION
Average Annual Rate of Return (%) for The Periods Ended December 31, 2008
December 31, 2008 NAV $32.51
| Since | ||||||||
| 1 Year(A) | 3 Years(A) | 5 Years(A) | Inception(A) | |||||
| Paradigm Value Fund | (33.88)% | (6.10)% | 5.51% | 13.18% | ||||
| Russell 2000 Value Index(B) | (28.92)% | (7.49)% | 0.27% | 6.75% |
(A)1 Year, 3 Years, 5 Years and Since Inception returns include change in share prices and in each case includes reinvestment of any dividends and capital gain distributions. The inception date of the Paradigm Value Fund was January 1, 2003.
(B)The Russell 2000® Value Index (whose composition is different from the Fund) is an unmanaged index of small-capitalization stocks with lower price-to-book ratios and lower forecasted growth values than the total population of small-capitalization stocks.
For purposes of the graph and the accompanying table, it is assumed that all dividends and distributions were reinvested.
PAST PERFORMANCE DOES NOT GUARANTEE FUTURE RESULTS. INVESTMENT RETURN AND PRINCIPAL VALUE WILL FLUCTUATE SO THAT SHARES, WHEN REDEEMED, MAY BE WORTH MORE OR LESS THAN THEIR ORIGINAL COST. RETURNS DO NOT REFLECT THE DEDUCTION OF TAXES THAT A SHAREHOLDER WOULD PAY ON FUND DISTRIBUTIONS OR THE REDEMPTION OF FUND SHARES. CURRENT PERFORMANCE MAY BE LOWER OR HIGHER THAT THE PERFORMANCE DATA QUOTED. TO OBTAIN PERFORMANCE DATA CURRENT TO THE MOST RECENT MONTH END, PLEASE CALL 1-800-239-0732 OR VISIT OUR WEBSITE AT www.paradigm-funds.com.
2008 Annual Report 8
Paradigm Select Fund (Unaudited)
PERFORMANCE INFORMATION
Average Annual Rate of Return (%) for The Periods Ended December 31, 2008
December 31, 2008 NAV $18.53
| Since | ||||||
| 1 Year(A) | 3 Year(A) | Inception(A) | ||||
| Paradigm Select Fund | (33.61)% | (5.16)% | (1.13)% | |||
| Russell 2500 Index(B) | (36.79)% | (9.37)% | (5.29)% |
(A)1 Year, 3 Year and Since Inception returns include change in share prices and in each case includes reinvestment of any dividends and capital gain distributions. The inception date of the Paradigm Select Fund was January 1, 2005.
(B)The Russell 2500® Index (whose composition is different from the Fund) measures the performance of the small to mid-cap segment of the U.S. equity universe, commonly referred to as "mid" cap. The Russell 2500 Index is a subset of the Russell 3000® Index. It includes approximately 2,500 of the smallest securities based on a combination of their market cap and current index membership.
For purposes of the graph and the accompanying table, it is assumed that all dividends and distributions were reinvested.
PAST PERFORMANCE DOES NOT GUARANTEE FUTURE RESULTS. INVESTMENT RETURN AND PRINCIPAL VALUE WILL FLUCTUATE SO THAT SHARES, WHEN REDEEMED, MAY BE WORTH MORE OR LESS THAN THEIR ORIGINAL COST. RETURNS DO NOT REFLECT THE DEDUCTION OF TAXES THAT A SHAREHOLDER WOULD PAY ON FUND DISTRIBUTIONS OR THE REDEMPTION OF FUND SHARES. CURRENT PERFORMANCE MAY BE LOWER OR HIGHER THAT THE PERFORMANCE DATA QUOTED. TO OBTAIN PERFORMANCE DATA CURRENT TO THE MOST RECENT MONTH END, PLEASE CALL 1-800-239-0732 OR VISIT OUR WEBSITE AT www.paradigm-funds.com.
2008 Annual Report 9
Paradigm Opportunity Fund (Unaudited)
PERFORMANCE INFORMATION
Average Annual Rate of Return (%) for The Periods Ended December 31, 2008
December 31, 2008 NAV $13.79
| Since | ||||||
| 1 Year(A) | 3 Year(A) | Inception(A) | ||||
| Paradigm Opportunity Fund | (39.89)% | (11.97)% | (7.43)% | |||
| Russell 2000 Index(B) | (33.79)% | (8.28)% | (5.23)% |
(A)1 Year, 3 Year and Since Inception returns include change in share prices and in each case includes reinvestment of any dividends and capital gain distributions. The inception date of the Paradigm Opportunity Fund was January 1, 2005.
(b)The Russell 2000® Index (whose composition is different from the Fund) consists of the smallest 2,000 companies in the Russell 3000 Index (which represents approximately 98% of the investable U.S. equity market). The Index is an unmanaged index generally considered as the premier of small capitalization stocks.
For purposes of the graph and the accompanying table, it is assumed that all dividends and distributions were reinvested.
PAST PERFORMANCE DOES NOT GUARANTEE FUTURE RESULTS. INVESTMENT RETURN AND PRINCIPAL VALUE WILL FLUCTUATE SO THAT SHARES, WHEN REDEEMED, MAY BE WORTH MORE OR LESS THAN THEIR ORIGINAL COST. RETURNS DO NOT REFLECT THE DEDUCTION OF TAXES THAT A SHAREHOLDER WOULD PAY ON FUND DISTRIBUTIONS OR THE REDEMPTION OF FUND SHARES. CURRENT PERFORMANCE MAY BE LOWER OR HIGHER THAT THE PERFORMANCE DATA QUOTED. TO OBTAIN PERFORMANCE DATA CURRENT TO THE MOST RECENT MONTH END, PLEASE CALL 1-800-239-0732 OR VISIT OUR WEBSITE AT www.paradigm-funds.com.
2008 Annual Report 10
Paradigm Intrinsic Value Fund (Unaudited)
PERFORMANCE INFORMATION
Average Annual Rate of Return (%) for The Period Ended December 31, 2008
December 31, 2008 NAV $13.98
| Since | ||
| Inception(A) | ||
| Paradigm Intrinsic Value Fund | (30.10)% | |
| S&P 500 Index(B) | (37.00)% |
(A)Since Inception returns include change in share prices and in each case includes reinvestment of any dividends and capital gain distributions. The inception date of the Paradigm Intrinsic Value Fund was January 1, 2008.
(B)The S&P 500® Index (whose composition is different from the Fund) is a managed index which measures the performance of 500 companies chosen by Standard & Poor’s to represent the large cap U.S. equity market.
For purposes of the graph and the accompanying table, it is assumed that all dividends and distributions were reinvested.
PAST PERFORMANCE DOES NOT GUARANTEE FUTURE RESULTS. INVESTMENT RETURN AND PRINCIPAL VALUE WILL FLUCTUATE SO THAT SHARES, WHEN REDEEMED, MAY BE WORTH MORE OR LESS THAN THEIR ORIGINAL COST. RETURNS DO NOT REFLECT THE DEDUCTION OF TAXES THAT A SHAREHOLDER WOULD PAY ON FUND DISTRIBUTIONS OR THE REDEMPTION OF FUND SHARES. CURRENT PERFORMANCE MAY BE LOWER OR HIGHER THAT THE PERFORMANCE DATA QUOTED. TO OBTAIN PERFORMANCE DATA CURRENT TO THE MOST RECENT MONTH END, PLEASE CALL 1-800-239-0732 OR VISIT OUR WEBSITE AT www.paradigm-funds.com.
2008 Annual Report 11
| Paradigm Value Fund | ||||||
| Schedule of Investments | ||||||
| December 31, 2008 | ||||||
| Shares/Principal Amount | Market Value | % of Net Assets | ||||
| COMMON STOCKS | ||||||
| Aircraft Part & Auxiliary Equipment | ||||||
| 98,000 | LMI Aerospace Inc. * | $ 1,114,260 | 1.31% | |||
| Apparel & Other Finished Products of Fabrics & Similar Materials | ||||||
| 136,200 | Volcom Inc. * | 1,484,580 | 1.75% | |||
| Canned, Frozen & Preserved Fruit, Vegetables & Food Specialties | ||||||
| 48,500 | Corn Products International Inc. | 1,399,225 | 1.65% | |||
| Carpets & Rugs | ||||||
| 170,300 | Interface Inc. Class A | 790,192 | 0.93% | |||
| Chemical & Allied Products | ||||||
| 45,600 | Arch Chemicals Inc. | 1,188,792 | ||||
| 108,500 | Innospec Inc. | 639,065 | ||||
| 1,827,857 | 2.15% | |||||
| Computer Services Software & Services | ||||||
| 142,350 | Aspen Technology Inc. * | 1,056,237 | 1.24% | |||
| Construction Machinery & Equipment | ||||||
| 64,600 | Columbus McKinnon Corp. * | 881,790 | 1.04% | |||
| Crude Petroleum & Natural Gas | ||||||
| 60,300 | St. Mary Land & Exploration Co. | 1,224,693 | ||||
| 23,400 | Swift Energy Co. * | 393,354 | ||||
| 32,800 | Whiting Petroleum Corp. * | 1,097,488 | ||||
| 2,715,535 | 3.19% | |||||
| Deep Sea Foreign Transportation of Freight | ||||||
| 17,400 | Seacor Holdings Inc. * | 1,159,710 | 1.36% | |||
| Drilling Oil & Gas Wells | ||||||
| 49,800 | Atwood Oceanics Inc. * | 760,944 | 0.90% | |||
| Electric Services | ||||||
| 67,600 | Portland General Electric Co. | 1,316,172 | 1.55% | |||
| Electrical Industrial Apparatus | ||||||
| 43,600 | Woodward Governor Co. | 1,003,672 | 1.18% | |||
| Electronic Components, NEC | ||||||
| 340,350 | Spectrum Control Inc. * | 2,089,749 | 2.46% | |||
| Fire, Marine & Casualty Insurance | ||||||
| 67,000 | American Financial Group Inc. | 1,532,960 | ||||
| 56,200 | Harleysville Group Inc. | 1,951,826 | ||||
| 3,484,786 | 4.10% | |||||
| Food and Kindred Products | ||||||
| 66,650 | Flowers Foods Inc. | 1,623,594 | 1.91% | |||
| Games, Toys & Children's Vehicles (No Dolls & Bicycles) | ||||||
| 53,500 | JAKKS Pacific Inc. * | 1,103,705 | 1.30% | |||
| Hospital & Medical Service Plans | ||||||
| 77,600 | Molina Healthcare Inc. * | 1,366,536 | 1.61% | |||
| In Vitro & In Vivo Diagnostic Substances | ||||||
| 177,000 | Trinity Biotech plc * ** | 283,200 | 0.33% | |||
| Industrial Instruments For Measurement, Display and Control | ||||||
| 8,730 | K-Tron International Inc. * | 697,527 | 0.82% | |||
| Industrial Organic Chemicals | ||||||
| 65,600 | Sensient Technologies Corp. | 1,566,528 | 1.84% | |||
| Laboratory Analytical Instruments | ||||||
| 49,800 | PerkinElmer Inc. | 692,718 | 0.81% | |||
| Life Insurance | ||||||
| 8,100 | National Western Life Insurance Co. | 1,370,277 | 1.61% | |||
| *Non-Income Producing Securities. **ADR - American Depository Receipt. The accompanying notes are an integral part of these financial statements. |
2008 Annual Report 12
Paradigm Value Fund | ||||||
| Schedule of Investments | ||||||
| December 31, 2008 | ||||||
| Shares/Principal Amount | Market Value | % of Net Assets | ||||
| COMMON STOCKS | ||||||
| Men's & Boy's Furnishings, Work Clothing & Allied Garments | ||||||
| 48,000 | Phillips-Van Heusen Corp. | $ 966,240 | 1.14% | |||
| Metal Cans | ||||||
| 45,400 | Silgan Holdings Inc. | 2,170,574 | 2.55% | |||
| Miscellaneous Industrial & Commercial Machinery & Equipment | ||||||
| 48,200 | Curtiss-Wright Corp. | 1,609,398 | 1.89% | |||
| Miscellaneous Chemical Products | ||||||
| 49,800 | WD-40 Co. | 1,408,842 | 1.66% | |||
| Motor Vehicle Parts & Accessories | ||||||
| 60,800 | Superior Industries International Inc. | 639,616 | 0.75% | |||
| Orthopedic, Prosthetic & Surgical Appliances & Supplies | ||||||
| 56,800 | Steris Corp. | 1,356,952 | 1.60% | |||
| Pharmaceutical Preparations | ||||||
| 119,400 | Endo Pharmaceuticals Holdings Inc. * | 3,090,072 | 3.63% | |||
| Railroads, Line-Haul Operating | ||||||
| 58,100 | Kansas City Southern * | 1,106,805 | 1.30% | |||
| Retail - Miscellaneous Retail | ||||||
| 108,100 | EZCORP Inc. * | 1,644,201 | 1.93% | |||
| Retail - Shoe Stores | ||||||
| 59,700 | Genesco Inc. * | 1,010,124 | 1.19% | |||
| Rolling, Drawing & Extruding of Nonferrous Metals | ||||||
| 66,600 | RTI International Metals Inc. * | 953,046 | 1.12% | |||
| Savings Institution, Federally Chartered | ||||||
| 105,600 | United Financial Bancorp | 1,598,784 | ||||
| 182,700 | Westfield Financial Inc. | 1,885,464 | ||||
| 3,484,248 | 4.10% | |||||
| Security Brokers, Dealers & Flotation Companies | ||||||
| 101,600 | Jefferies Group Inc. | 1,428,496 | ||||
| 43,900 | Piper Jaffray Companies * | 1,745,464 | ||||
| 3,173,960 | 3.73% | |||||
| Semiconductors & Related Devices | ||||||
| 33,300 | Cabot Microelectronics Corp. * | 868,131 | ||||
| 69,300 | Verigy, Ltd. * | 666,666 | ||||
| 1,534,797 | 1.81% | |||||
| Services - Business Services | ||||||
| 63,200 | Fair Isaac Corp. | 1,065,552 | ||||
| 174,100 | Premiere Global Services, Inc. * | 1,499,001 | ||||
| 2,564,553 | 3.02% | |||||
| Services - Computer Programming Services | ||||||
| 248,100 | Ness Technologies Inc. * ** | 1,061,868 | 1.25% | |||
| Services - Hospitals | ||||||
| 67,700 | Magellan Health Services Inc. * | 2,651,132 | ||||
| 88,400 | Rehabcare Group Inc. * | 1,340,144 | ||||
| 3,991,276 | 4.69% | |||||
| Services - Motion Picture Theaters | ||||||
| 165,500 | Regal Entertainment Group | 1,689,755 | 1.99% | |||
| Services - Prepackaged Software | ||||||
| 47,100 | ACI Worldwide, Inc. * | 748,890 | ||||
| 244,600 | Compuware Corp. * | 1,651,050 | ||||
| 69,800 | Sybase, Inc. * | 1,728,946 | ||||
| 4,128,886 | 4.86% | |||||
| *Non-Income Producing Securities. **ADR - American Depository Receipt. The accompanying notes are an integral part of these financial statements. |
2008 Annual Report 13
Paradigm Value Fund | ||||||
| Schedule of Investments | ||||||
| December 31, 2008 | ||||||
| Shares/Principal Amount | Market Value | % of Net Assets | ||||
| COMMON STOCKS | ||||||
| Sporting & Athletic Goods, NEC | ||||||
| 154,100 | Callaway Golf Co. | $ 1,431,589 | ||||
| 444,100 | Cybex International Inc. * | 817,144 | ||||
| 2,248,733 | 2.65% | |||||
| Surgical & Medical Instruments & Apparatus | ||||||
| 77,900 | Cantel Medical Corp. * | 1,142,793 | 1.34% | |||
| Telephone Communications | ||||||
| 84,000 | iBasis Inc. * | 118,440 | 0.14% | |||
| Water, Sewer, Pipeline, Comm & Power Line Construction | ||||||
| 16,936 | Preformed Line Products Co. | 779,734 | 0.92% | |||
| Wholesale - Machinery, Equipment & Supplies | ||||||
| 101,000 | Kaman Corp. | 1,831,130 | 2.14% | |||
| Total for Common Stock (Cost $93,489,185) | $ 73,494,837 | 86.44% | ||||
| REAL ESTATE INVESTMENT TRUSTS | ||||||
| 245,200 | Anworth Mortgage Asset Corp. | 1,576,636 | ||||
| 274,400 | MFA Mortgage Investments Inc. | 1,616,216 | ||||
| Total for Real Estate Investment Trusts (Cost $4,341,221) | 3,192,852 | 3.76% | ||||
| CORPORATE BONDS | ||||||
| 2,000,000 | Ciena Corp. (0.25% expires 5/1/2013) | 1,066,644 | ||||
| Total for Corporate Bonds (Cost $1,110,910) | 1,066,644 | 1.25% | ||||
| CASH EQUIVALENTS | ||||||
| 7,683,785 | SEI Daily Income Treasury Government CL B 1.41% *** | 7,683,785 | 9.04% | |||
| Total for Cash Equivalents (Cost $7,683,785) | ||||||
| Total Investment Securities | 85,438,118 | 100.49% | ||||
| (Cost $106,625,101) | ||||||
| Liabilities In Excess of Other Assets | (420,025) | -0.49% | ||||
| Net Assets | $ 85,018,093 | 100.00% | ||||
| *Non-Income Producing Securities. ***Variable Rate Security; the rate shown was the rate at December 31, 2008. The accompanying notes are an integral part of these financial statements. |
2008 Annual Report 14
Paradigm Select Fund | ||||||
| Schedule of Investments | ||||||
| December 31, 2008 | ||||||
| Shares/Principal Amount | Market Value | % of Net Assets | ||||
| COMMON STOCKS | ||||||
| Aircraft Part & Auxiliary Equipment, NEC | ||||||
| 400 | Rockwell Collins Inc. | $ 15,636 | 0.77% | |||
| Biological Products, (No Diagnostic Substances) | ||||||
| 1,700 | Life Technologies Corporation * | 39,627 | 1.95% | |||
| Canned, Fruits, Vegetables, Preserves, Jams & Jellies | ||||||
| 900 | The J. M. Smucker Company | 39,024 | 1.92% | |||
| Carpets & Rugs | ||||||
| 3,400 | Interface Inc. Class A | 15,776 | 0.78% | |||
| Chemical & Allied Products | ||||||
| 1,800 | Innospec Inc. | 10,602 | 0.52% | |||
| Computer Services Software & Services | ||||||
| 3,200 | Aspen Technology Inc. * | 23,744 | 1.17% | |||
| Crude Petroleum & Natural Gas | ||||||
| 900 | Denbury Resources Inc. * | 9,828 | ||||
| 1,100 | Plains Exploration & Production Company * | 25,564 | ||||
| 1,300 | St. Mary Land & Exploration Co. | 26,403 | ||||
| 800 | Whiting Petroleum Corp. * | 26,768 | ||||
| 88,563 | 4.36% | |||||
| Electric & Other Services Combined | ||||||
| 2,600 | CMS Energy Corp. | 26,286 | 1.29% | |||
| Electric Services | ||||||
| 3,500 | Dynegy Inc. * | 7,000 | ||||
| 1,900 | Portland General Electric Co. | 36,993 | ||||
| 43,993 | 2.17% | |||||
| Electrical Industrial Apparatus | ||||||
| 1,000 | Woodward Governor Co. | 23,020 | 1.13% | |||
| Fabricated Rubber Products | ||||||
| 1,000 | West Pharmaceutical Services, Inc. | 37,770 | 1.86% | |||
| Fire, Marine & Casualty Insurance | ||||||
| 261 | Alleghany Inc. * | 73,602 | ||||
| 2,000 | American Financial Group Inc. | 45,760 | ||||
| 400 | Everest Re Group Ltd. ** | 30,456 | ||||
| 1,700 | Harleysville Group Inc. | 59,041 | ||||
| 150 | Markel Corp. * | 44,850 | ||||
| 253,709 | 12.49% | |||||
| Food & Kindred Products | ||||||
| 1,575 | Flowers Foods Inc. | 38,367 | 1.89% | |||
| Guided Missiles & Space Vehicles & Parts | ||||||
| 500 | Alliant Techsystems Inc. * | 42,880 | 2.11% | |||
| Insurance Agents, Brokers & Service | ||||||
| 1,700 | Arthur J Gallagher & Co. | 44,047 | 2.17% | |||
| Iron & Steel Foundries | ||||||
| 300 | Precision Castparts Corp. | 17,844 | 0.88% | |||
| Laboratory Analytical Instruments | ||||||
| 2,348 | PerkinElmer Inc. | 32,661 | 1.61% | |||
| Life Insurance | ||||||
| 148 | National Western Life Insurance Co. | 25,037 | 1.23% | |||
| Meat Packing Plants | ||||||
| 1,100 | Hormel Foods Corp. | 34,188 | 1.68% | |||
| Men's & Boy's Furnishings, Work Clothing & Allied Garments | ||||||
| 1,580 | Phillips-Van Heusen Corp. | 31,805 | 1.57% | |||
| Metal Cans | ||||||
| 1,600 | Crown Holdings Inc. * | 30,720 | 1.51% | |||
| *Non-Income Producing Securities. **ADR - American Depository Receipt. The accompanying notes are an integral part of these financial statements. |
2008 Annual Report 15
| Paradigm Select Fund | ||||||
| Schedule of Investments | ||||||
| December 31, 2008 | ||||||
| Shares/Principal Amount | Market Value | % of Net Assets | ||||
| COMMON STOCKS | ||||||
| Miscellaneous Industrial & Commercial Machinery & Equipment | ||||||
| 1,100 | Curtiss-Wright Corp. | $ 36,729 | 1.81% | |||
| Orthopedic, Prosthetic & Surgical Appliances & Supplies | ||||||
| 1,300 | Steris Corp. | 31,057 | 1.53% | |||
| Pharmaceutical Preparations | ||||||
| 2,600 | Endo Pharmaceuticals Holdings Inc. * | 67,288 | 3.31% | |||
| Plastics Products | ||||||
| 1,100 | AptarGroup Inc. | 38,764 | 1.91% | |||
| Pumps & Pumping Equipment | ||||||
| 900 | Robbins & Myers Inc. | 14,553 | 0.72% | |||
| Radiotelephone Communications | ||||||
| 1,100 | Telephone & Data Systems Inc. | 30,910 | 1.52% | |||
| Railroad, Line-Haul Operating | ||||||
| 1,348 | Kansas City Southern * | 25,679 | 1.26% | |||
| Retail - Retail Stores | ||||||
| 1,300 | Petsmart Inc. | 23,985 | 1.18% | |||
| Secondary Selting & Refining of Nonferrous Metals | ||||||
| 1,600 | Titanium Metals Corp. | 14,096 | 0.70% | |||
| Security & Commodity Brokers, Dealers, Exchanges & Services | ||||||
| 2,000 | Interactive Data Corporation | 49,320 | 2.43% | |||
| Security Brokers, Dealers & Flotation Companies | ||||||
| 2,300 | Jefferies Group Inc. | 32,338 | ||||
| 1,100 | Piper Jaffray Companies * | 43,736 | ||||
| 76,074 | 3.75% | |||||
| Semiconductors & Related Devices | ||||||
| 1,000 | Cabot Microelectronics Corp. * | 26,070 | ||||
| 1,600 | Verigy, Ltd. * ** | 15,392 | ||||
| 41,462 | 2.04% | |||||
| Services - Business Services | ||||||
| 1,500 | Fair Isaac Corp. | 25,290 | ||||
| 3,800 | Premiere Global Services Inc. * | 32,718 | ||||
| 58,008 | 2.86% | |||||
| Services - Computer Integrated Systems Design | ||||||
| 2,800 | Convergys Corp. * | 17,948 | 0.88% | |||
| Services - Hospitals | ||||||
| 1,300 | Magellan Health Services Inc. * | 50,908 | 2.51% | |||
| Services - Miscellaneous Health & Allied Services, NEC | ||||||
| 1,200 | Lincare Holdings Inc. * | 32,316 | 1.59% | |||
| Services - Motion Picture Theaters | ||||||
| 3,000 | Regal Entertainment Group | 30,630 | 1.51% | |||
| Services - Prepackaged Software | ||||||
| 5,300 | Compuware Corp. * | 35,775 | ||||
| 1,700 | Sybase, Inc. * | 42,109 | ||||
| 77,884 | 3.83% | |||||
| Soap, Detergents, Cleaning Preparations, Perfumes, Cosmetics | ||||||
| 700 | Church & Dwight Co., Inc. | 39,284 | 1.93% | |||
| Special Industry Machinery (No Metalworking Machinery) | ||||||
| 800 | Pentair Inc. | 18,936 | 0.93% | |||
| Sporting & Athletic Goods, NEC | ||||||
| 3,400 | Callaway Golf Co. | 31,586 | 1.56% | |||
| State Commercial Banks | ||||||
| 800 | Wilmington Trust Corporation | 17,792 | 0.88% | |||
| *Non-Income Producing Securities. **ADR - American Depository Receipt. The accompanying notes are an integral part of these financial statements. |
2008 Annual Report 16
Paradigm Select Fund | ||||||
| Schedule of Investments | ||||||
| December 31, 2008 | ||||||
| Shares/Principal Amount | Market Value | % of Net Assets | ||||
| COMMON STOCKS | ||||||
| Water Transportation | ||||||
| 1,000 | Alexander & Baldwin Inc. | $ 25,060 | 1.23% | |||
| Wholesale - Electronic Parts & Equipment | ||||||
| 2,200 | Avnet Inc. * | 40,062 | 1.97% | |||
| Total for Common Stock (Cost $2,056,351) | $ 1,805,630 | 88.90% | ||||
| REAL ESTATE INVESTMENT TRUSTS | ||||||
| 7,700 | Anworth Mortgage Asset Corp. | 49,511 | ||||
| 6,600 | MFA Mortgage Investments Inc. | 38,874 | ||||
| Total for Real Estate Investment Trusts (Cost $98,976) | 88,385 | 4.36% | ||||
| CASH EQUIVALENTS | ||||||
| 327,459 | SEI Daily Income Treasury Government CL B 1.41% *** | 327,459 | 16.12% | |||
| Total for Cash Equivalents (Cost $327,459) | ||||||
| Total Investment Securities | 2,221,474 | 109.38% | ||||
(Cost $2,482,786) | ||||||
| Liabilities In Excess of Other Assets | (190,441) | -9.38% | ||||
| Net Assets�� | $ 2,031,033 | 100.00% | ||||
| *Non-Income Producing Securities. ***Variable Rate Security; the rate shown was the rate at December 31, 2008. The accompanying notes are an integral part of these financial statements. |
2008 Annual Report 17
Paradigm Opportunity Fund | ||||||
| Schedule of Investments | ||||||
| December 31, 2008 | ||||||
| Shares/Principal Amount | Market Value | % of Net Assets | ||||
| COMMON STOCKS | ||||||
| Aircraft Parts & Auxiliary Equipment | ||||||
| 7,400 | LMI Aerospace Inc. * | $ 84,138 | 3.47% | |||
| Apparel & Other Finished Products of Fabrics & Similar Materials | ||||||
| 7,600 | Volcom Inc. * | 82,840 | 3.42% | |||
| Biological Products, (No Diagnostic Substances) | ||||||
| 3,200 | Life Technologies Corporation * | 74,592 | 3.08% | |||
| Carpets & Rugs | ||||||
| 14,800 | Interface Inc. Class A | 68,672 | 2.83% | |||
| Computer Services Software | ||||||
| 12,300 | Aspen Technology Inc. * | 91,266 | 3.76% | |||
| Construction Machinery & Equipment | ||||||
| 6,300 | Columbus Mckinnon Corp. * | 85,995 | 3.55% | |||
| Crude Petroleum & Natural Gas | ||||||
| 3,800 | St. Mary Land & Exploration Co. | 77,178 | 3.18% | |||
| Electronic Components, NEC | ||||||
| 19,900 | Spectrum Control Inc. * | 122,186 | 5.04% | |||
| Hospital & Medical Service Plans | ||||||
| 4,100 | Molina Healthcare Inc. * | 72,201 | 2.98% | |||
| In Vitro & In Vivo Diagnostic Substances | ||||||
| 17,200 | Trinity Biotech plc * ** | 27,520 | 1.13% | |||
| Laboratory Analytical Instruments | ||||||
| 5,300 | PerkinElmer Inc. | 73,723 | 3.04% | |||
| Metal Cans | ||||||
| 4,500 | Crown Holdings Inc. * | 86,400 | 3.56% | |||
| Orthopedic, Prosthetic & Surgical Appliances & Supplies | ||||||
| 3,100 | Steris Corp. | 74,059 | 3.05% | |||
| Pharmaceutical Preparations | ||||||
| 5,900 | Endo Pharmaceuticals Holdings Inc. * | 152,692 | 6.30% | |||
| Retail - Miscellaneous Retail | ||||||
| 6,300 | EZCORP Inc. * | 95,823 | 3.95% | |||
| Services - Business Services | ||||||
| 10,200 | Premiere Global Services Inc. * | 87,822 | 3.62% | |||
| Services - Computer Programming Services | ||||||
| 16,500 | Ness Technologies Inc. * ** | 70,620 | 2.91% | |||
| Services - Hospitals | ||||||
| 2,300 | Magellan Health Services Inc. * | 90,068 | 3.71% | |||
| Services - Motion Picture Theaters | ||||||
| 8,200 | Regal Entertainment Group | 83,722 | 3.45% | |||
| Service - Prepackaged Software | ||||||
| 5,200 | ACI Worldwide, Inc. * | 82,680 | ||||
| 12,400 | Compuware Corp. * | 83,700 | ||||
| 6,600 | Parametric Technology Corp. * | 83,490 | ||||
| 3,600 | Sybase, Inc. * | 89,172 | ||||
| 339,042 | 13.98% | |||||
| Sporting & Athletic Goods, NEC | ||||||
| 8,100 | Callaway Golf Co. | 75,249 | ||||
| 44,100 | Cybex International Inc. * | 81,144 | ||||
| 156,393 | 6.45% | |||||
| Surgical & Medical Instruments & Apparatus | ||||||
| 5,100 | Cantel Medical Corp. * | 74,817 | 3.09% | |||
| *Non-Income Producing Securities. **ADR - American Depository Receipt. The accompanying notes are an integral part of these financial statements. |
2008 Annual Report 18
Paradigm Opportunity Fund | ||||
| Schedule of Investments | ||||
| December 31, 2008 | ||||
| Shares/Principal Amount | Market Value | % of Net Assets | ||
| COMMON STOCKS | ||||
| Wholesale - Machinery, Equipment & Supplies | ||||
| 4,000 Kaman Corp. | $ 72,520 | 2.99% | ||
| Total for Common Stock (Cost $3,044,315) | $ 2,244,289 | 92.54% | ||
| REAL ESTATE INVESTMENT TRUSTS | ||||
| 14,400 MFA Mortgage Investments Inc. | 84,816 | 3.50% | ||
| Total for Real Estate Investment Trusts (Cost $80,826) | ||||
| CASH EQUIVALENTS | ||||
| 162,579 SEI Daily Income Treasury Government CL B 1.41% *** | 162,579 | 6.71% | ||
| Total for Cash Equivalents (Cost $162,579) | ||||
| Total Investment Securities | 2,491,684 | 102.75% | ||
| (Cost $3,287,720) | ||||
| Liabilities In Excess of Other Assets | (66,592) | -2.75% | ||
| Net Assets | $ 2,425,092 | 100.00% | ||
| ***Variable Rate Security; the rate shown was the rate at December 31, 2008. The accompanying notes are an integral part of these financial statements. |
2008 Annual Report 19
| Paradigm Intrinsic Value Fund | ||||||
| Schedule of Investments | ||||||
| December 31, 2008 | ||||||
| Shares/Principal Amount | Market Value | % of Net Assets | ||||
| COMMON STOCKS | ||||||
| Apparel & Other Finished Products of Fabrics & Similar Materials | ||||||
| 2,780 | Volcom Inc. * | $ 30,302 | 1.87% | |||
| Beverages | ||||||
| 725 | Dr Pepper Snapple Group, Inc. * | 11,781 | ||||
| 655 | Pepsico, Inc. | 35,874 | ||||
| 47,655 | 2.94% | |||||
| Chemicals & Allied Products | ||||||
| 5,845 | Innospec Inc. | 34,427 | 2.13% | |||
| Crude Petroleum & Natural Gas | ||||||
| 245 | EnCana Corp. | 11,388 | ||||
| 570 | Plains Exploration & Production Company * | 13,247 | ||||
| 420 | Whiting Petroleum Corp. * | 14,053 | ||||
| 38,688 | 2.39% | |||||
| Engines & Turbines | ||||||
| 890 | Cummins Inc. | 23,790 | 1.47% | |||
| Fire, Marine & Casualty Insurance | ||||||
| 3,950 | American Financial Group Inc. | 90,376 | ||||
| 11 | Berkshire Hathaway Inc. Class B * | 35,354 | ||||
| 125,730 | 7.76% | |||||
| Food and Kindred Products | ||||||
| 1,547 | Nestle SA ** | 61,416 | 3.79% | |||
| Guided Missiles & Space Vehicles & Parts | ||||||
| 435 | Alliant Techsystems Inc. * | 37,306 | 2.30% | |||
| Insurance Agents, Brokers & Service | ||||||
| 2,640 | Marsh & McLennan Companies, Inc. | 64,073 | 3.96% | |||
| Iron & Steel Foundries | ||||||
| 550 | Precision Castparts Corp. | 32,714 | 2.02% | |||
| Leather & Leather Products | ||||||
| 2,655 | Coach Inc. * | 55,144 | 3.40% | |||
| Men's & Boys' Furnishings, Work Clothing, and Allied Garments | ||||||
| 1,915 | Phillips-Van Heusen Corp. | 38,549 | 2.38% | |||
| Misccellaneous Industrial & Commercial Machinery & Equipment | ||||||
| 1,295 | Curtiss-Wright Corp. | 43,240 | 2.67% | |||
| Miscellaneous Fabricated Metal Products | ||||||
| 2,010 | Crane Co. | 34,652 | ||||
| 1,525 | Parker Hannifin Corporation | 64,874 | ||||
| 99,526 | 6.14% | |||||
| National Commercial Banks | ||||||
| 1,510 | Bank of America Corporation | 21,261 | 1.31% | |||
| Newspapers: Publishing or Publishing & Printing | ||||||
| 3,660 | News Corp. | 33,269 | 2.05% | |||
| Petroleum Refining | ||||||
| 195 | ConocoPhillips | 10,101 | 0.62% | |||
| Pharmaceutical Preparations | ||||||
| 1,100 | Endo Pharmaceuticals Holdings Inc. * | 28,468 | 1.76% | |||
| Railroads, Line-Haul Operating | ||||||
| 910 | Canadian National Railway Company | 33,452 | 2.07% | |||
| Rolling Drawing & Extruding of Nonferrous Metals | ||||||
| 820 | RTI International Metals Inc. * | 11,734 | 0.72% | |||
| Security Brokers, Dealers & Flotation Companies | ||||||
| 415 | Goldman Sachs Group Inc. | 35,022 | ||||
| 2,250 | Jefferies Group Inc. | 31,635 | ||||
| 840 | Morgan Stanley | 13,474 | ||||
| 80,131 | 4.95% | |||||
| *Non-Income Producing Securities. **ADR - American Depository Receipt. The accompanying notes are an integral part of these financial statements. |
2008 Annual Report 20
Paradigm Intrinsic Value Fund | ||||||
| Schedule of Investments | ||||||
| December 31, 2008 | ||||||
| Shares/Principal Amount | Market Value | % of Net Assets | ||||
| COMMON STOCKS | ||||||
| Semiconductors & Related Devices | ||||||
| 1,955 | Applied Materials Inc. | $ 19,804 | 1.22% | |||
| Services - Business Services | ||||||
| 990 | Fair Isaac Corp. | 16,691 | 1.03% | |||
| Services - Hospitals | ||||||
| 1,135 | Magellan Health Services Inc. * | 44,447 | 2.75% | |||
| Service - Prepackaged Software | ||||||
| 5,995 | Compuware Corp. * | 40,466 | 2.50% | |||
| Ship & Boat Building & Repairing | ||||||
| 1,055 | General Dynamics Corp. | 60,758 | 3.75% | |||
| Special Industry Machinery, NEC | ||||||
| 870 | Cymer Inc. * | 19,062 | ||||
| 1,220 | Varian Semiconductor Equipment Associates Inc. * | 22,106 | ||||
| 41,168 | 2.54% | |||||
| State Commercial Banks | ||||||
| 1,480 | The Bank of New York Mellon Corporation | 41,928 | 2.59% | |||
| Wholesale - Electronic Parts & Equipment, NEC | ||||||
| 4,240 | Avnet Inc. * | 77,210 | 4.77% | |||
| Total for Common Stock (Cost $1,766,092) | $ 1,293,448 | 79.85% | ||||
| REAL ESTATE INVESTMENT TRUSTS | ||||||
| 10,650 | Anworth Mortgage Asset Corp. | 68,480 | ||||
| 10,725 | MFA Mortgage Investments Inc. | 63,170 | ||||
| Total for Real Estate Investment Trusts (Cost - $144,963) | 131,650 | 8.13% | ||||
| EXCHANGE TRADED FUNDS | ||||||
| 870 | iShares COMEX Gold Trust * | 75,394 | ||||
| Total for Exchange Traded Funds (Cost - $71,558) | 75,394 | 4.65% | ||||
| CASH EQUIVALENTS | ||||||
| 117,673 | SEI Daily Income Treasury Government CL B 1.41% *** | 117,673 | 7.26% | |||
| Total for Cash Equivalents (Cost $117,673) | ||||||
| Total Investment Securities | 1,618,165 | 99.89% | ||||
(Cost $2,100,286) | ||||||
| Other Assets In Excess of Liabilities | 1,712 | 0.11% | ||||
| Net Assets | $ 1,619,877 | 100.00% | ||||
| *Non-Income Producing Securities. ***Variable Rate Security; the rate shown was the rate at December 31, 2008. The accompanying notes are an integral part of these financial statements. |
2008 Annual Report 21
Paradigm Funds | ||||
| Statements of Assets and Liabilities | Value | Select | ||
| December 31, 2008 | Fund | Fund | ||
| Assets: | ||||
| Investment Securities at Market Value* | $ 85,438,118 | $ 2,221,474 | ||
| Receivable for Securities Sold | 119,883 | 708,943 | ||
| Receivable for Fund Shares Sold | 236,322 | - | ||
| Dividend Receivable | 107,632 | 4,342 | ||
| Interest Receivable | 8,420 | 301 | ||
| Total Assets | 85,910,375 | 2,935,060 | ||
| Liabilities: | ||||
| Payable for Securities Purchased | 188,532 | - | ||
| Payable for Fund Shares Redeemed | 551,770 | 900,198 | ||
| Payable to Advisor | 151,980 | 3,829 | ||
| Total Liabilities | 892,282 | 904,027 | ||
| Net Assets | $ 85,018,093 | $ 2,031,033 | ||
| Net Assets Consist of: | ||||
| Paid In Capital | $ 120,477,310 | $ 2,702,048 | ||
| Accumulated Undistributed Net Investment Income | - | 7,832 | ||
| Accumulated Undistributed Realized Gain (Loss) on Investments - Net | (14,272,234) | (417,535) | ||
| Unrealized Appreciation (Depreciation) in Value of Investments Securities - Net | (21,186,983) | (261,312) | ||
| Net Assets | $ 85,018,093 | $ 2,031,033 | ||
| Net Asset Value and Offering Price (Note 2) | $ 32.51 | $ 18.53 | ||
| * Investments at Identified Cost | $ 106,625,101 | $ 2,482,786 | ||
| Shares Outstanding (Unlimited number of shares | 2,615,172 | 109,606 | ||
| authorized without par value) | ||||
| Statements of Operations | ||||
| For year ended December 31, 2008 | ||||
| Investment Income: | ||||
| Dividends | $ 1,378,222 | $ 93,157 | ||
| Interest | 244,257 | 6,404 | ||
| Total Investment Income | 1,622,479 | 99,561 | ||
| Expenses: | ||||
| Investment Advisor Fees | 2,201,843 | 91,729 | ||
| Interest Expense | 2,352 | - | ||
| Total Expenses | 2,204,195 | 91,729 | ||
| Net Expenses | 2,204,195 | 91,729 | ||
| Net Investment Income (Loss) | (581,716) | 7,832 | ||
| Realized and Unrealized Gain (Loss) on Investments: | ||||
| Net Realized Gain (Loss) on Investments | (14,224,732) | (410,099) | ||
| Net Change in Unrealized Appreciation (Depreciation) on Investments | (30,472,841) | (1,584,796) | ||
| Net Realized and Unrealized Gain (Loss) on Investments | (44,697,573) | (1,994,895) | ||
| Net Increase (Decrease) in Net Assets from Operations | $ (45,279,289) | $ (1,987,063) | ||
| The accompanying notes are an integral part of these financial statements. |
2008 Annual Report 22
Paradigm Funds | ||||
| Statements of Assets and Liabilities | Opportunity | Intrinsic Value | ||
| December 31, 2008 | Fund | Fund | ||
| Assets: | ||||
| Investment Securities at Market Value* | $ 2,491,684 | $ 1,618,165 | ||
| Dividend Receivable | 560 | 3,309 | ||
| Interest Receivable | 93 | 125 | ||
| Total Assets | 2,492,337 | 1,621,599 | ||
| Liabilities: | ||||
| Payable for Securities Purchased | 64,093 | - | ||
| Payable to Advisor | 3,152 | 1,722 | ||
| Total Liabilities | 67,245 | 1,722 | ||
| Net Assets | $ 2,425,092 | $ 1,619,877 | ||
| Net Assets Consist of: | ||||
| Paid In Capital | $ 3,951,256 | $ 2,319,949 | ||
| Accumulated Undistributed Net Investment Income | - | 15,123 | ||
| Accumulated Undistributed Realized Gain (Loss) on Investments - Net | (730,128) | (233,074) | ||
| Unrealized Appreciation (Depreciation) in Value of Investments Securities - Net | (796,036) | (482,121) | ||
| Net Assets | $ 2,425,092 | $ 1,619,877 | ||
| Net Asset Value and Offering Price (Note 2) | $ 13.79 | $ 13.98 | ||
| * Investments at Identified Cost | $ 3,287,720 | $ 2,100,286 | ||
| Shares Outstanding (Unlimited number of shares | 175,818 | 115,861 | ||
| authorized without par value) | ||||
| Statements of Operations | ||||
| For year ended December 31, 2008 | ||||
| Investment Income: | ||||
| Dividends (Net of foreign withholding tax and fees of $0 and $303, respectively) | $ 27,918 | $ 26,258 | ||
| Interest | 4,209 | 10,722 | ||
| Total Investment Income | 32,127 | 36,980 | ||
| Expenses: | ||||
| Investment Advisor Fees | 76,853 | 21,857 | ||
| Total Expenses | 76,853 | 21,857 | ||
| Less: Expenses Waived | (19,213) | - | ||
| Net Expenses | 57,640 | 21,857 | ||
| Net Investment Income (Loss) | (25,513) | 15,123 | ||
| Realized and Unrealized Gain (Loss) on Investments: | ||||
| Net Realized Gain (Loss) on Investments | (728,182) | (233,074) | ||
| Net Change in Unrealized Appreciation (Depreciation) on Investments | (1,000,597) | (482,121) | ||
| Net Realized and Unrealized Gain (Loss) on Investments | (1,728,779) | (715,195) | ||
| Net Decrease in Net Assets from Operations | $ (1,754,292) | $ (700,072) | ||
| The accompanying notes are an integral part of these financial statements. |
2008 Annual Report 23
Paradigm Funds | ||||||||
| Statements of Changes in Net Assets | Value Fund | Select Fund | ||||||
| 1/1/2008 | 1/1/2007 | 1/1/2008 | 1/1/2007 | |||||
| to | to | to | to | |||||
| 12/31/2008 | 12/31/2007 | 12/31/2008 | 12/31/2007 | |||||
| From Operations: | ||||||||
| Net Investment Income (Loss) | $ (581,716) | $ (785,187) | $ 7,832 | $ (25,547) | ||||
| Net Realized Gain (Loss) on Investments and Short Positions | (14,224,732) | 4,153,214 | (410,099) | 17,379 | ||||
| Change in Net Unrealized Appreciation (Depreciation) | (30,472,841) | (459,174) | (1,584,796) | 565,965 | ||||
| Increase (Decrease) in Net Assets from Operations | (45,279,289) | 2,908,853 | (1,987,063) | 557,797 | ||||
| From Distributions to Shareholders: | ||||||||
| Net Investment Income | - | - | - | - | ||||
| Net Realized Gain from Security Transactions | (174,123) | (3,925,744) | - | (17,970) | ||||
| Total Distributions to Shareholders | (174,123) | (3,925,744) | - | (17,970) | ||||
| From Capital Share Transactions: | ||||||||
| Proceeds From Sale of Shares | 64,736,515 | 100,524,715 | 237,464 | 5,370,689 | ||||
| Proceeds from Redemption Fees (Note 2) | 118,899 | 27,242 | - | - | ||||
| Shares Issued on Reinvestment of Dividends | 171,705 | 3,867,545 | - | 17,970 | ||||
| Cost of Shares Redeemed | (50,802,151) | (43,898,992) | (7,328,411) | (1,493,447) | ||||
| Net Increase (Decrease) from Shareholder Activity | 14,224,968 | 60,520,510 | (7,090,947) | 3,895,212 | ||||
| Net Increase (Decrease) in Net Assets | (31,228,444) | 59,503,619 | (9,078,010) | 4,435,039 | ||||
| Net Assets at Beginning of Period | 116,246,537 | 56,742,918 | 11,109,043 | 6,674,004 | ||||
| Net Assets at End of Period | $ 85,018,093 | $ 116,246,537 | $ 2,031,033 | $ 11,109,043 | ||||
| Accumulated Undistributed Net Investment Income | $ - | $ - | $ 7,832 | $ - | ||||
| Share Transactions: | ||||||||
| Issued | 1,523,593 | 1,967,239 | 9,419 | 199,502 | ||||
| Reinvested | 5,425 | 78,195 | - | 638 | ||||
| Redeemed | (1,273,065) | (854,854) | (297,807) | (54,151) | ||||
| Net Increase (Decrease) in Shares | 255,953 | 1,190,580 | (288,388) | 145,989 | ||||
| Shares Outstanding Beginning of Period | 2,359,219 | 1,168,639 | 397,994 | 252,005 | ||||
| Shares Outstanding End of Period | 2,615,172 | 2,359,219 | 109,606 | 397,994 | ||||
| The accompanying notes are an integral part of these financial statements. |
2008 Annual Report 24
| Paradigm Funds | ||||||
| Statements of Changes in Net Assets | Opportunity Fund | Intrinsic Value | ||||
| 1/1/2008 | 1/1/2007 | 1/1/2008* | ||||
| to | to | to | ||||
| 12/31/2008 | 12/31/2007 | 12/31/2008 | ||||
| From Operations: | ||||||
| Net Investment Income (Loss) | $ (25,513) | $ (9,582) | $ 15,123 | |||
| Net Realized Gain (Loss) on Investments | (728,182) | 167,757 | (233,074) | |||
| Change in Net Unrealized Appreciation (Depreciation) | (1,000,597) | (204,857) | (482,121) | |||
| Increase (Decrease) in Net Assets from Operations | (1,754,292) | (46,682) | (700,072) | |||
| From Distributions to Shareholders: | ||||||
| Net Investment Income | - | - | - | |||
| Net Realized Gain from Security Transactions | - | (166,837) | - | |||
| Total Distributions to Shareholders | - | (166,837) | - | |||
| From Capital Share Transactions: | ||||||
| Proceeds From Sale of Shares | 48,186 | 2,073,387 | 2,336,408 | |||
| Proceeds from Redemption Fees (Note 2) | 385 | - | - | |||
| Shares Issued on Reinvestment of Dividends | - | 166,837 | - | |||
| Cost of Shares Redeemed | (1,481,767) | (132,952) | (16,459) | |||
| Net Increase (Decrease) from Shareholder Activity | (1,433,196) | 2,107,272 | 2,319,949 | |||
| Net Increase (Decrease) in Net Assets | (3,187,488) | 1,893,753 | 1,619,877 | |||
| Net Assets at Beginning of Period | 5,612,580 | 3,718,827 | - | |||
| Net Assets at End of Period | $ 2,425,092 | $ 5,612,580 | $ 1,619,877 | |||
| Accumulated Undistributed Net Investment Income | $ - | $ - | $ 15,123 | |||
| Share Transactions: | ||||||
| Issued | 2,364 | 82,592 | 116,689 | |||
| Reinvested | - | 7,238 | - | |||
| Redeemed | (71,262) | (5,324) | (828) | |||
| Net Increase (Decrease) in Shares | (68,898) | 84,506 | 115,861 | |||
| Shares Outstanding Beginning of Period | 244,716 | 160,210 | - | |||
| Shares Outstanding End of Period | 175,818 | 244,716 | 115,861 | |||
| *Commencement of operations. The accompanying notes are an integral part of these financial statements. |
2008 Annual Report 25
Paradigm Value Fund | ||||||||||
| Financial Highlights - Paradigm Value Fund | ||||||||||
| Selected data for a share outstanding | 1/1/2008 | 1/1/2007 | 1/1/2006 | 1/1/2005 | 1/1/2004 | |||||
| throughout the period: | to | to | to | to | to | |||||
| 12/31/2008 | 12/31/2007 | 12/31/2006 | 12/31/2005 | 12/31/2004 | ||||||
| Net Asset Value - Beginning of Period | $ 49.27 | $ 48.55 | $ 42.90 | $ 37.51 | $ 28.83 | |||||
| Net Investment Loss ** | (0.22) | (0.40) | (0.47) | (0.40) | (0.44) | |||||
| Net Gains (Loss) on Securities (realized and unrealized) | (16.52) | 2.84 | 8.69 | 7.75 | 9.69 | |||||
| Total from Investment Operations | (16.74) | 2.44 | 8.22 | 7.35 | 9.25 | |||||
| Distributions (From Net Investment Income) | - | - | - | - | - | |||||
| Distributions (From Capital Gains) | (0.07) | (1.73) | (2.58) | (1.96) | (0.57) | |||||
| Total Distributions | (0.07) | (1.73) | (2.58) | (1.96) | (0.57) | |||||
| Proceeds from Redemption Fee (Note 2) | 0.05 | 0.01 | 0.01 | - | - | |||||
| Net Asset Value - End of Period | $ 32.51 | $ 49.27 | $ 48.55 | $ 42.90 | $ 37.51 | |||||
| Total Return *** | (33.88)% | 5.03% | 19.19% | 19.61% | 32.09% | |||||
| Ratios/Supplemental Data | ||||||||||
| Net Assets - End of Period (Thousands) | $ 85,018 | $ 116,247 | $ 56,743 | $ 24,002 | $ 14,528 | |||||
| Ratio of Expenses to Average Net Assets, | ||||||||||
| Excluding Dividends on Securities Sold Short | ||||||||||
| and Interest Expense | 1.99% | 2.00% | 2.00% | 2.00% | 1.99% | |||||
| Ratio of Dividend Expense on Securities Sold Short | ||||||||||
| and Interest Expense to Average Net Assets | 0.00% | + | 0.02% | 0.02% | 0.06% | 0.04% | ||||
| Ratio of Expenses to Average Net Assets | 1.99% | 2.02% | 2.02% | 2.06% | 2.03% | |||||
| Ratio of Net Investment Loss to Average Net Assets | -0.52% | -0.78% | -1.02% | -0.98% | -1.34% | |||||
| Portfolio Turnover Rate | 67.84% | 59.75% | 69.95% | 67.39% | 91.66% | |||||
| Paradigm Select Fund | ||||||||
| Financial Highlights - Paradigm Select Fund | ||||||||
| Selected data for a share outstanding throughout the period: | 1/1/2008 | 1/1/2007 | 1/1/2006 | 1/1/2005* | ||||
| to | to | to | to | |||||
| 12/31/2008 | 12/31/2007 | 12/31/2006 | 12/31/2005 | |||||
| Net Asset Value - Beginning of Period | $ 27.91 | $ 26.48 | $ 22.33 | $ 20.00 | ||||
| Net Investment Loss ** | 0.03 | (0.06) | (0.08) | (0.08) | ||||
| Net Gains (Loss) on Securities (realized and unrealized) | (9.41) | 1.54 | 4.92 | 2.49 | ||||
| Total from Investment Operations | (9.38) | 1.48 | 4.84 | 2.41 | ||||
| Distributions (From Net Investment Income) | - | - | - | - | ||||
| Distributions (From Capital Gains) | - | (0.05) | (0.69) | (0.08) | ||||
| Total Distributions | $ - | (0.05) | (0.69) | (0.08) | ||||
| Proceeds from Redemption Fee (Note 2) | - | - | - | - | ||||
| Net Asset Value - End of Period | $ 18.53 | $ 27.91 | $ 26.48 | $ 22.33 | ||||
| Total Return *** | (33.61)% | 5.57% | 21.67% | 12.06% | ||||
| Ratios/Supplemental Data | ||||||||
| Net Assets - End of Period (Thousands) | $ 2,031 | $ 11,109 | $ 6,674 | $ 2,521 | ||||
| Ratio of Expenses to Average Net Assets | 1.50% | 1.50% | 1.50% | 1.50% | ||||
| Ratio of Net Investment Loss to Average Net Assets | 0.13% | -0.23% | -0.30% | -0.36% | ||||
| Portfolio Turnover Rate | 47.71% | 64.68% | 72.15% | 68.56% | ||||
| * Commencement of operations. ** Per share amount calculated using the average shares method. *** Total return in the above table represents the rate that the investor would have earned or lost on an investment in the Fund assuming reinvestment of dividends. Returns do not reflect the deduction of taxes a shareholder would pay on Fund distributions or redemption of Fund shares. + Amount calculated is less than 0.005% . |
| The accompanying notes are an integral part of these financial statements. |
2008 Annual Report 26
Paradigm Opportunity Fund | ||||||||
| Financial Highlights - Paradigm Opportunity Fund | ||||||||
| Selected data for a share outstanding throughout the period: | 1/1/2008 | 1/1/2007 | 1/1/2006 | 1/1/2005* | ||||
| to | to | to | to | |||||
| 12/31/2008 | 12/31/2007 | 12/31/2006 | 12/31/2005 | |||||
| Net Asset Value - Beginning of Period | $ 22.94 | $ 23.21 | $ 21.33 | $ 20.00 | ||||
| Net Investment Income (Loss) ** | (0.13) | (0.04) | (0.04) | 0.04 | ||||
| Net Gains (Loss) on Securities (realized and unrealized) | (9.02) | 0.47 | 2.47 | 1.49 | ||||
| Total from Investment Operations | (9.15) | 0.43 | 2.43 | 1.53 | ||||
| Distributions (From Net Investment Income) | - | - | - | (0.02) | ||||
| Distributions (From Capital Gains) | - | (0.70) | (0.55) | (0.18) | ||||
| Total Distributions | $ - | (0.70) | (0.55) | (0.20) | ||||
| Proceeds from Redemption Fee (Note 2) | - | - | - | - | ||||
| Net Asset Value - End of Period | $ 13.79 | $ 22.94 | $ 23.21 | $ 21.33 | ||||
| Total Return *** | (39.89)% | 1.85% | 11.39% | 7.65% | ||||
| Ratios/Supplemental Data | ||||||||
| Net Assets - End of Period (Thousands) | $ 2,425 | $ 5,613 | $ 3,719 | $ 3,289 | ||||
| Before Reimbursement | ||||||||
| Ratio of Expenses to Average Net Assets | 2.00% | 2.00% | 2.00% | 2.00% | ||||
| Ratio of Net Investment Loss to Average Net Assets | -1.17% | -0.67% | -0.68% | -0.11% | ||||
| After Reimbursement | ||||||||
| Ratio of Expenses to Average Net Assets **** | 1.50% | 1.50% | 1.50% | 1.69% | ||||
| Ratio of Net Investment Income (Loss) to Average Net Assets **** | -0.67% | -0.17% | -0.18% | 0.21% | ||||
| Portfolio Turnover Rate | 164.89% | 169.26% | 122.62% | 129.06% | ||||
| Paradigm Intrinsic Value Fund | ||
| Financial Highlights - Paradigm Intrinsic Value Fund | ||
| Selected data for a share outstanding throughout the period: | 1/1/2008* | |
| to | ||
| 12/31/2008 | ||
| Net Asset Value - Beginning of Period | $ 20.00 | |
| Net Investment Income (Loss) ** | 0.15 | |
| Net Gains (Loss) on Securities (realized and unrealized) | (6.17) | |
| Total from Investment Operations | (6.02) | |
| Distributions (From Net Investment Income) | - | |
| Distributions (From Capital Gains) | - | |
| Total Distributions | - | |
| Proceeds from Redemption Fee (Note 2) | - | |
| Net Asset Value - End of Period | $ 13.98 | |
| Total Return *** | (30.10)% | |
| Ratios/Supplemental Data | ||
| Net Assets - End of Period (Thousands) | $ 1,620 | |
| Ratio of Expenses to Average Net Assets | 1.25% | |
| Ratio of Net Investment Income to Average Net Assets | 0.86% | |
| Portfolio Turnover Rate | 70.57% | |
| * Commencement of operations. ** Per share amount calculated using the average shares method. *** Total return in the above table represents the rate that the investor would have earned or lost on an investment in the Fund assuming reinvestment of dividends. Returns do not reflect the deduction of taxes a shareholder would pay on Fund distributions or redemption of Fund shares. **** Such percentages reflect an expense waiver by the Advisor. |
| The accompanying notes are an integral part of these financial statements. |
2008 Annual Report 27
NOTES TO THE FINANCIAL STATEMENTS PARADIGM FUNDS December 31, 2008 |
1.) ORGANIZATION
The Paradigm Funds (the "Trust”) is an open-end management investment company organized in Ohio as a business trust on September 13, 2002 that may offer shares of beneficial interest in a number of separate series, each series representing a distinct fund with its own investment objectives and policies. The Paradigm Value Fund (“Value”) commenced operations on January 1, 2003. The Paradigm Value Fund's investment objective is long-term capital appreciation. The Paradigm Opportunity Fund (“Opportunity”) and Paradigm Select Fund (“Select”) both commenced operations on January 1, 2005 with long-term capital appreciation as their objective. The Paradigm Intrinsic Value Fund (“Intrinsic Value”) commenced operations on January 1, 2008. The Paradigm Intrinsic Value Fund's investment objective is long-term capital appreciation. The Advisor to Value, Opportunity, Select and Intrinsic Value (collectively the “Funds”) is Paradigm Funds Ad visor LLC (the “Advisor”).
2.) SIGNIFICANT ACCOUNTING POLICIES
SECURITY VALUATION: Securities that are traded on any exchange, including the NASDAQ, are generally valued by a pricing service at the last quoted sale price. Lacking a last sale price, an equity security is valued at its last bid price except when, in the Advisor's opinion, the last bid price does not accurately reflect the current value of the security. All other securities for which over-the-counter market quotations are readily available are valued at their last bid price. When market quotations are not readily available, when the Advisor determines the last bid price does not accurately reflect the current value or when restricted securities are being valued, such securities are valued as determined in good faith by the Advisor, in conformity with guidelines adopted by and subject to review of the Board of Trustees of the Trust.
Fixed income securities generally are valued on the basis of prices furnished by a pricing service when the Advisor believes such prices accurately reflect the fair market value of such securities. A pricing service utilizes electronic data processing techniques based on yield spreads relating to securities with similar characteristics to determine prices for normal institutional-size trading units of debt securities without regard to sale or bid prices. If the Advisor decides that a price provided by the pricing service does not accurately reflect the fair market value of the securities, or when prices are not readily available from a pricing service or when restricted or illiquid securities are being valued, securities are valued at fair value as determined in good faith by the Advisor, in conformity with guidelines adopted by and subject to review of the Board of Trustees. Short term investments in fixed income securities with maturities of less than 60 days when acqui red, or which subsequently are within 60 days of maturity, are valued by using the amortized cost method of valuation, which the Board of Trustees has determined will represent fair value.
In accordance with the Trust's good faith pricing guidelines, the Advisor is required to consider all appropriate factors relevant to the value of securities for which it has determined other pricing sources are not available or reliable as described above. No single standard for determining fair value controls, since fair value depends upon the circumstances of each individual case. As a general principle, the current fair value of an issue of securities being valued by the Advisor would appear to be the amount which the owner might reasonably expect to receive for them upon their current sale. Methods which are in accord with this principle may, for example, be based on (i) a multiple of earnings; (ii) a discount from market of a similar freely traded security (including a derivative security or a basket of securities traded on other markets, exchanges or among dealers); or (iii) yield to maturity with respect to debt issues, or a combination of these and other methods.
The Funds adopted Financial Accounting Standards Board (FASB) Statement on Financial Accounting Standards (SFAS) No. 157 "Fair Value Measurements" effective January 1, 2008. This standard establishes a single authoritative definition of fair value, sets out a framework for measuring fair value and requires additional disclosure about fair value measurements. SFAS No. 157 applies to fair value measurements already required or permitted by existing standards. In accordance with SFAS No. 157, fair value is defined as the price that would be received by the Funds upon selling an asset or paid by the Funds to transfer a liability in an orderly transaction between market participants at the measurement date. In the absence of a principal market for the asset or liability, the assumption is that the transaction occurs on the most advantageous market for the asset or liability. SFAS No. 157 established a three-tier fair value hierarchy that prioritizes the assumptions, also known as "inputs", to valuation techniques used by market participants to measure fair value. The term "inputs" refers broadly to the assumptions that market participants would use in pricing the asset or liability, including assumptions about risk, for example, the risk inherent in a particular valuation technique
2008 Annual Report 28
Notes to the Financial Statements - continued
used to measure fair value (such as a pricing model) and/or the risk inherent in the inputs to the valuation technique. Inputs may be observable or unobservable. Observable inputs are inputs that reflect the assumptions market participants would use in pricing the asset or liability developed based on market data obtained from sources independent of the reporting entity. Unobservable inputs are inputs that reflect the reporting entity's own assumptions about the assumptions market participants would use in pricing the asset or liability developed based on the best information available in the circumstances. The valuation techniques used to measure fair value should maximize the use of observable inputs and minimize the use of unobservable inputs. The three-tier hierarchy of inputs is summarized in three levels with the highest priority given to Level 1 and the lowest priority given to Level 3: Level 1 - quoted prices in active markets for identical securities, Level 2 - o ther significant observable inputs (including quoted prices for similar securities, interest rates, prepayment speeds, credit risk, etc.) and Level 3 - significant unobservable inputs (including the Fund's own assumptions in determining the fair value of investments). The following is a summary of the inputs used as of December 31, 2008 in valuing the Funds’ assets carried at fair value:
| Value | Select | |||
| Investments | Investments | |||
| Valuation Inputs | in Securities | in Securities | ||
| Level 1- Quoted Prices | $84,371,474 | $2,221,474 | ||
| Level 2- Significant Other Observable Inputs | 1,066,644 | - | ||
| Level 3- Significant Unobservable Inputs | - | - | ||
| Total | $85,438,118 | $2,221,474 | ||
| Opportunity | Intrinsic Value | |||
| Investments | Investments | |||
| Valuation Inputs | in Securities | in Securities | ||
| Level 1- Quoted Prices | $2,491,684 | $1,618,165 | ||
| Level 2- Significant Other Observable Inputs | - | - | ||
| Level 3- Significant Unobservable Inputs | - | - | ||
| Total | $2,491,684 | $1,618,165 | ||
The Funds did not hold any Level 3 assets during the year ended December 31, 2008.
In March 2008, the Financial Accounting Standards Board issued the Statement of Financial Accounting Standards No.161, "Disclosures about Derivative Instruments and Hedging Activities" ("SFAS 161"). SFAS 161 is effective for fiscal years and interim periods beginning after November 15, 2008. SFAS 161 requires enhanced disclosures about the Funds’ derivative and hedging activities, including how such activities are accounted for and their effect on the Funds’ financial position, performance and cash flows. Management is currently evaluating the impact the adoption of SFAS 161 will have on the Funds’ financial statements and related disclosures.
SECURITY TRANSACTIONS AND OTHER: Security transactions are recorded based on a trade date. Dividend income is recognized on the ex-dividend date. Interest income is recognized on an accrual basis. The Funds use the specific identification basis in computing gain or loss on sale of investment securities. Discounts and premiums on fixed income securities purchased are amortized over the lives of the respective securities. Withholding taxes on foreign dividends have been provided for in accordance with the Funds’ understanding of the applicable country’s tax rules and rates. The Funds may invest in real estate investment trusts (“REITs”) that pay distributions to their shareholders based on available funds from operations. It is common for these distributions to exceed the REITs taxable earnings and profits resulting in the excess portion of such distribution to be designated as return of capital.
SHARE VALUATION: The net asset value (the “NAV”) is generally calculated as of the close of trading on the New York Stock Exchange (normally 4:00 p.m. Eastern time) every day the Exchange is open. The NAV for each fund is calculated by taking the total value of the fund’s assets, subtracting its liabilities, and then dividing by the total number of shares outstanding, rounded to the nearest cent. The offering price and redemption price per share is equal to the net asset value per share, except that shares of each fund are subject to a redemption fee of 2% if redeemed within 90 days of purchase. During fiscal year ended December 31, 2008 proceeds from redemption fees were $118,899, $0, $385 and $0 for Value, Select, Opportunity and Intrinsic Value, respectively.
SHORT SALES: A Fund may sell a security it does not own in anticipation of a decline in the fair value of the security. When a Fund sells a security short, it must borrow the security sold short and deliver it to the broker-dealer through which it made the short sale. A gain, limited to the price at which a Fund sold the security short, or a loss, unlimited in size, will be recognized upon the termination of a short sale.
2008 Annual Report 29
Notes to the Financial Statements - continued
INCOME TAXES: The Funds’ policy is to continue to comply with the requirements of Subchapter M of the Internal Revenue Code that are applicable to regulated investment companies and to distribute all of their taxable income to their shareholders. The Funds also intend to distribute sufficient net investment income and net capital gains, if any, so that they will not be subject to excise tax on undistributed income and gains. Therefore, no federal income tax or excise provision is required.
The Funds adopted the provisions of Financial Accounting Standards Board Interpretation No. 48 (“FIN 48”), Accounting for Uncertainty in Income Taxes, on June 29, 2007. The implementation of FIN 48 resulted in no material liability for unrecognized tax benefits and no material change to the beginning net asset value of the Funds.
As of and during the period ended December 31, 2008, the Funds did not have a liability for any unrecognized tax benefits. The Funds recognize interest and penalties, if any, related to unrecognized tax benefits as income tax expense in the statement of operations. During the period, the Funds did not incur any interest or penalties.
The Funds are not subject to examination by U.S. federal and state tax authorities for tax years before 2005.
ESTIMATES: The preparation of financial statements in conformity with accounting principles generally accepted in the United States of America requires management to make estimates and assumptions that affect the reported amounts of assets and liabilities and disclosure of contingent assets and liabilities at the date of the financial statements and the reported amounts of increases and decreases in net assets from operations during the reporting period. Actual results could differ from those estimates.
DISTRIBUTIONS TO SHAREHOLDERS: Distributions to shareholders, which are determined in accordance with income tax regulations, are recorded on the ex-dividend date. The treatment for financial reporting purposes of distributions made to shareholders during the year from net investment income or net realized capital gains may differ from their ultimate treatment for federal income tax purposes. These differences are caused primarily by differences in the timing of recognition of certain components of income, expense or realized capital gain for federal income tax purposes. Where such differences are permanent in nature, they are reclassified in the components of the net assets based on their ultimate characterization for federal income tax purposes. Any such reclassification will have no effect on net assets, results of operations or net asset values per share of any Fund. For the fiscal year ended December 31, 2008 net investment loss of $581,716 and $25,513 was reclassifi ed to paid in capital for Value and Opportunity, respectively.
3.) INVESTMENT ADVISORY AGREEMENTS
Each of the Funds has an investment advisory agreement (collectively the "Management Agreements") with the Advisor. Under the terms of the Management Agreements, the Advisor manages the investment portfolios of the Funds, subject to policies adopted by the Trust’s Board of Trustees. Under the Management Agreements, the Advisor, at its own expense and without reimbursement from the Trust, furnishes office space and all necessary office facilities, equipment and executive personnel necessary for managing the assets of the Funds. The Advisor also pays the salaries and fees of all of its officers and employees that serve as officers and trustees of the Trust. For its services and payment of certain Fund expenses as described below, the Advisor receives an annual investment management fee of 2.00% of the average daily net assets from both Value and Opportunity; 1.50% of the average daily net assets from Select and 1.25% of the average daily net assets from Intrinsic Value. As of Ma y 1, 2008 Value receives an annual investment management fee of 2.00% of the average daily net assets of Value on assets up to and including $100 million and 1.75% of the average daily net assets over $100 million. As a result of the above calculations, for the fiscal year ended December 31, 2008, the Advisor earned management fees totaling $2,201,843, $91,729, $76,853 (before the waiver described below) and $21,857 for Value, Select, Opportunity, and Intrinsic Value, respectively. At December 31, 2008, $151,980, $3,829, $3,152 and $1,722 was due to the Advisor from Value, Select, Opportunity and Intrinsic Value, respectively. The Advisor has contractually agreed to waive management fees and/or reimburse Opportunity to the extent necessary to maintain total annual operating expenses of the Fund (excluding brokerage fees and commissions, interest and other borrowing expenses, taxes, extraordinary expenses and indirect costs of investing in acquired funds) at 1.50% of daily net assets through May 1, 2009. A to tal of $19,213 was waived for the fiscal year ended December 31, 2008 for Opportunity. The Advisor pays all operating expenses of the Funds with the exception of taxes, brokerage fees and commissions, borrowing costs (such as (a) interest and (b) dividend expenses on securities sold short) and extraordinary expenses as defined under accounting principles generally accepted in the United States of America.
2008 Annual Report 30
Notes to the Financial Statements - continued
Certain officers and a shareholder of the Advisor are also officers and/or a Trustee of the Trust. These individuals may receive benefits from the Advisor resulting from management fees paid to the Advisor from the Funds.
The Trustees who are not interested persons of the Funds were paid $2,000 per meeting for the fiscal year ended December 31, 2008 for the Trust. Under the Management Agreements, the Advisor pays these fees.
4.) INVESTMENTS
For the fiscal year ended December 31, 2008, purchases and sales of investment securities other than U.S. Government obligations and short-term investments were as follows:
| Value | Select | Opportunity | Intrinsic Value | |||||
| Purchases | $82,027,472 | $2,797,576 | $6,084,548 | $3,232,571 | ||||
| Sales | $69,220,629 | $9,695,385 | $7,478,710 | $1,012,268 |
There were no purchases or sales of U.S. Government obligations.
For federal income tax purposes, at December 31, 2008 the cost of securities on a tax basis and the composition of gross unrealized appreciation (the excess of value over tax cost) and depreciation (the excess of tax cost over value) were as follows:
| Value | Select | Opportunity | Intrinsic Value | |||||
| Cost of Investments | $107,007,472 | $2,516,853 | $3,426,174 | $2,122,075 | ||||
| Gross Unrealized Appreciation | $5,431,398 | $139,480 | $103,471 | $31,522 | ||||
| Gross Unrealized Depreciation | ($27,000,752) | ($434,859) | ($1,037,961) | ($535,432) | ||||
| Net Unrealized Appreciation | ||||||||
| (Depreciation) on Investments | ($21,569,354) | ($295,379) | ($934,490) | ($503,910) | ||||
5.) CAPITAL SHARES
At December 31, 2008, the Trust was authorized to issue an unlimited number of shares of beneficial interest. The following are the shares issued and paid in capital outstanding for the Funds at December 31, 2008:
| Value | Select | Opportunity | Intrinsic Value | |||||
| Shares Issued | ||||||||
| and Outstanding | 2,615,172 | 109,606 | 175,818 | 115,861 | ||||
| Paid in Capital | $120,477,310 | $2,702,048 | $3,951,256 | $2,319,949 |
6.) CONTROL OWNERSHIP
The beneficial ownership, either directly or indirectly, of more than 25% of the voting shares of a fund creates a presumption of control of the fund, under section 2(a)(9) of the Investment Company Act of 1940. At December 31, 2008, Charles Schwab & Co., Inc. and National Financial Services, LLC, both held, for the benefit of its customers, in aggregate, 40.54% and 28.76%, respectively, of Value, and therefore each may be deemed to control the Fund. Candace King Weir held, in aggregate, 32.94% of Select, and therefore may be deemed to control the Fund. Candace King Weir held, in aggregate, 88.40%, of Opportunity, and therefore may be deemed to control the Fund. Also, Candace King Weir and Charles Schwab & Co., for the benefit of its customers, held, in aggregate, 64.73% and 29.50%, respectively, of Intrinsic Value, and therefore each may be deemed to control the Fund.
7.) DISTRIBUTIONS TO SHAREHOLDERS
The tax character of distributions paid during the fiscal years ended December 31, 2008 and 2007 were as follows:
| Fiscal Year Ended | Fiscal Year Ended | |||
| December 31, 2008 | December 31, 2007 | |||
| PARADIGM VALUE FUND | ||||
| Ordinary Income | $ - | $ - | ||
| Short-term Capital Gain | - | - | ||
| Long-term Capital Gain | 174,123 | 3,925,744 | ||
| 174,123 | $3,925,744 | |||
| PARADIGM SELECT FUND | ||||
| Ordinary Income | $ - | $ - | ||
| Short-term Capital Gain | - | - | ||
| Long-term Capital Gain | - | 17,970 | ||
| $ - | $ 17,970 | |||
2008 Annual Report 31
Notes to the Financial Statements - continued
| PARADIGM OPPORTUNITY FUND | ||||
| Ordinary Income | $ - | $ - | ||
| Short-term Capital Gain | - | - | ||
| Long-term Capital Gain | - | 166,837 | ||
| $ - | $ 166,837 | |||
| PARADIGM INTRINSIC VALUE FUND (Inception date January 1, 2008) | ||||
| Ordinary Income | $ - | |||
| Short-term Capital Gain | - | |||
| Long-term Capital Gain | - | |||
| $ - | ||||
As of December 31, 2008, the components of distributable earnings/(accumulated losses) on a tax basis were as follows:
| Value | Select | |||
| Undistributed ordinary | ||||
| income/(accumulated losses) | $ -0- | $ 7,832 | ||
| Undistributed long-term capital | ||||
| gain/(accumulated losses) | (13,889,863) | (383,468) | ||
| Unrealized appreciation/(depreciation) | (21,569,354) | (295,379) | ||
| $(35,459,217) | $ (671,015) | |||
| Opportunity | Intrinsic Value | |||
| Undistributed ordinary | ||||
| income/(accumulated losses) | $ -0- | $ 15,123 | ||
| Undistributed long-term capital | ||||
| gain/(accumulated losses) | (591,674) | (211,285) | ||
| Unrealized appreciation/(depreciation) | (934,490) | (503,910) | ||
| $(1,526,164) | $ (700,072) |
The difference between book basis and tax basis unrealized appreciation/(depreciation) is attributable to the tax deferral of losses on wash sales.
9.) CAPITAL LOSS CARRYFORWARD
At December 31, 2008 Value, Select, Opportunity and Intrinsic Value Funds had available for federal tax purposes unused capital losses of $13,889,863, $383,468, $591,674 and $211,285, respectively, of which the entire amounts expire in 2016. Capital loss carryforwards are available to offset future realized capital gains. To the extent that these carryforwards are used to offset future realized capital gains, it is probable that the amount which is offset will not be distributed to shareholders.
2008 Annual Report 32
DISCLOSURE OF EXPENSES (Unaudited) |
Shareholders of the Paradigm Funds (the “Funds”) incur ongoing costs. The ongoing costs asso ciated with the Paradigm Value Fund include management fees, interest expense and dividend expense on securities sold short. The ongoing costs associated with the Paradigm Opportunity Fund, Paradigm Select Fund and Paradigm Capital Appreciation Fund consist solely of management fees. Although the Funds charge no sales loads or transaction fees, you will be assessed fees for outgoing wire transfers, returned checks and stop payment orders at prevailing rates charged by Mutual Shareholder Services, LLC, the Funds’ transfer agent. IRA accounts will be charged an $8.00 annual maintenance fee. The following example is intended to help you understand your ongo ing costs of investing in the Funds and to compare these costs with similar costs of investing in other mutual funds. The example is based on an investment of $1,000 invested in the Fun ds on July 1, 2008 and held through December 31, 2008.
The first line of the table below provides information about actual account values and actual expenses. In order to estimate the expenses a shareholder paid during the period covered by this report, shareholders can divide their account value by $1,000 (for example, an $8,600 account value divided by $1,000 = 8.6) and then multiply the result by the number in the first line under the heading entitled "Expenses Paid During the Period."
The second line of the table below provides information about hypothetical account values and hypothetical expenses based on the Funds’ actual expense ratios and an assumed rate of return of 5% per year before expenses, which is not the Funds’ actual return. The hypothetical account val ues and expenses may not be used to estimate the actual ending account balance or expenses paid by a shareholder for the period. Shareholders may use this information to compare the ongoing costs of investing in the Funds and other funds. In order to do so, compare these 5% hypothetical examples with the 5% hypothetical examples that appear in other funds' shareholder reports.
PARADIGM VALUE FUND
| Expenses Paid | ||||||
| Beginning | Ending | During the Period* | ||||
| Account Value | Account Value | July 1, 2008 to | ||||
| July 1, 2008 | December 31, 2008 | December 31, 2008 | ||||
| Actual | $1,000.00 | $728.65 | $8.65 | |||
| Hypothetical | $1,000.00 | $1,015.13 | $10.08 | |||
| (5% annual return | ||||||
| before expenses) | ||||||
* Expenses are equal to the Fund’s annualized expense ratio of 1.99%, multiplied by the average
account value over the period, multiplied by 184/366 (to reflect the one-half year period).
PARADIGM SELECT FUND
| Expenses Paid | ||||||
| Beginning | Ending | During the Period* | ||||
| Account Value | Account Value | July 1, 2008 to | ||||
| July 1, 2008 | December 31, 2008 | December 31, 2008 | ||||
| Actual | $1,000.00 | $737.37 | $6.55 | |||
| Hypothetical | $1,000.00 | $1,017.60 | $7.61 | |||
| (5% annual return | ||||||
| before expenses) | ||||||
* Expenses are equal to the Fund’s annualized expense ratio of 1.50%, multiplied by the average
account value over the period, multiplied by 184/366 (to reflect the one-half year period).
2008 Annual Report 33
Disclosure of Expenses (Unaudited) - continued
PARADIGM OPPORTUNITY FUND
| Expenses Paid | ||||||
| Beginning | Ending | During the Period* | ||||
| Account Value | Account Value | July 1, 2008 to | ||||
| July 1, 2008 | December 31, 2008 | December 31, 2008 | ||||
| Actual | $1,000.00 | $692.96 | $6.38 | |||
| Hypothetical | $1,000.00 | $1,017.60 | $7.61 | |||
| (5% annual return | ||||||
| before expenses) | ||||||
* Expenses are equal to the Fund’s annualized expense ratio of 1.50%, multiplied by the average
account value over the period, multiplied by 184/366 (to reflect the one-half year period).
PARADIGM INTRINSIC VALUE FUND
| Expenses Paid | ||||||
| Beginning | Ending | During the Period* | ||||
| Account Value | Account Value | July 1, 2008 to | ||||
| July 1, 2008 | December 31, 2008 | December 31, 2008 | ||||
| Actual | $1,000.00 | $736.18 | $5.46 | |||
| Hypothetical | $1,000.00 | $1,018.85 | $6.34 | |||
| (5% annual return | ||||||
| before expenses) | ||||||
* Expenses are equal to the Fund’s annualized expense ratio of 1.25%, multiplied by the average
account value over the period, multiplied by 184/366 (to reflect the one-half year period).
2008 Annual Report 34
ADDITIONAL INFORMATION December 31, 2008 |
AVAILABILITY OF QUARTERLY SCHEDULE OF INVESTMENTS
(Unaudited)
The Funds file their complete schedules of portfolio holdings with the Securities and Exchange Commission ("SEC") for the first and third quarters of each fiscal year on Form N-Q. The Funds’ Forms N-Q are available on the SEC's Web site at http://www.sec.gov. The Funds’ Forms N-Q may also be reviewed and copied at the SEC's Public Reference Room in Washington, DC. Information on the operation of the Public Reference Room may be obtained by calling 1-800-SEC-0330.
| PROXY VOTING GUIDELINES (Unaudited) |
Paradigm Funds Advisor LLC, the Funds’ Advisor, is responsible for exercising the voting rights associated with the securities held by the Funds. A description of the policies and procedures used by the Advisor in fulfilling this responsibility is available without charge on the Funds’ web site at www.paradigm-funds.com. It is also included in the Funds’ Statement of Additional Information, which is available on the Securities and Exchange Commission’s web site at http://www.sec.gov.
Information regarding how the Funds voted proxies, Form N-PX, relating to portfolio securities during the most recent 12-month period ended June 30 is available without charge, upon request, by calling our toll free number(1-800-239-0732). This information is also available on the Securities and Exchange Commission’s web site at http://www.sec.gov.
ADDITIONAL INFORMATION
You will find more information about the Funds at www.paradigm-funds.com. For shareholder inquiries, please call toll-free in the U.S. at 1-800-239-0732.
2008 Annual Report 35
|
|
To The Shareholders and Board of Trustees
Paradigm Funds
REPORT OF INDEPENDENT REGISTERED PUBLIC ACCOUNTING FIRM
We have audited the accompanying statements of assets and liabilities, including the schedules of investments, of Paradigm Funds, comprising Paradigm Value Fund, Paradigm Opportunity Fund, Paradigm Select Fund and Paradigm Intrinsic Value Fund ("the Funds") as of December 31, 2008, and the related statements of operations for the year then ended, statements of changes in net assets for each of the two years in the period then ended for Paradigm Value Fund, Paradigm Opportunity Fund, and Paradigm Select Fund, and for the year then ended for the Paradigm Intrinsic Value Fund, and the financial highlights for each of the five years in the period then ended for the Paradigm Value Fund, each of the four years in the period then ended for the Paradigm Opportunity Fund and Paradigm Select Fund, and for the year then ended for the Paradigm Intrinsic Value Fund. These financial statements and financial highlights are the responsibility of Fund management. Our responsibility is to express an opinion on these financial statements and financial highlights based on our audits.
We conducted our audits in accordance with the standards of the Public Company Accounting Oversight Board (United States). Those standards require that we plan and perform the audit to obtain reasonable assurance about whether the financial statements and financial highlights are free of material misstatement. An audit includes examining, on a test basis, evidence supporting the amounts and disclosures in the financial statements. Our procedures included confirmation of securities owned as of December 31, 2008, by correspondence with the Funds' custodian and brokers. An audit also includes assessing the accounting principles used and significant estimates made by management, as well as evaluating the overall financial statement presentation. We believe that our audits provide a reasonable basis for our opinion.
In our opinion, the financial statements and financial highlights referred to above present fairly, in all material respects, the financial positions of each of the funds constituting Paradigm Funds, as of December 31, 2008, the results of their operations for the year then ended, statements of changes in net assets for each of the two years in the period then ended for Paradigm Value Fund, Paradigm Opportunity Fund, and Paradigm Select Fund, and for the year then ended for the Paradigm Intrinsic Value Fund, and their financial highlights for the periods indicated therein, in conformity with accounting principles generally accepted in the United States of America.
Cohen Fund Audit Services, Ltd.
Westlake, Ohio
February 24, 2009
2008 Annual Report 36
This page intentionally left blank.
2008 Annual Report 37
TRUSTEES AND OFFICERS Unaudited
The Board of Trustees supervises the business activities of the Trust. Each Trustee serves as a trustee until the termination of the Trust unless the Trustee dies, resigns, retires or is removed.
The following table provides information regarding each Trustee who is an "interested person" of the Trust, as defined in the Investment Company Act of 1940, and each officer of the Trust as of December 31, 2008.
Interested Trustees and Officers
| Number of | Other | |||||||||
| Name, | Position(s) | Term of | Principal | Portfolios Directorships | ||||||
| Address1, | Held with | Office and | Occupation(s) | Overseen | Held By | |||||
| and Year of Birth | theTrust | Length of | During the | By | Trustee or | |||||
| Time Served | Past 5 Years | Trustee | Officer | |||||||
| Candace King | President | Indefinite Term, | Investment Manager of PCM Ventures Intl., LLC (Nov. 2001 | 4 | None | |||||
| Weir2, (1944) | and Trustee | Since 2002 | - current) and PCM Ventures II, LLC (June 2003 - current); | |||||||
| Investment Manager and principal of PCM Ventures LLC | ||||||||||
| (Jan. 1997 - current); Director and President of Paradigm | ||||||||||
| Capital Management, Inc. (1993 - current); Director and | ||||||||||
| President of C.L. King & Associates, a registered broker | ||||||||||
| dealer (1972 - current); CEO, Portfolio Manager and | ||||||||||
| Member of PCM Advisors LLC (Dec. 2004 - current); CEO | ||||||||||
| and Member of Paradigm Funds Advisor LLC (July 2005 - | ||||||||||
| current); Director and Member of PCM Growth Advisors, | ||||||||||
| Inc. (Feb. 2007 - current). | ||||||||||
| Carl A. Florio, | Trustee | Indefinite Term, | Director and Vice Chairman of Paradigm Funds Advisors | 4 | Director, | |||||
| CPA3, (1948) | Since 2005 | LLC and affiliated entities (2008 – current); Eastern | American Bio | |||||||
| Regional President of First Niagara Bank (2005 - 2007); | Medical; Dir., | |||||||||
| President and Chief Executive Officer of Hudson River | First Niagara | |||||||||
| Bank & Trust Company (1996 - 2005). | Financial Group | |||||||||
| Charles J. | Secretary | Indefinite Term, | SVP and COO of Paradigm Funds Advisor LLC and affili- | NA | NA | |||||
| DiVencenzo, Jr. | Since 2006 | ated advisors (January 2006 - current); Vice President of | ||||||||
| (1960) | The Hartford (Investment Products Division) (April 1998 - | |||||||||
| January 2006). | ||||||||||
| John V. Gulick | Chief | Indefinite Term, | VP and CCO of Paradigm Funds Advisor LLC and affiliat- | NA | NA | |||||
| (1972) | Compliance | Since 2006 | ed advisors (February 2007 – current), Compliance Officer | |||||||
| Officer | of Paradigm Capital Management, Inc. (April 2005 – Feb. | |||||||||
| 2007); Senior Compliance Analyst of GE Asset | ||||||||||
| Management, Inc. (Feb. 2001 - March 2005). | ||||||||||
| Robert A. | Treasurer | Indefinite Term, | SVP and CFO of Paradigm Funds Advisor LLC and | NA | NA | |||||
| Benton, CPA | and Chief | Since 2002 | affiliated advisors (May 2006 – current), SVP and CFO | |||||||
| (1954) | Financial | of C.L. King & Associates, a registered broker dealer | ||||||||
| Officer | (February 2001 - current); SVP and CFO of Paradigm | |||||||||
| Capital Management, Inc. (February 2001 - March | ||||||||||
| 2004). | ||||||||||
Independent Trustees
| Term of | Principal | Number of | Other | |||||||
| Name, | Position(s) | Office and | Occupation(s) | Portfolios Directorships | ||||||
| Address1, | Held with | Length of | During | Overseen | Held By | |||||
| and Year of Birth | theTrust | Time Served | Past 5 Years | By Trustee | Trustee | |||||
| Lewis Golub4, | Independent | Indefinite Term, | Chairman of the Board, Golub Corporation - DBA Price | 4 | Director, | |||||
| (1931) | Trustee | Since 2002 | Chopper Supermarkets (1950 - current). | Racemark Int'l; | ||||||
| Director, | ||||||||||
| TaylorMade Inc.; | ||||||||||
| Director, DOT | ||||||||||
| Foods, Inc. | ||||||||||
| Anthony J. | Independent | Indefinite Term, | President and Chairman of the Board of Cool Insuring | 4 | Director, | |||||
| Mashuta, (1956) | Trustee | Since 2004 | Agency, Inc. (1988 - current). | Proctor's | ||||||
| Theatre | ||||||||||
| William P. | Independent | Indefinite Term, | Chief Executive Officer of Bright Hub, Inc. (2006 - cur- | 4 | Director, MTI | |||||
| Phelan5, (1956) | Trustee | Since 2007 | rent); Chief Executive Officer of OneMade, Inc. (1999 - | Micro | ||||||
| 2004). | ||||||||||
1 The address of each trustee and officer is c/o Paradigm Funds, Nine Elk Street, Albany, NY 12207.
2 Candace King Weir is considered an "interested person" as defined in Section 2(a)(19) of the Investment Company Act of 1940, as amended, by virtue of her affiliation with the Trust's investment advisor, Paradigm Funds Advisor LLC.
3 Carl A. Florio is considered an "interested person" as defined in Section 2(a)(19) of the Investment Company Act of 1940, as amended, because he is an officer of the Trust's investment advisor, Paradigm Funds Advisor LLC. Carl A. Florio is a member of the Board of Directors of a non-profit foundation that recently retained Paradigm Capital Management, Inc. to manage a portion of the foundation's assets. Candace King Weir is a Director and the President of Paradigm Capital Management, Inc.; and an interested Trustee of the Trust; and CEO of the Trust's investment advisor, Paradigm Funds Advisor LLC.
4 Lewis Golub is a limited partner in PCM Partners, LP II. As of December 31, 2008 he owned 1.20% of the PCM Partners, LP II partnership, the value of which was $1.7 million. Candace King Weir is the general partner of PCM Partners, LP II; an interested Trustee of the Trust; and CEO of the Trust's investment advisor, Paradigm Funds Advisor LLC.
5 William P. Phelan is a limited partner in PCM Partners, LP II. As of December 31, 2008 he owned 0.94% of the PCM Partners, LP II partnership, the value of which was $1.3 million. Candace King Weir is the general partner of PCM Partners, LP II; an interested Trustee of the Trust; and CEO of the Trust's investment advisor, Paradigm Funds Advisor LLC.
The Statement of Additional Information includes additional information about the Fund’s Trustees and may be obtained without charge by calling 1-800-239-0732.
Board of Trustees Carl A. Florio Lewis Golub Candace King Weir Anthony Mashuta William P. Phelan Investment Advisor Paradigm Funds Advisor LLC Nine Elk Street Albany, NY 12207-1002 Counsel Thompson Hine LLP 312 Walnut Street, 14th Floor Cincinnati, OH 45202 Custodian U.S. Bank, NA 425 Walnut Street P.O. Box 1118 Cincinnati, OH 45201 Dividend Paying Agent, Shareholders' Servicing Agent, Transfer Agent Mutual Shareholder Services 8000 Town Centre Dr., Suite 400 Broadview Hts., OH 44147 Fund Administrator Premier Fund Solutions, Inc. 480 N. Magnolia Avenue, Suite 103 El Cajon, CA 92020 Independent Registered Public Accounting Firm Cohen Fund Audit Services, Ltd. 800 Westpoint Pkwy., Suite 1100 Westlake, OH 44145-1524 |
This report is provided for the general information of the shareholders of the Paradigm Funds. This report is not intended for distribution to prospective investors in the Funds, unless preceded or accompanied by an effective prospectus.
Item 2. Code of Ethics.
The registrant has adopted a code of ethics that applies to the registrant’s principal executive officer and the principal financial officer. The registrant has not made any amendments to its code of ethics during the covered period. The registrant has not granted any waivers from any provisions of the code of ethics during the covered period. A copy of the registrant’s Code of Ethics is filed herewith.
Item 3. Audit Committee Financial Expert.
The registrant’s Board of Trustees has determined that William P. Phalen is an audit committee financial expert. Mr. Phalen is independent for purposes of this Item 3.
Item 4. Principal Accountant Fees and Services.
(a-d) The following table details the aggregate fees billed for each of the last two fiscal years for audit fees, audit-related fees, tax fees and other fees by the principal accountant to the registrant. The principal accountant has provided no services to the adviser or any entity controlled by, or under common control with the adviser that provides ongoing services to the registrant.
| FYE 12/31/08 | FYE 12/31/07 | |||
| Audit Fees | $34,100 | $33,950 | ||
| Audit-Related Fees | $0 | $0 | ||
| Tax Fees | $12,500 | $10,000 | ||
| All Other Fees | $2,600 | $2,450 |
Nature of Tax Fees: preparation of Excise Tax Statement and 1120 RIC. Nature of All Other Fees: Review of Semi-Annual Report.
(e) (1) The audit committee approves all audit and non-audit related services and, therefore, has not adopted pre-approval policies and procedures described in paragraph (c)(7) of Rule 2-01 of Regulation S-X.
(e) (2) None of the services described in paragraph (b) through (d) of this Item were approved by the audit committee pursuant to paragraph (c)(7)(i)(C) of Rule 2-01 of Regulation S-X.
(f) All of the principal accountant’s hours spent on auditing the registrant’s financial statements were attributed to work performed by full-time permanent employees of the principal accountant.
(g) The following table indicates the aggregate non-audit fees billed by the registrant’s principal accountant for services to the registrant , the registrant’s investment adviser (not sub-adviser), and any entity controlling, controlled by, or under common control with the adviser that provides ongoing services to the registrant, for the last two years.
| Non-Audit Fees | FYE 12/31/08 | FYE 12/31/07 | ||
| Registrant | $15,100 | $12,450 | ||
| Registrant’s Investment Adviser | $0 | $0 |
(h) The principal accountant provided no services to the investment adviser or any entity controlling, controlled by, or under common control with the adviser that provides ongoing services to the registrant.
Item 5. Audit Committee of Listed Companies. Not applicable.
Item 6. Schedule of Investments. Schedule filed with Item 1.
Item 7. Disclosure of Proxy Voting Policies and Procedures for Closed-End Management Investment Companies. Not applicable.
Item 8. Portfolio Managers of Closed End Management Investment Companies. Not applicable.
Item 9. Purchases of Equity Securities by Closed-End Management Investment Companies and Affiliated Purchasers. Not applicable.
Item 10. Submission of Matters to a Vote of Security Holders.
The registrant has not adopted procedures by which shareholders may recommend nominees to the registrant’s board of trustees.
Item 11. Controls and Procedures.
(a) The registrant’s president and chief financial officer concluded that the disclosure controls and procedures (as defined in Rule 30a-3(c) under the Investment Company Act of 1940 (the “Act”)) were effective as of a date within 90 days of the filing date of this report, based on the evaluation of these controls and procedures required by Rule 30a-3(b) under the Act.
(b) There were no changes in the registrant’s internal control over financial reporting (as defined in Rule 30a-3(d) under the Act) that occurred during the registrant’s second fiscal quarter of the period covered by this report that have materially affected, or are reasonably likely to materially affect, the registrant’s internal control over financial reporting.
Item 12. Exhibits.
(a)(1) Code of Ethics. Filed herewith.
(a)(2) Certifications pursuant to Section 302 of the Sarbanes-Oxley Act of 2002. Filed herewith.
(b) Certification pursuant to Section 906 Certification of the Sarbanes-Oxley Act of 2002. Filed herewith
| SIGNATURES |
Pursuant to the requirements of the Securities Exchange Act of 1934 and the Investment Company Act of 1940, the registrant has duly caused this report to be signed on its behalf by the undersigned, thereunto duly authorized.
| Paradigm Funds |
| By: /s/ Candace King Weir Candace King Weir President |
| Date: 3 - 4 - 2009 |
Pursuant to the requirements of the Securities Exchange Act of 1934 and the Investment Company Act of 1940, this report has been signed below by the following persons on behalf of the registrant and in the capacities and on the dates indicated.
| By: /s/ Candace King Weir Candace King Weir President |
| Date: 3 - 4 - 2009 |
| By: /s/ Robert A. Benton Robert A. Benton Chief Financial Officer |
| Date: 3 - 4 - 2009 |