united states
securities and exchange commission
washington, d.c. 20549
form n-csr
certified shareholder report of registered management
investment companies
Investment Company Act file number 811-21237
Unified Series Trust
(Exact name of registrant as specified in charter)
225 Pictoria Drive, Suite 450
Cincinnati, OH 45246
(Address of principal executive offices)
(Zip code)
Zachary P. Richmond
Ultimus Fund Solutions, LLC
225 Pictoria Drive. Suite 450
Cincinnati, OH 45246
(Name and address of agent for service)
Registrant's telephone number, including area code: 513-587-3400
Date of fiscal year end: 08/31
Date of reporting period: 08/31/22
Form N-CSR is to be used by management investment companies to file reports with the Commission not later than 10 days after the transmission to stockholders of any report that is required to be transmitted to stockholders under Rule 30e-1 under the Investment Company Act of 1940 (17 CFR 270.30e-1). The Commission may use the information provided on Form N-CSR in its regulatory, disclosure review, inspection and policymaking roles.
A registrant is required to disclose the information specified by Form N-CSR, and the Commission will make this information public. A registrant is not required to respond to the collection of information contained in Form N-CSR unless the Form displays a currently valid Office of Management and Budget ("OMB") control number. Please direct comments concerning the accuracy of the information collection burden estimate and any suggestions for reducing the burden to Secretary, Securities and Exchange Commission, 450 Fifth Street, NW, Washington, DC 20549-0609. The OMB has reviewed this collection of information under the clearance requirements of 44 U.S.C. § 3507.
Item 1. Reports to Stockholders.
| |
| |
| Tactical Multi-Purpose Fund |
| |
| |
| |
| |
| |
| |
| |
| |
| |
| Annual Report |
| |
| |
| August 31, 2022 |
| |
| |
| |
| |
| |
| Fund Adviser: |
| |
| |
| Fisher Asset Management, LLC |
| |
| 5525 NW Fisher Creek Drive |
| Camas, Washington 98607 |
| (800) 550-1071 |
| |
| |
| |
| |
| |
| |
| |
| |
| |
| |
| |
| |
| |
| |
| |
| |
| |
| |
| |
| |
| |
| |
| |
| Tactical Multi-Purpose Fund |
| Management’s Discussion of Fund Performance (Unaudited) |
| |
Dear Shareholder:
Market Commentary and Outlook
After relatively steady and strong stock returns in 2021, negative market volatility resurfaced in 2022. By August 31, 2022 Global stocks declined -15% over the prior year—entering bear market territory from their January 4 high. While many headlines in June focused on stocks crossing this threshold, we argued at the time there wasn’t anything magical about the -20% mark and that investors should prepare for stocks to rebound faster than many believed. Following June’s low, Global stocks recovered over half their decline by mid-August but encountered another bout of negativity in late August. We continue to believe the best course of action is to remain disciplined and position for stocks to rebound. In our view, today’s combination of overly dour sentiment and underappreciated fundamentals sets the stage for a strong market recovery, which may already be underway. But even if stocks re-test this year’s lows, a new bull market is likely close by and ready to deliver the returns investors seeking long-term growth will need.
Coming into 2022, we anticipated a positive, back-end loaded year with frustration and grind earlier on—typical of US midterm election years. However, we did not anticipate the magnitude of the decline we’ve seen this year. In our view, this year’s market downturn has been fueled by multiple narratives converging and interacting in ways that create more uncertainty than each would on its own. We’ve seen corrections sparked by fears about wars, inflation, monetary policy, China’s economy, and COVID where investors were able to move on from these concerns reasonably quickly. Now these issues are all happening at once, which could take investors longer to wrap their heads around. But stocks don’t wait for clarity—they eventually look past present uncertainties and focus on the future, which we believe will likely be brighter than many imagine.
We believe current concerns are blinding many investors to underappreciated positive economic fundamentals. For example, Q2 2022 S&P 500 blended earnings and revenue—combining reported results with remaining consensus expectations—remain nicely positive (+6.0% y/y EPS and +12.3% y/y sales). We believe this illustrates how many companies have continued to remain profitable despite commonly cited headwinds and tough year-over-year comparisons. Additionally, data indicate American households entered 2022 relatively well positioned to weather market volatility, rising inflation and other economic hardships. For example, household liabilities as a ratio of total assets have fallen substantially since 2009 to nearly 11% and household net worth remains near all-time highs.
Inflation has spiked higher for longer than we initially expected as continued COVID disruptions, the war in Ukraine and high oil prices have all added to price pressures. With US inflation running at +8.3% y/y in August, many worry higher inflation levels are becoming entrenched. While higher prices are frustrating for consumers and month-to-month data remain volatile, we still believe inflation is likely to slow further before too long. It is unlikely inflation continues accelerating or lingers over 8% for years, in our view. This sets the stage for reality to prove better than most anticipate as inflation eventually moderates.
Supply chain issues remain a widespread concern related to inflation. Some headwinds clearly persist, but there are signs of easing. The New York Fed’s Global Supply Chain Pressure Index, which aggregates transportation costs, input-output prices and several purchasing managers’ index components, is falling from recent highs, indicating supply bottlenecks are moderating.
Fed rate hike expectations have been evolving rapidly this year as investors try to discern the Fed’s policy trajectory amid current economic uncertainty. While hyper focus on the Fed helps markets pre-price the most likely Fed moves in the near term, Fed decisions are ultimately made by a group of individuals whose choices defy exact prediction. Thus, it’s always possible the Fed does something different than widely expected. Additionally, shifting inflation expectations can also move long-term investor rates in unexpected ways. However, investors’ intense scrutiny of inflation reports and Fed moves once they are announced helps reduce the likelihood a monetary policy error would go unnoticed—lessening the surprise power of such a scenario.
As another indication credit markets appear healthy, global loan growth has been robust this year and ended June at 7.9% y/y. Banks are flush with cash and have historically high Tier 1 capital ratios, which reflect strong balance sheets and capacity to lend. We believe all this suggests credit markets are in good shape.
| Tactical Multi-Purpose Fund |
| Management’s Discussion of Fund Performance (Unaudited) – (continued) |
| |
Performance Attribution
The Tactical Multi-Purpose Fund (the “Fund”) seeks positive total returns over the long-term regardless of market conditions in the U.S. and foreign equity markets. The Fund is designed to be used by the Adviser to facilitate moving groups of clients into and out of defensive and special situation investments efficiently, based on the Adviser’s perceptions of market risks and opportunities.
During the fiscal year ended August 31, 2022, the Adviser did not take a defensive position; therefore the Fund was limited in size, with its assets invested mostly in T-Bills and cash equivalents. The Fund returned -0.41% during the fiscal year ended August 31, 2022. During the same period, the Fund’s primary benchmark, the ICE BofA 3-month U.S. Treasury Bill Index returned 0.38%.
The Fund’s underperformance is reflective of its modest investment in T-Bills and cash equivalents for the period, which generated minimal interest. Underperformance as compared to the index is also in part due to the Fund’s 1.00% expense ratio (the performance of the index does not reflect the deduction of expenses). Due to the size of the investment, the Fund maintained a sizeable portion of the investments in cash equivalents to meet expense obligations. However, T-Bills were purchased in June 2022 with a portion of the Fund to opportunistically benefit from changes by the Fed to short rates. It is anticipated that similar returns will continue until the Adviser utilizes the Fund for defensive purposes or prevailing short-term interest rates meaningfully change.
Fisher Investments
August 2022
| Tactical Multi-Purpose Fund |
| Investment Results (Unaudited) |
Average Annual Total Returns(a)
(for the periods ended August 31, 2022) |
| | | | Since |
| | | | Inception |
| | One Year | Three Year | (3/30/17) |
| Tactical Multi-Purpose Fund | (0.41)% | (0.51)% | (0.37)% |
| ICE BofA 3-Month U.S. Treasury Bill Index(b) | 0.38% | 0.57% | 1.10% |
| Total annual operating expenses, as disclosed in the Tactical Multi-Purpose Fund (the “Fund”) prospectus dated November 30, 2021, were 635.29% of average daily net assets (1.00% after fee waivers/expense reimbursements). Fisher Asset Management, LLC, d/b/a Fisher Investments (the “Adviser”) is contractually obligated to limit the Fund’s total annual operating expenses to 1.00% of the Fund’s average daily net assets through December 31, 2026 (excluding portfolio transaction and other investment-related costs (including brokerage fees and commissions); taxes; borrowing costs (such as interest and dividend expenses on securities sold short); acquired fund fees and expenses; fees and expenses associated with investments in other collective investment vehicles or derivative instruments (including for example option and swap fees and expenses); any amounts payable pursuant to a distribution or service plan adopted in accordance with Rule 12b-1 under the Investment Company Act of 1940; any administrative and/or shareholder servicing fees payable pursuant to a plan adopted by the Board of Trustees; expenses incurred in connection with any merger or reorganization; extraordinary expenses (such as litigation expenses, indemnification of Trust officers and Trustees and contractual indemnification of Fund service providers); and other expenses that the Trustees agree have not been incurred in the ordinary course of the Fund’s business). This expense cap may not be terminated prior to this date except by the Board of Trustees. Each expense payment by the Adviser (but not management fee waiver) is subject to recoupment by the Adviser from the Fund in the three years following the date the particular expense payment occurred, but only if such recoupment can be achieved without exceeding the annual expense limitation in effect at the time of the expense payment and any expense limitation in effect at the time of recoupment. Additional information pertaining to the Fund’s expense ratios as of August 31, 2022 can be found in the financial highlights. |
| |
The performance quoted represents past performance, which does not guarantee future results. The investment return and principal value of an investment will fluctuate so that an investor’s shares, when redeemed, may be worth more or less than their original cost. The returns shown do not reflect deduction of taxes that a shareholder would pay on Fund distributions or the redemption of Fund shares. Current performance of the Fund may be lower or higher than the performance quoted. The Fund’s investment objectives, risks, charges and expenses must be considered carefully before investing. Performance data current to the most recent month end may be obtained by calling (800) 550-1071.
| (a) | Return figures reflect any change in price per share and assume the reinvestment of all distributions. The Fund’s returns reflect any fee reductions during the applicable periods. If such fee reductions had not occurred, the quoted performance would have been lower. |
| (b) | The ICE BofA 3-Month U.S. Treasury Bill Index (the “Index”) is comprised of a single issue purchased at the beginning of the month and held for a full month. Each month the Index is rebalanced and the issue selected is the outstanding Treasury Bill that matures closest to, but not beyond, three months from the rebalancing date. The Index returns assume reinvestment of all distributions and do not reflect the deduction of taxes and fees. Individuals cannot invest directly in the Index. However, an individual may invest in exchange traded funds or other investment vehicles that attempt to track the performance of a benchmark index. |
You should consider the Fund’s investment objectives, risks, charges and expenses carefully before you invest. The Fund’s prospectus contains important information about the Fund’s investment objectives, potential risks, management fees, charges and expenses, and other information and should be read carefully before investing. You may obtain a current copy of the Fund’s prospectus or performance data current to the most recent month-end by calling (800) 550-1071.
The Fund is distributed by Ultimus Fund Distributors, LLC, member FINRA/SIPC.
| Tactical Multi-Purpose Fund |
| Investment Results (Unaudited) – (continued) |
| |
Comparison of the Growth of a $10,000 Investment in the Tactical Multi-Purpose Fund and the
ICE BofA ML 3-Month U.S. Treasury Bill Index (Unaudited)
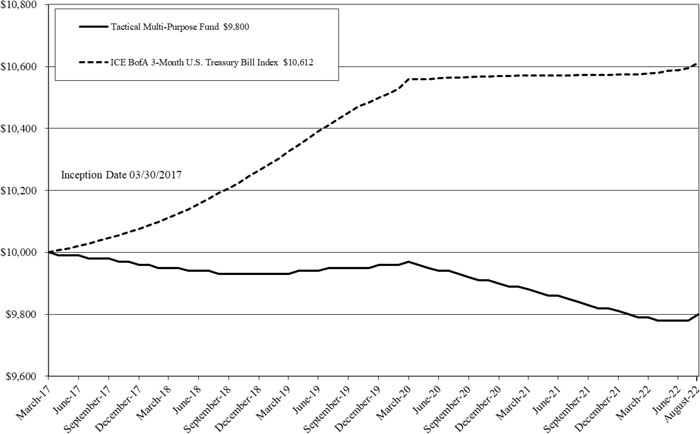
This graph shows the value of a hypothetical initial investment of $10,000 made on March 30, 2017 (commencement of operations) and held through August 31, 2022. THE FUND’S RETURN REPRESENTS PAST PERFORMANCE AND DOES NOT GUARANTEE FUTURE RESULTS. The ICE BofA 3 -Month U.S. Treasury Bill Index is an unmanaged index of Treasury securities that assumes reinvestment of all income. The returns shown do not reflect deduction of taxes that a shareholder would pay on Fund distributions or the redemption of Fund shares. Investment returns and principal values will fluctuate so that your shares, when redeemed, may be worth more or less than their original purchase price.
Current performance may be lower or higher than the performance data quoted. For more information on the Fund, and to obtain performance data current to the most recent month-end, or to request a prospectus, please call (800) 550-1071. You should carefully consider the investment objectives, potential risks, management fees, and charges and expenses of the Fund before investing. The Fund’s prospectus contains this and other information about the Fund, and should be read carefully before investing.
The Fund is distributed by Ultimus Fund Distributors, LLC, member FINRA/SIPC.
| Tactical Multi-Purpose Fund |
| Fund Holdings (Unaudited) |
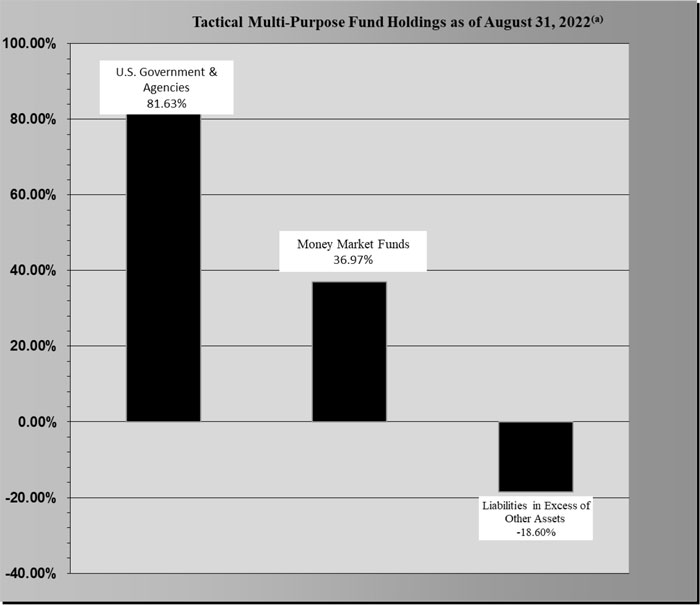
| (a) | As a percentage of net assets. |
The investment objective of the Fund is to seek positive total returns over the long-term regardless of market conditions in the U.S. and foreign equity markets.
Availability of Portfolio Schedule (Unaudited)
The Fund files its complete schedule of portfolio holdings with the Securities and Exchange Commission (the “SEC”) for the first and third quarters of each fiscal year as an exhibit to its reports on Form N-PORT. The Fund’s Form N-PORT reports are available on the SEC’s website at http://www.sec.gov.
| Tactical Multi-Purpose Fund |
| Schedule of Investments |
| August 31, 2022 |
| U.S. GOVERNMENT & AGENCIES — 81.63% | | Principal Amount | | | Fair Value | |
| | | | | | | |
| United States Treasury Bill, 1.53%, 9/8/2022(a) | | $ | 20,000 | | | $ | 19,992 | |
| | | | | | | | | |
| Total U.S. Government & Agencies (Cost $19,994) | | | | | | | 19,992 | |
| | | | | | | | | |
| MONEY MARKET FUNDS - 36.97% | | Shares | | | Fair Value | |
| | | | | | | | | |
| First American Government Obligations Fund, Class X, 2.04% (b) | | | 9,054 | | | | 9,054 | |
| | | | | | | | | |
| Total Money Market Funds (Cost $9,054) | | | | | | | 9,054 | |
| | | | | | | | | |
| Total Investments — 118.60% (Cost $29,048) | | | | | | | 29,046 | |
| | | | | | | | | |
| Liabilities in Excess of Other Assets — (18.60)% | | | | | | | (4,556 | ) |
| | | | | | | | | |
| NET ASSETS — 100.00% | | | | | | $ | 24,490 | |
| | | | | | | | | |
| (a) | Discount security. Rate shown is the effective yield at time of purchase. |
| (b) | Rate disclosed is the seven day effective yield as of August 31, 2022. |
See accompanying notes which are an integral part of these financial statements.
| Tactical Multi-Purpose Fund |
| Statement of Assets and Liabilities |
| August 31, 2022 |
| Assets | | | | |
| Investments in securities at fair value (cost $29,048) | | $ | 29,046 | |
| Interest receivable | | | 17 | |
| Receivable from Adviser | | | 11,702 | |
| Prepaid expenses | | | 2,178 | |
| Total Assets | | | 42,943 | |
| Liabilities | | | | |
| Payable to affiliates | | | 6,360 | |
| Other accrued expenses | | | 12,093 | |
| Total Liabilities | | | 18,453 | |
| Net Assets | | $ | 24,490 | |
| Net Assets consist of: | | | | |
| Paid-in capital | | | 24,520 | |
| Accumulated deficit | | | (30 | ) |
| Net Assets | | $ | 24,490 | |
| Shares outstanding (unlimited number of shares authorized, no par value) | | | 2,500 | |
| Net asset value, offering and redemption price per share | | $ | 9.80 | |
| | | | | |
See accompanying notes which are an integral part of these financial statements.
| Tactical Multi-Purpose Fund |
| Statement of Operations |
| For the year ended August 31, 2022 |
| Investment Income | | | | |
| Dividend income | | $ | 70 | |
| Interest income | | | 66 | |
| Total investment income | | | 136 | |
| | | | | |
| Expenses | | | | |
| Fund accounting | | | 30,003 | |
| Administration | | | 30,001 | |
| Legal | | | 22,001 | |
| Trustee | | | 14,582 | |
| Audit and tax | | | 12,250 | |
| Transfer agent | | | 12,000 | |
| Compliance services | | | 12,000 | |
| Custodian | | | 5,000 | |
| Report printing | | | 2,650 | |
| Registration | | | 352 | |
| Adviser | | | 62 | |
| Miscellaneous | | | 16,974 | |
| Total expenses | | | 157,875 | |
| Fees waived and expenses reimbursed by Adviser | | | (156,021 | ) |
| Fees reduced by Administrator | | | (1,610 | ) |
| Net operating expenses | | | 244 | |
| Net investment loss | | | (108 | ) |
| | | | | |
| Net Realized and Change in Unrealized Gain (Loss) on Investments | | | | |
| Net change in unrealized depreciation of investment securities | | | (2 | ) |
| Net realized and change in unrealized loss on investments | | | (2 | ) |
| Net decrease in net assets resulting from operations | | $ | (110 | ) |
| | | | | |
See accompanying notes which are an integral part of these financial statements.
| Tactical Multi-Purpose Fund |
| Statements of Changes in Net Assets |
| | | For the Year | | | For the Year | |
| | | Ended August 31, | | | Ended August 31, | |
| | | 2022 | | | 2021 | |
| Decrease in Net Assets due to: | | | | | | | | |
| Operations | | | | | | | | |
| Net investment loss | | $ | (108 | ) | | $ | (224 | ) |
| Net change in unrealized depreciation of investment securities | | | (2 | ) | | | — | |
| Net decrease in net assets resulting from operations | | | (110 | ) | | | (224 | ) |
| | | | | | | | | |
| Capital Transactions | | | | | | | | |
| Amount paid for shares redeemed | | $ | (10 | ) | | $ | — | |
| | | | | | | | | |
| Net decrease in net assets resulting from capital transactions | | | (10 | ) | | | — | |
| | | | | | | | | |
| Total Decrease in Net Assets | | | (120 | ) | | | (224 | ) |
| | | | | | | | | |
| Net Assets | | | | | | | | |
| Beginning of year | | | 24,610 | | | | 24,834 | |
| End of year | | $ | 24,490 | | | $ | 24,610 | |
| | | | | | | | | |
| Share Transactions | | | | | | | | |
| Shares redeemed | | | (1 | ) | | | — | |
| Net decrease in shares | | | (1 | ) | | | — | |
| | | | | | | | | |
See accompanying notes which are an integral part of these financial statements.
| Tactical Multi-Purpose Fund |
| Financial Highlights |
| |
| (For a share outstanding during each year) |
| | | For the Year | | | For the Year | | | For the Year | | | For the Year | | | For the Year | |
| | | Ended | | | Ended | | | Ended | | | Ended | | | Ended | |
| | | August 31, | | | August 31, | | | August 31, | | | August 31, | | | August 31, | |
| | | 2022 | | | 2021 | | | 2020 | | | 2019 | | | 2018 | |
| Selected Per Share Data: | | | | | | | | | | | | | | | | | | | | |
| Net asset value, beginning of year | | $ | 9.84 | | | $ | 9.93 | | | $ | 9.95 | | | $ | 9.93 | | | $ | 9.98 | |
| | | | | | | | | | | | | | | | | | | | | |
| Investment operations: | | | | | | | | | | | | | | | | | | | | |
| Net investment income (loss) | | | (0.04 | ) | | | (0.09 | ) | | | (0.02 | ) | | | 0.02 | | | | (0.05 | ) |
| Net realized and unrealized gain | | | — | (a) | | | — | | | | — | (a) | | | — | (a) | | | — | |
| Total from investment operations | | | (0.04 | ) | | | (0.09 | ) | | | (0.02 | ) | | | 0.02 | | | | (0.05 | ) |
| | | | | | | | | | | | | | | | | | | | | |
| Net asset value, end of year | | $ | 9.80 | | | $ | 9.84 | | | $ | 9.93 | | | $ | 9.95 | | | $ | 9.93 | |
| | | | | | | | | | | | | | | | | | | | | |
| Total Return(b) | | | (0.41 | )% | | | (0.91 | )% | | | (0.20 | )% | | | 0.20 | % | | | (0.50 | )% |
| | | | | | | | | | | | | | | | | | | | | |
| Ratios and Supplemental Data: | | | | | | | | | | | | | | | | | | | | |
| Net assets, end of year (000 omitted) | | $ | 24 | | | $ | 25 | | | $ | 25 | | | $ | 25 | | | $ | 25 | |
| Ratio of net expenses to average net assets | | | 1.00 | % | | | 1.00 | % | | | 1.00 | % | | | 1.00 | % | | | 1.00 | % |
| Ratio of gross expenses to average net assets before waiver and reimbursement | | | 644.19 | % | | | 635.29 | % | | | 596.00 | % | | | 589.45 | % | | | 534.46 | % |
| Ratio of net investment income (loss) to average net assets | | | (0.44 | )% | | | (0.91 | )% | | | (0.20 | )% | | | 0.15 | % | | | (0.46 | )% |
| Portfolio turnover rate | | | 0 | % | | | 0 | % | | | 0 | % | | | 0 | % | | | 0 | % |
| | | | | | | | | | | | | | | | | | | | | |
| (a) | Rounds to less than $0.005 per share. |
| (b) | Total return represents the rate that the investor would have earned or lost on an investment in the Fund, assuming reinvestment of distributions. |
See accompanying notes which are an integral part of these financial statements.
Tactical Multi-Purpose Fund
Notes to the Financial Statements
August 31, 2022
NOTE 1. ORGANIZATION
Tactical Multi-Purpose Fund (the “Fund”) is registered under the Investment Company Act of 1940, as amended (“1940 Act”), as a non-diversified series of Unified Series Trust (the “Trust”) on November 14, 2016. The Trust is an open-end investment company established under the laws of Ohio by an Agreement and Declaration of Trust dated October 14, 2002 (the “Trust Agreement”). The Trust Agreement permits the Board of Trustees of the Trust (the “Board”) to issue an unlimited number of shares of beneficial interest of separate series without par value. The Fund is one of a series of funds currently authorized by the Board. The Fund commenced operations on March 30, 2017. The investment adviser to the Fund is Fisher Asset Management, LLC, d/b/a Fisher Investments (the “Adviser”). The investment objective of the Fund is to seek positive total returns over the long-term regardless of market conditions in the U.S. and foreign equity markets.
NOTE 2. SIGNIFICANT ACCOUNTING POLICIES
The Fund is an investment company and follows accounting and reporting guidance under Financial Accounting Standards Board Accounting Standards Codification (“ASC”) Topic 946, “Financial Services-Investment Companies” including Accounting Standards Update 2013-08. The following is a summary of significant accounting policies followed by the Fund in the preparation of its financial statements. These policies are in conformity with generally accepted accounting principles in the United States of America (“GAAP”).
Estimates – The preparation of financial statements in conformity with GAAP requires management to make estimates and assumptions that affect the reported amounts of assets and liabilities and disclosure of contingent assets and liabilities at the date of the financial statements and the reported amounts of increases and decreases in net assets from operations during the reporting period. Actual results could differ from those estimates.
Federal Income Taxes – The Fund makes no provision for federal income or excise tax. The Fund has qualified and intends to qualify each year as a regulated investment company (“RIC”) under subchapter M of the Internal Revenue Code of 1986, as amended, by complying with the requirements applicable to RICs and by distributing substantially all of its taxable income. The Fund also intends to distribute sufficient net investment income and net realized capital gains, if any, so that it will not be subject to excise tax on undistributed income and gains. If the required amount of net investment income or gains is not distributed, the Fund could incur a tax expense.
As of and during the fiscal year ended August 31, 2022, the Fund did not have any liabilities for any unrecognized tax benefits. The Fund recognizes interest and penalties, if any, related to unrecognized tax benefits as income tax expense in the Statement of Operations when incurred. During the year, the Fund did not incur any interest or penalties. Management of the Fund has reviewed tax positions taken in tax years that remain subject to examination by all major tax jurisdictions, including federal (i.e., the previous three tax year ends and the interim tax period since then, as applicable) and has concluded that no provision for unrecognized tax benefits or expenses is required in these financial statements and does not expect this to change over the next twelve months.
Expenses – Expenses incurred by the Trust that do not relate to a specific fund of the Trust are allocated to the individual funds based on each fund’s relative net assets or another appropriate basis (as determined by the Board).
Security Transactions and Related Income – The Fund follows industry practice and records security transactions on the trade date for financial reporting purposes. The specific identification method is used for determining gains or losses for financial statement and income tax purposes. Dividend income is recorded on the ex-dividend date and interest income is recorded on an accrual basis.
Dividends and Distributions – The Fund intends to distribute its net investment income and net realized long-term and short-term capital gains, if any, at least annually. Dividends and distributions to shareholders, which are determined in accordance with income tax regulations, are recorded on the ex-dividend date. The treatment for financial reporting purposes of distributions made to
Tactical Multi-Purpose Fund
Notes to the Financial Statements (continued)
August 31, 2022
shareholders during the period from net investment income or net realized capital gains may differ from their ultimate treatment for federal income tax purposes. These differences are caused primarily by differences in the timing of the recognition of certain components of income, expense or realized capital gain for federal income tax purposes. Where such differences are permanent in nature, they are reclassified among the components of net assets based on their ultimate characterization for federal income tax purposes. Any such reclassifications will have no effect on net assets, results of operations or net asset value (“NAV”) per share of the Fund.
For the fiscal year ended August 31, 2022, the Fund made the following reclassifications to increase (decrease) the components of net assets:
| | | | Accumulated | |
| Paid-In Capital | | | Earnings (Deficit) | |
| $ | (231 | ) | | $ | 231 | |
NOTE 3. NON-DIVERSIFICATION RISK
The Fund is non-diversified, which means it may invest a greater percentage of its assets in a limited number of issuers as compared to other mutual funds that are more broadly diversified. As a result, the Fund’s share price may be more volatile than the share price of some other mutual funds, and the poor performance of an individual holding in the Fund’s portfolio may have a significant negative impact on the Fund’s performance.
NOTE 4. SECURITIES VALUATION AND FAIR VALUE MEASUREMENTS
The Fund values its portfolio securities at fair value as of the close of regular trading on the New York Stock Exchange (“NYSE”) (normally 4:00 p.m. Eastern time) on each business day the NYSE is open for business. Fair value is defined as the price that the Fund would receive upon selling an investment in a timely transaction to an independent buyer in the principal or most advantageous market of the investment. GAAP establishes a three-tier hierarchy to maximize the use of observable market data and minimize the use of unobservable inputs and to establish classification of fair value measurements for disclosure purposes.
Inputs refer broadly to the assumptions that market participants would use in pricing the asset or liability, including assumptions about risk (the risk inherent in a particular valuation technique used to measure fair value including a pricing model and/or the risk inherent in the inputs to the valuation technique). Inputs may be observable or unobservable. Observable inputs are inputs that reflect the assumptions market participants would use in pricing the asset or liability developed based on market data obtained and available from sources independent of the reporting entity. Unobservable inputs are inputs that reflect the reporting entity’s own assumptions about the assumptions market participants would use in pricing the asset or liability developed based on the best information available in the circumstances.
Various inputs are used in determining the value of the Fund’s investments. These inputs are summarized in the three broad levels listed below.
| ● | Level 1 – unadjusted quoted prices in active markets for identical investments and/or registered investment companies where the value per share is determined and published and is the basis for current transactions for identical assets or liabilities at the valuation date |
| ● | Level 2 – other significant observable inputs (including, but not limited to, quoted prices for an identical security in an inactive market, quoted prices for similar securities, interest rates, prepayment speeds, credit risk, etc.) |
| ● | Level 3 – significant unobservable inputs (including the Fund’s own assumptions in determining fair value of investments based on the best information available) |
Tactical Multi-Purpose Fund
Notes to the Financial Statements (continued)
August 31, 2022
The inputs used to measure fair value may fall into different levels of the fair value hierarchy. In such cases, for disclosure purposes, the level in the fair value hierarchy which is reported is determined based on the lowest level input that is significant to the fair value measurement in its entirety.
Debt securities are valued by using the mean between the closing bid and ask prices provided by a pricing service. If the closing bid and ask prices are not readily available, the pricing service may provide a price determined by a matrix pricing method. Matrix pricing is a mathematical technique used to value fixed income securities without relying exclusively on quoted prices. Matrix pricing takes into consideration recent transactions, yield, liquidity, risk, credit quality, coupon, maturity, type of issue and any other factors or market data the pricing service deems relevant for the actual security being priced and for other securities with similar characteristics. These securities will generally be categorized as Level 2 securities. If the Board or the Adviser as Valuation Designee decides that a price provided by the pricing service does not accurately reflect the fair value of the securities or when prices are not readily available from a pricing service, securities are valued at fair value as determined by the Valuation Designee, in conformity with guidelines adopted by and subject to review of the Board. These securities will generally be categorized as Level 3 securities.
Equity securities that are traded on any stock exchange are generally valued at the last quoted sale price on the security’s primary exchange. Lacking a last sale price, an exchange-traded security is generally valued at its last bid price. Securities traded in the NASDAQ over-the -counter market are generally valued at the NASDAQ Official Closing Price. When using market quotations and when the market is considered active, the security is classified as a Level 1 security. In the event that market quotations are not readily available or are considered unreliable due to market or other events, the Fund values its securities and other assets at fair value in accordance with policies established by and under the general supervision of the Board. Under these policies, the securities will be classified as Level 2 or 3 within the fair value hierarchy, depending on the inputs used.
Investments in mutual funds, including money market mutual funds, are generally priced at the ending NAV. These securities are categorized as Level 1 securities.
In accordance with the Trust’s valuation policies, the Valuation Designee is required to consider all appropriate factors relevant to the value of securities for which it has determined other pricing sources are not available or reliable as described above. No single method exists for determining fair value, because fair value depends upon the circumstances of each individual case. As a general principle, the current fair value of a security being valued by the Valuation Designee would be the amount that the Fund might reasonably expect to receive upon the current sale. Methods that are in accordance with this principle may, for example, be based on (i) a multiple of earnings; (ii) a discount from market prices of a similar freely traded security (including a derivative security or a basket of securities traded on other markets, exchanges or among dealers); or (iii) yield to maturity with respect to debt issues, or a combination of these and other methods. Fair -value pricing is permitted if, in the Valuation Designee’s opinion, the validity of market quotations appears to be questionable based on factors such as evidence of a thin market in the security based on a small number of quotations, a significant event occurs after the close of a market but before the Fund’s NAV calculation that may affect a security’s value, or the Valuation Designee is aware of any other data that calls into question the reliability of market quotations.
The following is a summary of the inputs used to value the Fund’s investments as of August 31, 2022:
| | | Valuation Inputs | |
| Assets | | Level 1 | | | Level 2 | | | Level 3 | | | Total | |
| U.S. Government & Agencies | | $ | — | | | $ | 19,992 | | | $ | — | | | $ | 19,992 | |
| Money Market Funds | | | 9,054 | | | | — | | | | — | | | | 9,054 | |
| Total | | $ | 9,054 | | | $ | 19,992 | | | $ | — | | | $ | 29,046 | |
Tactical Multi-Purpose Fund
Notes to the Financial Statements (continued)
August 31, 2022
The Fund did not hold any investments at the end of the reporting period for which significant unobservable inputs (Level 3) were used in determining fair value; therefore, no reconciliation of Level 3 securities is included for this reporting period. The Fund did not hold any derivative instruments during the reporting period.
NOTE 5. FEES AND OTHER TRANSACTIONS WITH AFFILIATES
The Adviser, under the terms of the management agreement (the “Agreement”) with the Trust with respect to the Fund, manages the Fund’s investments. As compensation for its management services, the Fund is obligated to pay the Adviser a fee computed and accrued daily and paid monthly at an annual rate of 0.25% of the Fund’s average daily net assets. For the fiscal year ended August 31, 2022, the Adviser earned fees of $62 from the Fund before the waiver and reimbursement described below.
The Adviser is contractually obligated to limit the Fund’s total annual operating expenses to 1.00% of the Fund’s average daily net assets through December 31, 2026 (excluding portfolio transaction and other investment-related costs (including brokerage fees and commissions); taxes; borrowing costs (such as interest and dividend expenses on securities sold short); acquired fund fees and expenses; fees and expenses associated with investments in other collective investment vehicles or derivative instruments (including for example option and swap fees and expenses); any amounts payable pursuant to a distribution or service plan adopted in accordance with Rule 12b-1 under the 1940 Act; any administrative and/or shareholder servicing fees payable pursuant to a plan adopted by the Board; expenses incurred in connection with any merger or reorganization; extraordinary expenses (such as litigation expenses, indemnification of Trust officers and Trustees and contractual indemnification of Fund service providers); and other expenses that the Trustees agree have not been incurred in the ordinary course of the Fund’s business. This expense cap may not be terminated prior to this date except by the Board.
Each expense payment by the Adviser (but not management fee waiver) is subject to recoupment by the Adviser from the Fund in the three years following the date the particular expense payment occurred, but only if such recoupment can be achieved without exceeding the annual expense limitation in effect at the time of the expense payment and any expense limitation in effect at the time of the recoupment. As of August 31, 2022, the Adviser may seek repayment of expense reimbursements in the amounts as follows:
| Recoverable through | | | |
| August 31, 2023 | | $ | 146,296 | |
| August 31, 2024 | | | 155,999 | |
| August 31, 2025 | | | 155,959 | |
Ultimus Fund Solutions, LLC (“Ultimus”) provides administration, fund accounting and transfer agent services to the Fund. The Fund pays Ultimus fees in accordance with the agreements for such services.
The Administrator has agreed to waive fees to the extent necessary that the Fund’s total annual operating expenses (excluding taxes, borrowing costs such as interest and dividend expenses on securities sold short, brokerage commissions, acquired fund fees and expenses, shareholder servicing fees paid to financial intermediaries, extraordinary expenses and expenses outside the normal course of business) do not exceed $156,000 annually, based on a twelve-month period commencing April 1 and ending March 31 (the “Annual Period”). The waiver will accrue on a monthly basis such that the Fund’s operating expenses for any month during the Annual Period will not exceed the sum of $13,000 (the “Monthly Expense Cap”), provided that Ultimus may recoup any fees waived by Ultimus in a prior month during the Annual Period to the extent of any unused amount of the Monthly Expense Cap in the current month. The waiver will be suspended and forfeited in any month that the Adviser is not the sole shareholder of the Fund. During the fiscal year ended August 31, 2022, the total amount waived by the Administrator was $1,610.
Tactical Multi-Purpose Fund
Notes to the Financial Statements (continued)
August 31, 2022
Northern Lights Compliance Services, LLC (“NLCS”), an affiliate of Ultimus, provides a Chief Compliance Officer to the Trust, as well as related compliance services, pursuant to a consulting agreement between NLCS and the Trust. Under the terms of such agreement, NLCS receives fees from the Fund, which are approved annually by the Board. Prior to April 1, 2021, Ultimus provided certain compliance services and Buttonwood Compliance Partners provided the Chief Compliance Officer to the Trust.
Under the terms of a Distribution Agreement with the Trust, Ultimus Fund Distributors, LLC (the “Distributor”) serves as principal underwriter to the Fund. The Distributor is a wholly-owned subsidiary of Ultimus. The Distributor is compensated by the Adviser (not the Fund) for acting as principal underwriter.
Certain officers and a Trustee of the Trust are also employees of Ultimus and such persons are not paid by the Fund for serving in such capacities.
The Board supervises the business activities of the Trust. Each Trustee serves as a trustee until termination of the Trust unless the Trustee dies, resigns, retires, or is removed. The Chairman of the Board and more than 75% of the Trustees are “Independent Trustees,” which means that they are not “interested persons” as defined in the 1940 Act. Each Independent Trustee of the Trust receives annual compensation of $2,785 per fund from the Trust, except that the Chairman of the Audit Committee, the Chairman of the Governance & Nominating Committee, and the Chairman of the Pricing & Liquidity Committee each receives annual compensation of $3,235 per fund from the Trust, and the Independent Chairman of the Board receives $3,435 per fund from the Trust. Independent Trustees also receive $1,000 for attending any special meeting that requires an in person approval of a contract and $250 for the first hour and $200 for each additional hour for attending other special meetings. In addition, the Trust reimburses Independent Trustees for out-of-pocket expenses incurred in conjunction with attendance at meetings.
NOTE 6. INVESTMENT TRANSACTIONS
For the fiscal year ended August 31, 2022, there were no purchases or sales of investment securities, other than short-term investments.
NOTE 7. BENEFICIAL OWNERSHIP
The beneficial ownership, either directly or indirectly, of more than 25% of the voting securities of a fund creates a presumption of control of a fund, under Section 2(a)(9) of the 1940 Act. As of August 31, 2022, the Adviser owned 100% of the Fund’s outstanding shares. As a result, the Adviser may be deemed to control the Fund.
NOTE 8. FEDERAL TAX INFORMATION
At August 31, 2022, the net unrealized appreciation (depreciation) and tax cost of investments for tax purposes was as follows:
| Gross unrealized appreciation | | $ | — | |
| Gross unrealized depreciation | | | (2 | ) |
| Net unrealized depreciation on investments | | $ | (2 | ) |
| Tax cost of investments | | $ | 29,048 | |
Tactical Multi-Purpose Fund
Notes to the Financial Statements (continued)
August 31, 2022
At August 31, 2022, the components of accumulated earnings (deficit) on a tax basis were as follows:
| Accumulated capital and other losses | | $ | (28 | ) |
| Unrealized depreciation on investments | | | (2 | ) |
| Total accumulated deficit | | $ | (30 | ) |
For tax purposes no distributions were paid by the Fund for the fiscal years 2021 and 2022.
Certain capital losses and specified gains realized after October 31, and net investment losses realized after December 31 of the Fund’s fiscal year may be deferred and treated as occurring on the first business day of the Fund’s following taxable year. For the tax period ended August 31, 2022, the Fund deferred qualified late year ordinary losses in the amount of $28.
NOTE 9. COMMITMENTS AND CONTINGENCIES
The Trust indemnifies its officers and Trustees for certain liabilities that may arise from their performance of their duties to the Trust or the Fund. Additionally, in the normal course of business, the Trust enters into contracts that contain a variety of representations and warranties which provide general indemnifications. The Trust’s maximum exposure under these arrangements is unknown, as this would involve future claims that may be made against the Trust that have not yet occurred.
NOTE 10. SUBSEQUENT EVENTS
Management of the Fund has evaluated the need for disclosures and/or adjustments resulting from subsequent events through the date at which these financial statements were issued. Based upon this evaluation, management has determined there were no items requiring adjustment of the financial statements or additional disclosure.
Report of Independent Registered Public Accounting Firm
To the Shareholders of Tactical Multi-Purpose Fund and
Board of Trustees of Unified Series Trust
Opinion on the Financial Statements
We have audited the accompanying statement of assets and liabilities, including the schedule of investments, of Tactical Multi-Purpose Fund (the “Fund”), a series of Unified Series Trust, as of August 31, 2022, the related statement of operations for the year then ended, the statements of changes in net assets for each of the two years in the period then ended, the related notes, and the financial highlights for each of the five years in the period then ended (collectively referred to as the “financial statements”). In our opinion, the financial statements present fairly, in all material respects, the financial position of the Fund as of August 31, 2022, the results of its operations for the year then ended, the changes in net assets for each of the two years in the period then ended, and the financial highlights for each of the five years in the period then ended, in conformity with accounting principles generally accepted in the United States of America.
Basis for Opinion
These financial statements are the responsibility of the Fund’s management. Our responsibility is to express an opinion on the Fund’s financial statements based on our audits. We are a public accounting firm registered with the Public Company Accounting Oversight Board (United States) (“PCAOB”) and are required to be independent with respect to the Fund in accordance with the U.S. federal securities laws and the applicable rules and regulations of the Securities and Exchange Commission and the PCAOB.
We conducted our audits in accordance with the standards of the PCAOB. Those standards require that we plan and perform the audit to obtain reasonable assurance about whether the financial statements are free of material misstatement whether due to error or fraud.
Our audits included performing procedures to assess the risks of material misstatement of the financial statements, whether due to error or fraud, and performing procedures that respond to those risks. Such procedures included examining, on a test basis, evidence regarding the amounts and disclosures in the financial statements. Our procedures included confirmation of securities owned as of August 31, 2022, by correspondence with the custodian. Our audits also included evaluating the accounting principles used and significant estimates made by management, as well as evaluating the overall presentation of the financial statements. We believe that our audits provide a reasonable basis for our opinion.
We have served as the auditor of one or more investment companies advised by Fisher Asset Management, LLC since 2017.
COHEN & COMPANY, LTD.
Chicago, Illinois
October 28, 2022
Liquidity Risk Management Program (Unaudited)
The Fund has adopted and implemented a written liquidity risk management program (the “Program”) as required by Rule 22e-4 (the “Liquidity Rule”) under the 1940 Act. The Program is reasonably designed to assess and manage the Fund’s liquidity risk, taking into consideration, among other factors, the Fund’s investment strategy and the liquidity of its portfolio investments during normal and reasonably foreseeable stressed conditions; its short and long -term cash flow projections; and its cash holdings and access to other funding sources. The Board approved the appointment of the Liquidity Administrator Committee, comprising certain Trust officers and employees of the Adviser. The Liquidity Administrator Committee maintains Program oversight and reports to the Board on at least an annual basis regarding the Program’s operational effectiveness through a written report (the “Report”). The Program’s most recent report, which was presented to the Board for consideration at its meeting held on August 15- 16, 2022, outlined the operation of the Program and the adequacy and effectiveness of the Program’s implementation. During the review period, the Fund did not experience unusual stress or disruption to their operations related to purchase and redemption activity. Also, during the review period the Fund held adequate levels of cash and highly liquid investments to meet shareholder redemption activities in accordance with applicable requirements. The Report concluded that the Program is reasonably designed to prevent violation of the Liquidity Rule and has been effectively implemented.
Summary of Fund Expenses (Unaudited)
As a shareholder of the Fund, you incur two types of costs: (1) transaction and (2) ongoing costs, including management fees and other Fund expenses. These examples are intended to help you understand your ongoing costs (in dollars) of investing in the Fund and to compare these costs with the ongoing costs of investing in other mutual funds. The example is based on an investment of $1,000 invested at the beginning of the period and held for the entire period from March 1, 2022 through August 31, 2022.
Actual Expenses
The first line of the table below provides information about actual account values and actual expenses. You may use the information in this line, together with the amount you invested, to estimate the expenses that you paid over the period. Simply divide your account value by $1,000 (for example, an $8,600 account value divided by $1,000 = 8.6), then multiply the result by the number in the first line under the heading entitled “Expenses Paid During Period” to estimate the expenses you paid on your account during this period.
Hypothetical Example for Comparison Purposes
The second line of the table below provides information about hypothetical account values and hypothetical expenses based on the Fund’s actual expense ratio and an assumed rate of return of 5% per year before expenses, which is not the Fund’s actual return. The hypothetical account values and expenses may not be used to estimate the actual ending account balance or expenses you paid for the period. You may use this information to compare the ongoing costs of investing in the Fund and other funds. To do so, compare this 5% hypothetical example with the 5% hypothetical examples that appear in the shareholder reports of other funds.
| | | Beginning | | | Ending | | | | | | | |
| | | Account | | | Account | | | Expenses | | | | |
| | | Value | | | Value | | | Paid | | | Annualized | |
| | | March 1, | | | August 31, | | | During | | | Expense | |
| | | 2022 | | | 2022 | | | Period(a) | | | Ratio | |
| Actual | | $ | 1,000.00 | | | $ | 1,001.00 | | | $ | 5.03 | | | | 1.00 | % |
| Hypothetical(b) | | $ | 1,000.00 | | | $ | 1,020.18 | | | $ | 5.07 | | | | 1.00 | % |
| (a) | Expenses are equal to the Fund’s annualized expense ratios, multiplied by the average account value over the period, multiplied by 184/365 (to reflect the one-half year period). |
| (b) | Hypothetical assumes 5% annual return before expenses. |
Shareholder Voting Results (Unaudited)
At a Special Shareholder Meeting at which a quorum was present, held on September 6, 2022, Fund shareholders of record as of the close of business on July 5, 2022 voted to approve the following proposal:
Proposal 1: To elect the following individuals to serve on the Board of Trustees of the Trust:
Freddie Jacobs Jr.
Catharine Barrow McGauley
Kenneth G.Y. Grant
Daniel J. Condon
Gary A. Hippenstiel
Stephen A. Little
Ronald C. Tritschler
David R. Carson
| | Shares Voted in | Shares Voted Against | Shares Needed to |
| Fund | Favor* | or Abstain* | Approve* |
| Tactical Multi-Purpose Fund | 2,501 (100%) | 0 (0.00%) | Plurality (greater than 50%) |
| * | as a percentage of the total voting securities of the Fund voted at the meeting at which a quorum was present |
Trustees and Officers (Unaudited)
GENERAL QUALIFICATIONS. The Board supervises the business activities of the Trust. Each Trustee serves as a trustee until termination of the Trust unless the Trustee dies, resigns, retires, or is removed. The Chairman of the Board and more than 75% of the Trustees are “Independent Trustees,” which means that they are not “interested persons” (as defined in the 1940 Act) of the Trust or any adviser, sub-adviser or distributor of the Trust.
The following table provides information regarding the Independent Trustees.
Name, Address*, (Year of Birth),
Position with Trust**,
Term of Position with Trust | Principal Occupation During Past 5 Years and Other
Directorships |
Daniel J. Condon (1950)
Chairman, May 2022 to present; Chairman of the Audit Committee; Chairman of the Governance & Nominating Committee, May 2020 to May 2022; Independent Trustee, December 2002 to present | Current: Retired (2017 - present); Trustee, Peak Income Plus Fund (2022 – present). |
Kenneth G.Y. Grant (1949)
Chairman of the Governance & Nominating Committee, May 2022 to present; Chairman, January 2017 to May 2022; Independent Trustee, May 2008 to present | Current: Director, Standpoint Multi-Asset (Cayman) Fund, Ltd. (2019 – present); Director, Advisors Charitable Gift Fund (2020 - present), a Donor Advised Fund; Trustee, Peak Income Plus Fund (2022 – present). Previous: EVP, Benefit Plans Administrative Services, Inc., provider of retirement benefit plans administration (2019 – 2020); Director, Northeast Retirement Services (NRS) LLC, a transfer agent and fund administrator; and Director, Global Trust Company (GTC), a non-depository trust company sponsoring private investment product (2003 – 2019); EVP, NRS (2003 – 2019); GTC, EVP (2008 – 2019); EVP, Savings Banks Retirement Association (2003 – 2019), provider of qualified retirement benefit plans. |
Gary E. Hippenstiel (1947)
Chairman of the Pricing & Liquidity Committee; Independent Trustee, December 2002 to present | Current: President and founder of Hippenstiel Investment Counsel LLC (“Hippenstiel”) since 2008. Hippenstiel was registered as an investment adviser from 2008 to December 31, 2019; Trustee, Peak Income Plus Fund (2022 – present). |
Stephen A. Little (1946)
Independent Trustee, December 2002 to present; Chairman, December 2004 to December 2016 | Current: President and founder of The Rose, Inc., a registered investment adviser, since 1993; Trustee, Peak Income Plus Fund (2022 – present). |
Ronald C. Tritschler (1952)
Independent Trustee, January 2007 to present; Interested Trustee, December 2002 to December 2006 | Current: Chief Executive Officer, Director and Legal Counsel of The Webb Companies, a national real estate company, since 2001; Director, Standpoint Multi-Asset (Cayman) Fund, Ltd. (2020 – present; Director of First State Bank of the Southeast (2000 – present); Trustee, Peak Income Plus Fund (2022 – present). |
Catharine B. McGauley (1977)
Independent Trustee, September 2022 to present | Current: Lead Portfolio Manager of Atlantic Charter Insurance, a workers’ compensation insurer, since 2010; Investment Councilor of a Family Office (2015 – present); Senior Analyst/Advisor for a Boston real estate company and related family (2010 – present); Trustee, Peak Income Plus Fund (2002 – present). |
Freddie Jacobs, Jr. (1970)
Independent Trustee, September 2022 to present | Current: Chief Operating Officer and Chief Risk Officer Northeast Retirement Services (NRS) LLC, a transfer agent and fund administrator; and Director, Global Trust Company (GTC), a non-depository trust company sponsoring private investment product (2021- present); Trustee of Buckingham Browne & Nichols (BBN) (2018 – present); Chair of the Finance Committee, BBN (2020 – present); Chairman Board of Directors of Crispus Attucks Fund (2020– present); Board Member and Treasurer of New England Tennis Association (2017 –present); Board Member of Camp Harbor View (2020 – present); Trustee, Peak Income Plus Fund (2002 – present). Previous: SVP, Senior Risk Officer NRS (2013 – 2019). |
| * | The address for each Trustee is 225 Pictoria Drive, Suite 450, Cincinnati, Ohio 45246. |
| ** | As of the date of this report, the Trust consists of 31 series. |
Trustees and Officers (Unaudited) (continued)
The following table provides information regarding the Interested Trustee and Officers of the Trust.
Name, Address*, (Year of Birth), Position
with Trust,
Term of Position with Trust | Principal Occupation During Past 5 Years and Other
Directorships |
David R. Carson (1958)
President, January 2016 to August 2021; Interested Trustee, August 2020 to present | Current: Senior Vice President Client Strategies of Ultimus Fund Solutions, LLC, since 2013; Interested Trustee of Ultimus Mangers Trust, since 2020; Trustee, Peak Income Plus Fund (2022 – present). |
Martin R. Dean (1963)
President, August 2021 to present; Vice President, November 2020 to August 2021; Chief Compliance Officer, April 2021 to August 2021; Assistant Chief Compliance Officer, January 2016 to April 2021 | Current: Senior Vice President, Head of Fund Compliance of Ultimus Fund Solutions, LLC, since 2016. |
Zachary P. Richmond (1980)
Treasurer and Chief Financial Officer, November 2014 to present | Current: Vice President, Director of Financial Administration for Ultimus Fund Solutions, LLC, since 2015. |
Gweneth K. Gosselink (1955)
Chief Compliance Officer, August 2021 to present | Current: Assistant Vice President, Senior Compliance Officer of Ultimus Fund Solutions, LLC, since 2019. Previous: Chief Operating Officer & CCO at Miles Capital, Inc. (2013 – 2019). |
Elisabeth Dahl (1962)
Secretary, May 2017 to present; Assistant Secretary, March 2016 to May 2017 | Current: Attorney, Ultimus Fund Solutions, LLC since March 2016. |
Stephen Preston (1966)
AML Compliance Officer, May 2017 to present | Current: Vice President and Chief Compliance Officer, Ultimus Fund Solutions, LLC and Ultimus Fund Distributors, LLC, since 2011. |
Lynn E. Wood (1946)
Assistant Chief Compliance Officer, April 2021 to present; Chief Compliance Officer, October 2004 to April 2021 | Current: Managing Member, Buttonwood Compliance Partners, LLC, since 2013. |
| * | The address for each Officer is 225 Pictoria Drive, Suite 450, Cincinnati, Ohio 45246. |
Other Information (Unaudited)
The Fund’s Statement of Additional Information (“SAI”) includes additional information about the trustees and is available without charge, upon request. You may call toll-free at (800) 550-1071 to request a copy of the SAI or to make shareholder inquiries.
PRIVACY NOTICE
Rev: January 2020
| FACTS | WHAT DOES TACTICAL MULTI-PURPOSE FUND (THE “FUND”) DO WITH YOUR PERSONAL INFORMATION? |
| Why? | Financial companies choose how they share your personal information. Federal law gives consumers the right to limit some but not all sharing. Federal law also requires us to tell you how we collect, share, and protect your personal information. Please read this notice carefully to understand what we do. |
| What? | The types of personal information we collect and share depend on the product or service you have with us. This information can include: ● Social Security number ● account balances and account transactions ● transaction or loss history and purchase history When you are no longer our customer, we continue to share your information as described in this notice. |
| How? | All financial companies need to share customers’ personal information to run their everyday business. In the section below, we list the reasons financial companies can share their customers’ personal information; the reasons the Fund chooses to share; and whether you can limit this sharing. |
| Reasons we can share your personal information | Does the Fund share? | Can you limit this
sharing? |
| For our everyday business purposes— | | |
| such as to process your transactions, maintain your account(s), respond to court orders and legal investigations, or report to credit bureaus | Yes | No |
| For our marketing purposes— | | |
| to offer our products and services to you | No | We don’t share |
| For joint marketing with other financial companies | No | We don’t share |
For our affiliates’ everyday business purposes—
information about your transactions and experiences | No | We don’t share |
For our affiliates’ everyday business purposes—
information about your creditworthiness | No | We don’t share |
| For nonaffiliates to market to you | No | We don’t share |
| Questions? | Call (800) 550-1071 |
| Who we are |
| Who is providing this notice? | Tactical Multi-Purpose Fund Ultimus Fund Distributors, LLC (Distributor) Ultimus Fund Solutions, LLC (Administrator) |
| What we do |
| How does the Fund protect my personal information? | To protect your personal information from unauthorized access and use, we use security measures that comply with federal law. These measures include computer safeguards and secured files and buildings. Our service providers are held accountable for adhering to strict policies and procedures to prevent any misuse of your nonpublic personal information. |
| How does the Fund collect my personal information? | We collect your personal information, for example, when you ● open an account or deposit money ● make deposits or withdrawals from your account or provide account information We also collect your personal information from other companies. |
| Why can’t I limit all sharing? | Federal law gives you the right to limit only ● sharing for affiliates’ everyday business purposes—information about your creditworthiness ● affiliates from using your information to market to you ● sharing for nonaffiliates to market to you State laws and individual companies may give you additional rights to limit sharing. |
| Definitions | |
| Affiliates | Companies related by common ownership or control. They can be financial and nonfinancial companies. ● Fisher Asset Management, LLC, d/b/a Fisher Investments, the investment adviser to the Fund, could be deemed to be an affiliate. |
| Nonaffiliates | Companies not related by common ownership or control. They can be financial and nonfinancial companies. ● The Fund does not share your personal information with nonaffiliates so they can market to you |
| Joint marketing | A formal agreement between nonaffiliated financial companies that together market financial products or services to you.
● The Fund doesn’t jointly market. |
| | |
PROXY VOTING
A description of the policies and procedures that the Fund uses to determine how to vote proxies relating to portfolio securities and information regarding how the Fund voted those proxies during the most recent twelve month period ended June 30, are available (1) without charge upon request by calling the Fund at (800) 550-1071 and (2) in Fund documents filed with the Securities and Exchange Commission (“SEC”) on the SEC’s website at www.sec.gov.
TRUSTEES
Daniel J. Condon, Chairman
David R. Carson
Kenneth G.Y. Grant
Gary E. Hippenstiel
Freddie Jacobs, Jr.
Stephen A. Little
Catharine B. McGauley
Ronald C. Tritschler | INDEPENDENT REGISTERED PUBLIC ACCOUNTING FIRM
Cohen & Company, Ltd.
151 N Franklin Street, Suite 575
Chicago, IL 60606 |
| | |
OFFICERS
Martin R. Dean, President
Gweneth K. Gosselink, Chief Compliance Officer Zachary P. Richmond, Treasurer and Chief Financial Officer
Lynn E. Wood, Assistant Chief
Compliance Officer | LEGAL COUNSEL
Thompson Hine LLP
312 Walnut Street, 20th Floor
Cincinnati, OH 45202 |
| | |
INVESTMENT ADVISER
Fisher Asset Management, LLC
5525 NW Fisher Creek Drive
Camas, WA 98607 | CUSTODIAN
U.S. Bank, N.A.
425 Walnut Street
Cincinnati, OH 45202 |
| | |
DISTRIBUTOR
Ultimus Fund Distributors, LLC
225 Pictoria Drive, Suite 450
Cincinnati, OH 45246 | ADMINISTRATOR, TRANSFER AGENT AND FUND ACCOUNTANT
Ultimus Fund Solutions, LLC
225 Pictoria Drive, Suite 450
Cincinnati, OH 45246 |
This report is intended only for the information of shareholders or those who have received the Fund’s prospectus which contains information about the Fund’s management fee and expenses. Please read the prospectus carefully before investing.
Distributed by Ultimus Fund Distributors, LLC
Member FINRA/SIPC
FISHER INVESTMENTS INSTITUTIONAL GROUP FUND FAMILY |
Annual Report
August 31, 2022
Fisher Investments Institutional Group
Stock Fund for Retirement Plans
Fisher Investments Institutional Group
ESG Stock Fund for Retirement Plans
Fisher Investments Institutional Group
Fixed Income Fund for Retirement Plans
Fisher Investments Institutional Group
ESG Fixed Income Fund for Retirement Plans
Fund Adviser:
Fisher Asset Management, LLC
5525 NW Fisher Creek Drive,
Camas, Washington 98607
(800) 851-8845
FISHER INVESTMENTS INSTITUTIONAL GROUP
MANAGEMENT’S DISCUSSION OF FUND PERFORMANCE
(Unaudited)
Dear Shareholder:
Market Outlook
Global developed equities (MSCI World) extended their decline in Q2, ending 2022’s first half down -19.6%. Developed markets (MSCI World ex-US) hit a new low on June 17, down -22.5% since September 6, 2021’s high—past the -20% threshold commonly used to determine bear markets. Though more declines are possible in the near term, we still believe this market downturn is sentiment-driven, with a myriad of concerning headlines, from the Russia – Ukraine war to China’s COVID restrictions and elevated inflation, weighing heavily on investors’ moods. In our view, a rebound is more likely than an extended downturn, and we expect a recovery to start sooner than many anticipate.
Elevated inflation continued dominating headlines across the developed world in Q2. For instance, UK Consumer Price Index (CPI) rose 9.0% y/y in April, accelerating from March’s 7.0%, while the eurozone’s harmonized index of consumer prices (HICP) sped from 7.4% y/y in April to 8.1% in May. High prices are a burden on companies and households alike, and the war in Ukraine added supply-side price spikes—so elevated inflation may linger. But this is largely a supply issue, so despite plenty of calls for central banks to do something, monetary tools can’t resolve supply bottlenecks, reopen Chinese ports or bring energy online immediately. Moreover, elevated inflation isn’t automatically bad for equities. Last year, Europe, Australasia and Far East (EAFE), UK and eurozone were all nicely positive even as CPI accelerated throughout the year. Although sentiment may be hitting equities so far this year, we see no fundamental reason equities can’t continue overcoming inflation.
Recession fears led to value-oriented sectors—namely Materials—underperforming late in Q2, a reversal from its big outperformance in Q1. Where fears of supply shortages drove commodity prices higher earlier in the year—benefiting Materials— the sector fell on expectations for a recession to destroy demand in the near term. Other cyclical sectors and industries, including Industrials and Banks, also underperformed. In our view, there is mounting evidence that equities are pricing in a potential shallow recession—likely limiting the surprise power if this comes to pass.
Energy outperformed during Q2, but also retreated toward the end of Q2. While we think recent negative sentiment’s impact on oil prices is perhaps overdone, the late quarter decline illustrates why early-year fears of indefinitely high and rising oil prices were off base. They extrapolated a potential acute supply shortage forward without acknowledging the potential for production to rise and demand to fluctuate. For example, focus on projected shortages overlooks other sources of supply, whether
FISHER INVESTMENTS INSTITUTIONAL GROUP
MANAGEMENT’S DISCUSSION OF FUND PERFORMANCE
(Unaudited) – (continued)
from other countries (such as the US) or black and grey markets. Russian producers have found ways to work around sanctions like obscuring their oil’s origins or transferring products at sea. Additionally, it isn’t clear that Russian oil refined in third countries is subject to sanctions—a loophole refineries in India are reportedly exploiting already. In our view, supply and demand in oil markets likely will be in better balance than many believe and we don’t think a recession is likely to destroy oil demand. However, we do think oil prices are likely to stay range-bound for the foreseeable future, making Energy’s early-year run unlikely to last.
As for recession, it is possible, but data released thus far doesn’t indicate the developed world is necessarily in one already. Purchasing managers’ indexes (PMIs) for the UK, eurozone and Japan remained expansionary in June, albeit with eurozone surveys signaling slower growth. UK monthly GDP also contracted again in April, its second straight decline, although this stemmed primarily from the end of COVID testing and tracing and the vaccination drive. Yet there were also plenty of positive data, which— combined with PMIs—point to a global economy that is muddling through the extant headwinds, with pockets of strength counterbalancing the weak areas. Yet with several eurozone nations dealing with Russia’s increasingly widespread clampdown on natural gas flows—and warning of potential energy rationing this winter—recession could emerge in the months ahead. We aren’t blind to this possibility, and neither are equities, whose decline this year has coincided with escalating economic fear.
Italian equities fell -17.6% in Q2 on renewed concerns regarding the country’s debt. Italy’s 10-year government bond yields climbed past 3% in late May, and after the European Central Bank (ECB) didn’t address Italian debt at its regularly scheduled June meeting—and discussed hiking its policy rate later in the summer—the Italian 10-year BTP yield crossed over 4% seemingly tied to negative sentiment. That prompted an emergency ECB meeting on June 15 where officials discussed an “anti-fragmentation instrument” to address the divergence in eurozone nations’ borrowing costs. While details remain scant, many pundits think the ECB’s response will resemble its Outright Monetary Transactions (OMT) program along with altering the geographic breakdown of its bond portfolio. For instance, the central bank may invest the proceeds of one nation’s maturing bonds into Italian bonds.
The dialogue surrounding the ECB’s plans overstates the concerns surrounding Italian debt, in our view. The most pressing question about debt isn’t the amount outstanding but a country’s ability to service its obligations by making its interest payments. As of Q1’s end, Italy’s interest payments comprised 12.4% of tax revenues, down from around 20% during the eurozone sovereign debt crisis—and much lower than the 40% levels in the mid-1990s. As of the end of 2021, the average maturity of Italian debt was just over 7 years, so even if rates climb and stay higher, they aren’t likely
FISHER INVESTMENTS INSTITUTIONAL GROUP
MANAGEMENT’S DISCUSSION OF FUND PERFORMANCE
(Unaudited) – (continued)
to cause problems overnight. In our view, Italy offers an opportunity for uncertainty to fall, especially since the country isn’t in economic jeopardy. Since hitting 4% in mid-June, 10-year Italian bond yields have eased, ending the month at 3.29%. Should reality prove better than feared, that positive outcome can boost sentiment higher.
France’s legislative elections yielded unexpected results. President Emmanuel Macron’s Together! bloc won 245 seats, falling short of the 289 necessary for a parliamentary majority. While that wasn’t surprising, other parties’ results contrasted with poll projections. Many forecast the leftist alliance known as Nupes to benefit most from any Together! losses, but after winning just 131 seats collectively, the four parties comprising the group decided to form their own parliamentary groups rather than combine forces under leftist leader Jean-Luc Mélenchon’s France Unbowed party. The splintered leftist alliance left Marine Le Pen’s National Rally—whose parliamentary seats jumped from 8 to 89, surprising many observers—the single-largest opposition party. Since the vote, President Macron carried out a limited reshuffle of his cabinet, with no opponents joining his camp, and his minority government will have to negotiate on a bill-by-bill basis with the opposition. This doesn’t mean President Macron and the French legislature won’t pass anything, but it looks unlikely contentious items, including pension reform, will sail through. Despite the recent discussion of bills aimed at workers getting a share of dividends paid to shareholders, it is unclear whether this can pass—or if President Macron would even try. In our view, gridlock looks likely in France’s political future—an outcome equities like, as it reduces uncertainty.
Hong Kong equities only fell slightly in Q2, -1.1%, though with volatility. The special administrative region’s outperformance was likely tied to mainland developments, as China scaled back many COVID measures, including travel restrictions. Hong Kong equities likely rose late in Q2 in sympathy with mainland equities as regulators relaxed their tough approach to China’s tech sector—a source of lingering uncertainty for past 12 months. The mid-June rally also coincided with the release of May Chinese economic data, including widely watched industrial production (0.7% y/y) and retail sales (-6.7% y/y)—both better than consensus expectations. Hong Kong’s prospects are tied to the mainland, and in our view, there is room for uncertainty to fall ahead. While many focus on the possibility of new lockdowns, the government likely prioritizes economic stability ahead of autumn’s National People Congress. A return to normal—an underappreciated positive—seems to go overlooked by many.
Japanese equities fell in line with other developed markets in Q2. Headlines highlighted several stories, including the Bank of Japan’s ineffective and arguably counterproductive policy; the weak yen’s weighing on businesses and households due to expensive imported energy (and not to mention international investors’ returns);
FISHER INVESTMENTS INSTITUTIONAL GROUP
MANAGEMENT’S DISCUSSION OF FUND PERFORMANCE
(Unaudited) – (continued)
and developments ahead of July’s upper house election. However, one widely overlooked potential positive long-term development: giant industrial conglomerate Toshiba agreed to add two directors from activist hedge fund investors. Japanese conglomerates have long struggled with improving corporate governance. Though former Prime Minister Shinzo Abe implemented some reforms, change has been glacial, especially among biggest conglomerates, due largely to cross-shareholdings insulating boards from outside influence. The announcement at Toshiba is perhaps a sign of progress on that front, though it doesn’t mean a sea change is underway. We have long argued Japanese conglomerates’ resistance to corporate governance reform is a long-running structural headwind, as change would encourage creative destruction that could help free up stagnant business.
Fisher Investments Institutional Group Stock Fund for Retirement Plans
Performance Attribution
The Fisher Investments Institutional Group Stock Fund for Retirement Plans underperformed the MSCI ACWI Investable Markets Index for the one-year period ended August 31, 2022. During this period, the Fund returned -22.55% while the Fund’s primary benchmark, the MSCI ACWI Investable Markets Index, returned -16.24%. Country and sector allocation as well as equity selection detracted from relative return. An overweight to and selection within Energy was the largest contributor to relative return, driven by natural gas company ExxonMobil, oil company Chevron and petroleum refineries company Marathon Oil. Additionally, a strategic lack of exposure to Sweden contributed to fund performance, as the country underperformed the MSCI ACWI Investable Markets Index. Conversely, stock selection within United States was the largest detractor, driven by semiconductor company Nvidia, medical device company Align Technology and multinational conglomerate Alphabet. Further, an overweight to and selection within Information Technology detracted, as computer software company Adobe, semiconductor manufacturers ASML and Taiwan Semiconductor Manufacturing underperformed relative to sector peers.
Portfolio Shifts
For the period from September 1, 2021 through August 31, 2022, we significantly decreased our exposure to China. A number of headwinds have weighed on Chinese equities more than expected this year including defaults in the property sector, heightened geopolitical tensions, supply chain concerns, delisting fears as well as uncertainty surrounding China’s adherence to its zero-COVID policy. While we still hold some conviction in China, these headwinds may prove to last longer than we initially expected.
FISHER INVESTMENTS INSTITUTIONAL GROUP
MANAGEMENT’S DISCUSSION OF FUND PERFORMANCE
(Unaudited) – (continued)
Similarly, we further reduced our exposure to Consumer Discretionary as certain cyclical industries within Consumer Discretionary, such as Autos and traditional Retailing, may see headwinds from rising inflation and slowing economic growth.
Fisher Investments Institutional Group ESG Stock Fund for Retirement Plans
Performance Attribution
The Fisher Investments Institutional Group ESG Stock Fund for Retirement Plans underperformed the MSCI ACWI Investable Markets Index for the one-year period ended August 31, 2022. During this period, the Fund returned -22.03% while the Fund’s primary benchmark, the MSCI ACWI Investable Markets Index, returned -16.24%. Country and sector allocation as well as equity selection detracted from relative return. Selection within United Kingdom was the largest contributor to relative return, driven by oil & gas producer BP as well as pharmaceutical companies AstraZeneca and GSK. Additionally, a strategic lack of exposure to Sweden contributed to fund performance, as the country underperformed the MSCI ACWI Investable Markets Index. Conversely, stock selection within United States was the largest detractor, driven by semiconductor company Nvidia, medical device company Align Technology and multinational conglomerate Alphabet. Further, an overweight to and selection within Information Technology detracted, as computer software company Adobe, semiconductor manufacturers ASML and Taiwan Semiconductor Manufacturing underperformed relative to sector peers.
Portfolio Shifts
For the period from September 1, 2021 through August 31, 2022, we significantly decreased our exposure to China. A number of headwinds have weighed on Chinese equities more than expected this year including defaults in the property sector, heightened geopolitical tensions, supply chain concerns, delisting fears as well as uncertainty surrounding China’s adherence to its zero-COVID policy. While we still hold some conviction in China, these headwinds may prove to last longer than we initially expected.
Fisher Investments Institutional Group Fixed Income Fund for Retirement Plans
Performance Attribution
The Fisher Investments Institutional Group Fixed Income Fund for Retirement Plans underperformed the ICE BofA US Broad Market Index for the one-year period ended August 31, 2022. During this period, the Fund returned -12.54% while the Fund’s primary benchmark, the ICE Bank of America U.S. Broad Market Index, returned -11.52%. Moderately longer than the benchmark portfolio duration with interest
FISHER INVESTMENTS INSTITUTIONAL GROUP
MANAGEMENT’S DISCUSSION OF FUND PERFORMANCE
(Unaudited) – (continued)
rates rising was the largest detractor from relative returns in the period. However, an overweight to Corporate bonds modestly offset the detraction from duration as higher income from Corporates contributed versus the benchmark.
Portfolio Shifts
For the period from June 30, 2022 to August 31, 2022, we have decreased our exposure to investment grade Corporate bonds by 10% and increased our exposure to High Yield Corporate bonds by 10%.
Fisher Investments Institutional Group ESG Fixed Income Fund for Retirement Plans
Performance Attribution
The Fisher Investments Institutional Group ESG Fixed Income Fund for Retirement Plans underperformed the ICE BofA US Broad Market Index for the period from September 1, 2021 through August 31, 2022. During this period, the Fund returned -12.85% while the Fund’s primary benchmark, the ICE Bank of America U.S. Broad Market Index, returned -11.52%. Moderately longer than the benchmark portfolio duration with interest rates rising was the largest detractor from relative returns in the period. However, an overweight to Corporate bonds modestly offset the detraction from duration as higher income from Corporates contributed versus the benchmark.
Portfolio Shifts
For the period from June 30, 2022 to August 31, 2022, we have decreased our exposure to investment grade Corporate bonds by 10% and increased our exposure to ESG screened High Yield Corporate bonds by 10%.
FISHER INVESTMENTS INSTITUTIONAL GROUP
STOCK FUND FOR RETIREMENT PLANS
Investment Results (Unaudited)
| Average Annual Total Returns as of August 31, 2022(a) |
| | | | | | | |
| | | | | | Since | |
| | | | | | Inception | |
| | Fund/Index | | 1 Year | | (12/13/19) | |
| | Fisher Investments Institutional Group Stock Fund for Retirement Plans | | -22.55% | | 6.43% | |
| | MSCI ACWI Investable Markets Index(b) | | -16.24% | | 5.32% | |
| | | | | | | |
| | | | | | Expense | |
| | | | | | Ratios(c) | |
| | Gross | | | | 0.00% | |
| | With Applicable Waivers | | | | 0.00% | |
The performance quoted represents past performance, which does not guarantee future results. The investment return and principal value of an investment will fluctuate so that an investor’s shares, when redeemed, may be worth more or less than their original cost. The returns shown do not reflect deduction of taxes that a shareholder would pay on Fisher Investments Institutional Group Stock Fund for Retirement Plans (the “Fund”) distributions or the redemption of Fund shares. The Fund’s investment objectives, risks, charges and expenses must be considered carefully before investing. Current performance may be lower or higher than the performance quoted. Performance data current to the most recent month end may be obtained by calling (800) 851-8845.
| (a) | Return figures reflect any change in price per share and assume the reinvestment of all distributions. |
| (b) | The MSCI ACWI Investable Market Index is designed to represent performance of the full opportunity set of large and mid-cap stocks across 23 developed and 24 emerging markets. Individuals cannot invest directly in an index; however, an individual can invest in exchange traded funds or other investment vehicles that attempt to track the performance of a benchmark index. Index returns assume reinvestment of dividends and do not reflect any fees or expenses. |
| (c) | The expense ratios are from the Fund’s prospectus dated December 29, 2021. Fisher Asset Management, LLC, d/b/a Fisher Investments (the “Adviser”) pays all of the operating expenses of the Funds except portfolio transaction and other investment related costs (including brokerage fees and commissions, and fees and expenses associated with investments in derivative instruments, such as option and swap fees and expenses), taxes, borrowing costs (such as interest and dividend expense on securities sold short), extraordinary expenses, and any indirect expenses (such as fees and expenses associated with investment in acquired funds and other collective investment vehicles). The Fund is available only to eligible retirement plans receiving the Adviser’s managed account or other services. The Fund does not pay a management fee to the Adviser. Retirement plans, plan sponsors and/or plan participants pay a separate fee for the Adviser’s services and also pay fees to record keepers and administrators. If paid from plan assets, these fees will reduce the net return to plan participants but are not reflected in net fund performance. |
The Fund’s investment objective, strategies, risks, charges and expenses must be considered carefully before investing. The Fund’s prospectus contains this and other important information about the investment company and may be obtained by calling (800) 851-8845. Please read it carefully before investing.
The Fund is distributed by Ultimus Fund Distributors, LLC, Member FINRA/SIPC.
FISHER INVESTMENTS INSTITUTIONAL GROUP
STOCK FUND FOR RETIREMENT PLANS
Investment Results (Unaudited)
Comparison of the Growth of a $10,000 Investment in the Fisher Investments Institutional
Group Stock Fund for Retirement Plans and the MSCI ACWI Investable
Markets Index (Unaudited)

This graph shows the value of a hypothetical initial investment of $10,000 made on December 13, 2019 (commencement of operations) and held through August 31, 2022. The MSCI ACWI Investable Markets Index is designed to represent performance of the full opportunity set of large and mid-cap stocks across 23 developed and 24 emerging markets. THE FUND’S RETURN REPRESENTS PAST PERFORMANCE AND DOES NOT GUARANTEE OR PREDICT FUTURE RESULTS. The returns shown do not reflect deduction of taxes that a shareholder would pay on Fund distributions or the redemption of Fund shares. Investment returns and principal values will fluctuate so that an investor’s shares, when redeemed, may be worth more or less than their original cost.
Current performance may be lower or higher than the performance data quoted. For more information on the Fund, and to obtain performance data current to the most recent month-end, or to request a prospectus, please call (800) 851-8845.
You should carefully consider the investment objectives, risks, charges and expenses of the Fund before investing. The Fund’s prospectus contains this and other information about the Fund and should be read carefully before investing.
The Fund is distributed by Ultimus Fund Distributors, LLC, member FINRA/SIPC.
FISHER INVESTMENTS INSTITUTIONAL GROUP
ESG STOCK FUND FOR RETIREMENT PLANS
Investment Results (Unaudited) – (continued)
| Average Annual Total Returns as of August 31, 2022(a) |
| | | | | | | |
| | | | | | Since | |
| | | | | | Inception | |
| | Fund/Index | | 1 Year | | (12/13/19) | |
| | Fisher Investments Institutional Group ESG Stock Fund for Retirement Plans | | -22.03% | | 6.39% | |
| | MSCI ACWI Investable Markets Index(b) | | -16.24% | | 5.32% | |
| | | | | | | |
| | | | | | Expense | |
| | | | | | Ratios(c) | |
| | Gross | | | | 0.00% | |
| | With Applicable Waivers | | | | 0.00% | |
The performance quoted represents past performance, which does not guarantee future results. The investment return and principal value of an investment will fluctuate so that an investor’s shares, when redeemed, may be worth more or less than their original cost. The returns shown do not reflect deduction of taxes that a shareholder would pay on Fisher Investments Institutional Group ESG Stock Fund for Retirement Plans (the “Fund”) distributions or the redemption of Fund shares. The Fund’s investment objectives, risks, charges and expenses must be considered carefully before investing. Current performance may be lower or higher than the performance quoted. Performance data current to the most recent month end may be obtained by calling (800) 851-8845.
| (a) | Return figures reflect any change in price per share and assume the reinvestment of all distributions. |
| (b) | The MSCI ACWI Investable Markets Index is designed to represent performance of the full opportunity set of large and mid-cap stocks across 23 developed and 24 emerging markets. Individuals cannot invest directly in an index; however, an individual can invest in exchange traded funds or other investment vehicles that attempt to track the performance of a benchmark index. Index returns assume reinvestment of dividends and do not reflect any fees or expenses. |
| (c) | The expense ratios are from the Fund’s prospectus dated December 29, 2021. Fisher Asset Management, LLC, d/b/a Fisher Investments (the “Adviser”) pays all of the operating expenses of the Funds except portfolio transaction and other investment related costs (including brokerage fees and commissions, and fees and expenses associated with investments in derivative instruments, such as option and swap fees and expenses), taxes, borrowing costs (such as interest and dividend expense on securities sold short), extraordinary expenses, and any indirect expenses (such as fees and expenses associated with investment in acquired funds and other collective investment vehicles). The Fund is available only to eligible retirement plans receiving the Adviser’s managed account or other services. The Fund does not pay a management fee to the Adviser. Retirement plans, plan sponsors and/or plan participants pay a separate fee for the Adviser’s services and also pay fees to record keepers and administrators. If paid from plan assets, these fees will reduce the net return to plan participants but are not reflected in net fund performance. |
The Fund’s investment objective, strategies, risks, charges and expenses must be considered carefully before investing. The Fund’s prospectus contains this and other important information about the investment company and may be obtained by calling (800) 851-8845. Please read it carefully before investing.
The Fund is distributed by Ultimus Fund Distributors, LLC, Member FINRA/SIPC
FISHER INVESTMENTS INSTITUTIONAL GROUP
ESG STOCK FUND FOR RETIREMENT PLANS
Investment Results (Unaudited) – (continued)
Comparison of the Growth of a $10,000 Investment in the Fisher Investments
Institutional Group ESG Stock Fund for Retirement Plans and the MSCI ACWI Investable
Markets Index (Unaudited)
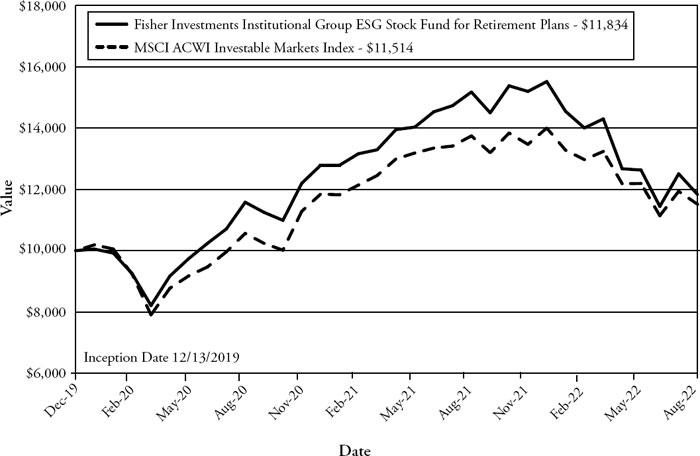
This graph shows the value of a hypothetical initial investment of $10,000 made on December 13, 2019 (commencement of operations) and held through August 31, 2022. The MSCI ACWI Investable Markets Index is designed to represent performance of the full opportunity set of large and mid-cap stocks across 23 developed and 24 emerging markets. THE FUND’S RETURN REPRESENTS PAST PERFORMANCE AND DOES NOT GUARANTEE OR PREDICT FUTURE RESULTS. The returns shown do not reflect deduction of taxes that a shareholder would pay on Fund distributions or the redemption of Fund shares. Investment returns and principal values will fluctuate so that an investor’s shares, when redeemed, may be worth more or less than their original cost.
Current performance may be lower or higher than the performance data quoted. For more information on the Fund, and to obtain performance data current to the most recent month-end, or to request a prospectus, please call (800) 851-8845.
You should carefully consider the investment objectives, risks, charges and expenses of the Fund before investing. The Fund’s prospectus contains this and other information about the Fund and should be read carefully before investing.
The Fund is distributed by Ultimus Fund Distributors, LLC, member FINRA/SIPC.
FISHER INVESTMENTS INSTITUTIONAL GROUP
FIXED INCOME FUND FOR RETIREMENT PLANS
Investment Results (Unaudited) – (continued)
| Average Annual Total Returns as of August 31, 2022(a) |
| | | | | | | |
| | | | | | Since | |
| | | | | | Inception | |
| | Fund/Index | | 1 Year | | (12/13/19) | |
| | Fisher Investments Institutional Group Fixed Income Fund for Retirement Plans | | -12.54% | | -2.14% | |
| | ICE Bank of America U.S. Broad Market Index(b) | | -11.52% | | -2.12% | |
| | | | | | | |
| | | | | | Expense | |
| | | | | | Ratios(c) | |
| | Gross | | | | 0.03% | |
| | With Applicable Waivers | | | | 0.03% | |
The performance quoted represents past performance, which does not guarantee future results. The investment return and principal value of an investment will fluctuate so that an investor’s shares, when redeemed, may be worth more or less than their original cost. The returns shown do not reflect deduction of taxes that a shareholder would pay on Fisher Investments Institutional Group Fixed Income Fund for Retirement Plans (the “Fund”) distributions or the redemption of Fund shares. The Fund’s investment objectives, risks, charges and expenses must be considered carefully before investing. Current performance may be lower or higher than the performance quoted. Performance data current to the most recent month end may be obtained by calling (800) 851-8845.
| (a) | Return figures reflect any change in price per share and assume the reinvestment of all distributions. |
| (b) | The ICE Bank of America U.S. Broad Market Index measures the performance of US dollar-denominated, investment grade debt securities, including US Treasury notes and bonds, quasi-government securities, corporate securities, residential and commercial mortgage-backed securities and asset-backed securities. Individuals cannot invest directly in an index; however, an individual can invest in exchange traded funds or other investment vehicles that attempt to track the performance of a benchmark index. Index returns assume reinvestment of dividends and do not reflect any fees or expenses. |
| (c) | The expense ratios are from the Fund’s prospectus dated December 29, 2021. Fisher Asset Management, LLC, d/b/a Fisher Investments (the “Adviser”) pays all of the operating expenses of the Fund except portfolio transaction and other investment related costs (including brokerage fees and commissions, and fees and expenses associated with investments in derivative instruments, such as option and swap fees and expenses), taxes, borrowing costs (such as interest and dividend expense on securities sold short), extraordinary expenses, and any indirect expenses (such as fees and expenses associated with investment in acquired funds and other collective investment vehicles). The Fund is available only to eligible retirement plans receiving the Adviser’s managed account or other services. The Fund does not pay a management fee to the Adviser. Retirement plans, plan sponsors and/or plan participants pay a separate fee for the Adviser’s services and also pay fees to record keepers and administrators. If paid from plan assets, these fees will reduce the net return to plan participants but are not reflected in net fund performance. |
The Fund’s investment objective, strategies, risks, charges and expenses must be considered carefully before investing. The Fund’s prospectus contains this and other important information about the investment company and may be obtained by calling (800) 851-8845. Please read it carefully before investing.
The Fund is distributed by Ultimus Fund Distributors, LLC, Member FINRA/SIPC
FISHER INVESTMENTS INSTITUTIONAL GROUP
FIXED INCOME FUND FOR RETIREMENT PLANS
Investment Results (Unaudited) – (continued)
Comparison of the Growth of a $10,000 Investment in the Fisher Investments Institutional Group
Fixed Income Fund for Retirement Plans and the ICE Bank of America U.S. Broad
Market Index (Unaudited)
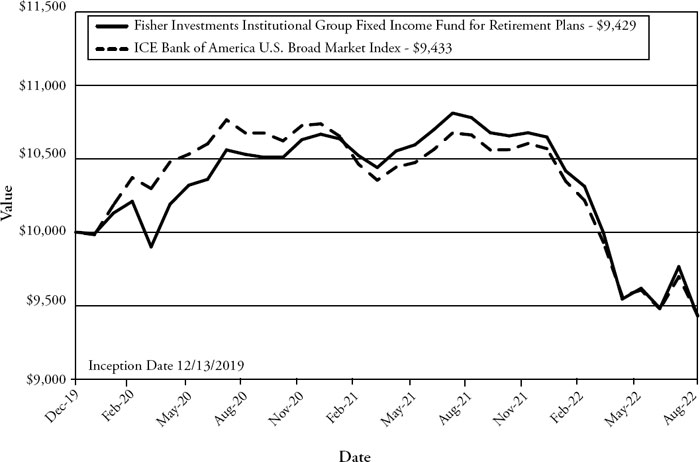
This graph shows the value of a hypothetical initial investment of $10,000 made on December 13, 2019 (commencement of operations) and held through August 31, 2022. The ICE Bank of America U.S. Broad Market Index measures the performance of U.S. dollar-denominated, investment grade debt securities, including U.S. Treasury notes and bonds, quasi-government securities, corporate securities, residential and commercial mortgage-backed securities, and asset-backed securities. THE FUND’S RETURN REPRESENTS PAST PERFORMANCE AND DOES NOT GUARANTEE OR PREDICT FUTURE RESULTS. The returns shown do not reflect deduction of taxes that a shareholder would pay on Fund distributions or the redemption of Fund shares. Investment returns and principal values will fluctuate so that an investor’s shares, when redeemed, may be worth more or less than their original cost.
Current performance may be lower or higher than the performance data quoted. For more information on the Fund, and to obtain performance data current to the most recent month-end, or to request a prospectus, please call (800) 851-8845.
You should carefully consider the investment objectives, risks, charges and expenses of the Fund before investing. The Fund’s prospectus contains this and other information about the Fund and should be read carefully before investing.
The Fund is distributed by Ultimus Fund Distributors, LLC, member FINRA/SIPC.
FISHER INVESTMENTS INSTITUTIONAL GROUP
ESG FIXED INCOME FUND FOR RETIREMENT PLANS
Investment Results (Unaudited) – (continued)
| Average Annual Total Returns as of August 31, 2022(a) |
| | | | | | | |
| | | | | | Since | |
| | | | | | Inception | |
| | Fund/Index | | 1 Year | | (12/13/19) | |
| | Fisher Investments Institutional Group ESG Fixed Income Fund for Retirement Plans | | -12.85% | | -2.36% | |
| | ICE Bank of America U.S. Broad Market Index(b) | | -11.52% | | -2.12% | |
| | | | | | | |
| | | | | | Expense | |
| | | | | | Ratios(c) | |
| | Gross | | | | 0.04% | |
| | With Applicable Waivers | | | | 0.04% | |
The performance quoted represents past performance, which does not guarantee future results. The investment return and principal value of an investment will fluctuate so that an investor’s shares, when redeemed, may be worth more or less than their original cost. The returns shown do not reflect deduction of taxes that a shareholder would pay on Fisher Investments Institutional Group ESG Fixed Income Fund for Retirement Plans (the “Fund”) distributions or the redemption of Fund shares. The Fund’s investment objectives, risks, charges and expenses must be considered carefully before investing. Current performance may be lower or higher than the performance quoted. Performance data current to the most recent month end may be obtained by calling (800) 851-8845.
| (a) | Return figures reflect any change in price per share and assume the reinvestment of all distributions. |
| (b) | The ICE Bank of America U.S. Broad Market Index measures the performance of US dollar-denominated, investment grade debt securities, including US Treasury notes and bonds, quasi-government securities, corporate securities, residential and commercial mortgage-backed securities and asset-backed securities. Individuals cannot invest directly in an index; however, an individual can invest in exchange traded funds or other investment vehicles that attempt to track the performance of a benchmark index. Index returns assume reinvestment of dividends and do not reflect any fees or expenses. |
| (c) | The expense ratios are from the Fund’s prospectus dated December 29, 2021. Fisher Asset Management, LLC, d/b/a Fisher Investments (the “Adviser”) pays all of the operating expenses of the Funds except portfolio transaction and other investment related costs (including brokerage fees and commissions, and fees and expenses associated with investments in derivative instruments, such as option and swap fees and expenses), taxes, borrowing costs (such as interest and dividend expense on securities sold short), extraordinary expenses, and any indirect expenses (such as fees and expenses associated with investment in acquired funds and other collective investment vehicles). The Fund is available only to eligible retirement plans receiving the Adviser’s managed account or other services. The Fund does not pay a management fee to the Adviser. Retirement plans, plan sponsors and/or plan participants pay a separate fee for the Adviser’s services and also pay fees to record keepers and administrators. If paid from plan assets, these fees will reduce the net return to plan participants but are not reflected in net fund performance. |
The Fund’s investment objective, strategies, risks, charges and expenses must be considered carefully before investing. The Fund’s prospectus contains this and other important information about the investment company and may be obtained by calling (800) 851-8845. Please read it carefully before investing.
The Fund is distributed by Ultimus Fund Distributors, LLC, Member FINRA/SIPC
FISHER INVESTMENTS INSTITUTIONAL GROUP
ESG FIXED INCOME FUND FOR RETIREMENT PLANS
Investment Results (Unaudited) – (continued)
Comparison of the Growth of a $10,000 Investment in the Fisher Investments Institutional Group
ESG Fixed Income Fund for Retirement Plans and the ICE Bank of America U.S. Broad Market
Index (Unaudited)
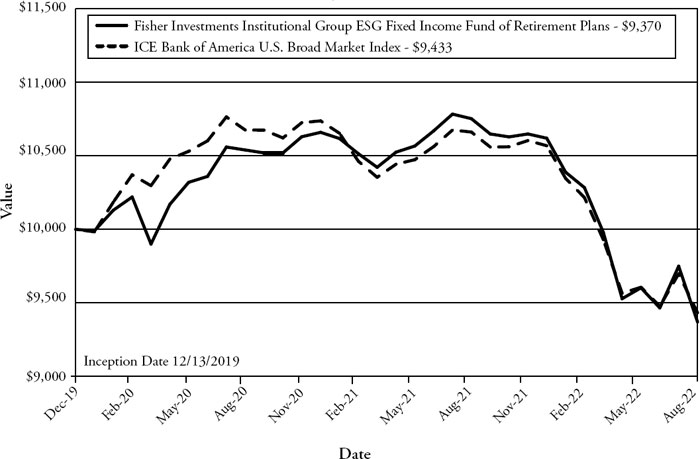
This graph shows the value of a hypothetical initial investment of $10,000 made on December 13, 2019 (commencement of operations) and held through August 31, 2022. The ICE Bank of America U.S. Broad Market Index measures the performance of U.S. dollar-denominated, investment grade debt securities, including U.S. Treasury notes and bonds, quasi-government securities, corporate securities, residential and commercial mortgage-backed securities, and asset-backed securities. THE FUND’S RETURN REPRESENTS PAST PERFORMANCE AND DOES NOT GUARANTEE OR PREDICT FUTURE RESULTS. The returns shown do not reflect deduction of taxes that a shareholder would pay on Fund distributions or the redemption of Fund shares. Investment returns and principal values will fluctuate so that an investor’s shares, when redeemed, may be worth more or less than their original cost.
Current performance may be lower or higher than the performance data quoted. For more information on the Fund, and to obtain performance data current to the most recent month-end, or to request a prospectus, please call (800) 851-8845.
You should carefully consider the investment objectives, risks, charges and expenses of the Fund before investing. The Fund’s prospectus contains this and other information about the Fund and should be read carefully before investing.
The Fund is distributed by Ultimus Fund Distributors, LLC, member FINRA/SIPC.
FISHER INVESTMENTS INSTITUTIONAL GROUP
STOCK FUND FOR RETIREMENT PLANS
Fund Holdings (Unaudited)
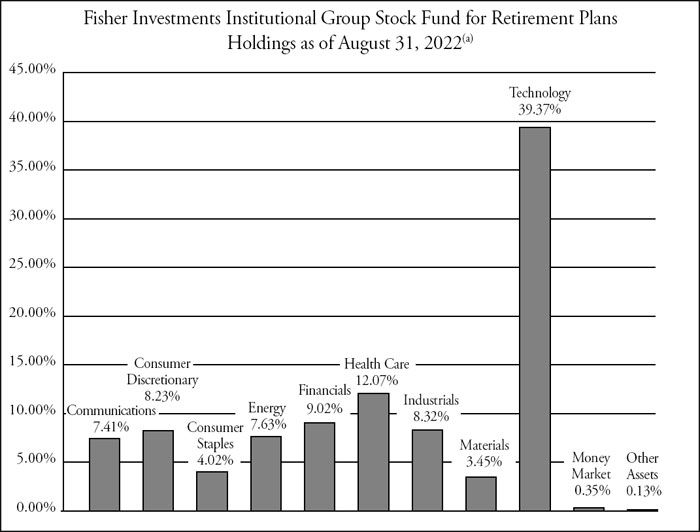
| (a) | As a percentage of net assets. |
The investment objective of Fisher Investments Institutional Group Stock Fund for Retirement Plans seeks to outperform, net of fees and expenses, the return of the MSCI ACWI Investable Markets Index.
FISHER INVESTMENTS INSTITUTIONAL GROUP
ESG STOCK FUND FOR RETIREMENT PLANS
Fund Holdings (Unaudited) – (continued)
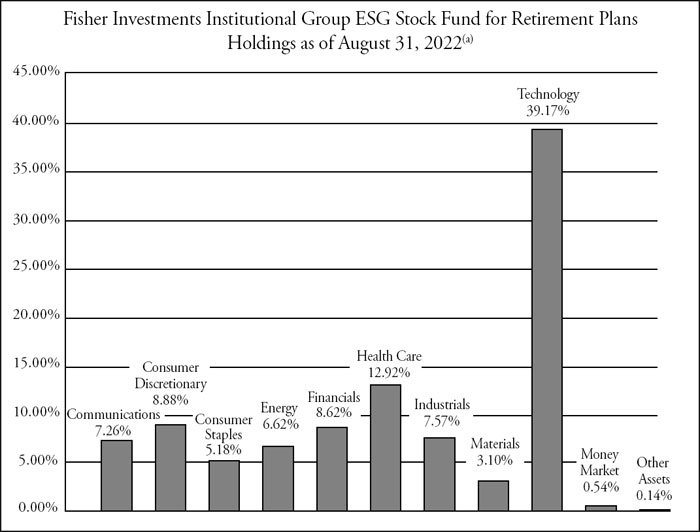
| (a) | As a percentage of net assets. |
The investment objective of the Fisher Investments Institutional Group ESG Stock Fund for Retirement Plans seeks to outperform, net of fees and expenses, the return of the MSCI ACWI Investable Markets Index.
FISHER INVESTMENTS INSTITUTIONAL GROUP
FIXED INCOME FUND FOR RETIREMENT PLANS
Fund Holdings (Unaudited) – (continued)

| (a) | As a percentage of net assets. |
The investment objective of Fisher Investments Institutional Group Fixed Income Fund for Retirement Plans seeks to outperform, net of fees and expenses, the return of the ICE Bank of America U.S. Broad Market Index.
FISHER INVESTMENTS INSTITUTIONAL GROUP
ESG FIXED INCOME FUND FOR RETIREMENT PLANS
Fund Holdings (Unaudited) – (continued)
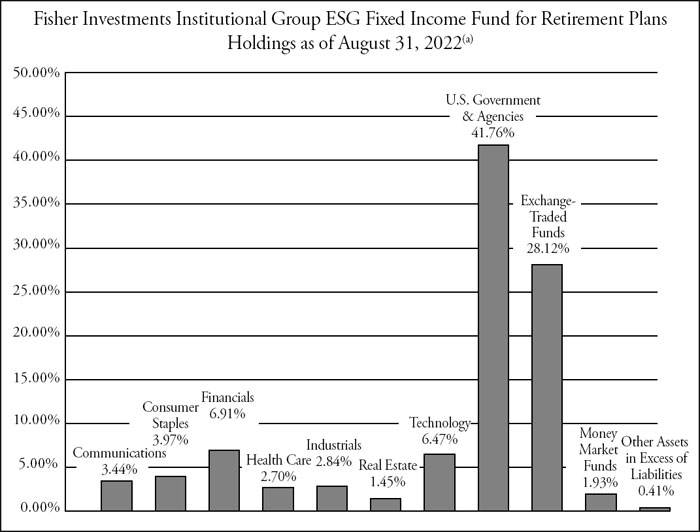
| (a) | As a percentage of net assets. |
The investment objective of Fisher Investments Institutional Group ESG Fixed Income Fund for Retirement Plans seeks to outperform, net of fees and expenses, the return of the ICE Bank of America U.S. Broad Market Index.
Availability of Portfolio Schedule (Unaudited)
The Funds file their complete schedule of portfolio holdings with the Securities and Exchange Commission (“SEC”) for the first and third quarters of each fiscal year as an exhibit to their reports on Form N-PORT. The Funds’ Form N-PORT reports are available on the SEC’s website at http://www.sec.gov.
| FISHER INVESTMENTS INSTITUTIONAL GROUP |
| STOCK FUND FOR RETIREMENT PLANS |
| SCHEDULE OF INVESTMENTS |
| August 31, 2022 |
| COMMON STOCKS — 99.52% | | Shares | | | Fair Value | |
| Argentina — 0.96% | | | | | | | | |
| Consumer Discretionary — 0.96% | | | | | | | | |
| MercadoLibre, Inc.(a) | | | 2 | | | $ | 1,711 | |
| Total Argentina | | | | | | | 1,711 | |
| | | | | | | | | |
| Australia — 1.59% | | | | | | | | |
| Energy — 0.05% | | | | | | | | |
| Woodside Energy Group Ltd. | | | 4 | | | | 94 | |
| | | | | | | | | |
| Materials — 1.54% | | | | | | | | |
| BHP Group Ltd. | | | 26 | | | | 722 | |
| OZ Minerals Ltd. | | | 77 | | | | 1,354 | |
| Rio Tinto Ltd. | | | 10 | | | | 647 | |
| | | | | | | | 2,723 | |
| Total Australia | | | | | | | 2,817 | |
| | | | | | | | | |
| Brazil — 0.27% | | | | | | | | |
| Materials — 0.27% | | | | | | | | |
| Vale SA - ADR | | | 38 | | | | 472 | |
| Total Brazil | | | | | | | 472 | |
| | | | | | | | | |
| Canada — 1.33% | | | | | | | | |
| Industrials — 0.84% | | | | | | | | |
| Canadian Pacific Railway Ltd. | | | 20 | | | | 1,497 | |
| | | | | | | | | |
| Materials — 0.49% | | | | | | | | |
| Hudbay Minerals, Inc. | | | 90 | | | | 396 | |
| Lundin Mining Corp. | | | 93 | | | | 484 | |
| | | | | | | | 880 | |
| Total Canada | | | | | | | 2,377 | |
| | | | | | | | | |
| China — 0.88% | | | | | | | | |
| Communications — 0.56% | | | | | | | | |
| Tencent Holdings Ltd. - ADR | | | 24 | | | | 991 | |
See accompanying notes which are an integral part of these financial statements.
| FISHER INVESTMENTS INSTITUTIONAL GROUP |
| STOCK FUND FOR RETIREMENT PLANS |
| SCHEDULE OF INVESTMENTS – (continued) |
| August 31, 2022 |
| COMMON STOCKS — 99.52% - continued | | Shares | | | Fair Value | |
| China — 0.88% - continued | | | | | | | | |
| Consumer Discretionary — 0.32% | | | | | | | | |
| Alibaba Group Holding Ltd. - ADR(a) | | | 6 | | | $ | 572 | |
| Total China | | | | | | | 1,563 | |
| | | | | | | | | |
| France — 4.75% | | | | | | | | |
| Consumer Discretionary — 0.99% | | | | | | | | |
| Kering SA - ADR | | | 35 | | | | 1,758 | |
| | | | | | | | | |
| Energy — 1.00% | | | | | | | | |
| TotalEnergies SE | | | 35 | | | | 1,782 | |
| | | | | | | | | |
| Financials — 0.60% | | | | | | | | |
| BNP Paribas SA | | | 23 | | | | 1,074 | |
| | | | | | | | | |
| Health Care — 0.42% | | | | | | | | |
| Sanofi | | | 9 | | | | 743 | |
| | | | | | | | | |
| Technology — 1.74% | | | | | | | | |
| Dassault Systems SE | | | 80 | | | | 3,100 | |
| Total France | | | | | | | 8,457 | |
| | | | | | | | | |
| Germany — 2.43% | | | | | | | | |
| Consumer Discretionary — 1.59% | | | | | | | | |
| adidas AG | | | 7 | | | | 1,043 | |
| Daimler AG | | | 21 | | | | 1,184 | |
| Sixt SE | | | 6 | | | | 587 | |
| | | | | | | | 2,814 | |
| Industrials — 0.84% | | | | | | | | |
| MTU Aero Engines AG | | | 3 | | | | 530 | |
| Siemens AG | | | 9 | | | | 914 | |
| Siemens Energy AG | | | 4 | | | | 59 | |
| | | | | | | | 1,503 | |
| Total Germany | | | | | | | 4,317 | |
See accompanying notes which are an integral part of these financial statements.
| FISHER INVESTMENTS INSTITUTIONAL GROUP |
| STOCK FUND FOR RETIREMENT PLANS |
| SCHEDULE OF INVESTMENTS – (continued) |
| August 31, 2022 |
| COMMON STOCKS — 99.52% - continued | | Shares | | | Fair Value | |
| Hong Kong — 0.43% | | | | | | | | |
| Health Care — 0.43% | | | | | | | | |
| Sino Biopharmaceutical Ltd. - ADR | | | 75 | | | $ | 769 | |
| Total Hong Kong | | | | | | | 769 | |
| | | | | | | | | |
| India — 0.67% | | | | | | | | |
| Technology — 0.67% | | | | | | | | |
| Infosys Ltd. - ADR | | | 65 | | | | 1,190 | |
| Total India | | | | | | | 1,190 | |
| | | | | | | | | |
| Italy — 0.88% | | | | | | | | |
| Energy — 0.50% | | | | | | | | |
| Eni SpA | | | 75 | | | | 890 | |
| | | | | | | | | |
| Financials — 0.38% | | | | | | | | |
| Intesa Sanpaolo SpA | | | 390 | | | | 675 | |
| Total Italy | | | | | | | 1,565 | |
| | | | | | | | | |
| Japan — 3.23% | | | | | | | | |
| Industrials — 3.23% | | | | | | | | |
| Daifuku Co. Ltd - ADR | | | 42 | | | | 614 | |
| FANUC Corp. - ADR | | | 99 | | | | 1,592 | |
| SMC Corp. - ADR | | | 98 | | | | 2,334 | |
| Yaskawa Electric Corp. - ADR | | | 18 | | | | 1,179 | |
| | | | | | | | 5,719 | |
| Total Japan | | | | | | | 5,719 | |
| | | | | | | | | |
| Korea (Republic Of) — 2.29% | | | | | | | | |
| Financials — 0.44% | | | | | | | | |
| KB Financial Group, Inc. | | | 21 | | | | 773 | |
| | | | | | | | | |
| Technology — 1.85% | | | | | | | | |
| Samsung Electronics Co. Ltd. - GDR | | | 3 | | | | 3,287 | |
| Total Korea (Republic Of) | | | | | | | 4,060 | |
See accompanying notes which are an integral part of these financial statements.
| FISHER INVESTMENTS INSTITUTIONAL GROUP |
| STOCK FUND FOR RETIREMENT PLANS |
| SCHEDULE OF INVESTMENTS – (continued) |
| August 31, 2022 |
| COMMON STOCKS — 99.52% - continued | | Shares | | | Fair Value | |
| Netherlands — 2.65% | | | | | | | | |
| Financials — 0.46% | | | | | | | | |
| ING Groep NV | | | 93 | | | $ | 819 | |
| | | | | | | | | |
| Technology — 2.19% | | | | | | | | |
| ASML Holding NV | | | 8 | | | | 3,894 | |
| Total Netherlands | | | | | | | 4,713 | |
| | | | | | | | | |
| Spain — 0.63% | | | | | | | | |
| Financials — 0.63% | | | | | | | | |
| Banco Bilbao Vizcaya Argentaria SA | | | 142 | | | | 641 | |
| Banco Santander SA | | | 198 | | | | 481 | |
| | | | | | | | 1,122 | |
| Total Spain | | | | | | | 1,122 | |
| | | | | | | | | |
| Switzerland — 0.82% | | | | | | | | |
| Health Care — 0.82% | | | | | | | | |
| Novartis AG | | | 18 | | | | 1,457 | |
| Total Switzerland | | | | | | | 1,457 | |
| | | | | | | | | |
| Taiwan Province Of China — 3.19% | | | | | | | | |
| Technology — 3.19% | | | | | | | | |
| Taiwan Semiconductor Manufacturing Co. Ltd. - ADR | | | 68 | | | | 5,668 | |
| Total Taiwan Province Of China | | | | | | | 5,668 | |
| | | | | | | | | |
| United Kingdom — 2.68% | | | | | | | | |
| Consumer Staples — 0.07% | | | | | | | | |
| Haleon PLC(a) | | | 44 | | | | 132 | |
| | | | | | | | | |
| Energy — 1.45% | | | | | | | | |
| BP PLC | | | 148 | | | | 759 | |
| Shell PLC | | | 68 | | | | 1,807 | |
| | | | | | | | 2,566 | |
See accompanying notes which are an integral part of these financial statements.
| FISHER INVESTMENTS INSTITUTIONAL GROUP |
| STOCK FUND FOR RETIREMENT PLANS |
| SCHEDULE OF INVESTMENTS – (continued) |
| August 31, 2022 |
| COMMON STOCKS — 99.52% - continued | | Shares | | | Fair Value | |
| United Kingdom — 2.68% - continued | | | | | | | | |
| Health Care — 1.16% | | | | | | | | |
| AstraZeneca PLC | | | 12 | | | $ | 1,484 | |
| GlaxoSmithKline PLC | | | 35 | | | | 561 | |
| | | | | | | | 2,045 | |
| Total United Kingdom | | | | | | | 4,743 | |
| | | | | | | | | |
| United States — 69.85% | | | | | | | | |
| Communications — 6.85% | | | | | | | | |
| Alphabet, Inc., Class A(a) | | | 80 | | | | 8,658 | |
| Meta Platforms, Inc., Class A(a) | | | 11 | | | | 1,792 | |
| Netflix, Inc.(a) | | | 4 | | | | 894 | |
| Uber Technologies, Inc.(a) | | | 29 | | | | 834 | |
| | | | | | | | 12,178 | |
| Consumer Discretionary — 4.37% | | | | | | | | |
| Amazon.com, Inc.(a) | | | 43 | | | | 5,450 | |
| Home Depot, Inc. (The) | | | 8 | | | | 2,308 | |
| | | | | | | | 7,758 | |
| Consumer Staples — 3.95% | | | | | | | | |
| Costco Wholesale Corp. | | | 10 | | | | 5,221 | |
| Procter & Gamble Co. (The) | | | 13 | | | | 1,794 | |
| | | | | | | | 7,015 | |
| Energy — 4.63% | | | | | | | | |
| Chevron Corp. | | | 15 | | | | 2,371 | |
| Exxon Mobil Corp. | | | 25 | | | | 2,389 | |
| Marathon Oil Corp. | | | 64 | | | | 1,638 | |
| Schlumberger Ltd. | | | 48 | | | | 1,831 | |
| | | | | | | | 8,229 | |
| Financials — 6.51% | | | | | | | | |
| American Express Co. | | | 13 | | | | 1,976 | |
| BlackRock, Inc. | | | 4 | | | | 2,666 | |
| Goldman Sachs Group, Inc. (The) | | | 5 | | | | 1,663 | |
| JPMorgan Chase & Co. | | | 14 | | | | 1,591 | |
| Morgan Stanley | | | 29 | | | | 2,472 | |
| T. Rowe Price Group, Inc. | | | 10 | | | | 1,200 | |
| | | | | | | | 11,568 | |
See accompanying notes which are an integral part of these financial statements.
| FISHER INVESTMENTS INSTITUTIONAL GROUP |
| STOCK FUND FOR RETIREMENT PLANS |
| SCHEDULE OF INVESTMENTS – (continued) |
| August 31, 2022 |
| COMMON STOCKS — 99.52% - continued | | Shares | | | Fair Value | |
| United States — 69.85% - continued | | | | | | | | |
| Health Care — 9.24% | | | | | | | | |
| Abbott Laboratories | | | 9 | | | $ | 924 | |
| Align Technology, Inc.(a) | | | 7 | | | | 1,705 | |
| Danaher Corp. | | | 5 | | | | 1,350 | |
| Edwards LifeSciences Corp.(a) | | | 9 | | | | 811 | |
| Eli Lilly & Co. | | | 14 | | | | 4,216 | |
| Exact Sciences Corp.(a) | | | 14 | | | | 498 | |
| Intuitive Surgical, Inc.(a) | | | 9 | | | | 1,851 | |
| Merck & Co., Inc. | | | 17 | | | | 1,451 | |
| PTC Therapeutics, Inc.(a) | | | 15 | | | | 749 | |
| Sarepta Therapeutics, Inc.(a) | | | 5 | | | | 547 | |
| Stryker Corp. | | | 6 | | | | 1,231 | |
| Thermo Fisher Scientific, Inc. | | | 2 | | | | 1,091 | |
| | | | | | | | 16,424 | |
| Industrials — 3.41% | | | | | | | | |
| AeroVironment, Inc.(a) | | | 14 | | | | 1,241 | |
| Boeing Co. (The)(a) | | | 5 | | | | 801 | |
| Carrier Global Corp. | | | 6 | | | | 235 | |
| Cummins, Inc. | | | 4 | | | | 861 | |
| Deere & Co. | | | 4 | | | | 1,461 | |
| Otis Worldwide Corp. | | | 3 | | | | 217 | |
| Raytheon Technologies Corp. | | | 6 | | | | 539 | |
| Rockwell Automation, Inc. | | | 3 | | | | 710 | |
| | | | | | | | 6,065 | |
| Materials — 1.16% | | | | | | | | |
| Cleveland-Cliffs, Inc.(a) | | | 69 | | | | 1,192 | |
| Materion Corp. | | | 10 | | | | 863 | |
| | | | | | | | 2,055 | |
| Technology — 29.73% | | | | | | | | |
| Adobe, Inc.(a) | | | 10 | | | | 3,734 | |
| Advanced Micro Devices, Inc.(a) | | | 17 | | | | 1,443 | |
| Apple, Inc. | | | 72 | | | | 11,319 | |
| Autodesk, Inc.(a) | | | 9 | | | | 1,816 | |
| Block, Inc., Class A(a) | | | 12 | | | | 827 | |
| DocuSign, Inc.(a) | | | 15 | | | | 873 | |
| Intuit, Inc. | | | 2 | | | | 864 | |
See accompanying notes which are an integral part of these financial statements.
| FISHER INVESTMENTS INSTITUTIONAL GROUP |
| STOCK FUND FOR RETIREMENT PLANS |
| SCHEDULE OF INVESTMENTS – (continued) |
| August 31, 2022 |
| COMMON STOCKS — 99.52% - continued | | Shares | | | Fair Value | |
| United States — 69.85% - continued | | | | | | | | |
| Technology — 29.73% - continued | | | | | | | | |
| MasterCard, Inc., Class A | | | 10 | | | $ | 3,243 | |
| Microsoft Corp. | | | 37 | | | | 9,675 | |
| NVIDIA Corp. | | | 44 | | | | 6,641 | |
| Oracle Corp. | | | 42 | | | | 3,114 | |
| Paycom Software, Inc.(a) | | | 6 | | | | 2,107 | |
| PayPal Holdings, Inc.(a) | | | 13 | | | | 1,215 | |
| salesforce.com, Inc.(a) | | | 16 | | | | 2,498 | |
| ServiceNow, Inc.(a) | | | 2 | | | | 869 | |
| Visa, Inc., Class A | | | 10 | | | | 1,987 | |
| Zoom Video Communications, Inc., Class A(a) | | | 7 | | | | 563 | |
| | | | | | | | 52,788 | |
| Total United States | | | | | | | 124,080 | |
| | | | | | | | | |
| Total Common Stocks (Cost $154,465) | | | | | | | 176,800 | |
| | | | | | | | | |
| MONEY MARKET FUNDS — 0.35% | | | | | | | | |
| First American Government Obligations Fund, Class X, 2.04%(b) | | | 625 | | | | 625 | |
| | | | | | | | | |
| Total Money Market Funds (Cost $625) | | | | | | | 625 | |
| | | | | | | | | |
| Total Investments — 99.87% (Cost $155,090) | | | | | | | 177,425 | |
| | | | | | | | | |
| Other Assets in Excess of Liabilities — 0.13% | | | | | | | 236 | |
| | | | | | | | | |
| NET ASSETS — 100.00% | | | | | | $ | 177,661 | |
| (a) | Non-income producing security. |
| (b) | Rate disclosed is the seven day effective yield as of August 31, 2022. |
ADR - American Depositary Receipt
GDR - Global Depositary Receipt
See accompanying notes which are an integral part of these financial statements.
| FISHER INVESTMENTS INSTITUTIONAL GROUP |
| ESG STOCK FUND FOR RETIREMENT PLANS |
| SCHEDULE OF INVESTMENTS |
| August 31, 2022 |
| COMMON STOCKS — 99.32% | | Shares | | | Fair Value | |
| Argentina — 0.96% | | | | | | | | |
| Consumer Discretionary — 0.96% | | | | | | | | |
| MercadoLibre, Inc.(a) | | | 2 | | | $ | 1,711 | |
| Total Argentina | | | | | | | 1,711 | |
| | | | | | | | | |
| Australia — 1.49% | | | | | | | | |
| Materials — 1.49% | | | | | | | | |
| OZ Minerals Ltd. | | | 70 | | | | 1,232 | |
| Rio Tinto Ltd. | | | 22 | | | | 1,422 | |
| Total Australia | | | | | | | 2,654 | |
| | | | | | | | | |
| Canada — 1.01% | | | | | | | | |
| Industrials — 0.72% | | | | | | | | |
| Canadian Pacific Railway Ltd. | | | 17 | | | | 1,273 | |
| | | | | | | | | |
| Materials — 0.29% | | | | | | | | |
| Lundin Mining Corp. | | | 100 | | | | 520 | |
| Total Canada | | | | | | | 1,793 | |
| | | | | | | | | |
| China — 0.76% | | | | | | | | |
| Communications — 0.44% | | | | | | | | |
| Tencent Holdings Ltd. - ADR | | | 19 | | | | 785 | |
| | | | | | | | | |
| Consumer Discretionary — 0.32% | | | | | | | | |
| Alibaba Group Holding Ltd. - ADR(a) | | | 6 | | | | 572 | |
| Total China | | | | | | | 1,357 | |
| | | | | | | | | |
| Colombia — 0.67% | | | | | | | | |
| Energy — 0.67% | | | | | | | | |
| Ecopetrol SA - ADR | | | 116 | | | | 1,196 | |
| Total Colombia | | | | | | | 1,196 | |
| | | | | | | | | |
| France — 3.81% | | | | | | | | |
| Consumer Discretionary — 0.94% | | | | | | | | |
| Kering SA - ADR | | | 33 | | | | 1,658 | |
| | | | | | | | | |
| Financials — 0.61% | | | | | | | | |
| BNP Paribas SA | | | 23 | | | | 1,074 | |
See accompanying notes which are an integral part of these financial statements.
| FISHER INVESTMENTS INSTITUTIONAL GROUP |
| ESG STOCK FUND FOR RETIREMENT PLANS |
| SCHEDULE OF INVESTMENTS – (continued) |
| August 31, 2022 |
| COMMON STOCKS — 99.32% - continued | | Shares | | | Fair Value | |
| France — 3.81% - continued | | | | | | | | |
| Health Care — 0.51% | | | | | | | | |
| Sanofi | | | 11 | | | $ | 908 | |
| | | | | | | | | |
| Technology — 1.75% | | | | | | | | |
| Dassault Systems SE | | | 80 | | | | 3,100 | |
| Total France | | | | | | | 6,740 | |
| | | | | | | | | |
| Germany — 2.46% | | | | | | | | |
| Consumer Discretionary — 1.80% | | | | | | | | |
| adidas AG | | | 8 | | | | 1,191 | |
| Sixt SE | | | 6 | | | | 587 | |
| Volkswagen AG | | | 10 | | | | 1,428 | |
| | | | | | | | 3,206 | |
| Industrials — 0.66% | | | | | | | | |
| Siemens AG | | | 11 | | | | 1,117 | |
| Siemens Energy AG | | | 4 | | | | 59 | |
| | | | | | | | 1,176 | |
| Total Germany | | | | | | | 4,382 | |
| | | | | | | | | |
| Hong Kong — 0.44% | | | | | | | | |
| Health Care — 0.44% | | | | | | | | |
| Sino Biopharmaceutical Ltd. - ADR | | | 76 | | | | 779 | |
| Total Hong Kong | | | | | | | 779 | |
| | | | | | | | | |
| India — 0.48% | | | | | | | | |
| Technology — 0.48% | | | | | | | | |
| Infosys Ltd. - ADR | | | 47 | | | | 860 | |
| Total India | | | | | | | 860 | |
| | | | | | | | | |
| Italy — 0.78% | | | | | | | | |
| Energy — 0.41% | | | | | | | | |
| Eni SpA | | | 61 | | | | 723 | |
See accompanying notes which are an integral part of these financial statements.
| FISHER INVESTMENTS INSTITUTIONAL GROUP |
| ESG STOCK FUND FOR RETIREMENT PLANS |
| SCHEDULE OF INVESTMENTS – (continued) |
| August 31, 2022 |
| COMMON STOCKS — 99.32% - continued | | Shares | | | Fair Value | |
| Italy — 0.78% - continued | | | | | | | | |
| Financials — 0.37% | | | | | | | | |
| Intesa Sanpaolo SpA | | | 380 | | | $ | 658 | |
| Total Italy | | | | | | | 1,381 | |
| | | | | | | | | |
| Japan — 2.18% | | | | | | | | |
| Industrials — 2.18% | | | | | | | | |
| Daifuku Co. Ltd - ADR | | | 43 | | | | 628 | |
| FANUC Corp. - ADR | | | 92 | | | | 1,479 | |
| Yaskawa Electric Corp. - ADR | | | 27 | | | | 1,770 | |
| | | | | | | | 3,877 | |
| Total Japan | | | | | | | 3,877 | |
| | | | | | | | | |
| Korea (Republic Of) — 1.71% | | | | | | | | |
| Financials — 0.48% | | | | | | | | |
| KB Financial Group, Inc. | | | 23 | | | | 847 | |
| | | | | | | | | |
| Technology — 1.23% | | | | | | | | |
| Samsung Electronics Co. Ltd. - GDR | | | 2 | | | | 2,191 | |
| Total Korea (Republic Of) | | | | | | | 3,038 | |
| | | | | | | | | |
| Netherlands — 2.19% | | | | | | | | |
| Technology — 2.19% | | | | | | | | |
| ASML Holding NV | | | 8 | | | | 3,894 | |
| Total Netherlands | | | | | | | 3,894 | |
| | | | | | | | | |
| Spain — 1.50% | | | | | | | | |
| Energy — 0.87% | | | | | | | | |
| Repsol SA | | | 119 | | | | 1,552 | |
| | | | | | | | | |
| Financials — 0.63% | | | | | | | | |
| Banco Bilbao Vizcaya Argentaria SA | | | 137 | | | | 618 | |
| Banco Santander SA | | | 208 | | | | 505 | |
| | | | | | | | 1,123 | |
| Total Spain | | | | | | | 2,675 | |
See accompanying notes which are an integral part of these financial statements.
| FISHER INVESTMENTS INSTITUTIONAL GROUP |
| ESG STOCK FUND FOR RETIREMENT PLANS |
| SCHEDULE OF INVESTMENTS – (continued) |
| August 31, 2022 |
| COMMON STOCKS — 99.32% - continued | | Shares | | | Fair Value | |
| Switzerland — 0.64% | | | | | | | | |
| Industrials — 0.64% | | | | | | | | |
| ABB Ltd. | | | 41 | | | $ | 1,131 | |
| Total Switzerland | | | | | | | 1,131 | |
| | | | | | | | | |
| Taiwan Province Of China — 3.15% | | | | | | | | |
| Technology — 3.15% | | | | | | | | |
| Taiwan Semiconductor Manufacturing Co. Ltd. - ADR | | | 67 | | | | 5,584 | |
| Total Taiwan Province Of China | | | | | | | 5,584 | |
| | | | | | | | | |
| United Kingdom — 3.44% | | | | | | | | |
| Consumer Staples — 0.67% | | | | | | | | |
| Unilever PLC | | | 26 | | | | 1,186 | |
| | | | | | | | | |
| Energy — 1.38% | | | | | | | | |
| BP PLC | | | 479 | | | | 2,456 | |
| | | | | | | | | |
| Health Care — 0.84% | | | | | | | | |
| AstraZeneca PLC | | | 12 | | | | 1,484 | |
| | | | | | | | | |
| Materials — 0.55% | | | | | | | | |
| Antofagasta PLC | | | 76 | | | | 972 | |
| Total United Kingdom | | | | | | | 6,098 | |
| | | | | | | | | |
| United States — 71.64% | | | | | | | | |
| Communications — 6.82% | | | | | | | | |
| Alphabet, Inc., Class A(a) | | | 80 | | | | 8,658 | |
| Meta Platforms, Inc., Class A(a) | | | 11 | | | | 1,792 | |
| Netflix, Inc.(a) | | | 4 | | | | 894 | |
| Uber Technologies, Inc.(a) | | | 26 | | | | 748 | |
| | | | | | | | 12,092 | |
| Consumer Discretionary — 4.86% | | | | | | | | |
| Amazon.com, Inc.(a) | | | 43 | | | | 5,450 | |
| Home Depot, Inc. (The) | | | 8 | | | | 2,308 | |
| NIKE, Inc., Class B | | | 8 | | | | 852 | |
| | | | | | | | 8,610 | |
See accompanying notes which are an integral part of these financial statements.
FISHER INVESTMENTS INSTITUTIONAL GROUP
ESG STOCK FUND FOR RETIREMENT PLANS
SCHEDULE OF INVESTMENTS – (continued) |
| August 31, 2022 |
| COMMON STOCKS — 99.32% - continued | | Shares | | | Fair Value | |
| United States — 71.64% - continued | | | | | | | | |
| Consumer Staples — 4.51% | | | | | | | | |
| Costco Wholesale Corp. | | | 8 | | | $ | 4,176 | |
| PepsiCo, Inc. | | | 11 | | | | 1,895 | |
| Procter & Gamble Co. (The) | | | 14 | | | | 1,932 | |
| | | | | | | | 8,003 | |
| Energy — 3.29% | | | | | | | | |
| Exxon Mobil Corp. | | | 45 | | | | 4,302 | |
| Schlumberger Ltd. | | | 40 | | | | 1,526 | |
| | | | | | | | 5,828 | |
| Financials — 6.53% | | | | | | | | |
| American Express Co. | | | 14 | | | | 2,128 | |
| BlackRock, Inc. | | | 4 | | | | 2,666 | |
| Goldman Sachs Group, Inc. (The) | | | 5 | | | | 1,663 | |
| JPMorgan Chase & Co. | | | 14 | | | | 1,592 | |
| Morgan Stanley | | | 26 | | | | 2,216 | |
| T. Rowe Price Group, Inc. | | | 11 | | | | 1,320 | |
| | | | | | | | 11,585 | |
| Health Care — 11.13% | | | | | | | | |
| Abbott Laboratories | | | 9 | | | | 924 | |
| Align Technology, Inc.(a) | | | 7 | | | | 1,706 | |
| Danaher Corp. | | | 5 | | | | 1,350 | |
| Edwards LifeSciences Corp.(a) | | | 9 | | | | 811 | |
| Eli Lilly & Co. | | | 16 | | | | 4,819 | |
| Exact Sciences Corp.(a) | | | 17 | | | | 604 | |
| Intuitive Surgical, Inc.(a) | | | 9 | | | | 1,852 | |
| Merck & Co., Inc. | | | 19 | | | | 1,622 | |
| PTC Therapeutics, Inc.(a) | | | 14 | | | | 699 | |
| Sarepta Therapeutics, Inc.(a) | | | 5 | | | | 547 | |
| Stryker Corp. | | | 6 | | | | 1,231 | |
| Thermo Fisher Scientific, Inc. | | | 4 | | | | 2,181 | |
| Vertex Pharmaceuticals, Inc.(a) | | | 5 | | | | 1,409 | |
| | | | | | | | 19,755 | |
| Industrials — 3.37% | | | | | | | | |
| Cummins, Inc. | | | 4 | | | | 861 | |
| Deere & Co. | | | 4 | | | | 1,461 | |
| HEICO Corp. | | | 10 | | | | 1,523 | |
See accompanying notes which are an integral part of these financial statements.
| FISHER INVESTMENTS INSTITUTIONAL GROUP |
| ESG STOCK FUND FOR RETIREMENT PLANS |
| SCHEDULE OF INVESTMENTS – (continued) |
| August 31, 2022 |
| COMMON STOCKS — 99.32% - continued | | Shares | | | Fair Value | |
| United States — 71.64% - continued | | | | | | | | |
| Industrials — 3.37% - continued | | | | | | | | |
| Rockwell Automation, Inc. | | | 9 | | | $ | 2,132 | |
| | | | | | | | 5,977 | |
| Materials — 0.76% | | | | | | | | |
| Cleveland-Cliffs, Inc.(a) | | | 78 | | | | 1,347 | |
| | | | | | | | | |
| Technology — 30.37% | | | | | | | | |
| Adobe, Inc.(a) | | | 10 | | | | 3,734 | |
| Advanced Micro Devices, Inc.(a) | | | 19 | | | | 1,613 | |
| Apple, Inc. | | | 76 | | | | 11,949 | |
| Autodesk, Inc.(a) | | | 7 | | | | 1,412 | |
| Block, Inc., Class A(a) | | | 12 | | | | 827 | |
| DocuSign, Inc.(a) | | | 12 | | | | 699 | |
| Intuit, Inc. | | | 2 | | | | 864 | |
| MasterCard, Inc., Class A | | | 9 | | | | 2,919 | |
| Microsoft Corp. | | | 37 | | | | 9,674 | |
| NVIDIA Corp. | | | 44 | | | | 6,642 | |
| Oracle Corp. | | | 45 | | | | 3,337 | |
| Paycom Software, Inc.(a) | | | 6 | | | | 2,107 | |
| PayPal Holdings, Inc.(a) | | | 12 | | | | 1,121 | |
| salesforce.com, Inc.(a) | | | 17 | | | | 2,654 | |
| ServiceNow, Inc.(a) | | | 2 | | | | 869 | |
| Visa, Inc., Class A | | | 15 | | | | 2,981 | |
| Zoom Video Communications, Inc., Class A(a) | | | 6 | | | | 482 | |
| | | | | | | | 53,884 | |
| Total United States | | | | | | | 127,081 | |
| | | | | | | | | |
| Total Common Stocks (Cost $153,475) | | | | | | | 176,231 | |
See accompanying notes which are an integral part of these financial statements.
| FISHER INVESTMENTS INSTITUTIONAL GROUP |
| ESG STOCK FUND FOR RETIREMENT PLANS |
| SCHEDULE OF INVESTMENTS – (continued) |
| August 31, 2022 |
| MONEY MARKET FUNDS — 0.54% | | Shares | | | Fair Value | |
| First American Government Obligations Fund, Class X, 2.04%(b) | | | 955 | | | $ | 955 | |
| | | | | | | | | |
| Total Money Market Funds (Cost $955) | | | | | | | 955 | |
| | | | | | | | | |
| Total Investments — 99.86% (Cost $154,430) | | | | | | | 177,186 | |
| | | | | | | | | |
| Other Assets in Excess of Liabilities — 0.14% | | | | | | | 255 | |
| | | | | | | | | |
| NET ASSETS — 100.00% | | | | | | $ | 177,441 | |
| (a) | Non-income producing security. |
| (b) | Rate disclosed is the seven day effective yield as of August 31, 2022. |
ADR - American Depositary Receipt
GDR - Global Depositary Receipt
See accompanying notes which are an integral part of these financial statements.
| FISHER INVESTMENTS INSTITUTIONAL GROUP |
| FIXED INCOME FUND FOR RETIREMENT PLANS |
| SCHEDULE OF INVESTMENTS |
| August 31, 2022 |
| | | Principal | | | | |
| CORPORATE BONDS — 27.62% | | Amount | | | Fair Value | |
| Communications — 3.42% | | | | | | | | |
| Comcast Corp., 3.55%, 5/1/2028 | | $ | 100,000 | | | $ | 96,715 | |
| | | | | | | | | |
| Consumer Staples — 3.95% | | | | | | | | |
| Procter & Gamble Co. (The), 5.50%, 2/1/2034 | | | 100,000 | | | | 111,583 | |
| | | | | | | | | |
| Financials — 6.86% | | | | | | | | |
| BlackRock, Inc., 3.25%, 4/30/2029 | | | 100,000 | | | | 95,304 | |
| JPMorgan Chase & Co., 4.13%, 12/15/2026 | | | 100,000 | | | | 98,947 | |
| | | | | | | | 194,251 | |
| | | | | | | | | |
| Health Care — 2.68% | | | | | | | | |
| Bristol-Myers Squibb Co., 4.55%, 2/20/2048 | | | 78,000 | | | | 75,922 | |
| | | | | | | | | |
| Industrials — 2.83% | | | | | | | | |
| Southwest Airlines Co., 7.38%, 3/1/2027 | | | 75,000 | | | | 79,919 | |
| | | | | | | | | |
| Real Estate — 1.45% | | | | | | | | |
| Omega Healthcare Investors, Inc., 3.38%, 2/1/2031 | | | 50,000 | | | | 40,895 | |
| | | | | | | | | |
| Technology — 6.43% | | | | | | | | |
| International Business Machines Corp., 4.25%, 5/15/2049 | | | 100,000 | | | | 89,334 | |
| Oracle Corp., 3.25%, 11/15/2027 | | | 100,000 | | | | 92,512 | |
| | | | | | | | 181,846 | |
| | | | | | | | | |
| Total Corporate Bonds (Cost $897,230) | | | | | | | 781,131 | |
See accompanying notes which are an integral part of these financial statements.
| FISHER INVESTMENTS INSTITUTIONAL GROUP |
| FIXED INCOME FUND FOR RETIREMENT PLANS |
| SCHEDULE OF INVESTMENTS – (continued) |
| August 31, 2022 |
| |
| | | Principal | | | | |
| U.S. GOVERNMENT & AGENCIES — 41.80% | | Amount | | | Fair Value | |
| United States Treasury Note, 1.50%, 9/30/2024 | | $ | 109,700 | | | $ | 105,468 | |
| United States Treasury Note, 2.63%, 2/15/2029 | | | 301,100 | | | | 289,491 | |
| United States Treasury Note, 4.50%, 2/15/2036 | | | 490,000 | | | | 566,956 | |
| United States Treasury Bond, 4.63%, 2/15/2040 | | | 187,300 | | | | 220,308 | |
| Total U.S. Government & Agencies (Cost $1,344,300) | | | | | | | 1,182,223 | |
| | | | | | | | | |
| EXCHANGE-TRADED FUNDS — 27.58% | | Shares | | | | |
| iShares Broad USD High Yield Corporate Bond ETF(a) | | | 7,880 | | | | 277,061 | |
| iShares MBS ETF | | | 5,201 | | | | 502,884 | |
| Total Exchange-Traded Funds (Cost $848,987) | | | | | | | 779,945 | |
| | | | | | | | | |
| MONEY MARKET FUNDS — 2.59% | | | | | | | | |
| First American Government Obligations Fund, Class X, 2.04%(b) | | | 73,283 | | | | 73,283 | |
| | | | | | | | | |
| Total Money Market Funds (Cost $73,283) | | | | | | | 73,283 | |
| | | | | | | | | |
| Total Investments — 99.59% (Cost $3,163,800) | | | | | | | 2,816,582 | |
| | | | | | | | | |
| Other Assets in Excess of Liabilities — 0.41% | | | | | | | 11,475 | |
| | | | | | | | | |
| NET ASSETS — 100.00% | | | | | | $ | 2,828,057 | |
| (a) | Non-income producing security. |
| (b) | Rate disclosed is the seven day effective yield as of August 31, 2022. |
See accompanying notes which are an integral part of these financial statements.
| FISHER INVESTMENTS INSTITUTIONAL GROUP |
| ESG FIXED INCOME FUND FOR RETIREMENT PLANS |
| SCHEDULE OF INVESTMENTS |
| August 31, 2022 |
| | | Principal | | | | |
| CORPORATE BONDS — 27.78% | | Amount | | | Fair Value | |
| Communications — 3.44% | | | | | | | | |
| Comcast Corp., 3.55%, 5/1/2028 | | | 100,000 | | | $ | 96,715 | |
| | | | | | | | | |
| Consumer Staples — 3.97% | | | | | | | | |
| Procter & Gamble Co. (The), 5.50%, 2/1/2034 | | | 100,000 | | | | 111,583 | |
| | | | | | | | | |
| Financials — 6.91% | | | | | | | | |
| BlackRock, Inc., 3.25%, 4/30/2029 | | | 100,000 | | | | 95,304 | |
| JPMorgan Chase & Co., 4.13%, 12/15/2026 | | | 100,000 | | | | 98,947 | |
| | | | | | | | 194,251 | |
| Health Care — 2.70% | | | | | | | | |
| Bristol-Myers Squibb Co., 4.55%, 2/20/2048 | | | 78,000 | | | | 75,922 | |
| | | | | | | | | |
| Industrials — 2.84% | | | | | | | | |
| Southwest Airlines Co., 7.38%, 3/1/2027 | | | 75,000 | | | | 79,919 | |
| | | | | | | | | |
| Real Estate — 1.45% | | | | | | | | |
| Omega Healthcare Investors, Inc., 3.38%, 2/1/2031 | | | 50,000 | | | | 40,895 | |
| | | | | | | | | |
| Technology — 6.47% | | | | | | | | |
| International Business Machines Corp., 4.25%, 5/15/2049 | | | 100,000 | | | | 89,334 | |
| Oracle Corp., 3.25%, 11/15/2027 | | | 100,000 | | | | 92,512 | |
| | | | | | | | 181,846 | |
| | | | | | | | | |
| Total Corporate Bonds (Cost $897,230) | | | | | | | 781,131 | |
| | | | | | | | | |
| U.S. GOVERNMENT & AGENCIES — 41.76% | | | | | | | | |
| United States Treasury Note, 1.50%, 9/30/2024 | | | 109,900 | | | | 105,661 | |
| United States Treasury Note, 2.63%, 2/15/2029 | | | 286,700 | | | | 275,646 | |
| United States Treasury Bond, 4.50%, 2/15/2036 | | | 495,000 | | | | 572,739 | |
| United States Treasury Bond, 4.63%, 2/15/2040 | | | 187,100 | | | | 220,073 | |
| | | | | | | | | |
| Total U.S. Government & Agencies (Cost $1,335,184) | | | | | | | 1,174,119 | |
See accompanying notes which are an integral part of these financial statements.
| FISHER INVESTMENTS INSTITUTIONAL GROUP |
| ESG FIXED INCOME FUND FOR RETIREMENT PLANS |
| SCHEDULE OF INVESTMENTS – (continued) |
| August 31, 2022 |
| EXCHANGE-TRADED FUNDS — 28.12% | | Shares | | | Fair Value | |
| iShares MBS ETF | | $ | 5,156 | | | $ | 498,534 | |
| Nuveen ESG High Yield Corporate Bond ETF(a) | | | 14,200 | | | | 292,236 | |
| Total Exchange-Traded Funds (Cost $868,804) | | | | | | | 790,770 | |
| | | | | | | | | |
| MONEY MARKET FUNDS — 1.93% | | | | | | | | |
| First American Government Obligations Fund, Class X, 2.04%(b) | | | 54,245 | | | | 54,245 | |
| | | | | | | | | |
| Total Money Market Funds (Cost $54,245) | | | | | | | 54,245 | |
| | | | | | | | | |
| Total Investments — 99.59% (Cost $3,155,463) | | | | | | | 2,800,265 | |
| | | | | | | | | |
| Other Assets in Excess of Liabilities — 0.41% | | | | | | | 11,474 | |
| | | | | | | | | |
| NET ASSETS — 100.00% | | | | | | $ | 2,811,739 | |
| (a) | Non-income producing security. |
| (b) | Rate disclosed is the seven day effective yield as of August 31, 2022. |
See accompanying notes which are an integral part of these financial statements.
| FISHER INVESTMENTS INSTITUTIONAL GROUP FUND FAMILY |
| STATEMENTS OF ASSETS AND LIABILITIES |
| August 31, 2022 |
| | | Fisher Investments Institutional Group | |
| | | | | | ESG | | | Fixed | | | ESG Fixed | |
| | | Stock Fund | | | Stock Fund | | | Income Fund | | | Income Fund | |
| | | for Retirement | | | for Retirement | | | for Retirement | | | for Retirement | |
| | | Plans | | | Plans | | | Plans | | | Plans | |
| Assets | | | | | | | | | | | | | | | | |
| Investments in securities at value (cost $155,090, $154,430, $3,163,800 and $3,155,463) | | $ | 177,425 | | | $ | 177,186 | | | $ | 2,816,582 | | | $ | 2,800,265 | |
| Dividends and interest receivable | | | 236 | | | | 255 | | | | 11,475 | | | | 11,474 | |
| Total Assets | | | 177,661 | | | | 177,441 | | | | 2,828,057 | | | | 2,811,739 | |
| Net Assets | | $ | 177,661 | | | $ | 177,441 | | | $ | 2,828,057 | | | $ | 2,811,739 | |
| Net Assets consist of: | | | | | | | | | | | | | | | | |
| Paid-in capital | | $ | 154,885 | | | $ | 154,815 | | | $ | 3,157,057 | | | $ | 3,154,825 | |
| Accumulated earnings (deficits) | | | 22,776 | | | | 22,626 | | | | (329,000 | ) | | | (343,086 | ) |
| Net Assets | | $ | 177,661 | | | $ | 177,441 | | | $ | 2,828,057 | | | $ | 2,811,739 | |
| Shares outstanding (unlimited number of shares authorized, no par value) | | | 15,355 | | | | 15,355 | | | | 315,350 | | | | 315,148 | |
| Net asset value (“NAV”) and offering price per share | | $ | 11.57 | | | $ | 11.56 | | | $ | 8.97 | | | $ | 8.92 | |
See accompanying notes which are an integral part of these financial statements.
| FISHER INVESTMENTS INSTITUTIONAL GROUP FUND FAMILY |
| STATEMENTS OF OPERATIONS |
| For the year ended August 31, 2022 |
| | | Fisher Investments Institutional Group | |
| | | | | | ESG | | | Fixed | | | ESG Fixed | |
| | | Stock Fund | | | Stock Fund | | | Income Fund | | | Income Fund | |
| | | for Retirement | | | for Retirement | | | for Retirement | | | for Retirement | |
| | | Plans | | | Plans | | | Plans | | | Plans | |
| Investment Income | | | | | | | | | | | | | | | | |
| Dividend income | | $ | 3,197 | | | $ | 3,176 | | | $ | 6,293 | | | $ | 6,252 | |
| Interest income | | | — | | | | — | | | | 51,066 | | | | 50,769 | |
| Foreign dividend taxes withheld | | | (351 | ) | | | (330 | ) | | | — | | | | — | |
| Total investment income | | | 2,846 | | | | 2,846 | | | | 57,359 | | | | 57,021 | |
| Net investment income | | | 2,846 | | | | 2,846 | | | | 57,359 | | | | 57,021 | |
| Net Realized and Change in Unrealized Gain (Loss) on Investments | | | | | | | | | | | | | | | | |
| Net realized loss on investment securities transactions | | | (837 | ) | | | (717 | ) | | | (22,424 | ) | | | (20,538 | ) |
| Net realized gain on foreign currency translations | | | — | | | | 2 | | | | — | | | | — | |
| Net change in unrealized depreciation of investment securities and foreign currency translations | | | (53,752 | ) | | | (52,521 | ) | | | (442,415 | ) | | | (451,545 | ) |
| Net realized and change in unrealized loss on investment securities and foreign currency translations | | | (54,589 | ) | | | (53,236 | ) | | | (464,839 | ) | | | (472,083 | ) |
| Net decrease in net assets resulting from operations | | $ | (51,743 | ) | | $ | (50,390 | ) | | $ | (407,480 | ) | | $ | (415,062 | ) |
See accompanying notes which are an integral part of these financial statements.
| FISHER INVESTMENTS INSTITUTIONAL GROUP FUND FAMILY |
| STATEMENTS OF CHANGES IN NET ASSETS |
| | | Fisher Investments | | | Fisher Investments | |
| | | Institutional Group Stock Fund | | | Institutional Group ESG Stock | |
| | | for Retirement Plans | | | Fund for Retirement Plans | |
| | | For the | | | For the | | | For the | | | For the | |
| | | Year Ended | | | Year Ended | | | Year Ended | | | Year Ended | |
| | | August 31, | | | August 31, | | | August 31, | | | August 31, | |
| | | 2022 | | | 2021 | | | 2022 | | | 2021 | |
| Increase (Decrease) in Net Assets due to: | | | | | | | | | | | | | | | | |
| Operations | | | | | | | | | | | | | | | | |
| Net investment income | | $ | 2,846 | | | $ | 2,525 | | | $ | 2,846 | | | $ | 2,431 | |
| Net realized gain (loss) on investment securities transactions and foreign currency translations | | | (837 | ) | | | (747 | ) | | | (715 | ) | | | (741 | ) |
| Net change in unrealized appreciation (depreciation) of investment securities and foreign currency translations | | | (53,752 | ) | | | 53,868 | | | | (52,521 | ) | | | 52,486 | |
| Net increase (decrease) in net assets resulting from operations | | | (51,743 | ) | | | 55,646 | | | | (50,390 | ) | | | 54,176 | |
| Distributions to Shareholders From: | | | | | | | | | | | | | | | | |
| Earnings | | | (2,617 | ) | | | (2,272 | ) | | | (2,359 | ) | | | (2,459 | ) |
| Total distributions | | | (2,617 | ) | | | (2,272 | ) | | | (2,359 | ) | | | (2,459 | ) |
| Capital Transactions | | | | | | | | | | | | | | | | |
| Reinvestment of distributions | | | 2,617 | | | | 2,272 | | | | 2,359 | | | | 2,459 | |
| Amount paid for shares redeemed | | | (14 | ) | | | — | | | | (13 | ) | | | — | |
| Net increase in net assets resulting from capital transactions | | | 2,603 | | | | 2,272 | | | | 2,346 | | | | 2,459 | |
| Total Increase (Decrease) in Net | | | | | | | | | | | | | | | | |
| Assets | | | (51,757 | ) | | | 55,646 | | | | (50,403 | ) | | | 54,176 | |
| Net Assets | | | | | | | | | | | | | | | | |
| Beginning of year | | | 229,418 | | | | 173,772 | | | | 227,844 | | | | 173,668 | |
| End of year | | $ | 177,661 | | | $ | 229,418 | | | $ | 177,441 | | | $ | 227,844 | |
| Share Transactions | | | | | | | | | | | | | | | | |
| Shares issued in reinvestment of distributions | | | 174 | | | | 181 | | | | 157 | | | | 198 | |
| Shares redeemed | | | (1 | ) | | | — | | | | (1 | ) | | | — | |
| Net increase in shares outstanding | | | 173 | | | | 181 | | | | 156 | | | | 198 | |
See accompanying notes which are an integral part of these financial statements.
| FISHER INVESTMENTS INSTITUTIONAL GROUP FUND FAMILY |
| STATEMENTS OF CHANGES IN NET ASSETS – (continued) |
| | | Fisher Investments Institutional | | | Fisher Investments Institutional | |
| | | Group Fixed Income Fund for | | | Group ESG Fixed Income Fund | |
| | | Retirement Plans | | | for Retirement Plans | |
| | | For the | | | For the | | | For the | | | For the | |
| | | Year Ended | | | Year Ended | | | Year Ended | | | Year Ended | |
| | | August 31, | | | August 31, | | | August 31, | | | August 31, | |
| | | 2022 | | | 2021 | | | 2022 | | | 2021 | |
| Increase (Decrease) in Net Assets due to: | | | | | | | | | | | | | | | | |
| Operations | | | | | | | | | | | | | | | | |
| Net investment income | | $ | 57,359 | | | $ | 63,668 | | | $ | 57,021 | | | $ | 63,303 | |
| Net realized gain (loss) on investment securities transactions | | | (22,424 | ) | | | 21,246 | | | | (20,538 | ) | | | 13,053 | |
| Net change in unrealized depreciation of investment securities | | | (442,415 | ) | | | (9,436 | ) | | | (451,545 | ) | | | (11,549 | ) |
| Net increase (decrease) in net assets resulting from operations | | | (407,480 | ) | | | 75,478 | | | | (415,062 | ) | | | 64,807 | |
| Distributions to Shareholders From: | | | | | | | | | | | | | | | | |
| Earnings | | | (56,411 | ) | | | (100,645 | ) | | | (53,329 | ) | | | (101,495 | ) |
| Total distributions | | | (56,411 | ) | | | (100,645 | ) | | | (53,329 | ) | | | (101,495 | ) |
| Capital Transactions | | | | | | | | | | | | | | | | |
| Reinvestment of distributions | | | 56,411 | | | | 100,645 | | | | 53,329 | | | | 101,495 | |
| Amount paid for shares redeemed | | | (9 | ) | | | — | | | | (9 | ) | | | — | |
| Net increase in net assets resulting from capital transactions | | | 56,402 | | | | 100,645 | | | | 53,320 | | | | 101,495 | |
| Total Increase (Decrease) in Net | | | | | | | | | | | | | | | | |
| Assets | | | (407,489 | ) | | | 75,478 | | | | (415,071 | ) | | | 64,807 | |
| Net Assets | | | | | | | | | | | | | | | | |
| Beginning of year | | | 3,235,546 | | | | 3,160,068 | | | | 3,226,810 | | | | 3,162,003 | |
| End of year | | $ | 2,828,057 | | | $ | 3,235,546 | | | $ | 2,811,739 | | | $ | 3,226,810 | |
| Share Transactions | | | | | | | | | | | | | | | | |
| Shares issued in reinvestment of distributions | | | 5,569 | | | | 9,781 | | | | 5,275 | | | | 9,873 | |
| Shares redeemed | | | (1 | ) | | | — | | | | (1 | ) | | | — | |
| Net increase in shares outstanding | | | 5,568 | | | | 9,781 | | | | 5,274 | | | | 9,873 | |
See accompanying notes which are an integral part of these financial statements.
| FISHER INVESTMENTS INSTITUTIONAL GROUP |
| STOCK FUND FOR RETIREMENT PLANS |
| FINANCIAL HIGHLIGHTS |
| |
| (For a share outstanding during each period) |
| | | | | | | | | For the | |
| | | For the | | | For the | | | Period | |
| | | Year Ended | | | Year Ended | | | Ended | |
| | | August 31, | | | August 31, | | | August 31, | |
| | | 2022 | | | 2021 | | | 2020(a) | |
| Selected Per Share Data: | | | | | | | | | | | | |
| Net asset value, beginning of year | | $ | 15.11 | | | $ | 11.58 | | | $ | 10.00 | |
| Investment operations: | | | | | | | | | | | | |
| Net investment income | | | 0.18 | | | | 0.17 | | | | 0.10 | |
| Net realized and unrealized gain (loss) | | | (3.55 | ) | | | 3.51 | | | | 1.48 | |
| Total from investment operations | | | (3.37 | ) | | | 3.68 | | | | 1.58 | |
| Less distributions to shareholders from: | | | | | | | | | | | | |
| Net investment income | | | (0.17 | ) | | | (0.15 | ) | | | — | |
| Total distributions | | | (0.17 | ) | | | (0.15 | ) | | | — | |
| Net asset value, end of year | | $ | 11.57 | | | $ | 15.11 | | | $ | 11.58 | |
| Total Return(b) | | | (22.55 | )% | | | 32.06 | % | | | 15.80 | % (c) |
| Ratios and Supplemental Data: | | | | | | | | | | | | |
| Net assets, end of year (000 omitted) | | $ | 178 | | | $ | 229 | | | $ | 174 | |
| Ratio of net investment income to average net assets | | | 1.37 | % | | | 1.27 | % | | | 1.44 | % (d) |
| Portfolio turnover rate | | | 11 | % | | | 1 | % | | | 12 | % (c) |
| (a) | For the period December 13, 2019 (commencement of operations) to August 31, 2020. |
| (b) | Total return represents the rate that the investor would have earned or lost on an investment in the Fund, assuming reinvestment of distributions. |
See accompanying notes which are an integral part of these financial statements.
| FISHER INVESTMENTS INSTITUTIONAL GROUP |
| ESG STOCK FUND FOR RETIREMENT PLANS |
| FINANCIAL HIGHLIGHTS |
| |
| (For a share outstanding during each period) |
| | | | | | | | | For the | |
| | | For the | | | For the | | | Period | |
| | | Year Ended | | | Year Ended | | | Ended | |
| | | August 31, | | | August 31, | | | August 31, | |
| | | 2022 | | | 2021 | | | 2020(a) | |
| Selected Per Share Data: | | | | | | | | | | | | |
| Net asset value, beginning of year | | $ | 14.98 | | | $ | 11.58 | | | $ | 10.00 | |
| Investment operations: | | | | | | | | | | | | |
| Net investment income | | | 0.19 | | | | 0.16 | | | | 0.12 | |
| Net realized and unrealized gain (loss) | | | (3.45 | ) | | | 3.40 | | | | 1.46 | |
| Total from investment operations | | | (3.26 | ) | | | 3.56 | | | | 1.58 | |
| Less distributions to shareholders from: | | | | | | | | | | | | |
| Net investment income | | | (0.16 | ) | | | (0.16 | ) | | | — | |
| Total distributions | | | (0.16 | ) | | | (0.16 | ) | | | — | |
| Net asset value, end of year | | $ | 11.56 | | | $ | 14.98 | | | $ | 11.58 | |
| Total Return(b) | | | (22.03 | )% | | | 31.07 | % | | | 15.80 | % (c) |
| Ratios and Supplemental Data: | | | | | | | | | | | | |
| Net assets, end of year (000 omitted) | | $ | 177 | | | $ | 228 | | | $ | 174 | |
| Ratio of net investment income to average net assets | | | 1.37 | % | | | 1.23 | % | | | 1.64 | % (d) |
| Portfolio turnover rate | | | 10 | % | | | 1 | % | | | 15 | % (c) |
| (a) | For the period December 13, 2019 (commencement of operations) to August 31, 2020. |
| (b) | Total return represents the rate that the investor would have earned or lost on an investment in the Fund, assuming reinvestment of distributions. |
See accompanying notes which are an integral part of these financial statements.
| FISHER INVESTMENTS INSTITUTIONAL GROUP |
| FIXED INCOME FUND FOR RETIREMENT PLANS |
| FINANCIAL HIGHLIGHTS |
| |
| (For a share outstanding during each period) |
| | | | | | | | | For the | |
| | | For the | | | For the | | | Period | |
| | | Year Ended | | | Year Ended | | | Ended | |
| | | August 31, | | | August 31, | | | August 31, | |
| | | 2022 | | | 2021 | | | 2020(a) | |
| Selected Per Share Data: | | | | | | | | | | | | |
| Net asset value, beginning of year | | $ | 10.44 | | | $ | 10.53 | | | $ | 10.00 | |
| Investment operations: | | | | | | | | | | | | |
| Net investment income | | | 0.18 | | | | 0.21 | | | | 0.18 | |
| Net realized and unrealized gain (loss) | | | (1.47 | ) | | | 0.04 | | | | 0.35 | |
| Total from investment operations | | | (1.29 | ) | | | 0.25 | | | | 0.53 | |
| Less distributions to shareholders from: | | | | | | | | | | | | |
| Net investment income | | | (0.18 | ) | | | (0.27 | ) | | | — | |
| Net realized gains | | | — | (b) | | | (0.07 | ) | | | — | |
| Total distributions | | | (0.18 | ) | | | (0.34 | ) | | | — | |
| Net asset value, end of year | | $ | 8.97 | | | $ | 10.44 | | | $ | 10.53 | |
| Total Return(c) | | | (12.54 | )% | | | 2.38 | % | | | 5.30 | % (d) |
| Ratios and Supplemental Data: | | | | | | | | | | | | |
| Net assets, end of year (000 omitted) | | $ | 2,828 | | | $ | 3,236 | | | $ | 3,160 | |
| Ratio of net investment income to average net assets | | | 1.89 | % | | | 2.00 | % | | | 2.51 | % (e) |
| Portfolio turnover rate | | | 32 | % | | | 46 | % | | | — | % (d) |
| (a) | For the period December 13, 2019 (commencement of operations) to August 31, 2020. |
| (b) | Rounds to less than $0.005 per share. |
| (c) | Total return represents the rate that the investor would have earned or lost on an investment in the Fund, assuming reinvestment of distributions. |
See accompanying notes which are an integral part of these financial statements.
| FISHER INVESTMENTS INSTITUTIONAL GROUP |
| ESG FIXED INCOME FUND FOR RETIREMENT PLANS |
| FINANCIAL HIGHLIGHTS |
| |
| (For a share outstanding during each period) |
| | | | | | | | | For the | |
| | | For the | | | For the | | | Period | |
| | | Year Ended | | | Year Ended | | | Ended | |
| | | August 31, | | | August 31, | | | August 31, | |
| | | 2022 | | | 2021 | | | 2020(a) | |
| Selected Per Share Data: | | | | | | | | | | | | |
| Net asset value, beginning of year | | $ | 10.41 | | | $ | 10.54 | | | $ | 10.00 | |
| Investment operations: | | | | | | | | | | | | |
| Net investment income | | | 0.18 | | | | 0.21 | | | | 0.18 | |
| Net realized and unrealized gain (loss) | | | (1.50 | ) | | | — | (b) | | | 0.36 | |
| Total from investment operations | | | (1.32 | ) | | | 0.21 | | | | 0.54 | |
| Less distributions to shareholders from: | | | | | | | | | | | | |
| Net investment income | | | (0.17 | ) | | | (0.27 | ) | | | — | |
| Net realized gains | | | — | (b) | | | (0.07 | ) | | | — | |
| Total distributions | | | (0.17 | ) | | | (0.34 | ) | | | — | |
| Net asset value, end of year | | $ | 8.92 | | | $ | 10.41 | | | $ | 10.54 | |
| Total Return(c) | | | (12.85 | )% | | | 2.02 | % | | �� | 5.40 | % (d) |
| Ratios and Supplemental Data: | | | | | | | | | | | | |
| Net assets, end of year (000 omitted) | | $ | 2,812 | | | $ | 3,227 | | | $ | 3,162 | |
| Ratio of net investment income to average net assets | | | 1.88 | % | | | 1.99 | % | | | 2.46 | % (e) |
| Portfolio turnover rate | | | 33 | % | | | 46 | % | | | — | % (d) |
| (a) | For the period December 13, 2019 (commencement of operations) to August 31, 2020. |
| (b) | Rounds to less than $0.005 per share. |
| (c) | Total return represents the rate that the investor would have earned or lost on an investment in the Fund, assuming reinvestment of distributions. |
See accompanying notes which are an integral part of these financial statements.
| FISHER INVESTMENTS INSTITUTIONAL GROUP FUND FAMILY |
| NOTES TO THE FINANCIAL STATEMENTS |
| August 31, 2022 |
NOTE 1. ORGANIZATION
Fisher Investments Institutional Group Stock Fund for Retirement Plans (the “Stock Fund”), Fisher Investments Institutional Group ESG Stock Fund for Retirement Plans (the “ESG Stock Fund”), Fisher Investments Institutional Group Fixed Income Fund for Retirement Plans (the “Fixed Income Fund”) and the Fisher Investments Institutional Group ESG Fixed Income Fund for Retirement Plans (the “ESG Fixed Income Fund”) (each a “Fund” and collectively the “Funds”) were each registered under the Investment Company Act of 1940, as amended (“1940 Act”), as a diversified series of Unified Series Trust (the “Trust”) on November 12, 2018. The Trust is an open-end investment company established under the laws of Ohio by an Agreement and Declaration of Trust dated October 14, 2002, as amended (the “Trust Agreement”). The Trust Agreement permits the Board of Trustees of the Trust (the “Board”) to issue an unlimited number of shares of beneficial interest of separate series without par value. Each Fund is one of a series of funds currently authorized by the Board. The Funds commenced operations on December 13, 2019. The investment adviser to the Funds is Fisher Asset Management, LLC, d/b/a Fisher Investments (the “Adviser”). The investment objective of the Stock Fund and ESG Stock Fund is to seek to outperform, net of fees and expenses, the return of the MSCI ACWI Investable Markets Index. The investment objective of the Fixed Income Fund and ESG Fixed Income Fund is seek to outperform, net of fees and expenses, the return of the ICE Bank of America U.S. Broad Market Index.
NOTE 2. SIGNIFICANT ACCOUNTING POLICIES
The Funds are investment companies and follow accounting and reporting guidance under Financial Accounting Standards Board Accounting Standards Codification (“ASC”) Topic 946, “Financial Services-Investment Companies”, including Accounting Standards Update 2013-08. The following is a summary of significant accounting policies followed by the Funds in the preparation of their financial statements. These policies are in conformity with the generally accepted accounting principles in the United States of America (“GAAP”).
Estimates – The preparation of financial statements in conformity with GAAP requires management to make estimates and assumptions that affect the reported amounts of assets and liabilities and disclosure of contingent assets and liabilities at the date of the financial statements and the reported amounts of increases and decreases in net assets from operations during the reporting period. Actual results could differ from those estimates.
| FISHER INVESTMENTS INSTITUTIONAL GROUP FUND FAMILY |
| NOTES TO THE FINANCIAL STATEMENTS – (continued) |
| August 31, 2022 |
NOTE 2. SIGNIFICANT ACCOUNTING POLICIES – continued
Foreign Currency Translation – The accounting records of the Funds are maintained in U.S. dollars. Foreign currency amounts are translated into U.S. dollars at the current rate of exchange each business day to determine the value of investments, and other assets and liabilities. Purchases and sales of foreign securities, and income and expenses, are translated at the prevailing rate of exchange on the respective date of these transactions. The Funds do not isolate that portion of the results of operations resulting from changes in foreign exchange rates on investments from fluctuation arising from changes in market prices of securities held. These fluctuations are included with the realized and unrealized gain or loss from investments. Net realized gain (loss) on foreign currency translations on the Statements of Operations represents currency gains (losses) realized between the trade and settlement dates on securities transactions, and the difference between the amount of investment income and foreign withholding taxes recorded on the Funds’ books and the U.S. dollar equivalent amounts actually received or paid. The change in unrealized currency gains (losses) on foreign currency translations for the period is reflected in the Statements of Operations.
Federal Income Taxes – The Funds make no provision for federal income or excise tax. Each Fund has qualified and intends to qualify each year as a regulated investment company (“RIC”) under subchapter M of the Internal Revenue Code of 1986, as amended, by complying with the requirements applicable to RICs and by distributing substantially all of its taxable income. Each Fund also intends to distribute sufficient net investment income and net capital gains, if any, so that it will not be subject to excise tax on undistributed income and gains. If the required amount of net investment income or gains is not distributed, the Fund could incur a tax expense.
As of and during the fiscal year ended August 31, 2022, the Funds did not have any liabilities for any unrecognized tax benefits. The Funds recognize interest and penalties, if any, related to unrecognized tax benefits as income tax expense on the Statements of Operations when incurred. During the fiscal year ended August 31, 2022, the Funds did not incur any interest or penalties. Management of the Funds has reviewed tax positions taken in tax years that remain subject to examination by all major tax jurisdictions, including federal (i.e., the last three tax year ends and the interim tax period since then, as applicable). Management believes that there is no tax liability resulting from unrecognized tax benefits related to uncertain tax positions taken.
| FISHER INVESTMENTS INSTITUTIONAL GROUP FUND FAMILY |
| NOTES TO THE FINANCIAL STATEMENTS – (continued) |
| August 31, 2022 |
NOTE 2. SIGNIFICANT ACCOUNTING POLICIES – continued
Expenses – Expenses incurred by the Trust that do not relate to a specific fund of the Trust are allocated to the individual funds based on each fund’s relative net assets or another appropriate basis (as determined by the Board).
Security Transactions and Related Income – The Funds follow industry practice and record security transactions on the trade date for financial reporting purposes. The specific identification method is used for determining gains or losses for financial statement and income tax purposes. Dividend income is recorded on the ex-dividend date and interest income is recorded on an accrual basis. Discounts and premiums on securities purchased are amortized or accreted using the effective interest method. Withholding taxes on foreign dividends, related reclaims, and foreign capital gain taxes have been provided for in accordance with the Funds’ understanding of the applicable country’s tax rules and rates.
Dividends and Distributions – Each Fund intends to distribute its net investment income and net realized long-term and short-term capital gains, if any, at least annually. Dividends and distributions to shareholders, which are determined in accordance with income tax regulations, are recorded on the ex-dividend date. The treatment for financial reporting purposes of distributions made to shareholders during the period from net investment income or net realized capital gains may differ from their ultimate treatment for federal income tax purposes. These differences are caused primarily by differences in the timing of the recognition of certain components of income, expense or realized capital gain for federal income tax purposes. Where such differences are permanent in nature, they are reclassified among the components of the net assets based on their ultimate characterization for federal income tax purposes. Any such reclassifications will have no effect on net assets, results of operations or net asset value (“NAV”) per share of the Funds.
NOTE 3. SECURITIES VALUATION AND FAIR VALUE MEASUREMENTS
Each Fund values its portfolio securities at fair value as of the close of regular trading on the New York Stock Exchange (“NYSE”) (normally 4:00 p.m. Eastern time) on each business day the NYSE is open for business. Fair value is defined as the price that a Fund would receive upon selling an investment in a timely transaction to an independent buyer in the principal or most advantageous market of the investment. GAAP establishes a three-tier hierarchy to maximize the use of observable market data and minimize the use of unobservable inputs and to establish classification of fair value measurements for disclosure purposes.
| FISHER INVESTMENTS INSTITUTIONAL GROUP FUND FAMILY |
| NOTES TO THE FINANCIAL STATEMENTS – (continued) |
| August 31, 2022 |
NOTE 3. SECURITIES VALUATION AND FAIR VALUE MEASUREMENTS – continued
Inputs refer broadly to the assumptions that market participants would use in pricing the asset or liability, including assumptions about risk (the risk inherent in a particular valuation technique used to measure fair value including a pricing model and/or the risk inherent in the inputs to the valuation technique). Inputs may be observable or unobservable. Observable inputs are inputs that reflect the assumptions market participants would use in pricing the asset or liability developed based on market data obtained and available from sources independent of the reporting entity. Unobservable inputs are inputs that reflect the reporting entity’s own assumptions about the assumptions market participants would use in pricing the asset or liability developed based on the best information available in the circumstances.
Various inputs are used in determining the value of each Fund’s investments. These inputs are summarized in the three broad levels listed below.
| ● | Level 1 – unadjusted quoted prices in active markets for identical investments and/or registered investment companies where the value per share is determined and published and is the basis for current transactions for identical assets or liabilities at the valuation date |
| ● | Level 2 – other significant observable inputs (including, but not limited to, quoted prices for an identical security in an inactive market, quoted prices for similar securities, interest rates, prepayment speeds, credit risk, etc.) |
| ● | Level 3 – significant unobservable inputs (including the Funds’ own assumptions in determining fair value of investments based on the best information available) |
The inputs used to measure fair value may fall into different levels of the fair value hierarchy. In such cases, for disclosure purposes, the level in the fair value hierarchy which is reported is determined based on the lowest level input that is significant to the fair value measurement in its entirety.
Equity securities that are traded on any stock exchange are generally valued at the last quoted sale price on the security’s primary exchange. Lacking a last sale price, an exchange-traded security is generally valued at its last bid price. Securities traded in the NASDAQ over-the-counter market are generally valued at the NASDAQ Official Closing Price. When using the market quotations and when the market is considered active, the security is classified as a Level 1 security. In the event that market
| FISHER INVESTMENTS INSTITUTIONAL GROUP FUND FAMILY |
| NOTES TO THE FINANCIAL STATEMENTS – (continued) |
| August 31, 2022 |
NOTE 3. SECURITIES VALUATION AND FAIR VALUE MEASUREMENTS – continued
quotations are not readily available or are considered unreliable due to market or other events, a Fund values its securities and other assets at fair value in accordance with policies established by and under the general supervision of the Board. Under these policies, the securities will be classified as Level 2 or 3 within the fair value hierarchy, depending on the inputs used.
Debt securities are valued by using the mean between the closing bid and ask prices provided by a pricing service. If the closing bid and ask prices are not readily available, the pricing service may provide a price determined by a matrix pricing method. Matrix pricing is a mathematical technique used to value fixed income securities without relying exclusively on quoted prices. Matrix pricing takes into consideration recent transactions, yield, liquidity, risk, credit quality, coupon, maturity, type of issue and any other factors or market data the pricing service deems relevant for the actual security being priced and for other securities with similar characteristics. These securities will generally be categorized as Level 2 securities. If the Board or the Adviser, as Valuation Designee appointed by the Board, decides that a price provided by the pricing service does not accurately reflect the fair value of the securities or when prices are not readily available from a pricing service, securities are valued at fair value as determined by the Valuation Designee, in conformity with guidelines adopted by and subject to review of the Board. These securities will generally be categorized as Level 3 securities.
Investments in mutual funds, including money market mutual funds, are generally priced at the ending NAV provided by the service agent of the mutual funds. These securities are categorized as Level 1 securities.
In accordance with the Trust’s valuation policies, the Board or Adviser as Valuation Designee is required to consider all appropriate factors relevant to the value of securities for which it has determined other pricing sources are not available or reliable as described above. No single method exists for determining fair value, because fair value depends upon the circumstances of each individual case. As a general principle, the current fair value of a security being valued by the Valuation Designee would be the amount that the Funds might reasonably expect to receive upon the current sale. Methods that are in accordance with this principle may, for example, be based on (i) a multiple of earnings; (ii) a discount from market prices of a similar freely traded security (including a derivative security or a basket of securities traded on other markets, exchanges or among dealers); or (iii) yield to maturity with
| FISHER INVESTMENTS INSTITUTIONAL GROUP FUND FAMILY |
| NOTES TO THE FINANCIAL STATEMENTS – (continued) |
| August 31, 2022 |
NOTE 3. SECURITIES VALUATION AND FAIR VALUE MEASUREMENTS – continued
respect to debt issues, or a combination of these and other methods. Fair-value pricing is permitted if, in the Valuation Designee’s opinion, the validity of market quotations appears to be questionable based on factors such as evidence of a thin market in the security based on a small number of quotations, a significant event occurs after the close of a market but before a Fund’s NAV calculation that may affect a security’s value, or the Valuation Designee is aware of any other data that calls into question the reliability of market quotations.
The following is a summary of the inputs used to value the Funds’ investments as of August 31, 2022:
| | | Valuation Inputs | |
| | | Level 1 | | | Level 2 | | | Level 3 | | | Total | |
| Stock Fund | | | | | | | | | | | | | | | | |
| Assets | | | | | | | | | | | | | | | | |
| Common Stocks(a) | | $ | 176,031 | | | $ | 769 | | | $ | — | | | $ | 176,800 | |
| Money Market Funds | | | 625 | | | | — | | | | — | | | | 625 | |
| Total | | $ | 176,656 | | | $ | 769 | | | $ | — | | | $ | 177,425 | |
| | | | | | | | | | | | | | | | | |
| ESG Stock Fund | | | | | | | | | | | | | | | | |
| Assets | | | | | | | | | | | | | | | | |
| Common Stocks(a) | | $ | 175,452 | | | $ | 779 | | | | — | | | $ | 176,231 | |
| Money Market Funds | | | 955 | | | | — | | | | — | | | | 955 | |
| Total | | $ | 176,407 | | | $ | 779 | | | $ | — | | | $ | 177,186 | |
| | | | | | | | | | | | | | | | | |
| Fixed Income Fund | | | | | | | | | | | | | | | | |
| Assets | | | | | | | | | | | | | | | | |
| Corporate Bonds(a) | | $ | — | | | $ | 781,131 | | | $ | — | | | $ | 781,131 | |
| Exchange-Traded Funds | | | 779,945 | | | | — | | | | — | | | | 779,945 | |
| U.S. Government & Agencies | | | — | | | | 1,182,223 | | | | — | | | | 1,182,223 | |
| Money Market Funds | | | 73,283 | | | | — | | | | — | | | | 73,283 | |
| Total | | $ | 853,228 | | | $ | 1,963,354 | | | $ | — | | | $ | 2,816,582 | |
| FISHER INVESTMENTS INSTITUTIONAL GROUP FUND FAMILY |
| NOTES TO THE FINANCIAL STATEMENTS – (continued) |
| August 31, 2022 |
NOTE 3. SECURITIES VALUATION AND FAIR VALUE MEASUREMENTS – continued
| | | Valuation Inputs | |
| | | Level 1 | | | Level 2 | | | Level 3 | | | Total | |
| ESG Fixed Income Fund | | | | | | | | | | | | | | | | |
| Assets | | | | | | | | | | | | | | | | |
| Corporate Bonds(a) | | $ | — | | | $ | 781,131 | | | $ | — | | | $ | 781,131 | |
| Exchange-Traded Funds | | | 790,770 | | | | — | | | | — | | | | 790,770 | |
| U.S. Government & Agencies | | | — | | | | 1,174,119 | | | | — | | | | 1,174,119 | |
| Money Market Funds | | | 54,245 | | | | — | | | | — | | | | 54,245 | |
| Total | | $ | 845,015 | | | $ | 1,955,250 | | | $ | — | | | $ | 2,800,265 | |
| (a) | Refer to Schedule of Investments for sector classifications. |
The Funds did not hold any investments at the end of the reporting period for which significant unobservable inputs (Level 3) were used in determining fair value; therefore, no reconciliation of Level 3 securities is included for this reporting period. The Funds did not hold any derivative instruments during the reporting period.
NOTE 4. FEES AND OTHER TRANSACTIONS WITH AFFILIATES
The Adviser, under the terms of the management agreement with the Trust with respect to the Funds, manages the Funds’ investments. The Adviser pays all of the operating expenses of the Funds except portfolio transaction and other investment related costs (including brokerage fees and commissions, and fees and expenses associated with investments in derivative instruments, such as option and swap fees and expenses), taxes, borrowing costs (such as interest and dividend expense on securities sold short), extraordinary expenses, and any indirect expenses (such as fees and expenses associated with investment in acquired funds and other collective investment vehicles). In this regard, it should be noted that most investment companies pay their own operating expenses directly, while the Funds’ expenses, except those specified above, are paid by the Adviser. The Funds do not pay a management fee to the Adviser. Retirement plans, plan sponsors and/or plan participants pay a separate fee for the Adviser’s services and also pay fees to record keepers and administrators.
Ultimus Fund Solutions, LLC (“Ultimus”) provides administration, fund accounting and transfer agent services to the Funds.
| FISHER INVESTMENTS INSTITUTIONAL GROUP FUND FAMILY |
| NOTES TO THE FINANCIAL STATEMENTS – (continued) |
| August 31, 2022 |
NOTE 4. FEES AND OTHER TRANSACTIONS WITH AFFILIATES – continued
Northern Lights Compliance Services, LLC (“NLCS”), an affiliate of Ultimus, provides a Chief Compliance Officer to the Trust, as well as related compliance services, pursuant to a consulting agreement between NLCS and the Trust. Under the terms of such agreement, NLCS receives fees from the Adviser, which are approved annually by the Board.
Under the terms of a Distribution Agreement with the Trust, Ultimus Fund Distributors, LLC (the “Distributor”) serves as principal underwriter to the Funds. The Distributor is a wholly-owned subsidiary of Ultimus. The Distributor is compensated by the Adviser (not the Funds) for acting as principal underwriter.
Certain officers and a Trustee of the Trust are also employees of Ultimus and are not paid by the Funds for serving in such capacities.
The Board supervises the business activities of the Trust. Each Trustee serves as a trustee until termination of the Trust unless the Trustee dies, resigns, retires, or is removed. The Chairman of the Board and more than 75% of the Trustees are “Independent Trustees,” which means that they are not “interested persons” as defined in the 1940 Act. Each Independent Trustee of the Trust receives annual compensation of $2,785 per fund from the Trust, except that the Chairman of the Audit Committee, the Chairman of the Governance & Nominating Committee, and the Chairman of the Pricing & Liquidity Committee each receives annual compensation of $3,235 per fund from the Trust, and the Independent Chairman of the Board receives $3,435 per fund from the Trust. Independent Trustees also receive $1,000 for attending any special meeting that requires an in person approval of a contract and $250 for the first hour and $200 for each additional hour for attending other special meetings. In addition, the Trust reimburses Independent Trustees for out-of-pocket expenses incurred in conjunction with attendance at meetings.
| FISHER INVESTMENTS INSTITUTIONAL GROUP FUND FAMILY |
| NOTES TO THE FINANCIAL STATEMENTS – (continued) |
| August 31, 2022 |
NOTE 5. INVESTMENT TRANSACTIONS
For the fiscal year ended August 31, 2022, purchases and sales of investment securities, other than short-term investments were as follows:
| | | | | | | | | Fixed | | | ESG Fixed | |
| | | Stock | | | ESG Stock | | | Income | | | Income | |
| | | Fund | | | Fund | | | Fund | | | Fund | |
| Purchases | | $ | 25,796 | | | $ | 24,216 | | | $ | 359,167 | | | $ | 382,333 | |
| Sales | | | 22,381 | | | | 21,062 | | | | 643,327 | | | | 646,233 | |
| U.S. Government Purchases | | | — | | | | — | | | | 670,669 | | | | 671,921 | |
| U.S. Government Sales | | | — | | | | — | | | | 318,157 | | | | 328,226 | |
NOTE 6. BENEFICIAL OWNERSHIP
The beneficial ownership, either directly or indirectly, of more than 25% of the voting securities of a fund creates a presumption of control of a fund, under Section 2(a)(9) of the 1940 Act. As of August 31, 2022, the Adviser owned 100.00%, 100.00%, 100.00% and 100.00% of the Stock Fund, ESG Stock Fund, Fixed Income Fund and ESG Fixed Income Fund outstanding shares, respectively. As a result, the Adviser may be deemed to control each Fund.
NOTE 7. FEDERAL TAX INFORMATION
At August 31, 2022, the net unrealized appreciation (depreciation) and tax cost of investments for tax purposes was as follows:
| | | | | | | | | Fixed | | | ESG Fixed | |
| | | Stock | | | ESG Stock | | | Income | | | Income | |
| | | Fund | | | Fund | | | Fund | | | Fund | |
| Gross unrealized appreciation | | $ | 39,320 | | | $ | 39,289 | | | $ | — | | | $ | — | |
| Gross unrealized depreciation | | | (16,985 | ) | | | (16,533 | ) | | | (345,317 | ) | | | (353,311 | ) |
| Net unrealized appreciation (depreciation) on investments | | | 22,335 | | | | 22,756 | | | | (345,317 | ) | | | (353,311 | ) |
| Tax cost of investments | | | 155,090 | | | | 154,430 | | | | 3,161,899 | | | | 3,153,576 | |
| FISHER INVESTMENTS INSTITUTIONAL GROUP FUND FAMILY |
| NOTES TO THE FINANCIAL STATEMENTS – (continued) |
| August 31, 2022 |
NOTE 7. FEDERAL TAX INFORMATION – continued
The tax character of distributions paid for the fiscal years ended August 31, 2022 and August 31, 2021 were as follows:
| | | Stock | | | ESG Stock | |
| | | Fund | | | Fund | |
| Distributions paid from: | | 2022 | | | 2021 | | | 2022 | | | 2021 | |
| Ordinary income(a) | | $ | 2,617 | | | $ | 2,272 | | | $ | 2,359 | | | $ | 2,459 | |
| Long term capital gains | | | — | | | | — | | | | — | | | | — | |
| Total distributions paid | | $ | 2,617 | | | $ | 2,272 | | | $ | 2,359 | | | $ | 2,459 | |
| | | | | | | | | | | | | | | | | |
| | | Fixed | | | ESG Fixed | |
| | | Income | | | Income | |
| | | Fund | | | Fund | |
| Distributions paid from: | | 2022 | | | 2021 | | | 2022 | | | 2021 | |
| Ordinary income(a) | | $ | 56,361 | | | $ | 100,645 | | | $ | 53,329 | | | $ | 101,495 | |
| Long term capital gains | | | 50 | | | | — | | | | — | | | | — | |
| Total distributions paid | | $ | 56,411 | | | $ | 100,645 | | | $ | 53,329 | | | $ | 101,645 | |
| (a) | Short-term capital gain distributions are treated as ordinary income for tax purposes. |
At August 31, 2022, the components of accumulated earnings (deficit) on a tax basis were as follows:
| | | | | | | | | Fixed | | | ESG Fixed | |
| | | Stock | | | ESG Stock | | | Income | | | Income | |
| | | Fund | | | Fund | | | Fund | | | Fund | |
| Undistributed ordinary income | | $ | 2,025 | | | $ | 2,184 | | | $ | 38,741 | | | $ | 38,639 | |
| Accumulated capital and other losses | | | (1,584 | ) | | | (2,314 | ) | | | (22,424 | ) | | | (28,414 | ) |
| Unrealized appreciation (depreciation) on investments | | | 22,335 | | | | 22,756 | | | | (345,317 | ) | | | (353,311 | ) |
| Total accumulated earnings (deficit) | | $ | 22,776 | | | $ | 22,626 | | | $ | (329,000 | ) | | $ | (343,086 | ) |
| FISHER INVESTMENTS INSTITUTIONAL GROUP FUND FAMILY |
| NOTES TO THE FINANCIAL STATEMENTS – (continued) |
| August 31, 2022 |
NOTE 7. FEDERAL TAX INFORMATION – continued
As of August 31, 2022, the Funds had accumulated capital loss carryforwards as follows:
| | | Not Subject to Expiration | | | | |
| | | Short-Term | | | Long-Term | | | Total | |
| Stock Fund | | $ | 760 | | | $ | 824 | | | $ | 1,584 | |
| ESG Stock Fund | | | 1,596 | | | | 718 | | | | 2,314 | |
| Fixed Income Fund | | | 308 | | | | 22,116 | | | | 22,424 | |
| ESG Fixed Income Fund | | | 315 | | | | 28,099 | | | | 28,414 | |
At August 31, 2022, the ESG Stock Fund utilized short-term capital loss carryforwards of $1.
NOTE 8. SECTOR RISK
If a Fund has significant investments in the securities of issuers within a particular sector, any development affecting that sector will have a greater impact on the value of the net assets of a Fund than would be the case if a Fund did not have significant investments in that sector. In addition, this may increase the risk of loss in a Fund and increase the volatility of a Fund’s NAV per share. For instance, economic or market factors, regulatory changes or other developments may negatively impact all companies in a particular sector, and therefore the value of a Fund’s portfolio will be adversely affected. As of August 31, 2022, the Stock Fund and ESG Stock Fund had 39.36% and 39.17%, respectively, of the value of its net assets invested in stocks within the Technology sector.
NOTE 9. COMMITMENTS AND CONTINGENCIES
The Trust indemnifies its officers and Trustees for certain liabilities that may arise from their performance of their duties to the Trust or the Funds. Additionally, in the normal course of business, the Trust enters into contracts that contain a variety of representations and warranties which provide general indemnifications. The Trust’s maximum exposure under these arrangements is unknown, as this would involve future claims that may be made against the Trust that have not yet occurred.
NOTE 10. SUBSEQUENT EVENTS
Management of the Funds has evaluated the need for disclosures and/or adjustments resulting from subsequent events through the date at which these financial statements were issued. Based upon this evaluation, management has determined there were no items requiring adjustment of the financial statements or additional disclosure.
| REPORT OF INDEPENDENT REGISTERED PUBLIC |
| ACCOUNTING FIRM |
To the Shareholders of Fisher Investments Institutional Group Fund Family and Board of Trustees of Unified Series Trust
Opinion on the Financial Statements
We have audited the accompanying statements of assets and liabilities, including the schedules of investments, of Fisher Investments Institutional Group Stock Fund for Retirement Plans, Fisher Investments Institutional Group ESG Stock Fund for Retirement Plans, Fisher Investments Institutional Group Fixed Income Fund for Retirement Plans, and Fisher Investments Institutional Group ESG Fixed Income Fund for Retirement Plans (the “Funds”), each a series of Unified Series Trust, as of August 31, 2022, the related statements of operations for the year then ended, the statements of changes in net assets for each of the two years in the period then ended, the related notes, and the financial highlights for each of the three periods in the period then ended (collectively referred to as the “financial statements”). In our opinion, the financial statements present fairly, in all material respects, the financial position of each of the Funds as of August 31, 2022, the results of their operations for the year then ended, the changes in net assets for each of the two years in the period then ended, and the financial highlights for each of the three periods in the period then ended, in conformity with accounting principles generally accepted in the United States of America.
Basis for Opinion
These financial statements are the responsibility of the Funds’ management. Our responsibility is to express an opinion on the Funds’ financial statements based on our audits. We are a public accounting firm registered with the Public Company Accounting Oversight Board (United States) (“PCAOB”) and are required to be independent with respect to the Funds in accordance with the U.S. federal securities laws and the applicable rules and regulations of the Securities and Exchange Commission and the PCAOB.
We conducted our audits in accordance with the standards of the PCAOB. Those standards require that we plan and perform the audit to obtain reasonable assurance about whether the financial statements are free of material misstatement whether due to error or fraud.
Our audits included performing procedures to assess the risks of material misstatement of the financial statements, whether due to error or fraud, and performing procedures that respond to those risks. Such procedures included examining, on a test basis, evidence regarding the amounts and disclosures in the financial statements. Our procedures included confirmation of securities owned as of August 31, 2022, by correspondence with the custodian. Our audits also included evaluating the accounting
| REPORT OF INDEPENDENT REGISTERED PUBLIC |
| ACCOUNTING FIRM – (continued) |
principles used and significant estimates made by management, as well as evaluating the overall presentation of the financial statements. We believe that our audits provide a reasonable basis for our opinion.
We have served as the auditor of one or more investment companies advised by Fisher Asset Management, LLC since 2017.
COHEN & COMPANY, LTD.
Chicago, Illinois
October 28, 2022
| LIQUIDITY RISK MANAGEMENT PROGRAM (Unaudited) |
The Funds have adopted and implemented a written liquidity risk management program (the “Program”) as required by Rule 22e-4 (the “Liquidity Rule”) under the 1940 Act. The Program is reasonably designed to assess and manage the Funds’ liquidity risk, taking into consideration, among other factors, each Fund’s investment strategy and the liquidity of its portfolio investments during normal and reasonably foreseeable stressed conditions; its short and long-term cash flow projections; and its cash holdings and access to other funding sources. The Board approved the appointment of the Liquidity Administrator Committee, comprising certain Trust officers and employees of the Adviser. The Liquidity Administrator Committee maintains Program oversight and reports to the Board on at least an annual basis regarding the Program’s operational effectiveness through a written report (the “Report”). The Program’s most recent report, which was presented to the Board for consideration at its meeting held on August 15-16, 2022, outlined the operation of the Program and the adequacy and effectiveness of the Program’s implementation. During the review period, the Funds did not experience unusual stress or disruption to their operations related to purchase and redemption activity. Also, during the review period the Funds held adequate levels of cash and highly liquid investments to meet shareholder redemption activities in accordance with applicable requirements. The Report concluded that the Program is reasonably designed to prevent violation of the Liquidity Rule and has been effectively implemented.
| SUMMARY OF FUND EXPENSES (Unaudited) |
As a shareholder of a Fund, you incur two types of costs: (1) transaction costs and (2) ongoing costs, including management fees and other Fund expenses. These examples are intended to help you understand your ongoing costs (in dollars) of investing in each Fund and to compare these costs with the ongoing costs of investing in other mutual funds. Each Fund’s example is based on an investment of $1,000 invested at the beginning of the period and held for the entire period from March 1, 2022 through August 31, 2022.
Actual Expenses
The first line of the table below provides information about actual account values and actual expenses. You may use the information in this line, together with the amount you invested, to estimate the expenses that you paid over the period. Simply divide your account value by $1,000 (for example, an $8,600 account value divided by $1,000 = 8.6), then multiply the result by the number in the first line under the heading entitled “Expenses Paid During Period” to estimate the expenses you paid on your account during this period.
Hypothetical Example for Comparison Purposes
The second line of the table below provides information about hypothetical account values and hypothetical expenses based on the Fund’s actual expense ratio and an assumed rate of return of 5% per year before expenses, which is not the Fund’s actual return. The hypothetical account values and expenses may not be used to estimate the actual ending account balance or expenses you paid for the period. You may use this information to compare the ongoing costs of investing in the Fund and other funds. To do so, compare this 5% hypothetical example with the 5% hypothetical examples that appear in the shareholder reports of other funds.
| SUMMARY OF FUND EXPENSES (Unaudited) – (continued) |
| | | Beginning | | Ending | | Expenses | | |
| | | Account Value | | Account Value | | Paid | | Annualized |
| | | March 1, | | August 31, | | During | | Expense |
| | | 2022 | | 2022 | | Period(a) | | Ratio |
| Fisher Investments Institutional Group Stock Fund for Retirement Plans |
| Actual | | $1,000.00 | | $911.10 | | $— | | —% |
| Hypothetical(b) | | $1,000.00 | | $1,025.21 | | $— | | —% |
| | | | | | | | | |
| Fisher Investments Institutional Group ESG Stock Fund for Retirement Plans |
| Actual | | $1,000.00 | | $845.00 | | $— | | —% |
| Hypothetical(b) | | $1,000.00 | | $1,025.21 | | $— | | —% |
| | | | | | | | | |
| Fisher Investments Institutional Group Fixed Income Fund for Retirement Plans |
| Actual | | $1,000.00 | | $914.40 | | $— | | —% |
| Hypothetical(b) | | $1,000.00 | | $1,025.21 | | $— | | —% |
| | | | | | | | | |
| Fisher Investments Institutional Group ESG Fixed Income Fund for Retirement Plans |
| Actual | | $1,000.00 | | $842.70 | | $— | | —% |
| Hypothetical(b) | | $1,000.00 | | $1,025.21 | | $— | | —% |
| (a) | Expenses are equal to the Fund’s annualized expense ratios, multiplied by the average account value over the period, multiplied by 184/365 (to reflect the one-half year period). |
| (b) | Hypothetical assumes 5% annual return before expenses. |
| ADDITIONAL FEDERAL TAX INFORMATION (Unaudited) |
The Form 1099-DIV you receive in January 2023 will show the tax status of all distributions paid to your account in calendar year 2022. Shareholders are advised to consult their own tax adviser with respect to the tax consequences of their investment in the Funds. As required by the Internal Revenue Code and/or regulations, shareholders must be notified regarding the status of qualified dividend income for individuals and the dividends received deduction for corporations.
Qualified Dividend Income. The Funds designates the following percentage or up to the maximum amount of such dividends allowable pursuant to the Internal Revenue Code, as qualified dividend income eligible for a reduced tax rate.
| | | | | | | Fixed | | ESG Fixed |
| | | Stock | | ESG Stock | | Income | | Income |
| | | Fund | | Fund | | Fund | | Fund |
| Qualified Dividend Income | | 81.64% | | 87.45% | | 0% | | 0% |
Qualified Business Income. The Funds designates approximately 0% of its ordinary income dividends, or up to the maximum amount of such dividends allowable pursuant to the Internal Revenue Code, as qualified business income.
Dividends Received Deduction. Corporate shareholders are generally entitled to take the dividends received deduction on the portion of the Funds’ dividend distribution that qualifies under tax law. For the Funds’ calendar year 2022 ordinary income dividends, the following percentage qualifies for the corporate dividends received deduction.
| | | | | | | Fixed | | ESG Fixed |
| | | Stock | | ESG Stock | | Income | | Income |
| | | Fund | | Fund | | Fund | | Fund |
| Dividends Received Deduction | | 45.94% | | 48.04% | | 0% | | 0% |
For the year ended August 31, 2022, the Fixed Income Fund designated $50 as long-term capital gain distributions.
| SHAREHOLDER VOTING RESULTS (Unaudited) |
At a Special Shareholder Meeting at which a quorum was present, held on September 6, 2022, Fund shareholders of record as of the close of business on July 5, 2022 voted to approve the following proposal:
Proposal 1: To elect the following individuals to serve on the Board of Trustees of the Trust:
Freddie Jacobs Jr.
Catharine Barrow McGauley
Kenneth G.Y. Grant
Daniel J. Condon
Gary A. Hippenstiel
Stephen A. Little
Ronald C. Tritschler
David R. Carson
| | | Shares | | Shares Voted | | Shares |
| | | Voted in | | Against or | | Needed to |
| Fund | | Favor* | | Abstain* | | Approve* |
| Fisher Investments Institutional Group Stock Fund for Retirement Plans | | 15,356 (100%) | | 0 (0.00%) | | Plurality (greater than 50%) |
| Fisher Investments Institutional Group ESG Stock Fund for Retirement Plans | | 15,356 (100%) | | 0 (0.00%) | | Plurality (greater than 50%) |
| Fisher Investments Institutional Group Fixed Income Fund for Retirement Plans | | 315,351 (100%) | | 0 (0.00%) | | Plurality (greater than 50%) |
| Fisher Investments Institutional Group ESG Fixed Income Fund for Retirement Plans | | 315,149 (100%) | | 0 (0.00%) | | Plurality (greater than 50%) |
| * | As a percentage of the total voting securities of the Fund voted at the meeting at which a quorum was present |
| TRUSTEES AND OFFICERS (Unaudited) |
GENERAL QUALIFICATIONS. The Board supervises the business activities of the Trust. Each Trustee serves as a trustee until termination of the Trust unless the Trustee dies, resigns, retires, or is removed. The Chairman of the Board and more than 75% of the Trustees are “Independent Trustees,” which means that they are not “interested persons” (as defined in the 1940 Act) of the Trust or any adviser, sub-adviser or distributor of the Trust.
The following table provides information regarding the Independent Trustees.
Name, Address*,
(Year of Birth),
Position with Trust**,
Term of Position
with Trust | Principal Occupation During Past 5 Years
and Other Directorships |
Daniel J. Condon (1950)
Chairman, May 2022 to present; Chairman of the Audit Committee; Chairman of the Governance & Nominating Committee, May 2020 to May 2022; Independent Trustee, December 2002 to present | Current: Retired (2017 - present); Trustee, Peak Income Plus Fund (2022 – present). |
Kenneth G.Y. Grant (1949)
Chairman of the Governance & Nominating Committee, May 2022 to present; Chairman, January 2017 to May 2022; Independent Trustee, May 2008 to present | Current: Director, Standpoint Multi-Asset (Cayman) Fund, Ltd. (2019 – present); Director, Advisors Charitable Gift Fund (2020 - present), a Donor Advised Fund; Trustee, Peak Income Plus Fund (2022 – present). Previous: EVP, Benefit Plans Administrative Services, Inc., provider of retirement benefit plans administration (2019 – 2020); Director, Northeast Retirement Services (NRS) LLC, a transfer agent and fund administrator; and Director, Global Trust Company (GTC), a non-depository trust company sponsoring private investment product (2003 – 2019); EVP, NRS (2003 – 2019); GTC, EVP (2008 – 2019); EVP, Savings Banks Retirement Association (2003 – 2019), provider of qualified retirement benefit plans. |
| TRUSTEES AND OFFICERS (Unaudited) – (continued) |
Name, Address*,
(Year of Birth),
Position with Trust**,
Term of Position
with Trust | Principal Occupation During Past 5 Years
and Other Directorships |
Gary E. Hippenstiel (1947)
Chairman of the Pricing & Liquidity Committee; Independent Trustee, December 2002 to present | Current: President and founder of Hippenstiel Investment Counsel LLC (“Hippenstiel”) since 2008. Hippenstiel was registered as an investment adviser from 2008 to December 31, 2019; Trustee, Peak Income Plus Fund (2022 – present). |
Stephen A. Little (1946)
Independent Trustee, December 2002 to present; Chairman, December 2004 to December 2016 | Current: President and founder of The Rose, Inc., a registered investment adviser, since 1993; Trustee, Peak Income Plus Fund (2022 – present). |
Ronald C. Tritschler (1952)
Chairman of the Audit Committee, May 2022 to present; Independent Trustee, January 2007 to present; Interested Trustee, December 2002 to December 2006 | Current: Chief Executive Officer, Director and Legal Counsel of The Webb Companies, a national real estate company, since 2001; Director, Standpoint Multi-Asset (Cayman) Fund, Ltd. (2020 – present); Director of First State Bank of the Southeast (2000 - present); Trustee, Peak Income Plus Fund (2022 – present). |
Catharine B. McGauley (1977)
Independent Trustee, September 2022 to present | Current: Lead Portfolio Manager of Atlantic Charter Insurance, a workers’ compensation insurer, since 2010; Investment Councilor of a Family Office (2015 – present); Senior Analyst/ Advisor for a Boston real estate company and related family (2010 – present); Trustee, Peak Income Plus Fund (2002 – present). |
| TRUSTEES AND OFFICERS (Unaudited) – (continued) |
Name, Address*,
(Year of Birth),
Position with Trust**,
Term of Position
with Trust | Principal Occupation During Past 5 Years
and Other Directorships |
Freddie Jacobs, Jr. (1970)
Independent Trustee, September 2022 to present | Current: Chief Operating Officer and Chief Risk Officer Northeast Retirement Services (NRS) LLC, a transfer agent and fund administrator; and Director, Global Trust Company (GTC), a non-depository trust company sponsoring private investment product (2021- present); Trustee of Buckingham Browne & Nichols (BBN) (2018 – present); Chair of the Finance Committee, BBN (2020 – present); Chairman Board of Directors of Crispus Attucks Fund (2020– present); Board Member and Treasurer of New England Tennis Association (2017 –present); Board Member of Camp Harbor View (2020 – present); Trustee, Peak Income Plus Fund (2002 – present). Previous: SVP, Senior Risk Officer NRS (2013 – 2019). |
| * | The business address for each Trustee is 225 Pictoria Drive, Suite 450, Cincinnati, Ohio 45246. |
| ** | As of the date of this Report, the Trust consists of 31 series. |
The following table provides information regarding the interested Trustee and certain officers of the Trust.
Name, Address*,
(Year of Birth),
Position with Trust,
Term of Position
with Trust | Principal Occupation During Past 5 Years
and Other Directorships |
David R. Carson (1958)
President, January 2016 to August 2021; Interested Trustee, August 2020 to present | Current: Senior Vice President Client Strategies of Ultimus Fund Solutions, LLC, since 2013; Interested Trustee of Ultimus Managers Trust, since 2020; Trustee, Peak Income Plus Fund (2022 – present). |
| TRUSTEES AND OFFICERS (Unaudited) – (continued) |
Name, Address*,
(Year of Birth),
Position with Trust,
Term of Position
with Trust | Principal Occupation During Past 5 Years
and Other Directorships |
Martin R. Dean (1963)
President, August 2021 to present; Vice President, November 2020 to August 2021; Chief Compliance Officer, April 2021 to August 2021; Assistant Chief Compliance Officer, January 2016 to April 2021 | Current: Senior Vice President, Head of Fund Compliance of Ultimus Fund Solutions, LLC, since 2016. |
Zachary P. Richmond (1980)
Treasurer and Chief Financial Officer, November 2014 to present | Current: Vice President, Director of Financial Administration for Ultimus Fund Solutions, LLC, since 2015. |
Gweneth K. Gosselink (1955)
Chief Compliance Officer, August 2021 to present | Current: Assistant Vice President, Senior Compliance Officer of Ultimus Fund Solutions, LLC, since 2019. Previous: Chief Operating Officer & CCO at Miles Capital, Inc. (2013 – 2019). |
Elisabeth A. Dahl(1962)
Secretary, May 2017 to present; Assistant Secretary, March 2016 to May 2017 | Current: Attorney, Ultimus Fund Solutions, LLC, since March 2016. |
Stephen L. Preston (1966)
AML Compliance Officer, May 2017 to present | Current: Vice President and Chief Compliance Officer, Ultimus Fund Solutions, LLC and Ultimus Fund Distributors, LLC, since 2011. |
Lynn E. Wood (1946)
Assistant Chief Compliance Officer, April 2021 to present; Chief Compliance Officer, October 2004 to April 2021 | Current: Managing Member, Buttonwood Compliance Partners, LLC, since 2013. |
| * | The business address for each officer is 225 Pictoria Drive, Suite 450, Cincinnati, Ohio 45246. |
| Other Information (Unaudited) |
The Fund’s Statement of Additional Information (“SAI”) includes additional information about the Trustees and is available without charge, upon request. You may call toll-free at (800) 851-8845 to request a copy of the SAI or to make shareholder inquiries.
| PRIVACY NOTICE |
| |
| | Rev: January 2020 |
| FACTS | WHAT DO THE FISHER INVESTMENTS INSTITUTIONAL GROUP FUND FAMILY (THE “FUNDS”) DO WITH YOUR PERSONAL INFORMATION? |
| Why? | Financial companies choose how they share your personal information. Federal law gives consumers the right to limit some but not all sharing. Federal law also requires us to tell you how we collect, share, and protect your personal information. Please read this notice carefully to understand what we do. |
| What? | The types of personal information we collect and share depend on the product or service you have with us. This information can include: ● Social Security number ● account balances and account transactions ● transaction or loss history and purchase history When you are no longer our customer, we continue to share your information as described in this notice. |
| How? | All financial companies need to share customers’ personal information to run their everyday business. In the section below, we list the reasons financial companies can share their customers’ personal information; the reasons the Funds choose to share; and whether you can limit this sharing. |
| |
| Reasons we can share your personal information | Do the Funds
share? | Can you limit
this sharing? |
For our everyday business purposes— such as to process your transactions, maintain your account(s), respond to court orders and legal investigations, or report to credit bureaus | Yes | No |
For our marketing purposes— to offer our products and services to you | No | We don’t share |
| For joint marketing with other financial companies | No | We don’t share |
For our affiliates’ everyday business purposes— information about your transactions and experiences | No | We don’t share |
For our affiliates’ everyday business purposes— information about your creditworthiness | No | We don’t share |
| For nonaffiliates to market to you | No | We don’t share |
| | | | |
| Questions? | Call (800) 851-8845 |
| Who we are |
| Who is providing this notice? | Fisher Investments Institutional Group Fund Family Ultimus Fund Distributors, LLC (Distributor) Ultimus Fund Solutions, LLC (Administrator) |
| What we do |
| How do the Funds protect my personal information? | To protect your personal information from unauthorized access and use, we use security measures that comply with federal law. These measures include computer safeguards and secured files and buildings. Our service providers are held accountable for adhering to strict policies and procedures to prevent any misuse of your nonpublic personal information. |
| How do the funds collect my personal information? | We collect your personal information, for example, when you ● open an account or deposit money ● make deposits or withdrawals from your account or provide account information |
| Why can’t I limit all sharing? | Federal law gives you the right to limit only ● sharing for affiliates’ everyday business purposes—information about your creditworthiness ● affiliates from using your information to market to you ● sharing for nonaffiliates to market to you State laws and individual companies may give you additional rights to limit sharing. |
| Definitions |
| Affiliates | Companies related by common ownership or control. They can be financial and nonfinancial companies. ● Fisher Asset Management, LLC, d/b/a Fisher Investments, the investment adviser to the Funds, could be deemed to be an affiliate. |
| Nonaffiliates | Companies not related by common ownership or control. They can be financial and nonfinancial companies. ● The Funds do not share your personal information with nonaffiliates so they can market to you |
| Joint marketing | A formal agreement between nonaffiliated financial companies that together market financial products or services to you. ● The Funds don’t jointly market. |
PROXY VOTING
A description of the policies and procedures that each Fund uses to determine how to vote proxies relating to portfolio securities and information regarding how each Fund voted those proxies during the most recent twelve month period ended June 30, are available (1) without charge upon request by calling the Funds at (800) 851-8845 and (2) in Fund documents filed with the Securities and Exchange Commission (“SEC”) on the SEC’s website at www.sec.gov.
TRUSTEES Daniel J. Condon, Chairman David R. Carson Kenneth G.Y. Grant Gary E. Hippenstiel Freddie Jacobs, Jr. Stephen A. Little Catharine B. McGauley Ronald C. Tritschler OFFICERS Martin R. Dean, President Gwen K. Gosselink, Chief Compliance Officer Zachary P. Richmond, Treasurer and Chief Financial Officer Lynn E. Wood, Assistant Chief Compliance Officer INVESTMENT ADVISER Fisher Asset Management, LLC 5525 NW Fisher Creek Drive Camas, WA 98607 DISTRIBUTOR Ultimus Fund Distributors, LLC 225 Pictoria Drive, Suite 450 Cincinnati, OH 45246 | INDEPENDENT REGISTERED PUBLIC ACCOUNTING FIRM Cohen & Company, Ltd. 1350 Euclid Avenue, Suite 800 Cleveland, OH 44115 LEGAL COUNSEL Thompson Hine LLP 312 Walnut Street, 20th Floor Cincinnati, OH 45202 CUSTODIAN U.S. Bank, N.A. 425 Walnut Street Cincinnati, OH 45202 ADMINISTRATOR, TRANSFER AGENT AND FUND ACCOUNTANT Ultimus Fund Solutions, LLC 225 Pictoria Drive, Suite 450 Cincinnati, OH 45246 |
This report is intended only for the information of shareholders or those who have received the Funds’ prospectus which contains information about the Funds’ management fee and expenses. Please read the prospectus carefully before investing.
Distributed by Ultimus Fund Distributors, LLC
Member FINRA/SIPC
Fisher4-AR-22
FISHER INVESTMENTS INSTITUTIONAL GROUP FUND FAMILY |
Annual Report
August 31, 2022
Fisher Investments Institutional Group
U.S. Large Cap Equity Environmental and Social Values Fund
Fund Adviser:
Fisher Asset Management, LLC
5525 NW Fisher Creek Drive,
Camas, Washington 98607
(800) 851-8845
| FISHER INVESTMENTS INSTITUTIONAL GROUP |
| U.S. LARGE CAP EQUITY ENVIRONMENTAL AND SOCIAL VALUES FUND |
| MANAGEMENT’S DISCUSSION OF FUND PERFORMANCE |
| (Unaudited) |
| |
Dear Shareholder:
Market Outlook
From its January 3 high, the S&P 500 breached -20% on June 13, officially entering bear market territory. Year to date, it also ended the first half down -20.0%. While we don’t know when the low will occur exactly, we think it is close. Once a downturn breaches -20% from a high, the end typically isn’t far off, and the items plaguing sentiment this year should resolve gradually. Moreover, markets will soon start pricing the gridlock that likely results from November’s midterm elections, which typically fuels a rally through the midterm year’s end and beyond.
Fundamentally, we believe the economy is in better shape than many appreciate. Q1 GDP’s headline -1.4% annualized drop was unexpected, but it stemmed from inventory changes, imports and government spending—core private sector demand accelerated. Combined, consumer spending, real estate and business investment grew 3.1% annualized in Q1, up from Q4’s 2.3%. Spending’s shifting to services (4.3% annualized growth) from goods (-0.1%) was particularly noteworthy, as it shows reopening’s progress to lagging areas finally seeing pent-up demand unleashed, e.g. travel for business and pleasure. Because GDP is adjusted for inflation, these data reflect increasing economic activity, not higher prices.
According to June’s Deutsche Bank global investor poll, 90% expect a US recession by year end 2023, up from 78% in May. This may prove correct, and equities seem to be pricing in a perceived higher likelihood of recession, but the data so far don’t prove that one is already underway. The Atlanta Fed’s GDPNow model is currently predicting a -2.1% annualized Q2 GDP decline, but the St. Louis Fed’s Nowcast suggests 3.9% growth. Their divergence shows these models are unproven and in need of refinement, in our view. For example, GDPNow’s record since the pandemic has shown greater dispersion from actual results even at quarter-end, when most of the quarter’s data are in.
If the Atlanta Fed’s gauge proves close to correct and Q2 GDP falls, we suspect many headlines will tout this being the second-straight quarterly contraction, one common measure of recession. But in the US, that isn’t the definition used by the National Bureau of Economic Research, the official body that dates US business cycles. We don’t know what determination that body will make, but we think that is worth remembering as late July’s report draws near.
| FISHER INVESTMENTS INSTITUTIONAL GROUP |
| U.S. LARGE CAP EQUITY ENVIRONMENTAL AND SOCIAL VALUES FUND |
| MANAGEMENT’S DISCUSSION OF FUND PERFORMANCE |
| (Unaudited) – (continued) |
| |
Q1 earnings results and commentary suggest many recent concerns are pre-priced into markets. Headline S&P 500 earnings rose roughly 9% y/y with revenues up over 13%. But earnings were largely inflated by Energy’s 268% y/y growth.
The bulk of reporting companies cited inflation and supply chain issues on their earnings calls, and over half cited Ukraine, suggesting these widely known factors are broadly pre-priced already. While they may weigh on sentiment, they aren’t likely to surprise investors for long. Bigger picture, earnings are growing overall even as the economy slows back to pre-pandemic rates as the initial reopening bounce fades. Meanwhile, negative sentiment may punish companies missing expectations, but it also resets expectations, making them easier to clear going forward.
Fears over inflation underpinned the Fed’s half-point rate hike and balance sheet wind down, unveiled in May followed by an additional 75 basis point hike bringing the fed-funds target rate range to 1.5% – 1.75% in June. However, the yield curve (10-year Treasury to fed-funds rate) is still about as steep as the year’s start—it has just shifted upward. Pundits say the 10-year to 2-year Treasury yield curve is close to inversion again, flattening to just six basis points at June’s end, allegedly a warning sign for the economy and widening credit stress. The relevant portion is the 10-year to 3-month or overnight spread, though, since banks’ funding costs are tied more closely to short-term rates and their lending rates are heavily influenced by 10-year Treasury yields. Hence, the 10-year to 3-month Treasury yield curve better approximates banks’ loan profit margins—and incentive to lend. The Fed’s ability to influence lending in this way is its main transmission mechanism for monetary policy. A negative 10-year to 3-month spread would be a risk, and while it has narrowed significantly in recent weeks, it remains positive at 1.15 percentage points currently.
While some fear this “tightening” is problematic for equities, we disagree. Focusing on the level of short-term rates or magnitude of hikes pales in comparison to the yield curve’s overall shape. This is also why talk of quantitative tightening (QT) hitting markets via “tighter credit conditions” is backwards. The Fed has said it will let a maximum of $95 billion a month in Treasurys mature without replacement on its balance sheet. In theory, doing so would mean less Fed bond buying, putting less downward pressure on long rates. If that happens, the yield curve would steepen, which few see as a signal of economic trouble or credit stress. But since Treasurys’ average daily trading volume is regularly well over half a trillion dollars, the scope of the Fed’s actions looks too small to cause material waves. In our view, this is why the Fed’s 2017 rate hikes also coincided with so-called QT amid a year of economic growth and strong stock market returns. Meanwhile, the Fed has telegraphed these
| FISHER INVESTMENTS INSTITUTIONAL GROUP |
| U.S. LARGE CAP EQUITY ENVIRONMENTAL AND SOCIAL VALUES FUND |
| MANAGEMENT’S DISCUSSION OF FUND PERFORMANCE |
| (Unaudited) – (continued) |
| |
moves well in advance. We don’t think taking its word for them is necessarily wise, but markets expected them already, which swaps any negative surprise power they might have had.
Moreover, a 10-year to 3-month yield curve inversion isn’t a timing tool and wouldn’t automatically be a trigger. Particularly in this cycle, banks remain flooded with deposits—rates banks pay on them are still pinned near zero. While the situation bears monitoring with nascent pressure to raise deposit rates, for now, credit is coursing strongly through the economy and driving investment. Total US loan growth has accelerated to 10.2% y/y through the week of June 22, approaching May 2020 emergency lockdown lending’s peak growth of 11.6%. Commercial and industrial lending is rising at a 9.1% y/y rate, and consumer lending is running at 12.5%, both historically high levels inconsistent with recession.
Performance Attribution
The Fisher Investments Institutional Group U.S. Large Cap Equity Environmental and Social Values Fund underperformed the S&P 500 Index for the period from September 1, 2021 through August 31, 2022. During this period, the Fund returned -21.68% while the Fund’s primary benchmark, the S&P 500 Index, returned -11.23%. Sector allocation contributed to relative return, while equity selection detracted. An overweight to Energy was the largest contributor to relative return, as the sector outperformed the broader benchmark. Additionally, selection within Metals & Mining contributed, as Nucor outperformed. Conversely, an overweight to and selection within Information Technology was the largest detractor, driven by online payments system provider PayPal, semiconductor company Nvidia and cloud computing company Salesforce. Further, an underweight to and selection within Health Care detracted, as medical device company Align Technology, medication company Intuitive Surgical and biotechnology company Biogen underperformed.
Portfolio Shifts
For the period from September 1, 2021 through August 31, 2022, we haven’t made any significant shifts in the portfolio. Portfolio deviations are largely attributed to market movements rather than fundamental shifts.
| FISHER INVESTMENTS INSTITUTIONAL GROUP |
| U.S. LARGE CAP EQUITY ENVIRONMENTAL AND SOCIAL VALUES FUND |
| Investment Results (Unaudited) |
| Average Annual Total Return as of August 31, 2022(a) |
| Fund/Index | One Year | Since
Inception
(7/17/20) |
| Fisher Investments Institutional Group U.S. Large Cap Equity Environmental and Social Values Fund | (21.68)% | 8.84% |
| S&P 500 Index(b) | (11.23)% | 11.77% |
| | | |
| | | Expense |
| | | Ratios(c) |
| Gross | | 74.51% |
| With Applicable Expense Cap | | 0.47% |
| | | |
The performance quoted represents past performance, which does not guarantee future results. The investment return and principal value of an investment will fluctuate so that an investor’s shares, when redeemed, may be worth more or less than their original cost. The returns shown do not reflect deduction of taxes that a shareholder would pay on Fisher Investments Institutional Group U.S. Large Cap Environmental and Social Values Fund (the “Fund”) distributions or the redemption of Fund shares. Current performance of the Fund may be lower or higher than the performance quoted. The Fund’s investment objectives, risks, charges and expenses must be considered carefully before investing. Performance data current to the most recent month end may be obtained by calling (800) 851-8845.
| (a) | Return figures reflect any change in price per share and assume the reinvestment of all distributions. |
| (b) | The S&P 500 Index (“S&P Index”) is a widely recognized unmanaged index of equity securities and is representative of a broader domestic equity market and range of securities than is found in the Fund’s portfolio. Individuals cannot invest directly in the S&P Index; however, an individual can invest in exchange traded funds or other investment vehicles that attempt to track the performance of a benchmark index. Index returns assume reinvestment of dividends and do not reflect any fees or expenses. |
| (c) | The expense ratios are from the Fund’s prospectus dated December 29, 2021. Fisher Asset Management, LLC, d/b/a Fisher Investments (the “Adviser”) is contractually obligated to limit the Fund’s total annual operating expenses to 0.47% of the Fund’s average daily net assets through December 31, 2026 (excluding portfolio transaction and other investment-related costs (including brokerage fees and commissions); taxes; borrowing costs (such as interest and dividend expenses on securities sold short); acquired fund fees and expenses; certain fees and expenses associated with investments in other collective investment vehicles or derivative instruments (including for example option and swap fees and expenses); any administrative and/ or shareholder servicing fees payable pursuant to a plan adopted by the Board of Trustees; expenses incurred in connection with any merger or reorganization; extraordinary expenses (such as litigation expenses, indemnification of Trust officers and Trustees and contractual indemnification of Fund service providers); and other expenses that the Trustees agree have not been incurred in the ordinary course of the Fund’s business). This expense cap may not be terminated prior to this date except by the Board of Trustees. Each waiver/expense payment by the Adviser is subject to recoupment by the Adviser from the Fund in the three years following the date the particular waiver/expense payment occurred, but only if such recoupment can be achieved without exceeding the annual expense limitation in effect at the time of the waiver/expense payment and any expense limitation in effect at the time of the recoupment. Additional information pertaining to the Fund’s expense ratios as of August 31, 2022 can be found in the financial highlights. |
The Fund’s investment objective, strategies, risks, charges and expenses must be considered carefully before investing. The Fund’s prospectus contains this and other important information about the investment company and may be obtained by calling (800) 851-8845. Please read it carefully before investing.
The Fund is distributed by Ultimus Fund Distributors, LLC, Member FINRA/SIPC
| FISHER INVESTMENTS INSTITUTIONAL GROUP |
| U.S. LARGE CAP EQUITY ENVIRONMENTAL AND SOCIAL VALUES FUND |
| Investment Results (Unaudited) – (continued) |
| |
Comparison of the Growth of a $10,000 Investment in the Fisher Investments Institutional Group
U.S. Large Cap Equity Environmental and Social Values Fund and the S&P 500 Index (Unaudited)
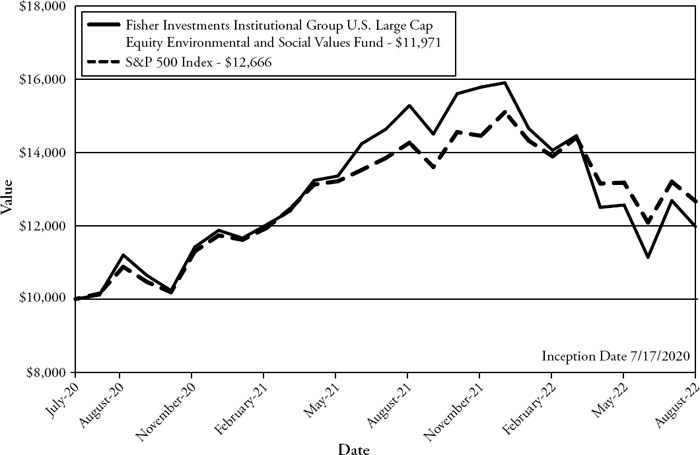
This graph shows the value of a hypothetical initial investment of $10,000 made on July 17, 2020 (commencement of operations) and held through August 31, 2022. S&P 500 Index is a widely recognized unmanaged index of equity securities and is representative of a broader domestic equity market and range of securities than is found in the Fund’s portfolio. Individuals cannot invest directly in an index; however, an individual may invest in exchange traded funds or other investment vehicles that attempt to track the performance of a benchmark index. THE FUND’S RETURN REPRESENTS PAST PERFORMANCE AND DOES NOT GUARANTEE OR PREDICT FUTURE RESULTS. The returns shown do not reflect deduction of taxes that a shareholder would pay on Fund distributions or the redemption of Fund shares. Investment returns and principal values will fluctuate so that an investor’s shares, when redeemed, may be worth more or less than their original cost.
Current performance may be lower or higher than the performance data quoted. For more information on the Fund, and to obtain performance data current to the most recent month-end, or to request a prospectus, please call (800) 851-8845. You should carefully consider the investment objectives, risks, charges and expenses of the Fund before investing. The Fund’s prospectus contains this and other information about the Fund and should be read carefully before investing.
The Fund is distributed by Ultimus Fund Distributors, LLC, member FINRA/SIPC.
| FISHER INVESTMENTS INSTITUTIONAL GROUP |
| U.S. LARGE CAP EQUITY ENVIRONMENTAL AND SOCIAL VALUES FUND |
| Fund Holdings (Unaudited) |
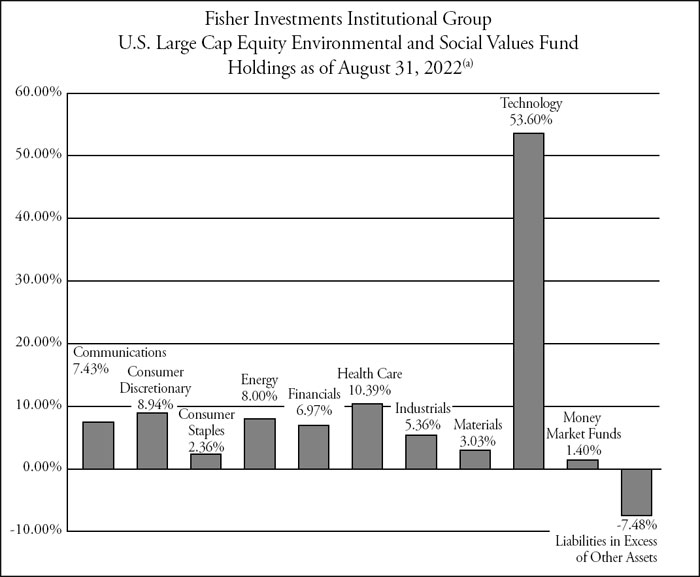
| (a) | As a percentage of net assets. |
The Fund seeks to outperform, net of fees and expenses, the return of the S&P 500 Index as its investment objective.
Availability of Portfolio Schedule – (Unaudited)
The Fund files its complete schedule of portfolio holdings with the Securities and Exchange Commission (the “SEC”) for the first and third quarters of each fiscal year as an exhibit to its reports on Form N-PORT. The Fund’s Form N-PORT reports are available on the SEC’s website at http://www.sec.gov.
| FISHER INVESTMENTS INSTITUTIONAL GROUP |
| U.S. LARGE CAP EQUITY ENVIRONMENTAL AND SOCIAL VALUES FUND |
| SCHEDULE OF INVESTMENTS |
| August 31, 2022 |
| COMMON STOCKS — 106.08% | | Shares | | | Fair Value | |
| Communications — 7.43% | | | | | | | | |
| Alphabet, Inc., Class A(a) | | | 60 | | | $ | 6,493 | |
| Meta Platforms, Inc., Class A(a) | | | 27 | | | | 4,399 | |
| Netflix, Inc.(a) | | | 11 | | | | 2,459 | |
| | | | | | | | 13,351 | |
| Consumer Discretionary — 8.94% | | | | | | | | |
| Amazon.com, Inc.(a) | | | 63 | | | | 7,987 | |
| Home Depot, Inc. (The) | | | 28 | | | | 8,075 | |
| | | | | | | | 16,062 | |
| Consumer Staples — 2.36% | | | | | | | | |
| Costco Wholesale Corp. | | | 4 | | | | 2,089 | |
| General Mills, Inc. | | | 18 | | | | 1,382 | |
| Kimberly-Clark Corp. | | | 6 | | | | 765 | |
| | | | | | | | 4,236 | |
| Energy — 8.00% | | | | | | | | |
| ConocoPhillips | | | 30 | | | | 3,284 | |
| Exxon Mobil Corp. | | | 19 | | | | 1,816 | |
| Halliburton Co. | | | 64 | | | | 1,928 | |
| Hess Corp. | | | 28 | | | | 3,381 | |
| Pioneer Natural Resources Co. | | | 12 | | | | 3,039 | |
| Schlumberger Ltd. | | | 24 | | | | 916 | |
| | | | | | | | 14,364 | |
| Financials — 6.97% | | | | | | | | |
| American Express Co. | | | 26 | | | | 3,952 | |
| BlackRock, Inc. | | | 5 | | | | 3,332 | |
| Goldman Sachs Group, Inc. (The) | | | 12 | | | | 3,992 | |
| JPMorgan Chase & Co. | | | 11 | | | | 1,251 | |
| | | | | | | | 12,527 | |
| Health Care — 10.39% | | | | | | | | |
| Abbott Laboratories | | | 17 | | | | 1,745 | |
| Align Technology, Inc.(a) | | | 9 | | | | 2,193 | |
| Amgen, Inc. | | | 5 | | | | 1,202 | |
| Biogen, Inc.(a) | | | 6 | | | | 1,172 | |
| DexCom, Inc.(a) | | | 11 | | | | 904 | |
| IDEXX Laboratories, Inc.(a) | | | 3 | | | | 1,043 | |
| Intuitive Surgical, Inc.(a) | | | 17 | | | | 3,497 | |
| Johnson & Johnson | | | 5 | | | | 807 | |
| Medtronic PLC | | | 16 | | | | 1,407 | |
| | | | | | | | | |
See accompanying notes which are an integral part of these financial statements.
| FISHER INVESTMENTS INSTITUTIONAL GROUP |
| U.S. LARGE CAP EQUITY ENVIRONMENTAL AND SOCIAL VALUES FUND |
| SCHEDULE OF INVESTMENTS – (continued) |
| August 31, 2022 |
| COMMON STOCKS — 106.08% - continued | | Shares | | | Fair Value | |
| Health Care — 10.39% - continued | | | | | | | | |
| Merck & Co., Inc. | | | 34 | | | $ | 2,901 | |
| Pfizer, Inc. | | | 20 | | | | 905 | |
| ResMed, Inc. | | | 4 | | | | 880 | |
| Viatris, Inc. | | | 1 | | | | 10 | |
| | | | | | | | 18,666 | |
| Industrials — 5.36% | | | | | | | | |
| 3M Co. | | | 7 | | | | 870 | |
| Caterpillar, Inc. | | | 9 | | | | 1,662 | |
| HEICO Corp. | | | 10 | | | | 1,523 | |
| Norfolk Southern Corp. | | | 4 | | | | 973 | |
| Rockwell Automation, Inc. | | | 12 | | | | 2,844 | |
| United Parcel Service, Inc., Class B | | | 9 | | | | 1,750 | |
| | | | | | | | 9,622 | |
| Materials — 3.03% | | | | | | | | |
| Nucor Corp. | | | 41 | | | | 5,451 | |
| | | | | | | | | |
| Technology — 53.60% | | | | | | | | |
| Adobe, Inc.(a) | | | 11 | | | | 4,108 | |
| Advanced Micro Devices, Inc.(a) | | | 78 | | | | 6,620 | |
| Apple, Inc. | | | 123 | | | | 19,338 | |
| Autodesk, Inc.(a) | | | 16 | | | | 3,228 | |
| Cisco Systems, Inc. | | | 55 | | | | 2,460 | |
| Intel Corp. | | | 64 | | | | 2,043 | |
| Microsoft Corp. | | | 49 | | | | 12,813 | |
| MSCI, Inc. | | | 13 | | | | 5,840 | |
| NVIDIA Corp. | | | 70 | | | | 10,565 | |
| Oracle Corp. | | | 41 | | | | 3,040 | |
| PayPal Holdings, Inc.(a) | | | 40 | | | | 3,738 | |
| QUALCOMM, Inc. | | | 30 | | | | 3,968 | |
| salesforce.com, Inc.(a) | | | 35 | | | | 5,464 | |
| Texas Instruments, Inc. | | | 32 | | | | 5,287 | |
| Visa, Inc., Class A | | | 39 | | | | 7,749 | |
| | | | | | | | 96,261 | |
| | | | | | | | | |
| Total Common Stocks (Cost $171,519) | | | | | | | 190,540 | |
| | | | | | | | | |
See accompanying notes which are an integral part of these financial statements.
| FISHER INVESTMENTS INSTITUTIONAL GROUP |
| U.S. LARGE CAP EQUITY ENVIRONMENTAL AND SOCIAL VALUES FUND |
| SCHEDULE OF INVESTMENTS – (continued) |
| August 31, 2022 |
| MONEY MARKET FUNDS — 1.40% | | Shares | | | Fair Value | |
| First American Government Obligations Fund, Class X, 2.04%(b) | | | 2,508 | | | $ | 2,508 | |
| | | | | | | | | |
| Total Money Market Funds (Cost $2,508) | | | | | | | 2,508 | |
| | | | | | | | | |
| Total Investments — 107.48% (Cost $174,027) | | | | | | | 193,048 | |
| | | | | | | | | |
| Liabilities in Excess of Other Assets — (7.48)% | | | | | | | (13,434 | ) |
| | | | | | | | | |
| NET ASSETS — 100.00% | | | | | | $ | 179,614 | |
| | | | | | | | | |
| (a) | Non-income producing security. |
| (b) | Rate disclosed is the seven day effective yield as of August 31, 2022. |
See accompanying notes which are an integral part of these financial statements.
| FISHER INVESTMENTS INSTITUTIONAL GROUP |
| U.S. LARGE CAP EQUITY ENVIRONMENTAL AND SOCIAL VALUES FUND |
| STATEMENT OF ASSETS AND LIABILITIES |
| August 31, 2022 |
| Assets | | | | |
| Investments in securities at fair value (cost $174,027) | | $ | 193,048 | |
| Dividends receivable | | | 270 | |
| Receivable from Adviser | | | 12,769 | |
| Prepaid expenses | | | 4,551 | |
| Total Assets | | | 210,638 | |
| Liabilities | | | | |
| Payable to Affiliates | | | 7,372 | |
| Accrued audit and tax fees | | | 18,900 | |
| Other accrued expenses | | | 4,752 | |
| Total Liabilities | | | 31,024 | |
| Net Assets | | $ | 179,614 | |
| Net Assets consist of: | | | | |
| Paid-in capital | | | 155,398 | |
| Accumulated earnings | | | 24,216 | |
| Net Assets | | $ | 179,614 | |
| Shares outstanding (unlimited number of shares authorized, no par value) | | | 15,360 | |
| Net asset value, offering and redemption price per share | | $ | 11.69 | |
| | | | | |
See accompanying notes which are an integral part of these financial statements.
| FISHER INVESTMENTS INSTITUTIONAL GROUP |
| U.S. LARGE CAP EQUITY ENVIRONMENTAL AND SOCIAL VALUES FUND |
| STATEMENT OF OPERATIONS |
| For the year ended August 31, 2022 |
| Investment Income | | | | |
| Dividend income | | $ | 2,388 | |
| Total investment income | | | 2,388 | |
| Expenses | | | | |
| Administration | | | 44,717 | |
| Legal | | | 19,070 | |
| Audit and tax | | | 18,860 | |
| Trustee | | | 14,583 | |
| Transfer agent | | | 12,000 | |
| Compliance services | | | 12,000 | |
| Report printing | | | 3,653 | |
| Custodian | | | 2,499 | |
| Registration | | | 1,504 | |
| Adviser | | | 836 | |
| Pricing | | | 333 | |
| Miscellaneous | | | 18,450 | |
| Total expenses | | | 148,505 | |
| Fees waived and expenses reimbursed by Adviser | | | (147,523 | ) |
| Net operating expenses | | | 982 | |
| Net investment income | | | 1,406 | |
| Net Realized and Change in Unrealized Gain (Loss) on Investments | | | | |
| Net realized gain on investment securities transactions | | | 7,217 | |
| Net change in unrealized depreciation of investment securities | | | (58,231 | ) |
| Net realized and change in unrealized loss on investments | | | (51,014 | ) |
| Net decrease in net assets resulting from operations | | $ | (49,608 | ) |
| | | | | |
See accompanying notes which are an integral part of these financial statements.
| FISHER INVESTMENTS INSTITUTIONAL GROUP |
| U.S. LARGE CAP EQUITY ENVIRONMENTAL AND SOCIAL VALUES FUND |
| STATEMENTS OF CHANGES IN NET ASSETS |
| | | For the | | | For the | |
| | | Year Ended | | | Year Ended | |
| | | August 31, | | | August 31, | |
| | | 2022 | | | 2021 | |
| Increase (Decrease) in Net Assets due to: | | | | | | | | |
| Operations | | | | | | | | |
| Net investment income | | $ | 1,406 | | | $ | 1,119 | |
| Net realized gain on investment securities transactions | | | 7,217 | | | | 745 | |
| Net change in unrealized appreciation (depreciation) of investment securities | | | (58,231 | ) | | | 59,421 | |
| Net increase (decrease) in net assets resulting from operations | | | (49,608 | ) | | | 61,285 | |
| Distributions From: | | | | | | | | |
| Earnings | | | (4,897 | ) | | | (505 | ) |
| Total distributions | | | (4,897 | ) | | | (505 | ) |
| Capital Transactions | | | | | | | | |
| Reinvestment of distributions | | | 4,896 | | | | 505 | |
| Amount paid for shares redeemed | | | (13 | ) | | | — | |
| Net increase in net assets resulting from capital transactions | | | 4,883 | | | | 505 | |
| Total Increase (Decrease) in Net Assets | | | (49,622 | ) | | | 61,285 | |
| Net Assets | | | | | | | | |
| Beginning of year | | | 229,236 | | | | 167,951 | |
| End of year | | $ | 179,614 | | | $ | 229,236 | |
| Share Transactions | | | | | | | | |
| Shares issued in reinvestment of distributions | | | 317 | | | | 43 | |
| Shares redeemed | | | (1 | ) | | | — | |
| Net increase in shares | | | 316 | | | | 43 | |
| | | | | | | | | |
See accompanying notes which are an integral part of these financial statements.
| FISHER INVESTMENTS INSTITUTIONAL GROUP |
| U.S. LARGE CAP EQUITY ENVIRONMENTAL AND SOCIAL VALUES FUND |
| FINANCIAL HIGHLIGHTS |
| |
| (For a share outstanding during each period) |
| | | For the | | | For the | | | For the | |
| | | Year Ended | | | Year Ended | | | Period Ended | |
| | | August 31, | | | August 31, | | | August 31, | |
| | | 2022 | | | 2021 | | | 2020(a) | |
| Selected Per Share Data: | | | | | | | | | | | | |
| Net asset value, beginning of period | | $ | 15.24 | | | $ | 11.20 | | | $ | 10.00 | |
| Investment operations: | | | | | | | | | | | | |
| Net investment income | | | 0.09 | | | | 0.07 | | | | 0.01 | |
| Net realized and unrealized gain (loss) | | | (3.32 | ) | | | 4.00 | | | | 1.19 | |
| Total from investment operations | | | (3.23 | ) | | | 4.07 | | | | 1.20 | |
| Less distributions from: | | | | | | | | | | | | |
| Net investment income | | | (0.07 | ) | | | (0.03 | ) | | | — | |
| Net realized gains | | | (0.25 | ) | | | — | | | | — | |
| Total distributions | | | (0.32 | ) | | | (0.03 | ) | | | — | |
| Net asset value, end of period | | $ | 11.69 | | | $ | 15.24 | | | $ | 11.20 | |
| Total Return(b) | | | (21.68 | )% | | | 36.46 | % | | | 12.00 | % (c) |
| Ratios and Supplemental Data: | | | | | | | | | | | | |
| Net assets, end of period (000 omitted) | | $ | 180 | | | $ | 229 | | | $ | 168 | |
| Ratio of net expenses to average net assets | | | 0.47 | % | | | 0.47 | % | | | 0.47 | % (d) |
| Ratio of gross expenses to average net assets before waiver and reimbursement | | | 71.11 | % | | | 74.51 | % | | | 185.76 | % (d) |
| Ratio of net investment income to average net assets | | | 0.67 | % | | | 0.60 | % | | | 0.60 | % (d) |
| Portfolio turnover rate | | | 12 | % | | | 9 | % | | | — | % (c) |
| | | | | | | | | | | | | |
| (a) | For the period July 17, 2020 (commencement of operations) to August 31, 2020. |
| (b) | Total return represents the rate that the investor would have earned or lost on an investment in the Fund, assuming reinvestment of distributions. |
See accompanying notes which are an integral part of these financial statements.
| FISHER INVESTMENTS INSTITUTIONAL GROUP |
| U.S. LARGE CAP EQUITY ENVIRONMENTAL AND SOCIAL VALUES FUND |
| NOTES TO THE FINANCIAL STATEMENTS |
| August 31, 2022 |
NOTE 1. ORGANIZATION
Fisher Investments Institutional Group U.S. Large Cap Equity Environmental and Social Values Fund (the “Fund”) is registered under the Investment Company Act of 1940, as amended (“1940 Act”), as a diversified series of Unified Series Trust (the “Trust”) on November 12, 2018. The Trust is an open-end investment company established under the laws of Ohio by an Agreement and Declaration of Trust dated October 14, 2002 (the “Trust Agreement”). The Trust Agreement permits the Board of Trustees of the Trust (the “Board”) to issue an unlimited number of shares of beneficial interest of separate series without par value. The Fund is one of a series of funds currently authorized by the Board. The Fund commenced operations on July 17, 2020. The investment adviser to the Fund is Fisher Asset Management, LLC, d/b/a Fisher Investments (the “Adviser”). The Fund seeks to outperform, net of fees and expenses, the return of the S&P 500 Index as its investment objective.
NOTE 2. SIGNIFICANT ACCOUNTING POLICIES
The Fund is an investment company and follows accounting and reporting guidance under Financial Accounting Standards Board Accounting Standards Codification (“ASC”) Topic 946, “Financial Services-Investment Companies”, including Accounting Standards Update 2013-08. The following is a summary of significant accounting policies followed by the Fund in the preparation of its financial statements. These policies are in conformity with generally accepted accounting principles in the United States of America (“GAAP”).
Estimates – The preparation of financial statements in conformity with GAAP requires management to make estimates and assumptions that affect the reported amounts of assets and liabilities and disclosure of contingent assets and liabilities at the date of the financial statements and the reported amounts of increases and decreases in net assets from operations during the reporting period. Actual results could differ from those estimates.
Federal Income Taxes – The Fund makes no provision for federal income or excise tax. The Fund has qualified and intends to qualify each year as a regulated investment company (“RIC”) under subchapter M of the Internal Revenue Code of 1986, as amended, by complying with the requirements applicable to RICs and by distributing substantially all of its taxable income. The Fund also intends to distribute sufficient
| FISHER INVESTMENTS INSTITUTIONAL GROUP |
| U.S. LARGE CAP EQUITY ENVIRONMENTAL AND SOCIAL VALUES FUND |
| NOTES TO THE FINANCIAL STATEMENTS – (continued) |
| August 31, 2022 |
NOTE 2. SIGNIFICANT ACCOUNTING POLICIES – continued
net investment income and net realized capital gains, if any, so that it will not be subject to excise tax on undistributed income and gains. If the required amount of net investment income or gains is not distributed, the Fund could incur a tax expense.
As of and during the fiscal year ended August 31, 2022, the Fund did not have any liabilities for any unrecognized tax benefits. The Fund recognizes interest and penalties, if any, related to unrecognized tax benefits as income tax expense on the Statement of Operations when incurred. During the fiscal year ended August 31, 2022, the Fund did not incur any interest or penalties. Management of the Fund has reviewed tax positions taken in tax years that remain subject to examination by all major tax jurisdictions, including federal (i.e., the last three tax year ends and the interim tax period since then, as applicable). Management believes that there is no tax liability resulting from unrecognized tax benefits related to uncertain tax positions taken.
Expenses – Expenses incurred by the Trust that do not relate to a specific fund of the Trust are allocated to the individual funds based on each fund’s relative net assets or another appropriate basis (as determined by the Board).
Security Transactions and Related Income – The Fund follows industry practice and records security transactions on the trade date for financial reporting purposes. The specific identification method is used for determining gains or losses for financial statements and income tax purposes. Dividend income is recorded on the ex-dividend date and interest income is recorded on an accrual basis. Withholding taxes on foreign dividends and related reclaims have been provided for in accordance with the Fund’s understanding of the applicable country’s tax rules and rates.
Dividends and Distributions – The Fund intends to distribute its net investment income and net realized long-term and short-term capital gains, if any, at least annually. Dividends and distributions to shareholders, which are determined in accordance with income tax regulations, are recorded on the ex-dividend date. The treatment for financial reporting purposes of distributions made to shareholders during the period from net investment income or net realized capital gains may differ from their ultimate treatment for federal income tax purposes. These differences are caused primarily by differences in the timing of the recognition of certain components of income, expense or realized capital gain for federal income tax purposes. Where such differences are permanent in nature, they are reclassified among the components of net assets based on their ultimate characterization for federal income tax purposes. Any such reclassifications will have no effect on net assets, results of operations or net asset value (“NAV”) per share of the Fund.
| FISHER INVESTMENTS INSTITUTIONAL GROUP |
| U.S. LARGE CAP EQUITY ENVIRONMENTAL AND SOCIAL VALUES FUND |
| NOTES TO THE FINANCIAL STATEMENTS – (continued) |
| August 31, 2022 |
NOTE 3. SECURITIES VALUATION AND FAIR VALUE MEASUREMENTS
The Fund values its portfolio securities at fair value as of the close of regular trading on the New York Stock Exchange (“NYSE”) (normally 4:00 p.m. Eastern time) on each business day the NYSE is open for business. Fair value is defined as the price that the Fund would receive upon selling an investment in a timely transaction to an independent buyer in the principal or most advantageous market of the investment. GAAP establishes a three-tier hierarchy to maximize the use of observable market data and minimize the use of unobservable inputs and to establish classification of fair value measurements for disclosure purposes.
Inputs refer broadly to the assumptions that market participants would use in pricing the asset or liability, including assumptions about risk (the risk inherent in a particular valuation technique used to measure fair value including a pricing model and/or the risk inherent in the inputs to the valuation technique). Inputs may be observable or unobservable. Observable inputs are inputs that reflect the assumptions market participants would use in pricing the asset or liability developed based on market data obtained and available from sources independent of the reporting entity. Unobservable inputs are inputs that reflect the reporting entity’s own assumptions about the assumptions market participants would use in pricing the asset or liability developed based on the best information available in the circumstances.
Various inputs are used in determining the value of the Fund’s investments. These inputs are summarized in the three broad levels listed below.
| ● | Level 1 – unadjusted quoted prices in active markets for identical investments and/or registered investment companies where the value per share is determined and published and is the basis for current transactions for identical assets or liabilities at the valuation date |
| ● | Level 2 – other significant observable inputs (including, but not limited to, quoted prices for an identical security in an inactive market, quoted prices for similar securities, interest rates, prepayment speeds, credit risk, etc.) |
| ● | Level 3 – significant unobservable inputs (including the Fund’s own assumptions in determining fair value of investments based on the best information available) |
| FISHER INVESTMENTS INSTITUTIONAL GROUP |
| U.S. LARGE CAP EQUITY ENVIRONMENTAL AND SOCIAL VALUES FUND |
| NOTES TO THE FINANCIAL STATEMENTS – (continued) |
| August 31, 2022 |
NOTE 3. SECURITIES VALUATION AND FAIR VALUE MEASUREMENTS – continued
The inputs used to measure fair value may fall into different levels of the fair value hierarchy. In such cases, for disclosure purposes, the level in the fair value hierarchy which is reported is determined based on the lowest level input that is significant to the fair value measurement in its entirety.
Equity securities that are traded on any stock exchange are generally valued at the last quoted sale price on the security’s primary exchange. Lacking a last sale price, an exchange-traded security is generally valued at its last bid price. Securities traded in the NASDAQ over-the-counter market are generally valued at the NASDAQ Official Closing Price. When using market quotations and when the market is considered active, the security is classified as a Level 1 security. In the event that market quotations are not readily available or are considered unreliable due to market or other events, the Fund values its securities and other assets at fair value in accordance with policies established by and under the general supervision of the Board. Under these policies, the securities will be classified as Level 2 or 3 within the fair value hierarchy, depending on the inputs used.
Investments in mutual funds, including money market mutual funds, are generally priced at the ending NAV provided by the service agent of the mutual funds. These securities are categorized as Level 1 securities.
In accordance with the Trust’s valuation policies, the Board or Adviser as Valuation Designee is required to consider all appropriate factors relevant to the value of securities for which it has determined other pricing sources are not available or reliable as described above. No single method exists for determining fair value, because fair value depends upon the circumstances of each individual case. As a general principle, the current fair value of a security being valued by the Valuation Designee would be the amount that the Fund might reasonably expect to receive upon the current sale. Methods that are in accordance with this principle may, for example, be based on (i) a multiple of earnings; (ii) a discount from market prices of a similar freely traded security (including a derivative security or a basket of securities traded on other markets, exchanges or among dealers); or (iii) yield to maturity with respect to debt issues, or a combination of these and other methods. Fair-value pricing is permitted if, in the Valuation Designee’s opinion, the validity of market quotations appears to be questionable based on factors such as evidence of a thin market in the security based on a small number of quotations, a significant event occurs after the
| FISHER INVESTMENTS INSTITUTIONAL GROUP |
| U.S. LARGE CAP EQUITY ENVIRONMENTAL AND SOCIAL VALUES FUND |
| NOTES TO THE FINANCIAL STATEMENTS – (continued) |
| August 31, 2022 |
NOTE 3. SECURITIES VALUATION AND FAIR VALUE MEASUREMENTS – continued
close of a market but before the Fund’s NAV calculation that may affect a security’s value, or the Valuation Designee is aware of any other data that calls into question the reliability of market quotations.
The following is a summary of the inputs used to value the Fund’s investments as of August 31, 2022:
| | | Valuation Inputs | |
| | | Level 1 | | | Level 2 | | | Level 3 | | | Total | |
| Assets | | | | | | | | | | | | | | | | |
| Common Stocks(a) | | $ | 190,540 | | | $ | — | | | $ | — | | | $ | 190,540 | |
| Money Market Funds | | | 2,508 | | | | — | | | | — | | | | 2,508 | |
| Total | | $ | 193,048 | | | $ | — | | | $ | — | | | $ | 193,048 | |
| (a) | Refer to Schedule of Investments for sector classifications. |
The Fund did not hold any investments at the end of the reporting period for which significant unobservable inputs (Level 3) were used in determining fair value; therefore, no reconciliation of Level 3 securities is included for this reporting period. The Fund did not hold any derivative instruments during the reporting period.
NOTE 4. FEES AND OTHER TRANSACTIONS WITH AFFILIATES
The Adviser, under the terms of the management agreement (the “Agreement”) with the Trust with respect to the Fund, manages the Fund’s investments. As compensation for its management services, the Fund is obligated to pay the Adviser a fee computed and accrued daily and paid monthly at an annual rate of 0.40% of the Fund’s average daily net assets. For the fiscal year ended August 31, 2022, the Adviser earned fees of $836 from the Fund before the waiver and reimbursement described below.
The Adviser is contractually obligated to limit the Fund’s total annual operating expenses to 0.47% of the Fund’s average daily net assets through December 31, 2026 (excluding portfolio transaction and other investment-related costs (including brokerage fees and commissions); taxes; borrowing costs (such as interest and dividend expenses on securities sold short); acquired fund fees and expenses; fees and expenses associated with investments in other collective investment vehicles or derivative instruments (including for example option and swap fees and expenses); any amounts payable pursuant to a distribution or service plan adopted in accordance
| FISHER INVESTMENTS INSTITUTIONAL GROUP |
| U.S. LARGE CAP EQUITY ENVIRONMENTAL AND SOCIAL VALUES FUND |
| NOTES TO THE FINANCIAL STATEMENTS – (continued) |
| August 31, 2022 |
NOTE 4. FEES AND OTHER TRANSACTIONS WITH AFFILIATES - continued
with Rule 12b-1 under the 1940 Act; any administrative and/or shareholder servicing fees payable to financial intermediaries; expenses incurred in connection with any merger or reorganization; extraordinary expenses (such as litigation expenses, indemnification of Trust officers and Trustees and contractual indemnification of Fund service providers); and other expenses that the Trustees agree have not been incurred in the ordinary course of the Fund’s business. This expense cap may not be terminated prior to this date except by the Board of Trustees. For the fiscal year ended August 31, 2022, the Adviser waived fees and reimbursed expenses in the amount of $147,523 for the Fund. At August 31, 2022, the Adviser owed the Fund $12,769.
Each waiver/expense payment by the Adviser is subject to recoupment by the Adviser from the Fund in the three years following the date the particular expense payment occurred, but only if such recoupment can be achieved without exceeding the annual expense limitation in effect at the time of the expense payment and any expense limitation in effect at the time of the recoupment. As of August 31, 2022, the Adviser may seek repayment of expense reimbursements in the amounts as follows:
| Recoverable through |
| August 31, 2023 | | $ | 33,995 | |
| August 31, 2024 | | | 139,012 | |
| August 31, 2025 | | | 147,523 | |
Ultimus Fund Solutions, LLC (“Ultimus”) provides administration, fund accounting and transfer agent services to the Fund. The Fund pays Ultimus fees in accordance with the agreements for such services.
Northern Lights Compliance Services, LLC (“NLCS”), an affiliate of Ultimus, provides a Chief Compliance Officer to the Trust, as well as related compliance services, pursuant to a consulting agreement between NLCS and the Trust. Under the terms of such agreement, NLCS receives fees from the Fund, which are approved annually by the Board.
Under the terms of a Distribution Agreement with the Trust, Ultimus Fund Distributors, LLC (the “Distributor”) serves as principal underwriter to the Fund. The Distributor is a wholly-owned subsidiary of Ultimus. The Distributor is compensated by the Adviser (not the Fund) for acting as principal underwriter.
| FISHER INVESTMENTS INSTITUTIONAL GROUP |
| U.S. LARGE CAP EQUITY ENVIRONMENTAL AND SOCIAL VALUES FUND |
| NOTES TO THE FINANCIAL STATEMENTS – (continued) |
| August 31, 2022 |
NOTE 4. FEES AND OTHER TRANSACTIONS WITH AFFILIATES - continued
Certain officers and a Trustee of the Trust are also employees of Ultimus and such persons are not paid by the Fund for serving in such capacities.
The Board supervises the business activities of the Trust. Each Trustee serves as a trustee until termination of the Trust unless the Trustee dies, resigns, retires, or is removed. The Chairman of the Board and more than 75% of the Trustees are “Independent Trustees,” which means that they are not “interested persons” as defined in the 1940 Act. Each Independent Trustee of the Trust receives annual compensation of $2,785 per fund from the Trust, except that the Chairman of the Audit Committee, the Chairman of the Governance & Nominating Committee, and the Chairman of the Pricing & Liquidity Committee each receives annual compensation of $3,235 per fund from the Trust, and the Independent Chairman of the Board receives $3,435 per fund from the Trust. Independent Trustees also receive $1,000 for attending any special meeting that requires an in person approval of a contract and $250 for the first hour and $200 for each additional hour for attending other special meetings. In addition, the Trust reimburses Independent Trustees for out-of-pocket expenses incurred in conjunction with attendance at meetings.
NOTE 5. INVESTMENT TRANSACTIONS
For the fiscal year ended August 31, 2022, purchases and sales of investment securities, other than short-term investments, were $25,224 and $27,157, respectively.
There were no purchases or sales of long-term U.S. government obligations during the fiscal year ended August 31, 2022.
NOTE 6. BENEFICIAL OWNERSHIP
The beneficial ownership, either directly or indirectly, of more than 25% of the voting securities of a fund creates a presumption of control of a fund, under Section 2(a) (9) of the 1940 Act. As of August 31, 2022, the Adviser owned 100% of the Fund’s outstanding shares. As a result, the Adviser may be deemed to control the Fund.
| FISHER INVESTMENTS INSTITUTIONAL GROUP |
| U.S. LARGE CAP EQUITY ENVIRONMENTAL AND SOCIAL VALUES FUND |
| NOTES TO THE FINANCIAL STATEMENTS – (continued) |
| August 31, 2022 |
NOTE 7. FEDERAL TAX INFORMATION
At August 31, 2022, the net unrealized appreciation (depreciation) and tax cost of investments for tax purposes was as follows:
| Gross unrealized appreciation | | $ | 36,990 | |
| Gross unrealized depreciation | | | (17,985 | ) |
| Net unrealized appreciation on investments | | $ | 19,005 | |
| Tax cost of investments | | $ | 174,043 | |
The tax character of distributions paid for the fiscal years ended August 31, 2022 and August 31, 2021 were as follows:
| | | 2022 | | | 2021 | |
| Distributions paid from: | | | | | | | | |
| Ordinary income(a) | | $ | 3,305 | | | $ | 505 | |
| Long term capital gains | | | 1,592 | | | | — | |
| Total distributions paid | | $ | 4,897 | | | $ | 505 | |
| (a) | Short-term capital gain distributions are treated as ordinary income for tax purposes. |
At August 31, 2022, the components of accumulated earnings (deficit) on a tax basis were as follows:
| Undistributed ordinary income | | $ | 1,136 | |
| Undistributed long-term capital gains | | | 4,075 | |
| Unrealized depreciation on investments | | | 19,005 | |
| Total accumulated earnings | | $ | 24,216 | |
NOTE 8. SECTOR RISK
If the Fund has significant investments in the securities of issuers within a particular sector, any development affecting that sector will have a greater impact on the value of the net assets of the Fund than would be the case if the Fund did not have significant investments in that sector. In addition, this may increase the risk of loss in the Fund and increase the volatility of the Fund’s NAV per share. For instance, economic or market factors, regulatory changes or other developments may negatively impact all companies in a particular sector, and therefore the value of the Fund’s portfolio will be adversely affected. As of August 31, 2022, the Fund had 53.60% of the value of its net assets invested in stocks within the Technology sector.
| FISHER INVESTMENTS INSTITUTIONAL GROUP |
| U.S. LARGE CAP EQUITY ENVIRONMENTAL AND SOCIAL VALUES FUND |
| NOTES TO THE FINANCIAL STATEMENTS – (continued) |
| August 31, 2022 |
NOTE 9. COMMITMENTS AND CONTINGENCIES
The Trust indemnifies its officers and Trustees for certain liabilities that may arise from their performance of their duties to the Trust or the Fund. Additionally, in the normal course of business, the Trust enters into contracts that contain a variety of representations and warranties which provide general indemnifications. The Trust’s maximum exposure under these arrangements is unknown, as this would involve future claims that may be made against the Trust that have not yet occurred.
NOTE 10. SUBSEQUENT EVENTS
Management of the Fund has evaluated the need for disclosures and/or adjustments resulting from subsequent events through the date at which these financial statements were issued. Based upon this evaluation, management has determined there were no items requiring adjustment of the financial statements or additional disclosure.
| REPORT OF INDEPENDENT REGISTERED PUBLIC |
| ACCOUNTING FIRM |
To the Shareholders of Fisher Investments Institutional Group Fund Family and Board of Trustees of Unified Series Trust
Opinion on the Financial Statements
We have audited the accompanying statement of assets and liabilities, including the schedule of investments, of Fisher Investments Institutional Group U.S. Large Cap Equity Environmental and Social Values Fund (the “Fund”), a series of Unified Series Trust, as of August 31, 2022, the related statement of operations for the year then ended, the statements of changes in net assets for each of the two years in the period then ended, the related notes, and the financial highlights for each of the three periods in the period then ended (collectively referred to as the “financial statements”). In our opinion, the financial statements present fairly, in all material respects, the financial position of the Fund as of August 31, 2022, the results of its operations for the year then ended, the changes in net assets for each of the two years in the period then ended, and the financial highlights for each of the three periods in the period then ended, in conformity with accounting principles generally accepted in the United States of America.
Basis for Opinion
These financial statements are the responsibility of the Fund’s management. Our responsibility is to express an opinion on the Fund’s financial statements based on our audits. We are a public accounting firm registered with the Public Company Accounting Oversight Board (United States) (“PCAOB”) and are required to be independent with respect to the Fund in accordance with the U.S. federal securities laws and the applicable rules and regulations of the Securities and Exchange Commission and the PCAOB.
We conducted our audits in accordance with the standards of the PCAOB. Those standards require that we plan and perform the audit to obtain reasonable assurance about whether the financial statements are free of material misstatement whether due to error or fraud.
Our audits included performing procedures to assess the risks of material misstatement of the financial statements, whether due to error or fraud, and performing procedures that respond to those risks. Such procedures included examining, on a test basis, evidence regarding the amounts and disclosures in the financial statements. Our procedures included confirmation of securities owned as of August 31, 2022, by correspondence with the custodian. Our audits also included evaluating the accounting principles used and significant estimates made by management, as well as evaluating the overall presentation of the financial statements. We believe that our audits provide a reasonable basis for our opinion.
We have served as the auditor of one or more investment companies advised by Fisher Asset Management, LLC since 2017.
COHEN & COMPANY, LTD.
Chicago, Illinois
October 28, 2022
| LIQUIDITY RISK MANAGEMENT PROGRAM (Unaudited) |
The Fund has adopted and implemented a written liquidity risk management program (the “Program”) as required by Rule 22e-4 (the “Liquidity Rule”) under the 1940 Act. The Program is reasonably designed to assess and manage the Fund’s liquidity risk, taking into consideration, among other factors, the Fund’s investment strategy and the liquidity of its portfolio investments during normal and reasonably foreseeable stressed conditions; its short and long-term cash flow projections; and its cash holdings and access to other funding sources. The Board approved the appointment of the Liquidity Administrator Committee, comprising certain Trust officers and employees of the Adviser. The Liquidity Administrator Committee maintains Program oversight and reports to the Board on at least an annual basis regarding the Program’s operational effectiveness through a written report (the “Report”). The Program’s most recent report, which was presented to the Board for consideration at its meeting held on August 15-16, 2022, outlined the operation of the Program and the adequacy and effectiveness of the Program’s implementation. During the review period, the Fund did not experience unusual stress or disruption to their operations related to purchase and redemption activity. Also, during the review period the Fund held adequate levels of cash and highly liquid investments to meet shareholder redemption activities in accordance with applicable requirements. The Report concluded that the Program is reasonably designed to prevent violation of the Liquidity Rule and has been effectively implemented.
| SUMMARY OF FUND EXPENSES (Unaudited) |
As a shareholder of the Fund, you incur two types of costs: (1) transaction and (2) ongoing costs, including management fees, distribution (12b-1) fees and other Fund expenses. These examples are intended to help you understand your ongoing costs (in dollars) of investing in the Fund and to compare these costs with the ongoing costs of investing in other funds. You may pay brokerage commissions on purchases and sales of exchange-traded fund shares, which are not reflected in the example. The example is based on an investment of $1,000 invested at the beginning of the period and held for the entire period from March 1, 2022 through August 31, 2022.
Actual Expenses
The first line of the table below provides information about actual account values and actual expenses. You may use the information in this line, together with the amount you invested, to estimate the expenses that you paid over the period. Simply divide your account value by $1,000 (for example, an $8,600 account value divided by $1,000 = 8.6), then multiply the result by the number in the first line under the heading “Expenses Paid During Period” to estimate the expenses you paid on your account during this period.
Hypothetical Example for Comparison Purposes
The second line of the table below provides information about hypothetical account values and hypothetical expenses based on the Fund’s actual expense ratio and an assumed rate of return of 5% per year before expenses, which is not the Fund’s actual return. The hypothetical account values and expenses may not be used to estimate the actual ending account balance or expenses you paid for the period. You may use this information to compare the ongoing costs of investing in the Fund and other funds. To do so, compare this 5% hypothetical example with the 5% hypothetical examples that appear in the shareholder reports of other funds.
| | | Beginning | | Ending | | Expenses | | |
| | | Account Value | | Account Value | | Paid | | Annualized |
| | | March 1, | | August 31, | | During | | Expense |
| | | 2022 | | 2022 | | Period(a) | | Ratio |
| Actual | | $1,000.00 | | $ 851.40 | | $2.19 | | 0.47% |
| Hypothetical(b) | | $1,000.00 | | $1,022.84 | | $2.40 | | 0.47% |
| (a) | Expenses are equal to the Fund’s annualized expense ratios, multiplied by the average account value over the period, multiplied by 184/365 (to reflect the one-half year period). |
| (b) | Hypothetical assumes 5% annual return before expenses. |
| ADDITIONAL FEDERAL INCOME TAX INFORMATION (Unaudited) |
The Form 1099-DIV you receive in January 2023 will show the tax status of all distributions paid to your account in calendar year 2022. Shareholders are advised to consult their own tax adviser with respect to the tax consequences of their investment in the Fund. As required by the Internal Revenue Code and/or regulations, shareholders must be notified regarding the status of qualified dividend income for individuals and the dividends received deduction for corporations.
Qualified Dividend Income. The Fund designates approximately 88.02% or up to the maximum amount of such dividends allowable pursuant to the Internal Revenue Code, as qualified dividend income eligible for a reduced tax rate.
Qualified Business Income. The Fund designates approximately 0% of its ordinary income dividends, or up to the maximum amount of such dividends allowable pursuant to the Internal Revenue Code, as qualified business income.
Dividends Received Deduction. Corporate shareholders are generally entitled to take the dividends received deduction on the portion of the Fund’s dividend distribution that qualifies under tax law. For the Fund’s calendar year 2022 ordinary income dividends, 87.50% qualifies for the corporate dividends received deduction.
For the year ended August 31, 2022, the Fund designated $1,592 as long-term capital gain distributions.
| SHAREHOLDER VOTING RESULTS (Unaudited) |
At a Special Shareholder Meeting at which a quorum was present, held on September 6, 2022, Fund shareholders of record as of the close of business on July 5, 2022 voted to approve the following proposal:
Proposal 1: To elect the following individuals to serve on the Board of Trustees of the Trust:
Freddie Jacobs Jr.
Catharine Barrow McGauley
Kenneth G.Y. Grant
Daniel J. Condon
Gary A. Hippenstiel
Stephen A. Little
Ronald C. Tritschler
David R. Carson
| | | Shares | | Shares Voted | | Shares |
| | | Voted in | | Against or | | Needed to |
| Fund | | Favor* | | Abstain* | | Approve* |
| Fisher Investments Institutional Group U.S. Large Cap Equity Environmental and Social Values Fund | | 15,361 (100%) | | 0 (0.00%) | | Plurality
(greater than
50%) |
| * | as a percentage of the total voting securities of the Fund voted at the meeting at which a quorum was present |
| TRUSTEES AND OFFICERS (Unaudited) |
GENERAL QUALIFICATIONS. The Board supervises the business activities of the Trust. Each Trustee serves as a trustee until termination of the Trust unless the Trustee dies, resigns, retires, or is removed. The Chairman of the Board and more than 75% of the Trustees are “Independent Trustees,” which means that they are not “interested persons” (as defined in the 1940 Act) of the Trust or any adviser, sub-adviser or distributor of the Trust.
The following table provides information regarding the Independent Trustees.
Name, Address*,
(Year of Birth),
Position with Trust**,
Term of Position
with Trust | Principal Occupation During Past 5 Years
and Other Directorships |
Daniel J. Condon (1950)
Chairman, May 2022 to present; Chairman of the Audit Committee; Chairman of the Governance & Nominating Committee, May 2020 to May 2022; Independent Trustee, December 2002 to present | Current: Retired (2017 - present); Trustee, Peak Income Plus Fund (2022 – present). |
Kenneth G.Y. Grant (1949)
Chairman of the Governance & Nominating Committee, May 2022 to present; Chairman, January 2017 to May 2022; Independent Trustee, May 2008 to present | Current: Director, Standpoint Multi-Asset (Cayman) Fund, Ltd. (2019 – present); Director, Advisors Charitable Gift Fund (2020 - present), a Donor Advised Fund; Trustee, Peak Income Plus Fund (2022 – present). Previous: EVP, Benefit Plans Administrative Services, Inc., provider of retirement benefit plans administration (2019 – 2020); Director, Northeast Retirement Services (NRS) LLC, a transfer agent and fund administrator; and Director, Global Trust Company (GTC), a non-depository trust company sponsoring private investment product (2003 – 2019); EVP, NRS (2003 – 2019); GTC, EVP (2008 – 2019); EVP, Savings Banks Retirement Association (2003 – 2019), provider of qualified retirement benefit plans. |
| TRUSTEES AND OFFICERS (Unaudited) – (continued) |
Name, Address*,
(Year of Birth),
Position with Trust**,
Term of Position
with Trust | Principal Occupation During Past 5 Years
and Other Directorships |
Gary E. Hippenstiel (1947)
Chairman of the Pricing & Liquidity Committee; Independent Trustee, December 2002 to present | Current: President and founder of Hippenstiel Investment Counsel LLC (“Hippenstiel”) since 2008. Hippenstiel was registered as an investment adviser from 2008 to December 31, 2019; Trustee, Peak Income Plus Fund (2022 – present). |
Stephen A. Little (1946)
Independent Trustee, December 2002 to present; Chairman, December 2004 to December 2016 | Current: President and founder of The Rose, Inc., a registered investment adviser, since 1993; Trustee, Peak Income Plus Fund (2022 – present). |
Ronald C. Tritschler (1952)
Chairman of the Audit Committee, May 2022 to present; Independent Trustee, January 2007 to present; Interested Trustee, December 2002 to December 2006 | Current: Chief Executive Officer, Director and Legal Counsel of The Webb Companies, a national real estate company, since 2001; Director, Standpoint Multi-Asset (Cayman) Fund, Ltd. (2020 – present); Director of First State Bank of the Southeast (2000 - present); Trustee, Peak Income Plus Fund (2022 – present). |
Catharine B. McGauley (1977)
Independent Trustee, September 2022 to present | Current: Lead Portfolio Manager of Atlantic Charter Insurance, a workers’ compensation insurer, since 2010; Investment Councilor of a Family Office (2015 – present); Senior Analyst/ Advisor for a Boston real estate company and related family (2010 – present); Trustee, Peak Income Plus Fund (2002 – present). |
| TRUSTEES AND OFFICERS (Unaudited) – (continued) |
Name, Address*,
(Year of Birth),
Position with Trust**,
Term of Position
with Trust | Principal Occupation During Past 5 Years
and Other Directorships |
Freddie Jacobs, Jr. (1970)
Independent Trustee, September 2022 to present | Current: Chief Operating Officer and Chief Risk Officer Northeast Retirement Services (NRS) LLC, a transfer agent and fund administrator; and Director, Global Trust Company (GTC), a non-depository trust company sponsoring private investment product (2021- present); Trustee of Buckingham Browne & Nichols (BBN) (2018 – present); Chair of the Finance Committee, BBN (2020 – present); Chairman Board of Directors of Crispus Attucks Fund (2020– present); Board Member and Treasurer of New England Tennis Association (2017 –present); Board Member of Camp Harbor View (2020 – present); Trustee, Peak Income Plus Fund (2002 – present). Previous: SVP, Senior Risk Officer NRS (2013 – 2019). |
| * | The business address for each Trustee is 225 Pictoria Drive, Suite 450, Cincinnati, Ohio 45246. |
| ** | As of the date of this Report, the Trust consists of 31 series. |
The following table provides information regarding the Interested Trustees and certain offficers of the Trust.
Name, Address*,
(Year of Birth),
Position with Trust,
Term of Position
with Trust | Principal Occupation During Past 5 Years
and Other Directorships |
David R. Carson(1958)
President, January 2016 to August 2021; Interested Trustee, August 2020 to present | Current: Senior Vice President Client Strategies of Ultimus Fund Solutions, LLC, since 2013; Interested Trustee of Ultimus Managers Trust, since 2020; Trustee, Peak Income Plus Fund (2022 – present). |
| TRUSTEES AND OFFICERS (Unaudited) – (continued) |
Name, Address*,
(Year of Birth),
Position with Trust,
Term of Position
with Trust | Principal Occupation During Past 5 Years
and Other Directorships |
Martin R. Dean (1963)
President, August 2021 to present; Vice President, November 2020 to August 2021; Chief Compliance Officer, April 2021 to August 2021; Assistant Chief Compliance Officer, January 2016 to April 2021 | Current: Senior Vice President, Head of Fund Compliance of Ultimus Fund Solutions, LLC, since 2016. |
Zachary P. Richmond (1980)
Treasurer and Chief Financial Officer, November 2014 to present | Current: Vice President, Director of Financial Administration for Ultimus Fund Solutions, LLC, since 2015. |
Gweneth K. Gosselink (1955)
Chief Compliance Officer, August 2021 to present | Current: Assistant Vice President, Senior Compliance Officer of Ultimus Fund Solutions, LLC, since 2019. Previous: Chief Operating Officer & CCO at Miles Capital, Inc. (2013 – 2019). |
Elisabeth A. Dahl(1962)
Secretary, May 2017 to present; Assistant Secretary, March 2016 to May 2017 | Current: Attorney, Ultimus Fund Solutions, LLC, since March 2016. |
Stephen L. Preston (1966)
AML Compliance Officer, May 2017 to present | Current: Vice President and Chief Compliance Officer, Ultimus Fund Solutions, LLC and Ultimus Fund Distributors, LLC, since 2011. |
Lynn E. Wood (1946)
Assistant Chief Compliance Officer, April 2021 to present; Chief Compliance Officer, October 2004 to April 2021 | Current: Managing Member, Buttonwood Compliance Partners, LLC, since 2013. |
| * | The business address for each officer is 225 Pictoria Drive, Suite 450, Cincinnati, Ohio 45246. |
| OTHER INFORMATION (Unaudited) |
The Fund’s Statement of Additional Information (“SAI”) includes additional information about the Trustees and is available without charge, upon request. You may call toll-free at (800) 851-8845 to request a copy of the SAI or to make shareholder inquiries.
| PRIVACY NOTICE |
| |
| | Rev: January 2020 |
| FACTS | WHAT DOES FISHER INVESTMENTS INSTITUTIONAL GROUP U.S. LARGE CAP EQUITY ENVIRONMENTAL AND SOCIAL VALUES FUND (THE “FUND”) DO WITH YOUR PERSONAL INFORMATION? |
| Why? | Financial companies choose how they share your personal information. Federal law gives consumers the right to limit some but not all sharing. Federal law also requires us to tell you how we collect, share, and protect your personal information. Please read this notice carefully to understand what we do. |
| What? | The types of personal information we collect and share depend on the product or service you have with us. This information can include: ■ Social Security number ■ account balances and account transactions ■ transaction or loss history and purchase history When you are no longer our customer, we continue to share your information as described in this notice. |
| How? | All financial companies need to share customers’ personal information to run their everyday business. In the section below, we list the reasons financial companies can share their customers’ personal information; the reasons the Fund chooses to share; and whether you can limit this sharing. |
| Reasons we can share your personal information | Does the
Fund share? | Can you limit
this sharing? |
For our everyday business purposes— such as to process your transactions, maintain your account(s), respond to court orders and legal investigations, or report to credit bureaus | Yes | No |
For our marketing purposes— to offer our products and services to you | No | We don’t share |
| For joint marketing with other financial companies | No | We don’t share |
For our affiliates’ everyday business purposes— information about your transactions and experiences | No | We don’t share |
For our affiliates’ everyday business purposes— information about your creditworthiness | No | We don’t share |
| For nonaffiliates to market to you | No | We don’t share |
| Questions? | Call (800) 851-8845 |
| Who we are |
| Who is providing this notice? | Fisher Investments Institutional Group U.S. Large Cap Equity Environmental and Social Values Fund Ultimus Fund Distributors, LLC (Distributor) Ultimus Fund Solutions, LLC (Administrator) |
| What we do |
| How does the Fund protect my personal information? | To protect your personal information from unauthorized access and use, we use security measures that comply with federal law. These measures include computer safeguards and secured files and buildings. Our service providers are held accountable for adhering to strict policies and procedures to prevent any misuse of your nonpublic personal information. |
| How does the Fund collect my personal information? | We collect your personal information, for example, when you ■ open an account or deposit money ■ make deposits or withdrawals from your account or provide account information We also collect your personal information from other companies. |
| Why can’t I limit all sharing? | Federal law gives you the right to limit only ■ sharing for affiliates’ everyday business purposes — information about your creditworthiness ■ affiliates from using your information to market to you ■ sharing for nonaffiliates to market to you State laws and individual companies may give you additional rights to limit sharing. |
| Definitions |
| Affiliates | Companies related by common ownership or control. They can be financial and nonfinancial companies. ■ Fisher Asset Management, LLC, d/b/a Fisher Investments, the investment adviser to the Fund, could be deemed to be an affiliate. |
| Nonaffiliates | Companies not related by common ownership or control. They can be financial and nonfinancial companies. ■ The Fund does not share your personal information with nonaffiliates so they can market to you. |
| Joint marketing | A formal agreement between nonaffiliated financial companies that together market financial products or services to you. ■ The Fund doesn’t jointly market. |
This page intentionally left blank.
PROXY VOTING
A description of the policies and procedures that the Fund uses to determine how to vote proxies relating to portfolio securities and information regarding how the Fund voted those proxies during the most recent twelve month period ended June 30, are available (1) without charge upon request by calling the Fund at (800) 851-8845 and (2) in Fund documents filed with the SEC on the SEC’s website at www.sec.gov.
TRUSTEES Daniel J. Condon, Chairman David R. Carson Kenneth G.Y. Grant Gary E. Hippenstiel Freddie Jacobs, Jr. Stephen A. Little Catharine B. McGauley Ronald C. Tritschler OFFICERS Martin R. Dean, President Gweneth K. Gosselink, Chief Compliance Officer Zachary P. Richmond, Treasurer and Chief Financial Officer Lynn E. Wood, Assistant Chief Compliance Officer INVESTMENT ADVISER Fisher Asset Management, LLC 5525 NW Fisher Creek Drive Camas, WA 98607 DISTRIBUTOR Ultimus Fund Distributors, LLC 225 Pictoria Drive, Suite 450 Cincinnati, OH 45246 | INDEPENDENT REGISTERED PUBLIC ACCOUNTING FIRM Cohen & Company, Ltd. 151 N Franklin Street, Suite 575 Chicago, IL 60606 LEGAL COUNSEL Thompson Hine LLP 312 Walnut Street, 20th Floor Cincinnati, OH 45202 CUSTODIAN U.S. Bank, N.A. 425 Walnut Street Cincinnati, OH 45202 ADMINISTRATOR, TRANSFER AGENT AND FUND ACCOUNTANT Ultimus Fund Solutions, LLC 225 Pictoria Drive, Suite 450 Cincinnati, OH 45246 |
This report is intended only for the information of shareholders or those who have received the Fund’s prospectus which contains information about the Fund’s management fee and expenses. Please read the prospectus carefully before investing.
Distributed by Ultimus Fund Distributors, LLC
Member FINRA/SIPC
Fisher2-AR-22
FISHER INVESTMENTS INSTITUTIONAL GROUP FUND FAMILY |
Annual Report
August 31, 2022
Fisher Investments Institutional Group
U.S. Small Cap Equity Fund
Fund Adviser:
Fisher Asset Management, LLC
5525 NW Fisher Creek Drive,
Camas, Washington 98607
(800) 851-8845
FISHER INVESTMENTS INSTITUTIONAL GROUP
U.S. SMALL CAP EQUITY FUND
MANAGEMENT’S DISCUSSION OF FUND PERFORMANCE
(Unaudited)
Dear Shareholder:
Market Outlook
The Russell 2000 benchmark as well as the broader index S&P 500 officially entered bear market territory in 2022. While we don’t know when the low will occur exactly, we think it is close. Once a downturn breaches -20% from a high, the end typically isn’t far off, and the items plaguing sentiment this year should resolve gradually. Moreover, markets will soon start pricing the gridlock that likely results from November’s midterm elections, which typically fuels a rally through the midterm year’s end and beyond.
Fundamentally, we believe the economy is in better shape than many appreciate. Q1 GDP’s headline -1.4% annualized drop was unexpected, but it stemmed from inventory changes, imports and government spending—core private sector demand accelerated. Combined, consumer spending, real estate and business investment grew 3.1% annualized in Q1, up from Q4’s 2.3%. Spending’s shifting to services (4.3% annualized growth) from goods (-0.1%) was particularly noteworthy, as it shows reopening’s progress to lagging areas finally seeing pent-up demand unleashed, e.g. travel for business and pleasure. Because GDP is adjusted for inflation, this data reflects increasing economic activity, not higher prices.
According to June’s Deutsche Bank global investor poll, 90% expect a US recession by year end 2023, up from 78% in May. This may prove correct, and equities seem to be pricing in a perceived higher likelihood of recession, but the data so far don’t prove that one is already underway. The Atlanta Fed’s GDPNow model is currently predicting a -2.1% annualized Q2 GDP decline, but the St. Louis Fed’s Nowcast suggests 3.9% growth. Their divergence shows these models are unproven and in need of refinement, in our view. For example, GDPNow’s record since the pandemic has shown greater dispersion from actual results even at quarter-end, when most of the quarter’s data are in.
If the Atlanta Fed’s gauge proves close to correct and Q2 GDP falls, we suspect many headlines will tout this being the second-straight quarterly contraction, one common measure of recession. But in the US, that isn’t the definition used by the National Bureau of Economic Research, the official body that dates US business cycles. We don’t know what determination that body will make, but we think that is worth remembering as late July’s report draws near.
FISHER INVESTMENTS INSTITUTIONAL GROUP
U.S. SMALL CAP EQUITY FUND
MANAGEMENT’S DISCUSSION OF FUND PERFORMANCE
(Unaudited) – (continued)
Q1 earnings results and commentary suggest many recent concerns are pre-priced into markets. Headline S&P 500 earnings rose roughly 9% y/y with revenues up over 13%. But earnings were largely inflated by Energy’s 268% y/y growth.
The bulk of reporting companies cited inflation and supply chain issues on their earnings calls, and over half cited Ukraine, suggesting these widely known factors are broadly pre-priced already. While they may weigh on sentiment, they aren’t likely to surprise investors for long. Bigger picture, earnings are growing overall even as the economy slows back to pre-pandemic rates as the initial reopening bounce fades. Meanwhile, negative sentiment may punish companies missing expectations, but it also resets expectations, making them easier to clear going forward.
Fears over inflation underpinned the Fed’s half-point rate hike and balance sheet wind down, unveiled in May followed by an additional 75 basis point hike bringing the fed-funds target rate range to 1.5% – 1.75% in June. However, the yield curve (10-year Treasury to fed-funds rate) is still about as steep as the year’s start—it has just shifted upward. Pundits say the 10-year to 2-year Treasury yield curve is close to inversion again, flattening to just six basis points at June’s end, allegedly a warning sign for the economy and widening credit stress. The relevant portion is the 10-year to 3-month or overnight spread, though, since banks’ funding costs are tied more closely to short-term rates and their lending rates are heavily influenced by 10-year Treasury yields. Hence, the 10-year to 3-month Treasury yield curve better approximates banks’ loan profit margins—and incentive to lend. The Fed’s ability to influence lending in this way is its main transmission mechanism for monetary policy. A negative 10-year to 3-month spread would be a risk, and while it has narrowed significantly in recent weeks, it remains positive at 1.15 percentage points currently.
While some fear this “tightening” is problematic for equities, we disagree. Focusing on the level of short-term rates or magnitude of hikes pales in comparison to the yield curve’s overall shape. This is also why talk of quantitative tightening (QT) hitting markets via “tighter credit conditions” is backwards. The Fed has said it will let a maximum of $95 billion a month in Treasurys mature without replacement on its balance sheet. In theory, doing so would mean less Fed bond buying, putting less downward pressure on long rates. If that happens, the yield curve would steepen, which few see as a signal of economic trouble or credit stress. But since Treasurys’ average daily trading volume is regularly well over half a trillion dollars, the scope of the Fed’s actions looks too small to cause material waves. In our view, this is why the Fed’s 2017 rate hikes also coincided with so-called QT amid a year of economic growth and strong stock market returns. Meanwhile, the Fed has telegraphed these
FISHER INVESTMENTS INSTITUTIONAL GROUP
U.S. SMALL CAP EQUITY FUND
MANAGEMENT’S DISCUSSION OF FUND PERFORMANCE
(Unaudited) – (continued)
moves well in advance. We don’t think taking its word for them is necessarily wise, but markets expected them already, which saps any negative surprise power they might have had.
Moreover, a 10-year to 3-month yield curve inversion isn’t a timing tool and wouldn’t automatically be a trigger. Particularly in this cycle, banks remain flooded with deposits—rates banks pay on them are still pinned near zero. While the situation bears monitoring with nascent pressure to raise deposit rates, for now, credit is coursing strongly through the economy and driving investment. Total US loan growth has accelerated to 10.2% y/y through the week of June 22, approaching May 2020 emergency lockdown lending’s peak growth of 11.6%. Commercial and industrial lending is rising at a 9.1% y/y rate, and consumer lending is running at 12.5%, both historically high levels inconsistent with recession.
Performance Attribution
The Fisher Investments Institutional Group U.S. Small Cap Equity Fund underperformed the Russell 2000 Index for the period from September 1, 2021 through August 31, 2022. During this period, the Fund returned -26.24% while the Fund’s primary benchmark, the Russell 2000 Index, returned -17.88%. Sector allocation and equity selection detracted from relative return. Selection within Industrials was the largest contributor to relative return, driven by portable storage solutions provider WillScot Mobile Mini, aerospace company HEICO and waste management company Casella Waste Systems. Additionally, an underweight to Communication Services contributed, as the sector underperformed the broader benchmark. Conversely, an overweight to and selection within Information Technology was the largest detractor, driven by AI software companies LivePerson and Cerence, as well as voice over IP company 8x8. Further, an underweight to and selection within Consumer Staples detracted, as pet food company Freshpet and craft brewer Boston Beer underperformed.
Portfolio Shifts
For the period from September 1, 2021 through August 31, 2022, we have increased our exposure to the Consumer Discretionary sector. Certain cyclical industries within Consumer Discretionary, such as Autos and traditional Retailing, likely see headwinds from rising inflation and slowing economic growth. However, other less-cyclical industries such as Internet Retail and Luxury Goods possess attractive high-growth and high-quality characteristics. Typically, the stocks that fall the most during a
FISHER INVESTMENTS INSTITUTIONAL GROUP
U.S. SMALL CAP EQUITY FUND
MANAGEMENT’S DISCUSSION OF FUND PERFORMANCE
(Unaudited) – (continued)
downturn, bounce the most during recovery. Many Discretionary stocks, particularly those in growth oriented categories such as e-commerce, have fallen substantially and could be poised for sharper recovery.
Fisher Investments
August 2022
FISHER INVESTMENTS INSTITUTIONAL GROUP
U.S. SMALL CAP EQUITY FUND
Investment Results (Unaudited)
| Average Annual Total Return as of August 31, 2022(a) |
| |
| | | | | | Since | |
| | | | | | Inception | |
| | Fund/Index | | One Year | | (7/17/20) | |
| | Fisher Investments Institutional Group U.S. Small Cap Equity Fund | | (26.23)% | | 7.00% | |
| | Russell 2000 Index(b) | | (17.88)% | | 12.42% | |
| | | | | | | |
| | | | | | Expense | |
| | | | | | Ratios(c) | |
| | Gross | | | | 68.54% | |
| | With Applicable Expense Cap | | | | 0.75% | |
The performance quoted represents past performance, which does not guarantee future results. The investment return and principal value of an investment will fluctuate so that an investor’s shares, when redeemed, may be worth more or less than their original cost. The returns shown do not reflect deduction of taxes that a shareholder would pay on Fisher Investments Institutional Group U.S. Small Cap Equity Fund (the “Fund”) distributions or the redemption of Fund shares. Current performance of the Fund may be lower or higher than the performance quoted. The Fund’s investment objectives, risks, charges and expenses must be considered carefully before investing. Performance data current to the most recent month end may be obtained by calling (800) 851-8845.
| (a) | Return figures reflect any change in price per share and assume the reinvestment of all distributions. |
| (b) | The Russell 2000 Index (“Russell Index”) is a widely recognized unmanaged index of equity securities and is representative of a broader domestic equity market and range of securities than are found in the Fund’s portfolio. Individuals cannot invest directly in the Russell Index; however, an individual can invest in exchange traded funds or other investment vehicles that attempt to track the performance of a benchmark index. Index returns assume reinvestment of dividends and do not reflect any fees or expenses. |
| (c) | The expense ratios are from the Fund’s prospectus dated December 29, 2021. Fisher Asset Management, LLC, d/b/a Fisher Investments (the “Adviser”) is contractually obligated to limit the Fund’s total annual operating expenses to 0.75% of the Fund’s average daily net assets through December 31, 2026 (excluding portfolio transaction and other investment-related costs (including brokerage fees and commissions); taxes; borrowing costs (such as interest and dividend expenses on securities sold short); acquired fund fees and expenses; certain fees and expenses associated with investments in other collective investment vehicles or derivative instruments (including for example option and swap fees and expenses); any administrative and/ or shareholder servicing fees payable pursuant to a plan adopted by the Board of Trustees; expenses incurred in connection with any merger or reorganization; extraordinary expenses (such as litigation expenses, indemnification of Trust officers and Trustees and contractual indemnification of Fund service providers); and other expenses that the Trustees agree have not been incurred in the ordinary course of the Fund’s business). This expense cap may not be terminated prior to this date except by the Board of Trustees. Each waiver/expense payment by the Adviser is subject to recoupment by the Adviser from the Fund in the three years following the date the particular waiver/expense payment occurred, but only if such recoupment can be achieved without exceeding the annual expense limitation in effect at the time of the waiver/expense payment and any expense limitation in effect at the time of the recoupment. Additional information pertaining to the Fund’s expense ratios as of August 31, 2022 can be found in the financial highlights. |
The Fund’s investment objective, strategies, risks, charges and expenses must be considered carefully before investing. The Fund’s prospectus contains this and other important information about the investment company and may be obtained by calling (800) 851-8845. Please read it carefully before investing.
The Fund is distributed by Ultimus Fund Distributors, LLC, Member FINRA/SIPC.
FISHER INVESTMENTS INSTITUTIONAL GROUP
U.S. SMALL CAP EQUITY FUND
Investment Results (Unaudited) – (continued)
Comparison of the Growth of a $10,000 Investment in the Fisher Investments Institutional Group
U.S. Small Cap Equity Fund and the Russell 2000 Index (Unaudited)
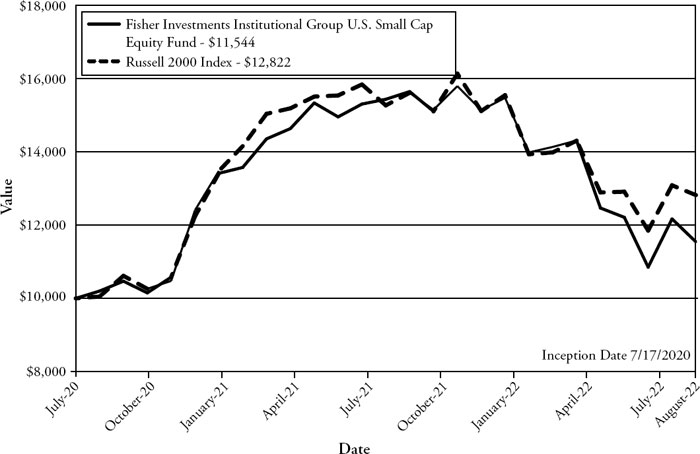
This graph shows the value of a hypothetical initial investment of $10,000 made on July 17, 2020 (commencement of operations) and held through August 31, 2022. Russell 2000 Index is a widely recognized unmanaged index of equity securities and is representative of a broader domestic equity market and range of securities than is found in the Fund’s portfolio. Individuals cannot invest directly in an index; however, an individual may invest in exchange traded funds or other investment vehicles that attempt to track the performance of a benchmark index. THE FUND’S RETURN REPRESENTS PAST PERFORMANCE AND DOES NOT GUARANTEE OR PREDICT FUTURE RESULTS. The returns shown do not reflect deduction of taxes that a shareholder would pay on Fund distributions or the redemption of Fund shares. Investment returns and principal values will fluctuate so that an investor’s shares, when redeemed, may be worth more or less than their original cost.
Current performance may be lower or higher than the performance data quoted. For more information on the Fund, and to obtain performance data current to the most recent month-end, or to request a prospectus, please call (800) 851-8845. You should carefully consider the investment objectives, risks, charges and expenses of the Fund before investing. The Fund’s prospectus contains this and other information about the Fund and should be read carefully before investing.
The Fund is distributed by Ultimus Fund Distributors, LLC, member FINRA/SIPC.
FISHER INVESTMENTS INSTITUTIONAL GROUP
U.S. SMALL CAP EQUITY FUND
Fund Holdings (Unaudited)
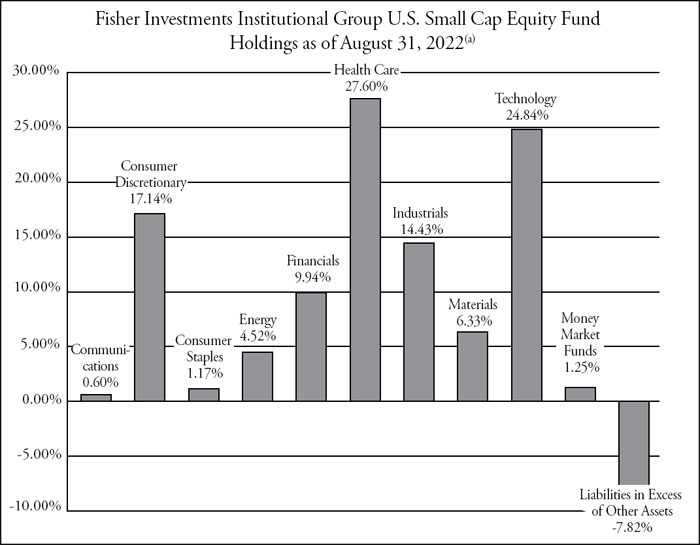
| (a) | As a percentage of net assets. |
The Fund seeks to outperform, net of fees and expenses, the Russell 2000 Index as its investment objective.
Availability of Portfolio Schedule – (Unaudited)
The Fund files its complete schedule of portfolio holdings with the Securities and Exchange Commission (the “SEC”) for the first and third quarters of each fiscal year as an exhibit to its reports on Form N-PORT. The Fund’s Form N-PORT reports are available on the SEC’s website at http://www.sec.gov.
| FISHER INVESTMENTS INSTITUTIONAL GROUP |
| U.S. SMALL CAP EQUITY FUND |
| SCHEDULE OF INVESTMENTS |
| August 31, 2022 |
| COMMON STOCKS — 106.57% | | Shares | | | Fair Value | |
| | | | | | | | | |
| Communications — 0.60% | | | | | | | | |
| 8X8, Inc.(a) | | | 199 | | | $ | 1,037 | |
| | | | | | | | | |
| Consumer Discretionary — 17.14% | | | | | | | | |
| Abercrombie & Fitch Co., Class A(a) | | | 28 | | | | 403 | |
| Builders FirstSource, Inc.(a) | | | 69 | | | | 4,044 | |
| Domino’s Pizza, Inc. | | | 2 | | | | 744 | |
| Freshpet, Inc.(a) | | | 49 | | | | 2,133 | |
| Gap, Inc. (The) | | | 71 | | | | 649 | |
| Goodyear Tire & Rubber Co. (The)(a) | | | 53 | | | | 744 | |
| Hibbett, Inc. | | | 21 | | | | 1,231 | |
| M.D.C. Holdings, Inc. | | | 38 | | | | 1,181 | |
| M/I Homes, Inc.(a) | | | 39 | | | | 1,686 | |
| National Vision Holdings, Inc.(a) | | | 28 | | | | 930 | |
| Papa John’s International, Inc. | | | 35 | | | | 2,828 | |
| Pool Corp. | | | 9 | | | | 3,053 | |
| Rent-A-Center, Inc. | | | 34 | | | | 879 | |
| Revolve Group, Inc.(a) | | | 96 | | | | 2,255 | |
| Scotts Miracle-Gro Co. (The) | | | 14 | | | | 937 | |
| Shake Shack, Inc., Class A(a) | | | 29 | | | | 1,382 | |
| Six Flags Entertainment Corp.(a) | | | 57 | | | | 1,263 | |
| Taylor Morrison Home Corp.(a) | | | 36 | | | | 904 | |
| Thor Industries, Inc. | | | 11 | | | | 891 | |
| Urban Outfitters, Inc.(a) | | | 43 | | | | 866 | |
| Wolverine World Wide, Inc. | | | 35 | | | | 684 | |
| | | | | | | | 29,687 | |
| Consumer Staples — 1.17% | | | | | | | | |
| Boston Beer Co., Inc. (The), Class A(a) | | | 6 | | | | 2,022 | |
| | | | | | | | | |
| Energy — 4.52% | | | | | | | | |
| ChampionX Corp. | | | 139 | | | | 3,032 | |
| Helmerich & Payne, Inc. | | | 12 | | | | 513 | |
| Oceaneering International, Inc.(a) | | | 99 | | | | 876 | |
| Ovintiv, Inc. | | | 64 | | | | 3,401 | |
| | | | | | | | 7,822 | |
See accompanying notes which are an integral part of these financial statements.
| FISHER INVESTMENTS INSTITUTIONAL GROUP |
| U.S. SMALL CAP EQUITY FUND |
| SCHEDULE OF INVESTMENTS – (continued) |
| August 31, 2022 |
| COMMON STOCKS — 106.57% - continued | | Shares | | | Fair Value | |
| | | | | | | | | |
| Financials — 9.94% | | | | | | | | |
| Cadence Bank | | | 34 | | | $ | 866 | |
| Evercore Partners, Inc., Class A | | | 22 | | | | 2,061 | |
| First Merchants Corp. | | | 56 | | | | 2,230 | |
| Focus Financial Partners, Inc., Class A(a) | | | 23 | | | | 900 | |
| Independent Bank Corp. | | | 26 | | | | 2,034 | |
| Moelis & Co., A | | | 22 | | | | 917 | |
| Piper Sandler Cos. | | | 20 | | | | 2,291 | |
| Stifel Financial Corp. | | | 30 | | | | 1,780 | |
| SVB Financial Group(a) | | | 7 | | | | 2,846 | |
| Umpqua Holdings Corp. | | | 73 | | | | 1,295 | |
| | | | | | | | 17,220 | |
| Health Care — 27.60% | | | | | | | | |
| Agios Pharmaceuticals, Inc.(a) | | | 51 | | | | 1,301 | |
| Align Technology, Inc.(a) | | | 13 | | | | 3,168 | |
| Alkermes PLC(a) | | | 14 | | | | 331 | |
| Anika Therapeutics(a) | | | 90 | | | | 2,034 | |
| Avid Bioservices, Inc.(a) | | | 56 | | | | 964 | |
| BioCryst Pharmaceuticals, Inc.(a) | | | 74 | | | | 1,029 | |
| Charles River Laboratories International, Inc.(a) | | | 6 | | | | 1,232 | |
| CONMED Corp. | | | 61 | | | | 5,402 | |
| Emergent BioSolutions, Inc.(a) | | | 56 | | | | 1,345 | |
| Exact Sciences Corp.(a) | | | 29 | | | | 1,031 | |
| Haemonetics Corp.(a) | | | 45 | | | | 3,376 | |
| Halozyme Therapeutics, Inc.(a) | | | 67 | | | | 2,729 | |
| ImmunoGen, Inc.(a) | | | 231 | | | | 1,342 | |
| Ironwood Pharmaceuticals, Inc.(a) | | | 85 | | | | 915 | |
| Ligand Pharmaceuticals, Inc., Class B(a) | | | 13 | | | | 1,201 | |
| Medpace Holdings, Inc.(a) | | | 28 | | | | 4,133 | |
| Myriad Genetics, Inc.(a) | | | 55 | | | | 1,229 | |
| NanoString Technologies, Inc.(a) | | | 73 | | | | 990 | |
| Neurocrine Biosciences Inc.(a) | | | 15 | | | | 1,569 | |
| PTC Therapeutics, Inc.(a) | | | 37 | | | | 1,848 | |
| Shockwave Medical, Inc.(a) | | | 7 | | | | 2,078 | |
| Twist Bioscience Corp.(a) | | | 29 | | | | 1,163 | |
| Vericel Corp.(a) | | | 38 | | | | 948 | |
| WillScot Mobile Mini Holdings Corp.(a) | | | 160 | | | | 6,422 | |
| | | | | | | | 47,780 | |
See accompanying notes which are an integral part of these financial statements.
| FISHER INVESTMENTS INSTITUTIONAL GROUP |
| U.S. SMALL CAP EQUITY FUND |
| SCHEDULE OF INVESTMENTS – (continued) |
| August 31, 2022 |
| COMMON STOCKS — 106.57% - continued | | Shares | | | Fair Value | |
| | | | | | | | | |
| Industrials — 14.43% | | | | | | | | |
| Advanced Energy Industries, Inc. | | | 53 | | | $ | 4,758 | |
| Alarm.com Holdings, Inc.(a) | | | 41 | | | | 2,731 | |
| Cactus, Inc., Class A | | | 103 | | | | 4,115 | |
| Casella Waste Systems, Inc., Class A(a) | | | 36 | | | | 2,949 | |
| Chart Industries, Inc.(a) | | | 25 | | | | 4,847 | |
| HEICO Corp. | | | 14 | | | | 2,132 | |
| Lincoln Electric Holdings, Inc. | | | 14 | | | | 1,914 | |
| Mercury Systems, Inc.(a) | | | 32 | | | | 1,540 | |
| | | | | | | | 24,986 | |
| Materials — 6.33% | | | | | | | | |
| Alcoa Corp. | | | 61 | | | | 3,018 | |
| Cleveland-Cliffs, Inc.(a) | | | 163 | | | | 2,815 | |
| Steel Dynamics, Inc. | | | 18 | | | | 1,453 | |
| UFP Industries, Inc. | | | 29 | | | | 2,302 | |
| Worthington Industries, Inc. | | | 27 | | | | 1,377 | |
| | | | | | | | 10,965 | |
| Technology — 24.84% | | | | | | | | |
| Allscripts Healthcare Solutions, Inc.(a) | | | 287 | | | | 4,879 | |
| Alteryx, Inc., Class A(a) | | | 49 | | | | 3,054 | |
| Azenta, Inc. | | | 27 | | | | 1,423 | |
| Box, Inc., Class A(a) | | | 34 | | | | 876 | |
| Cerence, Inc.(a) | | | 32 | | | | 640 | |
| Ceridian HCM Holding, Inc.(a) | | | 21 | | | | 1,252 | |
| Diodes, Inc.(a) | | | 69 | | | | 4,911 | |
| Donnelley Financial Solutions, Inc.(a) | | | 23 | | | | 976 | |
| Dropbox, Inc., Class A(a) | | | 38 | | | | 813 | |
| Five9, Inc.(a) | | | 11 | | | | 1,079 | |
| Knowles Corp.(a) | | | 125 | | | | 1,894 | |
| Liveperson, Inc.(a) | | | 75 | | | | 870 | |
| Manhattan Associates, Inc.(a) | | | 8 | | | | 1,130 | |
| Momentive Global, Inc.(a) | | | 203 | | | | 1,439 | |
| Omnicell, Inc.(a) | | | 25 | | | | 2,557 | |
| Paycom Software, Inc.(a) | | | 6 | | | | 2,107 | |
| Paylocity Holdings Corp.(a) | | | 37 | | | | 8,918 | |
| Pegasystems, Inc. | | | 19 | | | | 696 | |
| Qualys, Inc.(a) | | | 6 | | | | 911 | |
See accompanying notes which are an integral part of these financial statements.
| FISHER INVESTMENTS INSTITUTIONAL GROUP |
| U.S. SMALL CAP EQUITY FUND |
| SCHEDULE OF INVESTMENTS – (continued) |
| August 31, 2022 |
| COMMON STOCKS — 106.57% - continued | | Shares | | | Fair Value | |
| | | | | | | | | |
| Technology — 24.84% - continued | | | | | | | | |
| SPS Commerce, Inc.(a) | | | 10 | | | $ | 1,221 | |
| Synaptics, Inc.(a) | | | 7 | | | | 809 | |
| Tenable Holdings, Inc.(a) | | | 14 | | | | 555 | |
| | | | | | | | 43,010 | |
| Total Common Stocks — 106.57% | | | | | | | | |
| (Cost $186,638) | | | | | | | 184,529 | |
| | | | | | | | | |
| MONEY MARKET FUNDS — 1.25% | | | | | | | | |
| First American Government Obligations Fund, Class X, 2.04%(b) | | | 2,171 | | | | 2,171 | |
| | | | | | | | | |
| Total Money Market Funds | | | | | | | | |
| (Cost $2,171) | | | | | | | 2,171 | |
| | | | | | | | | |
| Total Investments — 107.82% | | | | | | | | |
| (Cost $188,809) | | | | | | | 186,700 | |
| | | | | | | | | |
| Liabilities in Excess of Other Assets — (7.82)% | | | | | | | (13,534 | ) |
| | | | | | | | | |
| NET ASSETS — 100.00% | | | | | | $ | 173,166 | |
| (a) | Non-income producing security. |
| (b) | Rate disclosed is the seven day effective yield as of August 31, 2022. |
See accompanying notes which are an integral part of these financial statements.
| FISHER INVESTMENTS INSTITUTIONAL GROUP |
| U.S. SMALL CAP EQUITY FUND |
| STATEMENT OF ASSETS AND LIABILITIES |
| August 31, 2022 |
| Assets | | | | |
| Investments in securities at fair value (cost $188,809) | | $ | 186,700 | |
| Dividends receivable | | | 70 | |
| Receivable from Adviser | | | 13,002 | |
| Prepaid expenses | | | 4,558 | |
| Total Assets | | | 204,330 | |
| Liabilities | | | | |
| Payable to Affiliates | | | 7,371 | |
| Accrued audit and tax fees | | | 18,900 | |
| Other accrued expenses | | | 4,893 | |
| Total Liabilities | | | 31,164 | |
| Net Assets | | $ | 173,166 | |
| Net Assets consist of: | | | | |
| Paid-in capital | | | 163,588 | |
| Accumulated earnings | | | 9,578 | |
| Net Assets | | $ | 173,166 | |
| Shares outstanding (unlimited number of shares authorized, no par value) | | | 15,945 | |
| Net asset value, offering and redemption price per share | | $ | 10.86 | |
See accompanying notes which are an integral part of these financial statements.
| FISHER INVESTMENTS INSTITUTIONAL GROUP |
| U.S. SMALL CAP EQUITY FUND |
| STATEMENT OF OPERATIONS |
| For the year ended August 31, 2022 |
| Investment Income | | | | |
| Dividend income (net of foreign taxes withheld of $1) | | $ | 1,142 | |
| Total investment income | | | 1,142 | |
| Expenses | | | | |
| Administration | | | 44,717 | |
| Legal | | | 19,070 | |
| Audit and tax | | | 18,860 | |
| Trustee | | | 14,583 | |
| Transfer agent | | | 12,000 | |
| Compliance services | | | 12,000 | |
| Report printing | | | 3,661 | |
| Custodian | | | 2,520 | |
| Registration | | | 1,522 | |
| Adviser | | | 1,408 | |
| Pricing | | | 620 | |
| Miscellaneous | | | 18,969 | |
| Total expenses | | | 149,930 | |
| Fees waived and expenses reimbursed by Adviser | | | (148,379 | ) |
| Net operating expenses | | | 1,551 | |
| Net investment loss | | | (409 | ) |
| Net Realized and Change in Unrealized Gain (Loss) on Investments | | | | |
| Net realized gain on investment securities transactions | | | 14,605 | |
| Net change in unrealized depreciation of investment securities | | | (75,719 | ) |
| Net realized and change in unrealized loss on investments | | | (61,114 | ) |
| Net decrease in net assets resulting from operations | | $ | (61,523 | ) |
See accompanying notes which are an integral part of these financial statements.
| FISHER INVESTMENTS INSTITUTIONAL GROUP |
| U.S. SMALL CAP EQUITY FUND |
| STATEMENTS OF CHANGES IN NET ASSETS |
| | | For the | | | For the | |
| | | Year Ended | | | Year Ended | |
| | | August 31, | | | August 31, | |
| | | 2022 | | | 2021 | |
| Increase (Decrease) in Net Assets due to: | | | | | | | | |
| Operations | | | | | | | | |
| Net investment loss | | $ | (409 | ) | | $ | (533 | ) |
| Net realized gain on investment securities transactions | | | 14,605 | | | | 11,374 | |
| Net change in unrealized appreciation (depreciation) of investment securities | | | (75,719 | ) | | | 66,846 | |
| Net increase (decrease) in net assets resulting from operations | | | (61,523 | ) | | | 77,687 | |
| Distributions From: | | | | | | | | |
| Earnings | | | (13,339 | ) | | | (253 | ) |
| Total distributions | | | (13,339 | ) | | | (253 | ) |
| Capital Transactions | | | | | | | | |
| Reinvestment of distributions | | | 13,338 | | | | 253 | |
| Amount paid for shares redeemed | | | (13 | ) | | | — | |
| Net increase in net assets resulting from capital transactions | | | 13,325 | | | | 253 | |
| Total Increase (Decrease) in Net Assets | | | (61,537 | ) | | | 77,687 | |
| Net Assets | | | | | | | | |
| Beginning of year | | | 234,703 | | | | 157,016 | |
| End of year | | $ | 173,166 | | | $ | 234,703 | |
| Share Transactions | | | | | | | | |
| Shares issued in reinvestment of distributions | | | 926 | | | | 19 | |
| Shares redeemed | | | (1 | ) | | | — | |
| Net increase in shares | | | 925 | | | | 19 | |
See accompanying notes which are an integral part of these financial statements.
| FISHER INVESTMENTS INSTITUTIONAL GROUP |
| U.S. SMALL CAP EQUITY FUND |
| FINANCIAL HIGHLIGHTS |
| (For a share outstanding during each period) |
| | | For the | | | For the | | | For the | |
| | | Year Ended | | | Year Ended | | | Period Ended | |
| | | August 31, | | | August 31, | | | August 31, | |
| | | 2022 | | | 2021 | | | 2020(a) | |
| Selected Per Share Data: | | | | | | | | | | | | |
| Net asset value, beginning of period | | $ | 15.63 | | | $ | 10.47 | | | $ | 10.00 | |
| Investment operations: | | | | | | | | | | | | |
| Net investment loss | | | (0.03 | ) | | | (0.04 | ) | | | — | (b) |
| Net realized and unrealized gain (loss) | | | (3.85 | ) | | | 5.22 | | | | 0.47 | |
| Total from investment operations | | | (3.88 | ) | | | 5.18 | | | | 0.47 | |
| Less distributions from: | | | | | | | | | | | | |
| Net realized gains | | | (0.89 | ) | | | (0.02 | ) | | | — | |
| Total distributions | | | (0.89 | ) | | | (0.02 | ) | | | — | |
| Net asset value, end of period | | $ | 10.86 | | | $ | 15.63 | | | $ | 10.47 | |
| Total Return(c) | | | (26.23 | )% | | | 49.47 | % | | | 4.70 | % (d) |
| Ratios and Supplemental Data: | | | | | | | | | | | | |
| Net assets, end of period (000 omitted) | | $ | 173 | | | $ | 235 | | | $ | 157 | |
| Ratio of net expenses to average net assets | | | 0.75 | % | | | 0.75 | % | | | 0.75 | % (e) |
| Ratio of gross expenses to average net assets before waiver and reimbursement | | | 72.50 | % | | | 68.54 | % | | | 188.33 | % (e) |
| Ratio of net investment income (loss) to average net assets | | | (0.20 | )% | | | (0.26 | )% | | | 0.30 | % (e) |
| Portfolio turnover rate | | | 30 | % | | | 24 | % | | | 2 | % (d) |
| (a) | For the period July 17, 2020 (commencement of operations) to August 31, 2020. |
| (b) | Rounds to less than $0.005 per share. |
| (c) | Total return represents the rate that the investor would have earned or lost on an investment in the Fund, assuming reinvestment of distributions. |
See accompanying notes which are an integral part of these financial statements.
| FISHER INVESTMENTS INSTITUTIONAL GROUP |
| U.S. SMALL CAP EQUITY FUND |
| NOTES TO THE FINANCIAL STATEMENTS |
| August 31, 2022 |
NOTE 1. ORGANIZATION
Fisher Investments Institutional Group U.S. Small Cap Equity Fund (the “Fund”) is registered under the Investment Company Act of 1940, as amended (“1940 Act”), as a diversified series of Unified Series Trust (the “Trust”) on November 12, 2018. The Trust is an open-end investment company established under the laws of Ohio by an Agreement and Declaration of Trust dated October 14, 2002 (the “Trust Agreement”). The Trust Agreement permits the Board of Trustees of the Trust (the “Board”) to issue an unlimited number of shares of beneficial interest of separate series without par value. The Fund is one of a series of funds currently authorized by the Board. The Fund commenced operations on July 17, 2020. The investment adviser to the Fund is Fisher Asset Management, LLC, d/b/a Fisher Investments (the “Adviser”). The Fund seeks to outperform, net of fees and expenses, the Russell 2000 Index as its investment objective.
NOTE 2. SIGNIFICANT ACCOUNTING POLICIES
The Fund is an investment company and follows accounting and reporting guidance under Financial Accounting Standards Board Accounting Standards Codification (“ASC”) Topic 946, “Financial Services-Investment Companies”, including Accounting Standards Update 2013-08. The following is a summary of significant accounting policies followed by the Fund in the preparation of its financial statements. These policies are in conformity with generally accepted accounting principles in the United States of America (“GAAP”).
Estimates – The preparation of financial statements in conformity with GAAP requires management to make estimates and assumptions that affect the reported amounts of assets and liabilities and disclosure of contingent assets and liabilities at the date of the financial statements and the reported amounts of increases and decreases in net assets from operations during the reporting period. Actual results could differ from those estimates.
Federal Income Taxes – The Fund makes no provision for federal income or excise tax. The Fund has qualified and intends to qualify each year as a regulated investment company (“RIC”) under subchapter M of the Internal Revenue Code of 1986, as amended, by complying with the requirements applicable to RICs and by distributing substantially all of its taxable income. The Fund also intends to distribute sufficient net investment income and net realized capital gains, if any, so that it will not be subject to excise tax on undistributed income and gains. If the required amount of net investment income or gains is not distributed, the Fund could incur a tax expense.
| FISHER INVESTMENTS INSTITUTIONAL GROUP |
| U.S. SMALL CAP EQUITY FUND |
| NOTES TO THE FINANCIAL STATEMENTS – (continued) |
| August 31, 2022 |
NOTE 2. SIGNIFICANT ACCOUNTING POLICIES – continued
As of and during the fiscal year ended August 31, 2022, the Fund did not have any liabilities for any unrecognized tax benefits. The Fund recognizes interest and penalties, if any, related to unrecognized tax benefits as income tax expense on the Statement of Operations when incurred. During the fiscal year ended August 31, 2022, the Fund did not incur any interest or penalties. Management of the Fund has reviewed tax positions taken in tax years that remain subject to examination by all major tax jurisdictions, including federal (i.e., the last three tax year ends and the interim tax period since then, as applicable). Management believes that there is no tax liability resulting from unrecognized tax benefits related to uncertain tax positions taken.
Expenses – Expenses incurred by the Trust that do not relate to a specific fund of the Trust are allocated to the individual funds based on each fund’s relative net assets or another appropriate basis (as determined by the Board).
Security Transactions and Related Income – The Fund follows industry practice and records security transactions on the trade date for financial reporting purposes. The specific identification method is used for determining gains or losses for financial statements and income tax purposes. Dividend income is recorded on the ex-dividend date and interest income is recorded on an accrual basis. Withholding taxes on foreign dividends and related reclaims have been provided for in accordance with the Fund’s understanding of the applicable country’s tax rules and rates.
Dividends and Distributions – The Fund intends to distribute its net investment income and net realized long-term and short-term capital gains, if any, at least annually. Dividends and distributions to shareholders, which are determined in accordance with income tax regulations, are recorded on the ex-dividend date. The treatment for financial reporting purposes of distributions made to shareholders during the period from net investment income or net realized capital gains may differ from their ultimate treatment for federal income tax purposes. These differences are caused primarily by differences in the timing of the recognition of certain components of income, expense or realized capital gain for federal income tax purposes. Where such differences are permanent in nature, they are reclassified among the components of net assets based on their ultimate characterization for federal income tax purposes. Any such reclassifications will have no effect on net assets, results of operations or net asset value (“NAV”) per share of the Fund.
| FISHER INVESTMENTS INSTITUTIONAL GROUP |
| U.S. SMALL CAP EQUITY FUND |
| NOTES TO THE FINANCIAL STATEMENTS – (continued) |
| August 31, 2022 |
NOTE 3. SECURITIES VALUATION AND FAIR VALUE MEASUREMENTS
The Fund values its portfolio securities at fair value as of the close of regular trading on the New York Stock Exchange (“NYSE”) (normally 4:00 p.m. Eastern time) on each business day the NYSE is open for business. Fair value is defined as the price that the Fund would receive upon selling an investment in a timely transaction to an independent buyer in the principal or most advantageous market of the investment. GAAP establishes a three-tier hierarchy to maximize the use of observable market data and minimize the use of unobservable inputs and to establish classification of fair value measurements for disclosure purposes.
Inputs refer broadly to the assumptions that market participants would use in pricing the asset or liability, including assumptions about risk (the risk inherent in a particular valuation technique used to measure fair value including a pricing model and/or the risk inherent in the inputs to the valuation technique). Inputs may be observable or unobservable. Observable inputs are inputs that reflect the assumptions market participants would use in pricing the asset or liability developed based on market data obtained and available from sources independent of the reporting entity. Unobservable inputs are inputs that reflect the reporting entity’s own assumptions about the assumptions market participants would use in pricing the asset or liability developed based on the best information available in the circumstances.
Various inputs are used in determining the value of the Fund’s investments. These inputs are summarized in the three broad levels listed below.
| ● | Level 1 – unadjusted quoted prices in active markets for identical investments and/or registered investment companies where the value per share is determined and published and is the basis for current transactions for identical assets or liabilities at the valuation date |
| ● | Level 2 – other significant observable inputs (including, but not limited to, quoted prices for an identical security in an inactive market, quoted prices for similar securities, interest rates, prepayment speeds, credit risk, etc.) |
| ● | Level 3 – significant unobservable inputs (including the Fund’s own assumptions in determining fair value of investments based on the best information available) |
| FISHER INVESTMENTS INSTITUTIONAL GROUP |
| U.S. SMALL CAP EQUITY FUND |
| NOTES TO THE FINANCIAL STATEMENTS – (continued) |
| August 31, 2022 |
NOTE 3. SECURITIES VALUATION AND FAIR VALUE MEASUREMENTS – continued
The inputs used to measure fair value may fall into different levels of the fair value hierarchy. In such cases, for disclosure purposes, the level in the fair value hierarchy which is reported is determined based on the lowest level input that is significant to the fair value measurement in its entirety.
Equity securities that are traded on any stock exchange are generally valued at the last quoted sale price on the security’s primary exchange. Lacking a last sale price, an exchange-traded security is generally valued at its last bid price. Securities traded in the NASDAQ over-the-counter market are generally valued at the NASDAQ Official Closing Price. When using market quotations and when the market is considered active, the security is classified as a Level 1 security. In the event that market quotations are not readily available or are considered unreliable due to market or other events, the Fund values its securities and other assets at fair value in accordance with policies established by and under the general supervision of the Board. Under these policies, the securities will be classified as Level 2 or 3 within the fair value hierarchy, depending on the inputs used.
Investments in mutual funds, including money market mutual funds, are generally priced at the ending NAV provided by the service agent of the mutual funds. These securities are categorized as Level 1 securities.
In accordance with the Trust’s valuation policies, the Board or Adviser as Valuation Designee is required to consider all appropriate factors relevant to the value of securities for which it has determined other pricing sources are not available or reliable as described above. No single method exists for determining fair value, because fair value depends upon the circumstances of each individual case. As a general principle, the current fair value of a security being valued by the Valuation Designee would be the amount that the Fund might reasonably expect to receive upon the current sale. Methods that are in accordance with this principle may, for example, be based on (i) a multiple of earnings; (ii) a discount from market prices of a similar freely traded security (including a derivative security or a basket of securities traded on other markets, exchanges or among dealers); or (iii) yield to maturity with respect to debt issues, or a combination of these and other methods. Fair-value pricing is permitted if, in the Valuation Designee’s opinion, the validity of market quotations appears to be questionable based on factors such as evidence of a thin market in the security based on a small number of quotations, a significant event occurs after the
| FISHER INVESTMENTS INSTITUTIONAL GROUP |
| U.S. SMALL CAP EQUITY FUND |
| NOTES TO THE FINANCIAL STATEMENTS – (continued) |
| August 31, 2022 |
NOTE 3. SECURITIES VALUATION AND FAIR VALUE MEASUREMENTS – continued
close of a market but before the Fund’s NAV calculation that may affect a security’s value, or the Valuation Designee is aware of any other data that calls into question the reliability of market quotations.
The following is a summary of the inputs used to value the Fund’s investments as of August 31, 2022:
| | | Valuation Inputs | |
| | | Level 1 | | | Level 2 | | | Level 3 | | | Total | |
| Assets | | | | | | | | | | | | | | | | |
| Common Stocks(a) | | $ | 184,529 | | | $ | — | | | $ | — | | | $ | 184,529 | |
| Money Market Funds | | | 2,171 | | | | — | | | | — | | | | 2,171 | |
| Total | | $ | 186,700 | | | $ | — | | | $ | — | | | $ | 186,700 | |
| (a) | Refer to Schedule of Investments for sector classifications. |
The Fund did not hold any investments at the end of the reporting period for which significant unobservable inputs (Level 3) were used in determining fair value; therefore, no reconciliation of Level 3 securities is included for this reporting period.
The Fund did not hold any derivative instruments during the reporting period.
NOTE 4. FEES AND OTHER TRANSACTIONS WITH AFFILIATES
The Adviser, under the terms of the management agreement (the “Agreement”) with the Trust with respect to the Fund, manages the Fund’s investments. As compensation for its management services, the Fund is obligated to pay the Adviser a fee computed and accrued daily and paid monthly at an annual rate of 0.68% of the Fund’s average daily net assets. For the fiscal year ended August 31, 2022, the Adviser earned fees of $1,408 from the Fund before the waiver and reimbursement described below.
The Adviser is contractually obligated to limit the Fund’s total annual operating expenses to 0.75% of the Fund’s average daily net assets through December 31, 2026 (excluding portfolio transaction and other investment-related costs (including brokerage fees and commissions); taxes; borrowing costs (such as interest and dividend expenses on securities sold short); acquired fund fees and expenses; fees and expenses associated with investments in other collective investment vehicles or
| FISHER INVESTMENTS INSTITUTIONAL GROUP |
| U.S. SMALL CAP EQUITY FUND |
| NOTES TO THE FINANCIAL STATEMENTS – (continued) |
| August 31, 2022 |
NOTE 4. FEES AND OTHER TRANSACTIONS WITH AFFILIATES - continued
derivative instruments (including for example option and swap fees and expenses); any amounts payable pursuant to a distribution or service plan adopted in accordance with Rule 12b-1 under the 1940 Act; any administrative and/or shareholder servicing fees payable to financial intermediaries; expenses incurred in connection with any merger or reorganization; extraordinary expenses (such as litigation expenses, indemnification of Trust officers and Trustees and contractual indemnification of Fund service providers); and other expenses that the Trustees agree have not been incurred in the ordinary course of the Fund’s business. This expense cap may not be terminated prior to this date except by the Board of Trustees. For the fiscal year ended August 31, 2022, the Adviser waived fees and reimbursed expenses in the amount of $148,379 for the Fund. At August 31, 2022, the Adviser owed the Fund $13,002.
Each waiver/expense payment by the Adviser is subject to recoupment by the Adviser from the Fund in the three years following the date the particular expense payment occurred, but only if such recoupment can be achieved without exceeding the annual expense limitation in effect at the time of the expense payment and any expense limitation in effect at the time of the recoupment. As of August 31, 2022, the Adviser may seek repayment of expense reimbursements in the amounts as follows:
| Recoverable through |
| August 31, 2023 | | $ | 34,216 | |
| August 31, 2024 | | | 139,672 | |
| August 31, 2025 | | | 148,379 | |
Ultimus Fund Solutions, LLC (“Ultimus”) provides administration, fund accounting and transfer agent services to the Fund. The Fund pays Ultimus fees in accordance with the agreements for such services.
Northern Lights Compliance Services, LLC (“NLCS”), an affiliate of Ultimus, provides a Chief Compliance Officer to the Trust, as well as related compliance services, pursuant to a consulting agreement between NLCS and the Trust. Under the terms of such agreement, NLCS receives fees from the Fund, which are approved annually by the Board.
| FISHER INVESTMENTS INSTITUTIONAL GROUP |
| U.S. SMALL CAP EQUITY FUND |
| NOTES TO THE FINANCIAL STATEMENTS – (continued) |
| August 31, 2022 |
NOTE 4. FEES AND OTHER TRANSACTIONS WITH AFFILIATES - continued
Under the terms of a Distribution Agreement with the Trust, Ultimus Fund Distributors, LLC (the “Distributor”) serves as principal underwriter to the Fund. The Distributor is a wholly-owned subsidiary of Ultimus. The Distributor is compensated by the Adviser (not the Fund) for acting as principal underwriter.
Certain officers and a Trustee of the Trust are also employees of Ultimus and such persons are not paid by the Fund for serving in such capacities.
The Board supervises the business activities of the Trust. Each Trustee serves as a trustee until termination of the Trust unless the Trustee dies, resigns, retires, or is removed. The Chairman of the Board and more than 75% of the Trustees are “Independent Trustees,” which means that they are not “interested persons” as defined in the 1940 Act. Each Independent Trustee of the Trust receives annual compensation of $2,785 per fund from the Trust, except that the Chairman of the Audit Committee, the Chairman of the Governance & Nominating Committee, and the Chairman of the Pricing & Liquidity Committee each receives annual compensation of $3,235 per fund from the Trust, and the Independent Chairman of the Board receives $3,435 per fund from the Trust. Independent Trustees also receive $1,000 for attending any special meeting that requires an in person approval of a contract and $250 for the first hour and $200 for each additional hour for attending other special meetings. In addition, the Trust reimburses Independent Trustees for out-of-pocket expenses incurred in conjunction with attendance at meetings.
NOTE 5. INVESTMENT TRANSACTIONS
For the fiscal year ended August 31, 2022, purchases and sales of investment securities, other than short-term investments, were $63,123 and $65,943, respectively.
There were no purchases or sales of long-term U.S. government obligations during the fiscal year ended August 31, 2022.
NOTE 6. BENEFICIAL OWNERSHIP
The beneficial ownership, either directly or indirectly, of more than 25% of the voting securities of a fund creates a presumption of control of a fund, under Section 2(a) (9) of the 1940 Act. As of August 31, 2022, the Adviser owned 100% of the Fund’s outstanding shares. As a result, the Adviser may be deemed to control the Fund.
| FISHER INVESTMENTS INSTITUTIONAL GROUP |
| U.S. SMALL CAP EQUITY FUND |
| NOTES TO THE FINANCIAL STATEMENTS – (continued) |
| August 31, 2022 |
NOTE 7. FEDERAL TAX INFORMATION
At August 31, 2022, the net unrealized appreciation (depreciation) and tax cost of investments for tax purposes was as follows:
| Gross unrealized appreciation | | $ | 39,037 | |
| Gross unrealized depreciation | | | (41,355 | ) |
| Net unrealized depreciation on investments | | $ | (2,318 | ) |
| Tax cost of investments | | $ | 189,018 | |
The tax character of distributions paid for the fiscal years ended August 31, 2022 and August 31, 2021 were as follows:
| | | 2022 | | | 2021 | |
| Distributions paid from: | | | | | | | | |
| Ordinary income(a) | | $ | 10,864 | | | $ | 253 | |
| Long term capital gains | | | 2,475 | | | | — | |
| Total distributions paid | | $ | 13,339 | | | $ | 253 | |
| (a) | Short-term capital gain distributions are treated as ordinary income for tax purposes. |
At August 31, 2022, the components of accumulated earnings (deficit) on a tax basis were as follows:
| Undistributed long-term capital gains | | $ | 13,141 | |
| Accumulated capital and other losses | | | (1,245 | ) |
| Unrealized depreciation on investments | | | (2,318 | ) |
| Total accumulated earnings | | $ | 9,578 | |
Post-October capital losses incurred after October 31 and within the taxable year are deemed to arise on the first business day of the Fund’s next taxable year. As of August 31, 2022, the Fund had Post-October capital losses of $1,029.
Under current tax law, net investment losses after December 31 and capital losses realized after October 31 of the Fund’s fiscal year may be deferred and treated as occurring on the first business day of the following fiscal year for tax purposes. As of August 31, 2022, the Fund had Qualified Late Year Ordinary Losses of $216.
| FISHER INVESTMENTS INSTITUTIONAL GROUP |
| U.S. SMALL CAP EQUITY FUND |
| NOTES TO THE FINANCIAL STATEMENTS – (continued) |
| August 31, 2022 |
NOTE 8. SECTOR RISK
If the Fund has significant investments in the securities of issuers within a particular sector, any development affecting that sector will have a greater impact on the value of the net assets of the Fund than would be the case if the Fund did not have significant investments in that sector. In addition, this may increase the risk of loss in the Fund and increase the volatility of the Fund’s NAV per share. For instance, economic or market factors, regulatory changes or other developments may negatively impact all companies in a particular sector, and therefore the value of the Fund’s portfolio will be adversely affected. As of August 31, 2022, the Fund had 27.60% of the value of its net assets invested in stocks within the Health Care sector.
NOTE 9. COMMITMENTS AND CONTINGENCIES
The Trust indemnifies its officers and Trustees for certain liabilities that may arise from their performance of their duties to the Trust or the Fund. Additionally, in the normal course of business, the Trust enters into contracts that contain a variety of representations and warranties which provide general indemnifications. The Trust’s maximum exposure under these arrangements is unknown, as this would involve future claims that may be made against the Trust that have not yet occurred.
NOTE 10. SUBSEQUENT EVENTS
Management of the Fund has evaluated the need for disclosures and/or adjustments resulting from subsequent events through the date at which these financial statements were issued. Based upon this evaluation, management has determined there were no items requiring adjustment of the financial statements or additional disclosure.
| REPORT OF INDEPENDENT REGISTERED PUBLIC |
| ACCOUNTING FIRM |
To the Shareholders of Fisher Investments Institutional Group Fund Family and Board of Trustees of Unified Series Trust
Opinion on the Financial Statements
We have audited the accompanying statement of assets and liabilities, including the schedule of investments, of Fisher Investments Institutional Group U.S. Small Cap Equity Fund (the “Fund”), a series of Unified Series Trust, as of August 31, 2022, the related statement of operations for the year then ended, the statements of changes in net assets for each of the two years in the period then ended, the related notes, and the financial highlights for each of the three periods in the period then ended (collectively referred to as the “financial statements”). In our opinion, the financial statements present fairly, in all material respects, the financial position of the Fund as of August 31, 2022, the results of its operations for the year then ended, the changes in net assets for each of the two years in the period then ended, and the financial highlights for each of the three periods in the period then ended, in conformity with accounting principles generally accepted in the United States of America.
Basis for Opinion
These financial statements are the responsibility of the Fund’s management. Our responsibility is to express an opinion on the Fund’s financial statements based on our audits. We are a public accounting firm registered with the Public Company Accounting Oversight Board (United States) (“PCAOB”) and are required to be independent with respect to the Fund in accordance with the U.S. federal securities laws and the applicable rules and regulations of the Securities and Exchange Commission and the PCAOB.
We conducted our audits in accordance with the standards of the PCAOB. Those standards require that we plan and perform the audit to obtain reasonable assurance about whether the financial statements are free of material misstatement whether due to error or fraud.
Our audits included performing procedures to assess the risks of material misstatement of the financial statements, whether due to error or fraud, and performing procedures that respond to those risks. Such procedures included examining, on a test basis, evidence regarding the amounts and disclosures in the financial statements. Our procedures included confirmation of securities owned as of August 31, 2022, by correspondence with the custodian. Our audits also included evaluating the accounting principles used and significant estimates made by management, as well as evaluating the overall presentation of the financial statements. We believe that our audits provide a reasonable basis for our opinion.
We have served as the auditor of one or more investment companies advised by Fisher Asset Management, LLC since 2017.
COHEN & COMPANY, LTD.
Chicago, Illinois
October 28, 2022
| LIQUIDITY RISK MANAGEMENT PROGRAM (Unaudited) |
The Fund has adopted and implemented a written liquidity risk management program (the “Program”) as required by Rule 22e-4 (the “Liquidity Rule”) under the 1940 Act. The Program is reasonably designed to assess and manage the Fund’s liquidity risk, taking into consideration, among other factors, the Fund’s investment strategy and the liquidity of its portfolio investments during normal and reasonably foreseeable stressed conditions; its short and long-term cash flow projections; and its cash holdings and access to other funding sources. The Board approved the appointment of the Liquidity Administrator Committee, comprising certain Trust officers and employees of the Adviser. The Liquidity Administrator Committee maintains Program oversight and reports to the Board on at least an annual basis regarding the Program’s operational effectiveness through a written report (the “Report”). The Program’s most recent report, which was presented to the Board for consideration at its meeting held on August 15-16, 2022, outlined the operation of the Program and the adequacy and effectiveness of the Program’s implementation. During the review period, the Fund did not experience unusual stress or disruption to their operations related to purchase and redemption activity. Also, during the review period the Fund held adequate levels of cash and highly liquid investments to meet shareholder redemption activities in accordance with applicable requirements. The Report concluded that the Program is reasonably designed to prevent violation of the Liquidity Rule and has been effectively implemented.
| SUMMARY OF FUND EXPENSES (Unaudited) |
As a shareholder of the Fund, you incur two types of costs: (1) transaction and (2) ongoing costs, including management fees, distribution (12b-1) fees and other Fund expenses. These examples are intended to help you understand your ongoing costs (in dollars) of investing in the Fund and to compare these costs with the ongoing costs of investing in other funds. You may pay brokerage commissions on purchases and sales of exchange-traded fund shares, which are not reflected in the example. The example is based on an investment of $1,000 invested at the beginning of the period and held for the entire period from March 1, 2022 through August 31, 2022.
Actual Expenses
The first line of the table below provides information about actual account values and actual expenses. You may use the information in this line, together with the amount you invested, to estimate the expenses that you paid over the period. Simply divide your account value by $1,000 (for example, an $8,600 account value divided by $1,000 = 8.6), then multiply the result by the number in the first line under the heading “Expenses Paid During Period” to estimate the expenses you paid on your account during this period.
Hypothetical Example for Comparison Purposes
The second line of the table below provides information about hypothetical account values and hypothetical expenses based on the Fund’s actual expense ratio and an assumed rate of return of 5% per year before expenses, which is not the Fund’s actual return. The hypothetical account values and expenses may not be used to estimate the actual ending account balance or expenses you paid for the period. You may use this information to compare the ongoing costs of investing in the Fund and other funds. To do so, compare this 5% hypothetical example with the 5% hypothetical examples that appear in the shareholder reports of other funds.
| | | Beginning | | Ending | | Expenses | | |
| | | Account Value | | Account Value | | Paid | | Annualized |
| | | March 1, | | August 31, | | During | | Expense |
| | | 2022 | | 2022 | | Period(a) | | Ratio |
| Actual | | $1,000.00 | | $ 825.20 | | $3.45 | | 0.75% |
| Hypothetical(b) | | $1,000.00 | | $1,021.42 | | $3.82 | | 0.75% |
| (a) | Expenses are equal to the Fund’s annualized expense ratios, multiplied by the average account value over the period, multiplied by 184/365 (to reflect the one-half year period). |
| (b) | Hypothetical assumes 5% annual return before expenses. |
| ADDITIONAL FEDERAL INCOME TAX INFORMATION (Unaudited) |
The Form 1099-DIV you receive in January 2023 will show the tax status of all distributions paid to your account in calendar year 2022. Shareholders are advised to consult their own tax adviser with respect to the tax consequences of their investment in the Fund. As required by the Internal Revenue Code and/or regulations, shareholders must be notified regarding the status of qualified dividend income for individuals and the dividends received deduction for corporations.
Qualified Dividend Income. The Fund designates approximately 11.01% or up to the maximum amount of such dividends allowable pursuant to the Internal Revenue Code, as qualified dividend income eligible for a reduced tax rate.
Qualified Business Income. The Fund designates approximately 0% of its ordinary income dividends, or up to the maximum amount of such dividends allowable pursuant to the Internal Revenue Code, as qualified business income.
Dividends Received Deduction. Corporate shareholders are generally entitled to take the dividends received deduction on the portion of the Fund’s dividend distribution that qualifies under tax law. For the Fund’s calendar year 2022 ordinary income dividends, 11.01% qualifies for the corporate dividends received deduction.
For the year ended August 31, 2022, the Fund designated $2,475 as long-term capital gain distributions.
| SHAREHOLDER VOTING RESULTS (Unaudited) |
At a Special Shareholder Meeting at which a quorum was present, held on September 6, 2022, Fund shareholders of record as of the close of business on July 5, 2022 voted to approve the following proposal:
Proposal 1: To elect the following individuals to serve on the Board of Trustees of the Trust:
Freddie Jacobs Jr.
Catharine Barrow McGauley
Kenneth G.Y. Grant
Daniel J. Condon
Gary A. Hippenstiel
Stephen A. Little
Ronald C. Tritschler
David R. Carson
| | | Shares | | Shares Voted | | Shares |
| | | Voted in | | Against or | | Needed to |
| Fund | | Favor* | | Abstain* | | Approve* |
| Fisher Investments Institutional Group U.S. Small Cap Equity Fund | | 15,946 (100%) | | 0 (0.00%) | | Plurality (greater than 50%) |
| * | as a percentage of the total voting securities of the Fund voted at the meeting at which a quorum was present |
| TRUSTEES AND OFFICERS (Unaudited) |
GENERAL QUALIFICATIONS. The Board supervises the business activities of the Trust. Each Trustee serves as a trustee until termination of the Trust unless the Trustee dies, resigns, retires, or is removed. The Chairman of the Board and more than 75% of the Trustees are “Independent Trustees,” which means that they are not “interested persons” (as defined in the 1940 Act) of the Trust or any adviser, subadviser or distributor of the Trust.
The following table provides information regarding the Independent Trustees.
Name, Address*,
(Year of Birth),
Position with Trust**,
Term of Position
with Trust | Principal Occupation During Past 5 Years
and Other Directorships |
Daniel J. Condon (1950)
Chairman, May 2022 to present; Chairman of the Audit Committee; Chairman of the Governance & Nominating Committee, May 2020 to May 2022; Independent Trustee, December 2002 to present | Current: Retired (2017 - present); Trustee, Peak Income Plus Fund (2022 – present). |
Kenneth G.Y. Grant (1949)
Chairman of the Governance & Nominating Committee, May 2022 to present; Chairman, January 2017 to May 2022; Independent Trustee, May 2008 to present | Current: Director, Standpoint Multi-Asset (Cayman) Fund, Ltd. (2019 – present); Director, Advisors Charitable Gift Fund (2020 - present), a Donor Advised Fund; Trustee, Peak Income Plus Fund (2022 – present). Previous: EVP, Benefit Plans Administrative Services, Inc., provider of retirement benefit plans administration (2019 – 2020); Director, Northeast Retirement Services (NRS) LLC, a transfer agent and fund administrator; and Director, Global Trust Company (GTC), a non-depository trust company sponsoring private investment product (2003 – 2019); EVP, NRS (2003 – 2019); GTC, EVP (2008 – 2019); EVP, Savings Banks Retirement Association (2003 – 2019), provider of qualified retirement benefit plans. |
| TRUSTEES AND OFFICERS (Unaudited) – (continued) |
Name, Address*,
(Year of Birth),
Position with Trust**,
Term of Position
with Trust | Principal Occupation During Past 5 Years
and Other Directorships |
Gary E. Hippenstiel (1947)
Chairman of the Pricing & Liquidity Committee; Independent Trustee, December 2002 to present | Current: President and founder of Hippenstiel Investment Counsel LLC (“Hippenstiel”) since 2008. Hippenstiel was registered as an investment adviser from 2008 to December 31, 2019; Trustee, Peak Income Plus Fund (2022 – present). |
Stephen A. Little (1946)
Independent Trustee, December 2002 to present; Chairman, December 2004 to December 2016 | Current: President and founder of The Rose, Inc., a registered investment adviser, since 1993; Trustee, Peak Income Plus Fund (2022 – present). |
Ronald C. Tritschler (1952)
Chairman of the Audit Committee, May 2022 to present; Independent Trustee, January 2007 to present; Interested Trustee, December 2002 to December 2006 | Current: Chief Executive Officer, Director and Legal Counsel of The Webb Companies, a national real estate company, since 2001; Director, Standpoint Multi-Asset (Cayman) Fund, Ltd. (2020 – present); Director of First State Bank of the Southeast (2000 - present); Trustee, Peak Income Plus Fund (2022 – present). |
Catharine B. McGauley (1977)
Independent Trustee, September 2022 to present | Current: Lead Portfolio Manager of Atlantic Charter Insurance, a workers’ compensation insurer, since 2010; Investment Councilor of a Family Office (2015 – present); Senior Analyst/ Advisor for a Boston real estate company and related family (2010 – present); Trustee, Peak Income Plus Fund (2002 – present). |
| TRUSTEES AND OFFICERS (Unaudited) – (continued) |
Name, Address*,
(Year of Birth),
Position with Trust**,
Term of Position
with Trust | Principal Occupation During Past 5 Years
and Other Directorships |
Freddie Jacobs, Jr. (1970)
Independent Trustee, September 2022 to present | Current: Chief Operating Officer and Chief Risk Officer Northeast Retirement Services (NRS) LLC, a transfer agent and fund administrator; and Director, Global Trust Company (GTC), a non-depository trust company sponsoring private investment product (2021- present); Trustee of Buckingham Browne & Nichols (BBN) (2018 – present); Chair of the Finance Committee, BBN (2020 – present); Chairman Board of Directors of Crispus Attucks Fund (2020– present); Board Member and Treasurer of New England Tennis Association (2017 –present); Board Member of Camp Harbor View (2020 – present); Trustee, Peak Income Plus Fund (2002 – present). Previous: SVP, Senior Risk Officer NRS (2013 – 2019). |
| * | The business address for each Trustee is 225 Pictoria Drive, Suite 450, Cincinnati, Ohio 45246. |
| ** | As of the date of this Report, the Trust consists of 31 series. |
The following table provides information regarding the interested Trustee and certain officers of the Trust.
Name, Address*,
(Year of Birth),
Position with Trust,
Term of Position
with Trust | Principal Occupation During Past 5 Years
and Other Directorships |
David R. Carson (1958)
President, January 2016 to August 2021; Interested Trustee, August 2020 to present | Current: Senior Vice President Client Strategies of Ultimus Fund Solutions, LLC, since 2013; Interested Trustee of Ultimus Managers Trust, since 2020; Trustee, Peak Income Plus Fund (2022 – present). |
| TRUSTEES AND OFFICERS (Unaudited) – (continued) |
Name, Address*,
(Year of Birth),
Position with Trust,
Term of Position
with Trust | Principal Occupation During Past 5 Years
and Other Directorships |
Martin R. Dean (1963)
President, August 2021 to present; Vice President, November 2020 to August 2021; Chief Compliance Officer, April 2021 to August 2021; Assistant Chief Compliance Officer, January 2016 to April 2021 | Current: Senior Vice President, Head of Fund Compliance of Ultimus Fund Solutions, LLC, since 2016. |
Zachary P. Richmond (1980)
Treasurer and Chief Financial Officer, November 2014 to present | Current: Vice President, Director of Financial Administration for Ultimus Fund Solutions, LLC, since 2015. |
Gweneth K. Gosselink (1955)
Chief Compliance Officer, August 2021 to present | Current: Assistant Vice President, Senior Compliance Officer of Ultimus Fund Solutions, LLC, since 2019. Previous: Chief Operating Officer & CCO at Miles Capital, Inc. (2013 – 2019). |
Elisabeth A. Dahl (1962)
Secretary, May 2017 to present; Assistant Secretary, March 2016 to May 2017 | Current: Attorney, Ultimus Fund Solutions, LLC, since March 2016. |
Stephen L. Preston (1966)
AML Compliance Officer, May 2017 to present | Current: Vice President and Chief Compliance Officer, Ultimus Fund Solutions, LLC and Ultimus Fund Distributors, LLC, since 2011. |
Lynn E. Wood (1946)
Assistant Chief Compliance Officer, April 2021 to present; Chief Compliance Officer, October 2004 to April 2021 | Current: Managing Member, Buttonwood Compliance Partners, LLC, since 2013. |
| * | The business address for each officer is 225 Pictoria Drive, Suite 450, Cincinnati, Ohio 45246. |
| OTHER INFORMATION (Unaudited) |
The Fund’s Statement of Additional Information (“SAI”) includes additional information about the Trustees and is available without charge, upon request. You may call toll-free at (800) 851-8845 to request a copy of the SAI or to make shareholder inquiries.
PRIVACY NOTICE
| FACTS | WHAT DOES FISHER INVESTMENTS INSTITUTIONAL GROUP U.S. SMALL CAP EQUITY FUND (THE “FUND”) DO WITH YOUR PERSONAL INFORMATION? |
| |
| Why? | Financial companies choose how they share your personal information. Federal law gives consumers the right to limit some but not all sharing. Federal law also requires us to tell you how we collect, share, and protect your personal information. Please read this notice carefully to understand what we do. |
| |
| What? | The types of personal information we collect and share depend on the product or service you have with us. This information can include: ■ Social Security number ■ account balances and account transactions ■ transaction or loss history and purchase history When you are no longer our customer, we continue to share your information as described in this notice. |
| |
| How? | All financial companies need to share customers’ personal information to run their everyday business. In the section below, we list the reasons financial companies can share their customers’ personal information; the reasons the Fund chooses to share; and whether you can limit this sharing. |
| |
| Reasons we can share your personal information | Does the Fund
share? | Can you limit
this sharing? |
For our everyday business purposes – such as to process your transactions, maintain your account(s), respond to court orders and legal investigations, or report to credit bureaus | Yes | No |
For our marketing purposes – to offer our products and services to you | No | We don’t share |
| For joint marketing with other financial companies | No | We don’t share |
For our affiliates’ everyday business purposes – information about your transactions and experiences | No | We don’t share |
For our affiliates’ everyday business purposes – information about your creditworthiness | No | We don’t share |
| For nonaffiliates to market to you | No | We don’t share |
| | | | |
| Questions? | Call (800) 851-8845 |
| Who we are |
| Who is providing this notice? | Fisher Investments Institutional Group U.S. Small Cap Equity Fund Ultimus Fund Distributors, LLC (Distributor) Ultimus Fund Solutions, LLC (Administrator) |
| What we do |
| How does the Fund protect my personal information? | To protect your personal information from unauthorized access and use, we use security measures that comply with federal law. These measures include computer safeguards and secured files and buildings. Our service providers are held accountable for adhering to strict policies and procedures to prevent any misuse of your nonpublic personal information. |
| How does the Fund collect my personal information? | We collect your personal information, for example, when you ■ open an account or deposit money ■ make deposits or withdrawals from your account or provide account information We also collect your personal information from other companies. |
| Why can’t I limit all sharing? | Federal law gives you the right to limit only ■ sharing for affiliates’ everyday business purposes – information about your creditworthiness ■ affiliates from using your information to market to you ■ sharing for nonaffiliates to market to you State laws and individual companies may give you additional rights to limit sharing. |
| |
| Definitions |
| Affiliates | Companies related by common ownership or control. They can be financial and nonfinancial companies. ■ Fisher Asset Management, LLC, d/b/a Fisher Investments, the investment adviser to the Fund, could be deemed to be an affiliate. |
| Nonaffiliates | Companies not related by common ownership or control. They can be financial and nonfinancial companies. ■ The Fund does not share your personal information with nonaffiliates so they can market to you. |
| Joint marketing | A formal agreement between nonaffiliated financial companies that together market financial products or services to you. ■ The Fund doesn’t jointly market. |
This page intentionally left blank.
This page intentionally left blank.
This page intentionally left blank.
PROXY VOTING
A description of the policies and procedures that the Fund uses to determine how to vote proxies relating to portfolio securities and information regarding how the Fund voted those proxies during the most recent twelve month period ended June 30, are available (1) without charge upon request by calling the Fund at (800) 851-8845 and (2) in Fund documents filed with the SEC on the SEC’s website at www.sec.gov.
TRUSTEES Daniel J. Condon, Chairman David R. Carson Kenneth G.Y. Grant Gary E. Hippenstiel Freddie Jacobs, Jr. Stephen A. Little Catharine B. McGauley Ronald C. Tritschler OFFICERS Martin R. Dean, President Gweneth K. Gosselink, Chief Compliance Officer Zachary P. Richmond, Treasurer and Chief Financial Officer Lynn E. Wood, Assistant Chief Compliance Officer INVESTMENT ADVISER Fisher Asset Management, LLC 5525 NW Fisher Creek Drive Camas, WA 98607 DISTRIBUTOR Ultimus Fund Distributors, LLC 225 Pictoria Drive, Suite 450 Cincinnati, OH 45246 | INDEPENDENT REGISTERED PUBLIC ACCOUNTING FIRM Cohen & Company, Ltd. 151 N Franklin Street, Suite 575 Chicago, IL 60606 LEGAL COUNSEL Thompson Hine LLP 312 Walnut Street, 20th Floor Cincinnati, OH 45202 CUSTODIAN U.S. Bank, N.A. 425 Walnut Street Cincinnati, OH 45202 ADMINISTRATOR, TRANSFER AGENT AND FUND ACCOUNTANT Ultimus Fund Solutions, LLC 225 Pictoria Drive, Suite 450 Cincinnati, OH 45246 |
This report is intended only for the information of shareholders or those who have received the Fund’s prospectus which contains information about the Fund’s management fee and expenses. Please read the prospectus carefully before investing.
Distributed by Ultimus Fund Distributors, LLC
Member FINRA/SIPC
Fisher3-AR-22
| FISHER INVESTMENTS INSTITUTIONAL |
| GROUP FUND FAMILY |
Annual Report
August 31, 2022
Fisher Investments Institutional Group
All Foreign Equity Environmental and Social Values Fund
Fund Adviser:
Fisher Asset Management, LLC
5525 NW Fisher Creek Drive,
Camas, Washington 98607
(800) 851-8845
| FISHER INVESTMENTS INSTITUTIONAL GROUP ALL FOREIGN |
| EQUITY ENVIRONMENTAL AND SOCIAL VALUES FUND |
| MANAGEMENT’S DISCUSSION OF FUND PERFORMANCE |
| (Unaudited) |
| |
Dear Shareholder:
Market Outlook
Global developed equities extended their decline in Q2, ending 2022’s first half down -19.6%. Developed markets hit a new low on June 17, down -22.5% since September 6, 2021’s high—past the -20% threshold commonly used to determine bear markets. Though more declines are possible in the near term, we still believe this market downturn is sentiment-driven, with a myriad of concerning headlines, from the Russia – Ukraine war to China’s COVID restrictions and elevated inflation, weighing heavily on investors’ moods. In our view, shareholders should expect a rebound is more likely than an extended downturn, and we expect a recovery to start sooner than many anticipate.
Elevated inflation continued dominating headlines across the developed world in Q2. For instance, UK CPI rose 9.0% y/y in April, accelerating from March’s 7.0%, while the eurozone’s harmonized index of consumer prices (HICP) sped from 7.4% y/y in April to 8.1% in May. High prices are a burden on companies and households alike, and the war in Ukraine added supply-side price spikes—so elevated inflation may linger. But this is largely a supply issue, so despite plenty of calls for central banks to act, monetary tools can’t resolve supply bottlenecks, reopen Chinese ports or bring energy online immediately. Moreover, elevated inflation isn’t automatically bad for equities. Last year, the EAFE, UK and eurozone were all nicely positive even as CPI accelerated throughout the year. Although sentiment may be hitting equities so far this year, we see no fundamental reason equities can’t continue overcoming inflation.
Recession fears led to value-oriented sectors—namely Materials—underperforming late in Q2, a reversal from its big outperformance in Q1. Where fears of supply shortages drove commodity prices higher earlier in the year—benefiting Materials— the sector fell on expectations for a recession to destroy demand in the near term. Other cyclical sectors and industries, including Industrials and Banks, also underperformed. In our view, there is mounting evidence that equities are pricing in a potential shallow recession—likely limiting the surprise power if this comes to pass.
Energy outperformed during the quarter, but also retreated toward the end of Q2. While we think recent negative sentiment’s impact on oil prices is perhaps overdone, the late quarter decline illustrates why early-year fears of indefinitely high and rising oil prices were off base. They extrapolated a potential acute supply shortage forward without acknowledging the potential for production to rise and demand to fluctuate. For example, focus on projected shortages overlooks other sources of supply, whether
| FISHER INVESTMENTS INSTITUTIONAL GROUP ALL FOREIGN |
| EQUITY ENVIRONMENTAL AND SOCIAL VALUES FUND |
| MANAGEMENT’S DISCUSSION OF FUND PERFORMANCE |
| (Unaudited) – (continued) |
| |
from other countries (such as the US) or black and grey markets. Russian producers have found ways to work around sanctions like obscuring their oil’s origins or transferring products at sea. Additionally, it isn’t clear that Russian oil refined in third countries would be subject to sanctions—a loophole refineries in India are reportedly exploiting already. In our view, supply and demand in oil markets likely will be in better balance than many believe and we don’t think a recession is likely to destroy oil demand. However, we do think oil is likely to stay range-bound for the foreseeable future, making Energy’s early-year run unlikely to last.
As for recession, it is possible, but data released thus far don’t indicate the developed world is necessarily in one already. Purchasing managers’ indexes (PMIs) for the UK, eurozone and Japan remained expansionary in June, albeit with eurozone surveys signaling slower growth. UK monthly GDP also contracted again in April, its second straight decline, although this stemmed primarily from the end of COVID testing and tracing and the vaccination drive. Yet there were also plenty of positive data, which— combined with PMIs—point to a global economy that is muddling through the extant headwinds, with pockets of strength counterbalancing the weak areas. Yet with several eurozone nations dealing with Russia’s increasingly widespread clampdown on natural gas flows—and warning of potential energy rationing this winter—recession could emerge in the months ahead. We aren’t blind to this possibility, and neither are equities, whose decline this year has coincided with escalating economic fear.
Italian equities fell -17.6% in Q2 on renewed concerns regarding the country’s debt. Italy’s 10-year government bond yields climbed past 3% in late May, and after the ECB didn’t address Italian debt at its regularly scheduled June meeting—and discussed hiking its policy rate later in the summer—the Italian 10-year BTP yield crossed over 4% seemingly tied to negative sentiment. That prompted an emergency ECB meeting on June 15 where officials discussed an “anti-fragmentation instrument” to address the divergence in eurozone nations’ borrowing costs. While details remain scant, many pundits think the ECB’s response will resemble its Outright Monetary Transactions (OMT) program along with altering the geographic breakdown of its bond portfolio. For instance, the central bank may invest the proceeds of one nation’s maturing bonds into Italian bonds.
The dialogue surrounding the ECB’s plans overstates the concerns surrounding Italian debt, in our view. The most pressing question about debt isn’t the amount outstanding but a country’s ability to service its obligations by making its interest payments. As of Q1’s end, Italy’s interest payments comprised 12.4% of tax revenues, down from around 20% during the eurozone sovereign debt crisis—and much lower than the
| FISHER INVESTMENTS INSTITUTIONAL GROUP ALL FOREIGN |
| EQUITY ENVIRONMENTAL AND SOCIAL VALUES FUND |
| MANAGEMENT’S DISCUSSION OF FUND PERFORMANCE |
| (Unaudited) – (continued) |
| |
40% levels in the mid-1990s. As of the end of 2021, the average maturity of Italian debt was just over 7 years, so even if rates climb and stay higher, they aren’t likely to cause problems overnight. In our view, Italy offers an opportunity for uncertainty to fall, especially since the country isn’t in economic jeopardy. Since hitting 4% in mid-June, 10-year Italian bond yields have eased, ending the month at 3.29%. Should reality prove better than feared, that positive outcome can boost sentiment higher.
France’s legislative elections yielded unexpected results. President Emmanuel Macron’s Together! bloc won 245 seats, falling short of the 289 necessary for a parliamentary majority. While that wasn’t surprising, other parties’ results contrasted with poll projections. Many forecast the leftist alliance known as Nupes to benefit most from any Together! losses, but after winning just 131 seats collectively, the four parties comprising the group decided to form their own parliamentary groups rather than combine forces under leftist leader Jean-Luc Mélenchon’s France Unbowed party. The splintered leftist alliance left Marine Le Pen’s National Rally—whose parliamentary seats jumped from 8 to 89, surprising many observers—the single-largest opposition party. Since the vote, President Macron carried out a limited reshuffle of his cabinet, with no opponents joining his camp, and his minority government will have to negotiate on a bill-by-bill basis with the opposition. This doesn’t mean President Macron and the French legislature won’t pass anything, but it looks unlikely contentious items, including pension reform, will sail through. Despite the recent discussion of bills aimed at workers getting a share of dividends paid to shareholders, it is unclear whether this can pass—or if President Macron would even try. In our view, gridlock looks likely in France’s political future—an outcome equities like, as it reduces uncertainty.
Hong Kong equities only fell slightly in Q2, -1.1%, though with volatility. The special administrative region’s outperformance was likely tied to mainland developments, as China scaled back many COVID measures, including travel restrictions. Hong Kong equities likely rose late in Q2 in sympathy with mainland equities as regulators relaxed their tough approach to China’s tech sector—a source of lingering uncertainty for past 12 months. The mid-June rally also coincided with the release of May Chinese economic data, including widely watched industrial production (0.7% y/y) and retail sales (-6.7% y/y)—both better than consensus expectations. Hong Kong’s prospects are tied to the mainland, and in our view, there is room for uncertainty to fall ahead. While many focus on the possibility of new lockdowns, the government likely prioritizes economic stability ahead of autumn’s National People Congress. A return to normal—an underappreciated positive—seems to go overlooked by many.
| FISHER INVESTMENTS INSTITUTIONAL GROUP ALL FOREIGN |
| EQUITY ENVIRONMENTAL AND SOCIAL VALUES FUND |
| MANAGEMENT’S DISCUSSION OF FUND PERFORMANCE |
| (Unaudited) – (continued) |
| |
Japanese equities fell in line with other developed markets in Q2. Headlines highlighted several stories, including the Bank of Japan’s ineffective and arguably counterproductive policy; the weak yen’s weighing on businesses and households due to expensive imported energy (and not to mention international investors’ returns); and developments ahead of July’s upper house election. However, one widely overlooked potential positive long-term development: giant industrial conglomerate Toshiba agreed to add two directors from activist hedge fund investors. Japanese conglomerates have long struggled with improving corporate governance. Though former Prime Minister Shinzo Abe implemented some reforms, change has been glacial, especially among biggest conglomerates, due largely to cross-shareholdings insulating boards from outside influence. The announcement at Toshiba is perhaps a sign of progress on that front, though it doesn’t mean a sea change is underway. We have long argued Japanese conglomerates’ resistance to corporate governance reform is a long-running structural headwind, as change would encourage creative destruction that could help free up stagnant business.
Performance Attribution
The Fisher Investments Institutional Group All Foreign Equity Environmental and Social Values Fund underperformed the MSCI ACWI ex US Index for the period from September 1, 2021 through August 31, 2022. During this period, the Fund returned -27.71% while the Fund’s primary benchmark, the MSCI ACWI ex U.S. Index, returned -19.52%. Country, sector and equity selection detracted from relative return. An overweight to and selection within Norwegian Energy was the largest contributor to relative return, driven by petroleum refining company Equinor. Additionally, an overweight to Spanish Energy contributed, as the sector outperformed the broader benchmark. Conversely, an overweight to and selection within Information Technology was the largest detractor, driven by semiconductor company ASML, electronics manufacturer Keyence and e-commerce company Shopify. Further, an overweight to and selection within Industrials detracted, as post company Deutsche Post, building materials manufacturer Saint-Gobain and human resources company Recruit Holdings underperformed.
Portfolio Shifts
For the period from September 1, 2021 through August 31 2022, we have further reduced our exposure to China. A number of headwinds have weighed on Chinese equities more than expected this year including defaults in the property sector, heightened geopolitical tensions, supply chain concerns, delisting fears as well as
| FISHER INVESTMENTS INSTITUTIONAL GROUP ALL FOREIGN |
| EQUITY ENVIRONMENTAL AND SOCIAL VALUES FUND |
| MANAGEMENT’S DISCUSSION OF FUND PERFORMANCE |
| (Unaudited) – (continued) |
| |
uncertainty surrounding China’s adherence to its zero-COVID policy. While we still hold some conviction in China, these headwinds are lasting longer than we initially expected.
On a sector level, the portfolio is largely similar as we didn’t make any significant shifts. Rather, portfolio deviations are primarily attributable to market movements.
Fisher Investments
August 2022
| FISHER INVESTMENTS INSTITUTIONAL GROUP ALL FOREIGN |
| EQUITY ENVIRONMENTAL AND SOCIAL VALUES FUND |
| Investment Results (Unaudited) |
| Average Annual Total Return as of August 31, 2022(a) |
| | | Since |
| | | Inception |
| Fund/Index | One Year | (7/17/20) |
| Fisher Investments Institutional Group | | |
| All Foreign Equity Environmental and Social Values Fund | (27.71)% | 0.19% |
| MSCI ACWI ex U.S. Index(b) | (19.52)% | 2.08% |
| | | |
| | | Expense |
| | | Ratios (c) |
| Gross | | 80.18% |
| With Applicable Expense Cap | | 0.68% |
The performance quoted represents past performance, which does not guarantee future results. The investment return and principal value of an investment will fluctuate so that an investor’s shares, when redeemed, may be worth more or less than their original cost. The returns shown do not reflect deduction of taxes that a shareholder would pay on Fisher Investments Institutional Group All Foreign Equity Environmental and Social Values Fund (the “Fund”) distributions or the redemption of Fund shares. The Fund’s investment objectives, risks, charges and expenses must be considered carefully before investing. Current performance of a fund may be lower or higher than the performance quoted. Performance data current to the most recent month end may be obtained by calling (800) 851-8845.
| (a) | Return figures reflect any change in price per share and assume the reinvestment of all distributions. |
| (b) | The MSCI ACWI ex U.S. Index is a stock market index comprising of non-U.S. stocks from 23 developed markets and 24 emerging markets. Individuals cannot invest directly in an index; however, an individual can invest in exchange traded funds or other investment vehicles that attempt to track the performance of a benchmark index. Index returns assume reinvestment of dividends and do not reflect any fees or expenses. |
| (c) | The expense ratios are from the Fund’s prospectus dated December 29, 2021. Fisher Asset Management, LLC, d/b/a Fisher Investments (the “Adviser”) is contractually obligated to limit the Fund’s total annual operating expenses to 0.68% of the Fund’s average daily net assets through December 31, 2026 (excluding portfolio transaction and other investment-related costs (including brokerage fees and commissions); taxes; borrowing costs (such as interest and dividend expenses on securities sold short); acquired fund fees and expenses; certain fees and expenses associated with investments in other collective investment vehicles or derivative instruments (including for example option and swap fees and expenses); any administrative and/ or shareholder servicing fees payable pursuant to a plan adopted by the Board of Trustees; expenses incurred in connection with any merger or reorganization; extraordinary expenses (such as litigation expenses, indemnification of Trust officers and Trustees and contractual indemnification of Fund service providers); and other expenses that the Trustees agree have not been incurred in the ordinary course of the Fund’s business). This expense cap may not be terminated prior to this date except by the Board of Trustees. Each waiver/expense payment by the Adviser is subject to recoupment by the Adviser from the Fund in the three years following the date the particular waiver/expense payment occurred, but only if such recoupment can be achieved without exceeding the annual expense limitation in effect at the time of the waiver/expense payment and any expense limitation in effect at the time of the recoupment. Additional information pertaining to the Fund’s expense ratios as of August 31, 2022 can be found in the financial highlights. |
The Fund’s investment objective, strategies, risks, charges and expenses must be considered carefully before investing. The Fund’s prospectus contains this and other important information about the investment company and may be obtained by calling (800) 851-8845. Please read it carefully before investing.
The Fund is distributed by Ultimus Fund Distributors, LLC, Member FINRA/SIPC.
| FISHER INVESTMENTS INSTITUTIONAL GROUP ALL FOREIGN |
| EQUITY ENVIRONMENTAL AND SOCIAL VALUES FUND |
| Investment Results (Unaudited) – (continued) |
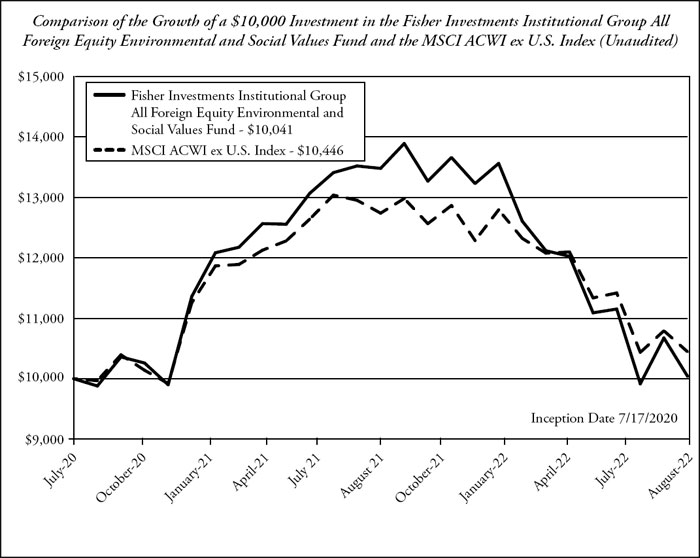
This graph shows the value of a hypothetical initial investment of $10,000 made on July 17, 2020 (commencement of operations) and held through August 31, 2022. MSCI ACWI ex U.S. Index is a widely recognized unmanaged index of equity prices and is representative of a broader market and range of securities than is found in the Fund’s portfolio. Individuals cannot invest directly in an index; however, an individual may invest in exchange traded funds or other investment vehicles that attempt to track the performance of a benchmark index. THE FUND’S RETURN REPRESENTS PAST PERFORMANCE AND DOES NOT GUARANTEE OR PREDICT FUTURE RESULTS. The returns shown do not reflect deduction of taxes that a shareholder would pay on Fund distributions or the redemption of Fund shares. Investment returns and principal values will fluctuate so that an investor’s shares, when redeemed, may be worth more or less than their original cost.
Current performance may be lower or higher than the performance data quoted. For more information on the Fund, and to obtain performance data current to the most recent month-end, or to request a prospectus, please call (800) 851-8845. You should carefully consider the investment objectives, risks, charges and expenses of the Fund before investing. The Fund’s prospectus contains this and other information about the Fund and should be read carefully before investing.
The Fund is distributed by Ultimus Fund Distributors, LLC, member FINRA/SIPC.
| FISHER INVESTMENTS INSTITUTIONAL GROUP ALL FOREIGN |
| EQUITY ENVIRONMENTAL AND SOCIAL VALUES FUND |
| Fund Holdings (Unaudited) |
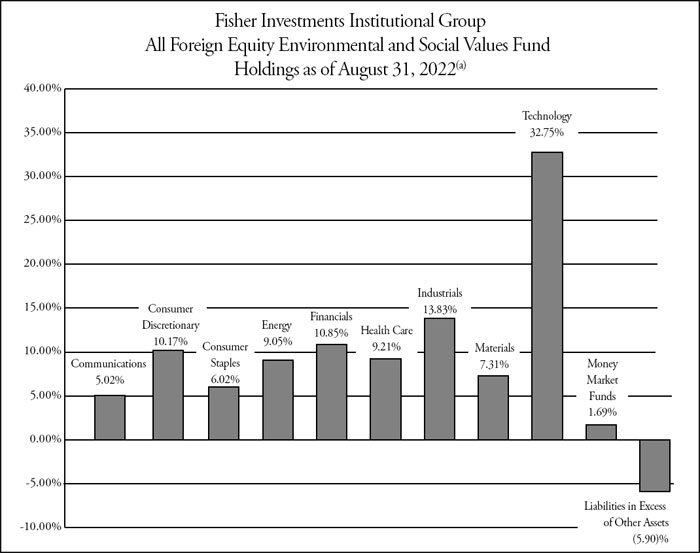
| (a) | As a percentage of net assets |
The Fund seeks to outperform, net of fees and expenses, the return of the MSCI ACWI ex U.S. Index as its investment objective.
| Availability of Portfolio Schedule – (Unaudited) |
| |
The Fund files its complete schedule of portfolio holdings with the Securities and Exchange Commission (the “SEC”) for the first and third quarters of each fiscal year as an exhibit to its reports on Form N-PORT. The Fund’s Form N-PORT reports are available on the SEC’s website at http://www.sec.gov.
| FISHER INVESTMENTS INSTITUTIONAL GROUP ALL FOREIGN |
| EQUITY ENVIRONMENTAL AND SOCIAL VALUES FUND |
| SCHEDULE OF INVESTMENTS |
| August 31, 2022 |
| COMMON STOCKS — 104.21% | | Shares | | | Fair Value | |
| Argentina — 1.71% | | | | | | | | |
| Consumer Discretionary — 1.71% | | | | | | | | |
| MercadoLibre, Inc.(a) | | | 3 | | | $ | 2,565 | |
| Total Argentina | | | | | | | 2,565 | |
| | | | | | | | | |
| Australia — 3.31% | | | | | | | | |
| Health Care — 1.33% | | | | | | | | |
| CSL Ltd. | | | 10 | | | | 2,008 | |
| | | | | | | | | |
| Technology — 1.98% | | | | | | | | |
| Atlassian Corp. PLC, Class A(a) | | | 12 | | | | 2,972 | |
| Total Australia | | | | | | | 4,980 | |
| | | | | | | | | |
| Canada — 1.24% | | | | | | | | |
| Technology — 1.24% | | | | | | | | |
| Open Text Corp. | | | 19 | | | | 598 | |
| Shopify, Inc., Class A(a) | | | 40 | | | | 1,266 | |
| | | | | | | | 1,864 | |
| Total Canada | | | | | | | 1,864 | |
| | | | | | | | | |
| China — 5.49% | | | | | | | | |
| Communications — 2.24% | | | | | | | | |
| NetEase, Inc. - ADR | | | 19 | | | | 1,682 | |
| Tencent Holdings Ltd. - ADR | | | 41 | | | | 1,693 | |
| | | | | | | | 3,375 | |
| Consumer Discretionary — 3.25% | | | | | | | | |
| Alibaba Group Holding Ltd. - ADR(a) | | | 19 | | | | 1,813 | |
| JD.com, Inc. - ADR | | | 26 | | | | 1,651 | |
| Meituan - ADR(a) | | | 30 | | | | 1,437 | |
| | | | | | | | 4,901 | |
| Total China | | | | | | | 8,276 | |
| | | | | | | | | |
| Denmark — 3.93% | | | | | | | | |
| Energy — 1.27% | | | | | | | | |
| Vestas Wind Systems A/S | | | 76 | | | | 1,914 | |
| | | | | | | | | |
See accompanying notes which are an integral part of these financial statements.
| FISHER INVESTMENTS INSTITUTIONAL GROUP ALL FOREIGN |
| EQUITY ENVIRONMENTAL AND SOCIAL VALUES FUND |
| SCHEDULE OF INVESTMENTS – (continued) |
| August 31, 2022 |
| COMMON STOCKS — 104.21% - continued | | Shares | | | Fair Value | |
| Denmark — 3.93% - (continued) | | | | | | | | |
| Health Care — 2.66% | | | | | | | | |
| Coloplast A/S - ADR | | | 51 | | | $ | 585 | |
| Novo Nordisk A/S, Class B | | | 32 | | | | 3,427 | |
| | | | | | | | 4,012 | |
| Total Denmark | | | | | | | 5,926 | |
| | | | | | | | | |
| France — 15.51% | | | | | | | | |
| Consumer Discretionary — 4.76% | | | | | | | | |
| Hermes International SA | | | 4 | | | | 5,153 | |
| Kering SA | | | 4 | | | | 2,021 | |
| | | | | | | | 7,174 | |
| Consumer Staples — 1.60% | | | | | | | | |
| L’Oreal SA | | | 7 | | | | 2,414 | |
| | | | | | | | | |
| Financials — 1.92% | | | | | | | | |
| BNP Paribas SA | | | 25 | | | | 1,167 | |
| Credit Agricole SA | | | 116 | | | | 1,071 | |
| Societe Generale SA | | | 30 | | | | 665 | |
| | | | | | | | 2,903 | |
| Health Care — 1.10% | | | | | | | | |
| Sanofi | | | 20 | | | | 1,651 | |
| | | | | | | | | |
| Industrials — 1.69% | | | | | | | | |
| Aeroports de Paris(a) | | | 14 | | | | 1,924 | |
| Vinci SA - ADR | | | 27 | | | | 622 | |
| | | | | | | | 2,546 | |
| Materials — 1.75% | | | | | | | | |
| Cie de Saint-Gobain | | | 65 | | | | 2,634 | |
| | | | | | | | | |
| Technology — 2.69% | | | | | | | | |
| Dassault Systems SE | | | 71 | | | | 2,751 | |
| Teleperformance | | | 3 | | | | 857 | |
| Worldline SA/France(a) | | | 10 | | | | 430 | |
| | | | | | | | 4,038 | |
| Total France | | | | | | | 23,360 | |
| | | | | | | | | |
| Germany — 6.81% | | | | | | | | |
| Consumer Staples — 1.41% | | | | | | | | |
| Beiersdorf AG | | | 21 | | | | 2,122 | |
| | | | | | | | | |
See accompanying notes which are an integral part of these financial statements.
| FISHER INVESTMENTS INSTITUTIONAL GROUP ALL FOREIGN |
| EQUITY ENVIRONMENTAL AND SOCIAL VALUES FUND |
| SCHEDULE OF INVESTMENTS – (continued) |
| August 31, 2022 |
| COMMON STOCKS — 104.21% - continued | | Shares | | | Fair Value | |
| Germany — 6.81% - (continued) | | | | | | | | |
| Financials — 1.69% | | | | | | | | |
| Deutsche Boerse AG | | | 15 | | | $ | 2,538 | |
| | | | | | | | | |
| Industrials — 3.20% | | | | | | | | |
| Deutsche Post AG | | | 74 | | | | 2,706 | |
| Siemens AG | | | 21 | | | | 2,132 | |
| | | | | | | | 4,838 | |
| Technology — 0.51% | | | | | | | | |
| SAP SE | | | 9 | | | | 768 | |
| Total Germany | | | | | | | 10,266 | |
| | | | | | | | | |
| India — 2.92% | | | | | | | | |
| Financials — 1.66% | | | | | | | | |
| HDFC Bank Ltd. - ADR | | | 41 | | | | 2,503 | |
| | | | | | | | | |
| Technology — 1.26% | | | | | | | | |
| Infosys Ltd. - ADR | | | 104 | | | | 1,903 | |
| Total India | | | | | | | 4,406 | |
| | | | | | | | | |
| Indonesia — 1.83% | | | | | | | | |
| Financials — 1.83% | | | | | | | | |
| Bank Rakyat Indonesia Persero Tbk PT - ADR | | | 190 | | | | 2,756 | |
| Total Indonesia | | | | | | | 2,756 | |
| | | | | | | | | |
| Israel — 1.35% | | | | | | | | |
| Technology — 1.35% | | | | | | | | |
| NICE-Systems Ltd. - ADR(a) | | | 6 | | | | 1,280 | |
| Wix.com Ltd.(a) | | | 12 | | | | 759 | |
| | | | | | | | 2,039 | |
| Total Israel | | | | | | | 2,039 | |
| | | | | | | | | |
| Italy — 1.79% | | | | | | | | |
| Energy — 1.41% | | | | | | | | |
| Eni SpA | | | 179 | | | | 2,123 | |
| | | | | | | | | |
See accompanying notes which are an integral part of these financial statements.
| FISHER INVESTMENTS INSTITUTIONAL GROUP ALL FOREIGN |
| EQUITY ENVIRONMENTAL AND SOCIAL VALUES FUND |
| SCHEDULE OF INVESTMENTS – (continued) |
| August 31, 2022 |
| COMMON STOCKS — 104.21% - continued | | Shares | | | Fair Value | |
| Italy — 1.79% - (continued) | | | | | | | | |
| Financials — 0.38% | | | | | | | | |
| Intesa Sanpaolo SpA | | | 329 | | | $ | 569 | |
| Total Italy | | | | | | | 2,692 | |
| | | | | | | | | |
| Japan — 11.81% | | | | | | | | |
| Communications — 1.31% | | | | | | | | |
| M3, Inc. | | | 61 | | | | 1,985 | |
| | | | | | | | | |
| Health Care — 1.99% | | | | | | | | |
| Eisai Co. Ltd. - ADR | | | 14 | | | | 571 | |
| Hoya Corp. - ADR | | | 14 | | | | 1,429 | |
| Terumo Corp. - ADR | | | 31 | | | | 997 | |
| | | | | | | | 2,997 | |
| Industrials — 7.82% | | | | | | | | |
| Daifuku Co. Ltd. - ADR | | | 52 | | | | 760 | |
| FANUC Corp. - ADR | | | 105 | | | | 1,688 | |
| Keyence Corp. | | | 14 | | | | 5,325 | |
| Kubota Corp. | | | 100 | | | | 1,566 | |
| Recruit Holdings Co. Ltd. - ADR | | | 384 | | | | 2,431 | |
| | | | | | | | 11,770 | |
| Technology — 0.69% | | | | | | | | |
| Obic Co. Ltd.(a) | | | 7 | | | | 1,047 | |
| Total Japan | | | | | | | 17,799 | |
| | | | | | | | | |
| Korea (Republic Of) — 5.85% | | | | | | | | |
| Communications — 1.07% | | | | | | | | |
| NAVER Corp. | | | 9 | | | | 1,609 | |
| | | | | | | | | |
| Financials — 1.39% | | | | | | | | |
| KB Financial Group, Inc. | | | 57 | | | | 2,099 | |
| | | | | | | | | |
| Technology — 3.39% | | | | | | | | |
| Samsung Electronics Co. Ltd. | | | 115 | | | | 5,114 | |
| Total Korea (Republic Of) | | | | | | | 8,822 | |
| | | | | | | | | |
See accompanying notes which are an integral part of these financial statements.
| FISHER INVESTMENTS INSTITUTIONAL GROUP ALL FOREIGN |
| EQUITY ENVIRONMENTAL AND SOCIAL VALUES FUND |
| SCHEDULE OF INVESTMENTS – (continued) |
| August 31, 2022 |
| COMMON STOCKS — 104.21% - continued | | Shares | | | Fair Value | |
| Netherlands — 12.90% | | | | | | | | |
| Consumer Discretionary — 0.45% | | | | | | | | |
| Stellantis NV | | | 51 | | | $ | 684 | |
| | | | | | | | | |
| Financials — 0.60% | | | | | | | | |
| ING Groep NV | | | 103 | | | | 907 | |
| | | | | | | | | |
| Technology — 11.85% | | | | | | | | |
| Adyen NV(a) | | | 1 | | | | 1,552 | |
| ASML Holding NV | | | 17 | | | | 8,275 | |
| NXP Semiconductors NV | | | 34 | | | | 5,596 | |
| Wolters Kluwer NV | | | 25 | | | | 2,447 | |
| | | | | | | | 17,870 | |
| Total Netherlands | | | | | | | 19,461 | |
| | | | | | | | | |
| Norway — 2.35% | | | | | | | | |
| Energy — 2.35% | | | | | | | | |
| Equinor ASA | | | 92 | | | | 3,543 | |
| Total Norway | | | | | | | 3,543 | |
| | | | | | | | | |
| Spain — 2.61% | | | | | | | | |
| Energy — 2.27% | | | | | | | | |
| Repsol SA | | | 262 | | | | 3,417 | |
| | | | | | | | | |
| Financials — 0.34% | | | | | | | | |
| Banco Santander SA | | | 209 | | | | 507 | |
| Total Spain | | | | | | | 3,924 | |
| | | | | | | | | |
| Switzerland — 1.12% | | | | | | | | |
| Industrials — 1.12% | | | | | | | | |
| ABB Ltd.(a) | | | 61 | | | | 1,682 | |
| Total Switzerland | | | | | | | 1,682 | |
| | | | | | | | | |
| Taiwan Province Of China — 5.71% | | | | | | | | |
| Technology — 5.71% | | | | | | | | |
| Taiwan Semiconductor Manufacturing Co. Ltd. - ADR | | | 103 | | | | 8,586 | |
| Total Taiwan Province Of China | | | | | | | 8,586 | |
| | | | | | | | | |
See accompanying notes which are an integral part of these financial statements.
| FISHER INVESTMENTS INSTITUTIONAL GROUP ALL FOREIGN |
| EQUITY ENVIRONMENTAL AND SOCIAL VALUES FUND |
| SCHEDULE OF INVESTMENTS – (continued) |
| August 31, 2022 |
| COMMON STOCKS — 104.21% - continued | | Shares | | | Fair Value | |
| United Kingdom — 15.97% | | | | | | | | |
| Communications — 0.40% | | | | | | | | |
| WPP PLC | | | 69 | | | $ | 597 | |
| | | | | | | | | |
| Consumer Staples — 3.01% | | | | | | | | |
| Coca-Cola European Partners PLC | | | 53 | | | | 2,606 | |
| Reckitt Benckiser Group PLC | | | 25 | | | | 1,930 | |
| | | | | | | | 4,536 | |
| Energy — 1.75% | | | | | | | | |
| BP PLC | | | 515 | | | | 2,641 | |
| | | | | | | | | |
| Financials — 1.04% | | | | | | | | |
| Barclays PLC | | | 378 | | | | 722 | |
| London Stock Exchange Group PLC | | | 9 | | | | 847 | |
| | | | | | | | 1,569 | |
| Health Care — 2.13% | | | | | | | | |
| AstraZeneca PLC | | | 26 | | | | 3,214 | |
| | | | | | | | | |
| Materials — 5.56% | | | | | | | | |
| Anglo American PLC | | | 98 | | | | 3,168 | |
| Antofagasta PLC | | | 217 | | | | 2,775 | |
| Rio Tinto PLC | | | 44 | | | | 2,438 | |
| | | | | | | | 8,381 | |
| Technology — 2.08% | | | | | | | | |
| Experian PLC | | | 103 | | | | 3,137 | |
| Total United Kingdom | | | | | | | 24,075 | |
| | | | | | | | | |
| Total Common Stocks (Cost $162,894) | | | | | | | 157,022 | |
| | | | | | | | | |
See accompanying notes which are an integral part of these financial statements.
| FISHER INVESTMENTS INSTITUTIONAL GROUP ALL FOREIGN |
| EQUITY ENVIRONMENTAL AND SOCIAL VALUES FUND |
| SCHEDULE OF INVESTMENTS – (continued) |
| August 31, 2022 |
| MONEY MARKET FUNDS — 1.69% | | Shares | | | Fair Value | |
| First American Government Obligations Fund, Class X, 2.04%(b) | | | 2,553 | | | $ | 2,553 | |
| | | | | | | | | |
| Total Money Market Funds (Cost $2,553) | | | | | | | 2,553 | |
| | | | | | | | | |
| Total Investments — 105.90% (Cost $165,447) | | | | | | | 159,575 | |
| | | | | | | | | |
| Liabilities in Excess of Other Assets — (5.90)% | | | | | | | (8,886 | ) |
| | | | | | | | | |
| NET ASSETS — 100.00% | | | | | | $ | 150,689 | |
| | | | | | | | | |
| (a) | Non-income producing security. |
| (b) | Rate disclosed is the seven day effective yield as of August 31, 2022. |
See accompanying notes which are an integral part of these financial statements.
| FISHER INVESTMENTS INSTITUTIONAL GROUP ALL FOREIGN |
| EQUITY ENVIRONMENTAL AND SOCIAL VALUES FUND |
| STATEMENT OF ASSETS AND LIABILITIES |
| August 31, 2022 |
| Assets | | | | |
| Investments in securities at fair value (cost $165,447) | | $ | 159,575 | |
| Dividends receivable | | | 347 | |
| Receivable from Adviser | | | 20,271 | |
| Prepaid expenses | | | 2,949 | |
| Total Assets | | | 183,142 | |
| Liabilities | | | | |
| Payable to Affiliates | | | 7,371 | |
| Accrued audit and tax fees | | | 19,450 | |
| Other accrued expenses | | | 5,632 | |
| Total Liabilities | | | 32,453 | |
| Net Assets | | $ | 150,689 | |
| Net Assets consist of: | | | | |
| Paid-in capital | | | 157,359 | |
| Accumulated deficit | | | (6,670 | ) |
| Net Assets | | $ | 150,689 | |
| Shares outstanding (unlimited number of shares authorized, no par value) | | | 15,575 | |
| Net asset value, offering and redemption price per share | | $ | 9.67 | |
| | | | | |
See accompanying notes which are an integral part of these financial statements.
| FISHER INVESTMENTS INSTITUTIONAL GROUP ALL FOREIGN |
| EQUITY ENVIRONMENTAL AND SOCIAL VALUES FUND |
| STATEMENT OF OPERATIONS |
| For the year ended August 31, 2022 |
| Investment Income | | | | |
| Dividend income (net of foreign taxes withheld of $631) | | $ | 4,071 | |
| Total investment income | | | 4,071 | |
| Expenses | | | | |
| Administration | | | 45,050 | |
| Audit and tax | | | 19,410 | |
| Legal | | | 19,070 | |
| Trustee | | | 14,624 | |
| Transfer agent | | | 12,000 | |
| Compliance services | | | 11,999 | |
| Custodian | | | 11,541 | |
| Report printing | | | 3,863 | |
| Pricing | | | 3,642 | |
| Registration | | | 1,582 | |
| Adviser | | | 1,107 | |
| Miscellaneous | | | 26,518 | |
| Total expenses | | | 170,406 | |
| Fees waived and expenses reimbursed by Adviser | | | (169,173 | ) |
| Net operating expenses | | | 1,233 | |
| Net investment income | | | 2,838 | |
| Net Realized and Change in Unrealized Gain (Loss) on Investments | | | | |
| Net realized loss on investment securities transactions | | | (1,360 | ) |
| Net realized gain on foreign currency translations | | | 15 | |
| Net change in unrealized depreciation of investment securities | | | (59,171 | ) |
| Net change in unrealized depreciation of foreign currency | | | (6 | ) |
| Net realized and change in unrealized loss on investments | | | (60,522 | ) |
| Net decrease in net assets resulting from operations | | $ | (57,684 | ) |
| | | | | |
See accompanying notes which are an integral part of these financial statements.
| FISHER INVESTMENTS INSTITUTIONAL GROUP ALL FOREIGN |
| EQUITY ENVIRONMENTAL AND SOCIAL VALUES FUND |
| STATEMENTS OF CHANGES IN NET ASSETS |
| | | For the | | | For the | |
| | | Year | | | Year | |
| | | Ended | | | Ended | |
| | | August 31, | | | August 31, | |
| | | 2022 | | | 2021 | |
| Increase (Decrease) in Net Assets due to: | | | | | | | | |
| Operations | | | | | | | | |
| Net investment income | | $ | 2,838 | | | $ | 2,125 | |
| Net realized gain (loss) on investment securities transactions | | | (1,345 | ) | | | 2,749 | |
| Net change in unrealized appreciation (depreciation) of investment securities | | | (59,177 | ) | | | 48,086 | |
| Net increase (decrease) in net assets resulting from operations | | | (57,684 | ) | | | 52,960 | |
| Distributions From: | | | | | | | | |
| Earnings | | | (6,731 | ) | | | (630 | ) |
| Total distributions | | | (6,731 | ) | | | (630 | ) |
| Capital Transactions | | | | | | | | |
| Reinvestment of distributions | | | 6,730 | | | | 630 | |
| Amount paid for shares redeemed | | | (11 | ) | | | — | |
| Net increase in net assets resulting from capital transactions | | | 6,719 | | | | 630 | |
| Total Increase (Decrease) in Net Assets | | | (57,696 | ) | | | 52,960 | |
| Net Assets | | | | | | | | |
| Beginning of year | | | 208,385 | | | | 155,425 | |
| End of year | | $ | 150,689 | | | $ | 208,385 | |
| Share Transactions | | | | | | | | |
| Shares issued in reinvestment of distributions | | | 521 | | | | 54 | |
| Shares redeemed | | | (1 | ) | | | — | |
| Net increase in shares | | | 520 | | | | 54 | |
| | | | | | | | | |
See accompanying notes which are an integral part of these financial statements.
| FISHER INVESTMENTS INSTITUTIONAL GROUP ALL FOREIGN |
| EQUITY ENVIRONMENTAL AND SOCIAL VALUES FUND |
| FINANCIAL HIGHLIGHTS |
| |
| (For a share outstanding during each period) |
| | | For the | | | For the | | | For the | |
| | | Year | | | Year | | | Period | |
| | | Ended | | | Ended | | | Ended | |
| | | August 31, | | | August 31, | | | August 31, | |
| | | 2022 | | | 2021 | | | 2020(a) | |
| Selected Per Share Data: | | | | | | | | | | | | |
| Net asset value, beginning of period | | $ | 13.84 | | | $ | 10.36 | | | $ | 10.00 | |
| Investment operations: | | | | | | | | | | | | |
| Net investment income | | | 0.19 | | | | 0.14 | | | | 0.01 | |
| Net realized and unrealized gain (loss) | | | (3.91 | ) | | | 3.38 | | | | 0.35 | |
| Total from investment operations | | | (3.72 | ) | | | 3.52 | | | | 0.36 | |
| Less distributions from: | | | | | | | | | | | | |
| Net investment income | | | (0.16 | ) | | | (0.04 | ) | | | — | |
| Net realized gains | | | (0.29 | ) | | | — | | | | — | |
| Total distributions | | | (0.45 | ) | | | (0.04 | ) | | | — | |
| Net asset value, end of period | | $ | 9.67 | | | $ | 13.84 | | | $ | 10.36 | |
| Total Return(b) | | | (27.71 | )% | | | 34.07 | % | | | 3.60 | % (c) |
| Ratios and Supplemental Data: | | | | | | | | | | | | |
| Net assets, end of period (000 omitted) | | $ | 151 | | | $ | 208 | | | $ | 155 | |
| Ratio of net expenses to average net assets | | | 0.68 | % | | | 0.68 | % | | | 0.68 | % (d) |
| Ratio of gross expenses to average net assets before waiver and reimbursement | | | 93.97 | % | | | 80.18 | % | | | 201.44 | % (d) |
| Ratio of net investment income to average net assets | | | 1.56 | % | | | 1.15 | % | | | 0.98 | % (d) |
| Portfolio turnover rate | | | 22 | % | | | 17 | % | | | 4 | % (c) |
| | | | | | | | | | | | | |
| (a) | For the period July 17, 2020 (commencement of operations) to August 31, 2020. |
| (b) | Total return represents the rate that the investor would have earned or lost on an investment in the Fund, assuming reinvestment of distributions. |
See accompanying notes which are an integral part of these financial statements.
| FISHER INVESTMENTS INSTITUTIONAL GROUP ALL FOREIGN |
| EQUITY ENVIRONMENTAL AND SOCIAL VALUES FUND |
| NOTES TO THE FINANCIAL STATEMENTS |
| August 31, 2022 |
NOTE 1. ORGANIZATION
Fisher Investments Institutional Group All Foreign Equity Environmental and Social Values Fund (the “Fund”) is registered under the Investment Company Act of 1940, as amended (“1940 Act”), as a diversified series of Unified Series Trust (the “Trust”) on November 12, 2018. The Trust is an open-end investment company established under the laws of Ohio by an Agreement and Declaration of Trust dated October 14, 2002 (the “Trust Agreement”). The Trust Agreement permits the Board of Trustees of the Trust (the “Board”) to issue an unlimited number of shares of beneficial interest of separate series without par value. The Fund is one of a series of funds currently authorized by the Board. The Fund commenced operations on July 17, 2020. The investment adviser to the Fund is Fisher Asset Management, LLC, d/b/a Fisher Investments (the “Adviser”). The Fund seeks to outperform, net of fees and expenses, the return of the MSCI ACWI ex U.S. Index as its investment objective.
NOTE 2. SIGNIFICANT ACCOUNTING POLICIES
The Fund is an investment company and follows accounting and reporting guidance under Financial Accounting Standards Board Accounting Standards Codification (“ASC”) Topic 946, “Financial Services-Investment Companies”, including Accounting Standards Update 2013-08. The following is a summary of significant accounting policies followed by the Fund in the preparation of its financial statements. These policies are in conformity with generally accepted accounting principles in the United States of America (“GAAP”).
Estimates – The preparation of financial statements in conformity with GAAP requires management to make estimates and assumptions that affect the reported amounts of assets and liabilities and disclosure of contingent assets and liabilities at the date of the financial statements and the reported amounts of increases and decreases in net assets from operations during the reporting period. Actual results could differ from those estimates.
Foreign Currency Translation – The accounting records of the Fund are maintained in U.S. dollars. Foreign currency amounts are translated into U.S. dollars at the current rate of exchange each business day to determine the value of investments, and other assets and liabilities. Purchases and sales of foreign securities, and income and expenses, are translated at the prevailing rate of exchange on the respective date of these transactions. The Fund does not isolate that portion of the results of operations resulting from changes in foreign exchange rates on investments from fluctuations
| FISHER INVESTMENTS INSTITUTIONAL GROUP ALL FOREIGN |
| EQUITY ENVIRONMENTAL AND SOCIAL VALUES FUND |
| NOTES TO THE FINANCIAL STATEMENTS – (continued) |
| August 31, 2022 |
NOTE 2. SIGNIFICANT ACCOUNTING POLICIES – continued
arising from changes in market prices of securities held. These fluctuations are included with the realized and unrealized gain or loss from investments. Net realized gain (loss) on foreign currency translations on the Statement of Operations represents currency gains (losses) realized between the trade and settlement dates on securities transactions, and the difference between the amount of investment income and foreign withholding taxes recorded on the Fund’s books and the U.S. dollar equivalent amounts actually received or paid. The change in unrealized currency gains (losses) on foreign currency translations for the period is reflected in the Statement of Operations.
Federal Income Taxes – The Fund makes no provision for federal income or excise tax. The Fund has qualified and intends to qualify each year as a regulated investment company (“RIC”) under subchapter M of the Internal Revenue Code of 1986, as amended, by complying with the requirements applicable to RICs and by distributing substantially all of its taxable income. The Fund also intends to distribute sufficient net investment income and net realized capital gains, if any, so that it will not be subject to excise tax on undistributed income and gains. If the required amount of net investment income or gains is not distributed, the Fund could incur a tax expense.
As of and during the fiscal year ended August 31, 2022, the Fund did not have any liabilities for any unrecognized tax benefits. The Fund recognizes interest and penalties, if any, related to unrecognized tax benefits as income tax expense on the Statement of Operations when incurred. During the fiscal year ended August 31, 2022, the Fund did not incur any interest or penalties. Management of the Fund has reviewed tax positions taken in tax years that remain subject to examination by all major tax jurisdictions, including federal (i.e., the last three tax year ends and the interim tax period since then, as applicable). Management believes that there is no tax liability resulting from unrecognized tax benefits related to uncertain tax positions taken.
Expenses – Expenses incurred by the Trust that do not relate to a specific fund of the Trust are allocated to the individual funds based on each fund’s relative net assets or another appropriate basis (as determined by the Board).
Security Transactions and Related Income – The Fund follows industry practice and records security transactions on the trade date for financial reporting purposes. The specific identification method is used for determining gains or losses for financial statements and income tax purposes. Dividend income is recorded on the ex-dividend
| FISHER INVESTMENTS INSTITUTIONAL GROUP ALL FOREIGN |
| EQUITY ENVIRONMENTAL AND SOCIAL VALUES FUND |
| NOTES TO THE FINANCIAL STATEMENTS – (continued) |
| August 31, 2022 |
NOTE 2. SIGNIFICANT ACCOUNTING POLICIES – continued
date and interest income is recorded on an accrual basis. Withholding taxes on foreign dividends and related reclaims have been provided for in accordance with the Fund’s understanding of the applicable country’s tax rules and rates.
Dividends and Distributions – The Fund intends to distribute its net investment income and net realized long-term and short-term capital gains, if any, at least annually. Dividends and distributions to shareholders, which are determined in accordance with income tax regulations, are recorded on the ex-dividend date. The treatment for financial reporting purposes of distributions made to shareholders during the period from net investment income or net realized capital gains may differ from their ultimate treatment for federal income tax purposes. These differences are caused primarily by differences in the timing of the recognition of certain components of income, expense or realized capital gain for federal income tax purposes. Where such differences are permanent in nature, they are reclassified among the components of net assets based on their ultimate characterization for federal income tax purposes. Any such reclassifications will have no effect on net assets, results of operations or net asset value (“NAV”) per share of the Fund.
NOTE 3. SECURITIES VALUATION AND FAIR VALUE MEASUREMENTS
The Fund values its portfolio securities at fair value as of the close of regular trading on the New York Stock Exchange (“NYSE”) (normally 4:00 p.m. Eastern time) on each business day the NYSE is open for business. Fair value is defined as the price that the Fund would receive upon selling an investment in a timely transaction to an independent buyer in the principal or most advantageous market of the investment. GAAP establishes a three-tier hierarchy to maximize the use of observable market data and minimize the use of unobservable inputs and to establish classification of fair value measurements for disclosure purposes.
Inputs refer broadly to the assumptions that market participants would use in pricing the asset or liability, including assumptions about risk (the risk inherent in a particular valuation technique used to measure fair value including a pricing model and/or the risk inherent in the inputs to the valuation technique). Inputs may be observable or unobservable. Observable inputs are inputs that reflect the assumptions market participants would use in pricing the asset or liability developed based on market data obtained and available from sources independent of the reporting entity. Unobservable
| FISHER INVESTMENTS INSTITUTIONAL GROUP ALL FOREIGN |
| EQUITY ENVIRONMENTAL AND SOCIAL VALUES FUND |
| NOTES TO THE FINANCIAL STATEMENTS – (continued) |
| August 31, 2022 |
NOTE 3. SECURITIES VALUATION AND FAIR VALUE MEASUREMENTS – continued
inputs are inputs that reflect the reporting entity’s own assumptions about the assumptions market participants would use in pricing the asset or liability developed based on the best information available in the circumstances.
Various inputs are used in determining the value of the Fund’s investments. These inputs are summarized in the three broad levels listed below.
| ● | Level 1 – unadjusted quoted prices in active markets for identical investments and/or registered investment companies where the value per share is determined and published and is the basis for current transactions for identical assets or liabilities at the valuation date |
| ● | Level 2 – other significant observable inputs (including, but not limited to, quoted prices for an identical security in an inactive market, quoted prices for similar securities, interest rates, prepayment speeds, credit risk, etc.) |
| ● | Level 3 – significant unobservable inputs (including the Fund’s own assumptions in determining fair value of investments based on the best information available) |
The inputs used to measure fair value may fall into different levels of the fair value hierarchy. In such cases, for disclosure purposes, the level in the fair value hierarchy which is reported is determined based on the lowest level input that is significant to the fair value measurement in its entirety.
Equity securities that are traded on any stock exchange are generally valued at the last quoted sale price on the security’s primary exchange. Lacking a last sale price, an exchange-traded security is generally valued at its last bid price. Securities traded in the NASDAQ over-the-counter market are generally valued at the NASDAQ Official Closing Price. When using market quotations and when the market is considered active, the security is classified as a Level 1 security. In the event that market quotations are not readily available or are considered unreliable due to market or other events, the Fund values its securities and other assets at fair value in accordance with policies established by and under the general supervision of the Board. Under these policies, the securities will be classified as Level 2 or 3 within the fair value hierarchy, depending on the inputs used.
| FISHER INVESTMENTS INSTITUTIONAL GROUP ALL FOREIGN |
| EQUITY ENVIRONMENTAL AND SOCIAL VALUES FUND |
| NOTES TO THE FINANCIAL STATEMENTS – (continued) |
| August 31, 2022 |
NOTE 3. SECURITIES VALUATION AND FAIR VALUE MEASUREMENTS – continued
With respect to foreign equity securities that are principally traded on a market outside the United States, the Board has approved the utilization of an independent fair value pricing service to evaluate the effect of market fluctuations on these securities after the close of trading in that foreign market. To the extent that securities are valued using this service, they will be classified as Level 2 securities.
Investments in mutual funds, including money market mutual funds, are generally priced at the ending NAV provided by the service agent of the mutual funds. These securities are categorized as Level 1 securities.
In accordance with the Trust’s valuation policies, the Board or Adviser as Valuation Designee is required to consider all appropriate factors relevant to the value of securities for which it has determined other pricing sources are not available or reliable as described above. No single method exists for determining fair value, because fair value depends upon the circumstances of each individual case. As a general principle, the current fair value of a security being valued by the Valuation Designee would be the amount that the Fund might reasonably expect to receive upon the current sale. Methods that are in accordance with this principle may, for example, be based on (i) a multiple of earnings; (ii) a discount from market prices of a similar freely traded security (including a derivative security or a basket of securities traded on other markets, exchanges or among dealers); or (iii) yield to maturity with respect to debt issues, or a combination of these and other methods. Fair-value pricing is permitted if, in the Valuation Designee’s opinion, the validity of market quotations appears to be questionable based on factors such as evidence of a thin market in the security based on a small number of quotations, a significant event occurs after the close of a market but before the Fund’s NAV calculation that may affect a security’s value, or the Valuation Designee is aware of any other data that calls into question the reliability of market quotations.
| FISHER INVESTMENTS INSTITUTIONAL GROUP ALL FOREIGN |
| EQUITY ENVIRONMENTAL AND SOCIAL VALUES FUND |
| NOTES TO THE FINANCIAL STATEMENTS – (continued) |
| August 31, 2022 |
NOTE 3. SECURITIES VALUATION AND FAIR VALUE MEASUREMENTS – continued
The following is a summary of the inputs used to value the Fund’s investments as of August 31, 2022:
| | | Valuation Inputs | |
| | | Level 1 | | | Level 2 | | | Level 3 | | | Total | |
| Assets | | | | | | | | | | | | | | | | |
| Common Stocks(a) | | $ | 157,022 | | | $ | — | | | $ | — | | | $ | 157,022 | |
| Money Market Funds | | | 2,553 | | | | — | | | | — | | | | 2,553 | |
| Total | | $ | 159,575 | | | $ | — | | | $ | — | | | $ | 159,575 | |
| (a) | Refer to Schedule of Investments for sector classifications. |
The Fund did not hold any investments at the end of the reporting period for which significant unobservable inputs (Level 3) were used in determining fair value; therefore, no reconciliation of Level 3 securities is included for this reporting period. The Fund did not hold any derivative instruments during the reporting period.
NOTE 4. FEES AND OTHER TRANSACTIONS WITH AFFILIATES
The Adviser, under the terms of the management agreement (the “Agreement”) with the Trust with respect to the Fund, manages the Fund’s investments. As compensation for its management services, the Fund is obligated to pay the Adviser a fee computed and accrued daily and paid monthly at an annual rate of 0.61% of the Fund’s average daily net assets. For the fiscal year ended August 31, 2022, the Adviser earned fees of $1,107 from the Fund before the waiver and reimbursement described below.
The Adviser is contractually obligated to limit the Fund’s total annual operating expenses to 0.68% of the Fund’s average daily net assets through December 31, 2026 (excluding portfolio transaction and other investment-related costs (including brokerage fees and commissions); taxes; borrowing costs (such as interest and dividend expenses on securities sold short); acquired fund fees and expenses; fees and expenses associated with investments in other collective investment vehicles or derivative instruments (including for example option and swap fees and expenses); any amounts payable pursuant to a distribution or service plan adopted in accordance with Rule 12b-1 under the 1940 Act; any administrative and/or shareholder servicing fees payable to financial intermediaries; expenses incurred in connection with
| FISHER INVESTMENTS INSTITUTIONAL GROUP ALL FOREIGN |
| EQUITY ENVIRONMENTAL AND SOCIAL VALUES FUND |
| NOTES TO THE FINANCIAL STATEMENTS – (continued) |
| August 31, 2022 |
NOTE 4. FEES AND OTHER TRANSACTIONS WITH AFFILIATES – continued
any merger or reorganization; extraordinary expenses (such as litigation expenses, indemnification of Trust officers and Trustees and contractual indemnification of Fund service providers); and other expenses that the Trustees agree have not been incurred in the ordinary course of the Fund’s business. This expense cap may not be terminated prior to this date except by the Board of Trustees. For the fiscal year ended August 31, 2022, the Adviser waived fees and reimbursed expenses in the amount of $169,173 for the Fund. At August 31, 2022, the Adviser owed the Fund $20,271.
Each waiver/expense payment by the Adviser is subject to recoupment by the Adviser from the Fund in the three years following the date the particular expense payment occurred, but only if such recoupment can be achieved without exceeding the annual expense limitation in effect at the time of the expense payment and any expense limitation in effect at the time of the recoupment. As of August 31, 2022, the Adviser may seek repayment of expense reimbursements in the amounts as follows:
| Recoverable through |
| August 31, 2023 | | $ | 35,943 | |
| August 31, 2024 | | | 147,330 | |
| August 31, 2025 | | | 169,173 | |
Ultimus Fund Solutions, LLC (“Ultimus”) provides administration, fund accounting and transfer agent services to the Fund. The Fund pays Ultimus fees in accordance with the agreements for such services.
Northern Lights Compliance Services, LLC (“NLCS”), an affiliate of Ultimus, provides a Chief Compliance Officer to the Trust, as well as related compliance services, pursuant to a consulting agreement between NLCS and the Trust. Under the terms of such agreement, NLCS receives fees from the Fund, which are approved annually by the Board.
Under the terms of a Distribution Agreement with the Trust, Ultimus Fund Distributors, LLC (the “Distributor”) serves as principal underwriter to the Fund. The Distributor is a wholly-owned subsidiary of Ultimus. The Distributor is compensated by the Adviser (not the Fund) for acting as principal underwriter.
| FISHER INVESTMENTS INSTITUTIONAL GROUP ALL FOREIGN |
| EQUITY ENVIRONMENTAL AND SOCIAL VALUES FUND |
| NOTES TO THE FINANCIAL STATEMENTS – (continued) |
| August 31, 2022 |
NOTE 4. FEES AND OTHER TRANSACTIONS WITH AFFILIATES – continued
Certain officers and a Trustee of the Trust are also employees of Ultimus and such persons are not paid by the Fund for serving in such capacities.
The Board supervises the business activities of the Trust. Each Trustee serves as a trustee until termination of the Trust unless the Trustee dies, resigns, retires, or is removed. The Chairman of the Board and more than 75% of the Trustees are “Independent Trustees,” which means that they are not “interested persons” as defined in the 1940 Act. Each Independent Trustee of the Trust receives annual compensation of $2,785 per fund from the Trust, except that the Chairman of the Audit Committee, the Chairman of the Governance & Nominating Committee, and the Chairman of the Pricing & Liquidity Committee each receives annual compensation of $3,235 per fund from the Trust, and the Independent Chairman of the Board receives $3,435 per fund from the Trust. Independent Trustees also receive $1,000 for attending any special meeting that requires an in person approval of a contract and $250 for the first hour and $200 for each additional hour for attending other special meetings. In addition, the Trust reimburses Independent Trustees for out-of-pocket expenses incurred in conjunction with attendance at meetings.
NOTE 5. INVESTMENT TRANSACTIONS
For the fiscal year ended August 31, 2022, purchases and sales of investment securities, other than short-term investments, were $40,559 and $43,724, respectively.
There were no purchases or sales of long-term U.S. government obligations during the fiscal year ended August 31, 2022.
NOTE 6. BENEFICIAL OWNERSHIP
The beneficial ownership, either directly or indirectly, of more than 25% of the voting securities of a fund creates a presumption of control of a fund, under Section 2(a) (9) of the 1940 Act. As of August 31, 2022, the Adviser owned 100% of the Fund’s outstanding shares. As a result, the Adviser may be deemed to control the Fund.
| FISHER INVESTMENTS INSTITUTIONAL GROUP ALL FOREIGN |
| EQUITY ENVIRONMENTAL AND SOCIAL VALUES FUND |
| NOTES TO THE FINANCIAL STATEMENTS – (continued) |
| August 31, 2022 |
NOTE 7. FEDERAL TAX INFORMATION
At August 31, 2022, the net unrealized appreciation (depreciation) and tax cost of investments for tax purposes was as follows:
| Gross unrealized appreciation | | $ | 15,311 | |
| Gross unrealized depreciation | | | (21,620 | ) |
| Net unrealized depreciation on investments | | $ | (6,309 | ) |
| Tax cost of investments | | $ | 165,877 | |
The tax character of distributions paid for the fiscal years ended August 31, 2022 and August 31, 2021 were as follows:
| | | 2022 | | | 2021 | |
| Distributions paid from: | | | | | | | | |
| Ordinary income(a) | | $ | 4,604 | | | $ | 630 | |
| Long term capital gains | | | 2,127 | | | | — | |
| Total distributions paid | | $ | 6,731 | | | $ | 630 | |
| (a) | Short-term capital gain distributions are treated as ordinary income for tax purposes. |
At August 31, 2022, the components of accumulated earnings (deficit) on a tax basis were as follows:
| Undistributed ordinary income | | $ | 2,204 | |
| Accumulated capital and other losses | | | (2,565 | ) |
| Unrealized depreciation on investments | | | (6,309 | ) |
| Total accumulated earnings | | $ | (6,670 | ) |
Post-October capital losses incurred after October 31 and within the taxable year are deemed to arise on the first business day of the Fund’s next taxable year. As of August 31, 2022, the Fund had Post-October capital losses of $2,565.
| FISHER INVESTMENTS INSTITUTIONAL GROUP ALL FOREIGN |
| EQUITY ENVIRONMENTAL AND SOCIAL VALUES FUND |
| NOTES TO THE FINANCIAL STATEMENTS – (continued) |
| August 31, 2022 |
NOTE 8. SECTOR RISK
If the Fund has significant investments in the securities of issuers within a particular sector, any development affecting that sector will have a greater impact on the value of the net assets of the Fund than would be the case if the Fund did not have significant investments in that sector. In addition, this may increase the risk of loss in the Fund and increase the volatility of the Fund’s NAV per share. For instance, economic or market factors, regulatory changes or other developments may negatively impact all companies in a particular sector, and therefore the value of the Fund’s portfolio will be adversely affected. As of August 31, 2022, the Fund had 32.75% of the value of its net assets invested in stocks within the Technology sector.
NOTE 9. COMMITMENTS AND CONTINGENCIES
The Trust indemnifies its officers and Trustees for certain liabilities that may arise from their performance of their duties to the Trust or the Fund. Additionally, in the normal course of business, the Trust enters into contracts that contain a variety of representations and warranties which provide general indemnifications. The Trust’s maximum exposure under these arrangements is unknown, as this would involve future claims that may be made against the Trust that have not yet occurred.
NOTE 10. SUBSEQUENT EVENTS
Management of the Fund has evaluated the need for disclosures and/or adjustments resulting from subsequent events through the date at which these financial statements were issued. Based upon this evaluation, management has determined there were no items requiring adjustment of the financial statements or additional disclosure.
| REPORT OF INDEPENDENT REGISTERED PUBLIC |
| ACCOUNTING FIRM |
To the Shareholders of Fisher Investment Institutional Group Fund Family and Board of Trustees of Unified Series Trust
Opinion on the Financial Statements
We have audited the accompanying statement of assets and liabilities, including the schedule of investments, of Fisher Investments Institutional Group All Foreign Equity Environmental and Social Values Fund (the “Fund”), a series of Unified Series Trust, as of August 31, 2022, the related statement of operations for the year then ended, the statements of changes in net assets for each of the two years in the period then ended, the related notes, and the financial highlights for each of the three periods in the period then ended (collectively referred to as the “financial statements”). In our opinion, the financial statements present fairly, in all material respects, the financial position of the Fund as of August 31, 2022, the results of its operations for the year then ended, the changes in net assets for each of the two years in the period then ended, and the financial highlights for each of the three periods in the period then ended, in conformity with accounting principles generally accepted in the United States of America.
Basis for Opinion
These financial statements are the responsibility of the Fund’s management. Our responsibility is to express an opinion on the Fund’s financial statements based on our audits. We are a public accounting firm registered with the Public Company Accounting Oversight Board (United States) (“PCAOB”) and are required to be independent with respect to the Fund in accordance with the U.S. federal securities laws and the applicable rules and regulations of the Securities and Exchange Commission and the PCAOB.
We conducted our audits in accordance with the standards of the PCAOB. Those standards require that we plan and perform the audit to obtain reasonable assurance about whether the financial statements are free of material misstatement whether due to error or fraud.
Our audits included performing procedures to assess the risks of material misstatement of the financial statements, whether due to error or fraud, and performing procedures that respond to those risks. Such procedures included examining, on a test basis, evidence regarding the amounts and disclosures in the financial statements. Our procedures included confirmation of securities owned as of August 31, 2022, by correspondence with the custodian. Our audits also included evaluating the accounting principles used and significant estimates made by management, as well as evaluating the overall presentation of the financial statements. We believe that our audits provide a reasonable basis for our opinion.
We have served as the auditor of one or more investment companies advised by Fisher Asset Management, LLC since 2017.
COHEN & COMPANY, LTD.
Chicago, Illinois
October 28, 2022
| LIQUIDITY RISK MANAGEMENT PROGRAM (Unaudited) |
The Fund has adopted and implemented a written liquidity risk management program (the “Program”) as required by Rule 22e-4 (the “Liquidity Rule”) under the 1940 Act. The Program is reasonably designed to assess and manage the Fund’s liquidity risk, taking into consideration, among other factors, the Fund’s investment strategy and the liquidity of its portfolio investments during normal and reasonably foreseeable stressed conditions; its short and long-term cash flow projections; and its cash holdings and access to other funding sources. The Board approved the appointment of the Liquidity Administrator Committee, comprising certain Trust officers and employees of the Adviser. The Liquidity Administrator Committee maintains Program oversight and reports to the Board on at least an annual basis regarding the Program’s operational effectiveness through a written report (the “Report”). The Program’s most recent report, which was presented to the Board for consideration at its meeting held on August 15-16, 2022, outlined the operation of the Program and the adequacy and effectiveness of the Program’s implementation. During the review period, the Fund did not experience unusual stress or disruption to their operations related to purchase and redemption activity. Also, during the review period the Fund held adequate levels of cash and highly liquid investments to meet shareholder redemption activities in accordance with applicable requirements. The Report concluded that the Program is reasonably designed to prevent violation of the Liquidity Rule and has been effectively implemented.
| SUMMARY OF FUND EXPENSES (Unaudited) |
As a shareholder of the Fund, you incur two types of costs: (1) transaction and (2) ongoing costs, including management fees, distribution (12b-1) fees and other Fund expenses. These examples are intended to help you understand your ongoing costs (in dollars) of investing in the Fund and to compare these costs with the ongoing costs of investing in other funds. You may pay brokerage commissions on purchases and sales of exchange-traded fund shares, which are not reflected in the example. The example is based on an investment of $1,000 invested at the beginning of the period and held for the entire period from March 1, 2022 through August 31, 2022.
Actual Expenses
The first line of the table below provides information about actual account values and actual expenses. You may use the information in this line, together with the amount you invested, to estimate the expenses that you paid over the period. Simply divide your account value by $1,000 (for example, an $8,600 account value divided by $1,000 = 8.6), then multiply the result by the number in the first line under the heading “Expenses Paid During Period” to estimate the expenses you paid on your account during this period.
Hypothetical Example for Comparison Purposes
The second line of the table below provides information about hypothetical account values and hypothetical expenses based on the Fund’s actual expense ratio and an assumed rate of return of 5% per year before expenses, which is not the Fund’s actual return. The hypothetical account values and expenses may not be used to estimate the actual ending account balance or expenses you paid for the period. You may use this information to compare the ongoing costs of investing in the Fund and other funds. To do so, compare this 5% hypothetical example with the 5% hypothetical examples that appear in the shareholder reports of other funds.
| | | Beginning | | Ending | | Expenses | | |
| | | Account Value | | Account Value | | Paid | | Annualized |
| | | March 1, | | August 31, | | During | | Expense |
| | | 2022 | | 2022 | | Period(a) | | Ratio |
| Actual | | $1,000.00 | | $ 828.60 | | $3.13 | | 0.68% |
| Hypothetical(b) | | $1,000.00 | | $1,021.78 | | $3.47 | | 0.68% |
| (a) | Expenses are equal to the Fund’s annualized expense ratios, multiplied by the average account value over the period, multiplied by 184/365 (to reflect the one-half year period). |
| (b) | Hypothetical assumes 5% annual return before expenses. |
| ADDITIONAL FEDERAL INCOME TAX INFORMATION (Unaudited) |
The Form 1099-DIV you receive in January 2023 will show the tax status of all distributions paid to your account in calendar year 2022. Shareholders are advised to consult their own tax adviser with respect to the tax consequences of their investment in the Fund. As required by the Internal Revenue Code and/or regulations, shareholders must be notified regarding the status of qualified dividend income for individuals and the dividends received deduction for corporations.
Qualified Dividend Income. The Fund designates approximately 66.82% or up to the maximum amount of such dividends allowable pursuant to the Internal Revenue Code, as qualified dividend income eligible for a reduced tax rate.
Qualified Business Income. The Fund designates approximately 0% of its ordinary income dividends, or up to the maximum amount of such dividends allowable pursuant to the Internal Revenue Code, as qualified business income.
Dividends Received Deduction. Corporate shareholders are generally entitled to take the dividends received deduction on the portion of the Fund’s dividend distribution that qualifies under tax law. For the Fund’s calendar year 2022 ordinary income dividends, 0% qualifies for the corporate dividends received deduction.
For the year ended August 31, 2022, the Fund designated $2,127 as long-term capital gain distributions.
SHAREHOLDER VOTING RESULTS (Unaudited)
At a Special Shareholder Meeting at which a quorum was present, held on September 6, 2022, Fund shareholders of record as of the close of business on July 5, 2022 voted to approve the following proposal:
Proposal 1: To elect the following individuals to serve on the Board of Trustees of the Trust:
Freddie Jacobs Jr.
Catharine Barrow McGauley
Kenneth G.Y. Grant
Daniel J. Condon
Gary A. Hippenstiel
Stephen A. Little
Ronald C. Tritschler
David R. Carson
| | | Shares | | Shares Voted | | Shares |
| | | Voted in | | Against or | | Needed to |
| Fund | | Favor* | | Abstain* | | Approve* |
| Fisher Investments Institutional Group All Foreign Equity Environmental and Social Values Fund | | 15,576 (100%) | | 0 (0.00%) | | Plurality (greater
than 50%) |
| * | as a percentage of the total voting securities of the Fund voted at the meeting at which a quorum was present |
| TRUSTEES AND OFFICERS (Unaudited) |
GENERAL QUALIFICATIONS. The Board supervises the business activities of the Trust. Each Trustee serves as a trustee until termination of the Trust unless the Trustee dies, resigns, retires, or is removed. The Chairman of the Board and more than 75% of the Trustees are “Independent Trustees,” which means that they are not “interested persons” (as defined in the 1940 Act) of the Trust or any adviser, sub-adviser or distributor of the Trust.
The following table provides information regarding the Independent Trustees.
Name, Address*,
(Year of Birth),
Position with Trust**,
Term of Position
with Trust | Principal Occupation During Past 5 Years
and Other Directorships |
Daniel J. Condon (1950)
Chairman, May 2022 to present; Chairman of the Audit Committee; Chairman of the Governance & Nominating Committee, May 2020 to May 2022; Independent Trustee, December 2002 to present | Current: Retired (2017 - present); Trustee, Peak Income Plus Fund (2022 – present). |
Kenneth G.Y. Grant (1949)
Chairman of the Governance & Nominating Committee, May 2022 to present; Chairman, January 2017 to May 2022; Independent Trustee, May 2008 to present | Current: Director, Standpoint Multi-Asset (Cayman) Fund, Ltd. (2019 – present); Director, Advisors Charitable Gift Fund (2020 - present), a Donor Advised Fund; Trustee, Peak Income Plus Fund (2022 – present). Previous: EVP, Benefit Plans Administrative Services, Inc., provider of retirement benefit plans administration (2019 – 2020); Director, Northeast Retirement Services (NRS) LLC, a transfer agent and fund administrator; and Director, Global Trust Company (GTC), a non-depository trust company sponsoring private investment product (2003 – 2019); EVP, NRS (2003 – 2019); GTC, EVP (2008 – 2019); EVP, Savings Banks Retirement Association (2003 – 2019), provider of qualified retirement benefit plans. |
| TRUSTEES AND OFFICERS (Unaudited) – (continued) |
Name, Address*,
(Year of Birth),
Position with Trust**,
Term of Position
with Trust | Principal Occupation During Past 5 Years
and Other Directorships |
Gary E. Hippenstiel (1947)
Chairman of the Pricing & Liquidity Committee; Independent Trustee, December 2002 to present | Current: President and founder of Hippenstiel Investment Counsel LLC (“Hippenstiel”) since 2008. Hippenstiel was registered as an investment adviser from 2008 to December 31, 2019; Trustee, Peak Income Plus Fund (2022 – present). |
Stephen A. Little (1946)
Independent Trustee, December 2002 to present; Chairman, December 2004 to December 2016 | Current: President and founder of The Rose, Inc., a registered investment adviser, since 1993; Trustee, Peak Income Plus Fund (2022 – present). |
Ronald C. Tritschler (1952)
Chairman of the Audit Committee, May 2022 to present; Independent Trustee, January 2007 to present; Interested Trustee, December 2002 to December 2006 | Current: Chief Executive Officer, Director and Legal Counsel of The Webb Companies, a national real estate company, since 2001; Director, Standpoint Multi-Asset (Cayman) Fund, Ltd. (2020 – present); Director of First State Bank of the Southeast (2000 - present); Trustee, Peak Income Plus Fund (2022 – present). |
Catharine B. McGauley (1977)
Independent Trustee, September 2022 to present | Current: Lead Portfolio Manager of Atlantic Charter Insurance, a workers’ compensation insurer, since 2010; Investment Councilor of a Family Office (2015 – present); Senior Analyst/ Advisor for a Boston real estate company and related family (2010 – present); Trustee, Peak Income Plus Fund (2002 – present). |
| TRUSTEES AND OFFICERS (Unaudited) – (continued) |
Name, Address*,
(Year of Birth),
Position with Trust**,
Term of Position
with Trust | Principal Occupation During Past 5 Years
and Other Directorships |
Freddie Jacobs, Jr. (1970)
Independent Trustee, September 2022 to present | Current: Chief Operating Officer and Chief Risk Officer Northeast Retirement Services (NRS) LLC, a transfer agent and fund administrator; and Director, Global Trust Company (GTC), a non-depository trust company sponsoring private investment product (2021- present); Trustee of Buckingham Browne & Nichols (BBN) (2018 – present); Chair of the Finance Committee, BBN (2020 – present); Chairman Board of Directors of Crispus Attucks Fund (2020– present); Board Member and Treasurer of New England Tennis Association (2017 –present); Board Member of Camp Harbor View (2020 – present); Trustee, Peak Income Plus Fund (2002 – present). Previous: SVP, Senior Risk Officer NRS (2013 – 2019). |
| * | The business address for each Trustee is 225 Pictoria Drive, Suite 450, Cincinnati, Ohio 45246. |
| ** | As of the date of this Report, the Trust consists of 31 series. |
The following table provides information regarding the interested Trustee and certain officers of the Trust.
Name, Address*,
(Year of Birth),
Position with Trust,
Term of Position
with Trust | Principal Occupation During Past 5 Years
and Other Directorships |
David R. Carson(1958)
President, January 2016 to August 2021; Interested Trustee, August 2020 to present | Current: Senior Vice President Client Strategies of Ultimus Fund Solutions, LLC, since 2013; Interested Trustee of Ultimus Managers Trust, since 2020; Trustee, Peak Income Plus Fund (2022 – present). |
| TRUSTEES AND OFFICERS (Unaudited) – (continued) |
Name, Address*,
(Year of Birth),
Position with Trust,
Term of Position
with Trust | Principal Occupation During Past 5 Years
and Other Directorships |
Martin R. Dean (1963)
President, August 2021 to present; Vice President, November 2020 to August 2021; Chief Compliance Officer, April 2021 to August 2021; Assistant Chief Compliance Officer, January 2016 to April 2021 | Current: Senior Vice President, Head of Fund Compliance of Ultimus Fund Solutions, LLC, since 2016. |
Zachary P. Richmond (1980)
Treasurer and Chief Financial Officer, November 2014 to present | Current: Vice President, Director of Financial Administration for Ultimus Fund Solutions, LLC, since 2015. |
Gweneth K. Gosselink (1955)
Chief Compliance Officer, August 2021 to present | Current: Assistant Vice President, Senior Compliance Officer of Ultimus Fund Solutions, LLC, since 2019. Previous: Chief Operating Officer & CCO at Miles Capital, Inc. (2013 – 2019). |
Elisabeth A. Dahl(1962)
Secretary, May 2017 to present; Assistant Secretary, March 2016 to May 2017 | Current: Attorney, Ultimus Fund Solutions, LLC, since March 2016. |
Stephen L. Preston (1966)
AML Compliance Officer, May 2017 to present | Current: Vice President and Chief Compliance Officer, Ultimus Fund Solutions, LLC and Ultimus Fund Distributors, LLC, since 2011. |
Lynn E. Wood (1946)
Assistant Chief Compliance Officer, April 2021 to present; Chief Compliance Officer, October 2004 to April 2021 | Current: Managing Member, Buttonwood Compliance Partners, LLC, since 2013. |
| * | The business address for each officer is 225 Pictoria Drive, Suite 450, Cincinnati, Ohio 45246. |
OTHER INFORMATION (Unaudited)
The Fund’s Statement of Additional Information (“SAI”) includes additional information about the Trustees and is available without charge, upon request. You may call toll-free at (800) 851-8845 to request a copy of the SAI or to make shareholder inquiries.
PRIVACY NOTICE
Rev: January 2020
| FACTS | WHAT DOES FISHER INVESTMENTS INSTITUTIONAL GROUP ALL FOREIGN EQUITY ENVIRONMENTAL AND SOCIAL VALUES FUND (THE “FUND”) DO WITH YOUR PERSONAL INFORMATION? |
| Why? | Financial companies choose how they share your personal information. Federal law gives consumers the right to limit some but not all sharing. Federal law also requires us to tell you how we collect, share, and protect your personal information. Please read this notice carefully to understand what we do. |
| What? | The types of personal information we collect and share depend on the product or service you have with us. This information can include: ● Social Security number ● account balances and account transactions ● transaction or loss history and purchase history When you are no longer our customer, we continue to share your information as described in this notice. |
| How? | All financial companies need to share customers’ personal information to run their everyday business. In the section below, we list the reasons financial companies can share their customers’ personal information; the reasons the Fund chooses to share; and whether you can limit this sharing. |
| Reasons we can share your personal information | Does the
Fund share? | Can you limit
this sharing? |
For our everyday business purposes— such as to process your transactions, maintain your account(s), respond to court orders and legal investigations, or report to credit bureaus | Yes | No |
For our marketing purposes— to offer our products and services to you | No | We don’t share |
| For joint marketing with other financial companies | No | We don’t share |
For our affiliates’ everyday business purposes— information about your transactions and experiences | No | We don’t share |
For our affiliates’ everyday business purposes— information about your creditworthiness | No | We don’t share |
| For nonaffiliates to market to you | No | We don’t share |
| Questions? | Call (800) 851-8845 |
| Who we are |
| Who is providing this notice? | Fisher Investments Institutional Group All Foreign Equity Environmental and Social Values Fund Ultimus Fund Distributors, LLC (Distributor) Ultimus Fund Solutions, LLC (Administrator) |
| What we do |
| How does the Fund protect my personal information? | To protect your personal information from unauthorized access and use, we use security measures that comply with federal law. These measures include computer safeguards and secured files and buildings. Our service providers are held accountable for adhering to strict policies and procedures to prevent any misuse of your nonpublic personal information. |
| How does the Fund collect my personal information? | We collect your personal information, for example, when you ● open an account or deposit money ● make deposits or withdrawals from your account or provide account information We also collect your personal information from other companies. |
| Why can’t I limit all sharing? | Federal law gives you the right to limit only ● sharing for affiliates’ everyday business purposes—information about your creditworthiness ● affiliates from using your information to market to you ● sharing for nonaffiliates to market to you State laws and individual companies may give you additional rights to limit sharing. |
| Definitions |
| Affiliates | Companies related by common ownership or control. They can be financial and nonfinancial companies. ● Fisher Asset Management, LLC, d/b/a Fisher Investments, the investment adviser to the Fund, could be deemed to be an affiliate. |
| Nonaffiliates | Companies not related by common ownership or control. They can be financial and nonfinancial companies. ● The Fund does not share your personal information with nonaffiliates so they can market to you |
| Joint marketing | A formal agreement between nonaffiliated financial companies that together market financial products or services to you. ● The Fund doesn’t jointly market. |
This page intentionally left blank.
PROXY VOTING
A description of the policies and procedures that the Fund uses to determine how to vote proxies relating to portfolio securities and information regarding how the Fund voted those proxies during the most recent twelve month period ended June 30, are available (1) without charge upon request by calling the Fund at (800) 851-8845 and (2) in Fund documents filed with the SEC on the SEC’s website at www.sec.gov.
TRUSTEES Daniel J. Condon, Chairman David R. Carson Kenneth G.Y. Grant Gary E. Hippenstiel Freddie Jacobs, Jr. Stephen A. Little Catharine B. McGauley Ronald C. Tritschler OFFICERS Martin R. Dean, President Gweneth K. Gosselink, Chief Compliance Officer Zachary P. Richmond, Treasurer and Chief Financial Officer Lynn E. Wood, Assistant Chief Compliance Officer INVESTMENT ADVISER Fisher Asset Management, LLC 5525 NW Fisher Creek Drive Camas, WA 98607 DISTRIBUTOR Ultimus Fund Distributors, LLC 225 Pictoria Drive, Suite 450 Cincinnati, OH 45246 | INDEPENDENT REGISTERED PUBLIC ACCOUNTING FIRM Cohen & Company, Ltd. 151 N Franklin Street, Suite 575 Chicago, IL 60606 LEGAL COUNSEL Thompson Hine LLP 312 Walnut Street, 20th Floor Cincinnati, OH 45202 CUSTODIAN U.S. Bank, N.A. 425 Walnut Street Cincinnati, OH 45202 ADMINISTRATOR, TRANSFER AGENT AND FUND ACCOUNTANT Ultimus Fund Solutions, LLC 225 Pictoria Drive, Suite 450 Cincinnati, OH 45246 |
This report is intended only for the information of shareholders or those who have received the Fund’s prospectus which contains information about the Fund’s management fee and expenses. Please read the prospectus carefully before investing.
Distributed by Ultimus Fund Distributors, LLC
Member FINRA/SIPC
Fisher1-AR-22
| |
| |
| |
| |
| |
 |
| |
| |
| |
| |
| |
| |
| |
| |
| OneAscent Large Cap Core ETF (OALC) |
| |
| OneAscent Core Plus Bond ETF (OACP) |
| |
| NYSE Arca, Inc. |
| |
| |
| |
| Annual Report |
| |
| August 31, 2022 |
| |
| |
| |
| |
| |
| |
| |
| |
| |
| |
| |
| |
| |
| |
| |
OneAscent Investment Solutions, LLC
23 Inverness Center Parkway
Birmingham, Alabama 35242
Telephone: 1-800-222-8274 |
| Management Discussion of Fund Performance (Unaudited) |
| |
Dear Shareholder,
It is our privilege to share with you the Annual Report for the OneAscent Investment Solutions suite of Exchange-Traded Funds (ETFs) as of August 31, 2022.
At OneAscent, we believe that business is one of, if not the single, most powerful engines that God has given us to impact the world. Because of this power, we must invest intentionally. We should consider not only who business may be impacting (i.e. People and Places), but also how those groups are being impacted (i.e. positively or negatively). To put it simply, OneAscent seeks to eliminate companies from its investable universe whose products or practices are causing harm, while elevating those companies who make the world a better place. Our aim is to identify and invest in companies that not only make great investments but are also great businesses.
Since its founding in 2017, OneAscent has remained committed to developing investment solutions designed to help investors live aligned with what they value most. We call this Values-Based Investing. Over the past year, we have had the privilege to expand and deepen that commitment through the launch of OneAscent Large Cap Core ETF (November 2021) and OneAscent Core Plus Bond ETF (March 2022). We invite you to learn more about values-based investing and the comprehensive suite of OneAscent investment solutions available by visiting our website at investments.oneascent.com.
On behalf of our team at OneAscent, we want to extend our sincerest thanks and appreciation for the trust you have placed in us. We are honored to partner with you, as together, we seek to invest in businesses that bless the world.
Sincerely,

Cole Pearson, President
OneAscent Investment Solutions
FUND PERFORMANCE AND REVIEW
OneAscent Large Cap Core ETF
The OneAscent Large Cap Core ETF (the “Fund”) returned -18.71% from its inception on November 15, 2021 through August 31, 2022 compared with the -14.49% return of its benchmark, the S&P 500® Index. The Fund underperformed its benchmark due to the tilt toward growth factors in the portfolio during the first few months of the period. The
| Management Discussion of Fund Performance (Unaudited) (continued) |
| |
launch of the Fund in November 2021 only slightly preceded the peak in market levels that occurred in early January 2022.
A portfolio manager change was made in February and several modifications were made to the composition of the portfolio, with the biggest change being a shift from growth stocks to more conservative positioning. In early February, the portfolio’s biggest weight by sector was in information technology, the beta was 1.06 versus the benchmark, and the tracking error was nearly 5%. By the end of February, the beta was brought down to 0.96 and the tracking error was lowered to close to 4%, even as the active share increased. The number of portfolio holdings dropped from 120 at the beginning of the period to 75 at the end of the period. Cash was the biggest overweight by the end of February followed by financials.
To this end, performance improved significantly throughout the period. From inception (11/15/2021) to February 3, 2022 the Fund underperformed the benchmark by 5.5%. However, from February 4, 2022 through the end of the period, the Fund outperformed the index by 0.30% as the change from growth stocks to conservative stocks were being implemented. Turnover was significant during the period as the portfolio reconstruction unfolded.
For the overall period, information technology holdings detracted from performance the most, followed by consumer discretionary and industrials. Information technology was the worst performing sector overall which, due to our overweight positioning at the start of the period, drove most of the underperformance. The Fund’s exposure to the communications sector led to the biggest contribution to performance, followed by cash and healthcare. For individual position attribution, Vertex Pharmaceuticals, cash, and Pioneer Natural Resources were the three biggest contributors while Yeti Holdings, SVB Financial and T Rowe Price were the biggest detractors.
The best performing stock was Signify Health, Inc. followed by Hess and Vertex Pharmaceuticals, rising by 63%, 50%, and 50% respectively while in the Fund’s portfolio. Yeti Holdings, Align Technology, and Zoom Video Communications were the worst performing stocks dropping 65%, 65%, and 59% respectively while in the Fund’s portfolio.
At the end of the period, cash was still the biggest holding in the portfolio reflecting the manager’s conservative outlook. However, we feel like the portfolio is now in a great position to take advantage of opportunities as the market continues to correct from euphoric levels.
| Management Discussion of Fund Performance (Unaudited) (continued) |
| |
OneAscent Core Plus Bond ETF
The OneAscent Core Plus Bond ETF (the “Fund”) returned -5.23% from its inception on March 30, 2022 to August 31, 2022, compared with the -5.06% return of its benchmark, the Bloomberg U.S. Aggregate Bond Index. The Federal Reserve (the “Fed”) embarked upon an aggressive tightening of monetary policy during the period, punctuated by two 75-basis point increases to the Federal Funds Rate, as well as the start of balance sheet run-off. The latter is sometimes referred to as quantitative tightening, and it follows a couple years of open market purchases of U.S. Treasury and agency mortgage-backed securities (MBS), which pumps liquidity into the financial system via quantitative easing. Given the current hawkish rhetoric and forward guidance offered by a number of Fed governors, the Fed anticipates that interest-rate increases will be ongoing through year-end and into 2023.
The potential for over-tightening is a legitimate risk. The U.S. economy showed signs of contraction during the period as food and energy inflation spiked higher and core inflation broadened out, while labor markets operated near full employment. Real gross domestic product (GDP), which measures the value of all goods and services produced in the United States, decreased at an annual rate of 0.6 percent in the second quarter of 2022, following a decrease of 1.6 percent in the first quarter. Core inflation, which measures all items except food and energy, rose 6.3% over the twelve months ended August 2022, the highest since March, up from 5.9% in the previous month. Crude oil prices, which were strongly affected by Russia’s invasion of Ukraine in late February 2022 and touched $120 per barrel in March and June, and ended August around $90. The unemployment rate declined steadily over the prior two years to reach 3.6% in March 2022 and remained at 3.7% as of August 2022.
All of the sectors in the Bloomberg U.S. Aggregate Bond Index posted negative returns for the since inception period. From inception through August 31, 2022, U.S. Treasuries, the largest benchmark sector, returned -4.6%. Mortgage-backed securities (MBS) and corporate bonds, the next two largest sectors, returned -4.3% and -7.0%, respectively. Corporate bonds are the longest-duration segment of the index, meaning that they carry the most interest rate sensitivity, which is a headwind when yields (interest rates) are rising. Among smaller sectors in the benchmark, agencies, commercial mortgage backed securities (CMBS), and asset-backed securities (ABS), returned -2.5%, -3.6%, and -1.1%, respectively, as each benefited from shorter durations relative to the broader benchmark. High yield, or below investment grade, corporate bonds, which are not included in the benchmark but are an opportunistic allocation for the Fund, returned -6.7% as investors shed riskier securities in both the equity and debt markets during the period.
Overall, the Fund slightly trailed its benchmark since inception, primarily due to its overweight to the longer duration corporate sector and allocation to off-benchmark high
| Management Discussion of Fund Performance (Unaudited) (continued) |
| |
yield corporates. The Fund’s underweight allocation to Treasuries also detracted. The underweight Treasury and overweight high yield allocations are strategic for the Fund’s strategy and expected to persist over a market cycle. Meanwhile, the positioning of the Fund’s securitized exposures, which are more tactical and based on the investment team’s relative value assessments, contributed favorably to relative performance across MBS, ABS, and CMBS. The Fund’s shorter-than-benchmark duration during the period was the largest positive contributor to relative results.
As part of its investment strategy, the Fund pursues investments in direct and measurable impact securities. Several notable purchases during the period include: a commercial mortgage backed (CMBS) deal to finance a pool of 12 multi-family affordable housing communities located in Florida. Of the 3,082 units, 2,668 will be rented to households with incomes of no more than 60% of Area Median Income (AMI) and 315 units will be available to households with incomes of no more than 35% of AMI. These units have provisions limiting monthly rent to no more than 30% of household income. These affordability provisions are contractually in effect beyond the 2036 term of the bonds. (There are 99 market-rate units without the household income limit.)
The Fund also invested in Fortescue Metals Group’s (FMG) green bond, a USD-denominated high yield corporate bond from an Australian company. FMG is the world’s fourth-largest exporter of iron ore, which is used in steel production. The transition to a more sustainable economy will require significant steel resources, for the construction of wind turbines and solar arrays, among other things. Bond proceeds will be used for a variety of green projects intended to decarbonize mining operations and shipping/transportation of iron ore, including renewable energy, green hydrogen and ammonia production and infrastructure, energy storage, clean transportation, and water purification/recycling.
| Investment Results (Unaudited) |
| |
Total Returns* as of August 31, 2022
| | Since |
| | Inception |
| | (11/15/2021) |
| OneAscent Large Cap Core ETF - NAV | (18.71)% |
| OneAscent Large Cap Core ETF - Market Price | (18.55)% |
| S&P 500® Index(a) | (14.49)% |
| | |
Total annual operating expenses based on estimated amounts for the current fiscal year, as disclosed in the OneAscent Large Cap Core ETF’s (the “Fund”) prospectus dated November 7, 2021, as supplemented on February 24, 2022, were 0.76% of average daily net assets. OneAscent Investment Solutions, LLC (the “Adviser”) contractually has agreed to waive its management fee and/or reimburse expenses so that total annual Fund operating expenses, excluding portfolio transaction and other investment-related costs (including brokerage fees and commissions); taxes; borrowing costs (such as interest and dividend expenses on securities sold short); acquired fund fees and expenses; fees and expenses associated with investments in other collective investment vehicles or derivative instruments (including for example option and swap fees and expenses); any administrative and/or shareholder servicing fees payable pursuant to a plan adopted by the Board of Trustees; expenses incurred in connection with any merger or reorganization; extraordinary expenses (such as litigation expenses, indemnification of Trust officers and Trustees and contractual indemnification of Fund service providers); and other expenses that the Trustees agree have not been incurred in the ordinary course of the Fund’s business, do not exceed 1.00% through December 31, 2022. This expense cap may not be terminated prior to this date except by the Board of Trustees. Each waiver/expense payment by the Adviser is subject to recoupment by the Adviser from the Fund in the three years following the date the particular waiver/expense payment occurred, but only if such recoupment can be achieved without exceeding the annual expense limitation in effect at the time of the waiver/ expense payment and any expense limitation in effect at the time of the recoupment. Additional information pertaining to the Fund’s expense ratio as of August 31, 2022 can be found in the financial highlights.
The performance quoted represents past performance, which does not guarantee future results. The investment return and principal value of an investment will fluctuate so that an investor’s shares, when redeemed, may be worth more or less than their original cost. The returns shown do not reflect deduction of taxes that a shareholder would pay on Fund distributions or the redemption of Fund shares. Current performance of the Fund may be lower or higher than the performance quoted. The Fund’s investment objectives, risks, charges and expenses must be considered carefully before investing. Performance data current to the most recent month end may be obtained by calling (800) 222-8274. The Fund’s per share net asset value (“NAV”) is the value of one share of the Fund as calculated in accordance with the standard formula for valuing shares. The NAV return is based on the NAV of the Fund and the market return is based on the market price per share of the Fund. The price used to calculate market return (“Market Price”) is determined by using the midpoint between the highest bid and the lowest offer on the primary stock exchange on which the shares of the Fund are listed for trading, as of the time that the Fund’s NAV is calculated. Market Price and NAV returns assume that dividends and capital gain distributions have been reinvested in the Fund at Market Price and NAV, respectively. Since exchange-traded funds are bought and sold at prices set by the market, which can result in a premium or discount to NAV, the returns calculated using Market Price can differ from those calculated using NAV. For more information about current performance, holdings or historical premiums/discounts, please visit the Fund’s website at http://investments.oneascent.com.
| * | Return figures reflect any change in price per share and assume the reinvestment of all distributions. Total returns for less than one year are not annualized. |
| Investment Results (Unaudited) (continued) |
| |
| (a) | The S&P 500® Index is a widely recognized unmanaged index of 500 large capitalization companies and is representative of a broader market and range of securities than are found in the |
Fund’s portfolio. Index returns do not reflect the deduction of expenses, which have been deducted from the Fund’s returns. Index returns assume reinvestment of all distributions and do not reflect the deduction of taxes and fees. Individuals cannot invest directly in an index.
The Fund’s investment objectives, strategies, risks, charges and expenses must be considered carefully before investing. The prospectus contains this and other important information about the Fund and may be obtained by calling (800) 222-8274. Please read it carefully before investing.
The Fund is distributed by Northern Lights Distributors, LLC, Member FINRA/SIPC.
| Investment Results (Unaudited) (continued) |
| |
Comparison of the Growth of a $10,000 Investment in the OneAscent Large Cap Core ETF (NAV) and the S&P 500® Index (Unaudited)
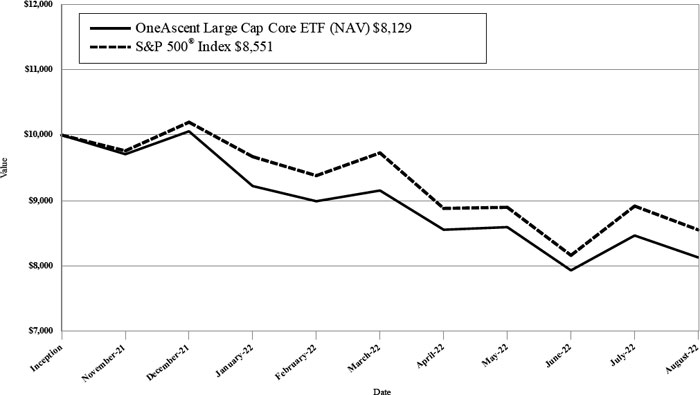
The chart above assumes an initial investment of $10,000 made on November 15, 2021 (commencement of operations) and through August 31, 2022. THE ONEASCENT LARGE CAP CORE ETF’S RETURNS REPRESENT PAST PERFORMANCE AND DO NOT GUARANTEE FUTURE RESULTS. The S&P 500® Index is a widely recognized unmanaged index of equity prices and are representative of a broader market and range of securities than are found in the OneAscent Large Cap Core ETF’s portfolio. The returns shown do not reflect deduction of taxes that a shareholder would pay on the OneAsecnt Large Cap Core ETF distributions or the redemption of shares. Investment returns and principal values will fluctuate so that your shares, when redeemed, may be worth more or less than their original purchase price.
Current performance may be lower or higher than the performance data quoted. For more information on the OneAscent Large Cap Core ETF, and to obtain performance data current to the most recent month-end, or to request a prospectus, please call (800) 222-8274. The OneAscent Large Cap Core ETF’s prospectus and summary prospectus contains important information about the OneAscent Large Cap Core ETF’s investment objectives, potential risks, management fees, charges and expenses, and other information. Please read the prospectus or summary prospectus carefully before investing.
The Fund is distributed by Northern Lights Distributors, LLC, Member FINRA/SIPC.
| Investment Results (Unaudited) (continued) |
Total Returns* as of August 31, 2022
| | Since |
| | Inception |
| | (3/30/2022) |
| OneAscent Core Plus Bond ETF - NAV | (5.23)% |
| OneAscent Core Plus Bond ETF - Market Price | (5.48)% |
| Bloomberg U.S. Aggregate Bond Index(a) | (5.06)% |
| | |
Total annual operating expenses based on estimated amounts for the current fiscal year, as disclosed in the OneAscent Core Plus Bond ETF’s (the “Fund”) prospectus dated March 15, 2022, as supplemented on March 28, 2022, were 0.79% of average daily net assets. The Adviser contractually has agreed to waive its management fee and/or reimburse expenses so that total annual Fund operating expenses, excluding portfolio transaction and other investment-related costs (including brokerage fees and commissions); taxes; borrowing costs (such as interest and dividend expenses on securities sold short); acquired fund fees and expenses; fees and expenses associated with investments in other collective investment vehicles or derivative instruments (including for example option and swap fees and expenses); any administrative and/or shareholder servicing fees payable pursuant to a plan adopted by the Board of Trustees; expenses incurred in connection with any merger or reorganization; extraordinary expenses (such as litigation expenses, indemnification of Trust officers and Trustees and contractual indemnification of Fund service providers); and other expenses that the Trustees agree have not been incurred in the ordinary course of the Fund’s business, do not exceed 1.00% through December 31, 2023. This expense cap may not be terminated prior to this date except by the Board of Trustees. Each waiver/expense payment by the Adviser is subject to recoupment by the Adviser from the Fund in the three years following the date the particular waiver/expense payment occurred, but only if such recoupment can be achieved without exceeding the annual expense limitation in effect at the time of the waiver/expense payment and any expense limitation in effect at the time of the recoupment. Additional information pertaining to the Fund’s expense ratio as of August 31, 2022 can be found in the financial highlights.
The performance quoted represents past performance, which does not guarantee future results. The investment return and principal value of an investment will fluctuate so that an investor’s shares, when redeemed, may be worth more or less than their original cost. The returns shown do not reflect deduction of taxes that a shareholder would pay on Fund distributions or the redemption of Fund shares. Current performance of the Fund may be lower or higher than the performance quoted. The Fund’s investment objectives, risks, charges and expenses must be considered carefully before investing. Performance data current to the most recent month end may be obtained by calling (800) 222-8274. The Fund’s per share net asset value (“NAV”) is the value of one share of the Fund as calculated in accordance with the standard formula for valuing shares. The NAV return is based on the NAV of the Fund and the market return is based on the market price per share of the Fund. The price used to calculate market return (“Market Price”) is determined by using the midpoint between the highest bid and the lowest offer on the primary stock exchange on which the shares of the Fund are listed for trading, as of the time that the Fund’s NAV is calculated. Market Price and NAV returns assume that dividends and capital gain distributions have been reinvested in the Fund at Market Price and NAV, respectively. Since exchange-traded funds are bought and sold at prices set by the market, which can result in a premium or discount to NAV, the returns calculated using Market Price can differ from those calculated using NAV. For more information about current performance, holdings or historical premiums/discounts, please visit the Fund’s website at http://investments.oneascent.com.
| * | Return figures reflect any change in price per share and assume the reinvestment of all distributions. Total returns for less than one year are not annualized. |
| Investment Results (Unaudited) (continued) |
| |
| (a) | The Bloomberg U.S. Aggregate Bond Index is a broad based, market capitalization-weighted bond market index representing intermediate term investment grade bonds traded in the United States and is representative of a broader market and range of securities than are found in the Fund’s portfolio. Index returns do not reflect the deduction of expenses, which have been deducted from the Fund’s returns. Index returns assume reinvestment of all distributions and do not reflect the deduction of taxes and fees. Individuals cannot invest directly in an index. |
The Fund’s investment objectives, strategies, risks, charges and expenses must be considered carefully before investing. The prospectus contains this and other important information about the Fund and may be obtained by calling (800) 222-8274. Please read it carefully before investing.
The Fund is distributed by Northern Lights Distributors, LLC, Member FINRA/SIPC.
| Investment Results (Unaudited) (continued) |
| |
Comparison of the Growth of a $10,000 Investment in the OneAscent Core Plus Bond ETF (NAV) and the Bloomberg U.S. Aggregate Bond Index (Unaudited)
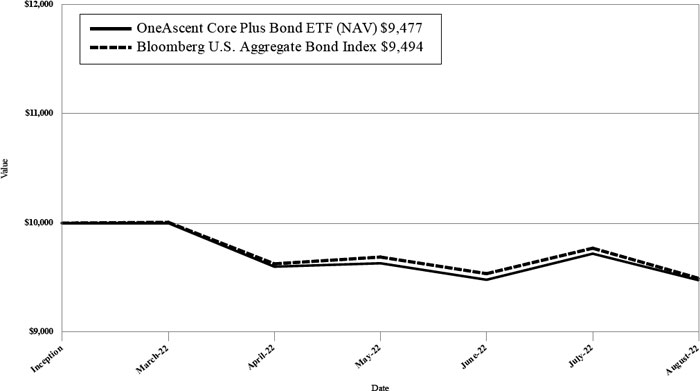
The chart above assumes an initial investment of $10,000 made on March 30, 2022 (commencement of operations) and through August 31, 2022. THE ONEASCENT CORE PLUS BOND ETF’S RETURNS REPRESENT PAST PERFORMANCE AND DO NOT GUARANTEE FUTURE RESULTS. The Bloomberg U.S. Aggregate Bond Index is a broad based, market capitalization-weighted bond market index representing intermediate term investment grade bonds traded in the United States representative of a broader market and range of securities than are found in the OneAscent Core Plus Bond ETF’s portfolio. The returns shown do not reflect deduction of taxes that a shareholder would pay on the OneAsecnt Core Plus Bond ETF distributions or the redemption of shares. Investment returns and principal values will fluctuate so that your shares, when redeemed, may be worth more or less than their original purchase price.
Current performance may be lower or higher than the performance data quoted. For more information on the OneAscent Core Plus Bond ETF, and to obtain performance data current to the most recent month-end, or to request a prospectus, please call (800) 222-8274. The OneAscent Core Plus Bond ETF’s prospectus and summary prospectus contains important information about the OneAscent Core Plus Bond ETF’s investment objectives, potential risks, management fees, charges and expenses, and other information. Please read the prospectus or summary prospectus carefully before investing.
The Fund is distributed by Northern Lights Distributors, LLC, Member FINRA/SIPC.
| Fund Holdings (Unaudited) |
| |
OneAscent Large Cap Core ETF Holdings as of August 31, 2022.*
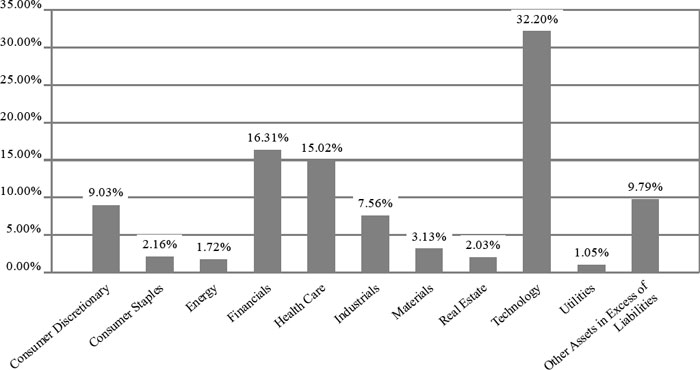
| * | As a percentage of net assets. |
The investment objective of the OneAscent Large Cap Core ETF is to seek capital appreciation.
Portfolio holdings are subject to change.
OneAscent Core Plus Bond ETF Holdings as of August 31, 2022.*
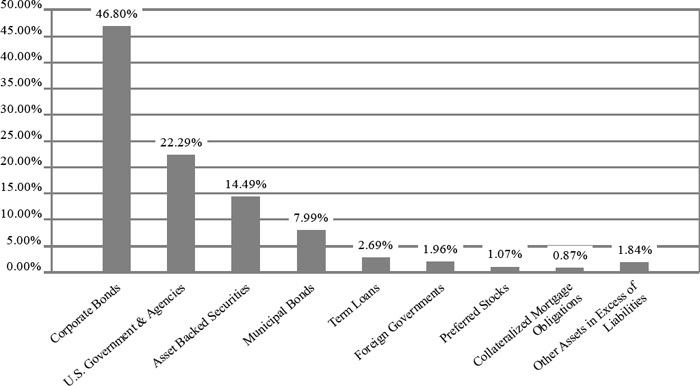
| * | As a percentage of net assets. |
| Fund Holdings (Unaudited) |
| |
The investment objective of the OneAscent Core Plus Bond ETF is to seek total return, with an emphasis on income as the source of that total return, while giving special consideration to certain values-based and impact criteria.
Portfolio holdings are subject to change.
| Availability of Portfolio Schedule (Unaudited) |
| |
The Funds file a complete schedule of portfolio holdings with the Securities and Exchange Commission (the “SEC”) for the first and third quarters of each fiscal year as an exhibit to its reports on Form N-PORT. Each Fund’s Form N-PORT reports are available on the SEC’s website at http:// www.sec.gov or on the Funds’ website at http://investments.oneascent.com.
| OneAscent Large Cap Core ETF |
| Schedule of Investments |
| August 31, 2022 |
| COMMON STOCKS — 90.21% | | Shares | | | Fair Value | |
| Consumer Discretionary — 9.03% | | | | | | | | |
| Copart, Inc.(a) | | | 4,216 | | | $ | 504,445 | |
| Fortune Brands Home & Security, Inc. | | | 4,934 | | | | 303,095 | |
| Gentex Corp. | | | 37,148 | | | | 1,013,769 | |
| Lennar Corp., Class A | | | 3,439 | | | | 266,351 | |
| LKQ Corp. | | | 6,315 | | | | 336,084 | |
| Lululemon Athletica, Inc.(a) | | | 511 | | | | 153,280 | |
| Thor Industries, Inc. | | | 12,934 | | | | 1,047,783 | |
| Tractor Supply Co. | | | 3,748 | | | | 693,942 | |
| Williams-Sonoma, Inc. | | | 3,195 | | | | 475,256 | |
| YETI Holdings, Inc.(a) | | | 12,950 | | | | 477,726 | |
| | | | | | | | 5,271,731 | |
| Consumer Staples — 2.16% | | | | | | | | |
| Clorox Co. (The) | | | 2,174 | | | | 313,796 | |
| Costco Wholesale Corp. | | | 642 | | | | 335,188 | |
| Estee Lauder Cos., Inc. (The), Class A | | | 1,117 | | | | 284,142 | |
| McCormick & Co., Inc. | | | 3,885 | | | | 326,612 | |
| | | | | | | | 1,259,738 | |
| Energy — 1.72% | | | | | | | | |
| EOG Resources, Inc. | | | 2,724 | | | | 330,421 | |
| Hess Corp. | | | 2,807 | | | | 339,030 | |
| ONEOK, Inc. | | | 5,509 | | | | 337,316 | |
| | | | | | | | 1,006,767 | |
| Financials — 16.31% | | | | | | | | |
| Arch Capital Group Ltd.(a) | | | 16,544 | | | | 756,392 | |
| Brown & Brown, Inc. | | | 5,739 | | | | 361,787 | |
| Cboe Global Markets, Inc. | | | 3,453 | | | | 407,350 | |
| Charles Schwab Corp. (The) | | | 21,331 | | | | 1,513,434 | |
| Chubb Ltd. | | | 9,837 | | | | 1,859,686 | |
| Cincinnati Financial Corp. | | | 4,244 | | | | 411,498 | |
| Everest Re Group Ltd. | | | 1,944 | | | | 523,033 | |
| Progressive Corp. (The) | | | 7,465 | | | | 915,582 | |
| RenaissanceRe Holdings Ltd. | | | 2,289 | | | | 309,610 | |
| SVB Financial Group(a) | | | 3,584 | | | | 1,456,968 | |
| T. Rowe Price Group, Inc. | | | 5,624 | | | | 674,880 | |
| Willis Towers Watson PLC | | | 1,599 | | | | 330,721 | |
| | | | | | | | 9,520,941 | |
| Health Care — 15.02% | | | | | | | | |
| Align Technology, Inc.(a) | | | 3,796 | | | | 925,085 | |
| Cigna Corp. | | | 3,667 | | | | 1,039,411 | |
| Danaher Corp. | | | 6,904 | | | | 1,863,459 | |
| Elevance Health, Inc. | | | 4,609 | | | | 2,235,872 | |
| Horizon Therapeutics PLC(a) | | | 4,819 | | | | 285,333 | |
| Laboratory Corp. of America Holdings | | | 1,254 | | | | 282,489 | |
| PerkinElmer, Inc. | | | 2,174 | | | | 293,620 | |
| Vertex Pharmaceuticals, Inc.(a) | | | 6,545 | | | | 1,844,119 | |
| | | | | | | | 8,769,388 | |
| | | | | | | | | |
See accompanying notes which are an integral part of these financial statements.
| OneAscent Large Cap Core ETF |
| Schedule of Investments (continued) |
| August 31, 2022 |
| COMMON STOCKS — 90.21% - continued | | Shares | | | Fair Value | |
| Industrials — 7.56% | | | | | | | | |
| AMERCO | | | 449 | | | $ | 236,026 | |
| Amphenol Corp., Class A | | | 14,211 | | | | 1,044,936 | |
| Cintas Corp. | | | 1,254 | | | | 510,177 | |
| Expeditors International of Washington, Inc. | | | 3,873 | | | | 398,492 | |
| Graco, Inc. | | | 4,589 | | | | 292,962 | |
| JB Hunt Transport Services, Inc. | | | 1,829 | | | | 318,283 | |
| Old Dominion Freight Line, Inc. | | | 1,024 | | | | 277,924 | |
| Sensata Technologies Holding PLC | | | 20,293 | | | | 817,402 | |
| Stanley Black & Decker, Inc. | | | 2,404 | | | | 211,792 | |
| Toro Co. (The) | | | 3,669 | | | | 304,270 | |
| | | | | | | | 4,412,264 | |
| Materials — 3.13% | | | | | | | | |
| Newmont Corp. | | | 7,777 | | | | 321,657 | |
| Sherwin-Williams Co. (The) | | | 5,369 | | | | 1,246,144 | |
| Steel Dynamics, Inc. | | | 3,233 | | | | 260,968 | |
| | | | | | | | 1,828,769 | |
| Real Estate — 2.03% | | | | | | | | |
| Crown Castle International Corp. | | | 2,864 | | | | 489,257 | |
| Jones Lang LaSalle, Inc.(a) | | | 1,369 | | | | 236,837 | |
| Prologis, Inc. | | | 3,669 | | | | 456,827 | |
| | | | | | | | 1,182,921 | |
| Technology — 32.20% | | | | | | | | |
| Adobe, Inc.(a) | | | 1,959 | | | | 731,569 | |
| Advanced Micro Devices, Inc.(a) | | | 14,465 | | | | 1,227,644 | |
| Arista Networks, Inc.(a) | | | 6,961 | | | | 834,485 | |
| Broadcom, Inc. | | | 2,003 | | | | 999,717 | |
| FactSet Research Systems, Inc. | | | 1,017 | | | | 440,707 | |
| Garmin Ltd. | | | 7,514 | | | | 664,914 | |
| Intuit, Inc. | | | 2,380 | | | | 1,027,636 | |
| KLA Corp. | | | 3,174 | | | | 1,092,268 | |
| Lam Research Corp. | | | 1,294 | | | | 566,656 | |
| Leidos Holdings, Inc. | | | 3,784 | | | | 359,669 | |
| MasterCard, Inc., Class A | | | 4,014 | | | | 1,302,021 | |
| Micron Technology, Inc. | | | 17,203 | | | | 972,486 | |
| Microsoft Corp. | | | 15,700 | | | | 4,105,079 | |
| NVIDIA Corp. | | | 6,007 | | | | 906,697 | |
| S&P Global, Inc. | | | 988 | | | | 347,954 | |
| Signify Health, Inc., Class A(a) | | | 16,576 | | | | 462,470 | |
| TD SYNNEX Corp. | | | 11,872 | | | | 1,143,036 | |
| Universal Display Corp. | | | 2,829 | | | | 316,084 | |
| Verisk Analytics, Inc. | | | 1,714 | | | | 320,792 | |
| VMware, Inc., Class A | | | 8,389 | | | | 973,376 | |
| | | | | | | | 18,795,260 | |
| Utilities — 1.05% | | | | | | | | |
| WEC Energy Group, Inc. | | | 5,970 | | | | 615,746 | |
| | | | | | | | | |
| Total Common Stocks/Investments — 90.21% (Cost $59,051,799) | | | | | | $ | 52,663,525 | |
| Other Assets in Excess of Liabilities — 9.79% | | | | | | | 5,714,156 | |
| NET ASSETS — 100.00% | | | | | | $ | 58,377,681 | |
| | | | | | | | | |
| (a) | Non-income producing security. |
See accompanying notes which are an integral part of these financial statements.
| OneAscent Core Plus Bond ETF |
| Schedule of Investments |
| August 31, 2022 |
| | | Principal | | | | |
| ASSET BACKED SECURITIES — 14.49% | | Amount | | | Fair Value | |
| Century Plaza Towers, Series 2019-CPT, Class B, 3.10%, 11/13/2039(a)(b) | | $ | 740,000 | | | $ | 623,023 | |
| COMM Mortgage Trust, Series 2022-HC, Class B, 3.17%, 1/10/2039(a) | | | 1,000,000 | | | | 905,518 | |
| DBUBS Mortgage Trust, Series 2017-BRBK, Class A, 3.45%, 10/10/2034(a) | | | 1,000,000 | | | | 962,324 | |
| GoodLeap Sustainable Home Solutions Trust, Series 2022-3CS, Class B, 5.50%, 7/20/2049(a) | | | 1,250,000 | | | | 1,184,062 | |
| J.P. Morgan Chase Commercial Mortgage Securities Trust, Series 2020- 609M, Class A, 3.76%, 10/15/2033 (US0001M + 1.370bps)(a)(b) | | | 1,000,000 | | | | 971,425 | |
| Manhattan West Mortgage Trust, Series 2020-1MW, Class C, 2.41%, 9/10/2039(a)(b) | | | 1,000,000 | | | | 864,314 | |
| Natixis Commercial Mortgage Securities Trust, Series 2019-MILE, Class A, 3.89%, 7/15/2036 (US0001M + 1.500bps)(a)(b) | | | 1,000,000 | | | | 986,650 | |
| One Bryant Park Trust, Series 2019-OBP, Class A, 2.52%, 9/15/2054(a) | | | 1,100,000 | | | | 947,150 | |
| One Market Plaza Trust, Series 2017-1MKT, Class A, 3.61%, 2/10/2024(a) | | | 1,000,000 | | | | 971,783 | |
| One Market Plaza Trust, Series 2017-1MKT, Class B, 3.85%, 2/10/2032(a) | | | 1,000,000 | | | | 965,852 | |
| One Market Plaza Trust, Series 2017-1MKT, Class C, 4.02%, 2/10/2032(a) | | | 500,000 | | | | 481,703 | |
| STWD Mortgage Trust, Series 2021-LIH, Class AS, 3.65%, 11/15/2036 (US0001M + 1.257bps)(a)(b) | | | 1,000,000 | | | | 960,214 | |
| STWD Mortgage Trust, Series 2021-LIH, Class B, 4.05%, 11/15/2036 (US0001M + 1.656bps)(a)(b) | | | 1,000,000 | | | | 960,827 | |
| Sunrun Jupiter Issuer, LLC, Series 2022-1A, Class A, 4.75%, 7/30/2057(a) | | | 995,991 | | | | 974,840 | |
| TES, LLC, Series 2017-1A, Class B, 7.74%, 10/20/2047(a) | | | 1,000,000 | | | | 910,512 | |
| TES, LLC, Series 2017-2, 6.99%, 2/20/2048(a) | | | 1,000,000 | | | | 922,178 | |
| Vivint Solar Financing V, LLC, Series 2018-1A, Class B, 7.37%, 4/30/2048(a) | | | 732,013 | | | | 702,796 | |
| Total Asset Backed Securities (Cost $15,623,632) | | | | | | | 15,295,171 | |
| | | | | | | | | |
| COLLATERALIZED MORTGAGE OBLIGATIONS — 0.87% | | | | | | | | |
| Freddie Mac Multiclass Certificates, Series 2022-P013, Class A2, 2.85%, 2/25/2032(b) | | | 1,000,000 | | | | 922,798 | |
| Total Collateralized Mortgage Obligations (Cost $941,669) | | | | | | | 922,798 | |
| | | | | | | | | |
| CORPORATE BONDS — 46.80% | | | | | | | | |
| Communications — 1.77% | | | | | | | | |
| Alphabet, Inc., 1.10%, 8/15/2030 | | | 1,000,000 | | | | 818,061 | |
| Verizon Communications, Inc., 3.40%, 3/22/2041 | | | 1,300,000 | | | | 1,046,905 | |
| | | | | | | | 1,864,966 | |
| Consumer Discretionary — 4.31% | | | | | | | | |
| Conservation Fund, Series 2019, 3.47%, 12/15/2029 | | | 1,000,000 | | | | 904,808 | |
| General Motors Co., 5.40%, 10/15/2029 | | | 1,000,000 | | | | 978,832 | |
| General Motors Co., 5.60%, 10/15/2032 | | | 1,000,000 | | | | 960,867 | |
| Magna International, Inc., 2.45%, 6/15/2030 | | | 1,000,000 | | | | 859,341 | |
| Walmart, Inc., 1.80%, 9/22/2031 | | | 1,000,000 | | | | 844,002 | |
| | | | | | | �� | 4,547,850 | |
| Consumer Staples — 2.45% | | | | | | | | |
| PepsiCo, Inc., 3.90%, 7/18/2032 | | | 1,100,000 | | | | 1,081,958 | |
| PepsiCo, Inc., 2.88%, 10/15/2049 | | | 1,000,000 | | | | 783,890 | |
| | | | | | | | | |
See accompanying notes which are an integral part of these financial statements.
| OneAscent Core Plus Bond ETF |
| Schedule of Investments (continued) |
| August 31, 2022 |
| | | Principal | | | | |
| CORPORATE BONDS — 46.80% - continued | | Amount | | | Fair Value | |
| Unilever Capital Corp., 2.63%, 8/12/2051 | | $ | 1,000,000 | | | $ | 717,976 | |
| | | | | | | | 2,583,824 | |
| Energy — 1.53% | | | | | | | | |
| BP Capital Markets America, Inc., 2.77%, 11/10/2050 | | | 1,000,000 | | | | 705,512 | |
| Equinor ASA, 3.95%, 5/15/2043 | | | 1,000,000 | | | | 908,736 | |
| | | | | | | | 1,614,248 | |
| Financials — 10.79% | | | | | | | | |
| Bank of America Corp., MTN, 0.98%, 9/25/2025 (SOFRRATE + 0.910bps)(b) | | | 1,000,000 | | | | 928,905 | |
| Bank of America Corp., MTN, 3.38%, 4/2/2026 (SOFRRATE + 1.330bps)(b) | | | 1,000,000 | | | | 965,874 | |
| Credit Suisse A.G., 5.00%, 7/9/2027 | | | 850,000 | | | | 826,931 | |
| HSBC Holdings PLC, 5.21%, 8/11/2028 (SOFRRATE + 2.610bps)(b) | | | 1,000,000 | | | | 978,513 | |
| HSBC Holdings PLC, 5.40%, 8/11/2033 (SOFRRATE + 2.870bps)(b) | | | 1,075,000 | | | | 1,027,669 | |
| ING Groep N.V., 1.40%, 7/1/2026 (H15T1Y + 1.100bps)(a)(b) | | | 1,000,000 | | | | 904,926 | |
| National Bank of Canada, MTN, 0.55%, 11/15/2024 (H15T1Y + 0.400bps)(b) | | | 1,000,000 | | | | 954,192 | |
| OMERS Finance Trust, 3.50%, 4/19/2032(a) | | | 1,000,000 | | | | 964,793 | |
| OMERS Finance Trust, 4.00%, 4/19/2052(a) | | | 1,000,000 | | | | 912,619 | |
| Pattern Energy Operations, L.P., 4.50%, 8/15/2028(a) | | | 500,000 | | | | 451,151 | |
| Province of Quebec Canada, 1.90%, 4/21/2031 | | | 1,000,000 | | | | 871,114 | |
| SVB Financial Group, 1.80%, 2/2/2031 | | | 1,000,000 | | | | 755,797 | |
| Wells Fargo & Co., MTN, 4.54%, 8/15/2026 (SOFRRATE + 1.560bps)(b) | | | 850,000 | | | | 844,399 | |
| | | | | | | | 11,386,883 | |
| Health Care — 1.49% | | | | | | | | |
| Gilead Sciences, Inc., 2.60%, 10/1/2040 | | | 1,000,000 | | | | 730,647 | |
| Takeda Pharmaceutical Co., Ltd., 2.05%, 3/31/2030 | | | 1,000,000 | | | | 839,345 | |
| | | | | | | | 1,569,992 | |
| Industrials — 5.45% | | | | | | | | |
| Delta Air Lines Pass Through Trust, Series 2020-1, Class A, 2.50%, 6/10/2028 | | | 1,613,986 | | | | 1,389,840 | |
| Otis Worldwide Corp., 3.11%, 2/15/2040 | | | 1,000,000 | | | | 770,082 | |
| Siemens Financieringsmaatschappij N.V., 1.20%, 3/11/2026 | | | 1,000,000 | | | | 901,233 | |
| Tote Shipholdings, LLC, 3.40%, 10/16/2040 | | | 1,052,000 | | | | 994,663 | |
| Vessel Management Services, Inc., 3.48%, 1/16/2037 | | | 963,000 | | | | 918,290 | |
| Waste Management, Inc., 2.95%, 6/1/2041 | | | 1,000,000 | | | | 781,534 | |
| | | | | | | | 5,755,642 | |
| Materials — 1.22% | | | | | | | | |
| FMG Resources (August 2006) Pty Ltd., 6.13%, 4/15/2032(a) | | | 500,000 | | | | 462,845 | |
| Newmont Corp., 2.25%, 10/1/2030 | | | 1,000,000 | | | | 824,543 | |
| | | | | | | | 1,287,388 | |
| Multi-Nationals — 5.28% | | | | | | | | |
| European Investment Bank, 0.75%, 9/23/2030 | | | 1,000,000 | | | | 820,577 | |
| Inter-American Investment Corp., 2.63%, 4/22/2025 | | | 1,000,000 | | | | 973,333 | |
| International Bank for Reconstruction & Global Construction, 0.63%, 4/22/2025 | | | 1,000,000 | | | | 926,878 | |
| International Financial Corp., Series GMTN, 0.50%, 3/20/2023 | | | 1,000,000 | | | | 984,694 | |
| Kreditanstalt fuer Wiederaufbau, 1.00%, 10/1/2026 | | | 1,000,000 | | | | 904,765 | |
| | | | | | | | | |
See accompanying notes which are an integral part of these financial statements.
| OneAscent Core Plus Bond ETF |
| Schedule of Investments (continued) |
| August 31, 2022 |
| | | Principal | | | | |
| CORPORATE BONDS — 46.80% - continued | | Amount | | | Fair Value | |
| United States International Development Finance, 3.43%, 6/1/2033 | | $ | 996,970 | | | $ | 959,827 | |
| | | | | | | | 5,570,074 | |
| Real Estate — 1.74% | | | | | | | | |
| HAT Holdings I, LLC/HAT Holdings II, LLC, 3.38%, 6/15/2026(a) | | | 1,000,000 | | | | 869,380 | |
| Preservation of Affordable Housing, Inc., 4.48%, 12/1/2032 | | | 1,000,000 | | | | 967,299 | |
| | | | | | | | 1,836,679 | |
| Technology — 1.84% | | | | | | | | |
| Apple, Inc., 3.00%, 6/20/2027 | | | 1,000,000 | | | | 973,157 | |
| Intel Corp., 4.15%, 8/5/2032 | | | 1,000,000 | | | | 971,441 | |
| | | | | | | | 1,944,598 | |
| Utilities — 8.93% | | | | | | | | |
| AES Corp. (The), 2.45%, 1/15/2031 | | | 1,000,000 | | | | 827,563 | |
| Ameren Illinois Co., 2.90%, 6/15/2051 | | | 1,000,000 | | | | 731,495 | |
| Avangrid, Inc., 3.15%, 12/1/2024 | | | 1,311,000 | | | | 1,275,303 | |
| Duke Energy Carolinas, LLC, 3.55%, 3/15/2052 | | | 1,000,000 | | | | 828,428 | |
| Duke Energy Progress, LLC, 3.45%, 3/15/2029 | | | 850,000 | | | | 813,059 | |
| Interstate Power and Light Co., 3.50%, 9/30/2049 | | | 845,000 | | | | 671,864 | |
| New York State Electric & Gas Corp., 2.15%, 10/1/2031(a) | | | 1,000,000 | | | | 825,177 | |
| Niagara Mohawk Power Corp., 1.96%, 6/27/2030(a) | | | 1,000,000 | | | | 820,610 | |
| San Diego Gas & Electric Co., 2.95%, 8/15/2051 | | | 1,000,000 | | | | 743,793 | |
| Sempra Energy, 4.88%, 10/15/2170 (H15T5Y + 4.550bps)(b) | | | 1,000,000 | | | | 968,468 | |
| Vistra Corp., 7.00%, Perpetual (H15T5Y + 5.740bps)(a)(b) | | | 1,000,000 | | | | 923,760 | |
| | | | | | | | 9,429,520 | |
| Total Corporate Bonds (Cost $52,340,997) | | | | | | | 49,391,664 | |
| | | | | | | | | |
| FOREIGN GOVERNMENT BONDS — 1.96% | | | | | | | | |
| Canada Government International Bond, 2.88%, 4/28/2025 | | | 1,100,000 | | | | 1,081,383 | |
| Council of Europe Development Bank, 3.00%, 6/16/2025 | | | 1,000,000 | | | | 984,871 | |
| Total Foreign Government Bonds (Cost $2,097,926) | | | | | | | 2,066,254 | |
| | | | | | | | | |
| MUNICIPAL BONDS — 7.99% | | | | | | | | |
| District of Columbia — 1.62% | | | | | | | | |
| District of Columbia, Revenue, 3.85%, 2/28/2025 | | | 1,750,000 | | | | 1,712,637 | |
| | | | | | | | | |
| Florida — 0.93% | | | | | | | | |
| Florida Development Finance Corp., Revenue, Series A, 7.25%, 7/1/2057 | | | 1,000,000 | | | | 979,642 | |
| | | | | | | | | |
| Montana — 0.96% | | | | | | | | |
| Gallatin County Industrial Development, Revenue, Series B, 11.50%, 9/1/2027 | | | 1,000,000 | | | | 1,016,136 | |
| | | | | | | | | |
| New York — 4.00% | | | | | | | | |
| Metropolitan Transportation Authority, Revenue, 5.18%, 11/15/2049 | | | 1,000,000 | | | | 997,742 | |
| New York State Energy Research & Development Authority, Revenue, Series A, 4.87%, 4/1/2037 | | | 3,335,000 | | | | 3,220,747 | |
| | | | | | | | 4,218,489 | |
| Wisconsin — 0.48% | | | | | | | | |
| Fond du Lac County Social Bonds, Revenue, Series A, 5.57%, 11/1/2051 | | | 500,000 | | | | 505,662 | |
| Total Municipal Bonds (Cost $8,627,538) | | | | | | | 8,432,566 | |
| | | | | | | | | |
See accompanying notes which are an integral part of these financial statements.
| OneAscent Core Plus Bond ETF |
| Schedule of Investments (continued) |
| August 31, 2022 |
| | | Principal | | | | |
| TERM LOANS — 2.69% | | Amount | | | Fair Value | |
| Utilities — 1.82% | | | | | | | | |
| ExGen Renewables IV, LLC, 5.51%, 12/15/2027 (US0001M + 250.000bps) | | $ | 943,711 | | | $ | 932,876 | |
| TerraForm Power Operating, LLC, 5.83%, 5/30/2029 (TSFR1M + 275.000bps) | | | 1,000,000 | | | | 988,320 | |
| | | | | | | | 1,921,196 | |
| Industrials — 0.87% | | | | | | | | |
| LTR Intermediate Holdings, Inc., 7.20%, 5/7/2028 (US0001M + 450.000bps) | | | 1,000,000 | | | | 922,500 | |
| Total Term Loans (Cost $2,914,118) | | | | | | | 2,843,696 | |
| | | | | | | | | |
| U.S. GOVERNMENT & AGENCIES — 22.29% | | | | | | | | |
| Fannie Mae Pool, 2.00%, 7/1/2036 | | | 849,020 | | | | 784,746 | |
| Fannie Mae Pool, 2.00%, 6/1/2051 | | | 991,450 | | | | 857,902 | |
| Fannie Mae Pool, 2.50%, 1/1/2052 | | | 2,317,990 | | | | 2,082,103 | |
| Fannie Mae Pool, 2.50%, 4/1/2052 | | | 1,535,052 | | | | 1,379,642 | |
| Fannie Mae Pool, 3.00%, 4/1/2052 | | | 2,876,477 | | | | 2,681,278 | |
| Fannie Mae Pool, 3.50%, 4/1/2052 | | | 2,915,775 | | | | 2,787,457 | |
| Fannie Mae Pool, 5.00%, 5/1/2052 | | | 181,339 | | | | 183,632 | |
| Fannie Mae Pool, 5.00%, 7/1/2052 | | | 471,160 | | | | 477,289 | |
| Fannie Mae Pool, 4.50%, 8/1/2052 | | | 2,000,854 | | | | 1,994,996 | |
| Federal National Mortgage Association, 0.88%, 8/5/2030 | | | 1,000,000 | | | | 824,811 | |
| Freddie Mac Pool, 3.00%, 2/1/2052 | | | 262,268 | | | | 244,133 | |
| Freddie Mac Pool, 2.00%, 3/1/2052 | | | 1,126,251 | | | | 974,339 | |
| Ginnie Mae II Pool, 2.50%, 9/20/2051 | | | 1,595,487 | | | | 1,461,288 | |
| Ginnie Mae II Pool, 3.00%, 12/20/2051 | | | 1,889,345 | | | | 1,778,336 | |
| Ginnie Mae II Pool, 3.00%, 5/20/2052 | | | 212,451 | | | | 199,916 | |
| Ginnie Mae II Pool, 3.50%, 7/20/2052 | | | 215,476 | | | | 208,330 | |
| United States Treasury Note, 2.75%, 8/15/2032 | | | 1,165,000 | | | | 1,127,320 | |
| United States Treasury Note, 2.38%, 2/15/2042 | | | 483,000 | | | | 402,324 | |
| United States Treasury Note, 3.38%, 8/15/2042 | | | 2,481,000 | | | | 2,430,604 | |
| United States Treasury Note, 2.88%, 5/15/2052 | | | 703,300 | | | | 651,102 | |
| | | | | | | | | |
| Total U.S. Government & Agencies (Cost $24,394,080) | | | | | | | 23,531,548 | |
| | | | | | | | | |
| PREFERRED STOCKS — 1.07% | | Shares | | | Fair Value | |
| Financials — 1.07% | | | | | | | | |
| Morgan Stanley, Series P, 6.50% | | | 43,475 | | | | 1,134,698 | |
| Total Preferred Stocks (Cost $1,086,875) | | | | | | | 1,134,698 | |
| | | | | | | | | |
| Total Investments — 98.16% (Cost $108,026,835) | | | | | | | 103,618,395 | |
| Other Assets in Excess of Liabilities — 1.84% | | | | | | | 1,945,004 | |
| NET ASSETS — 100.00% | | | | | | $ | 105,563,399 | |
| | | | | | | | | |
| (a) | Security exempt from registration under Rule 144A or Section 4(2) of the Securities Act of 1933. The security may be resold in transactions exempt from registration, normally to qualified institutional buyers. |
| (b) | Variable rate security. Interest rate resets periodically. The rate shown is the effective interest rate as of August 31, 2022. For securities based on a published reference rate and spread, the reference rate and spread (in basis points) are indicated parenthetically. Certain variable rate securities are not based on a published reference rate and spread but are determined by the issuer or agent and are based on current market conditions. These securities, therefore, do not indicate a reference rate and spread. |
See accompanying notes which are an integral part of these financial statements.
| OneAscent ETFs |
| Statements of Assets and Liabilities |
| August 31, 2022 |
| | | OneAscent | | | OneAscent | |
| | | Large Cap | | | Core Plus | |
| | | Core ETF | | | Bond ETF | |
| Assets | | | | | | | | |
| Investments in securities, at fair value (cost $59,051,799 and $108,026,835) | | $ | 52,663,525 | | | $ | 103,618,395 | |
| Cash | | | 5,737,801 | | | | 5,568,431 | |
| Receivable for investments sold | | | — | | | | 668,330 | |
| Dividend and interest receivable | | | 37,123 | | | | 606,798 | |
| Prepaid expenses | | | 4,583 | | | | 5,432 | |
| Total Assets | | | 58,443,032 | | | | 110,467,386 | |
| | | | | | | | | |
| Liabilities | | | | | | | | |
| Payable for fund shares redeemed | | | — | | | | 3,534,446 | |
| Payable for investments purchased | | | — | | | | 1,004,501 | |
| Payable for distributions to shareholders | | | — | | | | 256,950 | |
| Payable to Adviser | | | 17,977 | | | | 47,033 | |
| Payable to affiliates | | | 9,540 | | | | 14,608 | |
| Payable to audit and tax | | | 19,450 | | | | 19,450 | |
| Other accrued expenses | | | 18,384 | | | | 26,999 | |
| Total Liabilities | | | 65,351 | | | | 4,903,987 | |
| Net Assets | | $ | 58,377,681 | | | $ | 105,563,399 | |
| | | | | | | | | |
| Net Assets consist of: | | | | | | | | |
| Paid-in capital | | $ | 70,035,745 | | | $ | 111,662,432 | |
| Accumulated deficit | | | (11,658,064 | ) | | | (6,099,033 | ) |
| Net Assets | | $ | 58,377,681 | | | $ | 105,563,399 | |
| Shares outstanding (unlimited number of shares authorized, no par value) | | | 2,875,000 | | | | 4,500,000 | |
| Net asset value per share | | $ | 20.31 | | | $ | 23.46 | |
| | | | | | | | | |
See accompanying notes which are an integral part of these financial statements.
| OneAscent ETFs |
| Statements of Operations |
| For the period ended August 31, 2022 |
| | | OneAscent | | | OneAscent | |
| | | Large Cap | | | Core Plus | |
| | | Core ETF(a) | | | Bond ETF(a) | |
| Investment Income | | | | | | | | |
| Dividend income | | $ | 478,538 | | | $ | — | |
| Interest income | | | — | | | | 1,483,712 | |
| Total investment income | | | 478,538 | | | | 1,483,712 | |
| | | | | | | | | |
| Expenses | | | | | | | | |
| Adviser | | | 151,616 | | | | 223,594 | |
| Administration | | | 49,067 | | | | 40,204 | |
| Custodian | | | 27,109 | | | | 11,106 | |
| Audit and tax | | | 19,450 | | | | 19,450 | |
| Legal | | | 17,146 | | | | 8,797 | |
| Compliance services | | | 15,417 | | | | 12,601 | |
| Trustee | | | 11,820 | | | | 7,951 | |
| Report printing | | | 9,660 | | | | 5,876 | |
| Transfer agent | | | 8,532 | | | | 4,463 | |
| Pricing | | | 1,694 | | | | 8,426 | |
| Insurance | | | 221 | | | | 270 | |
| Miscellaneous | | | 39,186 | | | | 32,389 | |
| Net operating expenses | | | 350,918 | | | | 375,127 | |
| Net investment income | | | 127,620 | | | | 1,108,585 | |
| | | | | | | | | |
| Net Realized and Change in Unrealized Gain (Loss) on Investments | | | | | | | | |
| Net realized gain (loss) on: | | | | | | | | |
| Investment securities | | | (5,133,241 | ) | | | (1,724,603 | ) |
| Change in unrealized depreciation on: | | | | | | | | |
| Investment securities | | | (6,392,154 | ) | | | (4,408,440 | ) |
| Net realized and change in unrealized gain (loss) on investment securities | | | (11,525,395 | ) | | | (6,133,043 | ) |
| | | | | | | | | |
| Net decrease in net assets resulting from operations | | $ | (11,397,775 | ) | | $ | (5,024,458 | ) |
| | | | | | | | | |
| (a) | For the period November 15, 2021 (commencement of operations) to August 31, 2022. |
| (b) | For the period March 30, 2022 (commencement of operations) to August 31, 2022. |
See accompanying notes which are an integral part of these financial statements.
| OneAscent ETFs |
| Statements of Changes in Net Assets |
| | | OneAscent | | | OneAscent | |
| | | Large Cap | | | Core Plus | |
| | | Core ETF | | | Bond ETF | |
| | | For the Period | | | For the Period | |
| | | Ended August | | | Ended August | |
| | | 31, 2022(a) | | | 31, 2022(b) | |
| Increase (Decrease) in Net Assets due to: | | | | | | | | |
| Operations | | | | | | | | |
| Net investment income | | $ | 127,620 | | | $ | 1,108,585 | |
| Net realized loss on investment securities | | | (5,133,241 | ) | | | (1,724,603 | ) |
| Change in unrealized depreciation on investment securities | | | (6,392,154 | ) | | | (4,408,440 | ) |
| Net decrease in net assets resulting from operations | | | (11,397,775 | ) | | | (5,024,458 | ) |
| | | | | | | | | |
| Distributions to Shareholders From: | | | | | | | | |
| Earnings | | | (33,250 | ) | | | (1,074,575 | ) |
| Total distributions | | | (33,250 | ) | | | (1,074,575 | ) |
| | | | | | | | | |
| Capital Transactions | | | | | | | | |
| Proceeds from shares sold | | | 73,618,036 | | | | 115,196,878 | |
| Amount paid for shares redeemed | | | (3,809,330 | ) | | | (3,534,446 | ) |
| Net increase in net assets resulting from capital transactions | | | 69,808,706 | | | | 111,662,432 | |
| Total Increase in Net Assets | | | 58,377,681 | | | | 105,563,399 | |
| | | | | | | | | |
| Net Assets | | | | | | | | |
| Beginning of period | | $ | — | | | $ | — | |
| End of period | | $ | 58,377,681 | | | $ | 105,563,399 | |
| | | | | | | | | |
| Share Transactions | | | | | | | | |
| Shares sold | | | 3,050,000 | | | | 4,650,000 | |
| Shares redeemed | | | (175,000 | ) | | | (150,000 | ) |
| Net increase in shares outstanding | | | 2,875,000 | | | | 4,500,000 | |
| | | | | | | | | |
| (a) | For the period November 15, 2021 (commencement of operations) to August 31, 2022. |
| (b) | For the period March 30, 2022 (commencement of operations) to August 31, 2022. |
See accompanying notes which are an integral part of these financial statements.
| OneAscent Large Cap Core ETF |
| Financial Highlights |
| |
| (For a share outstanding during the period) |
| | | For the | |
| | | Period | |
| | | Ended | |
| | | August 31, | |
| | | 2022(a) | |
| Selected Per Share Data: | | | | |
| Net asset value, beginning of period | | $ | 25.00 | |
| | | | | |
| Investment operations: | | | | |
| Net investment income | | | 0.04 | |
| Net realized and unrealized loss on investments | | | (4.72 | ) |
| Total from investment operations | | | (4.68 | ) |
| | | | | |
| Less distributions to shareholders from: | | | | |
| Net investment income | | | (0.01 | ) |
| Total distributions | | | (0.01 | ) |
| | | | | |
| Net asset value, end of period | | $ | 20.31 | |
| Market price, end of period | | $ | 20.35 | |
| | | | | |
| Total Return(b) | | | (18.71 | %) (c) |
| | | | | |
| Ratios and Supplemental Data: | | | | |
| Net assets, end of period (000 omitted) | | $ | 58,378 | |
| Ratio of net expenses to average net assets | | | 0.81 | % (d) |
| Ratio of net investment income to average net assets | | | 0.28 | % (d) |
| Portfolio turnover rate(e) | | | 52 | % (c) |
| | | | | |
| (a) | For the period November 15, 2021 (commencement of operations) to August 31, 2022. |
| (b) | Total return is calculated assuming a purchase of shares at net asset value on the first day and a sale at net asset value on the last day of the period. Distributions are assumed, for the purpose of this calculation, to be reinvested at the ex-dividend date net asset value per share on their respective payment dates. |
| (e) | Portfolio turnover rate excludes securities received or delivered from in-kind processing of creations or redemptions. |
See accompanying notes which are an integral part of these financial statements.
| OneAscent Core Plus Bond ETF |
| Financial Highlights |
| |
| (For a share outstanding during the period) |
| | | For the | |
| | | Period | |
| | | Ended | |
| | | August 31, | |
| | | 2022(a) | |
| Selected Per Share Data: | | | | |
| Net asset value, beginning of period | | $ | 25.00 | |
| | | | | |
| Investment operations: | | | | |
| Net investment income | | | 0.24 | |
| Net realized and unrealized loss on investments | | | (1.55 | ) |
| Total from investment operations | | | (1.31 | ) |
| | | | | |
| Less distributions to shareholders from: | | | | |
| Net investment income | | | (0.23 | ) |
| Total distributions | | | (0.23 | ) |
| | | | | |
| Net asset value, end of period | | $ | 23.46 | |
| Market price, end of period | | $ | 23.40 | |
| | | | | |
| Total Return(b) | | | (5.23 | %) (c) |
| | | | | |
| Ratios and Supplemental Data: | | | | |
| Net assets, end of period (000 omitted) | | $ | 105,563 | |
| Ratio of net expenses to average net assets | | | 0.83 | % (d) |
| Ratio of net investment income to average net assets | | | 2.51 | % (d) |
| Portfolio turnover rate(e) | | | 122 | % (c) |
| | | | | |
| (a) | For the period March 30, 2022 (commencement of operations) to August 31, 2022. |
| (b) | Total return is calculated assuming a purchase of shares at net asset value on the first day and a sale at net asset value on the last day of the period. Distributions are assumed, for the purpose of this calculation, to be reinvested at the ex-dividend date net asset value per share on their respective payment dates. |
| (e) | Portfolio turnover rate excludes securities received or delivered from in-kind processing of creations or redemptions. |
See accompanying notes which are an integral part of these financial statements.
| OneAscent ETFs |
| Notes to the Financial Statements |
| August 31, 2022 |
| |
NOTE 1. ORGANIZATION
OneAscent Large Cap Core ETF (the “Large Cap Core ETF”) and the OneAscent Core Plus Bond ETF (the “Core Plus Bond ETF”) (each a “Fund” and collectively the “Funds”) are registered under the Investment Company Act of 1940, as amended (“1940 Act”), as diversified series of Unified Series Trust (the “Trust”). The Trust is an open-end investment company established under the laws of Ohio by an Agreement and Declaration of Trust dated October 14, 2002, as amended (the “Trust Agreement”). The Trust Agreement permits the Board of Trustees of the Trust (the “Board”) to issue an unlimited number of shares of beneficial interest of separate series. Each Fund is one of a series of funds currently authorized by the Board. The Funds’ investment adviser is OneAscent Investment Solutions, LLC (the “Adviser”). The Adviser has retained Teachers Advisors, LLC (the “Sub-Adviser”) to serve as sub-adviser to the Core Plus Bond ETF. The investment objective of the Large Cap Core ETF is to seek capital appreciation. The investment objective of the Core Plus Bond ETF is to seek total return, with an emphasis on income as the source of that total return, while giving special consideration to certain values-based and impact criteria.
NOTE 2. SIGNIFICANT ACCOUNTING POLICIES
The Funds are investment companies and follow accounting and reporting guidance under Financial Accounting Standards Board Accounting Standards Codification (“ASC”) Topic 946, “Financial Services-Investment Companies” including Accounting Standards Update 2013-08. The following is a summary of significant accounting policies followed by the Funds in the preparation of their financial statements. These policies are in conformity with generally accepted accounting principles in the United States of America (“GAAP”).
Estimates – The preparation of financial statements in conformity with GAAP requires management to make estimates and assumptions that affect the reported amounts of assets and liabilities and disclosure of contingent assets and liabilities at the date of the financial statements and the reported amounts of increases and decreases in net assets from operations during the reporting period. Actual results could differ from those estimates.
Federal Income Taxes – The Funds make no provision for federal income or excise tax. Each Fund has qualified and intends to qualify each year as a regulated investment company (“RIC”) under subchapter M of the Internal Revenue Code of 1986, as amended, by complying with the requirements applicable to RICs and by distributing substantially all of its taxable income. Each Fund also intends to distribute sufficient net investment income and net capital gains, if any, so that it will not be subject to excise tax on undistributed income and gains. If the required amount of net investment income or gains is not distributed, the Funds could incur a tax expense.
| OneAscent ETFs |
| Notes to the Financial Statements (continued) |
| August 31, 2022 |
| |
As of and during the fiscal period ended August 31, 2022, the Funds did not have any liabilities for any unrecognized tax benefits. The Funds recognize interest and penalties, if any, related to unrecognized tax benefits as income tax expense in the Statements of Operations when incurred. During the period, the Funds did not incur any interest or penalties. Management of the Funds has reviewed tax positions taken in tax years that remain subject to examination by all major tax jurisdictions, including federal (i.e., the interim tax period since inception, as applicable) and has concluded that no provision for unrecognized tax benefits or expenses is required in these financial statements and does not expect this to change over the next twelve months.
Expenses – Expenses incurred by the Trust that do not relate to a specific fund of the Trust are allocated to the individual funds based on each fund’s relative net assets or another appropriate basis (as determined by the Board).
Security Transactions and Related Income – The Funds follow industry practice and record security transactions on the trade date for financial reporting purposes. The specific identification method is used for determining gains or losses for financial statements and income tax purposes. Dividend income is recorded on the ex-dividend date and interest income is recorded on an accrual basis. Distributions received from investments in real estate investment trusts (“REITs”) that represent a return of capital or capital gain are recorded as a reduction of the cost of investment or as a realized gain, respectively. The calendar year-end amounts of ordinary income, capital gains, and return of capital included in distributions received from the Funds’ investments in REITs are reported to the Funds after the end of the calendar year; accordingly, the Funds estimate these amounts for accounting purposes until the characterization of REIT distributions is reported. Estimates are based on the most recent REIT distributions information available. Withholding taxes on foreign dividends and related reclaims have been provided for in accordance with the Funds’ understanding of the applicable country’s tax rules and rates.
Dividends and Distributions – The Large Cap Core ETF intends to distribute its dividends from net investment income and net realized long-term and short-term capital gains, if any, at least annually. The Core Plus Bond ETF typically distributes dividends from net investment income monthly and any realized net capital gains, if any, annually. Dividends and distributions to shareholders, which are determined in accordance with income tax regulations, are recorded on the ex-dividend date. The treatment for financial reporting purposes of distributions made to shareholders during the period from net investment income or net realized capital gains may differ from their ultimate treatment for federal income tax purposes. These differences are caused primarily by differences in the timing of the recognition of certain components of income, expense or realized capital gain for federal income tax purposes. Where such differences are permanent in nature, they are reclassified among the components of net assets based on their ultimate characterization
| OneAscent ETFs |
| Notes to the Financial Statements (continued) |
| August 31, 2022 |
| |
for federal income tax purposes. Any such reclassifications will have no effect on net assets, results of operations or net asset value (“NAV”) per share of the Funds.
For the fiscal period ended August 31, 2022, the Funds made the following reclassifications to increase (decrease) the components of net assets:
| | | | | Accumulated Earnings |
| | | Paid-In Capital | | (Deficit) |
| Large Cap Core ETF | | $227,039 | | $(227,039) |
| Core Plus Bond ETF | | — | | — |
| | | | | |
NOTE 3. SECURITIES VALUATION AND FAIR VALUE MEASUREMENTS
Each Fund values its portfolio securities at fair value as of the close of regular trading on the New York Stock Exchange (“NYSE”) (normally 4:00 p.m. Eastern time) on each business day the NYSE is open for business. Fair value is defined as the price that a Fund would receive upon selling an investment in a timely transaction to an independent buyer in the principal or most advantageous market of the investment. GAAP establishes a three-tier hierarchy to maximize the use of observable market data and minimize the use of unobservable inputs and to establish classification of fair value measurements for disclosure purposes.
Inputs refer broadly to the assumptions that market participants would use in pricing the asset or liability, including assumptions about risk (the risk inherent in a particular valuation technique used to measure fair value including a pricing model and/or the risk inherent in the inputs to the valuation technique). Inputs may be observable or unobservable. Observable inputs are inputs that reflect the assumptions market participants would use in pricing the asset or liability developed based on market data obtained and available from sources independent of the reporting entity. Unobservable inputs are inputs that reflect the reporting entity’s own assumptions about the assumptions market participants would use in pricing the asset or liability developed based on the best information available in the circumstances.
Various inputs are used in determining the value of each Fund’s investments. These inputs are summarized in the three broad levels listed below.
| ● | Level 1 – unadjusted quoted prices in active markets for identical investments and/or registered investment companies where the value per share is determined and published and is the basis for current transactions for identical assets or liabilities at the valuation date |
| ● | Level 2 – other significant observable inputs (including, but not limited to, quoted prices for an identical security in an inactive market, quoted prices for similar securities, interest rates, prepayment speeds, credit risk, etc.) |
| ● | Level 3 – significant unobservable inputs (including the Funds’ own assumptions in determining fair value of investments based on the best information available) |
| OneAscent ETFs |
| Notes to the Financial Statements (continued) |
| August 31, 2022 |
| |
The inputs used to measure fair value may fall into different levels of the fair value hierarchy. In such cases, for disclosure purposes, the level in the fair value hierarchy which is reported is determined based on the lowest level input that is significant to the fair value measurement in its entirety.
Equity securities that are traded on any stock exchange are generally valued at the last quoted sale price on the security’s primary exchange. Lacking a last sale price, an exchange-traded security is generally valued at its last bid price. Securities traded in the NASDAQ over-the-counter market are generally valued at the NASDAQ Official Closing Price. When using market quotations and when the market is considered active, the security is classified as a Level 1 security. In the event that market quotations are not readily available or are considered unreliable due to market or other events, a Fund values its securities and other assets at fair value in accordance with policies established by and under the general supervision of the Board. Under these policies, the securities will be classified as Level 2 or 3 within the fair value hierarchy, depending on the inputs used.
Debt securities are valued by using the mean between the closing bid and ask prices provided by a pricing service. If the closing bid and ask prices are not readily available, the pricing service may provide a price determined by a matrix pricing method. Matrix pricing is a mathematical technique used to value fixed income securities without relying exclusively on quoted prices. Matrix pricing takes into consideration recent transactions, yield, liquidity, risk, credit quality, coupon, maturity, type of issue and any other factors or market data the pricing service deems relevant for the actual security being priced and for other securities with similar characteristics. These securities will generally be categorized as Level 2 securities. If the Adviser decides that a price provided by the pricing service does not accurately reflect the fair value of the securities or when prices are not readily available from a pricing service, securities are valued at fair value as determined by the Adviser, in conformity with guidelines adopted by and subject to review of the Board. These securities will generally be categorized as Level 3 securities.
| OneAscent ETFs |
| Notes to the Financial Statements (continued) |
| August 31, 2022 |
| |
The following is a summary of the inputs used to value the Funds’ investments as of August 31, 2022:
| Valuation Inputs |
| Assets | | Level 1 | | | Level 2 | | | Level 3 | | | Total | |
| Large Cap Core ETF | | | | | | | | | | | | | | | | |
| Common Stocks(a) | | $ | 52,663,525 | | | $ | — | | | $ | — | | | $ | 52,663,525 | |
| Total | | $ | 52,663,525 | | | $ | — | | | $ | — | | | $ | 52,663,525 | |
| | | | | | | | | | | | | | | | | |
| Core Plus Bond ETF | | | | | | | | | | | | | | | | |
| Asset Backed Securities | | $ | — | | | $ | 15,295,171 | | | $ | — | | | $ | 15,295,171 | |
| Collateralized Mortgage | | | | | | | | | | | | | | | | |
| Obligations | | | — | | | | 922,798 | | | | — | | | | 922,798 | |
| Corporate Bonds | | | — | | | | 49,391,664 | | | | — | | | | 49,391,664 | |
| Foreign Government Bonds | | | — | | | | 2,066,254 | | | | — | | | | 2,066,254 | |
| Municipal Bonds | | | — | | | | 8,432,566 | | | | — | | | | 8,432,566 | |
| Term Loans | | | — | | | | 2,843,696 | | | | — | | | | 2,843,696 | |
| U.S. Government & Agencies | | | — | | | | 23,531,548 | | | | — | | | | 23,531,548 | |
| Preferred Stocks | | | 1,134,698 | | | | — | | | | — | | | | 1,134,698 | |
| Total | | $ | 1,134,698 | | | $ | 102,483,697 | | | $ | — | | | $ | 103,618,395 | |
| | | | | | | | | | | | | | | | | |
| (a) | Refer to Schedule of Investments for sector classifications. |
The Funds did not hold any investments at the end of the reporting period for which significant unobservable inputs (Level 3) were used in determining fair value; therefore, no reconciliation of Level 3 securities is included for this reporting period.
NOTE 4. FEES AND OTHER TRANSACTIONS WITH AFFILIATES AND OTHER SERVICE PROVIDERS
The Adviser, under the terms of the management agreement with the Trust with respect to each Fund (each an “Agreement”), manages the Funds’ investments. As compensation for its management services, each Fund is obligated to pay the Adviser a fee computed and accrued daily and paid monthly as follows:
| | | Large Cap Core | | |
| | | ETF | | Core Plus Bond ETF |
| Management fee rate | | 0.35% | | 0.50% |
| Management fees earned | | $151,616 | | $223,594 |
| | | | | |
The Adviser has retained a sub-adviser to provide portfolio management and related services to the Core Plus Bond ETF. The Sub-Adviser receives a fee from the Adviser for these services.
The Adviser has contractually agreed to waive its management fee and/or reimburse expenses so that total annual operating expenses, excluding portfolio transaction and other investment-related costs (including brokerage fees and commissions); taxes; borrowing
| OneAscent ETFs |
| Notes to the Financial Statements (continued) |
| August 31, 2022 |
| |
costs (such as interest and dividend expenses on securities sold short); acquired fund fees and expenses; fees and expenses associated with investments in other collective investment vehicles or derivative instruments (including for example option and swap fees and expenses); any administrative and/or shareholder servicing fees payable pursuant to a plan adopted by the Board of Trustees; expenses incurred in connection with any merger or reorganization; extraordinary expenses (such as litigation expenses, indemnification of Trust officers and Trustees and contractual indemnification of Fund service providers); and other expenses that the Trustees agree have not been incurred in the ordinary course of the Funds’ business, do not exceed 1.00% of the average daily net assets with respect to the Large Cap Core ETF through December 31, 2022 and 1.00% of the Fund’s average daily net assets with the respect of the Core Plus Bond ETF through December 31, 2023. For the fiscal period ended August 31, 2022, the Adviser did not waive any fees in each Fund. At August 31, 2022, the Funds owed the Adviser $17,977 and $47,033 for the Large Cap Core ETF and Core Plus Bond ETF, respectively.
Each fee waiver/expense payment by the Adviser is subject to recoupment by the Adviser from the Fund in the three years following the date in which that particular waiver/expense payment occurred, but only if such recoupment can be achieved without exceeding the annual expense limitation in effect at the time of the waiver/expense payment and any expense limitation in effect at the time of the recoupment.
Ultimus Fund Solutions, LLC (“Ultimus”) provides administration, fund accounting and transfer agent services to the Funds. The Funds pay Ultimus fees in accordance with the agreements for such services.
Northern Lights Compliance Services, LLC (“NLCS”), an affiliate of Ultimus, provides a Chief Compliance Officer to the Trust, as well as related compliance services, pursuant to a consulting agreement between NLCS and the Trust. Under the terms of such agreement, NLCS receives fees from the Funds, which are approved annually by the Board.
Under the terms of a Distribution Agreement with the Trust, Northern Lights Distributors, LLC (the “Distributor”) serves as principal underwriter to the Funds. The Distributor is a wholly-owned subsidiary of Ultimus. The Distributor is compensated by the Adviser (not the Funds) for acting as principal underwriter.
Certain officers and a Trustee of the Trust are also employees of Ultimus and such persons are not paid by the Funds for serving in such capacities.
The Board supervises the business activities of the Trust. Each Trustee serves as a trustee until termination of the Trust unless the Trustee dies, resigns, retires, or is removed. The Chairman of the Board and more than 75% of the Trustees are “Independent Trustees,” which means that they are not “interested persons” as defined in the 1940 Act. Each
| OneAscent ETFs |
| Notes to the Financial Statements (continued) |
| August 31, 2022 |
| |
Independent Trustee of the Trust receives annual compensation of $2,785 per fund from the Trust, except that the Chairman of the Audit Committee, the Chairman of the Governance & Nominating Committee, and the Chairman of the Pricing & Liquidity Committee each receives annual compensation of $3,235 per fund from the Trust, and the Independent Chairman of the Board receives $3,435 per fund from the Trust. Independent Trustees also receive $1,000 for attending any special meeting that requires an in person approval of a contract and $250 for the first hour and $200 for each additional hour for attending other special meetings. In addition, the Trust reimburses Independent Trustees for out-of-pocket expenses incurred in conjunction with attendance at meetings.
NOTE 5. PURCHASES AND SALES OF SECURITIES
For the fiscal period ended August 31, 2022, purchases and sales of investment securities, other than short-term investments, were as follows:
| | | | | | | | | U.S. | | | U.S. | |
| | | | | | | | | Government | | | Government | |
| | | Purchases | | | Sales | | | Purchases | | | Sales | |
| Large Cap Core ETF | | $ | 27,165,299 | | | $ | 31,434,011 | | | $ | — | | | $ | — | |
| Core Plus Bond ETF | | | 104,916,021 | | | | 23,511,013 | | | | 133,337,805 | | | | 106,102,400 | |
| | | | | | | | | | | | | | | | | |
For the fiscal period ended August 31, 2022, purchases and sales for in-kind transactions were as follows:
| | | Purchases | | | Sales | |
| Large Cap Core ETF | | $ | 71,850,328 | | | $ | 3,392,696 | |
| Core Plus Bond ETF | | | — | | | | — | |
| | | | | | | | | |
For the fiscal period ended August 31, 2022, the Funds incurred net realized gains on in-kind redemptions as follows:
| | | In-Kind | |
| | | Realized Gains | |
| Large Cap Core ETF | | $ | 237,994 | |
| Core Plus Bond ETF | | | — | |
| | | | | |
NOTE 6. CAPITAL SHARE TRANSACTIONS
Shares are not individually redeemable and may be redeemed by each Fund at NAV only in large blocks known as “Creation Units.” Only Authorized Participants or transactions done through an Authorized Participant are permitted to purchase or redeem Creation Units
| OneAscent ETFs |
| Notes to the Financial Statements (continued) |
| August 31, 2022 |
| |
from a Fund. An Authorized Participant is either (i) a broker-dealer or other participant in the clearing process through the Continuous Net Settlement System of the National Securities Clearing Corporation or (ii) a Depository Trust Company participant and, in each case, must have executed a Participant Agreement with the Distributor. Such transactions are generally permitted on an in-kind basis, with a balancing cash component to equate the transaction to the NAV per share of the Fund on the transaction date. Cash may be substituted equivalent to the value of certain securities generally when they are not available in sufficient quantity for delivery, not eligible for trading by the Authorized Participant or as a result of other market circumstances. In addition, the Fund may impose transaction fees on purchases and redemptions of Fund shares to cover the custodial and other costs incurred by the Fund in effecting trades. A fixed fee payable to the Custodian may be imposed on each creation and redemption transaction regardless of the number of Creation Units involved in the transaction (“Fixed Fee”). Purchases and redemptions of Creation Units for cash or involving cash-in-lieu are required to pay an additional variable charge to compensate a Fund and its ongoing shareholders for brokerage and market impact expenses relating to Creation Unit transactions (“Variable Charge,” and together with the Fixed Fee, the “Transaction Fees”). Transactions in capital shares for each Fund are disclosed in the Statements of Changes in Net Assets. For the fiscal period ended August 31, 2022, the Large Cap Core ETF and the Core Plus Bond ETF received $14,500 and $600 in fixed fees, respectively. There were no variable rate fees charged for the Large Cap Core ETF or the Core Plus Bond ETF during the fiscal period ended August 31, 2022. The Transaction Fees for each Fund are listed in the table below:
| | | | | Variable |
| | | Fixed Fee | | Charge |
| Large Cap Core ETF | | $500 | | 2.00%* |
| Core Plus Bond ETF | | $200 | | 2.00%* |
| | | | | |
| * | The maximum Transaction Fee may be up to 2.00% of the amount invested. |
NOTE 7. FEDERAL TAX INFORMATION
At August 31, 2022, the net unrealized appreciation (depreciation) and tax cost of investments for tax purposes was as follows:
| | | Large Cap | | | Core Plus | |
| | | Core ETF | | | Bond ETF | |
| Gross unrealized appreciation | | $ | 927,798 | | | $ | 78,252 | |
| Gross unrealized depreciation | | | (8,032,263 | ) | | | (4,529,324 | ) |
| Net unrealized depreciation on investments | | $ | (7,104,465 | ) | | $ | (4,451,072 | ) |
| | | | | | | | | |
| Tax cost of investments | | $ | 59,767,990 | | | $ | 108,069,467 | |
| OneAscent ETFs |
| Notes to the Financial Statements (continued) |
| August 31, 2022 |
| |
The tax character of distributions paid for the fiscal period ended August 31, 2022 were as follows:
| | | Large Cap | | | Core Plus | |
| | | Core ETF | | | Bond ETF | |
| | | 2022 | | | 2022 | |
| Distributions paid from: | | | | | | | | |
| Ordinary income(a) | | $ | 33,250 | | | $ | 817,625 | |
| Total distributions paid | | $ | 33,250 | | | $ | 817,625 | |
| | | | | | | | | |
At August 31, 2022, the components of accumulated earnings (deficit) on a tax basis were as follows:
| | | Large Cap | | | Core Plus Bond | |
| | | Core ETF | | | ETF | |
| Undistributed ordinary income | | $ | 80,978 | | | $ | 309,935 | |
| Distributions payable | | | — | | | | (256,950 | ) |
| Accumulated capital and other losses | | | (4,634,577 | ) | | | (1,700,946 | ) |
| Unrealized depreciation on investments | | | (7,104,465 | ) | | | (4,451,072 | ) |
| Total accumulated deficits | | $ | (11,658,064 | ) | | $ | (6,099,033 | ) |
| | | | | | | | | |
As of August 31, 2022, the Core Plus Bond ETF had short-term capital loss carryforwards available to offset future gains and not subject to expiration in the amount of $1,700,946.
Under current tax law, net investment losses after December 31 and capital losses realized after October 31 of the Fund’s fiscal year may be deferred and treated as occurring on the first business day of the following fiscal year for tax purposes. For the fiscal year ended August 31, 2022, the Large Cap Core ETF deferred Post-October capital losses of $4,634,577.
NOTE 8. SECTOR RISK
If a Fund has significant investments in the securities of issuers within a particular sector, any development affecting that sector will have a greater impact on the value of the net assets of the Fund than would be the case if the Fund did not have significant investments in that sector. In addition, this may increase the risk of loss in the Fund and increase the volatility of the Fund’s NAV per share. For instance, economic or market factors, regulatory changes or other developments may negatively impact all companies in a particular sector, and therefore the value of the Fund’s portfolio will be adversely affected. As of August 31, 2022, the Large Cap Core ETF had 32.20% of the value of its net assets invested in securities within the Technology sector.
| OneAscent ETFs |
| Notes to the Financial Statements (continued) |
| August 31, 2022 |
| |
NOTE 9. COMMITMENTS AND CONTINGENCIES
The Trust indemnifies its officers and Trustees for certain liabilities that may arise from their performance of their duties to the Trust or the Funds. Additionally, in the normal course of business, the Trust enters into contracts that contain a variety of representations and warranties which provide general indemnifications. The Trust’s maximum exposure under these arrangements is unknown, as this would involve future claims that may be made against the Trust that have not yet occurred.
NOTE 10. SUBSEQUENT EVENTS
Management of the Funds has evaluated the need for disclosures and/or adjustments resulting from subsequent events through the date at which these financial statements were issued. Based upon this evaluation, management has determined there were no items requiring adjustment of the financial statements or additional disclosure.
| Report of Independent Registered Public Accounting Firm |
| |
To the Shareholders of OneAscent ETFs and
Board of Trustees of Unified Series Trust
Opinion on the Financial Statements
We have audited the accompanying statements of assets and liabilities, including the schedules of investments, of OneAscent Investments, comprising the funds listed below (the “Funds”) as of August 31, 2022, the related statements of operations, the statements of changes in net assets, the related notes, and the financial highlights for each of the periods indicated below (collectively referred to as the “financial statements”). In our opinion, the financial statements present fairly, in all material respects, the financial position of each of the Funds as of August 31, 2022, the results of their operations, the changes in net assets, and the financial highlights for each of the periods indicated below in conformity with accounting principles generally accepted in the United States of America.
| | | Statements of | |
| | Statements of | Changes in Net | Financial |
| Fund Name | Operations | Assets | Highlights |
| OneAscent Large Cap Core ETF | For the period from November 15, 2021 (commencement of operations) through August 31, 2022 |
| | |
| OneAscent Core Plus Bond ETF | For the period from March 30, 2022 (commencement of operations) through August 31, 2022 |
| | |
Basis for Opinion
These financial statements are the responsibility of the Funds’ management. Our responsibility is to express an opinion on the Funds’ financial statements based on our audits. We are a public accounting firm registered with the Public Company Accounting Oversight Board (United States) (“PCAOB”) and are required to be independent with respect to the Funds in accordance with the U.S. federal securities laws and the applicable rules and regulations of the Securities and Exchange Commission and the PCAOB.
We conducted our audits in accordance with the standards of the PCAOB. Those standards require that we plan and perform the audit to obtain reasonable assurance about whether the financial statements are free of material misstatement whether due to error or fraud.
Our audits included performing procedures to assess the risks of material misstatement of the financial statements, whether due to error or fraud, and performing procedures that respond to those risks. Such procedures included examining, on a test basis, evidence regarding the amounts and disclosures in the financial statements. Our procedures included confirmation of securities owned as of August 31, 2022, by correspondence with the custodian and brokers. Our audits also included evaluating the accounting principles used and significant estimates made by management, as well as evaluating the overall presentation of the financial statements. We believe that our audits provide a reasonable basis for our opinion.
We have served as the Funds’ auditor since 2022.
COHEN & COMPANY, LTD.
Chicago, Illinois
October 28, 2022
| Liquidity Risk Management Program (Unaudited) |
| |
The Funds have adopted and implemented a written liquidity risk management program (the “Program”) as required by Rule 22e-4 (the “Liquidity Rule”) under the 1940 Act. The Program is reasonably designed to assess and manage the Funds’ liquidity risk, taking into consideration, among other factors, each Fund’s investment strategy and the liquidity of its portfolio investments during normal and reasonably foreseeable stressed conditions; its short and long- term cash flow projections; and its cash holdings and access to other funding sources. The Board approved the appointment of the Liquidity Administrator Committee, comprising certain Trust officers and employees of the Adviser. The Liquidity Administrator Committee maintains Program oversight and reports to the Board on at least an annual basis regarding the Program’s operational effectiveness through a written report (the “Report”). The Program’s most recent report, which was presented to the Board for consideration at its meeting held on August 15-16, 2022, outlined the operation of the Program and the adequacy and effectiveness of the Program’s implementation. During the review period, the Funds did not experience unusual stress or disruption to their operations related to purchase and redemption activity. Also, during the review period the Funds held adequate levels of cash and highly liquid investments to meet shareholder redemption activities in accordance with applicable requirements. The Report concluded that the Program is reasonably designed to prevent violation of the Liquidity Rule and has been effectively implemented.
| Summary of Fund Expenses (Unaudited) |
| |
As a shareholder of a Fund, you incur two types of costs: (1) transaction and (2) ongoing costs, including management fees and other Fund expenses. These examples are intended to help you understand your ongoing costs (in dollars) of investing in each Fund and to compare these costs with the ongoing costs of investing in other mutual funds. You may pay brokerage commissions on purchases and sales of exchange-traded fund shares, which are not reflected in the example. Each Fund’s example is based on an investment of $1,000 invested at the beginning of the period and held for the entire period from March 1, 2022 through August 31, 2022.
Actual Expenses
The first line of the table below provides information about actual account values and actual expenses. You may use the information in this line, together with the amount you invested, to estimate the expenses that you paid over the period. Simply divide your account value by $1,000 (for example, an $8,600 account value divided by $1,000 = 8.6), then multiply the result by the number in the first line under the heading “Expenses Paid During Period” to estimate the expenses you paid on your account during this period.
Hypothetical Example for Comparison Purposes
The second line of the table below provides information about hypothetical account values and hypothetical expenses based on the Fund’s actual expense ratio and an assumed rate of return of 5% per year before expenses, which is not the Fund’s actual return. The hypothetical account values and expenses may not be used to estimate the actual ending account balance or expenses you paid for the period. You may use this information to compare the ongoing costs of investing in the Fund and other funds. To do so, compare this 5% hypothetical example with the 5% hypothetical examples that appear in the shareholder reports of other funds.
Expenses shown in the table are meant to highlight your ongoing costs only and do not reflect any transactional costs. Therefore, the second line of the table below is useful in comparing ongoing costs only and will not help you determine the relative costs of owning different funds. In addition, if transaction costs were included, your costs would have been higher.
| | | Beginning | | Ending | | | | |
| | | Account | | Account | | Expenses | | |
| | | Value | | Value | | Paid | | Annualized |
| | | March 1, | | August 31, | | During | | Expense |
| | | 2022 | | 2022 | | Period(a) | | Ratio |
| OneAscent Large Cap Core ETF | | | | | | | | |
| Actual | | $1,000.00 | | $ 904.30 | | $3.91 | | 0.82% |
| Hypothetical(b) | | $1,000.00 | | $1,021.10 | | $4.15 | | 0.82% |
| | | | | | | | | |
| OneAscent Core Plus Bond ETF | | | | | | | | |
| Actual(c) | | $1,000.00 | | $ 947.70 | | $3.43 | | 0.83% |
| Hypothetical(b) | | $1,000.00 | | $1,021.00 | | $4.25 | | 0.83% |
| | | | | | | | | |
| (a) | Expenses are equal to the Fund’s annualized expense ratios, multiplied by the average account value over the period, multiplied by 184/365 (to reflect the one-half year period). |
| (b) | Hypothetical assumes 5% annual return before expenses. |
| (c) | Actual expenses are equal to the Fund’s annualized expense ratios, multiplied by the average account value over the period, multiplied by 154/365 (to reflect the period since commencement of operations on March 30, 2022). |
| Shareholder Voting Results (Unaudited) |
| |
At a Special Shareholder Meeting at which a quorum was present, held on September 6, 2022, Fund shareholders of record as of the close of business on July 5, 2022 voted to approve the following proposal:
Proposal 1: To elect the following individuals to serve on the Board of Trustees of the Trust:
| Freddie Jacobs Jr. |
| Catharine Barrow McGauley |
| Kenneth G.Y. Grant |
| Daniel J. Condon |
| Gary A. Hippenstiel |
| Stephen A. Little |
| Ronald C. Tritschler |
| David R. Carson |
| | | Shares Voted in | | Shares Voted | | Shares Needed to |
| Fund | | Favor* | | Against or Abstain* | | Approve* |
| OneAscent Large Cap Core ETF | | 1,2723,929 | | 1,095 | | Plurality |
| | | (99.94%) | | (0.06%) | | (greater than 50%) |
| | | | | | | |
| OneAscent Core Plus Bond ETF | | 2,816,939 | | 4,637 | | Plurality |
| | | (99.84%) | | (0.16%) | | (greater than 50%) |
| | | | | | | |
| * | as a percentage of the total voting securities of the Fund voted at the meeting at which a quorum was present |
| Additional Federal Income Tax Information (Unaudited) |
| |
The Form 1099-DIV you receive in January 2023 will show the tax status of all distributions paid to your account in calendar year 2022. Shareholders are advised to consult their own tax adviser with respect to the tax consequences of their investment in the Funds. As required by the Internal Revenue Code and/or regulations, shareholders must be notified regarding the status of qualified dividend income for individuals and the dividends received deduction for corporations.
Qualified Dividend Income. The Funds designate the following percentage or up to the maximum amount of such dividends allowable pursuant to the Internal Revenue Code, as qualified dividend income eligible for the reduced tax rate.
| | | Large Cap Core | | Core Plus Bond |
| | | ETF | | ETF |
| Qualified Dividend Income | | 100% | | 0% |
| | | | | |
Qualified Business Income. The Funds designate the following percentage of ordinary income dividends, or up to the maximum amount of such dividends allowable pursuant to the Internal Revenue Code, as qualified business income.
| | | Large Cap Core | | Core Plus Bond |
| | | ETF | | ETF |
| Qualified Business Income | | 0% | | 0% |
| | | | | |
Dividends Received Deduction. Corporate shareholders are generally entitled to take the dividends received deduction on the portion of the Funds’ dividend distribution that qualifies under tax law. For the Funds’ calendar year 2019 ordinary income dividends, the following percentage qualifies for the corporate dividends received deduction.
| | | Large Cap Core | | Core Plus Bond |
| | | ETF | | ETF |
| Dividends Received Deduction | | 100% | | 0% |
| | | | | |
The Funds designate the following amounts as long-term capital gains distributions. The amounts designated may not agree with long-term capital gains in the tax character of distribution table due to utilization of earnings and profits distributed to shareholders on redemption of shares.
| | | Large Cap Core | | | Core Plus Bond | |
| | | ETF | | | ETF | |
| Long-Term Capital Gains Distributions | | $ | — | | | $ | — | |
| Trustees and Officers (Unaudited) |
GENERAL QUALIFICATIONS. The Board supervises the business activities of the Trust. Each Trustee serves as a trustee until termination of the Trust unless the Trustee dies, resigns, retires, or is removed. The Chairman of the Board and more than 75% of the Trustees are “Independent Trustees,” which means that they are not “interested persons” (as defined in the 1940 Act) of the Trust or any adviser, sub-adviser or distributor of the Trust.
The following table provides information regarding the Independent Trustees.
Name, Address*, (Year of Birth),
Position with Trust**,
Term of Position with Trust | Principal Occupation During Past 5 Years and Other
Directorships |
Daniel J. Condon (1950)
Chairman, May 2022 to present; Chairman of the Audit Committee; Chairman of the Governance & Nominating Committee, May 2020 to May 2022; Independent Trustee, December 2002 to present | Current: Retired (2017 - present); Trustee, Peak Income Plus Fund (2022 – present). |
Kenneth G.Y. Grant (1949)
Chairman of the Governance & Nominating Committee, May 2022 to present; Chairman, January 2017 to May 2022; Independent Trustee, May 2008 to present | Current: Director, Standpoint Multi-Asset (Cayman) Fund, Ltd. (2019 – present); Director, Advisors Charitable Gift Fund (2020 - present), a Donor Advised Fund; Trustee, Peak Income Plus Fund (2022 – present). Previous: EVP, Benefit Plans Administrative Services, Inc., provider of retirement benefit plans administration (2019 – 2020); Director, Northeast Retirement Services (NRS) LLC, a transfer agent and fund administrator; and Director, Global Trust Company (GTC), a non-depository trust company sponsoring private investment product (2003 – 2019); EVP, NRS (2003 – 2019); GTC, EVP (2008 – 2019); EVP, Savings Banks Retirement Association (2003 – 2019), provider of qualified retirement benefit plans. |
Gary E. Hippenstiel (1947)
Chairman of the Pricing & Liquidity Committee; Independent Trustee, December 2002 to present | Current: President and founder of Hippenstiel Investment Counsel LLC (“Hippenstiel”) since 2008. Hippenstiel was registered as an investment adviser from 2008 to December 31, 2019; Trustee, Peak Income Plus Fund (2022 – present). |
Stephen A. Little (1946)
Independent Trustee, December 2002 to present; Chairman, December 2004 to December 2016 | Current: President and founder of The Rose, Inc., a registered investment adviser, since 1993; Trustee, Peak Income Plus Fund (2022 – present). |
| Trustees and Officers (Unaudited) (continued) |
Ronald C. Tritschler (1952)
Chairman of the Audit Committee, May 2022 to present; Independent Trustee, January 2007 to present; Interested Trustee, December 2002 to December 2006 | Current: Chief Executive Officer, Director and Legal Counsel of The Webb Companies, a national real estate company, since 2001; Director, Standpoint Multi-Asset (Cayman) Fund, Ltd. (2020 – present); Director of First State Bank of the Southeast (2000 - present);Trustee, Peak Income Plus Fund (2022 – present). |
Catharine B. McGauley (1977)
Independent Trustee, September 2022 to present | Current: Lead Portfolio Manager of Atlantic Charter Insurance, a workers’ compensation insurer, since 2010; Investment Councilor of a Family Office (2015 – present); Senior Analyst/Advisor for a Boston real estate company and related family (2010 – present); Trustee, Peak Income Plus Fund (2002 – present). |
Freddie Jacobs, Jr. (1970)
Independent Trustee, September 2022 to present | Current: Chief Operating Officer and Chief Risk Officer Northeast Retirement Services (NRS) LLC, a transfer agent and fund administrator; and Director, Global Trust Company (GTC), a non-depository trust company sponsoring private investment product (2021- present); Trustee of Buckingham Browne & Nichols (BBN) (2018 – present); Chair of the Finance Committee, BBN (2020 – present); Chairman Board of Directors of Crispus Attucks Fund (2020– present); Board Member and Treasurer of New England Tennis Association (2017 –present); Board Member of Camp Harbor View (2020 – present); Trustee, Peak Income Plus Fund (2002 – present). Previous: SVP, Senior Risk Officer NRS (2013 – 2019). |
| * | The address for each Trustee is 225 Pictoria Drive, Suite 450, Cincinnati, Ohio 45246. |
| ** | As of the date of this report, the Trust consists of 31 series. |
The following table provides information regarding the Interested Trustees and Officers of the Trust.
Name, Address*, (Year of Birth),
Position with Trust,
Term of Position with Trust | Principal Occupation During Past 5 Years and Other
Directorships |
David R. Carson (1958) President, January 2016 to August 2021; Interested Trustee, August 2020 to present | Current: Senior Vice President Client Strategies of Ultimus Fund Solutions, LLC, since 2013; Interested Trustee of Ultimus Managers Trust, since 2020; Trustee, Peak Income Plus Fund (2022 – present). |
| Trustees and Officers (Unaudited) (continued) |
Martin R. Dean (1963)
President, August 2021 to present; Vice President, November 2020 to August 2021; Chief Compliance Officer, April 2021 to August 2021; Assistant Chief Compliance Officer, January 2016 to April 2021 | Current: Senior Vice President, Head of Fund Compliance of Ultimus Fund Solutions, LLC, since 2016. |
Zachary P. Richmond (1980)
Treasurer and Chief Financial Officer, November 2014 to present | Current: Vice President, Director of Financial Administration for Ultimus Fund Solutions, LLC, since 2015. |
Gweneth K. Gosselink (1955)
Chief Compliance Officer, August 2021 to present | Current: Assistant Vice President, Senior Compliance Officer of Ultimus Fund Solutions, LLC, since 2019. Previous: Chief Operating Officer & CCO at Miles Capital, Inc. (2013 – 2019). |
Elisabeth Dahl (1962)
Secretary, May 2017 to present; Assistant Secretary, March 2016 to May 2017 | Current: Attorney, Ultimus Fund Solutions, LLC since March 2016. |
Stephen Preston (1966)
AML Compliance Officer, May 2017 to present | Current: Vice President and Chief Compliance Officer, Ultimus Fund Solutions, LLC and Ultimus Fund Distributors, LLC, since 2011. |
Lynn E. Wood (1946)
Assistant Chief Compliance Officer, April 2021 to present; Chief Compliance Officer, October 2004 to April 2021 | Current: Managing Member, Buttonwood Compliance Partners, LLC, since 2013. |
| * | The address for each Officer is 225 Pictoria Drive, Suite 450, Cincinnati, Ohio 45246. |
| Other Information (Unaudited) |
The Funds’ Statement of Additional Information (“SAI”) includes additional information about the trustees and is available without charge, upon request. You may call toll-free at (800) 222-8274 to request a copy of the SAI or to make shareholder inquiries.
| Investment Advisory Agreement Approval (Unaudited) |
The OneAscent Core Plus Bond ETF (the “Fund”) is a series of Unified Series Trust (the “Trust”). The Trust’s Board of Trustees (the “Board” or “Trustees”) oversees the management of the Fund and, as required by law, considered the approval of the Fund’s management agreement with its investment adviser, OneAscent Investment Solutions, LLC (“OneAscent”) and OneAscent’s sub-advisory agreement with Teachers Advisors, LLC (“TAL”). The Board approved the management agreement and the sub-advisory agreement.
The Board requested and evaluated all information that the Trustees deemed reasonably necessary under the circumstances in connection with the approval of the management agreement and the sub-advisory agreement.
The Trustees met at a special meeting in December 2021 to review and discuss materials compiled by Ultimus Fund Solutions, LLC, the Trust’s administrator, with regard to the management agreement between the Trust and OneAscent and the sub-advisory agreement between OneAscent and TAL. At the special meeting, the Board interviewed certain executives of OneAscent, including OneAscent’s Vice President, Director of Portfolio Strategy and Chief Compliance Officer. The Board also interviewed certain executives of TAL. After discussion, the Trustees, including the Trustees who are not “interested persons” (as that term is defined in the Investment Company Act of 1940) of the Trust, OneAscent or TAL (the “Independent Trustees”), approved the management agreement between the Trust and OneAscent and the sub-advisory agreement between OneAscent and TAL, each for an initial period of two years. The Trustees’ approval of the Fund’s management agreement and sub-advisory agreement was based on a consideration of all the information provided to the Trustees, and was not the result of any single factor. Some of the factors that figured particularly in the Trustees’ deliberations are described below, although individual Trustees may have evaluated this information differently, ascribing different weights to various factors.
(i) The Nature, Extent, and Quality of Services. The Trustees reviewed and considered information regarding the nature, extent, and quality of services that each of OneAscent and TAL would provide to the Fund, which include, but are not limited to, providing a continuous investment program for the Fund, adhering to the Fund’s investment restrictions, complying with the Trust’s policies and procedures, and voting proxies on behalf of the Fund. The Trustees considered the qualifications and experience of TAL’s portfolio managers who would be responsible for the day-to-day management of the Fund’s portfolio, as well as the qualifications and experience of the other individuals at OneAscent and TAL who would provide services to the Fund. They discussed OneAscent’s and TAL’s value-based investment strategy, how any screens are applied with respect to the Fund, and the self-discipline associated with such impact investing. The Trustees discussed and reviewed OneAscent’s compliance program and its compliance policies and procedures with respect to regulatory requirements for ETFs, and Ms. Gosselink and Mr. Wood provided assurances regarding their continuing review and oversight with respect to adoption of appropriate compliance policies. They further discussed OneAscent’s financial position and its commitment with respect to supporting the expense reimbursement and fee waiver commitments to the Fund. After a thorough discussion and consideration, the Trustees concluded that OneAscent and TAL both have adequate resources to provide satisfactory investment management services to the proposed Fund.
(ii) Fund Performance. The Trustees next reviewed and discussed the performance of separate accounts that have an investment strategy similar to that of the proposed Fund and which is managed by key personnel of TAL and its affiliates who will also manage the Fund. The Trustees once again considered OneAscent and TAL’s values-based investment strategy. It was the consensus
| Investment Advisory Agreement Approval (Unaudited) (continued) |
of the Trustees that it was reasonable to conclude that OneAscent and TAL have the ability to manage the proposed Fund successfully from a performance standpoint.
(iii) Fee Rate and Profitability. The Trustees reviewed a fee and expense comparison for the Morningstar Intermediate Core-Plus Bond category, which indicated that the Fund’s proposed management fee is higher than the average but in line with the median for the category. The Trustees noted that the estimated net expense ratio is higher than the average and median for the category. The Trustees also considered a profitability analysis prepared by OneAscent for its management of the Fund, which indicated that, both before and after the deduction of marketing expenses, OneAscent expects to earn a profit as a result of managing the Fund in its first and second years of operations. The Trustees noted that TAL, both before and after deduction of marketing expenses, does not expect to earn a profit in the first two years of operations.
The Trustees considered other potential benefits that OneAscent or TAL may receive in connection with its management of the Fund, including third-party research obtained by soft dollars, and noted that OneAscent currently does not have soft dollar arrangements in place but may in the future. The Trustees noted that TAL does not employ the use of soft dollars. After considering the above information, the Trustees concluded that the proposed management fee and sub-advisory fee represent reasonable compensation in light of the nature and quality of the services that OneAscent and TAL propose to provide to the Fund and the fees paid by other exchange-traded funds in the same Morningstar category.
(iv) Economies of Scale. In determining the reasonableness of the management fee, the Trustees also considered the extent to which OneAscent or TAL will realize economies of scale as the Fund grows larger. The Trustees determined that, in light of the anticipated size of the Fund in its first two years of operations, it does not appear that OneAscent will realize benefits from economies of scale in managing the Fund in the near term to such an extent that breakpoints in the management fee need to be considered at this time. The Trustees also noted that the sub-advisory fee already includes breakpoints, but at a level exceeding the anticipated size of the Fund in the first two years of operations.
A description of the policies and procedures that each Fund uses to determine how to vote proxies relating to portfolio securities and information regarding how each Fund voted those proxies during the most recent twelve month period ended June 30, are available (1) without charge upon request by calling the Funds at (800) 222-8274 and (2) in Fund documents filed with the Securities and Exchange Commission (“SEC”) on the SEC’s website at www.sec.gov.
TRUSTEES Daniel J. Condon, Chairman David R. Carson Kenneth G.Y. Grant Gary E. Hippenstiel Freddie Jacobs, Jr. Stephen A. Little Catharine B. McGauley Ronald C. Tritschler | INDEPENDENT REGISTERED PUBLIC ACCOUNTING FIRM Cohen & Company, Ltd. 151 North Franklin Street, Suite 575 Chicago, IL 60606 |
| | |
OFFICERS Martin R. Dean, President GwenethK. Gosselink, Chief Compliance Officer Zachary P. Richmond, Treasurer and Chief Financial Officer Lynn E. Wood, Assistant Chief Compliance Officer | LEGAL COUNSEL Thompson Hine LLP 312 Walnut Street, 20th Floor Cincinnati, OH 45202 |
| | |
INVESTMENT ADVISER OneAscent Investment Solutions, LLC 23 Inverness Center Parkway Birmingham, AL 35242 | CUSTODIAN AND TRANSFER AGENT Brown Brothers Harriman & Co. 50 Post Office Square Boston, MA 02110 |
| | |
DISTRIBUTOR Northern Lights Distributors, LLC 4221 North 203rd Street, Suite 100 Elkhorn, NE 68022 | ADMINISTRATOR AND FUND ACCOUNTANT Ultimus Fund Solutions, LLC 225 Pictoria Drive, Suite 450 Cincinnati, OH 45246 |
This report is intended only for the information of shareholders or those who have received the Funds’ prospectus which contains information about the Funds’ management fee and expenses. Please read the prospectus carefully before investing.
Distributed by Northern Lights Distributors, LLC, Member FINRA/SIPC
ONEASENT-AR-22
Item 2. Code of Ethics.
As of the end of the period covered by this report, the registrant has adopted a code of ethics that applies to the registrant’s principal executive officer, principal financial officer, principal accounting officer or controller, or persons performing similar functions, regardless of whether these individuals are employed by the registrant or a third party. Pursuant to Item 12(a)(1), a copy of registrant’s code of ethics is filed as an exhibit to this Form N-CSR. During the period covered by this report, the code of ethics has not been amended, and the registrant has not granted any waivers, including implicit waivers, from the provisions of the code of ethics.
Item 3. Audit Committee Financial Expert.
(a) The registrant’s board of trustees has determined that the registrant does not have an audit committee financial expert. The committee members and the full Board considered a possibility of adding a member that would qualify as an expert. The audit committee determined that, although none of its members meet the technical definition of an audit committee expert, the committee has sufficient financial expertise to adequately perform its duties under the Audit Committee Charter without the addition of a qualified expert.
Item 4. Principal Accountant Fees and Services.
| Tactical Multi-Purpose Fund: | | | FY 2022 | | | $7,950 |
| | | | FY 2021 | | | $7,500 |
| | | | | | | |
| | | | | | | |
| FIIG Retirement Funds | | | FY 2022 | | | $60,600 |
| | | | FY 2021 | | | $57,200 |
| | | | | | | |
| FIIG US Small Cap Equity Fund | | | FY 2022 | | | $14,600 |
| | | | FY 2021 | | | $13,800 |
| | | | | | | |
| FIIG All Foreign Equity Environmental and | | | | | | |
| Social Values Fund | | | FY 2022 | | | $15,150 |
| | | | FY 2021 | | | $14,300 |
| | | | | | | |
| FIIG US Large Cap Equity | | | | | | |
| Environmental and Social Values Fund | | | FY 2022 | | | $14,600 |
| | | | FY 2021 | | | $13,800 |
| | | | | | | |
| OneAscent Large Cap Core ETF: | | | FY 2022 | | | $15,150 |
| | | | | | | |
| OneAscent Core Plus Bond ETF: | | | FY 2022 | | | $15,700 |
| Tactical Multi-Purpose Fund: | | | FY 2022 | | | $0 |
| | | | FY 2021 | | | $0 |
| | | | | | | |
| | | | | | | |
| FIIG Retirement Funds | | | FY 2022 | | | $0 |
| | | | FY 2021 | | | $0 |
| | | | | | | |
| FIIG US Small Cap Equity Fund | | | FY 2022 | | | $0 |
| | | | FY 2021 | | | $0 |
| FIIG All Foreign Equity Environmental and | | | |
| Social Values Fund | | FY 2022 | | | $0 |
| | | FY 2021 | | | $0 |
| | | | | | |
| FIIG US Large Cap Equity | | | | | |
| Environmental and Social Values Fund | | FY 2022 | | | $0 |
| | | FY 2021 | | | $0 |
| | | | | | |
| OneAscent Large Cap Core ETF: | | FY 2022 | | | $0 |
| | | | | | |
| OneAscent Core Plus Bond ETF: | | FY 2022 | | | $0 |
| Tactical Multi-Purpose Fund: | | | FY 2022 | | | $3,300 |
| | | | FY 2021 | | | $3,300 |
| | | | | | | |
| | | | | | | |
| FIIG Retirement Funds | | | FY 2022 | | | $13,200 |
| | | | FY 2021 | | | $13,200 |
| | | | | | | |
| FIIG US Small Cap Equity Fund | | | FY 2022 | | | $3,300 |
| | | | FY 2021 | | | $3,300 |
| | | | | | | |
| FIIG All Foreign Equity Environmental and | | | | | | |
| Social Values Fund | | | FY 2022 | | | $3,300 |
| | | | FY 2021 | | | $3,300 |
| | | | | | | |
| FIIG US Large Cap Equity | | | | | | |
| Environmental and Social Values Fund | | | FY 2022 | | | $3,300 |
| | | | FY 2021 | | | $3,300 |
| | | | | | | |
| OneAscent Large Cap Core ETF: | | | FY 2022 | | | $3,300 |
| | | | | | | |
| OneAscent Core Plus Bond ETF: | | | FY 2022 | | | $3,300 |
Nature of the fees: Preparation of the 1120 RIC and Excise review
| Tactical Multi-Purpose Fund: | | | FY 2022 | | | $0 |
| | | | FY 2021 | | | $0 |
| | | | | | | |
| | | | | | | |
| FIIG Retirement Funds | | | FY 2022 | | | $0 |
| | | | FY 2021 | | | $0 |
| | | | | | | |
| FIIG US Small Cap Equity Fund | | | FY 2022 | | | $0 |
| | | | FY 2021 | | | $0 |
| | | | | | | |
| FIIG All Foreign Equity Environmental and | | | | | | |
| Social Values Fund | | | FY 2022 | | | $0 |
| | | | FY 2021 | | | $0 |
| FIIG US Large Cap Equity | | | | |
| Environmental and Social Values Fund | | | FY 2022 | | | $0 |
| | | | FY 2021 | | | $0 |
| | | | | | | |
| OneAscent Large Cap Core ETF: | | | FY 2022 | | | $0 |
| | | | | | | |
| OneAscent Core Plus Bond ETF: | | | FY 2022 | | | $0 |
| (e) | (1) Audit Committee’s Pre-Approval Policies |
The Audit Committee Charter requires the Audit Committee to be responsible for the selection, retention or termination of auditors and, in connection therewith, to (i) evaluate the proposed fees and other compensation, if any, to be paid to the auditors, (ii) evaluate the independence of the auditors, (iii) pre-approve all audit services and, when appropriate, any non-audit services provided by the independent auditors to the Trust, (iv) pre-approve, when appropriate, any non-audit services provided by the independent auditors to the Trust's investment adviser, or any entity controlling, controlled by, or under common control with the investment adviser and that provides ongoing services to the Trust if the engagement relates directly to the operations and financial reporting of the Trust, and (v) receive the auditors’ specific representations as to their independence;
| (2) | All of the services described in paragraphs (b) through (d) of Item 4 were pre-approved by the Audit Committee. |
(f) During audit of registrant's financial statements for the most recent fiscal year, less than 50 percent of the hours expended on the principal accountant's engagement were attributed to work performed by persons other than the principal accountant's full-time, permanent employees.
(g) The aggregate non-audit fees billed by the registrant's accountant for services rendered to the registrant, and rendered to the registrant's investment adviser (not including any sub-adviser whose role is primarily portfolio management and is subcontracted with or overseen by another investment adviser), and any entity controlling, controlled by, or under common control with the adviser that provides ongoing services to the registrant:
Registrant Adviser
FY 2022 $ 0 $ 0
FY 2021 $ 0 $ 0
(h) Not applicable. The auditor performed no services for the registrant’s investment adviser or any entity controlling, controlled by, or under common control with the investment adviser that provides ongoing services to the registrant.
(i) Not applicable.
(j) Not applicable.
Item 6. Schedule of Investments. Schedule filed with Item 1.
Item 7. Disclosure of Proxy Voting Policies and Procedures for Closed-End Management Investment Companies. NOT APPLICABLE – applies to closed-end funds only
Item 8. Portfolio Managers of Closed-End Investment Companies. NOT APPLICABLE – applies to closed-end funds only
Item 9. Purchases of Equity Securities by Closed-End Management Investment Company and Affiliated Purchasers. NOT APPLICABLE – applies to closed-end funds only
Item 10. Submission of Matters to a Vote of Security Holders.
The registrant has not adopted procedures by which shareholders may recommend nominees to the registrant’s board of trustees.
Item 11. Controls and Procedures.
(a) Based on their evaluation of the registrant’s disclosure controls and procedures (as defined in Rule 30a-3(c) under the Investment Company Act of 1940, as amended (the “Act”)) as of a date within 90 days of the filing date of this report, the registrant’s principal executive officer and principal financial officer have concluded that such disclosure controls and procedures are reasonably designed and are operating effectively to ensure that material information relating to the registrant is made known to them by others within those entities, particularly during the period in which this report is being prepared, and that the information required in filings on Form N-CSR is recorded, processed, summarized, and reported on a timely basis.
(b) There were no significant changes in the registrant’s internal control over financial reporting that occurred during the period covered by this report that have materially affected, or are reasonably likely to materially affect, the registrant’s internal control over financial reporting.
Item 12. Disclosure of Securities Lending Activities for Closed-End Investment Companies.
Not Applicable.
Item 13. Exhibits.
(a) (1) Code is filed herewith
(3) Not Applicable
SIGNATURES
Pursuant to the requirements of the Securities Exchange Act of 1934 and the Investment Company Act of 1940, the registrant has duly caused this report to be signed on its behalf by the undersigned, thereunto duly authorized.
(Registrant) Unified Series Trust
By /s/ Martin R. Dean
Martin R. Dean, President
Date 11/7/2022
Pursuant to the requirements of the Securities Exchange Act of 1934 and the Investment Company Act of 1940, this report has been signed below by the following persons on behalf of the registrant and in the capacities and on the dates indicated.
By /s/ Martin R. Dean
Martin R. Dean, President
Date 11/7/2022
By /s/ Zachary P. Richmond
Zachary P. Richmond, Treasurer
Date 11/7/2022