united states
securities and exchange commission
washington, d.c. 20549
form n-csr
certified shareholder report of registered management
investment companies
Investment Company Act file number 811-21237
Unified Series Trust
(Exact name of registrant as specified in charter)
225 Pictoria Drive, Suite 450
Cincinnati, OH 45246
(Address of principal executive offices)
(Zip code)
Zachary P. Richmond
Ultimus Fund Solutions, LLC
225 Pictoria Drive. Suite 450
Cincinnati, OH 45246
(Name and address of agent for service)
Registrant's telephone number, including area code: 513-587-3400
Date of fiscal year end: 03/31
Date of reporting period: 03/31/22
Form N-CSR is to be used by management investment companies to file reports with the Commission not later than 10 days after the transmission to stockholders of any report that is required to be transmitted to stockholders under Rule 30e-1 under the Investment Company Act of 1940 (17 CFR 270.30e-1). The Commission may use the information provided on Form N-CSR in its regulatory, disclosure review, inspection and policymaking roles.
A registrant is required to disclose the information specified by Form N-CSR, and the Commission will make this information public. A registrant is not required to respond to the collection of information contained in Form N-CSR unless the Form displays a currently valid Office of Management and Budget ("OMB") control number. Please direct comments concerning the accuracy of the information collection burden estimate and any suggestions for reducing the burden to Secretary, Securities and Exchange Commission, 450 Fifth Street, NW, Washington, DC 20549-0609. The OMB has reviewed this collection of information under the clearance requirements of 44 U.S.C. § 3507.
Item 1. Reports to Stockholders.

Absolute Core Strategy ETF (ABEQ)
NYSE Arca, Inc.
Annual Report
March 31, 2022
Fund Adviser:
Absolute Investment Advisers, LLC
4 North Street, Suite 2
Hingham, MA 02043
1 -833-CORE ETF (267-3383)
| Management Discussion of Fund Performance – (Unaudited) |
For the year ended March 31, 2022, the Absolute Core Equity ETF (ABEQ) returned 14.66%. By comparison, the S&P 500 Index returned 15.65%.
Berkshire Hathaway, Pfizer, and Enbridge were the largest gainers during the period. Unilever, Comcast, and Starbucks were detractors.
ABEQ utilizes a bottoms up fundamentally driven strategy focused on a concentrated group of individual equities. Over the past year, the Fund was helped by central banks beginning the process of intervening less in financial markets allowing individual company dynamics to be more influential towards share prices.
Our view is that this may continue since the central bank has now painted itself into a corner. High consumer inflation complicates the headwinds presented by record valuations. The last time that the consumer price index (CPI), the Government’s measure of inflation, stood at 7.9% was back in 1982. However, the federal funds rate (the overnight bank lending rate) in the summer of 1982 stood at 10%. Today, the federal funds target rate is only 0.50%--the Federal Reserve has never fallen further behind the yield curve. The longer the Federal Reserve waits to raise interest rates to a level more appropriate with the current rate of inflation, the more likely it becomes forced to do so in an aggressive manner, one that may shock complacent investors. Whether it was ignorance or overconfidence, enabling the “buy the dip” mantra among investors now hinders the central bank’s ability to tighten financial conditions to levels required to address today’s rate of inflation.
Despite the obscene valuations in the overall market, today there are extraordinary bargains for the thoughtful, contrarian investor. Further, market drawdowns reward patient investors, offering opportunities to shop on sale when others panic. While one can only speculate about future market price movements, investors can remain focused on what they do control—their emotions and their actions. Or, as Benjamin Graham said, “Basically, price fluctuations have only one significant meaning for the true investor. They provide him with an opportunity to buy wisely when prices fall sharply and to sell wisely when they advance a great deal.”
| Investment Results (Unaudited) |
Average Annual Total Returns* as of March 31, 2022
| | | | | Since |
| | | | | Inception |
| | | | | January 21, |
| | | One Year | | 2020 |
| Absolute Core Strategy ETF - NAV | | 14.66% | | 9.09% |
| Absolute Core Strategy ETF - Market Price | | 14.77% | | 9.16% |
| S&P 500® Index(a) | | 15.65% | | 17.09% |
Total annual operating expenses, as disclosed in the Absolute Core Strategy ETF’s (the “Fund”) prospectus dated July 29, 2021, were 0.85% of average daily net assets (1.51% before fee waivers/ expense reimbursements by Absolute Investment Advisers, LLC (the “Adviser”)). The Adviser contractually has agreed to waive its management fee and/or reimburse expenses so that total annual Fund operating expenses, excluding portfolio transaction and other investment-related costs (including brokerage fees and commissions); taxes; borrowing costs (such as interest and dividend expenses on securities sold short); acquired fund fees and expenses; fees and expenses associated with investments in other collective investment vehicles or derivative instruments (including for example option and swap fees and expenses); any amounts payable pursuant to a distribution or service plan adopted in accordance with Rule 12b-1 under the Investment Company Act of 1940; any administrative and/or shareholder servicing fees payable pursuant to a plan adopted by the Board of Trustees; expenses incurred in connection with any merger or reorganization; extraordinary expenses (such as litigation expenses, indemnification of Trust officers and Trustees and contractual indemnification of Fund service providers); and other expenses that the Trustees agree have not been incurred in the ordinary course of the Fund’s business, do not exceed 0.85% of the Fund’s average daily net assets through July 31, 2024. This expense cap may not be terminated prior to this date except by the Board of Trustees. Each waiver/expense payment by the Adviser is subject to recoupment by the Adviser from the Fund in the three years following the date the particular waiver/expense payment occurred, but only if such recoupment can be achieved without exceeding the annual expense limitation in effect at the time of the waiver/expense payment and any expense limitation in effect at the time of the recoupment. Additional information pertaining to the Fund’s expense ratios (not including acquired fund fees and expenses) as of March 31, 2022 can be found in the financial highlights.
The performance quoted represents past performance, which does not guarantee future results. The investment return and principal value of an investment will fluctuate so that an investor’s shares, when redeemed, may be worth more or less than their original cost. The returns shown do not reflect deduction of taxes that a shareholder would pay on the Fund distributions or the redemption of Fund shares. Current performance of the Fund may be lower or higher than the performance quoted. The Fund’s investment objectives, risks, charges and expenses must be considered carefully before investing. Performance data current to the most recent month end may be obtained by calling (833) 267-3383. The Fund’s per share net asset value (“NAV”) is the value of one share of the Fund as calculated in accordance with the standard formula for valuing shares. The NAV return is based on the NAV of the Fund and the market return is based on the market price per share of the Fund. The price used to calculate market return (“Market Price”) is determined by using the midpoint between the highest bid and the lowest offer on the primary stock exchange on which the shares of the Fund are listed for trading, as of the time that the Fund’s NAV is calculated. Market Price and NAV returns assume that dividends and capital gain distributions have been reinvested in the Fund at Market Price and NAV, respectively. Since exchange-traded funds are bought and sold at prices set by the market, which can result in a premium or discount to NAV, the returns calculated using Market Price can differ from those calculated using NAV.
| Investment Results (Unaudited) (continued) |
| * | Return figures reflect any change in price per share and assume the reinvestment of all distributions. The Fund’s returns reflect any fee reductions during the applicable periods. If such fee reductions had not occurred, the quoted performance would have been lower. |
| (a) | The S&P 500 Total Return Index (“Index”) is a widely recognized unmanaged index of equity securities and is representative of a broader domestic equity market and range of securities than is found in the Fund’s portfolio. Individuals cannot invest directly in the Index; however, an individual can invest in exchange-traded funds or other investment vehicles that attempt to track the performance of a benchmark index. |
The Fund’s investment objectives, strategies, risks, charges and expenses must be considered carefully before investing. The prospectus contains this and other important information about the Fund and may be obtained by calling (833) 267-3383. Please read it carefully before investing.
The Fund is distributed by Northern Lights Distributors, LLC, member FINRA/SIPC
| Investment Results (Unaudited) (continued) |
Comparison of the Growth of a $10,000 Investment in the Absolute Core Strategy ETF and the S&P 500® Total Return Index (Unaudited)
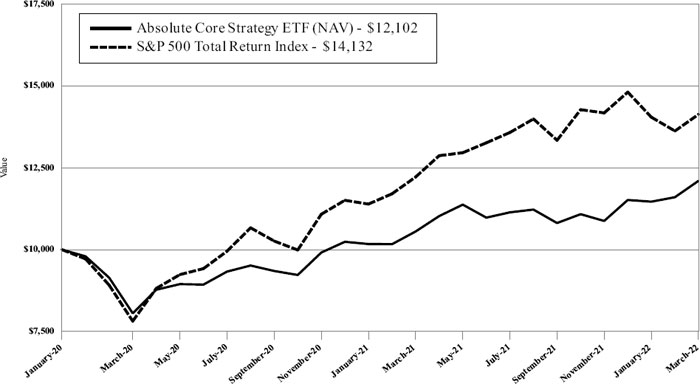
The graph shows the value of a hypothetical initial investment of $10,000 made on January 21, 2020 (commencement of operations) and held through March 31, 2022.
The S&P 500 Total Return Index is a widely recognized unmanaged index of equity prices and is representative of a broader market and range of securities than is found in the Fund’s portfolio. Individuals cannot invest directly in an index; however, an individual may invest in exchange-traded funds or other investment vehicles that attempt to track the performance of a benchmark index. THE FUND’S RETURNS REPRESENT PAST PERFORMANCE AND DO NOT GUARANTEE FUTURE RESULTS. The returns shown do not reflect deduction of taxes that a shareholder would pay on Fund distributions or the redemption of Fund shares. Investment returns and principal values will fluctuate so that your shares, when redeemed, may be worth more or less than their original purchase price.
Current performance may be lower or higher than the performance data quoted. For more information on the Fund, and to obtain performance data current to the most recent month-end, or to request a prospectus, please call (833) 267-3383. You should carefully consider the investment objectives, potential risks, management fees, and charges and expenses of the Fund before investing. The Fund’s prospectus contains this and other information about the Fund and should be read carefully before investing.
The Fund is distributed by Northern Lights Distributors, LLC, Member FINRA/SIPC.
| Fund Holdings (Unaudited) |
Absolute Core Strategy ETF Holdings as of March 31, 2022.*
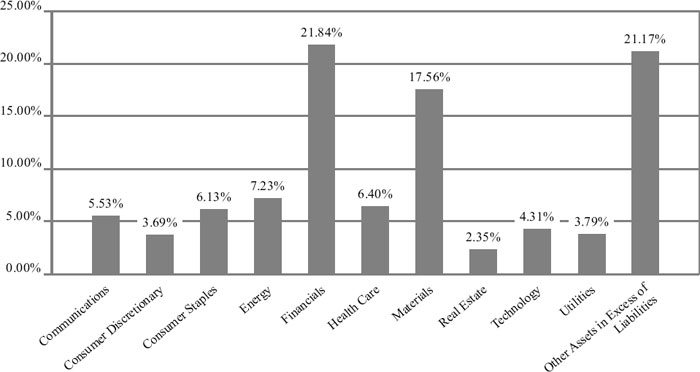
| * | As a percentage of net assets. |
As its investment objective, of the Absolute Core Strategy ETF (the “Fund”) seeks positive absolute returns.
Portfolio holdings are subject to change.
Availability of Portfolio Schedule (Unaudited)
The Fund files a complete schedule of portfolio holdings with the Securities and Exchange Commission (the “SEC”) for the first and third quarters of each fiscal year as an exhibit to its reports on Form N-PORT. The Fund’s Form N-PORT reports are available on the SEC’s website at http:// www.sec.gov or on the Fund’s website at https://absoluteadvisers.com/.
| Absolute Core Strategy ETF |
| Schedule of Investments |
| March 31, 2022 |
| Common Stocks — 78.83% | | Shares | | | Fair Value | |
| Canada — 15.08% | | | | | | | | |
| Energy — 4.89% | | | | | | | | |
| Enbridge, Inc. | | | 68,273 | | | $ | 3,146,703 | |
| | | | | | | | | |
| Materials — 10.19% | | | | | | | | |
| Agnico Eagle Mines Ltd. | | | 62,573 | | | | 3,831,971 | |
| Barrick Gold Corp. | | | 110,560 | | | | 2,712,037 | |
| | | | | | | | 6,544,008 | |
| Total Canada | | | | | | | 9,690,711 | |
| | | | | | | | | |
| Ireland — 2.82% | | | | | | | | |
| Health Care — 2.82% | | | | | | | | |
| Medtronic PLC | | | 16,342 | | | | 1,813,145 | |
| | | | | | | | | |
| Total Ireland | | | | | | | 1,813,145 | |
| | | | | | | | | |
| United Kingdom — 3.26% | | | | | | | | |
| Consumer Staples — 3.26% | | | | | | | | |
| Unilever PLC - ADR | | | 45,862 | | | | 2,089,932 | |
| | | | | | | | | |
| Total United Kingdom | | | | | | | 2,089,932 | |
| | | | | | | | | |
| United States — 57.67% | | | | | | | | |
| Communications — 5.53% | | | | | | | | |
| Comcast Corp., Class A | | | 24,610 | | | | 1,152,240 | |
| Verizon Communications, Inc. | | | 47,174 | | | | 2,403,044 | |
| | | | | | | | 3,555,284 | |
| Consumer Discretionary — 3.69% | | | | | | | | |
| Graham Holdings Co., Class B | | | 1,327 | | | | 811,421 | |
| Starbucks Corp. | | | 9,373 | | | | 852,661 | |
| TJX Cos., Inc. (The) | | | 11,693 | | | | 708,362 | |
| | | | | | | | 2,372,444 | |
| Consumer Staples — 2.87% | | | | | | | | |
| Ingredion, Inc. | | | 21,183 | | | | 1,846,098 | |
| | | | | | | | | |
| Energy — 2.34% | | | | | | | | |
| EOG Resources, Inc. | | | 12,587 | | | | 1,500,748 | |
| | | | | | | | | |
| Financials — 21.84% | | | | | | | | |
| Alleghany Corp.(a) | | | 2,422 | | | | 2,051,434 | |
| Berkshire Hathaway, Inc., Class B(a) | | | 17,802 | | | | 6,282,505 | |
| Loews Corp. | | | 53,494 | | | | 3,467,481 | |
| Travelers Cos., Inc. (The) | | | 12,177 | | | | 2,225,103 | |
| | | | | | | | 14,026,523 | |
| Health Care — 3.58% | | | | | | | | |
| Merck & Co., Inc. | | | 28,045 | | | | 2,301,092 | |
| | | | | | | | | |
| Materials — 7.37% | | | | | | | | |
| Corteva, Inc. | | | 39,966 | | | | 2,297,246 | |
| DuPont de Nemours, Inc. | | | 33,158 | | | | 2,439,765 | |
| | | | | | | | 4,737,011 | |
| Real Estate — 2.35% | | | | | | | | |
| Equity Commonwealth(a) | | | 25,908 | | | | 730,865 | |
See accompanying notes which are an integral part of these financial statements.
| Absolute Core Strategy ETF |
| Schedule of Investments (continued) |
| March 31, 2022 |
| Common Stocks — 78.83% (continued) | | Shares | | | Fair Value | |
| United States — 57.67% (continued) | | | | | | | | |
| Real Estate — 2.35% - continued | | | | | | | | |
| Jones Lang LaSalle, Inc.(a) | | | 3,243 | | | $ | 776,568 | |
| | | | | | | | 1,507,433 | |
| Technology — 4.31% | | | | | | | | |
| Cisco Systems, Inc. | | | 33,207 | | | | 1,851,622 | |
| Guidewire Software, Inc.(a) | | | 9,676 | | | | 915,543 | |
| | | | | | | | 2,767,165 | |
| Utilities — 3.79% | | | | | | | | |
| Dominion Energy, Inc. | | | 28,627 | | | | 2,432,436 | |
| Total United States | | | | | | | 37,046,234 | |
| | | | | | | | | |
| Total Common Stocks/Investments — 78.83% (Cost $41,643,274) | | | | | | | 50,640,022 | |
| Other Assets in Excess of Liabilities — 21.17% | | | | | | | 13,603,372 | |
| Net Assets — 100.00% | | | | | | $ | 64,243,394 | |
| (a) | Non-income producing security. |
ADR - American Depositary Receipt.
See accompanying notes which are an integral part of these financial statements.
Absolute Core Strategy ETF Statement of Assets and Liabilities |
| March 31, 2022 |
| Assets | | | | |
| Investments in securities, at fair value (cost $41,643,274) | | $ | 50,640,022 | |
| Cash | | | 11,774,140 | |
| Receivable for fund shares sold | | | 753,880 | |
| Receivable for investments sold | | | 1,625,067 | |
| Dividends receivable | | | 48,064 | |
| Tax reclaims receivable | | | 51,891 | |
| Prepaid expenses | | | 2,766 | |
| Total Assets | | | 64,895,830 | |
| Liabilities | | | | |
| Payable for investments purchased | | | 590,089 | |
| Payable to Adviser, net of waiver | | | 23,929 | |
| Payable to affiliates | | | 13,417 | |
| Other accrued expenses | | | 25,001 | |
| Total Liabilities | | | 652,436 | |
| Net Assets | | $ | 64,243,394 | |
| Net Assets consist of: | | | | |
| Paid-in capital | | $ | 55,516,798 | |
| Accumulated earnings | | | 8,726,596 | |
| Net Assets | | $ | 64,243,394 | |
| Shares outstanding (unlimited number of shares authorized, no par value) | | | 2,150,000 | |
| Net asset value per share | | $ | 29.88 | |
See accompanying notes which are an integral part of these financial statements.
| Absolute Core Strategy ETF |
| Statement of Operations |
| For the year ended March 31, 2022 |
| Investment Income | | | |
| Dividend income (net of foreign taxes withheld of $39,535) | | $ | 896,865 | |
| Total investment income | | | 896,865 | |
| Expenses | | | | |
| Adviser | | | 447,938 | |
| Administration | | | 53,004 | |
| Compliance services | | | 27,048 | |
| Legal | | | 24,032 | |
| Audit and tax | | | 18,607 | |
| Custodian | | | 18,387 | |
| Trustee | | | 14,463 | |
| Report printing | | | 9,526 | |
| Transfer agent | | | 7,657 | |
| Insurance | | | 2,143 | |
| Pricing | | | 661 | |
| Miscellaneous | | | 30,724 | |
| Total expenses | | | 654,190 | |
| Fees waived by Adviser | | | (205,812 | ) |
| Net operating expenses | | | 448,378 | |
| Net investment income | | | 448,487 | |
| | | | | |
| Net Realized and Change in Unrealized Gain (Loss) on Investments | | | | |
| Net realized gain (loss) on: | | | | |
| Investment securities | | | 2,774,737 | |
| Foreign currency translations | | | (741 | ) |
| Change in unrealized appreciation on: | | | | |
| Investment securities | | | 4,112,356 | |
| Foreign currency translations | | | 137 | |
| Net realized and unrealized gain (loss) on investment securities and foreign currency translations | | | 6,886,489 | |
| Net increase in net assets resulting from operations | | $ | 7,334,976 | |
See accompanying notes which are an integral part of these financial statements.
| Absolute Core Strategy ETF |
| Statements of Changes in Net Assets |
| | | For the Year | | | For the Year | |
| | | Ended March 31, | | | Ended March 31, | |
| | | 2022 | | | 2021 | |
| Increase (Decrease) in Net Assets due to: | | | | | | | | |
| Operations | | | | | | | | |
| Net investment income | | $ | 448,487 | | | $ | 188,643 | |
| Net realized gain on investment securities and foreign currency translations | | | 2,773,996 | | | | 985,128 | |
| Change in unrealized appreciation on investment securities | | | 4,112,493 | | | | 7,054,715 | |
| Net increase in net assets resulting from operations | | | 7,334,976 | | | | 8,228,486 | |
| Distributions to Shareholders From: | | | | | | | | |
| Earnings | | | (329,315 | ) | | | (212,839 | ) |
| Total distributions | | | (329,315 | ) | | | (212,839 | ) |
| | | | | | | | | |
| Capital Transactions | | | | | | | | |
| Proceeds from shares sold | | | 20,651,378 | | | | 21,233,292 | |
| Amount paid for shares redeemed | | | (9,300,348 | ) | | | (5,513,094 | ) |
| Net increase in net assets resulting from capital transactions | | | 11,351,030 | | | | 15,720,198 | |
| Total Increase in Net Assets | | | 18,356,691 | | | | 23,735,845 | |
| | | | | | | | | |
| Net Assets | | | | | | | | |
| Beginning of year | | $ | 45,886,703 | | | $ | 22,150,858 | |
| End of year | | $ | 64,243,394 | | | $ | 45,886,703 | |
| | | | | | | | | |
| Share Transactions | | | | | | | | |
| Shares sold | | | 725,000 | | | | 875,000 | |
| Shares redeemed | | | (325,000 | ) | | | (225,000 | ) |
| Net increase in shares outstanding | | | 400,000 | | | | 650,000 | |
See accompanying notes which are an integral part of these financial statements.
| Absolute Core Strategy ETF |
| Financial Highlights |
| (For a share outstanding during each period) |
| | | For the | | | For the | | | For the | |
| | | Year | | | Year | | | Period | |
| | | Ended | | | Ended | | | Ended | |
| | | March 31, | | | March 31, | | | March 31, | |
| | | 2022 | | | 2021 | | | 2020(a) | |
| Selected Per Share Data: | | | | | | | | | | | | |
| Net asset value, beginning of period | | $ | 26.22 | | | $ | 20.14 | | | $ | 25.00 | |
| Investment operations: | | | | | | | | | | | | |
| Net investment income | | | 0.22 | | | | 0.13 | | | | 0.03 | |
| Net realized and unrealized gain (loss) on investments | | | 3.61 | | | | 6.10 | | | | (4.89 | ) |
| Total from investment operations | | | 3.83 | | | | 6.23 | | | | (4.86 | ) |
| Less distributions to shareholders from: | | | | | | | | | | | | |
| Net investment income | | | (0.17 | ) | | | (0.15 | ) | | | — | |
| Total distributions | | | (0.17 | ) | | | (0.15 | ) | | | — | |
| Net asset value, end of period | | $ | 29.88 | | | $ | 26.22 | | | $ | 20.14 | |
| Market price, end of period | | $ | 29.92 | | | $ | 26.23 | | | $ | 20.21 | |
| | | | | | | | | | | | | |
| Total Return(b) | | | 14.66 | % | | | 31.02 | % | | | (19.44 | )% (c) |
| | | | | | | | | | | | | |
| Ratios and Supplemental Data: | | | | | | | | | | | | |
| Net assets, end of period (000 omitted) | | $ | 64,243 | | | $ | 45,887 | | | $ | 22,151 | |
| Ratio of net expenses to average net assets | | | 0.85 | % | | | 0.85 | % | | | 0.85 | % (d) |
| Ratio of expenses to average net assets before waiver and reimbursement | | | 1.24 | % | | | 1.51 | % | | | 3.88 | % (d) |
| Ratio of net investment income to average net assets | | | 0.85 | % | | | 0.58 | % | | | 1.40 | % (d) |
| Portfolio turnover rate(e) | | | 23 | % | | | 36 | % | | | 30 | % (c) |
| (a) | For the period January 21, 2020 (commencement of operations) to March 31, 2020. |
| (b) | Total return is calculated assuming a purchase of shares at net asset value on the first day and a sale at net asset value on the last day of the period. Distributions are assumed, for the purpose of this calculation, to be reinvested at the ex-dividend date net asset value per share on their respective payment dates. |
| (e) | Portfolio turnover rate excludes securities received or delivered from in-kind processing of creations or redemptions. |
See accompanying notes which are an integral part of these financial statements.
| Absolute Core Strategy ETF |
| Notes to the Financial Statements |
| March 31, 2022 |
NOTE 1. ORGANIZATION
Absolute Core Strategy ETF (the “Fund”) is registered under the Investment Company Act of 1940, as amended (“1940 Act”), as a non-diversified series of Unified Series Trust (the “Trust”) on August 20, 2019. The Trust is an open-end investment company established under the laws of Ohio by an Agreement and Declaration of Trust dated October 14, 2002, as amended from time to time (the “Trust Agreement”). The Trust Agreement permits the Board of Trustees of the Trust (the “Board”) to issue an unlimited number of shares of beneficial interest of separate series. The Fund is one of a series of funds currently authorized by the Board. The Fund’s investment adviser is Absolute Investment Advisers LLC (the “Adviser”). The Adviser has retained St. James Investment Company, LLC (the “Sub-Adviser”) to serve as Sub-Adviser to the Fund. As its investment objective, the Fund seeks positive absolute returns.
Non-Diversification Risk – The Fund is non-diversified, which means it may invest a greater percentage of its assets in a fewer number of stocks as compared to other mutual funds that are more broadly diversified. As a result, the Fund’s share price may be more volatile than the share price of some other mutual funds, and the poor performance of an individual stock in the Fund’s portfolio may have a significant negative impact on the Fund’s performance.
NOTE 2. SIGNIFICANT ACCOUNTING POLICIES
The Fund is an investment company and follows accounting and reporting guidance under Financial Accounting Standards Board Accounting Standards Codification (“ASC”) Topic 946, “Financial Services-Investment Companies”, including Accounting Standards Update 2013-08. The following is a summary of significant accounting policies followed by the Fund in the preparation of its financial statements. These policies are in conformity with generally accepted accounting principles in the United States of America (“GAAP”).
Estimates – The preparation of financial statements in conformity with GAAP requires management to make estimates and assumptions that affect the reported amounts of assets and liabilities and disclosure of contingent assets and liabilities at the date of the financial statements and the reported amounts of increases and decreases in net assets from operations during the reporting period. Actual results could differ from those estimates.
Foreign Currency Translation – The accounting records of the Fund are maintained in U.S. dollars. Foreign currency amounts are translated into U.S. dollars at the current rate of exchange each business day to determine the value of investments, and other assets and liabilities. Purchases and sales of foreign securities, and income and expenses, are translated at the prevailing rate of exchange on the respective date of these transactions. The Fund does not isolate that portion of the results of operations resulting from changes
| Absolute Core Strategy ETF |
| Notes to the Financial Statements (continued) |
| March 31, 2022 |
in foreign exchange rates on investments from fluctuation arising from changes in market prices of securities held. These fluctuations are included with the realized and unrealized gain or loss from investments. Net realized gain (loss) on foreign currency translations on the Statement of Operations represents currency gains (losses) realized between the trade and settlement dates on securities transactions, and the difference between the amount of investment income and foreign withholding taxes recorded on the Fund’s books and the U.S. dollar equivalent amounts actually received or paid. The change in unrealized currency gains (losses) on foreign currency translations for the period is reflected in the Statement of Operations.
Federal Income Taxes – The Fund makes no provision for federal income or excise tax. The Fund has qualified and intends to qualify each year as a regulated investment company (“RIC”) under subchapter M of the Internal Revenue Code of 1986, as amended, by complying with the requirements applicable to RICs and by distributing substantially all of its taxable income. The Fund also intends to distribute sufficient net investment income and net realized capital gains, if any, so that it will not be subject to excise tax on undistributed income and gains. If the required amount of net investment income or gains is not distributed, the Fund could incur a tax expense.
As of and during the fiscal year ended March 31, 2022, the Fund did not have any liabilities for any unrecognized tax benefits. The Fund recognizes interest and penalties, if any, related to unrecognized tax benefits as income tax expense in the Statement of Operations when incurred. During the year, the Fund did not incur any interest or penalties. Management of the Fund has reviewed tax positions taken in tax years that remain subject to examination by all major tax jurisdictions, including federal (i.e., the previous three years tax year ends and the interim tax period since then, as applicable) and has concluded that no provision for unrecognized tax benefits or expenses is required in these financial statements and does not expect this to change over the next twelve months.
Expenses – Expenses incurred by the Trust that do not relate to a specific fund of the Trust are allocated to the individual funds based on each fund’s relative net assets or another appropriate basis (as determined by the Board).
Security Transactions and Related Income – The Fund follows industry practice and records security transactions on the trade date for financial reporting purposes. The specific identification method is used for determining gains or losses for financial statements and income tax purposes. Dividend income is recorded on the ex-dividend date and interest income is recorded on an accrual basis. Distributions received from investments in real estate investment trusts (“REITs”) that represent a return of capital or capital gain are recorded as a reduction of the cost of investment or as a realized gain, respectively. The calendar year-end amounts of ordinary income, capital gains, and return of capital
| Absolute Core Strategy ETF |
| Notes to the Financial Statements (continued) |
| March 31, 2022 |
included in distributions received from the Fund’s investments in REITs are reported to the Fund after the end of the calendar year; accordingly, the Fund estimates these amounts for accounting purposes until the characterization of REIT distributions is reported. Estimates are based on the most recent REIT distributions information available. Withholding taxes on foreign dividends and related reclaims have been provided for in accordance with the Fund’s understanding of the applicable country’s tax rules and rates.
Dividends and Distributions – The Fund intends to distribute substantially all of its net investment income, if any, at least semi-annually. The Fund intends to distribute its net realized long-term and short-term capital gains, if any, annually. Distributions to shareholders, which are determined in accordance with income tax regulations, are recorded on the ex-dividend date. The treatment for financial reporting purposes of distributions made to shareholders during the year from net investment income or net realized capital gains may differ from their ultimate treatment for federal income tax purposes. These differences are caused primarily by differences in the timing of the recognition of certain components of income, expense or realized capital gain for federal income tax purposes. Where such differences are permanent in nature, they are reclassified in the components of the net assets based on their ultimate characterization for federal income tax purposes. Any such reclassifications will have no effect on net assets, results of operations or net asset value (“NAV”) per share of the Fund.
For the fiscal year ended March 31, 2022, the Fund made the following reclassifications to increase (decrease) the components of net assets:
| | | | Accumulated Earnings | |
| Paid-In Capital | | | (Deficit) | |
| $ | 2,503,554 | | | $ | (2,503,554 | ) |
NOTE 3. SECURITIES VALUATION AND FAIR VALUE MEASUREMENTS
The Fund values its portfolio securities at fair value as of the close of regular trading on the New York Stock Exchange (“NYSE”) (normally 4:00 p.m. Eastern time) on each business day the NYSE is open for business. Fair value is defined as the price that the Fund would receive upon selling an investment in a timely transaction to an independent buyer in the principal or most advantageous market of the investment. GAAP establishes a three-tier hierarchy to maximize the use of observable market data and minimize the use of unobservable inputs and to establish classification of fair value measurements for disclosure purposes.
Inputs refer broadly to the assumptions that market participants would use in pricing the asset or liability, including assumptions about risk (the risk inherent in a particular valuation technique used to measure fair value including a pricing model and/or the risk inherent in the inputs to the valuation technique). Inputs may be observable or unobservable.
| Absolute Core Strategy ETF |
| Notes to the Financial Statements (continued) |
| March 31, 2022 |
Observable inputs are inputs that reflect the assumptions market participants would use in pricing the asset or liability developed based on market data obtained and available from sources independent of the reporting entity. Unobservable inputs are inputs that reflect the reporting entity’s own assumptions about the assumptions market participants would use in pricing the asset or liability developed based on the best information available in the circumstances.
Various inputs are used in determining the value of the Fund’s investments. These inputs are summarized in the three broad levels listed below.
| ● | Level 1 – unadjusted quoted prices in active markets for identical investments and/or registered investment companies where the value per share is determined and published and is the basis for current transactions for identical assets or liabilities at the valuation date |
| ● | Level 2 – other significant observable inputs (including, but not limited to, quoted prices for an identical security in an inactive market, quoted prices for similar securities, interest rates, prepayment speeds, credit risk, etc.) |
| ● | Level 3 – significant unobservable inputs (including the Fund’s own assumptions in determining fair value of investments based on the best information available) |
The inputs used to measure fair value may fall into different levels of the fair value hierarchy. In such cases, for disclosure purposes, the level in the fair value hierarchy which is reported is determined based on the lowest level input that is significant to the fair value measurement in its entirety.
Equity securities that are traded on any stock exchange are generally valued at the last quoted sale price on the security’s primary exchange. Lacking a last sale price, an exchange-traded security is generally valued at its last bid price. Securities traded in the NASDAQ over-the-counter market are generally valued at the NASDAQ Official Closing Price. When using market quotations and when the market is considered active, the security is classified as a Level 1 security. In the event that market quotations are not readily available or are considered unreliable due to market or other events, the Fund values its securities and other assets at fair value in accordance with policies established by and under the general supervision of the Board. Under these policies, the securities will be classified as Level 2 or 3 within the fair value hierarchy, depending on the inputs used.
In accordance with the Trust’s valuation policies, the Adviser and/or Sub-Adviser is required to consider all appropriate factors relevant to the value of securities for which it has determined other pricing sources are not available or reliable as described above. No single method exists for determining fair value, because fair value depends upon the circumstances of each individual case. As a general principle, the current fair value of a
| Absolute Core Strategy ETF |
| Notes to the Financial Statements (continued) |
| March 31, 2022 |
security being valued by the Adviser and/or Sub-Adviser would be the amount that the Fund might reasonably expect to receive upon the current sale. Methods that are in accordance with this principle may, for example, be based on (i) a multiple of earnings; (ii) a discount from market prices of a similar freely traded security (including a derivative security or a basket of securities traded on other markets, exchanges or among dealers); or (iii) yield to maturity with respect to debt issues, or a combination of these and other methods. Fair-value pricing is permitted if, in the Adviser and/or Sub-Adviser’s opinion, the validity of market quotations appears to be questionable based on factors such as evidence of a thin market in the security based on a small number of quotations, a significant event occurs after the close of a market but before the Fund’s NAV calculation that may affect a security’s value, or the Adviser and/or Sub-Adviser is aware of any other data that calls into question the reliability of market quotations.
The following is a summary of the inputs used to value the Fund’s investments as of March 31, 2022:
| | | Valuation Inputs | |
| Assets | | Level 1 | | | Level 2 | | | Level 3 | | | Total | |
| Common Stocks (a) | | $ | 50,640,022 | | | $ | — | | | $ | — | | | $ | 50,640,022 | |
| Total | | $ | 50,640,022 | | | $ | — | | | $ | — | | | $ | 50,640,022 | |
| (a) | Refer to Schedule of Investments for sector classifications. |
The Fund did not hold any investments at the end of the reporting period for which significant unobservable inputs (Level 3) were used in determining fair value; therefore, no reconciliation of Level 3 securities is included for this reporting period.
NOTE 4. FEES AND OTHER TRANSACTIONS WITH AFFILIATES AND OTHER SERVICE PROVIDERS
The Adviser, under the terms of the management agreement with the Trust with respect to the Fund (the “Agreement”), manages the Fund’s investments. As compensation for its management services, the Fund is obligated to pay the Adviser a fee computed and accrued daily and paid monthly at an annual rate of 0.85% of the Fund’s average daily net assets. For the fiscal year ended March 31, 2022, before the waiver described below, the Adviser earned a fee of $447,938 from the Fund.
The Adviser has contractually agreed to waive its management fee and/or reimburse expenses so that total annual operating expenses (excluding portfolio transaction and other investment-related costs (including brokerage fees and commissions); taxes; borrowing costs (such as interest and dividend expenses on securities sold short); acquired fund fees and expenses; fees and expenses associated with investments in other collective investment vehicles or derivative instruments (including for example option and swap fees
| Absolute Core Strategy ETF |
| Notes to the Financial Statements (continued) |
| March 31, 2022 |
and expenses); any amounts payable pursuant to a distribution or service plan adopted in accordance with Rule 12b-1 under the 1940 Act; any administrative and/or shareholder servicing fees payable pursuant to a plan adopted by the Board of Trustees; expenses incurred in connection with any merger or reorganization; extraordinary expenses (such as litigation expenses, indemnification of Trust officers and Trustees and contractual indemnification of Fund service providers); and other expenses that the Trustees agree have not been incurred in the ordinary course of the Fund’s business) do not exceed 0.85% of the Fund’s average daily net assets through July 31, 2024. For the fiscal year ended March 31, 2022, the Adviser waived fees of $205,812. At March 31, 2022, the Fund owed the Adviser $23,929.
Each fee waiver/expense payment by the Adviser is subject to recoupment by the Adviser from the Fund in the three years following the date in which that particular waiver/expense payment occurred, but only if such recoupment can be achieved without exceeding the annual expense limitation in effect at the time of the waiver/expense payment and any expense limitation in effect at the time of the recoupment. As of March 31, 2022 the Adviser may seek repayment of investment advisory fees waived and expense reimbursements pursuant to the aforementioned conditions, from the Fund no later than the dates stated below:
| Recoverable Through | | | |
| March 31, 2023 | | $ | 59,995 | |
| March 31, 2024 | | | 217,326 | |
| March 31, 2025 | | | 205,812 | |
Ultimus Fund Solutions, LLC (“Ultimus”) provides administration and fund accounting services to the Fund. The Fund pays Ultimus fees in accordance with the agreements for such services.
Northern Lights Compliance Services, LLC (“NLCS”), an affiliate of Ultimus, provides a Chief Compliance Officer to the Trust, as well as related compliance services, pursuant to a consulting agreement between NLCS and the Trust. Under the terms of such agreement, NLCS receives fees from the Fund, which are approved annually by the Board.
Under the terms of a Distribution Agreement with the Trust, Northern Lights Distributors, LLC (the “Distributor”) serves as principal underwriter to the Fund. The Distributor is an affiliate of Ultimus. The Distributor is compensated by the Adviser (not the Fund) for acting as principal underwriter.
Certain officers and a Trustee of the Trust are also employees of Ultimus and such persons are not paid by the Fund for serving in such capacities.
| Absolute Core Strategy ETF |
| Notes to the Financial Statements (continued) |
| March 31, 2022 |
The Board supervises the business activities of the Trust. Each Trustee serves as a trustee until termination of the Trust unless the Trustee dies, resigns, retires, or is removed. The Chairman of the Board and more than 75% of the Trustees are “Independent Trustees,” which means that they are not “interested persons” as defined in the 1940 Act. Each Independent Trustee of the Trust receives annual compensation of $2,785 per fund from the Trust, except that the Chairman of the Audit Committee, the Chairman of the Governance & Nominating Committee, and the Chairman of the Pricing & Liquidity Committee each receives annual compensation of $3,235 per fund from the Trust, and the Independent Chairman of the Board receives $3,435 per fund from the Trust. Independent Trustees also receive $1,000 for attending any special meeting that requires an in person approval of a contract and $250 for the first hour and $200 for each additional hour for attending other special meetings. In addition, the Trust reimburses Independent Trustees for out-of-pocket expenses incurred in conjunction with attendance at meetings.
NOTE 5. INVESTMENT TRANSACTIONS
For the fiscal year ended March 31, 2022, purchases and sales of investment securities, other than short-term investments, were $9,931,771 and $11,450,344, respectively.
For the fiscal year ended March 31, 2022, purchases and sales for in-kind transactions were $16,560,238 and $8,451,847, respectively.
For the fiscal year ended March 31, 2022, the Fund had in-kind net realized gains of $2,503,554.
There were no purchases or sales of long-term U.S. government obligations during the fiscal year ended March 31, 2022.
NOTE 6. BENEFICIAL OWNERSHIP
The beneficial ownership, either directly or indirectly, of more than 25% of the voting securities of a fund creates a presumption of control of a fund, under Section 2(a)(9) of the 1940 Act. As of March 31, 2022, Tectonic Advisors LLC owned 30.07% of the Fund’s outstanding shares. As a result, Tectonic Advisors LLC may be deemed to control the Fund.
NOTE 7. CAPITAL SHARE TRANSACTIONS
Shares are not individually redeemable and may be redeemed by the Fund at NAV only in large blocks known as “Creation Units.” Only Authorized Participants or transactions done through an Authorized Participant are permitted to purchase or redeem Creation Units from the Fund. An Authorized Participant is either (i) a broker-dealer or other participant in the clearing process through the Continuous Net Settlement System of the
| Absolute Core Strategy ETF |
| Notes to the Financial Statements (continued) |
| March 31, 2022 |
National Securities Clearing Corporation or (ii) a Depository Trust Company participant and, in each case, must have executed a Participant Agreement with the Distributor. Such transactions are generally permitted on an in-kind basis, with a balancing cash component to equate the transaction to the NAV per share of the Fund on the transaction date. Cash may be substituted equivalent to the value of certain securities generally when they are not available in sufficient quantity for delivery, not eligible for trading by the Authorized Participant or as a result of other market circumstances. In addition, the Fund may impose transaction fees on purchases and redemptions of Fund shares to cover the custodial and other costs incurred by the Fund in effecting trades. A fixed fee payable to the Custodian may be imposed on each creation and redemption transaction regardless of the number of Creation Units involved in the transaction (“Fixed Fee”). Purchases and redemptions of Creation Units for cash or involving cash-in-lieu are required to pay an additional variable charge to compensate the Fund and its ongoing shareholders for brokerage and market impact expenses relating to Creation Unit transactions (“Variable Charge,” and together with the Fixed Fee, the “Transaction Fees”). Transactions in capital shares for the Fund are disclosed in the Statement of Changes in Net Assets. For the fiscal year ended March 31, 2022, the Fund received $3,750 and $0 in fixed fees and variable fees, respectively. The Transaction Fees for the Fund are listed in the table below:
| Fixed Fee | | Variable Charge |
| $250 | | 2.00%* |
| * | The maximum Transaction Fee may be up to 2.00% of the amount invested. |
NOTE 8. FEDERAL TAX INFORMATION
At March 31, 2022, the net unrealized appreciation (depreciation) and tax cost of investments for tax purposes was as follows:
| Gross unrealized appreciation | | $ | 9,470,019 | |
| Gross unrealized depreciation | | | (474,738 | ) |
| Net unrealized appreciation on investments | | $ | 8,995,281 | |
| Tax cost of investments | | $ | 41,644,741 | |
The tax character of distributions paid for the fiscal years ended March 31, 2022 and March 31, 2021 were as follows:
| | | 2022 | | | 2021 | |
| Distributions paid from: | | | |
| Ordinary income(a) | | $ | 329,315 | | | $ | 212,839 | |
| Total distributions paid | | $ | 329,315 | | | $ | 212,839 | |
| (a) | Short-term capital gain distributions are treated as ordinary income for tax purposes. |
| Absolute Core Strategy ETF |
| Notes to the Financial Statements (continued) |
| March 31, 2022 |
At March 31, 2022, the components of accumulated earnings (deficit) on a tax basis were as follows:
| Undistributed ordinary income | | $ | 123,110 | |
| Accumulated capital and other losses | | | (392,318 | ) |
| Unrealized appreciation on investments | | | 8,995,804 | |
| Total accumulated earnings | | $ | 8,726,596 | |
The difference between book basis and tax basis undistributed net investment income/ (loss), accumulated net realized gain/(loss), and unrealized appreciation/(depreciation) from investments is primarily attributable to the tax deferral of losses on wash sales.
Capital losses incurred after October 31 within the fiscal year are deemed to arise on the first business day of the following fiscal year for tax purposes. The Fund incurred and elected to defer such capital losses of $65,506.
At March 31, 2022, the Fund had $324,795 short-term and $2,017 long-term capital loss carry forwards for federal income tax purposes available to offset future capital gains. At March 31, 2022 the Fund utilized $338,156 capital loss carry forwards.
NOTE 9. COMMITMENTS AND CONTINGENCIES
The Trust indemnifies its officers and Trustees for certain liabilities that may arise from their performance of their duties to the Trust or the Fund. Additionally, in the normal course of business, the Trust enters into contracts that contain a variety of representations and warranties which provide general indemnifications. The Trust’s maximum exposure under these arrangements is unknown, as this would involve future claims that may be made against the Trust that have not yet occurred.
NOTE 10. SUBSEQUENT EVENTS
Management of the Fund has evaluated the need for disclosures and/or adjustments resulting from subsequent events through the date at which these financial statements were issued. Based upon this evaluation, management has determined there were no items requiring adjustment of the financial statements or additional disclosure.
| Report of Independent Registered Public Accounting Firm |
To the Shareholders of Absolute Core Strategy ETF and
Board of Trustees of Unified Series Trust
Opinion on the Financial Statements
We have audited the accompanying statement of assets and liabilities, including the schedule of investments, of Absolute Core Strategy ETF (the “Fund”), a series of Unified Series Trust, as of March 31, 2022, the related statement of operations for the year then ended, the statements of changes in net assets for each of the two years in the period then ended, the related notes, and the financial highlights for each of the three periods in the period then ended (collectively referred to as the “financial statements”). In our opinion, the financial statements present fairly, in all material respects, the financial position of the Fund as of March 31, 2022, the results of its operations for the year then ended, the changes in net assets for each of the two years in the period then ended, and the financial highlights for each of the three periods in the period then ended, in conformity with accounting principles generally accepted in the United States of America.
Basis for Opinion
These financial statements are the responsibility of the Fund’s management. Our responsibility is to express an opinion on the Fund’s financial statements based on our audits. We are a public accounting firm registered with the Public Company Accounting Oversight Board (United States) (“PCAOB”) and are required to be independent with respect to the Fund in accordance with the U.S. federal securities laws and the applicable rules and regulations of the Securities and Exchange Commission and the PCAOB.
We conducted our audits in accordance with the standards of the PCAOB. Those standards require that we plan and perform the audit to obtain reasonable assurance about whether the financial statements are free of material misstatement whether due to error or fraud.
Our audits included performing procedures to assess the risks of material misstatement of the financial statements, whether due to error or fraud, and performing procedures that respond to those risks. Such procedures included examining, on a test basis, evidence regarding the amounts and disclosures in the financial statements. Our procedures included confirmation of securities owned as of March 31, 2022, by correspondence with the custodian and brokers; when replies were not received from brokers, we performed other auditing procedures. Our audits also included evaluating the accounting principles used and significant estimates made by management, as well as evaluating the overall presentation of the financial statements. We believe that our audits provide a reasonable basis for our opinion.
We have served as the Fund’s auditor since 2020.
COHEN & COMPANY, LTD.
Chicago, Illinois
May 26, 2022
| Summary of Fund Expenses (Unaudited) |
As a shareholder of the Fund, you incur two types of costs: (1) transaction and (2) ongoing costs, including management fees and other Fund expenses. These examples are intended to help you understand your ongoing costs (in dollars) of investing in the Fund and to compare these costs with the ongoing costs of investing in other funds. You may pay brokerage commissions on purchases and sales of exchange-traded fund shares, which are not reflected in the example. The example is based on an investment of $1,000 invested at the beginning of the period and held for the entire period from October 1, 2021 through March 31, 2022.
Actual Expenses
The first line of the table below provides information about actual account values and actual expenses. You may use the information in this line, together with the amount you invested, to estimate the expenses that you paid over the period. Simply divide your account value by $1,000 (for example, an $8,600 account value divided by $1,000 = 8.6), then multiply the result by the number in the first line under the heading “Expenses Paid During Period” to estimate the expenses you paid on your account during this period.
Hypothetical Example for Comparison Purposes
The second line of the table below provides information about hypothetical account values and hypothetical expenses based on the Fund’s actual expense ratio and an assumed rate of return of 5% per year before expenses, which is not the Fund’s actual return. The hypothetical account values and expenses may not be used to estimate the actual ending account balance or expenses you paid for the period. You may use this information to compare the ongoing costs of investing in the Fund and other funds. To do so, compare this 5% hypothetical example with the 5% hypothetical examples that appear in the shareholder reports of other funds.
Expenses shown in the table are meant to highlight your ongoing costs only and do not reflect any transactional costs. Therefore, the second line of the table below is useful in comparing ongoing costs only and will not help you determine the relative costs of owning different funds. In addition, if transaction costs were included, your costs would have been higher.
| | | Beginning | | Ending | | | | |
| | | Account | | Account | | Expenses | | |
| | | Value | | Value | | Paid | | Annualized |
| | | October 1, | | March 31, | | During | | Expense |
| | | 2021 | | 2022 | | Period(a) | | Ratio |
| Actual | | $1,000.00 | | $1,119.10 | | $4.49 | | 0.85% |
| Hypothetical(b) | | $1,000.00 | | $1,020.69 | | $4.28 | | 0.85% |
| (a) | Expenses are equal to the Fund’s annualized expense ratios, multiplied by the average account value over the period, multiplied by 182/365 (to reflect the one-half year period). |
| (b) | Hypothetical assumes 5% annual return before expenses. |
| Trustees and Officers (Unaudited) |
GENERAL QUALIFICATIONS. The Board supervises the business activities of the Trust. Each Trustee serves as a trustee until termination of the Trust unless the Trustee dies, resigns, retires, or is removed. The Chairman of the Board and more than 75% of the Trustees are “Independent Trustees,” which means that they are not “interested persons” (as defined in the 1940 Act) of the Trust or any adviser, sub-adviser or distributor of the Trust.
The following table provides information regarding the Independent Trustees.
Name, Address*, (Year of Birth),
Position with Trust**,
Term of Position with Trust | Principal Occupation During Past 5 Years and Other
Directorships |
Kenneth G.Y. Grant (1949)
Chairman, January 2017 to present;
Independent Trustee, May 2008 to
present | Current: Director, Standpoint Multi-Asset (Cayman) Fund, Ltd. (2019 – present); Director, Advisors Charitable Gift Fund (2020 - present), a Donor Advised Fund. Previous: EVP, Benefit Plans Administrative Services, Inc., provider of retirement benefit plans administration (2019 – 2020); Director, Northeast Retirement Services (NRS) LLC, a transfer agent and fund administrator; and Director, Global Trust Company (GTC), a non-depository trust company sponsoring private investment product (2003 – 2019); EVP, NRS (2003 – 2019); GTC, EVP (2008 – 2019); EVP, Savings Banks Retirement Association (2003 – 2019), provider of qualified retirement benefit plans. |
Daniel J. Condon (1950)
Chairman of the Audit Committee;
Chairman of the Governance &
Nominating Committee; Independent
Trustee, December 2002 to present | Current: Retired (2017 - present). |
Gary E. Hippenstiel (1947)
Chairman of the Pricing & Liquidity
Committee; Independent Trustee,
December 2002 to present | Current: President and founder of Hippenstiel Investment Counsel LLC (“Hippenstiel”) since 2008. Hippenstiel was registered as an investment adviser from 2008 to December 31, 2019. |
Stephen A. Little (1946)
Independent Trustee, December 2002
to present; Chairman, December 2004
to December 2016 | Current: President and founder of The Rose, Inc., a registered investment adviser, since 1993. |
Ronald C. Tritschler (1952)
Independent Trustee, January 2007 to
present; Interested Trustee,
December 2002 to December 2006 | Current: Chief Executive Officer, Director and Legal Counsel of The Webb Companies, a national real estate company, since 2001; Director, Standpoint Multi-Asset (Cayman) Fund, Ltd. (2020 – present). |
| * | The address for each Trustee is 225 Pictoria Drive, Suite 450, Cincinnati, Ohio 45246. |
| ** | As of the date of this report, the Trust consists of 23 series. |
| Trustees and Officers (Unaudited) (continued) |
The following table provides information regarding the Interested Trustees and Officers of the Trust.
Name, Address*, (Year of Birth),
Position with Trust,
Term of Position with Trust | Principal Occupation During Past 5 Years and Other
Directorships |
David R. Carson (1958)
President, January 2016 to August
2021; Interested Trustee, August 2020
to present | Current: Senior Vice President Client Strategies of Ultimus Fund Solutions, LLC, since 2013; Interested Trustee of Ultimus Managers Trust, since 2020. |
Zachary P. Richmond (1980)
Treasurer and Chief Financial Officer,
November 2014 to present | Current: Vice President, Director of Financial Administration for Ultimus Fund Solutions, LLC, since 2015. |
Martin R. Dean (1963)
President, August 2021 to present; Vice
President, November 2020 to August
2021; Chief Compliance Officer, April
2021 to August 2021; Assistant Chief
Compliance Officer, January 2016 to
April 2021 | Current: Senior Vice President, Head of Fund Compliance of Ultimus Fund Solutions, LLC, since 2016. |
Gweneth K. Gosselink (1955)
Chief Compliance Officer, August
2021 to present | Current: Assistant Vice President, Senior Compliance Officer of Ultimus Fund Solutions, LLC, since 2019. Previous: Chief Operating Officer & CCO at Miles Capital, Inc. (2013 – 2019). |
Elisabeth Dahl (1962)
Secretary, May 2017 to present;
Assistant Secretary, March 2016 to
May 2017 | Current: Attorney, Ultimus Fund Solutions, LLC since March 2016. |
Stephen Preston (1966)
AML Compliance Officer, May 2017
to present | Current: Vice President and Chief Compliance Officer, Ultimus Fund Solutions, LLC and Ultimus Fund Distributors, LLC, since 2011. |
Lynn E. Wood (1946)
Assistant Chief Compliance Officer,
April 2021 to present; Chief
Compliance Officer, October 2004 to
April 2021 | Current: Managing Member, Buttonwood Compliance Partners, LLC, since 2013. |
| * | The address for each Officer is 225 Pictoria Drive, Suite 450, Cincinnati, Ohio 45246. |
| Other Information (Unaudited) |
The Fund’s Statement of Additional Information (“SAI”) includes additional information about the trustees and is available without charge, upon request. You may call toll-free at (833) 267-3383 to request a copy of the SAI or to make shareholder inquiries.
A description of the policies and procedures that the Fund uses to determine how to vote proxies relating to portfolio securities and information regarding how the Fund voted those proxies during the most recent twelve month period ended June 30, are available (1) without charge upon request by calling the Fund at (833) 267-3383 and (2) in Fund documents filed with the SEC on the SEC’s website at www.sec.gov.
TRUSTEES Kenneth G.Y. Grant, Chairman David R. Carson Daniel J. Condon Gary E. Hippenstiel Stephen A. Little Ronald C. Tritschler OFFICERS Martin R. Dean, President Gweneth K. Gosselink, Chief Compliance Officer Zachary P. Richmond, Treasurer and Chief Financial Officer Lynn E. Wood, Assistant Chief Compliance Officer INVESTMENT ADVISER Absolute Investment Advisers LLC 4 North Street, Suite 2 Hingham, MA 02043 DISTRIBUTOR Northern Lights Distributors, LLC 4221 North 203rd Street, Suite 100 Elkhorn, NE 68022 | INDEPENDENT REGISTERED PUBLIC ACCOUNTING FIRM Cohen & Company, Ltd. 151 N Franklin Street, Suite 575 Chicago, IL 60606 LEGAL COUNSEL Thompson Hine LLP 312 Walnut Street, 20th Floor Cincinnati, OH 45202 CUSTODIAN Brown Brothers Harriman & Co. 50 Post Office Square Boston, MA 02110 ADMINISTRATOR Ultimus Fund Solutions, LLC 225 Pictoria Drive, Suite 450 Cincinnati, OH 45246 |
This report is intended only for the information of shareholders or those who have received the Fund’s prospectus which contains information about the Fund’s management fee and expenses. Please read the prospectus carefully before investing.
Distributed by Northern Lights Distributors, LLC Member FINRA/SIPC
Absolute Core-AR-22
Dean Small Cap Value Fund
Dean Mid Cap Value Fund
Annual Report
March 31, 2022
Dean Small Cap Value Fund
Management Discussion of Fund Performance (Unaudited)
Management’s Discussion & Analysis
The Dean Small Cap Value Fund returned +7.98% net of fees for the twelve months ended March 31, 2022, compared with a +3.32% return for the benchmark Russell 2000 Value Index and a -5.79% return for the broader Russell 2000 Index.
Macro Factors Impacting Performance
Macro factors were a strong tailwind for the portfolio in the past fiscal year. The portfolio benefited from holding stocks that were less volatile than the benchmark (a proxy for quality) and from holding stocks that had lower valuations than the benchmark (value stocks). The rising cost of capital is beginning to have an impact on the market environment leading to more emphasis being placed on valuation and quality. This is causing a shift in investor appetite towards higher-quality, value-oriented stocks which represent the two most important tenets to our investment philosophy: “Value Driven, Quality Focused.”
Sector Performance (best/worst relative to benchmark)
The best performing sector relative to the benchmark for the twelve-month period ended March 31, 2022, was Financials. The outperformance resulted from better stock selection than that of the benchmark, especially in the Insurance and Diversified Financials industries. One of the insurance companies held by the Fund was acquired for a large premium, and the Fund holds idiosyncratic positions in the Diversified Financials industry which, in their own unique ways, have benefited from the volatility in the markets as well as from the Fed beginning a rate hiking cycle.
The second-best performing sector relative to the benchmark was Health Care. The bulk of the outperformance was a result of the Fund not holding any Biotech companies. Biotech stocks typically have a wide range of outcomes that tend to be binary in nature (they are either homeruns or strikeouts). Our process tends to shy away from these types of investments, and this fiscal year, as the market shifted its preference to higher quality companies, Biotech stocks sold off relative to the market. Thus, the Fund’s lack of ownership of Biotech stocks was a benefit to performance.
The worst performing sector relative to the benchmark for the last twelve months was Energy. The underperformance was due to the Fund’s underweight positioning versus the benchmark as well as below benchmark stock selection. Energy was, by a large margin, the best performing sector in the benchmark as oil prices rose sharply from a lack of supply combined with concerns over the consequences from the war in Ukraine. In addition, some of the most volatile, widest range of outcome stocks turned into the best performing stocks.
Dean Small Cap Value Fund
Management Discussion of Fund Performance (Unaudited)
(continued)
We are concerned with how the higher price of oil flows through to small cap companies’ economics during the recent oil price spike, as many of the dynamics in the industry have changed since the last price spike. We believe the stocks in the benchmark have high expectations built into their valuations, coupled with high risk to boot.
The second worst performing sector relative to the benchmark was Industrials. The underperformance was a result of the Fund’s stock selection, specifically, the portfolio’s overweight in trucking stocks. Investors are concerned over a slowing economy and a deceleration in freight rates at a time when fuel and labor costs are rising. We own stocks of two high-quality trucking companies from the Midwest who have managed many cycles before. They both have steadier than average end markets, and we believe they represent attractive opportunities, notwithstanding the potential for a slowing economy.
Individual Securities Performance (best/worst absolute contributors)
The largest contributing company in the fiscal year was American National Group (ANAT). ANAT is a diversified insurer offering life, annuities, house, business, health, auto, renters, and farm insurance services. Brookfield Asset Management Reinsurance Partners acquired ANAT for $190 per share in cash, which represented a 55% premium to ANAT’s price before rumors of a sale surfaced. Our private market value estimate range for ANAT was $138 per share to $168 per share. We were pleased to see the actual sale price come in 13% higher than the top end of our range. We have a high degree of confidence the deal will close on time with no issues; thus, we continue to hold the position until the closing of the deal.
The second largest contributing stock was Encore Wire (WIRE). WIRE manufactures electrical building wire and cable. It supplies building wire for interior electrical wiring in commercial and industrial buildings, homes, apartments, and manufactured housing. WIRE benefited from being a vertically integrated business as it was able to fulfill orders while its competitors struggled with supply chain issues. It also benefited from a strong housing market and anticipation of new infrastructure spending. We lowered the weight in the Fund’s portfolio because of the strong price performance; however, the Fund continues to hold a small position in WIRE.
The largest detracting stock for the period was Heartland Express (HTLD). HTLD is a short-to-medium haul trucking company. The market is increasingly growing concerned about peak growth rates in the economy, and as a result, in the trucking industry as well. We feel the current valuations in the group compensate for this possible deceleration of economic growth, while ignoring how well HTLD has managed past full economic cycles.
Dean Small Cap Value Fund
Management Discussion of Fund Performance (Unaudited)
(continued)
HTLD is one of the highest quality trucking companies we can own in the small cap value space. The portfolio holds a sizable position in HTLD.
The second largest detracting stock was Treehouse Foods (THS). THS is a private label packaged food manufacturer. Commodity prices have been on the rise, which is impacting the input costs for THS. Due to the nature of THS’s private label product, the ability to pass along rising input costs to customers is much less than that of branded goods, which consumers are already willing to ‘pay up’ for; thus, the fear of continued inflation has put pressure on THS’s stock price. THS is in the process of rightsizing its product portfolio by selling product lines that are unprofitable while pursuing internal cost containment procedures which should offset input cost inflation on the remaining product lines. The Fund maintains a position in THS.
Current Positioning and Opportunities
The Fund’s largest overweight sectors relative to the benchmark are currently in the Consumer Staples and Utilities sectors. The largest underweight sectors relative to the benchmark are currently in the Energy and Industrials sectors. Throughout the fiscal year, the Health Care and Information Technology sectors increased the most in weight, while the Financials and Industrials sectors decreased the most in weight. As always, these relative weights are a residual of our bottom-up opportunities and not based on a top-down macro call on the market or economy.
We remain focused on the fundamentals of the companies we own, and the price we are paying for those fundamentals. We are confident that a steadfast application of our proven and disciplined process should produce favorable results over time.
Thank you for your continued confidence in Dean.
Investment Results (Unaudited)
Average Annual Total Returns(a) as of March 31, 2022
| | | One Year | | Five Year | | Ten Year |
| Dean Small Cap Value Fund | | 7.98% | | 6.74% | | 9.85% |
| Russell 2000 Value Index(b) | | 3.32% | | 8.57% | | 10.54% |
| Russell 2000 Index(b) | | (5.79)% | | 9.74% | | 11.04% |
Total annual operating expenses, which include acquired fund fees and expenses of 0.01%, as disclosed in the Dean Small Cap Value Fund (the “Fund”) prospectus dated July 29, 2021, were 1.20% of the Fund’s average daily net assets. Additional information pertaining to the expense ratios as of March 31, 2022 can be found in the financial highlights.
The performance quoted represents past performance, which does not guarantee future results. The investment return and principal value of an investment will fluctuate so that an investor’s shares, when redeemed, may be worth more or less than their original cost. The returns shown do not reflect deduction of taxes that a shareholder would pay on Fund distributions or the redemption of Fund shares. Current performance may be lower or higher than the performance quoted. The Fund’s investment objectives, risks, charges and expenses must be considered carefully before investing. Performance data current to the most recent month end may be obtained by calling (888) 899-8343.
| (a) | Return figures reflect any change in price per share and assume the reinvestment of all distributions. |
| (b) | The Russell 2000 and Russell 2000 Value Indices are unmanaged indices that assume reinvestment of all distributions and exclude the effect of taxes and fees. The indices are widely recognized unmanaged indices of equity prices and are representative of a broader market and range of securities than are found in the Fund’s portfolio. An individual cannot invest directly in an index or the indices. However, an individual may be able to invest in exchange traded funds or other investment vehicles that attempt to track the performance of an index. |
You should consider the Fund’s investment objectives, risks, charges and expenses carefully before you invest. The Fund’s prospectus contains important information about the Fund’s investment objectives, potential risks, management fees, charges and expenses, and other information and should be read carefully before investing. You may obtain a current copy of the Fund’s prospectus or performance data current to the most recent month end by calling (888) 899-8343.
The Fund is distributed by Ultimus Fund Distributors, LLC, member FINRA/SIPC.
Investment Results (Unaudited) (continued)
Comparison of the Change in Value of a $10,000 Investment in the Dean Small Cap Value Fund, the Russell 2000 Index and the Russell 2000 Value Index (Unaudited)
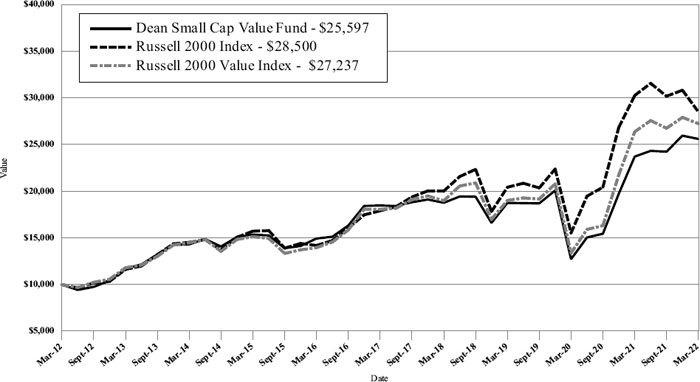
The graph shows the value of a hypothetical initial investment of $10,000 in the Fund, the Russell 2000 Index and the Russell 2000 Value Index on March 31, 2012 and held through March 31, 2022.
The Russell 2000 Index and the Russell 2000 Value Index are widely recognized unmanaged indices of common stock prices and are representative of a broader market and range of securities than is found in the Fund’s portfolio. Individuals cannot invest directly in an index; however, an individual may invest in exchange traded funds or other investment vehicles that attempt to track the performance of a benchmark index. THE FUND’S RETURN REPRESENTS PAST PERFORMANCE AND DOES NOT GUARANTEE OR PREDICT FUTURE RESULTS. The returns shown do not reflect deduction of taxes that a shareholder would pay on Fund distributions or the redemption of Fund shares. Investment returns and principal values will fluctuate so that an investor’s shares, when redeemed, may be worth more or less than their original cost.
Current performance may be lower or higher than the performance data quoted. For more information on the Fund, and to obtain performance data current to the most recent month-end, or to request a prospectus, please call (888) 899-8343. You should carefully consider the investment objectives, risks, charges and expenses of the Fund before investing. The Fund’s prospectus contains this and other information about the Fund and should be read carefully before investing.
The Fund is distributed by Ultimus Fund Distributors, LLC, Member FINRA/SIPC.
Dean Mid Cap Value Fund
Management Discussion of Fund Performance (Unaudited)
Management’s Discussion & Analysis
The Dean Mid Cap Value Fund (DALCX) returned 11.22% (net of fees) for the year ended March 31, 2022, compared with the Russell Midcap Value Index, up 11.45%, and the broader Russell Midcap Index, up 6.92%.
Macro Factors Impacting Performance
Macro style factors were a benefit to the portfolio in the fiscal year. The portfolio benefitted from owning stocks with lower valuations and lower volatility than those of the Russell Midcap Value Index. A strong economy coupled with shortages of goods and labor is driving the cost of capital higher as policy makers push to tighten liquidity in order to fight rampant inflation. The rise in the cost of capital is negatively impacting the present value of companies with growth far into the future, leading to a greater focus on valuation and quality as the market is fraught with uncertainty on a fiscal and geopolitical front.
Sector Performance (best/worst relative to benchmark)
The best performing sector relative to the Russell Midcap Value Index for the 12 months ended March 31, 2022, was Consumer Discretionary. The outperformance was driven by stock selection, mostly within the retail holdings of the Fund. Auto parts retailer AutoZone (AZO) was up 42.5% for the period held as the increase in miles driven and increasing age of cars positively impacted AZO’s sales. In addition, AZO took share in the professional delivery parts business with its strategy to increase the number of distribution points to improve speed of delivery and in stock parts. Cosmetic products retailer Ulta Beauty (ULTA) was up 28.8% over the period on strong results as customers returned to work and social gatherings. Auto parts retailer and industrial distributor Genuine Parts (GPC) also benefitted from the positive fundamentals in the parts business and increased demand in its distribution segment. The stock was up 11.9% in the 12 months ended March 31, 2022. These results compare to the benchmark’s Consumer Discretionary sector down -6.5% and the Retailing industry group up 2.7% over the period.
Industrials were the second-best performing sector relative to the benchmark. The Fund’s outperformance was primarily driven by stock selection with waste company Republic Services Group (RSG), electrical contractor nVent Electric (NVT), defense company Curtis-Wright (CW) and industrial product maker Dover (DOV) up 35.3%, 27.4%, 27.3%, and 15.8%, respectively, compared to the benchmark Industrials sector down -0.14%. While the companies listed have different end markets driving their performance, they are similar in characteristics in which they each benefit from overall economic activity and are relatively high quality with above average returns on invested capital. The Fund also benefitted being underweight in the Transportation industry group, primarily within the airlines, which saw severe headwinds with travel curtailed due to Covid and rising jet fuel prices.
Dean Mid Cap Value Fund
Management Discussion of Fund Performance (Unaudited)
(continued)
The worst performing sector was Information Technology for the trailing twelve-month period ended March 31, 2022. The Fund’s underweight in the sector was beneficial as the sector underperformed the overall benchmark by more than -8.0%. However, stock selection was not up to par and accounted for the sector underperformance. The stocks held by the Fund underperformed due to weak end markets served, coupled with rising costs impacting margins and supply disruptions curtailing revenue. Supply disruptions negatively impacted semiconductor instrument company MKS Instruments (MKSI) and network communication company Ciena (CIEN). Weak end markets impacted storage maker Western Digital (WDC) as it witnessed a decrease in pricing and Littlefuse (LFUS), which sells circuit protection into the auto market, which was negatively impacted by the lack of semiconductor products.
Energy was the second worst performing sector relative to the benchmark. The underperformance was driven by being underweight the sector by 1.4% on average, for the year ended March 31, 2022. With the benchmark Energy sector up 70.9% for the year, outperforming the Russell Midcap Value Index by 59.4%, the modest underweight was a meaningful headwind to performance. Stock selection was a modest negative with holding Pioneer Natural Resources (PXD) modestly underperforming the Energy sector. While the Fund’s holdings were largely in line with the sector performance, the Fund did not hold the Energy companies with high operating leverage to oil prices and often, less than stellar balance sheets and cost structures. Many of the companies with significant financial and commodity leverage were up well over 100% on the year. The sector’s performance was driven by demand returning to pre-Covid levels while the supply response was muted due to a limited increase in oilfield capital expenditures being deployed. In addition, the invasion of Ukraine by Russia sent oil prices higher as countries imposed sanctions on Russian oil and gas imports as well as sanctions on Russia’s financial system, making international payments difficult. In addition, many western oil companies doing business in Russia exited projects, which will have negative implications for future production. Russia is key exporter of oil to the market, with the primary destination in Europe.
Individual Securities Performance (best/worst absolute contributors)
The largest contributing stock for the fiscal year was Pioneer Natural Resources (PXD), up 66.0%. The company’s primary asset is in the Permian Basin where it was one of the early developers of the field. The company has a deep inventory of undeveloped drilling locations in the Midland side of the basin where it is one of the lowest cost producers. The company added to its position in the Permian Basin, completing the acquisitions of Parsley Energy and DoublePoint Energy LLC in 2021. The addition of adjacent acreage should allow the company to improve its cost position through greater economies of scale and exiting non-core assets. Energy was the highest returning sector for the year in the benchmark, up 70.9%. After seeing crude oil prices rise throughout 2021 on improved post-covid demand,
Dean Mid Cap Value Fund
Management Discussion of Fund Performance (Unaudited)
(continued)
oil prices surged in early 2022 as Russia invaded Ukraine, creating additional pressures on world oil supply. Pioneer benefitted from the rising commodity prices as well as guiding to a modest rise in capital spending and production while committing to a significant return of capital to shareholders through a new $4B stock buyback authorization, a base dividend, and a variable dividend based on excess cash flow. The Fund continues to hold a sizeable position in Pioneer Natural Resources.
The second largest contributing stock was Baker Hughes (BKR), up 73.5% for the year. The company is a global oil services company with two-thirds of sales outside of North America. While the company operates in the traditional oil services of well completion, drilling, artificial lift and subsea, with the combination of GE Oil & Gas in 2017, the company has become a leader in the green energy transition with exposure to liquified natural gas (LNG), carbon capture, utilization, and storage (CCUS), and hydrogen. Considering that Russia accounts for approximately 45% of the European Union’s gas imports, Russia’s invasion of Ukraine has created a destabilizing force in energy supply security for the EU. Alternate sources of energy supply will be key to the stability of the region, with likely sources being offshore wind, LNG, CCUS, and hydrogen, all lines of business that would benefit Baker Hughes. In addition, oil producers outside of Russia will need to increase investment to bridge the supply gap, benefitting Baker Hughes traditional oilfield service business. The Fund continues to hold Baker Hughes.
Jazz Pharmaceutical (JAZZ) was the largest detracting stock in the fiscal year ended March 31, 2022. Jazz is a global pharmaceutical company focusing on chronic diseases with little to no current therapy options in the sleep, oncology, and epilepsy therapeutics spaces. JAZZ was down -24.5% for the period held, compared with the benchmark Russell Midcap Value Index Health Care sector which returned 7.2% for the year. JAZZ produced solid second quarter results that were released in August, showing that ~32% of patients converted from Xyrem to Xywav, a lower-sodium treatment for chronic excessive daytime sleepiness (EDS), nearing a potential generic Xyrem triggering event of ~50% conversion. This spooked markets as the introduction of generic competition is set to occur earlier than expected. We felt this was unjustified as doctors unanimously support Xywav adoption due to the chronic nature of EDS and the health benefits provided from lower-sodium intake versus Xyrem or the potential Xyrem generics. However, just days after its own earnings release, Avadel Pharmaceuticals plc (AVDL) released its own earnings and announced that its drug, FT218, which competes with Xywav and offers patients a once-nightly dosage instead of Xywav’s twice-nightly, was on track for commercial launch in 4Q21, causing JAZZ to leg down further on fears of consumer preference for less nightly interruption. The Fund exited JAZZ as we revisit the competitive landscape and the impact on the company’s plans to de-lever and support its diversified pipeline of drug launches.
Dean Mid Cap Value Fund
Management Discussion of Fund Performance (Unaudited)
(continued)
The second largest detracting stock was MKS Instruments (MKSI), down -23.1% for the period held. MKSI is an equipment manufacturer that makes systems to analyze and control gasses during production for semiconductors and thin film processes, such as LED screens. Top customers include Applied Materials and Lam Research. After reporting second quarter earnings in-line with expectations, the company lowered future earnings guidance rather than beating and raising expectations, which had been the trend for several quarters. The shortfall was primarily in the company’s semiconductor business where the company is experiencing shortages in electronic components and saw a shutdown in Malaysian manufacturing due to Covid. The Fund exited the stock in the second fiscal quarter.
Current Positioning and Opportunities
Currently, the Fund’s largest overweight sectors relative to the benchmark are the Consumer Staples and Utilities sectors. The largest underweight sectors relative to the benchmark are the Information Technology and Real Estate sectors.
After two years of easy monetary and fiscal policy, the Federal Reserve is in the initial stages of normalization through increased interest rates and shrinking the size of the balance sheet. With ever increasing inflation and the additional element of geopolitical risks in Europe, the Federal Reserve must act to keep prices in check while balancing the risk of overshooting policy decisions, sending the economy into recession. We continue to believe the rotation to stocks with lower valuations, higher quality attributes, and fairly narrow ranges of outcomes will continue, and the Fund is well positioned for the environment ahead.
Investment Results (Unaudited)
Average Annual Total Returns(a) as of March 31, 2022
| | | One Year | | Five Year | | Ten Year |
| Dean Mid Cap Value Fund | | 11.22% | | 9.01% | | 10.64% |
| Russell Midcap Value Index(b) | | 11.45% | | 9.99% | | 12.01% |
| Russell Midcap Index(b) | | 6.92% | | 12.62% | | 12.85% |
The Total annual operating expenses, which included acquired fund fees and expenses of less than 0.005%, as disclosed in the Dean Mid Cap Value Fund (the “Fund”) prospectus dated July 29, 2021, were 1.15% of the Fund’s average daily net assets (0.85% after fee waivers/expense reimbursements by Dean Investment Associates, LLC (the “Adviser”)). The Adviser has contractually agreed to waive its management fee and/or reimburse expenses so that total annual Fund operating expenses (excluding portfolio transaction and other investment-related costs (including brokerage fees and commissions); taxes; borrowing costs (such as interest and dividend expenses on securities sold short); acquired fund fees and expenses; fees and expenses associated with investments in other collective investment vehicles or derivative instruments (including for example option and swap fees and expenses); any amounts payable pursuant to a distribution or service plan adopted in accordance with Rule 12b-1 under the Investment Company Act of 1940; expenses incurred in connection with any merger or reorganization; extraordinary expenses (such as litigation expenses, indemnification of Trust officers and Trustees and contractual indemnification of Fund service providers) do not exceed 0.85% of the Fund’s average daily net assets through July 31, 2022. Each waiver/expense payment by the Adviser is subject to recoupment by the Adviser from the Fund in the three years following the date the particular waiver/expense payment occurred, but only if such recoupment can be achieved without exceeding the annual expense limitation in effect at the time of the waiver/ expense payment and any expense limitation in effect at the time of recoupment. This expense limitation agreement may not be terminated prior to July 31, 2022, except by the Board of Trustees. Additional information pertaining to the expense ratios as of March 31, 2022 can be found in the financial highlights.
The performance quoted represents past performance, which does not guarantee future results. The investment return and principal value of an investment will fluctuate so that an investor’s shares, when redeemed, may be worth more or less than their original cost. The returns shown do not reflect deduction of taxes that a shareholder would pay on Fund distributions or the redemption of Fund shares. Current performance may be lower or higher than the performance quoted. The Fund’s investment objectives, risks, charges and expenses must be considered carefully before investing. Performance data current to the most recent month end may be obtained by calling (888) 899-8343.
| (a) | Return figures reflect any change in price per share and assume the reinvestment of all distributions. |
| (b) | The Russell Midcap and Russell Midcap Value Indices are unmanaged benchmarks that assume reinvestment of all distributions and exclude the effect of taxes and fees. The indices are widely recognized unmanaged indices of equity prices and are representative of a broader market and range of securities than are found in the Fund’s portfolio. An individual cannot invest directly in an index. However, an individual may be able to invest in exchange traded funds or other investment vehicles that attempt to track the performance of an index. |
Investment Results (Unaudited) (continued)
You should consider the Fund’s investment objectives, risks, charges and expenses carefully before you invest. The Fund’s prospectus contains important information about the Fund’s investment objectives, potential risks, management fees, charges and expenses, and other information and should be read carefully before investing. You may obtain a current copy of the Fund’s prospectus or performance data current to the most recent month end by calling (888) 899-8343.
The Fund is distributed by Ultimus Fund Distributors, LLC, member FINRA/SIPC
Comparison of the Change in the Value of a $10,000 Investment in the Dean Mid Cap Value Fund, the Russell Midcap Index, and the Russell Midcap Value Index (Unaudited)
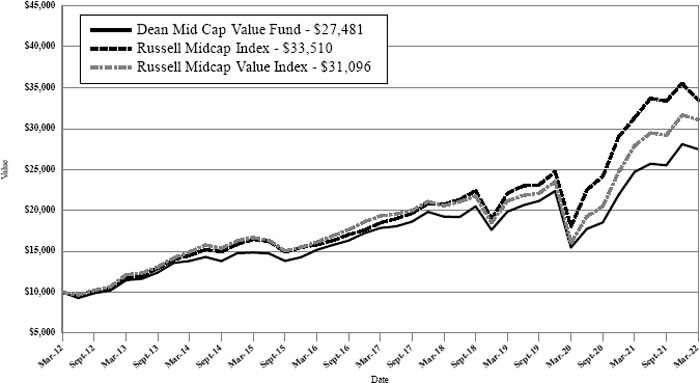
The graph shows the value of a hypothetical initial investment of $10,000 in the Fund, the Russell Midcap Index and the Russell Midcap Value Index on March 31, 2012 and held through March 31, 2022.
The Russell Midcap Index and the Russell Midcap Value Index are widely recognized unmanaged indices of common stock prices and are representative of a broader market and range of securities than is found in the Fund’s portfolio. Individuals cannot invest directly in an index; however, an individual may invest in exchange traded funds or other investment vehicles that attempt to track the performance of a benchmark index. THE FUND’S RETURN REPRESENTS PAST PERFORMANCE AND DOES NOT GUARANTEE OR PREDICT FUTURE RESULTS. The returns shown do not reflect deduction of taxes that a shareholder would pay on Fund distributions or the redemption of Fund shares. Investment returns and principal values will fluctuate so that an investor’s shares, when redeemed, may be worth more or less than their original cost.
Current performance may be lower or higher than the performance data quoted. For more information on the Fund, and to obtain performance data current to the most recent month-end, or to request a prospectus, please call (888) 899-8343. You should carefully consider the investment objectives, risks, charges and expenses of the Fund before investing. The Fund’s prospectus contains this and other information about the Fund and should be read carefully before investing.
The Fund is distributed by Ultimus Fund Distributors, LLC, Member FINRA/SIPC.
Fund Holdings (Unaudited)
Dean Small Cap Value Fund Holdings as of March 31, 2022*
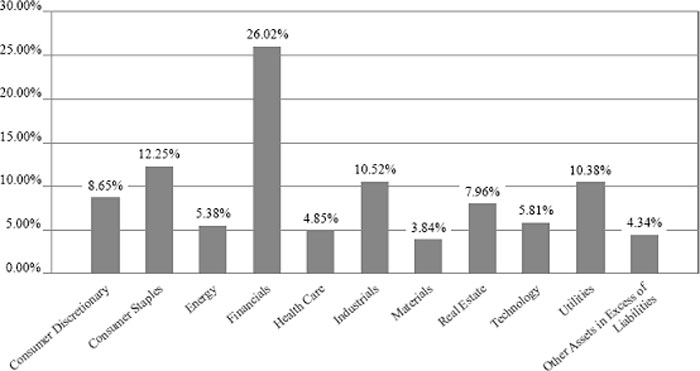
| * | As a percentage of net assets |
The investment objective of the Dean Small Cap Value Fund is long-term capital appreciation and, secondarily, dividend income. Portfolio holdings are subject to change.
Fund Holdings (Unaudited)
Dean Mid Cap Value Fund Holdings as of March 31, 2022*
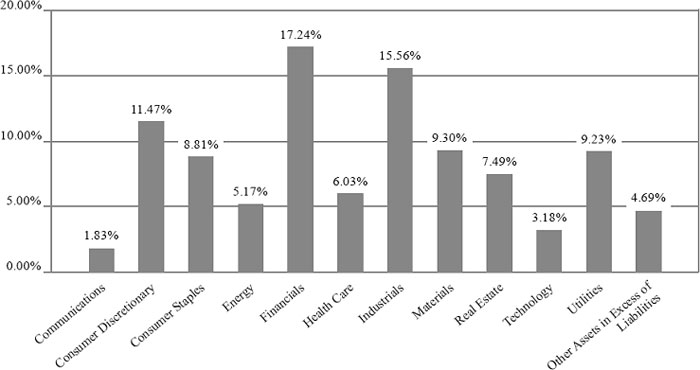
| * | As a percentage of net assets. |
The investment objective of the Dean Mid Cap Value Fund is long-term capital appreciation and, secondarily, dividend income. Portfolio holdings are subject to change.
Availability of Portfolio Schedule (Unaudited)
Each Fund files a complete schedule of portfolio holdings with the Securities and Exchange Commission (the “SEC”) for the first and third quarters of each fiscal year as an exhibit to its reports on Form N-PORT. The Funds’ Form N-PORT reports are available on the SEC’s website at http:// www.sec.gov and on the Funds’ website at www.deanmutualfunds.com.
Dean Small Cap Value Fund
Schedule of Investments
March 31, 2022
| COMMON STOCKS — 95.66% | | Shares | | | Fair Value | |
| Consumer Discretionary — 8.65% | | | | | | | | |
| American Woodmark Corp.(a) | | | 46,891 | | | $ | 2,295,314 | |
| Hooker Furniture Corp. | | | 75,116 | | | | 1,422,697 | |
| Johnson Outdoors, Inc., Class A | | | 17,186 | | | | 1,335,868 | |
| Methode Electronics, Inc. | | | 28,453 | | | | 1,230,592 | |
| Sally Beauty Holdings, Inc.(a) | | | 42,793 | | | | 668,855 | |
| Standard Motor Products, Inc. | | | 95,374 | | | | 4,114,435 | |
| TRI Pointe Group, Inc.(a) | | | 225,010 | | | | 4,518,200 | |
| | | | | | | | 15,585,961 | |
| Consumer Staples — 12.25% | | | | | | | | |
| Alico, Inc. | | | 16,958 | | | | 636,942 | |
| Cal-Maine Foods, Inc. | | | 65,784 | | | | 3,632,593 | |
| Edgewell Personal Care Co. | | | 36,078 | | | | 1,322,980 | |
| Energizer Holdings, Inc. | | | 28,567 | | | | 878,721 | |
| Fresh Del Monte Produce, Inc. | | | 54,516 | | | | 1,412,510 | |
| Hostess Brands, Inc.(a) | | | 65,442 | | | | 1,435,797 | |
| John B. Sanfilippo & Son, Inc. | | | 39,834 | | | | 3,323,749 | |
| Sanderson Farms, Inc. | | | 16,389 | | | | 3,072,774 | |
| Sprouts Farmers Market, Inc.(a) | | | 70,905 | | | | 2,267,542 | |
| TreeHouse Foods, Inc.(a) | | | 34,826 | | | | 1,123,487 | |
| Weis Markets, Inc. | | | 41,541 | | | | 2,966,858 | |
| | | | | | | | 22,073,953 | |
| Energy — 5.38% | | | | | | | | |
| Civitas Resources, Inc. | | | 43,818 | | | | 2,616,373 | |
| Murphy USA, Inc. | | | 25,152 | | | | 5,029,394 | |
| National Energy Services Reunited Corp.(a) | | | 244,700 | | | | 2,055,480 | |
| | | | | | | | 9,701,247 | |
| Financials — 26.02% | | | | | | | | |
| American National Group, Inc. | | | 18,893 | | | | 3,572,477 | |
| Associated Banc-Corp. | | | 71,360 | | | | 1,624,154 | |
| Camden National Corp. | | | 75,459 | | | | 3,549,590 | |
| Cathay General Bancorp | | | 17,072 | | | | 763,972 | |
| Diamond Hill Investment Group, Inc. | | | 17,413 | | | | 3,261,455 | |
| Employers Holdings, Inc. | | | 106,983 | | | | 4,388,443 | |
| Nelnet, Inc., Class A | | | 28,681 | | | | 2,437,598 | |
| QCR Holdings, Inc. | | | 44,956 | | | | 2,544,060 | |
| Safety Insurance Group, Inc. | | | 56,451 | | | | 5,128,573 | |
| Stewart Information Services Corp. | | | 56,224 | | | | 3,407,737 | |
| StoneX Group, Inc.(a) | | | 59,183 | | | | 4,393,154 | |
| Washington Federal, Inc. | | | 106,416 | | | | 3,492,573 | |
| Washington Trust Bancorp, Inc. | | | 47,573 | | | | 2,497,583 | |
| Waterstone Financial, Inc. | | | 131,794 | | | | 2,548,896 | |
| White Mountains Insurance Group Ltd. | | | 2,276 | | | | 2,586,082 | |
| WSFS Financial Corp. | | | 15,365 | | | | 716,316 | |
| | | | | | | | 46,912,663 | |
| Health Care — 4.85% | | | | | | | | |
| Bioventus, Inc.(a) | | | 62,028 | | | | 874,595 | |
| Haemonetics Corp.(a) | | | 12,405 | | | | 784,244 | |
See accompanying notes which are an integral part of these financial statements.
Dean Small Cap Value Fund
Schedule of Investments (continued)
March 31, 2022
| COMMON STOCKS — 95.66% - continued | | Shares | | | Fair Value | |
| Health Care — 4.85% - continued | | | | | | | | |
| Hanger, Inc.(a) | | | 41,655 | | | $ | 763,536 | |
| National Healthcare Corp. | | | 52,695 | | | | 3,700,770 | |
| Prestige Consumer Healthcare, Inc.(a) | | | 49,622 | | | | 2,626,989 | |
| | | | | | | 8,750,134 | |
| Industrials — 10.52% | | | | | | | | |
| Advanced Energy Industries, Inc. | | | 7,056 | | | | 607,380 | |
| Argan, Inc. | | | 102,544 | | | | 4,162,261 | |
| AZZ, Inc. | | | 35,055 | | | | 1,691,053 | |
| Brady Corp., Class A | | | 22,421 | | | | 1,037,420 | |
| DHT Holdings, Inc. | | | 469,246 | | | | 2,721,627 | |
| Heartland Express, Inc. | | | 313,443 | | | | 4,410,143 | |
| Preformed Line Products Co. | | | 12,064 | | | | 765,099 | |
| Werner Enterprises, Inc. | | | 86,954 | | | | 3,565,114 | |
| | | | | | | 18,960,097 | |
| Materials — 3.84% | | | | | | | | |
| Alamos Gold, Inc., Class A | | | 306,836 | | | | 2,583,558 | |
| Compass Minerals International, Inc. | | | 21,283 | | | | 1,336,360 | |
| Encore Wire Corp. | | | 6,596 | | | | 752,406 | |
| NewMarket Corp. | | | 4,325 | | | | 1,402,944 | |
| Stepan Co. | | | 8,626 | | | | 852,335 | |
| | | | | | | 6,927,603 | |
| Real Estate — 7.96% | | | | | | | | |
| Alexander’s, Inc. | | | 3,528 | | | | 903,979 | |
| CareTrust REIT, Inc. | | | 72,157 | | | | 1,392,630 | |
| CTO Realty Growth, Inc. | | | 46,208 | | | | 3,064,516 | |
| Equity Commonwealth(a) | | | 130,201 | | | | 3,672,971 | |
| Getty Realty Corp. | | | 96,399 | | | | 2,758,939 | |
| Piedmont Office Realty Trust, Inc., Class A | | | 148,752 | | | | 2,561,509 | |
| | | | | | | 14,354,544 | |
| Technology — 5.81% | | | | | | | | |
| Benchmark Electronics, Inc. | | | 82,286 | | | | 2,060,441 | |
| CMC Materials, Inc. | | | 4,211 | | | | 780,719 | |
| CSG Systems International, Inc. | | | 57,816 | | | | 3,675,363 | |
| NextGen Healthcare, Inc.(a) | | | 37,672 | | | | 787,722 | |
| Plexus Corp.(a) | | | 10,243 | | | | 837,980 | |
| Vishay Intertechnology, Inc. | | | 118,708 | | | | 2,326,677 | |
| | | | | | | 10,468,902 | |
| Utilities — 10.38% | | | | | | | | |
| Avista Corp. | | | 71,246 | | | | 3,216,756 | |
| Northwest Natural Holding Co. | | | 22,079 | | | | 1,141,926 | |
| NorthWestern Corp. | | | 52,695 | | | | 3,187,521 | |
| Portland General Electric Co. | | | 50,305 | | | | 2,774,321 | |
| Southwest Gas Holdings, Inc. | | | 63,279 | | | | 4,954,113 | |
| Spire, Inc. | | | 47,915 | | | | 3,438,380 | |
| | | | | | | | 18,713,017 | |
See accompanying notes which are an integral part of these financial statements.
Dean Small Cap Value Fund
Schedule of Investments (continued)
March 31, 2022
| Total Common Stocks/Investments — 95.66% (Cost $156,015,336) | | $ | 172,448,121 | |
| Other Assets in Excess of Liabilities — 4.34% | | | 7,817,545 | |
| NET ASSETS — 100.00% | | $ | 180,265,666 | |
| (a) | Non-income producing security. |
See accompanying notes which are an integral part of these financial statements.
Dean Mid Cap Value Fund
Schedule of Investments
March 31, 2022
| COMMON STOCKS — 95.31% | | Shares | | | Fair Value | |
| Communications — 1.83% | | | | | | | | |
| Omnicom Group, Inc. | | | 17,368 | | | $ | 1,474,196 | |
| | | | | | | | | |
| Consumer Discretionary — 11.47% | | | | | | | | |
| AutoZone, Inc.(a) | | | 836 | | | | 1,709,269 | |
| BorgWarner, Inc. | | | 26,470 | | | | 1,029,683 | |
| Genuine Parts Co. | | | 9,288 | | | | 1,170,474 | |
| Masco Corp. | | | 21,362 | | | | 1,089,462 | |
| Polaris Industries, Inc. | | | 8,545 | | | | 899,959 | |
| PulteGroup, Inc. | | | 23,405 | | | | 980,670 | |
| Skechers U.S.A., Inc., Class A(a) | | | 25,634 | | | | 1,044,842 | |
| Ulta Beauty, Inc.(a) | | | 3,251 | | | | 1,294,613 | |
| | | | | | | 9,218,972 | |
| Consumer Staples — 8.81% | | | | | | | | |
| BJ’s Wholesale Club Holdings, Inc.(a) | | | 26,563 | | | | 1,795,924 | |
| Casey’s General Stores, Inc. | | | 6,316 | | | | 1,251,642 | |
| Conagra Brands, Inc. | | | 37,522 | | | | 1,259,614 | |
| Flowers Foods, Inc. | | | 52,475 | | | | 1,349,132 | |
| Tyson Foods, Inc., Class A | | | 15,882 | | | | 1,423,504 | |
| | | | | | | 7,079,816 | |
| Energy — 5.17% | | | | | | | | |
| Baker Hughes Co. | | | 46,438 | | | | 1,690,808 | |
| Pioneer Natural Resources Co. | | | 9,845 | | | | 2,461,545 | |
| | | | | | | 4,152,353 | |
| Financials — 17.24% | | | | | | | | |
| Allstate Corp. (The) | | | 9,102 | | | | 1,260,718 | |
| Ameriprise Financial, Inc. | | | 4,644 | | | | 1,394,872 | |
| Assurant, Inc. | | | 8,545 | | | | 1,553,737 | |
| Fifth Third Bancorp | | | 35,757 | | | | 1,538,981 | |
| Globe Life, Inc. | | | 13,839 | | | | 1,392,203 | |
| Raymond James Financial, Inc. | | | 16,996 | | | | 1,868,030 | |
| Regions Financial Corp. | | | 50,896 | | | | 1,132,945 | |
| Reinsurance Group of America, Inc. | | | 8,637 | | | | 945,406 | |
| UMB Financial Corp. | | | 12,538 | | | | 1,218,192 | |
| W.R. Berkley Corp. | | | 23,405 | | | | 1,558,540 | |
| | | | | | | 13,863,624 | |
| Health Care — 6.03% | | | | | | | | |
| Chemed Corp. | | | 2,508 | | | | 1,270,427 | |
| Encompass Health Corp. | | | 17,832 | | | | 1,268,034 | |
| Quest Diagnostics, Inc. | | | 8,545 | | | | 1,169,469 | |
| Zimmer Biomet Holdings, Inc. | | | 8,916 | | | | 1,140,356 | |
| | | | | | | 4,848,286 | |
| Industrials — 15.56% | | | | | | | | |
| Curtiss-Wright Corp. | | | 9,009 | | | | 1,352,791 | |
| Dover Corp. | | | 7,709 | | | | 1,209,542 | |
| FTI Consulting, Inc.(a) | | | 7,802 | | | | 1,226,630 | |
| Hubbell, Inc. | | | 7,059 | | | | 1,297,232 | |
| ITT, Inc. | | | 15,975 | | | | 1,201,480 | |
| Littelfuse, Inc. | | | 4,551 | | | | 1,135,065 | |
See accompanying notes which are an integral part of these financial statements.
Dean Mid Cap Value Fund
Schedule of Investments (continued)
March 31, 2022
| COMMON STOCKS — 95.31% - continued | | Shares | | | Fair Value | |
| Industrials — 15.56% - continued | | | | | | | | |
| MSC Industrial Direct Co., Inc., Class A | | | 14,860 | | | $ | 1,266,221 | |
| nVent Electric PLC | | | 41,051 | | | | 1,427,754 | |
| Pentair PLC | | | 17,275 | | | | 936,478 | |
| Republic Services, Inc. | | | 11,052 | | | | 1,464,390 | |
| | | | | | | 12,517,583 | |
| Materials — 9.30% | | | | | | | | |
| Avery Dennison Corp. | | | 5,758 | | | | 1,001,719 | |
| Avient Corp. | | | 21,454 | | | | 1,029,792 | |
| Crown Holdings, Inc. | | | 12,631 | | | | 1,580,012 | |
| Eagle Materials, Inc. | | | 7,802 | | | | 1,001,465 | |
| FMC Corp. | | | 12,074 | | | | 1,588,576 | |
| Steel Dynamics, Inc. | | | 15,232 | | | | 1,270,806 | |
| | | | | | | 7,472,370 | |
| Real Estate — 7.49% | | | | | | | | |
| CBRE Group, Inc., Class A(a) | | | 15,510 | | | | 1,419,475 | |
| Essex Property Trust, Inc. | | | 5,201 | | | | 1,796,841 | |
| Healthcare Trust of America, Inc., Class A | | | 43,373 | | | | 1,359,310 | |
| STAG Industrial, Inc. | | | 34,829 | | | | 1,440,179 | |
| | | | | | | 6,015,805 | |
| Technology — 3.18% | | | | | | | | |
| Arrow Electronics, Inc.(a) | | | 10,309 | | | | 1,222,957 | |
| Broadridge Financial Solutions, Inc. | | | 8,545 | | | | 1,330,542 | |
| | | | | | | 2,553,499 | |
| Utilities — 9.23% | | | | | | | | |
| Ameren Corp. | | | 15,975 | | | | 1,497,816 | |
| Atmos Energy Corp. | | | 13,188 | | | | 1,575,834 | |
| CenterPoint Energy, Inc. | | | 47,924 | | | | 1,468,391 | |
| CMS Energy Corp. | | | 21,826 | | | | 1,526,510 | |
| Xcel Energy, Inc. | | | 18,668 | | | | 1,347,270 | |
| | | | | | | | 7,415,821 | |
| | | | | | | | | |
| Total Common Stocks/Investments — 95.31% (Cost $57,151,650) | | | | | | | 76,612,325 | |
| Other Assets in Excess of Liabilities — 4.69% | | | | | | | 3,767,400 | |
| NET ASSETS — 100.00% | | | | | | $ | 80,379,725 | |
| (a) | Non-income producing security. |
See accompanying notes which are an integral part of these financial statements.
Dean Funds
Statements of Assets and Liabilities
March 31, 2022
| | | Dean Small Cap | | | Dean Mid Cap | |
| | | Value Fund | | | Value Fund | |
| Assets | | | | | | | | |
| Investments in securities at value (cost $156,015,336 and $57,151,650) | | $ | 172,448,121 | | | $ | 76,612,325 | |
| Cash and cash equivalents | | | 7,110,172 | | | | 4,005,567 | |
| Receivable for fund shares sold | | | 24,094 | | | | 3,793 | |
| Receivable for investments sold | | | 1,377,630 | | | | 103,417 | |
| Dividends receivable | | | 225,341 | | | | 114,702 | |
| Prepaid expenses | | | 18,962 | | | | 18,999 | |
| Total Assets | | | 181,204,320 | | | | 80,858,803 | |
| Liabilities | | | | | | | | |
| Payable for investments purchased | | | 709,271 | | | | 392,287 | |
| Payable for fund shares redeemed | | | 35,240 | | | | 14,622 | |
| Payable to Adviser | | | 138,251 | | | | 35,894 | |
| Payable to affiliates | | | 20,946 | | | | 11,006 | |
| Other accrued expenses | | | 34,946 | | | | 25,269 | |
| Total Liabilities | | | 938,654 | | | | 479,078 | |
| Net Assets | | $ | 180,265,666 | | | $ | 80,379,725 | |
| Net Assets consist of: | | | | | | | | |
| Paid-in capital | | $ | 182,914,874 | | | $ | 57,626,601 | |
| Accumulated earnings (deficit) | | | (2,649,208 | ) | | | 22,753,124 | |
| Net Assets | | $ | 180,265,666 | | | $ | 80,379,725 | |
| Shares outstanding (unlimited number of shares authorized, no par value) | | | 9,943,274 | | | | 3,379,113 | |
| Net asset value, offering and redemption price per share | | $ | 18.13 | | | $ | 23.79 | |
See accompanying notes which are an integral part of these financial statements.
Dean Funds
Statements of Operations
For the year ended March 31, 2022
| | | Dean Small Cap | | | Dean Mid Cap | |
| | | Value Fund | | | Value Fund | |
| Investment Income | | | | | | | | |
| Dividend income (net of foreign taxes withheld of $4,298 and $–) | | $ | 4,023,522 | | | $ | 1,308,587 | |
| Interest income | | | 976 | | | | 426 | |
| Total investment income | | | 4,024,498 | | | | 1,309,013 | |
| | | | | | | | | |
| Expenses | | | | | | | | |
| Adviser | | | 1,587,769 | | | | 612,804 | |
| Administration | | | 145,268 | | | | 73,377 | |
| Custodian | | | 39,033 | | | | 13,571 | |
| Transfer agent | | | 30,795 | | | | 10,308 | |
| Fund accounting | | | 30,082 | | | | 20,444 | |
| Registration | | | 24,492 | | | | 24,005 | |
| Legal | | | 22,343 | | | | 22,343 | |
| Audit and tax preparation | | | 18,360 | | | | 18,360 | |
| Trustee | | | 14,661 | | | | 14,661 | |
| Compliance services | | | 12,000 | | | | 12,000 | |
| Report printing | | | 11,520 | | | | 7,421 | |
| Insurance | | | 4,209 | | | | 3,015 | |
| Pricing | | | 1,599 | | | | 1,145 | |
| Miscellaneous | | | 56,648 | | | | 31,562 | |
| Total expenses | | | 1,998,779 | | | | 865,016 | |
| Fees waived by Adviser | | | — | | | | (170,376 | ) |
| Net operating expenses | | | 1,998,779 | | | | 694,640 | |
| Net investment income | | | 2,025,719 | | | | 614,373 | |
| Net Realized and Change in Unrealized Gain (Loss) on Investments | | | | | | | | |
| Net realized gain on investment securities transactions | | | 25,615,419 | | | | 6,557,053 | |
| Net change in unrealized appreciation (depreciation) of investment securities | | | (14,232,164 | ) | | | 1,509,860 | |
| Net realized and change in unrealized gain on investments | | | 11,383,255 | | | | 8,066,913 | |
| Net increase in net assets resulting from operations | | $ | 13,408,974 | | | $ | 8,681,286 | |
See accompanying notes which are an integral part of these financial statements.
Dean Funds
Statements of Changes in Net Assets
| | | Dean Small Cap Value Fund | | | Dean Mid Cap Value Fund | |
| | | For the Year | | | For the Year | | | For the Year | | | For the Year | |
| | | Ended | | | Ended | | | Ended | | | Ended | |
| | | March 31, 2022 | | | March 31, 2021 | | | March 31, 2022 | | | March 31, 2021 | |
| Increase (Decrease) in Net Assets due to: | | | | | | | | | | | | | | | | |
| Operations | | | | | | | | | | | | | | | | |
| Net investment income | | $ | 2,025,719 | | | $ | 1,747,126 | | | $ | 614,373 | | | $ | 656,553 | |
| Net realized gain on investment securities transactions | | | 25,615,419 | | | | 2,034,895 | | | | 6,557,053 | | | | 4,811,594 | |
| Net change in unrealized appreciation (depreciation) of investment securities | | | (14,232,164 | ) | | | 89,313,587 | | | | 1,509,860 | | | | 20,156,186 | |
| Net increase in net assets resulting from operations | | | 13,408,974 | | | | 93,095,608 | | | | 8,681,286 | | | | 25,624,333 | |
| Distributions to Shareholders From: | | | | | | | | | | | | | | | | |
| Earnings | | | (1,786,178 | ) | | | (2,361,460 | ) | | | (4,319,680 | ) | | | (608,981 | ) |
| Total distributions | | | (1,786,178 | ) | | | (2,361,460 | ) | | | (4,319,680 | ) | | | (608,981 | ) |
| Capital Transactions | | | | | | | | | | | | | | | | |
| Proceeds from shares sold | | | 33,284,225 | | | | 51,629,499 | | | | 6,797,142 | | | | 30,635,226 | |
| Reinvestment of distributions | | | 1,447,112 | | | | 1,948,526 | | | | 4,205,623 | | | | 601,186 | |
| Amount paid for shares redeemed | | | (35,136,353 | ) | | | (201,828,242 | ) | | | (14,560,546 | ) | | | (9,348,917 | ) |
| Net increase (decrease) in net assets resulting from capital transactions | | | (405,016 | ) | | | (148,250,217 | ) | | | (3,557,781 | ) | | | 21,887,495 | |
| Total Increase (Decrease) in | | | | | | | | | | | | | | | | |
| Net Assets | | | 11,217,780 | | | | (57,516,069 | ) | | | 803,825 | | | | 46,902,847 | |
| Net Assets | | | | | | | | | | | | | | | | |
| Beginning of year | | | 169,047,886 | | | | 226,563,955 | | | | 79,575,900 | | | | 32,673,053 | |
| End of year | | $ | 180,265,666 | | | $ | 169,047,886 | | | $ | 80,379,725 | | | $ | 79,575,900 | |
| Share Transactions | | | | | | | | | | | | | | | | |
| Shares sold | | | 1,880,020 | | | | 4,526,065 | | | | 286,213 | | | | 1,684,591 | |
| Shares issued in reinvestment of distributions | | | 80,934 | | | | 139,380 | | | | 177,378 | | | | 30,363 | |
| Shares redeemed | | | (1,984,393 | ) | | | (19,190,963 | ) | | | (608,393 | ) | | | (481,662 | ) |
| Net increase (decrease) in shares outstanding | | | (23,439 | ) | | | (14,525,518 | ) | | | (144,802 | ) | | | 1,233,292 | |
See accompanying notes which are an integral part of these financial statements.
Dean Small Cap Value Fund
Financial Highlights
(For a share outstanding during each year)
| | | For the Years Ended March 31, | |
| | 2022 | | | 2021 | | | 2020 | | | 2019 | | | 2018 | |
| Selected Per Share Data: | | | | | | | | | | | | | | | |
| Net asset value, beginning of year | | $ | 16.96 | | | $ | 9.25 | | | $ | 14.19 | | | $ | 14.63 | | | $ | 17.04 | |
| Investment operations: | | | | | | | | | | | | | | | | | | | | |
| Net investment income | | | 0.20 | | | | 0.27 | | | | 0.16 | | | | 0.15 | | | | 0.12 | |
| Net realized and unrealized gain (loss) | | | 1.15 | | | | 7.67 | | | | (4.51 | ) | | | (0.18 | ) | | | 0.19 | (a) |
| Total from investment operations | | | 1.35 | | | | 7.94 | | | | (4.35 | ) | | | (0.03 | ) | | | 0.31 | |
| Less distributions to shareholders from: | | | | | | | | | | | | | | | | | | | | |
| Net investment income | | | (0.18 | ) | | | (0.23 | ) | | | (0.19 | ) | | | (0.20 | ) | | | (0.11 | ) |
| Net realized gains | | | — | | | | — | | | | (0.40 | ) | | | (0.21 | ) | | | (2.61 | ) |
| Total distributions | | | (0.18 | ) | | | (0.23 | ) | | | (0.59 | ) | | | (0.41 | ) | | | (2.72 | ) |
| Net asset value, end of year | | $ | 18.13 | | | $ | 16.96 | | | $ | 9.25 | | | $ | 14.19 | | | $ | 14.63 | |
| Total Return(b) | | | 7.98 | % | | | 86.33 | % | | | (32.14 | )% | | | (0.08 | )% | | | 1.59 | % |
| Ratios and Supplemental Data: | | | | | | | | | | | | | | | | | | | | |
| Net assets, end of year (000 omitted) | | $ | 180,266 | | | $ | 169,048 | | | $ | 226,564 | | | $ | 321,178 | | | $ | 350,182 | |
| Ratio of net expenses to average net assets | | | 1.13 | % | | | 1.19 | % | | | 1.15 | % | | | 1.12 | % | | | 1.18 | % |
| Ratio of gross expenses to average net assets before waiver or recoupment | | | 1.13 | % | | | 1.19 | % | | | 1.15 | % | | | 1.12 | % | | | 1.18 | % |
| Ratio of net investment income to average net assets | | | 1.15 | % | | | 1.16 | % | | | 1.14 | % | | | 1.04 | % | | | 0.97 | % |
| Portfolio turnover rate | | | 57 | % | | | 181 | % | | | 157 | % | | | 120 | % | | | 165 | % |
| (a) | The amount shown for a share outstanding throughout the period does not accord with the change in aggregate gains and losses in the portfolio of securities during the period because of the timing of sales and purchases of fund shares in relation to fluctuating market values during the period. |
| (b) | Total return represents the rate that the investor would have earned or lost on an investment in the Fund, assuming reinvestment of distributions. |
See accompanying notes which are an integral part of these financial statements.
Dean Mid Cap Value Fund
Financial Highlights
(For a share outstanding during each year)
| | | For the Years Ended March 31, | |
| | | 2022 | | | 2021 | | | 2020 | | | 2019 | | | 2018 | |
| Selected Per Share Data: | | | | | | | | | | | | | | | |
| Net asset value, beginning of year | | $ | 22.58 | | | $ | 14.26 | | | $ | 19.83 | | | $ | 19.87 | | | $ | 18.92 | |
| Investment operations: | | | | | | | | | | | | | | | | | | | | |
| Net investment income | | | 0.19 | | | | 0.16 | | | | 0.22 | | | | 0.22 | | | | 0.08 | |
| Net realized and unrealized gain (loss) | | | 2.34 | | | | 8.34 | | | | (4.08 | ) | | | 0.36 | | | | 1.40 | |
| Total from investment operations | | | 2.53 | | | | 8.50 | | | | (3.86 | ) | | | 0.58 | | | | 1.48 | |
| Less distributions to shareholders from: | | | | | | | | | | | | | | | | | | | | |
| Net investment income | | | (0.20 | ) | | | (0.18 | ) | | | (0.22 | ) | | | (0.16 | ) | | | (0.10 | ) |
| Net realized gains | | | (1.12 | ) | | | — | | | | (1.49 | ) | | | (0.46 | ) | | | (0.43 | ) |
| Total distributions | | | (1.32 | ) | | | (0.18 | ) | | | (1.71 | ) | | | (0.62 | ) | | | (0.53 | ) |
| Net asset value, end of year | | $ | 23.79 | | | $ | 22.58 | | | $ | 14.26 | | | $ | 19.83 | | | $ | 19.87 | |
| Total Return(a) | | | 11.22 | % | | | 59.75 | % | | | (22.04 | )% | | | 3.10 | % | | | 7.79 | % |
| Ratios and Supplemental Data: | | | | | | | | | | | | | | | | | | | | |
| Net assets, end of year (000 omitted) | | $ | 80,380 | | | $ | 79,576 | | | $ | 32,673 | | | $ | 41,889 | | | $ | 34,093 | |
| Ratio of net expenses to average net assets | | | 0.85 | % | | | 0.85 | % | | | 1.02 | % | | | 1.10 | % | | | 1.10 | % |
| Ratio of gross expenses to average net assets before waiver or recoupment | | | 1.06 | % | | | 1.15 | % | | | 1.30 | % | | | 1.40 | % | | | 1.53 | % |
| Ratio of net investment income to average net assets | | | 0.75 | % | | | 1.20 | % | | | 1.14 | % | | | 1.20 | % | | | 0.49 | % |
| Portfolio turnover rate | | | 27 | % | | | 65 | % | | | 76 | % | | | 46 | % | | | 52 | % |
| (a) | Total return represents the rate that the investor would have earned or lost on an investment in the Fund, assuming reinvestment of distributions. |
See accompanying notes which are an integral part of these financial statements.
| Dean Funds |
| Notes to the Financial Statements |
| March 31, 2022 |
NOTE 1. ORGANIZATION
The Dean Small Cap Value Fund (the “Small Cap Fund”) and the Dean Mid Cap Value Fund (the “Mid Cap Fund”) (each a “Fund” and, collectively the “Funds”) were each registered under the Investment Company Act of 1940, as amended (“1940 Act”), as diversified series of Unified Series Trust (the “Trust”) on November 13, 2006. The Trust is an open-end investment company established under the laws of Ohio by an Agreement and Declaration of Trust dated October 14, 2002, as amended from time to time (the “Trust Agreement”). The Trust Agreement permits the Board of Trustees (the “Board”) to issue an unlimited number of shares of beneficial interest of separate series. The Funds are each a series of the Trust currently authorized by the Board. The investment adviser to each Fund is Dean Investment Associates, LLC (“Dean Investment Associates” or “Adviser”). In addition, the Adviser has retained Dean Capital Management, LLC (“DCM” or “Sub-Adviser”) to serve as sub-adviser to the Funds. DCM is an affiliate of the Adviser. The investment objective of each Fund is long-term capital appreciation and, secondarily, dividend income.
NOTE 2. SIGNIFICANT ACCOUNTING POLICIES
The Funds are investment companies and follow accounting and reporting guidance under Financial Accounting Standards Board Accounting Standards Codification (“ASC”) Topic 946, “Financial Services-Investment Companies” including Accounting Standards Update 2013-08. The following is a summary of significant accounting policies followed by the Funds in the preparation of their financial statements. These policies are in conformity with generally accepted accounting principles in the United States of America (“GAAP”).
Estimates – The preparation of financial statements in conformity with GAAP requires management to make estimates and assumptions that affect the reported amounts of assets and liabilities and disclosure of contingent assets and liabilities at the date of the financial statements and the reported amounts of increases and decreases in net assets from operations during the reporting period. Actual results could differ from those estimates.
Federal Income Taxes – The Funds make no provision for federal income or excise tax. Each Fund has qualified and intends to qualify each year as a regulated investment company (“RIC”) under subchapter M of the Internal Revenue Code of 1986, as amended, by complying with the requirements applicable to RICs and by distributing substantially all of its taxable income. Each Fund also intends to distribute sufficient net investment income and net capital gains, if any, so that it will not be subject to excise tax on undistributed income and gains. If the required amount of net investment income or gains is not distributed, the Funds could incur a tax expense.
As of and during the fiscal year ended March 31, 2022, the Funds did not have any liabilities for any unrecognized tax benefits. The Funds recognize interest and penalties, if any, related
| Dean Funds |
| Notes to the Financial Statements (continued) |
| March 31, 2022 |
to unrecognized tax benefits as income tax expense in the Statements of Operations when incurred. During the year, the Funds did not incur any interest or penalties. Management of the Funds has reviewed tax positions taken in tax years that remain subject to examination by all major tax jurisdictions, including federal (i.e., the previous three tax year ends and the interim tax period since then, as applicable) and has concluded that no provision for unrecognized tax benefits or expenses is required in these financial statements and does not expect this to change over the next twelve months.
Expenses – Expenses incurred by the Trust that do not relate to a specific fund of the Trust are allocated to the individual funds based on each fund’s relative net assets or another appropriate basis (as determined by the Board).
Security Transactions and Related Income – The Funds follow industry practice and record security transactions on the trade date for financial reporting purposes. The specific identification method is used for determining gains or losses for financial statements and income tax purposes. Dividend income is recorded on the ex-dividend date and interest income is recorded on an accrual basis. Distributions received from investments in real estate investment trusts (“REITs”) that represent a return of capital or capital gain are recorded as a reduction of the cost of investment or as a realized gain, respectively. The calendar year-end amounts of ordinary income, capital gains, and return of capital included in distributions received from the Funds’ investments in REITs are reported to the Funds after the end of the calendar year; accordingly, the Funds estimate these amounts for accounting purposes until the characterization of REIT distributions is reported. Estimates are based on the most recent REIT distributions information available. Withholding taxes on foreign dividends and related reclaims have been provided for in accordance with the Funds’ understanding of the applicable country’s tax rules and rates.
Dividends and Distributions – Each Fund intends to distribute its net investment income and net realized long-term and short-term capital gains, if any, at least annually. Dividends and distributions to shareholders, which are determined in accordance with income tax regulations, are recorded on the ex-dividend date. The treatment for financial reporting purposes of distributions made to shareholders during the period from net investment income or net realized capital gains may differ from their ultimate treatment for federal income tax purposes. These differences are caused primarily by differences in the timing of the recognition of certain components of income, expense or realized capital gain for federal income tax purposes. Where such differences are permanent in nature, they are reclassified among the components of the net assets based on their ultimate characterization for federal income tax purposes. Any such reclassifications will have no effect on net assets, results of operations or net asset value (“NAV”) per share of the Funds.
| Dean Funds |
| Notes to the Financial Statements (continued) |
| March 31, 2022 |
Cash and Cash Equivalents — Idle cash may be swept into various interest bearing overnight demand deposits and is classified as a cash equivalent on the Statements of Assets and Liabilities. The Funds maintain cash in the bank deposit accounts which, at times, may exceed the Federal Deposit Insurance Corporation (FDIC) limit of $250,000. Amounts swept overnight are available on the next business day.
NOTE 3. SECURITIES VALUATION AND FAIR VALUE MEASUREMENTS
Each Fund values its portfolio securities at fair value as of the close of regular trading on the New York Stock Exchange (“NYSE”) (normally 4:00 p.m. Eastern time) on each business day the NYSE is open for business. Fair value is defined as the price that a Fund would receive upon selling an investment in a timely transaction to an independent buyer in the principal or most advantageous market of the investment. GAAP establishes a three-tier hierarchy to maximize the use of observable market data and minimize the use of unobservable inputs and to establish classification of fair value measurements for disclosure purposes.
Inputs refer broadly to the assumptions that market participants would use in pricing the asset or liability, including assumptions about risk (the risk inherent in a particular valuation technique used to measure fair value including a pricing model and/or the risk inherent in the inputs to the valuation technique). Inputs may be observable or unobservable. Observable inputs are inputs that reflect the assumptions market participants would use in pricing the asset or liability developed based on market data obtained and available from sources independent of the reporting entity. Unobservable inputs are inputs that reflect the reporting entity’s own assumptions about the assumptions market participants would use in pricing the asset or liability developed based on the best information available in the circumstances.
Various inputs are used in determining the value of each Fund’s investments. These inputs are summarized in the three broad levels listed below.
| ● | Level 1 – unadjusted quoted prices in active markets for identical investments and/or registered investment companies where the value per share is determined and published and is the basis for current transactions for identical assets or liabilities at the valuation date |
| ● | Level 2 – other significant observable inputs (including, but not limited to, quoted prices for an identical security in an inactive market, quoted prices for similar securities, interest rates, prepayment speeds, credit risk, etc.) |
| ● | Level 3 – significant unobservable inputs (including the Funds’ own assumptions in determining fair value of investments based on the best information available) |
| Dean Funds |
| Notes to the Financial Statements (continued) |
| March 31, 2022 |
The inputs used to measure fair value may fall into different levels of the fair value hierarchy. In such cases, for disclosure purposes, the level in the fair value hierarchy which is reported is determined based on the lowest level input that is significant to the fair value measurement in its entirety.
Equity securities that are traded on any stock exchange are generally valued at the last quoted sale price on the security’s primary exchange. Lacking a last sale price, an exchange-traded security is generally valued at its last bid price. Securities traded in the NASDAQ over-the-counter market are generally valued at the NASDAQ Official Closing Price. When using market quotations and when the market is considered active, the security is classified as a Level 1 security. In the event that market quotations are not readily available or are considered unreliable due to market or other events, a Fund values its securities and other assets at fair value in accordance with policies established by and under the general supervision of the Board. Under these policies, the securities will be classified as Level 2 or 3 within the fair value hierarchy, depending on the inputs used.
Investments in mutual funds, including money market mutual funds, are generally priced at the ending NAV provided by the service agent of the mutual funds. These securities are categorized as Level 1 securities.
In accordance with the Trust’s valuation policies, the Adviser and/or Sub-Adviser is required to consider all appropriate factors relevant to the value of securities for which it has determined other pricing sources are not available or reliable as described above. No single method exists for determining fair value, because fair value depends upon the circumstances of each individual case. As a general principle, the current fair value of a security being valued by the Adviser and/or Sub-Adviser would be the amount that the Fund might reasonably expect to receive upon the current sale. Methods that are in accordance with this principle may, for example, be based on (i) a multiple of earnings; (ii) a discount from market prices of a similar freely traded security (including a derivative security or a basket of securities traded on other markets, exchanges or among dealers); or (iii) yield to maturity with respect to debt issues, or a combination of these and other methods. Fair-value pricing is permitted if, in the Adviser and/or Sub-Adviser’s opinion, the validity of market quotations appears to be questionable based on factors such as evidence of a thin market in the security based on a small number of quotations, a significant event occurs after the close of a market but before a Fund’s NAV calculation that may affect a security’s value, or the Adviser and/or Sub-Adviser is aware of any other data that calls into question the reliability of market quotations.
| Dean Funds |
| Notes to the Financial Statements (continued) |
| March 31, 2022 |
The following is a summary of the inputs used to value the Funds’ investments as of March 31, 2022:
| Small Cap Fund | | Valuation Inputs | |
| Assets | | Level 1 | | | Level 2 | | | Level 3 | | | Total | |
| Common Stocks(a) | | $ | 172,448,121 | | | $ | — | | | $ | — | | | $ | 172,448,121 | |
| Total | | $ | 172,448,121 | | | $ | — | | | $ | — | | | $ | 172,448,121 | |
| | | | | | | | | | | | | | | | | |
| Mid Cap Fund | | Valuation Inputs | |
| Assets | | Level 1 | | | Level 2 | | | Level 3 | | | Total | |
| Common Stocks(a) | | $ | 76,612,325 | | | $ | — | | | $ | — | | | $ | 76,612,325 | |
| Total | | $ | 76,612,325 | | | $ | — | | | $ | — | | | $ | 76,612,325 | |
| (a) | Refer to Schedule of Investments for sector classifications. |
The Funds did not hold any investments at the end of the reporting period for which significant unobservable inputs (Level 3) were used in determining fair value; therefore, no reconciliation of Level 3 securities is included for this reporting period.
NOTE 4. FEES AND OTHER TRANSACTIONS WITH AFFILIATES AND OTHER SERVICE PROVIDERS
Each Fund’s investments are managed by the Adviser pursuant to the terms of an advisory agreement with the Trust. The Adviser has hired the Sub-Adviser to manage the Funds’ assets on a day-to-day basis. The Sub-Adviser is paid by the Adviser. In accordance with the advisory agreement for each Fund, the Adviser is entitled to an investment advisory fee, computed and accrued daily and paid monthly, at an annual rate of 0.90% and 0.75% of the average daily net assets of the Small Cap Fund and Mid Cap Fund, respectively. For the fiscal year ended March 31, 2022, the Adviser earned fees, before the waiver described below, of $1,587,769 and $612,804 from the Small Cap Fund and the Mid Cap Fund, respectively. At March 31, 2022, the Adviser was owed $138,251 from the Small Cap Fund and $35,894 from the Mid Cap Fund.
The Adviser has contractually agreed to waive its management fee and/or to reimburse certain Fund operating expenses, but only to the extent necessary so that total annual operating expenses, excluding portfolio transaction and other investment-related costs (including brokerage fees and commissions); taxes; borrowing costs (such as interest and dividend expenses on securities sold short); acquired fund fees and expenses; fees and expenses associated with investments in other collective investment vehicles or derivative instruments (including for example option and swap fees and expenses); any amounts payable pursuant to a distribution or service plan adopted in accordance with Rule 12b-1 under the 1940 Act; expenses incurred in connection with any merger or reorganization; extraordinary expenses (such as litigation expenses, indemnification of Trust officers and Trustees and contractual indemnification of Fund service providers, and other expenses that
| Dean Funds |
| Notes to the Financial Statements (continued) |
| March 31, 2022 |
the Trustees agree have not been incurred in the ordinary course of the Funds’ business), do not exceed 1.25% of the Small Cap Fund’s average daily net assets and 0.85% of the Mid Cap Fund’s average daily net assets. The contractual agreement with respect to each Fund is in place through July 31, 2022. For the fiscal year ended March 31, 2022, the Adviser waived fees of $170,376 for the Mid Cap Fund.
Each waiver/expense payment by the Adviser is subject to recoupment by the Adviser from the Fund in the three years following the date the particular waiver/expense payment occurred, but only if such recoupment can be achieved without exceeding the annual expense limitation in effect at the time of the waiver/expense payment and any expense limitation in effect at the time of recoupment. As of March 31, 2022, the Adviser may seek repayment of investment advisory fees waived and expense reimbursements pursuant to the aforementioned conditions, from the Mid Cap Fund no later than the dates stated below:
| Recoverable Through | | Mid Cap Fund | |
| March 31, 2023 | | $ | 118,935 | |
| March 31, 2024 | | | 163,089 | |
| March 31, 2025 | | | 170,376 | |
Ultimus Fund Solutions, LLC (“Ultimus”) provides administration, fund accounting and transfer agent services to the Funds. The Funds pay Ultimus fees in accordance with the agreements for such services.
Northern Lights Compliance Services, LLC (“NLCS”), an affiliate of Ultimus, provides a Chief Compliance Officer to the Trust, as well as related compliance services, pursuant to a consulting agreement between NLCS and the Trust. Under the terms of such agreement, NLCS receives fees from the Funds, which are approved annually by the Board.
Under the terms of a Distribution Agreement with the Trust, Ultimus Fund Distributors, LLC (the “Distributor”) serves as principal underwriter to the Funds. The Distributor is a wholly-owned subsidiary of Ultimus. The Distributor is compensated by the Adviser (not the Funds) for acting as principal underwriter.
Certain officers and a Trustee of the Trust are also employees of Ultimus and such persons are not paid by the Funds for serving in such capacities.
The Board supervises the business activities of the Trust. Each Trustee serves as a trustee until termination of the Trust unless the Trustee dies, resigns, retires, or is removed. The Chairman of the Board and more than 75% of the Trustees are “Independent Trustees,” which means that they are not “interested persons” as defined in the 1940 Act. Each Independent Trustee of the Trust receives annual compensation of $2,785 per fund from the Trust, except that the Chairman of the Audit Committee, the Chairman of the Governance
| Dean Funds |
| Notes to the Financial Statements (continued) |
| March 31, 2022 |
& Nominating Committee, and the Chairman of the Pricing & Liquidity Committee each receives annual compensation of $3,235 per fund from the Trust, and the Independent Chairman of the Board receives $3,435 per fund from the Trust. Independent Trustees also receive $1,000 for attending any special meeting that requires an in person approval of a contract and $250 for the first hour and $200 for each additional hour for attending other special meetings. In addition, the Trust reimburses Independent Trustees for out-of-pocket expenses incurred in conjunction with attendance at meetings.
NOTE 5. PURCHASES AND SALES OF SECURITIES
For the fiscal year ended March 31, 2022, purchases and sales of investment securities, other than short-term investments were as follows:
| | | Purchases | | | Sales | |
| Small Cap Fund | | $ | 95,629,834 | | | $ | 96,287,897 | |
| Mid Cap Fund | | | 21,254,751 | | | | 29,698,816 | |
There were no purchases or sales of long-term U.S. government obligations during the fiscal year ended March 31, 2022.
NOTE 6. FEDERAL TAX INFORMATION
At March 31, 2022, the net unrealized appreciation (depreciation) and tax cost of investments for tax purposes was as follows:
| | | Small Cap | | | Mid Cap | |
| | | Fund | | | Fund | |
| Gross unrealized appreciation | | $ | 20,076,915 | | | $ | 20,098,352 | |
| Gross unrealized depreciation | | | (5,712,757 | ) | | | (661,054 | ) |
| Net unrealized appreciation | | $ | 14,364,158 | | | $ | 19,437,298 | |
| Tax cost of investments | | $ | 158,083,963 | | | $ | 57,175,027 | |
The tax character of distributions paid for the fiscal years ended March 31, 2022 and March 31, 2021 were as follows:
| | | Small Cap Fund | | | Mid Cap Fund | |
| | | 2022 | | | 2021 | | | 2022 | | | 2021 | |
| Distributions paid from: | | | | | | | | | | | | | | | | |
| Ordinary income(a) | | $ | 1,786,178 | | | $ | 2,361,460 | | | $ | 1,278,861 | | | $ | 608,981 | |
| Long-term capital gains | | | — | | | | — | | | | 3,040,819 | | | | — | |
| Total distributions paid | | $ | 1,786,178 | | | $ | 2,361,460 | | | $ | 4,319,680 | | | $ | 608,981 | |
| (a) | Short-term capital gain distributions are treated as ordinary income for tax purposes. |
| Dean Funds |
| Notes to the Financial Statements (continued) |
| March 31, 2022 |
At March 31, 2022, the components of accumulated earnings (deficit) on a tax basis were as follows:
| | | Small Cap Fund | | | Mid Cap Fund | |
| Undistributed ordinary income | | $ | 1,297,357 | | | $ | 140,212 | |
| Undistributed long-term capital gains | | | — | | | | 3,175,614 | |
| Accumulated capital and other losses | | | (18,310,723 | ) | | | — | |
| Unrealized appreciation on investments | | | 14,364,158 | | | | 19,437,298 | |
| Total accumulated earnings (deficit) | | $ | (2,649,208 | ) | | $ | 22,753,124 | |
The difference between book basis and tax basis of unrealized appreciation (depreciation) is primarily attributable to the tax deferral of losses on wash sales.
As of March 31, 2022, the Small Cap Fund had short-term and long-term capital loss carryforwards of $891,705 and $17,419,018, respectively. These capital loss carryforwards, which do not expire, may be utilized in future years to offset net realized capital gains, if any, prior to distributing such gains to shareholders.
NOTE 7. SECTOR RISK
If a Fund has significant investments in the securities of issuers within a particular sector, any development affecting that sector will have a greater impact on the value of the net assets of the Fund than would be the case if the Fund did not have significant investments in that sector. In addition, this may increase the risk of loss in the Fund and increase the volatility of the Fund’s NAV per share. For instance, economic or market factors, regulatory changes or other developments may negatively impact all companies in a particular sector, and therefore the value of the Fund’s portfolio will be adversely affected. As of March 31, 2022, the Small Cap Fund had 26.02% of the value of its net assets invested in stocks within the Financials sector.
NOTE 8. COMMITMENTS AND CONTINGENCIES
The Trust indemnifies its officers and Trustees for certain liabilities that may arise from their performance of their duties to the Trust or the Funds. Additionally, in the normal course of business, the Trust enters into contracts that contain a variety of representations and warranties which provide general indemnifications. The Trust’s maximum exposure under these arrangements is unknown, as this would involve future claims that may be made against the Trust that have not yet occurred.
| Dean Funds |
| Notes to the Financial Statements (continued) |
| March 31, 2022 |
NOTE 9. SUBSEQUENT EVENTS
Management of the Funds has evaluated the need for disclosures and/or adjustments resulting from subsequent events through the date at which these financial statements were issued. Based upon this evaluation, management has determined there were no items requiring adjustment of the financial statements or additional disclosure.
| Report of Independent Registered Public Accounting Firm |
To the Shareholders of Dean Funds and
Board of Trustees of Unified Series Trust
Opinion on the Financial Statements
We have audited the accompanying statements of assets and liabilities, including the schedules of investments, of Dean Funds, comprising Dean Small Cap Value Fund and Dean Mid Cap Value Fund (the “Funds”), each a series of Unified Series Trust, as of March 31, 2022, the related statements of operations for the year then ended, the statements of changes in net assets for each of the two years in the period then ended, the related notes, and the financial highlights for each of the five years in the period then ended (collectively referred to as the “financial statements”). In our opinion, the financial statements present fairly, in all material respects, the financial position of each of the Funds as of March 31, 2022, the results of their operations for the year then ended, the changes in net assets for each of the two years in the period then ended, and the financial highlights for each of the five years in the period then ended, in conformity with accounting principles generally accepted in the United States of America.
Basis for Opinion
These financial statements are the responsibility of the Funds’ management. Our responsibility is to express an opinion on the Funds’ financial statements based on our audits. We are a public accounting firm registered with the Public Company Accounting Oversight Board (United States) (“PCAOB”) and are required to be independent with respect to the Funds in accordance with the U.S. federal securities laws and the applicable rules and regulations of the Securities and Exchange Commission and the PCAOB.
We conducted our audits in accordance with the standards of the PCAOB. Those standards require that we plan and perform the audit to obtain reasonable assurance about whether the financial statements are free of material misstatement whether due to error or fraud.
Our audits included performing procedures to assess the risks of material misstatement of the financial statements, whether due to error or fraud, and performing procedures that respond to those risks. Such procedures included examining, on a test basis, evidence regarding the amounts and disclosures in the financial statements. Our procedures included confirmation of securities owned as of March 31, 2022, by correspondence with the custodian and brokers; when replies were not received from brokers, we performed other auditing procedures. Our audits also included evaluating the accounting principles used and significant estimates made by management, as well as evaluating the overall presentation of the financial statements. We believe that our audits provide a reasonable basis for our opinion.
We have served as the Funds’ auditor since 2007.
COHEN & COMPANY, LTD.
Chicago, Illinois
May 26, 2022
| Investment Advisory Agreement Approval (Unaudited) |
The Dean Mid Cap Value Fund (the “Mid Cap Fund”) and the Dean Small Cap Value Fund (the “Small Cap Fund”) (together the “Funds” and each, a “Fund”) are series of Unified Series Trust (the “Trust”). The Trust’s Board of Trustees (the “Board”) oversees the management of the Funds and, as required by law, has considered the approval of the continuance of the Funds’ management agreements with their investment adviser, Dean Investment Associates, LLC (“DIA”) and the sub-advisory agreement between DIA and Dean Capital Management, LLC (“DCM”).
The Board requested and evaluated all information that the Trustees deemed reasonably necessary under the circumstances in connection with the approval of the continuance of the management agreements and the sub-advisory agreement.
The Trustees held a teleconference on November 10, 2021 to review and discuss materials compiled by Ultimus Fund Solutions, LLC, the Trust’s administrator, with regard to the management agreements between the Trust and DIA, and the sub-advisory agreement between DIA and DCM. At the Trustees’ quarterly meeting held in November 2021, the Board interviewed certain executives of DIA and DCM, including DIA’s Chief Compliance Officer and its President, DCM’s Chief Compliance Officer and portfolio managers. The Trustees, including the Trustees who are not “interested persons” (as that term is defined in the Investment Company Act of 1940) of the Trust, DIA or DCM (the “Independent Trustees”), approved the continuance of the management agreements between the Trust and DIA, and the sub-advisory agreement between DIA and DCM, for an additional year. The Trustees’ approval of the continuance of the Fund’s management agreements was based on a consideration of all the information provided to the Trustees, and was not the result of any single factor. Some of the factors that figured particularly in the Trustees’ deliberations are described below, although individual Trustees may have evaluated this information differently, ascribing different weights to various factors.
(i) The Nature, Extent, and Quality of Services. The Trustees reviewed and considered information regarding the nature, extent, and quality of services that DIA and DCM provide to the Funds, which include, but are not limited to, providing a continuous investment program for the Funds, adhering to the Funds’ investment restrictions, complying with the Trust’s policies and procedures, and voting proxies on behalf of the Funds. The Trustees considered the qualifications and experience of DCM’s portfolio managers who are responsible for the day-to-day management of the Funds’ portfolios, as well as the qualifications and experience of the other individuals at DIA and DCM who provide services to the Funds. The Trustees also considered the favorable compliance report from the Trust’s Chief Compliance Officer. The Trustees then reviewed the services provided by DIA in its oversight of DCM, noting that the two investment advisers are affiliated. The Trustees considered that the work of DIA is not duplicative of DCM and that each is responsible for a significant amount of work on behalf of the Funds. The Trustees concluded that they continue to be impressed with the nature, extent, and quality of investment management services provided by each of DIA and DCM to the Funds and their commitment to value investing.
(ii) Fund Performance. The Trustees next reviewed and discussed the Funds’ performance for periods ended September 30, 2021. The Trustees observed that the Small Cap Fund had underperformed its primary benchmark, the Russell 2000 Value Index over the year-to-date, one-, three-, and five- ten- and fifteen-year periods. The Trustees noted that the Small Cap Fund had underperformed its Morningstar Small-Cap Value category average over each period except the ten-year period, in which it slightly outperformed the category. The Trustees considered DIA and DCM’s commitment to style purity and their explanation that in seeking value, the Small Cap Fund
| Investment Advisory Agreement Approval (Unaudited) (continued) |
had moved into smaller capitalization companies compared to the benchmark and the category. The Trustees observed that the Mid Cap Fund had underperformed its primary benchmark, the Russell Midcap Value Index, over the year -to-date, one-, three-, five-, ten- and fifteen-year periods. The Trustees noted that the Mid Cap Fund underperformed its Morningstar Mid-Cap Value category average over each period except the ten-year period, in which it slightly outperformed the category. The Trustees noted that the Mid Cap Fund changed its investment strategy from Large Cap Value to Mid Cap Value on March 11, 2011 and thus has passed the ten-year anniversary of that change. The Trustees also noted that the Funds performed comparably to DIA’s separately managed accounts that have similar investment strategies, considering differences in fees and methods of calculating performance. The Trustees considered the Funds’ performance to be satisfactory.
(iii) Fee Rate and Profitability. The Trustees reviewed fee and expense comparisons for funds in the respective Morningstar category. The comparisons indicated that the Small Cap Fund’s management fee and net expense ratio are slightly higher than the averages for its category. The comparisons indicated that the Mid Cap Fund’s management fee and net expense ratio are also higher than the averages for its category and that DIA is continuing the expense limitation agreements for the Funds. The Trustees considered that both Funds have net assets that are on the low side of the comparison groups. The Trustees discussed and considered both the management fee and the sub-advisory fee and noted that that the management fee for both Funds is lower than the highest management fee in a sliding fee scale for DIA’s separately managed accounts.
The Trustees also considered profitability analyses prepared by DIA and DCM for their management of each Fund, which indicated that, both before and after the deduction of marketing expenses, DIA is earning a profit as a result of managing the Small Cap Fund but is not earning a profit as a result of managing the Mid Cap Fund. The Trustees considered that DCM is earning a profit both before and after deduction of marketing expenses as a result of managing the Small Cap Fund and that DCM is earning a profit before deduction of marketing expenses as a result of managing the Mid Cap Fund, but is not earning a profit after deduction of marketing expenses for the Mid Cap Fund. The Trustees determined that the profits for DIA and DCM were not excessive, based in part on their review of expense comparisons in the Broadridge 15(c) report prepared for the Board.
The Trustees also considered other potential benefits that DIA or DCM may receive in connection with its management of the Funds and noted neither DIA nor DCM utilizes any soft dollars. After considering the above information, the Trustees concluded that the current management fee and sub-advisory fee for each Fund represent reasonable compensation in light of the nature and quality of DIA’s and DCM’s respective services to the Funds, the fees paid by competitive mutual funds, and the profitability of DIA’s and DCM’s services to the Funds.
(iv) Economies of Scale. In determining the reasonableness of the management fee and sub-advisory fee for each Fund, the Trustees also considered the extent to which DIA and DCM will realize economies of scale as such Fund grows larger. The Trustees determined that, in light of the size of the Funds and DIA’s and DCM’s levels of profitability in managing the Funds, it does not appear that DIA or DCM is realizing benefits from economies of scale in managing the Funds to such an extent that breakpoints should be implemented at this time.
| Summary of Fund Expenses (Unaudited) |
As a shareholder of a Fund, you incur two types of costs: (1) transaction costs and (2) ongoing costs, including management fees and other Fund expenses. These examples are intended to help you understand your ongoing costs (in dollars) of investing in each Fund and to compare these costs with the ongoing costs of investing in other funds. You may pay brokerage commissions on purchases and sales of exchange-traded fund shares, which are not reflected in the example. Each Fund’s example is based on an investment of $1,000 invested at the beginning of the period and held for the entire period from October 1, 2021 through March 31, 2022.
Actual Expenses
The first line of the table below provides information about actual account values and actual expenses. You may use the information in this line, together with the amount you invested, to estimate the expenses that you paid over the period. Simply divide your account value by $1,000 (for example, an $8,600 account value divided by $1,000 = 8.6), then multiply the result by the number in the first line under the heading “Expenses Paid During the Period” to estimate the expenses you paid on your account during this period.
Hypothetical Example for Comparison Purposes
The second line of the table below provides information about hypothetical account values and hypothetical expenses based on the Fund’s actual expense ratio and an assumed rate of return of 5% per year before expenses, which is not the Fund’s actual return. The hypothetical account values and expenses may not be used to estimate the actual ending account balance or expenses you paid for the period. You may use this information to compare the ongoing costs of investing in the Fund and other funds. To do so, compare this 5% hypothetical example with the 5% hypothetical examples that appear in the shareholder reports of other funds.
Expenses shown in the table are meant to highlight your ongoing costs only and do not reflect any transactional costs. Therefore, the second line of the table below is useful in comparing ongoing costs only and will not help you determine the relative costs of owning different funds. In addition, if transaction costs were included, your costs would have been higher.
| | | | | Beginning | | | Ending | | | | | | |
| | | | | Account | | | Account | | | Expenses | | | |
| | | | | Value | | | Value | | | Paid | | | Annualized |
| | | | | October 1, | | | March 31, | | | During | | | Expense |
| | | | | 2021 | | | 2022 | | | Period(a) | | | Ratio |
| Small Cap Fund | | | | | | | | | | | |
| | | Actual | | $ | 1,000.00 | | | $ | 1,056.10 | | | $ | 5.72 | | | 1.12% |
| | | Hypothetical(b) | | $ | 1,000.00 | | | $ | 1,019.37 | | | $ | 5.62 | | | 1.12% |
| Mid Cap Fund | | | | | | | | | | | | | | |
| | | Actual | | $ | 1,000.00 | | | $ | 1,076.90 | | | $ | 4.40 | | | 0.85% |
| | | Hypothetical(b) | | $ | 1,000.00 | | | $ | 1,020.69 | | | $ | 4.28 | | | 0.85% |
| (a) | Expenses are equal to the Fund’s annualized expense ratios, multiplied by the average account value over the period, multiplied by 182/365 (to reflect the one-half year period). |
| (b) | Hypothetical assumes 5% annual return before expenses. |
| Additional Federal Income Tax Information (Unaudited) |
The Form 1099-DIV you receive in January 2023 will show the tax status of all distributions paid to your account in calendar year 2022. Shareholders are advised to consult their own tax adviser with respect to the tax consequences of their investment in the Fund. As required by the Internal Revenue Code and/or regulations, shareholders must be notified regarding the status of qualified dividend income for individuals and the dividends received deduction for corporations.
Qualified Dividend Income. The Funds designate the following percentage or up to the maximum amount of such dividends allowable pursuant to the Internal Revenue Code, as qualified dividend income eligible for the reduced tax rate.
| Mid Cap Fund | | Small Cap Fund |
| 100% | | 100% |
Qualified Business Income. The Funds designate the following percentage of ordinary income dividends, or up to the maximum amount of such dividends allowable pursuant to the Internal Revenue Code, as qualified business income.
| Mid Cap Fund | | Small Cap Fund |
| — | | — |
Dividends Received Deduction. Corporate shareholders are generally entitled to take the dividends received deduction on the portion of the Funds’ dividend distribution that qualifies under tax law. For the Funds’ calendar year 2022 ordinary income dividends, the following percentage qualifies for the corporate dividends received deduction.
| Mid Cap Fund | | Small Cap Fund |
| 100% | | 100% |
The Funds designate the following amounts as long-term capital gains distributions. The amounts designated may not agree with long-term capital gains in the tax character of distribution table due to utilization of earnings and profits distributed to shareholders on redemption of shares.
| Mid Cap Fund | | | Small Cap Fund | |
| $ | 3,040,819 | | | $ | — | |
| Trustees and Officers (Unaudited) |
GENERAL QUALIFICATIONS. The Board supervises the business activities of the Trust. Each Trustee serves as a trustee until termination of the Trust unless the Trustee dies, resigns, retires, or is removed. The Chairman of the Board and more than 75% of the Trustees are “Independent Trustees,” which means that they are not “interested persons” (as defined in the 1940 Act) of the Trust or any adviser, sub-adviser or distributor of the Trust.
The following table provides information regarding the Independent Trustees.
Name, Address*, (Year of Birth), Position with Trust**, Term of Position with Trust | Principal Occupation During Past 5 Years and Other
Directorships |
Kenneth G.Y. Grant(1949) Chairman, January 2017 to present; Independent Trustee, May 2008 to present | Current:Director, Standpoint Multi-Asset (Cayman) Fund, Ltd. (2019 – present); Director, Advisors Charitable Gift Fund (2020 - present), a Donor Advised Fund. Previous:EVP, Benefit Plans Administrative Services, Inc., provider of retirement benefit plans administration (2019 – 2020); Director, Northeast Retirement Services (NRS) LLC, a transfer agent and fund administrator; and Director, Global Trust Company (GTC), a non-depository trust company sponsoring private investment product (2003 – 2019); EVP, NRS (2003 – 2019); GTC, EVP (2008 – 2019); EVP, Savings Banks Retirement Association (2003 – 2019), provider of qualified retirement benefit plans. |
Daniel J. Condon(1950) Chairman of the Audit Committee; Chairman of the Governance & Nominating Committee; Independent Trustee, December 2002 to present | Current:Retired (2017 - present). |
Gary E. Hippenstiel(1947) Chairman of the Pricing & Liquidity
Committee; Independent Trustee,
December 2002 to present | Current:President and founder of HippenstielInvestment Counsel LLC (“Hippenstiel”) since 2008. Hippenstielwas registered as an investment adviser from 2008 to December 31, 2019. |
Stephen A. Little(1946) Independent Trustee, December 2002
to present; Chairman, December 2004
to December 2016 | Current:President and founder of The Rose, Inc., a registered investment adviser, since 1993. |
Ronald C. Tritschler(1952) Independent Trustee, January 2007 to
present; Interested Trustee, December
2002 to December 2006 | Current:Chief Executive Officer, Director and Legal Counsel of The Webb Companies, a national real estate company, since 2001; Director, Standpoint Multi-Asset (Cayman) Fund, Ltd. (2020 – present). |
| * | The address for each Trustee is 225 Pictoria Drive, Suite 450, Cincinnati, Ohio 45246. |
| ** | As of the date of this report, the Trust consists of 24 series. |
| Trustees and Officers (Unaudited) (continued) |
The following table provides information regarding the Interested Trustees and Officers of the Trust.
Name, Address*, (Year of Birth),
Position with Trust,
Term of Position with Trust | Principal Occupation During Past 5 Years and Other
Directorships |
David R. Carson(1958) President, January 2016 to August
2021; Interested Trustee, August 2020
to present | Current: Senior Vice President Client Strategies of Ultimus Fund Solutions, LLC, since 2013; Interested Trustee of Ultimus Managers Trust, since 2020. |
Zachary P. Richmond(1980) Treasurer and Chief Financial Officer,
November 2014 to present | Current:Vice President, Director of Financial Administration for Ultimus Fund Solutions, LLC, since 2015. |
Martin R. Dean(1963) President, August 2021 to present; Vice
President, November 2020 to August
2021; Chief Compliance Officer, April
2021 to August 2021; Assistant Chief
Compliance Officer, January 2016 to
April 2021 | Current:Senior Vice President, Head of Fund Compliance of Ultimus Fund Solutions, LLC, since 2016. |
GwenethK. Gosselink(1955) Chief Compliance Officer, August
2021 to present | Current:Assistant Vice President, Senior Compliance Officer of Ultimus Fund Solutions, LLC, since 2019. Previous:Chief Operating Officer & CCO at Miles Capital, Inc. (2013 – 2019). |
Elisabeth Dahl(1962) Secretary, May 2017 to present;
Assistant Secretary, March 2016 to
May 2017 | Current:Attorney, Ultimus Fund Solutions, LLC since March 2016. |
Stephen Preston(1966) AML Compliance Officer, May 2017
to present | Current:Vice President and Chief Compliance Officer, Ultimus Fund Solutions, LLC and Ultimus Fund Distributors, LLC, since 2011. |
Lynn E. Wood(1946) Assistant Chief Compliance Officer,
April 2021 to present; Chief
Compliance Officer, October 2004 to
April 2021 | Current:Managing Member, Buttonwood Compliance Partners, LLC, since 2013. |
| * | The address for each Officer is 225 Pictoria Drive, Suite 450, Cincinnati, Ohio 45246. |
| Other Information (Unaudited) |
The Funds’ Statement of Additional Information (“SAI”) includes additional information about the Trustees and is available without charge, upon request. You may call toll-free at (888) 899-8343 and (888) 899-8343 to request a copy of the SAI or to make shareholder inquiries.
Privacy Notice
Rev. March 2021
| FACTS | WHAT DO THE DEAN FUNDS (the “FUNDS”) DO WITH YOUR PERSONAL INFORMATION? |
| | |
| Why? | Financial companies choose how they share your personal information. Federal law gives consumers the right to limit some but not all sharing. Federal law also requires us to tell you how we collect, share, and protect your personal information. Please read this notice carefully to understand what we do. |
| | |
| What? | The types of personal information we collect and share depend on the product or service you have with us. This information can include: ■ Social Security number ■ account balances and account transactions ■ transaction or loss history and purchase history ■ checking account information and wire transfer instructions When you are no longer our customer, we continue to share your information as described in this notice. |
| | |
| How? | All financial companies need to share customers’ personal information to run their everyday business. In the section below, we list the reasons financial companies can share their customers’ personal information; the reasons the Funds choose to share; and whether you can limit this sharing. |
| Reasons we can share your personal information | Do the Funds share? |
For our everyday business purposes— such as to process your transactions, maintain your account(s), respond to court orders and legal investigations, or report to credit bureaus | Yes |
For our marketing purposes— to offer our products and services to you | No |
| For joint marketing with other financial companies | No |
For our affiliates’ everyday business purposes— information about your transactions and experiences | No |
For our affiliates’ everyday business purposes— information about your creditworthiness | No |
| For nonaffiliates to market to you | No |
| Questions? | Call (888) 899-8343 |
| Who we are |
| Who is providing this notice? | Dean Funds Ultimus Fund Distributors, LLC (Distributor) Ultimus Fund Solutions, LLC (Administrator) |
| What we do |
| How do the Funds protect my personal information? | To protect your personal information from unauthorized access and use, we use security measures that comply with federal law. These measures include computer safeguards and secured files and buildings. Our service providers are held accountable for adhering to strict policies and procedures to prevent any misuse of your nonpublic personal information. |
| How do the Funds collect my personal information? | We collect your personal information, for example, when you ■ open an account or deposit money ■ buy securities from us or sell securities to us ■ make deposits or withdrawals from your account ■ give us your account information ■ make a wire transfer ■ tell us who receives the money ■ tell us where to send the money ■ show your government-issued ID ■ show your driver’s license |
| Why can’t I limit all sharing? | Federal law gives you the right to limit only ■ sharing for affiliates’ everyday business purposes — information about your creditworthiness ■ affiliates from using your information to market to you ■ sharing for nonaffiliates to market to you State laws and individual companies may give you additional rights to limit sharing. |
| Definitions |
| Affiliates | Companies related by common ownership or control. They can be financial and nonfinancial companies. ■ Dean Investment Associates, LLC, the investment adviser to the Funds, could be deemed to be an affiliate. |
| Nonaffiliates | Companies not related by common ownership or control. They can be financial and nonfinancial companies. ■ The Dean Funds do not share your personal information with nonaffiliates so they can market to you |
| Joint marketing | A formal agreement between nonaffiliated financial companies that together market financial products or services to you. ■ The Dean Funds do not jointly market. |
PROXY VOTING
A description of the policies and procedures that each Fund uses to determine how to vote proxies relating to portfolio securities and information regarding how each Fund voted those proxies during the most recent twelve month period ended June 30, are available (1) without charge upon request by calling the Funds at (888) 899-8343 and (2) in Fund documents filed with the Securities and Exchange Commission (“SEC”) on the SEC’s website at www.sec.gov.
TRUSTEES Kenneth G.Y. Grant, Chairman David R. Carson Daniel J. Condon Gary E. Hippenstiel Stephen A. Little Ronald C. Tritschler OFFICERS Martin R. Dean, President Gweneth K. Gosselink, Chief Compliance Officer Zachary P. Richmond, Treasurer and Chief Financial Officer Lynn E. Wood, Assistant Chief Compliance Officer INVESTMENT ADVISER Dean Investment Associates LLC 3500 Pentagon Blvd., Suite 200 Beavercreek, Ohio. 45431 DISTRIBUTOR Ultimus Fund Distributors, LLC 225 Pictoria Drive, Suite 450 Cincinnati, OH 45246 | INDEPENDENT REGISTERED PUBLIC ACCOUNTING FIRM Cohen & Company, Ltd. 151 N Franklin Street, Suite 575 Chicago, IL 60606 LEGAL COUNSEL Thompson Hine LLP 312 Walnut Street, 20th Floor Cincinnati, OH 45202 CUSTODIAN Huntington National Bank 41 South High Street Columbus, OH 43215 ADMINISTRATOR, TRANSFER AGENT AND FUND ACCOUNTANT Ultimus Fund Solutions, LLC 225 Pictoria Drive, Suite 450 Cincinnati, OH 45246 |
This report is intended only for the information of shareholders or those who have received the Funds’ prospectus which contains information about the Funds’ management fees and expenses. Please read the prospectus carefully before investing.
Distributed by Ultimus Fund Distributors, LLC
Member FINRA/SIPC
Dean-AR-22
Item 2. Code of Ethics.
As of the end of the period covered by this report, the registrant has adopted a code of ethics that applies to the registrant’s principal executive officer, principal financial officer, principal accounting officer or controller, or persons performing similar functions, regardless of whether these individuals are employed by the registrant or a third party. Pursuant to Item 12(a)(1), a copy of registrant’s code of ethics is filed as an exhibit to this Form N-CSR. During the period covered by this report, the code of ethics has not been amended, and the registrant has not granted any waivers, including implicit waivers, from the provisions of the code of ethics.
Item 3. Audit Committee Financial Expert.
(a) The registrant’s board of trustees has determined that the registrant does not have an audit committee financial expert. The committee members and the full Board considered a possibility of adding a member that would qualify as an expert. The audit committee determined that, although none of its members meet the technical definition of an audit committee expert, the committee has sufficient financial expertise to adequately perform its duties under the Audit Committee Charter without the addition of a qualified expert.
Item 4. Principal Accountant Fees and Services.
| The Dean Funds: | | | FY 2022 | | | | $26,250 | |
| | | | FY 2021 | | | | $26,600 | |
| | | | | | | | | |
| The Absolute Core Strategy ETF | | | FY 2022 | | | | $14,100 | |
| | | | FY 2021 | | | | $14,300 | |
| The Dean Funds: | | | FY 2022 | | | | $0 | |
| | | | FY 2021 | | | | $0 | |
| | | | | | | | | |
| The Absolute Core Strategy ETF | | | FY 2022 | | | | $0 | |
| | | | FY 2021 | | | | $0 | |
| | | | | | | | | |
| The Dean Funds: | | | FY 2022 | | | | $6,600 | |
| | | | FY 2021 | | | | $6,600 | |
| | | | | | | | | |
| The Absolute Core Strategy ETF | | | FY 2022 | | | | $3,300 | |
| | | | FY 2021 | | | | $3,300 | |
Nature of the fees: Preparation of the 1120 RIC and Excise review
| The Dean Funds: | | | FY 2022 | | | | $0 | |
| | | | FY 2021 | | | | $0 | |
| | | | | | | | | |
| The Absolute Core Strategy ETF | | | FY 2022 | | | | $0 | |
| | | | FY 2021 | | | | $0 | |
| (e) | (1) Audit Committee’s Pre-Approval Policies |
The Audit Committee Charter requires the Audit Committee to be responsible for the selection, retention or termination of auditors and, in connection therewith, to (i) evaluate the proposed fees and other compensation, if any, to be paid to the auditors, (ii) evaluate the independence of the auditors, (iii) pre-approve all audit services and, when appropriate, any non-audit services provided by the independent auditors to the Trust, (iv) pre-approve, when appropriate, any non-audit services provided by the independent auditors to the Trust's investment adviser, or any entity controlling, controlled by, or under common control with the investment adviser and that provides ongoing services to the Trust if the engagement relates directly to the operations and financial reporting of the Trust, and (v) receive the auditors’ specific representations as to their independence;
(2) Percentages of Services Approved by the Audit Committee
| Audit-Related Fees: | | | 0 | % |
| Tax Fees: | | | 0 | % |
| All Other Fees: | | | 0 | % |
(f) During audit of registrant's financial statements for the most recent fiscal year, less than 50 percent of the hours expended on the principal accountant's engagement were attributed to work performed by persons other than the principal accountant's full-time, permanent employees.
(g) The aggregate non-audit fees billed by the registrant's accountant for services rendered to the registrant, and rendered to the registrant's investment adviser (not including any sub-adviser whose role is primarily portfolio management and is subcontracted with or overseen by another investment adviser), and any entity controlling, controlled by, or under common control with the adviser that provides ongoing services to the registrant:
| | | Registrant | | Adviser |
| The Dean Funds: | | | | | | | | |
| | | | | | | | | |
| FY 2022 | | $0 | | | | $0 | | |
| FY 2021 | | $0 | | | | $0 | | |
| | | | | | | | | |
| The Absolute Core Strategy ETF | | | | | | | | |
| | | | | | | | | |
| FY 2022 | | $0 | | | | $0 | | |
| FY 2021 | | $0 | | | | $0 | | |
(h) Not applicable. The auditor performed no services for the registrant’s investment adviser or any entity controlling, controlled by, or under common control with the investment adviser that provides ongoing services to the registrant.
Item 5. Audit Committee of Listed Companies. NOT APPLICABLE – applies to listed companies only
Item 6. Schedule of Investments. Schedule filed with Item 1.
Item 7. Disclosure of Proxy Voting Policies and Procedures for Closed-End Management Investment Companies. NOT APPLICABLE – applies to closed-end funds only
Item 8. Portfolio Managers of Closed-End Investment Companies. NOT APPLICABLE – applies to closed-end funds only
Item 9. Purchases of Equity Securities by Closed-End Management Investment Company and Affiliated Purchasers. NOT APPLICABLE – applies to closed-end funds only
Item 10. Submission of Matters to a Vote of Security Holders.
The registrant has not adopted procedures by which shareholders may recommend nominees to the registrant’s board of trustees.
Item 11. Controls and Procedures.
(a) Based on their evaluation of the registrant’s disclosure controls and procedures (as defined in Rule 30a-3(c) under the Investment Company Act of 1940, as amended (the “Act”)) as of a date within 90 days of the filing date of this report, the registrant’s principal executive officer and principal financial officer have concluded that such disclosure controls and procedures are reasonably designed and are operating effectively to ensure that material information relating to the registrant is made known to them by others within those entities, particularly during the period in which this report is being prepared, and that the information required in filings on Form N-CSR is recorded, processed, summarized, and reported on a timely basis.
(b) There were no significant changes in the registrant’s internal control over financial reporting that occurred during the period covered by this report that have materially affected, or are reasonably likely to materially affect, the registrant’s internal control over financial reporting.
Item 12. Disclosure of Securities Lending Activities for Closed-End Investment Companies.
Not Applicable.
Item 13. Exhibits.
SIGNATURES
Pursuant to the requirements of the Securities Exchange Act of 1934 and the Investment Company Act of 1940, the registrant has duly caused this report to be signed on its behalf by the undersigned, thereunto duly authorized.
(Registrant) Unified Series Trust
By /s/ Martin R. Dean
Martin R. Dean, President
Date 6/3/2022
Pursuant to the requirements of the Securities Exchange Act of 1934 and the Investment Company Act of 1940, this report has been signed below by the following persons on behalf of the registrant and in the capacities and on the dates indicated.
By /s/ Margin R. Dean
Martin R. Dean, President
Date 6/3/2022
By /s/ Zachary P. Richmond
Zachary P. Richmond, Treasurer
Date 6/3/2022