We are pleased to present this annual report for Dreyfus International Equity Fund, covering the 12-month period from October 1, 2016 through September 30, 2017. For information about how the fund performed during the reporting period, as well as general market perspectives, we provide a Discussion of Fund Performance on the pages that follow.
Stocks set a series of new record highs and bonds produced mixed results over the past year in response to changing economic and political conditions. Financial markets during the final months of 2016 were dominated by the election of a new U.S. presidential administration. Equities and corporate-backed bonds surged higher in anticipation of more business-friendly regulatory, tax, and fiscal policies, but high-quality bonds generally lost value due to expectations of rising interest rates and accelerating inflation in a stronger economy. Despite a series of short-term interest rate hikes, bonds recovered most or all of their previous losses over the first nine months of 2017 when it became clearer that pro-growth legislation would take time and political capital to enact. U.S. and international stocks continued to rally as corporate earnings grew and global economic conditions improved.
The markets’ recent strong performance has been supported by solid underlying fundamentals. While we currently expect these favorable conditions to persist, we remain watchful for economic and political developments that could derail the rallies. As always, we encourage you to discuss the risks and opportunities of today’s investment environment with your financial advisor.
Thank you for your continued confidence and support.
DISCUSSION OF FUND PERFORMANCE
For the period from October 1, 2016 through September 30, 2017, as provided by Mark A. Bogar, Andrew R. Leger, and James A. Lydotes, Portfolio Managers
Market and Fund Performance Overview
For the 12-month period ended September 30, 2017, Dreyfus International Equity Fund’s Class A shares produced a total return of 20.47%, Class C shares returned 19.52%, Class I shares returned 20.80%, and Class Y shares returned 20.81%.1 In comparison, the fund’s benchmark, the MSCI EAFE Index (the “Index”), produced a total return of 19.10% for the same period.2
International equity markets gained considerable ground during the reporting period, supported by improving economic data and better-than-expected corporate earnings. The fund outperformed its benchmark, largely due to strong individual security selections in Switzerland, Germany, and Japan.
The Fund’s Investment Approach
The fund seeks long-term growth of capital. The fund normally invests at least 80% of its assets in shares of companies located in the foreign countries represented in the Index and Canada, and may also invest up to 20% of its assets in securities of issuers located in emerging market countries.
We employ a bottom-up investment approach using proprietary quantitative models and traditional qualitative analysis to identify attractive stocks. We seek to allocate country weights generally in accordance with the Index, but deviations from the Index country weightings may occur. We use the sector allocations of the Index as a guide, but allocations may differ from those of the Index. The fund’s stock selection process is designed to produce a diversified portfolio that, relative to the Index, has a below-average price/earnings ratio and an above-average earnings growth trend.
Political Stability and Improving Economy Buoyed Markets
Early in the reporting period, most developed international markets lost ground in volatile trading due to political uncertainties and concerns regarding global economic growth. The U.S. presidential election in November 2016 marked a turning point for most global markets as investors responded to expectations of more business-friendly policies from a new U.S. administration. By early 2017, the Index and most individual country stock indices had recouped previous losses and advanced into positive territory.
The remainder of the reporting period saw steady gains across most international markets, supported by improving economic data in Europe and Asia. In the European Union (EU), political worries receded when anti-EU candidates for national office were rejected by voters in favor of more centrist, pro-EU figures, first in the Netherlands in March 2017 and then three months later in France. The U.K. market shrugged off concerns regarding the Brexit vote amid robust corporate earnings and improving economic forecasts. In Japan, the central bank revised its growth estimate upwards amid a slew of unexpectedly strong corporate earnings reports.
Individual Holdings Bolstered Relative Results
The fund’s performance compared to the Index benefited from several individual holdings in Switzerland, Germany, and Japan. Swiss wealth manager Julius Baer Group reported strong financial results due to higher new business volumes, contract pharmaceutical manufacturer Lonza Group delivered better-than-expected earnings and revenues in a favorable environment for commercial outsourcing, and employment services provider Adecco Group benefited from stronger economic conditions in Europe. In Germany, electric utility E.ON spun off legacy assets and received a favorable court ruling likely to reduce future costs, while life insurer Allianz saw increased new business, declining costs, and an improved solvency position.
3
DISCUSSION OF FUND PERFORMANCE (continued)
Several Japanese holdings performed relatively well, particularly in the consumer discretionary and materials sectors. Top performers included automaker Suzuki Motor, which rose due to positive sales trends in Europe, Japan, and India; and electronic products producer Panasonic, which boosted profit margins by reinvesting in high-growth housing and auto-related areas. In other markets, Swedish appliance manufacturer Electrolux advanced due to currency tailwinds and a successful cost-reduction program, and Italian defense contractor Leonardo benefited from a restructuring program and higher military spending.
On the other hand, some holdings detracted from the fund’s relative performance over the reporting period. In France, underweighted exposure to financial stocks, which surged in the wake of the country’s June 2017 presidential election, detracted from returns, as did grocery chain Carrefour, which missed quarterly earnings expectations in a challenging pricing environment. Israeli pharmaceutical company Teva Pharmaceutical Industries was hurt by pricing pressures and a heavy debt burden. In the U.K., biotechnology firm Shire also struggled with pricing issues, and underweighted exposure to the materials sector further undermined results. Along with other traditionally defensive stocks, Belgian brewery giant Anheuser-Busch InBev fell out of favor among investors.
Positioned for Further Growth
We believe the environment for international equities remains supported by widespread economic growth in developed and emerging markets, and despite ongoing challenges in North Korea and the Middle East, by growing investor confidence in global political stability. Although international equity valuations have risen, we believe that they remain in line with earnings expectations.
In light of the constructive environment, the fund ended the reporting period with overweighted exposure to the Netherlands, France, and Switzerland and underweighted positions in Sweden and Australia. Among industry groups, we have identified an ample number of investments meeting our investment criteria in the financials and industrials sectors, but relatively few in the energy and health care sectors.
October 16, 2017
1 Total return includes reinvestment of dividends and any capital gains paid, and does not take into consideration the maximum initial sales charge in the case of Class A shares, or the applicable contingent deferred sales charge imposed on redemptions in the case of Class C shares. Share price and investment return fluctuate such that upon redemption, fund shares may be worth more or less than their original cost. The fund’s return reflects the absorption of certain fund expenses by The Dreyfus Corporation and The Boston Company Asset Management, LLC pursuant to an agreement in effect through February 1, 2018, at which time it may be extended, modified, or terminated. Had these expenses not been absorbed, returns would have been lower. Past performance is no guarantee of future results.
2 Source: Lipper Inc. — Reflects reinvestment of net dividends and, where applicable, capital gain distributions. The MSCI EAFE Index (Europe, Australasia, Far East) is a free float-adjusted market capitalization-weighted index that is designed to measure the equity market performance of developed markets, excluding the U.S. and Canada. Investors cannot invest directly in any index.
Please note: the position in any security highlighted with italicized typeface was sold during the reporting period.
Equities are subject generally to market, market sector, market liquidity, issuer, and investment style risks, among other factors, to varying degrees, all of which are more fully described in the fund’s prospectus.
The fund’s performance will be influenced by political, social, and economic factors affecting investments in foreign companies. Special risks associated with investments in foreign companies include exposure to currency fluctuations, less liquidity, less developed or less efficient trading markets, lack of comprehensive company information, political instability, and differing auditing and legal standards. These risks are enhanced in emerging market countries. Investments in foreign currencies are subject to the risk that those currencies will decline in value relative to the U.S. dollar, or, in the case of hedged positions, that the U.S. dollar will decline relative to the currency being hedged. Each of these risks could increase the fund’s volatility.
4
FUND PERFORMANCE
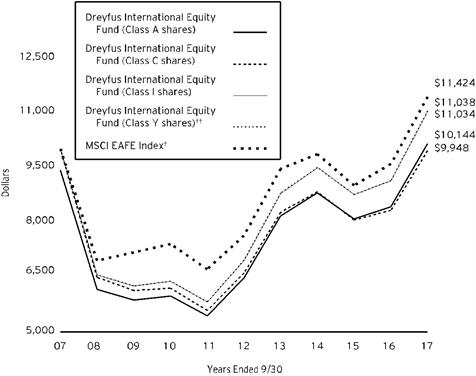
Comparison of change in value of $10,000 investment in Dreyfus International Equity Fund Class A shares, Class C shares, Class I shares and Class Y shares and the MSCI EAFE Index (the “Index”)
† Source: Lipper Inc.
†† The total return figures presented for Class Y shares of the fund reflect the performance of the fund’s Class I shares for the period prior to 6/1/15 (the inception date for Class Y shares).
Past performance is not predictive of future performance.
The above graph compares a $10,000 investment made in each of the Class A, Class C, Class I and Class Y shares of Dreyfus International Equity Fund on 9/30/07 to a $10,000 investment made in the Index on that date. All dividends and capital gain distributions are reinvested.
The fund’s performance shown in the line graph above takes into account the maximum initial sales charge on Class A shares and all other applicable fees and expenses on all classes. The Index is a free float-adjusted market capitalization-weighted index that is designed to measure the equity market performance of developed markets, excluding the U.S. and Canada. Unlike a mutual fund, the Index is not subject to charges, fees and other expenses. Investors cannot invest directly in any index. Further information relating to fund performance, including expense reimbursements, if applicable, is contained in the Financial Highlights section of the prospectus and elsewhere in this report.
5
FUND PERFORMANCE (continued)
| | | | | |
Average Annual Total Returns as of 9/30/17 | |
| Inception Date | 1 Year | 5 Years | 10 Years |
Class A shares | | | | |
with maximum sales charge (5.75%) | 12/8/88 | 13.53% | 8.07% | 0.14% |
without sales charge | 12/8/88 | 20.47% | 9.36% | 0.74% |
Class C shares | | | | |
with applicable redemption charge† | 12/8/88 | 18.52% | 8.51% | -0.05% |
without redemption | 12/8/88 | 19.52% | 8.51% | -0.05% |
Class I shares | 12/8/88 | 20.80% | 9.66% | 0.99% |
Class Y shares | 6/1/15 | 20.81% | 9.65%†† | 0.99%†† |
MSCI EAFE Index | | 19.10% | 8.38% | 1.34% |
† The maximum contingent deferred sales charge for Class C shares is 1% for shares redeemed within one year of the date of purchase.
†† The total return performance figures presented for Class Y shares of the fund reflect the performance of the fund’s Class I shares for the period prior to 6/1/15 (the inception date for Class Y shares).
The performance data quoted represents past performance, which is no guarantee of future results. Share price and investment return fluctuate and an investor’s shares may be worth more or less than original cost upon redemption. Current performance may be lower or higher than the performance quoted. Go to Dreyfus.com for the fund’s most recent month-end returns.
The fund’s performance shown in the graph and table does not reflect the deduction of taxes that a shareholder would pay on fund distributions or the redemption of fund shares. In addition to the performance of Class A shares shown with and without a maximum sales charge, the fund’s performance shown in the table takes into account all other applicable fees and expenses on all classes.
6
UNDERSTANDING YOUR FUND’S EXPENSES (Unaudited)
As a mutual fund investor, you pay ongoing expenses, such as management fees and other expenses. Using the information below, you can estimate how these expenses affect your investment and compare them with the expenses of other funds. You also may pay one-time transaction expenses, including sales charges (loads) and redemption fees, which are not shown in this section and would have resulted in higher total expenses. For more information, see your fund’s prospectus or talk to your financial adviser.
Review your fund’s expenses
The table below shows the expenses you would have paid on a $1,000 investment in Dreyfus International Equity Fund from April 1, 2017 to September 30, 2017. It also shows how much a $1,000 investment would be worth at the close of the period, assuming actual returns and expenses.
| | | | | | | | | | | | | |
Expenses and Value of a $1,000 Investment | | |
assuming actual returns for the six months ended September 30, 2017 |
| | | | Class A | Class C | Class I | Class Y |
Expenses paid per $1,000† | | $6.00 | | $10.16 | | $4.56 | | $4.56 |
Ending value (after expenses) | | $1,138.00 | | $1,133.60 | | $1,139.50 | | $1,139.50 |
COMPARING YOUR FUND’S EXPENSES
WITH THOSE OF OTHER FUNDS (Unaudited)
Using the SEC’s method to compare expenses
The Securities and Exchange Commission (“SEC”) has established guidelines to help investors assess fund expenses. Per these guidelines, the table below shows your fund’s expenses based on a $1,000 investment, assuming a hypothetical 5% annualized return. You can use this information to compare the ongoing expenses (but not transaction expenses or total cost) of investing in the fund with those of other funds. All mutual fund shareholder reports will provide this information to help you make this comparison. Please note that you cannot use this information to estimate your actual ending account balance and expenses paid during the period.
| | | | | | | | | | | | |
Expenses and Value of a $1,000 Investment | | |
assuming a hypothetical 5% annualized return for the six months ended September 30, 2017 |
| | | | Class A | Class C | Class I | Class Y |
Expenses paid per $1,000† | | $5.67 | | $9.60 | | $4.31 | | $4.31 |
Ending value (after expenses) | | $1,019.45 | | $1,015.54 | | $1,020.81 | | $1,020.81 |
† Expenses are equal to the fund’s annualized expense ratio of 1.12% for Class A, 1.90% for Class C, .85% for Class I and .85% for Class Y, multiplied by the average account value over the period, multiplied by 183/365 (to reflect the one-half year period).
7
STATEMENT OF INVESTMENTS
September 30, 2017
| | | | | | | | |
| |
Description | | | | Shares | | Value ($) | |
Common Stocks - 98.7% | | | | | |
Australia - 5.1% | | | | | |
Australia & New Zealand Banking Group | | | | 293,666 | | 6,818,406 | |
BHP Billiton | | | | 263,020 | | 5,318,745 | |
Macquarie Group | | | | 154,964 | | 11,051,666 | |
Woodside Petroleum | | | | 236,670 | | 5,402,238 | |
Woolworths | | | | 359,591 | | 7,110,811 | |
| | | | | 35,701,866 | |
Belgium - .7% | | | | | |
bpost | | | | 166,116 | | 4,937,735 | |
Brazil - 1.1% | | | | | |
APERAM | | | | 151,227 | | 7,923,287 | |
Denmark - 1.2% | | | | | |
Chr. Hansen Holding | | | | 101,009 | | 8,663,071 | |
Finland - .7% | | | | | |
UPM-Kymmene | | | | 185,948 | | 5,039,342 | |
France - 10.9% | | | | | |
Arkema | | | | 61,420 | | 7,531,409 | |
Atos | | | | 48,245 | | 7,483,934 | |
BNP Paribas | | | | 220,270 | | 17,767,909 | |
Cie de Saint-Gobain | | | | 88,689 | | 5,285,072 | |
Cie Generale des Etablissements Michelin | | | | 45,230 | | 6,601,944 | |
Orange | | | | 718,433 | | 11,768,681 | |
Renault | | | | 77,116 | | 7,574,886 | |
Thales | | | | 28,141 | | 3,185,610 | |
Vinci | | | | 99,319 | | 9,437,711 | |
| | | | | 76,637,156 | |
Germany - 6.6% | | | | | |
Allianz | | | | 59,352 | | 13,324,563 | |
Continental | | | | 22,673 | | 5,754,671 | |
Deutsche Post | | | | 81,112 | | 3,610,783 | |
Evonik Industries | | | | 173,693 | | 6,203,761 | |
Fresenius & Co. | | | | 144,731 | | 11,674,614 | |
Infineon Technologies | | | | 242,422 | | 6,094,216 | |
| | | | | 46,662,608 | |
Hong Kong - 2.8% | | | | | |
AIA Group | | | | 1,644,400 | | 12,125,229 | |
Sun Hung Kai Properties | | | | 445,000 | | 7,229,057 | |
| | | | | 19,354,286 | |
Italy - 6.7% | | | | | |
Enel | | | | 1,441,353 | | 8,679,463 | |
Fiat Chrysler Automobiles | | | | 440,869 | a | 7,899,272 | |
8
| | | | | | | | |
| |
Description | | | | Shares | | Value ($) | |
Common Stocks - 98.7% (continued) | | | | | |
Italy - 6.7% (continued) | | | | | |
Leonardo | | | | 528,141 | | 9,893,671 | |
Moncler | | | | 226,626 | | 6,540,843 | |
Prysmian | | | | 114,417 | | 3,864,836 | |
Telecom Italia | | | | 10,643,754 | a | 9,969,478 | |
| | | | | 46,847,563 | |
Japan - 23.0% | | | | | |
Alps Electric | | | | 293,400 | | 7,741,432 | |
Astellas Pharma | | | | 543,400 | | 6,912,927 | |
Chubu Electric Power | | | | 377,100 | | 4,681,704 | |
Daiwa Securities Group | | | | 592,000 | | 3,352,869 | |
Denso | | | | 154,900 | | 7,836,887 | |
Hitachi | | | | 1,952,000 | | 13,754,639 | |
ITOCHU | | | | 290,500 | | 4,757,978 | |
Japan Airlines | | | | 158,300 | | 5,357,089 | |
JTEKT | | | | 194,400 | | 2,691,626 | |
Kandenko | | | | 272,000 | | 2,854,761 | |
KDDI | | | | 295,300 | | 7,786,315 | |
MINEBEA MITSUMI | | | | 249,700 | | 3,905,550 | |
Mitsubishi Electric | | | | 467,800 | | 7,308,531 | |
Nintendo | | | | 29,800 | | 11,006,336 | |
Recruit Holdings | | | | 279,200 | | 6,046,749 | |
Seven & i Holdings | | | | 225,500 | | 8,707,376 | |
Shionogi & Co. | | | | 96,200 | | 5,258,620 | |
Showa Shell Sekiyu | | | | 727,700 | | 8,374,774 | |
Sony | | | | 321,000 | | 11,941,400 | |
Sumitomo Mitsui Financial Group | | | | 369,900 | | 14,201,004 | |
Suzuki Motor | | | | 203,400 | | 10,668,445 | |
Zeon | | | | 496,000 | | 6,431,140 | |
| | | | | 161,578,152 | |
Macau - 1.7% | | | | | |
Sands China | | | | 2,253,600 | | 11,727,282 | |
Netherlands - 5.5% | | | | | |
ABN AMRO Group | | | | 467,777 | b | 14,009,537 | |
Heineken | | | | 111,248 | | 10,998,576 | |
NN Group | | | | 333,592 | | 13,961,107 | |
| | | | | 38,969,220 | |
Norway - .8% | | | | | |
Telenor | | | | 282,014 | | 5,962,855 | |
Portugal - 1.4% | | | | | |
Galp Energia | | | | 540,992 | | 9,587,726 | |
Singapore - .6% | | | | | |
Ascendas Real Estate Investment Trust | | | | 2,217,300 | | 4,348,128 | |
9
STATEMENT OF INVESTMENTS (continued)
| | | | | | | | |
| |
Description | | | | Shares | | Value ($) | |
Common Stocks - 98.7% (continued) | | | | | |
Spain - 3.5% | | | | | |
ACS Actividades de Construccion y Servicios | | | | 203,523 | | 7,542,210 | |
Banco Santander | | | | 2,463,954 | | 17,201,957 | |
| | | | | 24,744,167 | |
Sweden - .5% | | | | | |
Volvo, Cl. B | | | | 190,684 | | 3,675,599 | |
Switzerland - 8.8% | | | | | |
ABB | | | | 241,303 | | 5,965,605 | |
Adecco Group | | | | 80,493 | | 6,267,540 | |
Julius Baer Group | | | | 184,594 | a | 10,922,947 | |
Lonza Group | | | | 34,604 | a | 9,076,693 | |
Novartis | | | | 175,177 | | 14,996,823 | |
Roche Holding | | | | 57,825 | | 14,761,543 | |
| | | | | 61,991,151 | |
United Kingdom - 16.1% | | | | | |
Anglo American | | | | 260,676 | | 4,678,943 | |
Compass Group | | | | 223,283 | | 4,736,315 | |
Diageo | | | | 468,619 | | 15,403,572 | |
Ferguson | | | | 68,647 | | 4,503,674 | |
Imperial Brands | | | | 321,166 | | 13,702,715 | |
Prudential | | | | 461,370 | | 11,044,763 | |
Royal Dutch Shell, Cl. B | | | | 276,692 | | 8,507,240 | |
Shire | | | | 162,716 | | 8,259,319 | |
Smiths Group | | | | 166,298 | | 3,514,170 | |
SSE | | | | 754,567 | | 14,125,318 | |
Standard Chartered | | | | 1,084,989 | a | 10,781,994 | |
Unilever | | | | 242,064 | | 14,009,332 | |
| | | | | 113,267,355 | |
United States - 1.0% | | | | | |
iShares MSCI EAFE ETF | | | | 101,513 | | 6,951,610 | |
Total Common Stocks (cost $605,194,271) | | | | 694,570,159 | |
10
| | | | | | | | |
| |
Description | | | | Shares | | Value ($) | |
Other Investment - .4% | | | | | |
Registered Investment Company; | | | | | |
Dreyfus Institutional Preferred Government Plus Money Market Fund
(cost $2,468,266) | | | | 2,468,266 | c | 2,468,266 | |
Total Investments (cost $607,662,537) | | 99.1% | | 697,038,425 | |
Cash and Receivables (Net) | | .9% | | 6,539,698 | |
Net Assets | | 100.0% | | 703,578,123 | |
ETF—Exchange-Traded Fund
aNon-income producing security.
bSecurity exempt from registration pursuant to Rule 144A under the Securities Act of 1933. These securities may be resold in transactions exempt from registration, normally to qualified institutional buyers. At September 30, 2017, these securities were valued at $14,009,537 or 1.99% of net assets.
cInvestment in affiliated money market mutual fund.
| | |
Portfolio Summary (Unaudited) † | Value (%) |
Financials | 22.3 |
Industrials | 14.9 |
Consumer Discretionary | 11.6 |
Health Care | 10.1 |
Consumer Staples | 9.9 |
Materials | 7.4 |
Information Technology | 6.5 |
Telecommunication Services | 5.0 |
Energy | 4.5 |
Utilities | 3.9 |
Real Estate | 1.6 |
Exchange-Traded Funds | 1.0 |
Money Market Investment | .4 |
| | 99.1 |
† Based on net assets.
See notes to financial statements.
11
STATEMENT OF INVESTMENTS IN AFFILIATED ISSUERS
| | | | | | | |
Registered Investment Company | Value
9/30/2016 ($) | Purchases ($) | Sales ($) | Value
9/30/2017 ($) | Net
Assets (%) | Dividends/
Distributions ($) |
Dreyfus Institutional Preferred Government Plus Money Market Fund | 3,149,300 | 237,671,012 | 238,352,046 | 2,468,266 | .4 | 29,769 |
See notes to financial statements.
12
STATEMENT OF FORWARD FOREIGN CURRENCY EXCHANGE CONTRACTS September 30, 2017
| | | | | | |
Counterparty/ Purchased
Currency | Purchased Currency
Amounts | Currency
Sold | Sold
Currency
Amounts | Settlement Date | Unrealized (Depreciation)($) |
Goldman Sachs International | | | |
United States Dollar | 2,897,594 | Japanese Yen | 326,181,841 | 10/2/17 | (1,156) |
Gross Unrealized Depreciation | | | (1,156) |
See notes to financial statements.
13
STATEMENT OF ASSETS AND LIABILITIES
September 30, 2017
| | | | | | | |
| | | | | | |
| | | Cost | | Value | |
Assets ($): | | | | |
Investments in securities—See Statement of Investments: | | | |
Unaffiliated issuers | | 605,194,271 | | 694,570,159 | |
Affiliated issuers | | 2,468,266 | | 2,468,266 | |
Cash | | | | | 381,569 | |
Cash denominated in foreign currency | | | 1,420,696 | | 1,406,754 | |
Receivable for investment securities sold | | | | | 2,898,749 | |
Dividends receivable | | | | | 2,798,105 | |
Receivable for shares of Beneficial Interest subscribed | | | | | 53,945 | |
Prepaid expenses and other assets | | | | | 31,941 | |
| | | | | 704,609,488 | |
Liabilities ($): | | | | |
Due to The Boston Company Asset
Management, LLC and affiliates—Note 3(c) | | | | | 500,719 | |
Payable for shares of Beneficial Interest redeemed | | | | | 325,443 | |
Unrealized depreciation on forward foreign
currency exchange contracts—See Statement of
Forward Foreign Currency Exchange Contracts—Note 4 | | | | | 1,156 | |
Accrued expenses | | | | | 204,047 | |
| | | | | 1,031,365 | |
Net Assets ($) | | | 703,578,123 | |
Composition of Net Assets ($): | | | | |
Paid-in capital | | | | | 687,073,613 | |
Accumulated undistributed investment income—net | | 10,527,791 | |
Accumulated net realized gain (loss) on investments | | | | | (83,394,344) | |
Accumulated net unrealized appreciation (depreciation)
on investments and foreign currency transactions | | | | 89,371,063 | |
Net Assets ($) | | | 703,578,123 | |
| | | | | | |
Net Asset Value Per Share | Class A | Class C | Class I | Class Y | |
Net Assets ($) | 153,146,345 | 11,984,767 | 187,557,539 | 350,889,472 | |
Shares Outstanding | 3,876,292 | 302,407 | 4,674,714 | 8,750,118 | |
Net Asset Value Per Share ($) | 39.51 | 39.63 | 40.12 | 40.10 | |
| | | | | | |
See notes to financial statements. | | | | | |
14
STATEMENT OF OPERATIONS
Year Ended September 30, 2017
| | | | | | | |
| | | | | | |
| | | | | | |
Investment Income ($): | | | | |
Income: | | | | |
Cash dividends (net of $1,690,042 foreign taxes withheld at source): | |
Unaffiliated issuers | | | 16,418,796 | |
Affiliated issuers | | | 29,769 | |
Total Income | | | 16,448,565 | |
Expenses: | | | | |
Investment advisory fee—Note 3(a) | | | 4,815,467 | |
Shareholder servicing costs—Note 3(c) | | | 1,344,829 | |
Administration fee—Note 3(a) | | | 608,729 | |
Custodian fees—Note 3(c) | | | 216,883 | |
Professional fees | | | 111,788 | |
Distribution fees—Note 3(b) | | | 99,546 | |
Registration fees | | | 79,527 | |
Trustees’ fees and expenses—Note 3(d) | | | 64,359 | |
Loan commitment fees—Note 2 | | | 14,771 | |
Prospectus and shareholders’ reports | | | 10,493 | |
Interest expense—Note 2 | | | 584 | |
Miscellaneous | | | 51,364 | |
Total Expenses | | | 7,418,340 | |
Less—reduction in expenses due to undertaking—Note 3(a) | | | (1,688,809) | |
Less—reduction in fees due to earnings credits—Note 3(c) | | | (3,671) | |
Net Expenses | | | 5,725,860 | |
Investment Income—Net | | | 10,722,705 | |
Realized and Unrealized Gain (Loss) on Investments—Note 4 ($): | | |
Net realized gain (loss) on investments and foreign currency transactions | 18,673,720 | |
Net realized gain (loss) on forward foreign currency exchange contracts | 280,291 | |
Net Realized Gain (Loss) | | | 18,954,011 | |
Net unrealized appreciation (depreciation) on investments
and foreign currency transactions | | | 88,562,899 | |
Net unrealized appreciation (depreciation) on
forward foreign currency exchange contracts | | | (1,156) | |
Net Unrealized Appreciation (Depreciation) | | | 88,561,743 | |
Net Realized and Unrealized Gain (Loss) on Investments | | | 107,515,754 | |
Net Increase in Net Assets Resulting from Operations | | 118,238,459 | |
| | | | | | | |
See notes to financial statements. | | | | | |
15
STATEMENT OF CHANGES IN NET ASSETS
| | | | | | | | | | |
| | | | Year Ended September 30, |
| | | | 2017 | | | | 2016 | |
Operations ($): | | | | | | | | |
Investment income—net | | | 10,722,705 | | | | 9,309,868 | |
Net realized gain (loss) on investments | | 18,954,011 | | | | (19,229,210) | |
Net unrealized appreciation (depreciation)
on investments | | 88,561,743 | | | | 36,757,647 | |
Net Increase (Decrease) in Net Assets
Resulting from Operations | 118,238,459 | | | | 26,838,305 | |
Distributions to Shareholders from ($): | |
Investment income—net: | | | | | | | | |
Class A | | | (2,551,707) | | | | (818,832) | |
Class C | | | (110,388) | | | | (33,512) | |
Class I | | | (2,263,871) | | | | (1,055,158) | |
Class Y | | | (5,124,738) | | | | (2,497,753) | |
Total Distributions | | | (10,050,704) | | | | (4,405,255) | |
Beneficial Interest Transactions ($): | | | | | | | | |
Net proceeds from shares sold: | | | | | | | | |
Class A | | | 44,889,345 | | | | 85,743,553 | |
Class C | | | 657,739 | | | | 3,624,122 | |
Class I | | | 105,666,218 | | | | 107,159,506 | |
Class Y | | | 64,167,577 | | | | 49,176,461 | |
Net assets received in connection
with reorganization—Note 1 | | - | | | | 37,711,679 | |
Distributions reinvested: | | | | | | | | |
Class A | | | 1,683,273 | | | | 681,065 | |
Class C | | | 74,857 | | | | 22,055 | |
Class I | | | 1,864,817 | | | | 886,711 | |
Class Y | | | 5,124,722 | | | | 2,497,743 | |
Cost of shares redeemed: | | | | | | | | |
Class A | | | (74,345,590) | | | | (42,424,243) | |
Class C | | | (6,480,514) | | | | (4,148,259) | |
Class I | | | (86,226,290) | | | | (61,619,585) | |
Class Y | | | (33,499,537) | | | | (22,722,716) | |
Increase (Decrease) in Net Assets
from Beneficial Interest Transactions | 23,576,617 | | | | 156,588,092 | |
Total Increase (Decrease) in Net Assets | 131,764,372 | | | | 179,021,142 | |
Net Assets ($): | |
Beginning of Period | | | 571,813,751 | | | | 392,792,609 | |
End of Period | | | 703,578,123 | | | | 571,813,751 | |
Undistributed investment income—net | 10,527,791 | | | | 9,025,035 | |
16
| | | | | | | | | | | |
| | | | Year Ended September 30, |
| | | | 2017 | | | | 2016 | |
Capital Share Transactions (Shares): | |
Class Aa | | | | | | | | |
Shares sold | | | 1,299,406 | | | | 2,688,408 | |
Shares issued in connection with reorganization—Note 1 | - | | | | 931,572 | |
Shares issued for distributions reinvested | | | 52,933 | | | | 20,102 | |
Shares redeemed | | | (2,179,612) | | | | (1,317,208) | |
Net Increase (Decrease) in Shares Outstanding | (827,273) | | | | 2,322,874 | |
Class C | | | | | | | | |
Shares sold | | | 18,737 | | | | 110,160 | |
Shares issued in connection with reorganization—Note 1 | - | | | | 141,500 | |
Shares issued for distributions reinvested | | | 2,333 | | | | 646 | |
Shares redeemed | | | (184,807) | | | | (127,510) | |
Net Increase (Decrease) in Shares Outstanding | (163,737) | | | | 124,796 | |
Class Ia | | | | | | | | |
Shares sold | | | 2,950,710 | | | | 3,314,038 | |
Shares issued in connection with reorganization—Note 1 | - | | | | 155,516 | |
Shares issued for distributions reinvested | | | 57,860 | | | | 25,874 | |
Shares redeemed | | | (2,450,097) | | | | (1,919,551) | |
Net Increase (Decrease) in Shares Outstanding | 558,473 | | | | 1,575,877 | |
Class Y | | | | | | | | |
Shares sold | | | 1,871,334 | | | | 1,555,753 | |
Shares issued for distributions reinvested | | | 159,103 | | | | 72,927 | |
Shares redeemed | | | (973,627) | | | | (702,963) | |
Net Increase (Decrease) in Shares Outstanding | 1,056,810 | | | | 925,717 | |
| | | | | | | | | | |
a During the period ended September 30, 2017, 1,317 Class A shares representing $44,975 were exchanged for 1,298 Class I shares. | |
See notes to financial statements.
| | | | | | | | |
17
FINANCIAL HIGHLIGHTS
The following tables describe the performance for each share class for the fiscal periods indicated. All information (except portfolio turnover rate) reflects financial results for a single fund share. Total return shows how much your investment in the fund would have increased (or decreased) during each period, assuming you had reinvested all dividends and distributions. These figures have been derived from the fund’s financial statements.
| | | | | | | | | |
| | | | | |
| | | | | |
| | | Year Ended September 30, |
Class A Shares | | 2017 | 2016 | 2015 | 2014 | 2013 |
Per Share Data ($): | | | | | | |
Net asset value, beginning of period | | 33.37 | 32.37 | 35.69 | 33.61 | 27.34 |
Investment Operations: | | | | | | |
Investment income—neta | | .52 | .58 | .39 | .50 | .47 |
Net realized and unrealized
gain (loss) on investments | | 6.18 | .74 | (3.23) | 2.06 | 6.52 |
Total from Investment Operations | | 6.70 | 1.32 | (2.84) | 2.56 | 6.99 |
Distributions: | | | | | | |
Dividends from
investment income—net | | (.56) | (.32) | (.48) | (.48) | (.72) |
Net asset value, end of period | | 39.51 | 33.37 | 32.37 | 35.69 | 33.61 |
Total Return (%)b | | 20.47 | 4.06 | (8.01) | 7.62 | 26.02 |
Ratios/Supplemental Data (%): | | | | | | |
Ratio of total expenses
to average net assets | | 1.64 | 1.59 | 1.37 | 1.40 | 1.46 |
Ratio of net expenses
to average net assets | | 1.12 | 1.12 | 1.12 | 1.12 | 1.12 |
Ratio of net investment income
to average net assets | | 1.50 | 1.79 | 1.12 | 1.38 | 1.55 |
Portfolio Turnover Rate | | 90.15 | 79.90 | 87.33 | 89.36 | 71.87 |
Net Assets, end of period ($ x 1,000) | | 153,146 | 156,949 | 77,052 | 77,195 | 51,441 |
a Based on average shares outstanding.
b Exclusive of sales charge.
See notes to financial statements.
18
| | | | | | | | | |
| | | | | |
| | | Year Ended September 30, |
Class C Shares | | 2017 | 2016 | 2015 | 2014 | 2013 |
Per Share Data ($): | | | | | | |
Net asset value, beginning of period | | 33.43 | 32.46 | 35.79 | 33.75 | 27.45 |
Investment Operations: | | | | | | |
Investment income—neta | | .26 | .31 | .14 | .24 | .24 |
Net realized and unrealized
gain (loss) on investments | | 6.20 | .75 | (3.25) | 2.05 | 6.55 |
Total from Investment Operations | | 6.46 | 1.06 | (3.11) | 2.29 | 6.79 |
Distributions: | | | | | | |
Dividends from
investment income—net | | (.26) | (.09) | (.22) | (.25) | (.49) |
Net asset value, end of period | | 39.63 | 33.43 | 32.46 | 35.79 | 33.75 |
Total Return (%)b | | 19.52 | 3.27 | (8.73) | 6.78 | 25.03 |
Ratios/Supplemental Data (%): | | | | | | |
Ratio of total expenses
to average net assets | | 2.13 | 2.16 | 2.14 | 2.17 | 2.27 |
Ratio of net expenses
to average net assets | | 1.90 | 1.90 | 1.90 | 1.90 | 1.90 |
Ratio of net investment income
to average net assets | | .75 | .95 | .39 | .66 | .77 |
Portfolio Turnover Rate | | 90.15 | 79.90 | 87.33 | 89.36 | 71.87 |
Net Assets, end of period ($ x 1,000) | | 11,985 | 15,582 | 11,079 | 8,887 | 5,297 |
a Based on average shares outstanding.
b Exclusive of sales charge.
See notes to financial statements.
19
FINANCIAL HIGHLIGHTS (continued)
| | | | | | | | | |
| | | | | |
| | | Year Ended September 30, |
Class I Shares | | 2017 | 2016 | 2015 | 2014 | 2013 |
Per Share Data ($): | | | | | | |
Net asset value, beginning of period | | 33.82 | 32.74 | 36.03 | 33.85 | 27.47 |
Investment Operations: | | | | | | |
Investment income—neta | | .67 | .66 | .56 | .62 | .54 |
Net realized and unrealized
gain (loss) on investments | | 6.22 | .77 | (3.34) | 2.06 | 6.57 |
Total from Investment Operations | | 6.89 | 1.43 | (2.78) | 2.68 | 7.11 |
Distributions: | | | | | | |
Dividends from
investment income—net | | (.59) | (.35) | (.51) | (.50) | (.73) |
Net asset value, end of period | | 40.12 | 33.82 | 32.74 | 36.03 | 33.85 |
Total Return (%) | | 20.80 | 4.37 | (7.77) | 7.91 | 26.36 |
Ratios/Supplemental Data (%): | | | | | | |
Ratio of total expenses
to average net assets | | 1.19 | 1.18 | 1.03 | 1.04 | 1.07 |
Ratio of net expenses
to average net assets | | .85 | .85 | .85 | .85 | .85 |
Ratio of net investment income
to average net assets | | 1.89 | 1.99 | 1.57 | 1.70 | 1.77 |
Portfolio Turnover Rate | | 90.15 | 79.90 | 87.33 | 89.36 | 71.87 |
Net Assets, end of period ($ x 1,000) | | 187,558 | 139,214 | 83,179 | 214,170 | 132,978 |
a Based on average shares outstanding.
See notes to financial statements.
20
| | | | | | |
| | | | | |
| | | Year Ended September 30, |
Class Y Shares | | 2017 | 2016 | 2015a |
Per Share Data ($): | | | | |
Net asset value, beginning of period | | 33.80 | 32.73 | 36.66 |
Investment Operations: | | | | |
Investment income—netb | | .67 | .62 | .10 |
Net realized and unrealized
gain (loss) on investments | | 6.22 | .80 | (4.03) |
Total from Investment Operations | | 6.89 | 1.42 | (3.93) |
Distributions: | | | | |
Dividends from
investment income—net | | (.59) | (.35) | — |
Net asset value, end of period | | 40.10 | 33.80 | 32.73 |
Total Return (%) | | 20.81 | 4.33 | (10.72)c |
Ratios/Supplemental Data (%): | | | | |
Ratio of total expenses
to average net assets | | .99 | 1.00 | 1.01d |
Ratio of net expenses
to average net assets | | .85 | .85 | .85d |
Ratio of net investment income
to average net assets | | 1.87 | 1.89 | .95d |
Portfolio Turnover Rate | | 90.15 | 79.90 | 87.33 |
Net Assets, end of period ($ x 1,000) | | 350,889 | 260,069 | 221,483 |
a From June 1, 2015 (commencement of initial offering) to September 30, 2015.
b Based on average shares outstanding.
c Not annualized.
d Annualized.
See notes to financial statements.
21
NOTES TO FINANCIAL STATEMENTS
NOTE 1—Significant Accounting Policies:
Dreyfus International Equity Fund (the “fund”) is a separate diversified series of Dreyfus Stock Funds (the “Company”), which is registered under the Investment Company Act of 1940, as amended (the “Act”), as an open-end management investment company and operates as a series company currently offering three series, including the fund. The fund’s investment objective is to seek long-term growth of capital. The Boston Company Asset Management, LLC (“TBCAM”), a wholly-owned subsidiary of The Bank of New York Mellon Corporation (“BNY Mellon”), serves as the fund’s investment adviser. The Dreyfus Corporation (the “Administrator” or “Dreyfus”), a wholly-owned subsidiary of BNY Mellon and an affiliate of TBCAM, serves as the fund’s Administrator.
As of the close of business on January 22, 2016, pursuant to an Agreement and Plan of Reorganization previously approved by the Company’s Board of Trustees (the “Board”), all of the assets, subject to the liabilities, of Dreyfus International Value Fund’s Class A, Class C and Class I shares were transferred to the fund in exchange for Class A, Class C and Class I shares of Beneficial Interest of equal value. The purpose of the transaction was to combine two funds with comparable investment objectives and strategies. Shareholders of Dreyfus International Value Fund’s Class A, Class C and Class I shares received Class A, Class C and Class I shares of the fund, respectively, in an amount equal to the aggregate net asset value of their investment in Dreyfus International Value Fund’s Class A, Class C and Class I shares at the time of the exchange. The net asset value of the fund’s shares on the close of business on January 22, 2016, after the reorganization was $30.63 for Class A, $30.85 for Class C and $30.98 for Class I, and a total of 931,572 Class A, 141,500 Class C and 155,516 Class I shares were issued to shareholders of Dreyfus International Value Fund’s Class A, Class C and Class I shares, respectively in the exchange.
Effective March 31, 2017, the fund authorized the issuance of Class T shares, but, as of the date of this report, the fund did not offer Class T shares for purchase.
MBSC Securities Corporation (the “Distributor”), a wholly-owned subsidiary of Dreyfus, is the distributor of the fund’s shares. The fund is authorized to issue an unlimited number of $.001 par value shares of Beneficial Interest in each of the following classes of shares: Class A, Class C, Class I, Class T and Class Y. Class A and Class T shares generally are subject to a sales charge imposed at the time of purchase. Class C shares
22
are subject to a contingent deferred sales charge (“CDSC”) imposed on Class C shares redeemed within one year of purchase. Class I and Class Y shares are sold at net asset value per share generally to institutional investors. Other differences between the classes include the services offered to and the expenses borne by each class, the allocation of certain transfer agency costs, and certain voting rights. Income, expenses (other than expenses attributable to a specific class), and realized and unrealized gains or losses on investments are allocated to each class of shares based on its relative net assets.
The Company accounts separately for the assets, liabilities and operations of each series. Expenses directly attributable to each series are charged to that series’ operations; expenses which are applicable to all series are allocated among them on a pro rata basis.
The Financial Accounting Standards Board (“FASB”) Accounting Standards Codification (“ASC”) is the exclusive reference of authoritative U.S. generally accepted accounting principles (“GAAP”) recognized by the FASB to be applied by nongovernmental entities. Rules and interpretive releases of the Securities and Exchange Commission (“SEC”) under authority of federal laws are also sources of authoritative GAAP for SEC registrants. The fund’s financial statements are prepared in accordance with GAAP, which may require the use of management estimates and assumptions. Actual results could differ from those estimates.
The Company enters into contracts that contain a variety of indemnifications. The fund’s maximum exposure under these arrangements is unknown. The fund does not anticipate recognizing any loss related to these arrangements.
(a) Portfolio valuation: The fair value of a financial instrument is the amount that would be received to sell an asset or paid to transfer a liability in an orderly transaction between market participants at the measurement date (i.e., the exit price). GAAP establishes a fair value hierarchy that prioritizes the inputs of valuation techniques used to measure fair value. This hierarchy gives the highest priority to unadjusted quoted prices in active markets for identical assets or liabilities (Level 1 measurements) and the lowest priority to unobservable inputs (Level 3 measurements).
Additionally, GAAP provides guidance on determining whether the volume and activity in a market has decreased significantly and whether such a decrease in activity results in transactions that are not orderly. GAAP requires enhanced disclosures around valuation inputs and techniques used during annual and interim periods.
23
NOTES TO FINANCIAL STATEMENTS (continued)
Various inputs are used in determining the value of the fund’s investments relating to fair value measurements. These inputs are summarized in the three broad levels listed below:
Level 1—unadjusted quoted prices in active markets for identical investments.
Level 2—other significant observable inputs (including quoted prices for similar investments, interest rates, prepayment speeds, credit risk, etc.).
Level 3—significant unobservable inputs (including the fund’s own assumptions in determining the fair value of investments).
The inputs or methodology used for valuing securities are not necessarily an indication of the risk associated with investing in those securities.
Changes in valuation techniques may result in transfers in or out of an assigned level within the disclosure hierarchy. Valuation techniques used to value the fund’s investments are as follows:
Investments in securities are valued at the last sales price on the securities exchange or national securities market on which such securities are primarily traded. Securities listed on the National Market System for which market quotations are available are valued at the official closing price or, if there is no official closing price that day, at the last sales price. For open short positions, asked prices are used for valuation purposes. Bid price is used when no asked price is available. Registered investment companies that are not traded on an exchange are valued at their net asset value. All of the preceding securities are generally categorized within Level 1 of the fair value hierarchy.
Securities not listed on an exchange or the national securities market, or securities for which there were no transactions, are valued at the average of the most recent bid and asked prices. These securities are generally categorized within Level 2 of the fair value hierarchy.
Fair valuing of securities may be determined with the assistance of a pricing service using calculations based on indices of domestic securities and other appropriate indicators, such as prices of relevant American Depository Receipts and futures. Utilizing these techniques may result in transfers between Level 1 and Level 2 of the fair value hierarchy.
When market quotations or official closing prices are not readily available, or are determined not to reflect accurately fair value, such as when the value of a security has been significantly affected by events after the close of the exchange or market on which the security is principally traded (for
24
example, a foreign exchange or market), but before the fund calculates its net asset value, the fund may value these investments at fair value as determined in accordance with the procedures approved by the Board. Certain factors may be considered when fair valuing investments such as: fundamental analytical data, the nature and duration of restrictions on disposition, an evaluation of the forces that influence the market in which the securities are purchased and sold, and public trading in similar securities of the issuer or comparable issuers. These securities are either categorized within Level 2 or 3 of the fair value hierarchy depending on the relevant inputs used.
For restricted securities where observable inputs are limited, assumptions about market activity and risk are used and are generally categorized within Level 3 of the fair value hierarchy.
Investments denominated in foreign currencies are translated to U.S. dollars at the prevailing rates of exchange.
Forward foreign currency exchange contracts (“forward contracts”) are valued at the forward rate and are generally categorized within Level 2 of the fair value hierarchy.
The following is a summary of the inputs used as of September 30, 2017 in valuing the fund’s investments:
| | | | | | |
| | Level 1- Unadjusted Quoted Prices | Level 2 - Other Significant Observable Inputs | | Level 3- Significant Unobservable Inputs | Total |
Assets ($) | | | |
Investments in Securities: | | | |
Equity Securities -
Foreign
Common Stocks† | 687,618,549 | — | | — | 687,618,549 |
Exchange-Traded Fund | 6,951,610 | — | | — | 6,951,610 |
Registered Investment Company | 2,468,266 | — | | — | 2,468,266 |
Liabilities ($) | | | | | |
Other Financial Instruments: | | | | |
Forward Foreign Currency Exchange Contracts†† | — | (1,156) | | — | (1,156) |
† See Statement of Investments for additional detailed categorizations.
†† Amount shown represents unrealized (depreciation) at period end.
At September 30, 2016, $549,697,566 of exchange traded foreign equity securities were classified within Level 2 of the fair value hierarchy pursuant to the fund’s fair valuation procedures. It is the fund’s policy to recognize transfers between levels at the end of the reporting period.
25
NOTES TO FINANCIAL STATEMENTS (continued)
(b) Foreign currency transactions: The fund does not isolate that portion of the results of operations resulting from changes in foreign exchange rates on investments from the fluctuations arising from changes in the market prices of securities held. Such fluctuations are included with the net realized and unrealized gain or loss on investments.
Net realized foreign exchange gains or losses arise from sales of foreign currencies, currency gains or losses realized on securities transactions between trade and settlement date, and the difference between the amounts of dividends, interest and foreign withholding taxes recorded on the fund’s books and the U.S. dollar equivalent of the amounts actually received or paid. Net unrealized foreign exchange gains and losses arise from changes in the value of assets and liabilities other than investments resulting from changes in exchange rates. Foreign currency gains and losses on foreign currency transactions are also included with net realized and unrealized gain or loss on investments.
(c) Securities transactions and investment income: Securities transactions are recorded on a trade date basis. Realized gains and losses from securities transactions are recorded on the identified cost basis. Dividend income is recognized on the ex-dividend date and interest income, including, where applicable, accretion of discount and amortization of premium on investments, is recognized on the accrual basis.
(d) Affiliated issuers: Investments in other investment companies advised by Dreyfus are defined as “affiliated” under the Act.
Certain affiliated investment companies may also invest in the fund. At September 30, 2017, Dreyfus Diversified International Fund, an affiliate of the fund, held 8,437,855 Class Y shares representing approximately 48% of the fund’s net assets.
(e) Risk: Investing in foreign markets may involve special risks and considerations not typically associated with investing in the U.S. These risks include revaluation of currencies, high rates of inflation, repatriation restrictions on income and capital, and adverse political and economic developments. Moreover, securities issued in these markets may be less liquid, subject to government ownership controls and delayed settlements, and their prices may be more volatile than those of comparable securities in the U.S.
(f) Dividends and distributions to shareholders: Dividends and distributions are recorded on the ex-dividend date. Dividends from investment income-net and dividends from net realized capital gains, if any, are normally declared and paid annually, but the fund may make
26
distributions on a more frequent basis to comply with the distribution requirements of the Internal Revenue Code of 1986, as amended (the “Code”). To the extent that net realized capital gains can be offset by capital loss carryovers, it is the policy of the fund not to distribute such gains. Income and capital gain distributions are determined in accordance with income tax regulations, which may differ from GAAP.
(g) Federal income taxes: It is the policy of the fund to continue to qualify as a regulated investment company, if such qualification is in the best interests of its shareholders, by complying with the applicable provisions of the Code, and to make distributions of taxable income sufficient to relieve it from substantially all federal income and excise taxes.
As of and during the period ended September 30, 2017, the fund did not have any liabilities for any uncertain tax positions. The fund recognizes interest and penalties, if any, related to uncertain tax positions as income tax expense in the Statement of Operations. During the period ended September 30, 2017, the fund did not incur any interest or penalties.
Each tax year in the four-year period ended September 30, 2017 remains subject to examination by the Internal Revenue Service and state taxing authorities.
At September 30, 2017, the components of accumulated earnings on a tax basis were as follows: undistributed ordinary income $10,867,497, accumulated capital losses $82,955,634 and unrealized appreciation $88,592,647.
Under the Regulated Investment Company Modernization Act of 2010 (the “2010 Act”), the fund is permitted to carry forward capital losses incurred in taxable years beginning after December 22, 2010 (“post-enactment losses”) for an unlimited period. Furthermore, post-enactment capital loss carryovers retain their character as either short-term or long-term capital losses rather than short-term as they were under previous statute. The 2010 Act requires post-enactment losses to be utilized before the utilization of losses incurred in taxable years prior to the effective date of the 2010 Act (“pre-enactment losses”). As a result of this ordering rule, pre-enactment losses may be more likely to expire unused.
The accumulated capital loss carryover is available for federal income tax purposes to be applied against future net realized capital gains, if any, realized subsequent to September 30, 2017. If not applied, $35,896,028 of the carryover expires in fiscal 2018. The fund has $8,095,205 of post-enactment long-term capital losses which can be carried forward for an unlimited period.
27
NOTES TO FINANCIAL STATEMENTS (continued)
As a result of the fund’s merger with Dreyfus International Value Fund, capital losses of $38,964,401 are available to offset future realized gains, if any. Based on certain provisions in the Code, the amount of losses which can be utilized in subsequent years is subject to an annual limitation. The acquired fund had $348,558 of post-enactment short-term capital losses and $38,615,843 of post-enactment long-term capital losses which can be carried forward for an unlimited period but are also subject to an annual limitation.
The tax character of distributions paid to shareholders during the fiscal periods ended September 30, 2017 and September 30, 2016 were as follows: ordinary income $10,050,704 and $4,405,255, respectively.
During the period ended September 30, 2017, as a result of permanent book to tax differences, primarily due to the tax treatment for passive foreign investment companies, foreign currency gains and losses and class action settlement, the fund increased accumulated undistributed investment income-net by $830,755 and decreased accumulated net realized gain (loss) on investments by the same amount. Net assets and net asset value per share were not affected by this reclassification.
NOTE 2—Bank Lines of Credit:
The fund participates with other Dreyfus-managed funds in an $810 million unsecured credit facility led by Citibank, N.A. and a $300 million unsecured credit facility provided by The Bank of New York Mellon, a subsidiary of BNY Mellon and an affiliate of Dreyfus (each, a “Facility”), each to be utilized primarily for temporary or emergency purposes, including the financing of redemptions. Prior to October 5, 2016, the unsecured credit facility with Citibank, N.A. was $555 million. In connection therewith, the fund has agreed to pay its pro rata portion of commitment fees for each Facility. Interest is charged to the fund based on rates determined pursuant to the terms of the respective Facility at the time of borrowing.
The average amount of borrowings outstanding under the Facilities during the period ended September 30, 2017 was approximately $37,300 with a related weighted average annualized interest rate of 1.57%.
NOTE 3—Investment Advisory Fee, Administration Fee and Other Transactions with Affiliates:
(a) Pursuant to an investment advisory agreement with TBCAM, the investment advisory fee is computed at the annual rate of .80% of the value of the fund’s average daily net assets up to $500 million, .75% of the next $500 million of such assets, .70% of the next $500 million of such
28
assets, .60% of the next $500 million of such assets and .50% of the fund’s average daily net assets in excess of $2 billion and is payable monthly. The effective investment advisory fee rate during the period ended September 30, 2017 was .79%.
Dreyfus and TBCAM have contractually agreed to waive receipt of their fees and/or assume the direct expenses of the fund, so that such expenses (excluding taxes, interest expense, brokerage commissions, commitment fees on borrowings and extraordinary expenses) do not exceed an annual rate of 1.12% for Class A shares, 1.90% for Class C shares, .85% for Class I shares and .85% for Class Y shares of the value of the respective class’ average daily net assets. With respect to Class A, Class C and Class I shares, this agreement will continue in effect, with respect to each class, until the fiscal year end following such time as the expenses are equal to or less than such annual rate for the applicable class. With respect to Class Y shares, this agreement will continue until February 1, 2019, after which the expense limitation can be terminated at any time. The reduction in expenses, pursuant to the undertaking, amounted to $1,688,809 during the period ended September 30, 2017.
The fund compensates Dreyfus under an administration agreement for providing personnel and facilities to perform accounting and administration services for the fund at an annual rate of .10% of the value of the fund’s average daily net assets. Pursuant to the administration agreement, the fund was charged $608,729 during the period ended September 30, 2017.
During the period ended September 30, 2017, the Distributor retained $6,075 from commissions earned on sales of the fund’s Class A shares and $3,504 from CDSCs on redemptions of the fund’s Class C shares.
(b) Under the Distribution Plan adopted pursuant to Rule 12b-1 under the Act, Class C shares pay the Distributor for distributing its shares at an annual rate of .75% of the value of its average daily net assets. During the period ended September 30, 2017, Class C shares were charged $99,546 pursuant to the Distribution Plan.
(c) Under the Shareholder Services Plan, Class A and Class C shares pay the Distributor at an annual rate of .25% of the value of their average daily net assets for the provision of certain services. The services provided may include personal services relating to shareholder accounts, such as answering shareholder inquiries regarding the fund and providing reports and other information, and services related to the maintenance of shareholder accounts. The Distributor may make payments to Service Agents (securities dealers, financial institutions or other industry
29
NOTES TO FINANCIAL STATEMENTS (continued)
professionals) with respect to these services. The Distributor determines the amounts to be paid to Service Agents. During the period ended September 30, 2017, Class A and Class C shares were charged $365,706 and $33,182, respectively, pursuant to the Shareholder Services Plan.
The fund has arrangements with the transfer agent and the custodian whereby the fund may receive earnings credits when positive cash balances are maintained, which are used to offset transfer agency and custody fees. For financial reporting purposes, the fund includes net earnings credits as an expense offset in the Statement of Operations.
The fund compensates Dreyfus Transfer, Inc., a wholly-owned subsidiary of Dreyfus, under a transfer agency agreement for providing transfer agency and cash management services for the fund. The majority of transfer agency fees are comprised of amounts paid on a per account basis, while cash management fees are related to fund subscriptions and redemptions. During the period ended September 30, 2017, the fund was charged $43,063 for transfer agency services and $3,671 for cash management services. These fees are included in Shareholder servicing costs in the Statement of Operations. Cash management fees were offset by earnings credits of $3,671.
The fund compensates The Bank of New York Mellon under a custody agreement for providing custodial services for the fund. These fees are determined based on net assets, geographic region and transaction activity. During the period ended September 30, 2017, the fund was charged $216,883 pursuant to the custody agreement.
During the period ended September 30, 2017, the fund was charged $11,281 for services performed by the Chief Compliance Officer and his staff.
The components of “Due to TBCAM and affiliates” in the Statement of Assets and Liabilities consist of: investment advisory fees $449,519, administration fees $57,196, Distribution Plan fees $7,404, Shareholder Services Plan fees $33,643, custodian fees $76,515, Chief Compliance Officer fees $5,604 and transfer agency fees $9,101, which are offset against an expense reimbursement currently in effect in the amount of $138,263.
(d) Each Board member also serves as a Board member of other funds within the Dreyfus complex. Annual retainer fees and attendance fees are allocated to each fund based on net assets.
30
NOTE 4—Securities Transactions:
The aggregate amount of purchases and sales of investment securities, excluding short-term securities and forward contracts, during the period ended September 30, 2017, amounted to $565,257,358 and $544,740,185, respectively.
Derivatives: A derivative is a financial instrument whose performance is derived from the performance of another asset. The fund enters into International Swaps and Derivatives Association, Inc. Master Agreements or similar agreements (collectively, “Master Agreements”) with its over-the-counter (“OTC”) derivative contract counterparties in order to, among other things, reduce its credit risk to counterparties. Master Agreements include provisions for general obligations, representations, collateral and events of default or termination. Under a Master Agreement, the fund may offset with the counterparty certain derivative financial instrument’s payables and/or receivables with collateral held and/or posted and create one single net payment in the event of default or termination.
Each type of derivative instrument that was held by the fund during the period ended September 30, 2017 is discussed below.
Forward Foreign Currency Exchange Contracts: The fund enters into forward contracts in order to hedge its exposure to changes in foreign currency exchange rates on its foreign portfolio holdings, to settle foreign currency transactions or as a part of its investment strategy. When executing forward contracts, the fund is obligated to buy or sell a foreign currency at a specified rate on a certain date in the future. With respect to sales of forward contracts, the fund incurs a loss if the value of the contract increases between the date the forward contract is opened and the date the forward contract is closed. The fund realizes a gain if the value of the contract decreases between those dates. With respect to purchases of forward contracts, the fund incurs a loss if the value of the contract decreases between the date the forward contract is opened and the date the forward contract is closed. The fund realizes a gain if the value of the contract increases between those dates. Any realized or unrealized gains or losses which occurred during the period are reflected in the Statement of Operations. The fund is exposed to foreign currency risk as a result of changes in value of underlying financial instruments. The fund is also exposed to credit risk associated with counterparty nonperformance on these forward contracts, which is generally limited to the unrealized gain on each open contract. This risk may be mitigated by Master Agreements, if any, between the fund and the counterparty and the posting of collateral, if any, by the counterparty to the fund to cover the fund’s exposure to the
31
NOTES TO FINANCIAL STATEMENTS (continued)
counterparty. Forward contracts open at September 30, 2017 are set forth in the Statement of Forward Foreign Currency Exchange Contracts.
The provisions of ASC Topic 210 “Disclosures about Offsetting Assets and Liabilities” require disclosure on the offsetting of financial assets and liabilities. These disclosures are required for certain investments, including derivative financial instruments subject to Master Agreements which are eligible for offsetting in the Statement of Assets and Liabilities and require the fund to disclose both gross and net information with respect to such investments. For financial reporting purposes, the fund does not offset derivative assets and derivative liabilities that are subject to Master Agreements in the Statement of Assets and Liabilities.
At September 30, 2017, derivative assets and liabilities (by type) on a gross basis are as follows:
| | | | | | |
Derivative Financial Instruments: | | Assets ($) | | Liabilities ($) | |
Forward contracts | | - | | (1,156) | |
Total gross amount of derivative | | | | | |
assets and liabilities in the | | | | | |
Statement of Assets and Liabilities | | - | | (1,156) | |
Derivatives not subject to | | | | | |
Master Agreements | | - | | - | |
Total gross amount of assets | | | | | |
and liabilities subject to | | | | | |
Master Agreements | | - | | (1,156) | |
The following table presents derivative liabilities net of amounts available for offsetting under Master Agreements and net of related collateral received or pledged, if any, as of September 30, 2017:
| | | | | | | |
| | | | | | | |
| | | | Financial | | | |
| | | | Instruments | | | |
| | | | and Derivatives | | | |
| | Gross Amount of | | Available | Collateral | | Net Amount of |
Counterparty | Liabilities ($) | 1 | for Offset ($) | Pledged ($) | | Liabilities ($) |
Goldman Sachs
International | (1,156) | | - | - | | (1,156) |
| | | | | | | |
1 Absent a default event or early termination, OTC derivative assets and liabilities are presented at gross amounts and are not offset in the Statement of Assets and Liabilities. |
The following summarizes the average market value of derivatives outstanding during the period ended September 30, 2017:
| | | |
| | Average Market Value ($) |
Forward contracts | | 4,212,184 |
32
At September 30, 2017, the cost of investments for federal income tax purposes was $608,440,953; accordingly, accumulated net unrealized appreciation on investments inclusive of derivative contracts was $88,596,316, consisting of $98,662,588 gross unrealized appreciation and $10,066,272 gross unrealized depreciation.
33
REPORT OF INDEPENDENT REGISTERED
PUBLIC ACCOUNTING FIRM
Shareholders and Board of Trustees
Dreyfus International Equity Fund
We have audited the accompanying statement of assets and liabilities, including the statements of investments, investments in affiliated issuers and forward foreign currency exchange contracts, of Dreyfus International Equity Fund (one of the series comprising Dreyfus Stock Funds) as of September 30, 2017, and the related statement of operations for the year then ended, the statement of changes in net assets for each of the two years in the period then ended, and the financial highlights for each of the periods indicated therein. These financial statements and financial highlights are the responsibility of the Fund’s management. Our responsibility is to express an opinion on these financial statements and financial highlights based on our audits.
We conducted our audits in accordance with the standards of the Public Company Accounting Oversight Board (United States). Those standards require that we plan and perform the audit to obtain reasonable assurance about whether the financial statements and financial highlights are free of material misstatement. We were not engaged to perform an audit of the Fund’s internal control over financial reporting. Our audits included consideration of internal control over financial reporting as a basis for designing audit procedures that are appropriate in the circumstances, but not for the purpose of expressing an opinion on the effectiveness of the Fund’s internal control over financial reporting. Accordingly, we express no such opinion. An audit also includes examining, on a test basis, evidence supporting the amounts and disclosures in the financial statements and financial highlights, assessing the accounting principles used and significant estimates made by management, and evaluating the overall financial statement presentation. Our procedures included confirmation of securities owned as of September 30, 2017 by correspondence with the custodian and others. We believe that our audits provide a reasonable basis for our opinion.
In our opinion, the financial statements and financial highlights referred to above present fairly, in all material respects, the financial position of Dreyfus International Equity Fund at September 30, 2017, the results of its operations for the year then ended, the changes in its net assets for each of the two years in the period then ended, and the financial highlights for each of the indicated periods, in conformity with U.S. generally accepted accounting principles.

New York, New York
November 29, 2017
34
IMPORTANT TAX INFORMATION (Unaudited)
In accordance with federal tax law, the fund elects to provide each shareholder with their portion of the fund’s foreign taxes paid and the income sourced from foreign countries. Accordingly, the fund hereby reports the following information regarding its fiscal year ended September 30, 2017:
- the total amount of taxes paid to foreign countries was $1,667,696.
- the total amount of income sourced from foreign countries was $17,912,118.
As required by federal tax law rules, shareholders will receive notification of their proportionate share of foreign taxes paid and foreign sourced income for the 2017 calendar year with Form 1099-DIV which will be mailed in early 2018. Also, certain dividends paid by the fund may be subject to a maximum tax rate of 15%, as provided for by the Jobs and Growth Tax Relief Reconciliation Act of 2003. Of the distributions paid during the fiscal year, $10,050,704 represents the maximum amount that may be considered qualified dividend income.
35
BOARD MEMBERS INFORMATION (Unaudited)
INDEPENDENT BOARD MEMBERS
Joseph S. DiMartino (73)
Chairman of the Board (2003)
Principal Occupation During Past 5 Years:
· Corporate Director and Trustee (1995-present)
Other Public Company Board Memberships During Past 5 Years:
· CBIZ (formerly, Century Business Services, Inc.), a provider of outsourcing functions for small and medium size companies, Director (1997-present)
No. of Portfolios for which Board Member Serves: 127
———————
Joni Evans (75)
Board Member (2006)
Principal Occupation During Past 5 Years:
· Chief Executive Officer, www.wowOwow.com, an online community dedicated to women’s conversations and publications (2007-present)
· Principal, Joni Evans Ltd. (publishing) (2006-present)
No. of Portfolios for which Board Member Serves: 21
———————
Ehud Houminer (77)
Board Member (2003)
Principal Occupation During Past 5 Years:
· Board of Overseers at the Columbia Business School, Columbia
University (1992-present)
Trustee, Ben Gurion University
Other Public Company Board Memberships During Past 5 Years:
· Avnet, Inc., an electronics distributor, Director (1993-2012)
No. of Portfolios for which Board Member Serves: 52
———————
Hans C. Mautner (79)
Board Member (2003)
Principal Occupation During Past 5 Years:
· Corporate Director and Trustee (1978-present)
No. of Portfolios for which Board Member Serves: 21
———————
36
Robin A. Melvin (54)
Board Member (2003)
Principal Occupation During Past 5 Years:
· Co-chairman, Illinois Mentoring Partnership, non-profit organization dedicated to increasing the quantity and quality of mentoring services in Illinois; (2014-present; board member since 2013)
· Director, Boisi Family Foundation, a private family foundation that supports
youth-serving organizations that promote the self sufficiency of youth from
disadvantaged circumstances (1995-2012)
No. of Portfolios for which Board Member Serves: 99
———————
Burton N. Wallack (66)
Board Member (2006)
Principal Occupation During Past 5 Years:
· President and Co-owner of Wallack Management Company, a real estate management
company (1987-present)
No. of Portfolios for which Board Member Serves: 21
———————
Benaree Pratt Wiley (71)
Board Member (2003)
Principal Occupation During Past 5 Years:
· Principal, The Wiley Group, a firm specializing in strategy and business development (2005-present)
Other Public Company Board Memberships During Past 5 Years:
· CBIZ (formerly, Century Business Services, Inc.), a provider of outsourcing functions for small and medium size companies, Director (2008-present)
No. of Portfolios for which Board Member Serves: 82
———————
37
BOARD MEMBERS INFORMATION (Unaudited) (continued)
INTERESTED BOARD MEMBER
Gordon J. Davis (76)
Board Member (2006)
Principal Occupation During Past 5 Years:
· Partner in the law firm of Venable LLP (2012-present)
· Partner in the law firm of Dewey & LeBoeuf LLP (1994-2012)
Other Public Company Board Memberships During Past 5 Years:
· Consolidated Edison, Inc., a utility company, Director (1997-2014)
· The Phoenix Companies, Inc., a life insurance company, Director (2000-2014)
No. of Portfolios for which Board Member Serves: 54
Gordon J. Davis is deemed to be an “interested person” (as defined under the Act) of the Company as a result of his affiliation with Venable LLP, which provides legal services to the Company.
———————
Once elected all Board Members serve for an indefinite term, but achieve Emeritus status upon reaching age 80. The address of the Board Members and Officers is c/o The Dreyfus Corporation, 200 Park Avenue, New York, New York 10166. Additional information about the Board Members is available in the fund’s Statement of Additional Information which can be obtained from Dreyfus free of charge by calling this toll free number: 1-800-DREYFUS.
William Hodding Carter III, Emeritus Board Member
38
OFFICERS OF THE FUND (Unaudited)
BRADLEY J. SKAPYAK, President since January 2010.
Chief Operating Officer and a director of the Manager since June 2009, Chairman of Dreyfus Transfer, Inc., an affiliate of the Manager and the transfer agent of the funds, since May 2011 and Chief Executive Officer of MBSC Securities Corporation since August 2016. He is an officer of 61 investment companies (comprised of 127 portfolios) managed by the Manager. He is 58 years old and has been an employee of the Manager since February 1988.
BENNETT A. MACDOUGALL, Chief Legal Officer since October 2015.
Chief Legal Officer of the Manager and Associate General Counsel and Managing Director of BNY Mellon since June 2015; from June 2005 to June 2015, he served in various capacities with Deutsche Bank – Asset & Wealth Management Division, including as Director and Associate General Counsel, and Chief Legal Officer of Deutsche Investment Management Americas Inc. from June 2012 to May 2015. He is an officer of 62 investment companies (comprised of 152 portfolios) managed by the Manager. He is 46 years old and has been an employee of the Manager since June 2015.
JANETTE E. FARRAGHER, Vice President and Secretary since December 2011.
Associate General Counsel of BNY Mellon, and an officer of 62 investment companies (comprised of 152 portfolios) managed by the Manager. She is 54 years old and has been an employee of the Manager since February 1984.
JAMES BITETTO, Vice President and Assistant Secretary since August 2005.
Managing Counsel of BNY Mellon and Secretary of the Manager, and an officer of 62 investment companies (comprised of 152 portfolios) managed by the Manager. He is 51 years old and has been an employee of the Manager since December 1996.
JOSEPH M. CHIOFFI, Vice President and Assistant Secretary since August 2005.
Managing Counsel of BNY Mellon, and an officer of 62 investment companies (comprised of 152 portfolios) managed by the Manager. He is 55 years old and has been an employee of the Manager since June 2000.
MAUREEN E. KANE, Vice President and Assistant Secretary since April 2015.
Managing Counsel of BNY Mellon since July 2014; from October 2004 until July 2014, General Counsel, and from May 2009 until July 2014, Chief Compliance Officer of Century Capital Management. She is an officer of 62 investment companies (comprised of 152 portfolios) managed by the Manager. She is 55 years old and has been an employee of the Manager since July 2014.
SARAH S. KELLEHER, Vice President and Assistant Secretary since April 2014.
Senior Counsel of BNY Mellon since March 2013, from August 2005 to March 2013, Associate General Counsel of Third Avenue Management. She is an officer of 62 investment companies (comprised of 152 portfolios) managed by the Manager. She is 42 years old and has been an employee of the Manager since March 2013.
JEFF PRUSNOFSKY, Vice President and Assistant Secretary since August 2005.
Senior Managing Counsel of BNY Mellon, and an officer of 62 investment companies (comprised of 152 portfolios) managed by the Manager. He is 52 years old and has been an employee of the Manager since October 1990.
NATALYA ZELENSKY, Vice President and Assistant Secretary since March 2017.
Counsel and Vice President of BNY Mellon since May 2016; Attorney at Wildermuth Endowment Strategy Fund/Wildermuth Advisory, LLC from November 2015 until May 2016; Assistant General Counsel at RCS Advisory Services from July 2014 until November 2015; Associate at Sutherland, Asbill & Brennan from January 2013 until January 2014; Associate at K&L Gates from October 2011 until January 2013. She is an officer of 62 investment companies (comprised of 152 portfolios) managed by Dreyfus. She is 32 years old and has been an employee of the Manager since May 2016.
JAMES WINDELS, Treasurer since November 2001.
Director – Mutual Fund Accounting of the Manager, and an officer of 62 investment companies (comprised of 152 portfolios) managed by the Manager. He is 59 years old and has been an employee of the Manager since April 1985.
39
OFFICERS OF THE FUND (Unaudited) (continued)
RICHARD CASSARO, Assistant Treasurer since January 2008.
Senior Accounting Manager – Money Market and Municipal Bond Funds of the Manager, and an officer of 62 investment companies (comprised of 152 portfolios) managed by the Manager. He is 58 years old and has been an employee of the Manager since September 1982.
GAVIN C. REILLY, Assistant Treasurer since December 2005.
Tax Manager of the Investment Accounting and Support Department of the Manager, and an officer of 62 investment companies (comprised of 152 portfolios) managed by the Manager. He is 49 years old and has been an employee of the Manager since April 1991.
ROBERT S. ROBOL, Assistant Treasurer since August 2005.
Senior Accounting Manager – Dreyfus Financial Reporting of the Manager, and an officer of 62 investment companies (comprised of 152 portfolios) managed by the Manager. He is 53 years old and has been an employee of the Manager since October 1988.
ROBERT SALVIOLO, Assistant Treasurer since July 2007.
Senior Accounting Manager – Equity Funds of the Manager, and an officer of 62 investment companies (comprised of 152 portfolios) managed by the Manager. He is 50 years old and has been an employee of the Manager since June 1989.
ROBERT SVAGNA, Assistant Treasurer since December 2002.
Senior Accounting Manager – Fixed Income and Equity Funds of the Manager, and an officer of 62 investment companies (comprised of 152 portfolios) managed by the Manager. He is 50 years old and has been an employee of the Manager since November 1990.
JOSEPH W. CONNOLLY, Chief Compliance Officer since October 2004.
Chief Compliance Officer of the Manager and The Dreyfus Family of Funds (62 investment companies, comprised of 152 portfolios). He is 60 years old and has served in various capacities with the Manager since 1980, including manager of the firm’s Fund Accounting Department from 1997 through October 2001.
CARIDAD M. CAROSELLA, Anti-Money Laundering Compliance Officer since January 2016.
Anti-Money Laundering Compliance Officer of the Dreyfus Family of Funds and BNY Mellon Funds Trust since January 2016; from May 2015 to December 2015, Interim Anti-Money Laundering Compliance Officer of the Dreyfus Family of Funds and BNY Mellon Funds Trust and the Distributor; from January 2012 to May 2015, AML Surveillance Officer of the Distributor and from 2007 to December 2011, Financial Processing Manager of the Distributor. She is an officer of 57 investment companies (comprised of 147 portfolios) managed by the Manager. She is 49 years old and has been an employee of the Distributor since 1997.
40
NOTES
41
Dreyfus International Equity Fund
200 Park Avenue
New York, NY 10166
Investment Adviser
The Boston Company
Asset Management, LLC
Mellon Financial Center
One Boston Place
Boston, MA 02108
Administrator
The Dreyfus Corporation
200 Park Avenue
New York, NY 10166
Custodian
The Bank of New York Mellon
225 Liberty Street
New York, NY 10286
Transfer Agent &
Dividend Disbursing Agent
Dreyfus Transfer, Inc.
200 Park Avenue
New York, NY 10166
Distributor
MBSC Securities Corporation
200 Park Avenue
New York, NY 10166
| | |
Ticker Symbols: | Class A: DIEAX Class C: DIECX Class I: DIERX Class Y: DIEYX |
Telephone Call your financial representative or 1-800-DREYFUS
Mail The Dreyfus Family of Funds, 144 Glenn Curtiss Boulevard, Uniondale, NY 11556-0144
E-mail Send your request to info@dreyfus.com
Internet Information can be viewed online or downloaded at www.dreyfus.com
The fund files its complete schedule of portfolio holdings with the Securities and Exchange Commission (“SEC”) for the first and third quarters of each fiscal year on Form N-Q. The fund’s Forms N-Q are available on the SEC’s website at www.sec.gov and may be reviewed and copied at the SEC’s Public Reference Room in Washington, D.C. (phone 1-800-SEC-0330 for information).
A description of the policies and procedures that the fund uses to determine how to vote proxies relating to portfolio securities and information regarding how the fund voted these proxies for the most recent 12-month period ended June 30 is available at www.dreyfus.com and on the SEC’s website at www.sec.gov and without charge, upon request, by calling 1-800-DREYFUS.
| | |
© 2017 MBSC Securities Corporation
0720AR0917 | 
|