UNITED STATES
SECURITIES AND EXCHANGE COMMISSION
Washington, D.C. 20549
FORM N-CSR
CERTIFIED SHAREHOLDER REPORT OF REGISTERED MANAGEMENT
INVESTMENT COMPANIES
Investment Company Act file number | 811-21236 |
| |
| DREYFUS STOCK FUNDS | |
| (Exact name of Registrant as specified in charter) | |
| | |
| c/o The Dreyfus Corporation 200 Park Avenue New York, New York 10166 | |
| (Address of principal executive offices) (Zip code) | |
| | |
| Bennett MacDougall, Esq. 200 Park Avenue New York, New York 10166 | |
| (Name and address of agent for service) | |
|
Registrant's telephone number, including area code: | (212) 922-6000 |
| |
Date of fiscal year end: | 10/31 | |
Date of reporting period: | 10/31/15 | |
| | | | | | | |
The following N-CSR relates only to the Registrant’s series listed below and does not affect the other series of the Registrant, which has a different fiscal year end and, therefore, different N-CSR reporting requirements. A separate N-CSR Form will be filed for those series, as appropriate.
-Dreyfus International Small Cap Fund
FORM N-CSR
Item 1. Reports to Stockholders.
Dreyfus International Small Cap Fund
| | | |

| | ANNUAL REPORT
October 31, 2015 |
| |
Save time. Save paper. View your next shareholder report online as soon as it’s available. Log into www.dreyfus.com and sign up for Dreyfus eCommunications. It’s simple and only takes a few minutes. |
| |
The views expressed in this report reflect those of the portfolio manager only through the end of the period covered and do not necessarily represent the views of Dreyfus or any other person in the Dreyfus organization. Any such views are subject to change at any time based upon market or other conditions and Dreyfus disclaims any responsibility to update such views. These views may not be relied on as investment advice and, because investment decisions for a Dreyfus fund are based on numerous factors, may not be relied on as an indication of trading intent on behalf of any Dreyfus fund. |
| |
Not FDIC-Insured • Not Bank-Guaranteed • May Lose Value |
Contents
T H E F U N D
F O R M O R E I N F O R M AT I O N
Back Cover
| | | | |
| |
Dreyfus International Small Cap Fund
| | The Fund |
A LETTER FROM THE PRESIDENT
Dear Shareholder:
We are pleased to present this annual report for Dreyfus Stock Funds - Dreyfus International Small Cap Fund, from the fund’s inception on January 30, 2015, to the end of its fiscal year on October 31, 2015. For information about how the fund performed during the reporting period, as well as general market perspectives, we provide a Discussion of Fund Performance on the pages that follow.
Financial markets proved volatile over the reporting period amid choppy U.S. and global economic growth. U.S. stocks advanced over the final months of 2014 and the spring of 2015, with some broad measures of market performance setting new record highs. Those gains were largely erased over the summer when global economic instability undermined investor sentiment, but a renewed rally in October enabled most broad stock indices to end the reporting period in positive territory. In contrast, international stocks generally lost a degree of value, with developed markets faring far better than emerging markets amid falling commodity prices and depreciating currency values. U.S. bonds generally produced modestly positive total returns, with municipal bonds and longer term U.S. government securities faring better, on average, than corporate-backed bonds.
We expect market volatility to persist over the near term until investors see greater clarity regarding short-term U.S. interest rates and global economic conditions. Our investment strategists and portfolio managers are monitoring developments carefully, keeping a close watch on credit spreads, currency values, commodity prices, corporate profits, economic trends in the emerging markets, and other developments that could influence investor sentiment. Over the longer term, we remain confident that markets are likely to benefit as investors increasingly recognize that inflation is likely to stay low, economic growth expectations are stabilizing, and monetary policies remain accommodative in most regions of the world. In our view, investors will continue to be well served under these circumstances by a long-term perspective and a disciplined investment approach.
Thank you for your continued confidence and support.
Sincerely,

J. Charles Cardona
President
The Dreyfus Corporation
November 16, 2015
2
DISCUSSION OF FUND PERFORMANCE
For the period of January 30, 2015, through October 31, 2015, as provided by Mark A. Bogar and James A. Lydotes, Portfolio Managers
Fund and Market Performance Overview
From the fund’s inception on January 30, 2015, to the end of its fiscal year on October 31, 2015, Dreyfus International Small Cap Fund’s Class A shares produced a total return of 6.08%, Class C shares returned 5.44%, Class I shares returned 6.24%, and Class Y shares returned 6.24%.1 In comparison, the fund’s benchmark, the S&P Developed Ex-U.S. Small Cap Index, produced a total return of 6.71% for the same period.2
International small-cap equities gained ground during the reporting period due to positive economic trends supported by central bank quantitative easing programs.
The Fund’s Investment Approach
The fund seeks long-term growth of capital. To pursue its goal, the fund normally invests at least 80% of its net assets, plus any borrowings for investment purposes, in common stocks and other equity securities of small-cap foreign companies. The fund’s portfolio managers use a disciplined investment process that relies on a bottom-up investment approach using proprietary quantitative models and traditional qualitative analysis to identify attractive stocks. This investment process is designed to produce a diversified portfolio that has a below-average price/earnings ratio and an above-average earnings growth trend. The portfolio managers monitor the securities in the fund’s portfolio, and will consider selling a security if its target price is exceeded, there is a negative change in the company’s fundamentals, or there is a deterioration in its ranking by the proprietary quantitative models.
Small Cap International Markets Gained Ground
In February and March 2015, a slowdown in U.S. economic activity precipitated by severe winter weather cast a shadow over global growth prospects. However, massive quantitative easing programs in Europe and Japan created a supportive backdrop for international equities, providing capital for business operations and expansion. Quantitative easing also caused most international currencies to decline sharply in value against the U.S. dollar, creating a favorable environment for exporters to the United States and for those competing locally with U.S. imports. Accordingly, international equities climbed through mid-summer with notably strong performance from Japan and the better positioned European nations.
In late June and early July, international stock prices declined due to uncertainties surrounding the Federal Reserve Board’s stance on future fiscal policy, and concerns about slowing Chinese economic growth amid weakening energy and commodity prices. However, because small-cap companies based in developed markets outside the United States generally derive much of their revenues from business activities within their home countries, their stock prices were somewhat insulated from global macroeconomic concerns, enabling the benchmark to end the reporting period in positive territory.
Stock Selections Generated Mixed Results
The fund captured most of the benchmark’s rise, supported by favorable stock selections in a number of markets. Overweighted exposure to the relatively robust Italian market
3
DISCUSSION OF FUND PERFORMANCE (continued)
enhanced returns, as did individual holdings such as asset management firm ANIMA Holding, which benefited from an increase in higher margin business; money center bank Banco Popolare, which rose in anticipation of industry consolidation; and water utility A2A, which benefited from merger speculation. The fund’s stock selections in Japan also performed well, led by industrial cleaners Lion Corp., drug store chain Ain Pharmaciez, technology consultants NS Solutions, and utility Shikoku Electric Power. In Canada, the fund held underweighted exposure to the weak energy sector, timing its investment in oil-and-gas producer Gran Tierra Energy Inc. well. Another Canadian holding, enterprise software company Constellation Software, completed a major acquisition and saw improving profit margins. In Denmark, shipping and logistics specialists DFDS climbed sharply on lower fuel costs and improving trends in European trade.
On a more negative note, Swiss artisan bread maker Aryzta, which sells its products throughout Europe, was hurt by the strength of the Swiss franc. However, gains in a more domestically focused Swiss holding, airline catering and retail provider GateGroup Holding, partly compensated for this disappointment. In Sweden, companies such as polymer maker Trelleborg and vehicle parts manufacturer HALDEX suffered from exposure to slowing emerging markets. Other notable detractors from relative returns included South Korean brokerage and investment firm Mirae Asset Securities, Dutch aluminum products maker Constellium, and Australian nickel miner Western Areas Ltd.
Positioned for Additional International Recovery
With a growing number of central banks around the world implementing quantitative easing programs and economic trends in parts of Europe and Asia showing signs of improvement, many international markets appear poised for growth. We believe we have positioned the fund to benefit by selecting attractive individual opportunities for this stage of the economic cycle. As of the end of the reporting period, we have found a relatively large number of such opportunities in Germany, South Korea, and Italy, while reducing the fund’s exposure in Canada, France, and the UK.
November 16, 2015
Equity funds are subject generally to market, market sector, market liquidity, issuer, and investment style risks, among other factors, to varying degrees, all of which are more fully described in the fund’s prospectus.
Stocks of small- and/or midcap companies often experience sharper price fluctuations than stocks of large-cap companies.
The fund’s performance will be influenced by political, social, and economic factors affecting investments in foreign companies. Special risks associated with investments in foreign companies include exposure to currency fluctuations, less liquidity, less developed or less efficient trading markets, lack of comprehensive company information, political instability, and differing auditing and legal standards. These risks are enhanced in emerging market countries. Please read the prospectus for further discussion of these risks.
1 Total return includes reinvestment of dividends and any capital gains paid, and does not take into consideration the maximum initial sales charge in the case of Class A shares, or the applicable contingent deferred sales charge imposed on redemptions in the case of Class C shares. Had these charges been reflected, returns would have been lower. Past performance is no guarantee of future results. Share price, yield, and investment return fluctuate such that upon redemption, fund shares may be worth more or less than their original cost. Return figures provided reflect an undertaking for the absorption of certain fund expenses by The Dreyfus Corporation through March 1, 2017, at which time it may be extended, terminated, or modified. Had these expenses not been absorbed, the fund’s returns would have been lower.
2 SOURCE: Lipper Inc. — Reflects reinvestment of net dividends and, where applicable, capital gain distributions. The S&P Developed Ex-U.S. Small Cap Index is a market capitalization weighted index designed to define and measure the investable universe of publicly traded small cap companies domiciled in developed countries outside the United States. The Index does not take into account fees and expenses to which the fund is subject. Investors cannot invest directly in any index. For comparative purpose, the value of the Index as of 1/31/15 is used as the beginning value on 1/30/15.
4
FUND PERFORMANCE
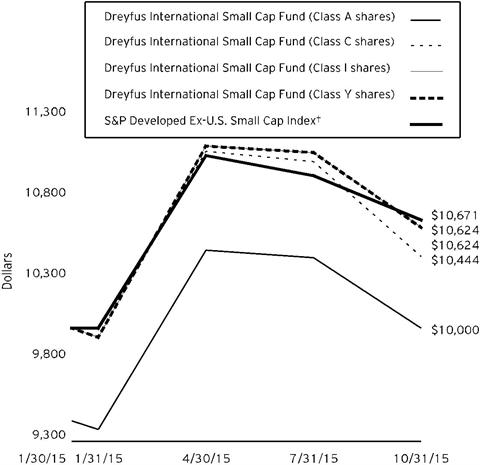
Comparison of change in value of $10,000 investment in Dreyfus International Small Cap Fund Class A shares, Class C shares, Class I shares, and Class Y shares, and the S&P Developed Ex-U.S. Small Cap Index
† Source: Lipper Inc.
Past performance is not predictive of future performance.
The above graph compares a $10,000 investment made in each of the Class A, Class C, Class I and Class Y shares of Dreyfus International Small Cap Fund on 1/30/15 (inception date) to a $10,000 investment made in the S&P Developed Ex-U.S. Small Cap Index (the “Index”) on that date. All dividends and capital gain distributions are reinvested.
The fund’s performance shown in the line graph above takes into account the maximum initial sales charge on Class A shares, the applicable contingent deferred sales charge on Class C shares and all other applicable fees and expenses on all classes. The Index is a market capitalization weighted index designed to define and measure the investable universe of publicly traded small cap companies domiciled in developed countries outside the United States. Further information relating to fund expenses, including expense reimbursements, if applicable, is contained in the Fees and Expenses section of the prospectus and elsewhere in this report.
5
FUND PERFORMANCE (continued)
| | | |
Actual Aggregate Total Returns as of 10/31/15 |
| | | |
| Inception
Date | From
Inception |
Class A shares | | |
with maximum sales charge (5.75%) | 1/30/15 | 0.00% |
without sales charge | 1/30/15 | 6.08% |
Class C shares | | |
with applicable redemption charge † | 1/30/15 | 4.44% |
without redemption | 1/30/15 | 5.44% |
Class I shares | 1/30/15 | 6.24% |
Class Y shares | 1/30/15 | 6.24% |
S&P Developed Ex-U.S. Small Cap Index | 1/31/15 | 6.71%†† |
Past performance is not predictive of future performance. The fund’s performance shown in the graph and table does not reflect the deduction of taxes that a shareholder would pay on fund distributions or the redemption of fund shares. In addition to the performance of Class A shares shown with and without a maximum sales charge, the fund’s performance shown in the table takes into account all other applicable fees and expenses on all classes.
† The maximum contingent deferred sales charge for Class C shares is 1% for shares redeemed within one year of the date of purchase.
†† For comparative purposes, the value of the Index as of 1/31/15 is used as the beginning value on 1/30/15.
6
UNDERSTANDING YOUR FUND’S EXPENSES (Unaudited)
As a mutual fund investor, you pay ongoing expenses, such as management fees and other expenses. Using the information below, you can estimate how these expenses affect your investment and compare them with the expenses of other funds. You also may pay one-time transaction expenses, including sales charges (loads) and redemption fees, which are not shown in this section and would have resulted in higher total expenses. For more information, see your fund’s prospectus or talk to your financial adviser.
Review your fund’s expenses
The table below shows the expenses you would have paid on a $1,000 investment in Dreyfus International Small Cap Fund from May 1, 2015 to October 31, 2015. It also shows how much a $1,000 investment would be worth at the close of the period, assuming actual returns and expenses.
| | | | | |
Expenses and Value of a $1,000 Investment |
assuming actual returns for the six months ended October 31, 2015 |
| |
| | Class A | Class C | Class I | Class Y |
Expenses paid per $1,000† | $ 6.89 | $ 10.57 | $ 5.67 | $ 5.67 |
Ending value (after expenses) | $953.90 | $950.20 | $954.70 | $954.70 |
COMPARING YOUR FUND’S EXPENSES
WITH THOSE OF OTHER FUNDS (Unaudited)
Using the SEC’s method to compare expenses
The Securities and Exchange Commission (SEC) has established guidelines to help investors assess fund expenses. Per these guidelines, the table below shows your fund’s expenses based on a $1,000 investment, assuming a hypothetical 5% annualized return. You can use this information to compare the ongoing expenses (but not transaction expenses or total cost) of investing in the fund with those of other funds. All mutual fund shareholder reports will provide this information to help you make this comparison. Please note that you cannot use this information to estimate your actual ending account balance and expenses paid during the period.
| | | | | |
Expenses and Value of a $1,000 Investment |
assuming a hypothetical 5% annualized return for the six months ended October 31, 2015 |
| |
| | Class A | Class C | Class I | Class Y |
Expenses paid per $1,000† | $ 7.12 | $ 10.92 | $ 5.85 | $ 5.85 |
Ending value (after expenses) | $1,018.15 | $1,014.37 | $1,019.41 | $1,019.41 |
† Expenses are equal to the fund’s annualized expense ratio of 1.40% for Class A, 2.15% for Class C, 1.15% for Class I and 1.15% for Class Y, multiplied by the average account value over the period, multiplied by 184/365 (to reflect the one-half year period).
7
STATEMENT OF INVESTMENTS
October 31, 2015
| | | | | | |
Common Stocks - 97.2% | | Shares | | Value ($) | |
Australia - 3.7% | | | | | |
Ansell | | 316,546 | | 4,541,660 | |
Fairfax Media | | 7,631,745 | | 5,142,869 | |
Federation Centres | | 3,829,322 | | 7,946,294 | |
Investa Office Fund | | 2,453,738 | | 7,069,022 | |
Qantas Airways | | 1,366,152 | a | 3,848,096 | |
| | | | | 28,547,941 | |
Austria - .6% | | | | | |
Zumtobel Group | | 196,120 | | 4,464,233 | |
Belgium - .3% | | | | | |
Galapagos | | 56,443 | a | 2,730,973 | |
Canada - 5.4% | | | | | |
Artis Real Estate Investment Trust | | 710,154 | | 7,272,073 | |
Canadian Apartment Properties REIT | | 237,540 | | 4,890,316 | |
Canfor | | 255,111 | a | 3,609,325 | |
Cogeco Cable | | 75,102 | | 3,878,585 | |
Constellation Software | | 9,437 | | 4,077,627 | |
Entertainment One | | 2,505,955 | | 8,487,364 | |
Gran Tierra Energy | | 2,778,249 | a | 6,714,031 | |
Lundin Mining | | 720,898 | a | 2,431,294 | |
| | | | | 41,360,615 | |
Denmark - .7% | | | | | |
DFDS | | 169,964 | | 5,162,309 | |
France - 7.7% | | | | | |
Alten | | 137,571 | | 7,140,416 | |
Atos | | 103,309 | | 8,241,954 | |
Eiffage | | 59,757 | | 3,729,145 | |
Fonciere Des Regions | | 67,550 | | 6,369,628 | |
Gaztransport Et Technigaz | | 72,788 | | 3,641,881 | |
JCDecaux | | 116,847 | | 4,760,586 | |
Lagardere | | 158,772 | | 4,628,478 | |
Orpea | | 42,286 | | 3,394,486 | |
Saft Groupe | | 111,040 | | 2,869,472 | |
SCOR | | 166,067 | | 6,185,191 | |
Teleperformance | | 106,573 | | 8,376,958 | |
| | | | | 59,338,195 | |
Germany - 6.5% | | | | | |
Aareal Bank | | 191,948 | | 7,313,772 | |
Duerr | | 41,633 | | 3,468,883 | |
8
| | | | | | |
Common Stocks - 97.2% (continued) | | Shares | | Value ($) | |
Germany - 6.5% (continued) | | | | | |
Gerresheimer | | 82,907 | | 6,470,243 | |
Nordex | | 140,773 | a | 4,603,784 | |
Rheinmetall | | 116,192 | | 7,316,143 | |
STADA Arzneimittel | | 86,028 | | 3,275,077 | |
Stroeer Media | | 118,769 | | 7,495,385 | |
TUI | | 245,344 | | 4,559,495 | |
Zalando | | 159,002 | a,b | 5,569,738 | |
| | | | | 50,072,520 | |
Hong Kong - 2.2% | | | | | |
Dah Sing Financial | | 1,120,800 | | 6,297,685 | |
EVA Precision Industrial Holdings | | 12,266,000 | | 2,927,786 | |
Johnson Electric Holdings | | 1,143,500 | | 4,197,427 | |
Luk Fook Holdings | | 1,342,000 | | 3,471,615 | |
| | | | | 16,894,513 | |
Ireland - 2.3% | | | | | |
Greencore Group | | 1,408,474 | | 6,557,303 | |
ICON | | 62,855 | a | 4,014,549 | |
Smurfit Kappa Group | | 252,493 | | 7,199,568 | |
| | | | | 17,771,420 | |
Israel - 1.5% | | | | | |
Bezeq The Israeli Telecommunication | | 3,268,598 | | 7,027,762 | |
Elbit Systems | | 61,672 | | 4,888,620 | |
| | | | | 11,916,382 | |
Italy - 5.4% | | | | | |
A2A | | 6,162,544 | | 8,450,474 | |
ANIMA Holding | | 780,789 | b | 7,662,959 | |
Banco Popolare | | 452,504 | a | 6,772,284 | |
Finmeccanica | | 309,412 | a | 4,048,916 | |
Prysmian | | 265,783 | | 5,743,073 | |
Saras | | 1,619,797 | a | 3,197,272 | |
Societa Iniziative Autostradali e Servizi | | 476,134 | | 5,460,949 | |
| | | | | 41,335,927 | |
Japan - 21.5% | | | | | |
Ain Pharmaciez | | 136,700 | | 6,525,168 | |
Air Water | | 399,000 | | 6,583,318 | |
Alpine Electronics | | 503,900 | | 6,698,066 | |
Chiba Bank | | 1,198,000 | | 8,815,977 | |
CKD | | 609,600 | | 5,597,388 | |
Daicel | | 533,600 | | 7,110,539 | |
Data Communication System | | 100,700 | | 2,393,367 | |
9
STATEMENT OF INVESTMENTS (continued)
| | | | | | |
Common Stocks - 97.2% (continued) | | Shares | | Value ($) | |
Japan - 21.5% (continued) | | | | | |
DeNA | | 341,200 | | 5,519,370 | |
Ebara | | 1,487,000 | | 6,494,149 | |
Goldcrest | | 322,700 | | 6,086,560 | |
Haseko | | 620,600 | | 6,382,403 | |
Hitachi Kokusai Electric | | 506,000 | | 7,044,667 | |
Japan Aviation Electronics Industry | | 182,000 | | 3,268,368 | |
Lion | | 595,000 | | 5,773,970 | |
Makino Milling Machine | | 771,000 | | 6,037,913 | |
Nifco | | 174,200 | | 6,777,733 | |
Nippon Shokubai | | 43,300 | | 3,416,060 | |
Nippon Signal | | 468,200 | | 4,892,684 | |
Nippon Suisan Kaisha | | 1,869,300 | | 6,304,840 | |
NS Solutions | | 106,800 | | 5,248,396 | |
Sanwa Holdings | | 1,038,100 | | 8,430,745 | |
Sawai Pharmaceutical | | 72,600 | | 4,674,749 | |
Shikoku Electric Power | | 250,500 | | 4,284,677 | |
Skylark | | 362,900 | | 4,748,646 | |
Takasago Thermal Engineering | | 290,600 | | 4,197,529 | |
Tokai Rika | | 275,800 | | 6,056,766 | |
Tokai Tokyo Financial Holdings | | 592,500 | | 3,638,373 | |
Tokyo Seimitsu | | 149,300 | | 3,329,463 | |
Tokyo Steel Manufacturing | | 802,100 | | 5,397,408 | |
Tsubakimoto Chain | | 506,000 | | 3,736,190 | |
| | | | | 165,465,482 | |
Luxembourg - .7% | | | | | |
Aperam | | 169,805 | | 5,246,070 | |
Netherlands - 3.3% | | | | | |
AerCap Holdings | | 102,946 | a | 4,272,259 | |
Corbion | | 169,105 | | 4,157,055 | |
Euronext | | 148,630 | b | 6,534,372 | |
TKH Group | | 158,769 | | 6,015,512 | |
USG People | | 258,841 | | 4,127,202 | |
| | | | | 25,106,400 | |
New Zealand - 1.8% | | | | | |
Air New Zealand | | 2,469,202 | | 4,865,571 | |
Sky Network Television | | 964,681 | | 2,965,676 | |
Spark New Zealand | | 2,514,574 | | 5,721,210 | |
| | | | | 13,552,457 | |
10
| | | | | | |
Common Stocks - 97.2% (continued) | | Shares | | Value ($) | |
Norway - .5% | | | | | |
Storebrand | | 1,003,521 | a | 3,511,305 | |
Singapore - 2.7% | | | | | |
ComfortDelGro | | 1,535,400 | | 3,331,870 | |
IGG | | 5,735,000 | | 2,279,024 | |
Mapletree Industrial Trust | | 5,905,900 | | 6,429,080 | |
Mapletree Logistics Trust | | 11,630,000 | | 8,467,842 | |
| | | | | 20,507,816 | |
South Korea - 3.9% | | | | | |
BNK Financial Group | | 467,167 | | 5,736,887 | |
LF | | 134,265 | | 3,727,457 | |
Medy-Tox | | 9,402 | | 4,015,468 | |
Osstem Implant | | 108,969 | a | 6,384,921 | |
S-Oil | | 109,006 | | 6,530,512 | |
Soulbrain | | 102,439 | | 3,580,715 | |
| | | | | 29,975,960 | |
Spain - 3.6% | | | | | |
Distribuidora Internacional de Alimentacion | | 951,939 | a | 6,058,878 | |
Enagas | | 136,248 | | 4,128,432 | |
Ence Energia y Celulosa | | 882,610 | | 3,096,094 | |
Liberbank | | 9,302,445 | a | 5,769,402 | |
Mediaset Espana Comunicacion | | 515,284 | | 6,264,119 | |
Talgo | | 427,960 | a,b | 2,545,980 | |
| | | | | 27,862,905 | |
Sweden - 1.0% | | | | | |
Boliden | | 279,839 | | 5,358,623 | |
HALDEX | | 237,686 | | 2,288,238 | |
| | | | | 7,646,861 | |
Switzerland - 6.6% | | | | | |
Actelion | | 45,916 | a | 6,382,577 | |
Adecco | | 105,233 | a | 7,835,651 | |
Aryzta | | 124,761 | a | 5,629,360 | |
Baloise Holding | | 58,442 | | 7,018,125 | |
Gategroup Holding | | 192,616 | a | 7,229,555 | |
Julius Baer Group | | 167,991 | a | 8,348,139 | |
Swiss Life Holding | | 35,465 | a | 8,471,128 | |
| | | | | 50,914,535 | |
United Kingdom - 14.8% | | | | | |
Bellway | | 194,915 | | 7,800,446 | |
Britvic | | 682,821 | | 7,357,894 | |
Card Factory | | 957,175 | | 5,322,393 | |
11
STATEMENT OF INVESTMENTS (continued)
| | | | | | |
Common Stocks - 97.2% (continued) | | Shares | | Value ($) | |
United Kingdom - 14.8% (continued) | | | | | |
Close Brothers Group | | 345,892 | | 7,806,405 | |
Dialog Semiconductor | | 177,972 | a | 6,585,539 | |
Galliford Try | | 340,229 | | 7,851,680 | |
GKN | | 1,086,681 | | 4,811,229 | |
Halma | | 503,792 | | 5,929,660 | |
Jimmy Choo | | 1,974,423 | a | 4,413,445 | |
John Wood Group | | 407,637 | | 3,751,608 | |
Jupiter Fund Management | | 985,918 | | 6,853,154 | |
Keller Group | | 430,216 | | 5,408,540 | |
LondonMetric Property | | 3,004,027 | | 7,835,626 | |
Man Group | | 3,214,816 | | 8,281,368 | |
Merlin Entertainments | | 1,038,076 | b | 6,638,002 | |
Micro Focus International | | 265,891 | | 5,148,287 | |
RPC Group | | 454,791 | | 4,564,176 | |
Spire Healthcare Group | | 1,336,055 | b | 7,721,635 | |
| | | | | 114,081,087 | |
United States - .5% | | | | | |
iShares MSCI EAFE Small-Cap ETF | | 75,235 | | 3,770,778 | |
Total Common Stocks (cost $760,385,553) | | | | 747,236,684 | |
Preferred Stocks - .9% | | | | | |
Germany - .9% | | | | | |
Jungheinrich
(cost $6,750,839) | | 97,970 | | 7,225,635 | |
| | | | | | |
Other Investment - .8% | | | | | |
Registered Investment Company; | | | | | |
Dreyfus Institutional Preferred Plus Money Market Fund
(cost $5,892,905) | | 5,892,905 | c | 5,892,905 | |
Total Investments (cost $773,029,297) | | 98.9% | | 760,355,224 | |
Cash and Receivables (Net) | | 1.1% | | 8,165,190 | |
Net Assets | | 100.0% | | 768,520,414 | |
12
ETF—Exchange-Traded Fund
REIT—Real Estate Investment Trust
a Non-income producing security.
b Security exempt from registration pursuant to Rule 144A under the Securities Act of 1933. These securities may be resold in transactions exempt from registration, normally to qualified institutional buyers. At October 31, 2015, these securities were valued at $36,672,686, or 4.8% of net assets.
c Investment in affiliated money market mutual fund.
| | |
Portfolio Summary (Unaudited) † | Value (%) |
Financial | 23.1 |
Industrial | 21.9 |
Consumer Discretionary | 15.7 |
Information Technology | 9.2 |
Materials | 7.5 |
Health Care | 7.0 |
Consumer Staples | 6.3 |
Energy | 3.1 |
Utilities | 2.2 |
Telecommunication Services | 1.6 |
Money Market Investment | .8 |
Exchange-Traded Funds | .5 |
| | 98.9 |
†Based on net assets.
See notes to financial statements.
13
STATEMENT OF ASSETS AND LIABILITIES
October 31, 2015
| | | | | | | |
| | | | | | |
| | | Cost | | Value | |
Assets ($): | | | | |
Investments in securities—See Statement of Investments: | | | | |
Unaffiliated issuers | | 767,136,392 | | 754,462,319 | |
Affiliated issuers | | 5,892,905 | | 5,892,905 | |
Cash | | | | | 4,263,245 | |
Cash denominated in foreign currency | | | 1,716,903 | | 1,722,295 | |
Receivable for investment securities sold | | | | | 4,827,461 | |
Dividends receivable | | | | | 2,501,012 | |
Receivable for shares of Beneficial Interest subscribed | | | | | 2,033,526 | |
Unrealized appreciation on forward foreign
currency exchange contracts—Note 4 | | | | | 6,115 | |
Prepaid expenses | | | | | 62,107 | |
| | | | | 775,770,985 | |
Liabilities ($): | | | | |
Due to The Dreyfus Corporation and affiliates—Note 3(c) | | | | | 933,327 | |
Payable for investment securities purchased | | | | | 5,302,428 | |
Payable for shares of Beneficial Interest redeemed | | | | | 868,944 | |
Unrealized depreciation on forward foreign
currency exchange contracts—Note 4 | | | | | 16 | |
Accrued expenses | | | | | 145,856 | |
| | | | | 7,250,571 | |
Net Assets ($) | | | 768,520,414 | |
Composition of Net Assets ($): | | | | |
Paid-in capital | | | | | 788,303,974 | |
Accumulated undistributed investment income—net | | | | | 4,597,047 | |
Accumulated net realized gain (loss) on investments | | | | | (11,690,464) | |
Accumulated net unrealized appreciation (depreciation)
on investments and foreign currency transactions | | | | | (12,690,143) | |
Net Assets ($) | | | 768,520,414 | |
| | | | | | |
Net Asset Value Per Share | Class A | Class C | Class I | Class Y | |
Net Assets ($) | 621,134 | 105,466 | 3,085,797 | 764,708,017 | |
Shares Outstanding | 46,851 | 8,000 | 232,331 | 57,577,198 | |
Net Asset Value Per Share ($) | 13.26 | 13.18 | 13.28 | 13.28 | |
See notes to financial statements.
14
STATEMENT OF OPERATIONS
From January 30, 2015 (commencement of operations) to October 31, 2015
| | | | | | | |
| | | | | | |
| | | | | | |
Investment Income ($): | | | | |
Income: | | | | |
Cash dividends (net of $879,856 foreign taxes withheld at source): | | | | |
Unaffiliated issuers | | | 8,427,999 | |
Affiliated issuers | | | 8,615 | |
Total Income | | | 8,436,614 | |
Expenses: | | | | |
Investment advisory fee—Note 3(a) | | | 3,443,296 | |
Custodian fees—Note 3(c) | | | 395,711 | |
Registration fees | | | 149,071 | |
Professional fees | | | 124,831 | |
Trustees’ fees and expenses—Note 3(d) | | | 24,751 | |
Prospectus and shareholders’ reports | | | 6,960 | |
Loan commitment fees—Note 2 | | | 2,492 | |
Shareholder servicing costs—Note 3(c) | | | 2,260 | |
Distribution fees—Note 3(b) | | | 642 | |
Miscellaneous | | | 38,910 | |
Total Expenses | | | 4,188,924 | |
Less—reduction in expenses due to undertaking—Note 3(a) | | | (220,025) | |
Less—reduction in fees due to earnings credits—Note 3(c) | | | (2) | |
Net Expenses | | | 3,968,897 | |
Investment Income—Net | | | 4,467,717 | |
Realized and Unrealized Gain (Loss) on Investments—Note 4 ($): | | |
Net realized gain (loss) on investments and foreign currency transactions | (11,699,488) | |
Net realized gain (loss) on forward foreign currency exchange contracts | 128,329 | |
Net Realized Gain (Loss) | | | (11,571,159) | |
Net unrealized appreciation (depreciation) on investments
and foreign currency transactions | | | (12,696,242) | |
Net unrealized appreciation (depreciation) on
forward foreign currency exchange contracts | | | 6,099 | |
Net Unrealized Appreciation (Depreciation) | | | (12,690,143) | |
Net Realized and Unrealized Gain (Loss) on Investments | | | (24,261,302) | |
Net (Decrease) in Net Assets Resulting from Operations | | (19,793,585) | |
See notes to financial statements.
15
STATEMENT OF CHANGES IN NET ASSETS
From January 30, 2015 (commencement of operations) to October 31, 2015
| | | | | | |
| | | | | | |
| | | | | | |
| | | | | |
Operations ($): | | | | |
Investment income—net | | | 4,467,717 | |
Net realized gain (loss) on investments | | (11,571,159) | |
Net unrealized appreciation (depreciation)
on investments | | (12,690,143) | |
Net Increase (Decrease) in Net Assets
Resulting from Operations | (19,793,585) | |
Beneficial Interest Transactions ($): | | | | |
Net proceeds from shares sold: | | | | |
Class A | | | 643,747 | |
Class C | | | 109,856 | |
Class I | | | 4,283,938 | |
Class Y | | | 840,111,054 | |
Cost of shares redeemed: | | | | |
Class A | | | (28,160) | |
Class C | | | (9,286) | |
Class I | | | (1,165,799) | |
Class Y | | | (55,631,351) | |
Increase (Decrease) in Net Assets
from Beneficial Interest Transactions | 788,313,999 | |
Total Increase (Decrease) in Net Assets | 768,520,414 | |
Net Assets ($): | | | | |
Beginning of Period | | | - | |
End of Period | | | 768,520,414 | |
Accumulated undistributed investment income—net | 4,597,047 | |
Capital Share Transactions (Shares): | | | | |
Class A | | | | |
Shares sold | | | 49,001 | |
Shares redeemed | | | (2,150) | |
Net Increase (Decrease) in Shares Outstanding | 46,851 | |
Class C | | | | |
Shares sold | | | 8,713 | |
Shares redeemed | | | (713) | |
Net Increase (Decrease) in Shares Outstanding | 8,000 | |
Class I | | | | |
Shares sold | | | 318,483 | |
Shares redeemed | | | (86,152) | |
Net Increase (Decrease) in Shares Outstanding | 232,331 | |
Class Y | | | | |
Shares sold | | | 61,741,818 | |
Shares redeemed | | | (4,164,620) | |
Net Increase (Decrease) in Shares Outstanding | 57,577,198 | |
See notes to financial statements.
16
FINANCIAL HIGHLIGHTS
The following table describes the performance for each share class for the period from January 30, 2015 (commencement of operations) to October 31, 2015. All information (except portfolio turnover rate) reflects financial results for a single fund share. Total return shows how much your investment in the fund would have increased (or decreased) during the period, assuming you had reinvested all dividends and distributions. These figures have been derived from the fund’s financial statements.
| | | | | | |
| | | Class A | Class C | Class I | Class Y |
| | | Shares | Shares | Shares | Shares |
Per Share Data ($): | | | | | |
Net asset value, beginning of period | | 12.50 | 12.50 | 12.50 | 12.50 |
Investment Operations: | | | | | |
Investment income—neta | | .11 | .02 | .12 | .12 |
Net realized and unrealized gain (loss) on investmentsb | | .65 | .66 | .66 | .66 |
Total from Investment Operations | | .76 | .68 | .78 | .78 |
Net asset value, end of period | | 13.26 | 13.18 | 13.28 | 13.28 |
Total Return (%)c | | 6.08d | 5.44d | 6.24 | 6.24 |
Ratios/Supplemental Data (%): | | | | | |
Ratio of total expenses to average net assetse | | 1.71 | 2.88 | 1.26 | 1.22 |
Ratio of net expenses to average net assetse | | 1.40 | 2.15 | 1.15 | 1.15 |
Ratio of net investment income to average net assetse | | 1.15 | .23 | 1.32 | 1.30 |
Portfolio Turnover Ratec | | 97.46 | 97.46 | 97.46 | 97.46 |
Net Assets, end of period ($ x 1,000) | | 621 | 105 | 3,086 | 764,708 |
a Based on average shares outstanding.
b In addition to net realized and unrealized losses on investments as set forth in the Statement of Operations, this amount includes an increase in net asset value per share resulting from the timing of issuances and redemptions of shares in relation to fluctuating market values for the portfolio investments.
c Not annualized.
d Exclusive of sales charge.
e Annualized.
See notes to financial statements.
17
NOTES TO FINANCIAL STATEMENTS
NOTE 1—Significant Accounting Policies:
Dreyfus International Small Cap Fund (the “fund”) is a separate diversified series of Dreyfus Stock Funds (the “Company”), which is registered under the Investment Company Act of 1940, as amended (the “Act”), as an open-end management investment company and operates as a series company currently offering three series, including the fund. The fund commenced operations on January 30, 2015. The fund’s investment objective is to seek long-term growth of capital. The Dreyfus Corporation (the “Manager” or “Dreyfus”), a wholly-owned subsidiary of The Bank of New York Mellon Corporation (“BNY Mellon”), serves as the fund’s investment adviser. The Boston Company Asset Management, LLC (“TBCAM”), a wholly-owned subsidiary of BNY Mellon and an affiliate of Dreyfus, serves as the fund’s sub-investment adviser.
MBSC Securities Corporation (the “Distributor”), a wholly-owned subsidiary of Dreyfus, is the distributor of the fund’s shares. The fund is authorized to issue an unlimited number of $.001 par value shares of Beneficial Interest in each of the following classes of shares: Class A, Class C, Class I and Class Y. Class A shares generally are subject to a sales charge imposed at the time of purchase. Class C shares are subject to a contingent deferred sales charge (“CDSC”) imposed on Class C shares redeemed within one year of purchase. Class I and Class Y shares are sold at net asset value per share generally to institutional investors. Other differences between the classes include the services offered to and the expenses borne by each class, the allocation of certain transfer agency costs, and certain voting rights. Income, expenses (other than expenses attributable to a specific class), and realized and unrealized gains or losses on investments are allocated to each class of shares based on its relative net assets.
As of October 31, 2015, MBC Investments Corp., an indirect subsidiary of BNY Mellon, held 8,000 Class A and 8,000 Class C shares of the fund.
The Company accounts separately for the assets, liabilities and operations of each series. Expenses directly attributable to each series are charged to that series’ operations; expenses which are applicable to all series are allocated among them on a pro rata basis.
The Financial Accounting Standards Board (“FASB”) Accounting Standards Codification (“ASC”) is the exclusive reference of authoritative U.S. generally accepted accounting principles (“GAAP”) recognized by the FASB to be applied by nongovernmental entities. Rules and interpretive releases of the Securities and Exchange Commission (“SEC”) under
18
authority of federal laws are also sources of authoritative GAAP for SEC registrants. The fund’s financial statements are prepared in accordance with GAAP, which may require the use of management estimates and assumptions. Actual results could differ from those estimates.
The Company enters into contracts that contain a variety of indemnifications. The fund’s maximum exposure under these arrangements is unknown. The fund does not anticipate recognizing any loss related to these arrangements.
(a) Portfolio valuation: The fair value of a financial instrument is the amount that would be received to sell an asset or paid to transfer a liability in an orderly transaction between market participants at the measurement date (i.e., the exit price). GAAP establishes a fair value hierarchy that prioritizes the inputs of valuation techniques used to measure fair value. This hierarchy gives the highest priority to unadjusted quoted prices in active markets for identical assets or liabilities (Level 1 measurements) and the lowest priority to unobservable inputs (Level 3 measurements).
Additionally, GAAP provides guidance on determining whether the volume and activity in a market has decreased significantly and whether such a decrease in activity results in transactions that are not orderly. GAAP requires enhanced disclosures around valuation inputs and techniques used during annual and interim periods.
Various inputs are used in determining the value of the fund’s investments relating to fair value measurements. These inputs are summarized in the three broad levels listed below:
Level 1—unadjusted quoted prices in active markets for identical investments.
Level 2—other significant observable inputs (including quoted prices for similar investments, interest rates, prepayment speeds, credit risk, etc.).
Level 3—significant unobservable inputs (including the fund’s own assumptions in determining the fair value of investments).
The inputs or methodology used for valuing securities are not necessarily an indication of the risk associated with investing in those securities.
Changes in valuation techniques may result in transfers in or out of an assigned level within the disclosure hierarchy. Valuation techniques used to value the fund’s investments are as follows:
Investments in securities are valued at the last sales price on the securities exchange or national securities market on which such securities are
19
NOTES TO FINANCIAL STATEMENTS (continued)
primarily traded. Securities listed on the National Market System for which market quotations are available are valued at the official closing price or, if there is no official closing price that day, at the last sales price. For open short positions, asked prices are used for valuation purposes. Bid price is used when no asked price is available. Registered investment companies that are not traded on an exchange are valued at their net asset value. All of the preceding securities are generally categorized within Level 1 of the fair value hierarchy.
Securities not listed on an exchange or the national securities market, or securities for which there were no transactions, are valued at the average of the most recent bid and asked prices. These securities are generally categorized within Level 2 of the fair value hierarchy.
Fair valuing of securities may be determined with the assistance of a pricing service using calculations based on indices of domestic securities and other appropriate indicators, such as prices of relevant American Depository Receipts and financial futures. Utilizing these techniques may result in transfers between Level 1 and Level 2 of the fair value hierarchy.
When market quotations or official closing prices are not readily available, or are determined not to reflect accurately fair value, such as when the value of a security has been significantly affected by events after the close of the exchange or market on which the security is principally traded (for example, a foreign exchange or market), but before the fund calculates its net asset value, the fund may value these investments at fair value as determined in accordance with the procedures approved by the Company’s Board of Trustees (the “Board”). Certain factors may be considered when fair valuing investments such as: fundamental analytical data, the nature and duration of restrictions on disposition, an evaluation of the forces that influence the market in which the securities are purchased and sold, and public trading in similar securities of the issuer or comparable issuers. These securities are either categorized within Level 2 or 3 of the fair value hierarchy depending on the relevant inputs used.
For restricted securities where observable inputs are limited, assumptions about market activity and risk are used and are generally categorized within Level 3 of the fair value hierarchy.
Investments denominated in foreign currencies are translated to U.S. dollars at the prevailing rates of exchange.
Forward foreign currency exchange contracts (“forward contracts”) are valued at the forward rate and are generally categorized within Level 2 of the fair value hierarchy.
20
The following is a summary of the inputs used as of October 31, 2015 in valuing the fund’s investments:
| | | | | |
| | Level 1- Unadjusted Quoted Prices | Level 2 - Other Significant Observable Inputs | Level 3- Significant Unobservable Inputs | Total |
Assets ($) |
Investments in Securities: |
Equity Securities - Foreign Common Stocks† | 743,465,906 | - | - | 743,465,906 |
Equity Securities - Foreign Preferred Stocks† | 7,225,635 | - | - | 7,225,635 |
Exchange-Traded Funds | 3,770,778 | - | - | 3,770,778 |
Mutual Funds | 5,892,905 | - | - | 5,892,905 |
Other Financial Instruments: |
Forward Foreign Currency Exchange Contracts†† | - | 6,115 | - | 6,115 |
Liabilities ($) |
Other Financial Instruments: |
Forward Foreign Currency Exchange Contracts†† | - | (16) | - | (16) |
† See Statement of Investments for additional detailed categorizations.
†† Amount shown represents unrealized appreciation (depreciation) at period end.
At October 31, 2015, there were no transfers between Level 1, Level 2 and Level 3 of the fair value hierarchy.
(b) Foreign currency transactions: The fund does not isolate that portion of the results of operations resulting from changes in foreign exchange rates on investments from the fluctuations arising from changes in the market prices of securities held. Such fluctuations are included with the net realized and unrealized gain or loss on investments.
Net realized foreign exchange gains or losses arise from sales of foreign currencies, currency gains or losses realized on securities transactions between trade and settlement date, and the difference between the amounts of dividends, interest and foreign withholding taxes recorded on the fund’s books and the U.S. dollar equivalent of the amounts actually received or paid. Net unrealized foreign exchange gains and losses arise from changes in the value of assets and liabilities other than investments resulting from changes in exchange rates. Foreign currency gains and losses on foreign currency transactions are also included with net realized and unrealized gain or loss on investments.
(c) Securities transactions and investment income: Securities transactions are recorded on a trade date basis. Realized gains and losses
21
NOTES TO FINANCIAL STATEMENTS (continued)
from securities transactions are recorded on the identified cost basis. Dividend income is recognized on the ex-dividend date and interest income, including, where applicable, accretion of discount and amortization of premium on investments, is recognized on the accrual basis.
(d) Affiliated issuers: Investments in other investment companies advised by Dreyfus are defined as “affiliated” under the Act. Investments in affiliated investment companies during the period ended October 31, 2015 were as follows:
| | | | | | |
Affiliated Investment Company | Value 1/30/2015 ($) | Purchases ($) | Sales ($) | Value 10/31/2015 ($) | Net Assets (%) |
Dreyfus Institutional Preferred Plus Money Market Fund | - | 375,548,341 | 369,655,436 | 5,892,905 | .8 |
(e) Risk: Investing in foreign markets may involve special risks and considerations not typically associated with investing in the U.S. These risks include revaluation of currencies, high rates of inflation, repatriation restrictions on income and capital, and adverse political and economic developments. Moreover, securities issued in these markets may be less liquid, subject to government ownership controls and delayed settlements, and their prices may be more volatile than those of comparable securities in the U.S.
(f) Dividends to shareholders: Dividends are recorded on the ex-dividend date. Dividends from investment income-net and dividends from net realized capital gains, if any, are normally declared and paid annually, but the fund may make distributions on a more frequent basis to comply with the distribution requirements of the Internal Revenue Code of 1986, as amended (the “Code”). To the extent that net realized capital gains can be offset by capital loss carryovers, it is the policy of the fund not to distribute such gains. Income and capital gain distributions are determined in accordance with income tax regulations, which may differ from GAAP.
(g) Federal income taxes: It is the policy of the fund to continue to qualify as a regulated investment company, if such qualification is in the best interests of its shareholders, by complying with the applicable provisions of the Code, and to make distributions of taxable income sufficient to relieve it from substantially all federal income and excise taxes.
22
As of and during the period ended October 31, 2015, the fund did not have any liabilities for any uncertain tax positions. The fund recognizes interest and penalties, if any, related to uncertain tax positions as income tax expense in the Statement of Operations. During the period ended October 31, 2015, the fund did not incur any interest or penalties.
The tax year for the period ended October 31, 2015 remains subject to examination by the Internal Revenue Service and state taxing authorities.
At October 31, 2015, the components of accumulated earnings on a tax basis were as follows: undistributed ordinary income $5,060,838, accumulated capital losses $9,308,008 and unrealized depreciation $15,536,390.
Under the Regulated Investment Company Modernization Act of 2010, the fund is permitted to carry forward capital losses for an unlimited period. Furthermore, capital loss carryovers retain their character as either short-term or long-term capital losses.
The accumulated capital loss carryover is available for federal income tax purposes to be applied against future net realized capital gains, if any, realized subsequent to October 31, 2015. The fund has $9,308,008 of short-term capital losses which can be carried forward for an unlimited period.
During the period ended October 31, 2015, as a result of permanent book to tax differences, primarily due to the tax treatment for fund start-up costs and foreign currency gains and losses, the fund increased accumulated undistributed investment income-net by $129,330, decreased accumulated net realized gain (loss) on investments by $119,305 and decreased paid-in capital by $10,025. Net assets and net asset value per share were not affected by this reclassification.
NOTE 2—Bank Lines of Credit:
The fund participates with other Dreyfus-managed funds in a $480 million unsecured credit facility led by Citibank, N.A. and a $300 million unsecured credit facility provided by The Bank of New York Mellon, a subsidiary of BNY Mellon and an affiliate of Dreyfus (each, a “Facility”), each to be utilized primarily for temporary or emergency purposes, including the financing of redemptions. In connection therewith, the fund has agreed to pay its pro rata portion of commitment fees for each Facility. Interest is charged to the fund based on rates determined pursuant to the terms of the respective Facility at the time of borrowing. During the period ended October 31, 2015, the fund did not borrow under the Facilities.
23
NOTES TO FINANCIAL STATEMENTS (continued)
NOTE 3—Investment Advisory Fee, Sub-Investment Advisory Fee and Other Transactions with Affiliates:
(a) Pursuant to an investment advisory agreement with Dreyfus, the investment advisory fee is computed at the annual rate of 1.00% of the value of the fund’s average daily net assets and is payable monthly. Dreyfus has contractually agreed, from January 30, 2015 through March 1, 2017, to waive receipt of its fees and/or assume the direct expenses of the fund, so that the expenses of none of the classes (excluding Rule 12b-1 Distribution Plan fees, Shareholder Services Plan fees, taxes, interest expense, brokerage commissions, commitment fees on borrowings and extraordinary expenses) exceed 1.15% of the value of the fund's average daily net assets. The reduction in expenses, pursuant to the undertaking, amounted to $220,025 during the period ended October 31, 2015.
Pursuant to a sub-investment advisory agreement between Dreyfus and TBCAM, TBCAM serves as the fund’s sub-investment adviser responsible for the day-to–day management of the fund’s portfolio. Dreyfus pays the sub-investment adviser a monthly fee at an annual percentage of the value of the fund’s average daily net assets. Dreyfus has obtained an exemptive order from the SEC (the “Order”), upon which the fund may rely, to use a manager of managers approach that permits Dreyfus, subject to certain conditions and approval by the Board, to enter into and materially amend sub-investment advisory agreements with one or more sub-investment advisers who are either unaffiliated with Dreyfus or are wholly-owned subsidiaries (as defined under the Act) of Dreyfus’ ultimate parent company, BNY Mellon, without obtaining shareholder approval. The Order also allows the fund to disclose the sub-investment advisory fee paid by Dreyfus to any unaffiliated sub-investment adviser in the aggregate with other unaffiliated sub-investment advisers in documents filed with the SEC and provided to shareholders. In addition, pursuant to the Order, it is not necessary to disclose the sub-investment advisory fee payable by Dreyfus separately to a sub-investment adviser that is a wholly-owned subsidiary of BNY Mellon in documents filed with the SEC and provided to shareholders; such fees are to be aggregated with fees payable to Dreyfus. Dreyfus has ultimate responsibility (subject to oversight by the Board) to supervise any sub-investment adviser and recommend the hiring, termination, and replacement of any sub-investment adviser to the Board.
(b) Under the Distribution Plan adopted pursuant to Rule 12b-1 under the Act, Class C shares pay the Distributor for distributing its shares at an annual rate of .75% of the value of its average daily net assets. During the period ended October 31, 2015, Class C shares were charged $642 pursuant to the Distribution Plan.
24
(c) Under the Shareholder Services Plan, Class A and Class C shares pay the Distributor at an annual rate of .25% of the value of their average daily net assets for the provision of certain services. The services provided may include personal services relating to shareholder accounts, such as answering shareholder inquiries regarding the fund and providing reports and other information, and services related to the maintenance of shareholder accounts. The Distributor may make payments to Service Agents (securities dealers, financial institutions or other industry professionals) with respect to these services. The Distributor determines the amounts to be paid to Service Agents. During the period ended October 31, 2015, Class A and Class C shares were charged $974 and $214, respectively, pursuant to the Shareholder Services Plan.
The fund has arrangements with the transfer agent and the custodian whereby the fund may receive earnings credits when positive cash balances are maintained, which are used to offset transfer agency and custody fees. For financial reporting purposes, the fund includes net earnings credits as an expense offset in the Statement of Operations.
The fund compensates Dreyfus Transfer, Inc., a wholly-owned subsidiary of Dreyfus, under a transfer agency agreement for providing transfer agency and cash management services for the fund. The majority of transfer agency fees are comprised of amounts paid on a per account basis, while cash management fees are related to fund subscriptions and redemptions. During the period ended October 31, 2015, the fund was charged $894 for transfer agency services and $33 for cash management services. These fees are included in Shareholder servicing costs in the Statement of Operations. Cash management fees were partially offset by earnings credits of $2.
The fund compensates The Bank of New York Mellon under a custody agreement for providing custodial services for the fund. These fees are determined based on net assets, geographic region and transaction activity. During the period ended October 31, 2015, the fund was charged $395,711 pursuant to the custody agreement.
During the period ended October 31, 2015, the fund was charged $8,187 for services performed by the Chief Compliance Officer and his staff.
The components of “Due to The Dreyfus Corporation and affiliates” in the Statement of Assets and Liabilities consist of: investment advisory fees $691,947, Distribution Plan fees $69, Shareholder Services Plan fees $152, custodian fees $240,035, Chief Compliance Officer fees $882 and transfer agency fees $242.
25
NOTES TO FINANCIAL STATEMENTS (continued)
(d) Each Board member also serves as a Board member of other funds within the Dreyfus complex. Annual retainer fees and attendance fees are allocated to each fund based on net assets.
NOTE 4—Securities Transactions:
The aggregate amount of purchases and sales of investment securities, excluding short-term securities and forward contracts, during the period ended October 31, 2015, amounted to $1,204,774,502 and $425,488,008, respectively.
Derivatives: A derivative is a financial instrument whose performance is derived from the performance of another asset. The fund enters into International Swaps and Derivatives Association, Inc. Master Agreements or similar agreements (collectively, “Master Agreements”) with its over-the-counter (“OTC”) derivative contract counterparties in order to, among other things, reduce its credit risk to counterparties. Master Agreements include provisions for general obligations, representations, collateral and events of default or termination. Under a Master Agreement, the fund may offset with the counterparty certain derivative financial instrument’s payables and/or receivables with collateral held and/or posted and create one single net payment in the event of default or termination.
Each type of derivative instrument that was held by the fund during the period ended October 31, 2015 is discussed below.
Forward Foreign Currency Exchange Contracts: The fund enters into forward contracts in order to hedge its exposure to changes in foreign currency exchange rates on its foreign portfolio holdings, to settle foreign currency transactions or as a part of its investment strategy. When executing forward contracts, the fund is obligated to buy or sell a foreign currency at a specified rate on a certain date in the future. With respect to sales of forward contracts, the fund incurs a loss if the value of the contract increases between the date the forward contract is opened and the date the forward contract is closed. The fund realizes a gain if the value of the contract decreases between those dates. With respect to purchases of forward contracts, the fund incurs a loss if the value of the contract decreases between the date the forward contract is opened and the date the forward contract is closed. The fund realizes a gain if the value of the contract increases between those dates. Any realized or unrealized gains or losses which occurred during the period are reflected in the Statement of Operations. The fund is exposed to foreign currency risk as a result of changes in value of underlying financial instruments. The fund is also exposed to credit risk associated with counterparty nonperformance on
26
these forward contracts, which is generally limited to the unrealized gain on each open contract. This risk may be mitigated by Master Agreements, if any, between the fund and the counterparty and the posting of collateral, if any, by the counterparty to the fund to cover the fund’s exposure to the counterparty. The following summarizes open forward contracts at October 31, 2015:
| | | | | |
Forward Foreign Currency Exchange Contracts | Foreign Currency
Amounts | Cost ($) | Value ($) | Unrealized Appreciation (Depreciation)($) |
Purchases: | | | |
JP Morgan Chase Bank | | | |
Euro, | | | | |
Expiring | | | | |
11/2/2015 | 349,063 | 382,462 | 383,847 | 1,385 |
Northern Trust Bank | | | |
Canadian Dollar, | | | | |
Expiring | | | | |
11/2/2015 | 611,281 | 463,666 | 467,483 | 3,817 |
Hong Kong Dollar, | | | | |
Expiring | | | | |
11/2/2015 | 2,118,822 | 273,391 | 273,375 | (16) |
New Zealand Dollar, | | | | |
Expiring | | | | |
11/3/2015 | 284,502 | 191,797 | 192,650 | 853 |
Singapore Dollar, | | | | |
Expiring | | | | |
11/3/2015 | 364,018 | 259,786 | 259,846 | 60 |
Gross Unrealized Appreciation | | | 6,115 |
Gross Unrealized Depreciation | | | (16) |
The provisions of ASC Topic 210 “Disclosures about Offsetting Assets and Liabilities” require disclosure on the offsetting of financial assets and liabilities. These disclosures are required for certain investments, including derivative financial instruments subject to Master Agreements which are eligible for offsetting in the Statement of Assets and Liabilities and require the fund to disclose both gross and net information with respect to such investments. For financial reporting purposes, the fund does not offset derivative assets and derivative liabilities that are subject to Master Agreements in the Statement of Assets and Liabilities.
At October 31, 2015, derivative assets and liabilities (by type) on a gross basis are as follows:
27
NOTES TO FINANCIAL STATEMENTS (continued)
| | | | | | |
Derivative Financial Instruments: | | Assets ($) | | Liabilities ($) | |
Forward contracts | | 6,115 | | (16) | |
Total gross amount of derivative | | | | | |
assets and liabilities in the | | | | | |
Statement of Assets and Liabilities | | 6,115 | | (16) | |
Derivatives not subject to | | | | | |
Master Agreements | | - | | - | |
Total gross amount of assets | | | | | |
and liabilities subject to | | | | | |
Master Agreements | | 6,115 | | (16) | |
The following tables present derivative assets and liabilities net of amounts available for offsetting under Master Agreements and net of related collateral received or pledged, if any, as of October 31, 2015:
| | | | | | | |
| | | | Financial | | | |
| | | | Instruments | | | |
| | | | and Derivatives | | | |
| | Gross Amount of | | Available | Collateral | | Net Amount of |
Counterparty | Assets ($) | 1 | for Offset ($) | Received ($) | | Assets ($) |
JP Morgan
Chase Bank | 1,385 | | - | - | | 1,385 |
Northern Trust
Bank | 4,730 | | (16) | - | | 4,714 |
Total | 6,115 | | (16) | - | | 6,099 |
| | | | | | | |
| | | | Financial | | | |
| | | | Instruments | | | |
| | | | and Derivatives | | | |
| | Gross Amount of | | Available | Collateral | | Net Amount of |
Counterparty | Liabilities ($) | 1 | for Offset ($) | Pledged ($) | | Liabilities ($) |
Northern Trust
Bank | (16) | | 16 | - | | - |
| | | | | | | |
1 Absent a default event or early termination, OTC derivative assets and liabilities are presented
at gross amounts and are not offset in the Statement of Assets and Liabilities. |
The following summarizes the average market value of derivatives outstanding during the period ended October 31, 2015:
| | | | | |
| | | | | Average Market Value ($) |
Forward contracts | | | | 7,100,954 |
At October 31, 2015, the cost of investments for federal income tax purposes was $775,875,544; accordingly, accumulated net unrealized depreciation on investments was $15,520,320, consisting of $32,240,521 gross unrealized appreciation and $47,760,841 gross unrealized depreciation.
28
REPORT OF INDEPENDENT REGISTERED
PUBLIC ACCOUNTING FIRM
Shareholders and Board of Trustees
Dreyfus International Small Cap Fund
We have audited the accompanying statement of assets and liabilities, including the statement of investments, of Dreyfus International Small Cap Fund (one of the series comprising Dreyfus Stock Funds) as of October 31, 2015, and the related statements of operations and changes in net assets and the financial highlights for the period from January 30, 2015 (commencement of operations) to October 31, 2015. These financial statements and financial highlights are the responsibility of the Fund’s management. Our responsibility is to express an opinion on these financial statements and financial highlights based on our audit.
We conducted our audit in accordance with the standards of the Public Company Accounting Oversight Board (United States).Those standards require that we plan and perform the audit to obtain reasonable assurance about whether the financial statements and financial highlights are free of material misstatement. We were not engaged to perform an audit of the Fund’s internal control over financial reporting. Our audit included consideration of internal control over financial reporting as a basis for designing audit procedures that are appropriate in the circumstances, but not for the purpose of expressing an opinion on the effectiveness of the Fund’s internal control over financial reporting. Accordingly, we express no such opinion. An audit also includes examining, on a test basis, evidence supporting the amounts and disclosures in the financial statements and financial highlights, assessing the accounting principles used and significant estimates made by management, and evaluating the overall financial statement presentation. Our procedures included confirmation of securities owned as of October 31, 2015 by correspondence with the custodian and others. We believe that our audit provides a reasonable basis for our opinion.
In our opinion, the financial statements and financial highlights referred to above present fairly, in all material respects, the financial position of Dreyfus International Small Cap Fund at October 31, 2015, and the results of its operations, the changes in its net assets and the financial highlights for the period from January 30, 2015 to October 31, 2015, in conformity with U.S. generally accepted accounting principles.

New York, New York
December 29, 2015
29
IMPORTANT TAX INFORMATION (Unaudited)
In accordance with federal tax law, the fund elects to provide each shareholder with their portion of the fund’s foreign taxes paid and the income sourced from foreign countries. Accordingly, the fund hereby reports the following information regarding its fiscal year ended October 31, 2015:
- the total amount of taxes paid to foreign countries was $739,792
- the total amount of income sourced from foreign countries was $9,057,713.
Where required by federal tax law rules, shareholders will receive notification of their proportionate share of foreign taxes paid and foreign sourced income for the 2015 calendar year with Form 1099-DIV which will be mailed in early 2016.
30
BOARD MEMBERS INFORMATION (Unaudited)
INDEPENDENT BOARD MEMBERS
Joseph S. DiMartino (72)
Chairman of the Board (2003)
Principal Occupation During Past 5 Years:
· Corporate Director and Trustee (1995-present)
Other Public Company Board Memberships During Past 5 Years:
· CBIZ (formerly, Century Business Services, Inc.), a provider of outsourcing functions for small and medium size companies, Director (1997-present)
· The Newark Group, a provider of a national market of paper recovery facilities, paperboard mills and paperboard converting plants, Director (2000-2010)
No. of Portfolios for which Board Member Serves: 140
———————
Joni Evans (73)
Board Member (2006)
Principal Occupation During Past 5 Years:
· Chief Executive Officer, www.wowOwow.com an online community dedicated to women’s conversations and publications (2007-present)
· Principal, Joni Evans Ltd. (publishing) (2006-present)
No. of Portfolios for which Board Member Serves: 24
———————
Ehud Houminer (75)
Board Member (2003)
Principal Occupation During Past 5 Years:
· Executive-in-Residence at the Columbia Business School, Columbia
University (1992-present)
Other Public Company Board Memberships During Past 5 Years:
· Avnet, Inc., an electronics distributor, Director (1993-2012)
No. of Portfolios for which Board Member Serves: 61
———————
Hans C. Mautner (77)
Board Member (2003)
Principal Occupation During Past 5 Years:
· President-International Division and an Advisory Director of Simon Property Group, a
real estate investment company (1998-2010)
· Chairman and Chief Executive Officer of Simon Global Limited, a real estate company (1999-2010)
No. of Portfolios for which Board Member Serves: 24
———————
31
BOARD MEMBERS INFORMATION (Unaudited) (continued)
INDEPENDENT BOARD MEMBERS (continued)
Robin A. Melvin (52)
Board Member (2003)
Principal Occupation During Past 5 Years:
· Co-chairman, Illinois Mentoring Partnership, non-profit organization dedicated to increasing the quantity and quality of mentoring services in Illinois; (2014-present; a board member since 2013)
· Director, Boisi Family Foundation, a private family foundation that supports
youth-serving organizations that promote the self sufficiency of youth from
disadvantaged circumstances (1995-2012)
No. of Portfolios for which Board Member Serves: 111
———————
Burton N. Wallack (64)
Board Member (2006)
Principal Occupation During Past 5 Years:
· President and Co-owner of Wallack Management Company, a real estate management
company (1987-present)
No. of Portfolios for which Board Member Serves: 24
———————
32
INTERESTED BOARD MEMBER
Gordon J. Davis (74)
Board Member (2006)
Principal Occupation During Past 5 Years:
· Partner in the law firm of Venable LLP (2012-present)
· Partner in the law firm of Dewey & LeBoeuf LLP (1994-2012)
Other Public Company Board Memberships During Past 5 Years:
· Consolidated Edison, Inc., a utility company, Director (1997-2014)
· The Phoenix Companies, Inc., a life insurance company, Director (2000-2014)
No. of Portfolios for which Board Member Serves: 60
Gordon J. Davis is deemed to be an “interested person” (as defined under the Act) of the Company as a result of his affiliation with Venable LLP, which provides legal services to the Company.
———————
Once elected all Board Members serve for an indefinite term, but achieve Emeritus status upon reaching age 80. The address of the Board Members and Officers is c/o The Dreyfus Corporation, 200 Park Avenue, New York, New York 10166. Additional information about the Board Members is available in the fund’s Statement of Additional Information which can be obtained from Dreyfus free of charge by calling this toll free number: 1-800-DREYFUS.
William Hodding Carter III, Emeritus Board Member
Arnold S. Hiatt, Emeritus Board Member
33
OFFICERS OF THE FUND (Unaudited)
BRADLEY J. SKAPYAK, President since January 2010.
Chief Operating Officer and a director of the Manager since June 2009, Chairman of Dreyfus Transfer, Inc., an affiliate of the Manager and the transfer agent of the funds, since May 2011 and Executive Vice President of the Distributor since June 2007. From April 2003 to June 2009, Mr. Skapyak was the head of the Investment Accounting and Support Department of the Manager. He is an officer of 66 investment companies (comprised of 140 portfolios) managed by the Manager. He is 56 years old and has been an employee of the Manager since February 1988.
BENNETT A. MACDOUGALL, Chief Legal Officer since October 2015
Chief Legal Officer of the Manager since June 2015; from June 2005 to June 2015, Director and Associate General Counsel of Deutsche Bank – Asset & Wealth Management Division, and Chief Legal Officer of Deutsche Investment Management Americas Inc. He is an officer of 67 investment companies (comprised of 165 portfolios) managed by the Manager. He is 44 years old and has been an employee of the Manager since June 2015.
JANETTE E. FARRAGHER, Vice President and Secretary since December 2011.
Assistant General Counsel of BNY Mellon, and an officer of 67 investment companies (comprised of 165 portfolios) managed by the Manager. She is 52 years old and has been an employee of the Manager since February 1984.
JAMES BITETTO, Vice President and Assistant Secretary since August 2005.
Managing Counsel of BNY Mellon and Secretary of the Manager, and an officer of 67 investment companies (comprised of 165 portfolios) managed by the Manager. He is 49 years old and has been an employee of the Manager since December 1996.
JONI LACKS CHARATAN, Vice President and Assistant Secretary since August 2005.
Managing Counsel of BNY Mellon, and an officer of 67 investment companies (comprised of 165 portfolios) managed by the Manager. She is 59 years old and has been an employee of the Manager since October 1988.
JOSEPH M. CHIOFFI, Vice President and Assistant Secretary since August 2005.
Managing Counsel of BNY Mellon, and an officer of 67 investment companies (comprised of 165 portfolios) managed by the Manager. He is 53 years old and has been an employee of the Manager since June 2000.
JOHN B. HAMMALIAN, Vice President and Assistant Secretary since August 2005.
Senior Managing Counsel of BNY Mellon, and an officer of 67 investment companies (comprised of 165 portfolios) managed by the Manager. He is 52 years old and has been an employee of the Manager since February 1991.
MAUREEN E. KANE, Vice President and Assistant Secretary since April 2015.
Managing Counsel of BNY Mellon since July 2014; from October 2004 until July 2014, General Counsel, and from May 2009 until July 2014, Chief Compliance Officer of Century Capital Management. She is an officer of 67 investment companies (comprised of 165 portfolios) managed by the Manager. She is 53 years old and has been an employee of the Manager since July 2014.
SARAH S. KELLEHER, Vice President and Assistant Secretary since April 2014.
Senior Counsel of BNY Mellon, and an officer of 67 investment companies (comprised of 165 portfolios) managed by the Manager; from August 2005 to March 2013, Associate General Counsel of Third Avenue Management. She is 40 years old and has been an employee of the Manager since March 2013.
JEFF PRUSNOFSKY, Vice President and Assistant Secretary since August 2005.
Senior Managing Counsel of BNY Mellon, and an officer of 67 investment companies (comprised of 165 portfolios) managed by the Manager. He is 50 years old and has been an employee of the Manager since October 1990.
JAMES WINDELS, Treasurer since November 2001.
Director – Mutual Fund Accounting of the Manager, and an officer of 67 investment companies (comprised of 165 portfolios) managed by the Manager. He is 57 years old and has been an employee of the Manager since April 1985.
34
RICHARD CASSARO, Assistant Treasurer since January 2008.
Senior Accounting Manager – Money Market and Municipal Bond Funds of the Manager, and an officer of 67 investment companies (comprised of 165 portfolios) managed by the Manager. He is 56 years old and has been an employee of the Manager since September 1982.
GAVIN C. REILLY, Assistant Treasurer since December 2005.
Tax Manager of the Investment Accounting and Support Department of the Manager, and an officer of 67 investment companies (comprised of 165 portfolios) managed by the Manager. He is 47 years old and has been an employee of the Manager since April 1991.
ROBERT S. ROBOL, Assistant Treasurer since August 2005.
Senior Accounting Manager – Fixed Income Funds of the Manager, and an officer of 67 investment companies (comprised of 165 portfolios) managed by the Manager. He is 51 years old and has been an employee of the Manager since October 1988.
ROBERT SALVIOLO, Assistant Treasurer since July 2007.
Senior Accounting Manager – Equity Funds of the Manager, and an officer of 67 investment companies (comprised of 165 portfolios) managed by the Manager. He is 48 years old and has been an employee of the Manager since June 1989.
ROBERT SVAGNA, Assistant Treasurer since December 2002.
Senior Accounting Manager – Equity Funds of the Manager, and an officer of 67 investment companies (comprised of 165 portfolios) managed by the Manager. He is 48 years old and has been an employee of the Manager since November 1990.
JOSEPH W. CONNOLLY, Chief Compliance Officer since October 2004.
Chief Compliance Officer of the Manager and The Dreyfus Family of Funds (67 investment companies, comprised of 165 portfolios). He is 58 years old and has served in various capacities with the Manager since 1980, including manager of the firm’s Fund Accounting Department from 1997 through October 2001.
35
NOTES
36
NOTES
37
Dreyfus International Small Cap Fund
200 Park Avenue
New York, NY 10166
Manager
The Dreyfus Corporation
200 Park Avenue
New York, NY 10166
Sub-Investment Adviser
The Boston Company Asset
Management LLC
BNY Mellon Center
One Boston Place
Boston, MA 02108
Custodian
The Bank of New York Mellon
225 Liberty Street
New York, NY 10286
Transfer Agent &
Dividend Disbursing Agent
Dreyfus Transfer, Inc.
200 Park Avenue
New York, NY 10166
Distributor
MBSC Securities Corporation
200 Park Avenue
New York, NY 10166
| | |
Ticker Symbols: | Class A: DYAPX Class C: DYCPX Class I: DYIPX Class Y: DYYPX |
Telephone Call your financial representative or 1-800-DREYFUS
Mail The Dreyfus Family of Funds, 144 Glenn Curtiss Boulevard, Uniondale, NY 11556-0144
E-mail Send your request to info@dreyfus.com
Internet Information can be viewed online or downloaded at www.dreyfus.com
The fund files its complete schedule of portfolio holdings with the Securities and Exchange Commission (“SEC”) for the first and third quarters of each fiscal year on Form N-Q. The fund’s Forms N-Q are available on the SEC’s website at www.sec.gov and may be reviewed and copied at the SEC’s Public Reference Room in Washington, DC. (phone 1-800-SEC-0330 for information).
A description of the policies and procedures that the fund uses to determine how to vote proxies relating to portfolio securities and information regarding how the fund voted these proxies for the most recent 12-month period ended June 30 is available at www.dreyfus.com and on the SEC’s website at www.sec.gov and without charge, upon request, by calling 1-800-DREYFUS.
| | |
© 2015 MBSC Securities Corporation
4006AR1015 | 
|
Item 2. Code of Ethics.
The Registrant has adopted a code of ethics that applies to the Registrant's principal executive officer, principal financial officer, principal accounting officer or controller, or persons performing similar functions. There have been no amendments to, or waivers in connection with, the Code of Ethics during the period covered by this Report.
Item 3. Audit Committee Financial Expert.
The Registrant's Board has determined that Ehud Houminer, a member of the Audit Committee of the Board, is an audit committee financial expert as defined by the Securities and Exchange Commission (the "SEC"). Ehud Houminer is "independent" as defined by the SEC for purposes of audit committee financial expert determinations.
Item 4. Principal Accountant Fees and Services.
(a) Audit Fees. The aggregate fees billed for each of the last two fiscal years (the "Reporting Periods") for professional services rendered by the Registrant's principal accountant (the "Auditor") for the audit of the Registrant's annual financial statements or services that are normally provided by the Auditor in connection with the statutory and regulatory filings or engagements for the Reporting Periods, were $0 in 2014 and $44,513 in 2015.
(b) Audit-Related Fees. The aggregate fees billed in the Reporting Periods for assurance and related services by the Auditor that are reasonably related to the performance of the audit of the Registrant's financial statements and are not reported under paragraph (a) of this Item 4 were $0 in 2014 and $6,273 in 2015. These services consisted of one or more of the following: (i) agreed upon procedures related to compliance with Internal Revenue Code section 817(h), (ii) security counts required by Rule 17f-2 under the Investment Company Act of 1940, as amended, (iii) advisory services as to the accounting or disclosure treatment of Registrant transactions or events and (iv) advisory services to the accounting or disclosure treatment of the actual or potential impact to the Registrant of final or proposed rules, standards or interpretations by the Securities and Exchange Commission, the Financial Accounting Standards Boards or other regulatory or standard-setting bodies.
The aggregate fees billed in the Reporting Periods for non-audit assurance and related services by the Auditor to the Registrant's investment adviser (not including any sub-investment adviser whose role is primarily portfolio management and is subcontracted with or overseen by another investment adviser), and any entity controlling, controlled by or under common control with the investment adviser that provides ongoing services to the Registrant ("Service Affiliates"), that were reasonably related to the performance of the annual audit of the Service Affiliate, which required pre-approval by the Audit Committee were $0 in 2014 and $0 in 2015.
(c) Tax Fees. The aggregate fees billed in the Reporting Periods for professional services rendered by the Auditor for tax compliance, tax advice, and tax planning ("Tax Services") were $0 in 2014 and $2,808 in 2015. These services consisted of: (i) review or preparation of U.S. federal, state, local and excise tax returns; (ii) U.S. federal, state and local tax planning, advice and assistance regarding statutory, regulatory or administrative developments; (iii) tax advice regarding tax qualification matters and/or treatment of various financial instruments held or proposed to be acquired or held, and (iv) determination of Passive Foreign Investment Companies. The aggregate fees billed in the Reporting Periods for Tax Services by the Auditor to Service Affiliates, which required pre-approval by the Audit Committee were $0 in 2014 and $0 in 2015.
(d) All Other Fees. The aggregate fees billed in the Reporting Periods for products and services provided by the Auditor, other than the services reported in paragraphs (a) through (c) of this Item, were $0 in 2014 and $6 in 2015. These services included a review of the Registrant's anti-money laundering program.
The aggregate fees billed in the Reporting Periods for Non-Audit Services by the Auditor to Service Affiliates, other than the services reported in paragraphs (b) through (c) of this Item, which required pre-approval by the Audit Committee, were $0 in 2014 and $0 in 2015.
(e)(1) Audit Committee Pre-Approval Policies and Procedures. The Registrant's Audit Committee has established policies and procedures (the "Policy") for pre-approval (within specified fee limits) of the Auditor's engagements for non-audit services to the Registrant and Service Affiliates without specific case-by-case consideration. The pre-approved services in the Policy can include pre-approved audit services, pre-approved audit-related services, pre-approved tax services and pre-approved all other services. Pre-approval considerations include whether the proposed services are compatible with maintaining the Auditor's independence. Pre-approvals pursuant to the Policy are considered annually.
(e)(2) Note: None of the services described in paragraphs (b) through (d) of this Item 4 were approved by the Audit Committee pursuant to paragraph (c)(7)(i)(C) of Rule 2-01 of Regulation S-X.
(f) None of the hours expended on the principal accountant's engagement to audit the registrant's financial statements for the most recent fiscal year were attributed to work performed by persons other than the principal account's full-time, permanent employees.
Non-Audit Fees. The aggregate non-audit fees billed by the Auditor for services rendered to the Registrant, and rendered to Service Affiliates, for the Reporting Periods were $26,822,186 in 2014 and $19,591,507 in 2015.
Auditor Independence. The Registrant's Audit Committee has considered whether the provision of non-audit services that were rendered to Service Affiliates, which were not pre-approved (not requiring pre-approval), is compatible with maintaining the Auditor's independence.
Item 5. Audit Committee of Listed Registrants.
Not applicable. [CLOSED-END FUNDS ONLY]
Item 6. Investments.
(a) Not applicable.
Item 7. Disclosure of Proxy Voting Policies and Procedures for Closed-End Management Investment Companies.
Not applicable. [CLOSED-END FUNDS ONLY]
Item 8. Portfolio Managers of Closed-End Management Investment Companies.
Not applicable. [CLOSED-END FUNDS ONLY, beginning with reports for periods ended on and after December 31, 2005]
Item 9. Purchases of Equity Securities by Closed-End Management Investment Companies and Affiliated Purchasers.
Not applicable. [CLOSED-END FUNDS ONLY]
Item 10. Submission of Matters to a Vote of Security Holders.
There have been no material changes to the procedures applicable to Item 10.
Item 11. Controls and Procedures.
(a) The Registrant's principal executive and principal financial officers have concluded, based on their evaluation of the Registrant's disclosure controls and procedures as of a date within 90 days of the filing date of this report, that the Registrant's disclosure controls and procedures are reasonably designed to ensure that information required to be disclosed by the Registrant on Form N-CSR is recorded, processed, summarized and reported within the required time periods and that information required to be disclosed by the Registrant in the reports that it files or submits on Form N-CSR is accumulated and communicated to the Registrant's management, including its principal executive and principal financial officers, as appropriate to allow timely decisions regarding required disclosure.
(b) There were no changes to the Registrant's internal control over financial reporting that occurred during the second fiscal quarter of the period covered by this report that have materially affected, or are reasonably likely to materially affect, the Registrant's internal control over financial reporting.
Item 12. Exhibits.
(a)(1) Code of ethics referred to in Item 2.
(a)(2) Certifications of principal executive and principal financial officers as required by Rule 30a-2(a) under the Investment Company Act of 1940.
(a)(3) Not applicable.
(b) Certification of principal executive and principal financial officers as required by Rule 30a-2(b) under the Investment Company Act of 1940.
SIGNATURES
Pursuant to the requirements of the Securities Exchange Act of 1934 and the Investment Company Act of 1940, the Registrant has duly caused this Report to be signed on its behalf by the undersigned, thereunto duly authorized.
DREYFUS STOCK FUNDS
By: /s/ Bradley J. Skapyak
Bradley J. Skapyak
President
Date: December 22, 2015
Pursuant to the requirements of the Securities Exchange Act of 1934 and the Investment Company Act of 1940, this Report has been signed below by the following persons on behalf of the Registrant and in the capacities and on the dates indicated.
By: /s/ Bradley J. Skapyak
Bradley J. Skapyak
President
Date: December 22, 2015
By: /s/ James Windels
James Windels
Treasurer
Date: December 22, 2015
EXHIBIT INDEX
(a)(1) Code of ethics referred to in Item 2.
(a)(2) Certifications of principal executive and principal financial officers as required by Rule 30a-2(a) under the Investment Company Act of 1940. (EX-99.CERT)
(b) Certification of principal executive and principal financial officers as required by Rule 30a-2(b) under the Investment Company Act of 1940. (EX-99.906CERT)
