UNITED STATES
SECURITIES AND EXCHANGE COMMISSION
Washington, D.C. 20549
FORM N-CSR
CERTIFIED SHAREHOLDER REPORT OF REGISTERED MANAGEMENT
INVESTMENT COMPANIES
Investment Company Act file number | 811-21236 |
| |
| DREYFUS STOCK FUNDS | |
| (Exact name of Registrant as specified in charter) | |
| | |
| c/o The Dreyfus Corporation 200 Park Avenue New York, New York 10166 | |
| (Address of principal executive offices) (Zip code) | |
| | |
| Bennett A. MacDougall, Esq. 225 Liberty Street New York, New York 10286 | |
| (Name and address of agent for service) | |
|
Registrant's telephone number, including area code: | (212) 922-6000 |
| |
Date of fiscal year end: | 09/30 | |
Date of reporting period: | 09/30/15 | |
| | | | | | | |
The following N-CSR relates only to the Registrant’s series listed below and does not affect the other series of the Registrant, which has a different fiscal year end and, therefore, different N-CSR reporting requirements. Separate N-CSR Form will be filed for that series, as appropriate.
Dreyfus International Equity Fund
(formerly, Dreyfus Premier International Equity Fund)
Dreyfus Small Cap Equity Fund
(formerly, Dreyfus Premier Small Cap Equity Fund)
FORM N-CSR
Item 1. Reports to Stockholders.
Dreyfus International Equity Fund
| | | |

| | ANNUAL REPORT September 30, 2015 |
| |
Save time. Save paper. View your next shareholder report online as soon as it’s available. Log into www.dreyfus.com and sign up for Dreyfus eCommunications. It’s simple and only takes a few minutes. |
| |
The views expressed in this report reflect those of the portfolio manager only through the end of the period covered and do not necessarily represent the views of Dreyfus or any other person in the Dreyfus organization. Any such views are subject to change at any time based upon market or other conditions and Dreyfus disclaims any responsibility to update such views. These views may not be relied on as investment advice and, because investment decisions for a Dreyfus fund are based on numerous factors, may not be relied on as an indication of trading intent on behalf of any Dreyfus fund. |
| |
Not FDIC-Insured • Not Bank-Guaranteed • May Lose Value |
Contents
THE FUND
FOR MORE INFORMATION
Back Cover
| | | | |
| |
Dreyfus International Equity Fund
| | The Fund |
A LETTER FROM THE PRESIDENT
Dear Shareholder:
We are pleased to present this annual report for Dreyfus International Equity Fund, covering the 12-month period from October 1, 2014, through September 30, 2015. For information about how the fund performed during the reporting period, as well as general market perspectives, we provide a Discussion of Fund Performance on the pages that follow.
Financial markets proved volatile over the reporting period. For much of the year, a recovering U.S. economy enabled stocks to advance, but those gains were erased during the third quarter of 2015 when economic concerns in China, falling commodity prices, and a stronger U.S. dollar sparked sharp corrections in equity markets throughout the world. The emerging markets were especially hard hit. U.S. bonds generally fared better, rallying in late 2014 before reversing course in the spring as the domestic economy strengthened. Global economic instability sparked a renewed rally among U.S. government securities toward the reporting period’s end, but corporate-backed and inflation-linked securities lost value.
We expect market volatility to persist over the near term as investors vacillate between hopes that current turmoil represents a healthy correction and fears that further disappointments could trigger a full-blown bear market. Our investment strategists and portfolio managers are monitoring developments carefully, keeping a close watch on Chinese fiscal and monetary policy, expectations of higher short-term interest rates in the United States, liquidity factors affecting various asset classes, and other developments that could influence investor sentiment. Over the longer term, we remain confident that markets are likely to stabilize as the world adjusts to slower Chinese economic growth, abundant energy resources, and the eventual normalization of U.S. monetary policy. In our view, investors will continue to be well served under these circumstances by a long-term perspective and a disciplined investment approach.
Thank you for your continued confidence and support.
Sincerely,

J. Charles Cardona
President
The Dreyfus Corporation
October 15, 2015
2
DISCUSSION OF FUND PERFORMANCE
For the period of October 1, 2014, through September 30, 2015, as provided by Sean P. Fitzgibbon and Mark A. Bogar, Portfolio Managers
Fund and Market Performance Overview
For the 12-month period ended September 30, 2015, Dreyfus International Equity Fund’s Class A shares produced a total return of -8.01%, Class C shares returned -8.73%, Class I shares returned -7.77%, and Class Y shares returned -10.72%.1 In comparison, the fund’s benchmark, the Morgan Stanley Capital International Europe, Australasia, Far East Index (“MSCI EAFE Index”), produced a total return of -8.66% for the same period.2
Developed equity markets lost ground during the reporting period amid heightened volatility stemming from global economic instability. The fund’s Class A, Class I, and Class Y shares outperformed the benchmark, mainly due to strong stock selections in the United Kingdom, France, and Ireland.
The Fund’s Investment Approach
The fund seeks long-term growth of capital. The fund normally invests at least 80% of assets in shares of companies located in the foreign countries represented in the MSCI EAFE Index and Canada, and may also invest up to 20% of its assets in securities of issuers located in emerging market countries.
The fund invests in stocks that appear to be undervalued and exhibit better fundamentals than the market expects. We employ a “bottom-up” investment approach, which emphasizes individual stock selection. Our stock selection process is designed to produce a diversified portfolio that, relative to the MSCI EAFE Index, frequently has a below-average price/earnings ratio and an above-average earnings growth trend.
International Equities Declined Amid Volatility
Shifting economic sentiment produced heightened volatility for international stock markets throughout the reporting period. Major global equity indices fell in early-October 2014 before recovering much of that ground in November. Markets again declined in December 2014 and early January 2015 in the midst of plummeting energy prices as a glut of oil and gas was met by tepid demand from the emerging markets. A subsequent economic recovery through the spring of 2015 was supported by quantitative easing from major central banks, and stock prices began to rally from their lows. As a result, by mid-May 2015 the MSCI EAFE Index had posted positive absolute returns.
In June and early July, however, stock prices fell again over renewed concerns about a debt crisis in Greece and slowing economic growth in China. Those concerns were exacerbated when the Chinese central bank later devalued the country’s currency, creating an increasingly risk-averse attitude among investors and sparking further declines in international stock prices through the reporting period’s end. International investment results for U.S. residents were further undermined by a strengthening U.S. dollar against most other currencies.
3
DISCUSSION OF FUND PERFORMANCE (continued)
Fund Strategies Helped Cushion Market’s Decline
The fund’s country allocation and security selection strategies helped the Class A, Class I, and Class Y shares outperform the MSCI EAFE Index for the reporting period overall. Modestly overweighted exposure to and strong security selections in the United Kingdom proved especially helpful, as the fund held little exposure to energy stocks and no exposure to materials stocks that weighed on U.K. market results. Moreover, the fund achieved strong relative returns from favorable timing of trades in pharmaceutical developer Shire Pharmaceuticals and gains posted by broadcaster Sky. Overweighted exposure to France also bolstered relative performance, as did positions in aerospace companies Thales and Safran, which benefited from a weaker euro and lower fuel prices. Professional services firm Cap Gemini fared well amid rising enterprise spending on technology consulting. Finally, results in Ireland were bolstered by packaging supplier Smurfit Kappa Group, which saw robust demand for its products from growth in shipments from Internet retailers. From an industry group perspective, the fund’s results were supported by relative strength in the materials and industrials sectors.
Relative performance proved more disappointing in Hong Kong, where casino operator SJM Holdings was undermined by reduced traffic from mainland China. In Japan, automakers Isuzu Motors and Honda Motor struggled with weakness in emerging markets and disappointing sales of new models, respectively. In addition, energy producer Inpex was hurt by a weakening yen and delays in the completion of a project under development. As for industry groups, shortfalls in the financials sector included Germany’s Commerzbank and the U.K.’s HSBC Holdings and Royal Bank of Scotland Group.
Finding Opportunities in a Turbulent Market
We are carefully monitoring macroeconomic developments throughout the world. We expect volatility to persist over the near term, but we remain optimistic about the longer term prospects for equities in developed markets. Aggressively accommodative monetary policies are at work in Europe, Japan, and China; the U.S. economy has continued to grow; and many stocks appear to have been punished more severely than is warranted by their underlying fundamentals. Therefore, we remain watchful for opportunities to purchase stocks of fundamentally sound businesses at attractive prices. In recent months we have identified a number of compelling investment ideas in the United Kingdom and Spain, but relatively fewer in Germany and Australia.
October 15, 2015
Please note, the position in any security highlighted with italicized typeface was sold during the reporting period.
Equity funds are subject generally to market, market sector, market liquidity, issuer, and investment style risks, among other factors, to varying degrees, all of which are more fully described in the fund’s prospectus.
The fund’s performance will be influenced by political, social, and economic factors affecting investments in foreign companies. Special risks associated with investments in foreign companies include exposure to currency fluctuations, less liquidity, less developed or less efficient trading markets, lack of comprehensive company information, political instability, and differing auditing and legal standards. These risks are enhanced in emerging markets countries. Investments in foreign currencies are subject to the risk that those currencies will decline in value relative to the U.S. dollar, or, in the case of hedged positions, that the U.S. dollar will decline relative to the currency being hedged. Each of these risks could increase the fund’s volatility.
1Total return includes reinvestment of dividends and any capital gains paid, and does not take into consideration the maximum initial sales charge in the case of Class A shares, or the applicable contingent deferred sales charge imposed on redemptions in the case of Class C shares. Had these charges been reflected, returns would have been lower. Past performance is no guarantee of future results. Share price and investment return fluctuate such that upon redemption, fund shares may be worth more or less than their original cost. Return figures provided reflect the absorption of certain fund expenses by The Dreyfus Corporation and The Boston Company Asset Management,
4
LLC. Had these expenses not been absorbed, returns would have been lower. Total return for Class Y shares is from inception on 6/1/2015.
2SOURCE: LIPPER INC. – Reflects reinvestment of net dividends and, where applicable, capital gain distributions. The Morgan Stanley Capital International Europe, Australasia, Far East (MSCI EAFE) Index is an unmanaged index composed of a sample of companies representative of the market structure of European and Pacific Basin countries. Returns are calculated on a month-end basis. Investors cannot invest directly in any index.
5
FUND PERFORMANCE
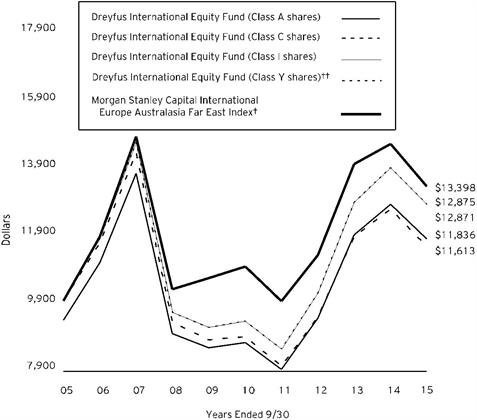
Comparison of change in value of $10,000 investment in Dreyfus International Equity Fund Class A shares, Class C shares, Class I shares and Class Y shares and the Morgan Stanley Capital International Europe Australasia Far East Index
† Source: Lipper Inc.
†† The total return figures presented for Class Y shares of the fund reflect the performance of the fund’s Class I shares for the period prior to 6/1/15 (the inception date for Class Y shares).
Past performance is not predictive of future performance.
On July 22, 2015 the Board authorized the fund to offer Class Y shares, as a new class of shares, to certain investors, including certain institutional investors. On June 1, 2015, Class Y shares were offered at net asset value and are not subject to certain fees, including Distribution Plan and Shareholder Services Plan fees.
The above graph compares a $10,000 investment made in each of the Class A, Class C, Class I and Class Y shares of Dreyfus International Equity Fund on 9/30/05 to a $10,000 investment made in the Morgan Stanley Capital International Europe Australasia Far East Index (the “Index”) on that date. All dividends and capital gain distributions are reinvested.
Prior to 8/1/07, the fund invested its assets in a "master portfolio" that had the same investment objective and policies as the fund. This master/feeder arrangement was terminated on 8/1/07 and the fund operates as a stand alone fund.
The fund’s performance shown in the line graph above takes into account the maximum initial sales charge on Class A shares and all other applicable fees and expenses on all classes. The Index is an unmanaged index composed of a sample of companies representative of the market structure of European and Pacific Basin countries. Unlike a mutual fund, the Index is not subject to charges, fees and other expenses. Investors cannot invest directly in any index. Further information relating to fund performance, including expense reimbursements, if applicable, is contained in the Financial Highlights section of the prospectus and elsewhere in this report.
6
| | | | | |
Average Annual Total Returns as of 9/30/15 | | | | |
| Inception Date | 1 Year | 5 Years | 10 Years |
Class A shares | | | | |
with maximum sales charge (5.75%) | 12/8/88 | -13.31% | 4.96% | 1.70% |
without sales charge | 12/8/88 | -8.01% | 6.21% | 2.30% |
Class C shares | | | | |
with applicable redemption charge † | 12/8/88 | -9.63% | 5.39% | 1.51% |
without redemption | 12/8/88 | -8.73% | 5.39% | 1.51% |
Class I shares | 12/8/88 | -7.77% | 6.50% | 2.56% |
Class Y shares†† | 6/1/15 | -7.79% | 6.49% | 2.56% |
Morgan Stanley Capital International | | | | |
Europe Australasia Far East Index | | -8.66% | 3.98% | 2.97% |
Past performance is not predictive of future performance. The fund’s performance shown in the graph and table does not reflect the deduction of taxes that a shareholder would pay on fund distributions or the redemption of fund shares. In addition to the performance of Class A shares shown with and without a maximum sales charge, the fund’s performance shown in the table takes into account all other applicable fees and expenses on all classes.
† The maximum contingent deferred sales charge for Class C shares is 1% for shares redeemed within one year of the date of purchase.
†† The total return performance figures presented for Class Y shares of the fund reflect the performance of the fund’s Class I shares for the period prior to 6/1/15 (the inception date for Class Y shares).
7
UNDERSTANDING YOUR FUND’S EXPENSES (Unaudited)
As a mutual fund investor, you pay ongoing expenses, such as management fees and other expenses. Using the information below, you can estimate how these expenses affect your investment and compare them with the expenses of other funds. You also may pay one-time transaction expenses, including sales charges (loads) and redemption fees, which are not shown in this section and would have resulted in higher total expenses. For more information, see your fund’s prospectus or talk to your financial adviser.
Review your fund’s expenses
The table below shows the expenses you would have paid on a $1,000 investment in Dreyfus International Equity Fund from April 1, 2015 to September 30, 2015. It also shows how much a $1,000 investment would be worth at the close of the period, assuming actual returns and expenses.
| | | | | | | | | | | | |
Expenses and Value of a $1,000 Investment | | |
assuming actual returns for the six months ended September 30, 2015† |
| | | | | | | | |
| | | | Class A | Class C | Class I | Class Y |
Expenses paid per $1,000†† | | $5.41 | | $9.16 | | $4.11 | | $2.69 |
Ending value (after expenses) | | $925.90 | | $922.20 | | $927.20 | | $892.80 |
COMPARING YOUR FUND’S EXPENSES
WITH THOSE OF OTHER FUNDS (Unaudited)
Using the SEC’s method to compare expenses
The Securities and Exchange Commission (SEC) has established guidelines to help investors assess fund expenses. Per these guidelines, the table below shows your fund’s expenses based on a $1,000 investment, assuming a hypothetical 5% annualized return. You can use this information to compare the ongoing expenses (but not transaction expenses or total cost) of investing in the fund with those of other funds. All mutual fund shareholder reports will provide this information to help you make this comparison. Please note that you cannot use this information to estimate your actual ending account balance and expenses paid during the period.
| | | | | | | | | | | | |
Expenses and Value of a $1,000 Investment | | |
assuming a hypothetical 5% annualized return for the six months ended September 30, 2015††† |
| | | | | | | | |
| | | | Class A | Class C | Class I | Class Y |
Expenses paid per $1,000†††† | | $5.67 | | $9.60 | | $4.31 | | $4.31 |
Ending value (after expenses) | | $1,019.45 | | $1,015.54 | | $1,020.81 | | $1,020.81 |
† From June 1, 2015 (commencement of initial offering) to September 30, 2015 for Class Y.
†† Expenses are equal to the fund’s annualized expense ratio of 1.12% for Class A, 1.90% for Class C and .85% for Class I, multiplied by the average account value over the period, multiplied by 183/365 (to reflect the one-half year period). Expenses are equal to the fund’s annualized expense ratio of .85% for Class Y, multiplied by the average account value over the period, multiplied by 122/365 (to reflect the actual days in the period).
††† Please note that while Class Y shares commenced operations on June 1, 2015, the hypothetical expenses paid during the period reflect projected activity for the full six month period for purposes of comparability. This projection assumes that annualized expense ratios were in effect during the period April 1, 2015 to September 30, 2015.
†††† Expenses are equal to the fund’s annualized expense ratio of 1.12% for Class A, 1.90% for Class C, .85% for Class I and .85% for Class Y, multiplied by the average account value over the period, multiplied by 183/365 (to reflect the one-half year period).
8
STATEMENT OF INVESTMENTS
September 30, 2015
| | | | | | | | | |
Common Stocks - 97.6% | | Shares | | Value ($) | |
Australia - 3.8% | | | | | |
ASX | | 64,750 | | 1,727,070 | |
Dexus Property Group | | 803,740 | | 4,041,177 | |
Goodman Group | | 533,349 | | 2,196,501 | |
Lend Lease Group | | 298,082 | | 2,634,197 | |
Woodside Petroleum | | 210,786 | | 4,309,829 | |
| | | | | 14,908,774 | |
Belgium - .9% | | | | | |
bpost | | 72,832 | | 1,729,307 | |
Solvay | | 18,924 | | 1,934,219 | |
| | | | | 3,663,526 | |
France - 9.9% | | | | | |
Atos | | 39,000 | | 2,995,187 | |
AXA | | 228,197 | | 5,540,004 | |
Cap Gemini | | 43,995 | | 3,920,235 | |
Carrefour | | 158,884 | | 4,708,635 | |
Safran | | 51,358 | | 3,875,132 | |
Sanofi | | 81,397 | | 7,754,381 | |
Societe Generale | | 133,140 | | 5,955,658 | |
Thales | | 58,123 | | 4,049,370 | |
| | | | | 38,798,602 | |
Germany - 7.1% | | | | | |
Commerzbank | | 702,058 | a | 7,389,986 | |
Continental | | 24,249 | | 5,150,991 | |
Evonik Industries | | 86,461 | | 2,889,897 | |
Infineon Technologies | | 431,920 | | 4,853,984 | |
Muenchener Rueckversicherungs | | 16,741 | | 3,118,790 | |
ProSiebenSat.1 Media | | 91,844 | | 4,497,607 | |
| | | | | 27,901,255 | |
Hong Kong - 1.5% | | | | | |
AIA Group | | 1,117,200 | | 5,816,751 | |
Ireland - 1.8% | | | | | |
Bank of Ireland | | 8,193,878 | a | 3,189,881 | |
Smurfit Kappa Group | | 142,881 | | 3,841,152 | |
| | | | | 7,031,033 | |
Israel - 3.0% | | | | | |
Bezeq The Israeli Telecommunication | | 1,968,781 | | 3,766,045 | |
Teva Pharmaceutical Industries, ADR | | 143,993 | | 8,129,845 | |
| | | | | 11,895,890 | |
9
STATEMENT OF INVESTMENTS (continued)
| | | | | | | | | | | |
Common Stocks - 97.6% (continued) | | Shares | | Value ($) | |
Italy - 4.2% | | | | | |
Assicurazioni Generali | | 240,156 | | 4,404,849 | |
Banco Popolare | | 153,951 | a | 2,277,310 | |
Enel | | 955,573 | | 4,272,776 | |
Prysmian | | 92,867 | | 1,921,101 | |
Telecom Italia | | 2,850,448 | a | 3,504,678 | |
| | | | | 16,380,714 | |
Japan - 21.8% | | | | | |
Aisin Seiki | | 156,500 | | 5,263,717 | |
Chubu Electric Power | | 213,000 | | 3,149,652 | |
East Japan Railway | | 26,800 | | 2,267,926 | |
Fujitsu | | 842,000 | | 3,671,876 | |
Hitachi Chemical | | 113,500 | | 1,569,291 | |
Japan Airlines | | 115,300 | | 4,070,361 | |
Kaken Pharmaceutical | | 21,500 | | 2,003,650 | |
KDDI | | 250,600 | | 5,612,019 | |
Mitsubishi Electric | | 467,000 | | 4,287,860 | |
Nintendo | | 27,400 | | 4,629,004 | |
Nippon Shokubai | | 29,400 | | 2,003,195 | |
Nitto Denko | | 38,100 | | 2,288,332 | |
Panasonic | | 638,600 | | 6,483,110 | |
Resona Holdings | | 764,400 | | 3,905,487 | |
Secom | | 49,700 | | 2,994,913 | |
Seven & I Holdings | | 179,400 | | 8,219,676 | |
Shionogi & Co. | | 63,700 | | 2,289,721 | |
Sony | | 249,600 | | 6,103,079 | |
Sumitomo Mitsui Financial Group | | 216,200 | | 8,230,192 | |
TDK | | 41,900 | | 2,383,290 | |
Tosoh | | 877,000 | | 4,245,912 | |
| | | | | 85,672,263 | |
Luxembourg - .5% | | | | | |
Aperam | | 76,817 | a | 2,075,660 | |
Netherlands - 4.2% | | | | | |
Airbus Group | | 55,068 | | 3,270,837 | |
Heineken | | 50,747 | | 4,107,421 | |
NXP Semiconductors | | 34,604 | a | 3,012,970 | |
RELX | | 368,519 | | 6,016,685 | |
| | | | | 16,407,913 | |
Portugal - 1.0% | | | | | |
Galp Energia | | 397,013 | | 3,916,651 | |
10
| | | | | | | | | | | |
Common Stocks - 97.6% (continued) | | Shares | | Value ($) | |
Singapore - 1.9% | | | | | |
ComfortDelGro | | 626,600 | | 1,268,544 | |
Oversea-Chinese Banking | | 735,100 | | 4,551,377 | |
Singapore Exchange | | 307,200 | | 1,520,251 | |
| | | | | 7,340,172 | |
Spain - 3.7% | | | | | |
ACS Actividades de Construccion y Servicios | | 128,498 | | 3,695,054 | |
Banco Bilbao Vizcaya Argentaria | | 1,050,206 | | 8,907,587 | |
Distribuidora Internacional de Alimentacion | | 343,627 | a | 2,076,941 | |
| | | | | 14,679,582 | |
Sweden - 2.2% | | | | | |
Boliden | | 147,591 | | 2,310,582 | |
SKF, Cl. B | | 134,678 | | 2,481,273 | |
Svenska Cellulosa, Cl. B | | 135,814 | | 3,805,784 | |
| | | | | 8,597,639 | |
Switzerland - 9.0% | | | | | |
Actelion | | 22,760 | a | 2,895,244 | |
Adecco | | 52,036 | a | 3,815,532 | |
Julius Baer Group | | 51,578 | a | 2,346,701 | |
Novartis | | 96,051 | | 8,847,714 | |
Roche Holding | | 50,731 | | 13,410,943 | |
Swiss Life Holding | | 17,650 | a | 3,945,948 | |
| | | | | 35,262,082 | |
United Kingdom - 20.4% | | | | | |
AstraZeneca | | 131,791 | | 8,363,873 | |
Aviva | | 573,711 | | 3,932,813 | |
BAE Systems | | 400,883 | | 2,721,677 | |
BG Group | | 311,677 | | 4,494,283 | |
Compass Group | | 245,648 | | 3,921,781 | |
HSBC Holdings | | 1,138,350 | | 8,611,353 | |
Imperial Tobacco Group | | 110,077 | | 5,697,368 | |
National Grid | | 425,378 | | 5,924,119 | |
Petrofac | | 171,186 | | 1,995,340 | |
Prudential | | 254,039 | | 5,370,510 | |
Sky | | 409,695 | | 6,483,044 | |
Unilever | | 272,025 | | 11,081,050 | |
Whitbread | | 47,990 | | 3,394,392 | |
Wolseley | | 53,217 | | 3,113,146 | |
WPP | | 248,527 | | 5,175,514 | |
| | | | | 80,280,263 | |
11
STATEMENT OF INVESTMENTS (continued)
| | | | | | | | | | | | | | |
Common Stocks - 97.6% (continued) | | Shares | | Value ($) | |
United States - .7% | | | | | |
iShares MSCI EAFE ETF | | 50,405 | | 2,889,215 | |
Total Common Stocks (cost $410,041,714) | | | | 383,517,985 | |
Other Investments - 1.5% | | | | | |
Registered Investment Company; | | | | | |
Dreyfus Institutional Preferred Plus Money Market Fund | | 5,749,627 | b | 5,749,627 | |
(cost $5,749,627) | | | | | |
Total Investments (cost $415,791,341) | | 99.1% | | 389,267,612 | |
Cash and Receivables (Net) | | .9% | | 3,524,997 | |
Net Assets | | 100.0% | | 392,792,609 | |
ADR—American Depository Receipt
ETF—Exchange-Traded Fund
a Non-income producing security.
b Investment in affiliated money market mutual fund.
| | |
Portfolio Summary (Unaudited) † | Value (%) |
Financials | 24.7 |
Consumer Discretionary | 13.8 |
Health Care | 13.7 |
Industrials | 12.4 |
Consumer Staples | 10.1 |
Materials | 6.5 |
Information Technology | 5.3 |
Energy | 3.7 |
Utilities | 3.4 |
Telecommunications | 3.3 |
Money Market Investment | 1.5 |
Exchange-Traded Funds | .7 |
| | 99.1 |
†Based on net assets.
See notes to financial statements.
12
STATEMENT OF ASSETS AND LIABILITIES
September 30, 2015
| | | | | | | |
| | | Cost | | Value | |
Assets ($): | | | | |
Investments in securities—See Statement of Investments: | | | | | |
Unaffiliated issuers | | 410,041,714 | | 383,517,985 | |
Affiliated issuers | | 5,749,627 | | 5,749,627 | |
Cash | | | | | 133,271 | |
Cash denominated in foreign currency | | | 1,151,595 | | 1,132,610 | |
Receivable for investment securities sold | | | | | 1,643,936 | |
Dividends receivable | | | | | 1,237,289 | |
Receivable for shares of Beneficial Interest subscribed | | | | | 1,181,762 | |
Unrealized appreciation on forward foreign
currency exchange contracts—Note 4 | | | | | 1,511 | |
Prepaid expenses and other assets | | | | | 36,794 | |
| | | | | 394,634,785 | |
Liabilities ($): | | | | |
Due to The Boston Company Asset
Management, LLC and affiliates—Note 3(c) | | | | | 293,713 | |
Payable for investment securities purchased | | | | | 1,221,016 | |
Payable for shares of Beneficial Interest redeemed | | | | | 212,486 | |
Interest payable—Note 2 | | | | | 47 | |
Accrued expenses | | | | | 114,914 | |
| | | | | 1,842,176 | |
Net Assets ($) | | | 392,792,609 | |
Composition of Net Assets ($): | | | | |
Paid-in capital | | | | | 457,420,326 | |
Accumulated undistributed investment income—net | | | | | 3,354,624 | |
Accumulated net realized gain (loss) on investments | | | | | (41,409,709) | |
Accumulated net unrealized appreciation (depreciation)
on investments and foreign currency transactions | | | | | (26,572,632) | |
Net Assets ($) | | | 392,792,609 | |
| | | | | | |
Net Asset Value Per Share | Class A | Class C | Class I | Class Y | |
Net Assets ($) | 77,051,700 | 11,079,252 | 83,178,539 | 221,483,118 | |
Shares Outstanding | 2,380,691 | 341,348 | 2,540,364 | 6,767,591 | |
Net Asset Value Per Share ($) | 32.37 | 32.46 | 32.74 | 32.73 | |
See notes to financial statements.
13
STATEMENT OF OPERATIONS
Year Ended September 30, 2015
| | | | | | | |
| | | | | | |
| | | | | | |
Investment Income ($): | | | | |
Income: | | | | |
Cash dividends (net of $690,147 foreign taxes withheld at source): | | | | |
Unaffiliated issuers | | | 7,613,951 | |
Affiliated issuers | | | 3,552 | |
Total Income | | | 7,617,503 | |
Expenses: | | | | |
Investment advisory fee—Note 3(a) | | | 2,667,017 | |
Shareholder servicing costs—Note 3(c) | | | 359,557 | |
Administration fee—Note 3(a) | | | 333,377 | |
Custodian fees—Note 3(c) | | | 99,877 | |
Professional fees | | | 92,677 | |
Distribution fees—Note 3(b) | | | 71,586 | |
Registration fees | | | 68,327 | |
Trustees' fees and expenses—Note 3(d) | | | 25,397 | |
Prospectus and shareholders’ reports | | | 20,868 | |
Loan commitment fees—Note 2 | | | 3,357 | |
Interest expense—Note 2 | | | 1,606 | |
Miscellaneous | | | 36,078 | |
Total Expenses | | | 3,779,724 | |
Less—reduction in expenses due to undertaking—Note 3(a) | | | (638,945) | |
Less—reduction in fees due to earnings credits—Note 3(c) | | | (103) | |
Net Expenses | | | 3,140,676 | |
Investment Income—Net | | | 4,476,827 | |
Realized and Unrealized Gain (Loss) on Investments—Note 4 ($): | | |
Net realized gain (loss) on investments and foreign currency transactions | (5,172,449) | |
Net realized gain (loss) on forward foreign currency exchange contracts | 108,089 | |
Net Realized Gain (Loss) | | | (5,064,360) | |
Net unrealized appreciation (depreciation) on investments
and foreign currency transactions | | | (31,970,008) | |
Net unrealized appreciation (depreciation) on
forward foreign currency exchange contracts | | | 2,783 | |
Net Unrealized Appreciation (Depreciation) | | | (31,967,225) | |
Net Realized and Unrealized Gain (Loss) on Investments | | | (37,031,585) | |
Net (Decrease) in Net Assets Resulting from Operations | | (32,554,758) | |
See notes to financial statements.
14
STATEMENT OF CHANGES IN NET ASSETS
| | | | | | | | | | |
| | | | | | | | | | |
| | | | Year Ended September 30, |
| | | | 2015 | a | | 2014 | |
Operations ($): | | | | | | | | |
Investment income—net | | | 4,476,827 | | | | 4,071,620 | |
Net realized gain (loss) on investments | | (5,064,360) | | | | 26,172,427 | |
Net unrealized appreciation (depreciation)
on investments | | (31,967,225) | | | | (16,444,603) | |
Net Increase (Decrease) in Net Assets
Resulting from Operations | (32,554,758) | | | | 13,799,444 | |
Dividends to Shareholders from ($): | | | | | | | | |
Investment income—net: | | | | | | | | |
Class A | | | (977,579) | | | | (815,846) | |
Class C | | | (52,770) | | | | (44,739) | |
Class I | | | (3,175,200) | | | | (2,002,948) | |
Total Dividends | | | (4,205,549) | | | | (2,863,533) | |
Beneficial Interest Transactions ($): | | | | | | | | |
Net proceeds from shares sold: | | | | | | | | |
Class A | | | 33,038,509 | | | | 35,551,257 | |
Class C | | | 5,736,049 | | | | 4,351,181 | |
Class I | | | 133,826,169 | | | | 81,221,233 | |
Class Y | | | 234,043,399 | | | | - | |
Dividends reinvested: | | | | | | | | |
Class A | | | 913,376 | | | | 748,610 | |
Class C | | | 34,328 | | | | 26,128 | |
Class I | | | 3,129,817 | | | | 2,000,368 | |
Cost of shares redeemed: | | | | | | | | |
Class A | | | (26,006,741) | | | | (13,515,910) | |
Class C | | | (2,430,191) | | | | (1,070,740) | |
Class I | | | (252,483,673) | | | | (9,710,277) | |
Class Y | | | (500,867) | | | | - | |
Increase (Decrease) in Net Assets
from Beneficial Interest Transactions | 129,300,175 | | | | 99,601,850 | |
Total Increase (Decrease) in Net Assets | 92,539,868 | | | | 110,537,761 | |
Net Assets ($): | | | | | | | | |
Beginning of Period | | | 300,252,741 | | | | 189,714,980 | |
End of Period | | | 392,792,609 | | | | 300,252,741 | |
Undistributed investment income—net | 3,354,624 | | | | 3,396,563 | |
15
STATEMENT OF CHANGES IN NET ASSETS (continued)
| | | | | | | | | | |
| | | | | | | | | | |
| | | | Year Ended September 30, |
| | | | 2015 | a | | 2014 | |
Capital Share Transactions: | | | | | | | | |
Class A | | | | | | | | |
Shares sold | | | 942,618 | | | | 986,190 | |
Shares issued for dividends reinvested | | | 27,119 | | | | 20,952 | |
Shares redeemed | | | (751,891) | | | | (374,866) | |
Net Increase (Decrease) in Shares Outstanding | 217,846 | | | | 632,276 | |
Class C | | | | | | | | |
Shares sold | | | 162,124 | | | | 120,097 | |
Shares issued for dividends reinvested | | | 1,010 | | | | 725 | |
Shares redeemed | | | (70,073) | | | | (29,458) | |
Net Increase (Decrease) in Shares Outstanding | 93,061 | | | | 91,364 | |
Class Ib | | | | | | | | |
Shares sold | | | 3,811,368 | | | | 2,226,017 | |
Shares issued for dividends reinvested | | | 92,080 | | | | 55,566 | |
Shares redeemed | | | (7,307,859) | | | | (265,527) | |
Net Increase (Decrease) in Shares Outstanding | (3,404,411) | | | | 2,016,056 | |
Class Yb | | | | | | | | |
Shares sold | | | 6,782,212 | | | | - | |
Shares redeemed | | | (14,621) | | | | - | |
Net Increase (Decrease) in Shares Outstanding | 6,767,591 | | | | - | |
a Effective June 1, 2015, the fund commenced offering Class Y shares. | |
b During the period ended September 30, 2015, 6,298,013 Class I shares representing $217,407,407 were exchanged for 6,298,013 Class Y shares. | |
See notes to financial statements.
16
FINANCIAL HIGHLIGHTS
The following tables describe the performance for each share class for the fiscal periods indicated. All information (except portfolio turnover rate) reflects financial results for a single fund share. Total return shows how much your investment in the fund would have increased (or decreased) during each period, assuming you had reinvested all dividends and distributions. These figures have been derived from the fund’s financial statements.
| | | | | | | |
| | | | | |
| | Year Ended September 30, |
Class A Shares | | 2015 | 2014 | 2013 | 2012 | 2011 |
Per Share Data ($): | | | | | | |
Net asset value, beginning of period | 35.69 | 33.61 | 27.34 | 23.42 | 26.30 |
Investment Operations: | | | | | | |
Investment income—neta | .39 | .50 | .47 | .54 | .52 |
Net realized and unrealized gain (loss) on investments | (3.23) | 2.06 | 6.52 | 3.86 | (2.81) |
Total from Investment Operations | (2.84) | 2.56 | 6.99 | 4.40 | (2.29) |
Distributions: | | | | | | |
Dividends from investment income—net | (.48) | (.48) | (.72) | (.48) | (.59) |
Net asset value, end of period | 32.37 | 35.69 | 33.61 | 27.34 | 23.42 |
Total Return (%)b | (8.01) | 7.62 | 26.02 | 19.12 | (9.06) |
Ratios/Supplemental Data (%): | | | | | |
Ratio of total expenses to average net assets | 1.37 | 1.40 | 1.46 | 1.54 | 1.50 |
Ratio of net expenses to average net assets | | 1.12 | 1.12 | 1.12 | 1.12 | 1.12 |
Ratio of net investment income to average net assets | 1.12 | 1.38 | 1.55 | 2.12 | 1.86 |
Portfolio Turnover Rate | 87.33 | 89.36 | 71.87 | 64.52 | 89.90 |
Net Assets, end of period ($ x 1,000) | 77,052 | 77,195 | 51,441 | 36,972 | 37,389 |
a Based on average shares outstanding.
b Exclusive of sales charge.
See notes to financial statements.
17
FINANCIAL HIGHLIGHTS (continued)
| | | | | | | |
| | | | | |
| | Year Ended September 30, |
Class C Shares | | 2015 | 2014 | 2013 | 2012 | 2011 |
Per Share Data ($): | | | | | | |
Net asset value, beginning of period | 35.79 | 33.75 | 27.45 | 23.44 | 26.30 |
Investment Operations: | | | | | | |
Investment income—neta | .14 | .24 | .24 | .34 | .33 |
Net realized and unrealized gain (loss) on investments | (3.25) | 2.05 | 6.55 | 3.90 | (2.85) |
Total from Investment Operations | (3.11) | 2.29 | 6.79 | 4.24 | (2.52) |
Distributions: | | | | | | |
Dividends from investment income—net | (.22) | (.25) | (.49) | (.23) | (.34) |
Net asset value, end of period | 32.46 | 35.79 | 33.75 | 27.45 | 23.44 |
Total Return (%)b | (8.73) | 6.78 | 25.03 | 18.24 | (9.78) |
Ratios/Supplemental Data (%): | | | | | |
Ratio of total expenses to average net assets | 2.14 | 2.17 | 2.27 | 2.34 | 2.27 |
Ratio of net expenses to average net assets | 1.90 | 1.90 | 1.90 | 1.90 | 1.90 |
Ratio of net investment income to average net assets | .39 | .66 | .77 | 1.33 | 1.16 |
Portfolio Turnover Rate | 87.33 | 89.36 | 71.87 | 64.52 | 89.90 |
Net Assets, end of period ($ x 1,000) | 11,079 | 8,887 | 5,297 | 4,724 | 5,348 |
a Based on average shares outstanding.
b Exclusive of sales charge.
See notes to financial statements.
18
| | | | | | | | | |
| | | | | |
| | Year Ended September 30, |
Class I Shares | | 2015 | 2014 | 2013 | 2012 | 2011 | |
Per Share Data ($): | | | | | | | |
Net asset value, beginning of period | 36.03 | 33.85 | 27.47 | 23.58 | 26.49 | |
Investment Operations: | | | | | | | |
Investment income—neta | .56 | .62 | .54 | .64 | .68 | |
Net realized and unrealized gain (loss) on investments | (3.34) | 2.06 | 6.57 | 3.86 | (2.93) | |
Total from Investment Operations | (2.78) | 2.68 | 7.11 | 4.50 | (2.25) | |
Distributions: | | | | | | | |
Dividends from investment income—net | (.51) | (.50) | (.73) | (.61) | (.66) | |
Net asset value, end of period | 32.74 | 36.03 | 33.85 | 27.47 | 23.58 | |
Total Return (%) | (7.77) | 7.91 | 26.36 | 19.51 | (8.86) | |
Ratios/Supplemental Data (%): | | | | | | |
Ratio of total expenses to average net assets | 1.03 | 1.04 | 1.07 | 1.10 | 1.08 | |
Ratio of net expenses to average net assets | .85 | .85 | .85 | .85 | .85 | |
Ratio of net investment income to average net assets | 1.57 | 1.70 | 1.77 | 2.49 | 2.41 | |
Portfolio Turnover Rate | 87.33 | 89.36 | 71.87 | 64.52 | 89.90 | |
Net Assets, end of period ($ x 1,000) | 83,179 | 214,170 | 132,978 | 124,328 | 111,593 | |
a Based on average shares outstanding.
See notes to financial statements.
19
FINANCIAL HIGHLIGHTS (continued)
| | | | |
| | | | |
Class Y Shares | | Year Ended
September 30, 2015 | a |
Per Share Data ($): | | | |
Net asset value, beginning of period | | 36.66 | |
Investment Operations: | | | |
Investment income—netb | | .10 | |
Net realized and unrealized gain (loss) on investments | | (4.03) | |
Total from Investment Operations | | (3.93) | |
Net asset value, end of period | | 32.73 | |
Total Return (%) | | (10.72) | c |
Ratios/Supplemental Data (%): | | | |
Ratio of total expenses to average net assets | | 1.01 | d |
Ratio of net expenses to average net assets | | .85 | d |
Ratio of net investment income to average net assets | | .95 | d |
Portfolio Turnover Rate | | 87.33 | |
Net Assets, end of period ($x 1,000) | | 221,483 | |
a From June 1, 2015 (commencement of initial offering) to September 30, 2015.
b Based on average shares outstanding.
c Not annualized.
d Annualized.
See notes to financial statements.
20
NOTES TO FINANCIAL STATEMENTS
NOTE 1—Significant Accounting Policies:
Dreyfus International Equity Fund (the “fund”) is a separate diversified series of Dreyfus Stock Funds (the “Company”), which is registered under the Investment Company Act of 1940, as amended (the “Act”), as an open-end management investment company and operates as a series company currently offering three series, including the fund. The fund’s investment objective is to seek long-term growth of capital. The Boston Company Asset Management, LLC (“TBCAM”), a wholly-owned subsidiary of The Bank of New York Mellon Corporation (“BNY Mellon”), serves as the fund’s investment adviser. The Dreyfus Corporation (the “Administrator” or “Dreyfus”), a wholly-owned subsidiary of BNY Mellon and an affiliate of TBCAM, serves as the fund’s Administrator.
On May 4, 2015, the Company’s Board of Trustees (the “Board”) approved, effective June 1, 2015 for the fund to offer Class Y shares.
MBSC Securities Corporation (the “Distributor”), a wholly-owned subsidiary of Dreyfus, is the distributor of the fund’s shares. The fund is authorized to issue an unlimited number of $.001 par value shares of Beneficial Interest in each of the following classes of shares: Class A, Class C, Class I and Class Y. Class A shares generally are subject to a sales charge imposed at the time of purchase. Class C shares are subject to a contingent deferred sales charge (“CDSC”) imposed on Class C shares redeemed within one year of purchase. Class I and Class Y shares are sold at net asset value per share generally to institutional investors. Other differences between the classes include the services offered to and the expenses borne by each class, the allocation of certain transfer agency costs, and certain voting rights. Income, expenses (other than expenses attributable to a specific class), and realized and unrealized gains or losses on investments are allocated to each class of shares based on its relative net assets.
The Company accounts separately for the assets, liabilities and operations of each series. Expenses directly attributable to each series are charged to that series’ operations; expenses which are applicable to all series are allocated among them on a pro rata basis.
The Financial Accounting Standards Board (“FASB”) Accounting Standards Codification (“ASC”) is the exclusive reference of authoritative U.S. generally accepted accounting principles (“GAAP”) recognized by the FASB to be applied by nongovernmental entities. Rules and interpretive releases of the Securities and Exchange Commission (“SEC”) under
21
NOTES TO FINANCIAL STATEMENTS (continued)
authority of federal laws are also sources of authoritative GAAP for SEC registrants. The fund’s financial statements are prepared in accordance with GAAP, which may require the use of management estimates and assumptions. Actual results could differ from those estimates.
The Company enters into contracts that contain a variety of indemnifications. The fund’s maximum exposure under these arrangements is unknown. The fund does not anticipate recognizing any loss related to these arrangements.
(a) Portfolio valuation: The fair value of a financial instrument is the amount that would be received to sell an asset or paid to transfer a liability in an orderly transaction between market participants at the measurement date (i.e., the exit price). GAAP establishes a fair value hierarchy that prioritizes the inputs of valuation techniques used to measure fair value. This hierarchy gives the highest priority to unadjusted quoted prices in active markets for identical assets or liabilities (Level 1 measurements) and the lowest priority to unobservable inputs (Level 3 measurements).
Additionally, GAAP provides guidance on determining whether the volume and activity in a market has decreased significantly and whether such a decrease in activity results in transactions that are not orderly. GAAP requires enhanced disclosures around valuation inputs and techniques used during annual and interim periods.
Various inputs are used in determining the value of the fund’s investments relating to fair value measurements. These inputs are summarized in the three broad levels listed below:
Level 1—unadjusted quoted prices in active markets for identical investments.
Level 2—other significant observable inputs (including quoted prices for similar investments, interest rates, prepayment speeds, credit risk, etc.).
Level 3—significant unobservable inputs (including the fund’s own assumptions in determining the fair value of investments).
The inputs or methodology used for valuing securities are not necessarily an indication of the risk associated with investing in those securities.
Changes in valuation techniques may result in transfers in or out of an assigned level within the disclosure hierarchy. Valuation techniques used to value the fund’s investments are as follows:
Investments in securities are valued at the last sales price on the securities exchange or national securities market on which such securities are
22
primarily traded. Securities listed on the National Market System for which market quotations are available are valued at the official closing price or, if there is no official closing price that day, at the last sales price. For open short positions, asked prices are used for valuation purposes. Bid price is used when no asked price is available. Registered investment companies that are not traded on an exchange are valued at their net asset value. All of the preceding securities are generally categorized within Level 1 of the fair value hierarchy.
Securities not listed on an exchange or the national securities market, or securities for which there were no transactions, are valued at the average of the most recent bid and asked prices. These securities are generally categorized within Level 2 of the fair value hierarchy.
Fair valuing of securities may be determined with the assistance of a pricing service using calculations based on indices of domestic securities and other appropriate indicators, such as prices of relevant ADRs and financial futures. Utilizing these techniques may result in transfers between Level 1 and Level 2 of the fair value hierarchy.
When market quotations or official closing prices are not readily available, or are determined not to reflect accurately fair value, such as when the value of a security has been significantly affected by events after the close of the exchange or market on which the security is principally traded (for example, a foreign exchange or market), but before the fund calculates its net asset value, the fund may value these investments at fair value as determined in accordance with the procedures approved by the Board. Certain factors may be considered when fair valuing investments such as: fundamental analytical data, the nature and duration of restrictions on disposition, an evaluation of the forces that influence the market in which the securities are purchased and sold, and public trading in similar securities of the issuer or comparable issuers. These securities are either categorized within Level 2 or 3 of the fair value hierarchy depending on the relevant inputs used.
For restricted securities where observable inputs are limited, assumptions about market activity and risk are used and are generally categorized within Level 3 of the fair value hierarchy.
Investments denominated in foreign currencies are translated to U.S. dollars at the prevailing rates of exchange.
Forward foreign currency exchange contracts (“forward contracts”) are valued at the forward rate and are generally categorized within Level 2 of the fair value hierarchy.
23
NOTES TO FINANCIAL STATEMENTS (continued)
The following is a summary of the inputs used as of September 30, 2015 in valuing the fund’s investments:
| | | | | | | |
Assets ($) | Level 1 Unadjusted Quoted Prices | Level 2 - Other Significant Observable Inputs | | Level 3 Significant Unobservable Inputs | Total |
Investments in Securities: | | | |
Equity Securities - Foreign Common Stocks† | 11,142,815 | 369,485,955 | †† | - | 380,628,770 |
Exchange-Traded Funds | 2,889,215 | - | | - | 2,889,215 |
Mutual Funds | 5,749,627 | - | | - | 5,749,627 |
Other Financial Instruments: | | | |
Forward Foreign Currency Exchange Contracts††† | - | 1,511 | | - | 1,511 |
† See Statement of Investments for additional detailed categorizations.
†† Securities classified within Level 2 at period end as the values were determined pursuant to the fund’s fair valuation procedures. See note above for additional information.
††† Amount shown represents unrealized appreciation at period end.
At September 30, 2014, no exchange traded foreign equity securities were classified within Level 2 of the fair value hierarchy pursuant to the fund’s fair valuation procedures.
(b) Foreign currency transactions: The fund does not isolate that portion of the results of operations resulting from changes in foreign exchange rates on investments from the fluctuations arising from changes in the market prices of securities held. Such fluctuations are included with the net realized and unrealized gain or loss on investments.
Net realized foreign exchange gains or losses arise from sales of foreign currencies, currency gains or losses realized on securities transactions between trade and settlement date, and the difference between the amounts of dividends, interest and foreign withholding taxes recorded on the fund’s books and the U.S. dollar equivalent of the amounts actually received or paid. Net unrealized foreign exchange gains and losses arise from changes in the value of assets and liabilities other than investments resulting from changes in exchange rates. Foreign currency gains and losses on foreign currency transactions are also included with net realized and unrealized gain or loss on investments.
(c) Securities transactions and investment income: Securities transactions are recorded on a trade date basis. Realized gains and losses from securities transactions are recorded on the identified cost basis. Dividend income is recognized on the ex-dividend date and interest
24
income, including, where applicable, accretion of discount and amortization of premium on investments, is recognized on the accrual basis.
(d) Affiliated issuers: Investments in other investment companies advised by Dreyfus are defined as “affiliated” under the Act. Investments in affiliated investment companies during the period ended September 30, 2015 were as follows:
| | | | | | |
Affiliated Investment Company | Value 9/30/2014 ($) | Purchases ($) | Sales ($) | Value 9/30/2015 ($) | Net
Assets (%) |
Dreyfus Institutional Preferred Plus Money Market Fund | 2,415,052 | 190,007,259 | 186,672,684 | 5,749,627 | 1.5 |
Certain affiliated investment companies may also invest in the fund. At September 30, 2015, Dreyfus Diversified International Fund, an affiliate of the fund, held 6,688,479 Class Y shares representing approximately 55.7% of the fund's net assets.
(e) Risk: Investing in foreign markets may involve special risks and considerations not typically associated with investing in the U.S. These risks include revaluation of currencies, high rates of inflation, repatriation restrictions on income and capital, and adverse political and economic developments. Moreover, securities issued in these markets may be less liquid, subject to government ownership controls and delayed settlements, and their prices may be more volatile than those of comparable securities in the U.S.
(f) Dividends to shareholders: Dividends are recorded on the ex-dividend date. Dividends from investment income-net and dividends from net realized capital gains, if any, are normally declared and paid annually, but the fund may make distributions on a more frequent basis to comply with the distribution requirements of the Internal Revenue Code of 1986, as amended (the “Code”). To the extent that net realized capital gains can be offset by capital loss carryovers, it is the policy of the fund not to distribute such gains. Income and capital gain distributions are determined in accordance with income tax regulations, which may differ from GAAP.
(g) Federal income taxes: It is the policy of the fund to continue to qualify as a regulated investment company, if such qualification is in the best interests of its shareholders, by complying with the applicable
25
NOTES TO FINANCIAL STATEMENTS (continued)
provisions of the Code, and to make distributions of taxable income sufficient to relieve it from substantially all federal income and excise taxes.
As of and during the period ended September 30, 2015, the fund did not have any liabilities for any uncertain tax positions. The fund recognizes interest and penalties, if any, related to uncertain tax positions as income tax expense in the Statement of Operations. During the period ended September 30, 2015, the fund did not incur any interest or penalties.
Each tax year in the four-year period ended September 30, 2015 remains subject to examination by the Internal Revenue Service and state taxing authorities.
At September 30, 2015, the components of accumulated earnings on a tax basis were as follows: undistributed ordinary income $3,630,258, accumulated capital losses $35,896,028 and unrealized depreciation $28,136,237. In addition, the fund had $4,225,710 of capital losses realized after October 31, 2014, which were deferred for tax purposes to the first day of the following fiscal year.
The accumulated capital loss carryover is available for federal income tax purposes to be applied against future net realized capital gains, if any, realized subsequent to September 30, 2015. If not applied, the carryover expires in fiscal year 2018.
The tax character of distributions paid to shareholders during the fiscal periods ended September 30, 2015 and September 30, 2014 were as follows: ordinary income $4,205,549 and $2,863,533, respectively.
During the period ended September 30, 2015, as a result of permanent book to tax differences, primarily due to the tax treatment for passive foreign investment companies and foreign currency gains and losses, the fund decreased accumulated undistributed investment income-net by $313,217 and increased accumulated net realized gain (loss) on investments by the same amount. Net assets and net asset value per share were not affected by this reclassification.
NOTE 2—Bank Lines of Credit:
The fund participates with other Dreyfus-managed funds in a $430 million unsecured credit facility led by Citibank, N.A. and a $300 million unsecured credit facility provided by The Bank of New York Mellon, a subsidiary of BNY Mellon and an affiliate of Dreyfus (each, a “Facility”), each to be utilized primarily for temporary or emergency purposes, including the financing of redemptions. Prior to October 8, 2014, the unsecured credit facility with Citibank, N.A. was $265 million. In connection therewith, the fund has agreed to pay its pro rata portion of
26
commitment fees for each Facility. Interest is charged to the fund based on rates determined pursuant to the terms of the respective Facility at the time of borrowing.
The average amount of borrowings outstanding under the Facilities during the period ended September 30, 2015 was approximately $143,800 with a related weighted average annualized interest rate of 1.12%.
NOTE 3—Investment Advisory Fee, Administration Fee and Other Transactions with Affiliates:
(a) Pursuant to an investment advisory agreement with TBCAM, the investment advisory fee is computed at the annual rate of .80% of the value of the fund's average daily net assets up to $500 million, .75% of the next $500 million of such assets, .70% of the next $500 million of such assets, .60% of the next $500 million of such assets and .50% of the fund’s average daily net assets in excess of $2 billion and is payable monthly. The effective investment advisory fee rate during the period ended September 30, 2015 was .80%.
Dreyfus and TBCAM have contractually agreed, from October 1, 2014 through September 30, 2015, for Class A, Class C and Class I shares and from June 1, 2015 through June 1, 2016 for Class Y shares, to assume the direct expenses of the fund, so that such expenses of Class A, Class C, Class I and Class Y shares (excluding taxes, interest expense, brokerage commissions, commitment fees on borrowings and extraordinary expenses) do not exceed 1.12%, 1.90%, .85% and .85% of the value of the respective class’ average daily net assets, until the fiscal year end following such time as the expenses are equal to or less than such annual rate for Class A, Class C and Class I. With respect to Class Y shares, this agreement will continue until June 1, 2016, after which the expense limitation can be terminated at any time. The reduction in expenses, pursuant to the undertaking, amounted to $638,945 during the period ended September 30, 2015.
The fund compensates Dreyfus under an administration agreement for providing personnel and facilities to perform accounting and administration services for the fund at an annual rate of .10% of the value of the fund’s average daily net assets. Pursuant to the administration agreement, the fund was charged $333,377 during the period ended September 30, 2015.
During the period ended September 30, 2015, the Distributor retained $10,238 from commissions earned on sales of the fund's Class A shares and $6,378 from CDSCs on redemptions of the fund's Class C shares.
27
NOTES TO FINANCIAL STATEMENTS (continued)
(b) Under the Distribution Plan adopted pursuant to Rule 12b-1 under the Act, Class C shares pay the Distributor for distributing its shares at an annual rate of .75% of the value of its average daily net assets. During the period ended September 30, 2015, Class C shares were charged $71,586 pursuant to the Distribution Plan.
(c) Under the Shareholder Services Plan, Class A and Class C shares pay the Distributor at an annual rate of .25% of the value of their average daily net assets for the provision of certain services. The services provided may include personal services relating to shareholder accounts, such as answering shareholder inquiries regarding the fund and providing reports and other information, and services related to the maintenance of shareholder accounts. The Distributor may make payments to Service Agents (securities dealers, financial institutions or other industry professionals) with respect to these services. The Distributor determines the amounts to be paid to Service Agents. During the period ended September 30, 2015, Class A and Class C shares were charged $184,360 and $23,862, respectively, pursuant to the Shareholder Services Plan.
The fund has arrangements with the transfer agent and the custodian whereby the fund may receive earnings credits when positive cash balances are maintained, which are used to offset transfer agency and custody fees. For financial reporting purposes, the fund includes net earnings credits as an expense offset in the Statement of Operations.
The fund compensates Dreyfus Transfer, Inc., a wholly-owned subsidiary of Dreyfus, under a transfer agency agreement for providing transfer agency and cash management services for the fund. The majority of transfer agency fees are comprised of amounts paid on a per account basis, while cash management fees are related to fund subscriptions and redemptions. During the period ended September 30, 2015, the fund was charged $40,154 for transfer agency services and $2,508 for cash management services. These fees are included in Shareholder servicing costs in the Statement of Operations. Cash management fees were partially offset by earnings credits of $103.
The fund compensates The Bank of New York Mellon under a custody agreement for providing custodial services for the fund. These fees are determined based on net assets, geographic region and transaction activity. During the period ended September 30, 2015, the fund was charged $99,877 pursuant to the custody agreement.
During the period ended September 30, 2015, the fund was charged $11,078 for services performed by the Chief Compliance Officer and his staff.
28
The components of “Due to TBCAM and affiliates” in the Statement of Assets and Liabilities consist of: investment advisory fees $254,288, administration fees $31,786, Distribution Plan fees $6,674, Shareholder Services Plan fees $18,064, custodian fees $42,418, Chief Compliance Officer fees $2,606 and transfer agency fees $8,161, which are offset against an expense reimbursement currently in effect in the amount of $70,284.
(d) Each Board member also serves as a Board member of other funds within the Dreyfus complex. Annual retainer fees and attendance fees are allocated to each fund based on net assets.
NOTE 4—Securities Transactions:
The aggregate amount of purchases and sales of investment securities, excluding short-term securities and forward contracts, during the period ended September 30, 2015, amounted to $412,327,840 and $288,465,997, respectively.
Derivatives: A derivative is a financial instrument whose performance is derived from the performance of another asset. The fund enters into International Swaps and Derivatives Association, Inc. Master Agreements or similar agreements (collectively, “Master Agreements”) with its over-the-counter (“OTC”) derivative contract counterparties in order to, among other things, reduce its credit risk to counterparties. Master Agreements include provisions for general obligations, representations, collateral and events of default or termination. Under a Master Agreement, the fund may offset with the counterparty certain derivative financial instrument’s payables and/or receivables with collateral held and/or posted and create one single net payment in the event of default or termination.
Each type of derivative instrument that was held by the fund during the period ended September 30, 2015 is discussed below.
Forward Foreign Currency Exchange Contracts: The fund enters into forward contracts in order to hedge its exposure to changes in foreign currency exchange rates on its foreign portfolio holdings, to settle foreign currency transactions or as a part of its investment strategy. When executing forward contracts, the fund is obligated to buy or sell a foreign currency at a specified rate on a certain date in the future. With respect to sales of forward contracts, the fund incurs a loss if the value of the contract increases between the date the forward contract is opened and the date the forward contract is closed. The fund realizes a gain if the value of the contract decreases between those dates. With respect to purchases of forward contracts, the fund incurs a loss if the value of the contract
29
NOTES TO FINANCIAL STATEMENTS (continued)
decreases between the date the forward contract is opened and the date the forward contract is closed. The fund realizes a gain if the value of the contract increases between those dates. Any realized or unrealized gains or losses which occurred during the period are reflected in the Statement of Operations. The fund is exposed to foreign currency risk as a result of changes in value of underlying financial instruments. The fund is also exposed to credit risk associated with counterparty nonperformance on these forward contracts, which is generally limited to the unrealized gain on each open contract. This risk may be mitigated by Master Agreements, if any, between the fund and the counterparty and the posting of collateral, if any, by the counterparty to the fund to cover the fund’s exposure to the counterparty. The following summarizes open forward contracts at September 30, 2015:
| | | | | |
Forward Foreign Currency Exchange Contracts | Foreign Currency
Amounts | Cost ($) | Value ($) | Unrealized Appreciation ($) |
Purchases: | | | | |
Citigroup | | | | |
Israeli Shekel, | | | | |
Expiring | | | | |
10/1/2015 | 156,305 | 39,801 | 39,844 | 43 |
Goldman Sachs International | | | | |
Australian Dollar, | | | | |
Expiring | | | | |
10/1/2015 | 226,580 | 158,923 | 159,037 | 114 |
Singapore Dollar, | | | | |
Expiring | | | | |
10/1/2015 | 111,710 | 78,228 | 78,501 | 273 |
JP Morgan Chase Bank | | | | |
Japanese Yen, | | | | |
Expiring | | | | |
10/1/2015 | 105,995,956 | 882,476 | 883,557 | 1,081 |
| | | | | |
Gross Unrealized Appreciation | | | | 1,511 |
The provisions of ASC Topic 210 “Disclosures about Offsetting Assets and Liabilities” require disclosure on the offsetting of financial assets and liabilities. These disclosures are required for certain investments, including derivative financial instruments subject to Master Agreements which are
30
eligible for offsetting in the Statement of Assets and Liabilities and require the fund to disclose both gross and net information with respect to such investments. For financial reporting purposes, the fund does not offset derivative assets and derivative liabilities that are subject to Master Agreements in the Statement of Assets and Liabilities.
At September 30, 2015, derivative assets and liabilities (by type) on a gross basis are as follows:
| | | | | | |
Derivative Financial Instruments: | | Assets ($) | | Liabilities ($) | |
Forward contracts | | 1,511 | | - | |
Total gross amount of derivative | | | | | |
assets and liabilities in the | | | | | |
Statement of Assets and Liabilities | | 1,511 | | - | |
Derivatives not subject to | | | | | |
Master Agreements | | - | | - | |
Total gross amount of assets | | | | | |
and liabilities subject to | | | | | |
Master Agreements | | 1,511 | | - | |
The following table presents derivative assets net of amounts available for offsetting under Master Agreements and net of related collateral received or pledged, if any, as of September 30, 2015:
| | | | | | | |
| | | | Financial | | | |
| | | | Instruments | | | |
| | | | and Derivatives | | | |
| | Gross Amount of | | Available | Collateral | | Net Amount of |
Counterparty | Assets ($) | 1 | for Offset ($) | Received ($) | | Assets ($) |
Citigroup | 43 | | - | - | | 43 |
Goldman Sachs
International | 387 | | - | - | | 387 |
JP Morgan Chase Bank | 1,081 | | - | - | | 1,081 |
Total | 1,511 | | - | - | | 1,511 |
| | | | | | | |
| | | | | | | |
1 Absent a default event or early termination, OTC derivative assets are presented at
gross amounts and are not offset in the Statement of Assets and Liabilities. |
The following summarizes the average market value of derivatives outstanding during the period ended September 30, 2015:
| | | | | |
| | | | | Average Market Value ($) |
Forward contracts | | | | 1,762,547 |
At September 30, 2015, the cost of investments for federal income tax purposes was $417,354,946; accordingly, accumulated net unrealized depreciation on investments was $28,087,334, consisting of $9,068,265
31
NOTES TO FINANCIAL STATEMENTS (continued)
gross unrealized appreciation and $37,155,599 gross unrealized depreciation.
NOTE 5—Plan of Reorganization:
On July 27, 2015, the Board approved an Agreement and Plan of Reorganization (the “Reorganization”) between Dreyfus Stock Funds, on behalf of the fund, and Dreyfus International Value Fund (the “Acquired Fund”). The Reorganization is subject to the approval of the shareholders of the Acquired Fund. The Reorganization is anticipated to occur on or about January 22, 2016. The Reorganization provides for the Acquired Fund to transfer all of its assets, subject to its liabilities, to the fund, in exchange for a number of Class A, Class C and Class I shares of the fund of equal value to the assets less liabilities of the Acquired Fund. The fund’s Class A, Class C and Class I shares will then be distributed to the Acquired Fund’s shareholders on a pro rata basis in liquidation of the Acquired Fund.
32
REPORT OF INDEPENDENT REGISTERED
PUBLIC ACCOUNTING FIRM
Shareholders and Board of Trustees
Dreyfus International Equity Fund
We have audited the accompanying statement of assets and liabilities, including the statement of investments, of Dreyfus International Equity Fund (one of the series comprising Dreyfus Stock Funds) as of September 30, 2015, and the related statement of operations for the year then ended, the statement of changes in net assets for each of the two years in the period then ended, and the financial highlights for each of the periods indicated therein. These financial statements and financial highlights are the responsibility of the Fund’s management. Our responsibility is to express an opinion on these financial statements and financial highlights based on our audits.
We conducted our audits in accordance with the standards of the Public Company Accounting Oversight Board (United States). Those standards require that we plan and perform the audit to obtain reasonable assurance about whether the financial statements and financial highlights are free of material misstatement. We were not engaged to perform an audit of the Fund’s internal control over financial reporting. Our audits included consideration of internal control over financial reporting as a basis for designing audit procedures that are appropriate in the circumstances, but not for the purpose of expressing an opinion on the effectiveness of the Fund’s internal control over financial reporting. Accordingly, we express no such opinion. An audit also includes examining, on a test basis, evidence supporting the amounts and disclosures in the financial statements and financial highlights, assessing the accounting principles used and significant estimates made by management, and evaluating the overall financial statement presentation. Our procedures included confirmation of securities owned as of September 30, 2015 by correspondence with the custodian and others. We believe that our audits provide a reasonable basis for our opinion.
In our opinion, the financial statements and financial highlights referred to above present fairly, in all material respects, the financial position of Dreyfus International Equity Fund at September 30, 2015, the results of its operations for the year then ended, the changes in its net assets for each of the two years in the period then ended, and the financial highlights for each of the indicated periods, in conformity with U.S. generally accepted accounting principles.

New York, New York
November 25, 2015
33
IMPORTANT TAX INFORMATION (Unaudited)
In accordance with federal tax law, the fund elects to provide each shareholder with their portion of the fund’s foreign taxes paid and the income sourced from foreign countries. Accordingly, the fund hereby reports the following information regarding its fiscal year ended September 30, 2015:
- the total amount of taxes paid to foreign countries was $675,266
- the total amount of income sourced from foreign countries was $8,181,954.
As required by federal tax law rules, shareholders will receive notification of their proportionate share of foreign taxes paid and foreign sourced income for the 2015 calendar year with Form 1099-DIV which will be mailed in early 2016. Also certain dividends paid by the fund may be subject to a maximum tax rate of 15%, as provided for by the Jobs and Growth Tax Relief Reconciliation Act of 2003. Of the distributions paid during the fiscal year, $4,205,549 represents the maximum amount that may be considered qualified dividend income.
34
BOARD MEMBERS INFORMATION (Unaudited)
INDEPENDENT BOARD MEMBERS
Joseph S. DiMartino (71)
Chairman of the Board (2003)
Principal Occupation During Past 5 Years:
· Corporate Director and Trustee (1995-present)
Other Public Company Board Memberships During Past 5 Years:
· CBIZ (formerly, Century Business Services, Inc.), a provider of outsourcing functions for small and medium size companies, Director (1997-present)
· The Newark Group, a provider of a national market of paper recovery facilities, paperboard mills and paperboard converting plants, Director (2000-2010)
No. of Portfolios for which Board Member Serves: 142
———————
Joni Evans (73)
Board Member (2006)
Principal Occupation During Past 5 Years:
· Chief Executive Officer, www.wowOwow.com an online community dedicated to women’s conversations and publications (2007-present)
· Principal, Joni Evans Ltd. (publishing) (2006-present)
No. of Portfolios for which Board Member Serves: 25
———————
Ehud Houminer (75)
Board Member (2003)
Principal Occupation During Past 5 Years:
· Executive-in-Residence at the Columbia Business School, Columbia
University (1992-present)
Other Public Company Board Memberships During Past 5 Years:
· Avnet, Inc., an electronics distributor, Director (1993-2012)
No. of Portfolios for which Board Member Serves: 62
———————
Hans C. Mautner (77)
Board Member (2003)
Principal Occupation During Past 5 Years:
· President-International Division and an Advisory Director of Simon Property Group, a
real estate investment company (1998-2010)
· Chairman and Chief Executive Officer of Simon Global Limited, a real estate company (1999-2010)
No. of Portfolios for which Board Member Serves: 25
———————
35
BOARD MEMBERS INFORMATION (Unaudited) (continued)
INDEPENDENT BOARD MEMBERS (continued)
Robin A. Melvin (52)
Board Member (2003)
Principal Occupation During Past 5 Years:
· Co-chairman, Illinois Mentoring Partnership, non-profit organization dedicated to increasing the quantity and quality of mentoring services in Illinois; (2014-present; a board member since 2013)
· Director, Boisi Family Foundation, a private family foundation that supports
youth-serving organizations that promote the self sufficiency of youth from
disadvantaged circumstances (1995-2012)
No. of Portfolios for which Board Member Serves: 112
———————
Burton N. Wallack (64)
Board Member (2006)
Principal Occupation During Past 5 Years:
· President and Co-owner of Wallack Management Company, a real estate management
company (1987-present)
No. of Portfolios for which Board Member Serves: 25
———————
36
INTERESTED BOARD MEMBER
Gordon J. Davis (74)
Board Member (2006)
Principal Occupation During Past 5 Years:
· Partner in the law firm of Venable LLP (2012-present)
· Partner in the law firm of Dewey & LeBoeuf LLP (1994-2012)
Other Public Company Board Memberships During Past 5 Years:
· Consolidated Edison, Inc., a utility company, Director (1997-2014)
· The Phoenix Companies, Inc., a life insurance company, Director (2000-2014)
No. of Portfolios for which Board Member Serves: 61
Gordon J. Davis is deemed to be an “interested person” (as defined under the Act) of the Company as a result of his affiliation with Venable LLP, which provides legal services to the Company.
———————
Once elected all Board Members serve for an indefinite term, but achieve Emeritus status upon reaching age 80. The address of the Board Members and Officers is c/o The Dreyfus Corporation, 200 Park Avenue, New York, New York 10166. Additional information about the Board Members is available in the fund's Statement of Additional Information which can be obtained from Dreyfus free of charge by calling this toll free number: 1-800-DREYFUS.
William Hodding Carter III, Emeritus Board Member
Arnold S. Hiatt, Emeritus Board Member
37
OFFICERS OF THE FUND (Unaudited)
BRADLEY J. SKAPYAK, President since January 2010.
Chief Operating Officer and a director of the Manager since June 2009, Chairman of Dreyfus Transfer, Inc., an affiliate of the Manager and the transfer agent of the funds, since May 2011 and Executive Vice President of the Distributor since June 2007. From April 2003 to June 2009, Mr. Skapyak was the head of the Investment Accounting and Support Department of the Manager. He is an officer of 68 investment companies (comprised of 142 portfolios) managed by the Manager. He is 56 years old and has been an employee of the Manager since February 1988.
BENNETT A. MACDOUGALL, Chief Legal Officer since October 2015
Chief Legal Officer of the Manager since June 2015; from June 2005 to June 2015, Director and Associate General Counsel of Deutsche Bank – Asset & Wealth Management Division, and Chief Legal Officer of Deutsche Investment Management Americas Inc. He is an officer of 69 investment companies (comprised of 167 portfolios) managed by the Manager. He is 44 years old and has been an employee of the Manager since June 2015.
JANETTE E. FARRAGHER, Vice President and Secretary since December 2011.
Assistant General Counsel of BNY Mellon, and an officer of 69 investment companies (comprised of 167 portfolios) managed by the Manager. She is 52 years old and has been an employee of the Manager since February 1984.
JAMES BITETTO, Vice President and Assistant Secretary since August 2005.
Managing Counsel of BNY Mellon and Secretary of the Manager, and an officer of 69 investment companies (comprised of 167 portfolios) managed by the Manager. He is 49 years old and has been an employee of the Manager since December 1996.
JONI LACKS CHARATAN, Vice President and Assistant Secretary since August 2005.
Managing Counsel of BNY Mellon, and an officer of 69 investment companies (comprised of 167 portfolios) managed by the Manager. She is 59 years old and has been an employee of the Manager since October 1988.
JOSEPH M. CHIOFFI, Vice President and Assistant Secretary since August 2005.
Managing Counsel of BNY Mellon, and an officer of 69 investment companies (comprised of 167 portfolios) managed by the Manager. He is 53 years old and has been an employee of the Manager since June 2000.
JOHN B. HAMMALIAN, Vice President and Assistant Secretary since August 2005.
Senior Managing Counsel of BNY Mellon, and an officer of 69 investment companies (comprised of 167 portfolios) managed by the Manager. He is 52 years old and has been an employee of the Manager since February 1991.
MAUREEN E. KANE, Vice President and Assistant Secretary since April 2015.
Managing Counsel of BNY Mellon since July 2014; from October 2004 until July 2014, General Counsel, and from May 2009 until July 2014, Chief Compliance Officer of Century Capital Management. She is an officer of 69 investment companies (comprised of 167 portfolios) managed by the Manager. She is 53 years old and has been an employee of the Manager since July 2014.
SARAH S. KELLEHER, Vice President and Assistant Secretary since April 2014.
Senior Counsel of BNY Mellon, and an officer of 69 investment companies (comprised of 167 portfolios) managed by the Manager; from August 2005 to March 2013, Associate General Counsel of Third Avenue Management. She is 40 years old and has been an employee of the Manager since March 2013.
JEFF PRUSNOFSKY, Vice President and Assistant Secretary since August 2005.
Senior Managing Counsel of BNY Mellon, and an officer of 69 investment companies (comprised of 167 portfolios) managed by the Manager. He is 50 years old and has been an employee of the Manager since October 1990.
JAMES WINDELS, Treasurer since November 2001.
Director – Mutual Fund Accounting of the Manager, and an officer of 69 investment companies (comprised of 167 portfolios) managed by the Manager. He is 57 years old and has been an employee of the Manager since April 1985.
38
RICHARD CASSARO, Assistant Treasurer since January 2008.
Senior Accounting Manager – Money Market and Municipal Bond Funds of the Manager, and an officer of 69 investment companies (comprised of 167 portfolios) managed by the Manager. He is 56 years old and has been an employee of the Manager since September 1982.
GAVIN C. REILLY, Assistant Treasurer since December 2005.
Tax Manager of the Investment Accounting and Support Department of the Manager, and an officer of 69 investment companies (comprised of 167 portfolios) managed by the Manager. He is 47 years old and has been an employee of the Manager since April 1991.
ROBERT S. ROBOL, Assistant Treasurer since August 2005.
Senior Accounting Manager – Fixed Income Funds of the Manager, and an officer of 69 investment companies (comprised of 167 portfolios) managed by the Manager. He is 51 years old and has been an employee of the Manager since October 1988.
ROBERT SALVIOLO, Assistant Treasurer since July 2007.
Senior Accounting Manager – Equity Funds of the Manager, and an officer of 69 investment companies (comprised of 167 portfolios) managed by the Manager. He is 48 years old and has been an employee of the Manager since June 1989.
ROBERT SVAGNA, Assistant Treasurer since December 2002.
Senior Accounting Manager – Equity Funds of the Manager, and an officer of 69 investment companies (comprised of 167 portfolios) managed by the Manager. He is 48 years old and has been an employee of the Manager since November 1990.
JOSEPH W. CONNOLLY, Chief Compliance Officer since October 2004.
Chief Compliance Officer of the Manager and The Dreyfus Family of Funds (69 investment companies, comprised of 167 portfolios). He is 58 years old and has served in various capacities with the Manager since 1980, including manager of the firm’s Fund Accounting Department from 1997 through October 2001.
39
NOTES
40
NOTES
41
Dreyfus International Equity Fund
200 Park Avenue
New York, NY 10166
Investment Adviser
The Boston Company
Asset Management, LLC
Mellon Financial Center
One Boston Place
Boston, MA 02108
Administrator
The Dreyfus Corporation
200 Park Avenue
New York, NY 10166
Custodian
The Bank of New York Mellon
225 Liberty Street
New York, NY 10286
Transfer Agent &
Dividend Disbursing Agent
Dreyfus Transfer, Inc.
200 Park Avenue
New York, NY 10166
Distributor
MBSC Securities Corporation
200 Park Avenue
New York, NY 10166
| | |
Ticker Symbols: | Class A: DIEAX Class C: DIECX Class I: DIERX Class Y: DIEYX |
Telephone Call your financial representative or 1-800-DREYFUS
Mail The Dreyfus Family of Funds, 144 Glenn Curtiss Boulevard, Uniondale, NY 11556-0144
E-mail Send your request to info@dreyfus.com
Internet Information can be viewed online or downloaded at www.dreyfus.com
The fund files its complete schedule of portfolio holdings with the Securities and Exchange Commission (“SEC”) for the first and third quarters of each fiscal year on Form N-Q. The fund’s Forms N-Q are available on the SEC’s website at www.sec.gov and may be reviewed and copied at the SEC’s Public Reference Room in Washington, DC. (phone 1-800-SEC-0330 for information).
A description of the policies and procedures that the fund uses to determine how to vote proxies relating to portfolio securities and information regarding how the fund voted these proxies for the most recent 12-month period ended June 30 is available at www.dreyfus.com and on the SEC’s website at www.sec.gov and without charge, upon request, by calling 1-800-DREYFUS.
| | |
© 2015 MBSC Securities Corporation
0720AR0915 | 
|
Dreyfus Small Cap Equity Fund
| | | |
| | ANNUAL REPORT September 30, 2015 |
| |
Save time. Save paper. View your next shareholder report online as soon as it’s available. Log into www.dreyfus.com and sign up for Dreyfus eCommunications. It’s simple and only takes a few minutes. |
| |
The views expressed in this report reflect those of the portfolio manager only through the end of the period covered and do not necessarily represent the views of Dreyfus or any other person in the Dreyfus organization. Any such views are subject to change at any time based upon market or other conditions and Dreyfus disclaims any responsibility to update such views. These views may not be relied on as investment advice and, because investment decisions for a Dreyfus fund are based on numerous factors, may not be relied on as an indication of trading intent on behalf of any Dreyfus fund. |
| |
Not FDIC-Insured • Not Bank-Guaranteed • May Lose Value |
Contents
THE FUND
FOR MORE INFORMATION
Back Cover
| | | | |
| |
Dreyfus Small Cap Equity Fund
| | The Fund |
A LETTER FROM THE PRESIDENT
Dear Shareholder:
We are pleased to present this annual report for Dreyfus Small Cap Equity Fund, covering the 12-month period from October 1, 2014, through September 30, 2015. For information about how the fund performed during the reporting period, as well as general market perspectives, we provide a Discussion of Fund Performance on the pages that follow.
Financial markets proved volatile over the reporting period. For much of the year, a recovering U.S. economy enabled stocks to advance, but those gains were erased during the third quarter of 2015 when economic concerns in China, falling commodity prices, and a stronger U.S. dollar sparked sharp corrections in equity markets throughout the world. The emerging markets were especially hard hit. U.S. bonds generally fared better, rallying in late 2014 before reversing course in the spring as the domestic economy strengthened. Global economic instability sparked a renewed rally among U.S. government securities toward the reporting period’s end, but corporate-backed and inflation-linked securities lost value.
We expect market volatility to persist over the near term as investors vacillate between hopes that current turmoil represents a healthy correction and fears that further disappointments could trigger a full-blown bear market. Our investment strategists and portfolio managers are monitoring developments carefully, keeping a close watch on Chinese fiscal and monetary policy, expectations of higher short-term interest rates in the United States, liquidity factors affecting various asset classes, and other developments that could influence investor sentiment. Over the longer term, we remain confident that markets are likely to stabilize as the world adjusts to slower Chinese economic growth, abundant energy resources, and the eventual normalization of U.S. monetary policy. In our view, investors will continue to be well served under these circumstances by a long-term perspective and a disciplined investment approach.
Thank you for your continued confidence and support.
Sincerely,

J. Charles Cardona
President
The Dreyfus Corporation
October 15, 2015
2
DISCUSSION OF FUND PERFORMANCE
For the period of October 1, 2014, through September 30, 2015, as provided by Joseph M. Corrado, CFA, Stephanie K. Brandaleone, CFA, and Edward R. Walter, CFA, Portfolio Managers
Fund and Market Performance Overview
For the 12-month period ended September 30, 2015, Dreyfus Small Cap Equity Fund’s Class A shares achieved a total return of -0.22%, Class C shares returned -1.03%, and Class I shares returned 0.04%.1 The fund’s benchmark, the Russell 2500 Value Index (the “Index”), achieved a total return of -2.44% for the same period.2
Stocks proved volatile over the reporting period amid shifting economic sentiment. The fund outperformed its benchmark due to the relative success of our security selection strategy in eight of the benchmark’s 10 economic sectors.
The Fund’s Investment Approach
The fund seeks long-term growth of capital. The fund invests, under normal circumstances, at least 80% of its net assets in the stocks of small-cap U.S. companies.
We seek to identify companies with stocks trading at prices below their intrinsic values. We measure value by evaluating each company’s valuation multiples (price/earnings, price/sales, price/cash flow), current competitive position, and expected business growth relative to its industry. We focus primarily on individual stock selection to produce a diversified portfolio of companies that we believe are undervalued relative to expected business growth, with the presence of a catalyst (such as a corporate restructuring, change in management, or spin-off) that may trigger a price increase.
Global Economic Concerns Sparked Market Volatility
The Russell 2500 Value Index encountered elevated levels of short-term market volatility on its way to posting a negative total return over the reporting period. October 2014 began in the midst of a market downturn across all capitalization ranges, but U.S. employment gains, better consumer confidence, and improved business sentiment prompted a quick market recovery. Consequently, some broad market indices climbed to record highs through the end of February 2015. The rally paused in March amid sluggish U.S. economic growth stemming from severe winter weather and an appreciating U.S. dollar. However, the domestic economy regained traction in the spring, and stocks advanced until economic uncertainty in Greece and China again sent U.S. stock prices lower during the third quarter of 2015.
In this tumultuous environment, small-cap stocks generally produced higher returns than their large- and midcap counterparts, but value-oriented stocks underperformed more growth-oriented companies, on average.
Strong Security Selections Bolstered Fund Results
The fund’s performance compared to the Russell 2500 Value Index over the reporting period was bolstered by successful security selections in most of the market sectors represented in the benchmark. Most notably, top performers in the industrials sector included transportation provider Alaska Air Group, which reported better-than-expected earnings supported by effective cost-control strategies. Tool manufacturer Snap-on advanced on the strength of higher revenues stemming from the introduction of new
3
DISCUSSION OF FUND PERFORMANCE (continued)
products. Agricultural equipment maker AGCO defied industry headwinds by achieving quarterly financial results that exceeded analysts’ expectations. The fund also benefited from underweighted exposure to hard-hit exploration-and-production companies in the energy sector, which ranked as the benchmark’s weakest segment over the reporting period.
In the information technology sector, communications and media software developer Amdocs gained value due to consistent growth and expanding profit margins. Software-as-a-service provider Acxiom reported positive sales momentum in its legacy data and analytics businesses. Cybersecurity software developer NICE-Systems reported better-than-expected earnings due to robust organic growth and stronger profit margins, and fiber lasers manufacturer IPG Photonics achieved strong order volumes across its various business markets. Results in the health care sector were buoyed by intensifying mergers-and-acquisitions activity, as takeover speculation supported gains in government-sponsored health care provider Centene, pharmaceutical management company Omnicare was acquired by CVS Health, and Horizon Pharma bought Hyperion Therapeutics.
On the other hand, the fund trailed market averages in two of the benchmark’s economic sectors. Falling commodity and energy prices presented challenges for holdings in the materials sector, such as steelmaker TimkenSteel and palladium producer Stillwater Mining. Results in the financial sector were undermined by underweighted exposure to better performing real estate investment trusts and insurance companies. In other areas, oil well servicing contractor Key Energy Services experienced production problems in its Mexico operations, and Flotek Industries was hurt by waning demand for the chemicals used in hydraulic fracturing.
A Constructive Investment Posture
As we enter the close of the year, volatility will likely continue to impact equities as they try to find more solid footing. Above all, it is important to remember that fundamentals for both U.S. companies and the overall U.S. economy remain solid. Despite this, investors continue to grapple with concerns over global growth, especially regarding China and Europe, as well as escalating geo-political risks (such Syria, Ukraine, and Iran) and importantly, the highly anticipated but yet-to-materialize Federal Reserve interest rate hike. The lack of clarity on those fronts continues to keep the markets off-balance. Despite this, our research driven process has led us to a number of areas in the market that are well positioned to experience positive tailwinds looking forward. While volatility is likely to persist throughout the remainder of the year, we believe that equities should be supported by positive seasonal influences, relatively healthier economic conditions, and solid corporate underpinnings.
Within this environment, we continue to find attractive opportunities in the Information Technology, Consumer Discretionary and Health Care sectors, which are emphasized in the portfolio with overweight positions versus the index. Conversely, we have maintained underweight exposure to the REITs and Insurance segments, where we have found fewer opportunities meeting our investment criteria.
October 15, 2015
Please note, the position in any security highlighted with italicized typeface was sold during the reporting period.
Equity funds are subject generally to market, market sector, market liquidity, issuer, and investment style risks, among other factors, to varying degrees, all of which are more fully described in the fund’s prospectus.
4
Small companies carry additional risks because their earnings and revenues tend to be less predictable, and their share prices more volatile than those of larger, more established companies.
1 Total return includes reinvestment of dividends and any capital gains paid, and does not take into consideration the maximum initial sales charge in the case of Class A shares, or the applicable contingent deferred sales charge imposed on redemptions in the case of Class C shares. Had these charges been reflected, returns would have been lower. Past performance is no guarantee of future results. Share price and investment return fluctuate such that upon redemption, fund shares may be worth more or less than their original cost. Return figures provided reflect the absorption of certain fund expenses by The Dreyfus Corporation and The Boston Company Asset Management, LLC. Had these expenses not been absorbed, returns would have been lower.
2 SOURCE: LIPPER INC. — Reflects the reinvestment of dividends and, where applicable, capital gain distributions. The Russell 2500 Value Index is a widely accepted, unmanaged index, which measures the performance of those Russell 2500 companies with lower price-to-book ratios and lower forecasted growth values.
5
FUND PERFORMANCE
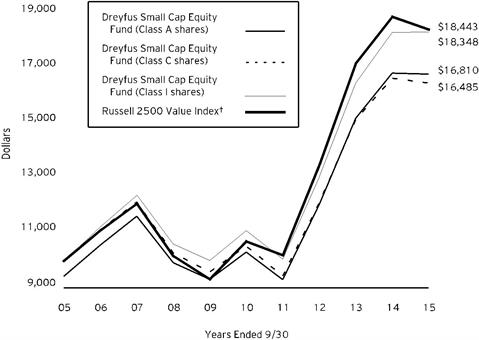
Comparison of change in value of $10,000 investment in Dreyfus Small Cap Equity Fund Class A shares, Class C shares and Class I shares with the Russell 2500 Value Index
† Source: Lipper Inc.
Past performance is not predictive of future performance.
The above graph compares a $10,000 investment made in each of the Class A, Class C and Class I shares of Dreyfus Small Cap Equity Fund on 9/30/05 to a $10,000 investment made in the Russell 2500 Value Index (the “Index”) on that date. All dividends and capital gain distributions are reinvested.
Prior to 8/1/07, the fund invested its assets in a "master portfolio" that had the same investment objective and policies as the fund. This master/feeder arrangement was terminated on 8/1/07 and the fund operates as a stand alone fund.
The fund’s performance shown in the line graph above takes into account the maximum initial sales charge on Class A shares and all other applicable fees and expenses on all classes. The Index is an unmanaged index which measures the performance of those Russell 2500 companies with lower price-to-book ratios and lower forecasted growth values. Unlike a mutual fund, the Index is not subject to charges, fees and other expenses. Investors cannot invest directly in any index. Further information relating to fund performance, including expense reimbursements, if applicable, is contained in the Financial Highlights section of the prospectus and elsewhere in this report.
6
| | | | |
Average Annual Total Returns as of 9/30/15 | | | |
| 1 Year | 5 Years | 10 Years |
Class A shares | | | |
with maximum sales charge (5.75%) | -5.96% | 8.96% | 5.33% |
without sales charge | -0.22% | 10.26% | 5.96% |
Class C shares | | | |
with applicable redemption charge † | -1.83% | 9.36% | 5.13% |
without redemption | -1.03% | 9.36% | 5.13% |
Class I shares | 0.04% | 10.55% | 6.26% |
Russell 2500 Value Index | -2.44% | 11.49% | 6.31% |
Past performance is not predictive of future performance. The fund’s performance shown in the graph and table does not reflect the deduction of taxes that a shareholder would pay on fund distributions or the redemption of fund shares. In addition to the performance of Class A shares shown with and without a maximum sales charge, the fund’s performance shown in the table takes into account all other applicable fees and expenses on all classes.
† The maximum contingent deferred sales charge for Class C shares is 1% for shares redeemed within one year of the date of purchase.
7
UNDERSTANDING YOUR FUND’S EXPENSES (Unaudited)
As a mutual fund investor, you pay ongoing expenses, such as management fees and other expenses. Using the information below, you can estimate how these expenses affect your investment and compare them with the expenses of other funds. You also may pay one-time transaction expenses, including sales charges (loads) and redemption fees, which are not shown in this section and would have resulted in higher total expenses. For more information, see your fund’s prospectus or talk to your financial adviser.
Review your fund’s expenses
The table below shows the expenses you would have paid on a $1,000 investment in Dreyfus Small Cap Equity Fund from April 1, 2015 to September 30, 2015. It also shows how much a $1,000 investment would be worth at the close of the period, assuming actual returns and expenses.
| | | | | | | | | | | | | | | |
Expenses and Value of a $1,000 Investment | | |
assuming actual returns for the six months ended September 30, 2015 |
| | | | Class A | | Class C | | Class I | |
Expenses paid per $1,000† | | | $6.61 | | | $10.53 | | | $5.09 | |
Ending value (after expenses) | | | $895.60 | | | $891.90 | | | $896.70 | |
COMPARING YOUR FUND’S EXPENSES
WITH THOSE OF OTHER FUNDS (Unaudited)
Using the SEC’s method to compare expenses
The Securities and Exchange Commission (SEC) has established guidelines to help investors assess fund expenses. Per these guidelines, the table below shows your fund’s expenses based on a $1,000 investment, assuming a hypothetical 5% annualized return. You can use this information to compare the ongoing expenses (but not transaction expenses or total cost) of investing in the fund with those of other funds. All mutual fund shareholder reports will provide this information to help you make this comparison. Please note that you cannot use this information to estimate your actual ending account balance and expenses paid during the period.
| | | | | | | | | | | | | | | | |
Expenses and Value of a $1,000 Investment | | | |
assuming a hypothetical 5% annualized return for the six months ended September 30, 2015 |
| | | | | Class A | | Class C | | Class I | |
Expenses paid per $1,000† | | | | $7.03 | | | $11.21 | | | $5.42 | |
Ending value (after expenses) | | | | $1,018.10 | | | $1,013.94 | | | $1,019.70 | |
† Expenses are equal to the fund's annualized expense ratio of 1.39% for Class A, 2.22% for Class C and 1.07% for Class I, multiplied by the average account value over the period, multiplied by 183/365 (to reflect the one-half year period).
8
STATEMENT OF INVESTMENTS
September 30, 2015
| | | | | | | | | |
Common Stocks - 98.6% | | Shares | | Value ($) | |
Banks - 11.3% | | | | | |
Bank of Hawaii | | 15,469 | | 982,127 | |
Boston Private Financial Holdings | | 39,617 | | 463,519 | |
First Horizon National | | 66,189 | a | 938,560 | |
First Republic Bank | | 15,330 | | 962,264 | |
SVB Financial Group | | 6,503 | b | 751,357 | |
Synovus Financial | | 41,194 | | 1,219,342 | |
Webster Financial | | 29,102 | | 1,036,904 | |
| | | | | 6,354,073 | |
Capital Goods - 5.7% | | | | | |
AGCO | | 15,067 | a | 702,574 | |
Carlisle | | 10,385 | | 907,441 | |
Chart Industries | | 13,604 | b | 261,333 | |
Snap-on | | 7,191 | | 1,085,410 | |
Timken | | 8,837 | | 242,929 | |
| | | | | 3,199,687 | |
Commercial & Professional Services - 4.8% | | | | | |
Advisory Board | | 16,996 | b | 773,998 | |
Clean Harbors | | 15,869 | b | 697,760 | |
Herman Miller | | 22,122 | | 637,998 | |
Towers Watson & Co., Cl. A | | 4,947 | | 580,679 | |
| | | | | 2,690,435 | |
Consumer Durables & Apparel - 1.3% | | | | | |
Toll Brothers | | 21,395 | b | 732,565 | |
Consumer Services - 5.2% | | | | | |
Cheesecake Factory | | 18,579 | | 1,002,523 | |
Grand Canyon Education | | 21,278 | b | 808,351 | |
Service Corporation International | | 41,250 | | 1,117,875 | |
| | | | | 2,928,749 | |
Diversified Financials - 3.3% | | | | | |
E*TRADE Financial | | 37,285 | b | 981,714 | |
Raymond James Financial | | 17,841 | | 885,449 | |
| | | | | 1,867,163 | |
Energy - 5.9% | | | | | |
Dril-Quip | | 11,445 | b | 666,328 | |
Energen | | 17,514 | | 873,248 | |
Oceaneering International | | 16,634 | | 653,384 | |
Oil States International | | 22,882 | b | 597,907 | |
RPC | | 58,152 | a | 514,645 | |
| | | | | 3,305,512 | |
9
STATEMENT OF INVESTMENTS (continued)
| | | | | | | | | | | |
Common Stocks - 98.6% (continued) | | Shares | | Value ($) | |
Exchange-Traded Funds - 1.2% | | | | | |
iShares Russell 2000 Value ETF | | 7,735 | | 696,923 | |
Food & Staples Retailing - 3.2% | | | | | |
Casey's General Stores | | 11,798 | | 1,214,250 | |
United Natural Foods | | 12,401 | a,b | 601,573 | |
| | | | | 1,815,823 | |
Health Care Equipment & Services - 8.3% | | | | | |
Air Methods | | 19,591 | a,b | 667,857 | |
Globus Medical, Cl. A | | 22,101 | b | 456,607 | |
Hanger | | 6,129 | b | 83,600 | |
HealthSouth | | 17,725 | | 680,108 | |
LifePoint Health | | 12,788 | b | 906,669 | |
MEDNAX | | 14,278 | b | 1,096,408 | |
WellCare Health Plans | | 9,090 | b | 783,376 | |
| | | | | 4,674,625 | |
Insurance - 1.8% | | | | | |
First American Financial | | 26,413 | | 1,031,956 | |
Materials - .8% | | | | | |
Stillwater Mining | | 23,378 | b | 241,495 | |
TimkenSteel | | 20,519 | | 207,652 | |
| | | | | 449,147 | |
Media - 2.5% | | | | | |
E.W. Scripps, Cl. A | | 38,182 | | 674,676 | |
New York Times, Cl. A | | 62,763 | | 741,231 | |
| | | | | 1,415,907 | |
Pharmaceuticals, Biotechnology & Life Sciences - .6% | | | | | |
Horizon Pharma | | 17,776 | b | 352,320 | |
Real Estate - 8.3% | | | | | |
Alexandria Real Estate Equities | | 8,470 | c | 717,155 | |
Brixmor Property Group | | 25,570 | c | 600,384 | |
Corrections Corporation of America | | 22,628 | c | 668,431 | |
CyrusOne | | 21,490 | c | 701,863 | |
EPR Properties | | 14,182 | c | 731,366 | |
Healthcare Trust of America, Cl. A | | 27,331 | | 669,883 | |
Kite Realty Group Trust | | 23,911 | | 569,321 | |
| | | | | 4,658,403 | |
Retailing - 7.4% | | | | | |
American Eagle Outfitters | | 66,189 | a | 1,034,534 | |
Dick's Sporting Goods | | 16,259 | | 806,609 | |
Guess? | | 25,909 | a | 553,416 | |
Staples | | 56,433 | | 661,959 | |
10
| | | | | | | | | | | | | | |
Common Stocks - 98.6% (continued) | | Shares | | Value ($) | |
Retailing - 7.4% (continued) | | | | | |
Urban Outfitters | | 25,296 | b | 743,196 | |
Vitamin Shoppe | | 11,736 | b | 383,063 | |
| | | | | 4,182,777 | |
Semiconductors & Semiconductor Equipment - 2.2% | | | | | |
First Solar | | 10,871 | b | 464,735 | |
Teradyne | | 43,116 | | 776,519 | |
| | | | | 1,241,254 | |
Software & Services - 10.8% | | | | | |
Acxiom | | 30,357 | b | 599,854 | |
Amdocs | | 17,218 | | 979,360 | |
CoreLogic | | 30,020 | b | 1,117,645 | |
Monotype Imaging Holdings | | 10,776 | | 235,132 | |
PTC | | 17,313 | b | 549,515 | |
Synchronoss Technologies | | 12,050 | a,b | 395,240 | |
Synopsys | | 19,877 | b | 917,920 | |
TiVo | | 74,222 | b | 642,763 | |
VeriFone Systems | | 23,842 | b | 661,139 | |
| | | | | 6,098,568 | |
Technology Hardware & Equipment - 3.4% | | | | | |
Electronics For Imaging | | 15,099 | b | 653,485 | |
IPG Photonics | | 6,865 | a,b | 521,534 | |
National Instruments | | 27,827 | | 773,312 | |
| | | | | 1,948,331 | |
Transportation - 4.2% | | | | | |
Alaska Air Group | | 10,866 | | 863,304 | |
Kirby | | 9,014 | b | 558,417 | |
Knight Transportation | | 11,750 | | 282,000 | |
Ryder System | | 9,034 | | 668,877 | |
| | | | | 2,372,598 | |
Utilities - 6.4% | | | | | |
Atmos Energy | | 15,330 | | 891,899 | |
CMS Energy | | 25,489 | | 900,271 | |
NiSource | | 50,041 | | 928,261 | |
Portland General Electric | | 24,321 | | 899,147 | |
| | | | | 3,619,578 | |
Total Common Stocks (cost $49,306,747) | | | | 55,636,394 | |
Other Investments - .6% | | | | | |
Registered Investment Company; | | | | | |
Dreyfus Institutional Preferred Plus Money Market Fund
(cost $361,453) | | 361,453 | d | 361,453 | |
| | | | | |
11
STATEMENT OF INVESTMENTS (continued)
| | | | | | | | | |
Investment of Cash Collateral for Securities Loaned - 2.2% | | Shares | | Value ($) | |
Registered Investment Company; | | | | | |
Dreyfus Institutional Cash Advantage Fund | | 1,261,045 | d | 1,261,045 | |
(cost $1,261,045) | | | | | |
Total Investments (cost $50,929,245) | | 101.4% | | 57,258,892 | |
Liabilities, Less Cash and Receivables | | (1.4%) | | (813,050) | |
Net Assets | | 100.0% | | 56,445,842 | |
ETF—Exchange-Traded Fund
a Security, or portion thereof, on loan. At September 30, 2015, the value of the fund's securities on loan was $5,642,111 and the value of the collateral held by the fund was $5,780,127, consisting of cash collateral of $1,261,045 and U.S. Government & Agency securities valued at $4,519,082.
b Non-income producing security.
c Investment in real estate investment trust.
d Investment in affiliated money market mutual fund.
| | |
Portfolio Summary (Unaudited) † | Value (%) |
Banks | 11.3 |
Software & Services | 10.8 |
Health Care Equipment & Services | 8.3 |
Real Estate | 8.3 |
Retailing | 7.4 |
Utilities | 6.4 |
Energy | 5.9 |
Capital Goods | 5.7 |
Consumer Services | 5.2 |
Commercial & Professional Services | 4.8 |
Transportation | 4.2 |
Technology Hardware & Equipment | 3.4 |
Diversified Financials | 3.3 |
Food & Staples Retailing | 3.2 |
Money Market Investments | 2.8 |
Media | 2.5 |
Semiconductors & Semiconductor Equipment | 2.2 |
Insurance | 1.8 |
Consumer Durables & Apparel | 1.3 |
Exchange-Traded Funds | 1.2 |
Materials | .8 |
Pharmaceuticals, Biotechnology & Life Sciences | .6 |
| | 101.4 |
†Based on net assets.
See notes to financial statements.
12
STATEMENT OF ASSETS AND LIABILITIES
September 30, 2015
| | | | | | | |
| | | Cost | | Value | |
Assets ($): | | | | |
Investments in securities—See Statement of Investments
(including securities on loan, valued at $5,642,111)—Note 1(b): | | | | | |
Unaffiliated issuers | | 49,306,747 | | 55,636,394 | |
Affiliated issuers | | 1,622,498 | | 1,622,498 | |
Cash | | | | | 36,636 | |
Receivable for investment securities sold | | | | | 681,481 | |
Receivable for shares of Beneficial Interest subscribed | | | | | 250,341 | |
Dividends and securities lending income receivable | | | | | 80,319 | |
Prepaid expenses | | | | | 18,694 | |
| | | | | 58,326,363 | |
Liabilities ($): | | | | |
Due to The Boston Company Asset
Management, LLC and affiliates—Note 3(c) | | | | | 70,879 | |
Liability for securities on loan—Note 1(b) | | | | | 1,261,045 | |
Payable for investment securities purchased | | | | | 444,067 | |
Payable for shares of Beneficial Interest redeemed | | | | | 21,171 | |
Accrued expenses | | | | | 83,359 | |
| | | | | 1,880,521 | |
Net Assets ($) | | | 56,445,842 | |
Composition of Net Assets ($): | | | | |
Paid-in capital | | | | | 43,155,048 | |
Accumulated investment (loss)—net | | | | | (92,442) | |
Accumulated net realized gain (loss) on investments | | | | | 7,053,589 | |
Accumulated net unrealized appreciation (depreciation)
on investments | | | | | 6,329,647 | |
Net Assets ($) | | | 56,445,842 | |
| | | | | |
Net Asset Value Per Share | Class A | Class C | Class I | |
Net Assets ($) | 40,051,720 | 8,388,513 | 8,005,609 | |
Shares Outstanding | 1,576,908 | 383,806 | 302,157 | |
Net Asset Value Per Share ($) | 25.40 | 21.86 | 26.49 | |
See notes to financial statements.
13
STATEMENT OF OPERATIONS
Year Ended September 30, 2015
| | | | | | | |
| | | | | | |
| | | | | | |
Investment Income ($): | | | | |
Income: | | | | |
Cash dividends (net of $1,552 foreign taxes withheld at source): | | | | |
Unaffiliated issuers | | | 895,031 | |
Affiliated issuers | | | 726 | |
Income from securities lending—Note 1(b) | | | 12,727 | |
Total Income | | | 908,484 | |
Expenses: | | | | |
Investment advisory fee—Note 3(a) | | | 556,360 | |
Shareholder servicing costs—Note 3(c) | | | 236,933 | |
Distribution fees—Note 3(b) | | | 73,260 | |
Administration fee—Note 3(a) | | | 69,545 | |
Professional fees | | | 54,804 | |
Registration fees | | | 47,635 | |
Custodian fees—Note 3(c) | | | 21,630 | |
Prospectus and shareholders’ reports | | | 18,261 | |
Trustees' fees and expenses—Note 3(d) | | | 5,282 | |
Interest expense—Note 2 | | | 855 | |
Loan commitment fees—Note 2 | | | 808 | |
Miscellaneous | | | 22,959 | |
Total Expenses | | | 1,108,332 | |
Less—reduction in expenses due to undertaking—Note 3(a) | | | (99,209) | |
Less—reduction in fees due to earnings credits—Note 3(c) | | | (52) | |
Net Expenses | | | 1,009,071 | |
Investment (Loss)—Net | | | (100,587) | |
Realized and Unrealized Gain (Loss) on Investments—Note 4 ($): | | |
Net realized gain (loss) on investments | 13,460,693 | |
Net unrealized appreciation (depreciation) on investments | | | (11,457,815) | |
Net Realized and Unrealized Gain (Loss) on Investments | | | 2,002,878 | |
Net Increase in Net Assets Resulting from Operations | | 1,902,291 | |
See notes to financial statements.
14
STATEMENT OF CHANGES IN NET ASSETS
| | | | | | | | | | |
| | | | | | | | | | |
| | | | Year Ended September 30, |
| | | | 2015 | | | | 2014 | |
Operations ($): | | | | | | | | |
Investment (loss)—net | | | (100,587) | | | | (151,377) | |
Net realized gain (loss) on investments | | 13,460,693 | | | | 17,220,861 | |
Net unrealized appreciation (depreciation)
on investments | | (11,457,815) | | | | (6,903,038) | |
Net Increase (Decrease) in Net Assets
Resulting from Operations | 1,902,291 | | | | 10,166,446 | |
Dividends to Shareholders from ($): | | | | | | | | |
Net realized gain on investments: | | | | | | | | |
Class A | | | (7,432,954) | | | | (4,429,462) | |
Class C | | | (1,908,706) | | | | (1,127,969) | |
Class I | | | (5,413,624) | | | | (3,232,986) | |
Total Dividends | | | (14,755,284) | | | | (8,790,417) | |
Beneficial Interest Transactions ($): | | | | | | | | |
Net proceeds from shares sold: | | | | | | | | |
Class A | | | 4,773,414 | | | | 4,657,435 | |
Class C | | | 558,873 | | | | 434,389 | |
Class I | | | 8,833,267 | | | | 9,167,652 | |
Dividends reinvested: | | | | | | | | |
Class A | | | 7,113,496 | | | | 4,213,328 | |
Class C | | | 1,622,806 | | | | 941,207 | |
Class I | | | 5,305,905 | | | | 3,202,021 | |
Cost of shares redeemed: | | | | | | | | |
Class A | | | (8,642,340) | | | | (12,666,603) | |
Class C | | | (1,872,570) | | | | (2,362,196) | |
Class I | | | (38,980,862) | | | | (20,987,246) | |
Increase (Decrease) in Net Assets
from Beneficial Interest Transactions | (21,288,011) | | | | (13,400,013) | |
Total Increase (Decrease) in Net Assets | (34,141,004) | | | | (12,023,984) | |
Net Assets ($): | | | | | | | | |
Beginning of Period | | | 90,586,846 | | | | 102,610,830 | |
End of Period | | | 56,445,842 | | | | 90,586,846 | |
Accumulated investment (loss)—net | (92,442) | | | | - | |
Capital Share Transactions (Shares): | | | | | | | | |
Class A | | | | | | | | |
Shares sold | | | 169,505 | | | | 150,035 | |
Shares issued for dividends reinvested | | | 277,221 | | | | 144,589 | |
Shares redeemed | | | (306,035) | | | | (408,176) | |
Net Increase (Decrease) in Shares Outstanding | 140,691 | | | | (113,552) | |
Class C | | | | | | | | |
Shares sold | | | 23,705 | | | | 16,094 | |
Shares issued for dividends reinvested | | | 72,982 | | | | 36,020 | |
Shares redeemed | | | (76,570) | | | | (85,743) | |
Net Increase (Decrease) in Shares Outstanding | 20,117 | | | | (33,629) | |
Class I | | | | | | | | |
Shares sold | | | 296,386 | | | | 285,216 | |
Shares issued for dividends reinvested | | | 198,825 | | | | 106,521 | |
Shares redeemed | | | (1,338,733) | | | | (651,858) | |
Net Increase (Decrease) in Shares Outstanding | (843,522) | | | | (260,121) | |
See notes to financial statements.
15
FINANCIAL HIGHLIGHTS
The following tables describe the performance for each share class for the fiscal periods indicated. All information (except portfolio turnover rate) reflects financial results for a single fund share. Total return shows how much your investment in the fund would have increased (or decreased) during each period, assuming you had reinvested all dividends and distributions. These figures have been derived from the fund’s financial statements.
| | | | | | | | |
| | | | | |
| | Year Ended September 30, |
Class A Shares | | 2015 | | 2014 | 2013 | 2012 | 2011 |
Per Share Data ($): | | | | | | |
Net asset value, beginning of period | 30.77 | | 30.58 | 26.65 | 22.79 | 25.23 |
Investment Operations: | | | | | | |
Investment income (loss)—neta | (.02) | | (.05) | .01 | .05 | (.01) |
Net realized and unrealized gain (loss) on investments | (.01) | b | 3.20 | 6.32 | 6.26 | (2.43) |
Total from Investment Operations | (.03) | | 3.15 | 6.33 | 6.31 | (2.44) |
Distributions: | | | | | | |
Dividends from investment income—net | — | | — | (.06) | — | — |
Dividends from net realized gain on investments | (5.34) | | (2.96) | (2.34) | (2.45) | — |
Total Distributions | (5.34) | | (2.96) | (2.40) | (2.45) | — |
Net asset value, end of period | 25.40 | | 30.77 | 30.58 | 26.65 | 22.79 |
Total Return (%)c | (.22) | | 10.85 | 26.08 | 29.39 | (9.67) |
Ratios/Supplemental Data (%): | | | | | |
Ratio of total expenses to average net assets | 1.55 | | 1.48 | 1.53 | 1.57 | 1.49 |
Ratio of net expenses to average net assets | 1.39 | | 1.39 | 1.39 | 1.40 | 1.39 |
Ratio of net investment income (loss) to average net assets | (.08) | | (.16) | .03 | .21 | (.05) |
Portfolio Turnover Rate | 77.01 | | 66.65 | 76.40 | 93.40 | 76.95 |
Net Assets, end of period ($ x 1,000) | 40,052 | | 44,191 | 47,394 | 45,806 | 45,048 |
a Based on average shares outstanding.
b In addition to net realized and unrealized gains on investments as set forth in the Statement of Operations, this amount includes a decrease in net asset value per share resulting from the timing of issuances and redemptions of shares in relation to fluctuating market values for the portfolio investments.
c Exclusive of sales charge.
See notes to financial statements.
16
| | | | | | | | |
| | | | | |
| | Year Ended September 30, |
Class C Shares | | 2015 | | 2014 | 2013 | 2012 | 2011 |
Per Share Data ($): | | | | | | |
Net asset value, beginning of period | 27.41 | | 27.76 | 24.55 | 21.33 | 23.80 |
Investment Operations: | | | | | | |
Investment (loss)—neta | (.22) | | (.27) | (.20) | (.15) | (.22) |
Net realized and unrealized gain (loss) on investments | .01 | | 2.88 | 5.75 | 5.82 | (2.25) |
Total from Investment Operations | (.21) | | 2.61 | 5.55 | 5.67 | (2.47) |
Distributions: | | | | | | |
Dividends from net realized gain on investments | (5.34) | | (2.96) | (2.34) | (2.45) | — |
Net asset value, end of period | 21.86 | | 27.41 | 27.76 | 24.55 | 21.33 |
Total Return (%)b | (1.03) | | 9.93 | 25.05 | 28.31 | (10.38) |
Ratios/Supplemental Data (%): | | | | | |
Ratio of total expenses to average net assets | 2.31 | | 2.23 | 2.28 | 2.31 | 2.19 |
Ratio of net expenses to average net assets | 2.22 | | 2.21 | 2.22 | 2.22 | 2.17 |
Ratio of net investment (loss) to average net assets | (.91) | | (.98) | (.80) | (.62) | (.84) |
Portfolio Turnover Rate | 77.01 | | 66.65 | 76.40 | 93.40 | 76.95 |
Net Assets, end of period ($ x 1,000) | 8,389 | | 9,969 | 11,029 | 10,855 | 10,632 |
a Based on average shares outstanding.
b Exclusive of sales charge.
See notes to financial statements.
17
FINANCIAL HIGHLIGHTS (continued)
| | | | | | | | | |
| | | | | |
| | Year Ended September 30, |
Class I Shares | | 2015 | 2014 | 2013 | 2012 | 2011 | |
Per Share Data ($): | | | | | | | |
Net asset value, beginning of period | 31.79 | 31.43 | 27.34 | 23.29 | 25.71 | |
Investment Operations: | | | | | | | |
Investment income—neta | .04 | .02 | .08 | .12 | .06 | |
Net realized and unrealized gain (loss) on investments | .00b | 3.30 | 6.49 | 6.42 | (2.48) | |
Total from Investment Operations | .04 | 3.32 | 6.57 | 6.54 | (2.42) | |
Distributions: | | | | | | | |
Dividends from investment income—net | — | — | (.14) | (.04) | (.00) | b |
Dividends from net realized gain on investments | (5.34) | (2.96) | (2.34) | (2.45) | — | |
Total Distributions | (5.34) | (2.96) | (2.48) | (2.49) | (.00) | b |
Net asset value, end of period | 26.49 | 31.79 | 31.43 | 27.34 | 23.29 | |
Total Return (%) | .04 | 11.11 | 26.35 | 29.80 | (9.41) | |
Ratios/Supplemental Data (%): | | | | | | |
Ratio of total expenses to average net assets | 1.26 | 1.16 | 1.27 | 1.24 | 1.28 | |
Ratio of net expenses to average net assets | 1.14 | 1.14 | 1.15 | 1.08 | 1.13 | |
Ratio of net investment income to average net assets | .14 | .08 | .27 | .47 | .22 | |
Portfolio Turnover Rate | 77.01 | 66.65 | 76.40 | 93.40 | 76.95 | |
Net Assets, end of period ($ x 1,000) | 8,006 | 36,427 | 44,188 | 49,552 | 90,251 | |
a Based on average shares outstanding.
b Amount represents less than $.01 per share.
See notes to financial statements.
18
NOTES TO FINANCIAL STATEMENTS
NOTE 1—Significant Accounting Policies:
Dreyfus Small Cap Equity Fund (the “fund”) is a separate diversified series of Dreyfus Stock Funds (the “Company”), which is registered under the Investment Company Act of 1940, as amended (the “Act”), as an open-end management investment company and operates as a series company currently offering three series, including the fund. The fund’s investment objective is to seek long-term growth of capital. The Boston Company Asset Management, LLC (“TBCAM”), a wholly-owned subsidiary of The Bank of New York Mellon Corporation (“BNY Mellon”), serves as the fund’s investment adviser. The Dreyfus Corporation (the “Administrator” or “Dreyfus”), a wholly-owned subsidiary of BNY Mellon and an affiliate of TBCAM, serves as the fund’s Administrator.
MBSC Securities Corporation (the “Distributor”), a wholly-owned subsidiary of Dreyfus, is the distributor of the fund’s shares. The fund is authorized to issue an unlimited number of $.001 par value shares of Beneficial Interest in each of the following classes of shares: Class A, Class C and Class I. Class A shares generally are subject to a sales charge imposed at the time of purchase. Class C shares are subject to a contingent deferred sales charge (“CDSC”) imposed on Class C shares redeemed within one year of purchase. Class I shares are sold at net asset value per share generally to institutional investors. Other differences between the classes include the services offered to and the expenses borne by each class, the allocation of certain transfer agency costs, and certain voting rights. Income, expenses (other than expenses attributable to a specific class), and realized and unrealized gains or losses on investments are allocated to each class of shares based on its relative net assets.
The Company accounts separately for the assets, liabilities and operations of each series. Expenses directly attributable to each series are charged to that series’ operations; expenses which are applicable to all series are allocated among them on a pro rata basis.
The Financial Accounting Standards Board (“FASB”) Accounting Standards Codification (“ASC”) is the exclusive reference of authoritative U.S. generally accepted accounting principles (“GAAP”) recognized by the FASB to be applied by nongovernmental entities. Rules and interpretive releases of the Securities and Exchange Commission (“SEC”) under authority of federal laws are also sources of authoritative GAAP for SEC registrants. The fund’s financial statements are prepared in accordance with GAAP, which may require the use of management estimates and assumptions. Actual results could differ from those estimates.
19
NOTES TO FINANCIAL STATEMENTS (continued)
The Company enters into contracts that contain a variety of indemnifications. The fund’s maximum exposure under these arrangements is unknown. The fund does not anticipate recognizing any loss related to these arrangements.
(a) Portfolio valuation: The fair value of a financial instrument is the amount that would be received to sell an asset or paid to transfer a liability in an orderly transaction between market participants at the measurement date (i.e., the exit price). GAAP establishes a fair value hierarchy that prioritizes the inputs of valuation techniques used to measure fair value. This hierarchy gives the highest priority to unadjusted quoted prices in active markets for identical assets or liabilities (Level 1 measurements) and the lowest priority to unobservable inputs (Level 3 measurements).
Additionally, GAAP provides guidance on determining whether the volume and activity in a market has decreased significantly and whether such a decrease in activity results in transactions that are not orderly. GAAP requires enhanced disclosures around valuation inputs and techniques used during annual and interim periods.
Various inputs are used in determining the value of the fund’s investments relating to fair value measurements. These inputs are summarized in the three broad levels listed below:
Level 1—unadjusted quoted prices in active markets for identical investments.
Level 2—other significant observable inputs (including quoted prices for similar investments, interest rates, prepayment speeds, credit risk, etc.).
Level 3—significant unobservable inputs (including the fund’s own assumptions in determining the fair value of investments).
The inputs or methodology used for valuing securities are not necessarily an indication of the risk associated with investing in those securities.
Changes in valuation techniques may result in transfers in or out of an assigned level within the disclosure hierarchy. Valuation techniques used to value the fund’s investments are as follows:
Investments in securities are valued at the last sales price on the securities exchange or national securities market on which such securities are primarily traded. Securities listed on the National Market System for which market quotations are available are valued at the official closing price or, if there is no official closing price that day, at the last sales price. For open short positions, asked prices are used for valuation purposes. Bid price is
20
used when no asked price is available. Registered investment companies that are not traded on an exchange are valued at their net asset value. All of the preceding securities are generally categorized within Level 1 of the fair value hierarchy.
Securities not listed on an exchange or the national securities market, or securities for which there were no transactions, are valued at the average of the most recent bid and asked prices. These securities are generally categorized within Level 2 of the fair value hierarchy.
Fair valuing of securities may be determined with the assistance of a pricing service using calculations based on indices of domestic securities and other appropriate indicators, such as prices of relevant American Depository Receipts and financial futures. Utilizing these techniques may result in transfers between Level 1 and Level 2 of the fair value hierarchy.
When market quotations or official closing prices are not readily available, or are determined not to reflect accurately fair value, such as when the value of a security has been significantly affected by events after the close of the exchange or market on which the security is principally traded (for example, a foreign exchange or market), but before the fund calculates its net asset value, the fund may value these investments at fair value as determined in accordance with the procedures approved by the Company’s Board of Trustees (the “Board”). Certain factors may be considered when fair valuing investments such as: fundamental analytical data, the nature and duration of restrictions on disposition, an evaluation of the forces that influence the market in which the securities are purchased and sold, and public trading in similar securities of the issuer or comparable issuers. These securities are either categorized within Level 2 or 3 of the fair value hierarchy depending on the relevant inputs used.
For restricted securities where observable inputs are limited, assumptions about market activity and risk are used and are generally categorized within Level 3 of the fair value hierarchy.
The following is a summary of the inputs used as of September 30, 2015 in valuing the fund’s investments:
21
NOTES TO FINANCIAL STATEMENTS (continued)
| | | | | |
Assets ($) | Level 1 - Unadjusted Quoted Prices | Level 2 - Other Significant Observable Inputs | Level 3 -Significant Unobservable Inputs | Total |
Investments in Securities: | | | |
Equity Securities - Domestic Common Stocks† | 54,939,471 | - | - | 54,939,471 |
Exchange-Traded Funds | 696,923 | - | - | 696,923 |
Mutual Funds | 1,622,498 | - | - | 1,622,498 |
† See Statement of Investments for additional detailed categorizations.
At September 30, 2015, there were no transfers between Level 1 and Level 2 of the fair value hierarchy.
(b) Securities transactions and investment income: Securities transactions are recorded on a trade date basis. Realized gains and losses from securities transactions are recorded on the identified cost basis. Dividend income is recognized on the ex-dividend date and interest income, including, where applicable, accretion of discount and amortization of premium on investments, is recognized on the accrual basis.
Pursuant to a securities lending agreement with The Bank of New York Mellon, a subsidiary of BNY Mellon and an affiliate of Dreyfus, the fund may lend securities to qualified institutions. It is the fund’s policy that, at origination, all loans are secured by collateral of at least 102% of the value of U.S. securities loaned and 105% of the value of foreign securities loaned. Collateral equivalent to at least 100% of the market value of securities on loan is maintained at all times. Collateral is either in the form of cash, which can be invested in certain money market mutual funds managed by Dreyfus, or U.S. Government and Agency securities. The fund is entitled to receive all dividends, interest and distributions on securities loaned, in addition to income earned as a result of the lending transaction. Should a borrower fail to return the securities in a timely manner, The Bank of New York Mellon is required to replace the securities for the benefit of the fund or credit the fund with the market value of the unreturned securities and is subrogated to the fund’s rights against the borrower and the collateral. During the period ended September 30, 2015, The Bank of New York Mellon earned $3,040 from lending portfolio securities, pursuant to the securities lending agreement.
(c) Affiliated issuers: Investments in other investment companies advised by Dreyfus are defined as “affiliated” under the Act. Investments in
22
affiliated investment companies during the period ended September 30, 2015 were as follows:
| | | | | | |
Affiliated Investment Company | Value 9/30/2014 ($) | Purchases ($) | Sales ($) | Value 9/30/2015 ($) | Net Assets (%) |
Dreyfus Institutional Preferred Plus Money Market Fund | 543,499 | 22,894,705 | 23,076,751 | 361,453 | .6 |
Dreyfus Institutional Cash Advantage Fund | 4,176,464 | 48,599,982 | 51,515,401 | 1,261,045 | 2.2 |
Total | 4,719,963 | 71,494,687 | 74,592,152 | 1,622,498 | 2.8 |
(d) Dividends to shareholders: Dividends are recorded on the ex-dividend date. Dividends from investment income-net and dividends from net realized capital gains, if any, are normally declared and paid annually, but the fund may make distributions on a more frequent basis to comply with the distribution requirements of the Internal Revenue Code of 1986, as amended (the “Code”). To the extent that net realized capital gains can be offset by capital loss carryovers, it is the policy of the fund not to distribute such gains. Income and capital gain distributions are determined in accordance with income tax regulations, which may differ from GAAP.
(e) Federal income taxes: It is the policy of the fund to continue to qualify as a regulated investment company, if such qualification is in the best interests of its shareholders, by complying with the applicable provisions of the Code, and to make distributions of taxable income sufficient to relieve it from substantially all federal income and excise taxes.
As of and during the period ended September 30, 2015, the fund did not have any liabilities for any uncertain tax positions. The fund recognizes interest and penalties, if any, related to uncertain tax positions as income tax expense in the Statement of Operations. During the period ended September 30, 2015, the fund did not incur any interest or penalties.
Each tax year in the four-year period ended September 30, 2015 remains subject to examination by the Internal Revenue Service and state taxing authorities.
23
NOTES TO FINANCIAL STATEMENTS (continued)
At September 30, 2015, the components of accumulated earnings on a tax basis were as follows: undistributed capital gains $11,131,009, accumulated capital losses $3,608,643 and unrealized appreciation $5,860,870. In addition, the fund deferred for tax purposes late year ordinary losses of $92,442 to the first day of the following fiscal year.
Under the Regulated Investment Company Modernization Act of 2010 (the “2010 Act”), the fund is permitted to carry forward capital losses incurred in taxable years beginning after December 22, 2010 (“post-enactment losses”) for an unlimited period. Furthermore, post-enactment capital loss carryovers retain their character as either short-term or long-term capital losses rather than short-term as they were under previous statute. The 2010 Act requires post-enactment losses to be utilized before the utilization of losses incurred in taxable years prior to the effective date of the 2010 Act (“pre-enactment losses”). As a result of this ordering rule, pre-enactment losses may be more likely to expire unused.
The accumulated capital loss carryover is available for federal income tax purposes to be applied against future net realized capital gains, if any, realized subsequent to September 30, 2015. If not applied, $3,542,193 of the carryover expires in fiscal year 2017 and $66,450 expires in fiscal year 2018. Acquired losses, as a result of the fund's merger with Dreyfus Premier Future Leaders Fund, can be utilized in subsequent years but will be subject to annual limitations based on certain provisions in the Code.
The tax character of distributions paid to shareholders during the fiscal periods ended September 30, 2015 and September 30, 2014 were as follows: ordinary income $749,821 and $1,650,133, and long-term capital gains $14,005,463 and $7,140,284, respectively.
During the period ended September 30, 2015, as a result of permanent book to tax differences, primarily due to the tax treatment for net operating losses, the fund increased accumulated undistributed investment income-net by $8,145, decreased accumulated net realized gain (loss) on investments by $2,831 and decreased paid-in capital by $5,314. Net assets and net asset value per share were not affected by this reclassification.
NOTE 2—Bank Lines of Credit:
The fund participates with other Dreyfus-managed funds in a $430 million unsecured credit facility led by Citibank, N.A. and a $300 million unsecured credit facility provided by The Bank of New York Mellon (each, a “Facility”), each to be utilized primarily for temporary or emergency purposes, including the financing of redemptions. Prior to October 8, 2014, the unsecured credit facility with Citibank, N.A. was $265 million. In connection therewith, the fund has agreed to pay its pro rata portion of
24
commitment fees for each Facility. Interest is charged to the fund based on rates determined pursuant to the terms of the respective Facility at the time of borrowing.
The average amount of borrowings outstanding under the Facilities during the period ended September 30, 2015 was approximately $77,500 with a related weighted average annualized interest rate of 1.10%.
NOTE 3—Investment Advisory Fee, Administration Fee and Other Transactions with Affiliates:
(a) Pursuant to an investment advisory agreement with TBCAM, the investment advisory fee is computed at the annual rate of .80% of the value of the fund’s average daily net assets and is payable monthly. Dreyfus and TBCAM have contractually agreed, from October 1, 2014 through September 30, 2015, to assume the direct expenses of the fund, so that such expenses of Class A, Class C and Class I shares (excluding taxes, interest expense, brokerage commissions, commitment fees on borrowings and extraordinary expenses) do not exceed 1.39%, 2.22% and 1.16% of the value of the respective class’ average daily net assets, until the fiscal year end following such time as the expenses are equal to or less than such annual rate for the applicable class. The reduction in expenses, pursuant to the undertaking, amounted to $99,209 during the period ended September 30, 2015.
The fund compensates Dreyfus under an administration agreement for providing personnel and facilities to perform accounting and administration services for the fund at an annual rate of .10% of the value of the fund’s average daily net asset. Pursuant to the administration agreement, the fund was charged $69,545 during the period ended September 30, 2015.
During the period ended September 30, 2015, the Distributor retained $1,697 from commissions earned on sales of the fund's Class A shares and $1,239 from CDSCs on redemptions of the fund's Class C shares.
(b) Under the Distribution Plan adopted pursuant to Rule 12b-1 under the Act, Class C shares pay the Distributor for distributing its shares at an annual rate of .75% of the value of its average daily net assets. During the period ended September 30, 2015, Class C shares were charged $73,260 pursuant to the Distribution Plan.
(c) Under the Shareholder Services Plan, Class A and Class C shares pay the Distributor at an annual rate of .25% of the value of their average daily net assets for the provision of certain services. The services provided may include personal services relating to shareholder accounts, such as
25
NOTES TO FINANCIAL STATEMENTS (continued)
answering shareholder inquiries regarding the fund and providing reports and other information, and services related to the maintenance of shareholder accounts. The Distributor may make payments to Service Agents (securities dealers, financial institutions or other industry professionals) with respect to these services. The Distributor determines the amounts to be paid to Service Agents. During the period ended September 30, 2015, Class A and Class C shares were charged $110,252 and $24,420, respectively, pursuant to the Shareholder Services Plan.
The fund has arrangements with the transfer agent and the custodian whereby the fund may receive earnings credits when positive cash balances are maintained, which are used to offset transfer agency and custody fees. For financial reporting purposes, the fund includes net earnings credits as an expense offset in the Statement of Operations.
The fund compensates Dreyfus Transfer, Inc., a wholly-owned subsidiary of Dreyfus, under a transfer agency agreement for providing transfer agency and cash management services for the fund. The majority of transfer agency fees are comprised of amounts paid on a per account basis, while cash management fees are related to fund subscriptions and redemptions. During the period ended September 30, 2015, the fund was charged $21,680 for transfer agency services and $1,261 for cash management services. These fees are included in Shareholder servicing costs in the Statement of Operations. Cash management fees were partially offset by earnings credits of $52.
The fund compensates The Bank of New York Mellon under a custody agreement for providing custodial services for the fund. These fees are determined based on net assets, geographic region and transaction activity. During the period ended September 30, 2015, the fund was charged $21,630 pursuant to the custody agreement.
During the period ended September 30, 2015, the fund was charged $11,078 for services performed by the Chief Compliance Officer and his staff.
The components of “Due to TBCAM and affiliates” in the Statement of Assets and Liabilities consist of: investment advisory fees $38,043, Distribution Plan fees $5,303, Shareholder Services Plan fees $10,245, custodian fees $9,727, Chief Compliance Officer fees $2,606, administration fees $4,755 and transfer agency fees $6,610, which are offset against an expense reimbursement currently in effect in the amount of $6,410.
26
(d) Each Board member also serves as a Board member of other funds within the Dreyfus complex. Annual retainer fees and attendance fees are allocated to each fund based on net assets.
NOTE 4—Securities Transactions:
The aggregate amount of purchases and sales of investment securities, excluding short-term securities, during the period ended September 30, 2015, amounted to $54,180,364 and $90,715,766, respectively.
At September 30, 2015, the cost of investments for federal income tax purposes was $51,398,022; accordingly, accumulated net unrealized appreciation on investments was $5,860,870, consisting of $10,774,669 gross unrealized appreciation and $4,913,799 gross unrealized depreciation.
27
REPORT OF INDEPENDENT REGISTERED
PUBLIC ACCOUNTING FIRM
Shareholders and Board of Trustees
Dreyfus Small Cap Equity Fund
We have audited the accompanying statement of assets and liabilities, including the statement of investments, of Dreyfus Small Cap Equity Fund (one of the series comprising Dreyfus Stock Funds) as of September 30, 2015, and the related statement of operations for the year then ended, the statement of changes in net assets for each of the two years in the period then ended, and the financial highlights for each of the five years in the period then ended. These financial statements and financial highlights are the responsibility of the Fund’s management. Our responsibility is to express an opinion on these financial statements and financial highlights based on our audits.
We conducted our audits in accordance with the standards of the Public Company Accounting Oversight Board (United States). Those standards require that we plan and perform the audit to obtain reasonable assurance about whether the financial statements and financial highlights are free of material misstatement. We were not engaged to perform an audit of the Fund’s internal control over financial reporting. Our audits included consideration of internal control over financial reporting as a basis for designing audit procedures that are appropriate in the circumstances, but not for the purpose of expressing an opinion on the effectiveness of the Fund’s internal control over financial reporting. Accordingly, we express no such opinion. An audit also includes examining, on a test basis, evidence supporting the amounts and disclosures in the financial statements and financial highlights, assessing the accounting principles used and significant estimates made by management, and evaluating the overall financial statement presentation. Our procedures included confirmation of securities owned as of September 30, 2015 by correspondence with the custodian and others. We believe that our audits provide a reasonable basis for our opinion.
In our opinion, the financial statements and financial highlights referred to above present fairly, in all material respects, the financial position of Dreyfus Small Cap Equity Fund at September 30, 2015, the results of its operations for the year then ended, the changes in its net assets for each of the two years in the period then ended, and the financial highlights for each of the five years in the period then ended, in conformity with U.S. generally accepted accounting principles.

New York, New York
November 25, 2015
28
IMPORTANT TAX INFORMATION (Unaudited)
For federal tax purposes, the fund hereby reports 98.20% of the ordinary dividends paid during the fiscal year ended September 30, 2015 as qualifying for the corporate dividends received deduction. Also certain dividends paid by the fund may be subject to a maximum tax rate of 15%, as provided for by the Jobs and Growth Tax Relief Reconciliation Act of 2003. Of the distributions paid during the fiscal year, $749,821 represents the maximum amount that may be considered qualified dividend income. Shareholders will receive notification in early 2016 of the percentage applicable to the preparation of their 2015 income tax returns. The fund also hereby reports $.0670 per share as a short-term capital gain distribution paid on March 25, 2015 and also hereby reports $.2168 per share as a short-term capital gain distribution and $5.0596 per share as a long-term capital gain distribution paid on December 16, 2014.
29
BOARD MEMBERS INFORMATION (Unaudited)
INDEPENDENT BOARD MEMBERS
Joseph S. DiMartino (71)
Chairman of the Board (2003)
Principal Occupation During Past 5 Years:
· Corporate Director and Trustee (1995-present)
Other Public Company Board Memberships During Past 5 Years:
· CBIZ (formerly, Century Business Services, Inc.), a provider of outsourcing functions for small and medium size companies, Director (1997-present)
· The Newark Group, a provider of a national market of paper recovery facilities, paperboard mills and paperboard converting plants, Director (2000-2010)
No. of Portfolios for which Board Member Serves: 142
———————
Joni Evans (73)
Board Member (2006)
Principal Occupation During Past 5 Years:
· Chief Executive Officer, www.wowOwow.com an online community dedicated to women’s conversations and publications (2007-present)
· Principal, Joni Evans Ltd. (publishing) (2006-present)
No. of Portfolios for which Board Member Serves: 25
———————
Ehud Houminer (75)
Board Member (2003)
Principal Occupation During Past 5 Years:
· Executive-in-Residence at the Columbia Business School, Columbia
University (1992-present)
Other Public Company Board Memberships During Past 5 Years:
· Avnet, Inc., an electronics distributor, Director (1993-2012)
No. of Portfolios for which Board Member Serves: 62
———————
Hans C. Mautner (77)
Board Member (2003)
Principal Occupation During Past 5 Years:
· President-International Division and an Advisory Director of Simon Property Group, a
real estate investment company (1998-2010)
· Chairman and Chief Executive Officer of Simon Global Limited, a real estate company (1999-2010)
No. of Portfolios for which Board Member Serves: 25
———————
30
Robin A. Melvin (52)
Board Member (2003)
Principal Occupation During Past 5 Years:
· Co-chairman, Illinois Mentoring Partnership, non-profit organization dedicated to increasing the quantity and quality of mentoring services in Illinois; (2014-present; a board member since 2013)
· Director, Boisi Family Foundation, a private family foundation that supports
youth-serving organizations that promote the self sufficiency of youth from
disadvantaged circumstances (1995-2012)
No. of Portfolios for which Board Member Serves: 112
———————
Burton N. Wallack (64)
Board Member (2006)
Principal Occupation During Past 5 Years:
· President and Co-owner of Wallack Management Company, a real estate management
company (1987-present)
No. of Portfolios for which Board Member Serves: 25
———————
31
BOARD MEMBERS INFORMATION (Unaudited) (continued)
INTERESTED BOARD MEMBER
Gordon J. Davis (74)
Board Member (2006)
Principal Occupation During Past 5 Years:
· Partner in the law firm of Venable LLP (2012-present)
· Partner in the law firm of Dewey & LeBoeuf LLP (1994-2012)
Other Public Company Board Memberships During Past 5 Years:
· Consolidated Edison, Inc., a utility company, Director (1997-2014)
· The Phoenix Companies, Inc., a life insurance company, Director (2000-2014)
No. of Portfolios for which Board Member Serves: 61
Gordon J. Davis is deemed to be an “interested person” (as defined under the Act) of the Company as a result of his affiliation with Venable LLP, which provides legal services to the Company.
———————
Once elected all Board Members serve for an indefinite term, but achieve Emeritus status upon reaching age 80. The address of the Board Members and Officers is c/o The Dreyfus Corporation, 200 Park Avenue, New York, New York 10166. Additional information about the Board Members is available in the fund's Statement of Additional Information which can be obtained from Dreyfus free of charge by calling this toll free number: 1-800-DREYFUS.
William Hodding Carter III, Emeritus Board Member
Arnold S. Hiatt, Emeritus Board Member
32
OFFICERS OF THE FUND (Unaudited)
BRADLEY J. SKAPYAK, President since January 2010.
Chief Operating Officer and a director of the Manager since June 2009, Chairman of Dreyfus Transfer, Inc., an affiliate of the Manager and the transfer agent of the funds, since May 2011 and Executive Vice President of the Distributor since June 2007. From April 2003 to June 2009, Mr. Skapyak was the head of the Investment Accounting and Support Department of the Manager. He is an officer of 68 investment companies (comprised of 142 portfolios) managed by the Manager. He is 56 years old and has been an employee of the Manager since February 1988.
BENNETT A. MACDOUGALL, Chief Legal Officer since October 2015
Chief Legal Officer of the Manager since June 2015; from June 2005 to June 2015, Director and Associate General Counsel of Deutsche Bank – Asset & Wealth Management Division, and Chief Legal Officer of Deutsche Investment Management Americas Inc. He is an officer of 69 investment companies (comprised of 167 portfolios) managed by the Manager. He is 44 years old and has been an employee of the Manager since June 2015.
JANETTE E. FARRAGHER, Vice President and Secretary since December 2011.
Assistant General Counsel of BNY Mellon, and an officer of 69 investment companies (comprised of 167 portfolios) managed by the Manager. She is 52 years old and has been an employee of the Manager since February 1984.
JAMES BITETTO, Vice President and Assistant Secretary since August 2005.
Managing Counsel of BNY Mellon and Secretary of the Manager, and an officer of 69 investment companies (comprised of 167 portfolios) managed by the Manager. He is 49 years old and has been an employee of the Manager since December 1996.
JONI LACKS CHARATAN, Vice President and Assistant Secretary since August 2005.
Managing Counsel of BNY Mellon, and an officer of 69 investment companies (comprised of 167 portfolios) managed by the Manager. She is 59 years old and has been an employee of the Manager since October 1988.
JOSEPH M. CHIOFFI, Vice President and Assistant Secretary since August 2005.
Managing Counsel of BNY Mellon, and an officer of 69 investment companies (comprised of 167 portfolios) managed by the Manager. He is 53 years old and has been an employee of the Manager since June 2000.
JOHN B. HAMMALIAN, Vice President and Assistant Secretary since August 2005.
Senior Managing Counsel of BNY Mellon, and an officer of 69 investment companies (comprised of 167 portfolios) managed by the Manager. He is 52 years old and has been an employee of the Manager since February 1991.
MAUREEN E. KANE, Vice President and Assistant Secretary since April 2015.
Managing Counsel of BNY Mellon since July 2014; from October 2004 until July 2014, General Counsel, and from May 2009 until July 2014, Chief Compliance Officer of Century Capital Management. She is an officer of 69 investment companies (comprised of 167 portfolios) managed by the Manager. She is 53 years old and has been an employee of the Manager since July 2014.
SARAH S. KELLEHER, Vice President and Assistant Secretary since April 2014.
Senior Counsel of BNY Mellon, and an officer of 69 investment companies (comprised of 167 portfolios) managed by the Manager; from August 2005 to March 2013, Associate General Counsel of Third Avenue Management. She is 40 years old and has been an employee of the Manager since March 2013.
JEFF PRUSNOFSKY, Vice President and Assistant Secretary since August 2005.
Senior Managing Counsel of BNY Mellon, and an officer of 69 investment companies (comprised of 167 portfolios) managed by the Manager. He is 50 years old and has been an employee of the Manager since October 1990.
JAMES WINDELS, Treasurer since November 2001.
Director – Mutual Fund Accounting of the Manager, and an officer of 69 investment companies (comprised of 167 portfolios) managed by the Manager. He is 57 years old and has been an employee of the Manager since April 1985.
33
OFFICERS OF THE FUND (Unaudited) (continued)
RICHARD CASSARO, Assistant Treasurer since January 2008.
Senior Accounting Manager – Money Market and Municipal Bond Funds of the Manager, and an officer of 69 investment companies (comprised of 167 portfolios) managed by the Manager. He is 56 years old and has been an employee of the Manager since September 1982.
GAVIN C. REILLY, Assistant Treasurer since December 2005.
Tax Manager of the Investment Accounting and Support Department of the Manager, and an officer of 69 investment companies (comprised of 167 portfolios) managed by the Manager. He is 47 years old and has been an employee of the Manager since April 1991.
ROBERT S. ROBOL, Assistant Treasurer since August 2005.
Senior Accounting Manager – Fixed Income Funds of the Manager, and an officer of 69 investment companies (comprised of 167 portfolios) managed by the Manager. He is 51 years old and has been an employee of the Manager since October 1988.
ROBERT SALVIOLO, Assistant Treasurer since July 2007.
Senior Accounting Manager – Equity Funds of the Manager, and an officer of 69 investment companies (comprised of 167 portfolios) managed by the Manager. He is 48 years old and has been an employee of the Manager since June 1989.
ROBERT SVAGNA, Assistant Treasurer since December 2002.
Senior Accounting Manager – Equity Funds of the Manager, and an officer of 69 investment companies (comprised of 167 portfolios) managed by the Manager. He is 48 years old and has been an employee of the Manager since November 1990.
JOSEPH W. CONNOLLY, Chief Compliance Officer since October 2004.
Chief Compliance Officer of the Manager and The Dreyfus Family of Funds (69 investment companies, comprised of 167 portfolios). He is 58 years old and has served in various capacities with the Manager since 1980, including manager of the firm’s Fund Accounting Department from 1997 through October 2001.
34
NOTES
35
NOTES
36
NOTES
37
Dreyfus Small Cap Equity Fund
200 Park Avenue
New York, NY 10166
Investment Adviser
The Boston Company
Asset Management, LLC
Mellon Financial Center
One Boston Place
Boston, MA 02108
Administrator
The Dreyfus Corporation
200 Park Avenue
New York, NY 10166
Custodian
The Bank of New York Mellon
225 Liberty Street
New York, NY 10286
Transfer Agent &
Dividend Disbursing Agent
Dreyfus Transfer, Inc.
200 Park Avenue
New York, NY 10166
Distributor
MBSC Securities Corporation
200 Park Avenue
New York, NY 10166
| | |
Ticker Symbols: Class A: DSEAX Class C: DSECX Class I: DSERX |
Telephone Call your financial representative or 1-800-DREYFUS
Mail The Dreyfus Family of Funds, 144 Glenn Curtiss Boulevard, Uniondale, NY 11556-0144
E-mail Send your request to info@dreyfus.com
Internet Information can be viewed online or downloaded at www.dreyfus.com
The fund files its complete schedule of portfolio holdings with the Securities and Exchange Commission (“SEC”) for the first and third quarters of each fiscal year on Form N-Q. The fund’s Forms N-Q are available on the SEC’s website at www.sec.gov and may be reviewed and copied at the SEC’s Public Reference Room in Washington, DC. (phone 1-800-SEC-0330 for information).
A description of the policies and procedures that the fund uses to determine how to vote proxies relating to portfolio securities and information regarding how the fund voted these proxies for the most recent 12-month period ended June 30 is available at www.dreyfus.com and on the SEC’s website at www.sec.gov and without charge, upon request, by calling 1-800-DREYFUS.
| | |
© 2015 MBSC Securities Corporation
0439AR0915 | 
|
Item 2. Code of Ethics.
The Registrant has adopted a code of ethics that applies to the Registrant's principal executive officer, principal financial officer, principal accounting officer or controller, or persons performing similar functions. There have been no amendments to, or waivers in connection with, the Code of Ethics during the period covered by this Report.
Item 3. Audit Committee Financial Expert.
The Registrant's Board has determined that Ehud Houminer, a member of the Audit Committee of the Board, is an audit committee financial expert as defined by the Securities and Exchange Commission (the "SEC"). Ehud Houminer is "independent" as defined by the SEC for purposes of audit committee financial expert determinations.
Item 4. Principal Accountant Fees and Services.
(a) Audit Fees. The aggregate fees billed for each of the last two fiscal years (the "Reporting Periods") for professional services rendered by the Registrant's principal accountant (the "Auditor") for the audit of the Registrant's annual financial statements or services that are normally provided by the Auditor in connection with the statutory and regulatory filings or engagements for the Reporting Periods, were $75,654 in 2014 and $77,544 in 2015.
(b) Audit-Related Fees. The aggregate fees billed in the Reporting Periods for assurance and related services by the Auditor that are reasonably related to the performance of the audit of the Registrant's financial statements and are not reported under paragraph (a) of this Item 4 were $24,240 in 2014 and $12,546 in 2015. These services consisted of one or more of the following: (i) agreed upon procedures related to compliance with Internal Revenue Code section 817(h), (ii) security counts required by Rule 17f-2 under the Investment Company Act of 1940, as amended, (iii) advisory services as to the accounting or disclosure treatment of Registrant transactions or events and (iv) advisory services to the accounting or disclosure treatment of the actual or potential impact to the Registrant of final or proposed rules, standards or interpretations by the Securities and Exchange Commission, the Financial Accounting Standards Boards or other regulatory or standard-setting bodies.
The aggregate fees billed in the Reporting Periods for non-audit assurance and related services by the Auditor to the Registrant's investment adviser (not including any sub-investment adviser whose role is primarily portfolio management and is subcontracted with or overseen by another investment adviser), and any entity controlling, controlled by or under common control with the investment adviser that provides ongoing services to the Registrant ("Service Affiliates"), that were reasonably related to the performance of the annual audit of the Service Affiliate, which required pre-approval by the Audit Committee were $0 in 2014 and $0 in 2015.
(c) Tax Fees. The aggregate fees billed in the Reporting Periods for professional services rendered by the Auditor for tax compliance, tax advice, and tax planning ("Tax Services") were $11,200 in 2014 and $15,917 in 2015. These services consisted of: (i) review or preparation of U.S. federal, state, local and excise tax returns; (ii) U.S. federal, state and local tax planning, advice and assistance regarding statutory, regulatory or administrative developments; (iii) tax advice regarding tax qualification matters and/or treatment of various financial instruments held or proposed to be acquired or held, and (iv) determination of Passive Foreign Investment Companies. The aggregate fees billed in the Reporting Periods for Tax Services by the Auditor to Service Affiliates, which required pre-approval by the Audit Committee were $0 in 2014 and $0 in 2015.
(d) All Other Fees. The aggregate fees billed in the Reporting Periods for products and services provided by the Auditor, other than the services reported in paragraphs (a) through (c) of this Item, were $1,364 in 2014 and $1,437 in 2015.[These services included a review of the Registrant's anti-money laundering program.
The aggregate fees billed in the Reporting Periods for Non-Audit Services by the Auditor to Service Affiliates, other than the services reported in paragraphs (b) through (c) of this Item, which required pre-approval by the Audit Committee, were $0 in 2014 and $0 in 2015.
(e)(1) Audit Committee Pre-Approval Policies and Procedures. The Registrant's Audit Committee has established policies and procedures (the "Policy") for pre-approval (within specified fee limits) of the Auditor's engagements for non-audit services to the Registrant and Service Affiliates without specific case-by-case consideration. The pre-approved services in the Policy can include pre-approved audit services, pre-approved audit-related services, pre-approved tax services and pre-approved all other services. Pre-approval considerations include whether the proposed services are compatible with maintaining the Auditor's independence. Pre-approvals pursuant to the Policy are considered annually.
(e)(2) Note: None of the services described in paragraphs (b) through (d) of this Item 4 were approved by the Audit Committee pursuant to paragraph (c)(7)(i)(C) of Rule 2-01 of Regulation S-X.
(f) None of the hours expended on the principal accountant's engagement to audit the registrant's financial statements for the most recent fiscal year were attributed to work performed by persons other than the principal account's full-time, permanent employees.
Non-Audit Fees. The aggregate non-audit fees billed by the Auditor for services rendered to the Registrant, and rendered to Service Affiliates, for the Reporting Periods were $30,348,123 in 2014 and $20,448,650 in 2015.
Auditor Independence. The Registrant's Audit Committee has considered whether the provision of non-audit services that were rendered to Service Affiliates, which were not pre-approved (not requiring pre-approval), is compatible with maintaining the Auditor's independence.
Item 5. Audit Committee of Listed Registrants.
Not applicable. [CLOSED-END FUNDS ONLY]
Item 6. Investments.
(a) Not applicable.
Item 7. Disclosure of Proxy Voting Policies and Procedures for Closed-End Management Investment Companies.
Not applicable. [CLOSED-END FUNDS ONLY]
Item 8. Portfolio Managers of Closed-End Management Investment Companies.
Not applicable. [CLOSED-END FUNDS ONLY, beginning with reports for periods ended on and after December 31, 2005]
Item 9. Purchases of Equity Securities by Closed-End Management Investment Companies and Affiliated Purchasers.
Not applicable. [CLOSED-END FUNDS ONLY]
Item 10. Submission of Matters to a Vote of Security Holders.
There have been no material changes to the procedures applicable to Item 10.
Item 11. Controls and Procedures.
(a) The Registrant's principal executive and principal financial officers have concluded, based on their evaluation of the Registrant's disclosure controls and procedures as of a date within 90 days of the filing date of this report, that the Registrant's disclosure controls and procedures are reasonably designed to ensure that information required to be disclosed by the Registrant on Form N-CSR is recorded, processed, summarized and reported within the required time periods and that information required to be disclosed by the Registrant in the reports that it files or submits on Form N-CSR is accumulated and communicated to the Registrant's management, including its principal executive and principal financial officers, as appropriate to allow timely decisions regarding required disclosure.
(b) There were no changes to the Registrant's internal control over financial reporting that occurred during the second fiscal quarter of the period covered by this report that have materially affected, or are reasonably likely to materially affect, the Registrant's internal control over financial reporting.
Item 12. Exhibits.
(a)(1) Code of ethics referred to in Item 2.
(a)(2) Certifications of principal executive and principal financial officers as required by Rule 30a-2(a) under the Investment Company Act of 1940.
(a)(3) Not applicable.
(b) Certification of principal executive and principal financial officers as required by Rule 30a-2(b) under the Investment Company Act of 1940.
SIGNATURES
Pursuant to the requirements of the Securities Exchange Act of 1934 and the Investment Company Act of 1940, the Registrant has duly caused this Report to be signed on its behalf by the undersigned, thereunto duly authorized.
DREYFUS STOCK FUNDS
By: /s/ Bradley J. Skapyak
Bradley J. Skapyak
President
Date: November 23, 2015
Pursuant to the requirements of the Securities Exchange Act of 1934 and the Investment Company Act of 1940, this Report has been signed below by the following persons on behalf of the Registrant and in the capacities and on the dates indicated.
By: /s/ Bradley J. Skapyak
Bradley J. Skapyak
President
Date: November 23, 2015
By: /s/ James Windels
James Windels
Treasurer
Date: November 23, 2015
EXHIBIT INDEX
(a)(1) Code of ethics referred to in Item 2.
(a)(2) Certifications of principal executive and principal financial officers as required by Rule 30a-2(a) under the Investment Company Act of 1940. (EX-99.CERT)
(b) Certification of principal executive and principal financial officers as required by Rule 30a-2(b) under the Investment Company Act of 1940. (EX-99.906CERT)
