UNITED STATES
SECURITIES AND EXCHANGE COMMISSION
Washington, D.C. 20549
FORM N-CSR
CERTIFIED SHAREHOLDER REPORT OF REGISTERED MANAGEMENT
INVESTMENT COMPANIES
Investment Company Act file number | 811-21236 |
| |
| DREYFUS STOCK FUNDS | |
| (Exact name of Registrant as specified in charter) | |
| | |
| c/o The Dreyfus Corporation 200 Park Avenue New York, New York 10166 | |
| (Address of principal executive offices) (Zip code) | |
| | |
| John Pak, Esq. 200 Park Avenue New York, New York 10166 | |
| (Name and address of agent for service) | |
|
Registrant's telephone number, including area code: | (212) 922-6000 |
| |
Date of fiscal year end: | 09/30 | |
Date of reporting period: | 09/30/14 | |
| | | | | | | |
FORM N-CSR
Item 1. Reports to Stockholders.
Dreyfus
International
Equity Fund
ANNUAL REPORT September 30, 2014

Save time. Save paper. View your next shareholder report online as soon as it’s available. Log into www.dreyfus.com and sign up for Dreyfus eCommunications. It’s simple and only takes a few minutes.
The views expressed in this report reflect those of the portfolio manager only through the end of the period covered and do not necessarily represent the views of Dreyfus or any other person in the Dreyfus organization. Any such views are subject to change at any time based upon market or other conditions and Dreyfus disclaims any responsibility to update such views.These views may not be relied on as investment advice and, because investment decisions for a Dreyfus fund are based on numerous factors, may not be relied on as an indication of trading intent on behalf of any Dreyfus fund.

| | Contents |
| | THE FUND |
| 2 | A Letter from the President |
| 3 | Discussion of Fund Performance |
| 6 | Fund Performance |
| 8 | Understanding Your Fund’s Expenses |
| 8 | Comparing Your Fund’s Expenses With Those of Other Funds |
| 9 | Statement of Investments |
| 13 | Statement of Assets and Liabilities |
| 14 | Statement of Operations |
| 15 | Statement of Changes in Net Assets |
| 17 | Financial Highlights |
| 20 | Notes to Financial Statements |
| 34 | Report of Independent Registered Public Accounting Firm |
| 35 | Important Tax Information |
| 36 | Board Members Information |
| 40 | Officers of the Fund |
| | FOR MORE INFORMATION |
| | Back Cover |
Dreyfus
International Equity Fund
The Fund
A LETTER FROM THE PRESIDENT
Dear Shareholder:
This annual report for Dreyfus International Equity Fund covers the 12-month period from October 1, 2013, through September 30, 2014. For information about how the fund performed during the reporting period, as well as general market perspectives, we provide a Discussion of Fund Performance on the pages that follow.
For the 12-month reporting period overall, international stock prices advanced modestly as investors generally responded positively to more accommodative monetary policies throughout much of the world. However, the overall market’s entire advance was achieved during the first half of the reporting period.The second half saw mildly negative returns, on average, due to renewed concerns regarding geopolitical tensions and persistently sluggish growth in Europe and the emerging markets.
Some forces appear likely to support international stock prices over the foreseeable future; low inflation has enabled the European Central Bank to reduce short-term interest rates further, China’s economic slowdown appears increasingly unlikely to devolve into a more severe financial crisis, and India’s stock market has surged in anticipation of a more business-friendly government.Yet, some countries are faring better economically than others and monetary policies have begun to diverge, affecting currency exchange rates and capital flows. Consequently, selectivity and a long-term perspective seem poised to become more important determinants of investment success.As always, we urge you to talk regularly with your financial advisor to assess the potential impact of these and other developments on your investments.
Thank you for your continued confidence and support.

J. Charles Cardona
President
The Dreyfus Corporation
October 15, 2014
2
DISCUSSION OF FUND PERFORMANCE
For the period of October 1, 2013, through September 30, 2014, as provided by Sean P. Fitzgibbon and Mark A. Bogar, Portfolio Managers
Fund and Market Performance Overview
For the 12-month period ended September 30, 2014, Dreyfus International Equity Fund’s Class A shares produced a total return of 7.62%, Class C shares returned 6.78%, and Class I shares returned 7.91%.1 In comparison, the fund’s benchmark, the Morgan Stanley Capital International Europe, Australasia, Far East Index (“MSCI EAFE Index”), produced a total return of 4.25% for the same period.2
Developed equity markets generally advanced early in the reporting period amid signs of improving global business prospects, but renewed economic concerns later sparked broad-based declines. The fund produced higher returns than its benchmark, mainly due to successful security selections in the United Kingdom, Japan, and Switzerland.
The Fund’s Investment Approach
The fund seeks long-term growth of capital. The fund normally invests at least 80% of assets in shares of companies located in the foreign countries represented in the MSCI EAFE Index and Canada, and may also invest up to 20% of its assets in securities of issuers located in emerging market countries.
The fund invests in stocks that appear to be undervalued and exhibit better fundamentals than the market expects. We employ a “bottom-up” investment approach, which emphasizes individual stock selection. Our stock selection process is designed to produce a diversified portfolio that, relative to the MSCI EAFE Index, frequently has a below-average price/earnings ratio and an above-average earnings growth trend.
International Markets Advanced Despite Volatility
European stock markets climbed during the first eight months of the reporting period as economic growth appeared to pick up in some countries, such as Germany, and signs of recovery emerged in some of the region’s more troubled economies, including Italy and Spain. Investors also responded positively to an unexpected reduction in
The Fund 3
DISCUSSION OF FUND PERFORMANCE (continued)
short-term interest rates by the European Central Bank. However, many European stocks came under pressure over the summer due to disappointing GDP growth rates and deflation fears. Worries about instability in Ukraine and the Middle East also weighed on investor sentiment. Although European equity markets gave up a significant portion of their earlier gains between June and September, the region ended the reporting period with moderate gains overall.
Developed markets in Asia generated more modest total returns, on average. The Japanese stock market struggled with stalling economic growth and the fading benefits of aggressively stimulative monetary and fiscal policies. Hong Kong and Australian stocks were hampered by slowing economic growth and sluggish demand for commodities in China.
Stock Selection Strategy Helped Buoy Relative Results
The fund participated in the international markets’ gains over the reporting period. The United Kingdom ranked as the fund’s top contributor, mainly due to strength in the health care sector, where Shire Pharmaceuticals advanced strongly after receiving a takeover offer from U.S.-based AbbVie. U.K. financial stocks also fared well, led by insurers Prudential and Aviva. In consumer-related market segments, investors responded positively to restructuring efforts by broadcaster ITV and hotels-and-restaurants operator Whitbread.
Although Japanese stocks ended the reporting period with generally flat returns, underweighted exposure to the country’s financial institutions helped the fund outperform market averages. One notable exception was Daito Trust Construction, a regional lender that focused on areas where property values are recovering.The fund also added value in Japan’s telecommunications services sector, where mobile and landline services provider KDDI benefited from the rollout of new 4G products and greater pricing flexibility. In Switzerland, the fund scored successes by owning shares of insurers Swiss Life Holding and Zurich Insurance Group, while avoiding diversified financial institutions Credit Suisse and UBS.
Although disappointments over the reporting period proved relatively mild, the fund’s results in Hong Kong were undermined by casino operator SJM Holdings, which faltered when foot traffic declined in its Macau facilities.The fund held no exposure to stocks in Denmark, which generally gained value. In the U.K., energy services
4
provider Subsea 7 was hurt when oil producers cut their exploration-and-production budgets due to falling oil prices.
From an industry group perspective, the fund fared especially well in the information technology and health care sectors. On the other hand, the materials sector hampered relative performance.
Valuations Are More Attractive
Recent economic and geopolitical concerns in Europe sparked a market correction toward the end of the reporting period. However, the U.S. dollar strengthened considerably compared to the euro and other major currencies, making imported products more competitively priced for U.S. buyers, and stock prices at the end of the reporting period appear to reflect investors’ global economic concerns. In our view, these circumstances may provide opportunities to purchase the stocks of fundamentally strong international companies at attractive valuations.We have found especially compelling opportunities among Japanese exporters and multinational corporations with a presence in faster growing parts of the world.
October 15, 2014
Please note, the position in any security highlighted with italicized typeface was sold during the reporting period. Equity funds are subject generally to market, market sector, market liquidity, issuer, and investment style risks, among other factors, to varying degrees, all of which are more fully described in the fund’s prospectus.
The fund’s performance will be influenced by political, social, and economic factors affecting investments in foreign companies. Special risks associated with investments in foreign companies include exposure to currency fluctuations, less liquidity, less developed or less efficient trading markets, lack of comprehensive company information, political instability, and differing auditing and legal standards.These risks are enhanced in emerging markets countries. Investments in foreign currencies are subject to the risk that those currencies will decline in value relative to the U.S. dollar, or, in the case of hedged positions, that the U.S. dollar will decline relative to the currency being hedged. Each of these risks could increase the fund’s volatility.
|
| 1 Total return includes reinvestment of dividends and any capital gains paid, and does not take into consideration the |
| maximum initial sales charge in the case of Class A shares, or the applicable contingent deferred sales charge imposed |
| on redemptions in the case of Class C shares. Had these charges been reflected, returns would have been lower. Past |
| performance is no guarantee of future results. Share price and investment return fluctuate such that upon redemption, |
| fund shares may be worth more or less than their original cost. Return figures provided reflect the absorption of certain |
| fund expenses by The Dreyfus Corporation and The Boston Company Asset Management, LLC. Had these |
| expenses not been absorbed, returns would have been lower. |
| 2 SOURCE: LIPPER INC. – Reflects reinvestment of net dividends and, where applicable, capital gain distributions. |
| The Morgan Stanley Capital International Europe,Australasia, Far East (MSCI EAFE) Index is an unmanaged |
| index composed of a sample of companies representative of the market structure of European and Pacific Basin |
| countries. Returns are calculated on a month-end basis. Investors cannot invest directly in any index. |
The Fund 5
FUND PERFORMANCE

|
| † Source: Lipper Inc. |
| Past performance is not predictive of future performance. |
| The above graph compares a $10,000 investment made in each of the Class A, Class C and Class I shares of Dreyfus |
| International Equity Fund on 9/30/04 to a $10,000 investment made in the Morgan Stanley Capital International |
| Europe Australasia Far East Index (the “Index”) on that date.All dividends and capital gain distributions are reinvested. |
| Prior to 8/1/07, the fund invested its assets in a “master portfolio” that had the same investment objective and |
| policies as the fund. This master/feeder arrangement was terminated on 8/1/07 and the fund operates as a |
| stand alone fund. Performance information represents the performance of the predecessor master portfolio (and its |
| predecessor fund) and the expenses of the master portfolio’s predecessor fund through January 31, 2003, and the |
| fund’s performance and expense structure thereafter. The master portfolio’s predecessor fund contributed all of its |
| assets to the master portfolio before the fund commenced investment operations on 2/1/03. |
| The fund’s performance shown in the line graph above takes into account the maximum initial sales charge on Class A |
| shares and all other applicable fees and expenses on all classes.The Index is an unmanaged index composed of a sample |
| of companies representative of the market structure of European and Pacific Basin countries. Unlike a mutual fund, the |
| Index is not subject to charges, fees and other expenses. Investors cannot invest directly in any index. Further information |
| relating to fund performance, including expense reimbursements, if applicable, is contained in the Financial Highlights |
| section of the prospectus and elsewhere in this report. |
6
| | | | | | |
| Average Annual Total Returns as of 9/30/14 | | | | | | |
| |
| | 1 Year | | 5 Years | | 10 Years | |
| Class A shares | | | | | | |
| with maximum sales charge (5.75%) | 1.43 | % | 7.12 | % | 5.30 | % |
| without sales charge | 7.62 | % | 8.39 | % | 5.92 | % |
| Class C shares | | | | | | |
| with applicable redemption charge † | 5.78 | % | 7.55 | % | 5.10 | % |
| without redemption | 6.78 | % | 7.55 | % | 5.10 | % |
| Class I shares | 7.91 | % | 8.68 | % | 6.19 | % |
| Morgan Stanley Capital International | | | | | | |
| Europe Australasia Far East Index | 4.25 | % | 6.56 | % | 6.32 | % |
Past performance is not predictive of future performance.The fund’s performance shown in the graph and table does not reflect the deduction of taxes that a shareholder would pay on fund distributions or the redemption of fund shares. In addition to the performance of Class A shares shown with and without a maximum sales charge, the fund’s performance shown in the table takes into account all other applicable fees and expenses on all classes.
|
| † The maximum contingent deferred sales charge for Class C shares is 1% for shares redeemed within one year of the |
| date of purchase. |
The Fund 7
UNDERSTANDING YOUR FUND’S EXPENSES (Unaudited)
As a mutual fund investor, you pay ongoing expenses, such as management fees and other expenses. Using the information below, you can estimate how these expenses affect your investment and compare them with the expenses of other funds.You also may pay one-time transaction expenses, including sales charges (loads) and redemption fees, which are not shown in this section and would have resulted in higher total expenses. For more information, see your fund’s prospectus or talk to your financial adviser.
Review your fund’s expenses
The table below shows the expenses you would have paid on a $1,000 investment in Dreyfus International Equity Fund from April 1, 2014 to September 30, 2014. It also shows how much a $1,000 investment would be worth at the close of the period, assuming actual returns and expenses.
Expenses and Value of a $1,000 Investment
assuming actual returns for the six months ended September 30, 2014
| | | | | | |
| | | Class A | | Class C | | Class I |
| Expenses paid per $1,000† | $ | 5.56 | $ | 9.42 | $ | 4.22 |
| Ending value (after expenses) | $ | 981.30 | $ | 977.30 | $ | 982.80 |
COMPARING YOUR FUND’S EXPENSES
WITH THOSE OF OTHER FUNDS (Unaudited)
Using the SEC’s method to compare expenses
The Securities and Exchange Commission (SEC) has established guidelines to help investors assess fund expenses. Per these guidelines, the table below shows your fund’s expenses based on a $1,000 investment, assuming a hypothetical 5% annualized return. You can use this information to compare the ongoing expenses (but not transaction expenses or total cost) of investing in the fund with those of other funds. All mutual fund shareholder reports will provide this information to help you make this comparison. Please note that you cannot use this information to estimate your actual ending account balance and expenses paid during the period.
Expenses and Value of a $1,000 Investment
assuming a hypothetical 5% annualized return for the six months ended September 30, 2014
| | | | | | |
| | | Class A | | Class C | | Class I |
| Expenses paid per $1,000† | $ | 5.67 | $ | 9.60 | $ | 4.31 |
| Ending value (after expenses) | $ | 1,019.45 | $ | 1,015.54 | $ | 1,020.81 |
|
| † Expenses are equal to the fund’s annualized expense ratio of 1.12% for Class A, 1.90% for Class C and .85% |
| for Class I, multiplied by the average account value over the period, multiplied by 183/365 (to reflect the one-half |
| year period). |
8
|
| STATEMENT OF INVESTMENTS |
| September 30, 2014 |
| | | |
| Common Stocks—97.6% | Shares | | Value ($) |
| Australia—7.2% | | | |
| ASX | 46,800 | | 1,469,389 |
| Dexus Property Group | 2,499,510 | | 2,429,173 |
| Fortescue Metals Group | 402,370 | | 1,225,986 |
| Insurance Australia Group | 669,360 | | 3,586,673 |
| Rio Tinto | 119,316 | | 6,224,147 |
| Spark Infrastructure Group | 1,171,520 | | 1,887,331 |
| Westpac Banking | 170,210 | | 4,789,736 |
| | | | 21,612,435 |
| Belgium—1.1% | | | |
| Solvay | 21,310 | | 3,281,029 |
| France—11.1% | | | |
| Airbus Group | 60,380 | | 3,799,441 |
| AXA | 205,290 | | 5,058,805 |
| Cap Gemini | 31,800 | | 2,282,589 |
| Carrefour | 119,970 | | 3,706,398 |
| Electricite de France | 89,890 | | 2,948,535 |
| Safran | 45,120 | | 2,928,101 |
| Societe Generale | 132,150 | | 6,746,622 |
| Thales | 66,470 | | 3,540,819 |
| Unibail-Rodamco | 9,120 | | 2,346,436 |
| | | | 33,357,746 |
| Germany—9.3% | | | |
| Allianz | 25,200 | | 4,085,256 |
| Bayer | 27,570 | | 3,861,813 |
| Commerzbank | 406,530 | a | 6,079,491 |
| Continental | 10,670 | | 2,030,282 |
| Deutsche Lufthansa | 82,750 | | 1,306,997 |
| Evonik Industries | 32,240 | | 1,117,383 |
| HeidelbergCement | 35,960 | | 2,376,349 |
| Infineon Technologies | 182,660 | | 1,890,207 |
| OSRAM Licht | 31,630 | a | 1,178,340 |
| Siemens | 34,060 | | 4,059,771 |
| | | | 27,985,889 |
| Hong Kong—3.4% | | | |
| BOC Hong Kong Holdings | 737,500 | | 2,350,738 |
| Cheung Kong Holdings | 192,000 | | 3,162,559 |
The Fund 9
STATEMENT OF INVESTMENTS (continued)
| | | |
| Common Stocks (continued) | Shares | | Value ($) |
| Hong Kong (continued) | | | |
| SJM Holdings | 2,539,000 | | 4,839,398 |
| | | | 10,352,695 |
| Ireland—1.0% | | | |
| Smurfit Kappa Group | 138,000 | | 3,025,009 |
| Israel—1.4% | | | |
| Teva Pharmaceutical Industries, ADR | 78,450 | | 4,216,688 |
| Italy—3.9% | | | |
| Enel | 541,000 | | 2,871,284 |
| Eni | 223,680 | | 5,331,163 |
| Telecom Italia | 2,970,780 | a | 3,405,180 |
| | | | 11,607,627 |
| Japan—22.5% | | | |
| Aisin Seiki | 87,800 | | 3,166,164 |
| Asahi Glass | 495,000 | | 2,683,629 |
| Fujitsu | 495,000 | | 3,046,501 |
| Hitachi | 505,000 | | 3,856,280 |
| Honda Motor | 141,100 | | 4,888,808 |
| INPEX | 348,300 | | 4,920,819 |
| Isuzu Motors | 138,000 | | 1,950,308 |
| Japan Tobacco | 117,900 | | 3,834,505 |
| KDDI | 87,800 | | 5,278,007 |
| Mitsubishi Electric | 316,000 | | 4,208,051 |
| Nippon Shokubai | 109,000 | | 1,212,491 |
| Nippon Telegraph & Telephone | 24,400 | | 1,517,505 |
| Omron | 55,500 | | 2,520,082 |
| Panasonic | 254,700 | | 3,029,461 |
| Secom | 67,900 | | 4,044,593 |
| Seven & I Holdings | 92,900 | | 3,603,343 |
| Shionogi & Co. | 152,800 | | 3,505,309 |
| Sumitomo Metal Mining | 78,000 | | 1,098,081 |
| Sumitomo Mitsui Financial Group | 186,500 | | 7,602,840 |
| TDK | 30,500 | | 1,701,938 |
| | | | 67,668,715 |
| Netherlands—2.9% | | | |
| ING Groep | 216,120 | a | 3,087,312 |
| Koninklijke Philips | 146,480 | | 4,674,342 |
10
| | | |
| Common Stocks (continued) | Shares | | Value ($) |
| Netherlands (continued) | | | |
| NN Group | 32,860 | | 953,555 |
| | | | 8,715,209 |
| Singapore—.4% | | | |
| Singapore Exchange | 222,000 | | 1,258,180 |
| Spain—1.6% | | | |
| ACS Actividades de Construccion y Servicios | 62,535 | | 2,402,732 |
| Repsol | 95,340 | | 2,263,893 |
| | | | 4,666,625 |
| Sweden—2.1% | | | |
| Nordea Bank | 274,760 | | 3,575,383 |
| Svenska Cellulosa, Cl. B | 115,370 | | 2,751,549 |
| | | | 6,326,932 |
| Switzerland—7.8% | | | |
| Adecco | 37,610 | a | 2,554,738 |
| Novartis | 105,410 | | 9,953,610 |
| Roche Holding | 25,000 | | 7,413,324 |
| Swiss Life Holding | 14,070 | a | 3,363,123 |
| | | | 23,284,795 |
| United Kingdom—20.5% | | | |
| AstraZeneca | 46,400 | | 3,340,935 |
| Aviva | 298,670 | | 2,534,713 |
| British Sky Broadcasting Group | 219,620 | | 3,140,226 |
| Compass Group | 141,160 | | 2,280,391 |
| Drax Group | 316,150 | | 3,313,463 |
| Imperial Tobacco Group | 87,050 | | 3,759,442 |
| ITV | 753,910 | | 2,539,718 |
| National Grid | 262,844 | | 3,783,829 |
| Prudential | 223,460 | | 4,984,696 |
| Reckitt Benckiser Group | 60,720 | | 5,266,305 |
| Royal Bank of Scotland Group | 1,267,770 | a | 7,567,365 |
| SABMiller | 69,710 | | 3,873,971 |
| Subsea 7 | 153,120 | | 2,186,662 |
| Unilever | 173,870 | | 7,286,276 |
| Whitbread | 30,080 | | 2,025,652 |
| WPP | 179,630 | | 3,610,946 |
| | | | 61,494,590 |
The Fund 11
STATEMENT OF INVESTMENTS (continued)
| | | |
| Common Stocks (continued) | Shares | | Value ($) |
| United States—1.4% | | | |
| iShares MSCI EAFE ETF | 66,520 | | 4,265,262 |
| Total Common Stocks | | | |
| (cost $287,041,976) | | | 293,119,426 |
| |
| Preferred Stocks—1.2% | | | |
| Germany | | | |
| Volkswagen | | | |
| (cost $4,119,557) | 16,870 | | 3,502,997 |
| |
| Other Investment—.8% | | | |
| Registered Investment Company; | | | |
| Dreyfus Institutional Preferred | | | |
| Plus Money Market Fund | | | |
| (cost $2,415,052) | 2,415,052 | b | 2,415,052 |
| Total Investments (cost $293,576,585) | 99.6 | % | 299,037,475 |
| Cash and Receivables (Net) | .4 | % | 1,215,266 |
| Net Assets | 100.0 | % | 300,252,741 |
ADR—American Depository Receipts
ETF—Exchange-Traded Funds
| |
| a | Non-income producing security. |
| b | Investment in affiliated money market mutual fund. |
| | | |
| Portfolio Summary (Unaudited)† | | |
| |
| | Value (%) | | Value (%) |
| Financial | 25.6 | Energy | 4.9 |
| Industrial | 12.5 | Utilities | 4.9 |
| Consumer Discretionary | 12.3 | Telecommunications | 3.4 |
| Consumer Staples | 11.4 | Exchange-Traded Funds | 1.4 |
| Health Care | 10.8 | Money Market Investment | .8 |
| Materials | 6.5 | | |
| Information Technology | 5.1 | | 99.6 |
| |
| † Based on net assets. | | | |
| See notes to financial statements. | | | |
12
|
| STATEMENT OF ASSETS AND LIABILITIES |
| September 30, 2014 |
| | | | |
| | | Cost | Value | |
| Assets ($): | | | | |
| Investments in securities—See Statement of Investments: | | | |
| Unaffiliated issuers | | 291,161,533 | 296,622,423 | |
| Affiliated issuers | | 2,415,052 | 2,415,052 | |
| Cash denominated in foreign currencies | | 1,051,941 | 1,028,035 | |
| Receivable for investment securities sold | | | 1,483,544 | |
| Dividends receivable | | | 982,718 | |
| Receivable for shares of Beneficial Interest subscribed | | 607,375 | |
| Unrealized appreciation on forward foreign | | | | |
| currency exchange contracts—Note 4 | | | 93 | |
| Prepaid expenses | | | 12,707 | |
| | | | 303,151,947 | |
| Liabilities ($): | | | | |
| Due to The Boston Company Asset | | | | |
| Management, LLC and affiliates—Note 3(c) | | | 224,133 | |
| Due to Administrator—Note 3(a) | | | 25,107 | |
| Cash overdraft due to Custodian | | | 31 | |
| Payable for investment securities purchased | | | 2,546,267 | |
| Payable for shares of Beneficial Interest redeemed | | | 9,684 | |
| Unrealized depreciation on forward foreign | | | | |
| currency exchange contracts—Note 4 | | | 1,365 | |
| Accrued expenses | | | 92,619 | |
| | | | 2,899,206 | |
| Net Assets ($) | | | 300,252,741 | |
| Composition of Net Assets ($): | | | | |
| Paid-in capital | | | 328,120,151 | |
| Accumulated undistributed investment income—net | | | 3,396,563 | |
| Accumulated net realized gain (loss) on investments | | | (36,658,566 | ) |
| Accumulated net unrealized appreciation (depreciation) | | | |
| on investments and foreign currency transactions | | | 5,394,593 | |
| Net Assets ($) | | | 300,252,741 | |
| |
| |
| Net Asset Value Per Share | | | | |
| | Class A | Class C | Class I | |
| Net Assets ($) | 77,194,886 | 8,887,410 | 214,170,445 | |
| Shares Outstanding | 2,162,845 | 248,287 | 5,944,775 | |
| Net Asset Value Per Share ($) | 35.69 | 35.79 | 36.03 | |
| |
| See notes to financial statements. | | | | |
The Fund 13
| | |
| STATEMENT OF OPERATIONS | | |
| Year Ended September 30, 2014 | | |
| |
| |
| |
| |
| Investment Income ($): | | |
| Income: | | |
| Cash dividends (net of $511,294 foreign taxes withheld at source): | | |
| Unaffiliated issuers | 6,517,891 | |
| Affiliated issuers | 2,322 | |
| Total Income | 6,520,213 | |
| Expenses: | | |
| Investment advisory fee—Note 3(a) | 2,055,319 | |
| Shareholder servicing costs—Note 3(c) | 310,018 | |
| Administration fee—Note 3(a) | 256,915 | |
| Custodian fees—Note 3(c) | 100,587 | |
| Professional fees | 99,239 | |
| Distribution fees—Note 3(b) | 56,441 | |
| Registration fees | 50,438 | |
| Prospectus and shareholders’ reports | 19,423 | |
| Trustees’ fees and expenses—Note 3(d) | 18,793 | |
| Loan commitment fees—Note 2 | 2,033 | |
| Interest expense—Note 2 | 78 | |
| Miscellaneous | 34,234 | |
| Total Expenses | 3,003,518 | |
| Less—reduction in expenses due to undertaking—Note 3(a) | (554,729 | ) |
| Less—reduction in fees due to earnings credits—Note 3(c) | (196 | ) |
| Net Expenses | 2,448,593 | |
| Investment Income—Net | 4,071,620 | |
| Realized and Unrealized Gain (Loss) on Investments—Note 4 ($): | | |
| Net realized gain (loss) on investments and foreign currency transactions | 26,176,761 | |
| Net realized gain (loss) on forward foreign currency exchange contracts | (4,334 | ) |
| Net Realized Gain (Loss) | 26,172,427 | |
| Net unrealized appreciation (depreciation) on | | |
| investments and foreign currency transactions | (16,439,176 | ) |
| Net unrealized appreciation (depreciation) on | | |
| forward foreign currency exchange contracts | (5,427 | ) |
| Net Unrealized Appreciation (Depreciation) | (16,444,603 | ) |
| Net Realized and Unrealized Gain (Loss) on Investments | 9,727,824 | |
| Net Increase in Net Assets Resulting from Operations | 13,799,444 | |
| |
| See notes to financial statements. | | |
14
STATEMENT OF CHANGES IN NET ASSETS
| | | | |
| | Year Ended September 30, | |
| | 2014 | | 2013 | |
| Operations ($): | | | | |
| Investment income—net | 4,071,620 | | 2,830,326 | |
| Net realized gain (loss) on investments | 26,172,427 | | 21,325,904 | |
| Net unrealized appreciation | | | | |
| (depreciation) on investments | (16,444,603 | ) | 15,330,060 | |
| Net Increase (Decrease) in Net Assets | | | | |
| Resulting from Operations | 13,799,444 | | 39,486,290 | |
| Dividends to Shareholders from ($): | | | | |
| Investment income—net: | | | | |
| Class A | (815,846 | ) | (916,011 | ) |
| Class C | (44,739 | ) | (80,162 | ) |
| Class I | (2,002,948 | ) | (3,155,753 | ) |
| Total Dividends | (2,863,533 | ) | (4,151,926 | ) |
| Beneficial Interest Transactions ($): | | | | |
| Net proceeds from shares sold: | | | | |
| Class A | 35,551,257 | | 13,668,773 | |
| Class C | 4,351,181 | | 749,103 | |
| Class I | 81,221,233 | | 6,671,312 | |
| Dividends reinvested: | | | | |
| Class A | 748,610 | | 850,275 | |
| Class C | 26,128 | | 45,067 | |
| Class I | 2,000,368 | | 3,153,209 | |
| Cost of shares redeemed: | | | | |
| Class A | (13,515,910 | ) | (8,319,736 | ) |
| Class C | (1,070,740 | ) | (1,249,053 | ) |
| Class I | (9,710,277 | ) | (27,211,978 | ) |
| Increase (Decrease) in Net Assets from | | | | |
| Beneficial Interest Transactions | 99,601,850 | | (11,643,028 | ) |
| Total Increase (Decrease) in Net Assets | 110,537,761 | | 23,691,336 | |
| Net Assets ($): | | | | |
| Beginning of Period | 189,714,980 | | 166,023,644 | |
| End of Period | 300,252,741 | | 189,714,980 | |
| Undistributed investment income—net | 3,396,563 | | 2,185,456 | |
The Fund 15
STATEMENT OF CHANGES IN NET ASSETS (continued)
| | | | |
| | Year Ended September 30, | |
| | 2014 | | 2013 | |
| Capital Share Transactions: | | | | |
| Class Aa | | | | |
| Shares sold | 986,190 | | 428,289 | |
| Shares issued for dividends reinvested | 20,952 | | 29,813 | |
| Shares redeemed | (374,866 | ) | (279,778 | ) |
| Net Increase (Decrease) in Shares Outstanding | 632,276 | | 178,324 | |
| Class Ca | | | | |
| Shares sold | 120,097 | | 24,273 | |
| Shares issued for dividends reinvested | 725 | | 1,564 | |
| Shares redeemed | (29,458 | ) | (41,009 | ) |
| Net Increase (Decrease) in Shares Outstanding | 91,364 | | (15,172 | ) |
| Class I | | | | |
| Shares sold | 2,226,017 | | 213,226 | |
| Shares issued for dividends reinvested | 55,566 | | 110,021 | |
| Shares redeemed | (265,527 | ) | (921,067 | ) |
| Net Increase (Decrease) in Shares Outstanding | 2,016,056 | | (597,820 | ) |
|
| a During the period ended September 30, 2013, 4,066 Class C shares representing $133,228 were exchanged for |
| 4,096 Class A shares. |
See notes to financial statements.
16
FINANCIAL HIGHLIGHTS
The following tables describe the performance for each share class for the fiscal periods indicated. All information (except portfolio turnover rate) reflects financial results for a single fund share.Total return shows how much your investment in the fund would have increased (or decreased) during each period, assuming you had reinvested all dividends and distributions.These figures have been derived from the fund’s financial statements.
| | | | | | | | | | |
| | | | Year Ended September 30, | | | |
| Class A Shares | 2014 | | 2013 | | 2012 | | 2011 | | 2010 | |
| Per Share Data ($): | | | | | | | | | | |
| Net asset value, beginning of period | 33.61 | | 27.34 | | 23.42 | | 26.30 | | 26.36 | |
| Investment Operations: | | | | | | | | | | |
| Investment income—neta | .50 | | .47 | | .54 | | .52 | | .42 | |
| Net realized and unrealized | | | | | | | | | | |
| gain (loss) on investments | 2.06 | | 6.52 | | 3.86 | | (2.81 | ) | .06 | |
| Total from Investment Operations | 2.56 | | 6.99 | | 4.40 | | (2.29 | ) | .48 | |
| Distributions: | | | | | | | | | | |
| Dividends from investment income—net | (.48 | ) | (.72 | ) | (.48 | ) | (.59 | ) | (.54 | ) |
| Net asset value, end of period | 35.69 | | 33.61 | | 27.34 | | 23.42 | | 26.30 | |
| Total Return (%)b | 7.62 | | 26.02 | | 19.12 | | (9.06 | ) | 1.84 | |
| Ratios/Supplemental Data (%): | | | | | | | | | | |
| Ratio of total expenses | | | | | | | | | | |
| to average net assets | 1.40 | | 1.46 | | 1.54 | | 1.50 | | 1.64 | |
| Ratio of net expenses | | | | | | | | | | |
| to average net assets | 1.12 | | 1.12 | | 1.12 | | 1.12 | | 1.12 | |
| Ratio of net investment income | | | | | | | | | | |
| to average net assets | 1.38 | | 1.55 | | 2.12 | | 1.86 | | 1.65 | |
| Portfolio Turnover Rate | 89.36 | | 71.87 | | 64.52 | | 89.90 | | 86.84 | |
| Net Assets, end of period ($ x 1,000) | 77,195 | | 51,441 | | 36,972 | | 37,389 | | 58,526 | |
| |
| a | Based on average shares outstanding. |
| b | Exclusive of sales charge. |
See notes to financial statements.
The Fund 17
FINANCIAL HIGHLIGHTS (continued)
| | | | | | | | | | |
| | | | Year Ended September 30, | | | |
| Class C Shares | 2014 | | 2013 | | 2012 | | 2011 | | 2010 | |
| Per Share Data ($): | | | | | | | | | | |
| Net asset value, beginning of period | 33.75 | | 27.45 | | 23.44 | | 26.30 | | 26.34 | |
| Investment Operations: | | | | | | | | | | |
| Investment income—neta | .24 | | .24 | | .34 | | .33 | | .22 | |
| Net realized and unrealized | | | | | | | | | | |
| gain (loss) on investments | 2.05 | | 6.55 | | 3.90 | | (2.85 | ) | .06 | |
| Total from Investment Operations | 2.29 | | 6.79 | | 4.24 | | (2.52 | ) | .28 | |
| Distributions: | | | | | | | | | | |
| Dividends from investment income—net | (.25 | ) | (.49 | ) | (.23 | ) | (.34 | ) | (.32 | ) |
| Net asset value, end of period | 35.79 | | 33.75 | | 27.45 | | 23.44 | | 26.30 | |
| Total Return (%)b | 6.78 | | 25.03 | | 18.24 | | (9.78 | ) | 1.03 | |
| Ratios/Supplemental Data (%): | | | | | | | | | | |
| Ratio of total expenses | | | | | | | | | | |
| to average net assets | 2.17 | | 2.27 | | 2.34 | | 2.27 | | 2.46 | |
| Ratio of net expenses | | | | | | | | | | |
| to average net assets | 1.90 | | 1.90 | | 1.90 | | 1.90 | | 1.90 | |
| Ratio of net investment income | | | | | | | | | | |
| to average net assets | .66 | | .77 | | 1.33 | | 1.16 | | .87 | |
| Portfolio Turnover Rate | 89.36 | | 71.87 | | 64.52 | | 89.90 | | 86.84 | |
| Net Assets, end of period ($ x 1,000) | 8,887 | | 5,297 | | 4,724 | | 5,348 | | 8,025 | |
| |
| a | Based on average shares outstanding. |
| b | Exclusive of sales charge. |
See notes to financial statements.
18
| | | | | | | | | | |
| | | | Year Ended September 30, | | | |
| Class I Shares | 2014 | | 2013 | | 2012 | | 2011 | | 2010 | |
| Per Share Data ($): | | | | | | | | | | |
| Net asset value, beginning of period | 33.85 | | 27.47 | | 23.58 | | 26.49 | | 26.60 | |
| Investment Operations: | | | | | | | | | | |
| Investment income—neta | .62 | | .54 | | .64 | | .68 | | .55 | |
| Net realized and unrealized | | | | | | | | | | |
| gain (loss) on investments | 2.06 | | 6.57 | | 3.86 | | (2.93 | ) | .00 | b |
| Total from Investment Operations | 2.68 | | 7.11 | | 4.50 | | (2.25 | ) | .55 | |
| Distributions: | | | | | | | | | | |
| Dividends from investment income—net | (.50 | ) | (.73 | ) | (.61 | ) | (.66 | ) | (.66 | ) |
| Net asset value, end of period | 36.03 | | 33.85 | | 27.47 | | 23.58 | | 26.49 | |
| Total Return (%) | 7.91 | | 26.36 | | 19.51 | | (8.86 | ) | 2.06 | |
| Ratios/Supplemental Data (%): | | | | | | | | | | |
| Ratio of total expenses | | | | | | | | | | |
| to average net assets | 1.04 | | 1.07 | | 1.10 | | 1.08 | | 1.20 | |
| Ratio of net expenses | | | | | | | | | | |
| to average net assets | .85 | | .85 | | .85 | | .85 | | .85 | |
| Ratio of net investment income | | | | | | | | | | |
| to average net assets | 1.70 | | 1.77 | | 2.49 | | 2.41 | | 2.13 | |
| Portfolio Turnover Rate | 89.36 | | 71.87 | | 64.52 | | 89.90 | | 86.84 | |
| Net Assets, end of period ($ x 1,000) | 214,170 | | 132,978 | | 124,328 | | 111,593 | | 77,931 | |
| |
| a | Based on average shares outstanding. |
| b | Amount represents less than $.01 per share. |
See notes to financial statements.
The Fund 19
NOTES TO FINANCIAL STATEMENTS
NOTE 1—Significant Accounting Policies:
Dreyfus International Equity Fund (the “fund”) is a separate diversified series of Dreyfus Stock Funds (the “Company”), which is registered under the Investment Company Act of 1940, as amended (the “Act”), as an open-end management investment company and operates as a series company currently offering two series, including the fund. The fund’s investment objective is to seek long-term growth of capital.The Boston Company Asset Management, LLC (“TBCAM”), a wholly-owned subsidiary of The Bank of NewYork Mellon Corporation (“BNY Mellon”), serves as the fund’s investment adviser. The Dreyfus Corporation (the “Administrator” or “Dreyfus”), a wholly-owned subsidiary of BNY Mellon and an affiliate of TBCAM, serves as the fund’s Administrator.
MBSC Securities Corporation (the “Distributor”), a wholly-owned subsidiary of Dreyfus, is the distributor of the fund’s shares. The fund is authorized to issue an unlimited number of $.001 par value shares of Beneficial Interest in each of the following classes of shares: Class A, Class C and Class I. Class A shares generally are subject to a sales charge imposed at the time of purchase. Class C shares are subject to a contingent deferred sales charge (“CDSC”) imposed on Class C shares redeemed within one year of purchase. Class I shares are sold at net asset value per share generally to institutional investors. Other differences between the classes include the services offered to and the expenses borne by each class, the allocation of certain transfer agency costs, and certain voting rights. Income, expenses (other than expenses attributable to a specific class), and realized and unrealized gains or losses on investments are allocated to each class of shares based on its relative net assets.
The Company accounts separately for the assets, liabilities and operations of each series. Expenses directly attributable to each series are
20
charged to that series’ operations; expenses which are applicable to all series are allocated among them on a pro rata basis.
The Financial Accounting Standards Board (“FASB”) Accounting Standards Codification (“ASC”) is the exclusive reference of authoritative U.S. generally accepted accounting principles (“GAAP”) recognized by the FASB to be applied by nongovernmental entities. Rules and interpretive releases of the Securities and Exchange Commission (“SEC”) under authority of federal laws are also sources of authoritative GAAP for SEC registrants. The fund’s financial statements are prepared in accordance with GAAP, which may require the use of management estimates and assumptions. Actual results could differ from those estimates.
The Company enters into contracts that contain a variety of indemnifications. The fund’s maximum exposure under these arrangements is unknown.The fund does not anticipate recognizing any loss related to these arrangements.
(a) Portfolio valuation: The fair value of a financial instrument is the amount that would be received to sell an asset or paid to transfer a liability in an orderly transaction between market participants at the measurement date (i.e., the exit price). GAAP establishes a fair value hierarchy that pri-oritizes the inputs of valuation techniques used to measure fair value.This hierarchy gives the highest priority to unadjusted quoted prices in active markets for identical assets or liabilities (Level 1 measurements) and the lowest priority to unobservable inputs (Level 3 measurements).
Additionally, GAAP provides guidance on determining whether the volume and activity in a market has decreased significantly and whether such a decrease in activity results in transactions that are not orderly. GAAP requires enhanced disclosures around valuation inputs and techniques used during annual and interim periods.
The Fund 21
NOTES TO FINANCIAL STATEMENTS (continued)
Various inputs are used in determining the value of the fund’s investments relating to fair value measurements.These inputs are summarized in the three broad levels listed below:
Level 1—unadjusted quoted prices in active markets for identical investments.
Level 2—other significant observable inputs (including quoted prices for similar investments, interest rates, prepayment speeds, credit risk, etc.).
Level 3—significant unobservable inputs (including the fund’s own assumptions in determining the fair value of investments).
The inputs or methodology used for valuing securities are not necessarily an indication of the risk associated with investing in those securities.
Changes in valuation techniques may result in transfers in or out of an assigned level within the disclosure hierarchy. Valuation techniques used to value the fund’s investments are as follows:
Investments in securities are valued at the last sales price on the securities exchange or national securities market on which such securities are primarily traded. Securities listed on the National Market System for which market quotations are available are valued at the official closing price or, if there is no official closing price that day, at the last sales price. Securities not listed on an exchange or the national securities market, or securities for which there were no transactions, are valued at the average of the most recent bid and asked prices, except for open short positions, where the asked price is used for valuation purposes. Bid price is used when no asked price is available. Registered investment companies that are not traded on an exchange are valued at their net asset value. All of the preceding securities are generally categorized within Level 1 of the fair value hierarchy.
Fair valuing of securities may be determined with the assistance of a pricing service using calculations based on indices of domestic securities and other appropriate indicators, such as prices of relevant ADRs and financial futures. Utilizing these techniques may result in transfers between Level 1 and Level 2 of the fair value hierarchy.
22
When market quotations or official closing prices are not readily available, or are determined not to reflect accurately fair value, such as when the value of a security has been significantly affected by events after the close of the exchange or market on which the security is principally traded (for example, a foreign exchange or market), but before the fund calculates its net asset value, the fund may value these investments at fair value as determined in accordance with the procedures approved by the Company’s Board of Trustees (the “Board”). Certain factors may be considered when fair valuing investments such as: fundamental analytical data, the nature and duration of restrictions on disposition, an evaluation of the forces that influence the market in which the securities are purchased and sold, and public trading in similar securities of the issuer or comparable issuers. These securities are either categorized within Level 2 or 3 of the fair value hierarchy depending on the relevant inputs used.
For restricted securities where observable inputs are limited, assumptions about market activity and risk are used and are generally categorized within Level 3 of the fair value hierarchy.
Investments denominated in foreign currencies are translated to U.S. dollars at the prevailing rates of exchange.
Forward foreign currency exchange contracts (“forward contracts”) are valued at the forward rate and are generally categorized within Level 2 of the fair value hierarchy.
The following is a summary of the inputs used as of September 30, 2014 in valuing the fund’s investments:
| | | | |
| | | Level 2—Other | Level 3— | |
| Level 1— | Significant | Significant | |
| Unadjusted | Observable | Unobservable | |
| Quoted Prices | Inputs | Inputs | Total |
| Assets ($) | | | | |
| Investments in Securities: | | | | |
| Equity Securities— | | | | |
| Foreign | | | | |
| Common Stocks† | 288,854,164 | — | — | 288,854,164 |
The Fund 23
NOTES TO FINANCIAL STATEMENTS (continued)
| | | | | | |
| | | Level 2—Other | | Level 3— | | |
| | Level 1— | Significant | | Significant | | |
| | Unadjusted | Observable | | Unobservable | | |
| | Quoted Prices | Inputs | | Inputs | Total | |
| Assets ($) (continued) | | | | | | |
| Investments in | | | | | | |
| Securities (continued): | | | | | | |
| Equity Securities— | | | | | | |
| Foreign | | | | | | |
| Preferred Stocks† | 3,502,997 | — | | — | 3,502,997 | |
| Exchange-Traded | | | | | | |
| Funds | 4,265,262 | — | | — | 4,265,262 | |
| Mutual Funds | 2,415,052 | — | | — | 2,415,052 | |
| Other Financial | | | | | | |
| Instruments: | | | | | | |
| Forward Foreign | | | | | | |
| Currency Exchange | | | | | | |
| Contracts†† | — | 93 | | — | 93 | |
| Liabilities ($) | | | | | | |
| Other Financial | | | | | | |
| Instruments: | | | | | | |
| Forward Foreign | | | | | | |
| Currency Exchange | | | | | | |
| Contracts†† | — | (1,365 | ) | — | (1,365 | ) |
| |
| † | See Statement of Investments for additional detailed categorizations. |
| †† | Amount shown represents unrealized appreciation (depreciation) at period end. |
At September 30, 2013, $178,172,875 of exchange traded foreign equity securities were classified within Level 2 of the fair value hierarchy pursuant to the fund’s fair valuation procedures.
(b) Foreign currency transactions: The fund does not isolate that portion of the results of operations resulting from changes in foreign exchange rates on investments from the fluctuations arising from changes in the market prices of securities held. Such fluctuations are included with the net realized and unrealized gain or loss on investments.
Net realized foreign exchange gains or losses arise from sales of foreign currencies, currency gains or losses realized on securities transactions between trade and settlement date, and the difference between the amounts of dividends, interest and foreign withholding taxes recorded on the fund’s books and the U.S. dollar equivalent of the amounts actu-
24
ally received or paid. Net unrealized foreign exchange gains and losses arise from changes in the value of assets and liabilities other than investments resulting from changes in exchange rates. Foreign currency gains and losses on foreign currency transactions are also included with net realized and unrealized gain or loss on investments.
(c) Securities transactions and investment income: Securities transactions are recorded on a trade date basis. Realized gains and losses from securities transactions are recorded on the identified cost basis. Dividend income is recognized on the ex-dividend date and interest income, including, where applicable, accretion of discount and amortization of premium on investments, is recognized on the accrual basis.
(d) Affiliated issuers: Investments in other investment companies advised by Dreyfus are defined as “affiliated” under the Act. Investments in affiliated investment companies during the period ended September 30, 2014 were as follows:
| | | | | |
| Affiliated | | | | | |
| Investment | Value | | | Value | Net |
| Company | 9/30/2013 b | Purchases ($) | Sales ($) | 9/30/2014 ($) | Assets (%) |
| Dreyfus | | | | | |
| Institutional | | | | | |
| Preferred | | | | | |
| Plus Money | | | | | |
| Market Fund | 1,270,158 | 101,059,655 | 99,914,761 | 2,415,052 | 8 |
Certain affiliated investment companies may also invest in the fund. At September 30, 2014, Dreyfus Diversified International Fund, an affiliate of the fund, held 5,050,094 Class I shares representing approximately 61% of the fund’s net assets.
(e) Risk: Investing in foreign markets may involve special risks and considerations not typically associated with investing in the U.S.These risks include revaluation of currencies, high rates of inflation, repatriation restrictions on income and capital, and adverse political and economic developments. Moreover, securities issued in these markets may be less liquid, subject to government ownership controls and delayed settlements, and their prices may be more volatile than those of comparable securities in the U.S.
The Fund 25
NOTES TO FINANCIAL STATEMENTS (continued)
(f) Dividends to shareholders: Dividends are recorded on the ex-dividend date. Dividends from investment income-net and dividends from net realized capital gains, if any, are normally declared and paid annually, but the fund may make distributions on a more frequent basis to comply with the distribution requirements of the Internal Revenue Code of 1986, as amended (the “Code”).To the extent that net realized capital gains can be offset by capital loss carryovers, it is the policy of the fund not to distribute such gains. Income and capital gain distributions are determined in accordance with income tax regulations, which may differ from GAAP.
(g) Federal income taxes: It is the policy of the fund to continue to qualify as a regulated investment company, if such qualification is in the best interests of its shareholders, by complying with the applicable provisions of the Code, and to make distributions of taxable income sufficient to relieve it from substantially all federal income and excise taxes.
As of and during the period ended September 30, 2014, the fund did not have any liabilities for any uncertain tax positions. The fund recognizes interest and penalties, if any, related to uncertain tax positions as income tax expense in the Statement of Operations. During the period ended September 30, 2014, the fund did not incur any interest or penalties.
Each tax year in the four-year period ended September 30, 2014 remains subject to examination by the Internal Revenue Service and state taxing authorities.
At September 30, 2014, the components of accumulated earnings on a tax basis were as follows: undistributed ordinary income $3,857,958, accumulated capital losses $36,643,431 and unrealized appreciation $4,918,063.
Under the Regulated Investment Company Modernization Act of 2010 (the “2010 Act”), the fund is permitted to carry forward capital losses incurred in taxable years beginning after December 22, 2010 (“post-enactment losses”) for an unlimited period. Furthermore, post-enactment capital loss carryovers retain their character as either short-term or long-term capital losses rather than short-term as they were under previous statute.The 2010 Act requires post-enactment losses to
26
be utilized before the utilization of losses incurred in taxable years prior to the effective date of the 2010 Act (“pre-enactment losses”).As a result of this ordering rule, pre-enactment losses may be more likely to expire unused.
The accumulated capital loss carryover is available for federal income tax purposes to be applied against future net realized capital gains, if any, realized subsequent to September 30, 2014. If not applied, the carryover expires in fiscal year 2018.
The tax character of distributions paid to shareholders during the fiscal periods ended September 30, 2014 and September 30, 2013 were as follows: ordinary income $2,863,533 and $4,151,926, respectively.
During the period ended September 30, 2014, as a result of permanent book to tax differences, primarily due to the tax treatment for passive foreign investment companies, foreign currency gains and losses and recognition of book to tax differences resulting from prior year fund restructuring, the fund increased accumulated undistributed investment income-net by $3,020, decreased accumulated net realized gain (loss) on investments by $7,279 and increased paid-in capital by $4,259. Net assets and net asset value per share were not affected by this reclassification.
NOTE 2—Bank Lines of Credit:
The fund participates with other Dreyfus-managed funds in a $265 million unsecured credit facility led by Citibank, N.A. and a $300 million unsecured credit facility provided by The Bank of New York Mellon, a subsidiary of BNY Mellon and an affiliate of Dreyfus (each, a “Facility”), each to be utilized primarily for temporary or emergency purposes, including the financing of redemptions. Prior to October 9, 2013, the unsecured credit facility with Citibank, N.A. was $210 million. In connection therewith, the fund has agreed to pay its pro rata portion of commitment fees for each Facility. Interest is charged to the fund based on rates determined pursuant to the terms of the respective Facility at the time of borrowing.
The Fund 27
NOTES TO FINANCIAL STATEMENTS (continued)
The average amount of borrowings outstanding under the Facilities during the period ended September 30, 2014 was approximately $7,100 with a related weighted average annualized interest rate of 1.10%.
NOTE 3—Investment Advisory Fee, Administration Fee and Other Transactions with Affiliates:
(a) Pursuant to an investment advisory agreement with TBCAM, the investment advisory fee is computed at the annual rate of .80% of the value of the fund’s average daily net assets up to $500 million, .75% of the next $500 million of such assets, .70% of the next $500 million of such assets, .60% of the next $500 million of such assets and .50% of the fund’s average daily net assets in excess of $2 billion and is payable monthly.The effective investment advisory fee rate during the period ended September 30, 2014 was .80%.
Dreyfus and TBCAM have contractually agreed, from October 1, 2013 through September 30, 2014, to assume the direct expenses of the fund, so that such expenses of Class A, Class C and Class I shares (excluding taxes, interest expense, brokerage commissions, commitment fees on borrowings and extraordinary expenses) do not exceed 1.12%, 1.90% and .85% of the value of the respective class’ average daily net assets, until the fiscal year end following such time as the expenses are equal to or less than such annual rate for the applicable class. The reduction in expenses, pursuant to the undertaking, amounted to $554,729 during the period ended September 30, 2014.
The fund compensates Dreyfus under an administration agreement for providing personnel and facilities to perform accounting and administration services for the fund at an annual rate of .10% of the value of the fund’s average daily net assets. Pursuant to the administration agreement, the fund was charged $256,915 during the period ended September 30, 2014.
During the period ended September 30, 2014, the Distributor retained $15,703 from commissions earned on sales of the fund’s Class A shares and $759 from CDSCs on redemptions of the fund’s Class C shares.
28
(b) Under the Distribution Plan adopted pursuant to Rule 12b-1 under the Act, Class C shares pay the Distributor for distributing its shares at an annual rate of .75% of the value of its average daily net assets. During the period ended September 30, 2014, Class C shares were charged $56,441 pursuant to the Distribution Plan.
(c) Under the Shareholder Services Plan, Class A and Class C shares pay the Distributor at an annual rate of .25% of the value of their average daily net assets for the provision of certain services.The services provided may include personal services relating to shareholder accounts, such as answering shareholder inquiries regarding the fund and providing reports and other information, and services related to the maintenance of shareholder accounts.The Distributor may make payments to Service Agents (securities dealers, financial institutions or other industry professionals) with respect to these services.The Distributor determines the amounts to be paid to Service Agents. During the period ended September 30, 2014, Class A and Class C shares were charged $170,772 and $18,813, respectively, pursuant to the Shareholder Services Plan.
The fund has arrangements with the transfer agent and the custodian whereby the fund may receive earnings credits when positive cash balances are maintained, which are used to offset transfer agency and custody fees. For financial reporting purposes, the fund includes net earnings credits as an expense offset in the Statement of Operations.
The fund compensates Dreyfus Transfer, Inc., a wholly-owned subsidiary of Dreyfus, under a transfer agency agreement for providing transfer agency and cash management services for the fund.The majority of transfer agency fees are comprised of amounts paid on a per account basis, while cash management fees are related to fund subscriptions and redemptions. During the period ended September 30, 2014, the fund was charged $47,016 for transfer agency services and $2,842 for cash management services. These fees are included in Shareholder servicing costs in the Statement of Operations. Cash management fees were partially offset by earnings credits of $196.
The Fund 29
NOTES TO FINANCIAL STATEMENTS (continued)
The fund compensates The Bank of NewYork Mellon under a custody agreement for providing custodial services for the fund.These fees are determined based on net assets, geographic region and transaction activity. During the period ended September 30, 2014, the fund was charged $100,587 pursuant to the custody agreement.
During the period ended September 30, 2014, the fund was charged $8,107 for services performed by the Chief Compliance Officer and his staff.
The components of “Due to TBCAM and affiliates” in the Statement of Assets and Liabilities consist of: investment advisory fees $200,855, Distribution Plan fees $5,508, Shareholder Services Plan fees $18,104, custodian fees $45,664, Chief Compliance Officer fees $1,730 and transfer agency fees $9,571, which are offset against an expense reimbursement currently in effect in the amount of $57,299.
(d) Each Board member also serves as a Board member of other funds within the Dreyfus complex. Annual retainer fees and attendance fees are allocated to each fund based on net assets.
NOTE 4—Securities Transactions:
The aggregate amount of purchases and sales of investment securities, excluding short-term securities and forward contracts, during the period ended September 30, 2014, amounted to $327,132,050 and $225,704,542, respectively.
Derivatives: A derivative is a financial instrument whose performance is derived from the performance of another asset. Each type of derivative instrument that was held by the fund during the period ended September 30, 2014 is discussed below.
Master Netting Arrangements: The fund enters into International Swaps and Derivatives Association, Inc. Master Agreements or similar
30
agreements (collectively, “Master Agreements”) with its over-the counter (“OTC”) derivative contract counterparties in order to, among other things, reduce its credit risk to counterparties. Master Agreements include provisions for general obligations, representations, collateral and events of default or termination. Under a Master Agreement, the fund may offset with the counterparty certain derivative financial instrument’s payables and/or receivables with collateral held and/or posted and create one single net payment in the event of default or termination.
Forward Foreign Currency Exchange Contracts: The fund enters into forward contracts in order to hedge its exposure to changes in foreign currency exchange rates on its foreign portfolio holdings, to settle foreign currency transactions or as a part of its investment strategy.When executing forward contracts, the fund is obligated to buy or sell a foreign currency at a specified rate on a certain date in the future.With respect to sales of forward contracts, the fund incurs a loss if the value of the contract increases between the date the forward contract is opened and the date the forward contract is closed. The fund realizes a gain if the value of the contract decreases between those dates. With respect to purchases of forward contracts, the fund incurs a loss if the value of the contract decreases between the date the forward contract is opened and the date the forward contract is closed. The fund realizes a gain if the value of the contract increases between those dates. Any realized or unrealized gains or losses which occurred during the period are reflected in the Statement of Operations.The fund is exposed to foreign currency risk as a result of changes in value of underlying financial instruments. The fund is also exposed to credit risk associated with counterparty nonperformance on these forward contracts, which is generally limited to the unrealized gain on each open contract.The risk is mitigated by
The Fund 31
NOTES TO FINANCIAL STATEMENTS (continued)
Master Agreements between the fund and the counterparty.The following summarizes open forward contracts at September 30, 2014:
| | | | | |
| | Foreign | | | Unrealized | |
| Forward Foreign Currency | Currency | | | Appreciation | |
| Exchange Contracts | Amounts | Proceeds ($) | Value ($) | (Depreciation) ($) | |
| Sales: | | | | | |
| Australian Dollar, | | | | | |
| Expiring 10/2/2014a | 298,152 | 260,585 | 261,047 | (462 | ) |
| British Pound, | | | | | |
| Expiring 10/2/2014b | 127,263 | 206,404 | 206,311 | 93 | |
| Euro, | | | | | |
| Expiring 10/2/2014b | 1,277,259 | 1,612,348 | 1,613,251 | (903 | ) |
| Gross Unrealized | | | | | |
| Appreciation | | | | 93 | |
| Gross Unrealized | | | | | |
| Depreciation | | | | (1,365 | ) |
Counterparties:
| |
| a | Goldman Sachs International |
| b | JP Morgan Chase Bank |
The provisions of ASC Topic 210 “Disclosures about Offsetting Assets and Liabilities” require disclosure on the offsetting of financial assets and liabilities.These disclosures are required for certain investments, including derivative financial instruments subject to Master Agreements which are eligible for offsetting in the Statement of Assets and Liabilities and require the fund to disclose both gross and net information with respect to such investments. For financial reporting purposes, the fund does not offset derivative assets and derivative liabilities that are subject to Master Agreements in the Statement of Asset and Liabilities.
At September 30, 2014, derivative assets and liabilities (by type) on a gross basis are as follows:
| | | |
| Derivative Financial Instruments: | Assets ($) | Liabilities ($) | |
| Forward contracts | 93 | (1,365 | ) |
| Total gross amount of derivative | | | |
| assets and liabilities in the | | | |
| Statement of Assets and Liabilities | 93 | (1,365 | ) |
| Derivatives not subject to | | | |
| Master Agreements | — | — | |
| Total gross amount of assets and liabilities | | | |
| subject to Master Agreements | 93 | (1,365 | ) |
32
The following tables present derivative assets and liabilities net of amounts available for offsetting under Master Agreements and net of related collateral received or pledged, if any, as of September 30, 2014:
| | | | | | | |
| | | | Financial | | | | |
| | | | Instruments | | | | |
| | | | and | | | | |
| | | | Derivatives | | | | |
| | Gross Amount of | | Available | | Collateral | Net Amount | |
| Counterparty | Assets ($)1 | | for Offset ($) | | Received ($)2 | of Assets ($) | |
| JP Morgan Chase Bank | 93 | | (93 | ) | — | — | |
| Total | 93 | | (93 | ) | — | — | |
| |
| |
| | | | Financial | | | | |
| | | | Instruments | | | | |
| | | | and | | | | |
| | | | Derivatives | | | | |
| | Gross Amount of | | Available | | Collateral | Net Amount of | |
| Counterparties | Liabilities ($)1 | | for Offset ($) | | Pledged ($)2 | Liabilities ($) | |
| Goldman Sachs | | | | | | | |
| International | (462 | ) | — | | — | (462 | ) |
| JP Morgan Chase Bank | (903 | ) | 93 | | — | (810 | ) |
| Total | (1,365 | ) | 93 | | — | (1,272 | ) |
| |
| 1 | Absent a default event or early termination, over-the counter derivative assets and liabilities are |
| | presented at gross amounts and are not offset in the Statement of Assets and Liabilities. |
| 2 | In some instances, the actual collateral received and/or pledged may be more than the amount |
| | shown due to overcollateralization. |
The following summarizes the average market value of derivatives outstanding during the period ended September 30, 2014:
| |
| | Average Market Value ($) |
| Forward contracts | 1,742,830 |
At September 30, 2014, the cost of investments for federal income tax purposes was $294,053,115; accordingly, accumulated net unrealized appreciation on investments was $4,984,360, consisting of $17,295,581 gross unrealized appreciation and $12,311,221 gross unrealized depreciation.
The Fund 33
|
| REPORT OF INDEPENDENT REGISTERED |
| PUBLIC ACCOUNTING FIRM |
Shareholders and Board of Trustees
Dreyfus International Equity Fund
We have audited the accompanying statement of assets and liabilities, including the statement of investments, of Dreyfus International Equity Fund (one of the series comprising Dreyfus Stock Funds) as of September 30, 2014, and the related statement of operations for the year then ended, the statement of changes in net assets for each of the two years in the period then ended, and the financial highlights for each of the five years in the period then ended. These financial statements and financial highlights are the responsibility of the Fund’s management. Our responsibility is to express an opinion on these financial statements and financial highlights based on our audits.
We conducted our audits in accordance with the standards of the Public Company Accounting Oversight Board (United States). Those standards require that we plan and perform the audit to obtain reasonable assurance about whether the financial statements and financial highlights are free of material misstatement. We were not engaged to perform an audit of the Fund’s internal control over financial reporting. Our audits included consideration of internal control over financial reporting as a basis for designing audit procedures that are appropriate in the circumstances, but not for the purpose of expressing an opinion on the effectiveness of the Fund’s internal control over financial reporting. Accordingly, we express no such opinion. An audit also includes examining, on a test basis, evidence supporting the amounts and disclosures in the financial statements and financial highlights, assessing the accounting principles used and significant estimates made by management, and evaluating the overall financial statement presentation. Our procedures included confirmation of securities owned as of September 30, 2014 by correspondence with the custodian and others. We believe that our audits provide a reasonable basis for our opinion.
In our opinion, the financial statements and financial highlights referred to above present fairly, in all material respects, the financial position of Dreyfus International Equity Fund at September 30, 2014, the results of its operations for the year then ended, the changes in its net assets for each of the two years in the period then ended, and the financial highlights for each of the five years in the period then ended, in conformity with U.S. generally accepted accounting principles.

New York, New York
November 25, 2014
34
IMPORTANT TAX INFORMATION (Unaudited)
In accordance with federal tax law, the fund elects to provide each shareholder with their portion of the fund’s foreign taxes paid and the income sourced from foreign countries. Accordingly, the fund hereby reports the following information regarding its fiscal year ended September 30, 2014:
—the total amount of taxes paid to foreign countries was $508,757.
—the total amount of income sourced from foreign countries was $6,861,032.
As required by federal tax law rules, shareholders will receive notification of their proportionate share of foreign taxes paid and foreign sourced income for the 2014 calendar year with Form 1099-DIV which will be mailed in early 2015.Also, certain dividends paid by the fund may be subject to a maximum tax rate of 15%, as provided for by the Jobs and Growth Tax Relief Reconciliation Act of 2003. Of the distributions paid during the fiscal year, $2,863,533 represents the maximum amount that may be considered qualified dividend income.
The Fund 35
|
| BOARD MEMBERS INFORMATION (Unaudited) |
| INDEPENDENT BOARD MEMBERS |
|
| Joseph S. DiMartino (70) |
| Chairman of the Board (2003) |
| Principal Occupation During Past 5Years: |
| • Corporate Director and Trustee (1995-present) |
| Other Public Company Board Memberships During Past 5Years: |
| • CBIZ (formerly, Century Business Services, Inc.), a provider of outsourcing functions for small |
| and medium size companies, Director (1997-present) |
| • The Newark Group, a provider of a national market of paper recovery facilities, paperboard |
| mills and paperboard converting plants, Director (2000-2010) |
| • Sunair Services Corporation, a provider of certain outdoor-related services to homes and |
| businesses, Director (2005-2009) |
| No. of Portfolios for which Board Member Serves: 145 |
| ——————— |
| William Hodding Carter III (79) |
| Board Member (2003) |
| Principal Occupation During Past 5Years: |
| • Professor of Leadership & Public Policy, University of North Carolina, Chapel Hill (2006-present) |
| No. of Portfolios for which Board Member Serves: 24 |
| ——————— |
| Joni Evans (72) |
| Board Member (2006) |
| Principal Occupation During Past 5Years: |
| • Chief Executive Officer, www.wowOwow.com an online community dedicated to women’s |
| conversations and publications (2007-present) |
| • Principal, Joni Evans Ltd. (publishing) (2006-present) |
| No. of Portfolios for which Board Member Serves: 24 |
36
|
| Ehud Houminer (74) |
| Board Member (2003) |
| Principal Occupation During Past 5Years: |
| • Executive-in-Residence at the Columbia Business School, Columbia University (1992-present) |
| Other Public Company Board Membership During Past 5Years: |
| • Avnet Inc., an electronics distributor, Director (1993-2012) |
| No. of Portfolios for which Board Member Serves: 62 |
| ——————— |
| Richard C. Leone (74) |
| Board Member (1984) |
| Principal Occupation During Past 5Years: |
| • Senior Fellow and former President of The Century Foundation (formerly,The Twentieth |
| Century Fund, Inc.), a tax exempt research foundation engaged in the study of economic, |
| foreign policy and domestic issues (2011-present) |
| • President—The Century Foundation (1989-2011) |
| No. of Portfolios for which Board Member Serves: 24 |
| ——————— |
| Hans C. Mautner (76) |
| Board Member (2003) |
| Principal Occupation During Past 5Years: |
| • President—International Division and an Advisory Director of Simon Property Group, a real |
| estate investment company (1998-2010) |
| • Chairman and Chief Executive Officer of Simon Global Limited, a real estate company (1999-2010) |
| No. of Portfolios for which Board Member Serves: 24 |
| ——————— |
| Robin A. Melvin (51) |
| Board Member (2003) |
| Principal Occupation During Past 5Years: |
| • Board Member, Illinois Mentoring Partnership, non-profit organization dedicated to increasing |
| the quantity and quality of mentoring services in Illinois (2013-present) |
| • Director, Boisi Family Foundation, a private family foundation that supports youth-serving orga- |
| nizations that promote the self sufficiency of youth from disadvantaged circumstances (1995-2012) |
| No. of Portfolios for which Board Member Serves: 112 |
The Fund 37
|
| BOARD MEMBERS INFORMATION (Unaudited) (continued) |
| INDEPENDENT BOARD MEMBERS (continued) |
|
| Burton N. Wallack (63) |
| Board Member (2006) |
| Principal Occupation During Past 5Years: |
| • President and Co-owner of Wallack Management Company, a real estate management |
| company (1987-present) |
| No. of Portfolios for which Board Member Serves: 24 |
| ——————— |
| John E. Zuccotti (77) |
| Board Member (2003) |
| Principal Occupation During Past 5Years: |
| • Chairman of Brookfield Properties, Inc. (1996-present) |
| • Senior Counsel of Weil, Gotshal & Manges, LLP (1997-present) |
| Other Public Company Board Membership During Past 5Years: |
| • Wellpoint, Inc., a health benefits company, Director (2005-2010) |
| No. of Portfolios for which Board Member Serves: 24 |
38
INTERESTED BOARD MEMBER
|
| Gordon J. Davis (73) |
| Board Member (2006) |
| Principal Occupation During Past 5Years: |
| • Partner in the law firm of Venable LLP (2012-present) |
| • Partner in the law firm of Dewey & LeBoeuf LLP (1994-2012) |
| Other Public Company Board Memberships During Past 5Years: |
| • Consolidated Edison, Inc., a utility company, Director (1997-present) |
| • The Phoenix Companies, Inc., a life insurance company, Director (2000-present) |
| No. of Portfolios for which Board Member Serves: 62 |
| |
| Gordon J. Davis is deemed to be an “interested person” (as defined in the Act) of the fund as a result of his affiliation |
| with Venable LLP, which provides legal services to the fund. |
| |
| ——————— |
| Once elected all Board Members serve for an indefinite term, but achieve Emeritus status upon reaching age 80.The |
| address of the Board Members and Officers is c/o The Dreyfus Corporation, 200 Park Avenue, NewYork, NewYork |
| 10166.Additional information about the Board Members is available in the fund’s Statement of Additional Information |
| which can be obtained from Dreyfus free of charge by calling this toll free number: 1-800-DREYFUS. |
| Arnold S. Hiatt, Emeritus Board Member |
The Fund 39
OFFICERS OF THE FUND (Unaudited)
BRADLEY J. SKAPYAK, President since January 2010.
Chief Operating Officer and a director of the Manager since June 2009, Chairman of Dreyfus Transfer, Inc., an affiliate of the Manager and the transfer agent of the funds, since May 2011 and Executive Vice President of the Distributor since June 2007. From April 2003 to June 2009, Mr. Skapyak was the head of the Investment Accounting and Support Department of the Manager. He is an officer of 69 investment companies (comprised of 145 portfolios) managed by the Manager. He is 55 years old and has been an employee of the Manager since February 1988.
JOHN PAK, Chief Legal Officer since March 2013.
Deputy General Counsel, Investment Management, of BNY Mellon since August 2014; Chief Legal Officer of the Manager since August 2012; from March 2005 to July 2012, Managing Director of Deutsche Bank, Deputy Global Head of Deutsche Asset Management Legal and Regional Head of Deutsche Asset Management Americas Legal. He is an officer of 70 investment companies (comprised of 170 portfolios) managed by the Manager. He is 46 years old and has been an employee of the Manager since August 2012.
JANETTE E. FARRAGHER, Vice President and Secretary since December 2011.
Assistant General Counsel of BNY Mellon, and an officer of 70 investment companies (comprised of 170 portfolios) managed by the Manager. She is 51 years old and has been an employee of the Manager since February 1984.
KIESHA ASTWOOD, Vice President and Assistant Secretary since January 2010.
Counsel of BNY Mellon, and an officer of 70 investment companies (comprised of 170 portfolios) managed by the Manager. She is 41 years old and has been an employee of the Manager since July 1995.
JAMES BITETTO, Vice President and Assistant Secretary since August 2005.
Managing Counsel of BNY Mellon and Secretary of the Manager, and an officer of 70 investment companies (comprised of 170 portfolios) managed by the Manager. He is 48 years old and has been an employee of the Manager since December 1996.
JONI LACKS CHARATAN, Vice President and Assistant Secretary since August 2005.
Managing Counsel of BNY Mellon, and an officer of 70 investment companies (comprised of 170 portfolios) managed by the Manager. She is 58 years old and has been an employee of the Manager since October 1988.
JOSEPH M. CHIOFFI, Vice President and Assistant Secretary since August 2005.
Managing Counsel of BNY Mellon, and an officer of 70 investment companies (comprised of 170 portfolios) managed by the Manager. He is 52 years old and has been an employee of the Manager since June 2000.
JOHN B. HAMMALIAN, Vice President and Assistant Secretary since August 2005.
Senior Managing Counsel of BNY Mellon, and an officer of 70 investment companies (comprised of 170 portfolios) managed by the Manager. He is 51 years old and has been an employee of the Manager since February 1991.
SARAH S. KELLEHER, Vice President and Assistant Secretary since April 2014.
Senior Counsel of BNY Mellon, and an officer of 70 investment companies (comprised of 170 portfolios) managed by the Manager; from August 2005 to March 2013, Associate General Counsel of Third Avenue Management. She is 38 years old and has been an employee of the Manager since March 2013.
40
JEFF PRUSNOFSKY, Vice President and Assistant Secretary since August 2005.
Senior Managing Counsel of BNY Mellon, and an officer of 70 investment companies (comprised of 170 portfolios) managed by the Manager. He is 49 years old and has been an employee of the Manager since October 1990.
JAMES WINDELS, Treasurer since November 2001.
Director – Mutual Fund Accounting of the Manager, and an officer of 70 investment companies (comprised of 170 portfolios) managed by the Manager. He is 56 years old and has been an employee of the Manager since April 1985.
RICHARD CASSARO, Assistant Treasurer since January 2008.
Senior Accounting Manager – Money Market and Municipal Bond Funds of the Manager, and an officer of 70 investment companies (comprised of 170 portfolios) managed by the Manager. He is 55 years old and has been an employee of the Manager since September 1982.
GAVIN C. REILLY, Assistant Treasurer since December 2005.
Tax Manager of the Investment Accounting and Support Department of the Manager, and an officer of 70 investment companies (comprised of 170 portfolios) managed by the Manager. He is 46 years old and has been an employee of the Manager since April 1991.
ROBERT S. ROBOL, Assistant Treasurer since August 2005.
Senior Accounting Manager – Fixed Income Funds of the Manager, and an officer of 70 investment companies (comprised of 170 portfolios) managed by the Manager. He is 50 years old and has been an employee of the Manager since October 1988.
ROBERT SALVIOLO, Assistant Treasurer since July 2007.
Senior Accounting Manager – Equity Funds of the Manager, and an officer of 70 investment companies (comprised of 170 portfolios) managed by the Manager. He is 47 years old and has been an employee of the Manager since June 1989.
ROBERT SVAGNA, Assistant Treasurer since December 2002.
Senior Accounting Manager – Equity Funds of the Manager, and an officer of 70 investment companies (comprised of 170 portfolios) managed by the Manager. He is 47 years old and has been an employee of the Manager since November 1990.
JOSEPH W. CONNOLLY, Chief Compliance Officer since October 2004.
Chief Compliance Officer of the Manager and The Dreyfus Family of Funds (70 investment companies, comprised of 170 portfolios). He is 57 years old and has served in various capacities with the Manager since 1980, including manager of the firm’s Fund Accounting Department from 1997 through October 2001.
MATTHEW D. CONNOLLY, Anti-Money Laundering Compliance Officer since April 2012.
Anti-Money Laundering Compliance Officer of the Distributor since October 2011; from March 2010 to September 2011, Global Head, KYC Reviews and Director of UBS Investment Bank; until March 2010, AML Compliance Officer and Senior Vice President of Citi Global Wealth Management. He is an officer of 65 investment companies (comprised of 165 portfolios) managed by the Manager. He is 42 years old and has been an employee of the Distributor since October 2011.
The Fund 41
For More Information
Telephone Call your financial representative or 1-800-DREYFUS
Mail The Dreyfus Family of Funds, 144 Glenn Curtiss Boulevard, Uniondale, NY 11556-0144
The fund files its complete schedule of portfolio holdings with the Securities and Exchange Commission (“SEC”) for the first and third quarters of each fiscal year on Form N-Q. The fund’s Forms N-Q are available on the SEC’s website at http://www.sec.gov and may be reviewed and copied at the SEC’s Public Reference Room in Washington, DC. Information on the operation of the Public Reference Room may be obtained by calling 1-800-SEC-0330.
A description of the policies and procedures that the fund uses to determine how to vote proxies relating to portfolio securities, and information regarding how the fund voted these proxies for the most recent 12-month period ended June 30 is available at http://www.dreyfus.com and on the SEC’s website at http://www.sec.gov. The description of the policies and procedures is also available without charge, upon request, by calling 1-800-DREYFUS.

Dreyfus
Small Cap
Equity Fund
ANNUAL REPORT September 30, 2014

Save time. Save paper. View your next shareholder report online as soon as it’s available. Log into www.dreyfus.com and sign up for Dreyfus eCommunications. It’s simple and only takes a few minutes.
The views expressed in this report reflect those of the portfolio manager only through the end of the period covered and do not necessarily represent the views of Dreyfus or any other person in the Dreyfus organization. Any such views are subject to change at any time based upon market or other conditions and Dreyfus disclaims any responsibility to update such views.These views may not be relied on as investment advice and, because investment decisions for a Dreyfus fund are based on numerous factors, may not be relied on as an indication of trading intent on behalf of any Dreyfus fund.

| | Contents |
| | THE FUND |
| 2 | A Letter from the President |
| 3 | Discussion of Fund Performance |
| 6 | Fund Performance |
| 8 | Understanding Your Fund’s Expenses |
| 8 | Comparing Your Fund’s Expenses With Those of Other Funds |
| 9 | Statement of Investments |
| 14 | Statement of Assets and Liabilities |
| 15 | Statement of Operations |
| 16 | Statement of Changes in Net Assets |
| 18 | Financial Highlights |
| 21 | Notes to Financial Statements |
| 32 | Report of Independent Registered Public Accounting Firm |
| 33 | Important Tax Information |
| 34 | Board Members Information |
| 38 | Officers of the Fund |
| | FOR MORE INFORMATION |
| | Back Cover |
Dreyfus
Small Cap Equity Fund
The Fund
A LETTER FROM THE PRESIDENT
Dear Shareholder:
This annual report for Dreyfus Small Cap Equity Fund covers the 12-month period from October 1, 2013, through September 30, 2014. For information about how the fund performed during the reporting period, as well as general market perspectives, we provide a Discussion of Fund Performance on the pages that follow.
Despite occasional bouts of heightened volatility, U.S. stocks gained ground steadily over the reporting period as the domestic economy rebounded. As a result, most broad measures of equity market performance established a series of new record highs. Smaller and more economically sensitive stocks generally fared well over the reporting period’s first half, but larger, better established companies rallied more strongly over the second half.
We remain cautiously optimistic regarding the U.S. stock market’s prospects. We currently expect the economy to continue to accelerate as several longstanding drags, including tight fiscal policies and private sector deleveraging, fade from the scene. Of course, a number of risks remain, including the possibilities of higher interest rates and intensifying geopolitical turmoil. As always, we encourage you to discuss our observations with your financial adviser to assess their potential impact on your investments.
Thank you for your continued confidence and support.

J. Charles Cardona
President
The Dreyfus Corporation
October 15, 2014
2
DISCUSSION OF FUND PERFORMANCE
For the period of October 1, 2013, through September 30, 2014, as provided by Joseph M. Corrado, CFA, Stephanie K. Brandaleone, CFA, and Edward R. Walter, CFA, Portfolio Managers
Fund and Market Performance Overview
For the 12-month period ended September 30, 2014, Dreyfus Small Cap Equity Fund’s Class A shares achieved a total return of 10.85%, Class C shares returned 9.93%, and Class I shares returned 11.11%.1 The fund’s benchmark, the Russell 2500 Value Index (the “Index”), achieved a total return of 9.88% for the same period.2
Despite bouts of heightened volatility, small- and midcap stocks gained value during the reporting period in an environment of improving economic growth. The fund produced higher returns than the Russell 2500Value Index, mainly due to successful security selections in the health care, financials, and materials sectors.
The Fund’s Investment Approach
The fund seeks long-term growth of capital. The fund invests, under normal circumstances, at least 80% of its net assets in the stocks of small-cap U.S. companies.
We seek to identify companies with stocks trading at prices below their intrinsic values. We measure value by evaluating each company’s valuation multiples (price/earnings, price/sales, price/cash flow), current competitive position, and expected business growth relative to its industry. We focus primarily on individual stock selection to produce a diversified portfolio of companies that we believe are undervalued relative to expected business growth, with the presence of a catalyst (such as a corporate restructuring, change in management, or spin-off) that may trigger a price increase.
Small- and Midcap Stocks Advanced in Volatile Market
Stocks generally rallied over the fall of 2013 in response to encouraging economic data, enabling several broad measures of U.S. stock market performance to end the year near record highs. The market relinquished some of its gains in January 2014 amid concerns regarding economic slowdowns in the emerging markets, but stocks rebounded in February when those worries proved to be overblown. Another bout of weakness in the spring signaled a shift in market leadership from more aggressive
The Fund 3
DISCUSSION OF FUND PERFORMANCE (continued)
growth stocks to their better established, value-oriented counterparts. However, positive economic data subsequently drove stocks to new record highs. Small-cap stocks and, to a lesser extent, midcap stocks gave up a significant portion of their earlier gains in July and September, when concerns regarding geopolitical tensions, deteriorating European economic conditions, and the possibility of higher U.S. interest rates weighed on smaller companies.
While stocks across all capitalization ranges produced positive absolute returns in this environment, the shift in market leadership to more conservative companies caused small-cap stocks to trail their larger counterparts by a wide margin for the reporting period overall. Midcap stocks lagged large-cap stocks somewhat more modestly.
Favorable Security Selections Fueled Fund Outperformance
Our security selection process produced robust results in the health care sector, where Salix Pharmaceuticals traded higher amid takeover speculation and strong clinical trial results. Health care services provider Centene posted strong earnings and announced a large, new contract to serve Medicaid patients. Hospitals operator Universal Health Services saw revenues benefit from the Affordable Care Act.
In the financials sector, online broker E*Trade Financial advanced in the midst of increased trading activity and improving loan volumes. Investment firm Raymond James Financial experienced solid loan growth while controlling expenses effectively. Banking institution Comerica achieved higher levels of fee income and improved cost controls. Among materials producers, investors reacted positively when steelmaker Steel Dynamics acquired a new milling facility. Specialty metals producer Allegheny Technologies benefited from higher nickel prices and rising demand for stainless steel products. Packaging Corporation of America posted better-than-expected earnings after making an accretive acquisition.
Although disappointments proved relatively mild over the reporting period, the fund’s relative performance was hindered to a degree by disappointments in the energy sector. Onshore well servicer Key Energy Services experienced weakness in international markets, particularly Mexico; seismic equipment provider Geospace Technologies suffered declining order volumes, and oil services company Helix Energy Solutions Group was hurt by reduced demand stemming from a weaker offshore drilling environment. In the consumer discretionary sector, electronics retailer Best Buy reported weaker-than-expected profit margins, specialty retailer
4
Office Depot encountered challenging conditions in its office equipment segment, and media organization New York Times was hurt by sluggish national and local advertising spending.
Continuing to Find Attractive Opportunities
Investors remain focused on the potential timing of the Federal Reserve’s interest rate hikes and geopolitical headline risks surrounding the Russia/Ukraine conflict and turmoil in the Middle East. In addition, uncertainty pertaining to Chinese growth and the outlook for the Eurozone continue to raise concerns. Despite these challenges, the U.S. economy remains well positioned to benefit from key drivers including a recovery in consumer and business spending, while the corporate earnings backdrop remains solid. Overall, we believe a healthier U.S. economy, strong corporate underpinnings, and secular tailwinds will remain supportive of U.S. equities and we remain focused on the strategy’s disciplined, research-driven investment approach.
Within this environment, we are finding attractive opportunities in the Health Care and Information Technology sectors and those areas are emphasized in the portfolio with overweight positions versus the index. Conversely, we have maintained underweight exposure to REITs and Insurance as we have found fewer opportunities meeting our investment criteria within these segments.
October 15, 2014
Please note, the position in any security highlighted with italicized typeface was sold during the reporting period. Equity funds are subject generally to market, market sector, market liquidity, issuer, and investment style risks, among other factors, to varying degrees, all of which are more fully described in the fund’s prospectus.
Small companies carry additional risks because their earnings and revenues tend to be less predictable, and their share prices more volatile than those of larger, more established companies.
|
| 1 Total return includes reinvestment of dividends and any capital gains paid, and does not take into consideration the |
| maximum initial sales charge in the case of Class A shares, or the applicable contingent deferred sales charge imposed |
| on redemptions in the case of Class C shares. Had these charges been reflected, returns would have been lower. Past |
| performance is no guarantee of future results. Share price and investment return fluctuate such that upon redemption, |
| fund shares may be worth more or less than their original cost. Return figures provided reflect the absorption of certain |
| fund expenses by The Dreyfus Corporation and The Boston Company Asset Management, LLC. Had these |
| expenses not been absorbed, returns would have been lower. |
| 2 SOURCE: LIPPER INC. — Reflects the reinvestment of dividends and, where applicable, capital gain |
| distributions.The Russell 2500 Value Index is a widely accepted, unmanaged index, which measures the performance |
| of those Russell 2500 companies with lower price-to-book ratios and lower forecasted growth values. |
The Fund 5
FUND PERFORMANCE
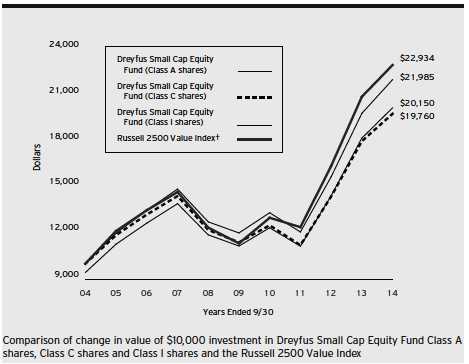
|
| † Source: Lipper Inc. |
| Past performance is not predictive of future performance. |
| The above graph compares a $10,000 investment made in each of the Class A, Class C and Class I shares of Dreyfus |
| Small Cap Equity Fund on 9/30/04 to a $10,000 investment made in the Russell 2500 Value Index (the “Index”) |
| on that date.All dividends and capital gain distributions are reinvested. |
| Prior to 8/1/07, the fund invested its assets in a “master portfolio” that had the same investment objective and |
| policies as the fund. This master/feeder arrangement was terminated on 8/1/07 and the fund operates as a |
| stand alone fund. Performance information represents the performance of the predecessor master portfolio (and its |
| predecessor fund) and the expenses of the master portfolio’s predecessor fund through January 31, 2003, and the |
| fund’s performance and expense structure thereafter. The master portfolio’s predecessor fund contributed all of its |
| assets to the master portfolio before the fund commenced investment operations on 2/1/03. |
| The fund’s performance shown in the line graph above takes into account the maximum initial sales charge on Class A |
| shares and all other applicable fees and expenses on all classes.The Index is an unmanaged index which measures the |
| performance of those Russell 2500 companies with lower price-to-book ratios and lower forecasted growth values. Unlike |
| a mutual fund, the Index is not subject to charges, fees and other expenses. Investors cannot invest directly in any index. |
| Further information relating to fund performance, including expense reimbursements, if applicable, is contained in the |
| Financial Highlights section of the prospectus and elsewhere in this report. |
6
| | | | | | |
| Average Annual Total Returns as of 9/30/14 | | | | | |
| | 1 Year | | 5 Years | | 10 Years | |
| Class A shares | | | | | | |
| with maximum sales charge (5.75%) | 4.46 | % | 11.24 | % | 7.26 | % |
| without sales charge | 10.85 | % | 12.56 | % | 7.89 | % |
| Class C shares | | | | | | |
| with applicable redemption charge † | 8.94 | % | 11.65 | % | 7.05 | % |
| without redemption | 9.93 | % | 11.65 | % | 7.05 | % |
| Class I shares | 11.11 | % | 12.87 | % | 8.20 | % |
| Russell 2500 Value Index | 9.88 | % | 15.16 | % | 8.65 | % |
Past performance is not predictive of future performance.The fund’s performance shown in the graph and table does not reflect the deduction of taxes that a shareholder would pay on fund distributions or the redemption of fund shares. In addition to the performance of Class A shares shown with and without a maximum sales charge, the fund’s performance shown in the table takes into account all other applicable fees and expenses on all classes.
|
| † The maximum contingent deferred sales charge for Class C shares is 1% for shares redeemed within one year of the |
| date of purchase. |
The Fund 7
UNDERSTANDING YOUR FUND’S EXPENSES (Unaudited)
As a mutual fund investor, you pay ongoing expenses, such as management fees and other expenses. Using the information below, you can estimate how these expenses affect your investment and compare them with the expenses of other funds.You also may pay one-time transaction expenses, including sales charges (loads) and redemption fees, which are not shown in this section and would have resulted in higher total expenses. For more information, see your fund’s prospectus or talk to your financial adviser.
Review your fund’s expenses
The table below shows the expenses you would have paid on a $1,000 investment in Dreyfus Small Cap Equity Fund from April 1, 2014 to September 30, 2014. It also shows how much a $1,000 investment would be worth at the close of the period, assuming actual returns and expenses.
Expenses and Value of a $1,000 Investment
assuming actual returns for the six months ended September 30, 2014
| | | | | | |
| | | Class A | | Class C | | Class I |
| Expenses paid per $1,000† | $ | 6.92 | $ | 10.93 | $ | 5.73 |
| Ending value (after expenses) | $ | 984.90 | $ | 981.00 | $ | 986.00 |
COMPARING YOUR FUND’S EXPENSES
WITH THOSE OF OTHER FUNDS (Unaudited)
Using the SEC’s method to compare expenses
The Securities and Exchange Commission (SEC) has established guidelines to help investors assess fund expenses. Per these guidelines, the table below shows your fund’s expenses based on a $1,000 investment, assuming a hypothetical 5% annualized return. You can use this information to compare the ongoing expenses (but not transaction expenses or total cost) of investing in the fund with those of other funds. All mutual fund shareholder reports will provide this information to help you make this comparison. Please note that you cannot use this information to estimate your actual ending account balance and expenses paid during the period.
Expenses and Value of a $1,000 Investment
assuming a hypothetical 5% annualized return for the six months ended September 30, 2014
| | | | | | |
| | | Class A | | Class C | | Class I |
| Expenses paid per $1,000† | $ | 7.03 | $ | 11.11 | $ | 5.82 |
| Ending value (after expenses) | $ | 1,018.10 | $ | 1,014.04 | $ | 1,019.30 |
|
| † Expenses are equal to the fund’s annualized expense ratio of 1.39% for Class A, 2.20% for Class C and 1.15% |
| for Class I, multiplied by the average account value over the period, multiplied by 183/365 (to reflect the one-half |
| year period). |
8
|
| STATEMENT OF INVESTMENTS |
| September 30, 2014 |
| | | |
| Common Stocks—99.6% | Shares | | Value ($) |
| Automobiles & Components—1.3% | | | |
| Lear | 13,870 | | 1,198,507 |
| Banks—11.4% | | | |
| BankUnited | 29,030 | | 885,125 |
| City National | 19,867 | | 1,503,336 |
| Comerica | 25,360 | | 1,264,450 |
| First Horizon National | 89,745 | | 1,102,069 |
| Hancock Holding | 28,850 | | 924,642 |
| SVB Financial Group | 8,580 | a | 961,732 |
| Synovus Financial | 67,968 | | 1,606,764 |
| UMB Financial | 18,630 | | 1,016,267 |
| Webster Financial | 34,820 | | 1,014,655 |
| | | | 10,279,040 |
| Capital Goods—7.2% | | | |
| AGCO | 13,570 | | 616,892 |
| Armstrong World Industries | 24,030 | a | 1,345,680 |
| Carlisle | 16,945 | | 1,362,039 |
| Chart Industries | 7,360 | a | 449,917 |
| Snap-on | 12,950 | | 1,567,986 |
| Timken | 14,410 | | 610,840 |
| Universal Display | 18,690 | a,b | 610,042 |
| | | | 6,563,396 |
| Commercial & Professional Services—5.6% | | | |
| Clean Harbors | 23,872 | a | 1,287,178 |
| Equifax | 17,820 | | 1,331,867 |
| Herman Miller | 36,090 | | 1,077,286 |
| Towers Watson & Co., Cl. A | 13,900 | | 1,383,050 |
| | | | 5,079,381 |
| Consumer Durables & Apparel—1.6% | | | |
| Toll Brothers | 28,590 | a | 890,864 |
| Vera Bradley | 28,020 | a | 579,454 |
| | | | 1,470,318 |
The Fund 9
STATEMENT OF INVESTMENTS (continued)
| | | |
| Common Stocks (continued) | Shares | | Value ($) |
| Consumer Services—3.8% | | | |
| Cheesecake Factory | 23,150 | | 1,053,325 |
| Grand Canyon Education | 22,320 | a | 909,986 |
| Hyatt Hotels, Cl. A | 23,960 | a | 1,450,059 |
| | | | 3,413,370 |
| Diversified Financials—3.5% | | | |
| E*TRADE Financial | 65,890 | a | 1,488,455 |
| Raymond James Financial | 30,760 | | 1,648,121 |
| | | | 3,136,576 |
| Energy—5.2% | | | |
| Energen | 17,540 | | 1,267,090 |
| Geospace Technologies | 17,050 | a | 599,307 |
| Key Energy Services | 173,310 | a | 838,820 |
| Oceaneering International | 13,850 | | 902,605 |
| Oil States International | 18,440 | a | 1,141,436 |
| | | | 4,749,258 |
| Food & Staples Retailing—1.4% | | | |
| Casey’s General Stores | 18,210 | | 1,305,657 |
| Health Care Equipment & Services—11.6% | | | |
| Air Methods | 28,870 | a | 1,603,728 |
| Centene | 18,683 | a | 1,545,271 |
| Hanger | 23,750 | a | 487,350 |
| HealthSouth | 39,670 | | 1,463,823 |
| MEDNAX | 22,220 | a | 1,218,100 |
| Omnicare | 23,490 | | 1,462,487 |
| Select Medical Holdings | 49,490 | | 595,365 |
| Universal Health Services, Cl. B | 15,670 | | 1,637,515 |
| WellCare Health Plans | 8,700 | a | 524,958 |
| | | | 10,538,597 |
| Insurance—2.0% | | | |
| First American Financial | 33,030 | | 895,774 |
| Old Republic International | 66,080 | | 943,622 |
| | | | 1,839,396 |
| Materials—5.1% | | | |
| Allegheny Technologies | 22,550 | | 836,605 |
| Packaging Corporation of America | 16,050 | | 1,024,311 |
10
| | | |
| Common Stocks (continued) | Shares | | Value ($) |
| Materials (continued) | | | |
| Steel Dynamics | 53,280 | | 1,204,661 |
| Stillwater Mining | 43,810 | a | 658,464 |
| TimkenSteel | 19,170 | | 891,213 |
| | | | 4,615,254 |
| Media—2.1% | | | |
| E.W. Scripps, Cl. A | 62,290 | a,b | 1,015,950 |
| New York Times, Cl. A | 81,270 | | 911,849 |
| | | | 1,927,799 |
| Pharmaceuticals, Biotech & | | | |
| Life Sciences—2.4% | | | |
| PerkinElmer | 14,880 | | 648,768 |
| Salix Pharmaceuticals | 9,620 | a | 1,503,029 |
| | | | 2,151,797 |
| Real Estate—5.5% | | | |
| Acadia Realty Trust | 33,080 | c | 912,346 |
| Corporate Office Properties Trust | 42,030 | c | 1,081,012 |
| Corrections Corporation of America | 33,100 | c | 1,137,316 |
| Healthcare Trust of America, Cl. A | 100,900 | | 1,170,440 |
| RLJ Lodging Trust | 22,470 | c | 639,721 |
| | | | 4,940,835 |
| Retailing—3.9% | | | |
| American Eagle Outfitters | 100,710 | b | 1,462,309 |
| Staples | 52,610 | | 636,581 |
| Urban Outfitters | 38,410 | a | 1,409,647 |
| | | | 3,508,537 |
| Semiconductors & Semiconductor | | | |
| Equipment—2.3% | | | |
| First Solar | 11,620 | a | 764,712 |
| Teradyne | 65,490 | | 1,269,851 |
| | | | 2,034,563 |
| Software & Services—11.3% | | | |
| Akamai Technologies | 21,290 | a | 1,273,142 |
| Amdocs | 25,760 | | 1,181,869 |
| CoreLogic | 48,980 | a | 1,325,889 |
| IAC/InterActiveCorp | 15,660 | | 1,031,994 |
The Fund 11
STATEMENT OF INVESTMENTS (continued)
| | | |
| Common Stocks (continued) | Shares | | Value ($) |
| Software & Services (continued) | | | |
| Monotype Imaging Holdings | 25,260 | | 715,363 |
| NICE Systems, ADR | 25,560 | | 1,042,592 |
| PTC | 36,790 | a | 1,357,551 |
| Solera Holdings | 17,360 | | 978,410 |
| Synopsys | 32,425 | a | 1,287,110 |
| | | | 10,193,920 |
| Technology Hardware & Equipment—3.8% | | | |
| F5 Networks | 11,510 | a | 1,366,697 |
| IPG Photonics | 21,570 | a,b | 1,483,585 |
| Lexmark International, Cl. A | 14,670 | | 623,475 |
| | | | 3,473,757 |
| Transportation—4.6% | | | |
| Alaska Air Group | 33,850 | | 1,473,829 |
| Con-way | 22,554 | | 1,071,315 |
| Ryder System | 17,490 | | 1,573,575 |
| | | | 4,118,719 |
| Utilities—4.0% | | | |
| CMS Energy | 38,810 | | 1,151,105 |
| NiSource | 23,630 | | 968,357 |
| Portland General Electric | 23,448 | | 753,150 |
| UGI | 23,040 | | 785,434 |
| | | | 3,658,046 |
| Total Common Stocks | | | |
| (cost $72,409,261) | | | 90,196,723 |
| |
| Other Investment—.6% | | | |
| Registered Investment Company; | | | |
| Dreyfus Institutional Preferred | | | |
| Plus Money Market Fund | | | |
| (cost $543,499) | 543,499 | d | 543,499 |
12
| | | | |
| Investment of Cash Collateral | | | | |
| for Securities Loaned—4.6% | Shares | | Value ($) | |
| Registered Investment Company; | | | | |
| Dreyfus Institutional Cash | | | | |
| Advantage Fund | | | | |
| (cost $4,176,464) | 4,176,464 | d | 4,176,464 | |
| Total Investments (cost $77,129,224) | 104.8 | % | 94,916,686 | |
| Liabilities, Less Cash and Receivables | (4.8 | %) | (4,329,840 | ) |
| Net Assets | 100.0 | % | 90,586,846 | |
ADR—American Depository Receipts
|
| a Non-income producing security. |
| b Security, or portion thereof, on loan.At September 30, 2014, the value of the fund’s securities on loan was |
| $4,010,422 and the value of the collateral held by the fund was $4,176,464. |
| c Investment in real estate investment trust. |
| d Investment in affiliated money market mutual fund. |
| | | |
| Portfolio Summary (Unaudited)† | | |
| |
| | Value (%) | | Value (%) |
| Health Care Equipment & Services | 11.6 | Technology Hardware & Equipment | 3.8 |
| Banks | 11.4 | Diversified Financials | 3.5 |
| Software & Services | 11.3 | Pharmaceuticals, Biotech & | |
| Capital Goods | 7.2 | Life Sciences | 2.4 |
| Commercial & Professional Services | 5.6 | Semiconductors & Semiconductor | |
| Real Estate | 5.5 | Equipment | 2.3 |
| Energy | 5.2 | Media | 2.1 |
| Money Market Investments | 5.2 | Insurance | 2.0 |
| Materials | 5.1 | Consumer Durables & Apparel | 1.6 |
| Transportation | 4.6 | Food & Staples Retailing | 1.4 |
| Utilities | 4.0 | Automobiles & Components | 1.3 |
| Retailing | 3.9 | | |
| Consumer Services | 3.8 | | 104.8 |
| |
| † Based on net assets. | | | |
| See notes to financial statements. | | | |
The Fund 13
|
| STATEMENT OF ASSETS AND LIABILITIES |
| September 30, 2014 |
| | | |
| | | Cost | Value |
| Assets ($): | | | |
| Investments in securities—See Statement of Investments (including | | |
| securities on loan, valued at $4,010,422)—Note 1(b): | | |
| Unaffiliated issuers | | 72,409,261 | 90,196,723 |
| Affiliated issuers | | 4,719,963 | 4,719,963 |
| Cash | | | 75,675 |
| Receivable for investment securities sold | | | 240,266 |
| Dividends and securities lending income receivable | | | 152,847 |
| Receivable for shares of Beneficial Interest subscribed | | 61,140 |
| Prepaid expenses | | | 13,997 |
| | | | 95,460,611 |
| Liabilities ($): | | | |
| Due to The Boston Company Asset Management, LLC and | | |
| affiliates—Note 3(c) | | | 99,480 |
| Liability for securities on loan—Note 1(b) | | | 4,176,464 |
| Payable for investment securities purchased | | | 438,549 |
| Payable for shares of Beneficial Interest redeemed | | | 85,295 |
| Accrued expenses | | | 73,977 |
| | | | 4,873,765 |
| Net Assets ($) | | | 90,586,846 |
| Composition of Net Assets ($): | | | |
| Paid-in capital | | | 64,448,373 |
| Accumulated net realized gain (loss) on investments | | | 8,351,011 |
| Accumulated net unrealized appreciation | | | |
| (depreciation) on investments | | | 17,787,462 |
| Net Assets ($) | | | 90,586,846 |
| |
| |
| Net Asset Value Per Share | | | |
| | Class A | Class C | Class I |
| Net Assets ($) | 44,191,474 | 9,968,717 | 36,426,655 |
| Shares Outstanding | 1,436,217 | 363,689 | 1,145,679 |
| Net Asset Value Per Share ($) | 30.77 | 27.41 | 31.79 |
| See notes to financial statements. | | | |
14
| | |
| STATEMENT OF OPERATIONS | | |
| Year Ended September 30, 2014 | | |
| |
| |
| |
| |
| Investment Income ($): | | |
| Income: | | |
| Cash dividends (net of $1,121 foreign taxes withheld at source): | | |
| Unaffiliated issuers | 1,148,548 | |
| Affiliated issuers | 613 | |
| Income from securities lending—Note 1(b) | 29,291 | |
| Total Income | 1,178,452 | |
| Expenses: | | |
| Investment advisory fee—Note 3(a) | 768,503 | |
| Administration fee—Note 3(a) | 96,063 | |
| Shareholder servicing costs—Note 3(c) | 265,418 | |
| Distribution fees—Note 3(b) | 80,633 | |
| Professional fees | 60,164 | |
| Registration fees | 42,108 | |
| Prospectus and shareholders’ reports | 24,668 | |
| Custodian fees—Note 3(c) | 22,636 | |
| Trustees’ fees and expenses—Note 3(d) | 4,971 | |
| Interest expense—Note 2 | 1,180 | |
| Loan commitment fees—Note 2 | 689 | |
| Miscellaneous | 12,989 | |
| Total Expenses | 1,380,022 | |
| Less—reduction in expenses due to undertaking—Note 3(a) | (50,103 | ) |
| Less—reduction in fees due to earnings credits—Note 3(c) | (90 | ) |
| Net Expenses | 1,329,829 | |
| Investment (Loss)—Net | (151,377 | ) |
| Realized and Unrealized Gain (Loss) on Investments—Note 4 ($): | | |
| Net realized gain (loss) on investments | 17,220,861 | |
| Net unrealized appreciation (depreciation) on investments | (6,903,038 | ) |
| Net Realized and Unrealized Gain (Loss) on Investments | 10,317,823 | |
| Net Increase in Net Assets Resulting from Operations | 10,166,446 | |
| See notes to financial statements. | | |
The Fund 15
STATEMENT OF CHANGES IN NET ASSETS
| | | | |
| | Year Ended September 30, | |
| | 2014 | | 2013 | |
| Operations ($): | | | | |
| Investment income (loss)—net | (151,377 | ) | 61,428 | |
| Net realized gain (loss) on investments | 17,220,861 | | 9,029,145 | |
| Net unrealized appreciation | | | | |
| (depreciation) on investments | (6,903,038 | ) | 16,121,428 | |
| Net Increase (Decrease) in Net Assets | | | | |
| Resulting from Operations | 10,166,446 | | 25,212,001 | |
| Dividends to Shareholders from ($): | | | | |
| Investment income—net: | | | | |
| Class A | — | | (98,361 | ) |
| Class I | — | | (267,825 | ) |
| Net realized gain on investments: | | | | |
| Class A | (4,429,462 | ) | (3,996,526 | ) |
| Class C | (1,127,969 | ) | (967,722 | ) |
| Class I | (3,232,986 | ) | (4,191,200 | ) |
| Total Dividends | (8,790,417 | ) | (9,521,634 | ) |
| Beneficial Interest Transactions ($): | | | | |
| Net proceeds from shares sold: | | | | |
| Class A | 4,657,435 | | 7,133,795 | |
| Class C | 434,389 | | 833,777 | |
| Class I | 9,167,652 | | 12,509,044 | |
| Dividends reinvested: | | | | |
| Class A | 4,213,328 | | 3,861,733 | |
| Class C | 941,207 | | 790,456 | |
| Class I | 3,202,021 | | 4,434,970 | |
| Cost of shares redeemed: | | | | |
| Class A | (12,666,603 | ) | (16,260,866 | ) |
| Class C | (2,362,196 | ) | (2,867,260 | ) |
| Class I | (20,987,246 | ) | (29,728,195 | ) |
| Increase (Decrease) in Net Assets from | | | | |
| Beneficial Interest Transactions | (13,400,013 | ) | (19,292,546 | ) |
| Total Increase (Decrease) in Net Assets | (12,023,984 | ) | (3,602,179 | ) |
| Net Assets ($): | | | | |
| Beginning of Period | 102,610,830 | | 106,213,009 | |
| End of Period | 90,586,846 | | 102,610,830 | |
| Accumulated undistributed | | | | |
| investment income—net | — | | 25,217 | |
16
| | | | |
| | Year Ended September 30, | |
| | 2014 | | 2013 | |
| Capital Share Transactions: | | | | |
| Class Aa | | | | |
| Shares sold | 150,035 | | 262,329 | |
| Shares issued for dividends reinvested | 144,589 | | 158,461 | |
| Shares redeemed | (408,176 | ) | (589,693 | ) |
| Net Increase (Decrease) in Shares Outstanding | (113,552 | ) | (168,903 | ) |
| Class Ca | | | | |
| Shares sold | 16,094 | | 33,560 | |
| Shares issued for dividends reinvested | 36,020 | | 35,664 | |
| Shares redeemed | (85,743 | ) | (114,037 | ) |
| Net Increase (Decrease) in Shares Outstanding | (33,629 | ) | (44,813 | ) |
| Class I | | | | |
| Shares sold | 285,216 | | 438,276 | |
| Shares issued for dividends reinvested | 106,521 | | 176,114 | |
| Shares redeemed | (651,858 | ) | (1,021,149 | ) |
| Net Increase (Decrease) in Shares Outstanding | (260,121 | ) | (406,759 | ) |
|
| a During the period ended September 30, 2013, 18,769 Class C shares representing $499,635 were exchanged for |
| 17,087 Class A shares. |
See notes to financial statements.
The Fund 17
FINANCIAL HIGHLIGHTS
The following tables describe the performance for each share class for the fiscal periods indicated. All information (except portfolio turnover rate) reflects financial results for a single fund share.Total return shows how much your investment in the fund would have increased (or decreased) during each period, assuming you had reinvested all dividends and distributions.These figures have been derived from the fund’s financial statements.
| | | | | | | | | | |
| | | | Year Ended September 30, | | | |
| Class A Shares | 2014 | | 2013 | | 2012 | | 2011 | | 2010 | |
| Per Share Data ($): | | | | | | | | | | |
| Net asset value, beginning of period | 30.58 | | 26.65 | | 22.79 | | 25.23 | | 22.84 | |
| Investment Operations: | | | | | | | | | | |
| Investment income (loss)—neta | (.05 | ) | .01 | | .05 | | (.01 | ) | (.00 | )b |
| Net realized and unrealized | | | | | | | | | | |
| gain (loss) on investments | 3.20 | | 6.32 | | 6.26 | | (2.43 | ) | 2.42 | |
| Total from Investment Operations | 3.15 | | 6.33 | | 6.31 | | (2.44 | ) | 2.42 | |
| Distributions: | | | | | | | | | | |
| Dividends from | | | | | | | | | | |
| investment income—net | — | | (.06 | ) | — | | — | | (.03 | ) |
| Dividends from net realized | | | | | | | | | | |
| gain on investments | (2.96 | ) | (2.34 | ) | (2.45 | ) | — | | — | |
| Total Distributions | (2.96 | ) | (2.40 | ) | (2.45 | ) | — | | (.03 | ) |
| Net asset value, end of period | 30.77 | | 30.58 | | 26.65 | | 22.79 | | 25.23 | |
| Total Return (%)c | 10.85 | | 26.08 | | 29.39 | | (9.67 | ) | 10.62 | |
| Ratios/Supplemental Data (%): | | | | | | | | | | |
| Ratio of total expenses | | | | | | | | | | |
| to average net assets | 1.48 | | 1.53 | | 1.57 | | 1.49 | | 1.59 | |
| Ratio of net expenses | | | | | | | | | | |
| to average net assets | 1.39 | | 1.39 | | 1.40 | | 1.39 | | 1.38 | |
| Ratio of net investment income | | | | | | | | | | |
| (loss) to average net assets | (.16 | ) | .03 | | .21 | | (.05 | ) | (.00 | )d |
| Portfolio Turnover Rate | 66.65 | | 76.40 | | 93.40 | | 76.95 | | 78.90 | |
| Net Assets, end of period ($ x 1,000) | 44,191 | | 47,394 | | 45,806 | | 45,048 | | 61,796 | |
| |
| a | Based on average shares outstanding. |
| b | Amount represents less than $.01 per share. |
| c | Exclusive of sales charge. |
| d | Amount represents less than .01%. |
See notes to financial statements.
18
| | | | | | | | | | |
| | | | Year Ended September 30, | | | |
| Class C Shares | 2014 | | 2013 | | 2012 | | 2011 | | 2010 | |
| Per Share Data ($): | | | | | | | | | | |
| Net asset value, beginning of period | 27.76 | | 24.55 | | 21.33 | | 23.80 | | 21.69 | |
| Investment Operations: | | | | | | | | | | |
| Investment (loss)—neta | (.27 | ) | (.20 | ) | (.15 | ) | (.22 | ) | (.19 | ) |
| Net realized and unrealized | | | | | | | | | | |
| gain (loss) on investments | 2.88 | | 5.75 | | 5.82 | | (2.25 | ) | 2.30 | |
| Total from Investment Operations | 2.61 | | 5.55 | | 5.67 | | (2.47 | ) | 2.11 | |
| Distributions: | | | | | | | | | | |
| Dividends from net realized | | | | | | | | | | |
| gain on investments | (2.96 | ) | (2.34 | ) | (2.45 | ) | — | | — | |
| Net asset value, end of period | 27.41 | | 27.76 | | 24.55 | | 21.33 | | 23.80 | |
| Total Return (%)b | 9.93 | | 25.05 | | 28.31 | | (10.38 | ) | 9.78 | |
| Ratios/Supplemental Data (%): | | | | | | | | | | |
| Ratio of total expenses | | | | | | | | | | |
| to average net assets | 2.23 | | 2.28 | | 2.31 | | 2.19 | | 2.24 | |
| Ratio of net expenses | | | | | | | | | | |
| to average net assets | 2.21 | | 2.22 | | 2.22 | | 2.17 | | 2.20 | |
| Ratio of net investment (loss) | | | | | | | | | | |
| to average net assets | (.98 | ) | (.80 | ) | (.62 | ) | (.84 | ) | (.81 | ) |
| Portfolio Turnover Rate | 66.65 | | 76.40 | | 93.40 | | 76.95 | | 78.90 | |
| Net Assets, end of period ($ x 1,000) | 9,969 | | 11,029 | | 10,855 | | 10,632 | | 14,436 | |
| |
| a | Based on average shares outstanding. |
| b | Exclusive of sales charge. |
See notes to financial statements.
The Fund 19
FINANCIAL HIGHLIGHTS (continued)
| | | | | | | | | | |
| | | | Year Ended September 30, | | | |
| Class I Shares | 2014 | | 2013 | | 2012 | | 2011 | | 2010 | |
| Per Share Data ($): | | | | | | | | | | |
| Net asset value, beginning of period | 31.43 | | 27.34 | | 23.29 | | 25.71 | | 23.24 | |
| Investment Operations: | | | | | | | | | | |
| Investment income—neta | .02 | | .08 | | .12 | | .06 | | .07 | |
| Net realized and unrealized | | | | | | | | | | |
| gain (loss) on investments | 3.30 | | 6.49 | | 6.42 | | (2.48 | ) | 2.47 | |
| Total from Investment Operations | 3.32 | | 6.57 | | 6.54 | | (2.42 | ) | 2.54 | |
| Distributions: | | | | | | | | | | |
| Dividends from | | | | | | | | | | |
| investment income—net | — | | (.14 | ) | (.04 | ) | (.00 | )b | (.07 | ) |
| Dividends from net realized | | | | | | | | | | |
| gain on investments | (2.96 | ) | (2.34 | ) | (2.45 | ) | — | | — | |
| Total Distributions | (2.96 | ) | (2.48 | ) | (2.49 | ) | (.00 | )b | (.07 | ) |
| Net asset value, end of period | 31.79 | | 31.43 | | 27.34 | | 23.29 | | 25.71 | |
| Total Return (%) | 11.11 | | 26.35 | | 29.80 | | (9.41 | ) | 10.94 | |
| Ratios/Supplemental Data (%): | | | | | | | | | | |
| Ratio of total expenses | | | | | | | | | | |
| to average net assets | 1.16 | | 1.27 | | 1.24 | | 1.28 | | 1.14 | |
| Ratio of net expenses | | | | | | | | | | |
| to average net assets | 1.14 | | 1.15 | | 1.08 | | 1.13 | | 1.11 | |
| Ratio of net investment income | | | | | | | | | | |
| to average net assets | .08 | | .27 | | .47 | | .22 | | .27 | |
| Portfolio Turnover Rate | 66.65 | | 76.40 | | 93.40 | | 76.95 | | 78.90 | |
| Net Assets, end of period ($ x 1,000) | 36,427 | | 44,188 | | 49,552 | | 90,251 | | 88,779 | |
| |
| a | Based on average shares outstanding. |
| b | Amount represents less than $.01 per share. |
See notes to financial statements.
20
NOTES TO FINANCIAL STATEMENTS
NOTE 1—Significant Accounting Policies:
Dreyfus Small Cap Equity Fund (the “fund”) is a separate diversified series of Dreyfus Stock Funds (the “Company”), which is registered under the Investment Company Act of 1940, as amended (the “Act”), as an open-end management investment company and operates as a series company currently offering two series, including the fund.The fund’s investment objective is to seek long-term growth of capital. The Boston Company Asset Management, LLC (“TBCAM”), a wholly-owned subsidiary of The Bank of New York Mellon Corporation (“BNY Mellon”), serves as the fund’s investment adviser. The Dreyfus Corporation (the “Administrator” or “Dreyfus”), a wholly-owned subsidiary of BNY Mellon and an affiliate of TBCAM, serves as the fund’s Administrator.
MBSC Securities Corporation (the “Distributor”), a wholly-owned subsidiary of Dreyfus, is the distributor of the fund’s shares.The fund is authorized to issue an unlimited number of $.001 par value shares of Beneficial Interest in each of the following classes of shares: Class A, Class C and Class I. Class A shares generally are subject to a sales charge imposed at the time of purchase. Class C shares are subject to a contingent deferred sales charge (“CDSC”) imposed on Class C shares redeemed within one year of purchase. Class I shares are sold at net asset value per share generally to institutional investors. Other differences between the classes include the services offered to and the expenses borne by each class, the allocation of certain transfer agency costs, and certain voting rights. Income, expenses (other than expenses attributable to a specific class), and realized and unrealized gains or losses on investments are allocated to each class of shares based on its relative net assets.
The Fund 21
NOTES TO FINANCIAL STATEMENTS (continued)
The Company accounts separately for the assets, liabilities and operations of each series. Expenses directly attributable to each series are charged to that series’ operations; expenses which are applicable to all series are allocated among them on a pro rata basis.
The Financial Accounting Standards Board (“FASB”) Accounting Standards Codification (“ASC”) is the exclusive reference of authoritative U.S. generally accepted accounting principles (“GAAP”) recognized by the FASB to be applied by nongovernmental entities. Rules and interpretive releases of the Securities and Exchange Commission (“SEC”) under authority of federal laws are also sources of authoritative GAAP for SEC registrants. The fund’s financial statements are prepared in accordance with GAAP, which may require the use of management estimates and assumptions. Actual results could differ from those estimates.
The Company enters into contracts that contain a variety of indemnifications. The fund’s maximum exposure under these arrangements is unknown.The fund does not anticipate recognizing any loss related to these arrangements.
(a) Portfolio valuation: The fair value of a financial instrument is the amount that would be received to sell an asset or paid to transfer a liability in an orderly transaction between market participants at the measurement date (i.e., the exit price). GAAP establishes a fair value hierarchy that prioritizes the inputs of valuation techniques used to measure fair value. This hierarchy gives the highest priority to unadjusted quoted prices in active markets for identical assets or liabilities (Level 1 measurements) and the lowest priority to unobservable inputs (Level 3 measurements).
Additionally, GAAP provides guidance on determining whether the volume and activity in a market has decreased significantly and whether such a decrease in activity results in transactions that are not orderly. GAAP requires enhanced disclosures around valuation inputs and techniques used during annual and interim periods.
22
Various inputs are used in determining the value of the fund’s investments relating to fair value measurements.These inputs are summarized in the three broad levels listed below:
Level 1—unadjusted quoted prices in active markets for identical investments.
Level 2—other significant observable inputs (including quoted prices for similar investments, interest rates, prepayment speeds, credit risk, etc.).
Level 3—significant unobservable inputs (including the fund’s own assumptions in determining the fair value of investments).
The inputs or methodology used for valuing securities are not necessarily an indication of the risk associated with investing in those securities.
Changes in valuation techniques may result in transfers in or out of an assigned level within the disclosure hierarchy. Valuation techniques used to value the fund’s investments are as follows:
Investments in securities are valued at the last sales price on the securities exchange or national securities market on which such securities are primarily traded. Securities listed on the National Market System for which market quotations are available are valued at the official closing price or, if there is no official closing price that day, at the last sales price. Securities not listed on an exchange or the national securities market, or securities for which there were no transactions, are valued at the average of the most recent bid and asked prices, except for open short positions, where the asked price is used for valuation purposes. Bid price is used when no asked price is available. Registered investment companies that are not traded on an exchange are valued at their net asset value.All of the preceding securities are generally categorized within Level 1 of the fair value hierarchy.
Fair valuing of securities may be determined with the assistance of a pricing service using calculations based on indices of domestic securi-
The Fund 23
NOTES TO FINANCIAL STATEMENTS (continued)
ties and other appropriate indicators, such as prices of relevant ADRs and financial futures. Utilizing these techniques may result in transfers between Level 1 and Level 2 of the fair value hierarchy.
When market quotations or official closing prices are not readily available, or are determined not to reflect accurately fair value, such as when the value of a security has been significantly affected by events after the close of the exchange or market on which the security is principally traded (for example, a foreign exchange or market), but before the fund calculates its net asset value, the fund may value these investments at fair value as determined in accordance with the procedures approved by the Company’s Board of Trustees (the “Board”). Certain factors may be considered when fair valuing investments such as: fundamental analytical data, the nature and duration of restrictions on disposition, an evaluation of the forces that influence the market in which the securities are purchased and sold, and public trading in similar securities of the issuer or comparable issuers. These securities are either categorized within Level 2 or 3 of the fair value hierarchy depending on the relevant inputs used.
For restricted securities where observable inputs are limited, assumptions about market activity and risk are used and are generally categorized within Level 3 of the fair value hierarchy.
The following is a summary of the inputs used as of September 30, 2014 in valuing the fund’s investments:
| | | | |
| | | Level 2—Other | Level 3— | |
| | Level 1— | Significant | Significant | |
| | Unadjusted | Observable Unobservable | |
| | Quoted Prices | Inputs | Inputs | Total |
| Assets ($) | | | | |
| Investments in Securities: | | | | |
| Equity Securities—Domestic | | | | |
| Common Stocks† | 89,154,131 | — | — | 89,154,131 |
| Equity Securities—Foreign | | | | |
| Common Stocks† | 1,042,592 | — | — | 1,042,592 |
| Mutual Funds | 4,719,963 | — | — | 4,719,963 |
| |
| † | See Statement of Investments for additional detailed categorizations. |
24
At September 30, 2014, there were no transfers between Level 1 and Level 2 of the fair value hierarchy.
(b) Securities transactions and investment income: Securities transactions are recorded on a trade date basis. Realized gains and losses from securities transactions are recorded on the identified cost basis. Dividend income is recognized on the ex-dividend date and interest income, including, where applicable, accretion of discount and amortization of premium on investments, is recognized on the accrual basis.
Pursuant to a securities lending agreement with The Bank of New York Mellon, a subsidiary of BNY Mellon and an affiliate of Dreyfus, the fund may lend securities to qualified institutions. It is the fund’s policy that, at origination, all loans are secured by collateral of at least 102% of the value of U.S. securities loaned and 105% of the value of foreign securities loaned. Collateral equivalent to at least 100% of the market value of securities on loan is maintained at all times. Collateral is either in the form of cash, which can be invested in certain money market mutual funds managed by Dreyfus or U.S. Government and Agency securities.The fund is entitled to receive all dividends, interest and distributions on securities loaned, in addition to income earned as a result of the lending transaction. Should a borrower fail to return the securities in a timely manner, The Bank of New York Mellon is required to replace the securities for the benefit of the fund or credit the fund with the market value of the unreturned securities and is subrogated to the fund’s rights against the borrower and the collateral. During the period ended September 30, 2014,The Bank of NewYork Mellon earned $8,899 from lending portfolio securities, pursuant to the securities lending agreement.
(c) Affiliated issuers: Investments in other investment companies advised by Dreyfus are defined as “affiliated” under the Act.
The Fund 25
NOTES TO FINANCIAL STATEMENTS (continued)
Investments in affiliated investment companies during the period ended September 30, 2014 were as follows:
| | | | | |
| Affiliated | | | | | |
| Investment | Value | | | Value | Net |
| Company | 9/30/2013 ($) | Purchases ($) | Sales ($) | 9/30/2014 ($) | Assets (%) |
| Dreyfus | | | | | |
| Institutional | | | | | |
| Preferred | | | | | |
| Plus Money | | | | | |
| Market Fund | 938,041 | 26,985,400 | 27,379,942 | 543,499 | .6 |
| Dreyfus | | | | | |
| Institutional | | | | | |
| Cash | | | | | |
| Advantage | | | | | |
| Fund | — | 48,582,760 | 44,406,296 | 4,176,464 | 4.6 |
| Total | 938,041 | 75,568,160 | 71,786,238 | 4,719,963 | 5.2 |
(d) Dividends to shareholders: Dividends are recorded on the ex-dividend date. Dividends from investment income-net and dividends from net realized capital gains, if any, are normally declared and paid annually, but the fund may make distributions on a more frequent basis to comply with the distribution requirements of the Internal Revenue Code of 1986, as amended (the “Code”). To the extent that net realized capital gains can be offset by capital loss carryovers, it is the policy of the fund not to distribute such gains. Income and capital gain distributions are determined in accordance with income tax regulations, which may differ from GAAP.
(e) Federal income taxes: It is the policy of the fund to continue to qualify as a regulated investment company, if such qualification is in the best interests of its shareholders, by complying with the applicable provisions of the Code, and to make distributions of taxable income sufficient to relieve it from substantially all federal income and excise taxes.
As of and during the period ended September 30, 2014, the fund did not have any liabilities for any uncertain tax positions.The fund recognizes interest and penalties, if any, related to uncertain tax positions as income tax expense in the Statement of Operations. During the period ended September 30, 2014, the fund did not incur any interest or penalties.
26
Each tax year in the four-year period ended September 30, 2014 remains subject to examination by the Internal Revenue Service and state taxing authorities.
At September 30, 2014, the components of accumulated earnings on a tax basis were as follows: undistributed ordinary income $752,935, undistributed capital gains $13,241,148, accumulated capital losses $5,379,741 and unrealized appreciation $17,524,131.
Under the Regulated Investment Company Modernization Act of 2010 (the “2010 Act”), the fund is permitted to carry forward capital losses incurred in taxable years beginning after December 22, 2010 (“post-enactment losses”) for an unlimited period. Furthermore, post-enactment capital loss carryovers retain their character as either short-term or long-term capital losses rather than short-term as they were under previous statute.The 2010 Act requires post-enactment losses to be utilized before the utilization of losses incurred in taxable years prior to the effective date of the 2010 Act (“pre-enactment losses”).As a result of this ordering rule, pre-enactment losses may be more likely to expire unused.
The accumulated capital loss carryover is available for federal income tax purposes to be applied against future net realized capital gains, if any, realized subsequent to September 30, 2014. If not applied, $5,313,291 of the carryover expires in fiscal year 2017 and $66,450 expires in fiscal year 2018. Acquired losses, as a result of the fund’s merger with Dreyfus Premier Future Leaders Fund, can be utilized in subsequent years but will be subject to annual limitations based on certain provisions in the Code.
The tax character of distributions paid to shareholders during the fiscal periods ended September 30, 2014 and September 30, 2013 were as follows: ordinary income $1,650,133 and $366,186, and long-term capital gains $7,140,284 and $9,155,448, respectively.
The Fund 27
NOTES TO FINANCIAL STATEMENTS (continued)
During the period ended September 30, 2014, as a result of permanent book to tax differences, primarily due to the tax treatment for net operating losses, dividend reclassification and a capital loss carryover expiration, the fund increased accumulated undistributed investment income-net by $126,160, increased accumulated net realized gain (loss) on investments by $10,585,440 and decreased paid-in capital by $10,711,600. Net assets and net asset value per share were not affected by this reclassification.
NOTE 2—Bank Lines of Credit:
The fund participates with other Dreyfus-managed funds in a $265 million unsecured credit facility led by Citibank, N.A. and a $300 million unsecured credit facility provided by The Bank of New York Mellon (each, a “Facility”), each to be utilized primarily for temporary or emergency purposes, including the financing of redemptions. Prior to October 9, 2013, the unsecured credit facility with Citibank, N.A. was $210 million. In connection therewith, the fund has agreed to pay its pro rata portion of commitment fees for each Facility. Interest is charged to the fund based on rates determined pursuant to the terms of the respective Facility at the time of borrowing.
The average amount of borrowings outstanding under the Facilities during the period ended September 30, 2014 was approximately $107,100 with a related weighted average annualized interest rate of 1.10%.
NOTE 3—Investment Advisory Fee, Administration Fee and Other Transactions with Affiliates:
(a) Pursuant to an investment advisory agreement with TBCAM, the investment advisory fee is computed at the annual rate of .80% of the value of the fund’s average daily net assets and is payable monthly. Dreyfus and TBCAM have contractually agreed, from October 1, 2013 through September 30, 2014, to assume the direct expenses of the fund, so that such expenses of Class A, Class C and Class I shares (excluding taxes, interest expense, brokerage commissions, commit-
28
ment fees on borrowings and extraordinary expenses) do not exceed 1.39%, 2.22% and 1.16% of the value of the respective class’ average daily net assets, until the fiscal year end following such time as the expenses are equal to or less than such annual rate for the applicable class. The reduction in expenses, pursuant to the undertaking, amounted to $50,103 during the period ended September 30, 2014.
The fund compensates Dreyfus under an administration agreement for providing personnel and facilities to perform accounting and administration services for the fund at an annual rate of .10% of the value of the fund’s average daily net assets. Pursuant to the administration agreement, the fund was charged $96,063 during the period ended September 30, 2014.
During the period ended September 30, 2014, the Distributor retained $5,254 from commissions earned on sales of the fund’s Class A shares and $96 from CDSCs on redemptions of the fund’s Class C shares.
(b) Under the Distribution Plan adopted pursuant to Rule 12b-1 under the Act, Class C shares pay the Distributor for distributing its shares at an annual rate of .75% of the value of its average daily net assets. During the period ended September 30, 2014, Class C shares were charged $80,633 pursuant to the Distribution Plan.
(c) Under the Shareholder Services Plan, Class A and Class C shares pay the Distributor at an annual rate of .25% of the value of their average daily net assets for the provision of certain services. The services provided may include personal services relating to shareholder accounts, such as answering shareholder inquiries regarding the fund and providing reports and other information, and services related to the maintenance of shareholder accounts. The Distributor may make payments to Service Agents (securities dealers, financial institutions or other industry professionals) with respect to these services. The Distributor determines the amounts to be paid to Service Agents.
The Fund 29
NOTES TO FINANCIAL STATEMENTS (continued)
During the period ended September 30, 2014, Class A and Class C shares were charged $118,581 and $26,878, respectively, pursuant to the Shareholder Services Plan.
The fund has arrangements with the transfer agent and the custodian whereby the fund may receive earnings credits when positive cash balances are maintained, which are used to offset transfer agency and custody fees. For financial reporting purposes, the fund includes net earnings credits as an expense offset in the Statement of Operations.
The fund compensates Dreyfus Transfer, Inc., a wholly-owned subsidiary of Dreyfus, under a transfer agency agreement for providing transfer agency and cash management services for the fund. The majority of transfer agency fees are comprised of amounts paid on a per account basis, while cash management fees are related to fund subscriptions and redemptions. During the period ended September 30, 2014, the fund was charged $20,238 for transfer agency services and $1,310 for cash management services. These fees are included in Shareholder servicing costs in the Statement of Operations. Cash management fees were partially offset by earnings credits of $90.
The fund compensates The Bank of NewYork Mellon under a custody agreement for providing custodial services for the fund.These fees are determined based on net assets, geographic region and transaction activity. During the period ended September 30, 2014, the fund was charged $22,636 pursuant to the custody agreement.
During the period ended September 30, 2014, the fund was charged $8,107 for services performed by the Chief Compliance Officer and his staff.
The components of “Due to TBCAM and affiliates” in the Statement of Assets and Liabilities consist of: investment advisory fees $61,854, Distribution Plan fees $6,424, Shareholder Services Plan fees $11,561, custodian fees $9,500, Chief Compliance Officer fees $1,730, administration fees $7,732, and transfer agency fees $7,011, which are offset against an expense reimbursement currently in effect in the amount of $6,332.
30
(d) Each Board member also serves as a Board member of other funds within the Dreyfus complex. Annual retainer fees and attendance fees are allocated to each fund based on net assets.
NOTE 4—Securities Transactions:
The aggregate amount of purchases and sales of investment securities, excluding short-term securities, during the period ended September 30, 2014, amounted to $63,556,467 and $85,652,296, respectively.
At September 30, 2014, the cost of investments for federal income tax purposes was $77,392,555; accordingly, accumulated net unrealized appreciation on investments was $17,524,131, consisting of $20,090,725 gross unrealized appreciation and $2,566,594 gross unrealized depreciation.
The Fund 31
REPORT OF INDEPENDENT REGISTERED
PUBLIC ACCOUNTING FIRM
Shareholders and Board of Trustees
Dreyfus Small Cap Equity Fund
We have audited the accompanying statement of assets and liabilities, including the statement of investments, of Dreyfus Small Cap Equity Fund (one of the series comprising Dreyfus Stock Funds) as of September 30, 2014, and the related statement of operations for the year then ended, the statement of changes in net assets for each of the two years in the period then ended, and the financial highlights for each of the five years in the period then ended.These financial statements and financial highlights are the responsibility of the Fund’s management. Our responsibility is to express an opinion on these financial statements and financial highlights based on our audits.
We conducted our audits in accordance with the standards of the Public Company Accounting Oversight Board (United States). Those standards require that we plan and perform the audit to obtain reasonable assurance about whether the financial statements and financial highlights are free of material misstatement. We were not engaged to perform an audit of the Fund’s internal control over financial reporting. Our audits included consideration of internal control over financial reporting as a basis for designing audit procedures that are appropriate in the circumstances, but not for the purpose of expressing an opinion on the effectiveness of the Fund’s internal control over financial reporting. Accordingly, we express no such opinion.An audit also includes examining, on a test basis, evidence supporting the amounts and disclosures in the financial statements and financial highlights, assessing the accounting principles used and significant estimates made by management, and evaluating the overall financial statement presentation. Our procedures included confirmation of securities owned as of September 30, 2014 by correspondence with the custodian and others. We believe that our audits provide a reasonable basis for our opinion.
In our opinion, the financial statements and financial highlights referred to above present fairly, in all material respects, the financial position of Dreyfus Small Cap Equity Fund at September 30, 2014, the results of its operations for the year then ended, the changes in its net assets for each of the two years in the period then ended, and the financial highlights for each of the five years in the period then ended, in conformity with U.S. generally accepted accounting principles.

New York, New York
November 25, 2014
32
IMPORTANT TAX INFORMATION (Unaudited)
For federal tax purposes, the fund hereby reports 82.19% of the ordinary dividends paid during the fiscal year ended September 30, 2014 as qualifying for the corporate dividends received deduction.Also, certain dividends paid by the fund may be subject to a maximum tax rate of 15%, as provided for by the Jobs and Growth Tax Relief Reconciliation Act of 2003. Of the distributions paid during the fiscal year, $1,124,084 represents the maximum amount that may be considered qualified dividend income. The fund also hereby reports $.5558 per share as a short-term capital gain distribution and $2.4050 per share as a long-term capital gain distribution paid on December 17, 2013. Shareholders will receive notification in early 2015 of the percentage applicable to the preparation of their 2014 income tax returns.
The Fund 33
BOARD MEMBERS INFORMATION (Unaudited)
INDEPENDENT BOARD MEMBERS
|
| Joseph S. DiMartino (70) |
| Chairman of the Board (2003) |
| Principal Occupation During Past 5Years: |
| • Corporate Director and Trustee (1995-present) |
| Other Public Company Board Memberships During Past 5Years: |
| • CBIZ (formerly, Century Business Services, Inc.), a provider of outsourcing functions for small |
| and medium size companies, Director (1997-present) |
| • The Newark Group, a provider of a national market of paper recovery facilities, paperboard |
| mills and paperboard converting plants, Director (2000-2010) |
| • Sunair Services Corporation, a provider of certain outdoor-related services to homes and |
| businesses, Director (2005-2009) |
| No. of Portfolios for which Board Member Serves: 145 |
| ——————— |
| William Hodding Carter III (79) |
| Board Member (2003) |
| Principal Occupation During Past 5Years: |
| • Professor of Leadership & Public Policy, University of North Carolina, Chapel Hill (2006-present) |
| No. of Portfolios for which Board Member Serves: 24 |
| ——————— |
| Joni Evans (72) |
| Board Member (2006) |
| Principal Occupation During Past 5Years: |
| • Chief Executive Officer, www.wowOwow.com an online community dedicated to women’s |
| conversations and publications (2007-present) |
| • Principal, Joni Evans Ltd. (publishing) (2006-present) |
| No. of Portfolios for which Board Member Serves: 24 |
| ——————— |
| Ehud Houminer (74) |
| Board Member (2003) |
| Principal Occupation During Past 5Years: |
| • Executive-in-Residence at the Columbia Business School, Columbia University (1992-present) |
| Other Public Company Board Membership During Past 5Years: |
| • Avnet Inc., an electronics distributor, Director (1993-2012) |
| No. of Portfolios for which Board Member Serves: 62 |
34
|
| Richard C. Leone (74) |
| Board Member (1984) |
| Principal Occupation During Past 5Years: |
| • Senior Fellow and former President of The Century Foundation (formerly,The Twentieth |
| Century Fund, Inc.), a tax exempt research foundation engaged in the study of economic, |
| foreign policy and domestic issues (2011-present) |
| • President—The Century Foundation (1989-2011) |
| No. of Portfolios for which Board Member Serves: 24 |
| ——————— |
| Hans C. Mautner (76) |
| Board Member (2003) |
| Principal Occupation During Past 5Years: |
| • President—International Division and an Advisory Director of Simon Property Group, a real |
| estate investment company (1998-2010) |
| • Chairman and Chief Executive Officer of Simon Global Limited, a real estate company (1999-2010) |
| No. of Portfolios for which Board Member Serves: 24 |
| ——————— |
| Robin A. Melvin (51) |
| Board Member (2003) |
| Principal Occupation During Past 5Years: |
| • Board Member, Illinois Mentoring Partnership, non-profit organization dedicated to increasing |
| the quantity and quality of mentoring services in Illinois (2013-present) |
| • Director, Boisi Family Foundation, a private family foundation that supports youth-serving orga- |
| nizations that promote the self sufficiency of youth from disadvantaged circumstances (1995-2012) |
| No. of Portfolios for which Board Member Serves: 112 |
The Fund 35
|
| BOARD MEMBERS INFORMATION (Unaudited) (continued) |
| INDEPENDENT BOARD MEMBERS (continued) |
|
| Burton N. Wallack (63) |
| Board Member (2006) |
| Principal Occupation During Past 5Years: |
| • President and Co-owner of Wallack Management Company, a real estate management company |
| (1987-present) |
| No. of Portfolios for which Board Member Serves: 24 |
| ——————— |
| John E. Zuccotti (77) |
| Board Member (2003) |
| Principal Occupation During Past 5Years: |
| • Chairman of Brookfield Properties, Inc. (1996-present) |
| • Senior Counsel of Weil, Gotshal & Manges, LLP (1997-present) |
| Other Public Company Board Membership During Past 5Years: |
| • Wellpoint, Inc., a health benefits company, Director (2005-2010) |
| No. of Portfolios for which Board Member Serves: 24 |
36
INTERESTED BOARD MEMBER
|
| Gordon J. Davis (73) |
| Board Member (2006) |
| Principal Occupation During Past 5Years: |
| • Partner in the law firm of Venable LLP (2012-present) |
| • Partner in the law firm of Dewey & LeBoeuf LLP (1994-2012) |
| Other Public Company Board Memberships During Past 5Years: |
| • Consolidated Edison, Inc., a utility company, Director (1997-present) |
| • The Phoenix Companies, Inc., a life insurance company, Director (2000-present) |
| No. of Portfolios for which Board Member Serves: 62 |
| |
| Gordon J. Davis is deemed to be an “interested person” (as defined in the Act) of the fund as a result of his affiliation |
| with Venable LLP, which provides legal services to the fund. |
| |
| ——————— |
| Once elected all Board Members serve for an indefinite term, but achieve Emeritus status upon reaching age 80.The |
| address of the Board Members and Officers is c/o The Dreyfus Corporation, 200 Park Avenue, NewYork, NewYork |
| 10166.Additional information about the Board Members is available in the fund’s Statement of Additional Information |
| which can be obtained from Dreyfus free of charge by calling this toll free number: 1-800-DREYFUS. |
| Arnold S. Hiatt, Emeritus Board Member |
The Fund 37
OFFICERS OF THE FUND (Unaudited)
BRADLEY J. SKAPYAK, President since January 2010.
Chief Operating Officer and a director of the Manager since June 2009, Chairman of Dreyfus Transfer, Inc., an affiliate of the Manager and the transfer agent of the funds, since May 2011 and Executive Vice President of the Distributor since June 2007. From April 2003 to June 2009, Mr. Skapyak was the head of the Investment Accounting and Support Department of the Manager. He is an officer of 69 investment companies (comprised of 145 portfolios) managed by the Manager. He is 55 years old and has been an employee of the Manager since February 1988.
JOHN PAK, Chief Legal Officer since March 2013.
Deputy General Counsel, Investment Management, of BNY Mellon since August 2014; Chief Legal Officer of the Manager since August 2012; from March 2005 to July 2012, Managing Director of Deutsche Bank, Deputy Global Head of Deutsche Asset Management Legal and Regional Head of Deutsche Asset Management Americas Legal. He is an officer of 70 investment companies (comprised of 170 portfolios) managed by the Manager. He is 46 years old and has been an employee of the Manager since August 2012.
JANETTE E. FARRAGHER, Vice President and Secretary since December 2011.
Assistant General Counsel of BNY Mellon, and an officer of 70 investment companies (comprised of 170 portfolios) managed by the Manager. She is 51 years old and has been an employee of the Manager since February 1984.
KIESHA ASTWOOD, Vice President and Assistant Secretary since January 2010.
Counsel of BNY Mellon, and an officer of 70 investment companies (comprised of 170 portfolios) managed by the Manager. She is 41 years old and has been an employee of the Manager since July 1995.
JAMES BITETTO, Vice President and Assistant Secretary since August 2005.
Managing Counsel of BNY Mellon and Secretary of the Manager, and an officer of 70 investment companies (comprised of 170 portfolios) managed by the Manager. He is 48 years old and has been an employee of the Manager since December 1996.
JONI LACKS CHARATAN, Vice President and Assistant Secretary since August 2005.
Managing Counsel of BNY Mellon, and an officer of 70 investment companies (comprised of 170 portfolios) managed by the Manager. She is 58 years old and has been an employee of the Manager since October 1988.
JOSEPH M. CHIOFFI, Vice President and Assistant Secretary since August 2005.
Managing Counsel of BNY Mellon, and an officer of 70 investment companies (comprised of 170 portfolios) managed by the Manager. He is 52 years old and has been an employee of the Manager since June 2000.
JOHN B. HAMMALIAN, Vice President and Assistant Secretary since August 2005.
Senior Managing Counsel of BNY Mellon, and an officer of 70 investment companies (comprised of 170 portfolios) managed by the Manager. He is 51 years old and has been an employee of the Manager since February 1991.
SARAH S. KELLEHER, Vice President and Assistant Secretary since April 2014.
Senior Counsel of BNY Mellon, and an officer of 70 investment companies (comprised of 170 portfolios) managed by the Manager; from August 2005 to March 2013, Associate General Counsel of Third Avenue Management. She is 38 years old and has been an employee of the Manager since March 2013.
38
JEFF PRUSNOFSKY, Vice President and Assistant Secretary since August 2005.
Senior Managing Counsel of BNY Mellon, and an officer of 70 investment companies (comprised of 170 portfolios) managed by the Manager. He is 49 years old and has been an employee of the Manager since October 1990.
JAMES WINDELS, Treasurer since November 2001.
Director – Mutual Fund Accounting of the Manager, and an officer of 70 investment companies (comprised of 170 portfolios) managed by the Manager. He is 56 years old and has been an employee of the Manager since April 1985.
RICHARD CASSARO, Assistant Treasurer since January 2008.
Senior Accounting Manager – Money Market and Municipal Bond Funds of the Manager, and an officer of 70 investment companies (comprised of 170 portfolios) managed by the Manager. He is 55 years old and has been an employee of the Manager since September 1982.
GAVIN C. REILLY, Assistant Treasurer since December 2005.
Tax Manager of the Investment Accounting and Support Department of the Manager, and an officer of 70 investment companies (comprised of 170 portfolios) managed by the Manager. He is 46 years old and has been an employee of the Manager since April 1991.
ROBERT S. ROBOL, Assistant Treasurer since August 2005.
Senior Accounting Manager – Fixed Income Funds of the Manager, and an officer of 70 investment companies (comprised of 170 portfolios) managed by the Manager. He is 50 years old and has been an employee of the Manager since October 1988.
ROBERT SALVIOLO, Assistant Treasurer since July 2007.
Senior Accounting Manager – Equity Funds of the Manager, and an officer of 70 investment companies (comprised of 170 portfolios) managed by the Manager. He is 47 years old and has been an employee of the Manager since June 1989.
ROBERT SVAGNA, Assistant Treasurer since December 2002.
Senior Accounting Manager – Equity Funds of the Manager, and an officer of 70 investment companies (comprised of 170 portfolios) managed by the Manager. He is 47 years old and has been an employee of the Manager since November 1990.
JOSEPH W. CONNOLLY, Chief Compliance Officer since October 2004.
Chief Compliance Officer of the Manager and The Dreyfus Family of Funds (70 investment companies, comprised of 170 portfolios).
He is 57 years old and has served in various capacities with the Manager since 1980, including manager of the firm’s Fund Accounting Department from 1997 through October 2001.
MATTHEW D. CONNOLLY, Anti-Money Laundering Compliance Officer since April 2012.
Anti-Money Laundering Compliance Officer of the Distributor since October 2011; from March 2010 to September 2011, Global Head, KYC Reviews and Director of UBS Investment Bank; until March 2010, AML Compliance Officer and Senior Vice President of Citi Global Wealth Management. He is an officer of 65 investment companies (comprised of 165 portfolios) managed by the Manager. He is 42 years old and has been an employee of the Distributor since October 2011.
The Fund 39
For More Information
Telephone Call your financial representative or 1-800-DREYFUS
Mail The Dreyfus Family of Funds, 144 Glenn Curtiss Boulevard, Uniondale, NY 11556-0144
The fund files its complete schedule of portfolio holdings with the Securities and Exchange Commission (“SEC”) for the first and third quarters of each fiscal year on Form N-Q. The fund’s Forms N-Q are available on the SEC’s website at http://www.sec.gov and may be reviewed and copied at the SEC’s Public Reference Room in Washington, DC. Information on the operation of the Public Reference Room may be obtained by calling 1-800-SEC-0330.
A description of the policies and procedures that the fund uses to determine how to vote proxies relating to portfolio securities, and information regarding how the fund voted these proxies for the most recent 12-month period ended June 30 is available at http://www.dreyfus.com and on the SEC’s website at http://www.sec.gov. The description of the policies and procedures is also available without charge, upon request, by calling 1-800-DREYFUS.

Item 2. Code of Ethics.
The Registrant has adopted a code of ethics that applies to the Registrant's principal executive officer, principal financial officer, principal accounting officer or controller, or persons performing similar functions. There have been no amendments to, or waivers in connection with, the Code of Ethics during the period covered by this Report.
Item 3. Audit Committee Financial Expert.
The Registrant's Board has determined that Ehud Houminer, a member of the Audit Committee of the Board, is an audit committee financial expert as defined by the Securities and Exchange Commission (the "SEC"). Ehud Houminer is "independent" as defined by the SEC for purposes of audit committee financial expert determinations.
Item 4. Principal Accountant Fees and Services.
(a) Audit Fees. The aggregate fees billed for each of the last two fiscal years (the "Reporting Periods") for professional services rendered by the Registrant's principal accountant (the "Auditor") for the audit of the Registrant's annual financial statements or services that are normally provided by the Auditor in connection with the statutory and regulatory filings or engagements for the Reporting Periods, were $74,170 in 2013 and $75,654 in 2014.
(b) Audit-Related Fees. The aggregate fees billed in the Reporting Periods for assurance and related services by the Auditor that are reasonably related to the performance of the audit of the Registrant's financial statements and are not reported under paragraph (a) of this Item 4 were $6,000 in 2013 and $24,240 in 2014. These services consisted of one or more of the following: (i) agreed upon procedures related to compliance with Internal Revenue Code section 817(h), (ii) security counts required by Rule 17f-2 under the Investment Company Act of 1940, as amended, (iii) advisory services as to the accounting or disclosure treatment of Registrant transactions or events and (iv) advisory services to the accounting or disclosure treatment of the actual or potential impact to the Registrant of final or proposed rules, standards or interpretations by the Securities and Exchange Commission, the Financial Accounting Standards Boards or other regulatory or standard-setting bodies.
The aggregate fees billed in the Reporting Periods for non-audit assurance and related services by the Auditor to the Registrant's investment adviser (not including any sub-investment adviser whose role is primarily portfolio management and is subcontracted with or overseen by another investment adviser), and any entity controlling, controlled by or under common control with the investment adviser that provides ongoing services to the Registrant ("Service Affiliates"), that were reasonably related to the performance of the annual audit of the Service Affiliate, which required pre-approval by the Audit Committee were $0 in 2013 and $0 in 2014.
(c) Tax Fees. The aggregate fees billed in the Reporting Periods for professional services rendered by the Auditor for tax compliance, tax advice, and tax planning ("Tax Services") were $9,922 in 2013 and $11,200 in 2014. These services consisted of: (i) review or preparation of U.S. federal, state, local and excise tax returns; (ii) U.S. federal, state and local tax planning, advice and assistance regarding statutory, regulatory or administrative developments; (iii) tax advice regarding tax qualification matters and/or treatment of various financial instruments held or proposed to be acquired or held, and (iv) determination of Passive Foreign Investment Companies. The aggregate fees billed in the Reporting Periods for Tax Services by the Auditor to Service Affiliates, which required pre-approval by the Audit Committee were $0 in 2013 and $0 in 2014.
(d) All Other Fees. The aggregate fees billed in the Reporting Periods for products and services provided by the Auditor, other than the services reported in paragraphs (a) through (c) of this Item, were $482 in 2013 and $1,364 in 2014. [These services included a review of the Registrant's anti-money laundering program].
The aggregate fees billed in the Reporting Periods for Non-Audit Services by the Auditor to Service Affiliates, other than the services reported in paragraphs (b) through (c) of this Item, which required pre-approval by the Audit Committee, were $0 in 2013 and $0 in 2014.
(e)(1) Audit Committee Pre-Approval Policies and Procedures. The Registrant's Audit Committee has established policies and procedures (the "Policy") for pre-approval (within specified fee limits) of the Auditor's engagements for non-audit services to the Registrant and Service Affiliates without specific case-by-case consideration. The pre-approved services in the Policy can include pre-approved audit services, pre-approved audit-related services, pre-approved tax services and pre-approved all other services. Pre-approval considerations include whether the proposed services are compatible with maintaining the Auditor's independence. Pre-approvals pursuant to the Policy are considered annually.
(e)(2) Note: None of the services described in paragraphs (b) through (d) of this Item 4 were approved by the Audit Committee pursuant to paragraph (c)(7)(i)(C) of Rule 2-01 of Regulation S-X.
(f) None of the hours expended on the principal accountant's engagement to audit the registrant's financial statements for the most recent fiscal year were attributed to work performed by persons other than the principal account's full-time, permanent employees.
Non-Audit Fees. The aggregate non-audit fees billed by the Auditor for services rendered to the Registrant, and rendered to Service Affiliates, for the Reporting Periods were $52,124,229 in 2013 and $30,348,123 in 2014.
Auditor Independence. The Registrant's Audit Committee has considered whether the provision of non-audit services that were rendered to Service Affiliates, which were not pre-approved (not requiring pre-approval), is compatible with maintaining the Auditor's independence.
Item 5. Audit Committee of Listed Registrants.
Not applicable. [CLOSED-END FUNDS ONLY]
Item 6. Investments.
(a) Not applicable.
Item 7. Disclosure of Proxy Voting Policies and Procedures for Closed-End Management Investment Companies.
Not applicable. [CLOSED-END FUNDS ONLY]
Item 8. Portfolio Managers of Closed-End Management Investment Companies.
Not applicable. [CLOSED-END FUNDS ONLY, beginning with reports for periods ended on and after December 31, 2005]
Item 9. Purchases of Equity Securities by Closed-End Management Investment Companies and Affiliated Purchasers.
Not applicable. [CLOSED-END FUNDS ONLY]
Item 10. Submission of Matters to a Vote of Security Holders.
There have been no material changes to the procedures applicable to Item 10.
Item 11. Controls and Procedures.
(a) The Registrant's principal executive and principal financial officers have concluded, based on their evaluation of the Registrant's disclosure controls and procedures as of a date within 90 days of the filing date of this report, that the Registrant's disclosure controls and procedures are reasonably designed to ensure that information required to be disclosed by the Registrant on Form N-CSR is recorded, processed, summarized and reported within the required time periods and that information required to be disclosed by the Registrant in the reports that it files or submits on Form N-CSR is accumulated and communicated to the Registrant's management, including its principal executive and principal financial officers, as appropriate to allow timely decisions regarding required disclosure.
(b) There were no changes to the Registrant's internal control over financial reporting that occurred during the second fiscal quarter of the period covered by this report that have materially affected, or are reasonably likely to materially affect, the Registrant's internal control over financial reporting.
Item 12. Exhibits.
(a)(1) Code of ethics referred to in Item 2.
(a)(2) Certifications of principal executive and principal financial officers as required by Rule 30a-2(a) under the Investment Company Act of 1940.
(a)(3) Not applicable.
(b) Certification of principal executive and principal financial officers as required by Rule 30a-2(b) under the Investment Company Act of 1940.
SIGNATURES
Pursuant to the requirements of the Securities Exchange Act of 1934 and the Investment Company Act of 1940, the Registrant has duly caused this Report to be signed on its behalf by the undersigned, thereunto duly authorized.
DREYFUS STOCK FUNDS
By: /s/ Bradley J. Skapyak |
Bradley J. Skapyak President |
Date: | November 17, 2014 |
|
Pursuant to the requirements of the Securities Exchange Act of 1934 and the Investment Company Act of 1940, this Report has been signed below by the following persons on behalf of the Registrant and in the capacities and on the dates indicated. |
|
By: /s/ Bradley J. Skapyak |
Bradley J. Skapyak President |
Date: | November 17, 2014 |
|
By: /s/ James Windels |
James Windels Treasurer |
Date: | November 17, 2014 |
|
EXHIBIT INDEX
(a)(1) Code of ethics referred to in Item 2.
(a)(2) Certifications of principal executive and principal financial officers as required by Rule 30a-2(a) under the Investment Company Act of 1940. (EX-99.CERT)
(b) Certification of principal executive and principal financial officers as required by Rule 30a-2(b) under the Investment Company Act of 1940. (EX-99.906CERT)