UNITED STATES
SECURITIES AND EXCHANGE COMMISSION
Washington, D.C. 20549
FORM N-CSR
CERTIFIED SHAREHOLDER REPORT OF REGISTERED MANAGEMENT
INVESTMENT COMPANIES
Investment Company Act file number | 811-21236 |
| |
| DREYFUS STOCK FUNDS | |
| (Exact name of Registrant as specified in charter) | |
| | |
| c/o The Dreyfus Corporation 200 Park Avenue New York, New York 10166 | |
| (Address of principal executive offices) (Zip code) | |
| | |
| Michael A. Rosenberg, Esq. 200 Park Avenue New York, New York 10166 | |
| (Name and address of agent for service) | |
|
Registrant's telephone number, including area code: | (212) 922-6000 |
| |
Date of fiscal year end: | 09/30 | |
Date of reporting period: | 09/30/11 | |
| | | | | | | |
FORM N-CSR
Item 1. Reports to Stockholders.
Dreyfus
International
Equity Fund
ANNUAL REPORT September 30, 2011

Save time. Save paper. View your next shareholder report online as soon as it’s available. Log into www.dreyfus.com and sign up for Dreyfus eCommunications. It’s simple and only takes a few minutes.
The views expressed in this report reflect those of the portfolio manager only through the end of the period covered and do not necessarily represent the views of Dreyfus or any other person in the Dreyfus organization. Any such views are subject to change at any time based upon market or other conditions and Dreyfus disclaims any responsibility to update such views.These views may not be relied on as investment advice and, because investment decisions for a Dreyfus fund are based on numerous factors, may not be relied on as an indication of trading intent on behalf of any Dreyfus fund.
| |
| | Contents |
| |
| | THE FUND |
| 2 | A Letter from the Chairman and CEO |
| 3 | Discussion of Fund Performance |
| 6 | Fund Performance |
| 8 | Understanding Your Fund’s Expenses |
| 8 | Comparing Your Fund’s Expenses |
| With Those of Other Funds |
| 9 | Statement of Investments |
| 13 | Statement of Assets and Liabilities |
| 14 | Statement of Operations |
| 15 | Statement of Changes in Net Assets |
| 17 | Financial Highlights |
| 21 | Notes to Financial Statements |
| 34 | Report of Independent Registered |
| | Public Accounting Firm |
| 35 | Important Tax Information |
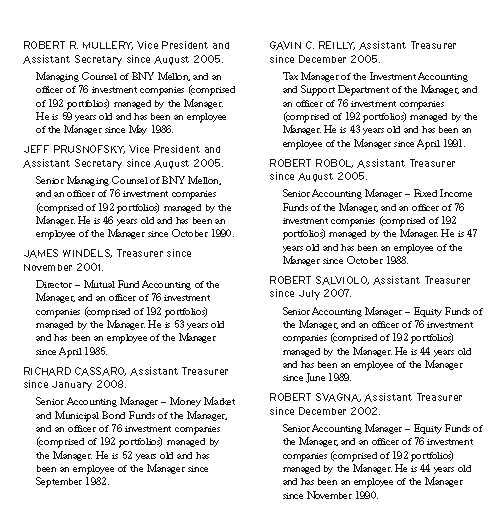
| 36 | Board Members Information |
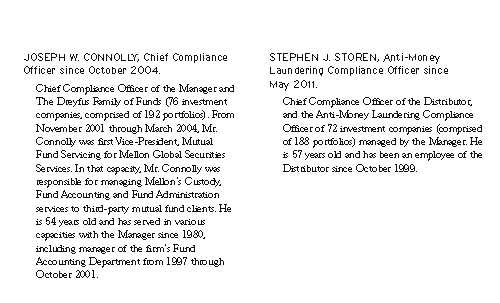
| 39 | Officers of the Fund |
| |
| FOR MORE INFORMATION |
|
| | Back Cover |
Dreyfus
International Equity Fund
The Fund

A LETTER FROM THE CHAIRMAN AND CEO
Dear Shareholder:
This annual report for Dreyfus International Equity Fund covers the 12-month period from October 1, 2010, through September 30, 2011. For information about how the fund performed during the reporting period, as well as general market perspectives, we provide a Discussion of Fund Performance on the pages that follow.
Although stocks in some markets rallied strongly over the first half of the reporting period amid expectations of a more robust economic recovery, investor sentiment deteriorated sharply during the second half due to disappointing economic data, rising commodity prices, an escalating sovereign debt crisis in Europe and a contentious debate regarding taxes, spending and borrowing in the United States. Market volatility was particularly severe during August and September after a major credit rating agency downgraded U.S. long-term debt. Stocks proved sensitive to macroeconomic concerns in this challenging environment, often regardless of more promising company fundamentals, and most international equity market indices ended the reporting period with negative absolute returns.
The economic outlook currently is clouded by market turbulence and political infighting, but we believe that a continued subpar global expansion is more likely than a return to recession. Inflationary pressures appear to be waning in most countries as energy prices recently have retreated from their highs. In the United States, the Federal Reserve Board has signaled its intention to maintain an aggressively accommodative monetary policy, which may help offset the financial stresses caused by deleveraging in the private sector and fiscal consolidation by governments in the United States and Europe. To assess the potential impact of these and other developments on your investments, we encourage you, as always, to speak with your financial advisor.
Thank you for your continued confidence and support.

Jonathan R. Baum
Chairman and Chief Executive Officer
The Dreyfus Corporation
October 17, 2011
2

DISCUSSION OF FUND PERFORMANCE
For the period of October 1, 2010, through September 30, 2011, as provided by Sean Fitzgibbon and Mark Bogar, Portfolio Managers
Fund and Market Performance Overview
For the 12-month period ended September 30, 2011, Dreyfus International Equity Fund’s Class A shares produced a total return of –9.06%, Class B shares returned –9.80%, Class C shares returned –9.78% and Class I shares returned –8.86%.1 In comparison, the fund’s benchmark, the Morgan Stanley Capital International Europe,Australasia, Far East Index (“MSCI EAFE Index”), produced a total return of –9.36% for the same period.2
Strong corporate earnings buoyed international stocks over the reporting period’s first half, but a number of macroeconomic challenges later erased those gains. The fund produced returns that were roughly in line with its benchmark, as strong stock selections in the materials, financials and information technology sectors were balanced by more disappointing results from the consumer discretionary and telecommunications services sectors.
The Fund’s Investment Approach
The fund seeks long-term growth of capital.The fund normally invests at least 80% of assets in shares of companies located in the foreign countries represented in the MSCI EAFE Index and Canada, and may also invest up to 25% of its assets in securities of issuers located in emerging market countries.
The fund invests in stocks that appear to be undervalued as measured by their price/earnings ratios, and that may have value and/or growth characteristics.We employ a “bottom-up” investment approach, which emphasizes individual stock selection. Our stock selection process is designed to produce a diversified portfolio that, relative to the MSCI EAFE Index, frequently has a below-average price/earnings ratio and an above-average earnings growth trend.
Macroeconomic Developments Challenged Global Markets
Expectations of continued global economic recovery prevailed through the first quarter of 2011, supporting investor sentiment and international
The Fund 3
DISCUSSION OF FUND PERFORMANCE (continued)
stock prices. While global markets continued to advance during the spring of 2011, investors grew more concerned about several economic challenges, including a sovereign debt crisis in Europe, inflationary pressures in China and rising energy prices stemming from political unrest in the Middle East. In March, catastrophic natural and nuclear disasters struck Japan, disrupting the global industrial supply chain. However, most equity markets rebounded quickly, and the MSCI EAFE Index hit new highs for the reporting period in April.
By May, investor sentiment began to deteriorate in earnest. U.S. economic growth proved more sluggish than expected, and a contentious debate about government spending and borrowing intensified. In Europe, the debt problems facing Ireland, Portugal, Spain and Italy intensified, and Greece faced the possibility of default. Market volatility proved especially severe during August and September, driving the MSCI EAFE Index well into negative territory for the reporting period overall.
Stock Selections Produced Mixed Results
In this challenging investment climate, the momentum factors considered by our investment process worked well, but valuation factors did not. Our bottom-up approach achieved strong relative performance in Japan, where stocks rebounded strongly from depressed levels after the earthquake and tsunami, while investments in the European Union suffered despite attractive valuations relative to historical norms.
The fund achieved strong relative results through a focus on chemicals companies in the materials sector, where limited manufacturing capacity and rising global demand supported earnings growth at industry giant BASF, German specialty chemicals producer Lanxess and Japan’s Mitsubishi Chemical Holdings. In addition, French chemical company Rhodia was acquired during the reporting period by Belgian chemical company Solvay at a 50% premium. In the financials sector, the fund largely avoided pronounced weakness among European banks while participating in the rebound of Japanese real estate financing company Daito Trust Construction after the earthquake and tsunami. Finally, in the information technology sector, Japanese technology conglomerate Hitachi reduced costs through restructuring and rebounded from depressed levels over the reporting period’s second half.The fund also benefited from its lack of exposure to Tokyo Electric Power, whose Fukushima power plants were at the center of Japan’s nuclear disaster.
4
Companies that fell short of investors’ expectations were punished during the market downturn, often severely. In the consumer discretionary sector, earnings for Danish jewelry producer Pandora were undermined by higher prices for precious metals and inventory problems, prompting its elimination from the portfolio. Among telecommunications services companies,Telecom Italia and France Telecom lost value due to economic concerns despite low valuations and high dividend yields.
Identifying Opportunities Despite Global Challenges
Although we expect heightened market volatility to persist over the near term, we believe that investor sentiment is likely to improve over the longer term as Europe’s sovereign debt crisis moves closer to resolution and fears of a “hard landing” wane in China.As of the reporting period’s end, our security selection process has identified a number of opportunities in the consumer discretionary and energy sectors, and the prospects of industrials companies appear to be improving.We have found fewer opportunities meeting our investment criteria in the materials and telecommunications services sectors.
October 17, 2011
Please note, the position in any security highlighted with italicized typeface was sold during the reporting period.
Equity funds are subject generally to market, market sector, market liquidity, issuer and investment style risks, among other factors, to varying degrees, all of which are more fully described in the fund’s prospectus.
The fund’s performance will be influenced by political, social and economic factors affecting investments in foreign companies. Special risks associated with investments in foreign companies include exposure to currency fluctuations, less liquidity, less developed or less efficient trading markets, lack of comprehensive company information, political instability and differing auditing and legal standards.These risks are enhanced in emerging markets countries. Investments in foreign currencies are subject to the risk that those currencies will decline in value relative to the U.S. dollar, or, in the case of hedged positions, that the U.S. dollar will decline relative to the currency being hedged. Each of these risks could increase the fund’s volatility.
1 Total return includes reinvestment of dividends and any capital gains paid, and does not take into
consideration the maximum initial sales charge in the case of Class A shares, or the applicable
contingent deferred sales charges imposed on redemptions in the case of Class B and Class C
shares. Had these charges been reflected, returns would have been lower. Past performance is no
guarantee of future results. Share price and investment return fluctuate such that upon redemption,
fund shares may be worth more or less than their original cost. Return figures provided reflect the
absorption of certain fund expenses by The Dreyfus Corporation and The Boston Company Asset
Management, LLC. Had these expenses not been absorbed, returns would have been lower.
2 SOURCE: LIPPER INC. – Reflects reinvestment of net dividends and, where applicable,
capital gain distributions.The Morgan Stanley Capital International Europe,Australasia, Far
East (MSCI EAFE) Index is an unmanaged index composed of a sample of companies
representative of the market structure of European and Pacific Basin countries. Returns are
calculated on a month-end basis. Investors cannot invest directly in any index.
The Fund 5
FUND PERFORMANCE
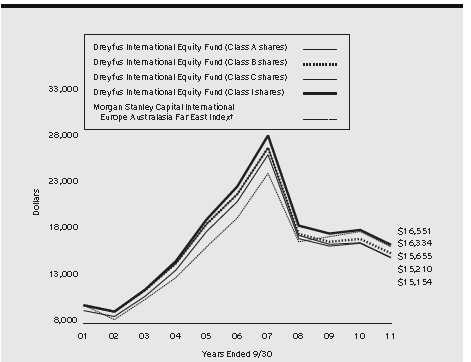
Comparison of change in value of $10,000 investment in Dreyfus International Equity Fund Class A shares, Class B shares, Class C shares and Class I shares and the Morgan Stanley Capital International Europe Australasia Far East Index
† Source: Lipper Inc.
Past performance is not predictive of future performance.
The above graph compares a $10,000 investment made in Class A, Class B, Class C and Class I shares of Dreyfus International Equity Fund on 9/30/01 to a $10,000 investment made in the Morgan Stanley Capital International Europe Australasia Far East Index (the “Index”) on that date.All dividends and capital gain distributions are reinvested.
Prior to 8/1/07, the fund invested its assets in a "master portfolio" that had the same investment objective and policies as the fund. This master/feeder arrangement was terminated on 8/1/07 and the fund operates as a stand alone fund. Performance information represents the performance of the predecessor master portfolio (and its predecessor fund) and the expenses of the master portfolio’s predecessor fund through January 31, 2003, and the fund’s performance and expense structure thereafter. The master portfolio’s predecessor fund contributed all of its assets to the master portfolio before the fund commenced investment operations on 2/1/03.
The fund’s performance shown in the line graph above takes into account the maximum initial sales charge on Class A shares and all other applicable fees and expenses on all classes. Performance for Class B shares assumes the conversion of Class B shares to Class A shares at the end of the sixth year following the date of purchase.The Index is an unmanaged index composed of a sample of companies representative of the market structure of European and Pacific Basin countries. Unlike a mutual fund, the Index is not subject to charges, fees and other expenses. Investors cannot invest directly in any index. Further information relating to fund performance, including expense reimbursements, if applicable, is contained in the Financial Highlights section of the prospectus and elsewhere in this report.
6
| | | | | | |
| Average Annual Total Returns as of 9/30/11 | | | |
| |
| | 1Year | 5 Years | 10 Years |
| Class A shares | | | |
| with maximum sales charge (5.75%) | –14.27% | –7.58% | 4.28% |
| without sales charge | –9.06% | –6.48% | 4.90% |
| Class B shares | | | |
| with applicable redemption charge † | –13.37% | –7.60% | 4.58% |
| without redemption | –9.80% | –7.28% | 4.58% |
| Class C shares | | | |
| with applicable redemption charge †† | –10.67% | –7.23% | 4.25% |
| without redemption | –9.78% | –7.23% | 4.25% |
| Class I shares | –8.86% | –6.28% | 5.17% |
| Morgan Stanley Capital International | | | |
| Europe Australasia Far East Index | –9.36% | –3.46% | 5.03% |
Past performance is not predictive of future performance.The fund’s performance shown in the graph and table does not reflect the deduction of taxes that a shareholder would pay on fund distributions or the redemption of fund shares.
| |
| † | The maximum contingent deferred sales charge for Class B shares is 4%.After six years Class B shares convert to |
| | Class A shares. |
| †† | The maximum contingent deferred sales charge for Class C shares is 1% for shares redeemed within one year of the |
| | date of purchase. |
The Fund 7
UNDERSTANDING YOUR FUND’S EXPENSES (Unaudited)
As a mutual fund investor, you pay ongoing expenses, such as management fees and other expenses. Using the information below, you can estimate how these expenses affect your investment and compare them with the expenses of other funds.You also may pay one-time transaction expenses, including sales charges (loads) and redemption fees, which are not shown in this section and would have resulted in higher total expenses. For more information, see your fund’s prospectus or talk to your financial adviser.
Review your fund’s expenses
The table below shows the expenses you would have paid on a $1,000 investment in Dreyfus International Equity Fund from April 1, 2011 to September 30, 2011. It also shows how much a $1,000 investment would be worth at the close of the period, assuming actual returns and expenses.
Expenses and Value of a $1,000 Investment assuming actual returns for the six months ended September 30, 2011
| | | | | | | | |
| | | Class A | | Class B | | Class C | | Class I |
| Expenses paid per $1,000† | $ | 5.06 | $ | 8.79 | $ | 8.57 | $ | 3.84 |
| Ending value (after expenses) | $ | 801.80 | $ | 798.50 | $ | 798.60 | $ | 802.60 |
COMPARING YOUR FUND’S EXPENSES WITH THOSE OF OTHER FUNDS (Unaudited)
Using the SEC’s method to compare expenses
The Securities and Exchange Commission (SEC) has established guidelines to help investors assess fund expenses. Per these guidelines, the table below shows your fund’s expenses based on a $1,000 investment, assuming a hypothetical 5% annualized return. You can use this information to compare the ongoing expenses (but not transaction expenses or total cost) of investing in the fund with those of other funds.All mutual fund shareholder reports will provide this information to help you make this comparison. Please note that you cannot use this information to estimate your actual ending account balance and expenses paid during the period.
Expenses and Value of a $1,000 Investment
assuming a hypothetical 5% annualized return for the six months ended September 30, 2011
| | | | | | | | |
| | | Class A | | Class B | | Class C | | Class I |
| Expenses paid per $1,000† | $ | 5.67 | $ | 9.85 | $ | 9.60 | $ | 4.31 |
| Ending value (after expenses) | $ | 1,019.45 | $ | 1,015.29 | $ | 1,015.54 | $ | 1,020.81 |
† Expenses are equal to the fund’s annualized expense ratio of 1.12% for Class A, 1.95% for Class B, 1.90% for
Class C, and .85% for Class I, multiplied by the average account value over the period, multiplied by 183/365 (to
reflect the one-half year period).
8
STATEMENT OF INVESTMENTS
September 30, 2011
| | | |
| Common Stocks—95.8% | Shares | Value ($) |
| Australia—8.4% | | |
| Atlas Iron | 430,270 | 1,155,399 |
| Australia & New Zealand Banking Group | 46,810 | 869,330 |
| BHP Billiton | 33,343 | 1,107,819 |
| Coca-Cola Amatil | 257,680 | 2,948,305 |
| Commonwealth Bank of Australia | 41,760 | 1,815,740 |
| Dexus Property Group | 1,877,280 | 1,480,715 |
| Rio Tinto Ltd. | 23,600 | 1,381,720 |
| Spark Infrastructure Group | 1,129,290a | 1,352,032 |
| Stockland | 359,470 | 999,884 |
| | | 13,110,944 |
| Denmark—.5% | | |
| Carlsberg, Cl. B | 12,700 | 753,312 |
| Finland—1.1% | | |
| Sampo, Cl. A | 66,110 | 1,655,771 |
| France—6.4% | | |
| Arkema | 14,930 | 867,040 |
| BNP Paribas | 43,207 | 1,710,230 |
| Sanofi | 64,000 | 4,202,169 |
| Technip | 15,550 | 1,244,431 |
| Total | 44,732 | 1,972,259 |
| | | 9,996,129 |
| Germany—5.9% | | |
| Deutsche Lufthansa | 74,510 | 961,177 |
| Fresenius & Co. | 17,330 | 1,538,024 |
| Gerresheimer | 30,100 | 1,246,647 |
| Hannover Rueckversicherung | 38,540 | 1,743,746 |
| Metro | 48,790 | 2,052,806 |
| SAP | 31,250 | 1,592,972 |
| | | 9,135,372 |
| Italy—4.4% | | |
| Enel | 705,710 | 3,122,309 |
| Telecom Italia | 3,477,380 | 3,775,911 |
| | | 6,898,220 |
| Japan—22.3% | | |
| Asahi Kasei | 269,000 | 1,614,498 |
| Canon | 50,000 | 2,263,603 |
The Fund 9
STATEMENT OF INVESTMENTS (continued)
| | | |
| Common Stocks (continued) | Shares | Value ($) |
| Japan (continued) | | |
| CAPCOM | 57,200 | 1,428,870 |
| Central Japan Railway | 221 | 1,925,590 |
| Daito Trust Construction | 42,900 | 3,933,707 |
| Fuji Heavy Industries | 430,000 | 2,511,839 |
| Hitachi | 652,000 | 3,242,871 |
| Keihin | 117,600 | 2,012,802 |
| Miraca Holdings | 31,400 | 1,380,369 |
| Mitsubishi | 153,500 | 3,125,978 |
| Mitsubishi Tanabe Pharma | 106,200 | 1,968,715 |
| Nippon Shokubai | 119,000 | 1,474,469 |
| NTN | 316,000 | 1,481,311 |
| Softbank | 47,800 | 1,399,245 |
| Sumitomo Mitsui Financial Group | 46,000 | 1,298,217 |
| Sumitomo Mitsui Trust Holdings | 572,600 | 1,892,906 |
| Toyo Suisan Kaisha | 60,000 | 1,644,201 |
| | | 34,599,191 |
| Luxembourg—.3% | | |
| ArcelorMittal | 25,900 | 413,649 |
| Macau—.5% | | |
| Sands China | 309,600b | 712,075 |
| Netherlands—4.7% | | |
| ING Groep | 301,590b | 2,122,589 |
| Koninklijke Philips Electronics | 97,990 | 1,754,084 |
| Nutreco | 13,690 | 853,603 |
| Unilever | 82,980 | 2,628,301 |
| | | 7,358,577 |
| Norway—1.0% | | |
| TGS Nopec Geophysical | 80,310 | 1,492,832 |
| Portugal—.5% | | |
| Jeronimo Martins | 49,060 | 764,437 |
| Spain—3.5% | | |
| Banco Santander | 245,160 | 2,004,188 |
| Inditex | 10,750 | 920,603 |
| Red Electrica | 19,870 | 906,753 |
| Repsol | 62,890 | 1,657,016 |
| | | 5,488,560 |
10
| | | |
| Common Stocks (continued) | Shares | Value ($) |
| Sweden—2.0% | | |
| Autoliv, SDR | 15,900 | 773,955 |
| Volvo, Cl. B | 237,260 | 2,319,631 |
| | | 3,093,586 |
| Switzerland—6.9% | | |
| ABB | 153,130b | 2,615,109 |
| Adecco | 27,820b | 1,090,901 |
| Cie Financiere Richemont, Cl. A | 20,230 | 898,024 |
| Nestle | 27,547 | 1,514,267 |
| Partners Group Holding | 9,380 | 1,543,313 |
| Transocean | 26,180 | 1,259,426 |
| Zurich Financial Services | 8,670b | 1,794,915 |
| | | 10,715,955 |
| United Arab Emirates—1.0% | | |
| Dragon Oil | 200,810 | 1,487,697 |
| United Kingdom—24.6% | | |
| Aberdeen Asset Management | 365,660 | 978,142 |
| Barclays | 598,690 | 1,469,684 |
| British American Tobacco | 82,640 | 3,502,703 |
| British Land | 215,220 | 1,589,383 |
| BT Group | 535,690 | 1,435,987 |
| Burberry Group | 65,500 | 1,185,652 |
| Experian | 206,520 | 2,323,401 |
| GlaxoSmithKline | 191,210 | 3,947,826 |
| Kingfisher | 448,010 | 1,717,304 |
| Legal & General Group | 531,980 | 796,174 |
| Man Group | 275,080 | 711,424 |
| Old Mutual | 560,990 | 907,027 |
| Rexam | 268,690 | 1,288,553 |
| Rio Tinto PLC | 72,090 | 3,183,858 |
| Royal Bank of Scotland Group | 3,113,610b | 1,114,678 |
| Royal Dutch Shell, Cl. A | 12,455 | 386,297 |
| Royal Dutch Shell, Cl. B | 198,500 | 6,165,388 |
| Smith & Nephew | 156,620 | 1,408,111 |
| Unilever | 56,410 | 1,767,092 |
| WPP | 263,160 | 2,426,908 |
| | | 38,305,592 |
The Fund 11
| | | |
| STATEMENT OF INVESTMENTS (continued) | | | |
| |
| |
| |
| |
| Common Stocks (continued) | Shares | | Value ($) |
| United States—1.8% | | | |
| iShares MSCI EAFE Index Fund | 57,420 | | 2,743,528 |
| Total Common Stocks | | | |
| (cost $167,260,578) | | | 148,725,427 |
| |
| Preferred Stocks—3.0% | | | |
| Germany—3.0% | | | |
| ProSiebenSat.1 Media | 131,690 | | 2,305,565 |
| Volkswagen | 18,074 | | 2,391,181 |
| Total Preferred Stocks | | | |
| (cost $5,347,718) | | | 4,696,746 |
| |
| Other Investment—.8% | | | |
| Registered Investment Company; | | | |
| Dreyfus Institutional Preferred Plus Money Market Fund | | | |
| (cost $1,299,000) | 1,299,000 | c | 1,299,000 |
| Total Investments (cost $173,907,296) | 99.6 | % | 154,721,173 |
| Cash and Receivables (Net) | .4 | % | 572,957 |
| Net Assets | 100.0 | % | 155,294,130 |
SDR-Swedish Depository Receipts
a Security exempt from registration under Rule 144A of the Securities Act of 1933.This security may be resold in
transactions exempt from registration, normally to qualified institutional buyers.At September 30, 2011, this security
was valued at $1,352,032 or .9% of net assets.
b Non-income producing security.
c Investment in affiliated money market mutual fund.
| | | |
| Portfolio Summary (Unaudited)† | | |
| |
| | Value (%) | | Value (%) |
| Financial | 18.2 | Information Technology | 6.4 |
| Consumer Discretionary | 16.7 | Utilities | 3.5 |
| Consumer Staples | 11.9 | Telecommunication Services | 3.4 |
| Energy | 10.1 | Exchange Traded Funds | 1.8 |
| Health Care | 10.1 | Money Market Investment | .8 |
| Industrial | 8.7 | | |
| Materials | 8.0 | | 99.6 |
| |
| † Based on net assets. | | | |
| See notes to financial statements. | | | |
12
STATEMENT OF ASSETS AND LIABILITIES
September 30, 2011
| | | | | |
| | | | Cost | Value |
| Assets ($): | | | | |
| Investments in securities—See Statement of Investments: | | | |
| Unaffiliated issuers | | | 172,608,296 | 153,422,173 |
| Affiliated issuers | | | 1,299,000 | 1,299,000 |
| Cash denominated in foreign currencies | | 224,015 | 219,720 |
| Receivable for investment securities sold | | | 1,365,428 |
| Dividends and interest receivable | | | | 1,142,400 |
| Unrealized appreciation on forward foreign | | | |
| currency exchange contracts—Note 4 | | | | 2,447 |
| Receivable for shares of Beneficial Interest subscribed | | | 924 |
| Prepaid expenses | | | | 12,152 |
| | | | | 157,464,244 |
| Liabilities ($): | | | | |
| Due to The Boston Company Asset | | | | |
| Management, LLC and affiliates—Note 3(c) | | | 120,746 |
| Cash overdraft due to Custodian | | | | 92,364 |
| Payable for investment securities purchased | | | 1,774,627 |
| Payable for shares of Beneficial Interest redeemed | | | 78,300 |
| Interest payable—Note 2 | | | | 159 |
| Accrued expenses | | | | 103,918 |
| | | | | 2,170,114 |
| Net Assets ($) | | | | 155,294,130 |
| Composition of Net Assets ($): | | | | |
| Paid-in capital | | | | 253,417,504 |
| Accumulated undistributed investment income—net | | | 2,849,163 |
| Accumulated net realized gain (loss) on investments | | | (81,787,751) |
| Accumulated net unrealized appreciation (depreciation) | | | |
| on investments and foreign currency transactions | | | (19,184,786) |
| Net Assets ($) | | | | 155,294,130 |
| |
| |
| Net Asset Value Per Share | | | | |
| | Class A | Class B | Class C | Class I |
| Net Assets ($) | 37,388,552 | 964,682 | 5,348,131 | 111,592,765 |
| Shares Outstanding | 1,596,730 | 41,396 | 228,193 | 4,731,722 |
| Net Asset Value Per Share ($) | 23.42 | 23.30 | 23.44 | 23.58 |
| See notes to financial statements. | | | | |
The Fund 13
| | |
| STATEMENT OF OPERATIONS | |
| Year Ended September 30, 2011 | |
| |
| |
| |
| |
| Investment Income ($): | |
| Income: | |
| Cash dividends (net of $511,178 foreign taxes withheld at source): | |
| Unaffiliated issuers | 5,414,532 |
| Affiliated issuers | 2,169 |
| Interest | 796 |
| Total Income | 5,417,497 |
| Expenses: | |
| Investment advisory fee—Note 3(a) | 1,369,721 |
| Administration fee—Note 3(a) | 171,215 |
| Shareholder servicing costs—Note 3(c) | 295,612 |
| Professional fees | 76,948 |
| Custodian fees—Note 3(c) | 74,622 |
| Distribution fees—Note 3(b) | 68,095 |
| Registration fees | 58,132 |
| Trustees’ fees and expenses—Note 3(d) | 22,060 |
| Prospectus and shareholders’ reports | 20,697 |
| Loan commitment fees—Note 2 | 1,870 |
| Interest expense—Note 2 | 1,070 |
| Miscellaneous | 24,211 |
| Total Expenses | 2,184,253 |
| Less—reduction in investment advisory fee | |
| due to undertaking—Note 3(a) | (486,423) |
| Less—reduction in fees due to earnings credits—Note 3(c) | (348) |
| Net Expenses | 1,697,482 |
| Investment Income—Net | 3,720,015 |
| Realized and Unrealized Gain (Loss) on Investments—Note 4 ($): | |
| Net realized gain (loss) on investments and foreign currency transactions | 8,583,284 |
| Net realized gain (loss) on forward foreign currency exchange contracts | (32,196) |
| Net Realized Gain (Loss) | 8,551,088 |
| Net unrealized appreciation (depreciation) | |
| on investments and foreign currency transactions | (31,279,091) |
| Net unrealized appreciation (depreciation) | |
| on forward foreign currency exchange contracts | 301 |
| Net Unrealized Appreciation (Depreciation) | (31,278,790) |
| Net Realized and Unrealized Gain (Loss) on Investments | (22,727,702) |
| Net (Decrease) in Net Assets Resulting from Operations | (19,007,687) |
| |
| See notes to financial statements. | |
14
STATEMENT OF CHANGES IN NET ASSETS
| | | | |
| | Year Ended September 30, |
| | 2011 | 2010 |
| Operations ($): | | |
| Investment income—net | 3,720,015 | 2,542,145 |
| Net realized gain (loss) on investments | 8,551,088 | 172,510 |
| Net unrealized appreciation | | |
| (depreciation) on investments | (31,278,790) | (588,961) |
| Net Increase (Decrease) in Net Assets | | |
| Resulting from Operations | (19,007,687) | 2,125,694 |
| Dividends to Shareholders from ($): | | |
| Investment income—net: | | |
| Class A Shares | (1,234,422) | (1,507,279) |
| Class B Shares | (20,226) | (32,954) |
| Class C Shares | (94,023) | (124,420) |
| Class I Shares | (2,051,598) | (1,287,423) |
| Total Dividends | (3,400,269) | (2,952,076) |
| Beneficial Interest Transactions ($): | | |
| Net proceeds from shares sold: | | |
| Class A Shares | 3,279,082 | 4,679,563 |
| Class B Shares | 4,785 | 39,607 |
| Class C Shares | 844,584 | 703,287 |
| Class I Shares | 55,172,018 | 59,559,407 |
| Dividends reinvested: | | |
| Class A Shares | 1,162,122 | 1,415,765 |
| Class B Shares | 15,031 | 23,791 |
| Class C Shares | 51,936 | 68,985 |
| Class I Shares | 2,051,056 | 1,281,710 |
| Cost of shares redeemed: | | |
| Class A Shares | (22,649,461) | (24,317,208) |
| Class B Shares | (970,529) | (1,592,392) |
| Class C Shares | (3,087,717) | (3,461,813) |
| Class I Shares | (4,620,606) | (14,612,926) |
| Increase (Decrease) in Net Assets from | | |
| Beneficial Interest Transactions | 31,252,301 | 23,787,776 |
| Total Increase (Decrease) in Net Assets | 8,844,345 | 22,961,394 |
| Net Assets ($): | | |
| Beginning of Period | 146,449,785 | 123,488,391 |
| End of Period | 155,294,130 | 146,449,785 |
| Undistributed investment income—net | 2,849,163 | 2,115,700 |
The Fund 15
STATEMENT OF CHANGES IN NET ASSETS (continued)
| | | | |
| | Year Ended September 30, |
| | 2011 | 2010 |
| Capital Share Transactions: | | |
| Class Aa | | |
| Shares sold | 115,382 | 181,205 |
| Shares issued for dividends reinvested | 42,244 | 53,425 |
| Shares redeemed | (786,244) | (960,292) |
| Net Increase (Decrease) in Shares Outstanding | (628,618) | (725,662) |
| Class Ba | | |
| Shares sold | 145 | 1,534 |
| Shares issued for dividends reinvested | 545 | 898 |
| Shares redeemed | (34,604) | (62,808) |
| Net Increase (Decrease) in Shares Outstanding | (33,914) | (60,376) |
| Class C | | |
| Shares sold | 29,271 | 26,482 |
| Shares issued for dividends reinvested | 1,875 | 2,587 |
| Shares redeemed | (108,103) | (135,728) |
| Net Increase (Decrease) in Shares Outstanding | (76,957) | (106,659) |
| Class I | | |
| Shares sold | 1,888,349 | 2,320,740 |
| Shares issued for dividends reinvested | 74,179 | 48,112 |
| Shares redeemed | (173,146) | (603,865) |
| Net Increase (Decrease) in Shares Outstanding | 1,789,382 | 1,764,987 |
a During the period ended September 30, 2011, 5,663 Class B shares representing $161,750 were automatically
converted to 5,654 Class A shares and during the period ended September 30, 2010, 14,796 Class B shares
representing $376,838 were automatically converted to 14,746 Class A shares.
See notes to financial statements.
16
FINANCIAL HIGHLIGHTS
The following tables describe the performance for each share class for the fiscal periods indicated.All information (except portfolio turnover rate) reflects financial results for a single fund share.Total return shows how much your investment in the fund would have increased (or decreased) during each period, assuming you had reinvested all dividends and distributions.These figures have been derived from the fund’s financial statements.
| | | | | | | | | | |
| | | Year Ended September 30, | |
| Class A Shares | 2011 | 2010 | 2009 | 2008 | 2007 |
| Per Share Data ($): | | | | | |
| Net asset value, beginning of period | 26.30 | 26.36 | 29.26 | 48.76 | 40.05 |
| Investment Operations: | | | | | |
| Investment income—neta | .52 | .42 | .45 | .77 | .63 |
| Net realized and unrealized | | | | | |
| gain (loss) on investments | (2.81) | .06 | (2.11) | (16.45) | 8.81 |
| Total from Investment Operations | (2.29) | .48 | (1.66) | (15.68) | 9.44 |
| Distributions: | | | | | |
| Dividends from investment income—net | (.59) | (.54) | (1.24) | (.67) | (.28) |
| Dividends from net realized | | | | | |
| gain on investments | — | — | — | (3.15) | (.45) |
| Total Distributions | (.59) | (.54) | (1.24) | (3.82) | (.73) |
| Net asset value, end of period | 23.42 | 26.30 | 26.36 | 29.26 | 48.76 |
| Total Return (%)b | (9.06) | 1.84 | (4.73) | (34.53) | 23.80 |
| Ratios/Supplemental Data (%): | | | | | |
| Ratio of total expenses | | | | | |
| to average net assets | 1.50 | 1.64 | 1.84 | 1.57 | 1.27c |
| Ratio of net expenses | | | | | |
| to average net assets | 1.12 | 1.12 | 1.12 | 1.12 | 1.19c |
| Ratio of net investment income | | | | | |
| to average net assets | 1.86 | 1.65 | 2.12 | 1.90 | 1.37c |
| Portfolio Turnover Rate | 89.90 | 86.84 | 160.27 | 117.20 | 18.76d,e |
| Net Assets, end of period ($ x 1,000) | 37,389 | 58,526 | 77,775 | 129,886 | 286,373 |
a Based on average shares outstanding at each month end.
b Exclusive of sales charge.
c For the period from October 1, 2006 to July 31, 2007, the ratios include the fund’s share of The Boston Company
International Core Equity Portfolio’s (the “Portfolio”) allocated income and expenses.
d Not annualized.
e For the period from October 1, 2006 to July 31, 2007, the fund invested exclusively in the Portfolio under a
master/feeder organizational structure that was terminated on August 1, 2007. On that date, the fund withdrew
entirely from the Portfolio and received the Portfolio’s securities and cash in exchange for its interest in the Portfolio.
Effective August 1, 2007, the fund began investing directly in the securities in which the Portfolio had invested.
Portfolio turnover represents investment activity of the fund.
See notes to financial statements.
The Fund 17
FINANCIAL HIGHLIGHTS (continued)
| | | | | | | | | | |
| | | Year Ended September 30, | |
| Class B Shares | 2011 | 2010 | 2009 | 2008 | 2007 |
| Per Share Data ($): | | | | | |
| Net asset value, beginning of period | 26.13 | 26.14 | 28.70 | 47.83 | 39.40 |
| Investment Operations: | | | | | |
| Investment income—neta | .28 | .19 | .26 | .41 | .19 |
| Net realized and unrealized | | | | | |
| gain (loss) on investments | (2.80) | .07 | (2.03) | (16.15) | 8.73 |
| Total from Investment Operations | (2.52) | .26 | (1.77) | (15.74) | 8.92 |
| Distributions: | | | | | |
| Dividends from investment income—net | (.31) | (.27) | (.79) | (.24) | (.04) |
| Dividends from net realized | | | | | |
| gain on investments | — | — | — | (3.15) | (.45) |
| Total Distributions | (.31) | (.27) | (.79) | (3.39) | (.49) |
| Net asset value, end of period | 23.30 | 26.13 | 26.14 | 28.70 | 47.83 |
| Total Return (%)b | (9.80) | .96 | (5.63) | (35.04) | 22.79 |
| Ratios/Supplemental Data (%): | | | | | |
| Ratio of total expenses | | | | | |
| to average net assets | 2.42 | 2.74 | 2.78 | 2.40 | 2.06c |
| Ratio of net expenses | | | | | |
| to average net assets | 1.95 | 1.95 | 1.95 | 1.95 | 2.00c |
| Ratio of net investment income | | | | | |
| to average net assets | 1.00 | .75 | 1.23 | 1.04 | .43c |
| Portfolio Turnover Rate | 89.90 | 86.84 | 160.27 | 117.20 | 18.76d,e |
| Net Assets, end of period ($ x 1,000) | 965 | 1,968 | 3,547 | 6,356 | 13,590 |
a Based on average shares outstanding at each month end.
b Exclusive of sales charge.
c For the period from October 1, 2006 to July 31, 2007, the ratios include the fund’s share of The Boston Company
International Core Equity Portfolio’s (the “Portfolio”) allocated income and expenses.
d Not annualized.
e For the period from October 1, 2006 to July 31, 2007, the fund invested exclusively in the Portfolio under a
master/feeder organizational structure that was terminated on August 1, 2007. On that date, the fund withdrew
entirely from the Portfolio and received the Portfolio’s securities and cash in exchange for its interest in the Portfolio.
Effective August 1, 2007, the fund began investing directly in the securities in which the Portfolio had invested.
Portfolio turnover represents investment activity of the fund.
See notes to financial statements.
18
| | | | | | | | | | |
| | | Year Ended September 30, | |
| Class C Shares | 2011 | 2010 | 2009 | 2008 | 2007 |
| Per Share Data ($): | | | | | |
| Net asset value, beginning of period | 26.30 | 26.34 | 28.82 | 47.81 | 39.40 |
| Investment Operations: | | | | | |
| Investment income—neta | .33 | .22 | .27 | .37 | .23 |
| Net realized and unrealized | | | | | |
| gain (loss) on investments | (2.85) | .06 | (2.02) | (16.14) | 8.71 |
| Total from Investment Operations | (2.52) | .28 | (1.75) | (15.77) | 8.94 |
| Distributions: | | | | | |
| Dividends from investment income—net | (.34) | (.32) | (.73) | (.07) | (.08) |
| Dividends from net realized | | | | | |
| gain on investments | — | — | — | (3.15) | (.45) |
| Total Distributions | (.34) | (.32) | (.73) | (3.22) | (.53) |
| Net asset value, end of period | 23.44 | 26.30 | 26.34 | 28.82 | 47.81 |
| Total Return (%)b | (9.78) | 1.03 | (5.54) | (35.04) | 22.85 |
| Ratios/Supplemental Data (%): | | | | | |
| Ratio of total expenses | | | | | |
| to average net assets | 2.27 | 2.46 | 2.62 | 2.30 | 1.99c |
| Ratio of net expenses | | | | | |
| to average net assets | 1.90 | 1.90 | 1.90 | 1.90 | 1.96c |
| Ratio of net investment income | | | | | |
| to average net assets | 1.16 | .87 | 1.28 | .93 | .51c |
| Portfolio Turnover Rate | 89.90 | 86.84 | 160.27 | 117.20 | 18.76d,e |
| Net Assets, end of period ($ x 1,000) | 5,348 | 8,025 | 10,848 | 19,529 | 66,102 |
a Based on average shares outstanding at each month end.
b Exclusive of sales charge.
c For the period from October 1, 2006 to July 31, 2007, the ratios include the fund’s share of The Boston Company
International Core Equity Portfolio’s (the “Portfolio”) allocated income and expenses.
d Not annualized.
e For the period from October 1, 2006 to July 31, 2007, the fund invested exclusively in the Portfolio under a
master/feeder organizational structure that was terminated on August 1, 2007. On that date, the fund withdrew
entirely from the Portfolio and received the Portfolio’s securities and cash in exchange for its interest in the Portfolio.
Effective August 1, 2007, the fund began investing directly in the securities in which the Portfolio had invested.
Portfolio turnover represents investment activity of the fund.
See notes to financial statements.
The Fund 19
FINANCIAL HIGHLIGHTS (continued)
| | | | | | | | | | |
| | | Year Ended September 30, | |
| Class I Shares | 2011 | 2010 | 2009 | 2008 | 2007a |
| Per Share Data ($): | | | | | |
| Net asset value, beginning of period | 26.49 | 26.60 | 29.73 | 49.50 | 40.57 |
| Investment Operations: | | | | | |
| Investment income—netb | .68 | .55 | .58 | .54 | .76 |
| Net realized and unrealized | | | | | |
| gain (loss) on investments | (2.93) | .00c | (2.27) | (16.37) | 8.94 |
| Total from Investment Operations | (2.25) | .55 | (1.69) | (15.83) | 9.70 |
| Distributions: | | | | | |
| Dividends from investment income—net | (.66) | (.66) | (1.44) | (.79) | (.32) |
| Dividends from net realized | | | | | |
| gain on investments | — | — | — | (3.15) | (.45) |
| Total Distributions | (.66) | (.66) | (1.44) | (3.94) | (.77) |
| Net asset value, end of period | 23.58 | 26.49 | 26.60 | 29.73 | 49.50 |
| Total Return (%) | (8.86) | 2.06 | (4.62) | (34.34) | 24.12 |
| Ratios/Supplemental Data (%): | | | | | |
| Ratio of total expenses | | | | | |
| to average net assets | 1.08 | 1.20 | 1.26 | 1.19 | .93d |
| Ratio of net expenses | | | | | |
| to average net assets | .85 | .85 | .85 | .85 | .91d |
| Ratio of net investment income | | | | | |
| to average net assets | 2.41 | 2.13 | 2.58 | 1.30 | 1.63d |
| Portfolio Turnover Rate | 89.90 | 86.84 | 160.27 | 117.20 | 18.76e,f |
| Net Assets, end of period ($ x 1,000) | 111,593 | 77,931 | 31,317 | 2,350 | 15,515 |
a Effective June 1, 2007, Class R shares were redesignated as Class I shares.
b Based on average shares outstanding at each month end.
c Amount represents less than $.01 per share.
d For the period from October 1, 2006 to July 31, 2007, the ratios include the fund’s share of The Boston Company
International Core Equity Portfolio’s (the “Portfolio”) allocated income and expenses.
e Not annualized.
f For the period from October 1, 2006 to July 31, 2007, the fund invested exclusively in the Portfolio under a
master/feeder organizational structure that was terminated on August 1, 2007. On that date, the fund withdrew
entirely from the Portfolio and received the Portfolio’s securities and cash in exchange for its interest in the Portfolio.
Effective August 1, 2007, the fund began investing directly in the securities in which the Portfolio had invested.
Portfolio turnover represents investment activity of the fund.
See notes to financial statements.
20
NOTES TO FINANCIAL STATEMENTS
NOTE 1—Significant Accounting Policies:
Dreyfus International Equity Fund (the “fund”) is a separate diversified series of Dreyfus Stock Funds (the “Company”), which is registered under the Investment Company Act of 1940, as amended (the “Act”), as an open-end management investment company and operates as a series company currently offering two series, including the fund.The fund’s investment objective is to seek long-term growth of capital.The Boston Company Asset Management, LLC (“TBCAM”) serves as the fund’s investment adviser.The Dreyfus Corporation (the “Administrator” or “Dreyfus”), a wholly-owned subsidiary of The Bank of NewYork Mellon Corporation (“BNY Mellon”) and an affiliate of TBCAM, serves as the fund’s Administrator.
MBSC Securities Corporation (the “Distributor”), a wholly-owned subsidiary of Dreyfus, is the distributor of the fund’s shares.The fund is authorized to issue an unlimited number of $.001 par value shares of Beneficial Interest in each of the following classes of shares: Class A, Class B, Class C and Class I. Class A shares are subject to a sales charge imposed at the time of purchase. Class B shares are subject to a contingent deferred sales charge (“CDSC”) imposed on Class B share redemptions made within six years of purchase and automatically convert to Class A shares after six years.The fund does not offer Class B shares, except in connection with dividend reinvestment and permitted exchanges of Class B shares and, effective on or about March 13, 2012, all outstanding Class B shares will automatically convert to Class A shares. Class C shares are subject to a CDSC imposed on Class C shares redeemed within one year of purchase. Class I shares are sold at net asset value per share only to institutional investors. Other differences between the classes include the services offered to and the expenses borne by each class, the allocation of certain transfer agency costs and certain voting rights. Income, expenses (other than expenses attributable to a specific class), and realized and unrealized gains or losses on investments are allocated to each class of shares based on its relative net assets.
The Fund 21
NOTES TO FINANCIAL STATEMENTS (continued)
The Company accounts separately for the assets, liabilities and operations of each series. Expenses directly attributable to each series are charged to that series’ operations; expenses which are applicable to all series are allocated among them on a pro rata basis.
The Financial Accounting Standards Board (“FASB”) Accounting Standards Codification (“ASC”) is the exclusive reference of authoritative U.S. generally accepted accounting principles (“GAAP”) recognized by the FASB to be applied by nongovernmental entities. Rules and interpretive releases of the Securities and Exchange Commission (“SEC”) under authority of federal laws are also sources of authoritative GAAP for SEC registrants. The fund’s financial statements are prepared in accordance with GAAP, which may require the use of management estimates and assumptions.Actual results could differ from those estimates.
The Company enters into contracts that contain a variety of indemnifications.The fund’s maximum exposure under these arrangements is unknown.The fund does not anticipate recognizing any loss related to these arrangements.
(a) Portfolio valuation: The fair value of a financial instrument is the amount that would be received to sell an asset or paid to transfer a liability in an orderly transaction between market participants at the measurement date (i.e. the exit price). GAAP establishes a fair value hierarchy that prioritizes the inputs of valuation techniques used to measure fair value.This hierarchy gives the highest priority to unadjusted quoted prices in active markets for identical assets or liabilities (Level 1 measurements) and the lowest priority to unobservable inputs (Level 3 measurements).
Additionally, GAAP provides guidance on determining whether the volume and activity in a market has decreased significantly and whether such a decrease in activity results in transactions that are not orderly. GAAP requires enhanced disclosures around valuation inputs and techniques used during annual and interim periods.
22
Various inputs are used in determining the value of the fund’s investments relating to fair value measurements.These inputs are summarized in the three broad levels listed below:
Level 1—unadjusted quoted prices in active markets for identical investments.
Level 2—other significant observable inputs (including quoted prices for similar investments, interest rates, prepayment speeds, credit risk, etc.).
Level 3—significant unobservable inputs (including the fund’s own assumptions in determining the fair value of investments).
The inputs or methodology used for valuing securities are not necessarily an indication of the risk associated with investing in those securities.
Changes in valuation techniques may result in transfers in or out of an assigned level within the disclosure hierarchy. Valuation techniques used to value the fund’s investments are as follows:
Investments in securities are valued at the last sales price on the securities exchange or national securities market on which such securities are primarily traded. Securities listed on the National Market System for which market quotations are available are valued at the official closing price or, if there is no official closing price that day, at the last sales price. Securities not listed on an exchange or the national securities market, or securities for which there were no transactions, are valued at the average of the most recent bid and asked prices, except for open short positions, where the asked price is used for valuation purposes. Bid price is used when no asked price is available. Registered investment companies that are not traded on an exchange are valued at their net asset value.All preceding securities are categorized within Level 1 of the fair value hierarchy.
The Fund 23
NOTES TO FINANCIAL STATEMENTS (continued)
Fair valuing of securities may be determined with the assistance of a pricing service using calculations based on indices of domestic securities and other appropriate indicators, such as prices of relevant American Depository Receipts and futures contracts. Utilizing these techniques may result in transfers between Level 1 and Level 2 of the fair value hierarchy.
When market quotations or official closing prices are not readily available, or are determined not to reflect accurately fair value, such as when the value of a security has been significantly affected by events after the close of the exchange or market on which the security is principally traded (for example, a foreign exchange or market), but before the fund calculates its net asset value, the fund may value these investments at fair value as determined in accordance with the procedures approved by the Board of Trustees. Certain factors may be considered when fair valuing investments such as: fundamental analytical data, the nature and duration of restrictions on disposition, an evaluation of the forces that influence the market in which the securities are purchased and sold, and public trading in similar securities of the issuer or comparable issuers.These securities are either categorized as Level 2 or 3 depending on the relevant inputs used.
For restricted securities where observable inputs are limited, assumptions about market activity and risk are used and are categorized within Level 3 of the fair value hierarchy.
Investments denominated in foreign currencies are translated to U.S. dollars at the prevailing rates of exchange. Forward foreign currency exchange contracts (“forward contracts”) are valued at the forward rate. These securities are generally categorized within Level 2 of the fair value hierarchy.
24
The following is a summary of the inputs used as of September 30, 2011 in valuing the fund’s investments:
| | | | | |
| | Level 1— | Level 2—Other | | Level 3— | |
| | Unadjusted | Significant | | Significant | |
| | Quoted | Observable | | Unobservable | |
| | Prices | Inputs | | Inputs | Total |
| Assets ($) | | | | | |
| Investments in Securities: | | | | |
| Equity Securities— | | | | | |
| Foreign† | — | 150,678,645 | †† | — | 150,678,645 |
| Mutual Funds/ | | | | | |
| Exchange | | | | | |
| Traded Funds | 4,042,528 | — | | — | 4,042,528 |
| Other Financial | | | | | |
| Instruments: | | | | | |
| Forward Foreign | | | | | |
| Currency Exchange | | | | | |
| Contracts††† | — | 2,447 | | — | 2,447 |
| |
| † | See Statement of Investments for additional detailed categorizations. |
| †† | Securities classified as Level 2 at period end as the values were determined pursuant to the fund’s |
| | fair valuation procedures. |
| ††† Amount shown represents unrealized appreciation at period end. |
In May 2011, FASB issued Accounting Standards Update (“ASU”) No. 2011-04 “Amendments to Achieve Common Fair Value Measurement and Disclosure Requirements in GAAP and International Financial Reporting Standards (“IFRS”)” (“ASU 2011-04”). ASU 2011-04 includes common requirements for measurement of and disclosure about fair value between GAAP and IFRS. ASU 2011-04 will require reporting entities to disclose the following information for fair value measurements categorized within Level 3 of the fair value hierarchy: quantitative information about the unobservable inputs used in the fair value measurement, the valuation processes used by the reporting entity
The Fund 25
NOTES TO FINANCIAL STATEMENTS (continued)
and a narrative description of the sensitivity of the fair value measurement to changes in unobservable inputs and the interrelationships between those unobservable inputs. In addition, ASU 2011-04 will require reporting entities to make disclosures about amounts and reasons for all transfers in and out of Level 1 and Level 2 fair value measurements. The new and revised disclosures are effective for interim and annual reporting periods beginning after December 15, 2011. At this time, management is evaluating the implications of ASU 2011-04 and its impact on the financial statements.
(b) Foreign currency transactions: The fund does not isolate that portion of the results of operations resulting from changes in foreign exchange rates on investments from the fluctuations arising from changes in market prices of securities held. Such fluctuations are included with the net realized and unrealized gain or loss on investments.
Net realized foreign exchange gains or losses arise from sales of foreign currencies, currency gains or losses realized on securities transactions between trade and settlement date and the difference between the amounts of dividends, interest and foreign withholding taxes recorded on the fund’s books and the U.S. dollar equivalent of the amounts actually received or paid. Net unrealized foreign exchange gains or losses arise from changes in the value of assets and liabilities other than investments resulting from changes in exchange rates. Foreign currency gains and losses on investments are included with net realized and unrealized gain or loss on investments.
(c) Securities transactions and investment income: Securities transactions are recorded on a trade date basis. Realized gains and losses from securities transactions are recorded on the identified cost basis. Dividend income is recognized on the ex-dividend date and interest income, including, where applicable, accretion of discount and amortization of premium on investments, is recognized on the accrual basis.
Investing in foreign markets may involve special risks and considerations not typically associated with investing in the U.S. These risks include revaluation of currencies, high rates of inflation, repatriation restrictions on income and capital, and adverse political and economic developments.
26
Moreover, securities issued in these markets may be less liquid, subject to government ownership controls and delayed settlements, and their prices may be more volatile than those of comparable securities in the U.S.
(d) Affiliated issuers: Investments in other investment companies advised by Dreyfus are defined as “affiliated” in the Act.
The fund may invest in shares of certain affiliated investment companies also advised or managed by Dreyfus. Investments in affiliated investment companies for the period ended September 30, 2011 were as follows:
| | | | | | | |
| Affiliated | | | | | | | |
| Investment | Value | | | | Value | | Net |
| Company | 9/30/2010 | ($) | Purchases ($) | Sales ($) | 9/30/2011 | ($) | Assets (%) |
| Dreyfus | | | | | | | |
| Institutional | | | | | | | |
| Preferred | | | | | | | |
| Plus Money | | | | | | | |
| Market Fund | 780,000 | | 88,183,000 | 87,664,000 | 1,299,000 | | .8 |
Certain affiliated investment companies also advised or managed by Dreyfus may also invest in the fund. At September 30, 2011, Dreyfus Diversified International Fund held 99% of the outstanding Class I shares of the fund.
(e) Dividends to shareholders: Dividends are recorded on the ex-dividend date. Dividends from investment income-net and dividends from net realized capital gains, if any, are normally declared and paid annually, but the fund may make distributions on a more frequent basis to comply with the distribution requirements of the Internal Revenue Code of 1986, as amended (the “Code”).To the extent that net realized capital gains can be offset by capital loss carryovers, it is the policy of the fund not to distribute such gains. Income and capital gain distributions are determined in accordance with income tax regulations, which may differ from GAAP.
(f) Federal income taxes: It is the policy of the fund to continue to qualify as a regulated investment company, if such qualification is in the best interests of its shareholders, by complying with the applicable provisions of the Code, and to make distributions of taxable income sufficient to relieve it from substantially all federal income and excise taxes.
The Fund 27
NOTES TO FINANCIAL STATEMENTS (continued)
As of and during the period ended September 30, 2011, the fund did not have any liabilities for any uncertain tax positions.The fund recognizes interest and penalties, if any, related to uncertain tax positions as income tax expense in the Statement of Operations. During the period, the fund did not incur any interest or penalties.
Each of the tax years in the four-year period ended September 30, 2011 remains subject to examination by the Internal Revenue Service and state taxing authorities.
At September 30, 2011, the components of accumulated earnings on a tax basis were as follows: undistributed ordinary income $2,983,132, accumulated capital losses $80,833,240 and unrealized depreciation $20,171,051. In addition, the fund had $102,215 of passive foreign investment company losses realized after October 31, 2010, which were deferred for tax purposes to the first day of the following fiscal year.
The accumulated capital loss carryover is available for federal income tax purposes to be applied against future net securities profits, if any, realized subsequent to September 30, 2011. If not applied, $32,961,104 of the carryover expires in fiscal 2017 and $47,872,136 expires in fiscal 2018.
Under the recently enacted Regulated Investment Company Modernization Act of 2010 (the “2010 Act”), the fund will be permitted to carry forward capital losses incurred in taxable years beginning after December 22, 2010 (“post-enactment losses”) for an unlimited period. However, the 2010 Act requires any post-enactment losses to be utilized before the utilization of losses incurred in taxable years prior to the effective date of the 2010 Act.As a result of this ordering rule, capital loss carryovers related to taxable years beginning prior to the effective date of the 2010 Act may be more likely to expire unused.
The tax character of distributions paid to shareholders during the fiscal periods ended September 30, 2011 and September 30, 2010 were as follows: ordinary income $3,400,269 and $2,952,076, respectively.
During the period ended September 30, 2011, as a result of permanent book to tax differences, primarily due to the tax treatment for passive foreign investment companies, foreign currency gains and losses and
28
recognition of book to tax differences resulting from prior year fund restructuring, the fund increased accumulated undistributed investment income-net by $413,717, decreased accumulated net realized gain (loss) on investments by $434,904 and increased paid-in capital by $21,187. Net assets and net asset value per share were not affected by this reclassification.
NOTE 2—Bank Lines of Credit:
The fund participates with other Dreyfus-managed funds in a $225 million unsecured credit facility led by Citibank, N.A. and a $300 million unsecured credit facility provided by The Bank of New York Mellon, a subsidiary of BNY Mellon and an affiliate of Dreyfus (each, a “Facility”), each to be utilized primarily for temporary or emergency purposes, including the financing of redemptions. In connection therewith, the fund has agreed to pay its pro rata portion of commitment fees for each Facility. Interest is charged to the fund based on rates determined pursuant to the terms of the respective Facility at the time of borrowing.
The average amount of borrowings outstanding under the Facilities during the period ended September 30, 2011 was approximately $76,400, with a related weighted average annualized interest rate of 1.40%.
NOTE 3—Investment Advisory Fee, Administration Fee and Other Transactions With Affiliates:
(a) Pursuant to an investment advisory agreement with TBCAM, the investment advisory fee is computed at the annual rate of .80% of the value of the fund’s average daily net assets up to $500 million, .75% of the next $500 million of such assets, .70% of the next $500 million of such assets, .60% of the next $500 million of such assets and .50% of the fund’s average daily net assets in excess of $2 billion and is payable monthly.
The fund compensates Dreyfus under an administration agreement for providing personnel and facilities to perform accounting and administration services for the fund at an annual rate of .10% of the
The Fund 29
NOTES TO FINANCIAL STATEMENTS (continued)
value of the fund’s average daily net assets. During the period ended September 30, 2011, the fund was charged $171,215 pursuant to the administration agreement.
Dreyfus and TBCAM have contractually agreed, with respect to each class of fund shares, to assume the expenses of each class so that such expenses of the fund’s Class A, B, C and I shares (excluding taxes, interest, brokerage commissions, commitment fees on borrowings and extraordinary expenses) do not exceed an annual rate of 1.12%, 1.95%, 1.90% and .85%, respectively, of the value of such class’ average daily net assets, until the fiscal year end following such time as the expenses are equal to or less than such annual rate for the applicable class.The reduction in investment advisory fee, pursuant to the undertaking, amounted to $486,423 during the period ended September 30, 2011.
During the period ended September 30, 2011, the Distributor retained $637 from commissions earned on sales of the fund’s Class A shares and $8,917 and $3,015 from CDSCs on redemptions of the fund’s Class B and Class C shares, respectively.
(b) Under the Distribution Plan (the “Plan”) adopted pursuant to Rule 12b-1 under the Act, Class B and Class C shares pay the Distributor for distributing their shares at an annual rate of .75% of the value of the average daily net assets of Class B and Class C shares. During the period ended September 30, 2011, Class B and Class C shares were charged $12,118 and $55,977, respectively, pursuant to the Plan.
(c) Under the Shareholder Services Plan, Class A, Class B and Class C shares pay the Distributor at an annual rate of .25% of the value of their average daily net assets for the provision of certain services.The services provided may include personal services relating to shareholder accounts, such as answering shareholder inquiries regarding the fund and providing reports and other information, and services related to the maintenance of shareholder accounts.The Distributor may make payments to Service Agents (a securities dealer, financial institution or other industry professional) in respect of these services.The Distributor
30
determines the amounts to be paid to Service Agents. During the period ended September 30, 2011, Class A, Class B and Class C shares were charged $133,534, $4,040 and $18,659, respectively, pursuant to the Shareholder Services Plan.
The fund compensates DreyfusTransfer, Inc., a wholly-owned subsidiary of Dreyfus, under a transfer agency agreement for providing personnel and facilities to perform transfer agency services for the fund. During the period ended September 30, 2011, the fund was charged $58,115 pursuant to the transfer agency agreement, which is included in Shareholder servicing costs in the Statement of Operations.
The fund has arrangements with the custodian and cash management bank whereby the fund may receive earnings credits when positive cash balances are maintained, which are used to offset custody and cash management fees. For financial reporting purposes, the fund includes net earnings credits as an expense offset in the Statement of Operations.
The fund compensates The Bank of New York Mellon under cash management agreements for performing cash management services related to fund subscriptions and redemptions. During the period ended September 30, 2011, the fund was charged $8,006 pursuant to the cash management agreements, which is included in Shareholder servicing costs in the Statement of Operations. These fees were partially offset by earnings credits of $348.
The fund also compensates The Bank of New York Mellon under a custody agreement for providing custodial services for the fund. During the period ended September 30, 2011, the fund was charged $74,622 pursuant to the custody agreement.
During the period ended September 30, 2011, the fund was charged $7,146 for services performed by the Chief Compliance Officer.
The components of “Due to TBCAM and affiliates” in the Statement of Assets and Liabilities consist of: investment advisory fees $106,596,
The Fund 31
NOTES TO FINANCIAL STATEMENTS (continued)
administration fees $13,324, Rule 12b-1 distribution plan fees $4,103, shareholder services plan fees $9,475, custodian fees $22,678, chief compliance officer fees $3,750 and transfer agency per account fees $9,338, which are offset against an expense reimbursement currently in effect in the amount of $48,518.
(d) Each Board member also serves as a Board member of other funds within the Dreyfus complex. Annual retainer fees and attendance fees are allocated to each fund based on net assets.
(e) A 2% redemption fee was charged and retained by the fund on certain shares redeemed within sixty days following the date of issuance subject to exceptions, including redemptions made through use of the fund’s exchange privilege. During the period ended September 30, 2011, redemption fees charged and retained by the fund amounted to $1,661. Effective December 15, 2010, the fund no longer charges a redemption fee on shares that are redeemed or exchanged before the end of the required holding period. The fund reserves the right to reimpose a redemption fee in the future.
NOTE 4—Securities Transactions:
The aggregate amount of purchases and sales of investment securities, excluding short-term securities and forward contracts, during the period ended September 30, 2011, amounted to $183,520,268 and $151,132,729, respectively.
Forward Foreign Currency Exchange Contracts: The fund enters into forward contracts in order to hedge its exposure to changes in foreign currency exchange rates on its foreign portfolio holdings, to settle foreign currency transactions or as a part of its investment strategy. When executing forward contracts, the fund is obligated to buy or sell a foreign currency at a specified rate on a certain date in the future. With respect to sales of forward contracts, the fund incurs a loss if the value of the contract increases between the date the forward contract is opened and the date the forward contract is closed.The fund realizes
32
a gain if the value of the contract decreases between those dates.With respect to purchases of forward contracts, the fund incurs a loss if the value of the contract decreases between the date the forward contract is opened and the date the forward contract is closed.The fund realizes a gain if the value of the contract increases between those dates. Any realized gain or loss which occurred during the period is reflected in the Statement of Operations.The fund is exposed to foreign currency risk as a result of changes in value of underlying financial instruments. The fund is also exposed to credit risk associated with counterparty nonperformance on these forward contracts, which is typically limited to the unrealized gain on each open contract.The following summarizes open forward contracts at September 30, 2011:
| | | | |
| | Foreign | | | |
| Forward Foreign Currency | Currency | | | Unrealized |
| Exchange Contracts | Amount | Proceeds ($) | Value ($) | Appreciation ($) |
| Sales: | | | | |
| Japanese Yen, | | | | |
| Expiring 10/4/2011 | 54,733,893 | 712,078 | 709,631 | 2,447 |
The following summarizes the average market value of derivatives outstanding during the period ended September 30, 2011:
| |
| | Average Market Value ($) |
| Forward contracts | 434,449 |
At September 30, 2011, the cost of investments for federal income tax purposes was $174,893,561; accordingly, accumulated net unrealized depreciation on investments was $20,172,388, consisting of $5,602,271 gross unrealized appreciation and $25,774,659 gross unrealized depreciation.
The Fund 33
REPORT OF INDEPENDENT REGISTERED
PUBLIC ACCOUNTING FIRM
Shareholders and Board of Trustees
Dreyfus International Equity Fund
We have audited the accompanying statement of assets and liabilities, including the statement of investments, of Dreyfus International Equity Fund (one of the series comprising Dreyfus Stock Funds) as of September 30, 2011, and the related statement of operations for the year then ended, the statement of changes in net assets for each of the two years in the period then ended and financial highlights for each of the years indicated therein. These financial statements and financial highlights are the responsibility of the Fund’s management. Our responsibility is to express an opinion on these financial statements and financial highlights based on our audits.
We conducted our audits in accordance with the standards of the Public Company Accounting Oversight Board (United States). Those standards require that we plan and perform the audit to obtain reasonable assurance about whether the financial statements and financial highlights are free of material misstatement. We were not engaged to perform an audit of the Fund’s internal control over financial reporting. Our audits included consideration of internal control over financial reporting as a basis for designing audit procedures that are appropriate in the circumstances, but not for the purpose of expressing an opinion on the effectiveness of the Fund’s internal control over financial reporting. Accordingly, we express no such opinion. An audit also includes examining, on a test basis, evidence supporting the amounts and disclosures in the financial statements and financial highlights, assessing the accounting principles used and significant estimates made by management, and evaluating the overall financial statement presentation. Our procedures included confirmation of securities owned as of September 30, 2011 by correspondence with the custodian and others.We believe that our audits provide a reasonable basis for our opinion.
In our opinion, the financial statements and financial highlights referred to above present fairly, in all material respects, the financial position of Dreyfus International Equity Fund at September 30, 2011, the results of its operations for the year then ended, the changes in its net assets for each of the two years in the period then ended and financial highlights for each of the indicated years, in conformity with U.S. generally accepted accounting principles.

New York, New York
November 23, 2011
34
IMPORTANT TAX INFORMATION (Unaudited)
In accordance with federal tax law, the fund elects to provide each shareholder with their portion of the fund’s foreign taxes paid and the income sourced from foreign countries. Accordingly, the fund hereby makes the following designations regarding its fiscal year ended September 30, 2011:
—the total amount of taxes paid to foreign countries was $492,728
—the total amount of income sourced from foreign countries was $5,830,756.
As required by federal tax law rules, shareholders will receive notification of their proportionate share of foreign taxes paid and foreign sourced income for the 2011 calendar year with Form 1099-DIV which will be mailed in early 2012.Also, certain dividends paid by the fund may be subject to a maximum tax rate of 15%, as provided for by the Jobs and Growth Tax Relief Reconciliation Act of 2003. Of the distributions paid during the fiscal year, $3,400,269 represents the maximum amount that may be considered qualified dividend income.
The Fund 35
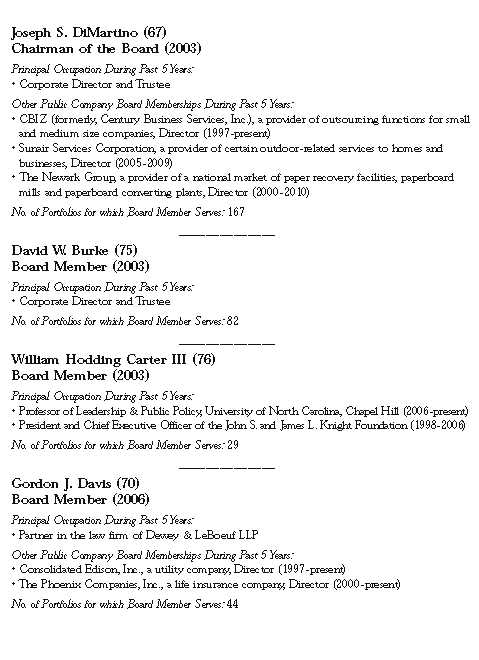
BOARD MEMBERS INFORMATION (Unaudited)
36
The Fund 37
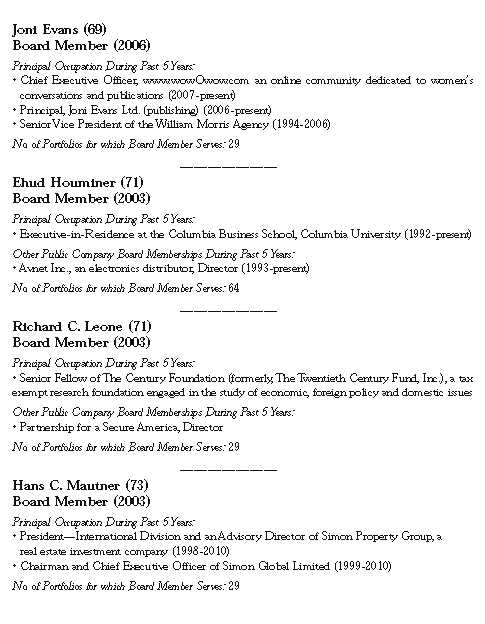
BOARD MEMBERS INFORMATION (Unaudited) (continued)

38
OFFICERS OF THE FUND (Unaudited)

The Fund 39
OFFICERS OF THE FUND (Unaudited) (continued)
40
The Fund 41
For More Information
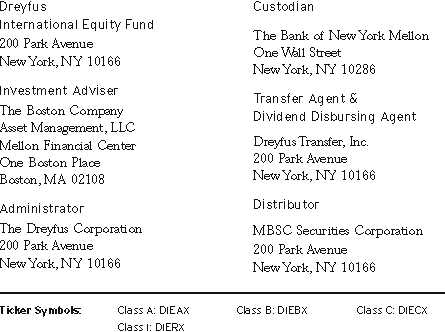
Telephone Call your financial representative or 1-800-DREYFUS
Mail The Dreyfus Family of Funds, 144 Glenn Curtiss Boulevard, Uniondale, NY 11556-0144
The fund files its complete schedule of portfolio holdings with the Securities and Exchange Commission (“SEC”) for the first and third quarters of each fiscal year on Form N-Q. The fund’s Forms N-Q are available on the SEC’s website at http://www.sec.gov and may be reviewed and copied at the SEC’s Public Reference Room in Washington, DC. Information on the operation of the Public Reference Room may be obtained by calling 1-800-SEC-0330.
A description of the policies and procedures that the fund uses to determine how to vote proxies relating to portfolio securities, and information regarding how the fund voted these proxies for the most recent 12-month period ended June 30 is available at http://www.dreyfus.com and on the SEC’s website at http://www.sec.gov. The description of the policies and procedures is also available without charge, upon request, by calling 1-800-DREYFUS.

|
| © 2011 MBSC Securities Corporation |
Dreyfus
Small Cap
Equity Fund
ANNUAL REPORT September 30, 2011

Save time. Save paper. View your next shareholder report online as soon as it’s available. Log into www.dreyfus.com and sign up for Dreyfus eCommunications. It’s simple and only takes a few minutes.
The views expressed in this report reflect those of the portfolio manager only through the end of the period covered and do not necessarily represent the views of Dreyfus or any other person in the Dreyfus organization. Any such views are subject to change at any time based upon market or other conditions and Dreyfus disclaims any responsibility to update such views.These views may not be relied on as investment advice and, because investment decisions for a Dreyfus fund are based on numerous factors, may not be relied on as an indication of trading intent on behalf of any Dreyfus fund.
| |
| | Contents |
| |
| | THE FUND |
| 2 | A Letter from the Chairman and CEO |
| 3 | Discussion of Fund Performance |
| 6 | Fund Performance |
| 8 | Understanding Your Fund’s Expenses |
| 8 | Comparing Your Fund’s Expenses |
| With Those of Other Funds |
| 9 | Statement of Investments |
| 14�� | Statement of Assets and Liabilities |
| 15 | Statement of Operations |
| 16 | Statement of Changes in Net Assets |
| 18 | Financial Highlights |
| 22 | Notes to Financial Statements |
| 33 | Report of Independent Registered |
| | Public Accounting Firm |
| 34 | Important Tax Information |
| 35 | Board Members Information |
| 38 | Officers of the Fund |
| |
| FOR MORE INFORMATION |
|
| | Back Cover |
Dreyfus
Small Cap Equity Fund
The Fund

A LETTER FROM THE CHAIRMAN AND CEO
Dear Shareholder:
This annual report for Dreyfus Small Cap Equity Fund covers the 12-month period from October 1, 2010, through September 30, 2011. For information about how the fund performed during the reporting period, as well as general market perspectives, we provide a Discussion of Fund Performance on the pages that follow.
Investors generally were encouraged by expectations of a more robust economic recovery over the first half of the reporting period, but investor sentiment deteriorated sharply during the second half due to disappointing economic data, rising commodity prices, an escalating sovereign debt crisis in Europe and a contentious debate regarding taxes, spending and borrowing in the United States. Market volatility was particularly severe during August and September after a major credit rating agency downgraded U.S. long-term debt. Stocks proved sensitive to macroeconomic concerns in this challenging environment, often regardless of more promising company fundamentals, and most U.S. equity market indices gave back their earlier gains.
The economic outlook currently is clouded by market turbulence and political infighting, but we believe that a continued subpar global expansion is more likely than a return to recession. Inflationary pressures appear to be waning in most countries as energy prices recently have retreated from their highs. In the United States, the Federal Reserve Board has signaled its intention to maintain an aggressively accommodative monetary policy, which may help offset the financial stresses caused by deleveraging in the private sector and fiscal consolidation by governments in the United States and Europe. To assess the potential impact of these and other developments on your investments, we encourage you, as always, to speak with your financial advisor.
Thank you for your continued confidence and support.

Jonathan R. Baum
Chairman and Chief Executive Officer
The Dreyfus Corporation
October 17, 2011
2

DISCUSSION OF FUND PERFORMANCE
For the period from October 1, 2010, through September 30, 2011, as provided by Joseph M. Corrado, CFA, Stephanie K. Brandaleone, CFA, and Edward R. Walter, CFA, Portfolio Managers
Fund and Market Performance Overview
For the 12-month period ended September 30, 2011, Dreyfus Small Cap Equity Fund’s Class A shares produced a total return of –9.67%, Class B shares returned –10.38%, Class C shares returned –10.38% and Class I shares returned –9.41%.1 The fund’s benchmark, the Russell 2500 Value Index (the “Index”), achieved a total return of –4.70% % for the same period.2
Small-cap stocks rallied through the first quarter of 2011 amid expectations of continued economic recovery, but disappointing economic data and other macroeconomic developments later erased those gains. The fund produced lower returns than its benchmark, primarily due to shortfalls in the performance of holdings classified within the financials, information technology and consumer discretionary sectors.
The Fund’s Investment Approach
The fund seeks long-term growth of capital. The fund invests, under normal circumstances, at least 80% of its assets in the stocks of small-cap U.S. companies.
We seek to identify companies with stocks trading at prices below their intrinsic values.We measure value by evaluating each company’s valuation multiples (price/earnings, price/sales, price/cash flow), current competitive position and expected business growth relative to its industry.We focus primarily on individual stock selection to produce a diversified portfolio of companies that we believe are undervalued relative to expected business growth, with the presence of a catalyst (such as a corporate restructuring, change in management or spin-off) that may trigger a price increase.
Shifting Sentiment Sparked Heightened Market Volatility
Investors’ outlooks had improved markedly during the final months of 2010 after the Federal Reserve Board announced a second round of
The Fund 3
DISCUSSION OF FUND PERFORMANCE (continued)
quantitative easing to jump-start the U.S. economy, and subsequent upturns in economic data and corporate earnings supported rising stock prices into the first quarter of 2011. However, the market rally was interrupted in February when political unrest in the Middle East led to sharply rising energy prices, and in March when devastating natural and nuclear disasters in Japan threatened to disrupt the global industrial supply chain. Nonetheless, stocks generally recovered quickly from these unexpected shocks.
In late April, investor sentiment began to deteriorate in earnest when Greece appeared headed for default and other European countries struggled with a resurgent sovereign debt crisis. Closer to home, investors grew worried when U.S. economic data proved disappointing and a contentious debate in Congress regarding government spending and borrowing intensified. Stocks suffered bouts of heightened volatility as newly risk-averse investors shifted their focus away from riskier assets and toward industry groups that historically have held up well under uncertain economic conditions. Market turbulence was particularly severe in August and September, driving the Index into negative territory for the reporting period overall as investors disregarded underlying company fundamentals in favor of reacting to each new headline and release of economic data.
Stock Selections Hurt Relative Performance
In this challenging investment climate, it appears that investors generally ignored the valuations and growth catalysts considered by our investment approach and instead, focused on quarterly financial results, punishing companies that fell short of near-term expectations regardless of their perceived longer-term strengths.This change in investor sentiment proved particularly damaging to the fund’s holdings in the information technology sector, where companies including CoreLogic, a provider of property, financial and consumer information, analytics and services, and U.S. networking specialist Netgear, reduced their future earnings guidance. In the consumer discretionary sector, specialty retailers Talbots and Office Max were impacted when sales disappointed, putting pressure on profit margins. Among homebuilders, Ryland Group was hurt despite an attractive valuation by a persistently weak housing market and rising uncertainty.
4
The fund achieved better results in the energy sector, where exploration-and-production company Cabot Oil & Gas increased production of natural gas in the Marcellus Shale Formation, and Frontier Oil, now known as HollyFrontier, benefited from higher profit margins in its refinery business. Relative results from the health care sector were buoyed by strength among medical service providers as investors turned to traditionally defensive areas of the market. Particularly beneficial to performance was the acquisition of medical facilities operator RehabCare by rival Kindred Healthcare.
Focusing on Underlying Fundamentals
We expect economic headwinds to persist and equity markets to stay volatile, suggesting that investors may continue to respond primarily to macroeconomic developments over the near term. Still, we remain committed to our valuation- and fundamentals-based investment process, which we believe will remain effective over the longer term. In our judgment, the fund is well positioned to participate in a market rebound when economic conditions stabilize and investors return their attention to company fundamentals.
October 17, 2011
Please note, the position in any security highlighted in italicized typeface was sold during the reporting period.
Equity funds are subject generally to market, market sector, market liquidity, issuer and investment style risks, among other factors, to varying degrees, all of which are more fully described in the fund’s prospectus.
Small companies carry additional risks because their earnings and revenues tend to be less predictable, and their share prices more volatile than those of larger, more established companies.
| 1 | Total return includes reinvestment of dividends and any capital gains paid, and does not take into consideration the maximum initial sales charge in the case of Class A shares, or the applicable contingent deferred sales charges imposed on redemptions in the case of Class B and Class C shares. Had these charges been reflected, returns would have been lower. Past performance is no guarantee of future results. Share price and investment return fluctuate such that upon redemption, fund shares may be worth more or less than their original cost. Return figures provided reflect the absorption of certain fund expenses by The Dreyfus Corporation and The Boston Company Asset Management, LLC. Had these expenses not been absorbed, returns would have been lower. |
| 2 | SOURCE: LIPPER INC. — Reflects the reinvestment of dividends and, where applicable, capital gain distributions.The Russell 2500 Value Index is a widely accepted, unmanaged index, which measures the performance of those Russell 2500 companies with lower price-to-book ratios and lower forecasted growth value. |
The Fund 5

Comparison of change in value of $10,000 investment in Dreyfus Small Cap Equity Fund Class A shares, Class B shares, Class C shares and Class I shares and the Russell 2500 Value Index
† Source: Lipper Inc.
Past performance is not predictive of future performance.
The above graph compares a $10,000 investment made in Class A, Class B, Class C and Class I shares of Dreyfus Small Cap Equity Fund on 9/30/01 to a $10,000 investment made in the Russell 2500 Value Index (the “Index”) on that date.All dividends and capital gain distributions are reinvested.
Prior to 8/1/07, the fund invested its assets in a "master portfolio" that had the same investment objective and policies as the fund. This master/feeder arrangement was terminated on 8/1/07 and the fund operates as a stand alone fund. Performance information represents the performance of the predecessor master portfolio (and its predecessor fund) and the expenses of the master portfolio's predecessor fund through January 31, 2003, and the fund's performance and expense structure thereafter. The master portfolio's predecessor fund contributed all of its assets to the master portfolio before the fund commenced investment operations on 2/1/03.
The fund’s performance shown in the line graph above takes into account the maximum initial sales charge on Class A shares and all other applicable fees and expenses on all classes. Performance for Class B shares assumes the conversion of Class B shares to Class A shares at the end of the sixth year following the date of purchase.The Index is an unmanaged index which measures the performance of those Russell 2500 companies with lower price-to-book ratios and lower forecasted growth values. Unlike a mutual fund, the Index is not subject to charges, fees and other expenses. Investors cannot invest directly in any index. Further information relating to fund performance, including expense reimbursements, if applicable, is contained in the Financial Highlights section of the prospectus and elsewhere in this report.
6
| | | | | | |
| Average Annual Total Returns as of 9/30/11 | | |
| |
| | 1Year | 5 Years | 10 Years |
| Class A shares | | | |
| with maximum sales charge (5.75%) | –14.87% | –3.64% | 6.98% |
| without sales charge | –9.67% | –2.49% | 7.62% |
| Class B shares | | | |
| with applicable redemption charge † | –13.97% | –3.59% | 7.23% |
| without redemption | –10.38% | –3.26% | 7.23% |
| Class C shares | | | |
| with applicable redemption charge †† | –11.27% | –3.23% | 6.91% |
| without redemption | –10.38% | –3.23% | 6.91% |
| Class I shares | –9.41% | –2.19% | 7.88% |
| Russell 2500 Value Index | –4.70% | –1.69% | 7.24% |
Past performance is not predictive of future performance.The fund’s performance shown in the graph and table does not reflect the deduction of taxes that a shareholder would pay on fund distributions or the redemption of fund shares.
| |
| † | The maximum contingent deferred sales charge for Class B shares is 4%.After six years Class B shares convert to |
| | Class A shares. |
| †† | The maximum contingent deferred sales charge for Class C shares is 1% for shares redeemed within one year of the |
| | date of purchase. |
The Fund 7
UNDERSTANDING YOUR FUND’S EXPENSES (Unaudited)
As a mutual fund investor, you pay ongoing expenses, such as management fees and other expenses. Using the information below, you can estimate how these expenses affect your investment and compare them with the expenses of other funds.You also may pay one-time transaction expenses, including sales charges (loads) and redemption fees, which are not shown in this section and would have resulted in higher total expenses. For more information, see your fund’s prospectus or talk to your financial adviser.
Review your fund’s expenses
The table below shows the expenses you would have paid on a $1,000 investment in Dreyfus Small Cap Equity Fund from April 1, 2011 to September 30, 2011. It also shows how much a $1,000 investment would be worth at the close of the period, assuming actual returns and expenses.
Expenses and Value of a $1,000 Investment assuming actual returns for the six months ended September 30, 2011
| | | | | | | | |
| | | Class A | | Class B | | Class C | | Class I |
| Expenses paid per $1,000† | $ | 6.10 | $ | 9.81 | $ | 9.59 | $ | 4.96 |
| Ending value (after expenses) | $ | 749.40 | $ | 746.20 | $ | 746.60 | $ | 750.60 |
COMPARING YOUR FUND’S EXPENSES WITH THOSE OF OTHER FUNDS (Unaudited)
Using the SEC’s method to compare expenses
The Securities and Exchange Commission (SEC) has established guidelines to help investors assess fund expenses. Per these guidelines, the table below shows your fund’s expenses based on a $1,000 investment, assuming a hypothetical 5% annualized return. You can use this information to compare the ongoing expenses (but not transaction expenses or total cost) of investing in the fund with those of other funds.All mutual fund shareholder reports will provide this information to help you make this comparison. Please note that you cannot use this information to estimate your actual ending account balance and expenses paid during the period.
Expenses and Value of a $1,000 Investment
assuming a hypothetical 5% annualized return for the six months ended September 30, 2011
| | | | | | | | |
| | | Class A | | Class B | | Class C | | Class I |
| Expenses paid per $1,000† | $ | 7.03 | $ | 11.31 | $ | 11.06 | $ | 5.72 |
| Ending value (after expenses) | $ | 1,018.10 | $ | 1,013.84 | $ | 1,014.09 | $ | 1,019.40 |
† Expenses are equal to the fund’s annualized expense ratio of 1.39% for Class A, 2.24% for Class B, 2.19% for
Class C, and 1.13% for Class I, multiplied by the average account value over the period, multiplied by 183/365 (to
reflect the one-half year period).
8
STATEMENT OF INVESTMENTS
September 30, 2011
| | | | |
| Common Stocks—99.2% | Shares | | | Value ($) |
| Consumer Discretionary—11.7% | | | | |
| BorgWarner | 20,765a | | 1,256,905 |
| Chico’s FAS | 134,760b | | 1,540,307 |
| DreamWorks Animation SKG, Cl. A | 73,340 a,b | | | 1,333,321 |
| GameStop, Cl. A | 75,030a,b | | 1,733,193 |
| Gentex | 50,420 | | | 1,212,601 |
| Hyatt Hotels, Cl. A | 23,110 a,b | | | 724,961 |
| Lennar, Cl. A | 82,120b | | 1,111,905 |
| Meredith | 70,650b | | 1,599,516 |
| Saks | 146,910a,b | | 1,285,463 |
| Thor Industries | 60,330b | | 1,336,309 |
| Toll Brothers | 99,000a,b | | 1,428,570 |
| Warnaco Group | 23,500a,b | | 1,083,115 |
| Williams-Sonoma | 49,110 | | | 1,512,097 |
| | | | | 17,158,263 |
| Consumer Staples—5.4% | | | | |
| BJ’s Wholesale Club | 36,820 a | | | 1,886,657 |
| Casey’s General Stores | 17,150 | | | 748,598 |
| Flowers Foods | 101,395b | | 1,973,147 |
| Safeway | 63,510 | | | 1,056,171 |
| Sanderson Farms | 47,580 b | | | 2,260,050 |
| | | | | 7,924,623 |
| Energy—7.3% | | | | |
| Cabot Oil & Gas | 32,576 | | | 2,016,780 |
| Cloud Peak Energy | 52,380 a,b | | | 887,841 |
| Energen | 20,560 | | | 840,698 |
| McDermott International | 167,270 a | | | 1,799,825 |
| Oceaneering International | 40,180 | | | 1,419,961 |
| Oil States International | 24,600 a,b | | | 1,252,632 |
| Tidewater | 29,710b | | 1,249,306 |
| Unit | 35,240a | | 1,301,061 |
| | | | | 10,768,104 |
| Exchange Traded Funds—.8% | | | | |
| iShares Russell 2000 Value Index Fund | 19,650 | | | 1,120,640 |
The Fund 9
STATEMENT OF INVESTMENTS (continued)
| | | | |
| Common Stocks (continued) | Shares | | | Value ($) |
| Financial—22.0% | | | | |
| BioMed Realty Trust | 121,940b,c | | 2,020,546 |
| CBL & Associates Properties | 73,160b,c | | 831,098 |
| City National | 55,797 b | | | 2,106,895 |
| Comerica | 90,320 | | | 2,074,650 |
| DCT Industrial Trust | 271,940 b,c | | | 1,193,817 |
| DiamondRock Hospitality | 196,126 c | | | 1,370,921 |
| Douglas Emmett | 42,400 b,c | | | 725,040 |
| Entertainment Properties Trust | 34,740 b,c | | | 1,354,165 |
| Fidelity National Financial, Cl. A | 123,824 | | | 1,879,648 |
| First Horizon National | 151,265 b | | | 901,539 |
| Hancock Holding | 59,720 | | | 1,599,302 |
| Hospitality Properties Trust | 66,120 c | | | 1,403,728 |
| Jefferies Group | 98,970b | | 1,228,218 |
| LaSalle Hotel Properties | 54,610b,c | | 1,048,512 |
| Lexington Realty Trust | 158,870b,c | | 1,039,010 |
| Macerich | 21,210b,c | | 904,182 |
| Omega Healthcare Investors | 78,440 b,c | | | 1,249,549 |
| ProAssurance | 18,050 | | | 1,299,961 |
| Protective Life | 82,990 | | | 1,297,134 |
| Raymond James Financial | 67,490 | | | 1,752,040 |
| SEI Investments | 79,780 | | | 1,227,016 |
| SVB Financial Group | 24,620 a,b | | | 910,940 |
| W.R. Berkley | 37,520b | | 1,113,969 |
| Webster Financial | 109,830 b | | | 1,680,399 |
| | | | | 32,212,279 |
| Health Care—10.1% | | | | |
| AMERIGROUP | 21,750a | | 848,467 |
| Haemonetics | 34,820a,b | | 2,036,274 |
| Healthsouth | 63,030a | | 941,038 |
| HealthSpring | 36,890a | | 1,345,009 |
| LifePoint Hospitals | 51,690 a,b | | | 1,893,922 |
| Medicis Pharmaceutical, Cl. A | 18,890 | | | 689,107 |
| Mednax | 35,640a | | 2,232,490 |
| Parexel International | 70,800 a | | | 1,340,244 |
| Salix Pharmaceuticals | 27,750 a,b | | | 821,400 |
10
| | | | |
| Common Stocks (continued) | Shares | | | Value ($) |
| Health Care (continued) | | | | |
| STERIS | 53,490b | | 1,565,652 |
| Universal Health Services, Cl. B | 31,120 | | | 1,058,080 |
| | | | | 14,771,683 |
| Industrial—15.9% | | | | |
| AGCO | 37,050a | | 1,280,818 |
| Alaska Air Group | 27,050a | | 1,522,644 |
| Armstrong World Industries | 33,360 | | | 1,148,918 |
| Babcock and Wilcox | 53,490 a | | | 1,045,729 |
| Brink’s | 80,600 | | | 1,878,786 |
| Carlisle | 34,580 | | | 1,102,410 |
| Clean Harbors | 47,322 a | | | 2,427,619 |
| Corrections Corp. of America | 86,180a | | 1,955,424 |
| Equifax | 39,540 | | | 1,215,460 |
| FTI Consulting | 49,670 a,b | | | 1,828,353 |
| Herman Miller | 56,310 | | | 1,005,697 |
| Owens Corning | 52,630a | | 1,141,018 |
| Robert Half International | 17,970 | | | 381,323 |
| Snap-On | 38,790 | | | 1,722,276 |
| Spirit Aerosystems Holdings, Cl. A | 137,590 a | | | 2,194,561 |
| Thomas & Betts | 35,440a | | 1,414,410 |
| | | | | 23,265,446 |
| Information Technology—10.8% | | | | |
| Akamai Technologies | 30,120 a | | | 598,786 |
| BMC Software | 22,930a | | 884,181 |
| Cadence Design Systems | 119,610 a,b | | | 1,105,196 |
| CoreLogic | 106,590a | | 1,137,315 |
| Cymer | 30,190a,b | | 1,122,464 |
| Cypress Semiconductor | 77,110a | | 1,154,337 |
| Diebold | 42,690 | | | 1,174,402 |
| FLIR Systems | 15,800b | | 395,790 |
| Harris | 44,050b | | 1,505,189 |
| Ingram Micro, Cl. A | 53,270 a | | | 859,245 |
| JDA Software Group | 40,000a,b | | 937,600 |
| Netgear | 30,970a | | 801,813 |
| QLogic | 85,660a,b | | 1,086,169 |
The Fund 11
STATEMENT OF INVESTMENTS (continued)
| | | | |
| Common Stocks (continued) | Shares | | | Value ($) |
| Information Technology (continued) | | | | |
| Semtech | 46,470a | | 980,517 |
| Synopsys | 66,965a | | 1,631,267 |
| Triquint Semiconductor | 105,010 a | | | 527,150 |
| | | | | 15,901,421 |
| Materials—6.5% | | | | |
| Allegheny Technologies | 21,360 | | | 790,106 |
| Carpenter Technology | 16,560 | | | 743,378 |
| Coeur d’Alene Mines | 44,570a,b | | 955,581 |
| Cytec Industries | 40,250 | | | 1,414,385 |
| Louisiana-Pacific | 208,150 a | | | 1,061,565 |
| MeadWestvaco | 57,380 | | | 1,409,253 |
| Packaging Corp. of America | 67,570 | | | 1,574,381 |
| Sonoco Products | 57,890b | | 1,634,235 |
| | | | | 9,582,884 |
| Utilities—8.7% | | | | |
| Atmos Energy | 46,360 | | | 1,504,382 |
| Great Plains Energy | 82,610 | | | 1,594,373 |
| Hawaiian Electric Industries | 96,930 b | | | 2,353,460 |
| MDU Resources Group | 79,210 | | | 1,520,040 |
| NiSource | 42,880b | | 916,774 |
| Portland General Electric | 63,410 | | | 1,502,183 |
| UGI | 72,400 | | | 1,901,948 |
| WGL Holdings | 37,550 | | | 1,467,079 |
| | | | | 12,760,239 |
| Total Common Stocks | | | | |
| (cost $160,495,621) | | | | 145,465,582 |
| |
| Other Investment—1.3% | | | | |
| Registered Investment Company; | | | | |
| Dreyfus Institutional Preferred | | | | |
| Plus Money Market Fund | | | | |
| (cost $1,912,000) | 1,912,000d | | 1,912,000 |
12
| | | | |
| Investment of Cash Collateral | | |
| for Securities Loaned—26.6% | Shares | Value ($) |
| Registered Investment Company; | | |
| Dreyfus Institutional Cash Advantage Fund | | |
| (cost $39,059,346) | 39,059,346d | 39,059,346 |
| Total Investments (cost $201,466,967) | 127.1% | 186,436,928 |
| Liabilities, Less Cash and Receivables | (27.1%) | (39,765,488) |
| Net Assets | 100.0% | 146,671,440 |
|
| a Non-income producing security. |
| b Security, or portion thereof, on loan.At September 30, 2011, the value of the fund’s securities on loan was |
| $37,060,124 and the value of the collateral held by the fund was $39,059,346. |
| c Investment in real estate investment trust. |
| d Investment in affiliated money market mutual fund. |
| | | |
| Portfolio Summary (Unaudited)† | | |
| |
| | Value (%) | | Value (%) |
| |
| Money Market Investments | 27.9 | Utilities | 8.7 |
| Financial | 22.0 | Energy | 7.3 |
| Industrial | 15.9 | Materials | 6.5 |
| Consumer Discretionary | 11.7 | Consumer Staples | 5.4 |
| Information Technology | 10.8 | Exchange Traded Funds | .8 |
| Health Care | 10.1 | | 127.1 |
| |
| † Based on net assets. | | | |
| See notes to financial statements. | | | |
The Fund 13
STATEMENT OF ASSETS AND LIABILITIES
September 30, 2011
| | | | | |
| | | | Cost | Value |
| Assets ($): | | | | |
| Investments in securities—See Statement of Investments (including | | |
| securities on loan, valued at $37,060,124)—Note 1(b): | | | |
| Unaffiliated issuers | | | 160,495,621 | 145,465,582 |
| Affiliated issuers | | | 40,971,346 | 40,971,346 |
| Cash | | | | 67,630 |
| Receivable for investment securities sold | | | | 350,671 |
| Dividends and securities lending income receivable | | | 217,085 |
| Receivable for shares of Beneficial Interest subscribed | | | 182,437 |
| Prepaid expenses | | | | 14,071 |
| | | | | 187,268,822 |
| Liabilities ($): | | | | |
| Due to The Boston Company Asset | | | | |
| Management, LLC and affiliates—Note 3(c) | | | 102,944 |
| Liability for securities on loan—Note 1(b) | | | | 39,059,346 |
| Payable for investment securities purchased | | | 1,141,775 |
| Payable for shares of Beneficial Interest redeemed | | | 135,394 |
| Accrued expenses | | | | 157,923 |
| | | | | 40,597,382 |
| Net Assets ($) | | | | 146,671,440 |
| Composition of Net Assets ($): | | | | |
| Paid-in capital | | | | 171,833,466 |
| Accumulated undistributed investment income—net | | | 108,534 |
| Accumulated net realized gain (loss) on investments | | | (10,240,521) |
| Accumulated net unrealized appreciation | | | | |
| (depreciation) on investments | | | | (15,030,039) |
| Net Assets ($) | | | | 146,671,440 |
| |
| |
| Net Asset Value Per Share | | | | |
| | Class A | Class B | Class C | Class I |
| Net Assets ($) | 45,048,034 | 740,841 | 10,631,921 | 90,250,644 |
| Shares Outstanding | 1,976,418 | 34,743 | 498,438 | 3,875,483 |
| Net Asset Value Per Share ($) | 22.79 | 21.32 | 21.33 | 23.29 |
| |
| See notes to financial statements. | | | | |
14
| | |
| STATEMENT OF OPERATIONS | |
| Year Ended September 30, 2011 | |
| |
| |
| |
| |
| Investment Income ($): | |
| Income: | |
| Cash dividends: | |
| Unaffiliated issuers | 2,409,486 |
| Affiliated issuers | 2,656 |
| Income from securities lending—Note 1(b) | 53,445 |
| Total Income | 2,465,587 |
| Expenses: | |
| Investment advisory fee—Note 3(a) | 1,464,490 |
| Administration fee—Note 3(a) | 183,061 |
| Shareholder servicing costs—Note 3(c) | 650,900 |
| Distribution fees—Note 3(b) | 120,128 |
| Professional fees | 63,508 |
| Registration fees | 57,819 |
| Custodian fees—Note 3(c) | 27,182 |
| Prospectus and shareholders’ reports | 24,931 |
| Trustees’ fees and expenses—Note 3(d) | 20,137 |
| Loan commitment fees—Note 2 | 1,980 |
| Miscellaneous | 13,548 |
| Total Expenses | 2,627,684 |
| Less—reduction in investment advisory fee | |
| due to undertaking—Note 3(a) | (227,938) |
| Less—reduction in fees due to earnings credits—Note 3(c) | (305) |
| Net Expenses | 2,399,441 |
| Investment Income—Net | 66,146 |
| Realized and Unrealized Gain (Loss) on Investments—Note 4 ($): | |
| Net realized gain (loss) on investments | 7,912,158 |
| Net unrealized appreciation (depreciation) on investments | (22,651,410) |
| Net Realized and Unrealized Gain (Loss) on Investments | (14,739,252) |
| Net Decrease in Net Assets Resulting from Operations | (14,673,106) |
| |
| See notes to financial statements. | |
The Fund 15
STATEMENT OF CHANGES IN NET ASSETS
| | | | |
| | Year Ended September 30, |
| | 2011 | 2010 |
| Operations ($): | | |
| Investment income—net | 66,146 | 67,993 |
| Net realized gain (loss) on investments | 7,912,158 | 23,031,983 |
| Net unrealized appreciation | | |
| (depreciation) on investments | (22,651,410) | (7,477,882) |
| Net Increase (Decrease) in Net Assets | | |
| Resulting from Operations | (14,673,106) | 15,622,094 |
| Dividends to Shareholders from ($): | | |
| Investment income—net: | | |
| Class A Shares | — | (88,816) |
| Class I Shares | (8,901) | (198,201) |
| Total Dividends | (8,901) | (287,017) |
| Beneficial Interest Transactions ($): | | |
| Net proceeds from shares sold: | | |
| Class A Shares | 12,866,064 | 16,039,523 |
| Class B Shares | 27,897 | 39,206 |
| Class C Shares | 1,014,246 | 2,895,429 |
| Class I Shares | 41,069,215 | 35,453,503 |
| Dividends reinvested: | | |
| Class A Shares | — | 80,196 |
| Class I Shares | 8,746 | 180,584 |
| Cost of shares redeemed: | | |
| Class A Shares | (25,856,370) | (20,845,276) |
| Class B Shares | (1,131,420) | (2,537,596) |
| Class C Shares | (3,807,511) | (3,835,634) |
| Class I Shares | (29,678,016) | (22,839,693) |
| Increase (Decrease) in Net Assets from | | |
| Beneficial Interest Transactions | (5,487,149) | 4,630,242 |
| Total Increase (Decrease) in Net Assets | (20,169,156) | 19,965,319 |
| Net Assets ($): | | |
| Beginning of Period | 166,840,596 | 146,875,277 |
| End of Period | 146,671,440 | 166,840,596 |
| Undistributed investment income—net | 108,534 | 51,289 |
16
| | | | |
| | Year Ended September 30, |
| | 2011 | 2010 |
| Capital Share Transactions: | | |
| Class Aa | | |
| Shares sold | 453,515 | 671,738 |
| Shares issued for dividends reinvested | — | 3,420 |
| Shares redeemed | (926,430) | (853,858) |
| Net Increase (Decrease) in Shares Outstanding | (472,915) | (178,700) |
| Class Ba | | |
| Shares sold | 1,011 | 1,730 |
| Shares redeemed | (43,155) | (111,670) |
| Net Increase (Decrease) in Shares Outstanding | (42,144) | (109,940) |
| Class C | | |
| Shares sold | 38,344 | 126,667 |
| Shares redeemed | (146,526) | (167,332) |
| Net Increase (Decrease) in Shares Outstanding | (108,182) | (40,665) |
| Class I | | |
| Shares sold | 1,460,941 | 1,408,098 |
| Shares issued for dividends reinvested | 288 | 7,553 |
| Shares redeemed | (1,038,441) | (921,316) |
| Net Increase (Decrease) in Shares Outstanding | 422,788 | 494,335 |
|
| a During the period ended September 30, 2011, 18,121 Class B shares representing $482,883 were automatically |
| converted to 17,032 Class A shares and during the period ended September 30, 2010, 57,789 Class B shares |
| representing $1,310,216 were automatically converted to 54,458 Class A shares. |
See notes to financial statements.
The Fund 17
FINANCIAL HIGHLIGHTS
The following tables describe the performance for each share class for the fiscal periods indicated.All information (except portfolio turnover rate) reflects financial results for a single fund share.Total return shows how much your investment in the fund would have increased (or decreased) during each period, assuming you had reinvested all dividends and distributions.These figures have been derived from the fund’s financial statements.
| | | | | | | | | | |
| | | Year Ended September 30, | |
| Class A Shares | 2011 | 2010 | 2009 | 2008 | 2007 |
| Per Share Data ($): | | | | | |
| Net asset value, beginning of period | 25.23 | 22.84 | 24.48 | 32.64 | 30.49 |
| Investment Operations: | | | | | |
| Investment income (loss)—neta | (.01) | (.00)b | .07 | .19 | .02 |
| Net realized and unrealized | | | | | |
| gain (loss) on investments | (2.43) | 2.42 | (1.60) | (4.61) | 3.02 |
| Total from Investment Operations | (2.44) | 2.42 | (1.53) | (4.42) | 3.04 |
| Distributions: | | | | | |
| Dividends from investment income—net | — | (.03) | (.11) | — | — |
| Dividends from net realized | | | | | |
| gain on investments | — | — | — | (3.74) | (.89) |
| Total Distributions | — | (.03) | (.11) | (3.74) | (.89) |
| Net asset value, end of period | 22.79 | 25.23 | 22.84 | 24.48 | 32.64 |
| Total Return (%)c | (9.67) | 10.62 | (6.11) | (14.59) | 10.00 |
| Ratios/Supplemental Data (%): | | | | | |
| Ratio of total expenses | | | | | |
| to average net assets | 1.49 | 1.59 | 1.72 | 1.56 | 1.50d |
| Ratio of net expenses | | | | | |
| to average net assets | 1.39 | 1.38 | 1.37 | 1.39 | 1.45d |
| Ratio of net investment income | | | | | |
| (loss) to average net assets | (.05) | (.00)e | .35 | .72 | .06d |
| Portfolio Turnover Rate | 76.95 | 78.90 | 110.88 | 92.67 | 66.82f,g |
| Net Assets, end of period ($ x 1,000) | 45,048 | 61,796 | 60,030 | 27,467 | 41,784 |
a Based on average shares outstanding at each month end.
b Amount represents less than $.01 per share.
c Exclusive of sales charge.
d For the period from October 1, 2006 to July 31, 2007, the ratios include the fund’s share of The Boston Company
Small Cap Value Portfolio’s (the “Portfolio”) allocated income and expenses.
e Amount represents less than .01%.
f Not annualized.
g For the period from October 1, 2006 to July 31, 2007, the fund invested exclusively in the Portfolio under a
master/feeder organizational structure that was terminated on August 1, 2007. On that date, the fund withdrew
entirely from the Portfolio and received the Portfolio’s securities and cash in exchange for its interest in the Portfolio.
Effective August 1, 2007, the fund began investing directly in the securities in which the Portfolio had invested.
Portfolio turnover represents investment activity of the fund.
See notes to financial statements.
18
| | | | | | | | | | |
| | | Year Ended September 30, | |
| Class B Shares | 2011 | 2010 | 2009 | 2008 | 2007 |
| Per Share Data ($): | | | | | |
| Net asset value, beginning of period | 23.79 | 21.68 | 23.23 | 31.41 | 29.63 |
| Investment Operations: | | | | | |
| Investment (loss)—neta | (.21) | (.18) | (.10) | (.04) | (.26) |
| Net realized and unrealized | | | | | |
| gain (loss) on investments | (2.26) | 2.29 | (1.45) | (4.40) | 2.93 |
| Total from Investment Operations | (2.47) | 2.11 | (1.55) | (4.44) | 2.67 |
| Distributions: | | | | | |
| Dividends from net realized | | | | | |
| gain on investments | — | — | — | (3.74) | (.89) |
| Net asset value, end of period | 21.32 | 23.79 | 21.68 | 23.23 | 31.41 |
| Total Return (%)b | (10.38) | 9.73 | (6.67) | (15.32) | 9.05 |
| Ratios/Supplemental Data (%): | | | | | |
| Ratio of total expenses | | | | | |
| to average net assets | 2.62 | 2.75 | 2.72 | 2.53 | 2.41c |
| Ratio of net expenses | | | | | |
| to average net assets | 2.15 | 2.21 | 2.22 | 2.24 | 2.34c |
| Ratio of net investment (loss) | | | | | |
| to average net assets | (.83) | (.81) | (.54) | (.14) | (.83)c |
| Portfolio Turnover Rate | 76.95 | 78.90 | 110.88 | 92.67 | 66.82d,e |
| Net Assets, end of period ($ x 1,000) | 741 | 1,829 | 4,051 | 1,580 | 2,740 |
a Based on average shares outstanding at each month end.
b Exclusive of sales charge.
c For the period from October 1, 2006 to July 31, 2007, the ratios include the fund’s share of The Boston Company
Small Cap Value Portfolio’s (the “Portfolio”) allocated income and expenses.
d Not annualized.
e For the period from October 1, 2006 to July 31, 2007, the fund invested exclusively in the Portfolio under a
master/feeder organizational structure that was terminated on August 1, 2007. On that date, the fund withdrew
entirely from the Portfolio and received the Portfolio’s securities and cash in exchange for its interest in the Portfolio.
Effective August 1, 2007, the fund began investing directly in the securities in which the Portfolio had invested.
Portfolio turnover represents investment activity of the fund.
See notes to financial statements.
The Fund 19
FINANCIAL HIGHLIGHTS (continued)
| | | | | | | | | | |
| | | Year Ended September 30, | |
| Class C Shares | 2011 | 2010 | 2009 | 2008 | 2007 |
| Per Share Data ($): | | | | | |
| Net asset value, beginning of period | 23.80 | 21.69 | 23.23 | 31.41 | 29.60 |
| Investment Operations: | | | | | |
| Investment (loss)—neta | (.22) | (.19) | (.09) | (.03) | (.24) |
| Net realized and unrealized | | | | | |
| gain (loss) on investments | (2.25) | 2.30 | (1.45) | (4.41) | 2.94 |
| Total from Investment Operations | (2.47) | 2.11 | (1.54) | (4.44) | 2.70 |
| Distributions: | | | | | |
| Dividends from net realized | | | | | |
| gain on investments | — | — | — | (3.74) | (.89) |
| Net asset value, end of period | 21.33 | 23.80 | 21.69 | 23.23 | 31.41 |
| Total Return (%)b | (10.38) | 9.78 | (6.67) | (15.29) | 9.13 |
| Ratios/Supplemental Data (%): | | | | | |
| Ratio of total expenses | | | | | |
| to average net assets | 2.19 | 2.24 | 2.40 | 2.36 | 2.29c |
| Ratio of net expenses | | | | | |
| to average net assets | 2.17 | 2.20 | 2.20 | 2.22 | 2.25c |
| Ratio of net investment (loss) | | | | | |
| to average net assets | (.84) | (.81) | (.48) | (.11) | (.74)c |
| Portfolio Turnover Rate | 76.95 | 78.90 | 110.88 | 92.67 | 66.82d,e |
| Net Assets, end of period ($ x 1,000) | 10,632 | 14,436 | 14,037 | 6,556 | 9,713 |
a Based on average shares outstanding at each month end.
b Exclusive of sales charge.
c For the period from October 1, 2006 to July 31, 2007, the ratios include the fund’s share of The Boston Company
Small Cap Value Portfolio’s (the “Portfolio”) allocated income and expenses.
d Not annualized.
e For the period from October 1, 2006 to July 31, 2007, the fund invested exclusively in the Portfolio under a
master/feeder organizational structure that was terminated on August 1, 2007. On that date, the fund withdrew
entirely from the Portfolio and received the Portfolio’s securities and cash in exchange for its interest in the Portfolio.
Effective August 1, 2007, the fund began investing directly in the securities in which the Portfolio had invested.
Portfolio turnover represents investment activity of the fund.
See notes to financial statements.
20
| | | | | | | | | | |
| | | Year Ended September 30, | |
| Class I Shares | 2011 | 2010 | 2009 | 2008 | 2007a |
| Per Share Data ($): | | | | | |
| Net asset value, beginning of period | 25.71 | 23.24 | 24.88 | 33.03 | 30.77 |
| Investment Operations: | | | | | |
| Investment income—netb | .06 | .07 | .13 | .25 | .11 |
| Net realized and unrealized | | | | | |
| gain (loss) on investments | (2.48) | 2.47 | (1.60) | (4.66) | 3.04 |
| Total from Investment Operations | (2.42) | 2.54 | (1.47) | (4.41) | 3.15 |
| Distributions: | | | | | |
| Dividends from investment income—net | (.00)c | (.07) | (.17) | — | — |
| Dividends from net realized | | | | | |
| gain on investments | — | — | — | (3.74) | (.89) |
| Total Distributions | (.00)c | (.07) | (.17) | (3.74) | (.89) |
| Net asset value, end of period | 23.29 | 25.71 | 23.24 | 24.88 | 33.03 |
| Total Return (%) | (9.41) | 10.94 | (5.67) | (14.37) | 10.27 |
| Ratios/Supplemental Data (%): | | | | | |
| Ratio of total expenses | | | | | |
| to average net assets | 1.28 | 1.14 | 1.20 | 1.22 | 1.22d |
| Ratio of net expenses | | | | | |
| to average net assets | 1.13 | 1.11 | 1.13 | 1.15 | 1.19d |
| Ratio of net investment income | | | | | |
| to average net assets | .22 | .27 | .65 | .98 | .32d |
| Portfolio Turnover Rate | 76.95 | 78.90 | 110.88 | 92.67 | 66.82e,f |
| Net Assets, end of period ($ x 1,000) | 90,251 | 88,779 | 68,758 | 39,424 | 15,701 |
a Effective June 1, 2007, Class R shares were redesignated as Class I shares.
b Based on average shares outstanding at each month end.
c Amount represents less than $.01 per share.
d For the period from October 1, 2006 to July 31, 2007, the ratios include the fund’s share of The Boston Company
Small Cap Value Portfolio’s (the “Portfolio”) allocated income and expenses.
e Not annualized.
f For the period from October 1, 2006 to July 31, 2007, the fund invested exclusively in the Portfolio under a
master/feeder organizational structure that was terminated on August 1, 2007. On that date, the fund withdrew
entirely from the Portfolio and received the Portfolio’s securities and cash in exchange for its interest in the Portfolio.
Effective August 1, 2007, the fund began investing directly in the securities in which the Portfolio had invested.
Portfolio turnover represents investment activity of the fund.
See notes to financial statements.
The Fund 21
NOTES TO FINANCIAL STATEMENTS
NOTE 1—Significant Accounting Policies:
Dreyfus Small Cap Equity Fund (the “fund”) is a separate diversified series of Dreyfus Stock Funds (the “Company”), which is registered under the Investment Company Act of 1940, as amended (the “Act”), as an open-end management investment company and operates as a series company currently offering two series, including the fund. The fund’s investment objective is to seek long-term growth of capital.The Boston Company Asset Management, LLC (“TBCAM”) serves as the fund’s investment adviser. The Dreyfus Corporation (the “Administrator” or “Dreyfus”), a wholly-owned subsidiary of The Bank of New York Mellon Corporation (“BNY Mellon”) and an affiliate of TBCAM, serves as the fund’s Administrator.
MBSC Securities Corporation (the “Distributor”), a wholly-owned subsidiary of Dreyfus, is the distributor of the fund’s shares. The fund is authorized to issue an unlimited number of $.001 par value shares of Beneficial Interest in each of the following classes of shares: Class A, Class B, Class C, and Class I. Class A shares are subject to a sales charge imposed at the time of purchase. Class B shares are subject to a contingent deferred sales charge (“CDSC”) imposed on Class B share redemptions made within six years of purchase and automatically convert to Class A shares after six years.The fund no longer offers Class B shares, except in connection with dividend reinvestment and permitted exchanges of Class B shares and, effective on or about March 13, 2012, all outstanding Class B shares will automatically convert to Class A shares. Class C shares are subject to a CDSC imposed on Class C shares redeemed within one year of purchase. Class I shares are sold at net asset value per share only to institutional investors. Other differences between the classes include the services offered to and the expenses borne by each class, the allocation of certain transfer agency costs and certain voting rights. Income, expenses (other than expenses attributable to a specific class), and realized and unrealized gains or losses on investments are allocated to each class of shares based on its relative net assets.
22
The Company accounts separately for the assets, liabilities and operations of each series. Expenses directly attributable to each series are charged to that series’ operations; expenses which are applicable to all series are allocated among them on a pro rata basis.
The Financial Accounting Standards Board (“FASB”) Accounting Standards Codification (“ASC”) is the exclusive reference of authoritative U.S. generally accepted accounting principles (“GAAP”) recognized by the FASB to be applied by nongovernmental entities. Rules and interpretive releases of the Securities and Exchange Commission (“SEC”) under authority of federal laws are also sources of authoritative GAAP for SEC registrants. The fund’s financial statements are prepared in accordance with GAAP, which may require the use of management estimates and assumptions.Actual results could differ from those estimates.
The Company enters into contracts that contain a variety of indemnifications.The fund’s maximum exposure under these arrangements is unknown.The fund does not anticipate recognizing any loss related to these arrangements.
(a) Portfolio valuation: The fair value of a financial instrument is the amount that would be received to sell an asset or paid to transfer a liability in an orderly transaction between market participants at the measurement date (i.e. the exit price). GAAP establishes a fair value hierarchy that prioritizes the inputs of valuation techniques used to measure fair value.This hierarchy gives the highest priority to unadjusted quoted prices in active markets for identical assets or liabilities (Level 1 measurements) and the lowest priority to unobservable inputs (Level 3 measurements).
Additionally, GAAP provides guidance on determining whether the volume and activity in a market has decreased significantly and whether such a decrease in activity results in transactions that are not orderly. GAAP requires enhanced disclosures around valuation inputs and techniques used during annual and interim periods.
The Fund 23
NOTES TO FINANCIAL STATEMENTS (continued)
Various inputs are used in determining the value of the fund’s investments relating to fair value measurements.These inputs are summarized in the three broad levels listed below:
Level 1—unadjusted quoted prices in active markets for identical investments.
Level 2—other significant observable inputs (including quoted prices for similar investments, interest rates, prepayment speeds, credit risk, etc.).
Level 3—significant unobservable inputs (including the fund’s own assumptions in determining the fair value of investments).
The inputs or methodology used for valuing securities are not necessarily an indication of the risk associated with investing in those securities.
Changes in valuation techniques may result in transfers in or out of an assigned level within the disclosure hierarchy. Valuation techniques used to value the fund’s investments are as follows:
Investments in securities are valued at the last sales price on the securities exchange or national securities market on which such securities are primarily traded. Securities listed on the National Market System for which market quotations are available are valued at the official closing price or, if there is no official closing price that day, at the last sales price. Securities not listed on an exchange or the national securities market, or securities for which there were no transactions, are valued at the average of the most recent bid and asked prices, except for open short positions, where the asked price is used for valuation purposes. Bid price is used when no asked price is available. Registered investment companies that are not traded on an exchange are valued at their net asset value. All preceding securities are categorized within Level 1 of the fair value hierarchy.
Fair valuing of securities may be determined with the assistance of a pricing service using calculations based on indices of domestic securities and other appropriate indicators, such as prices of relevant American Depository Receipts and futures contracts. Utilizing these
24
techniques may result in transfers between Level 1 and Level 2 of the fair value hierarchy.
When market quotations or official closing prices are not readily available, or are determined not to reflect accurately fair value, such as when the value of a security has been significantly affected by events after the close of the exchange or market on which the security is principally traded (for example, a foreign exchange or market), but before the fund calculates its net asset value, the fund may value these investments at fair value as determined in accordance with the procedures approved by the Board of Trustees. Certain factors may be considered when fair valuing investments such as: fundamental analytical data, the nature and duration of restrictions on disposition, an evaluation of the forces that influence the market in which the securities are purchased and sold, and public trading in similar securities of the issuer or comparable issuers.These securities are either categorized as Level 2 or 3 depending on the relevant inputs used.
For restricted securities where observable inputs are limited, assumptions about market activity and risk are used and are categorized within Level 3 of the fair value hierarchy.
The following is a summary of the inputs used as of September 30, 2011 in valuing the fund’s investments:
| | | | |
| | | Level 2—Other | Level 3— | |
| | Level 1— | Significant | Significant | |
| | Unadjusted | Observable | Unobservable | |
| | Quoted Prices | Inputs | Inputs | Total |
| Assets ($) | | | | |
| Investments in Securities: | | | |
| Equity Securities— | | | | |
| Domestic† | 144,344,942 | — | — | 144,344,942 |
| Mutual Funds/ | | | | |
| Exchange | | | | |
| Traded Funds | 42,091,986 | — | — | 42,091,986 |
† See Statement of Investments for additional detailed categorizations.
The Fund 25
NOTES TO FINANCIAL STATEMENTS (continued)
In May 2011, FASB issued Accounting Standards Update (“ASU”) No. 2011-04 “Amendments to Achieve Common FairValue Measurement and Disclosure Requirements in GAAP and International Financial Reporting Standards (“IFRS”)” (“ASU 2011-04”). ASU 2011-04 includes common requirements for measurement of and disclosure about fair value between GAAP and IFRS. ASU 2011-04 will require reporting entities to disclose the following information for fair value measurements categorized within Level 3 of the fair value hierarchy: quantitative information about the unobservable inputs used in the fair value measurement, the valuation processes used by the reporting entity and a narrative description of the sensitivity of the fair value measurement to changes in unobservable inputs and the interrelationships between those unobservable inputs. In addition, ASU 2011-04 will require reporting entities to make disclosures about amounts and reasons for all transfers in and out of Level 1 and Level 2 fair value measurements.The new and revised disclosures are effective for interim and annual reporting periods beginning after December 15, 2011. At this time, management is evaluating the implications of ASU 2011-04 and its impact on the financial statements.
(b) Securities transactions and investment income: Securities transactions are recorded on a trade date basis. Realized gains and losses from securities transactions are recorded on the identified cost basis. Dividend income is recognized on the ex-dividend date and interest income, including, where applicable, accretion of discount and amortization of premium on investments, is recognized on the accrual basis.
Pursuant to a securities lending agreement with The Bank of New York Mellon, a subsidiary of BNY Mellon and an affiliate of Dreyfus, the fund may lend securities to qualified institutions. It is the fund’s policy that, at origination, all loans are secured by collateral of at least 102% of the value of U.S. securities loaned and 105% of the value of foreign securities loaned. Collateral equivalent to at least 100% of the market value of securities on loan is maintained at all times. Collateral is either in the form of cash, which can be invested in certain money
26
market mutual funds managed by Dreyfus, U.S. Government and Agency securities or letters of credit.The fund is entitled to receive all income on securities loaned, in addition to income earned as a result of the lending transaction. Although each security loaned is fully collateralized, the fund bears the risk of delay in recovery of, or loss of rights in, the securities loaned should a borrower fail to return the securities in a timely manner. During the period ended September 30, 2011, The Bank of New York Mellon earned $17,815 from lending portfolio securities, pursuant to the securities lending agreement.
(c) Affiliated issuers: Investments in other investment companies advised by Dreyfus are defined as “affiliated” in the Act.
The fund may invest in shares of certain affiliated investment companies also advised or managed by Dreyfus. Investments in affiliated investment companies for the period ended September 30, 2011 were as follows:
| | | | | | | |
| Affiliated | | | | | | | |
| Investment | Value | | | | Value | | Net |
| Company | 9/30/2010 | ($) | Purchases ($) | Sales ($) | 9/30/2011 | ($) | Assets (%) |
| Dreyfus | | | | | | | |
| Institutional | | | | | | | |
| Preferred | | | | | | | |
| Plus Money | | | | | | | |
| Market Fund | 3,687,000 | | 75,303,000 | 77,078,000 | 1,912,000 | | 1.3 |
| Dreyfus | | | | | | | |
| Institutional | | | | | | | |
| Cash | | | | | | | |
| Advantage | | | | | | | |
| Fund | 6,182,982 | | 233,451,380 | 200,575,016 | 39,059,346 | | 26.6 |
| Total | 9,869,982 | | 308,754,380 | 277,653,016 | 40,971,346 | | 27.9 |
(d) Dividends to shareholders: Dividends are recorded on the ex-dividend date. Dividends from investment income-net and dividends from net realized capital gains, if any, are normally declared and paid annually, but the fund may make distributions on a more frequent basis to comply with the distribution requirements of the Internal Revenue Code of 1986, as amended (the “Code”).To the extent that net realized capital gains can be offset by capital loss carryovers, it is
The Fund 27
NOTES TO FINANCIAL STATEMENTS (continued)
the policy of the fund not to distribute such gains. Income and capital gain distributions are determined in accordance with income tax regulations, which may differ from GAAP.
(e) Federal income taxes: It is the policy of the fund to continue to qualify as a regulated investment company, if such qualification is in the best interests of its shareholders, by complying with the applicable provisions of the Code, and to make distributions of taxable income sufficient to relieve it from substantially all federal income and excise taxes.
As of and during the period ended September 30, 2011, the fund did not have any liabilities for any uncertain tax positions.The fund recognizes interest and penalties, if any, related to uncertain tax positions as income tax expense in the Statement of Operations. During the period, the fund did not incur any interest or penalties.
Each of the tax years in the four-year period ended September 30, 2011 remains subject to examination by the Internal Revenue Service and state taxing authorities.
At September 30, 2011, the components of accumulated earnings on a tax basis were as follows: undistributed ordinary income $3,299,000, undistributed capital gains $8,049,268, accumulated capital losses $21,404,631 and unrealized depreciation $15,105,663.
The accumulated capital loss carryover is available for federal income tax purposes to be applied against future net securities profits, if any, realized subsequent to September 30, 2011. If not applied, $5,038,524 of the carryover expires in fiscal 2016, $16,299,657 expires in fiscal 2017 and $66,450 expires in fiscal 2018. Acquired losses as a result of the fund’s merger with Dreyfus Premier Future Leaders Fund can be utilized in subsequent years but will be subject to annual limitations based on certain provisions in the Code.
Under the recently enacted Regulated Investment Company Modernization Act of 2010 (the “2010 Act”), the fund will be permit-
28
ted to carry forward capital losses incurred in taxable years beginning after December 22, 2010 (“post-enactment losses”) for an unlimited period. However, the 2010 Act requires post-enactment losses to be utilized before the utilization of losses incurred in taxable years prior to the effective date of the 2010 Act. As a result of this ordering rule, capital loss carryovers related to taxable years beginning prior to the effective date of the 2010 Act may be more likely to expire unused.
The tax character of distributions paid to shareholders during the fiscal periods ended September 30, 2011 and September 30, 2010 were as follows: ordinary income $8,901 and $287,017, respectively
During the period ended September 30, 2011, as a result of permanent book to tax differences, primarily due to the tax treatment for the recognition of book to tax differences resulting from prior year fund restructuring, the fund increased accumulated net realized gain (loss) on investments by $3,614 and decreased paid-in capital by the same amount. Net assets and net asset value per share were not affected by this reclassification.
NOTE 2—Bank Lines of Credit:
The fund participates with other Dreyfus-managed funds in a $225 million unsecured credit facility led by Citibank, N.A. and a $300 million unsecured credit facility provided by The Bank of New York Mellon (each, a “Facility”), each to be utilized primarily for temporary or emergency purposes, including the financing of redemptions. In connection therewith, the fund has agreed to pay its pro rata portion of commitment fees for each Facility. Interest is charged to the fund based on rates determined pursuant to the terms of the respective Facility at the time of borrowing. During the period ended September 30, 2011, the fund did not borrow under the Facilities.
The Fund 29
NOTES TO FINANCIAL STATEMENTS (continued)
NOTE 3—Investment Advisory Fee, Administration Fee and Other Transactions with Affiliates:
(a) Pursuant to an investment advisory agreement with TBCAM, the investment advisory fee is computed at the annual rate of .80% of the value of the fund’s average daily net assets and is payable monthly.
The fund compensates Dreyfus under an administration agreement for providing personnel and facilities to perform accounting and administration services for the fund at an annual rate of .10% of the value of the fund’s average daily net assets. During the period ended September 30, 2011, the fund was charged $183,061 pursuant to the administration agreement.
Dreyfus and TBCAM have contractually agreed, with respect to each class of fund shares, to assume the expenses of each class so that such expenses of the fund’s Class A, B, C and I shares (excluding taxes, interest, brokerage commissions, commitment fees on borrowings and extraordinary expenses) do not exceed an annual rate of 1.39%, 2.24%, 2.22% and 1.16%, respectively, of the value of such class’ average daily net assets, until the fiscal year end following such time as the expenses are equal to or less than such annual rate for the applicable class.The reduction in investment advisory fee, pursuant to the undertaking, amounted to $227,938 during the period ended September 30, 2011.
During the period ended September 30, 2011, the Distributor retained $10,645 from commissions earned on sales of the fund’s Class A shares and $1,597 and $4,062 from CDSCs on redemptions of the fund’s Class B and Class C shares, respectively.
(b) Under the Distribution Plan (the “Plan”) adopted pursuant to Rule 12b-1 under the Act, Class B and Class C shares pay the Distributor for distributing their shares at an annual rate of .75% of the value of the average daily net assets of Class B and Class C shares. During the period ended September 30, 2011, Class B and Class C shares were charged $10,476 and $109,652, respectively, pursuant to the Plan.
30
(c) Under the Shareholder Services Plan, Class A, Class B and Class C shares pay the Distributor at an annual rate of .25% of the value of their average daily net assets for the provision of certain services.The services provided may include personal services relating to shareholder accounts, such as answering shareholder inquiries regarding the fund and providing reports and other information, and services related to the maintenance of shareholder accounts.The Distributor may make payments to Service Agents (a securities dealer, financial institution or other industry professional) in respect of these services.The Distributor determines the amounts to be paid to Service Agents. During the period ended September 30, 2011, Class A, Class B and Class C shares were charged $154,815, $3,492 and $36,551, respectively, pursuant to the Shareholder Services Plan.
The fund compensates Dreyfus Transfer, Inc., a wholly-owned subsidiary of Dreyfus, under a transfer agency agreement for providing personnel and facilities to perform transfer agency services for the fund. During the period ended September 30, 2011, the fund was charged $50,985 pursuant to the transfer agency agreement, which is included in Shareholder servicing costs in the Statement of Operations.
The fund has arrangements with the custodian and cash management bank whereby the fund may receive earnings credits when positive cash balances are maintained, which are used to offset custody and cash management fees. For financial reporting purposes, the fund includes net earnings credits as an expense offset in the Statement of Operations.
The fund compensates The Bank of New York Mellon under cash management agreements for performing cash management services related to fund subscriptions and redemptions. During the period ended September 30, 2011, the fund was charged $7,049 pursuant to the cash management agreements, which is included in Shareholder servicing costs in the Statement of Operations. These fees were partially offset by earnings credits of $305.
The Fund 31
NOTES TO FINANCIAL STATEMENTS (continued)
The fund also compensates The Bank of New York Mellon under a custody agreement for providing custodial services for the fund. During the period ended September 30, 2011, the fund was charged $27,182 pursuant to the custody agreement.
During the period ended September 30, 2011, the fund was charged $7,146 for services performed by the Chief Compliance Officer.
The components of “Due to TBCAM and affiliates” in the Statement of Assets and Liabilities consist of: investment advisory fees $101,610, administration fees $12,701, Rule 12b-1 distribution plan fees $7,519, shareholder services plan fees $12,409, custodian fees $11,210, chief compliance officer fees $3,750 and transfer agency per account fees $8,781, which are offset against an expense reimbursement currently in effect in the amount of $55,036.
(d) Each Board member also serves as a Board member of other funds within the Dreyfus complex. Annual retainer fees and attendance fees are allocated to each fund based on net assets.
NOTE 4—Securities Transactions:
The aggregate amount of purchases and sales of investment securities, excluding short-term securities, during the period ended September 30, 2011, amounted to $138,793,311 and $144,297,619, respectively.
At September 30, 2011, the cost of investments for federal income tax purposes was $201,542,591; accordingly, accumulated net unrealized depreciation on investments was $15,105,663, consisting of $6,961,129 gross unrealized appreciation and $22,066,792 gross unrealized depreciation.
32
REPORT OF INDEPENDENT REGISTERED
PUBLIC ACCOUNTING FIRM
Shareholders and Board of Trustees
Dreyfus Small Cap Equity Fund
We have audited the accompanying statement of assets and liabilities, including the statement of investments, of Dreyfus Small Cap Equity Fund (one of the series comprising Dreyfus Stock Funds) as of September 30, 2011, and the related statement of operations for the year then ended, the statement of changes in net assets for each of the two years in the period then ended and financial highlights for each of the years indicated therein. These financial statements and financial highlights are the responsibility of the Fund’s management. Our responsibility is to express an opinion on these financial statements and financial highlights based on our audits.
We conducted our audits in accordance with the standards of the Public Company Accounting Oversight Board (United States).Those standards require that we plan and perform the audit to obtain reasonable assurance about whether the financial statements and financial highlights are free of material misstatement.We were not engaged to perform an audit of the Fund’s internal control over financial reporting. Our audits included consideration of internal control over financial reporting as a basis for designing audit procedures that are appropriate in the circumstances, but not for the purpose of expressing an opinion on the effectiveness of the Fund’s internal control over financial reporting. Accordingly, we express no such opinion.An audit also includes examining, on a test basis, evidence supporting the amounts and disclosures in the financial statements and financial highlights, assessing the accounting principles used and significant estimates made by management, and evaluating the overall financial statement presentation. Our procedures included confirmation of securities owned as of September 30, 2011 by correspondence with the custodian and others. We believe that our audits provide a reasonable basis for our opinion.
In our opinion, the financial statements and financial highlights referred to above present fairly, in all material respects, the financial position of Dreyfus Small Cap Equity Fund at September 30, 2011, the results of its operations for the year then ended, the changes in its net assets for each of the two years in the period then ended and the financial highlights for each of the indicated years, in conformity with U.S. generally accepted accounting principles.

|
| New York, New York |
| November 23, 2011 |
The Fund 33
IMPORTANT TAX INFORMATION (Unaudited)
For federal tax purposes, the fund hereby designates 100% of the ordinary dividends paid during the fiscal year ended September 30, 2011 as qualifying for the corporate dividends received deduction. Also certain dividends paid by the fund may be subject to a maximum tax rate of 15%, as provided for by the Jobs and Growth Tax Relief Reconciliation Act of 2003. Of the distributions paid during the fiscal year, $8,901 represents the maximum amount that may be considered qualified dividend income. Shareholders will receive notification in early 2012 of the percentage applicable to the preparation of their 2011 income tax returns.
34
BOARD MEMBERS INFORMATION (Unaudited)

The Fund 35
BOARD MEMBERS INFORMATION (Unaudited) (continued)
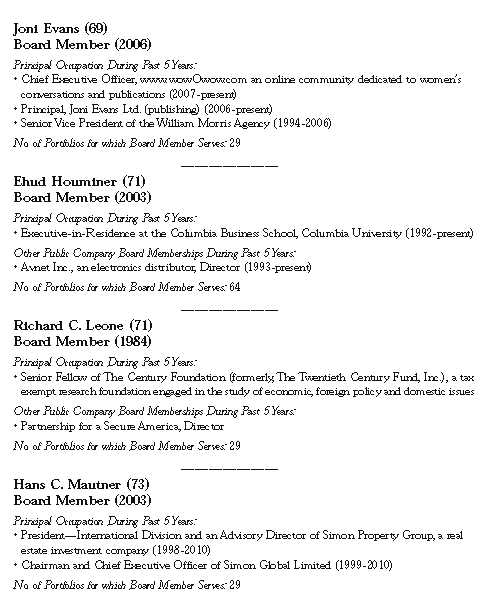
36
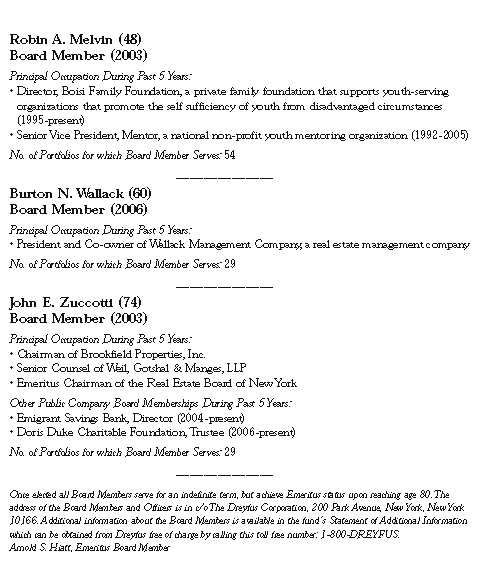
The Fund 37
OFFICERS OF THE FUND (Unaudited)

38
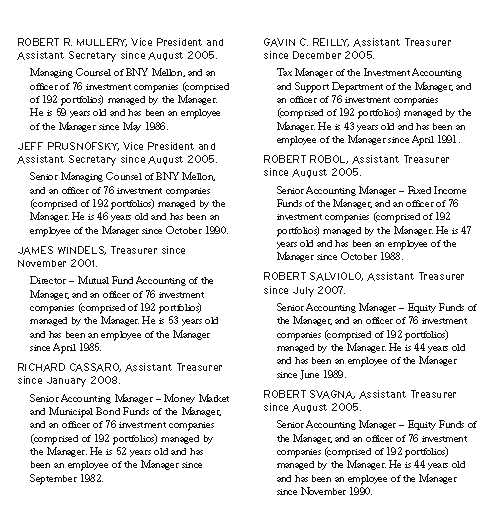
The Fund 39
OFFICERS OF THE FUND (Unaudited) (continued)
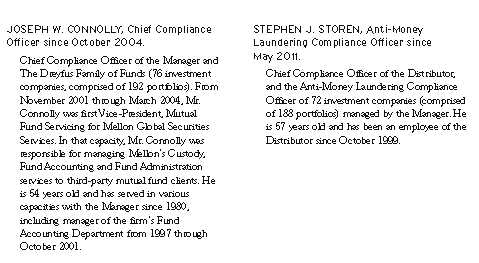
40
For More Information

Telephone Call your financial representative or 1-800-DREYFUS
Mail The Dreyfus Family of Funds, 144 Glenn Curtiss Boulevard, Uniondale, NY 11556-0144
The fund files its complete schedule of portfolio holdings with the Securities and Exchange Commission (“SEC”) for the first and third quarters of each fiscal year on Form N-Q. The fund’s Forms N-Q are available on the SEC’s website at http://www.sec.gov and may be reviewed and copied at the SEC’s Public Reference Room in Washington, DC. Information on the operation of the Public Reference Room may be obtained by calling 1-800-SEC-0330.
A description of the policies and procedures that the fund uses to determine how to vote proxies relating to portfolio securities, and information regarding how the fund voted these proxies for the most recent 12-month period ended June 30 is available at http://www.dreyfus.com and on the SEC’s website at http://www.sec.gov. The description of the policies and procedures is also available without charge, upon request, by calling 1-800-DREYFUS.

|
| © 2011 MBSC Securities Corporation |
Item 2. Code of Ethics.
The Registrant has adopted a code of ethics that applies to the Registrant's principal executive officer, principal financial officer, principal accounting officer or controller, or persons performing similar functions. There have been no amendments to, or waivers in connection with, the Code of Ethics during the period covered by this Report.
Item 3. Audit Committee Financial Expert.
The Registrant's Board has determined that Ehud Houminer, a member of the Audit Committee of the Board, is an audit committee financial expert as defined by the Securities and Exchange Commission (the "SEC"). Ehud Houminer is "independent" as defined by the SEC for purposes of audit committee financial expert determinations.
Item 4. Principal Accountant Fees and Services.
(a) Audit Fees. The aggregate fees billed for each of the last two fiscal years (the "Reporting Periods") for professional services rendered by the Registrant's principal accountant (the "Auditor") for the audit of the Registrant's annual financial statements or services that are normally provided by the Auditor in connection with the statutory and regulatory filings or engagements for the Reporting Periods, were $ 54,688 in 2010 and $71,232 in 2011.
(b) Audit-Related Fees. The aggregate fees billed in the Reporting Periods for assurance and related services by the Auditor that are reasonably related to the performance of the audit of the Registrant's financial statements and are not reported under paragraph (a) of this Item 4 were $10,764 in 2010 and $12,000 in 2011. These services consisted of one or more of the following: (i) agreed upon procedures related to compliance with Internal Revenue Code section 817(h), (ii) security counts required by Rule 17f-2 under the Investment Company Act of 1940, as amended, (iii) advisory services as to the accounting or disclosure treatment of Registrant transactions or events and (iv) advisory services to the accounting or disclosure treatment of the actual or potential impact to the Registrant of final or proposed rules, standards or interpretations by the Securities and Exchange Commission, the Financial Accounting Standards Boards or other regulatory or standard-setting bodies.
The aggregate fees billed in the Reporting Periods for non-audit assurance and related services by the Auditor to the Registrant's investment adviser (not including any sub-investment adviser whose role is primarily portfolio management and is subcontracted with or overseen by another investment adviser), and any entity controlling, controlled by or under common control with the investment adviser that provides ongoing services to the Registrant ("Service Affiliates"), that were reasonably related to the performance of the annual audit of the Service Affiliate, which required pre-approval by the Audit Committee were $0 in 2010 and $0 in 2011.
(c) Tax Fees. The aggregate fees billed in the Reporting Periods for professional services rendered by the Auditor for tax compliance, tax advice, and tax planning ("Tax Services") were $4,764 in 2010 and $6,323 in 2011. These services consisted of: (i) review or preparation of U.S. federal, state, local and excise tax returns; (ii) U.S. federal, state and local tax planning, advice and assistance regarding statutory, regulatory or administrative developments; (iii) tax advice regarding tax qualification matters and/or treatment of various financial instruments held or proposed to be acquired or held, and (iv) determination of Passive Foreign Investment Companies. The aggregate fees billed in the Reporting Periods for Tax Services by the Auditor to Service Affiliates, which required pre-approval by the Audit Committee were $0 in 2010 and $0 in 2011.
(d) All Other Fees. The aggregate fees billed in the Reporting Periods for products and services provided by the Auditor, other than the services reported in paragraphs (a) through (c) of this Item, were $667 in 2010 and $175 in 2011. [These services consisted of a review of the Registrant's anti-money laundering program].
The aggregate fees billed in the Reporting Periods for Non-Audit Services by the Auditor to Service Affiliates, other than the services reported in paragraphs (b) through (c) of this Item, which required pre-approval by the Audit Committee, were $0 in 2010 and $0 in 2011.
(e)(1) Audit Committee Pre-Approval Policies and Procedures. The Registrant's Audit Committee has established policies and procedures (the "Policy") for pre-approval (within specified fee limits) of the Auditor's engagements for non-audit services to the Registrant and Service Affiliates without specific case-by-case consideration. The pre-approved services in the Policy can include pre-approved audit services, pre-approved audit-related services, pre-approved tax services and pre-approved all other services. Pre-approval considerations include whether the proposed services are compatible with maintaining the Auditor's independence. Pre-approvals pursuant to the Policy are considered annually.
(e)(2) Note: None of the services described in paragraphs (b) through (d) of this Item 4 were approved by the Audit Committee pursuant to paragraph (c)(7)(i)(C) of Rule 2-01 of Regulation S-X.
(f) None of the hours expended on the principal accountant's engagement to audit the registrant's financial statements for the most recent fiscal year were attributed to work performed by persons other than the principal account's full-time, permanent employees.
Non-Audit Fees. The aggregate non-audit fees billed by the Auditor for services rendered to the Registrant, and rendered to Service Affiliates, for the Reporting Periods were $29,311,662 in 2010 and $16,565,389 in 2011.
Auditor Independence. The Registrant's Audit Committee has considered whether the provision of non-audit services that were rendered to Service Affiliates, which were not pre-approved (not requiring pre-approval), is compatible with maintaining the Auditor's independence.
Item 5. Audit Committee of Listed Registrants.
Not applicable. [CLOSED-END FUNDS ONLY]
Item 6. Investments.
(a) Not applicable.
Item 7. Disclosure of Proxy Voting Policies and Procedures for Closed-End Management Investment Companies.
Not applicable. [CLOSED-END FUNDS ONLY]
Item 8. Portfolio Managers of Closed-End Management Investment Companies.
Not applicable. [CLOSED-END FUNDS ONLY, beginning with reports for periods ended on and after December 31, 2005]
Item 9. Purchases of Equity Securities by Closed-End Management Investment Companies and Affiliated Purchasers.
Not applicable. [CLOSED-END FUNDS ONLY]
Item 10. Submission of Matters to a Vote of Security Holders.
There have been no material changes to the procedures applicable to Item 10.
Item 11. Controls and Procedures.
(a) The Registrant's principal executive and principal financial officers have concluded, based on their evaluation of the Registrant's disclosure controls and procedures as of a date within 90 days of the filing date of this report, that the Registrant's disclosure controls and procedures are reasonably designed to ensure that information required to be disclosed by the Registrant on Form N-CSR is recorded, processed, summarized and reported within the required time periods and that information required to be disclosed by the Registrant in the reports that it files or submits on Form N-CSR is accumulated and communicated to the Registrant's management, including its principal executive and principal financial officers, as appropriate to allow timely decisions regarding required disclosure.
(b) There were no changes to the Registrant's internal control over financial reporting that occurred during the second fiscal quarter of the period covered by this report that have materially affected, or are reasonably likely to materially affect, the Registrant's internal control over financial reporting.
Item 12. Exhibits.
(a)(1) Code of ethics referred to in Item 2.
(a)(2) Certifications of principal executive and principal financial officers as required by Rule 30a-2(a) under the Investment Company Act of 1940.
(a)(3) Not applicable.
(b) Certification of principal executive and principal financial officers as required by Rule 30a-2(b) under the Investment Company Act of 1940.
SIGNATURES
Pursuant to the requirements of the Securities Exchange Act of 1934 and the Investment Company Act of 1940, the Registrant has duly caused this Report to be signed on its behalf by the undersigned, thereunto duly authorized.
DREYFUS STOCK FUNDS
By: /s/Bradley J. Skapyak |
Bradley J. Skapyak, President |
Date: | November 22, 2011 |
|
Pursuant to the requirements of the Securities Exchange Act of 1934 and the Investment Company Act of 1940, this Report has been signed below by the following persons on behalf of the Registrant and in the capacities and on the dates indicated. |
|
By: /s/Bradley J. Skapyak |
Bradley J. Skapyak, President |
Date: | November 22, 2011 |
|
By: /s/James Windels |
James Windels, Treasurer |
Date: | November 22, 2011 |
|
EXHIBIT INDEX
(a)(1) Code of ethics referred to in Item 2.
(a)(2) Certifications of principal executive and principal financial officers as required by Rule 30a-2(a) under the Investment Company Act of 1940. (EX-99.CERT)
(b) Certification of principal executive and principal financial officers as required by Rule 30a-2(b) under the Investment Company Act of 1940. (EX-99.906CERT)