UNITED STATES
SECURITIES AND EXCHANGE COMMISSION
Washington, D.C. 20549
FORM N-CSR
CERTIFIED SHAREHOLDER REPORT OF REGISTERED MANAGEMENT
INVESTMENT COMPANIES
Investment Company Act file number | 811-21236 |
| |
| DREYFUS STOCK FUNDS | |
| (Exact name of Registrant as specified in charter) | |
| | |
| c/o The Dreyfus Corporation 200 Park Avenue New York, New York 10166 | |
| (Address of principal executive offices) (Zip code) | |
| | |
| Michael A. Rosenberg, Esq. 200 Park Avenue New York, New York 10166 | |
| (Name and address of agent for service) | |
|
Registrant's telephone number, including area code: | (212) 922-6000 |
| |
Date of fiscal year end: | 09/30 | |
Date of reporting period: | 09/30/10 | |
| | | | | | |
FORM N-CSR
Item 1. Reports to Stockholders.
Save time. Save paper. View your next shareholder report online as soon as it’s available. Log into www.dreyfus.com and sign up for Dreyfus eCommunications. It’s simple and only takes a few minutes.
The views expressed in this report reflect those of the portfolio manager only through the end of the period covered and do not necessarily represent the views of Dreyfus or any other person in the Dreyfus organization. Any such views are subject to change at any time based upon market or other conditions and Dreyfus disclaims any responsibility to update such views.These views may not be relied on as investment advice and, because investment decisions for a Dreyfus fund are based on numerous factors, may not be relied on as an indication of trading intent on behalf of any Dreyfus fund.
Not FDIC-Insured • Not Bank-Guaranteed • May Lose Value
| | Contents |
| | THE FUND |
| 2 | A Letter from the Chairman and CEO |
| 3 | Discussion of Fund Performance |
| 6 | Fund Performance |
| 8 | Understanding Your Fund’s Expenses |
| 8 | Comparing Your Fund’s Expenses With Those of Other Funds |
| 9 | Statement of Investments |
| 14 | Statement of Assets and Liabilities |
| 15 | Statement of Operations |
| 16 | Statement of Changes in Net Assets |
| 18 | Financial Highlights |
| 22 | Notes to Financial Statements |
| 34 | Report of Independent Registered Public Accounting Firm |
| 35 | Important Tax Information |
| 36 | Information About the Review and Approval of the Fund’s Investment Advisory and Administration Agreements |
| 42 | Board Members Information |
| 45 | Officers of the Fund |
| | FOR MORE INFORMATION |
| | Back Cover |
Dreyfus
International Equity Fund
The Fund

A LETTER FROM THE CHAIRMAN AND CEO
Dear Shareholder:
This annual report for Dreyfus International Equity Fund covers the 12-month period from October 1, 2009, through September 30, 2010.
Although a double-dip recession remains an unlikely scenario in most parts of the world in our analysis, recent uncertainty regarding the breadth and strength of the global economic recovery has led to bouts of weakness in some of the riskier asset classes, including international stocks. Former engines of growth appear stalled as large parts of the developed world remain indebted and burdened by weak housing markets. While some look to the developing world as an engine of economic growth, most emerging economies don’t yet have the demand infrastructure needed to support large-scale imports capable of meaningfully lifting global economic activity.
Uncertainty will probably remain in the broader financial markets until we see a persistent improvement in economic growth; but we currently are optimistic regarding the prospects for some equities. Higher-quality companies with healthy balance sheets, higher credit ratings and strong cash flows are currently priced at a discount, in our view. However, we continue to believe that selectivity will be a key to success in the stock market, as investors appear set to potentially reward fundamentally sound companies relative to those with questionable financial profiles and business strategies. During these market conditions, we suggest that you meet with your financial advisor regularly to review your global portfolio allocation in today’s slow-growth economic environment as well as your needs, goals and attitudes toward risk.
For information about how the fund performed during the reporting period, as well as general market perspectives, we provide a Discussion of Fund Performance on the pages that follow.
Thank you for your continued confidence and support.

Jonathan R. Baum
Chairman and Chief Executive Officer
The Dreyfus Corporation
October 15, 2010
2

DISCUSSION OF FUND PERFORMANCE
For the period of October 1, 2009, through September 30, 2010, as provided by D. Kirk Henry, Sean Fitzgibbon and Mark Bogar, Portfolio Managers
Fund and Market Performance Overview
For the 12-month period ended September 30, 2010, Dreyfus International Equity Fund’s Class A shares produced a total return of 1.84%, Class B shares returned 0.96%, Class C shares returned 1.03% and Class I shares returned 2.06%.1 In comparison, the fund’s benchmark, the Morgan Stanley Capital International Europe, Australasia, Far East Index (“MSCI EAFE Index”), produced a total return of 3.27% for the same period.2
International stocks encountered heightened volatility amid intensifying economic concerns, ending the reporting period with modest gains. The fund produced lower returns than its benchmark, primarily due to shortfalls in the health care and materials sectors.
The Fund’s Investment Approach
The fund seeks long-term growth of capital.The fund normally invests at least 80% of assets in shares of companies located in the foreign countries represented in the MSCI EAFE Index and Canada, and may also invest up to 25% of its assets in securities of issuers located in emerging market countries.
The fund invests in stocks that appear to be undervalued as measured by their price/earnings ratios, and that may have value and/or growth characteristics.We employ a “bottom-up” investment approach, which emphasizes individual stock selection. Our stock selection process is designed to produce a diversified portfolio that, relative to the MSCI EAFE Index, frequently has a below-average price/earnings ratio and an above-average earnings growth trend.
International Equities Volatile in Struggling Economy
Robust economic growth in the emerging markets supported global manufacturing activity over the first half of the reporting period, fueling improved confidence among businesses, consumers and investors. However, investor sentiment deteriorated in May 2010 due to a sovereign
TheFund 3
DISCUSSION OF FUND PERFORMANCE (continued)
debt crisis in Europe, where Greece found itself unable to finance a heavy debt load, requiring intervention from the International Monetary Fund and European Central Bank. In addition, global investors worried that higher interest rates and other efforts to forestall inflationary pressures in China might dampen a key engine of global economic growth. An appreciating currency hurt exports in Japan, and high unemployment levels weighed on the United States.
The sovereign debt crisis was especially hard on banking stocks, particularly those with heavy exposure to some of Europe’s more indebted economies. Energy stocks throughout the world were punished by the catastrophic oil spill in the Gulf of Mexico early in the reporting period, as investors reacted to uncertainty regarding potential liabilities and regulatory scrutiny of offshore drilling activity. In addition, over the reporting period’s second half, falling currency exchange rates relative to the U.S. dollar in most major markets except Japan undermined returns for U.S. residents.
Health Care and Materials Stocks Dampened Fund Results
The fund encountered several disappointments in the health care sector, where German generic drug maker STADA Arzneimittel was hurt by intensifying pricing and competitive pressures, prompting us to sell the fund’s position in the company. Similarly, Swiss pharmaceutical giant Roche Holding was hurt when generic versions of its biologic medications put pressure on pricing. Results from the materials sector were undermined by Irish building materials company CRH when a number of government construction projects were delayed due to fiscal pressures stemming from Europe’s sovereign debt crisis and sluggish economy. Finally, Swiss oil refiner Petroplus Holdings was hurt by overcapacity issues, which depressed earnings.
The fund achieved stronger relative performance in the information technology sector, where Japanese electronics and industrial conglomerate Hitachi successfully restructured, reducing costs and boosting profit margins.The fund also benefited from lack of exposure to wireless handset maker Nokia, which has lost market share to smartphones from other manufacturers. In the industrials sector, automakers Volkswagen and Honda Motor gained value as demand intensified for smaller cars and motorcycles in the emerging markets. Conversely, the fund did not own shares of Toyota, which lost market share amid highly publicized safety
4
recalls. The fund also benefited from its security selection strategy in Japan’s financials sector, where it avoided weakness among large banks and participated in gains among real estate firms.
Finding Opportunities in Volatile Markets
As of the reporting period’s end, we expect the subpar global economic recovery to continue, with generally sluggish growth in developed markets and more robust expansion in emerging markets. In addition, equity valuations have moderated to more reasonable levels in some regions, especially Europe.Therefore, it is not surprising to us that our bottom-up stock selection process has found a number of opportunities in recently beaten-down sectors and regions, including energy stocks in the wake of the Gulf oil spill, certain European banks, and companies in Japan and Europe that derive significant revenues from the emerging markets. In our judgment, these strategies position the fund for gains as the global economy gradually gains momentum and investors refocus on the fundamental strengths of individual companies.
October 15, 2010
| |
| | Equity funds are subject generally to market, market sector, market liquidity, issuer and investment |
| | style risks, among other factors, to varying degrees, all of which are more fully described in the |
| | fund’s prospectus. |
| | The fund’s performance will be influenced by political, social and economic factors affecting |
| | investments in foreign companies. Special risks associated with investments in foreign companies |
| | include exposure to currency fluctuations, less liquidity, less developed or less efficient trading |
| | markets, lack of comprehensive company information, political instability and differing auditing |
| | and legal standards.These risks are enhanced in emerging markets countries. Investments in foreign |
| | currencies are subject to the risk that those currencies will decline in value relative to the U.S. |
| | dollar, or, in the case of hedged positions, that the U.S. dollar will decline relative to the currency |
| | being hedged. Each of these risks could increase the fund’s volatility. |
| 1 | Total return includes reinvestment of dividends and any capital gains paid, and does not take into |
| | consideration the maximum initial sales charge in the case of Class A shares, or the applicable |
| | contingent deferred sales charges imposed on redemptions in the case of Class B and Class C |
| | shares. Had these charges been reflected, returns would have been lower. Past performance is no |
| | guarantee of future results. Share price and investment return fluctuate such that upon redemption, |
| | fund shares may be worth more or less than their original cost. Return figures provided reflect the |
| | absorption of certain fund expenses by The Dreyfus Corporation and The Boston Company Asset |
| | Management, LLC. Had these expenses not been absorbed, returns would have been lower. |
| 2 | SOURCE: LIPPER INC. – Reflects reinvestment of net dividends and, where applicable, |
| | capital gain distributions.The Morgan Stanley Capital International Europe,Australasia, Far |
| | East (MSCI EAFE) Index is an unmanaged index composed of a sample of companies |
| | representative of the market structure of European and Pacific Basin countries. Returns are |
| | calculated on a month-end basis. Investors cannot invest directly in any index. |
��
TheFund 5
FUND PERFORMANCE
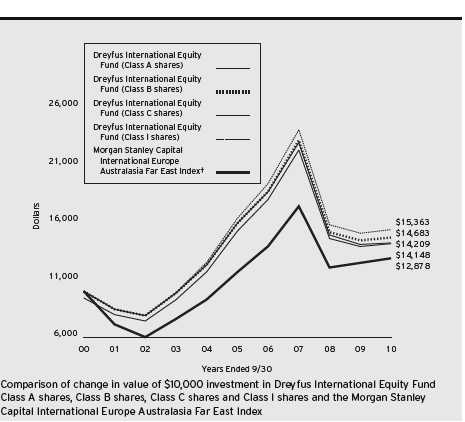
† Source: Lipper Inc.
Past performance is not predictive of future performance.
The above graph compares a $10,000 investment made in Class A, Class B, Class C and Class I shares of Dreyfus International Equity Fund on 9/30/00 to a $10,000 investment made in the Morgan Stanley Capital International Europe Australasia Far East Index (the “Index”) on that date.All dividends and capital gain distributions are reinvested.
Prior to 8/1/07, the fund invested its assets in a “master portfolio” that had the same investment objective and policies as the fund. This master/feeder arrangement was terminated on 8/1/07 and the fund operates as a stand alone fund. Performance information represents the performance of the predecessor master portfolio (and its predecessor fund) and the expenses of the master portfolio’s predecessor fund through January 31, 2003, and the fund’s performance and expense structure thereafter. The master portfolio’s predecessor fund contributed all of its assets to the master portfolio before the fund commenced investment operations on 2/1/03.
The fund’s performance shown in the line graph takes into account the maximum initial sales charge on Class A shares and all other applicable fees and expenses on all classes. Performance for each share class will vary from the performance of the fund’s other share classes due to differences in charges and expenses. Performance for Class B shares assumes the conversion of Class B shares to Class A shares at the end of the sixth year following the date of purchase.The Index is an unmanaged index composed of a sample of companies representative of the market structure of European and Pacific Basin countries. Unlike a mutual fund, the Index is not subject to charges, fees and other expenses. Investors cannot invest directly in any index. Further information relating to fund performance, including expense reimbursements, if applicable, is contained in the Financial Highlights section of the prospec tus and elsewhere in this report.
6
| | | |
| Average Annual Total Returns as of 9/30/10 | | | |
| |
| | 1 Year | 5 Years | 10 Years |
| Class A shares | | | |
| with maximum sales charge (5.75%) | –4.02% | –2.62% | 3.53% |
| without sales charge | 1.84% | –1.46% | 4.15% |
| Class B shares | | | |
| with applicable redemption charge † | –3.04% | –2.62% | 3.92% |
| without redemption | 0.96% | –2.28% | 3.92% |
| Class C shares | | | |
| with applicable redemption charge †† | 0.03% | –2.23% | 3.58% |
| without redemption | 1.03% | –2.23% | 3.58% |
| Class I shares | 2.06% | –1.23% | 4.39% |
| Morgan Stanley Capital International | | | |
| Europe Australasia Far East Index | 3.27% | 1.97% | 2.56% |
| |
| Past performance is not predictive of future performance.The fund’s performance shown in the graph and table does not |
| reflect the deduction of taxes that a shareholder would pay on fund distributions or the redemption of fund shares. |
| † | The maximum contingent deferred sales charge for Class B shares is 4%.After six years Class B shares convert to |
| | Class A shares. |
| †† | The maximum contingent deferred sales charge for Class C shares is 1% for shares redeemed within one year of the |
| | date of purchase. |
TheFund 7
UNDERSTANDING YOUR FUND’S EXPENSES (Unaudited)
As a mutual fund investor, you pay ongoing expenses, such as management fees and other expenses. Using the information below, you can estimate how these expenses affect your investment and compare them with the expenses of other funds.You also may pay one-time transaction expenses, including sales charges (loads) and redemption fees, which are not shown in this section and would have resulted in higher total expenses. For more information, see your fund’s prospectus or talk to your financial adviser.
Review your fund’s expenses
The table below shows the expenses you would have paid on a $1,000 investment in Dreyfus International Equity Fund from April 1, 2010 to September 30, 2010. It also shows how much a $1,000 investment would be worth at the close of the period, assuming actual returns and expenses.
| | | | |
| Expenses and Value of a $1,000 Investment | | | |
| assuming actual returns for the six months ended September 30, 2010 | | |
| | Class A | Class B | Class C | Class I |
| Expenses paid per $1,000† | $ 5.60 | $ 9.73 | $ 9.48 | $ 4.25 |
| Ending value (after expenses) | $995.50 | $990.90 | $991.30 | $996.60 |
|
| COMPARING YOUR FUND’S EXPENSES |
| WITH THOSE OF OTHER FUNDS (Unaudited) |
Using the SEC’s method to compare expenses
The Securities and Exchange Commission (SEC) has established guidelines to help investors assess fund expenses. Per these guidelines, the table below shows your fund’s expenses based on a $1,000 investment, assuming a hypothetical 5% annualized return. You can use this information to compare the ongoing expenses (but not transaction expenses or total cost) of investing in the fund with those of other funds.All mutual fund shareholder reports will provide this information to help you make this comparison. Please note that you cannot use this information to estimate your actual ending account balance and expenses paid during the period.
| | | | |
| Expenses and Value of a $1,000 Investment | | | |
| assuming a hypothetical 5% annualized return for the six months ended September 30, 2010 |
| | Class A | Class B | Class C | Class I |
| Expenses paid per $1,000† | $ 5.67 | $ 9.85 | $ 9.60 | $ 4.31 |
| Ending value (after expenses) | $1,019.45 | $1,015.29 | $1,015.54 | $1,020.81 |
† Expenses are equal to the fund’s annualized expense ratio of 1.12% for Class A, 1.95% for Class B, 1.90% for Class C, and .85% for Class I, multiplied by the average account value over the period, multiplied by 183/365 (to reflect the one-half year period).8
|
| STATEMENT OF INVESTMENTS |
| September 30, 2010 |
| | | |
| Common Stocks—96.8% | Shares | | Value ($) |
| Australia—6.3% | | | |
| AGL Energy | 51,190 | | 800,053 |
| Atlas Iron | 270,460 | a | 606,477 |
| Australia & New Zealand Banking Group | 37,610 | | 860,812 |
| BHP Billiton | 31,903 | | 1,199,820 |
| Commonwealth Bank of Australia | 33,570 | | 1,660,314 |
| Dexus Property Group | 1,508,400 | | 1,246,539 |
| Macquarie Group | 16,580 | | 581,240 |
| Stockland | 288,830 | | 1,072,005 |
| Westfield Group | 104,664 | | 1,240,255 |
| | | | 9,267,515 |
| Austria—.9% | | | |
| Erste Group Bank | 33,956 | | 1,359,555 |
| Denmark—.9% | | | |
| Carlsberg, Cl. B | 13,160 | | 1,372,137 |
| Finland—1.6% | | | |
| Fortum | 34,970 | | 914,844 |
| Sampo, Cl. A | 53,110 | | 1,434,290 |
| | | | 2,349,134 |
| France—12.3% | | | |
| BNP Paribas | 34,867 | | 2,479,771 |
| France Telecom | 108,930 | | 2,353,710 |
| GDF Suez | 49,842 | | 1,784,294 |
| L’Occitane International | 336,000 | | 935,396 |
| Legrand | 21,050 | | 711,959 |
| Rhodia | 46,760 | | 1,120,330 |
| Sanofi-Aventis | 27,940 | | 1,861,613 |
| Societe Generale | 32,980 | | 1,899,562 |
| Technip | 8,080 | | 649,779 |
| Total | 57,902 | | 2,984,139 |
| Valeo | 25,700 a | 1,190,684 |
| | | | 17,971,237 |
| Germany—4.0% | | | |
| BASF | 15,130 | | 954,056 |
| E.ON | 25,340 | | 747,204 |
| Lanxess | 12,140 | | 665,140 |
TheFund 9
STATEMENT OF INVESTMENTS (continued)
| | |
| Common Stocks (continued) | Shares | Value ($) |
| Germany (continued) | | |
| Metro | 36,990 | 2,407,875 |
| SAP | 21,160 | 1,046,692 |
| | | 5,820,967 |
| Hong Kong—1.1% | | |
| Hongkong Land Holdings | 263,000 | 1,633,230 |
| Ireland—.8% | | |
| CRH | 34,558 | 566,278 |
| Dragon Oil | 85,160 a | 588,955 |
| | | 1,155,233 |
| Italy—2.5% | | |
| Enel | 133,790 | 713,143 |
| ENI | 86,150 | 1,859,141 |
| UniCredit | 398,490 | 1,017,493 |
| | | 3,589,777 |
| Japan—19.8% | | |
| Asahi Kasei | 154,000 | 848,586 |
| Canon | 40,200 | 1,875,647 |
| Central Japan Railway | 188 | 1,382,750 |
| Daihatsu Motor | 85,000 | 1,137,338 |
| Daito Trust Construction | 14,300 | 854,780 |
| Fujitsu | 244,000 | 1,712,793 |
| Hino Motors | 252,000 | 1,216,531 |
| Hitachi | 465,000 | 2,033,122 |
| Honda Motor | 49,700 | 1,764,029 |
| JFE Holdings | 13,500 | 412,859 |
| Kaneka | 114,000 | 684,164 |
| Keihin | 66,100 | 1,360,323 |
| Lawson | 15,700 | 719,364 |
| Makita | 29,000 | 919,538 |
| Miraca Holding | 29,300 | 1,037,153 |
| Mitsubishi | 76,500 | 1,815,363 |
| Mitsubishi UFJ Financial Group | 214,900 | 1,001,391 |
| Sankyo | 8,400 | 444,753 |
| SMC | 10,800 | 1,424,389 |
| Softbank | 28,500 | 932,361 |
| Sumitomo Mitsui Financial Group | 37,000 | 1,077,911 |
10
| | | |
| Common Stocks (continued) | Shares | | Value ($) |
| Japan (continued) | | | |
| Sumitomo Trust & Banking | 81,000 | | 405,582 |
| Tokai Rika | 24,600 | | 416,090 |
| Tokyo Gas | 171,000 | | 776,342 |
| Toyo Suisan Kaisha | 56,000 | | 1,154,480 |
| Yahoo! Japan | 1,694 | | 585,230 |
| Yamada Denki | 14,520 | | 900,977 |
| | | | 28,893,846 |
| Luxembourg—1.1% | | | |
| ArcelorMittal | 24,900 | | 820,111 |
| Millicom International Cellular, SDR | 8,170 | | 779,382 |
| | | | 1,599,493 |
| Netherlands—4.2% | | | |
| ING Groep | 174,840 a | 1,813,851 |
| Koninklijke Ahold | 51,380 | | 692,594 |
| Koninklijke Philips Electronics | 52,120 | | 1,638,120 |
| TNT | 50,610 | | 1,359,876 |
| Unilever | 24,010 | | 717,642 |
| | | | 6,222,083 |
| Norway—1.6% | | | |
| Petroleum Geo-Services | 39,600 | a | 451,473 |
| Subsea 7 | 31,289 a | 611,293 |
| Telenor | 81,800 | | 1,281,005 |
| | | | 2,343,771 |
| Spain—4.7% | | | |
| Amadeus IT Holding, Cl. A | 38,220 | | 703,137 |
| Banco Bilbao Vizcaya Argentaria | 158,680 | | 2,142,658 |
| Banco Santander | 323,620 | | 4,110,434 |
| | | | 6,956,229 |
| Sweden—2.9% | | | |
| Atlas Copco, Cl. A | 96,430 | | 1,861,260 |
| Electrolux, Ser. B | 48,790 | | 1,201,590 |
| Sandvik | 78,880 | | 1,208,884 |
| | | | 4,271,734 |
| Switzerland—10.0% | | | |
| Adecco | 20,020 | | 1,046,178 |
| Credit Suisse Group | 38,520 | | 1,646,405 |
TheFund 11
STATEMENT OF INVESTMENTS (continued)
| | | |
| Common Stocks (continued) | Shares | | Value ($) |
| Switzerland (continued) | | | |
| Nestle | 38,317 | | 2,041,312 |
| Novartis | 26,625 | | 1,526,809 |
| Petroplus Holdings | 58,050 | a | 704,173 |
| Roche Holding | 15,424 | | 2,106,448 |
| Sulzer | 8,976 | | 1,041,331 |
| Transocean | 45,100 a | 2,909,658 |
| Zurich Financial Services | 6,970 | | 1,633,533 |
| | | | 14,655,847 |
| United Kingdom—21.1% | | | |
| Anglo American | 41,516 | | 1,647,062 |
| Barclays | 421,670 | | 1,984,548 |
| Berkeley Group Holdings | 94,310 | a | 1,223,728 |
| British American Tobacco | 66,400 | | 2,476,779 |
| BT Group | 205,320 | | 451,550 |
| Compass Group | 113,210 | | 943,446 |
| Cookson Group | 174,184 | a | 1,496,727 |
| GlaxoSmithKline | 176,930 | | 3,486,737 |
| HSBC Holdings | 165,390 | | 1,675,776 |
| IMI | 106,700 | | 1,286,441 |
| Imperial Tobacco Group | 33,760 | | 1,006,044 |
| Kingfisher | 348,750 | | 1,283,063 |
| Legal & General Group | 427,430 | | 694,948 |
| Old Mutual | 450,750 | | 982,816 |
| Rio Tinto | 40,810 | | 2,385,466 |
| Royal Dutch Shell, Cl. A | 7,940 | | 238,981 |
| Royal Dutch Shell, Cl. B | 71,820 | | 2,095,098 |
| Smith & Nephew | 69,130 | | 630,399 |
| Thomas Cook Group | 532,600 | | 1,437,379 |
| Unilever | 83,130 | | 2,404,133 |
| WPP | 95,270 | | 1,054,348 |
| | | | 30,885,469 |
| United States—1.0% | | | |
| iShares MSCI EAFE Index Fund | 26,390 | | 1,449,339 |
| Total Common Stocks | | | |
| (cost $130,271,359) | | | 141,796,596 |
12
| | |
| Preferred Stocks—1.4% | Shares | Value ($) |
| Germany | | |
| Volkswagen | | |
| (cost $1,564,023) | 17,374 | 2,096,846 |
| |
| Other Investment—.6% | | |
| Registered Investment Company; | | |
| Dreyfus Institutional Preferred | | |
| Plus Money Market Fund | | |
| (cost $780,000) | 780,000 b | 780,000 |
| Total Investments (cost $132,615,382) | 98.8% | 144,673,442 |
| Cash and Receivables (Net) | 1.2% | 1,776,343 |
| Net Assets | 100.0% | 146,449,785 |
| |
| SDR—Swedish Depository Receipts |
| a | Non-income producing security. |
| b | Investment in affiliated money market mutual fund. |
| | | |
| Portfolio Summary (Unaudited)† | | |
| |
| | Value (%) | | Value (%) |
| Financial | 24.9 | Information Technology | 5.4 |
| Industrial | 12.6 | Telecommunication Services | 4.0 |
| Consumer Discretionary | 11.9 | Utilities | 3.9 |
| Consumer Staples | 10.2 | Exchange Traded Funds | 1.0 |
| Energy | 8.9 | Money Market Investments | .6 |
| Materials | 8.1 | | |
| Health Care | 7.3 | | 98.8 |
|
| † Based on net assets. |
| See notes to financial statements. |
TheFund 13
|
| STATEMENT OF ASSETS AND LIABILITIES |
| September 30, 2010 |
| | | | |
| | | | Cost | Value |
| Assets ($): | | | | |
| Investments in securities—See Statement of Investments: | | |
| Unaffiliated issuers | | | 131,835,382 | 143,893,442 |
| Affiliated issuers | | | 780,000 | 780,000 |
| Cash | | | | 43,313 |
| Cash denominated in foreign currencies | | | 280,877 | 288,108 |
| Receivable for investment securities sold | | | 2,142,067 |
| Dividends and interest receivable | | | | 864,754 |
| Receivable for shares of Beneficial Interest subscribed | | | 7,099 |
| Unrealized appreciation on forward foreign | | | |
| currency exchange contracts—Note 4 | | | | 2,146 |
| Prepaid expenses | | | | 17,639 |
| | | | | 148,038,568 |
| Liabilities ($): | | | | |
| Due to The Boston Company Asset | | | | |
| Management, LLC and affiliates—Note 3(c) | | | 119,545 |
| Payable for investment securities purchased | | | 1,241,428 |
| Payable for shares of Beneficial Interest redeemed | | | 123,797 |
| Accrued expenses | | | | 104,013 |
| | | | | 1,588,783 |
| Net Assets ($) | | | | 146,449,785 |
| Composition of Net Assets ($): | | | | |
| Paid-in capital | | | | 222,144,016 |
| Accumulated undistributed investment income—net | | | 2,115,700 |
| Accumulated net realized gain (loss) on investments | | | (89,903,935) |
| Accumulated net unrealized appreciation (depreciation) | | | |
| on investments and foreign currency transactions | | | 12,094,004 |
| Net Assets ($) | | | | 146,449,785 |
| |
| |
| Net Asset Value Per Share | | | | |
| | Class A | Class B | Class C | Class I |
| Net Assets ($) | 58,526,107 | 1,967,957 | 8,024,718 | 77,931,003 |
| Shares Outstanding | 2,225,348 | 75,310 | 305,150 | 2,942,340 |
| Net Asset Value Per Share ($) | 26.30 | 26.13 | 26.30 | 26.49 |
| |
| See notes to financial statements. | | | | |
14
|
| STATEMENT OF OPERATIONS |
| Year Ended September 30, 2010 |
| |
| Investment Income ($): | |
| Income: | |
| Cash dividends (net of $417,923 foreign taxes withheld at source): | |
| Unaffiliated issuers | 4,061,200 |
| Affiliated issuers | 1,892 |
| Total Income | 4,063,092 |
| Expenses: | |
| Investment advisory fee—Note 3(a) | 1,135,374 |
| Administration fee—Note 3(a) | 141,922 |
| Shareholder servicing costs—Note 3(c) | 403,108 |
| Custodian fees—Note 3(c) | 197,666 |
| Distribution fees—Note 3(b) | 91,074 |
| Professional fees | 49,709 |
| Registration fees | 48,083 |
| Prospectus and shareholders’ reports | 31,247 |
| Trustees’ fees and expenses—Note 3(d) | 12,357 |
| Loan commitment fees—Note 2 | 2,346 |
| Interest expense—Note 2 | 2,174 |
| Miscellaneous | 44,721 |
| Total Expenses | 2,159,781 |
| Less—reduction in investment advisory and | |
| administration fees due to undertaking—Note 3(a) | (638,317) |
| Less—reduction in fees due to earnings credits—Note 3(c) | (517) |
| Net Expenses | 1,520,947 |
| Investment Income—Net | 2,542,145 |
| Realized and Unrealized Gain (Loss) on Investments—Note 4 ($): | |
| Net realized gain (loss) on investments and foreign currency transactions | 91,591 |
| Net realized gain (loss) on forward foreign currency exchange contracts | 80,919 |
| Net Realized Gain (Loss) | 172,510 |
| Net unrealized appreciation (depreciation) | |
| on investments and foreign currency transactions | (592,605) |
| Net unrealized appreciation (depreciation) | |
| on forward foreign currency exchange contracts | 3,644 |
| Net Unrealized Appreciation (Depreciation) | (588,961) |
| Net Realized and Unrealized Gain (Loss) on Investments | (416,451) |
| Net Increase in Net Assets Resulting from Operations | 2,125,694 |
| |
| See notes to financial statements. | |
TheFund 15
STATEMENT OF CHANGES IN NET ASSETS
| | |
| | Year Ended September 30, |
| | 2010 | 2009a |
| Operations ($): | | |
| Investment income—net | 2,542,145 | 2,072,837 |
| Net realized gain (loss) on investments | 172,510 | (66,060,279) |
| Net unrealized appreciation | | |
| (depreciation) on investments | (588,961) | 50,465,812 |
| Net Increase (Decrease) in Net Assets | | |
| Resulting from Operations | 2,125,694 | (13,521,630) |
| Dividends to Shareholders from ($): | | |
| Investment income—net: | | |
| Class A Shares | (1,507,279) | (4,649,806) |
| Class B Shares | (32,954) | (149,398) |
| Class C Shares | (124,420) | (422,631) |
| Class I Shares | (1,287,423) | (111,856) |
| Class T Shares | — | (43,840) |
| Total Dividends | (2,952,076) | (5,377,531) |
| Beneficial Interest Transactions ($): | | |
| Net proceeds from shares sold: | | |
| Class A Shares | 4,679,563 | 7,556,436 |
| Class B Shares | 39,607 | 117,213 |
| Class C Shares | 703,287 | 576,820 |
| Class I Shares | 59,559,407 | 28,202,542 |
| Class T Shares | — | 90,360 |
| Dividends reinvested: | | |
| Class A Shares | 1,415,765 | 4,192,930 |
| Class B Shares | 23,791 | 106,325 |
| Class C Shares | 68,985 | 230,943 |
| Class I Shares | 1,281,710 | 54,716 |
| Class T Shares | — | 25,122 |
| Cost of shares redeemed: | | |
| Class A Shares | (24,317,208) | (44,104,029) |
| Class B Shares | (1,592,392) | (2,030,166) |
| Class C Shares | (3,461,813) | (6,467,884) |
| Class I Shares | (14,612,926) | (4,579,357) |
| Class T Shares | — | (931,064) |
| Increase (Decrease) in Net Assets from | | |
| Beneficial Interest Transactions | 23,787,776 | (16,959,093) |
| Total Increase (Decrease) in Net Assets | 22,961,394 | (35,858,254) |
| Net Assets ($): | | |
| Beginning of Period | 123,488,391 | 159,346,645 |
| End of Period | 146,449,785 | 123,488,391 |
| Undistributed investment income—net | 2,115,700 | 2,012,335 |
16
| | |
| | Year Ended September 30, |
| | 2010 | 2009a |
| Capital Share Transactions: | | |
| Class Ab,c | | |
| Shares sold | 181,205 | 357,154 |
| Shares issued for dividends reinvested | 53,425 | 195,068 |
| Shares redeemed | (960,292) | (2,039,587) |
| Net Increase (Decrease) in Shares Outstanding | (725,662) | (1,487,365) |
| Class Bb | | |
| Shares sold | 1,534 | 4,743 |
| Shares issued for dividends reinvested | 898 | 4,955 |
| Shares redeemed | (62,808) | (95,453) |
| Net Increase (Decrease) in Shares Outstanding | (60,376) | (85,755) |
| Class C | | |
| Shares sold | 26,482 | 26,020 |
| Shares issued for dividends reinvested | 2,587 | 10,682 |
| Shares redeemed | (135,728) | (302,406) |
| Net Increase (Decrease) in Shares Outstanding | (106,659) | (265,704) |
| Class I | | |
| Shares sold | 2,320,740 | 1,306,091 |
| Shares issued for dividends reinvested | 48,112 | 2,526 |
| Shares redeemed | (603,865) | (210,329) |
| Net Increase (Decrease) in Shares Outstanding | 1,764,987 | 1,098,288 |
| Class Tc | | |
| Shares sold | — | 4,169 |
| Shares issued for dividends reinvested | — | 1,168 |
| Shares redeemed | — | (47,362) |
| Net Increase (Decrease) in Shares Outstanding | — | (42,025) |
| |
| a | Effective as of the close of business on February 4, 2009, the fund no longer offers Class T shares. |
| b | During the period ended September 30, 2010, 14,796 Class B shares representing $376,838 were automatically |
| | converted to 14,746 Class A shares and during the period ended September 30, 2009, 16,759 Class B shares |
| | representing $353,492 were automatically converted to 16,662 Class A shares. |
| c | On the close of business on February 4, 2009, 19,018 Class T shares representing $366,484 were converted to |
| | 19,028 Class A shares. |
| See notes to financial statements. |
TheFund 17
FINANCIAL HIGHLIGHTS
The following tables describe the performance for each share class for the fiscal periods indicated.All information (except portfolio turnover rate) reflects financial results for a single fund share.Total return shows how much your investment in the fund would have increased (or decreased) during each period, assuming you had reinvested all dividends and distributions.These figures have been derived from the fund’s financial statements.
| | | | | |
| | | Year Ended September 30, | |
| Class A Shares | 2010 | 2009 | 2008 | 2007 | 2006 |
| Per Share Data ($): | | | | | |
| Net asset value, beginning of period | 26.36 | 29.26 | 48.76 | 40.05 | 34.14 |
| Investment Operations: | | | | | |
| Investment income—neta | .42 | .45 | .77 | .63 | .59 |
| Net realized and unrealized | | | | | |
| gain (loss) on investments | .06 | (2.11) | (16.45) | 8.81 | 5.58 |
| Total from Investment Operations | .48 | (1.66) | (15.68) | 9.44 | 6.17 |
| Distributions: | | | | | |
| Dividends from investment income—net | (.54) | (1.24) | (.67) | (.28) | (.04) |
| Dividends from net realized | | | | | |
| gain on investments | — | — | (3.15) | (.45) | (.22) |
| Total Distributions | (.54) | (1.24) | (3.82) | (.73) | (.26) |
| Net asset value, end of period | 26.30 | 26.36 | 29.26 | 48.76 | 40.05 |
| Total Return (%)b | 1.84 | (4.73) | (34.53) | 23.80 | 18.16 |
| Ratios/Supplemental Data (%): | | | | | |
| Ratio of total expenses | | | | | |
| to average net assets | 1.64 | 1.84 | 1.57 | 1.27c | 1.38c |
| Ratio of net expenses | | | | | |
| to average net assets | 1.12 | 1.12 | 1.12 | 1.19c | 1.28c |
| Ratio of net investment income | | | | | |
| to average net assets | 1.65 | 2.12 | 1.90 | 1.37c | 1.55c |
| Portfolio Turnover Rate | 86.84 | 160.27 | 117.20 | 18.76d,e | — |
| Net Assets, end of period ($ x 1,000) | 58,526 | 77,775 | 129,886 | 286,373 | 124,283 |
| |
| a | Based on average shares outstanding at each month end. |
| b | Exclusive of sales charge. |
| c | For the period from October 1, 2006 to July 31, 2007 and for the fiscal year ended September 30, 2006, the |
| | ratios include the fund’s share of The Boston Company International Core Equity Portfolio’s (the “Portfolio”) |
| | allocated income and expenses. |
| d | Not annualized. |
| e | For the period from October 1, 2005 to July 31, 2007, the fund invested exclusively in the Portfolio under a |
| | master/feeder organizational structure that was terminated on August 1, 2007. On that date, the fund withdrew |
| | entirely from the Portfolio and received the Portfolio’s securities and cash in exchange for its interest in the Portfolio. |
| | Effective August 1, 2007, the fund began investing directly in the securities in which the Portfolio had invested. |
| | Portfolio turnover represents investment activity of the fund. |
| See notes to financial statements. |
18
| | | | | |
| | | Year Ended September 30, | |
| Class B Shares | 2010 | 2009 | 2008 | 2007 | 2006 |
| Per Share Data ($): | | | | | |
| Net asset value, beginning of period | 26.14 | 28.70 | 47.83 | 39.40 | 33.79 |
| Investment Operations: | | | | | |
| Investment income—neta | .19 | .26 | .41 | .19 | .25 |
| Net realized and unrealized | | | | | |
| gain (loss) on investments | .07 | (2.03) | (16.15) | 8.73 | 5.58 |
| Total from Investment Operations | .26 | (1.77) | (15.74) | 8.92 | 5.83 |
| Distributions: | | | | | |
| Dividends from investment income—net | (.27) | (.79) | (.24) | (.04) | — |
| Dividends from net realized | | | | | |
| gain on investments | — | — | (3.15) | (.45) | (.22) |
| Total Distributions | (.27) | (.79) | (3.39) | (.49) | (.22) |
| Net asset value, end of period | 26.13 | 26.14 | 28.70 | 47.83 | 39.40 |
| Total Return (%)b | .96 | (5.63) | (35.04) | 22.79 | 17.25 |
| Ratios/Supplemental Data (%): | | | | | |
| Ratio of total expenses | | | | | |
| to average net assets | 2.74 | 2.78 | 2.40 | 2.06c | 2.18c |
| Ratio of net expenses | | | | | |
| to average net assets | 1.95 | 1.95 | 1.95 | 2.00c | 2.03c |
| Ratio of net investment income | | | | | |
| to average net assets | .75 | 1.23 | 1.04 | .43c | .68c |
| Portfolio Turnover Rate | 86.84 | 160.27 | 117.20 | 18.76d,e | — |
| Net Assets, end of period ($ x 1,000) | 1,968 | 3,547 | 6,356 | 13,590 | 12,292 |
| |
| a | Based on average shares outstanding at each month end. |
| b | Exclusive of sales charge. |
| c | For the period from October 1, 2006 to July 31, 2007 and for the fiscal year ended September 30, 2006, the |
| | ratios include the fund’s share of The Boston Company International Core Equity Portfolio’s (the “Portfolio”) |
| | allocated income and expenses. |
| d | Not annualized. |
| e | For the period from October 1, 2005 to July 31, 2007, the fund invested exclusively in the Portfolio under a |
| | master/feeder organizational structure that was terminated on August 1, 2007. On that date, the fund withdrew |
| | entirely from the Portfolio and received the Portfolio’s securities and cash in exchange for its interest in the Portfolio. |
| | Effective August 1, 2007, the fund began investing directly in the securities in which the Portfolio had invested. |
| | Portfolio turnover represents investment activity of the fund. |
| See notes to financial statements. |
TheFund 19
FINANCIAL HIGHLIGHTS (continued)
| | | | | |
| | | Year Ended September 30, | |
| Class C Shares | 2010 | 2009 | 2008 | 2007 | 2006 |
| Per Share Data ($): | | | | | |
| Net asset value, beginning of period | 26.34 | 28.82 | 47.81 | 39.40 | 33.80 |
| Investment Operations: | | | | | |
| Investment income—neta | .22 | .27 | .37 | .23 | .25 |
| Net realized and unrealized | | | | | |
| gain (loss) on investments | .06 | (2.02) | (16.14) | 8.71 | 5.58 |
| Total from Investment Operations | .28 | (1.75) | (15.77) | 8.94 | 5.83 |
| Distributions: | | | | | |
| Dividends from investment income—net | (.32) | (.73) | (.07) | (.08) | (.01) |
| Dividends from net realized | | | | | |
| gain on investments | — | — | (3.15) | (.45) | (.22) |
| Total Distributions | (.32) | (.73) | (3.22) | (.53) | (.23) |
| Net asset value, end of period | 26.30 | 26.34 | 28.82 | 47.81 | 39.40 |
| Total Return (%)b | 1.03 | (5.54) | (35.04) | 22.85 | 17.27 |
| Ratios/Supplemental Data (%): | | | | | |
| Ratio of total expenses | | | | | |
| to average net assets | 2.46 | 2.62 | 2.30 | 1.99c | 2.11c |
| Ratio of net expenses | | | | | |
| to average net assets | 1.90 | 1.90 | 1.90 | 1.96c | 2.03c |
| Ratio of net investment income | | | | | |
| to average net assets | .87 | 1.28 | .93 | .51c | .68c |
| Portfolio Turnover Rate | 86.84 | 160.27 | 117.20 | 18.76d,e | — |
| Net Assets, end of period ($ x 1,000) | 8,025 | 10,848 | 19,529 | 66,102 | 51,752 |
| |
| a | Based on average shares outstanding at each month end. |
| b | Exclusive of sales charge. |
| c | For the period from October 1, 2006 to July 31, 2007 and for the fiscal year ended September 30, 2006, the |
| | ratios include the fund’s share of The Boston Company International Core Equity Portfolio’s (the “Portfolio”) |
| | allocated income and expenses. |
| d | Not annualized. |
| e | For the period from October 1, 2005 to July 31, 2007, the fund invested exclusively in the Portfolio under a |
| | master/feeder organizational structure that was terminated on August 1, 2007. On that date, the fund withdrew |
| | entirely from the Portfolio and received the Portfolio’s securities and cash in exchange for its interest in the Portfolio. |
| | Effective August 1, 2007, the fund began investing directly in the securities in which the Portfolio had invested. |
| | Portfolio turnover represents investment activity of the fund. |
| See notes to financial statements. |
20
| | | | | |
| | | Year Ended September 30, | |
| Class I Shares | 2010 | 2009 | 2008 | 2007a | 2006 |
| Per Share Data ($): | | | | | |
| Net asset value, beginning of period | 26.60 | 29.73 | 49.50 | 40.57 | 34.50 |
| Investment Operations: | | | | | |
| Investment income—netb | .55 | .58 | .54 | .76 | .85 |
| Net realized and unrealized | | | | | |
| gain (loss) on investments | .00c | (2.27) | (16.37) | 8.94 | 5.49 |
| Total from Investment Operations | .55 | (1.69) | (15.83) | 9.70 | 6.34 |
| Distributions: | | | | | |
| Dividends from investment income—net | (.66) | (1.44) | (.79) | (.32) | (.05) |
| Dividends from net realized | | | | | |
| gain on investments | — | — | (3.15) | (.45) | (.22) |
| Total Distributions | (.66) | (1.44) | (3.94) | (.77) | (.27) |
| Net asset value, end of period | 26.49 | 26.60 | 29.73 | 49.50 | 40.57 |
| Total Return (%) | 2.06 | (4.62) | (34.34) | 24.12 | 18.47 |
| Ratios/Supplemental Data (%): | | | | | |
| Ratio of total expenses | | | | | |
| to average net assets | 1.20 | 1.26 | 1.19 | .93d | 1.07d |
| Ratio of net expenses | | | | | |
| to average net assets | .85 | .85 | .85 | .91d | 1.03d |
| Ratio of net investment income | | | | | |
| to average net assets | 2.13 | 2.58 | 1.30 | 1.63d | 2.19d |
| Portfolio Turnover Rate | 86.84 | 160.27 | 117.20 | 18.76e,f | — |
| Net Assets, end of period ($ x 1,000) | 77,931 | 31,317 | 2,350 | 15,515 | 8,723 |
| |
| a | Effective June 1, 2007, Class R shares were redesignated as Class I shares. |
| b | Based on average shares outstanding at each month end. |
| c | Amount represents less than $.01 per share. |
| d | For the period from October 1, 2006 to July 31, 2007 and for the fiscal year ended September 30, 2006, the |
| | ratios include the fund’s share of The Boston Company International Core Equity Portfolio’s (the “Portfolio”) |
| | allocated income and expenses. |
| e | Not annualized. |
| f | For the period from October 1, 2005 to July 31, 2007, the fund invested exclusively in the Portfolio under a |
| | master/feeder organizational structure that was terminated on August 1, 2007. On that date, the fund withdrew |
| | entirely from the Portfolio and received the Portfolio’s securities and cash in exchange for its interest in the Portfolio. |
| | Effective August 1, 2007, the fund began investing directly in the securities in which the Portfolio had invested. |
| | Portfolio turnover represents investment activity of the fund. |
| See notes to financial statements. |
TheFund 21
NOTES TO FINANCIAL STATEMENTS
NOTE 1—Significant Accounting Policies:
Dreyfus International Equity Fund (the “fund”) is a separate diversified series of Dreyfus Stock Funds (the “Company”), which is registered under the Investment Company Act of 1940, as amended (the “Act”), as an open-end management investment company and operates as a series company currently offering two series, including the fund. The fund’s investment objective is to seek long-term growth of capital. The Boston Company Asset Management, LLC (“TBCAM”) serves as the fund’s investment adviser.The Dreyfus Corporation (the “Administrator” or “Dreyfus”), a wholly-owned subsidiary of The Bank of NewYork Mellon Corporation (“BNY Mellon”), and an affiliate of TBCAM, serves as the fund’s Administrator.
MBSC Securities Corporation (the “Distributor”), a wholly-owned subsidiary of Dreyfus, is the distributor of the fund’s shares.The fund is authorized to issue an unlimited number of $.001 par value shares of Beneficial Interest in each of the following classes of shares: Class A, Class B, Class C and Class I. Class A shares are subject to a sales charge imposed at the time of purchase. Class B shares are subject to a contingent deferred sales charge (“CDSC”) imposed on Class B share redemptions made within six years of purchase and automatically convert to Class A shares after six years.The fund does not offer Class B shares, except in connection with dividend reinvestment and permitted exchanges of Class B shares. Class C shares are subject to a CDSC imposed on Class C shares redeemed within one year of purchase. Class I shares are sold at net asset value per share only to institutional i nvestors. Other differences between the classes include the services offered to and the expenses borne by each class, the allocation of certain transfer agency costs and certain voting rights. Income, expenses (other than expenses attributable to a specific class), and realized and unrealized gains or losses on investments are allocated to each class of shares based on its relative net assets.
22
The Company accounts separately for the assets, liabilities and operations of each series. Expenses directly attributable to each series are charged to that series’ operations; expenses which are applicable to all series are allocated among them on a pro rata basis.
The Financial Accounting Standards Board (“FASB”) Accounting Standards Codification (“ASC”) is the exclusive reference of authoritative U.S. generally accepted accounting principles (“GAAP”) recognized by the FASB to be applied by nongovernmental entities. Rules and interpretive releases of the Securities and Exchange Commission (“SEC”) under authority of federal laws are also sources of authoritative GAAP for SEC registrants. The fund’s financial statements are prepared in accordance with GAAP, which may require the use of management estimates and assumptions.Actual results could differ from those estimates.
The Company enters into contracts that contain a variety of indemnifications.The fund’s maximum exposure under these arrangements is unknown.The fund does not anticipate recognizing any loss related to these arrangements.
(a) Portfolio valuation: Investments in securities are valued at the last sales price on the securities exchange or national securities market on which such securities are primarily traded. Securities listed on the National Market System for which market quotations are available are valued at the official closing price or, if there is no official closing price that day, at the last sales price. Securities not listed on an exchange or the national securities market, or securities for which there were no transactions, are valued at the average of the most recent bid and asked prices, except for open short positions, where the asked price is used for valuation purposes. Bid price is used when no asked price is available. Registered investment companies that are not traded on an exchange are valued at their net asset value.When market quotations or official
TheFund 23
NOTES TO FINANCIAL STATEMENTS (continued)
closing prices are not readily available, or are determined not to reflect accurately fair value, such as when the value of a security has been significantly affected by events after the close of the exchange or market on which the security is principally traded (for example, a foreign exchange or market), but before the fund calculates its net asset value, the fund may value these investments at fair value as determined in accordance with the procedures approved by the Board ofTrustees. Fair valuing of securities may be determined with the assistance of a pricing service using calculations based on indices of domestic securities and other appropriate indicators, such as prices of relevant American Depository Receipts and futures contracts. For other securities that are fair valued by the Board of Trustees, certain factors may be considered such as: fundamental analytical data, the nature and duration of restricti ons on disposition, an evaluation of the forces that influence the market in which the securities are purchased and sold, and public trading in similar securities of the issuer or comparable issuers. Investments denominated in foreign currencies are translated to U.S. dollars at the prevailing rates of exchange. Forward foreign currency exchange contracts (“forward contracts”) are valued at the forward rate.
The fair value of a financial instrument is the amount that would be received to sell an asset or paid to transfer a liability in an orderly transaction between market participants at the measurement date (i.e. the exit price). GAAP establishes a fair value hierarchy that prioritizes the inputs of valuation techniques used to measure fair value.This hierarchy gives the highest priority to unadjusted quoted prices in active markets for identical assets or liabilities (Level 1 measurements) and the lowest priority to unobservable inputs (Level 3 measurements).
Additionally, GAAP provides guidance on determining whether the volume and activity in a market has decreased significantly and whether such a decrease in activity results in transactions that are not orderly. GAAP requires enhanced disclosures around valuation inputs and techniques used during annual and interim periods.
24
Various inputs are used in determining the value of the fund’s investments relating to fair value measurements.These inputs are summarized in the three broad levels listed below:
Level 1—unadjusted quoted prices in active markets for identical investments.
Level 2—other significant observable inputs (including quoted prices for similar investments, interest rates, prepayment speeds, credit risk, etc.).
Level 3—significant unobservable inputs (including the fund’s own assumptions in determining the fair value of investments).
The inputs or methodology used for valuing securities are not necessarily an indication of the risk associated with investing in those securities.
The following is a summary of the inputs used as of September 30, 2010 in valuing the fund’s investments:
| | | | |
| | Level 1— | Level 2—Other | Level 3— | |
| | Unadjusted | Significant | Significant | |
| | Quoted | Observable | Unobservable | |
| | Prices | Inputs | Inputs | Total |
| Assets ($) | | | | |
| Investments in Securities: | | | |
| Equity Securities— | | | | |
| Foreign† | 142,444,103 | — | — | 142,444,103 |
| Mutual Funds/ | | | | |
| Exchange | | | | |
| Traded Funds | 2,229,339 | — | — | 2,229,339 |
| Other Financial | | | | |
| Instruments: | | | | |
| Forward Foreign | | | | |
| Currency Exchange | | | |
| Contracts†† | — | 2,146 | — | 2,146 |
| |
| † | See Statement of Investments for country and industry classification. |
| †† | Amount shown represents unrealized appreciation at period end. |
TheFund 25
NOTES TO FINANCIAL STATEMENTS (continued)
In January 2010, FASB issued Accounting Standards Update (“ASU”) No. 2010-06 “Improving Disclosures about Fair Value Measurements”. The portions of ASU No. 2010-06 which require reporting entities to prepare new disclosures surrounding amounts and reasons for significant transfers in and out of Level 1 and Level 2 fair value measurements as well as inputs and valuation techniques used to measure fair value for both recurring and nonrecurring fair value measurements that fall in either Level 2 or Level 3 have been adopted by the fund. No significant transfers between Level 1 or Level 2 fair value measurements occurred at September 30, 2010. The remaining portion of ASU No. 2010-06 requires reporting entities to make new disclosures about information on purchases, sales, issuances and settlements on a gross basis in the reconciliation of activity in Level 3 fair value measurements.These new and r evised disclosures are required to be implemented for fiscal years beginning after December 15, 2010. Management is currently evaluating the impact that the adoption of this remaining portion of ASU No. 2010-06 may have on the fund’s financial statement disclosures.
(b) Foreign currency transactions: The fund does not isolate that portion of the results of operations resulting from changes in foreign exchange rates on investments from the fluctuations arising from changes in market prices of securities held. Such fluctuations are included with the net realized and unrealized gain or loss on investments.
Net realized foreign exchange gains or losses arise from sales of foreign currencies, currency gains or losses realized on securities transactions between trade and settlement date and the difference between the amounts of dividends, interest and foreign withholding taxes recorded on the fund’s books and the U.S. dollar equivalent of the amounts actually received or paid. Net unrealized foreign exchange gains or losses arise from changes in the value of assets and liabilities other than investments resulting from changes in exchange rates. Foreign currency gains and losses on investments are included with net realized and unrealized gain or loss on investments.
26
(c) Securities transactions and investment income: Securities transactions are recorded on a trade date basis. Realized gains and losses from securities transactions are recorded on the identified cost basis. Dividend income is recognized on the ex-dividend date and interest income, including, where applicable, accretion of discount and amortization of premium on investments, is recognized on the accrual basis.
Investing in foreign markets may involve special risks and considerations not typically associated with investing in the U.S. These risks include revaluation of currencies, high rates of inflation, repatriation restrictions on income and capital, and adverse political and economic developments. Moreover, securities issued in these markets may be less liquid, subject to government ownership controls and delayed settlements, and their prices may be more volatile than those of comparable securities in the U.S.
(d) Affiliated issuers: Investments in other investment companies advised by Dreyfus are defined as “affiliated” in the Act.
The fund may invest in shares of certain affiliated investment companies also advised or managed by Dreyfus. Investments in affiliated investment companies for the period ended September 30, 2010 were as follows:
| | | | | |
| Affiliated | | | | | |
| Investment | Value | | | Value | Net |
| Company | 9/30/2009 ($) | Purchases ($) | Sales ($) | 9/30/2010 ($) | Assets (%) |
| Dreyfus | | | | | |
| Institutional | | | | | |
| Preferred | | | | | |
| Plus Money | | | | | |
| Market Fund | 110,000 | 61,898,000 | 61,228,000 | 780,000 | .6 |
(e) Dividends to shareholders: Dividends are recorded on the ex-dividend date. Dividends from investment income-net and dividends from net realized capital gains, if any, are normally declared and paid annually, but the fund may make distributions on a more frequent basis to comply with the distribution requirements of the Internal Revenue
TheFund 27
NOTES TO FINANCIAL STATEMENTS (continued)
Code of 1986, as amended (the “Code”).To the extent that net realized capital gains can be offset by capital loss carryovers, it is the policy of the fund not to distribute such gains. Income and capital gain distributions are determined in accordance with income tax regulations, which may differ from GAAP.
(f) Federal income taxes: It is the policy of the fund to continue to qualify as a regulated investment company, if such qualification is in the best interests of its shareholders, by complying with the applicable provisions of the Code, and to make distributions of taxable income sufficient to relieve it from substantially all federal income and excise taxes.
As of and during the period ended September 30, 2010, the fund did not have any liabilities for any uncertain tax positions.The fund recognizes interest and penalties, if any, related to uncertain tax positions as income tax expense in the Statement of Operations. During the period, the fund did not incur any interest or penalties.
Each of the tax years in the four-year period ended September 30, 2010 remains subject to examination by the Internal Revenue Service and state taxing authorities.
At September 30, 2010, the components of accumulated earnings on a tax basis were as follows: undistributed ordinary income $2,828,811, accumulated capital losses $86,580,648 and unrealized appreciation $9,876,973. In addition, the fund had $1,819,367 of capital losses realized after October 31, 2009, which were deferred for tax purposes to the first day of the following fiscal year.
The accumulated capital loss carryover is available for federal income tax purposes to be applied against future net securities profits, if any, realized subsequent to September 30, 2010. If not applied, $36,458,262 of the carryover expires in fiscal 2017 and $47,872,136 expires in fiscal 2018.
As a result of the fund’s merger with Dreyfus Founders International Equity Fund, capital losses of $2,250,250 are available to offset future gains, if any. Based on certain provisions in the Code, the amount of losses which can be utilized in subsequent years is subject to an annual limitation.This acquired capital loss will expire in fiscal 2011.
28
The tax character of distributions paid to shareholders during the fiscal periods ended September 30, 2010 and September 30, 2009 were as follows: ordinary income $2,952,076 and $5,377,531, respectively.
During the period ended September 30, 2010, as a result of permanent book to tax differences, primarily due to the tax treatment for passive foreign investment companies, foreign currency gains and losses, capital loss carryover expiration and recognition of book to tax differences resulting from prior year fund restructuring, the fund increased accumulated undistributed investment income-net by $513,296, increased accumulated net realized gain (loss) on investments by $1,404,992 and decreased paid-in capital by $1,918,288. Net assets and net asset value per share were not affected by this reclassification.
NOTE 2—Bank Lines of Credit:
The fund participates with other Dreyfus-managed funds in a $225 million unsecured credit facility led by Citibank, N.A. and a $300 million unsecured credit facility provided by The Bank of New York Mellon, a subsidiary of BNY Mellon and an affiliate of Dreyfus, (each, a “Facility”), each to be utilized primarily for temporary or emergency purposes, including the financing of redemptions. In connection therewith, the fund has agreed to pay its pro rata portion of commitment fees for each Facility. Interest is charged to the fund based on rates determined pursuant to the terms of the respective Facility at the time of borrowing.
The average amount of borrowings outstanding under the Facilities during the period ended September 30, 2010 was approximately $152,100, with a related weighted average annualized interest rate of 1.43%.
NOTE 3—Investment Advisory Fee, Administration Fee and Other Transactions with Affiliates:
(a) Pursuant to an investment advisory agreement with TBCAM, the investment advisory fee is computed at the annual rate of .80% of the value of the fund’s average daily net assets up to $500 million, .75% of the next $500 million of such assets, .70% of the next $500 million of such
TheFund 29
NOTES TO FINANCIAL STATEMENTS (continued)
assets, .60% of the next $500 million of such assets and .50% of the fund’s average daily net assets in excess of $2 billion and is payable monthly.
Dreyfus and TBCAM have contractually agreed, with respect to each class of fund shares, to assume the expenses of each class so that such expenses of the fund’s Class A, B, C and I shares (excluding taxes, interest, brokerage commissions, commitment fees on borrowings and extraordinary expenses) do not exceed an annual rate of 1.12%, 1.95%, 1.90% and .85%, respectively, of the value of such class’ average daily net assets, until the fiscal year end following such time as the expenses are equal to or less than such annual rate for each class.The reduction in investment advisory and administration fees, pursuant to the undertaking, amounted to $638,317 during the period ended September 30, 2010.
The fund compensates Dreyfus under an administration agreement for providing personnel and facilities to perform accounting and administration services for the fund at an annual rate of .10% of the value of the fund’s average daily net assets. During the period ended September 30, 2010, the fund was charged $141,922 pursuant to the administration agreement.
During the period ended September 30, 2010, the Distributor retained $1,690 from commissions earned on sales of the fund’s Class A shares and $13,436 and $1,127 from CDSCs on redemptions of the fund’s Class B and Class C shares, respectively.
(b) Under the Distribution Plan (the “Plan”) adopted pursuant to Rule 12b-1 under the Act, Class B and Class C shares pay the Distributor for distributing their shares at an annual rate of .75% of the value of the average daily net assets of Class B and Class C shares. During the period ended September 30, 2010, Class B and Class C shares were charged $20,234 and $70,840, respectively, pursuant to the Plan.
(c) Under the Shareholder Services Plan, Class A, Class B and Class C shares pay the Distributor at an annual rate of .25% of the value of their average daily net assets for the provision of certain services.The services provided may include personal services relating to shareholder accounts, such as answering shareholder inquiries regarding the fund
30
and providing reports and other information, and services related to the maintenance of shareholder accounts. The Distributor may make payments to Service Agents (a securities dealer, financial institution or other industry professional) in respect of these services. The Distributor determines the amounts to be paid to Service Agents. During the period ended September 30, 2010, Class A, Class B and Class C shares were charged $167,369, $6,745 and $23,613, respectively, pursuant to the Shareholder Services Plan.
The fund compensates Dreyfus Transfer, Inc., a wholly-owned subsidiary of Dreyfus, under a transfer agency agreement for providing personnel and facilities to perform transfer agency services for the fund. During the period ended September 30, 2010, the fund was charged $65,473 pursuant to the transfer agency agreement, which is included in Shareholder servicing costs in the Statement of Operations.
The fund has arrangements with the custodian and cash management bank whereby the fund may receive earnings credits when positive cash balances are maintained, which are used to offset custody and cash management fees. For financial reporting purposes, the fund includes net earnings credits as an expense offset in the Statement of Operations.
The fund compensates The Bank of New York Mellon, an affiliate of Dreyfus and TBCAM, under a cash management agreement for performing cash management services related to fund subscriptions and redemptions. During the period ended September 30, 2010, the fund was charged $9,756 pursuant to the cash management agreement, which is included in Shareholder servicing costs in the Statement of Operations.These fees were partially offset by earnings credits of $517.
The fund also compensates The Bank of New York Mellon under a custody agreement for providing custodial services for the fund. During the period ended September 30, 2010, the fund was charged $197,666 pursuant to the custody agreement.
During the period ended September 30, 2010, the fund was charged $6,380 for services performed by the Chief Compliance Officer.
TheFund 31
NOTES TO FINANCIAL STATEMENTS (continued)
The components of “Due to TBCAM and affiliates” in the Statement of Assets and Liabilities consist of: investment advisory fees $93,834, administration fees $11,729, Rule 12b-1 distribution plan fees $6,162, shareholder services plan fees $13,931, custodian fees $24,794, chief compliance officer fees $1,783 and transfer agency per account fees $14,960, which are offset against an expense reimbursement currently in effect in the amount of $47,648.
(d) Each Board member also serves as a Board member of other funds within the Dreyfus complex. Annual retainer fees and attendance fees are allocated to each fund based on net assets.
(e) A 2% redemption fee is charged and retained by the fund on certain shares redeemed within sixty days following the date of issuance subject to exceptions, including redemptions made through use of the fund’s exchange privilege. During the period ended September 30, 2010, redemption fees charged and retained by the fund amounted to $3,156.
NOTE 4—Securities Transactions:
The aggregate amount of purchases and sales of investment securities, excluding short-term securities and forward contracts, during the period ended September 30, 2010, amounted to $141,827,830 and $119,403,244, respectively.
The provisions of ASC Topic 815 “Derivatives and Hedging” require qualitative disclosures about objectives and strategies for using derivatives, quantitative disclosures about fair value amounts of gains and losses on derivative instruments and disclosures about credit-risk-related contingent features in derivative agreements. The disclosure requirements distinguish between derivatives, which are accounted for as “hedges” and those that do not qualify for hedge accounting. Because investment companies value their derivatives at fair value and recognize changes in fair value through the Statement of Operations, they do not qualify for such accounting. Accordingly, even though a fund’s investments in derivatives may represent economic hedges, they are considered to be non-hedge transactions for purposes of this disclosure.
32
Forward Foreign Currency Exchange Contracts: The fund enters into forward contracts in order to hedge its exposure to changes in foreign currency exchange rates on its foreign portfolio holdings, to settle foreign currency transactions or as a part of its investment strategy. When executing forward contracts, the fund is obligated to buy or sell a foreign currency at a specified rate on a certain date in the future. With respect to sales of forward contracts, the fund incurs a loss if the value of the contract increases between the date the forward contract is opened and the date the forward contract is closed.The fund realizes a gain if the value of the contract decreases between those dates.With respect to purchases of forward contracts, the fund incurs a loss if the value of the contract decreases between the date the for ward contract is opened and the date the forward contract is closed.The fund realizes a gain if the value of the contract increases between those dates. Any realized gain or loss which occurred during the period is reflected in the Statement of Operations.The fund is exposed to foreign currency risk as a result of changes in value of underlying financial instruments. The fund is also exposed to credit risk associated with counterparty nonperformance on these forward contracts, which is typically limited to the unrealized gain on each open contract.The following summarizes open forward contracts at September 30, 2010:
| | | | |
| | Foreign | | | |
| Forward Foreign Currency | Currency | | | Unrealized |
| Exchange Contracts | Amounts | Proceeds ($) | Value ($) | Appreciation ($) |
| Sales: | | | | |
| Euro, | | | | |
| Expiring 10/4/2010 | 613,578 | 836,491 | 836,462 | 29 |
| Swiss Franc, | | | | |
| Expiring 10/4/2010 | 353,444 | 361,802 | 359,685 | 2,117 |
| Gross Unrealized | | | | |
| Appreciation | | | | 2,146 |
At September 30, 2010, the cost of investments for federal income tax purposes was $134,832,413; accordingly, accumulated net unrealized appreciation on investments was $9,841,029, consisting of $18,693,477 gross unrealized appreciation and $8,852,448 gross unrealized depreciation.
TheFund 33
REPORT OF INDEPENDENT REGISTERED
PUBLIC ACCOUNTING FIRM
Shareholders and Board of Trustees
Dreyfus International Equity Fund
We have audited the accompanying statement of assets and liabilities, including the statement of investments, of Dreyfus International Equity Fund (one of the series comprising Dreyfus Stock Funds) as of September 30, 2010, and the related statement of operations for the year then ended, the statement of changes in net assets for each of the two years in the period then ended and financial highlights for each of the four years in the period then ended. These financial statements and financial highlights are the responsibility of the Fund’s management. Our responsibility is to express an opinion on these financial statements and financial highlights based on our audits.The financial highlights for the year ended September 30, 2006 were audited by other auditors whose report dated November 17, 2006, expressed an unqualified opinion on such financial highlights.
We conducted our audits in accordance with the standards of the Public Company Accounting Oversight Board (United States).Those standards require that we plan and perform the audit to obtain reasonable assurance about whether the financial statements and financial highlights are free of material misstatement.We were not engaged to perform an audit of the Fund’s internal control over financial reporting. Our audits included consideration of internal control over financial reporting as a basis for designing audit procedures that are appropriate in the circumstances, but not for the purpose of expressing an opinion on the effectiveness of the Fund’s internal control over financial reporting. Accordingly, we express no such opinion.An audit also includes examining, on a test basis, evidence supporting the amounts and disclosures in the financial statements and financial highlights, assessing the accounting p rinciples used and significant estimates made by management, and evaluating the overall financial statement presentation. Our procedures included confirmation of securities owned as of September 30, 2010 by correspondence with the custodian and others.We believe that our audits provide a reasonable basis for our opinion.
In our opinion, the 2010, 2009, 2008 and 2007 financial statements and financial highlights referred to above present fairly, in all material respects, the financial position of Dreyfus International Equity Fund at September 30, 2010, the results of its operations for the year then ended, the changes in its net assets for each of the two years in the period then ended and financial highlights for each of the four years in the period then ended, in conformity with U.S. generally accepted accounting principles.

New York, New York
November 23, 2010
34
IMPORTANT TAX INFORMATION (Unaudited)
In accordance with federal tax law, the fund elects to provide each shareholder with their portion of the fund’s foreign taxes paid and the income sourced from foreign countries. Accordingly, the fund hereby makes the following designations regarding its fiscal year ended September 30, 2010:
—the total amount of taxes paid to foreign countries was $397,653
—the total amount of income sourced from foreign countries was $4,449,137.
As required by federal tax law rules, shareholders will receive notification of their proportionate share of foreign taxes paid and foreign sourced income for the 2010 calendar year with Form 1099-DIV which will be mailed in early 2011.Also certain dividends paid by the fund may be subject to a maximum tax rate of 15%, as provided for by the Jobs and Growth Tax Relief Reconciliation Act of 2003. Of the distributions paid during the fiscal year, $2,952,076 represents the maximum amount that may be considered qualified dividend income.
TheFund 35
INFORMATION ABOUT THE REVIEW AND APPROVAL
OF THE FUND’S INVESTMENT ADVISORY AND
ADMINISTRATION AGREEMENTS (Unaudited)
At a Meeting of the fund’s Board of Trustees held on April 26, 2010, the Board considered the re-approval of the fund’s Investment Advisory Agreement through November 30, 2010, pursuant to which TBCAM provides the fund with investment advisory services. The Board members, none of whom are “interested persons” (as defined in the Investment Company Act of 1940, as amended) of the fund, were assisted in their review by independent legal counsel and met with counsel in executive session separate from representatives of Dreyfus and TBCAM.
Analysis of Nature, Extent, and Quality of Services Provided to the Fund.The Board members considered information previously provided to them in a presentation from representatives of Dreyfus regarding services provided to the fund and other funds in the Dreyfus complex, and representatives of Dreyfus confirmed that there had been no material changes in the information.The Board also discussed the nature, extent, and quality of the services provided to the fund by TBCAM pursuant to the fund’s Investment Advisory Agreement. Dreyfus’ representatives reviewed the fund’s distribution of accounts and the relationships that Dreyfus has with various intermediaries and the different needs of each. Dreyfus’ representatives noted the diversity of distribution of the fund as well as among the funds in the Dreyfus fund comple x, and Dreyfus’ corresponding need for broad, deep, and diverse resources to be able to provide ongoing shareholder services to each of the fund’s distribution channels.The Board also reviewed the number of shareholder accounts in the fund, as well as the fund’s asset size.
The Board members also considered TBCAM’s research and portfolio management capabilities and that Dreyfus provides oversight of day-today fund operations, including fund accounting and administration and assistance in meeting legal and regulatory requirements, pursuant to a separate agreement. The Board members also considered TBCAM’s separate administrative and compliance infrastructures.
36
Comparative Analysis of the Fund’s Total Investment Advisory Fee and Administration Fee and Expense Ratio and Performance. The Board members reviewed reports prepared by Lipper, Inc., an independent provider of investment company data, which included information comparing the fund’s investment advisory fee, total investment advisory fee and administration fee, and expense ratio, with a group of comparable funds (the “Expense Group”) and with a broader group of funds (the “Expense Universe”) that were selected by Lipper. Included in the fund’s reports were comparisons of contractual and actual management fee rates and total operating expenses.
The Board members also reviewed the reports prepared by Lipper that presented the fund’s performance as well as comparisons of total return performance for the fund to the same group of funds as the Expense Group (the “Performance Group”) and to a group of funds that was broader than the Expense Universe (the “Performance Universe”) that also were selected by Lipper, all for various periods ended March 31, 2010. Dreyfus previously had furnished the Board with a description of the methodology Lipper used to select the fund’s Expense Group and Expense Universe, and Performance Group and Performance Universe. Dreyfus also provided a comparison of the fund’s total returns to the returns of the fund’s benchmark index.
The Board reviewed the results of the Expense Group and Expense Universe comparisons that were prepared based on financial statements available to Lipper as of March 31, 2010.The Board reviewed the range of management fees and expense ratios of the funds in the Expense Group and Expense Universe, and noted that the fund’s total contractual investment advisory fee and administration fee was lower than the Expense Group median, and that the fund’s total actual investment advisory fee and administration fee also was lower than the Expense Group
TheFund 37
INFORMATION ABOUT THE REVIEW AND APPROVAL OF THE FUND’S INVESTMENT
ADVISORY AND ADMINISTRATION AGREEMENTS (Unaudited) (continued)
median and Expense Universe median.The Board also noted that the fund’s total expense ratio (Class A shares) was lower than the Expense Group median and Expense Universe median.The Board noted that the fund’s total expense ratio reflected an expense limitation implemented by Dreyfus and TBCAM and that such limitation continues in effect.
With respect to the fund’s performance (Class A shares), the Board noted that the fund achieved total returns lower than the Performance Group median and Performance Universe median for each reported time period up to five years.The Board received a presentation from the fund’s portfolio manager regarding the factors which affected the fund’s performance in 2009. The Board noted the fund’s stabilized asset size and the portfolio management and investment process changes implemented in January 2010.The Board noted that it would continue to closely monitor portfolio management’s effort to improve the fund’s performance record.
Representatives of Dreyfus reviewed with the Board members the fees paid toTBCAM or Dreyfus or its affiliates by the mutual funds managed by TBCAM (or Dreyfus or its affiliates) that was reported in the same Lipper category as the fund (the “Similar Funds”). Dreyfus’ representatives also reviewed the fees paid by institutional separate accounts managed by TBCAM and commingled funds managed by TBCAM (the “Separate Accounts” and, collectively with the Similar Funds, the “Similar Accounts”) that have similar investment objectives and policies as the fund. Dreyfus does not manage any international equity institutional separate accounts or commingled funds, or wrap fee accounts. Dreyfus’ representatives explained the nature of each Separate Account and the differences, from Dreyfus’ and TBCAM’s perspective (as applicable), in providing services to the Separate Accounts as compared to the fund.The Board analyzed the differences in fees paid to TBCAM and discussed the relationship of the management fees paid in light of the services provided. Dreyfus’ representatives advised the Board that the investment advisory fee rates for the Separate Accounts reflected TBCAM’s independent pricing and cost structures.The Board consid-
38
ered the relevance of the fee information provided for the Similar Accounts to evaluate the appropriateness and reasonableness of the fund’s investment advisory fee.
Analysis of Profitability and Economies of Scale. Dreyfus’ representatives reviewed the dollar amount of expenses allocated and profit received by Dreyfus for the fund and the method used to determine such expenses and profit. The Board considered information, previously provided and discussed, that was prepared by an independent consulting firm regarding Dreyfus’ approach to allocating costs to, and determining the profitability of, individual funds and the entire Dreyfus mutual fund complex.The Board also had been informed that the methodology had also been reviewed by an independent registered public accounting firm which, like the consultant, found the methodology to be reasonable. The consulting firm also analyzed where any economies of scale might emerge in connection with the management of a fund. The Board members e valuated the profitability analysis in light of the relevant circumstances for the fund, including the change in the fund’s asset size from the prior year, and the extent to which economies of scale would be realized if the fund grows and whether fee levels reflect these economies of scale for the benefit of fund shareholders.The Board also considered TBCAM’s brokerage policies and practices, the standards applied in seeking best execution, and their policies and practices regarding soft dollars.The Board members also considered potential benefits to TBCAM from acting as investment adviser to the fund and noted the soft dollar arrangements in effect with respect to trading the fund’s portfolio.
It was noted that prior to August 2007, under the fund’s master-feeder structure, the fund did not have an investment advisory agreement withTBCAM. It also was noted that since August 2007, when the fund was “despoked” and entered into its investment advisory agreement with TBCAM, the fund has enjoyed the benefit of an undertaking by TBCAM to limit the fund’s expense ratio to a specified percentage,
TheFund 39
INFORMATION ABOUT THE REVIEW AND APPROVAL OF THE FUND’S INVESTMENT
ADVISORY AND ADMINISTRATION AGREEMENTS (Unaudited) (continued)
which expense limitation continues in effect.The Board further noted the fund’s substantially smaller asset size from its peak asset size in 2007 and considered the effect that this asset decline, coupled with the expense limitation, has had on TBCAM’s revenues from the fund.The Board also noted prior and current undertakings implemented by Dreyfus and TBCAM (as applicable) to waive receipt of a portion of the fund’s investment advisory fee payable to TBCAM and/or limit the fund’s total operating expenses for a period of time.
At the conclusion of these discussions, the Board agreed that it had been furnished with sufficient information to make an informed business decision with respect to continuation of the fund’s Investment Advisory Agreement. Based on the discussions and considerations as described above, the Board reached the following conclusions and determinations.
The Board concluded that the nature, extent, and quality of the ser- vices provided by TBCAM to the fund are adequate and appropriate.
The Board noted the recent portfolio management and investment process changes and that it would closely monitor portfolio man- agement’s efforts to improve the fund’s performance record.
The Board concluded that the investment advisory fee paid to TBCAM by the fund was reasonable in light of the services provided, comparative performance and expense and investment advisory fee information, costs of the services provided and profits to be realized and benefits derived or to be derived by TBCAM from its relation- ship with the fund.
40
The Board determined that the economies of scale which may accrue to TBCAM and its affiliates in connection with the management of the fund had been adequately considered in connection with the investment advisory fee rate charged to the fund, and that, to the extent in the future it were to be determined that material economies of scale had not been shared with the fund, the Board would seek to have those economies of scale shared with the fund.
The Board members considered these conclusions and determinations, along with the information received on a routine and regular basis throughout the year, and, without any one factor being dispositive, the Board determined that re-approval of the fund’s Investment Advisory Agreement through November 30, 2010 was in the best interests of the fund and its shareholders.
TheFund 41
OFFICERS OF THE FUND (Unaudited)
BRADLEY J. SKAPYAK, President since January 2010.
Chief Operating Officer and a director of the Manager since June 2009. From April 2003 to June 2009, Mr. Skapyak was the head of the Investment Accounting and Support Department of the Manager. He is an officer of 76 investment companies (comprised of 170 portfolios) managed by the Manager. He is 51 years old and has been an employee of the Manager since February 1988.
PHILLIP N. MAISANO, Executive Vice President since July 2007.
Chief Investment Officer,Vice Chair and a director of the Manager, and an officer of 76 investment companies (comprised of 170 portfolios) managed by the Manager. Mr. Maisano also is an officer and/or Board member of certain other investment management subsidiaries of The Bank of New York Mellon Corporation, each of which is an affiliate of the Manager. He is 63 years old and has been an employee of the Manager since November 2006. Prior to joining the Manager, Mr. Maisano served as Chairman and Chief Executive Officer of EACM Advisors, an affiliate of the Manager, since August 2004.
MICHAEL A. ROSENBERG, Vice President and Secretary since August 2005.
Assistant General Counsel of BNY Mellon, and an officer of 77 investment companies (comprised of 195 portfolios) managed by the Manager. He is 50 years old and has been an employee of the Manager since October 1991.
KIESHA ASTWOOD, Vice President and Assistant Secretary since January 2010.
Counsel of BNY Mellon, and an officer of 77 investment companies (comprised of 195 portfolios) managed by the Manager. She is 37 years old and has been an employee of the Manager since July 1995.
JAMES BITETTO, Vice President and Assistant Secretary since August 2005.
Senior Counsel of BNY Mellon and Secretary of the Manager, and an officer of 77 investment companies (comprised of 195 portfolios) managed by the Manager. He is 44 years old and has been an employee of the Manager since December 1996.
JONI LACKS CHARATAN, Vice President and Assistant Secretary since August 2005.
Senior Counsel of BNY Mellon, and an officer of 77 investment companies (comprised of 195 portfolios) managed by the Manager. She is 54 years old and has been an employee of the Manager since October 1988.
JOSEPH M. CHIOFFI, Vice President and Assistant Secretary since August 2005.
Senior Counsel of BNY Mellon, and an officer of 77 investment companies (comprised of 195 portfolios) managed by the Manager. He is 48 years old and has been an employee of the Manager since June 2000.
KATHLEEN DENICHOLAS, Vice President and Assistant Secretary since January 2010.
Senior Counsel of BNY Mellon, and an officer of 77 investment companies (comprised of 195 portfolios) managed by the Manager. She is 35 years old and has been an employee of the Manager since February 2001.
JANETTE E. FARRAGHER, Vice President and Assistant Secretary since August 2005.
Assistant General Counsel of BNY Mellon, and an officer of 77 investment companies (comprised of 195 portfolios) managed by the Manager. She is 47 years old and has been an employee of the Manager since February 1984.
TheFund 45
OFFICERS OF THE FUND (Unaudited) (continued)
JOHN B. HAMMALIAN, Vice President and Assistant Secretary since August 2005.
Managing Counsel of BNY Mellon, and an officer of 77 investment companies (comprised of 195 portfolios) managed by the Manager. He is 47 years old and has been an employee of the Manager since February 1991.
M. CRISTINA MEISER, Vice President and Assistant Secretary since January 2010.
Senior Counsel of BNY Mellon, and an officer of 77 investment companies (comprised of 195 portfolios) managed by the Manager. She is 40 years old and has been an employee of the Manager since August 2001.
ROBERT R. MULLERY, Vice President and Assistant Secretary since August 2005.
Managing Counsel of BNY Mellon, and an officer of 77 investment companies (comprised of 195 portfolios) managed by the Manager. He is 58 years old and has been an employee of the Manager since May 1986.
JEFF PRUSNOFSKY, Vice President and Assistant Secretary since August 2005.
Managing Counsel of BNY Mellon, and an officer of 77 investment companies (comprised of 195 portfolios) managed by the Manager. He is 45 years old and has been an employee of the Manager since October 1990.
JAMES WINDELS, Treasurer since November 2001.
Director – Mutual Fund Accounting of the Manager, and an officer of 77 investment companies (comprised of 195 portfolios) managed by the Manager. He is 52 years old and has been an employee of the Manager since April 1985.
RICHARD CASSARO, Assistant Treasurer since January 2008.
Senior Accounting Manager – Money Market and Municipal Bond Funds of the Manager, and an officer of 77 investment companies (comprised of 195 portfolios) managed by the Manager. He is 51 years old and has been an employee of the Manager since September 1982.
GAVIN C. REILLY, Assistant Treasurer since December 2005.
Tax Manager of the Investment Accounting and Support Department of the Manager, and an officer of 77 investment companies (comprised of 195 portfolios) managed by the Manager. He is 42 years old and has been an employee of the Manager since April 1991.
ROBERT ROBOL, Assistant Treasurer since August 2005.
Senior Accounting Manager – Fixed Income Funds of the Manager, and an officer of 77 investment companies (comprised of 195 portfolios) managed by the Manager. He is 46 years old and has been an employee of the Manager since October 1988.
ROBERT SALVIOLO, Assistant Treasurer since July 2007.
Senior Accounting Manager – Equity Funds of the Manager, and an officer of 77 investment companies (comprised of 195 portfolios) managed by the Manager. He is 43 years old and has been an employee of the Manager since June 1989.
46
ROBERT SVAGNA, Assistant Treasurer
since August 2005.
Senior Accounting Manager – Equity Funds of the Manager, and an officer of 77 investment companies (comprised of 195 portfolios) managed by the Manager. He is 43 years old and has been an employee of the Manager since November 1990.
JOSEPH W. CONNOLLY, Chief Compliance Officer since October 2004.
Chief Compliance Officer of the Manager and The Dreyfus Family of Funds (77 investment companies, comprised of 195 portfolios). From November 2001 through March 2004, Mr. Connolly was first Vice-President, Mutual Fund Servicing for Mellon Global Securities Services. In that capacity, Mr. Connolly was responsible for managing Mellon’s Custody, Fund Accounting and Fund Administration services to third-party mutual fund clients. He is 53 years old and has served in various capacities with the Manager since 1980, including manager of the firm’s Fund Accounting Department from 1997 through October 2001.
NATALIA GRIBAS, Anti-Money Laundering
Compliance Officer since July 2010.
Anti-Money Laundering Compliance Officer of the Distributor, and the Anti-Money Laundering Compliance Officer of 73 investment companies (comprised of 191 portfolios) managed by the Manager. She is 40 years old and has been an employee of the Distributor since September 2008.
TheFund 47
Save time. Save paper. View your next shareholder report online as soon as it’s available. Log into www.dreyfus.com and sign up for Dreyfus eCommunications. It’s simple and only takes a few minutes.
The views expressed in this report reflect those of the portfolio manager only through the end of the period covered and do not necessarily represent the views of Dreyfus or any other person in the Dreyfus organization. Any such views are subject to change at any time based upon market or other conditions and Dreyfus disclaims any responsibility to update such views.These views may not be relied on as investment advice and, because investment decisions for a Dreyfus fund are based on numerous factors, may not be relied on as an indication of trading intent on behalf of any Dreyfus fund.
Not FDIC-Insured • Not Bank-Guaranteed • May Lose Value
| | Contents |
| | THE FUND |
| 2 | A Letter from the Chairman and CEO |
| 3 | Discussion of Fund Performance |
| 6 | Fund Performance |
| 8 | Understanding Your Fund’s Expenses |
| 8 | Comparing Your Fund’s Expenses With Those of Other Funds |
| 9 | Statement of Investments |
| 14 | Statement of Assets and Liabilities |
| 15 | Statement of Operations |
| 16 | Statement of Changes in Net Assets |
| 18 | Financial Highlights |
| 22 | Notes to Financial Statements |
| 34 | Report of Independent Registered Public Accounting Firm |
| 35 | Important Tax Information |
| 36 | Board Members Information |
| 39 | Officers of the Fund |
| | FOR MORE INFORMATION |
| | Back Cover |
Dreyfus
Small Cap Equity Fund
The Fund

A LETTER FROM THE CHAIRMAN AND CEO
Dear Shareholder:
This annual report for Dreyfus Small Cap Equity Fund covers the 12-month period from October 1, 2009, through September 30, 2010.
Although a double-dip recession remains an unlikely scenario in our analysis, recent uncertainty regarding the breadth and strength of the U.S. and global economic recoveries has led to bouts of weakness in some of the riskier asset classes, including U.S. stocks, offsetting gains achieved earlier in the reporting period.The spending power of consumers, long an important economic catalyst, has been diminished by concerns over job security and an inability to generate cash from the equity in their homes.The second major driver of sustainable growth, corporate investment, also has been stunted, as a continuing lack of credit thwarts business development.
Uncertainty will probably remain in the broader financial markets until we see a persistent improvement in economic growth; but we currently are optimistic regarding the prospects for equities. Higher-quality companies with healthy balance sheets, higher credit ratings and strong cash flows are currently priced at a discount, in our view. However, we continue to believe that selectivity will be a key to success in the stock market, as investors appear set to potentially reward fundamentally sound companies relative to those with questionable financial profiles and business strategies. During these market conditions, we suggest that you meet with your financial advisor regularly to review your investments in today’s slow-growth economic environment as well as your needs, goals and attitudes toward risk.
For information about how the fund performed during the reporting period, as well as general market perspectives, we provide a Discussion of Fund Performance on the pages that follow.
Thank you for your continued confidence and support.

Jonathan R. Baum
Chairman and Chief Executive Officer
The Dreyfus Corporation
October 15, 2010
2

DISCUSSION OF FUND PERFORMANCE
For the period of October 1, 2009, through September 30, 2010, as provided by Joseph M. Corrado, CFA, Stephanie K. Brandaleone, CFA, and Edward R.Walter, CFA, Portfolio Managers
Fund and Market Performance Overview
For the 12-month period ended September 30, 2010, Dreyfus Small Cap Equity Fund’s Class A shares produced a total return of 10.62%, Class B shares returned 9.73%, Class C shares returned 9.78% and Class I shares returned 10.94%.1 The fund’s benchmark, the Russell 2500 Value Index, achieved a total return of 14.74% for the same period.2
Economic uncertainties undermined stock prices over the second half of the reporting period, partly offsetting market gains achieved during an economic rebound over the first half.The fund’s returns lagged the benchmark, primarily due to shortfalls in the financials and energy sectors, which outweighed the fund’s achieved better-than-average results in the consumer discretionary sector.
The Fund’s Investment Approach
The fund seeks long-term growth of capital.The fund invests, under normal circumstances, at least 80% of its assets in the stocks of small-cap U.S. companies, and may invest up to 15% of its assets in foreign companies.
We seek to identify companies with stocks trading at prices below their intrinsic values.We measure value by evaluating each company’s valuation multiples (price/earnings, price/sales, price/cash flow), current competitive position and expected business growth relative to its industry.We focus primarily on individual stock selection to produce a diversified portfolio of companies that we believe are undervalued relative to expected business growth, with the presence of a catalyst (such as a corporate restructuring, change in management or spin-off) that may trigger a price increase.
Global Economic Concerns Intensified in 2010
The reporting period began in the midst of a sustained, but subpar, economic recovery as improved manufacturing activity and a rebound in corporate earnings helped boost confidence among businesses, con-
TheFund 3
DISCUSSION OF FUND PERFORMANCE (continued)
sumers and investors.The recovery appeared to gain additional traction early in 2010, when employment gains indicated that a stubbornly high unemployment rate might moderate.
In May, however, several developments threatened the U.S. and global economic rebounds. Europe was roiled by a sovereign debt crisis when Greece found itself unable to finance a heavy debt burden, requiring intervention from the International Monetary Fund and European Central Bank. Robust economic growth in China sparked local inflationary pressures, and investors worried that remedial measures might dampen a major engine of global growth. Mixed employment and housing data in the United States suggested that economic headwinds might constrain already mild domestic growth.As a result, stocks gave back many of their previous gains over the spring and summer. However, small-cap stocks generally produced higher returns than their large-cap counterparts.
Individual Holdings Produced Mixed Returns
In this changing market environment, the fund’s relative performance was undermined by disappointments in the financials sector, where lower trading volumes hurt institutional brokerage services firm Investment Technology Group. In the energy sector, a glut of supply and tepid demand constrained natural gas prices, undermining results from natural gas producers Cabot Oil & Gas, Comstock Resources and PennVirginia. We had maintained underweighted exposure to the materials sector in light of rich valuations, but metals-and-mining companies gained value as global investors refocused on companies poised to benefit from above-trend growth in the emerging markets. Disappointing stock selections and underweighted exposure to the utilities sector also hurt the fund’s results compared to its benchmark.
The fund achieved better results in the consumer discretionary sector, which encountered heightened volatility during the reporting period. The worldwide recovery of car and truck sales boosted earnings for automotive components manufacturers, including BorgWarner, Magna International and Autoliv.Among retailers,Williams-Sonoma continues to successfully integrate its “brick-and-mortar” stores with an expanded catalog and online presence. Apparel seller Abercrombie & Fitch saw improved store traffic, as did farm supplies chain Tractor Supply.
4
Positioned for a More Selective Market Environment
Although the U.S. and global economies have hit a rough patch, we do not currently expect a return to recession. Indeed, corporations now have record amounts of cash on their balance sheets, and profits in some industries have returned to pre-recession levels. However, it appears that the economic recovery will remain weaker than historical averages, with a number of uncertainties—such as tax policy, currency movements and geopolitical developments—likely to challenge investor sentiment.
In such an environment, we believe that investors will become more selective, favoring attractively valued companies with the ability to grow in a slow economy, and avoiding those with weaker underlying business fundamentals. Consequently, we have maintained overweighted exposure to the health care and consumer discretionary sectors, where valuations are relatively attractive. Although we have maintained a market neutral weighting in the financials sector, we have found a number of opportunities among dividend-paying real estate investment trusts, which could benefit as income-oriented investors seek higher yielding alternatives in a low interest-rate environment.
October 15, 2010
| |
| | Please note: the position in any security highlighted in italicized typeface was sold during the |
| | reporting period. |
| | Equity funds are subject generally to market, market sector, market liquidity, issuer and investment |
| | style risks, among other factors, to varying degrees, all of which are more fully described in the |
| | fund’s prospectus. |
| | Small companies carry additional risks because their earnings and revenues tend to be less |
| | predictable, and their share prices more volatile than those of larger, more established companies. |
| | The shares of smaller companies tend to trade less frequently than those of larger, more established |
| | companies, which can adversely affect the pricing of these securities and the fund’s ability to sell |
| | these securities. |
| 1 | Total return includes reinvestment of dividends and any capital gains paid, and does not take into |
| | consideration the maximum initial sales charge in the case of Class A shares, or the applicable |
| | contingent deferred sales charges imposed on redemptions in the case of Class B and Class C |
| | shares. Had these charges been reflected, returns would have been lower. Past performance is no |
| | guarantee of future results. Share price and investment return fluctuate such that upon redemption, |
| | fund shares may be worth more or less than their original cost. Return figures provided reflect the |
| | absorption of certain fund expenses by The Dreyfus Corporation and The Boston Company Asset |
| | Management, LLC. Had these expenses not been absorbed, returns would have been lower. |
| 2 | SOURCE: LIPPER INC. — Reflects the reinvestment of dividends and, where applicable, |
| | capital gain distributions.The Russell 2500 Value Index is a widely accepted, unmanaged index, |
| | which measures the performance of those Russell 2500 companies with lower price-to-book ratios |
| | and lower forecasted growth value. |
TheFund 5
FUND PERFORMANCE

|
| † Source: Lipper Inc. |
| Past performance is not predictive of future performance. |
| The above graph compares a $10,000 investment made in Class A, Class B, Class C and Class I shares of Dreyfus |
| Small Cap Equity Fund on 9/30/00 to a $10,000 investment made in the Russell 2500 Value Index (the “Index”) |
| on that date.All dividends and capital gain distributions are reinvested. |
| Prior to 8/1/07, the fund invested its assets in a “master portfolio” that had the same investment objective and |
| policies as the fund. This master/feeder arrangement was terminated on 8/1/07 and the fund operates as a |
| stand alone fund. Performance information represents the performance of the predecessor master portfolio (and its |
| predecessor fund) and the expenses of the master portfolio’s predecessor fund through January 31, 2003, and the |
| fund’s performance and expense structure thereafter. The master portfolio’s predecessor fund contributed all of its |
| assets to the master portfolio before the fund commenced investment operations on 2/1/03. |
| The fund’s performance shown in the line graph takes into account the maximum initial sales charge on Class A shares |
| and all other applicable fees and expenses on all classes. Performance for each share class will vary from the performance of |
| the fund’s other share classes due to differences in charges and expenses. Performance for Class B shares assumes the |
| conversion of Class B shares to Class A shares at the end of the sixth year following the date of purchase.The Index is an |
| unmanaged index which measures the performance of those Russell 2500 companies with lower price-to-book ratios and |
| lower forecasted growth values. Unlike a mutual fund, the Index is not subject to charges, fees and other expenses. Investors |
| cannot invest directly in any index. Further information relating to fund performance, including expense reimbursements, if |
| applicable, is contained in the Financial Highlights section of the prospectus and elsewhere in this report. |
6
| | | |
| Average Annual Total Returns as of 9/30/10 | | |
| |
| | 1 Year | 5 Years | 10 Years |
| Class A shares | | | |
| with maximum sales charge (5.75%) | 4.27% | 0.62% | 8.41% |
| without sales charge | 10.62% | 1.82% | 9.06% |
| Class B shares | | | |
| with applicable redemption charge † | 5.73% | 0.70% | 8.75% |
| without redemption | 9.73% | 1.03% | 8.75% |
| Class C shares | | | |
| with applicable redemption charge †† | 8.78% | 1.05% | 8.42% |
| without redemption | 9.78% | 1.05% | 8.42% |
| Class I shares | 10.94% | 2.13% | 9.29% |
| Russell 2500 Value Index | 14.74% | 1.38% | 8.02% |
| |
| Past performance is not predictive of future performance.The fund’s performance shown in the graph and table does not |
| reflect the deduction of taxes that a shareholder would pay on fund distributions or the redemption of fund shares. |
| † | The maximum contingent deferred sales charge for Class B shares is 4%.After six years Class B shares convert to |
| | Class A shares. |
| †† | The maximum contingent deferred sales charge for Class C shares is 1% for shares redeemed within one year of the |
| | date of purchase. |
TheFund 7
UNDERSTANDING YOUR FUND’S EXPENSES (Unaudited)
As a mutual fund investor, you pay ongoing expenses, such as management fees and other expenses. Using the information below, you can estimate how these expenses affect your investment and compare them with the expenses of other funds.You also may pay one-time transaction expenses, including sales charges (loads) and redemption fees, which are not shown in this section and would have resulted in higher total expenses. For more information, see your fund’s prospectus or talk to your financial adviser.
Review your fund’s expenses
The table below shows the expenses you would have paid on a $1,000 investment in Dreyfus Small Cap Equity Fund from April 1, 2010 to September 30, 2010. It also shows how much a $1,000 investment would be worth at the close of the period, assuming actual returns and expenses.
| | | | |
| Expenses and Value of a $1,000 Investment | | | |
| assuming actual returns for the six months ended September 30, 2010 | | |
| | Class A | Class B | Class C | Class I |
| Expenses paid per $1,000† | $ 6.91 | $ 11.02 | $ 10.97 | $ 5.57 |
| Ending value (after expenses) | $984.00 | $979.80 | $979.80 | $985.00 |
|
| COMPARING YOUR FUND’S EXPENSES |
| WITH THOSE OF OTHER FUNDS (Unaudited) |
Using the SEC’s method to compare expenses
The Securities and Exchange Commission (SEC) has established guidelines to help investors assess fund expenses. Per these guidelines, the table below shows your fund’s expenses based on a $1,000 investment, assuming a hypothetical 5% annualized return. You can use this information to compare the ongoing expenses (but not transaction expenses or total cost) of investing in the fund with those of other funds.All mutual fund shareholder reports will provide this information to help you make this comparison. Please note that you cannot use this information to estimate your actual ending account balance and expenses paid during the period.
| | | | |
| Expenses and Value of a $1,000 Investment | | | |
| assuming a hypothetical 5% annualized return for the six months ended September 30, 2010 |
| | Class A | Class B | Class C | Class I |
| Expenses paid per $1,000† | $ 7.03 | $ 11.21 | $ 11.16 | $ 5.67 |
| Ending value (after expenses) | $1,018.10 | $1,013.94 | $1,013.99 | $1,019.45 |
† Expenses are equal to the fund’s annualized expense ratio of 1.39% for Class A, 2.22% for Class B, 2.21% for Class C and 1.12% for Class I, multiplied by the average account value over the period, multiplied by 183/365 (to reflect the one-half year period).
8
|
| STATEMENT OF INVESTMENTS |
| September 30, 2010 |
| | | |
| Common Stocks—99.5% | Shares | | Value ($) |
| Consumer Discretionary—13.7% | | | |
| Abercrombie & Fitch, Cl. A | 35,600 | | 1,399,792 |
| American Eagle Outfitters | 94,880 | | 1,419,405 |
| BorgWarner | 25,615 a,b | 1,347,861 |
| Gentex | 43,340 | | 845,563 |
| Gymboree | 8,000 b | 332,320 |
| Herman Miller | 43,090 | | 848,011 |
| Jack in the Box | 53,350 b | 1,143,824 |
| Leggett & Platt | 58,340 | | 1,327,818 |
| MDC Holdings | 38,800 | | 1,126,364 |
| Meredith | 50,750 a | 1,690,483 |
| Nordstrom | 36,200 | | 1,346,640 |
| OfficeMax | 155,490 b | 2,035,364 |
| Ryland Group | 96,710 | | 1,733,043 |
| Talbots | 125,220 a,b | 1,640,382 |
| Thor Industries | 38,030 | | 1,270,202 |
| Toll Brothers | 74,020 b | 1,407,860 |
| Williams-Sonoma | 58,930 | | 1,868,081 |
| | | | 22,783,013 |
| Consumer Staples—2.5% | | | |
| BJ’s Wholesale Club | 35,430 | b | 1,470,345 |
| Flowers Foods | 43,580 | | 1,082,527 |
| Whole Foods Market | 42,996 | b | 1,595,582 |
| | | | 4,148,454 |
| Energy—7.9% | | | |
| Cabot Oil & Gas | 84,396 | | 2,541,164 |
| Comstock Resources | 57,160 b | 1,285,528 |
| Frontier Oil | 127,400 | | 1,707,160 |
| McDermott International | 86,540 | b | 1,279,061 |
| Oceaneering International | 31,360 | b | 1,689,050 |
| Penn Virginia | 66,240 | | 1,062,490 |
| Tidewater | 38,340 | | 1,718,015 |
| Unit | 50,930 b | 1,899,180 |
| | | | 13,181,648 |
TheFund 9
STATEMENT OF INVESTMENTS (continued)
| | | |
| Common Stocks (continued) | Shares | | Value ($) |
| Exchange Traded Funds—.6% | | | |
| iShares Russell 2000 Value Index Fund | 16,090 | a | 997,419 |
| Financial—31.3% | | | |
| Aspen Insurance Holdings | 41,260 | | 1,249,353 |
| Associated Banc-Corp | 123,200 | | 1,625,008 |
| BioMed Realty Trust | 94,860 c | 1,699,891 |
| Brandywine Realty Trust | 86,680 | c | 1,061,830 |
| CBL & Associates Properties | 110,500 c | 1,443,130 |
| City National | 56,957 | | 3,022,708 |
| Comerica | 43,480 | | 1,615,282 |
| DiamondRock Hospitality | 158,316 | b,c | 1,502,419 |
| E*TRADE Financial | 182,882 | b | 2,659,104 |
| Entertainment Properties Trust | 23,750 | c | 1,025,525 |
| Fidelity National Financial, Cl. A | 158,244 | | 2,486,013 |
| First American Financial | 136,800 | | 2,043,792 |
| First Horizon National | 158,494 | b | 1,808,416 |
| Hanover Insurance Group | 34,130 | | 1,604,110 |
| Hospitality Properties Trust | 77,710 | c | 1,735,264 |
| Investment Technology Group | 76,422 | b | 1,086,721 |
| KeyCorp | 190,240 | | 1,514,310 |
| Kilroy Realty | 33,050 c | 1,095,277 |
| LaSalle Hotel Properties | 53,890 c | 1,260,487 |
| Lexington Realty Trust | 265,910 a,c | 1,903,916 |
| Liberty Property Trust | 44,220 c | 1,410,618 |
| Mack-Cali Realty | 38,130 | c | 1,247,232 |
| Marshall & Ilsley | 241,190 | | 1,697,978 |
| MGIC Investment | 295,870 b | 2,730,880 |
| Omega Healthcare Investors | 60,160 | c | 1,350,592 |
| Protective Life | 55,300 | | 1,203,328 |
| Radian Group | 175,790 | | 1,374,678 |
| Raymond James Financial | 64,240 | | 1,627,199 |
| SEI Investments | 82,820 | | 1,684,559 |
| SVB Financial Group | 41,510 | b | 1,756,703 |
| Washington Federal | 105,500 | | 1,609,930 |
| Wilmington Trust | 117,476 | | 1,054,934 |
| | | | 52,191,187 |
10
| | | |
| Common Stocks (continued) | Shares | | Value ($) |
| Health Care—9.8% | | | |
| AMERIGROUP | 50,390 b | 2,140,063 |
| Beckman Coulter | 29,030 | | 1,416,374 |
| Chemed | 28,840 | | 1,643,015 |
| Emergency Medical Services, Cl. A | 15,950 | b | 849,338 |
| Haemonetics | 36,150 b | 2,115,860 |
| LifePoint Hospitals | 42,530 | b | 1,491,102 |
| Mednax | 31,970 b | 1,704,001 |
| RehabCare Group | 56,580 b | 1,144,048 |
| STERIS | 70,570 | | 2,344,335 |
| Universal Health Services, Cl. B | 37,200 | | 1,445,592 |
| | | | 16,293,728 |
| Industrial—12.5% | | | |
| AGCO | 45,190 b | 1,762,862 |
| Alliant Techsystems | 16,070 b | 1,211,678 |
| Atlas Air Worldwide Holdings | 15,200 | b | 764,560 |
| Babcock and Wilcox | 52,430 | b | 1,115,710 |
| Brink’s | 76,270 | | 1,754,210 |
| Clean Harbors | 30,071 | b | 2,037,310 |
| Corrections Corp. of America | 89,460 b | 2,207,873 |
| FTI Consulting | 77,820 | b | 2,699,576 |
| Granite Construction | 57,980 a | 1,318,465 |
| Shaw Group | 35,813 b | 1,201,884 |
| Snap-On | 37,050 | | 1,723,196 |
| Spirit Aerosystems Holdings, Cl. A | 104,150 | b | 2,075,710 |
| Thomas & Betts | 24,300 b | 996,786 |
| | | | 20,869,820 |
| Information Technology—11.2% | | | |
| Arris Group | 85,100 b | 831,427 |
| Brocade Communications Systems | 371,790 b | 2,171,254 |
| Cadence Design Systems | 243,500 | b | 1,857,905 |
| CommScope | 53,330 b | 1,266,054 |
| CoreLogic | 136,800 | | 2,621,088 |
| Cymer | 38,030 b | 1,410,152 |
| Cypress Semiconductor | 80,040 b | 1,006,903 |
| Diebold | 69,590 | | 2,163,553 |
TheFund 11
STATEMENT OF INVESTMENTS (continued)
| | |
| Common Stocks (continued) | Shares | Value ($) |
| Information Technology (continued) | | |
| Electronic Arts | 77,360 b | 1,271,025 |
| QLogic | 18,850 b | 332,514 |
| Synopsys | 69,505 b | 1,721,639 |
| Tekelec | 69,410 b | 899,554 |
| Websense | 67,270 b | 1,193,370 |
| | | 18,746,438 |
| Materials—4.4% | | |
| Allegheny Technologies | 23,310 a | 1,082,749 |
| Coeur d’Alene Mines | 101,190 a,b | 2,015,705 |
| Domtar | 22,330 | 1,442,071 |
| Louisiana-Pacific | 156,960 b | 1,188,187 |
| Sonoco Products | 48,920 | 1,635,885 |
| | | 7,364,597 |
| Utilities—5.6% | | |
| AGL Resources | 32,160 | 1,233,658 |
| Atmos Energy | 41,180 | 1,204,515 |
| Energen | 36,324 | 1,660,733 |
| Great Plains Energy | 85,750 | 1,620,675 |
| MDU Resources Group | 82,230 | 1,640,489 |
| UGI | 69,410 | 1,985,820 |
| | | 9,345,890 |
| Total Common Stocks | | |
| (cost $158,300,823) | | 165,922,194 |
| |
| Other Investment—2.2% | | |
| Registered Investment Company; | | |
| Dreyfus Institutional Preferred | | |
| Plus Money Market Fund | | |
| (cost $3,687,000) | 3,687,000 d | 3,687,000 |
12
| | |
| Investment of Cash Collateral | | |
| for Securities Loaned—3.7% | Shares | Value ($) |
| Registered Investment Company; | | |
| Dreyfus Institutional Cash | | |
| Advantage Fund | | |
| (cost $6,182,982) | 6,182,982 d | 6,182,982 |
| |
| Total Investments (cost $168,170,805) | 105.4% | 175,792,176 |
| Liabilities, Less Cash and Receivables | (5.4%) | (8,951,580) |
| Net Assets | 100.0% | 166,840,596 |
|
| a Security, or portion thereof, on loan.At September 30, 2010, the market value of the fund’s securities on loan was |
| $5,783,060 and the market value of the collateral held by the fund was $6,182,982. |
| b Non-income producing security. |
| c Investment in real estate investment trust. |
| d Investment in affiliated money market mutual fund. |
| | | |
| Portfolio Summary (Unaudited)† | | |
| |
| | Value (%) | | Value (%) |
| Financial | 31.3 | Money Market Investments | 5.9 |
| Consumer Discretionary | 13.7 | Utilities | 5.6 |
| Industrial | 12.5 | Materials | 4.4 |
| Information Technology | 11.2 | Consumer Staples | 2.5 |
| Health Care | 9.8 | Exchange Traded Funds | .6 |
| Energy | 7.9 | | 105.4 |
| |
| † Based on net assets. | | | |
| See notes to financial statements. | | | |
TheFund 13
|
| STATEMENT OF ASSETS AND LIABILITIES |
| September 30, 2010 |
| | | | |
| | | | Cost | Value |
| Assets ($): | | | | |
| Investments in securities—See Statement of Investments (including | | |
| securities on loan, valued at $5,783,060)—Note 1(b): | | |
| Unaffiliated issuers | | | 158,300,823 | 165,922,194 |
| Affiliated issuers | | | 9,869,982 | 9,869,982 |
| Cash | | | | 21,048 |
| Receivable for investment securities sold | | | 1,853,721 |
| Dividends and interest receivable | | | | 205,178 |
| Receivable for shares of Beneficial Interest subscribed | | 196,177 |
| Prepaid expenses | | | | 16,974 |
| | | | | 178,085,274 |
| Liabilities ($): | | | | |
| Due to The Boston Company Asset | | | | |
| Management, LLC and affiliates—Note 3(c) | | | 164,259 |
| Liability for securities on loan—Note 1(b) | | | 6,182,982 |
| Payable for investment securities purchased | | | 4,622,705 |
| Payable for shares of Beneficial Interest redeemed | | | 154,806 |
| Accrued expenses | | | | 119,926 |
| | | | | 11,244,678 |
| Net Assets ($) | | | | 166,840,596 |
| Composition of Net Assets ($): | | | | |
| Paid-in capital | | | | 177,324,229 |
| Accumulated undistributed investment income—net | | | 51,289 |
| Accumulated net realized gain (loss) on investments | | | (18,156,293) |
| Accumulated net unrealized appreciation | | | |
| (depreciation) on investments | | | | 7,621,371 |
| Net Assets ($) | | | | 166,840,596 |
| |
| |
| Net Asset Value Per Share | | | | |
| | Class A | Class B | Class C | Class I |
| Net Assets ($) | 61,796,047 | 1,829,010 | 14,436,367 | 88,779,172 |
| Shares Outstanding | 2,449,333 | 76,887 | 606,620 | 3,452,695 |
| Net Asset Value Per Share ($) | 25.23 | 23.79 | 23.80 | 25.71 |
| |
| See notes to financial statements. | | | | |
14
|
| STATEMENT OF OPERATIONS |
| Year Ended September 30, 2010 |
| |
| Investment Income ($): | |
| Income: | |
| Cash dividends: | |
| Unaffiliated issuers | 2,188,743 |
| Affiliated issuers | 3,774 |
| Income from securities lending—Note 1(b) | 14,077 |
| Total Income | 2,206,594 |
| Expenses: | |
| Investment advisory fee—Note 3(a) | 1,277,737 |
| Administration fee—Note 3(a) | 159,717 |
| Shareholder servicing costs—Note 3(c) | 547,482 |
| Distribution fees—Note 3(b) | 129,439 |
| Registration fees | 63,275 |
| Professional fees | 53,872 |
| Prospectus and shareholders’ reports | 32,276 |
| Custodian fees—Note 3(c) | 30,256 |
| Trustees’ fees and expenses—Note 3(d) | 12,892 |
| Loan commitment fees—Note 2 | 2,488 |
| Miscellaneous | 7,252 |
| Total Expenses | 2,316,686 |
| Less—reduction in investment advisory fee | |
| due to undertaking—Note 3(a) | (177,610) |
| Less—reduction in fees due to earnings credits—Note 3(c) | (475) |
| Net Expenses | 2,138,601 |
| Investment Income—Net | 67,993 |
| Realized and Unrealized Gain (Loss) on Investments—Note 4 ($): | |
| Net realized gain (loss) on investments | 22,696,308 |
| Net realized gain (loss) on financial futures | 335,675 |
| Net Realized Gain (Loss) | 23,031,983 |
| Net unrealized appreciation (depreciation) on investments | (7,459,580) |
| Net unrealized appreciation (depreciation) on financial futures | (18,302) |
| Net Unrealized Appreciation (Depreciation) | (7,477,882) |
| Net Realized and Unrealized Gain (Loss) on Investments | 15,554,101 |
| Net Increase in Net Assets Resulting from Operations | 15,622,094 |
| |
| See notes to financial statements. | |
TheFund 15
STATEMENT OF CHANGES IN NET ASSETS
| | |
| | Year Ended September 30, |
| | 2010 | 2009a |
| Operations ($): | | |
| Investment income—net | 67,993 | 337,286 |
| Net realized gain (loss) on investments | 23,031,983 | (26,449,377) |
| Net unrealized appreciation | | |
| (depreciation) on investments | (7,477,882) | 35,454,708 |
| Net Increase (Decrease) in Net Assets | | |
| Resulting from Operations | 15,622,094 | 9,342,617 |
| Dividends to Shareholders from ($): | | |
| Investment income—net: | | |
| Class A Shares | (88,816) | (120,349) |
| Class I Shares | (198,201) | (275,812) |
| Class T Shares | — | (238) |
| Total Dividends | (287,017) | (396,399) |
| Beneficial Interest Transactions ($): | | |
| Net proceeds from shares sold: | | |
| Class A Shares | 16,039,523 | 24,791,503 |
| Class B Shares | 39,206 | 364,028 |
| Class C Shares | 2,895,429 | 2,377,226 |
| Class I Shares | 35,453,503 | 41,253,595 |
| Class T Shares | — | 120,735 |
| Net assets received in connection | | |
| with reorganization—Note 1 | — | 32,798,090 |
| Dividends reinvested: | | |
| Class A Shares | 80,196 | 103,640 |
| Class I Shares | 180,584 | 261,102 |
| Class T Shares | — | 82 |
| Cost of shares redeemed: | | |
| Class A Shares | (20,845,276) | (20,706,588) |
| Class B Shares | (2,537,596) | (1,661,951) |
| Class C Shares | (3,835,634) | (1,965,146) |
| Class I Shares | (22,839,693) | (14,602,949) |
| Class T Shares | — | (931,003) |
| Increase (Decrease) in Net Assets from | | |
| Beneficial Interest Transactions | 4,630,242 | 62,202,364 |
| Total Increase (Decrease) in Net Assets | 19,965,319 | 71,148,582 |
| Net Assets ($): | | |
| Beginning of Period | 146,875,277 | 75,726,695 |
| End of Period | 166,840,596 | 146,875,277 |
| Undistributed investment income—net | 51,289 | 288,989 |
16
| | |
| | Year Ended September 30, |
| | 2010 | 2009a |
| Capital Share Transactions: | | |
| Class Ab,c | | |
| Shares sold | 671,738 | 1,305,352 |
| Shares issued in connection with reorganization—Note 1 | — | 1,332,718 |
| Shares issued for dividends reinvested | 3,420 | 6,036 |
| Shares redeemed | (853,858) | (1,137,947) |
| Net Increase (Decrease) in Shares Outstanding | (178,700) | 1,506,159 |
| Class Bb | | |
| Shares sold | 1,730 | 20,104 |
| Shares issued in connection with reorganization—Note 1 | — | 190,814 |
| Shares redeemed | (111,670) | (92,112) |
| Net Increase (Decrease) in Shares Outstanding | (109,940) | 118,806 |
| Class C | | |
| Shares sold | 126,667 | 128,685 |
| Shares issued in connection with reorganization—Note 1 | — | 346,893 |
| Shares redeemed | (167,332) | (110,444) |
| Net Increase (Decrease) in Shares Outstanding | (40,665) | 365,134 |
| Class I | | |
| Shares sold | 1,408,098 | 2,063,095 |
| Shares issued in connection with reorganization—Note 1 | — | 38,901 |
| Shares issued for dividends reinvested | 7,553 | 15,014 |
| Shares redeemed | (921,316) | (743,043) |
| Net Increase (Decrease) in Shares Outstanding | 494,335 | 1,373,967 |
| Class Tc | | |
| Shares sold | — | 6,977 |
| Shares issued in connection with reorganization—Note 1 | — | 18,224 |
| Shares issued for dividends reinvested | — | 5 |
| Shares redeemed | — | (54,481) |
| Net Increase (Decrease) in Shares Outstanding | — | (29,275) |
a Effective as of the close of business on February 4, 2009, the fund no longer offers Class T shares. b During the period ended September 30, 2010, 57,789 Class B shares representing $1,310,216 were automatically converted to 54,458 Class A shares and during the period ended September 30, 2009, 27,885 Class B shares representing $515,149 were automatically converted to 26,557 Class A shares. c On the close of business on February 4, 2009, 43,698 Class T shares repres enting $740,237 were converted to 42,937 Class A shares.
See notes to financial statements.
TheFund 17
FINANCIAL HIGHLIGHTS
The following tables describe the performance for each share class for the fiscal periods indicated.All information (except portfolio turnover rate) reflects financial results for a single fund share.Total return shows how much your investment in the fund would have increased (or decreased) during each period, assuming you had reinvested all dividends and distributions.These figures have been derived from the fund’s financial statements.
| | | | | |
| | | Year Ended September 30, | |
| Class A Shares | 2010 | 2009 | 2008 | 2007 | 2006 |
| Per Share Data ($): | | | | | |
| Net asset value, beginning of period | 22.84 | 24.48 | 32.64 | 30.49 | 27.89 |
| Investment Operations: | | | | | |
| Investment income (loss)—neta | (.00)b | .07 | .19 | .02 | .00b |
| Net realized and unrealized | | | | | |
| gain (loss) on investments | 2.42 | (1.60) | (4.61) | 3.02 | 3.31 |
| Total from Investment Operations | 2.42 | (1.53) | (4.42) | 3.04 | 3.31 |
| Distributions: | | | | | |
| Dividends from investment income—net | (.03) | (.11) | — | — | — |
| Dividends from net realized | | | | | |
| gain on investments | — | — | (3.74) | (.89) | (.71) |
| Total Distributions | (.03) | (.11) | (3.74) | (.89) | (.71) |
| Net asset value, end of period | 25.23 | 22.84 | 24.48 | 32.64 | 30.49 |
| Total Return (%)c | 10.62 | (6.11) | (14.59) | 10.00 | 12.15 |
| Ratios/Supplemental Data (%): | | | | | |
| Ratio of total expenses | | | | | |
| to average net assets | 1.59 | 1.72 | 1.56 | 1.50d | 1.60d |
| Ratio of net expenses | | | | | |
| to average net assets | 1.38 | 1.37 | 1.39 | 1.45d | 1.35d |
| Ratio of net investment income | | | | | |
| (loss) to average net assets | (.00)e | .35 | .72 | .06d | .01d |
| Portfolio Turnover Rate | 78.90 | 110.88 | 92.67 | 66.82f,g | — |
| Net Assets, end of period ($ x 1,000) | 61,796 | 60,030 | 27,467 | 41,784 | 41,006 |
| |
| a | Based on average shares outstanding at each month end. |
| b | Amount represents less than $.01 per share. |
| c | Exclusive of sales charge. |
| d | For the period from October 1, 2006 to July 31, 2007 and for the fiscal year ended September 30, 2006, the |
| | ratios include the fund’s share of The Boston Company Small Cap Value Portfolio’s (the “Portfolio”) allocated |
| | income and expenses. |
| e | Amount represents less than .01%. |
| f | Not annualized. |
| g | For the period from October 1, 2005 to July 31, 2007, the fund invested exclusively in the Portfolio under a |
| | master/feeder organizational structure that was terminated on August 1, 2007. On that date, the fund withdrew |
| | entirely from the Portfolio and received the Portfolio’s securities and cash in exchange for its interest in the Portfolio. |
| | Effective August 1, 2007, the fund began investing directly in the securities in which the Portfolio had invested. |
| | Portfolio turnover represents investment activity of the fund. |
| See notes to financial statements. |
18
| | | | | |
| | | Year Ended September 30, | |
| Class B Shares | 2010 | 2009 | 2008 | 2007 | 2006 |
| Per Share Data ($): | | | | | |
| Net asset value, beginning of period | 21.68 | 23.23 | 31.41 | 29.63 | 27.32 |
| Investment Operations: | | | | | |
| Investment (loss)—neta | (.18) | (.10) | (.04) | (.26) | (.22) |
| Net realized and unrealized | | | | | |
| gain (loss) on investments | 2.29 | (1.45) | (4.40) | 2.93 | 3.24 |
| Total from Investment Operations | 2.11 | (1.55) | (4.44) | 2.67 | 3.02 |
| Distributions: | | | | | |
| Dividends from net realized | | | | | |
| gain on investments | — | — | (3.74) | (.89) | (.71) |
| Net asset value, end of period | 23.79 | 21.68 | 23.23 | 31.41 | 29.63 |
| Total Return (%)b | 9.73 | (6.67) | (15.32) | 9.05 | 11.33 |
| Ratios/Supplemental Data (%): | | | | | |
| Ratio of total expenses | | | | | |
| to average net assets | 2.75 | 2.72 | 2.53 | 2.41c | 2.46c |
| Ratio of net expenses | | | | | |
| to average net assets | 2.21 | 2.22 | 2.24 | 2.34c | 2.10c |
| Ratio of net investment (loss) | | | | | |
| to average net assets | (.81) | (.54) | (.14) | (.83)c | (.77)c |
| Portfolio Turnover Rate | 78.90 | 110.88 | 92.67 | 66.82d,e | — |
| Net Assets, end of period ($ x 1,000) | 1,829 | 4,051 | 1,580 | 2,740 | 3,155 |
| |
| a | Based on average shares outstanding at each month end. |
| b | Exclusive of sales charge. |
| c | For the period from October 1, 2006 to July 31, 2007 and for the fiscal year ended September 30, 2006, the |
| | ratios include the fund’s share of The Boston Company Small Cap Value Portfolio’s (the “Portfolio”) allocated |
| | income and expenses. |
| d | Not annualized. |
| e | For the period from October 1, 2005 to July 31, 2007, the fund invested exclusively in the Portfolio under a |
| | master/feeder organizational structure that was terminated on August 1, 2007. On that date, the fund withdrew |
| | entirely from the Portfolio and received the Portfolio’s securities and cash in exchange for its interest in the Portfolio. |
| | Effective August 1, 2007, the fund began investing directly in the securities in which the Portfolio had invested. |
| | Portfolio turnover represents investment activity of the fund. |
| See notes to financial statements. |
TheFund 19
FINANCIAL HIGHLIGHTS (continued)
| | | | | |
| | | Year Ended September 30, | |
| Class C Shares | 2010 | 2009 | 2008 | 2007 | 2006 |
| Per Share Data ($): | | | | | |
| Net asset value, beginning of period | 21.69 | 23.23 | 31.41 | 29.60 | 27.32 |
| Investment Operations: | | | | | |
| Investment (loss)—neta | (.19) | (.09) | (.03) | (.24) | (.21) |
| Net realized and unrealized | | | | | |
| gain (loss) on investments | 2.30 | (1.45) | (4.41) | 2.94 | 3.20 |
| Total from Investment Operations | 2.11 | (1.54) | (4.44) | 2.70 | 2.99 |
| Distributions: | | | | | |
| Dividends from net realized | | | | | |
| gain on investments | — | — | (3.74) | (.89) | (.71) |
| Net asset value, end of period | 23.80 | 21.69 | 23.23 | 31.41 | 29.60 |
| Total Return (%)b | 9.78 | (6.67) | (15.29) | 9.13 | 11.26 |
| Ratios/Supplemental Data (%): | | | | | |
| Ratio of total expenses | | | | | |
| to average net assets | 2.24 | 2.40 | 2.36 | 2.29c | 2.46c |
| Ratio of net expenses | | | | | |
| to average net assets | 2.20 | 2.20 | 2.22 | 2.25c | 2.10c |
| Ratio of net investment (loss) | | | | | |
| to average net assets | (.81) | (.48) | (.11) | (.74)c | (.75)c |
| Portfolio Turnover Rate | 78.90 | 110.88 | 92.67 | 66.82d,e | — |
| Net Assets, end of period ($ x 1,000) | 14,436 | 14,037 | 6,556 | 9,713 | 11,042 |
| |
| a | Based on average shares outstanding at each month end. |
| b | Exclusive of sales charge. |
| c | For the period from October 1, 2006 to July 31, 2007 and for the fiscal year ended September 30, 2006, the |
| | ratios include the fund’s share of The Boston Company Small Cap Value Portfolio’s (the “Portfolio”) allocated |
| | income and expenses. |
| d | Not annualized. |
| e | For the period from October 1, 2005 to July 31, 2007, the fund invested exclusively in the Portfolio under a |
| | master/feeder organizational structure that was terminated on August 1, 2007. On that date, the fund withdrew |
| | entirely from the Portfolio and received the Portfolio’s securities and cash in exchange for its interest in the Portfolio. |
| | Effective August 1, 2007, the fund began investing directly in the securities in which the Portfolio had invested. |
| | Portfolio turnover represents investment activity of the fund. |
| See notes to financial statements. |
20
| | | | | |
| | | Year Ended September 30, | |
| Class I Shares | 2010 | 2009 | 2008 | 2007a | 2006 |
| Per Share Data ($): | | | | | |
| Net asset value, beginning of period | 23.24 | 24.88 | 33.03 | 30.77 | 28.07 |
| Investment Operations: | | | | | |
| Investment income—netb | .07 | .13 | .25 | .11 | .06 |
| Net realized and unrealized | | | | | |
| gain (loss) on investments | 2.47 | (1.60) | (4.66) | 3.04 | 3.35 |
| Total from Investment Operations | 2.54 | (1.47) | (4.41) | 3.15 | 3.41 |
| Distributions: | | | | | |
| Dividends from investment income—net | (.07) | (.17) | — | — | — |
| Dividends from net realized | | | | | |
| gain on investments | — | — | (3.74) | (.89) | (.71) |
| Total Distributions | (.07) | (.17) | (3.74) | (.89) | (.71) |
| Net asset value, end of period | 25.71 | 23.24 | 24.88 | 33.03 | 30.77 |
| Total Return (%) | 10.94 | (5.67) | (14.37) | 10.27 | 12.43 |
| Ratios/Supplemental Data (%): | | | | | |
| Ratio of total expenses | | | | | |
| to average net assets | 1.14 | 1.20 | 1.22 | 1.22c | 1.35c |
| Ratio of net expenses | | | | | |
| to average net assets | 1.11 | 1.13 | 1.15 | 1.19c | 1.10c |
| Ratio of net investment income | | | | | |
| to average net assets | .27 | .65 | .98 | .32c | .21c |
| Portfolio Turnover Rate | 78.90 | 110.88 | 92.67 | 66.82d,e | — |
| Net Assets, end of period ($ x 1,000) | 88,779 | 68,758 | 39,424 | 15,701 | 14,339 |
| |
| a | Effective June 1, 2007, Class R shares were redesignated as Class I shares. |
| b | Based on average shares outstanding at each month end. |
| c | For the period from October 1, 2006 to July 31, 2007 and for the fiscal year ended September 30, 2006, the |
| | ratios include the fund’s share of The Boston Company Small Cap Value Portfolio’s (the “Portfolio”) allocated |
| | income and expenses. |
| d | Not annualized. |
| e | For the period from October 1, 2005 to July 31, 2007, the fund invested exclusively in the Portfolio under a |
| | master/feeder organizational structure that was terminated on August 1, 2007. On that date, the fund withdrew |
| | entirely from the Portfolio and received the Portfolio’s securities and cash in exchange for its interest in the Portfolio. |
| | Effective August 1, 2007, the fund began investing directly in the securities in which the Portfolio had invested. |
| | Portfolio turnover represents investment activity of the fund. |
| See notes to financial statements. |
TheFund 21
NOTES TO FINANCIAL STATEMENTS
NOTE 1—Significant Accounting Policies:
Dreyfus Small Cap Equity Fund (the “fund”) is a separate diversified series of Dreyfus Stock Funds (the “Company”), which is registered under the Investment Company Act of 1940, as amended (the “Act”), as an open-end management investment company and operates as a series company currently offering two series, including the fund.The fund’s investment objective is to seek long-term growth of capital. The Boston Company Asset Management, LLC (“TBCAM”) serves as the fund’s investment adviser. The Dreyfus Corporation (the “Administrator” or “Dreyfus”), a wholly-owned subsidiary of The Bank of NewYork Mellon Corporation (“BNY Mellon”) and an affiliate of TBCAM, serves as the fund’s Administrator.
As of the close of business on December 15, 2008, pursuant to an Agreement and Plan of Reorganization previously approved by the fund’s Board of Trustees, all of the assets, subject to liabilities, of Dreyfus Premier Future Leaders Fund (“Premier Future Leaders”) were transferred to the fund in exchange for corresponding class of shares of Beneficial Interest of the fund of equal value. Shareholders of Class A, Class B, Class C, Class I and Class T shares of Premier Future Leaders received Class A, Class B, Class C, Class I and Class T shares of the fund, respectively, in each case in an amount equal to the aggregate net asset value of their investment in Premier Future Leaders at the time of the exchange.The net asset value of the fund’s shares on the close of business December 15, 2008, after the reorganization was $17.24 for Class A, $16.43 for Class B, $16.43 for Class C, $17.46 for Class I and $16.90 for Class T shares, and a total of 1,332,718 Class A shares, 190,814 Class B shares, 346,893 Class C shares, 38,901 Class I shares and 18,224 ClassT shares, representing net assets of $32,798,090 (including $17,212,916 net unrealized depreciation on investments) were issued to shareholders of Premier Future Leaders in the exchange. The exchange was a tax-free event to the Premier Future Leaders shareholders.
22
MBSC Securities Corporation (the “Distributor”), a wholly-owned subsidiary of Dreyfus, is the distributor of the fund’s shares.The fund is authorized to issue an unlimited number of $.001 par value shares of Beneficial Interest in each of the following classes of shares: Class A, Class B, Class C, and Class I. Class A shares are subject to a sales charge imposed at the time of purchase. Class B shares are subject to a contingent deferred sales charge (“CDSC”) imposed on Class B share redemptions made within six years of purchase and automatically convert to Class A shares after six years.The fund no longer offers Class B shares, except in connection with dividend reinvestment and permitted exchanges of Class B shares. Class C shares are subject to a CDSC imposed on Class C shares redeemed within one year of purchase. Class I shares are sold at net asset value per share only to institutiona l investors. Other differences between the classes include the services offered to and the expenses borne by each class, the allocation of certain transfer agency costs and certain voting rights. Income, expenses (other than expenses attributable to a specific class), and realized and unrealized gains or losses on investments are allocated to each class of shares based on its relative net assets.
The Company accounts separately for the assets, liabilities and operations of each series. Expenses directly attributable to each series are charged to that series’ operations; expenses which are applicable to all series are allocated among them on a pro rata basis.
The Financial Accounting Standards Board (“FASB”) Accounting Standards Codification (“ASC”) is the exclusive reference of authoritative U.S. generally accepted accounting principles (“GAAP”) recognized by the FASB to be applied by nongovernmental entities. Rules and interpretive releases of the Securities and Exchange Commission (“SEC”) under authority of federal laws are also sources of authoritative GAAP for SEC registrants. The fund’s financial statements are prepared in accordance with GAAP, which may require the use of management estimates and assumptions.Actual results could differ from those estimates.
TheFund 23
NOTES TO FINANCIAL STATEMENTS (continued)
The Company enters into contracts that contain a variety of indemnifications.The fund’s maximum exposure under these arrangements is unknown.The fund does not anticipate recognizing any loss related to these arrangements.
(a) Portfolio valuation: Investments in securities are valued at the last sales price on the securities exchange or national securities market on which such securities are primarily traded. Securities listed on the National Market System for which market quotations are available are valued at the official closing price or, if there is no official closing price that day, at the last sales price. Securities not listed on an exchange or the national securities market, or securities for which there were no transactions, are valued at the average of the most recent bid and asked prices, except for open short positions, where the asked price is used for valuation purposes. Bid price is used when no asked price is available. Registered investment companies that are not traded on an exchange are valued at their net asset value.When market quotations or official closing prices are not readily available, or are determined not to reflect accurately fair value, such as when the value of a security has been significantly affected by events after the close of the exchange or market on which the security is principally traded (for example, a foreign exchange or market), but before the fund calculates its net asset value, the fund may value these investments at fair value as determined in accordance with the procedures approved by the Board of Trustees. Fair valuing of securities may be determined with the assistance of a pricing service using calculations based on indices of domestic securities and other appropriate indicators, such as prices of relevant American Depository Receipts and futures contracts. For other securities that are fair valued by the Board of Trustees, certain factors may be considered such as: fundamental analytical data, the nature and duration of restrictions on disposition, an evaluation of the forces that influence th e market in which the securities are purchased and sold,
24
and public trading in similar securities of the issuer or comparable issuers. Financial futures are valued at the last sales price.
The fair value of a financial instrument is the amount that would be received to sell an asset or paid to transfer a liability in an orderly transaction between market participants at the measurement date (i.e. the exit price). GAAP establishes a fair value hierarchy that prioritizes the inputs of valuation techniques used to measure fair value.This hierarchy gives the highest priority to unadjusted quoted prices in active markets for identical assets or liabilities (Level 1 measurements) and the lowest priority to unobservable inputs (Level 3 measurements).
Additionally, GAAP provides guidance on determining whether the volume and activity in a market has decreased significantly and whether such a decrease in activity results in transactions that are not orderly. GAAP requires enhanced disclosures around valuation inputs and techniques used during annual and interim periods.
Various inputs are used in determining the value of the fund’s investments relating to fair value measurements.These inputs are summarized in the three broad levels listed below:
Level 1—unadjusted quoted prices in active markets for identical investments.
Level 2—other significant observable inputs (including quoted prices for similar investments, interest rates, prepayment speeds, credit risk, etc.).
Level 3—significant unobservable inputs (including the fund’s own assumptions in determining the fair value of investments).
The inputs or methodology used for valuing securities are not necessarily an indication of the risk associated with investing in those securities.
TheFund 25
NOTES TO FINANCIAL STATEMENTS (continued)
The following is a summary of the inputs used as of September 30, 2010 in valuing the fund’s investments:
| | | | |
| | Level 1— | Level 2—Other | Level 3— | |
| | Unadjusted | Significant | Significant | |
| | Quoted | Observable | Unobservable | |
| | Prices | Inputs | Inputs | Total |
| Assets ($) | | | | |
| Investments in Securities: | | | |
| Equity Securities— | | | | |
| Domestic† | 164,924,775 | — | — | 164,924,775 |
| Mutual Funds/ | | | | |
| Exchange | | | | |
| Traded Funds | 10,867,401 | — | — | 10,867,401 |
| |
| † See Statement of Investments for industry classification. | | |
In January 2010, FASB issued Accounting Standards Update (“ASU”) No. 2010-06 “Improving Disclosures about FairValue Measurements”. The portions of ASU No. 2010-06 which require reporting entities to prepare new disclosures surrounding amounts and reasons for significant transfers in and out of Level 1 and Level 2 fair value measurements as well as inputs and valuation techniques used to measure fair value for both recurring and nonrecurring fair value measurements that fall in either Level 2 or Level 3 have been adopted by the fund. No significant transfers between Level 1 or Level 2 fair value measurements occurred at September 30, 2010. The remaining portion of ASU No. 2010-06 requires reporting entities to make new disclosures about information on purchases, sales, issuances and settlements on a gross basis in the reconciliation of activity in Level 3 fair value measurements.These new and re vised disclosures are required to be implemented for fiscal years beginning after December 15, 2010. Management is currently evaluating the impact that the adoption of this remaining portion of ASU No. 2010-06 may have on the fund’s financial statement disclosures.
(b) Securities transactions and investment income: Securities transactions are recorded on a trade date basis. Realized gains and losses from securities transactions are recorded on the identified cost basis. Dividend income is recognized on the ex-dividend date and interest income, including, where applicable, accretion of discount and amortization of premium on investments, is recognized on the accrual basis.
26
Pursuant to a securities lending agreement with The Bank of New York Mellon, a subsidiary of BNY Mellon and an affiliate of Dreyfus, the fund may lend securities to qualified institutions. It is the fund’s policy that, at origination, all loans are secured by collateral of at least 102% of the value of U.S. securities loaned and 105% of the value of foreign securities loaned. Collateral equivalent to at least 100% of the market value of securities on loan is maintained at all times. Collateral is either in the form of cash, which can be invested in certain money market mutual funds managed by Dreyfus, U.S. Government and Agency securities or letters of credit.The fund is entitled to receive all income on securities loaned, in addition to income earned as a result of the lending transaction. Although each security loaned is fully collateralized, the fund bears the risk of delay in recovery of, or loss of right s in, the securities loaned should a borrower fail to return the securities in a timely manner. During the period ended September 30, 2010, The Bank of New York Mellon earned $4,692 from lending portfolio securities, pursuant to the securities lending agreement.
(c) Affiliated issuers: Investments in other investment companies advised by Dreyfus are defined as “affiliated” in the Act.
The fund may invest in shares of certain affiliated investment companies also advised or managed by Dreyfus. Investments in affiliated investment companies for the period ended September 30, 2010 were as follows:
| | | | |
| Affiliated | | | | |
| Investment | Value | | Value | Net |
| Company | 9/30/2009 ($) | Purchases ($) | Sales ($) 9/30/2010 ($) | Assets (%) |
| Dreyfus | | | | |
| Institutional | | | | |
| Preferred | | | | |
| Plus Money | | | | |
| Market Fund | 3,901,000 | 62,912,000 | 63,126,000 3,687,000 | 2.2 |
| Dreyfus | | | | |
| Institutional | | | | |
| Cash | | | | |
| Advantage | | | | |
| Fund | 20,067,794 | 73,657,720 | 87,542,532 6,182,982 | 3.7 |
| Total | 23,968,794 | 136,569,720 | 150,668,532 9,869,982 | 5.9 |
TheFund 27
NOTES TO FINANCIAL STATEMENTS (continued)
(d) Dividends to shareholders: Dividends are recorded on the ex-dividend date. Dividends from investment income-net and dividends from net realized capital gains, if any, are normally declared and paid annually, but the fund may make distributions on a more frequent basis to comply with the distribution requirements of the Internal Revenue Code of 1986, as amended (the “Code”).To the extent that net realized capital gains can be offset by capital loss carryovers, it is the policy of the fund not to distribute such gains. Income and capital gain distributions are determined in accordance with income tax regulations, which may differ from GAAP.
(e) Federal income taxes: It is the policy of the fund to continue to qualify as a regulated investment company, if such qualification is in the best interests of its shareholders, by complying with the applicable provisions of the Code, and to make distributions of taxable income sufficient to relieve it from substantially all federal income and excise taxes.
As of and during the period ended September 30, 2010, the fund did not have any liabilities for any uncertain tax positions.The fund recognizes interest and penalties, if any, related to uncertain tax positions as income tax expense in the Statement of Operations. During the period, the fund did not incur any interest or penalties.
Each of the tax years in the four-year period ended September 30, 2010 remains subject to examination by the Internal Revenue Service and state taxing authorities.
At September 30, 2010, the components of accumulated earnings on a tax basis were as follows: undistributed ordinary income $51,289, accumulated capital losses $17,946,716 and unrealized appreciation $7,411,794.
The accumulated capital loss carryover is available for federal income tax purposes to be applied against future net securities profits, if any, realized subsequent to September 30, 2010. If not applied, $9,882,463 of the carryover expires in fiscal 2016 and $8,064,253 expires in fiscal 2017. Acquired losses as a result of the fund’s merger with Dreyfus Premier Future Leaders Fund can be utilized in subsequent years but will be subject to annual limitations based on certain provisions in the Code.
28
The tax character of distributions paid to shareholders during the fiscal periods ended September 30, 2010 and September 30, 2009 were as follows: ordinary income $287,017 and $396,399, respectively.
During the period ended September 30, 2010, as a result of permanent book to tax differences, primarily due to the tax treatment for real estate investment trusts, recognition of book to tax differences resulting from prior year fund restructuring and investments in limited partnerships, the fund decreased accumulated undistributed investment income-net by $18,676, increased accumulated net realized gain (loss) on investments by $38,871 and decreased paid-in-capital by $20,195. Net assets and net asset value per share were not affected by this reclassification.
NOTE 2—Bank Lines of Credit:
The fund participates with other Dreyfus-managed funds in a $225 million unsecured credit facility led by Citibank, N.A. and a $300 million unsecured credit facility provided by The Bank of New York Mellon (each, a “Facility”), each to be utilized primarily for temporary or emergency purposes, including the financing of redemptions. In connection therewith, the fund has agreed to pay its pro rata portion of commitment fees for each Facility. Interest is charged to the fund based on rates determined pursuant to the terms of the respective Facility at the time of borrowing. During the period ended September 30, 2010, the fund did not borrow under the Facilities.
NOTE 3—Investment Advisory Fee, Administration Fee and Other Transactions with Affiliates:
(a) Pursuant to an investment advisory agreement with TBCAM, the investment advisory fee is computed at the annual rate of .80% of the value of the fund’s average daily net assets and is payable monthly.
Dreyfus and TBCAM have contractually agreed, with respect to each class of fund shares, to assume the expenses of each class so that such expenses of the fund’s Class A, B, C and I shares (excluding taxes, inter-
TheFund 29
NOTES TO FINANCIAL STATEMENTS (continued)
est, brokerage commissions, commitment fees on borrowings and extraordinary expenses) do not exceed an annual rate of 1.39%, 2.24%, 2.22% and 1.16%, respectively, of the value of such class’ average daily net assets, until the fiscal year end following such time as the expenses are equal to or less than such annual rate for the applicable class. The reduction in investment advisory fee, pursuant to the undertaking, amounted to $177,610 during the period ended September 30, 2010.
The fund compensates Dreyfus under an administration agreement for providing personnel and facilities to perform accounting and administration services for the fund at an annual rate of .10% of the value of the fund’s average daily net assets. During the period ended September 30, 2010, the fund was charged $159,717 pursuant to the administration agreement.
During the period ended September 30, 2010, the Distributor retained $9,562 from commissions earned on sales of the fund’s Class A shares and $5,045 and $2,568 from CDSCs on redemptions of the fund’s Class B and Class C shares, respectively.
(b) Under the Distribution Plan (the “Plan”) adopted pursuant to Rule 12b-1 under the Act, Class B and Class C shares pay the Distributor for distributing their shares at an annual rate of .75% of the value of the average daily net assets of Class B and Class C shares. During the period ended September 30, 2010, Class B and Class C shares were charged $20,464 and $108,975, respectively, pursuant to the Plan.
(c) Under the Shareholder Services Plan, Class A, Class B and Class C shares pay the Distributor at an annual rate of .25% of the value of their average daily net assets for the provision of certain services.The services provided may include personal services relating to shareholder accounts, such as answering shareholder inquiries regarding the fund and providing reports and other information, and services related to the maintenance of shareholder accounts.The Distributor may make payments to Service Agents (a securities dealer, financial institution or
30
other industry professional) in respect of these services.The Distributor determines the amounts to be paid to Service Agents. During the period ended September 30, 2010, Class A, Class B and Class C shares were charged $161,829, $6,821 and $36,325, respectively, pursuant to the Shareholder Services Plan.
The fund compensates Dreyfus Transfer, Inc., a wholly-owned subsidiary of Dreyfus, under a transfer agency agreement for providing personnel and facilities to perform transfer agency services for the fund. During the period ended September 30, 2010, the fund was charged $74,575 pursuant to the transfer agency agreement, which is included in Shareholder servicing costs in the Statement of Operations.
The fund has arrangements with the custodian and cash management bank whereby the fund may receive earnings credits when positive cash balances are maintained, which are used to offset custody and cash management fees. For financial reporting purposes, the fund includes net earnings credits as an expense offset in the Statement of Operations.
The fund compensates The Bank of New York Mellon under a cash management agreement for performing cash management services related to fund subscriptions and redemptions. During the period ended September 30, 2010, the fund was charged $8,977 pursuant to the cash management agreement, which is included in Shareholder servicing costs in the Statement of Operations. These fees were partially offset by earnings credits of $475.
The fund also compensates The Bank of New York Mellon, under a custody agreement for providing custodial services for the fund. During the period ended September 30, 2010, the fund was charged $30,256 pursuant to the custody agreement.
During the period ended September 30, 2010, the fund was charged $6,380 for services performed by the Chief Compliance Officer.
TheFund 31
NOTES TO FINANCIAL STATEMENTS (continued)
The components of “Due to TBCAM and affiliates” in the Statement of Assets and Liabilities consist of: investment advisory fees $106,473, administration fees $13,309, Rule 12b-1 distribution plan fees $9,791, shareholder services plan fees $15,692, custodian fees $4,400, chief compliance officer fees $1,783 and transfer agency per account fees $17,250, which are offset against an expense reimbursement currently in effect in the amount of $4,439.
(d) Each Board member also serves as a Board member of other funds within the Dreyfus complex. Annual retainer fees and attendance fees are allocated to each fund based on net assets.
NOTE 4—Securities Transactions:
The aggregate amount of purchases and sales of investment securities, excluding short-term securities and financial futures, during the period ended September 30, 2010, amounted to $128,541,406 and $122,371,005, respectively.
The provisions of ASC Topic 815 “Derivatives and Hedging” require qualitative disclosures about objectives and strategies for using derivatives, quantitative disclosures about fair value amounts of gains and losses on derivative instruments and disclosures about credit-risk-related contingent features in derivative agreements. The disclosure requirements distinguish between derivatives, which are accounted for as “hedges” and those that do not qualify for hedge accounting. Because investment companies value their derivatives at fair value and recognize changes in fair value through the Statement of Operations, they do not qualify for such accounting. Accordingly, even though a fund’s investments in derivatives may represent economic hedges, they are considered to be non-hedge transactions for purposes of this disclosure.
32
Futures Contracts: In the normal course of pursuing its investment objective, the fund is exposed to market risk, including equity price risk as a result of changes in value of underlying financial instruments.The fund invests in financial futures contracts in order to manage its exposure to or protect against changes in the market.A futures contract represents a commitment for the future purchase or a sale of an asset at a specified date. Upon entering into such contracts, these investments require initial margin deposits with a broker, which consist of cash or cash equivalents. The amount of these deposits is determined by the exchange or Board of Trade on which the contract is traded and is subject to change. Accordingly, variation margin payments are received or made to reflect daily unrealized gains or losses which are recorded in the Statement of Operations. Futures contracts are valued daily at the last sales price established by the Board of Trade or exchange upon which they are traded. When the contracts are closed, the fund recognizes a realized gain or loss.There is minimal counterparty credit risk to the fund with futures since futures are exchange traded, and the exchange’s clearinghouse guarantees the futures against default.At September 30, 2010, there were no financial futures contracts outstanding.
At September 30, 2010, the cost of investments for federal income tax purposes was $168,380,382; accordingly, accumulated net unrealized appreciation on investments was $7,411,794, consisting of $15,169,789 gross unrealized appreciation and $7,757,995 gross unrealized depreciation.
TheFund 33
REPORT OF INDEPENDENT REGISTERED
PUBLIC ACCOUNTING FIRM
Shareholders and Board of Trustees
Dreyfus Small Cap Equity Fund
We have audited the accompanying statement of assets and liabilities, including the statement of investments, of Dreyfus Small Cap Equity Fund (one of the series comprising Dreyfus Stock Funds) as of September 30, 2010, and the related statement of operations for the year then ended, the statement of changes in net assets for each of the two years in the period then ended and financial highlights for each of the four years in the period then ended. These financial statements and financial highlights are the responsibility of the Fund’s management. Our responsibility is to express an opinion on these financial statements and financial highlights based on our audits.The financial highlights for the year ended September 30, 2006 were audited by other auditors whose report dated November 17, 2006, expressed an unqualified opinion on such financial highlights.
We conducted our audits in accordance with the standards of the Public Company Accounting Oversight Board (United States).Those standards require that we plan and perform the audit to obtain reasonable assurance about whether the financial statements and financial highlights are free of material misstatement.We were not engaged to perform an audit of the Fund’s internal control over financial reporting. Our audits included consideration of internal control over financial reporting as a basis for designing audit procedures that are appropriate in the circumstances, but not for the purpose of expressing an opinion on the effectiveness of the Fund’s internal control over financial reporting. Accordingly, we express no such opinion.An audit also includes examining, on a test basis, evidence supporting the amounts and disclosures in the financial statements and financial highlights, assessing the accounting p rinciples used and significant estimates made by management, and evaluating the overall financial statement presentation. Our procedures included confirmation of securities owned as of September 30, 2010 by correspondence with the custodian and others. We believe that our audits provide a reasonable basis for our opinion.
In our opinion, the 2010, 2009, 2008 and 2007 financial statements and financial highlights referred to above present fairly, in all material respects, the financial position of Dreyfus Small Cap Equity Fund at September 30, 2010, the results of its operations for the year then ended, the changes in its net assets for each of the two years in the period then ended and the financial highlights for each of the four years in the period then ended, in conformity with U.S. generally accepted accounting principles.

New York, New York
November 23, 2010
34
IMPORTANT TAX INFORMATION (Unaudited)
For federal tax purposes, the fund hereby designates 100% of the ordinary dividends paid during the fiscal year ended September 30, 2010 as qualifying for the corporate dividends received deduction. Also certain dividends paid by the fund may be subject to a maximum tax rate of 15%, as provided for by the Jobs and Growth Tax Relief Reconciliation Act of 2003. Of the distributions paid during the fiscal year, $287,017 represents the maximum amount that may be considered qualified dividend income. Shareholders will receive notification in early 2011 of the percentage applicable to the preparation of their 2010 income tax returns.
TheFund 35


OFFICERS OF THE FUND (Unaudited)
BRADLEY J. SKAPYAK, President since January 2010.
Chief Operating Officer and a director of the Manager since June 2009. From April 2003 to June 2009, Mr. Skapyak was the head of the Investment Accounting and Support Department of the Manager. He is an officer of 76 investment companies (comprised of 170 portfolios) managed by the Manager. He is 51 years old and has been an employee of the Manager since February 1988.
PHILLIP N. MAISANO, Executive Vice President since July 2007.
Chief Investment Officer,Vice Chair and a director of the Manager, and an officer of 76 investment companies (comprised of 170 portfolios) managed by the Manager. Mr. Maisano also is an officer and/or Board member of certain other investment management subsidiaries of The Bank of New York Mellon Corporation, each of which is an affiliate of the Manager. He is 63 years old and has been an employee of the Manager since November 2006. Prior to joining the Manager, Mr. Maisano served as Chairman and Chief Executive Officer of EACM Advisors, an affiliate of the Manager, since August 2004.
MICHAEL A. ROSENBERG, Vice President and Secretary since August 2005.
Assistant General Counsel of BNY Mellon, and an officer of 77 investment companies (comprised of 195 portfolios) managed by the Manager. He is 50 years old and has been an employee of the Manager since October 1991.
KIESHA ASTWOOD, Vice President and Assistant Secretary since January 2010.
Counsel of BNY Mellon, and an officer of 77 investment companies (comprised of 195 portfolios) managed by the Manager. She is 37 years old and has been an employee of the Manager since July 1995.
JAMES BITETTO, Vice President and Assistant Secretary since August 2005.
Senior Counsel of BNY Mellon and Secretary of the Manager, and an officer of 77 investment companies (comprised of 195 portfolios) managed by the Manager. He is 44 years old and has been an employee of the Manager since December 1996.
JONI LACKS CHARATAN, Vice President and Assistant Secretary since August 2005.
Senior Counsel of BNY Mellon, and an officer of 77 investment companies (comprised of 195 portfolios) managed by the Manager. She is 54 years old and has been an employee of the Manager since October 1988.
JOSEPH M. CHIOFFI, Vice President and Assistant Secretary since August 2005.
Senior Counsel of BNY Mellon, and an officer of 77 investment companies (comprised of 195 portfolios) managed by the Manager. He is 48 years old and has been an employee of the Manager since June 2000.
KATHLEEN DENICHOLAS, Vice President and Assistant Secretary since January 2010.
Senior Counsel of BNY Mellon, and an officer of 77 investment companies (comprised of 195 portfolios) managed by the Manager. She is 35 years old and has been an employee of the Manager since February 2001.
JANETTE E. FARRAGHER, Vice President and Assistant Secretary since August 2005.
Assistant General Counsel of BNY Mellon, and an officer of 77 investment companies (comprised of 195 portfolios) managed by the Manager. She is 47 years old and has been an employee of the Manager since February 1984.
TheFund 39
OFFICERS OF THE FUND (Unaudited) (continued)
JOHN B. HAMMALIAN, Vice President and Assistant Secretary since August 2005.
Managing Counsel of BNY Mellon, and an officer of 77 investment companies (comprised of 195 portfolios) managed by the Manager. He is 47 years old and has been an employee of the Manager since February 1991.
M. CRISTINA MEISER, Vice President and Assistant Secretary since January 2010.
Senior Counsel of BNY Mellon, and an officer of 77 investment companies (comprised of 195 portfolios) managed by the Manager. She is 40 years old and has been an employee of the Manager since August 2001.
ROBERT R. MULLERY, Vice President and Assistant Secretary since August 2005.
Managing Counsel of BNY Mellon, and an officer of 77 investment companies (comprised of 195 portfolios) managed by the Manager. He is 58 years old and has been an employee of the Manager since May 1986.
JEFF PRUSNOFSKY, Vice President and Assistant Secretary since August 2005.
Managing Counsel of BNY Mellon, and an officer of 77 investment companies (comprised of 195 portfolios) managed by the Manager. He is 45 years old and has been an employee of the Manager since October 1990.
JAMES WINDELS, Treasurer since November 2001.
Director – Mutual Fund Accounting of the Manager, and an officer of 77 investment companies (comprised of 195 portfolios) managed by the Manager. He is 52 years old and has been an employee of the Manager since April 1985.
RICHARD CASSARO, Assistant Treasurer since January 2008.
Senior Accounting Manager – Money Market and Municipal Bond Funds of the Manager, and an officer of 77 investment companies (comprised of 195 portfolios) managed by the Manager. He is 51 years old and has been an employee of the Manager since September 1982.
GAVIN C. REILLY, Assistant Treasurer since December 2005.
Tax Manager of the Investment Accounting and Support Department of the Manager, and an officer of 77 investment companies (comprised of 195 portfolios) managed by the Manager. He is 42 years old and has been an employee of the Manager since April 1991.
ROBERT ROBOL, Assistant Treasurer since August 2005.
Senior Accounting Manager – Fixed Income Funds of the Manager, and an officer of 77 investment companies (comprised of 195 portfolios) managed by the Manager. He is 46 years old and has been an employee of the Manager since October 1988.
ROBERT SALVIOLO, Assistant Treasurer since July 2007.
Senior Accounting Manager – Equity Funds of the Manager, and an officer of 77 investment companies (comprised of 195 portfolios) managed by the Manager. He is 43 years old and has been an employee of the Manager since June 1989.
40
ROBERT SVAGNA, Assistant Treasurer
since August 2005.
Senior Accounting Manager – Equity Funds of the Manager, and an officer of 77 investment companies (comprised of 195 portfolios) managed by the Manager. He is 43 years old and has been an employee of the Manager since November 1990.
JOSEPH W. CONNOLLY, Chief Compliance Officer since October 2004.
Chief Compliance Officer of the Manager and The Dreyfus Family of Funds (77 investment companies, comprised of 195 portfolios). From November 2001 through March 2004, Mr. Connolly was first Vice-President, Mutual Fund Servicing for Mellon Global Securities Services. In that capacity, Mr. Connolly was responsible for managing Mellon’s Custody, Fund Accounting and Fund Administration services to third-party mutual fund clients. He is 53 years old and has served in various capacities with the Manager since 1980, including manager of the firm’s Fund Accounting Department from 1997 through October 2001.
NATALIA GRIBAS, Anti-Money Laundering
Compliance Officer since July 2010.
Anti-Money Laundering Compliance Officer of the Distributor, and the Anti-Money Laundering Compliance Officer of 73 investment companies (comprised of 191 portfolios) managed by the Manager. She is 40 years old and has been an employee of the Distributor since September 2008.
TheFund 41
Item 2. Code of Ethics.
The Registrant has adopted a code of ethics that applies to the Registrant's principal executive officer, principal financial officer, principal accounting officer or controller, or persons performing similar functions. There have been no amendments to, or waivers in connection with, the Code of Ethics during the period covered by this Report.
Item 3. Audit Committee Financial Expert.
The Registrant's Board has determined that Ehud Houminer, a member of the Audit Committee of the Board, is an audit committee financial expert as defined by the Securities and Exchange Commission (the "SEC"). Ehud Houminer is "independent" as defined by the SEC for purposes of audit committee financial expert determinations.
Item 4. Principal Accountant Fees and Services.
(a) Audit Fees. The aggregate fees billed for each of the last two fiscal years (the "Reporting Periods") for professional services rendered by the Registrant's principal accountant (the "Auditor") for the audit of the Registrant's annual financial statements or services that are normally provided by the Auditor in connection with the statutory and regulatory filings or engagements for the Reporting Periods, were $ 54,688 in 2009 and $54,688 in 2010.
(b) Audit-Related Fees. The aggregate fees billed in the Reporting Periods for assurance and related services by the Auditor that are reasonably related to the performance of the audit of the Registrant's financial statements and are not reported under paragraph (a) of this Item 4 were $10,552 in 2009 and $10,764 in 2010. These services consisted of one or more of the following: (i) agreed upon procedures related to compliance with Internal Revenue Code section 817(h), (ii) security counts required by Rule 17f-2 under the Investment Company Act of 1940, as amended, (iii) advisory services as to the accounting or disclosure treatment of Registrant transactions or events and (iv) advisory service s to the accounting or disclosure treatment of the actual or potential impact to the Registrant of final or proposed rules, standards or interpretations by the Securities and Exchange Commission, the Financial Accounting Standards Boards or other regulatory or standard-setting bodies.
The aggregate fees billed in the Reporting Periods for non-audit assurance and related services by the Auditor to the Registrant's investment adviser (not including any sub-investment adviser whose role is primarily portfolio management and is subcontracted with or overseen by another investment adviser), and any entity controlling, controlled by or under common control with the investment adviser that provides ongoing services to the Registrant ("Service Affiliates"), that were reasonably related to the performance of the annual audit of the Service Affiliate, which required pre-approval by the Audit Committee were $0 in 2009 and $0 in 2010.
(c) Tax Fees. The aggregate fees billed in the Reporting Periods for professional services rendered by the Auditor for tax compliance, tax advice, and tax planning ("Tax Services") were $5,164 in 2009 and $4,764 in 2010. These services consisted of: (i) review or preparation of U.S. federal, state, local and excise tax returns; (ii) U.S. federal, state and local tax planning, advice and assistance regarding statutory, regulatory or administrative developments; (iii) tax advice regarding tax qualification matters and/or treatment of various financial instruments held or proposed to be acquired or held, and (iv) determination of Passive Foreign Investment Companies. The aggregate fees billed in the Reporting Periods for Tax Services by the Auditor to Service Affiliates, which required pre-approval by the Audit Committee were $0 in 2009 and $0 in 2010.
(d) All Other Fees. The aggregate fees billed in the Reporting Periods for products and services provided by the Auditor, other than the services reported in paragraphs (a) through (c) of this Item, were $28 in 2009 and $667 in 2010. [These services consisted of a review of the Registrant's anti-money laundering program].
The aggregate fees billed in the Reporting Periods for Non-Audit Services by the Auditor to Service Affiliates, other than the services reported in paragraphs (b) through (c) of this Item, which required pre-approval by the Audit Committee, were $0 in 2009 and $0 in 2010.
(e)(1) Audit Committee Pre-Approval Policies and Procedures. The Registrant's Audit Committee has established policies and procedures (the "Policy") for pre-approval (within specified fee limits) of the Auditor's engagements for non-audit services to the Registrant and Service Affiliates without specific case-by-case consideration. The pre-approved services in the Policy can include pre-approved audit services, pre-approved audit-related services, pre-approved tax services and pre-approved all other services. Pre-approval considerations include whether the proposed services are compatible with maintaining the Auditor's independence. Pre-approvals pursuant to the Policy are considered annually.
(e)(2) Note: None of the services described in paragraphs (b) through (d) of this Item 4 were approved by the Audit Committee pursuant to paragraph (c)(7)(i)(C) of Rule 2-01 of Regulation S-X.
(f) None of the hours expended on the principal accountant's engagement to audit the registrant's financial statements for the most recent fiscal year were attributed to work performed by persons other than the principal account's full-time, permanent employees.
Non-Audit Fees. The aggregate non-audit fees billed by the Auditor for services rendered to the Registrant, and rendered to Service Affiliates, for the Reporting Periods were $25,619,110 in 2009 and $29,311,662 in 2010.
Auditor Independence. The Registrant's Audit Committee has considered whether the provision of non-audit services that were rendered to Service Affiliates, which were not pre-approved (not requiring pre-approval), is compatible with maintaining the Auditor's independence.
Item 5. Audit Committee of Listed Registrants.
Not applicable. [CLOSED-END FUNDS ONLY]
Item 6. Investments.
(a) Not applicable.
Item 7. Disclosure of Proxy Voting Policies and Procedures for Closed-End Management Investment Companies.
Not applicable. [CLOSED-END FUNDS ONLY]
Item 8. Portfolio Managers of Closed-End Management Investment Companies.
Not applicable. [CLOSED-END FUNDS ONLY, beginning with reports for periods ended on and after December 31, 2005]
Item 9. Purchases of Equity Securities by Closed-End Management Investment Companies and Affiliated Purchasers.
Not applicable. [CLOSED-END FUNDS ONLY]
Item 10. Submission of Matters to a Vote of Security Holders.
There have been no material changes to the procedures applicable to Item 10.
Item 11. Controls and Procedures.
(a) The Registrant's principal executive and principal financial officers have concluded, based on their evaluation of the Registrant's disclosure controls and procedures as of a date within 90 days of the filing date of this report, that the Registrant's disclosure controls and procedures are reasonably designed to ensure that information required to be disclosed by the Registrant on Form N-CSR is recorded, processed, summarized and reported within the required time periods and that information required to be disclosed by the Registrant in the reports that it files or submits on Form N-CSR is accumulated and communicated to the Registrant's management, including its principal executive and principal financial officers, as appropriate to allow timely decisions regarding required disclosure.
(b) There were no changes to the Registrant's internal control over financial reporting that occurred during the second fiscal quarter of the period covered by this report that have materially affected, or are reasonably likely to materially affect, the Registrant's internal control over financial reporting.
Item 12. Exhibits.
(a)(1) Code of ethics referred to in Item 2.
(a)(2) Certifications of principal executive and principal financial officers as required by Rule 30a-2(a) under the Investment Company Act of 1940.
(a)(3) Not applicable.
(b) Certification of principal executive and principal financial officers as required by Rule 30a-2(b) under the Investment Company Act of 1940.
SIGNATURES
Pursuant to the requirements of the Securities Exchange Act of 1934 and the Investment Company Act of 1940, the Registrant has duly caused this Report to be signed on its behalf by the undersigned, thereunto duly authorized.
DREYFUS STOCK FUNDS
By: /s/ Bradley J. Skapyak |
Bradley J. Skapyak, President |
Date: | November 22, 2010 |
|
Pursuant to the requirements of the Securities Exchange Act of 1934 and the Investment Company Act of 1940, this Report has been signed below by the following persons on behalf of the Registrant and in the capacities and on the dates indicated. |
|
By: /s/ Bradley J. Skapyak |
Bradley J. Skapyak, President |
Date: | November 22, 2010 |
|
By: /s/ James Windels |
James Windels, Treasurer |
Date: | November 22, 2010 |
|
EXHIBIT INDEX
(a)(1) Code of ethics referred to in Item 2.
(a)(2) Certifications of principal executive and principal financial officers as required by Rule 30a-2(a) under the Investment Company Act of 1940. (EX-99.CERT)
(b) Certification of principal executive and principal financial officers as required by Rule 30a-2(b) under the Investment Company Act of 1940. (EX-99.906CERT)