UNITED STATES
SECURITIES AND EXCHANGE COMMISSION
Washington, D.C. 20549
FORM N-CSR
CERTIFIED SHAREHOLDER REPORT OF REGISTERED MANAGEMENT
INVESTMENT COMPANIES
Investment Company Act file number | 811-21236 |
| |
| DREYFUS STOCK FUNDS | |
| (Exact name of Registrant as specified in charter) | |
| | |
| c/o The Dreyfus Corporation 200 Park Avenue New York, New York 10166 | |
| (Address of principal executive offices) (Zip code) | |
| | |
| John Pak, Esq. 200 Park Avenue New York, New York 10166 | |
| (Name and address of agent for service) | |
|
Registrant's telephone number, including area code: | (212) 922-6000 |
| |
Date of fiscal year end: | 09/30 | |
Date of reporting period: | 09/30/13 | |
| | | | | | | |
FORM N-CSR
Item 1. Reports to Stockholders.
Dreyfus
International
Equity Fund
ANNUAL REPORT September 30, 2013

Save time. Save paper. View your next shareholder report online as soon as it’s available. Log into www.dreyfus.com and sign up for Dreyfus eCommunications. It’s simple and only takes a few minutes.
The views expressed in this report reflect those of the portfolio manager only through the end of the period covered and do not necessarily represent the views of Dreyfus or any other person in the Dreyfus organization. Any such views are subject to change at any time based upon market or other conditions and Dreyfus disclaims any responsibility to update such views.These views may not be relied on as investment advice and, because investment decisions for a Dreyfus fund are based on numerous factors, may not be relied on as an indication of trading intent on behalf of any Dreyfus fund.
| | Contents |
| | THE FUND |
| 2 | A Letter from the President |
| 3 | Discussion of Fund Performance |
| 6 | Fund Performance |
| 8 | Understanding Your Fund’s Expenses |
| 8 | Comparing Your Fund’s Expenses With Those of Other Funds |
| 9 | Statement of Investments |
| 14 | Statement of Assets and Liabilities |
| 15 | Statement of Operations |
| 16 | Statement of Changes in Net Assets |
| 18 | Financial Highlights |
| 21 | Notes to Financial Statements |
| 35 | Report of Independent Registered Public Accounting Firm |
| 36 | Important Tax Information |
| 37 | Board Members Information |
| 40 | Officers of the Fund |
| | FOR MORE INFORMATION |
| | Back Cover |
Dreyfus
International Equity Fund
The Fund
A LETTER FROM THE PRESIDENT
Dear Shareholder:
This annual report for Dreyfus International Equity Fund covers the 12-month period from October 1, 2012, through September 30, 2013. For information about how the fund performed during the reporting period, as well as general market perspectives, we provide a Discussion of Fund Performance on the pages that follow.
Improving global economic conditions drove developed stock markets higher over much of the reporting period. Europe appeared to put the worst of its sovereign debt and banking crises behind it, and Japan embarked on a new economic course designed to reflate its long-stagnant domestic economy. However, the world’s emerging markets struggled with the effects of local economic slowdowns. As a result, equity market returns varied widely from one country to another over the past 12 months.
We currently expect global economic conditions to continue to improve in 2014, with stronger growth in many developed countries fueled by past and continuing monetary ease. The emerging markets seem poised for moderate economic expansion despite recently negative investor sentiment. In the United States, we anticipate accelerating growth supported by the fading drags of tighter federal fiscal policies and downsizing on the state and local levels. For more information on how these observations may affect your investments, we encourage you to speak with your financial advisor.
Thank you for your continued confidence and support.
Sincerely,
J. Charles Cardona
President
The Dreyfus Corporation
October 15, 2013
2
DISCUSSION OF FUND PERFORMANCE
For the period of October 1, 2012, through September 30, 2013, as provided by Sean P. Fitzgibbon and Mark A. Bogar, Portfolio Managers
Fund and Market Performance Overview
For the 12-month period ended September 30, 2013, Dreyfus International Equity Fund’s Class A shares produced a total return of 26.02%, Class C shares returned 25.03%, and Class I shares returned 26.36%.1 In comparison, the fund’s benchmark, the Morgan Stanley Capital International Europe, Australasia, Far East Index (the “MSCI EAFE Index”), produced a total return of 23.77% for the same period.2
International stock markets generally rallied over the reporting period as economic conditions improved in Europe, Japan, and the United States. The fund produced higher returns than its benchmark on the strength of successful stock selections in the consumer discretionary, materials, and information technology sectors.
The Fund’s Investment Approach
The fund seeks long-term growth of capital.The fund normally invests at least 80% of assets in shares of companies located in the foreign countries represented in the MSCI EAFE Index and Canada, and may also invest up to 20% of its assets in securities of issuers located in emerging market countries.
The fund invests in stocks that appear to be undervalued and exhibit better fundamentals than the market expects. We employ a “bottom-up” investment approach, which emphasizes individual stock selection. Our stock selection process is designed to produce a diversified portfolio that, relative to the MSCI EAFE Index, frequently has a below-average price/earnings ratio and an above-average earnings growth trend.
Recovering Global Economy Fueled Equity Markets’ Gains
The reporting period began near the outset of stock market rallies driven by improved global economic trends in the world’s more developed nations. Europe and Japan appeared to follow the lead of the United States in staging a sustained recovery from various financial crises and economic maladies. Investors were particularly encouraged by the European Central Bank’s efforts to shore up the region’s banking system, stimulative fiscal and monetary policies from a new government in Japan,
The Fund 3
DISCUSSION OF FUND PERFORMANCE (continued)
improving housing markets in the United Kingdom, and a new quantitative easing program and improved employment trends in the United States. However, China and other emerging markets continued to struggle with moderating economic growth.
Global economic data continued to show signs of improvement, and stocks in developed markets generally continued to rally, through the spring of 2013. In late May, remarks by Federal Reserve Board chairman Ben Bernanke were widely interpreted as a signal that U.S. monetary policymakers would soon back away from their quantitative easing program. Consequently, many equity markets encountered heightened volatility in June, and a strengthening U.S. dollar further eroded returns from international investments for U.S. residents. Markets generally stabilized over the summer, and investors returned their focus to company and market fundamentals.
Strong Stock Selections in Developed Markets
In this environment, the fund’s strong relative performance was driven by our stock selection strategy in several of the world’s more developed markets. In the consumer discretionary sector, the fund participated in gains posted by automotive companies, including Japanese carmaker Fuji Heavy Industries, producer of the Subaru brand, which benefited from a weakening yen versus the U.S. dollar.The fund also scored success in the media industry group, as German television network ProSieben more than doubled in value when advertising spending increased in the recovering economy, and U.K. television programmer ITV plc achieved higher earnings.
Results from the materials sector were buoyed by underweighted exposure to metals-and-mining companies that struggled amid sluggish demand from the emerging markets.The fund also held no precious metals stocks, helping to avoid the impact of falling gold prices. Instead, we focused on other industries, such as the paper-and-packaging group, where Ireland’s Smurfit Kappa Group expanded its profit margins in a consolidating industry. Among information technology companies, Swiss semiconductor manufacturer STMicroelectronics gained value after the sale of an underperforming business unit.
Disappointments during the reporting period included the financials sector, where underweighted exposure to Japanese financial institutions and real estate companies proved counterproductive. In the telecommunications services sector, we sold the
4
fund’s position in Japan’s Softbank after it acquired U.S. cellular carrier Sprint Nextel, missing gains stemming from its ownership of Chinese Internet company Alibaba.com. Meanwhile,Telecom Italia was hurt by intensifying competitive pressures and a heavy debt load.
Finding Opportunities in Most Markets
We have been encouraged by recently positive economic data in Europe, Japan, and the United States. Despite recent market rallies in some regions, our value-oriented investment process has continued to identify stocks meeting our investment criteria in a variety of industry groups. We recently have found an ample number of opportunities in the consumer discretionary and information technology sectors, but relatively few among metals-and-mining companies.We also have increased the fund’s exposure to financial companies in Europe and exporters in Japan.
October 15, 2013
Please note, the position in any security highlighted with italicized typeface was sold during the reporting period. Equity funds are subject generally to market, market sector, market liquidity, issuer and investment style risks, among other factors, to varying degrees, all of which are more fully described in the fund’s prospectus.
The fund’s performance will be influenced by political, social and economic factors affecting investments in foreign companies. Special risks associated with investments in foreign companies include exposure to currency fluctuations, less liquidity, less developed or less efficient trading markets, lack of comprehensive company information, political instability and differing auditing and legal standards.These risks are enhanced in emerging markets countries. Investments in foreign currencies are subject to the risk that those currencies will decline in value relative to the U.S. dollar, or, in the case of hedged positions, that the U.S. dollar will decline relative to the currency being hedged. Each of these risks could increase the fund’s volatility.
|
| 1 Total return includes reinvestment of dividends and any capital gains paid, and does not take into consideration the |
| maximum initial sales charge in the case of Class A shares, or the applicable contingent deferred sales charge imposed |
| on redemptions in the case of Class C shares. Had these charges been reflected, returns would have been lower. Past |
| performance is no guarantee of future results. Share price and investment return fluctuate such that upon redemption, |
| fund shares may be worth more or less than their original cost. Return figures provided reflect the absorption of certain |
| fund expenses by The Dreyfus Corporation and The Boston Company Asset Management, LLC. Had these |
| expenses not been absorbed, returns would have been lower. |
| 2 SOURCE: LIPPER INC. – Reflects reinvestment of net dividends and, where applicable, capital gain distributions. |
| The Morgan Stanley Capital International Europe,Australasia, Far East (MSCI EAFE) Index is an unmanaged |
| index composed of a sample of companies representative of the market structure of European and Pacific Basin |
| countries. Returns are calculated on a month-end basis. Investors cannot invest directly in any index. |
The Fund 5
FUND PERFORMANCE
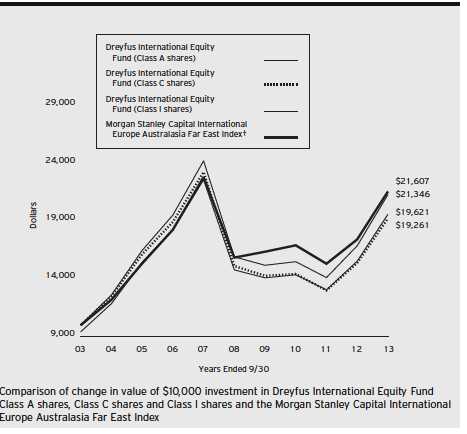
† Source: Lipper Inc.
Past performance is not predictive of future performance.
The above graph compares a $10,000 investment made in each of the Class A, Class C and Class I shares of Dreyfus International Equity Fund on 9/30/03 to a $10,000 investment made in the Morgan Stanley Capital International Europe Australasia Far East Index (the “Index”) on that date.All dividends and capital gain distributions are reinvested.
Prior to 8/1/07, the fund invested its assets in a “master portfolio” that had the same investment objective and policies as the fund. This master/feeder arrangement was terminated on 8/1/07 and the fund operates as a stand alone fund. Performance information represents the performance of the predecessor master portfolio (and its predecessor fund) and the expenses of the master portfolio’s predecessor fund through January 31, 2003, and the fund’s performance and expense structure thereafter. The master portfolio’s predecessor fund contributed all of its assets to the master portfolio before the fund commenced investment operations on 2/1/03.
The fund’s performance shown in the line graph above takes into account the maximum initial sales charge on Class A shares and all other applicable fees and expenses on all classes.The Index is an unmanaged index composed of a sample of companies representative of the market structure of European and Pacific Basin countries. Unlike a mutual fund, the Index is not subject to charges, fees and other expenses. Investors cannot invest directly in any index. Further information relating to fund performance, including expense reimbursements, if applicable, is contained in the Financial Highlights section of the prospectus and elsewhere in this report.
6
| | | | | | |
| Average Annual Total Returns as of 9/30/13 | | | | | | |
| |
| | 1 | Year | 5 Years | | 10 Years | |
| Class A shares | | | | | | |
| with maximum sales charge (5.75%) | 18.77 | % | 4.53 | % | 6.97 | % |
| without sales charge | 26.02 | % | 5.78 | % | 7.61 | % |
| Class C shares | | | | | | |
| with applicable redemption charge † | 24.03 | % | 4.95 | % | 6.78 | % |
| without redemption | 25.03 | % | 4.95 | % | 6.78 | % |
| Class I shares | 26.36 | % | 6.03 | % | 7.88 | % |
| Morgan Stanley Capital International | | | | | | |
| Europe Australasia Far East Index | 23.77 | % | 6.35 | % | 8.01 | % |
Past performance is not predictive of future performance.The fund’s performance shown in the graph and table does not reflect the deduction of taxes that a shareholder would pay on fund distributions or the redemption of fund shares.
|
| † The maximum contingent deferred sales charge for Class C shares is 1% for shares redeemed within one year of the |
| date of purchase. |
The Fund 7
UNDERSTANDING YOUR FUND’S EXPENSES (Unaudited)
As a mutual fund investor, you pay ongoing expenses, such as management fees and other expenses. Using the information below, you can estimate how these expenses affect your investment and compare them with the expenses of other funds.You also may pay one-time transaction expenses, including sales charges (loads) and redemption fees, which are not shown in this section and would have resulted in higher total expenses. For more information, see your fund’s prospectus or talk to your financial adviser.
Review your fund’s expenses
The table below shows the expenses you would have paid on a $1,000 investment in Dreyfus International Equity Fund from April 1, 2013 to September 30, 2013. It also shows how much a $1,000 investment would be worth at the close of the period, assuming actual returns and expenses.
Expenses and Value of a $1,000 Investment
assuming actual returns for the six months ended September 30, 2013
| | | | | | |
| | | Class A | | Class C | | Class I |
| Expenses paid per $1,000† | $ | 5.97 | $ | 10.10 | $ | 4.53 |
| Ending value (after expenses) | $ | 1,125.20 | $ | 1,120.90 | $ | 1,126.80 |
COMPARING YOUR FUND’S EXPENSES
WITH THOSE OF OTHER FUNDS (Unaudited)
Using the SEC’s method to compare expenses
The Securities and Exchange Commission (SEC) has established guidelines to help investors assess fund expenses. Per these guidelines, the table below shows your fund’s expenses based on a $1,000 investment, assuming a hypothetical 5% annualized return. You can use this information to compare the ongoing expenses (but not transaction expenses or total cost) of investing in the fund with those of other funds.All mutual fund shareholder reports will provide this information to help you make this comparison. Please note that you cannot use this information to estimate your actual ending account balance and expenses paid during the period.
Expenses and Value of a $1,000 Investment
assuming a hypothetical 5% annualized return for the six months ended September 30, 2013
| | | | | | |
| | | Class A | | Class C | | Class I |
| Expenses paid per $1,000† | $ | 5.67 | $ | 9.60 | $ | 4.31 |
| Ending value (after expenses) | $ | 1,019.45 | $ | 1,015.54 | $ | 1,020.81 |
|
| † Expenses are equal to the fund’s annualized expense ratio of 1.12% for Class A, 1.90% for Class C and .85% |
| for Class I, multiplied by the average account value over the period, multiplied by 183/365 (to reflect the one-half |
| year period). |
8
STATEMENT OF INVESTMENTS
September 30, 2013
| | | |
| Common Stocks—96.7% | Shares | | Value ($) |
| Australia—5.9% | | | |
| Dexus Property Group | 1,725,240 | | 1,618,702 |
| Fortescue Metals Group | 277,860 | | 1,233,061 |
| Rio Tinto | 26,996 | | 1,556,334 |
| Spark Infrastructure Group | 1,266,220 | | 1,961,056 |
| Westfield Group | 192,430 | | 1,976,606 |
| Westpac Banking | 94,960 | | 2,901,833 |
| | | | 11,247,592 |
| Finland—.9% | | | |
| Sampo, Cl. A | 41,410 | | 1,779,714 |
| France—12.0% | | | |
| BNP Paribas | 61,780 | | 4,181,625 |
| Cap Gemini | 21,990 | | 1,308,792 |
| Electricite de France | 30,950 | | 979,219 |
| Fonciere Des Regions | 16,730 | | 1,388,043 |
| GDF Suez | 60,840 | | 1,529,195 |
| L’Oreal | 7,440 | | 1,278,227 |
| Orange | 137,920 | | 1,730,032 |
| Sanofi | 47,100 | | 4,776,345 |
| Schneider Electric | 23,830 | | 2,016,324 |
| Societe Generale | 69,510 | | 3,466,614 |
| | | | 22,654,416 |
| Germany—9.2% | | | |
| Allianz | 19,410 | | 3,051,325 |
| Bayer | 39,810 | | 4,694,165 |
| Continental | 10,030 | | 1,699,994 |
| Deutsche Lufthansa | 114,210 | a | 2,227,415 |
| Fresenius & Co. | 5,990 | | 744,093 |
| Gerresheimer | 11,470 | | 687,510 |
| Siemens | 36,190 | | 4,363,033 |
| | | | 17,467,535 |
The Fund 9
STATEMENT OF INVESTMENTS (continued)
| | |
| Common Stocks (continued) | Shares | Value ($) |
| Hong Kong—2.9% | | |
| Cheung Kong Holdings | 98,000 | 1,494,496 |
| Sino Land | 740,000 | 1,088,235 |
| SJM Holdings | 1,051,000 | 2,961,935 |
| | | 5,544,666 |
| Ireland—2.3% | | |
| CRH | 101,520 | 2,441,983 |
| Smurfit Kappa Group | 85,930 | 1,961,845 |
| | | 4,403,828 |
| Italy—2.2% | | |
| Eni | 95,590 | 2,203,881 |
| Telecom Italia | 2,474,730 | 2,043,658 |
| | | 4,247,539 |
| Japan—19.6% | | |
| Aisin Seiki | 47,900 | 2,053,004 |
| Astellas Pharma | 23,500 | 1,201,193 |
| Daito Trust Construction | 17,600 | 1,762,532 |
| Fuji Heavy Industries | 40,000 | 1,112,708 |
| Hitachi | 488,000 | 3,231,233 |
| INPEX | 152,800 | 1,806,249 |
| Isuzu Motors | 269,000 | 1,783,281 |
| ITOCHU | 106,800 | 1,312,170 |
| Japan Tobacco | 70,900 | 2,560,057 |
| KDDI | 72,200 | 3,716,400 |
| Mitsubishi | 102,000 | 2,068,924 |
| Nihon Kohden | 27,100 | 1,111,309 |
| Nippon Shokubai | 111,000 | 1,288,806 |
| Nitto Denko | 14,800 | 969,639 |
| Omron | 38,400 | 1,389,708 |
| Seven & I Holdings | 57,500 | 2,106,166 |
| Sumitomo Metal Mining | 95,000 | 1,346,777 |
| Sumitomo Mitsui Financial Group | 84,700 | 4,112,013 |
| THK | 48,600 | 1,081,945 |
10
| | | |
| Common Stocks (continued) | Shares | | Value ($) |
| Japan (continued) | | | |
| Toyo Suisan Kaisha | 41,000 | | 1,205,206 |
| | | | 37,219,320 |
| Netherlands—5.6% | | | |
| ING Groep | 202,760 | a | 2,300,764 |
| Koninklijke Philips | 93,690 | | 3,021,557 |
| NXP Semiconductors | 51,470 | a | 1,915,199 |
| SBM Offshore | 90,400 | a | 1,791,635 |
| Unilever | 39,830 | | 1,549,993 |
| | | | 10,579,148 |
| Norway—1.6% | | | |
| DNB | 116,270 | | 1,766,051 |
| TGS Nopec Geophysical | 39,274 | | 1,158,218 |
| | | | 2,924,269 |
| Singapore—.5% | | | |
| United Overseas Bank | 58,000 | | 956,389 |
| Spain—.4% | | | |
| Red Electrica | 14,110 | | 805,489 |
| Sweden—3.7% | | | |
| Ericsson, Cl. B | 197,650 | | 2,632,545 |
| Nordea Bank | 189,780 | | 2,292,911 |
| Svenska Cellulosa, Cl. B | 79,740 | | 2,012,075 |
| | | | 6,937,531 |
| Switzerland—9.1% | | | |
| ABB | 104,980 | a | 2,480,011 |
| Adecco | 40,200 | a | 2,871,216 |
| Cie Financiere Richemont | 16,460 | | 1,644,963 |
| Novartis | 61,630 | | 4,737,237 |
| Partners Group Holding | 7,130 | | 1,746,758 |
| Swiss Life Holding | 9,350 | a | 1,770,138 |
| Zurich Insurance Group | 7,660 | a | 1,972,794 |
| | | | 17,223,117 |
The Fund 11
STATEMENT OF INVESTMENTS (continued)
| | | | |
| Common Stocks (continued) | Shares | | | Value ($) |
| United Kingdom—19.0% | | | | |
| Barclays | 784,820 | | | 3,376,655 |
| Compass Group | 103,640 | | | 1,424,848 |
| Diageo | 80,170 | | | 2,547,545 |
| Drax Group | 119,770 | | | 1,324,806 |
| Experian | 85,430 | | | 1,627,207 |
| ITV | 633,880 | | | 1,799,472 |
| Kingfisher | 375,520 | | | 2,343,054 |
| National Grid | 213,670 | | | 2,527,768 |
| Prudential | 167,930 | | | 3,130,665 |
| Rio Tinto | 55,401 | | | 2,713,229 |
| Rolls-Royce Holdings | 102,620 | a | | 1,849,404 |
| Royal Dutch Shell, Cl. B | 90,810 | | | 3,138,644 |
| SABMiller | 31,070 | | | 1,583,834 |
| Shire | 31,570 | | | 1,264,080 |
| Unilever | 51,120 | | | 1,974,350 |
| Whitbread | 14,160 | | | 679,029 |
| William Hill | 127,980 | | | 833,682 |
| WPP | 95,170 | | | 1,959,249 |
| | | | | 36,097,521 |
| United States—1.8% | | | | |
| iShares MSCI EAFE ETF | 52,120 | | | 3,325,308 |
| Total Common Stocks | | | | |
| (cost $161,554,227) | | | | 183,413,382 |
| |
| Preferred Stocks—1.0% | | | | |
| Germany | | | | |
| Volkswagen | | | | |
| (cost $1,879,714) | 7,950 | | | 1,873,913 |
| | Number of | | | |
| Rights—.1% | Rights | | | Value ($) |
| United Kingdom | | | | |
| Barclays | | | | |
| (cost $282,021) | 196,205 | a | 256,493 |
12
| | | |
| Other Investment—.7% | Shares | | Value ($) |
| Registered Investment Company; | | | |
| Dreyfus Institutional Preferred | | | |
| Plus Money Market Fund | | | |
| (cost $1,270,158) | 1,270,158 | b | 1,270,158 |
| |
| Total Investments (cost $164,986,120) | 98.5 | % | 186,813,946 |
| Cash and Receivables (Net) | 1.5 | % | 2,901,034 |
| Net Assets | 100.0 | % | 189,714,980 |
| |
| ETF—Exchange-Traded Fund |
| a | Non-income producing security. |
| b | Investment in affiliated money market mutual fund. |
| | | |
| Portfolio Summary (Unaudited)† | | |
| |
| | Value (%) | | Value (%) |
| Financial | 25.5 | Energy | 5.3 |
| Industrial | 13.1 | Utilities | 4.8 |
| Consumer Discretionary | 11.7 | Telecommunication Services | 4.0 |
| Health Care | 10.1 | Exchange-Traded Funds | 1.8 |
| Consumer Staples | 8.9 | Money Market Investment | .7 |
| Materials | 7.1 | | |
| Information Technology | 5.5 | | 98.5 |
|
| † Based on net assets. |
| See notes to financial statements. |
The Fund 13
STATEMENT OF ASSETS AND LIABILITIES
September 30, 2013
| | | |
| | Cost | Value | |
| Assets ($): | | | |
| Investments in securities—See Statement of Investments: | | | |
| Unaffiliated issuers | 163,715,962 | 185,543,788 | |
| Affiliated issuers | 1,270,158 | 1,270,158 | |
| Cash | | 295,713 | |
| Cash denominated in foreign currencies | 539,776 | 543,822 | |
| Receivable for investment securities sold | | 3,111,744 | |
| Receivable for shares of Beneficial Interest subscribed | | 820,290 | |
| Dividends receivable | | 749,260 | |
| Unrealized appreciation on forward foreign | | | |
| currency exchange contracts—Note 4 | | 4,804 | |
| Prepaid expenses | | 15,786 | |
| | | 192,355,365 | |
| Liabilities ($): | | | |
| Due to The Boston Company Asset | | | |
| Management, LLC and affiliates���Note 3(c) | | 143,324 | |
| Due to Administrator—Note 3(a) | | 15,277 | |
| Payable for investment securities purchased | | 2,347,564 | |
| Payable for shares of Beneficial Interest redeemed | | 52,154 | |
| Unrealized depreciation on forward foreign | | | |
| currency exchange contracts—Note 4 | | 649 | |
| Accrued expenses | | 81,417 | |
| | | 2,640,385 | |
| Net Assets ($) | | 189,714,980 | |
| Composition of Net Assets ($): | | | |
| Paid-in capital | | 228,514,042 | |
| Accumulated undistributed Investment income—net | | 2,185,456 | |
| Accumulated net realized gain (loss) on investments | | (62,823,714 | ) |
| Accumulated net unrealized appreciation (depreciation) | | | |
| on investments and foreign currency transactions | | 21,839,196 | |
| Net Assets ($) | | 189,714,980 | |
| | | |
| Net Asset Value Per Share | | | |
| | Class A | Class C | Class I |
| Net Assets ($) | 51,440,813 | 5,296,629 | 132,977,538 |
| Shares Outstanding | 1,530,569 | 156,923 | 3,928,719 |
| Net Asset Value Per Share ($) | 33.61 | 33.75 | 33.85 |
See notes to financial statements.
14
STATEMENT OF OPERATIONS
Year Ended September 30, 2013
| | |
| Investment Income ($): | | |
| Income: | | |
| Cash dividends (net of $327,253 foreign taxes withheld at source): | | |
| Unaffiliated issuers | 4,416,035 | |
| Affiliated issuers | 784 | |
| Interest | 2,016 | |
| Total Income | 4,418,835 | |
| Expenses: | | |
| Investment advisory fee—Note 3(a) | 1,341,544 | |
| Shareholder servicing costs—Note 3(c) | 194,484 | |
| Administration fee—Note 3(a) | 167,693 | |
| Professional fees | 87,408 | |
| Custodian fees—Note 3(c) | 64,662 | |
| Registration fees | 45,473 | |
| Distribution fees—Note 3(b) | 36,946 | |
| Prospectus and shareholders’ reports | 17,394 | |
| Trustees’ fees and expenses—Note 3(d) | 11,893 | |
| Interest expense—Note 2 | 2,830 | |
| Loan commitment fees—Note 2 | 1,650 | |
| Miscellaneous | 30,933 | |
| Total Expenses | 2,002,910 | |
| Less—reduction in expenses due to undertaking—Note 3(a) | (414,140 | ) |
| Less—reduction in fees due to earnings credits—Note 3(c) | (261 | ) |
| Net Expenses | 1,588,509 | |
| Investment Income—Net | 2,830,326 | |
| Realized and Unrealized Gain (Loss) on Investments—Note 4 ($): | | |
| Net realized gain (loss) on investments and foreign currency transactions | 21,414,496 | |
| Net realized gain (loss) on forward foreign currency exchange contracts | (88,592 | ) |
| Net Realized Gain (Loss) | 21,325,904 | |
| Net unrealized appreciation (depreciation) on | | |
| investments and foreign currency transactions | 15,326,690 | |
| Net unrealized appreciation (depreciation) on | | |
| forward foreign currency exchange contracts | 3,370 | |
| Net Unrealized Appreciation (Depreciation) | 15,330,060 | |
| Net Realized and Unrealized Gain (Loss) on Investments | 36,655,964 | |
| Net Increase in Net Assets Resulting from Operations | 39,486,290 | |
| |
| See notes to financial statements. | | |
The Fund 15
STATEMENT OF CHANGES IN NET ASSETS
| | | | |
| | Year Ended September 30, | |
| | 2013 | | 2012 | a |
| Operations ($): | | | | |
| Investment income—net | 2,830,326 | | 3,879,500 | |
| Net realized gain (loss) on investments | 21,325,904 | | (1,957,830 | ) |
| Net unrealized appreciation | | | | |
| (depreciation) on investments | 15,330,060 | | 25,693,922 | |
| Net Increase (Decrease) in Net Assets | | | | |
| Resulting from Operations | 39,486,290 | | 27,615,592 | |
| Dividends to Shareholders from ($): | | | | |
| Investment income—net: | | | | |
| Class A | (916,011 | ) | (730,805 | ) |
| Class B | — | | (225 | ) |
| Class C | (80,162 | ) | (49,228 | ) |
| Class I | (3,155,753 | ) | (2,819,907 | ) |
| Total Dividends | (4,151,926 | ) | (3,600,165 | ) |
| Beneficial Interest Transactions ($): | | | | |
| Net proceeds from shares sold: | | | | |
| Class A | 13,668,773 | | 2,931,952 | |
| Class B | — | | 2,309 | |
| Class C | 749,103 | | 267,248 | |
| Class I | 6,671,312 | | 20,601,703 | |
| Dividends reinvested: | | | | |
| Class A | 850,275 | | 679,646 | |
| Class B | — | | 176 | |
| Class C | 45,067 | | 28,394 | |
| Class I | 3,153,209 | | 2,819,186 | |
| Cost of shares redeemed: | | | | |
| Class A | (8,319,736 | ) | (9,965,688 | ) |
| Class B | — | | (1,088,963 | ) |
| Class C | (1,249,053 | ) | (1,711,244 | ) |
| Class I | (27,211,978 | ) | (27,850,632 | ) |
| Increase (Decrease) in Net Assets from | | | | |
| Beneficial Interest Transactions | (11,643,028 | ) | (13,285,913 | ) |
| Total Increase (Decrease) in Net Assets | 23,691,336 | | 10,729,514 | |
| Net Assets ($): | | | | |
| Beginning of Period | 166,023,644 | | 155,294,130 | |
| End of Period | 189,714,980 | | 166,023,644 | |
| Undistributed investment income—net | 2,185,456 | | 3,261,711 | |
16
| | | | |
| | Year Ended September 30, | |
| | 2013 | | 2012 | a |
| Capital Share Transactions: | | | | |
| Class Ab,c | | | | |
| Shares sold | 428,289 | | 113,569 | |
| Shares issued for dividends reinvested | 29,813 | | 29,119 | |
| Shares redeemed | (279,778 | ) | (387,173 | ) |
| Net Increase (Decrease) in Shares Outstanding | 178,324 | | (244,485 | ) |
| Class Bc | | | | |
| Shares sold | — | | 87 | |
| Shares issued for dividends reinvested | — | | 7 | |
| Shares redeemed | — | | (41,490 | ) |
| Net Increase (Decrease) in Shares Outstanding | — | | (41,396 | ) |
| Class Cb | | | | |
| Shares sold | 24,273 | | 10,434 | |
| Shares issued for dividends reinvested | 1,564 | | 1,204 | |
| Shares redeemed | (41,009 | ) | (67,736 | ) |
| Net Increase (Decrease) in Shares Outstanding | (15,172 | ) | (56,098 | ) |
| Class I | | | | |
| Shares sold | 213,226 | | 779,783 | |
| Shares issued for dividends reinvested | 110,021 | | 120,375 | |
| Shares redeemed | (921,067 | ) | (1,105,341 | ) |
| Net Increase (Decrease) in Shares Outstanding | (597,820 | ) | (205,183 | ) |
|
| a Effective as of the close of business on March 13, 2012, the fund no longer offers Class B shares. |
| b During the period ended September 30, 2013, 4,066 Class C shares representing $133,228 were exchanged for |
| 4,096 Class A shares. |
| c During the period ended September 30, 2012, 9,179 Class B shares representing $242,940 were automatically |
| converted to 9,256 Class A shares. |
See notes to financial statements.
The Fund 17
FINANCIAL HIGHLIGHTS
The following tables describe the performance for each share class for the fiscal periods indicated. All information (except portfolio turnover rate) reflects financial results for a single fund share.Total return shows how much your investment in the fund would have increased (or decreased) during each period, assuming you had reinvested all dividends and distributions.These figures have been derived from the fund’s financial statements.
| | | | | | | | | | |
| | | | Year Ended September 30, | | | |
| Class A Shares | 2013 | | 2012 | | 2011 | | 2010 | | 2009 | |
| Per Share Data ($): | | | | | | | | | | |
| Net asset value, beginning of period | 27.34 | | 23.42 | | 26.30 | | 26.36 | | 29.26 | |
| Investment Operations: | | | | | | | | | | |
| Investment income—neta | .47 | | .54 | | .52 | | .42 | | .45 | |
| Net realized and unrealized | | | | | | | | | | |
| gain (loss) on investments | 6.52 | | 3.86 | | (2.81 | ) | .06 | | (2.11 | ) |
| Total from Investment Operations | 6.99 | | 4.40 | | (2.29 | ) | .48 | | (1.66 | ) |
| Distributions: | | | | | | | | | | |
| Dividends from investment income—net | (.72 | ) | (.48 | ) | (.59 | ) | (.54 | ) | (1.24 | ) |
| Net asset value, end of period | 33.61 | | 27.34 | | 23.42 | | 26.30 | | 26.36 | |
| Total Return (%)b | 26.02 | | 19.12 | | (9.06 | ) | 1.84 | | (4.73 | ) |
| Ratios/Supplemental Data (%): | | | | | | | | | | |
| Ratio of total expenses | | | | | | | | | | |
| to average net assets | 1.46 | | 1.54 | | 1.50 | | 1.64 | | 1.84 | |
| Ratio of net expenses | | | | | | | | | | |
| to average net assets | 1.12 | | 1.12 | | 1.12 | | 1.12 | | 1.12 | |
| Ratio of net investment income | | | | | | | | | | |
| to average net assets | 1.55 | | 2.12 | | 1.86 | | 1.65 | | 2.12 | |
| Portfolio Turnover Rate | 71.87 | | 64.52 | | 89.90 | | 86.84 | | 160.27 | |
| Net Assets, end of period ($ x 1,000) | 51,441 | | 36,972 | | 37,389 | | 58,526 | | 77,775 | |
| |
| a | Based on average shares outstanding at each month end. |
| b | Exclusive of sales charge. |
See notes to financial statements.
18
| | | | | | | | | | |
| | | | Year Ended September 30, | | | |
| Class C Shares | 2013 | | 2012 | | 2011 | | 2010 | | 2009 | |
| Per Share Data ($): | | | | | | | | | | |
| Net asset value, beginning of period | 27.45 | | 23.44 | | 26.30 | | 26.34 | | 28.82 | |
| Investment Operations: | | | | | | | | | | |
| Investment income—neta | .24 | | .34 | | .33 | | .22 | | .27 | |
| Net realized and unrealized | | | | | | | | | | |
| gain (loss) on investments | 6.55 | | 3.90 | | (2.85 | ) | .06 | | (2.02 | ) |
| Total from Investment Operations | 6.79 | | 4.24 | | (2.52 | ) | .28 | | (1.75 | ) |
| Distributions: | | | | | | | | | | |
| Dividends from investment income—net | (.49 | ) | (.23 | ) | (.34 | ) | (.32 | ) | (.73 | ) |
| Net asset value, end of period | 33.75 | | 27.45 | | 23.44 | | 26.30 | | 26.34 | |
| Total Return (%)b | 25.03 | | 18.24 | | (9.78 | ) | 1.03 | | (5.54 | ) |
| Ratios/Supplemental Data (%): | | | | | | | | | | |
| Ratio of total expenses | | | | | | | | | | |
| to average net assets | 2.27 | | 2.34 | | 2.27 | | 2.46 | | 2.62 | |
| Ratio of net expenses | | | | | | | | | | |
| to average net assets | 1.90 | | 1.90 | | 1.90 | | 1.90 | | 1.90 | |
| Ratio of net investment income | | | | | | | | | | |
| to average net assets | .77 | | 1.33 | | 1.16 | | .87 | | 1.28 | |
| Portfolio Turnover Rate | 71.87 | | 64.52 | | 89.90 | | 86.84 | | 160.27 | |
| Net Assets, end of period ($ x 1,000) | 5,297 | | 4,724 | | 5,348 | | 8,025 | | 10,848 | |
| |
| a | Based on average shares outstanding at each month end. |
| b | Exclusive of sales charge. |
See notes to financial statements.
The Fund 19
FINANCIAL HIGHLIGHTS (continued)
| | | | | | | | | | |
| | | | Year Ended September 30, | | | |
| Class I Shares | 2013 | | 2012 | | 2011 | | 2010 | | 2009 | |
| Per Share Data ($): | | | | | | | | | | |
| Net asset value, beginning of period | 27.47 | | 23.58 | | 26.49 | | 26.60 | | 29.73 | |
| Investment Operations: | | | | | | | | | | |
| Investment income—neta | .54 | | .64 | | .68 | | .55 | | .58 | |
| Net realized and unrealized | | | | | | | | | | |
| gain (loss) on investments | 6.57 | | 3.86 | | (2.93 | ) | .00 | b | (2.27 | ) |
| Total from Investment Operations | 7.11 | | 4.50 | | (2.25 | ) | .55 | | (1.69 | ) |
| Distributions: | | | | | | | | | | |
| Dividends from investment income—net | (.73 | ) | (.61 | ) | (.66 | ) | (.66 | ) | (1.44 | ) |
| Net asset value, end of period | 33.85 | | 27.47 | | 23.58 | | 26.49 | | 26.60 | |
| Total Return (%) | 26.36 | | 19.51 | | (8.86 | ) | 2.06 | | (4.62 | ) |
| Ratios/Supplemental Data (%): | | | | | | | | | | |
| Ratio of total expenses | | | | | | | | | | |
| to average net assets | 1.07 | | 1.10 | | 1.08 | | 1.20 | | 1.26 | |
| Ratio of net expenses | | | | | | | | | | |
| to average net assets | .85 | | .85 | | .85 | | .85 | | .85 | |
| Ratio of net investment income | | | | | | | | | | |
| to average net assets | 1.77 | | 2.49 | | 2.41 | | 2.13 | | 2.58 | |
| Portfolio Turnover Rate | 71.87 | | 64.52 | | 89.90 | | 86.84 | | 160.27 | |
| Net Assets, end of period ($ x 1,000) | 132,978 | | 124,328 | | 111,593 | | 77,931 | | 31,317 | |
| |
| a | Based on average shares outstanding at each month end. |
| b | Amount represents less than $.01 per share. |
See notes to financial statements.
20
NOTES TO FINANCIAL STATEMENTS
NOTE 1—Significant Accounting Policies:
Dreyfus International Equity Fund (the “fund”) is a separate diversified series of Dreyfus Stock Funds (the “Company”), which is registered under the Investment Company Act of 1940, as amended (the “Act”), as an open-end management investment company and operates as a series company currently offering two series, including the fund.The fund’s investment objective is to seek long-term growth of capital.The Boston Company Asset Management, LLC (“TBCAM”), a wholly-owned subsidiary of The Bank of New York Mellon Corporation (“BNY Mellon”), serves as the fund’s investment adviser.The Dreyfus Corporation (the “Administrator” or “Dreyfus”), a wholly-owned subsidiary of BNY Mellon and an affiliate of TBCAM, serves as the fund’s Administrator.
MBSC Securities Corporation (the “Distributor”), a wholly-owned subsidiary of Dreyfus, is the distributor of the fund’s shares. The fund is authorized to issue an unlimited number of $.001 par value shares of Beneficial Interest in each of the following classes of shares: Class A, Class C and Class I. Class A shares generally are subject to a sales charge imposed at the time of purchase. Class C shares are subject to a contingent deferred sales charge (“CDSC”) imposed on Class C shares redeemed within one year of purchase. Class I shares are sold at net asset value per share only to institutional investors. Other differences between the classes include the services offered to and the expenses borne by each class, the allocation of certain transfer agency costs and certain voting rights. Income, expenses (other than expenses attributable to a specific class), and realized and unrealized gains or losses on investments are allocated to each class of shares based on its relative net assets.
The Company accounts separately for the assets, liabilities and operations of each series. Expenses directly attributable to each series are
The Fund 21
NOTES TO FINANCIAL STATEMENTS (continued)
charged to that series’ operations; expenses which are applicable to all series are allocated among them on a pro rata basis.
The Financial Accounting Standards Board (“FASB”) Accounting Standards Codification is the exclusive reference of authoritative U.S. generally accepted accounting principles (“GAAP”) recognized by the FASB to be applied by nongovernmental entities. Rules and interpretive releases of the Securities and Exchange Commission (“SEC”) under authority of federal laws are also sources of authoritative GAAP for SEC registrants. The fund’s financial statements are prepared in accordance with GAAP, which may require the use of management estimates and assumptions.Actual results could differ from those estimates.
The Company enters into contracts that contain a variety of indemnifications. The fund’s maximum exposure under these arrangements is unknown.The fund does not anticipate recognizing any loss related to these arrangements.
(a) Portfolio valuation: The fair value of a financial instrument is the amount that would be received to sell an asset or paid to transfer a liability in an orderly transaction between market participants at the measurement date (i.e., the exit price). GAAP establishes a fair value hierarchy that prioritizes the inputs of valuation techniques used to measure fair value. This hierarchy gives the highest priority to unadjusted quoted prices in active markets for identical assets or liabilities (Level 1 measurements) and the lowest priority to unobservable inputs (Level 3 measurements).
Additionally, GAAP provides guidance on determining whether the volume and activity in a market has decreased significantly and whether such a decrease in activity results in transactions that are not orderly. GAAP requires enhanced disclosures around valuation inputs and techniques used during annual and interim periods.
22
Various inputs are used in determining the value of the fund’s investments relating to fair value measurements.These inputs are summarized in the three broad levels listed below:
Level 1—unadjusted quoted prices in active markets for identical investments.
Level 2—other significant observable inputs (including quoted prices for similar investments, interest rates, prepayment speeds, credit risk, etc.).
Level 3—significant unobservable inputs (including the fund’s own assumptions in determining the fair value of investments).
The inputs or methodology used for valuing securities are not necessarily an indication of the risk associated with investing in those securities.
Changes in valuation techniques may result in transfers in or out of an assigned level within the disclosure hierarchy. Valuation techniques used to value the fund’s investments are as follows:
Investments in securities are valued at the last sales price on the securities exchange or national securities market on which such securities are primarily traded. Securities listed on the National Market System for which market quotations are available are valued at the official closing price or, if there is no official closing price that day, at the last sales price. Securities not listed on an exchange or the national securities market, or securities for which there were no transactions, are valued at the average of the most recent bid and asked prices, except for open short positions, where the asked price is used for valuation purposes. Bid price is used when no asked price is available. Registered investment companies that are not traded on an exchange are valued at their net asset value. All of the preceding securities are categorized within Level 1 of the fair value hierarchy.
The Fund 23
NOTES TO FINANCIAL STATEMENTS (continued)
Fair valuing of securities may be determined with the assistance of a pricing service using calculations based on indices of domestic securities and other appropriate indicators, such as prices of relevant American Depository Receipts and financial futures. Utilizing these techniques may result in transfers between Level 1 and Level 2 of the fair value hierarchy.
When market quotations or official closing prices are not readily available, or are determined not to reflect accurately fair value, such as when the value of a security has been significantly affected by events after the close of the exchange or market on which the security is principally traded (for example, a foreign exchange or market), but before the fund calculates its net asset value, the fund may value these investments at fair value as determined in accordance with the procedures approved by the Company’s Board of Trustees (the “Board”). Certain factors may be considered when fair valuing investments such as: fundamental analytical data, the nature and duration of restrictions on disposition, an evaluation of the forces that influence the market in which the securities are purchased and sold, and public trading in similar securities of the issuer or comparable issuers. These securities are either categorized within Level 2 or 3 of the fair value hierarchy depending on the relevant inputs used.
For restricted securities where observable inputs are limited, assumptions about market activity and risk are used and are categorized within Level 3 of the fair value hierarchy.
Investments denominated in foreign currencies are translated to U.S. dollars at the prevailing rates of exchange.
Forward foreign currency exchange contracts (“forward contracts”) are valued at the forward rate and are generally categorized within Level 2 of the fair value hierarchy.
24
The following is a summary of the inputs used as of September 30, 2013 in valuing the fund’s investments:
| | | | | | |
| | | Level 2—Other | | Level 3— | | |
| | Level 1— | Significant | | Significant | | |
| | Unadjusted | Observable | | Unobservable | | |
| | Quoted Prices | Inputs | | Inputs | Total | |
| Assets ($) | | | | | | |
| Investments in Securities: | | | | | |
| Equity Securities— | | | | | | |
| Foreign | | | | | | |
| Common Stocks† | 1,915,199 | 178,172,875 | †† | — | 180,088,074 | |
| Exchange-Traded | | | | | | |
| Funds | 3,325,308 | — | | — | 3,325,308 | |
| Mutual Funds | 1,270,158 | — | | — | 1,270,158 | |
| Preferred Stocks† | 1,873,913 | — | | — | 1,873,913 | |
| Rights† | 256,493 | — | | — | 256,493 | |
| Other Financial | | | | | | |
| Instruments: | | | | | | |
| Forward Foreign | | | | | | |
| Currency Exchange | | | | | | |
| Contracts††† | — | 4,804 | | — | 4,804 | |
| Liabilities ($) | | | | | | |
| Other Financial | | | | | | |
| Instruments: | | | | | | |
| Forward Foreign | | | | | | |
| Currency Exchange | | | | | | |
| Contracts††† | — | (649 | ) | — | (649 | ) |
| |
| † | See Statement of Investments for additional detailed categorizations. |
| †† | Securities classified as Level 2 at period end as the values were determined pursuant to the fund’s |
| | fair valuation procedures. |
| ††† Amount shown represents unrealized appreciation (depreciation) at period end. |
At September 30, 2012, there were no transfers between Level 1 and Level 2 of the fair value hierarchy.
(b) Foreign currency transactions: The fund does not isolate that portion of the results of operations resulting from changes in foreign
The Fund 25
NOTES TO FINANCIAL STATEMENTS (continued)
exchange rates on investments from the fluctuations arising from changes in the market prices of securities held. Such fluctuations are included with the net realized and unrealized gain or loss on investments.
Net realized foreign exchange gains or losses arise from sales of foreign currencies, currency gains or losses realized on securities transactions between trade and settlement date, and the difference between the amounts of dividends, interest and foreign withholding taxes recorded on the fund’s books and the U.S. dollar equivalent of the amounts actually received or paid. Net unrealized foreign exchange gains and losses arise from changes in the value of assets and liabilities other than investments resulting from changes in exchange rates. Foreign currency gains and losses on foreign currency transactions are also included with net realized and unrealized gain or loss on investments.
(c) Securities transactions and investment income: Securities transactions are recorded on a trade date basis. Realized gains and losses from securities transactions are recorded on the identified cost basis. Dividend income is recognized on the ex-dividend date and interest income, including, where applicable, accretion of discount and amortization of premium on investments, is recognized on the accrual basis.
(d) Affiliated issuers: Investments in other investment companies advised by Dreyfus are defined as “affiliated” under the Act. Investments in affiliated investment companies during the period ended September 30, 2013 were as follows:
| | | | | | | |
| Affiliated | | | | | | | |
| Investment | Value | | | | Value | | Net |
| Company | 9/30/2012 | ($) | Purchases ($) | Sales ($) | 9/30/2013 | ($) | Assets (%) |
| Dreyfus | | | | | | | |
| Institutional | | | | | | | |
| Preferred | | | | | | | |
| Plus Money | | | | | | | |
| Market Fund | 97,993 | | 37,498,953 | 36,326,788 | 1,270,158 | | .7 |
(e) Risk: Investing in foreign markets may involve special risks and considerations not typically associated with investing in the U.S.These risks include revaluation of currencies, high rates of inflation, repatriation restrictions on income and capital, and adverse political and economic
26
developments. Moreover, securities issued in these markets may be less liquid, subject to government ownership controls and delayed settlements, and their prices may be more volatile than those of comparable securities in the U.S.
(f) Dividends to shareholders: Dividends are recorded on the ex-dividend date. Dividends from investment income-net and dividends from net realized capital gains, if any, are normally declared and paid annually, but the fund may make distributions on a more frequent basis to comply with the distribution requirements of the Internal Revenue Code of 1986, as amended (the “Code”).To the extent that net realized capital gains can be offset by capital loss carryovers, it is the policy of the fund not to distribute such gains. Income and capital gain distributions are determined in accordance with income tax regulations, which may differ from GAAP.
(g) Federal income taxes: It is the policy of the fund to continue to qualify as a regulated investment company, if such qualification is in the best interests of its shareholders, by complying with the applicable provisions of the Code, and to make distributions of taxable income sufficient to relieve it from substantially all federal income and excise taxes.
As of and during the period ended September 30, 2013, the fund did not have any liabilities for any uncertain tax positions.The fund recognizes interest and penalties, if any, related to uncertain tax positions as income tax expense in the Statement of Operations. During the period ended September 30, 2013, the fund did not incur any interest or penalties.
Each tax year in the four-year period ended September 30, 2013 remains subject to examination by the Internal Revenue Service and state taxing authorities.
At September 30, 2013, the components of accumulated earnings on a tax basis were as follows: undistributed ordinary income $2,353,577, accumulated capital losses $62,769,809 and unrealized appreciation $21,617,170.
The Fund 27
NOTES TO FINANCIAL STATEMENTS (continued)
Under the Regulated Investment Company Modernization Act of 2010 (the “2010 Act”), the fund is permitted to carry forward capital losses incurred in taxable years beginning after December 22, 2010 (“post-enactment losses”) for an unlimited period. Furthermore, post-enactment capital loss carryovers retain their character as either short-term or long-term capital losses rather than short-term as they were under previous statute.The 2010 Act requires post-enactment losses to be utilized before the utilization of losses incurred in taxable years prior to the effective date of the 2010 Act (“pre-enactment losses”).As a result of this ordering rule, pre-enactment losses may be more likely to expire unused.
The accumulated capital loss carryover is available for federal income tax purposes to be applied against future net realized capital gains, if any, realized subsequent to September 30, 2013. If not applied, $14,897,672 of the carryover expires in fiscal year 2017 and $47,872,137 expires in fiscal year 2018.
The tax character of distributions paid to shareholders during the fiscal periods ended September 30, 2013 and September 30, 2012 were as follows: ordinary income $4,151,926 and $3,600,165, respectively.
During the period ended September 30, 2013, as a result of permanent book to tax differences, primarily due to the tax treatment for passive foreign investment companies, foreign currency gains and losses and recognition of book to tax differences resulting from prior year fund restructuring, the fund increased accumulated undistributed investment income-net by $245,345, decreased accumulated net realized gain (loss) on investments by $268,528 and increased paid-in capital by $23,183. Net assets and net asset value per share were not affected by this reclassification.
(h) Accounting Pronouncement: In January 2013, FASB issued Accounting Standards Update No. 2013-01 (“ASU 2013-01”), “Clarifying the Scope of Disclosures about Offsetting Assets and Liabilities”, which replaced Accounting Standards Update No. 2011-11
28
(“ASU 2011-11”), “Disclosures about Offsetting Assets and Liabilities”. ASU 2013-01 is effective for fiscal years beginning on or after January 1, 2013, and interim periods within those annual periods. ASU 2011-11 was intended to enhance disclosure requirements on the offsetting of financial assets and liabilities.ASU 2013-01 limits the scope of the new balance sheet offsetting disclosures to derivatives, repurchase agreements, and securities lending transactions to the extent that they are (1) offset in the financial statements or (2) subject to enforceable master netting arrangements (“MNA”) or similar agreements. Management is currently evaluating the application of ASU 2013-01 and its impact on the fund’s financial statements.
NOTE 2—Bank Lines of Credit:
The fund participates with other Dreyfus-managed funds in a $210 million unsecured credit facility led by Citibank, N.A. and a $300 million unsecured credit facility provided by The Bank of New York Mellon, a subsidiary of BNY Mellon and an affiliate of Dreyfus (each, a “Facility”), each to be utilized primarily for temporary or emergency purposes, including the financing of redemptions. Prior to October 10, 2012, the unsecured credit facility with Citibank, N.A. was $225 million. In connection therewith, the fund has agreed to pay its pro rata portion of commitment fees for each Facility. Interest is charged to the fund based on rates determined pursuant to the terms of the respective Facility at the time of borrowing.
The average amount of borrowings outstanding under the Facilities during the period ended September 30, 2013 was approximately $248,500 with a related weighted average annualized interest rate of 1.14%.
NOTE 3—Investment Advisory Fee, Administration Fee and Other Transactions With Affiliates:
(a) Pursuant to an investment advisory agreement with TBCAM, the investment advisory fee is computed at the annual rate of .80% of the value of the fund’s average daily net assets up to $500 million, .75% of the
The Fund 29
NOTES TO FINANCIAL STATEMENTS (continued)
next $500 million of such assets, .70% of the next $500 million of such assets, .60% of the next $500 million of such assets and .50% of the fund’s average daily net assets in excess of $2 billion and is payable monthly.
Dreyfus and TBCAM contractually agreed, with respect to each class of shares to assume the expenses of the fund, from October 1, 2012 through September 30, 2013, so that the expenses of Class A, Class C and Class I shares (excluding taxes, interest expense, brokerage commissions, commitment fees on borrowings and extraordinary expenses) do not exceed 1.12%, 1.90% and .85%, respectively, of the value of such class’ average daily net assets.The reduction in expenses, pursuant to the undertaking, amounted to $414,140 during the period ended September 30, 2013.
The fund compensates Dreyfus under an administration agreement for providing personnel and facilities to perform accounting and administration services for the fund at an annual rate of .10% of the value of the fund’s average daily net assets. During the period ended September 30, 2013, the fund was charged $167,693 pursuant to the administration agreement.
During the period ended September 30, 2013, the Distributor retained $926 from commissions earned on sales of the fund’s Class A shares and $48 from CDSCs on redemptions of the fund’s Class C shares.
(b) Under the Distribution Plan adopted pursuant to Rule 12b-1 under the Act, Class C shares pay the Distributor for distributing its shares at an annual rate of .75% of the value of its average daily net assets. During the period ended September 30, 2013, Class C shares were charged $36,946 pursuant to the Distribution Plan.
(c) Under the Shareholder Services Plan, Class A and Class C shares pay the Distributor at an annual rate of .25% of the value of their average daily net assets for the provision of certain services. The services provided may include personal services relating to shareholder accounts, such as answering shareholder inquiries regarding the fund and provid-
30
ing reports and other information, and services related to the maintenance of shareholder accounts.The Distributor may make payments to Service Agents (securities dealers, financial institutions or other industry professionals) with respect to these services.The Distributor determines the amounts to be paid to Service Agents. During the period ended September 30, 2013, Class A and Class C shares were charged $98,637 and $12,315, respectively, pursuant to the Shareholder Services Plan.
The fund has arrangements with the transfer agent and the custodian whereby the fund may receive earnings credits when positive cash balances are maintained, which are used to offset transfer agency and custody fees. For financial reporting purposes, the fund includes net earnings credits as an expense offset in the Statement of Operations.
The fund compensates DreyfusTransfer, Inc., a wholly-owned subsidiary of Dreyfus, under a transfer agency agreement for providing transfer agency services for the fund and cash management services related to fund subscriptions and redemptions. During the period ended September 30, 2013, the fund was charged $45,315 for transfer agency services and $2,110 for cash management services. These fees are included in Shareholder servicing costs in the Statement of Operations. Cash management fees were partially offset by earnings credits of $256.
The fund compensates The Bank of New York Mellon under a custody agreement for providing custodial services for the fund. During the period ended September 30, 2013, the fund was charged $64,662 pursuant to the custody agreement.
The fund compensates The Bank of New York Mellon under a cash management agreement for performing certain cash management services related to fund subscriptions and redemptions. During the period ended September 30, 2013, the fund was charged $1,100 pursuant to the cash management agreement, which is included in Shareholder servicing costs in the Statement of Operations.These fees were partially offset by earnings credits of $5.
The Fund 31
NOTES TO FINANCIAL STATEMENTS (continued)
During the period ended September 30, 2013, the fund was charged $9,045 for services performed by the Chief Compliance Officer and his staff.
The components of “Due to TBCAM and affiliates” in the Statement of Assets and Liabilities consist of: investment advisory fees $122,211, Distribution Plan fees $3,242, Shareholder Services Plan fees $11,459, custodian fees $21,004, Chief Compliance Officer fees $6,948 and transfer agency fees $12,041, which are offset against an expense reimbursement currently in effect in the amount of $33,581.
(d) Each Board member also serves as a Board member of other funds within the Dreyfus complex. Annual retainer fees and attendance fees are allocated to each fund based on net assets.
NOTE 4—Securities Transactions:
The aggregate amount of purchases and sales of investment securities, excluding short-term securities and forward contracts, during the period ended September 30, 2013, amounted to $118,836,565 and $133,715,477, respectively.
Derivatives: A derivative is a financial instrument whose performance is derived from the performance of another asset. Each type of derivative instrument that was held by the fund during the period ended September 30, 2013 is discussed below.
Forward Foreign Currency Exchange Contracts: The fund enters into forward contracts in order to hedge its exposure to changes in foreign currency exchange rates on its foreign portfolio holdings, to settle foreign currency transactions or as a part of its investment strategy. When executing forward contracts, the fund is obligated to buy or sell a foreign currency at a specified rate on a certain date in the future. With respect to sales of forward contracts, the fund incurs a loss if the value of the contract increases between the date the forward contract is opened and the date the forward contract is closed.The fund realizes
32
a gain if the value of the contract decreases between those dates.With respect to purchases of forward contracts, the fund incurs a loss if the value of the contract decreases between the date the forward contract is opened and the date the forward contract is closed.The fund realizes a gain if the value of the contract increases between those dates. Any realized or unrealized gains or losses which occurred during the period are reflected in the Statement of Operations. The fund is exposed to foreign currency risk as a result of changes in value of underlying financial instruments.The fund is also exposed to credit risk associated with counterparty nonperformance on these forward contracts, which is generally limited to the unrealized gain on each open contract.The following summarizes open forward contracts at September 30, 2013:
| | | | | |
| | Foreign | | | Unrealized | |
| Forward Foreign Currency | Currency | | | Appreciation | |
| Exchange Contracts | Amounts | Cost ($) | Value ($) | (Depreciation) ($) | |
| Purchases: | | | | | |
| British Pound, | | | | | |
| Expiring 10/2/2013a | 362,980 | 586,002 | 587,631 | 1,629 | |
| Euro, | | | | | |
| Expiring 10/2/2013b | 625,536 | 846,763 | 846,257 | (506 | ) |
| Sales: | | Proceeds ($) | | | |
| Euro, | | | | | |
| Expiring 10/1/2013c | 922,809 | 1,251,598 | 1,248,423 | 3,175 | |
| Japanese Yen, | | | | | |
| Expiring 10/1/2013d | 7,337,087 | 74,606 | 74,644 | (38 | ) |
| Singapore Dollar, | | | | | |
| Expiring 10/1/2013c | 360,519 | 287,264 | 287,369 | (105 | ) |
| Gross Unrealized | | | | | |
| Appreciation | | | | 4,804 | |
| Gross Unrealized | | | | | |
| Depreciation | | | | (649 | ) |
| |
| Counterparties: | | | | | |
| a Morgan Stanley Capital Services | | | | |
| b JP Morgan Chase Bank | | | | | |
| c Citigroup | | | | | |
| d Goldman Sachs International | | | | | |
The Fund 33
NOTES TO FINANCIAL STATEMENTS (continued)
The following summarizes the average market value of derivatives outstanding during the period ended September 30, 2013:
| |
| | Average Market Value ($) |
| Forward contracts | 2,189,787 |
At September 30, 2013, the cost of investments for federal income tax purposes was $165,208,146; accordingly, accumulated net unrealized appreciation on investments was $21,605,800, consisting of $26,372,310 gross unrealized appreciation and $4,766,510 gross unrealized depreciation.
34
REPORT OF INDEPENDENT REGISTERED
PUBLIC ACCOUNTING FIRM
Shareholders and Board of Trustees
Dreyfus International Equity Fund
We have audited the accompanying statement of assets and liabilities, including the statement of investments, of Dreyfus International Equity Fund (one of the series comprising Dreyfus Stock Funds) as of September 30, 2013, and the related statement of operations for the year then ended, the statement of changes in net assets for each of the two years in the period then ended, and the financial highlights for each of the five years in the period then ended.These financial statements and financial highlights are the responsibility of the Fund’s management. Our responsibility is to express an opinion on these financial statements and financial highlights based on our audits.
We conducted our audits in accordance with the standards of the Public Company Accounting Oversight Board (United States).Those standards require that we plan and perform the audit to obtain reasonable assurance about whether the financial statements and financial highlights are free of material misstatement.We were not engaged to perform an audit of the Fund’s internal control over financial reporting. Our audits included consideration of internal control over financial reporting as a basis for designing audit procedures that are appropriate in the circumstances, but not for the purpose of expressing an opinion on the effectiveness of the Fund’s internal control over financial reporting. Accordingly, we express no such opinion. An audit also includes examining, on a test basis, evidence supporting the amounts and disclosures in the financial statements and financial highlights, assessing the accounting principles used and significant estimates made by management, and evaluating the overall financial statement presentation. Our procedures included confirmation of securities owned as of September 30, 2013 by correspondence with the custodian and others. We believe that our audits provide a reasonable basis for our opinion.
In our opinion, the financial statements and financial highlights referred to above present fairly, in all material respects, the financial position of Dreyfus International Equity Fund at September 30, 2013, the results of its operations for the year then ended, the changes in its net assets for each of the two years in the period then ended, and the financial highlights for each of the five years in the period then ended, in conformity with U.S. generally accepted accounting principles.

New York, New York
November 26, 2013
The Fund 35
IMPORTANT TAX INFORMATION (Unaudited)
In accordance with federal tax law, the fund elects to provide each shareholder with their portion of the fund’s foreign taxes paid and the income sourced from foreign countries. Accordingly, the fund hereby reports the following information regarding its fiscal year ended September 30, 2013:
—the total amount of taxes paid to foreign countries was $253,637
—the total amount of income sourced from foreign countries was $4,713,007.
As required by federal tax law rules, shareholders will receive notification of their proportionate share of foreign taxes paid and foreign sourced income for the 2013 calendar year with Form 1099-DIV which will be mailed in early 2014.Also, certain dividends paid by the fund may be subject to a maximum tax rate of 15%, as provided for by the Jobs and Growth Tax Relief Reconciliation Act of 2003. Of the distributions paid during the fiscal year, $4,151,926 represents the maximum amount that may be considered qualified dividend income.
36
BOARD MEMBERS INFORMATION (Unaudited)
|
| Joseph S. DiMartino (69) |
| Chairman of the Board (2003) |
| Principal Occupation During Past 5Years: |
| • Corporate Director and Trustee |
| Other Public Company Board Memberships During Past 5Years: |
| • CBIZ (formerly, Century Business Services, Inc.), a provider of outsourcing functions for small |
| and medium size companies, Director (1997-present) |
| • Sunair Services Corporation, a provider of certain outdoor-related services to homes and |
| businesses, Director (2005-2009) |
| • The Newark Group, a provider of a national market of paper recovery facilities, paperboard |
| mills and paperboard converting plants, Director (2000-2010) |
| No. of Portfolios for which Board Member Serves: 141 |
| ——————— |
| William Hodding Carter III (78) |
| Board Member (2003) |
| Principal Occupation During Past 5Years: |
| • Professor of Leadership & Public Policy, University of North Carolina, Chapel Hill (2006-present) |
| No. of Portfolios for which Board Member Serves: 24 |
| ——————— |
| Gordon J. Davis (72) |
| Board Member (2006) |
| Principal Occupation During Past 5Years: |
| • Partner in the law firm of Venable LLP (2012-present) |
| • Partner in the law firm of Dewey & LeBoeuf LLP (1994-2012) |
| Other Public Company Board Memberships During Past 5Years: |
| • Consolidated Edison, Inc., a utility company, Director (1997-present) |
| • The Phoenix Companies, Inc., a life insurance company, Director (2000-present) |
| No. of Portfolios for which Board Member Serves: 49 |
| ——————— |
| Joni Evans (71) |
| Board Member (2006) |
| Principal Occupation During Past 5Years: |
| • Chief Executive Officer, www.wowOwow.com an online community dedicated to women’s |
| conversations and publications (2007-present) |
| • Principal, Joni Evans Ltd. (publishing) (2006-present) |
| No. of Portfolios for which Board Member Serves: 24 |
The Fund 37
BOARD MEMBERS INFORMATION (Unaudited) (continued)
|
| Ehud Houminer (73) |
| Board Member (2003) |
| Principal Occupation During Past 5Years: |
| • Executive-in-Residence at the Columbia Business School, Columbia University (1992-present) |
| Other Public Company Board Memberships During Past 5Years: |
| • Avnet Inc., an electronics distributor, Director (1993-2012) |
| No. of Portfolios for which Board Member Serves: 66 |
| ——————— |
| Richard C. Leone (73) |
| Board Member (1984) |
| Principal Occupation During Past 5Years: |
| • Senior Fellow and former President of The Century Foundation (formerly,The Twentieth |
| Century Fund, Inc.), a tax exempt research foundation engaged in the study of economic, |
| foreign policy and domestic issues |
| No. of Portfolios for which Board Member Serves: 24 |
| ——————— |
| Hans C. Mautner (75) |
| Board Member (2003) |
| Principal Occupation During Past 5Years: |
| • President—International Division and an Advisory Director of Simon Property Group, a real |
| estate investment company (1998-2010) |
| • Chairman and Chief Executive Officer of Simon Global Limited (1999-2010) |
| No. of Portfolios for which Board Member Serves: 24 |
| ——————— |
| Robin A. Melvin (50) |
| Board Member (2003) |
| Principal Occupation During Past 5Years: |
| • Director, Boisi Family Foundation, a private family foundation that supports youth-serving orga- |
| nizations that promote the self sufficiency of youth from disadvantaged circumstances (1995-2012) |
| • Board Member, Illinois Mentoring Partnership, non-profit organization dedicated to increasing |
| the quantity and quality of mentoring services in Illinois (2013-present) |
| No. of Portfolios for which Board Member Serves: 90 |
38
|
| Burton N. Wallack (62) |
| Board Member (2006) |
| Principal Occupation During Past 5Years: |
| • President and Co-owner of Wallack Management Company, a real estate management company |
| No. of Portfolios for which Board Member Serves: 24 |
| ——————— |
| John E. Zuccotti (76) |
| Board Member (2003) |
| Principal Occupation During Past 5Years: |
| • Chairman of Brookfield Properties, Inc. |
| • Senior Counsel of Weil, Gotshal & Manges, LLP |
| • Emeritus Chairman of the Real Estate Board of New York |
| Other Public Company Board Memberships During Past 5Years: |
| • Wellpoint, Inc., a health benefits company, Director (2005-2010) |
| No. of Portfolios for which Board Member Serves: 24 |
| ——————— |
| Once elected all Board Members serve for an indefinite term, but achieve Emeritus status upon reaching age 80.The |
| address of the Board Members and Officers is c/o The Dreyfus Corporation, 200 Park Avenue, NewYork, NewYork |
| 10166.Additional information about the Board Members is available in the fund’s Statement of Additional Information |
| which can be obtained from Dreyfus free of charge by calling this toll free number: 1-800-DREYFUS. |
| David W. Burke, Emeritus Board Member |
| Arnold S. Hiatt, Emeritus Board Member |
The Fund 39
OFFICERS OF THE FUND (Unaudited)

40
The Fund 41
|
| Dreyfus |
| Small Cap |
| Equity Fund |
ANNUAL REPORT September 30, 2013

Save time. Save paper. View your next shareholder report online as soon as it’s available. Log into www.dreyfus.com and sign up for Dreyfus eCommunications. It’s simple and only takes a few minutes.
The views expressed in this report reflect those of the portfolio manager only through the end of the period covered and do not necessarily represent the views of Dreyfus or any other person in the Dreyfus organization. Any such views are subject to change at any time based upon market or other conditions and Dreyfus disclaims any responsibility to update such views.These views may not be relied on as investment advice and, because investment decisions for a Dreyfus fund are based on numerous factors, may not be relied on as an indication of trading intent on behalf of any Dreyfus fund.
| | Contents |
| | THE FUND |
| 2 | A Letter from the President |
| 3 | Discussion of Fund Performance |
| 6 | Fund Performance |
| 8 | Understanding Your Fund’s Expenses |
| 8 | Comparing Your Fund’s Expenses With Those of Other Funds |
| 9 | Statement of Investments |
| 14 | Statement of Assets and Liabilities |
| 15 | Statement of Operations |
| 16 | Statement of Changes in Net Assets |
| 18 | Financial Highlights |
| 21 | Notes to Financial Statements |
| 32 | Report of Independent Registered Public Accounting Firm |
| 33 | Important Tax Information |
| 34 | Board Members Information |
| 37 | Officers of the Fund |
| | FOR MORE INFORMATION |
| | Back Cover |
Dreyfus
Small Cap Equity Fund
The Fund
A LETTER FROM THE PRESIDENT
Dear Shareholder:
This annual report for Dreyfus Small Cap Equity Fund covers the 12-month period from October 1, 2012, through September 30, 2013. For information about how the fund performed during the reporting period, as well as general market perspectives, we provide a Discussion of Fund Performance on the pages that follow.
Improved U.S. economic conditions drove stock prices higher over much of the reporting period, enabling several major stock market indices to reach new record highs during the spring of 2012. However, expectations of higher long-term interest rates and a less aggressively stimulative monetary policy subsequently caused equities to give back a portion of their gains. Nonetheless, stocks across most capitalization ranges and investment styles produced strong results for the reporting period overall.
We currently expect U.S. economic conditions to continue to improve in 2014, with accelerating growth supported by the fading drags of tighter federal fiscal policies and downsizing on the state and local levels. Moreover, inflation is likely to remain muted, so monetary policy can remain stimulative. Globally, we anticipate stronger growth in many developed countries due to past and continuing monetary ease, while emerging markets seem poised for moderate economic expansion despite recently negative investor sentiment. For more information on how these observations may affect your investments, we encourage you to speak with your financial advisor.
Thank you for your continued confidence and support.
Sincerely,

J. Charles Cardona
President
The Dreyfus Corporation
October 15, 2013
2
DISCUSSION OF FUND PERFORMANCE
For the period of October 1, 2012, through September 30, 2013, as provided by Joseph M. Corrado, CFA, Stephanie K. Brandaleone, CFA, and Edward R. Walter, CFA, Portfolio Managers
Fund and Market Performance Overview
For the 12-month period ended September 30, 2013, Dreyfus Small Cap Equity Fund’s Class A shares achieved a total return of 26.08%, Class C shares returned 25.05%, and Class I shares returned 26.35%.1 The fund’s benchmark, the Russell 2500 Value Index (the “Index”), achieved a total return of 27.58% for the same period.2
Small- and midcap stocks rallied strongly over the reporting period as investors responded to improving economic data. Despite strong absolute returns, the fund’s returns lagged its benchmark, primarily due to shortfalls in the industrials and information technology sectors.
The Fund’s Investment Approach
The fund seeks long-term growth of capital.The fund invests, under normal circumstances, at least 80% of its net assets in the stocks of small-cap U.S. companies.
We seek to identify companies with stocks trading at prices below their intrinsic values. We measure value by evaluating each company’s valuation multiples (price/earnings, price/sales, price/cash flow), current competitive position, and expected business growth relative to its industry. We focus primarily on individual stock selection to produce a diversified portfolio of companies that we believe are undervalued relative to expected business growth, with the presence of a catalyst (such as a corporate restructuring, change in management, or spin-off) that may trigger a price increase.
Recovering Economy Fueled Market Gains
The reporting period began near the outset of a sustained stock market rally driven by improved U.S. employment and housing market data, and the launch of a new round of quantitative easing by the Federal Reserve Board (the “Fed”). Improving conditions in overseas markets also contributed to greater investor optimism.
The Fund 3
DISCUSSION OF FUND PERFORMANCE (continued)
Economic data continued to improve, and stocks generally continued to rally, through the spring of 2013, driving several measures of stock market performance to new record highs. In late May, remarks by Fed chairman Ben Bernanke were widely interpreted as a signal that U.S. monetary policymakers would back away from their quantitative easing program sooner than expected, sparking heightened volatility that erased some of the stock market’s previous gains. Equity markets stabilized over the summer when investors returned their focus to company and market fundamentals. Despite concerns regarding an impending federal government shutdown, stocks surged in September when the Fed delayed tapering its quantitative easing program.
Fund Participated in Most of the Market’s Gains
Although the fund also advanced strongly over the reporting period, its relative performance was mildly constrained by some disappointing security selections. In the industrials sector, aircraft parts maker Spirit AeroSystems Holdings and wheels-and-tires producer Titan International failed to meet our expectations for fundamental improvement, prompting their elimination from the portfolio, but not before their relatively weak performance dampened the fund’s relative results. In the information technology sector, holdings in the semiconductors, communications equipment, and software industries were hurt by deferred orders and capital spending among their business customers. We believe that this development is temporary, and pent-up enterprise demand is likely to bolster the earnings of these companies over the intermediate-term.
The fund achieved better relative results in the health care sector, where robust sales of a new antibiotic drove a substantial gain in the stock price of Salix Pharmaceuticals. The fund also benefited from positions in companies expected to benefit from implementation of the Affordable Care Act, including hospitals operator Universal Health Services, rehabilitation facilities specialist HealthSouth, and pharmacy services provider Omnicare. In the energy sector, Cabot Oil & Gas announced prolific oil-and-gas production results stemming from successful drilling operations. The fund’s energy services holdings also fared well, including Oceaneering International, Helix Energy Solutions Group, and Helmerich & Payne. In the consumer discretionary sector, the fund has identified a number of companies in the midst of fundamental turnarounds, including casual footwear maker Deckers Outdoor, recreational products seller Brunswick, recreational vehicles manufacturer Thor
4
Industries, and electronics retailer Best Buy. Finally, two consumer discretionary holdings—apparel manufacturer Warnaco Group and retailer Saks—were acquired during the reporting period at substantial premiums to their stock prices at the time.
Finding Ample Opportunities Among Individual Stocks
We currently expect heightened market volatility to persist due to ongoing fiscal uncertainty, which may temporarily hurt companies that rely on government spending. However, these short-term challenges appear unlikely to tarnish what we believe to be a positive long-term outlook for equities.
After strong gains over the past two years, selectivity has become more critical to success in the small- and midcap markets. Investor skepticism about near-term earnings prospects has led to particularly attractive valuations in the technology, financials, and industrials sectors, where the pending recovery of business confidence could boost discretionary spending and drive earnings higher. On the other hand, investor demand for higher yielding stocks has elevated valuations for many consumer staples companies, utilities, telecommunication services companies and real estate investment trusts, which generally do not meet our investment criteria.
October 15, 2013
Please note, the position in any security highlighted with italicized typeface was sold during the reporting period. Equity funds are subject generally to market, market sector, market liquidity, issuer and investment style risks, among other factors, to varying degrees, all of which are more fully described in the fund’s prospectus.
Small companies carry additional risks because their earnings and revenues tend to be less predictable, and their share prices more volatile than those of larger, more established companies.
|
| 1 Total return includes reinvestment of dividends and any capital gains paid, and does not take into consideration the |
| maximum initial sales charge in the case of Class A shares, or the applicable contingent deferred sales charges imposed |
| on redemptions in the case of Class C shares. Had these charges been reflected, returns would have been lower. Past |
| performance is no guarantee of future results. Share price and investment return fluctuate such that upon redemption, |
| fund shares may be worth more or less than their original cost. Return figures provided reflect the absorption of certain |
| fund expenses by The Dreyfus Corporation and The Boston Company Asset Management, LLC. Had these |
| expenses not been absorbed, returns would have been lower. |
| 2 SOURCE: LIPPER INC. — Reflects the reinvestment of dividends and, where applicable, capital gain |
| distributions.The Russell 2500 Value Index is a widely accepted, unmanaged index, which measures the performance |
| of those Russell 2500 companies with lower price-to-book ratios and lower forecasted growth values. |
The Fund 5
FUND PERFORMANCE
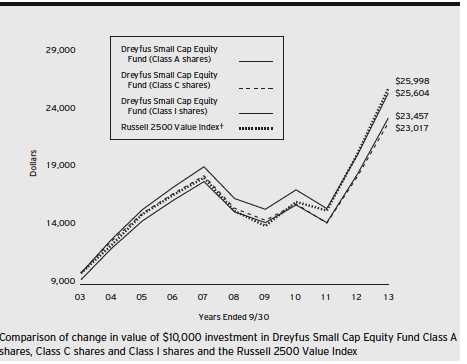
† Source: Lipper Inc.
Past performance is not predictive of future performance.
The above graph compares a $10,000 investment made in each of the Class A, Class C and Class I shares of Dreyfus Small Cap Equity Fund on 9/30/03 to a $10,000 investment made in the Russell 2500 Value Index (the “Index”) on that date. All dividends and capital gain distributions are reinvested.
Prior to 8/1/07, the fund invested its assets in a “master portfolio” that had the same investment objective and policies as the fund. This master/feeder arrangement was terminated on 8/1/07 and the fund operates as a stand alone fund. Performance information represents the performance of the predecessor master portfolio (and its predecessor fund) and the expenses of the master portfolio’s predecessor fund through January 31, 2003, and the fund’s performance and expense structure thereafter. The master portfolio’s predecessor fund contributed all of its assets to the master portfolio before the fund commenced investment operations on 2/1/03.
The fund’s performance shown in the line graph above takes into account the maximum initial sales charge on Class A shares and all other applicable fees and expenses on all classes.The Index is an unmanaged index which measures the performance of those Russell 2500 companies with lower price-to-book ratios and lower forecasted growth values. Unlike a mutual fund, the Index is not subject to charges, fees and other expenses. Investors cannot invest directly in any index. Further information relating to fund performance, including expense reimbursements, if applicable, is contained in the Financial Highlights section of the prospectus and elsewhere in this report.
6
| | | | | | |
| Average Annual Total Returns as of 9/30/13 | | | | | |
| | 1 | Year | 5 Years | | 10 Years | |
| Class A shares | | | | | | |
| with maximum sales charge (5.75%) | 18.82 | % | 7.61 | % | 8.90 | % |
| without sales charge | 26.08 | % | 8.88 | % | 9.55 | % |
| Class C shares | | | | | | |
| with applicable redemption charge † | 24.05 | % | 8.06 | % | 8.69 | % |
| without redemption | 25.05 | % | 8.06 | % | 8.69 | % |
| Class I shares | 26.35 | % | 9.23 | % | 9.86 | % |
| Russell 2500 Value Index | 27.58 | % | 11.07 | % | 10.03 | % |
Past performance is not predictive of future performance.The fund’s performance shown in the graph and table does not reflect the deduction of taxes that a shareholder would pay on fund distributions or the redemption of fund shares.
|
| † The maximum contingent deferred sales charge for Class C shares is 1% for shares redeemed within one year of the |
| date of purchase. |
The Fund 7
UNDERSTANDING YOUR FUND’S EXPENSES (Unaudited)
As a mutual fund investor, you pay ongoing expenses, such as management fees and other expenses. Using the information below, you can estimate how these expenses affect your investment and compare them with the expenses of other funds.You also may pay one-time transaction expenses, including sales charges (loads) and redemption fees, which are not shown in this section and would have resulted in higher total expenses. For more information, see your fund’s prospectus or talk to your financial adviser.
Review your fund’s expenses
The table below shows the expenses you would have paid on a $1,000 investment in Dreyfus Small Cap Equity Fund from April 1, 2013 to September 30, 2013. It also shows how much a $1,000 investment would be worth at the close of the period, assuming actual returns and expenses.
Expenses and Value of a $1,000 Investment
assuming actual returns for the six months ended September 30, 2013
| | | | | | |
| | | Class A | | Class C | | Class I |
| Expenses paid per $1,000† | $ | 7.33 | $ | 11.66 | $ | 6.13 |
| Ending value (after expenses) | $ | 1,089.80 | $ | 1,085.60 | $ | 1,091.30 |
COMPARING YOUR FUND’S EXPENSES
WITH THOSE OF OTHER FUNDS (Unaudited)
Using the SEC’s method to compare expenses
The Securities and Exchange Commission (SEC) has established guidelines to help investors assess fund expenses. Per these guidelines, the table below shows your fund’s expenses based on a $1,000 investment, assuming a hypothetical 5% annualized return. You can use this information to compare the ongoing expenses (but not transaction expenses or total cost) of investing in the fund with those of other funds.All mutual fund shareholder reports will provide this information to help you make this comparison. Please note that you cannot use this information to estimate your actual ending account balance and expenses paid during the period.
Expenses and Value of a $1,000 Investment
assuming a hypothetical 5% annualized return for the six months ended September 30, 2013
| | | | | | |
| | | Class A | | Class C | | Class I |
| Expenses paid per $1,000† | $ | 7.08 | $ | 11.26 | $ | 5.92 |
| Ending value (after expenses) | $ | 1,018.05 | $ | 1,013.89 | $ | 1,019.20 |
|
| † Expenses are equal to the fund’s annualized expense ratio of 1.40% for Class A, 2.23% for Class C and 1.17% for |
| Class I, multiplied by the average account value over the period, multiplied by 183/365 (to reflect the one-half year period). |
8
STATEMENT OF INVESTMENTS
September 30, 2013
| | | | |
| Common Stocks—99.5% | Shares | | | Value ($) |
| Automobiles & Components—2.5% | | | | |
| Lear | 23,990 | | | 1,716,964 |
| Thor Industries | 15,000 | | | 870,600 |
| | | | | 2,587,564 |
| Banks—10.4% | | | | |
| Associated Banc-Corp | 62,140 | | | 962,549 |
| BankUnited | 32,940 | | | 1,027,399 |
| City National | 24,837 | | | 1,655,634 |
| Comerica | 31,750 | | | 1,248,093 |
| First Horizon National | 90,585 | | | 995,529 |
| Hancock Holding | 30,580 | | | 959,600 |
| Synovus Financial | 533,930 | | | 1,761,969 |
| Valley National Bancorp | 98,360 | | | 978,682 |
| Webster Financial | 43,610 | | | 1,113,363 |
| | | | | 10,702,818 |
| Capital Goods—6.1% | | | | |
| AGCO | 17,010 | | | 1,027,744 |
| Armstrong World Industries | 26,280 | a | | 1,444,349 |
| Carlisle | 21,210 | | | 1,490,851 |
| Regal-Beloit | 10,220 | | | 694,245 |
| Snap-on | 16,210 | | | 1,612,895 |
| | | | | 6,270,084 |
| Commercial & Professional Services—4.4% | | | | |
| Clean Harbors | 23,042 | a | | 1,351,644 |
| Equifax | 16,600 | | | 993,510 |
| Herman Miller | 45,170 | | | 1,318,061 |
| Robert Half International | 22,150 | | | 864,515 |
| | | | | 4,527,730 |
| Consumer Durables & Apparel—4.2% | | | | |
| Brunswick | 24,820 | | | 990,566 |
| Deckers Outdoor | 24,070 | a | | 1,586,694 |
| Lennar, Cl. A | 24,010 | | | 849,954 |
| Toll Brothers | 28,370 | a | | 920,039 |
| | | | | 4,347,253 |
The Fund 9
STATEMENT OF INVESTMENTS (continued)
| | | | |
| Common Stocks (continued) | Shares | | | Value ($) |
| Consumer Services—2.5% | | | | |
| Cheesecake Factory | 31,800 | | | 1,397,610 |
| Hyatt Hotels, Cl. A | 28,180 | a | | 1,210,613 |
| | | | | 2,608,223 |
| Diversified Financials—3.3% | | | | |
| E*TRADE Financial | 110,680 | a | | 1,826,220 |
| Raymond James Financial | 38,500 | | | 1,604,295 |
| | | | | 3,430,515 |
| Energy—5.1% | | | | |
| Cabot Oil & Gas | 28,794 | | | 1,074,592 |
| Helix Energy Solutions Group | 61,090 | a | | 1,549,853 |
| Nabors Industries | 81,820 | | | 1,314,029 |
| Oceaneering International | 15,830 | | | 1,286,029 |
| | | | | 5,224,503 |
| Exchange-Traded Funds—1.3% | | | | |
| iShares Russell 2000 Value ETF | 13,970 | | | 1,280,211 |
| Food & Staples Retailing—1.0% | | | | |
| Casey’s General Stores | 13,740 | | | 1,009,890 |
| Food, Beverage & Tobacco—1.9% | | | | |
| Dean Foods | 32,415 | a | | 625,609 |
| Green Mountain Coffee Roasters | 17,590 | a | | 1,325,055 |
| | | | | 1,950,664 |
| Health Care Equipment & Services—9.8% | | | | |
| Air Methods | 24,250 | | | 1,033,050 |
| Allscripts Healthcare Solutions | 95,680 | a | | 1,422,762 |
| HealthSouth | 46,450 | | | 1,601,596 |
| LifePoint Hospitals | 25,960 | a | | 1,210,515 |
| MEDNAX | 14,710 | a | | 1,476,884 |
| Omnicare | 29,170 | | | 1,618,935 |
| Universal Health Services, Cl. B | 22,410 | | | 1,680,526 |
| | | | | 10,044,268 |
| Insurance—4.3% | | | | |
| Old Republic International | 82,710 | | | 1,273,734 |
| ProAssurance | 19,870 | | | 895,342 |
10
| | | | |
| Common Stocks (continued) | Shares | | | Value ($) |
| Insurance (continued) | | | | |
| Protective Life | 28,810 | | | 1,225,865 |
| W.R. Berkley | 22,840 | | | 978,922 |
| | | | | 4,373,863 |
| Materials—4.0% | | | | |
| Allegheny Technologies | 29,490 | | | 900,035 |
| Cytec Industries | 11,570 | | | 941,335 |
| Louisiana-Pacific | 45,190 | a | | 794,892 |
| Packaging Corporation of America | 24,760 | | | 1,413,548 |
| | | | | 4,049,810 |
| Media—2.2% | | | | |
| DreamWorks Animation SKG, Cl. A | 35,570 | a | | 1,012,322 |
| New York Times, Cl. A | 101,070 | | | 1,270,450 |
| | | | | 2,282,772 |
| Pharmaceuticals, Biotech & | | | | |
| Life Sciences—1.1% | | | | |
| Salix Pharmaceuticals | 17,160 | a | | 1,147,661 |
| Real Estate—4.3% | | | | |
| BioMed Realty Trust | 55,040 | b | | 1,023,194 |
| Corporate Office Properties Trust | 26,550 | b | | 613,305 |
| Corrections Corporation of America | 35,360 | b | | 1,221,688 |
| DCT Industrial Trust | 112,410 | b | | 808,228 |
| Douglas Emmett | 31,720 | b | | 744,468 |
| | | | | 4,410,883 |
| Retailing—5.3% | | | | |
| Best Buy | 54,650 | | | 2,049,375 |
| Children’s Place Retail Stores | 22,330 | a | | 1,292,014 |
| Guess? | 34,060 | | | 1,016,691 |
| Saks | 67,030 | a | | 1,068,458 |
| | | | | 5,426,538 |
| Semiconductors & Semiconductor | | | | |
| Equipment—3.1% | | | | |
| Cirrus Logic | 25,760 | a | | 584,237 |
| Semtech | 28,700 | a | | 860,713 |
The Fund 11
STATEMENT OF INVESTMENTS (continued)
| | | |
| Common Stocks (continued) | Shares | | Value ($) |
| Semiconductors & Semiconductor | | | |
| Equipment (continued) | | | |
| Teradyne | 74,020 | a | 1,222,810 |
| Veeco Instruments | 14,220 | a | 529,411 |
| | | | 3,197,171 |
| Software & Services—10.0% | | | |
| Akamai Technologies | 21,560 | a | 1,114,652 |
| CoreLogic | 54,370 | a | 1,470,708 |
| Informatica | 13,290 | a | 517,911 |
| Jack Henry & Associates | 20,360 | | 1,050,780 |
| MAXIMUS | 18,200 | | 819,728 |
| MICROS Systems | 23,770 | a | 1,187,074 |
| Solera Holdings | 24,930 | | 1,318,049 |
| Synopsys | 40,615 | a | 1,531,186 |
| Verint Systems | 32,370 | a | 1,199,632 |
| | | | 10,209,720 |
| Technology Hardware & Equipment—4.8% | | | |
| Brocade Communications Systems | 126,530 | a | 1,018,567 |
| F5 Networks | 11,060 | a | 948,506 |
| InvenSense | 47,270 | a | 832,897 |
| IPG Photonics | 16,430 | | 925,173 |
| Vishay Intertechnology | 89,510 | a | 1,153,784 |
| | | | 4,878,927 |
| Transportation—3.7% | | | |
| Alaska Air Group | 23,040 | | 1,442,765 |
| Con-way | 26,490 | | 1,141,454 |
| Landstar System | 21,040 | | 1,177,819 |
| | | | 3,762,038 |
| Utilities—4.2% | | | |
| Great Plains Energy | 37,160 | | 824,952 |
| Hawaiian Electric Industries | 39,880 | | 1,000,988 |
| NiSource | 29,610 | | 914,653 |
| Portland General Electric | 29,380 | | 829,397 |
| UGI | 19,250 | | 753,253 |
| | | | 4,323,243 |
| Total Common Stocks | | | |
| (cost $77,355,849) | | | 102,046,349 |
12
| | | | |
| Other Investment—.9% | Shares | | Value ($) | |
| Registered Investment Company; | | | | |
| Dreyfus Institutional Preferred | | | | |
| Plus Money Market Fund | | | | |
| (cost $938,041) | 938,041 | c | 938,041 | |
| |
| Total Investments (cost $78,293,890) | 100.4 | % | 102,984,390 | |
| Liabilities, Less Cash and Receivables | (.4 | %) | (373,560 | ) |
| Net Assets | 100.0 | % | 102,610,830 | |
| |
| ETF—Exchange Traded Fund |
| a | Non-income producing security. |
| b | Investment in real estate investment trust. |
| c | Investment in affiliated money market mutual fund. |
| | | |
| Portfolio Summary (Unaudited)† | | |
| |
| | Value (%) | | Value (%) |
| Banks | 10.4 | Diversified Financials | 3.3 |
| Software & Services | 10.0 | Semiconductors & Semiconductor | |
| Health Care Equipment & Services | 9.8 | Equipment | 3.1 |
| Capital Goods | 6.1 | Automobiles & Components | 2.5 |
| Retailing | 5.3 | Consumer Services | 2.5 |
| Energy | 5.1 | Media | 2.2 |
| Technology Hardware & Equipment | 4.8 | Food, Beverage & Tobacco | 1.9 |
| Commercial & Professional Services | 4.4 | Exchange-Traded Funds | 1.3 |
| Insurance | 4.3 | Pharmaceuticals, Biotech & | |
| Real Estate | 4.3 | Life Sciences | 1.1 |
| Consumer Durables & Apparel | 4.2 | Food & Staples Retailing | 1.0 |
| Utilities | 4.2 | Money Market Investment | .9 |
| Materials | 4.0 | | |
| Transportation | 3.7 | | 100.4 |
|
| † Based on net assets. |
| See notes to financial statements. |
The Fund 13
STATEMENT OF ASSETS AND LIABILITIES
September 30, 2013
| | | |
| | Cost | Value | |
| Assets ($): | | | |
| Investments in securities—See Statement of Investments: | | | |
| Unaffiliated issuers | 77,355,849 | 102,046,349 | |
| Affiliated issuers | 938,041 | 938,041 | |
| Cash | | 50,162 | |
| Dividends and securities lending income receivable | | 137,415 | |
| Receivable for shares of Beneficial Interest subscribed | | 13,151 | |
| Prepaid expenses | | 22,215 | |
| | | 103,207,333 | |
| Liabilities ($): | | | |
| Due to The Boston Company Asset | | | |
| Management, LLC and affiliates—Note 3(c) | | 116,037 | |
| Payable for investment securities purchased | | 193,513 | |
| Payable for shares of Beneficial Interest redeemed | | 182,859 | |
| Accrued expenses | | 104,094 | |
| | | 596,503 | |
| Net Assets ($) | | 102,610,830 | |
| Composition of Net Assets ($): | | | |
| Paid-in capital | | 88,559,986 | |
| Accumulated undistributed investment income—net | | 25,217 | |
| Accumulated net realized gain (loss) on investments | | (10,664,873 | ) |
| Accumulated net unrealized appreciation | | | |
| (depreciation) on investments | | 24,690,500 | |
| Net Assets ($) | | 102,610,830 | |
| | | |
| Net Asset Value Per Share | | | |
| | Class A | Class C | Class I |
| Net Assets ($) | 47,393,875 | 11,028,583 | 44,188,372 |
| Shares Outstanding | 1,549,769 | 397,318 | 1,405,800 |
| Net Asset Value Per Share ($) | 30.58 | 27.76 | 31.43 |
See notes to financial statements.
14
STATEMENT OF OPERATIONS
Year Ended September 30, 2013
| | |
| Investment Income ($): | | |
| Income: | | |
| Cash dividends: | | |
| Unaffiliated issuers | 1,496,532 | |
| Affiliated issuers | 961 | |
| Income from securities lending—Note 1(b) | 32,854 | |
| Total Income | 1,530,347 | |
| Expenses: | | |
| Investment advisory fee—Note 3(a) | 862,316 | |
| Administration fee—Note 3(a) | 107,790 | |
| Shareholder servicing costs—Note 3(c) | 347,966 | |
| Distribution fees—Note 3(b) | 80,056 | |
| Professional fees | 74,452 | |
| Registration fees | 43,959 | |
| Custodian fees—Note 3(c) | 25,764 | |
| Prospectus and shareholders’ reports | 24,247 | |
| Trustees’ fees and expenses—Note 3(d) | 8,319 | |
| Interest expense—Note 2 | 2,424 | |
| Loan commitment fees—Note 2 | 1,229 | |
| Miscellaneous | 20,825 | |
| Total Expenses | 1,599,347 | |
| Less—reduction in expenses due to undertaking—Note 3(a) | (130,231 | ) |
| Less—reduction in fees due to earnings credits—Note 3(c) | (197 | ) |
| Net Expenses | 1,468,919 | |
| Investment Income—Net | 61,428 | |
| Realized and Unrealized Gain (Loss) on Investments—Note 4 ($): | | |
| Net realized gain (loss) on investments | 9,029,145 | |
| Net unrealized appreciation (depreciation) on investments | 16,121,428 | |
| Net Realized and Unrealized Gain (Loss) on Investments | 25,150,573 | |
| Net Increase in Net Assets Resulting from Operations | 25,212,001 | |
| See notes to financial statements. | | |
The Fund 15
STATEMENT OF CHANGES IN NET ASSETS
| | | | |
| | Year Ended September 30, | |
| | 2013 | | 2012 | a |
| Operations ($): | | | | |
| Investment income—net | 61,428 | | 341,264 | |
| Net realized gain (loss) on investments | 9,029,145 | | 12,382,419 | |
| Net unrealized appreciation | | | | |
| (depreciation) on investments | 16,121,428 | | 23,599,111 | |
| Net Increase (Decrease) in Net Assets | | | | |
| Resulting from Operations | 25,212,001 | | 36,322,794 | |
| Dividends to Shareholders from ($): | | | | |
| Investment income—net: | | | | |
| Class A | (98,361 | ) | — | |
| Class I | (267,825 | ) | (109,625 | ) |
| Net realized gain on investments: | | | | |
| Class A | (3,996,526 | ) | (4,601,198 | ) |
| Class B | — | | (63,518 | ) |
| Class C | (967,722 | ) | (1,146,302 | ) |
| Class I | (4,191,200 | ) | (6,879,648 | ) |
| Total Dividends | (9,521,634 | ) | (12,800,291 | ) |
| Beneficial Interest Transactions ($): | | | | |
| Net proceeds from shares sold: | | | | |
| Class A | 7,133,795 | | 4,821,340 | |
| Class B | — | | 4,418 | |
| Class C | 833,777 | | 1,129,509 | |
| Class I | 12,509,044 | | 16,009,699 | |
| Dividends reinvested: | | | | |
| Class A | 3,861,733 | | 4,267,499 | |
| Class B | — | | 57,711 | |
| Class C | 790,456 | | 910,871 | |
| Class I | 4,434,970 | | 6,965,025 | |
| Cost of shares redeemed: | | | | |
| Class A | (16,260,866 | ) | (16,202,956 | ) |
| Class B | — | | (918,204 | ) |
| Class C | (2,867,260 | ) | (3,521,170 | ) |
| Class I | (29,728,195 | ) | (77,504,676 | ) |
| Increase (Decrease) in Net Assets from | | | | |
| Beneficial Interest Transactions | (19,292,546 | ) | (63,980,934 | ) |
| Total Increase (Decrease) in Net Assets | (3,602,179 | ) | (40,458,431 | ) |
| Net Assets ($): | | | | |
| Beginning of Period | 106,213,009 | | 146,671,440 | |
| End of Period | 102,610,830 | | 106,213,009 | |
| Undistributed investment income—net | 25,217 | | 329,975 | |
16
| | | | |
| | Year Ended September 30, | |
| | 2013 | | 2012 | a |
| Capital Share Transactions: | | | | |
| Class Ab,c | | | | |
| Shares sold | 262,329 | | 188,293 | |
| Shares issued for dividends reinvested | 158,461 | | 185,624 | |
| Shares redeemed | (589,693 | ) | (631,663 | ) |
| Net Increase (Decrease) in Shares Outstanding | (168,903 | ) | (257,746 | ) |
| Class Bc | | | | |
| Shares sold | — | | 207 | |
| Shares issued for dividends reinvested | — | | 2,708 | |
| Shares redeemed | — | | (37,658 | ) |
| Net Increase (Decrease) in Shares Outstanding | — | | (34,743 | ) |
| Class Cb | | | | |
| Shares sold | 33,560 | | 47,968 | |
| Shares issued for dividends reinvested | 35,664 | | 42,724 | |
| Shares redeemed | (114,037 | ) | (146,999 | ) |
| Net Increase (Decrease) in Shares Outstanding | (44,813 | ) | (56,307 | ) |
| Class I | | | | |
| Shares sold | 438,276 | | 614,938 | |
| Shares issued for dividends reinvested | 176,114 | | 296,132 | |
| Shares redeemed | (1,021,149 | ) | (2,973,994 | ) |
| Net Increase (Decrease) in Shares Outstanding | (406,759 | ) | (2,062,924 | ) |
|
| a Effective as of the close of business on March 13, 2012, the fund no longer offers Class B shares. |
| b During the period ended September 30, 2013, 18,769 Class C shares representing $499,635 were exchanged for |
| 17,087 Class A shares. |
| c During the period ended September 30, 2012, 14,640 Class B shares representing $357,225 were automatically |
| converted to 13,579 Class A shares. |
See notes to financial statements.
The Fund 17
FINANCIAL HIGHLIGHTS
The following tables describe the performance for each share class for the fiscal periods indicated. All information (except portfolio turnover rate) reflects financial results for a single fund share.Total return shows how much your investment in the fund would have increased (or decreased) during each period, assuming you had reinvested all dividends and distributions.These figures have been derived from the fund’s financial statements.
| | | | | | | | | | |
| | | | Year Ended September 30, | | | |
| Class A Shares | 2013 | | 2012 | | 2011 | | 2010 | | 2009 | |
| Per Share Data ($): | | | | | | | | | | |
| Net asset value, beginning of period | 26.65 | | 22.79 | | 25.23 | | 22.84 | | 24.48 | |
| Investment Operations: | | | | | | | | | | |
| Investment income (loss)—neta | .01 | | .05 | | (.01 | ) | (.00 | )b | .07 | |
| Net realized and unrealized | | | | | | | | | | |
| gain (loss) on investments | 6.32 | | 6.26 | | (2.43 | ) | 2.42 | | (1.60 | ) |
| Total from Investment Operations | 6.33 | | 6.31 | | (2.44 | ) | 2.42 | | (1.53 | ) |
| Distributions: | | | | | | | | | | |
| Dividends from investment income—net | (.06 | ) | — | | — | | (.03 | ) | (.11 | ) |
| Dividends from net realized | | | | | | | | | | |
| gain on investments | (2.34 | ) | (2.45 | ) | — | | — | | — | |
| Total Distributions | (2.40 | ) | (2.45 | ) | — | | (.03 | ) | (.11 | ) |
| Net asset value, end of period | 30.58 | | 26.65 | | 22.79 | | 25.23 | | 22.84 | |
| Total Return (%)c | 26.08 | | 29.39 | | (9.67 | ) | 10.62 | | (6.11 | ) |
| Ratios/Supplemental Data (%): | | | | | | | | | | |
| Ratio of total expenses | | | | | | | | | | |
| to average net assets | 1.53 | | 1.57 | | 1.49 | | 1.59 | | 1.72 | |
| Ratio of net expenses | | | | | | | | | | |
| to average net assets | 1.39 | | 1.40 | | 1.39 | | 1.38 | | 1.37 | |
| Ratio of net investment income | | | | | | | | | | |
| (loss) to average net assets | .03 | | .21 | | (.05 | ) | (.00 | )d | .35 | |
| Portfolio Turnover Rate | 76.40 | | 93.40 | | 76.95 | | 78.90 | | 110.88 | |
| Net Assets, end of period ($ x 1,000) | 47,394 | | 45,806 | | 45,048 | | 61,796 | | 60,030 | |
| |
| a | Based on average shares outstanding at each month end. |
| b | Amount represents less than $.01 per share. |
| c | Exclusive of sales charge. |
| d | Amount represents less than .01%. |
See notes to financial statements.
18
| | | | | | | | | | |
| | | | Year Ended September 30, | | | |
| Class C Shares | 2013 | | 2012 | | 2011 | | 2010 | | 2009 | |
| Per Share Data ($): | | | | | | | | | | |
| Net asset value, beginning of period | 24.55 | | 21.33 | | 23.80 | | 21.69 | | 23.23 | |
| Investment Operations: | | | | | | | | | | |
| Investment (loss)—neta | (.20 | ) | (.15 | ) | (.22 | ) | (.19 | ) | (.09 | ) |
| Net realized and unrealized | | | | | | | | | | |
| gain (loss) on investments | 5.75 | | 5.82 | | (2.25 | ) | 2.30 | | (1.45 | ) |
| Total from Investment Operations | 5.55 | | 5.67 | | (2.47 | ) | 2.11 | | (1.54 | ) |
| Distributions: | | | | | | | | | | |
| Dividends from net realized | | | | | | | | | | |
| gain on investments | (2.34 | ) | (2.45 | ) | — | | — | | — | |
| Net asset value, end of period | 27.76 | | 24.55 | | 21.33 | | 23.80 | | 21.69 | |
| Total Return (%)b | 25.05 | | 28.31 | | (10.38 | ) | 9.78 | | (6.67 | ) |
| Ratios/Supplemental Data (%): | | | | | | | | | | |
| Ratio of total expenses | | | | | | | | | | |
| to average net assets | 2.28 | | 2.31 | | 2.19 | | 2.24 | | 2.40 | |
| Ratio of net expenses | | | | | | | | | | |
| to average net assets | 2.22 | | 2.22 | | 2.17 | | 2.20 | | 2.20 | |
| Ratio of net investment (loss) | | | | | | | | | | |
| to average net assets | (.80 | ) | (.62 | ) | (.84 | ) | (.81 | ) | (.48 | ) |
| Portfolio Turnover Rate | 76.40 | | 93.40 | | 76.95 | | 78.90 | | 110.88 | |
| Net Assets, end of period ($ x 1,000) | 11,029 | | 10,855 | | 10,632 | | 14,436 | | 14,037 | |
| |
| a | Based on average shares outstanding at each month end. |
| b | Exclusive of sales charge. |
See notes to financial statements.
The Fund 19
FINANCIAL HIGHLIGHTS (continued)
| | | | | | | | | | |
| | | | Year Ended September 30, | | | |
| Class I Shares | 2013 | | 2012 | | 2011 | | 2010 | | 2009 | |
| Per Share Data ($): | | | | | | | | | | |
| Net asset value, beginning of period | 27.34 | | 23.29 | | 25.71 | | 23.24 | | 24.88 | |
| Investment Operations: | | | | | | | | | | |
| Investment income—neta | .08 | | .12 | | .06 | | .07 | | .13 | |
| Net realized and unrealized | | | | | | | | | | |
| gain (loss) on investments | 6.49 | | 6.42 | | (2.48 | ) | 2.47 | | (1.60 | ) |
| Total from Investment Operations | 6.57 | | 6.54 | | (2.42 | ) | 2.54 | | (1.47 | ) |
| Distributions: | | | | | | | | | | |
| Dividends from investment income—net | (.14 | ) | (.04 | ) | (.00 | )b | (.07 | ) | (.17 | ) |
| Dividends from net realized | | | | | | | | | | |
| gain on investments | (2.34 | ) | (2.45 | ) | — | | — | | — | |
| Total Distributions | (2.48 | ) | (2.49 | ) | (.00 | )b | (.07 | ) | (.17 | ) |
| Net asset value, end of period | 31.43 | | 27.34 | | 23.29 | | 25.71 | | 23.24 | |
| Total Return (%) | 26.35 | | 29.80 | | (9.41 | ) | 10.94 | | (5.67 | ) |
| Ratios/Supplemental Data (%): | | | | | | | | | | |
| Ratio of total expenses | | | | | | | | | | |
| to average net assets | 1.27 | | 1.24 | | 1.28 | | 1.14 | | 1.20 | |
| Ratio of net expenses | | | | | | | | | | |
| to average net assets | 1.15 | | 1.08 | | 1.13 | | 1.11 | | 1.13 | |
| Ratio of net investment income | | | | | | | | | | |
| to average net assets | .27 | | .47 | | .22 | | .27 | | .65 | |
| Portfolio Turnover Rate | 76.40 | | 93.40 | | 76.95 | | 78.90 | | 110.88 | |
| Net Assets, end of period ($ x 1,000) | 44,188 | | 49,552 | | 90,251 | | 88,779 | | 68,758 | |
| |
| a | Based on average shares outstanding at each month end. |
| b | Amount represents less than $.01 per share. |
See notes to financial statements.
20
NOTES TO FINANCIAL STATEMENTS
NOTE 1—Significant Accounting Policies:
Dreyfus Small Cap Equity Fund (the “fund”) is a separate diversified series of Dreyfus Stock Funds (the “Company”), which is registered under the Investment Company Act of 1940, as amended (the “Act”), as an open-end management investment company and operates as a series company currently offering two series, including the fund. The fund’s investment objective is to seek long-term growth of capital.The Boston Company Asset Management, LLC (“TBCAM”), a wholly-owned subsidiary ofThe Bank of NewYork Mellon Corporation (“BNY Mellon”), serves as the fund’s investment adviser. The Dreyfus Corporation (the “Administrator” or “Dreyfus”), a wholly-owned subsidiary of BNY Mellon and an affiliate of TBCAM, serves as the fund’s Administrator.
MBSC Securities Corporation (the “Distributor”), a wholly-owned subsidiary of Dreyfus, is the distributor of the fund’s shares.The fund is authorized to issue an unlimited number of $.001 par value shares of Beneficial Interest in each of the following classes of shares: Class A, Class C and Class I. Class A shares generally are subject to a sales charge imposed at the time of purchase. Class C shares are subject to a contingent deferred sales charge (“CDSC”) imposed on Class C shares redeemed within one year of purchase. Class I shares are sold at net asset value per share only to institutional investors. Other differences between the classes include the services offered to and the expenses borne by each class, the allocation of certain transfer agency costs and certain voting rights. Income, expenses (other than expenses attributable to a specific class), and realized and unrealized gains or losses on investments are allocated to each class of shares based on its relative net assets.
The Company accounts separately for the assets, liabilities and operations of each series. Expenses directly attributable to each series are charged to that series’ operations; expenses which are applicable to all series are allocated among them on a pro rata basis.
The Financial Accounting Standards Board (“FASB”) Accounting Standards Codification is the exclusive reference of authoritative U.S. generally accepted accounting principles (“GAAP”) recognized by the
The Fund 21
NOTES TO FINANCIAL STATEMENTS (continued)
FASB to be applied by nongovernmental entities. Rules and interpretive releases of the Securities and Exchange Commission (“SEC”) under authority of federal laws are also sources of authoritative GAAP for SEC registrants. The fund’s financial statements are prepared in accordance with GAAP, which may require the use of management estimates and assumptions.Actual results could differ from those estimates.
The Company enters into contracts that contain a variety of indemnifications. The fund’s maximum exposure under these arrangements is unknown.The fund does not anticipate recognizing any loss related to these arrangements.
(a) Portfolio valuation: The fair value of a financial instrument is the amount that would be received to sell an asset or paid to transfer a liability in an orderly transaction between market participants at the measurement date (i.e., the exit price). GAAP establishes a fair value hierarchy that prioritizes the inputs of valuation techniques used to measure fair value. This hierarchy gives the highest priority to unadjusted quoted prices in active markets for identical assets or liabilities (Level 1 measurements) and the lowest priority to unobservable inputs (Level 3 measurements).
Additionally, GAAP provides guidance on determining whether the volume and activity in a market has decreased significantly and whether such a decrease in activity results in transactions that are not orderly. GAAP requires enhanced disclosures around valuation inputs and techniques used during annual and interim periods.
Various inputs are used in determining the value of the fund’s investments relating to fair value measurements.These inputs are summarized in the three broad levels listed below:
Level 1—unadjusted quoted prices in active markets for identical investments.
Level 2—other significant observable inputs (including quoted prices for similar investments, interest rates, prepayment speeds, credit risk, etc.).
Level 3—significant unobservable inputs (including the fund’s own assumptions in determining the fair value of investments).
22
The inputs or methodology used for valuing securities are not necessarily an indication of the risk associated with investing in those securities.
Changes in valuation techniques may result in transfers in or out of an assigned level within the disclosure hierarchy. Valuation techniques used to value the fund’s investments are as follows:
Investments in securities are valued at the last sales price on the securities exchange or national securities market on which such securities are primarily traded. Securities listed on the National Market System for which market quotations are available are valued at the official closing price or, if there is no official closing price that day, at the last sales price. Securities not listed on an exchange or the national securities market, or securities for which there were no transactions, are valued at the average of the most recent bid and asked prices, except for open short positions, where the asked price is used for valuation purposes. Bid price is used when no asked price is available. Registered investment companies that are not traded on an exchange are valued at their net asset value. All of the preceding securities are categorized within Level 1 of the fair value hierarchy.
Fair valuing of securities may be determined with the assistance of a pricing service using calculations based on indices of domestic securities and other appropriate indicators, such as prices of relevant American Depository Receipts and financial futures. Utilizing these techniques may result in transfers between Level 1 and Level 2 of the fair value hierarchy.
When market quotations or official closing prices are not readily available, or are determined not to reflect accurately fair value, such as when the value of a security has been significantly affected by events after the close of the exchange or market on which the security is principally traded (for example, a foreign exchange or market), but before the fund calculates its net asset value, the fund may value these investments at fair value as determined in accordance with the procedures approved by the Company’s Board of Trustees (the “Board”). Certain factors may be considered when fair valuing investments such as: fundamental analytical
The Fund 23
NOTES TO FINANCIAL STATEMENTS (continued)
data, the nature and duration of restrictions on disposition, an evaluation of the forces that influence the market in which the securities are purchased and sold, and public trading in similar securities of the issuer or comparable issuers.These securities are either categorized within Level 2 or 3 of the fair value hierarchy depending on the relevant inputs used.
For restricted securities where observable inputs are limited, assumptions about market activity and risk are used and are categorized within Level 3 of the fair value hierarchy.
The following is a summary of the inputs used as of September 30, 2013 in valuing the fund’s investments:
| | | | |
| | | Level 2—Other | Level 3— | |
| | Level 1— | Significant | Significant | |
| | Unadjusted | Observable | Unobservable | |
| | Quoted Prices | Inputs | Inputs | Total |
| Assets ($) | | | | |
| Investments in Securities: | | | |
| Equity Securities—Domestic | | | |
| Common Stocks† | 100,766,138 | — | — | 100,766,138 |
| Exchange-Traded Funds | 1,280,211 | — | — | 1,280,211 |
| Mutual Funds | 938,041 | — | — | 938,041 |
† See Statement of Investments for additional detailed categorizations.
At September 30, 2013, there were no transfers between Level 1 and Level 2 of the fair value hierarchy.
(b) Securities transactions and investment income: Securities transactions are recorded on a trade date basis. Realized gains and losses from securities transactions are recorded on the identified cost basis. Dividend income is recognized on the ex-dividend date and interest income, including, where applicable, accretion of discount and amortization of premium on investments, is recognized on the accrual basis.
Pursuant to a securities lending agreement with The Bank of New York Mellon, a subsidiary of BNY Mellon and an affiliate of Dreyfus, the fund may lend securities to qualified institutions. It is the fund’s
24
policy that, at origination, all loans are secured by collateral of at least 102% of the value of U.S. securities loaned and 105% of the value of foreign securities loaned. Collateral equivalent to at least 100% of the market value of securities on loan is maintained at all times. Collateral is either in the form of cash, which can be invested in certain money market mutual funds managed by Dreyfus or U.S. Government and Agency securities.The fund is entitled to receive all dividends, interest and distributions on securities loaned, in addition to income earned as a result of the lending transaction. Should a borrower fail to return the securities in a timely manner, The Bank of New York Mellon is required to replace the securities for the benefit of the fund or credit the fund with the market value of the unreturned securities and is subrogated to the fund’s rights against the borrower and the collateral. During the period ended September 30, 2013,The Bank of NewYork Mellon earned $10,152 from lending portfolio securities, pursuant to the securities lending agreement.
(c) Affiliated issuers: Investments in other investment companies advised by Dreyfus are defined as “affiliated” under the Act. Investments in affiliated investment companies during the period ended September 30, 2013 were as follows:
| | | | | | | |
| Affiliated | | | | | | | |
| Investment | Value | | | | | Value | Net |
| Company | 9/30/2012 | ($) | Purchases ($) | | Sales ($) | 9/30/2013 ($) | Assets (%) |
| Dreyfus | | | | | | | |
| Institutional | | | | | | | |
| Preferred | | | | | | | |
| Plus Money | | | | | | | |
| Market Fund | 719,459 | | 39,203,488 | | 38,984,906 | 938,041 | .9 |
| Dreyfus | | | | | | | |
| Institutional | | | | | | | |
| Cash | | | | | | | |
| Advantage | | | | | | | |
| Fund | 5,382,842 | | 62,170,897 | | 67,553,739 | — | — |
| Total | 6,102,301 | | 101,374,385 | | 106,538,645 | 938,041 | .9 |
The Fund 25
NOTES TO FINANCIAL STATEMENTS (continued)
(d) Dividends to shareholders: Dividends are recorded on the ex-dividend date. Dividends from investment income-net and dividends from net realized capital gains, if any, are normally declared and paid annually, but the fund may make distributions on a more frequent basis to comply with the distribution requirements of the Internal Revenue Code of 1986, as amended (the “Code”).To the extent that net realized capital gains can be offset by capital loss carryovers, it is the policy of the fund not to distribute such gains. Income and capital gain distributions are determined in accordance with income tax regulations, which may differ from GAAP.
(e) Federal income taxes: It is the policy of the fund to continue to qualify as a regulated investment company, if such qualification is in the best interests of its shareholders, by complying with the applicable provisions of the Code, and to make distributions of taxable income sufficient to relieve it from substantially all federal income and excise taxes.
As of and during the period ended September 30, 2013, the fund did not have any liabilities for any uncertain tax positions.The fund recognizes interest and penalties, if any, related to uncertain tax positions as income tax expense in the Statement of Operations. During the period ended September 30, 2013, the fund did not incur any interest or penalties.
Each tax year in the four-year period ended September 30, 2013 remains subject to examination by the Internal Revenue Service and state taxing authorities.
At September 30, 2013, the components of accumulated earnings on a tax basis were as follows: undistributed ordinary income $1,621,671, undistributed capital gains $5,808,641, accumulated capital losses $17,862,437 and unrealized appreciation $24,482,969.
Under the Regulated Investment Company Modernization Act of 2010 (the “2010 Act”), the fund is permitted to carry forward capital
26
losses incurred in taxable years beginning after December 22, 2010 (“post-enactment losses”) for an unlimited period. Furthermore, post-enactment capital loss carryovers retain their character as either short-term or long-term capital losses rather than short-term as they were under previous statute.The 2010 Act requires post-enactment losses to be utilized before the utilization of losses incurred in taxable years prior to the effective date of the 2010 Act (“pre-enactment losses”).As a result of this ordering rule, pre-enactment losses may be more likely to expire unused.
The accumulated capital loss carryover is available for federal income tax purposes to be applied against future net realized capital gains, if any, realized subsequent to September 30, 2013. If not applied, $1,496,330 of the carryover expires in fiscal year 2016, $16,299,657 expires in fiscal year 2017 and $66,450 expires in fiscal year 2018. Acquired losses as a result of the fund’s merger with Dreyfus Premier Future Leaders Fund can be utilized in subsequent years but will be subject to an annual limitation based on certain provisions in the Code.
The tax character of distributions paid to shareholders during the fiscal periods ended September 30, 2013 and September 30, 2012 were as follows: ordinary income $366,186 and $3,316,124, and long-term capital gains $9,155,448 and $9,484,167, respectively.
NOTE 2—Bank Lines of Credit:
The fund participates with other Dreyfus-managed funds in a $210 million unsecured credit facility led by Citibank, N.A. and a $300 million unsecured credit facility provided by The Bank of New York Mellon (each, a “Facility”), each to be utilized primarily for temporary or emergency purposes, including the financing of redemptions. Prior to October 10, 2012, the unsecured credit facility with Citibank, N.A. was $225 million. In connection therewith, the fund has agreed to pay
The Fund 27
NOTES TO FINANCIAL STATEMENTS (continued)
its pro rata portion of commitment fees for each Facility. Interest is charged to the fund based on rates determined pursuant to the terms of the respective Facility at the time of borrowing.
The average amount of borrowings outstanding under the Facilities during the period ended September 30, 2013 was approximately $214,800 with a related weighted average annualized interest rate of 1.13%.
NOTE 3—Investment Advisory Fee, Administration Fee and Other Transactions with Affiliates:
(a) Pursuant to an investment advisory agreement with TBCAM, the investment advisory fee is computed at the annual rate of .80% of the value of the fund’s average daily net assets and is payable monthly.
Dreyfus and TBCAM have contractually agreed, from October 1, 2012 through September 30, 2013, to assume the expenses of Class A, Class C and Class I shares so that such expenses of the fund’s Class A, Class C and Class I shares (excluding taxes, interest expense, brokerage commissions, commitment fees on borrowings and extraordinary expenses) do not exceed 1.39%, 2.22% and 1.16%, respectively, of the value of such class’ average daily net assets, until the fiscal year end following such time as the expenses are equal to or less than such annual rate for the applicable class. The reduction in expenses, pursuant to the undertaking, amounted to $130,231 during the period ended September 30, 2013.
The fund compensates Dreyfus under an administration agreement for providing personnel and facilities to perform accounting and administration services for the fund at an annual rate of .10% of the value of the fund’s average daily net assets.
During the period ended September 30, 2013, the Distributor retained $4,858 from commissions earned on sales of the fund’s Class A shares and $48 from CDSCs on redemptions of the fund’s Class C shares.
28
(b) Under the Distribution Plan adopted pursuant to Rule 12b-1 under the Act, Class C shares pay the Distributor for distributing its shares at an annual rate of .75% of the value of its average daily net assets. During the period ended September 30, 2013, Class C shares were charged $80,056 pursuant to the Distribution Plan.
(c) Under the Shareholder Services Plan, Class A and Class C shares pay the Distributor at an annual rate of .25% of the value of their average daily net assets for the provision of certain services.The services provided may include personal services relating to shareholder accounts, such as answering shareholder inquiries regarding the fund and providing reports and other information, and services related to the maintenance of shareholder accounts.The Distributor may make payments to Service Agents (securities dealers, financial institutions or other industry professionals) with respect to these services. The Distributor determines the amounts to be paid to Service Agents. During the period ended September 30, 2013, Class A and Class C shares were charged $118,516 and $26,685, respectively, pursuant to the Shareholder Services Plan.
The fund has arrangements with the transfer agent and the custodian whereby the fund may receive earnings credits when positive cash balances are maintained, which are used to offset transfer agency and custody fees. For financial reporting purposes, the fund includes net earnings credits as an expense offset in the Statement of Operations.
The fund compensates DreyfusTransfer, Inc., a wholly-owned subsidiary of Dreyfus, under a transfer agency agreement for providing transfer agency services for the fund and cash management services related to fund subscriptions and redemptions. During the period ended September 30, 2013, the fund was charged $36,072 for transfer agency services and $1,527 for cash management services. These fees are included in Shareholder servicing costs in the Statement of Operations. Cash management fees were partially offset by earnings credits of $193.
The Fund 29
NOTES TO FINANCIAL STATEMENTS (continued)
The fund compensates The Bank of New York Mellon under a custody agreement for providing custodial services for the fund. During the period ended September 30, 2013, the fund was charged $25,764 pursuant to the custody agreement.
The fund compensates The Bank of New York Mellon under a cash management agreement for performing certain cash management services related to fund subscriptions and redemptions. During the period ended September 30, 2013, the fund was charged $806 pursuant to the cash management agreement, which is included in Shareholder servicing costs in the Statement of Operations.These fees were partially offset by earnings credits of $4.
During the period ended September 30, 2013, the fund was charged $9,045 for services performed by the Chief Compliance Officer and his staff.
The components of “Due to TBCAM and affiliates” in the Statement of Assets and Liabilities consist of: investment advisory fees $67,621, administration fees $8,453, Distribution Plan fees $6,758, Shareholder Services Plan fees $12,049, custodian fees $9,130, Chief Compliance Officer fees $6,948 and transfer agency fees $13,618, which are offset against an expense reimbursement currently in effect in the amount of $8,540.
(d) Each Board member also serves as a Board member of other funds within the Dreyfus complex. Annual retainer fees and attendance fees are allocated to each fund based on net assets.
30
NOTE 4—Securities Transactions:
The aggregate amount of purchases and sales of investment securities, excluding short-term securities, during the period ended September 30, 2013, amounted to $81,293,991 and $109,754,510, respectively.
At September 30, 2013, the cost of investments for federal income tax purposes was $78,501,421; accordingly, accumulated net unrealized appreciation on investments was $24,482,969, consisting of $25,278,598 gross unrealized appreciation and $795,629 gross unrealized depreciation.
The Fund 31
REPORT OF INDEPENDENT REGISTERED
PUBLIC ACCOUNTING FIRM
Shareholders and Board of Trustees
Dreyfus Small Cap Equity Fund
We have audited the accompanying statement of assets and liabilities, including the statement of investments, of Dreyfus Small Cap Equity Fund (one of the series comprising Dreyfus Stock Funds) as of September 30, 2013, and the related statement of operations for the year then ended, the statement of changes in net assets for each of the two years in the period then ended, and the financial highlights for each of the five years in the period then ended.These financial statements and financial highlights are the responsibility of the Fund’s management. Our responsibility is to express an opinion on these financial statements and financial highlights based on our audits.
We conducted our audits in accordance with the standards of the Public Company Accounting Oversight Board (United States).Those standards require that we plan and perform the audit to obtain reasonable assurance about whether the financial statements and financial highlights are free of material misstatement.We were not engaged to perform an audit of the Fund’s internal control over financial reporting. Our audits included consideration of internal control over financial reporting as a basis for designing audit procedures that are appropriate in the circumstances, but not for the purpose of expressing an opinion on the effectiveness of the Fund’s internal control over financial reporting. Accordingly, we express no such opinion. An audit also includes examining, on a test basis, evidence supporting the amounts and disclosures in the financial statements and financial highlights, assessing the accounting principles used and significant estimates made by management, and evaluating the overall financial statement presentation. Our procedures included confirmation of securities owned as of September 30, 2013 by correspondence with the custodian and others.We believe that our audits provide a reasonable basis for our opinion.
In our opinion, the financial statements and financial highlights referred to above present fairly, in all material respects, the financial position of Dreyfus Small Cap Equity Fund at September 30, 2013, the results of its operations for the year then ended, the changes in its net assets for each of the two years in the period then ended, and the financial highlights for each of the five years in the period then ended, in conformity with U.S. generally accepted accounting principles.
New York, New York
November 26, 2013
32
IMPORTANT TAX INFORMATION (Unaudited)
For federal tax purposes, the fund hereby reports 99.96% of the ordinary dividends paid during the fiscal year ended September 30, 2013 as qualifying for the corporate dividends received deduction. Also, certain dividends paid by the fund may be subject to a maximum tax rate of 15%, as provided for by the Jobs and Growth Tax Relief Reconciliation Act of 2003. Of the distributions paid during the fiscal year, $366,186 represents the maximum amount that may be considered qualified dividend income. Shareholders will receive notification in early 2014 of the percentage applicable to the preparation of their 2013 income tax returns. Also, the fund hereby reports $.0350 per share as a long-term capital gain distribution paid on March 21, 2013 and the fund also reports $2.3083 per share as a long-term capital gain distribution paid on December 14, 2012.
The Fund 33
BOARD MEMBERS INFORMATION (Unaudited)
|
| Joseph S. DiMartino (69) |
| Chairman of the Board (2003) |
| Principal Occupation During Past 5Years: |
| • Corporate Director and Trustee |
| Other Public Company Board Memberships During Past 5Years: |
| • CBIZ (formerly, Century Business Services, Inc.), a provider of outsourcing functions for small |
| and medium size companies, Director (1997-present) |
| • Sunair Services Corporation, a provider of certain outdoor-related services to homes and |
| businesses, Director (2005-2009) |
| • The Newark Group, a provider of a national market of paper recovery facilities, paperboard |
| mills and paperboard converting plants, Director (2000-2010) |
| No. of Portfolios for which Board Member Serves: 141 |
| ——————— |
| William Hodding Carter III (78) |
| Board Member (2003) |
| Principal Occupation During Past 5Years: |
| • Professor of Leadership & Public Policy, University of North Carolina, Chapel Hill (2006-present) |
| No. of Portfolios for which Board Member Serves: 24 |
| ——————— |
| Gordon J. Davis (72) |
| Board Member (2006) |
| Principal Occupation During Past 5Years: |
| • Partner in the law firm of Venable LLP (2012-present) |
| • Partner in the law firm of Dewey & LeBoeuf LLP (1994-2012) |
| Other Public Company Board Memberships During Past 5Years: |
| • Consolidated Edison, Inc., a utility company, Director (1997-present) |
| • The Phoenix Companies, Inc., a life insurance company, Director (2000-present) |
| No. of Portfolios for which Board Member Serves: 49 |
| ——————— |
| Joni Evans (71) |
| Board Member (2006) |
| Principal Occupation During Past 5Years: |
| • Chief Executive Officer, www.wowOwow.com an online community dedicated to women’s |
| conversations and publications (2007-present) |
| • Principal, Joni Evans Ltd. (publishing) (2006-present) |
| No. of Portfolios for which Board Member Serves: 24 |
34
|
| Ehud Houminer (73) |
| Board Member (2003) |
| Principal Occupation During Past 5Years: |
| • Executive-in-Residence at the Columbia Business School, Columbia University (1992-present) |
| Other Public Company Board Memberships During Past 5Years: |
| • Avnet Inc., an electronics distributor, Director (1993-2012) |
| No. of Portfolios for which Board Member Serves: 66 |
| ——————— |
| Richard C. Leone (73) |
| Board Member (1984) |
| Principal Occupation During Past 5Years: |
| • Senior Fellow and former President of The Century Foundation (formerly, The Twentieth |
| Century Fund, Inc.), a tax exempt research foundation engaged in the study of economic, foreign |
| policy and domestic issues |
| No. of Portfolios for which Board Member Serves: 24 |
| ——————— |
| Hans C. Mautner (75) |
| Board Member (2003) |
| Principal Occupation During Past 5Years: |
| • President—International Division and an Advisory Director of Simon Property Group, a real |
| estate investment company (1998-2010) |
| • Chairman and Chief Executive Officer of Simon Global Limited, a real estate company (1999-2010) |
| No. of Portfolios for which Board Member Serves: 24 |
| ——————— |
| Robin A. Melvin (50) |
| Board Member (2003) |
| Principal Occupation During Past 5Years: |
| • Director, Boisi Family Foundation, a private family foundation that supports youth-serving orga- |
| nizations that promote the self sufficiency of youth from disadvantaged circumstances (1995-2012) |
| • Board Member, Illinois Mentoring Partnership, non-profit organization dedicated to increasing |
| the quantity and quality of mentoring services in Illinois (2013-present) |
| No. of Portfolios for which Board Member Serves: 90 |
The Fund 35
BOARD MEMBERS INFORMATION (Unaudited) (continued)
|
| Burton N. Wallack (62) |
| Board Member (2006) |
| Principal Occupation During Past 5Years: |
| • President and Co-owner of Wallack Management Company, a real estate management company |
| No. of Portfolios for which Board Member Serves: 24 |
| ——————— |
| John E. Zuccotti (76) |
| Board Member (2003) |
| Principal Occupation During Past 5Years: |
| • Chairman of Brookfield Properties, Inc. |
| • Senior Counsel of Weil, Gotshal & Manges, LLP |
| • Emeritus Chairman of the Real Estate Board of New York |
| Other Public Company Board Memberships During Past 5Years: |
| • Wellpoint, Inc., a health benefits company, Director (2005-2010) |
| No. of Portfolios for which Board Member Serves: 24 |
| ——————— |
| Once elected all Board Members serve for an indefinite term, but achieve Emeritus status upon reaching age 80.The |
| address of the Board Members and Officers is c/o The Dreyfus Corporation, 200 Park Avenue, NewYork, NewYork |
| 10166.Additional information about the Board Members is available in the fund’s Statement of Additional Information |
| which can be obtained from Dreyfus free of charge by calling this toll free number: 1-800-DREYFUS. |
| David W. Burke, Emeritus Board Member |
| Arnold S. Hiatt, Emeritus Board Member |
36
OFFICERS OF THE FUND (Unaudited)
The Fund 37
OFFICERS OF THE FUND (Unaudited) (continued)
38
Item 2. Code of Ethics.
The Registrant has adopted a code of ethics that applies to the Registrant's principal executive officer, principal financial officer, principal accounting officer or controller, or persons performing similar functions. There have been no amendments to, or waivers in connection with, the Code of Ethics during the period covered by this Report.
Item 3. Audit Committee Financial Expert.
The Registrant's Board has determined that Ehud Houminer, a member of the Audit Committee of the Board, is an audit committee financial expert as defined by the Securities and Exchange Commission (the "SEC"). Ehud Houminer is "independent" as defined by the SEC for purposes of audit committee financial expert determinations.
Item 4. Principal Accountant Fees and Services.
(a) Audit Fees. The aggregate fees billed for each of the last two fiscal years (the "Reporting Periods") for professional services rendered by the Registrant's principal accountant (the "Auditor") for the audit of the Registrant's annual financial statements or services that are normally provided by the Auditor in connection with the statutory and regulatory filings or engagements for the Reporting Periods, were $72,481 in 2012 and $74,170 in 2013.
(b) Audit-Related Fees. The aggregate fees billed in the Reporting Periods for assurance and related services by the Auditor that are reasonably related to the performance of the audit of the Registrant's financial statements and are not reported under paragraph (a) of this Item 4 were $24,000 in 2012 and $6,000 in 2013. These services consisted of one or more of the following: (i) agreed upon procedures related to compliance with Internal Revenue Code section 817(h), (ii) security counts required by Rule 17f-2 under the Investment Company Act of 1940, as amended, (iii) advisory services as to the accounting or disclosure treatment of Registrant transactions or events and (iv) advisory services to the accounting or disclosure treatment of the actual or potential impact to the Registrant of final or proposed rules, standards or interpretations by the Securities and Exchange Commission, the Financial Accounting Standards Boards or other regulatory or standard-setting bodies.
The aggregate fees billed in the Reporting Periods for non-audit assurance and related services by the Auditor to the Registrant's investment adviser (not including any sub-investment adviser whose role is primarily portfolio management and is subcontracted with or overseen by another investment adviser), and any entity controlling, controlled by or under common control with the investment adviser that provides ongoing services to the Registrant ("Service Affiliates"), that were reasonably related to the performance of the annual audit of the Service Affiliate, which required pre-approval by the Audit Committee were $0 in 2012 and $0 in 2013.
(c) Tax Fees. The aggregate fees billed in the Reporting Periods for professional services rendered by the Auditor for tax compliance, tax advice, and tax planning ("Tax Services") were $8,457 in 2012 and $9,922 in 2013. These services consisted of: (i) review or preparation of U.S. federal, state, local and excise tax returns; (ii) U.S. federal, state and local tax planning, advice and assistance regarding statutory, regulatory or administrative developments; (iii) tax advice regarding tax qualification matters and/or treatment of various financial instruments held or proposed to be acquired or held, and (iv) determination of Passive Foreign Investment Companies. The aggregate fees billed in the Reporting Periods for Tax Services by the Auditor to Service Affiliates, which required pre-approval by the Audit Committee were $0 in 2012 and $0 in 2013.
(d) All Other Fees. The aggregate fees billed in the Reporting Periods for products and services provided by the Auditor, other than the services reported in paragraphs (a) through (c) of this Item, were $510 in 2012 and $482 in 2012. [These services consisted of a review of the Registrant's anti-money laundering program].
The aggregate fees billed in the Reporting Periods for Non-Audit Services by the Auditor to Service Affiliates, other than the services reported in paragraphs (b) through (c) of this Item, which required pre-approval by the Audit Committee, were $200,000 in 2012 and $0 in 2013.
(e)(1) Audit Committee Pre-Approval Policies and Procedures. The Registrant's Audit Committee has established policies and procedures (the "Policy") for pre-approval (within specified fee limits) of the Auditor's engagements for non-audit services to the Registrant and Service Affiliates without specific case-by-case consideration. The pre-approved services in the Policy can include pre-approved audit services, pre-approved audit-related services, pre-approved tax services and pre-approved all other services. Pre-approval considerations include whether the proposed services are compatible with maintaining the Auditor's independence. Pre-approvals pursuant to the Policy are considered annually.
(e)(2) Note: None of the services described in paragraphs (b) through (d) of this Item 4 were approved by the Audit Committee pursuant to paragraph (c)(7)(i)(C) of Rule 2-01 of Regulation S-X.
(f) None of the hours expended on the principal accountant's engagement to audit the registrant's financial statements for the most recent fiscal year were attributed to work performed by persons other than the principal account's full-time, permanent employees.
Non-Audit Fees. The aggregate non-audit fees billed by the Auditor for services rendered to the Registrant, and rendered to Service Affiliates, for the Reporting Periods were $44,747,470 in 2012 and $52,124,229 in 2013.
Auditor Independence. The Registrant's Audit Committee has considered whether the provision of non-audit services that were rendered to Service Affiliates, which were not pre-approved (not requiring pre-approval), is compatible with maintaining the Auditor's independence.
Item 5. Audit Committee of Listed Registrants.
Not applicable. [CLOSED-END FUNDS ONLY]
Item 6. Investments.
(a) Not applicable.
Item 7. Disclosure of Proxy Voting Policies and Procedures for Closed-End Management Investment Companies.
Not applicable. [CLOSED-END FUNDS ONLY]
Item 8. Portfolio Managers of Closed-End Management Investment Companies.
Not applicable. [CLOSED-END FUNDS ONLY, beginning with reports for periods ended on and after December 31, 2005]
Item 9. Purchases of Equity Securities by Closed-End Management Investment Companies and Affiliated Purchasers.
Not applicable. [CLOSED-END FUNDS ONLY]
Item 10. Submission of Matters to a Vote of Security Holders.
There have been no material changes to the procedures applicable to Item 10.
Item 11. Controls and Procedures.
(a) The Registrant's principal executive and principal financial officers have concluded, based on their evaluation of the Registrant's disclosure controls and procedures as of a date within 90 days of the filing date of this report, that the Registrant's disclosure controls and procedures are reasonably designed to ensure that information required to be disclosed by the Registrant on Form N-CSR is recorded, processed, summarized and reported within the required time periods and that information required to be disclosed by the Registrant in the reports that it files or submits on Form N-CSR is accumulated and communicated to the Registrant's management, including its principal executive and principal financial officers, as appropriate to allow timely decisions regarding required disclosure.
(b) There were no changes to the Registrant's internal control over financial reporting that occurred during the second fiscal quarter of the period covered by this report that have materially affected, or are reasonably likely to materially affect, the Registrant's internal control over financial reporting.
Item 12. Exhibits.
(a)(1) Code of ethics referred to in Item 2.
(a)(2) Certifications of principal executive and principal financial officers as required by Rule 30a-2(a) under the Investment Company Act of 1940.
(a)(3) Not applicable.
(b) Certification of principal executive and principal financial officers as required by Rule 30a-2(b) under the Investment Company Act of 1940.
SIGNATURES
Pursuant to the requirements of the Securities Exchange Act of 1934 and the Investment Company Act of 1940, the Registrant has duly caused this Report to be signed on its behalf by the undersigned, thereunto duly authorized.
DREYFUS STOCK FUNDS
By: /s/ Bradley J. Skapyak |
Bradley J. Skapyak President |
Date: | November 25, 2013 |
|
Pursuant to the requirements of the Securities Exchange Act of 1934 and the Investment Company Act of 1940, this Report has been signed below by the following persons on behalf of the Registrant and in the capacities and on the dates indicated. |
|
By: /s/ Bradley J. Skapyak |
Bradley J. Skapyak President |
Date: | November 25, 2013 |
|
By: /s/ James Windels |
James Windels Treasurer |
Date: | November 25, 2013 |
|
EXHIBIT INDEX
(a)(1) Code of ethics referred to in Item 2.
(a)(2) Certifications of principal executive and principal financial officers as required by Rule 30a-2(a) under the Investment Company Act of 1940. (EX-99.CERT)
(b) Certification of principal executive and principal financial officers as required by Rule 30a-2(b) under the Investment Company Act of 1940. (EX-99.906CERT)