UNITED STATES
SECURITIES AND EXCHANGE COMMISSION
Washington, D.C. 20549
FORM N-CSR
CERTIFIED SHAREHOLDER REPORT OF REGISTERED MANAGEMENT
INVESTMENT COMPANIES
Investment Company Act file number | 811-21236 |
| |
| DREYFUS STOCK FUNDS | |
| (Exact name of Registrant as specified in charter) | |
| | |
| c/o The Dreyfus Corporation 200 Park Avenue New York, New York 10166 | |
| (Address of principal executive offices) (Zip code) | |
| | |
| Janette E. Farragher, Esq. 200 Park Avenue New York, New York 10166 | |
| (Name and address of agent for service) | |
|
Registrant's telephone number, including area code: | (212) 922-6000 |
| |
Date of fiscal year end: | 09/30 | |
Date of reporting period: | 09/30/12 | |
| | | | | | | |
FORM N-CSR
Item 1. Reports to Stockholders.
Dreyfus
International
Equity Fund
ANNUAL REPORT September 30, 2012

Save time. Save paper. View your next shareholder report online as soon as it’s available. Log into www.dreyfus.com and sign up for Dreyfus eCommunications. It’s simple and only takes a few minutes.
The views expressed in this report reflect those of the portfolio manager only through the end of the period covered and do not necessarily represent the views of Dreyfus or any other person in the Dreyfus organization. Any such views are subject to change at any time based upon market or other conditions and Dreyfus disclaims any responsibility to update such views.These views may not be relied on as investment advice and, because investment decisions for a Dreyfus fund are based on numerous factors, may not be relied on as an indication of trading intent on behalf of any Dreyfus fund.
Not FDIC-Insured • Not Bank-Guaranteed • May Lose Value
| |
| | Contents |
| |
| | THE FUND |
| 2 | A Letter from the Chairman and CEO |
| 3 | Discussion of Fund Performance |
| 6 | Fund Performance |
| 8 | Understanding Your Fund’s Expenses |
| 8 | Comparing Your Fund’s Expenses |
| With Those of Other Funds |
| 9 | Statement of Investments |
| 13 | Statement of Assets and Liabilities |
| 14 | Statement of Operations |
| 15 | Statement of Changes in Net Assets |
| 17 | Financial Highlights |
| 20 | Notes to Financial Statements |
| 33 | Report of Independent Registered |
| | Public Accounting Firm |
| 34 | Important Tax Information |
| 35 | Board Members Information |
| 38 | Officers of the Fund |
| |
| FOR MORE INFORMATION |
|
| | Back Cover |
Dreyfus
International Equity Fund
The Fund
A LETTER FROM THE CHAIRMAN AND CEO

Dear Shareholder:
This annual report for Dreyfus International Equity Fund covers the 12-month period from October 1, 2011, through September 30, 2012. For information about how the fund performed during the reporting period, as well as general market perspectives, we provide a Discussion of Fund Performance on the pages that follow.
U.S. equities proved unusually volatile over the past year, as prices rose and fell according to investors’ changing expectations of global and domestic economic conditions.And while the pace of U.S. economic growth has been relatively consistent, it has progressed at about half the average rate achieved in prior recoveries. Overseas, Europe has remained under severe economic pressure due to a persistent debt crisis and austerity-oriented fiscal policies adopted by many governments. In Japan, a strengthening currency dampened export activity and economic growth. The emerging markets have posted a slower rate of growth, reducing demand for industrial commodities and other goods and services.
The sustained-but-subpar U.S. expansion appears likely to continue over the foreseeable future.Across the international markets though, on one hand the global economy has responded to a variety of stimulative measures, most notably aggressively accommodative monetary policies in most major markets. On the other hand, headwinds emanating from Europe and China may continue to weigh on economic growth and investor sentiment. Indeed, the ability of governments and economic policymakers to address these issues could go a long way toward shaping the 2013 market environment. As always, we urge you to speak regularly with your financial advisor to discuss how changing global economic conditions may affect your investments.
Thank you for your continued confidence and support.

Jonathan R. Baum
Chairman and Chief Executive Officer
The Dreyfus Corporation
October 15, 2012
2
DISCUSSION OF FUND PERFORMANCE
For the period of October 1, 2011, through September 30, 2012, as provided by Sean P. Fitzgibbon and Mark A. Bogar, Portfolio Managers
Fund and Market Performance Overview
For the 12-month period ended September 30, 2012, Dreyfus International Equity Fund’s Class A shares produced a total return of 19.12%, Class C shares returned 18.24% and Class I shares returned 19.51%.1 In comparison, the fund’s benchmark, the Morgan Stanley Capital International Europe, Australasia, Far East Index (the “MSCI EAFE Index”), produced a total return of 13.75% for the same period.2
International stocks encountered heightened volatility throughout the reporting period due to changing global economic conditions. The fund produced higher returns than its benchmark, primarily due to the success of our security selection strategy in the consumer discretionary, financials and utilities sectors.
The Fund’s Investment Approach
The fund seeks long-term growth of capital. The fund normally invests at least 80% of assets in shares of companies located in the foreign countries represented in the MSCI EAFE Index and Canada, and may also invest up to 20% of its assets in securities of issuers located in emerging market countries.
The fund invests in stocks that appear to be undervalued and exhibit better fundamentals than the market expects.We employ a “bottom-up” investment approach, which emphasizes individual stock selection. Our stock selection process is designed to produce a diversified portfolio that, relative to the MSCI EAFE Index, frequently has a below-average price/earnings ratio and an above-average earnings growth trend.
Markets Reacted Sharply to Economic Developments
The reporting period began in the immediate aftermath of major stock market declines throughout the world. One credit-rating agency’s downgrade of long-term U.S. government debt, an intensifying European debt crisis and inflationary pressures in China had triggered a flight away from stocks and other risky assets. Fortunately, better U.S. economic data and remedial measures from European policymakers soon stabilized many global equity markets.
The Fund 3
DISCUSSION OF FUND PERFORMANCE (continued)
By the start of 2012, international stocks were rallying amid U.S. employment gains, quantitative easing in Europe and less restrictive monetary and fiscal policies in China. Consequently, investors focused more intently on company fundamentals and less on macroeconomic developments. They returned to a risk-averse posture during the spring when austerity programs in Europe encountered resistance, but more encouraging economic data over the summer enabled the MSCI EAFE Index to end the reporting period with double-digit gains.
In this tumultuous environment, international investors tended to prefer large-cap, dividend-paying companies with positive earnings momentum. In contrast, value-oriented companies generally fell out of favor.
Consumer Stocks Drove Fund’s Strong Performance
Our bottom-up security selection process proved quite effective over the reporting period. Results compared to the benchmark were especially robust in Germany’s consumer discretionary sector, where broadcaster ProSieben divested non-core assets and strengthened its balance sheet, and automotive industry supplier Continental encountered rising demand for tires and gained market share for auto parts among German carmakers. In the financials sector, U.K. investment manager Aberdeen Asset Management attracted assets to its emerging-markets equity funds. Among utilities, the fund successfully avoided weakness affecting Japanese power producers that were unable to pass along higher input costs to their customers.
From a country perspective, the fund scored a number of successes in the United Kingdom, as overweighted exposure to well-capitalized financial services companies bolstered returns. Results in Germany, which ranked as one of the healthier European economies, were buoyed by an emphasis on the health care sector, including pharmaceutical developer Bayer.
Disappointments during the reporting period were concentrated in the information technology sector, where several Japanese software developers lagged market averages. For example, Japanese social gaming company Gree was affected when the government outlawed a sales tactic called “complete gacha.” Results from the consumer staples sector were undermined by lack of exposure to some of the category’s stronger performers, including The Netherlands’ Anheuser-Busch InBev. Italy proved to be the
4
fund’s weakest market for relative performance, as a number of telecommunications companies and utilities continued to lose value despite historically low valuations and high dividend yields. Japan also hurt relative results when companies expected to benefit from a global economic recovery had not yet done so.
Finding Attractive Opportunities Worldwide
The international equity markets’ gyrations have created attractive valuations among companies we consider fundamentally sound. In our judgment, the fund remains well positioned for a broad-based market rebound amid expectations that the European Central Bank will continue to take strong action to prevent a more severe financial crisis, a new government in China will adopt more stimulative fiscal policies and the United States will enact legislation to avoid automatic tax hikes and spending reductions scheduled for year-end.We have found a number of companies meeting our investment criteria in the consumer discretionary, information technology and industrials sectors, but fewer among financial companies and utilities.
October 15, 2012
Equity funds are subject generally to market, market sector, market liquidity, issuer and investment style risks, among
other factors, to varying degrees, all of which are more fully described in the fund’s prospectus.
The fund’s performance will be influenced by political, social and economic factors affecting investments in foreign
companies. Special risks associated with investments in foreign companies include exposure to currency fluctuations, less
liquidity, less developed or less efficient trading markets, lack of comprehensive company information, political
instability and differing auditing and legal standards.These risks are enhanced in emerging markets countries.
Investments in foreign currencies are subject to the risk that those currencies will decline in value relative to the U.S.
dollar, or, in the case of hedged positions, that the U.S. dollar will decline relative to the currency being hedged. Each
of these risks could increase the fund’s volatility.
1 Total return includes reinvestment of dividends and any capital gains paid, and does not take into consideration the
maximum initial sales charge in the case of Class A shares, or the applicable contingent deferred sales charge imposed
on redemptions in the case of Class C shares. Had these charges been reflected, returns would have been lower. Past
performance is no guarantee of future results. Share price and investment return fluctuate such that upon redemption,
fund shares may be worth more or less than their original cost. Return figures provided reflect the absorption of certain
fund expenses by The Dreyfus Corporation and The Boston Company Asset Management, LLC. Had these
expenses not been absorbed, returns would have been lower.
2 SOURCE: LIPPER INC. – Reflects reinvestment of net dividends and, where applicable, capital gain distributions.
The Morgan Stanley Capital International Europe,Australasia, Far East (MSCI EAFE) Index is an unmanaged
index composed of a sample of companies representative of the market structure of European and Pacific Basin
countries. Returns are calculated on a month-end basis. Investors cannot invest directly in any index.
The Fund 5
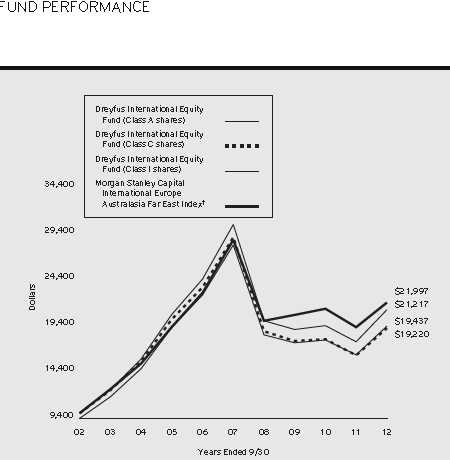
Comparison of change in value of $10,000 investment in Dreyfus International Equity Fund
Class A shares, Class C shares and Class I shares and the Morgan Stanley Capital International
Europe Australasia Far East Index
† Source: Lipper Inc.
Past performance is not predictive of future performance.
The above graph compares a $10,000 investment made in each of the Class A, Class C and Class I shares of Dreyfus
International Equity Fund on 9/30/02 to a $10,000 investment made in the Morgan Stanley Capital International
Europe Australasia Far East Index (the “Index”) on that date.All dividends and capital gain distributions are reinvested.
Prior to 8/1/07, the fund invested its assets in a “master portfolio” that had the same investment objective and
policies as the fund. This master/feeder arrangement was terminated on 8/1/07 and the fund operates as a
stand alone fund. Performance information represents the performance of the predecessor master portfolio (and its
predecessor fund) and the expenses of the master portfolio’s predecessor fund through January 31, 2003, and the
fund’s performance and expense structure thereafter. The master portfolio’s predecessor fund contributed all of its
assets to the master portfolio before the fund commenced investment operations on 2/1/03.
The fund’s performance shown in the line graph above takes into account the maximum initial sales charge on Class A
shares and all other applicable fees and expenses on all classes.The Index is an unmanaged index composed of a sample
of companies representative of the market structure of European and Pacific Basin countries. Unlike a mutual fund, the
Index is not subject to charges, fees and other expenses. Investors cannot invest directly in any index. Further information
relating to fund performance, including expense reimbursements, if applicable, is contained in the Financial Highlights
section of the prospectus and elsewhere in this report.
6
| | | | | | |
| Average Annual Total Returns as of 9/30/12 | | | | | | |
| |
| | 1 | Year | 5 Years | | 10 Years | |
| Class A shares | | | | | | |
| with maximum sales charge (5.75%) | 12.26 | % | –8.29 | % | 6.87 | % |
| without sales charge | 19.12 | % | –7.20 | % | 7.51 | % |
| Class C shares | | | | | | |
| with applicable redemption charge † | 17.24 | % | –7.94 | % | 6.75 | % |
| without redemption | 18.24 | % | –7.94 | % | 6.75 | % |
| Class I shares | 19.51 | % | –6.99 | % | 7.81 | % |
| Morgan Stanley Capital International | | | | | | |
| Europe Australasia Far East Index | 13.75 | % | –5.24 | % | 8.20 | % |
Past performance is not predictive of future performance.The fund’s performance shown in the graph and table does not
reflect the deduction of taxes that a shareholder would pay on fund distributions or the redemption of fund shares.
† The maximum contingent deferred sales charge for Class C shares is 1% for shares redeemed within one year of the
date of purchase.
The Fund 7
UNDERSTANDING YOUR FUND’S EXPENSES (Unaudited)
As a mutual fund investor, you pay ongoing expenses, such as management fees and other expenses. Using the information below, you can estimate how these expenses affect your investment and compare them with the expenses of other funds.You also may pay one-time transaction expenses, including sales charges (loads) and redemption fees, which are not shown in this section and would have resulted in higher total expenses. For more information, see your fund’s prospectus or talk to your financial adviser.
Review your fund’s expenses
The table below shows the expenses you would have paid on a $1,000 investment in Dreyfus International Equity Fund from April 1, 2012 to September 30, 2012. It also shows how much a $1,000 investment would be worth at the close of the period, assuming actual returns and expenses.
Expenses and Value of a $1,000 Investment
assuming actual returns for the six months ended September 30, 2012
| | | | | | |
| | | Class A | | Class C | | Class I |
| Expenses paid per $1,000† | $ | 5.62 | $ | 9.52 | $ | 4.27 |
| Ending value (after expenses) | $ | 1,008.50 | $ | 1,004.80 | $ | 1,010.30 |
COMPARING YOUR FUND’S EXPENSES WITH THOSE OF OTHER FUNDS (Unaudited)
Using the SEC’s method to compare expenses
The Securities and Exchange Commission (SEC) has established guidelines to help investors assess fund expenses. Per these guidelines, the table below shows your fund’s expenses based on a $1,000 investment, assuming a hypothetical 5% annualized return. You can use this information to compare the ongoing expenses (but not transaction expenses or total cost) of investing in the fund with those of other funds.All mutual fund shareholder reports will provide this information to help you make this comparison. Please note that you cannot use this information to estimate your actual ending account balance and expenses paid during the period.
Expenses and Value of a $1,000 Investment
assuming a hypothetical 5% annualized return for the six months ended September 30, 2012
| | | | | | |
| | | Class A | | Class C | | Class I |
| Expenses paid per $1,000† | $ | 5.65 | $ | 9.57 | $ | 4.29 |
| Ending value (after expenses) | $ | 1,019.40 | $ | 1,015.50 | $ | 1,020.75 |
† Expenses are equal to the fund’s annualized expense ratio of 1.12% for Class A, 1.90% for Class C, and .85%
for Class I, multiplied by the average account value over the period, multiplied by 183/366 (to reflect the one-half
year period).
8
STATEMENT OF INVESTMENTS
September 30, 2012
| | | |
| Common Stocks—97.7% | Shares | | Value ($) |
| Australia—6.8% | | | |
| Atlas Iron | 418,510 | a | 612,111 |
| Australia & New Zealand Banking Group | 45,530 | | 1,168,901 |
| Coca-Cola Amatil | 114,880 | | 1,615,880 |
| Commonwealth Bank of Australia | 23,920 | | 1,383,779 |
| Dexus Property Group | 1,825,990 | | 1,799,397 |
| Rio Tinto | 29,926 | | 1,656,416 |
| Spark Infrastructure Group | 1,098,430 | b | 1,857,227 |
| Stockland | 349,650 | | 1,211,393 |
| | | | 11,305,104 |
| Finland—1.5% | | | |
| Kemira | 37,300 | | 518,628 |
| Sampo, Cl. A | 64,310 | | 2,000,752 |
| | | | 2,519,380 |
| France—8.6% | | | |
| Arkema | 11,470 | | 1,073,921 |
| Dassault Systemes | 8,210 | | 862,589 |
| Fonciere Des Regions | 16,750 | | 1,259,188 |
| L’Oreal | 13,910 | | 1,720,652 |
| Sanofi | 52,630 | | 4,487,394 |
| Schneider Electric | 19,230 | | 1,138,088 |
| Technip | 19,650 | | 2,184,484 |
| Total | 30,952 | | 1,535,310 |
| | | | 14,261,626 |
| Germany—7.2% | | | |
| Bayer | 33,810 | | 2,903,599 |
| Continental | 22,670 | | 2,219,864 |
| Deutsche Lufthansa | 72,480 | | 982,631 |
| Fresenius & Co | 16,560 | | 1,922,473 |
| Gerresheimer | 29,290 | a | 1,530,783 |
| Hannover Rueckversicherung | 37,460 | | 2,393,660 |
| | | | 11,953,010 |
| Hong Kong—1.0% | | | |
| SJM Holdings | 725,000 | | 1,576,402 |
| Italy—2.1% | | | |
| Atlantia | 55,612 | | 863,287 |
| Telecom Italia | 2,606,260 | | 2,612,356 |
| | | | 3,475,643 |
The Fund 9
STATEMENT OF INVESTMENTS (continued)
| | | |
| Common Stocks (continued) | Shares | | Value ($) |
| Japan—19.7% | | | |
| Astellas Pharma | 35,100 | | 1,783,336 |
| Daito Trust Construction | 30,300 | | 3,047,860 |
| DeNA | 39,900 | | 1,325,228 |
| Fuji Heavy Industries | 330,000 | | 2,740,133 |
| Hitachi | 639,000 | | 3,553,639 |
| Hitachi Chemical | 39,600 | | 535,341 |
| INPEX | 288 | | 1,717,888 |
| Japan Tobacco | 78,700 | | 2,361,807 |
| Keihin | 77,600 | | 917,796 |
| Mitsubishi | 90,800 | | 1,651,015 |
| Murata Manufacturing | 27,000 | | 1,437,532 |
| Nihon Kohden | 44,400 | | 1,541,256 |
| Nippon Shokubai | 81,000 | | 906,112 |
| Nitto Denko | 21,800 | | 1,039,159 |
| Sega Sammy Holdings | 83,800 | | 1,590,310 |
| Seven & I Holdings | 80,600 | | 2,475,630 |
| Softbank | 44,100 | | 1,785,700 |
| Sumitomo Mitsui Financial Group | 44,700 | | 1,397,591 |
| Toyo Suisan Kaisha | 38,000 | | 950,487 |
| | | | 32,757,820 |
| Netherlands—6.4% | | | |
| ING Groep | 293,330 | a | 2,317,826 |
| Koninklijke Philips Electronics | 107,030 | | 2,497,018 |
| Nutreco | 13,320 | | 986,616 |
| STMicroelectronics | 378,000 | | 2,036,745 |
| Unilever | 80,710 | | 2,855,312 |
| | | | 10,693,517 |
| Norway—1.5% | | | |
| TGS Nopec Geophysical | 78,120 | | 2,548,592 |
| Singapore—1.3% | | | |
| United Overseas Bank | 132,000 | | 2,113,592 |
| Spain—1.3% | | | |
| Inditex | 10,470 | | 1,300,106 |
| Red Electrica | 19,320 | | 915,998 |
| | | | 2,216,104 |
10
| | | | |
| Common Stocks (continued) | Shares | | | Value ($) |
| Sweden—2.9% | | | | |
| Autoliv, SDR | 17,240 | | | 1,062,147 |
| Volvo, Cl. B | 269,770 | | | 3,782,398 |
| | | | | 4,844,545 |
| Switzerland—9.4% | | | | |
| ABB | 186,920 | a | 3,505,868 |
| Adecco | 50,600 | a | 2,408,140 |
| Cie Financiere Richemont, Cl. A | 15,520 | | | 930,705 |
| Nestle | 26,787 | | | 1,688,962 |
| Novartis | 20,860 | | | 1,276,441 |
| Partners Group Holding | 9,140 | | | 1,901,859 |
| Syngenta | 4,890 | | | 1,827,576 |
| Zurich Insurance Group | 8,500 | a | 2,116,640 |
| | | | | 15,656,191 |
| United Arab Emirates—1.2% | | | | |
| Dragon Oil | 195,330 | | | 1,908,290 |
| United Kingdom—25.3% | | | | |
| Aberdeen Asset Management | 466,180 | | | 2,341,928 |
| Barclays | 691,310 | | | 2,398,436 |
| BHP Billiton | 43,330 | | | 1,346,913 |
| BT Group | 521,040 | | | 1,941,058 |
| Centrica | 313,470 | | | 1,659,300 |
| Diageo | 57,740 | | | 1,621,889 |
| Experian | 174,910 | | | 2,906,364 |
| GlaxoSmithKline | 125,650 | | | 2,896,400 |
| ITV | 831,420 | | | 1,186,841 |
| Kingfisher | 338,150 | | | 1,442,654 |
| Legal & General Group | 517,420 | | | 1,102,067 |
| Lloyds Banking Group | 3,872,430 | a | | 2,428,124 |
| Old Mutual | 479,607 | | | 1,315,827 |
| Rexam | 220,545 | | | 1,548,840 |
| Rio Tinto | 71,241 | | | 3,318,912 |
| Rolls-Royce Holdings | 90,110 | a | | 1,226,650 |
| Royal Bank of Scotland Group | 501,948 | a | 2,083,108 |
| Royal Dutch Shell, Cl. B | 178,680 | | | 6,341,961 |
| SABMiller | 34,450 | | | 1,513,136 |
The Fund 11
STATEMENT OF INVESTMENTS (continued)
| | | |
| Common Stocks (continued) | Shares | | Value ($) |
| United Kingdom (continued) | | | |
| Unilever | 37,230 | | 1,353,884 |
| | | | 41,974,292 |
| United States—1.5% | | | |
| iShares MSCI EAFE Index Fund | 45,780 | | 2,426,340 |
| Total Common Stocks | | | |
| (cost $155,416,927) | | | 162,230,448 |
| |
| Preferred Stocks—1.2% | | | |
| Germany | | | |
| ProSiebenSat.1 Media | | | |
| (cost $2,221,843) | 76,500 | | 1,927,295 |
| |
| Other Investment—.0% | | | |
| Registered Investment Company; | | | |
| Dreyfus Institutional Preferred Plus Money Market Fund | | | |
| (cost $97,993) | 97,993 | c | 97,993 |
| Total Investments (cost $157,736,763) | 98.9 | % | 164,255,736 |
| Cash and Receivables (Net) | 1.1 | % | 1,767,908 |
| Net Assets | 100.0 | % | 166,023,644 |
SDR—Swedish Depository Receipts
a Non-income producing security.
b Security exempt from registration pursuant to Rule 144A under the Securities Act of 1933.This security may be
resold in transactions exempt from registration, normally to qualified institutional buyers.At September 30, 2012, this
security was valued at $1,857,227 or 1.1% of net assets.
c Investment in affiliated money market mutual fund.
| | | |
| Portfolio Summary (Unaudited)† | | |
| |
| | Value (%) | | Value (%) |
| Financial | 19.7 | Information Technology | 6.6 |
| Consumer Discretionary | 15.3 | Telecommunication Services | 2.7 |
| Consumer Staples | 11.5 | Utilities | 2.7 |
| Health Care | 11.0 | Exchange-Traded Funds | 1.5 |
| Energy | 9.8 | Money Market Investment | .0 |
| Industrial | 9.4 | | |
| Materials | 8.7 | | 98.9 |
† Based on net assets.
See notes to financial statements.
12
STATEMENT OF ASSETS AND LIABILITIES
September 30, 2012
| | | | |
| | | Cost | Value | |
| Assets ($): | | | | |
| Investments in securities—See Statement of Investments: | | | |
| Unaffiliated issuers | | 157,638,770 | 164,157,743 | |
| Affiliated issuers | | 97,993 | 97,993 | |
| Cash | | | 42,241 | |
| Cash denominated in foreign currencies | | 71,016 | 68,095 | |
| Receivable for investment securities sold | | | 1,094,989 | |
| Dividends receivable | | | 915,973 | |
| Receivable for shares of Beneficial Interest subscribed | | 9,030 | |
| Unrealized appreciation on forward foreign | | | | |
| currency exchange contracts—Note 4 | | | 785 | |
| Prepaid expenses | | | 16,435 | |
| | | | 166,403,284 | |
| Liabilities ($): | | | | |
| Due to The Boston Company Asset | | | | |
| Management, LLC and affiliates—Note 3(c) | | | 129,730 | |
| Due to Administrator—Note 3(a) | | | 13,782 | |
| Payable for shares of Beneficial Interest redeemed | | | 174,912 | |
| Accrued expenses | | | 61,216 | |
| | | | 379,640 | |
| Net Assets ($) | | | 166,023,644 | |
| Composition of Net Assets ($): | | | | |
| Paid-in capital | | | 240,133,887 | |
| Accumulated undistributed investment income—net | | | 3,261,711 | |
| Accumulated net realized gain (loss) on investments | | | (83,881,090 | ) |
| Accumulated net unrealized appreciation (depreciation) | | | |
| on investments and foreign currency transactions | | | 6,509,136 | |
| Net Assets ($) | | | 166,023,644 | |
| |
| |
| Net Asset Value Per Share | | | | |
| | Class A | Class C | Class I | |
| Net Assets ($) | 36,971,527 | 4,723,821 | 124,328,296 | |
| Shares Outstanding | 1,352,245 | 172,095 | 4,526,539 | |
| Net Asset Value Per Share ($) | 27.34 | 27.45 | 27.47 | |
| |
| See notes to financial statements. | | | | |
The Fund 13
| | |
| STATEMENT OF OPERATIONS | | |
| Year Ended September 30, 2012 | | |
| |
| |
| |
| |
| Investment Income ($): | | |
| Income: | | |
| Cash dividends (net of $453,777 foreign taxes withheld at source): | | |
| Unaffiliated issuers | 5,432,886 | |
| Affiliated issuers | 749 | |
| Total Income | 5,433,635 | |
| Expenses: | | |
| Investment advisory fee—Note 3(a) | 1,311,986 | |
| Shareholder servicing costs—Note 3(c) | 214,567 | |
| Administration fee—Note 3(a) | 163,998 | |
| Professional fees | 102,812 | |
| Custodian fees—Note 3(c) | 73,700 | |
| Registration fees | 52,146 | |
| Distribution fees—Note 3(b) | 40,220 | |
| Prospectus and shareholders’ reports | 21,504 | |
| Trustees’ fees and expenses—Note 3(d) | 19,107 | |
| Loan commitment fees—Note 2 | 1,567 | |
| Interest expense—Note 2 | 1,228 | |
| Miscellaneous | 31,058 | |
| Total Expenses | 2,033,893 | |
| Less—reduction in expenses due to undertaking—Note 3(a) | (479,542 | ) |
| Less—reduction in fees due to earnings credits—Note 3(c) | (216 | ) |
| Net Expenses | 1,554,135 | |
| Investment Income—Net | 3,879,500 | |
| Realized and Unrealized Gain (Loss) on Investments—Note 4 ($): | | |
| Net realized gain (loss) on investments and foreign currency transactions | (1,984,893 | ) |
| Net realized gain (loss) on forward foreign currency exchange contracts | 27,063 | |
| Net Realized Gain (Loss) | (1,957,830 | ) |
| Net unrealized appreciation (depreciation) | | |
| on investments and foreign currency transactions | 25,695,584 | |
| Net unrealized appreciation (depreciation) | | |
| on forward foreign currency exchange contracts | (1,662 | ) |
| Net Unrealized Appreciation (Depreciation) | 25,693,922 | |
| Net Realized and Unrealized Gain (Loss) on Investments | 23,736,092 | |
| Net Increase in Net Assets Resulting from Operations | 27,615,592 | |
| |
| See notes to financial statements. | | |
14
STATEMENT OF CHANGES IN NET ASSETS
| | | | |
| | Year Ended September 30, | |
| | 2012 | a | 2011 | |
| Operations ($): | | | | |
| Investment income—net | 3,879,500 | | 3,720,015 | |
| Net realized gain (loss) on investments | (1,957,830 | ) | 8,551,088 | |
| Net unrealized appreciation | | | | |
| (depreciation) on investments | 25,693,922 | | (31,278,790 | ) |
| Net Increase (Decrease) in Net Assets | | | | |
| Resulting from Operations | 27,615,592 | | (19,007,687 | ) |
| Dividends to Shareholders from ($): | | | | |
| Investment income—net: | | | | |
| Class A Shares | (730,805 | ) | (1,234,422 | ) |
| Class B Shares | (225 | ) | (20,226 | ) |
| Class C Shares | (49,228 | ) | (94,023 | ) |
| Class I Shares | (2,819,907 | ) | (2,051,598 | ) |
| Total Dividends | (3,600,165 | ) | (3,400,269 | ) |
| Beneficial Interest Transactions ($): | | | | |
| Net proceeds from shares sold: | | | | |
| Class A Shares | 2,931,952 | | 3,279,082 | |
| Class B Shares | 2,309 | | 4,785 | |
| Class C Shares | 267,248 | | 844,584 | |
| Class I Shares | 20,601,703 | | 55,172,018 | |
| Dividends reinvested: | | | | |
| Class A Shares | 679,646 | | 1,162,122 | |
| Class B Shares | 176 | | 15,031 | |
| Class C Shares | 28,394 | | 51,936 | |
| Class I Shares | 2,819,186 | | 2,051,056 | |
| Cost of shares redeemed: | | | | |
| Class A Shares | (9,965,688 | ) | (22,649,461 | ) |
| Class B Shares | (1,088,963 | ) | (970,529 | ) |
| Class C Shares | (1,711,244 | ) | (3,087,717 | ) |
| Class I Shares | (27,850,632 | ) | (4,620,606 | ) |
| Increase (Decrease) in Net Assets from | | | | |
| Beneficial Interest Transactions | (13,285,913 | ) | 31,252,301 | |
| Total Increase (Decrease) in Net Assets | 10,729,514 | | 8,844,345 | |
| Net Assets ($): | | | | |
| Beginning of Period | 155,294,130 | | 146,449,785 | |
| End of Period | 166,023,644 | | 155,294,130 | |
| Undistributed investment income—net | 3,261,711 | | 2,849,163 | |
The Fund 15
STATEMENT OF CHANGES IN NET ASSETS (continued)
| | | | |
| | Year Ended September 30, | |
| | 2012 | a | 2011 | |
| Capital Share Transactions: | | | | |
| Class Ab | | | | |
| Shares sold | 113,569 | | 115,382 | |
| Shares issued for dividends reinvested | 29,119 | | 42,244 | |
| Shares redeemed | (387,173 | ) | (786,244 | ) |
| Net Increase (Decrease) in Shares Outstanding | (244,485 | ) | (628,618 | ) |
| Class Bb | | | | |
| Shares sold | 87 | | 145 | |
| Shares issued for dividends reinvested | 7 | | 545 | |
| Shares redeemed | (41,490 | ) | (34,604 | ) |
| Net Increase (Decrease) in Shares Outstanding | (41,396 | ) | (33,914 | ) |
| Class C | | | | |
| Shares sold | 10,434 | | 29,271 | |
| Shares issued for dividends reinvested | 1,204 | | 1,875 | |
| Shares redeemed | (67,736 | ) | (108,103 | ) |
| Net Increase (Decrease) in Shares Outstanding | (56,098 | ) | (76,957 | ) |
| Class I | | | | |
| Shares sold | 779,783 | | 1,888,349 | |
| Shares issued for dividends reinvested | 120,375 | | 74,179 | |
| Shares redeemed | (1,105,341 | ) | (173,146 | ) |
| Net Increase (Decrease) in Shares Outstanding | (205,183 | ) | 1,789,382 | |
a Effective as of the close of business on March 13, 2012, the fund no longer offers Class B shares.
b During the period ended September 30, 2012, 9,179 Class B shares representing $242,940 were automatically
converted to 9,256 Class A shares and during the period ended September 30, 2011, 5,663 Class B shares
representing $161,750 were automatically converted to 5,654 Class A shares.
See notes to financial statements.
16
FINANCIAL HIGHLIGHTS
The following tables describe the performance for each share class for the fiscal periods indicated.All information (except portfolio turnover rate) reflects financial results for a single fund share.Total return shows how much your investment in the fund would have increased (or decreased) during each period, assuming you had reinvested all dividends and distributions.These figures have been derived from the fund’s financial statements.
| | | | | | | | | | |
| | | | Year Ended September 30, | | | |
| Class A Shares | 2012 | | 2011 | | 2010 | | 2009 | | 2008 | |
| Per Share Data ($): | | | | | | | | | | |
| Net asset value, beginning of period | 23.42 | | 26.30 | | 26.36 | | 29.26 | | 48.76 | |
| Investment Operations: | | | | | | | | | | |
| Investment income—neta | .54 | | .52 | | .42 | | .45 | | .77 | |
| Net realized and unrealized | | | | | | | | | | |
| gain (loss) on investments | 3.86 | | (2.81 | ) | .06 | | (2.11 | ) | (16.45 | ) |
| Total from Investment Operations | 4.40 | | (2.29 | ) | .48 | | (1.66 | ) | (15.68 | ) |
| Distributions: | | | | | | | | | | |
| Dividends from investment income—net | (.48 | ) | (.59 | ) | (.54 | ) | (1.24 | ) | (.67 | ) |
| Dividends from net realized | | | | | | | | | | |
| gain on investments | — | | — | | — | | — | | (3.15 | ) |
| Total Distributions | (.48 | ) | (.59 | ) | (.54 | ) | (1.24 | ) | (3.82 | ) |
| Net asset value, end of period | 27.34 | | 23.42 | | 26.30 | | 26.36 | | 29.26 | |
| Total Return (%)b | 19.12 | | (9.06 | ) | 1.84 | | (4.73 | ) | (34.53 | ) |
| Ratios/Supplemental Data (%): | | | | | | | | | | |
| Ratio of total expenses | | | | | | | | | | |
| to average net assets | 1.54 | | 1.50 | | 1.64 | | 1.84 | | 1.57 | |
| Ratio of net expenses | | | | | | | | | | |
| to average net assets | 1.12 | | 1.12 | | 1.12 | | 1.12 | | 1.12 | |
| Ratio of net investment income | | | | | | | | | | |
| to average net assets | 2.12 | | 1.86 | | 1.65 | | 2.12 | | 1.90 | |
| Portfolio Turnover Rate | 64.52 | | 89.90 | | 86.84 | | 160.27 | | 117.20 | |
| Net Assets, end of period ($ x 1,000) | 36,972 | | 37,389 | | 58,526 | | 77,775 | | 129,886 | |
a Based on average shares outstanding at each month end.
b Exclusive of sales charge.
See notes to financial statements.
The Fund 17
FINANCIAL HIGHLIGHTS (continued)
| | | | | | | | | | |
| | | | Year Ended September 30, | | | |
| Class C Shares | 2012 | | 2011 | | 2010 | | 2009 | | 2008 | |
| Per Share Data ($): | | | | | | | | | | |
| Net asset value, beginning of period | 23.44 | | 26.30 | | 26.34 | | 28.82 | | 47.81 | |
| Investment Operations: | | | | | | | | | | |
| Investment income—neta | .34 | | .33 | | .22 | | .27 | | .37 | |
| Net realized and unrealized | | | | | | | | | | |
| gain (loss) on investments | 3.90 | | (2.85 | ) | .06 | | (2.02 | ) | (16.14 | ) |
| Total from Investment Operations | 4.24 | | (2.52 | ) | .28 | | (1.75 | ) | (15.77 | ) |
| Distributions: | | | | | | | | | | |
| Dividends from investment income—net | (.23 | ) | (.34 | ) | (.32 | ) | (.73 | ) | (.07 | ) |
| Dividends from net realized | | | | | | | | | | |
| gain on investments | — | | — | | — | | — | | (3.15 | ) |
| Total Distributions | (.23 | ) | (.34 | ) | (.32 | ) | (.73 | ) | (3.22 | ) |
| Net asset value, end of period | 27.45 | | 23.44 | | 26.30 | | 26.34 | | 28.82 | |
| Total Return (%)b | 18.24 | | (9.78 | ) | 1.03 | | (5.54 | ) | (35.04 | ) |
| Ratios/Supplemental Data (%): | | | | | | | | | | |
| Ratio of total expenses | | | | | | | | | | |
| to average net assets | 2.34 | | 2.27 | | 2.46 | | 2.62 | | 2.30 | |
| Ratio of net expenses | | | | | | | | | | |
| to average net assets | 1.90 | | 1.90 | | 1.90 | | 1.90 | | 1.90 | |
| Ratio of net investment income | | | | | | | | | | |
| to average net assets | 1.33 | | 1.16 | | .87 | | 1.28 | | .93 | |
| Portfolio Turnover Rate | 64.52 | | 89.90 | | 86.84 | | 160.27 | | 117.20 | |
| Net Assets, end of period ($ x 1,000) | 4,724 | | 5,348 | | 8,025 | | 10,848 | | 19,529 | |
a Based on average shares outstanding at each month end.
b Exclusive of sales charge.
See notes to financial statements.
18
| | | | | | | | | | |
| | | | Year Ended September 30, | | | |
| Class I Shares | 2012 | | 2011 | | 2010 | | 2009 | | 2008 | |
| Per Share Data ($): | | | | | | | | | | |
| Net asset value, beginning of period | 23.58 | | 26.49 | | 26.60 | | 29.73 | | 49.50 | |
| Investment Operations: | | | | | | | | | | |
| Investment income—neta | .64 | | .68 | | .55 | | .58 | | .54 | |
| Net realized and unrealized | | | | | | | | | | |
| gain (loss) on investments | 3.86 | | (2.93 | ) | .00 | b | (2.27 | ) | (16.37 | ) |
| Total from Investment Operations | 4.50 | | (2.25 | ) | .55 | | (1.69 | ) | (15.83 | ) |
| Distributions: | | | | | | | | | | |
| Dividends from investment income—net | (.61 | ) | (.66 | ) | (.66 | ) | (1.44 | ) | (.79 | ) |
| Dividends from net realized | | | | | | | | | | |
| gain on investments | — | | — | | — | | — | | (3.15 | ) |
| Total Distributions | (.61 | ) | (.66 | ) | (.66 | ) | (1.44 | ) | (3.94 | ) |
| Net asset value, end of period | 27.47 | | 23.58 | | 26.49 | | 26.60 | | 29.73 | |
| Total Return (%) | 19.51 | | (8.86 | ) | 2.06 | | (4.62 | ) | (34.34 | ) |
| Ratios/Supplemental Data (%): | | | | | | | | | | |
| Ratio of total expenses | | | | | | | | | | |
| to average net assets | 1.10 | | 1.08 | | 1.20 | | 1.26 | | 1.19 | |
| Ratio of net expenses | | | | | | | | | | |
| to average net assets | .85 | | .85 | | .85 | | .85 | | .85 | |
| Ratio of net investment income | | | | | | | | | | |
| to average net assets | 2.49 | | 2.41 | | 2.13 | | 2.58 | | 1.30 | |
| Portfolio Turnover Rate | 64.52 | | 89.90 | | 86.84 | | 160.27 | | 117.20 | |
| Net Assets, end of period ($ x 1,000) | 124,328 | | 111,593 | | 77,931 | | 31,317 | | 2,350 | |
a Based on average shares outstanding at each month end.
b Amount represents less than $.01 per share.
See notes to financial statements.
The Fund 19
NOTES TO FINANCIAL STATEMENTS
NOTE 1—Significant Accounting Policies:
Dreyfus International Equity Fund (the “fund”) is a separate diversified series of Dreyfus Stock Funds (the “Company”), which is registered under the Investment Company Act of 1940, as amended (the “Act”), as an open-end management investment company and operates as a series company currently offering two series, including the fund. The fund’s investment objective is to seek long-term growth of capital.The Boston Company Asset Management, LLC (“TBCAM”), a wholly-owned subsidiary ofThe Bank of NewYork Mellon Corporation (“BNY Mellon”), serves as the fund’s investment adviser. The Dreyfus Corporation (the “Administrator” or “Dreyfus”), a wholly-owned subsidiary of BNY Mellon and an affiliate of TBCAM, serves as the fund’s Administrator.
MBSC Securities Corporation (the “Distributor”), a wholly-owned subsidiary of Dreyfus, is the distributor of the fund’s shares.The fund is authorized to issue an unlimited number of $.001 par value shares of Beneficial Interest in each of the following classes of shares: Class A, Class C and Class I. Class A shares are subject to a sales charge imposed at the time of purchase. Class C shares are subject to a contingent deferred sales charge (“CDSC”) imposed on Class C shares redeemed within one year of purchase. Class I shares are sold at net asset value per share only to institutional investors. Class B shares were subject to a CDSC imposed on Class B share redemptions made within six years of purchase and automatically converted to Class A shares after six years. The fund no longer offers Class B shares. Effective March 13, 2012, all outstanding Class B shares were automatically converted to Class A shares. Other differences between the classes include the services offered to and the expenses borne by each class, the allocation of certain transfer agency costs and certain voting rights. Income, expenses (other than expenses attributable to a specific class), and realized and unrealized gains or losses on investments are allocated to each class of shares based on its relative net assets.
The Company accounts separately for the assets, liabilities and operations of each series. Expenses directly attributable to each series are
20
charged to that series’ operations; expenses which are applicable to all series are allocated among them on a pro rata basis.
The Financial Accounting Standards Board (“FASB”) Accounting Standards Codification is the exclusive reference of authoritative U.S. generally accepted accounting principles (“GAAP”) recognized by the FASB to be applied by nongovernmental entities. Rules and interpretive releases of the Securities and Exchange Commission (“SEC”) under authority of federal laws are also sources of authoritative GAAP for SEC registrants. The fund’s financial statements are prepared in accordance with GAAP, which may require the use of management estimates and assumptions.Actual results could differ from those estimates.
The Company enters into contracts that contain a variety of indemnifications.The fund’s maximum exposure under these arrangements is unknown.The fund does not anticipate recognizing any loss related to these arrangements.
(a) Portfolio valuation: The fair value of a financial instrument is the amount that would be received to sell an asset or paid to transfer a liability in an orderly transaction between market participants at the measurement date (i.e., the exit price). GAAP establishes a fair value hierarchy that prioritizes the inputs of valuation techniques used to measure fair value.This hierarchy gives the highest priority to unadjusted quoted prices in active markets for identical assets or liabilities (Level 1 measurements) and the lowest priority to unobservable inputs (Level 3 measurements).
Additionally, GAAP provides guidance on determining whether the volume and activity in a market has decreased significantly and whether such a decrease in activity results in transactions that are not orderly. GAAP requires enhanced disclosures around valuation inputs and techniques used during annual and interim periods.
The Fund 21
NOTES TO FINANCIAL STATEMENTS (continued)
Various inputs are used in determining the value of the fund’s investments relating to fair value measurements.These inputs are summarized in the three broad levels listed below:
Level 1—unadjusted quoted prices in active markets for identical investments.
Level 2—other significant observable inputs (including quoted prices for similar investments, interest rates, prepayment speeds, credit risk, etc.).
Level 3—significant unobservable inputs (including the fund’s own assumptions in determining the fair value of investments).
The inputs or methodology used for valuing securities are not necessarily an indication of the risk associated with investing in those securities.
Changes in valuation techniques may result in transfers in or out of an assigned level within the disclosure hierarchy. Valuation techniques used to value the fund’s investments are as follows:
Investments in securities are valued at the last sales price on the securities exchange or national securities market on which such securities are primarily traded. Securities listed on the National Market System for which market quotations are available are valued at the official closing price or, if there is no official closing price that day, at the last sales price. Securities not listed on an exchange or the national securities market, or securities for which there were no transactions, are valued at the average of the most recent bid and asked prices, except for open short positions, where the asked price is used for valuation purposes. Bid price is used when no asked price is available. Registered investment companies that are not traded on an exchange are valued at their net asset value. All of the preceding securities are categorized within Level 1 of the fair value hierarchy.
22
Fair valuing of securities may be determined with the assistance of a pricing service using calculations based on indices of domestic securities and other appropriate indicators, such as prices of relevant American Depository Receipts and financial futures. Utilizing these techniques may result in transfers between Level 1 and Level 2 of the fair value hierarchy.
When market quotations or official closing prices are not readily available, or are determined not to reflect accurately fair value, such as when the value of a security has been significantly affected by events after the close of the exchange or market on which the security is principally traded (for example, a foreign exchange or market), but before the fund calculates its net asset value, the fund may value these investments at fair value as determined in accordance with the procedures approved by the Company’s Board of Trustees (the “Board”). Certain factors may be considered when fair valuing investments such as: fundamental analytical data, the nature and duration of restrictions on disposition, an evaluation of the forces that influence the market in which the securities are purchased and sold, and public trading in similar securities of the issuer or comparable issuers.These securities are either categorized as Level 2 or 3 depending on the relevant inputs used.
For restricted securities where observable inputs are limited, assumptions about market activity and risk are used and are categorized within Level 3 of the fair value hierarchy.
Investments denominated in foreign currencies are translated to U.S. dollars at the prevailing rates of exchange.
Forward foreign currency exchange contracts (“forward contracts”) are valued at the forward rate. These securities are generally categorized within Level 2 of the fair value hierarchy.
The Fund 23
NOTES TO FINANCIAL STATEMENTS (continued)
The following is a summary of the inputs used as of September 30, 2012 in valuing the fund’s investments:
| | | | | |
| | | | Level 2—Other | Level 3— | |
| | | Level 1— | Significant | Significant | |
| | | Unadjusted | Observable | Unobservable | |
| | Quoted Prices | Inputs | Inputs | Total |
| Investments in Securities: | | | | |
| Equity Securities—Foreign | | | | |
| Common Stocks† | 159,804,108 | — | — | 159,804,108 |
| Preferred Stocks† | 1,927,295 | — | — | 1,927,295 |
| Exchange— | | | | | |
| Traded Funds | | 2,426,340 | — | — | 2,426,340 |
| Mutual Funds | | 97,993 | — | — | 97,993 |
| Other Financial | | | | | |
| Instruments: | | | | | |
| Forward Foreign Currency | | | | |
| Exchange Contracts†† | — | 785 | — | 785 |
† See Statement of Investments for additional detailed categorizations.
Amounts shown represents unrealized appreciation at period end.
At September 30, 2011, $150,678,645 of exchange traded foreign equity securities were classified as Level 2 of the fair value hierarchy pursuant to the fund’s fair valuation procedures.
(b) Foreign currency transactions: The fund does not isolate that portion of the results of operations resulting from changes in foreign exchange rates on investments from the fluctuations arising from changes in the market prices of securities held. Such fluctuations are included with the net realized and unrealized gain or loss on investments.
Net realized foreign exchange gains or losses arise from sales of foreign currencies, currency gains or losses realized on securities transactions between trade and settlement date, and the difference between the amounts of dividends, interest and foreign withholding taxes recorded on the fund’s books and the U.S. dollar equivalent of the amounts actually received or paid. Net unrealized foreign exchange gains and losses arise from changes in the value of assets and liabilities other than investments resulting from changes in exchange rates. Foreign currency gains and losses on investments are also included with net realized and unrealized gain or loss on investments.
24
(c) Securities transactions and investment income: Securities transactions are recorded on a trade date basis. Realized gains and losses from securities transactions are recorded on the identified cost basis. Dividend income is recognized on the ex-dividend date and interest income, including, where applicable, accretion of discount and amortization of premium on investments, is recognized on the accrual basis.
(d) Affiliated issuers: Investments in other investment companies advised by Dreyfus are defined as “affiliated” in the Act. Investments in affiliated investment companies for the period ended September 30, 2012 were as follows:
| | | | | | | |
| Affiliated | | | | | | | |
| Investment | Value | | | | Value | | Net |
| Company | 9/30/2011 | ($) | Purchases ($) | Sales ($) | 9/30/2012 | ($) | Assets (%) |
| Dreyfus | | | | | | | |
| Institutional | | | | | | | |
| Preferred | | | | | | | |
| Plus Money | | | | | | | |
| Market Fund | 1,299,000 | | 45,728,385 | 46,929,392 | 97,993 | | .0 |
Certain affiliated investment companies may also invest in the fund.At September 30, 2012, approximately 99% of the outstanding Class I shares were held by other funds advised or managed by Dreyfus.
(e) Risk: Investing in foreign markets may involve special risks and considerations not typically associated with investing in the U.S. These risks include revaluation of currencies, high rates of inflation, repatriation restrictions on income and capital, and adverse political and economic developments. Moreover, securities issued in these markets may be less liquid, subject to government ownership controls and delayed settlements, and their prices may be more volatile than those of comparable securities in the U.S.
(f) Dividends to shareholders: Dividends are recorded on the ex-dividend date. Dividends from investment income-net and dividends from net realized capital gains, if any, are normally declared and paid annually, but the fund may make distributions on a more frequent basis to comply with the distribution requirements of the Internal Revenue Code
The Fund 25
NOTES TO FINANCIAL STATEMENTS (continued)
of 1986, as amended (the “Code”).To the extent that net realized capital gains can be offset by capital loss carryovers, it is the policy of the fund not to distribute such gains. Income and capital gain distributions are determined in accordance with income tax regulations, which may differ from GAAP.
(g) Federal income taxes: It is the policy of the fund to continue to qualify as a regulated investment company, if such qualification is in the best interests of its shareholders, by complying with the applicable provisions of the Code, and to make distributions of taxable income sufficient to relieve it from substantially all federal income and excise taxes.
As of and during the period ended September 30, 2012, the fund did not have any liabilities for any uncertain tax positions.The fund recognizes interest and penalties, if any, related to uncertain tax positions as income tax expense in the Statement of Operations. During the period, the fund did not incur any interest or penalties.
Each of the tax years in the four-year period ended September 30, 2012 remains subject to examination by the Internal Revenue Service and state taxing authorities.
At September 30, 2012, the components of accumulated earnings on a tax basis were as follows: undistributed ordinary income $3,667,692, accumulated capital losses $80,335,762 and unrealized appreciation $5,820,500. In addition, the fund had $3,262,673 of capital losses realized after October 31, 2011, which were deferred for tax purposes to the first day of the following fiscal year.
Under the Regulated Investment Company Modernization Act of 2010 (the “2010 Act”), the fund is permitted to carry forward capital losses incurred in taxable years beginning after December 22, 2010 (“post-enactment losses”) for an unlimited period. Furthermore, post-enactment capital loss carryovers retain their character as either short-term or long-term capital losses rather than short-term as they were under previous statute. The 2010 Act requires post-enactment losses to be utilized before the utilization of losses incurred in taxable years prior to the effective date of the 2010 Act (“pre-enactment
26
losses”).As a result of this ordering rule, pre-enactment losses may be more likely to expire unused.
The accumulated capital loss carryover is available for federal income tax purposes to be applied against future net realized capital gains, if any, realized subsequent to September 30, 2012. If not applied, $32,463,626 of the carryover expires in fiscal year 2017 and $47,872,136 expires in fiscal year 2018.
The tax character of distributions paid to shareholders during the fiscal periods ended September 30, 2012 and September 30, 2011 were as follows: ordinary income $3,600,165 and $3,400,269, respectively.
During the period ended September 30, 2012, as a result of permanent book to tax differences, primarily due to the tax treatment for passive foreign investment companies, foreign currency gains and losses and recognition of book to tax differences resulting from prior year fund restructuring, the fund increased accumulated undistributed investment income-net by $133,213, decreased accumulated net realized gain (loss) on investments by $135,509 and increased paid-in capital by $2,296. Net assets and net asset value per share were not affected by this reclassification.
(h) New Accounting Pronouncement: In December 2011, FASB issued Accounting Standards Update No. 2011-11 “Disclosures about Offsetting Assets and Liabilities” (“ASU 2011-11”). These disclosure requirements are intended to help investors and other financial statement users to better assess the effect or potential effect of offsetting arrangements on a company’s financial position.They also improve transparency in the reporting of how companies mitigate credit risk, including disclosure of related collateral pledged or received. In addition,ASU 2011-11 facilitates comparison between those entities that prepare their financial statements on the basis of GAAP and those entities that prepare their financial statements on the basis of International Financial Reporting Standards (“IFRS”). ASU 2011-11 requires entities to: disclose both gross and net information about both instruments and transactions eligible for offset in the financial state-
The Fund 27
NOTES TO FINANCIAL STATEMENTS (continued)
ments; and disclose instruments and transactions subject to an agreement similar to a master netting agreement.ASU 2011-11 is effective for fiscal years beginning on or after January 1, 2013, and interim periods within those annual periods.At this time, management is evaluating the implications of ASU 2011-11 and its impact on the fund’s financial statement disclosures.
NOTE 2—Bank Lines of Credit:
The fund participates with other Dreyfus-managed funds in a $225 million unsecured credit facility led by Citibank, N.A. and a $300 million unsecured credit facility provided by The Bank of New York Mellon, a subsidiary of BNY Mellon and an affiliate of Dreyfus (each, a “Facility”), each to be utilized primarily for temporary or emergency purposes, including the financing of redemptions. In connection therewith, the fund has agreed to pay its pro rata portion of commitment fees for each Facility. Interest is charged to the fund based on rates determined pursuant to the terms of the respective Facility at the time of borrowing.
The average amount of borrowings outstanding under the Facilities during the period ended September 30, 2012, was approximately $80,100 with a related weighted average annualized interest rate of 1.53%.
NOTE 3—Investment Advisory Fee, Administration Fee and Other Transactions With Affiliates:
(a) Pursuant to an investment advisory agreement with TBCAM, the investment advisory fee is computed at the annual rate of .80% of the value of the fund’s average daily net assets up to $500 million, .75% of the next $500 million of such assets, .70% of the next $500 million of such assets, .60% of the next $500 million of such assets and .50% of the fund’s average daily net assets in excess of $2 billion and is payable monthly.
Dreyfus and TBCAM, contractually agreed, with respect to each class of fund shares to assume the expenses of the fund until September 30, 2012, so that the expenses of Class A, Class C and Class I shares (excluding taxes, interest expense, brokerage commissions, commitment fees on borrowings and extraordinary expenses) do not exceed
28
1.12%, 1.90% and .85%, respectively, of the value of such class’ average daily net assets, until the fiscal year end following such time as the expenses are equal to or less than such annual rate for the applicable class. Dreyfus and TBCAM had contractually agreed to assume the expenses of Class B until March 13, 2012, so that the expenses of Class B (exclusive of certain expenses as described above) did not exceed 1.95% of the value of the Class B shares’ average daily net assets.The reduction in expenses, pursuant to the undertaking, amounted to $479,542 during the period ended September 30, 2012.
The fund compensates Dreyfus under an administration agreement for providing personnel and facilities to perform accounting and administration services for the fund at an annual rate of .10% of the value of the fund’s average daily net assets.
During the period ended September 30, 2012, the Distributor retained $644 from commissions earned on sales of the fund’s Class A shares and $335 and $137 from CDSCs on redemptions of the fund’s Class B and Class C shares, respectively.
(b) Under the Distribution Plan adopted pursuant to Rule 12b-1 under the Act, Class B shares paid and Class C shares pay the Distributor for distributing their shares at an annual rate of .75% of the value of the average daily net assets of Class B and Class C shares. During the period ended September 30, 2012, Class B and Class C shares were charged $2,527 and $37,693, respectively, pursuant to the Distribution Plan.
(c) Under the Shareholder Services Plan, Class A and Class C shares pay and Class B shares paid the Distributor at an annual rate of .25% of the value of their average daily net assets for the provision of certain services. The services provided may include personal services relating to shareholder accounts, such as answering shareholder inquiries regarding the fund and providing reports and other information, and services related to the maintenance of shareholder accounts.The Distributor may make payments to Service Agents (securities dealers, financial institutions or
The Fund 29
NOTES TO FINANCIAL STATEMENTS (continued)
other industry professionals) in respect of these services.The Distributor determines the amounts to be paid to Service Agents. During the period ended September 30, 2012, Class A, Class B and Class C shares were charged $93,497, $842 and $12,564, respectively, pursuant to the Shareholder Services Plan.
The fund has arrangements with the transfer agent and the custodian whereby the fund may receive earnings credits when positive cash balances are maintained, which are used to offset transfer agency and custody fees. For financial reporting purposes, the fund includes net earnings credits as an expense offset in the Statement of Operations.
The fund compensates DreyfusTransfer, Inc. (“DTI”), a wholly-owned subsidiary of Dreyfus, under a transfer agency agreement for providing transfer agency services for the fund and, since May 29, 2012, cash management services related to fund subscriptions and redemptions. During the period ended September 30, 2012, the fund was charged $40,953 for transfer agency services and $751 for cash management services. Cash management fees were partially offset by earnings credits of $90. These fees are included in Shareholder servicing costs in the Statement of Operations.
The fund compensates The Bank of New York Mellon under a custody agreement for providing custodial services for the fund. During the period ended September 30, 2012, the fund was charged $73,700 pursuant to the custody agreement.
Prior to May 29, 2012, the fund compensated The Bank of New York Mellon under a cash management agreement for performing cash management services related to fund subscriptions and redemptions. During the period ended September 30, 2012, the fund was charged $4,161 pursuant to the cash management agreement, which is included in Shareholder servicing costs in the Statement of Operations.These fees were partially offset by earnings credits of $126.
During the period ended September 30, 2012, the fund was charged $8,384 for services performed by the Chief Compliance Officer and his staff.
30
The components of “Due to TBCAM and affiliates” in the Statement of Assets and Liabilities consist of: investment advisory fees $110,256, Distribution Plan fees $2,954, Shareholder Services Plan fees $8,607, custodian fees $25,318, Chief Compliance Officer fees $1,991 and transfer agency per account fees $9,339, which are offset against an expense reimbursement currently in effect in the amount of $28,735.
(d) Each Board member also serves as a Board member of other funds within the Dreyfus complex. Annual retainer fees and attendance fees are allocated to each fund based on net assets.
NOTE 4—Securities Transactions:
The aggregate amount of purchases and sales of investment securities, excluding short-term securities and forward contracts, during the period ended September 30, 2012, amounted to $104,723,303 and $117,302,120, respectively.
Derivatives: A derivative is a financial instrument whose performance is derived from the performance of another asset. Each type of derivative instrument that was held by the fund during the period ended September 30, 2012 is discussed below.
Forward Foreign Currency Exchange Contracts: The fund enters into forward contracts in order to hedge its exposure to changes in foreign currency exchange rates on its foreign portfolio holdings, to settle foreign currency transactions or as a part of its investment strategy. When executing forward contracts, the fund is obligated to buy or sell a foreign currency at a specified rate on a certain date in the future. With respect to sales of forward contracts, the fund incurs a loss if the value of the contract increases between the date the forward contract is opened and the date the forward contract is closed.The fund realizes a gain if the value of the contract decreases between those dates.With respect to purchases of forward contracts, the fund incurs a loss if the value of the contract decreases between the date the forward contract is opened and the date the forward contract is closed.The fund realizes a gain if the value of the contract increases between those dates. Any
The Fund 31
NOTES TO FINANCIAL STATEMENTS (continued)
realized or unrealized gains or losses which occurred during the period are reflected in the Statement of Operations. The fund is exposed to foreign currency risk as a result of changes in value of underlying financial instruments.The fund is also exposed to credit risk associated with counterparty nonperformance on these forward contracts, which is typically limited to the unrealized gain on each open contract.The following summarizes open forward contracts at September 30, 2012:
| | | | |
| | Foreign | | | |
| Forward Foreign Currency | Currency | | | Unrealized |
| Exchange Contracts | Amounts | Proceeds ($) | Value ($) | Appreciation ($) |
| Sales: | | | | |
| British Pound, | | | | |
| Expiring 10/1/2012a | 92,597 | 150,127 | 149,526 | 601 |
| Euro, | | | | |
| Expiring 10/1/2012b | 154,351 | 198,533 | 198,349 | 184 |
| | | | | 785 |
Counterparties:
a JPMorgan Chase & Co.
b Bank of America
The following summarizes the average market value of derivatives outstanding during the period ended September 30, 2012:
| |
| | Average Market Value ($) |
| Forward contracts | 858,809 |
At September 30, 2012, the cost of investments for federal income tax purposes was $158,425,399; accordingly, accumulated net unrealized appreciation on investments was $5,830,337, consisting of $16,193,053 gross unrealized appreciation and $10,362,716 gross unrealized depreciation.
32
REPORT OF INDEPENDENT REGISTERED
PUBLIC ACCOUNTING FIRM
Shareholders and Board of Trustees
Dreyfus International Equity Fund
We have audited the accompanying statement of assets and liabilities, including the statement of investments, of Dreyfus International Equity Fund (one of the series comprising Dreyfus Stock Funds) as of September 30, 2012, and the related statement of operations for the year then ended, the statement of changes in net assets for each of the two years in the period then ended, and the financial highlights for each of the five years in the period then ended.These financial statements and financial highlights are the responsibility of the Fund’s management. Our responsibility is to express an opinion on these financial statements and financial highlights based on our audits.
We conducted our audits in accordance with the standards of the Public Company Accounting Oversight Board (United States). Those standards require that we plan and perform the audit to obtain reasonable assurance about whether the financial statements and financial highlights are free of material misstatement.We were not engaged to perform an audit of the Fund’s internal control over financial reporting. Our audits included consideration of internal control over financial reporting as a basis for designing audit procedures that are appropriate in the circumstances, but not for the purpose of expressing an opinion on the effectiveness of the Fund’s internal control over financial reporting.Accordingly, we express no such opinion. An audit also includes examining, on a test basis, evidence supporting the amounts and disclosures in the financial statements and financial highlights, assessing the accounting principles used and significant estimates made by management, and evaluating the overall financial statement presentation. Our procedures included confirmation of securities owned as of September 30, 2012 by correspondence with the custodian and others.We believe that our audits provide a reasonable basis for our opinion.
In our opinion, the financial statements and financial highlights referred to above present fairly, in all material respects, the financial position of Dreyfus International Equity Fund at September 30, 2012, the results of its operations for the year then ended, the changes in its net assets for each of the two years in the period then ended, and the financial highlights for each of the five years in the period then ended, in conformity with U.S. generally accepted accounting principles.

New York, New York
November 27, 2012
The Fund 33
IMPORTANT TAX INFORMATION (Unaudited)
In accordance with federal tax law, the fund elects to provide each shareholder with their portion of the fund’s foreign taxes paid and the income sourced from foreign countries. Accordingly, the fund hereby reports the following information regarding its fiscal year ended September 30, 2012:
—the total amount of taxes paid to foreign countries was $432,931.
—the total amount of income sourced from foreign countries was $5,774,821.
As required by federal tax law rules, shareholders will receive notification of their proportionate share of foreign taxes paid and foreign sourced income for the 2012 calendar year with Form 1099-DIV which will be mailed in early 2013.Also, certain dividends paid by the fund may be subject to a maximum tax rate of 15%, as provided for by the Jobs and Growth Tax Relief Reconciliation Act of 2003. Of the distributions paid during the fiscal year, $3,600,165 represents the maximum amount that may be considered qualified dividend income.
34

The Fund 35
36

Once elected all Board Members serve for an indefinite term, but achieve Emeritus status upon reaching age 80.The
address of the Board Members and Officers is c/o The Dreyfus Corporation, 200 Park Avenue, NewYork, NewYork
10166.Additional information about the Board Members is available in the fund’s Statement of Additional Information
which can be obtained from Dreyfus free of charge by calling this toll free number: 1-800-DREYFUS.
David W. Burke, Emeritus Board Member
Arnold S. Hiatt, Emeritus Board Member
The Fund 37
OFFICERS OF THE FUND (Unaudited)
38
The Fund 39
For More Information
Telephone Call your financial representative or 1-800-DREYFUS
Mail The Dreyfus Family of Funds, 144 Glenn Curtiss Boulevard, Uniondale, NY 11556-0144
The fund files its complete schedule of portfolio holdings with the Securities and Exchange Commission (“SEC”) for the first and third quarters of each fiscal year on Form N-Q. The fund’s Forms N-Q are available on the SEC’s website at http://www.sec.gov and may be reviewed and copied at the SEC’s Public Reference Room in Washington, DC. Information on the operation of the Public Reference Room may be obtained by calling 1-800-SEC-0330.
A description of the policies and procedures that the fund uses to determine how to vote proxies relating to portfolio securities, and information regarding how the fund voted these proxies for the most recent 12-month period ended June 30 is available at http://www.dreyfus.com and on the SEC’s website at http://www.sec.gov. The description of the policies and procedures is also available without charge, upon request, by calling 1-800-DREYFUS.

© 2012 MBSC Securities Corporation
Dreyfus
Small Cap
Equity Fund
ANNUAL REPORT September 30, 2012

Save time. Save paper. View your next shareholder report online as soon as it’s available. Log into www.dreyfus.com and sign up for Dreyfus eCommunications. It’s simple and only takes a few minutes.
The views expressed in this report reflect those of the portfolio manager only through the end of the period covered and do not necessarily represent the views of Dreyfus or any other person in the Dreyfus organization. Any such views are subject to change at any time based upon market or other conditions and Dreyfus disclaims any responsibility to update such views.These views may not be relied on as investment advice and, because investment decisions for a Dreyfus fund are based on numerous factors, may not be relied on as an indication of trading intent on behalf of any Dreyfus fund.
Not FDIC-Insured • Not Bank-Guaranteed • May Lose Value
| |
| | Contents |
| |
| | THE FUND |
| 2 | A Letter from the Chairman and CEO |
| 3 | Discussion of Fund Performance |
| 6 | Fund Performance |
| 8 | Understanding Your Fund’s Expenses |
| 8 | Comparing Your Fund’s Expenses |
| With Those of Other Funds |
| 9 | Statement of Investments |
| 15 | Statement of Assets and Liabilities |
| 16 | Statement of Operations |
| 17 | Statement of Changes in Net Assets |
| 19 | Financial Highlights |
| 22 | Notes to Financial Statements |
| 33 | Report of Independent Registered |
| | Public Accounting Firm |
| 34 | Important Tax Information |
| 35 | Board Members Information |
| 38 | Officers of the Fund |
| |
| FOR MORE INFORMATION |
|
| | Back Cover |
Dreyfus
Small Cap Equity Fund
The Fund
A LETTER FROM THE CHAIRMAN AND CEO

Dear Shareholder:
This annual report for Dreyfus Small Cap Equity Fund covers the 12-month period from October 1, 2011, through September 30, 2012. For information about how the fund performed during the reporting period, as well as general market perspectives, we provide a Discussion of Fund Performance on the pages that follow.
U.S. equities proved unusually volatile over the past year, as prices rose and fell according to investors’ changing expectations of global and domestic economic conditions. And while the pace of U.S. economic growth has been relatively consistent, it has progressed at about half the average rate achieved in prior recoveries. Overseas, Europe has remained under severe economic pressure due to a persistent debt crisis and austerity-oriented fiscal policies adopted by many governments. In Japan, a strengthening currency dampened export activity and economic growth. The emerging markets have posted a slower rate of growth, reducing demand for industrial commodities and other goods and services.
The sustained-but-subpar U.S. expansion appears likely to continue over the foreseeable future.Across the international markets though, on one hand the global economy has responded to a variety of stimulative measures, most notably aggressively accommodative monetary policies in most major markets. On the other hand, headwinds emanating from Europe and China may continue to weigh on economic growth and investor sentiment. Indeed, the ability of governments and economic policymakers to address these issues could go a long way toward shaping the 2013 market environment. As always, we urge you to speak regularly with your financial advisor to discuss how changing global economic conditions may affect your investments.
Thank you for your continued confidence and support.

Jonathan R. Baum
Chairman and Chief Executive Officer
The Dreyfus Corporation
October 15, 2012
2
DISCUSSION OF FUND PERFORMANCE
For the period of October 1, 2011, through September 30, 2012, as provided by Joseph M. Corrado, CFA, Stephanie K. Brandaleone, CFA, and Edward R. Walter, CFA, Portfolio Managers
Fund and Market Performance Overview
For the 12-month period ended September 30, 2012, Dreyfus Small Cap Equity Fund’s Class A shares achieved a total return of 29.39%, Class C shares returned 28.31% and Class I shares returned 29.80%.1The fund’s benchmark, the Russell 2500 Value Index (the “Index”), achieved a total return of 32.15% for the same period.2
Improving economic sentiment drove small-cap stocks higher as market declines during the spring of 2012 were more than offset by gains at other times of the reporting period.The fund produced solid absolute returns, but lower returns than its benchmark, largely due to shortfalls in the information technology, consumer discretionary, and consumer staples sectors.
The Fund’s Investment Approach
The fund seeks long-term growth of capital.The fund invests, under normal circumstances, at least 80% of its net assets in the stocks of small-cap U.S. companies.
We seek to identify companies with stocks trading at prices below their intrinsic values. We measure value by evaluating each company’s valuation multiples (price/earnings, price/sales, price/cash flow), current competitive position and expected business growth relative to its industry. We focus primarily on individual stock selection to produce a diversified portfolio of companies that we believe are undervalued relative to expected business growth, with the presence of a catalyst (such as a corporate restructuring, change in management or spin-off) that may trigger a price increase.
Markets Reacted to Shifting Macroeconomic Developments
The reporting period began in the immediate aftermath of a major stock market decline. One credit-rating agency’s downgrade of long-term U.S. government debt, an intensifying debt crisis in Europe and inflation-fighting programs in China had triggered a flight away from stocks and other risky assets. Fortunately, better U.S. economic data and new remedial measures from European and Chinese policymakers helped to stabilize equity markets in the fall.
The Fund 3
DISCUSSION OF FUND PERFORMANCE (continued)
By the beginning of 2012, U.S. stocks were rallying amid U.S. employment gains, a quantitative easing program in Europe and less restrictive monetary and fiscal policies in China. Investors grew more tolerant of risks, focusing more intently on company fundamentals and less on macroeconomic news. However, these positive influences were called into question during the spring, when the U.S. labor market’s rebound slowed, measures designed to relieve fiscal pressures in Europe encountered resistance and the Chinese economy remained sluggish. The summer saw the market rally resume amid more encouraging economic data, and the Russell 2500 Value Index ended the reporting period with substantial gains. The value-oriented stocks in the Index produced higher returns than their growth-oriented counterparts.
Security Selections Limited Participation in Market Gains
The fund’s research-intensive stock selection process produced above-average results in six of 10 market sectors represented in the Index over the reporting period, enabling the fund to participate substantially in the benchmark’s gains over the summer. However, relative performance was dampened by our stock selections in other areas. In the information technology sector, communications networks solutions provider ADTRAN announced weaker-than-expected quarterly earnings stemming from sluggish spending by major carriers.Video teleconferencing specialist Polycom also fell short of expectations, reducing the future guidance it provides to analysts.Videogame developer Take-Two Interactive Software stumbled when the introduction of a new game was delayed.
In the consumer discretionary sector, gaming equipment manufacturer WMS Industries reported disappointing earnings due to subdued usage trends, and automobile components maker Tenneco saw faltering sales of aftermarket parts. Among consumer staples companies, Sanderson Farms was hurt by concerns regarding potentially higher input costs in the wake of severe U.S. droughts, and Flowers Foods encountered intensifying competitive pressures.
The fund achieved better relative results in the energy sector, where Gulfport Energy and Cabot Oil & Gas saw solid production growth from domestic natural gas drilling, while Oil States International encountered greater demand from projects in Canada and Australia. In the materials sector, building products company Louisiana-Pacific benefited from improving U.S. residential and commercial construction trends, and containerboard producer Packaging Corp. of America announced record earnings
4
resulting from strong operational practices. The financials sector also contained a number of winners, including commercial banks SVB Financial andWebster Financial, which benefited from increased lending volumes and more stable net interest margins.
Maintaining a Constructive Investment Posture
Although macroeconomic uncertainties remain over the near term, we are optimistic about the longer term prospects for small- and mid-cap value stocks. Lower interest rates and reduced borrowing costs for businesses, consumers and homebuyers are expected to further stimulate economic growth; however this will likely occur at a more modest pace relative to the first two rounds of easing. Despite the Fed’s accommodative actions, we continue to face many of the same headwinds that have persisted throughout the year: weak employment trends, uncertainty surrounding the November elections, and future fiscal policy. Businesses appear to remain reluctant to spend in the face of these issues.The lack of confidence has contained additional hiring, capital expenditures, etc. while cash continues to build on company balance sheets. Although macro headline risks may continue to cause near-term market volatility, we continue to utilize a long-term view and remain focused on the strategy’s disciplined research-driven investment approach.
October 15, 2012
Please note, the position in any security highlighted with italicized typeface was sold during the reporting period.
Equity funds are subject generally to market, market sector, market liquidity, issuer and investment style risks, among
other factors, to varying degrees, all of which are more fully described in the fund’s prospectus.
Small companies carry additional risks because their earnings and revenues tend to be less predictable, and their share
prices more volatile than those of larger, more established companies.
1 Total return includes reinvestment of dividends and any capital gains paid, and does not take into consideration the
maximum initial sales charge in the case of Class A shares, or the applicable contingent deferred sales charges imposed
on redemptions in the case of Class C shares. Had these charges been reflected, returns would have been lower. Past
performance is no guarantee of future results. Share price and investment return fluctuate such that upon redemption,
fund shares may be worth more or less than their original cost. Return figures provided reflect the absorption of certain
fund expenses by The Dreyfus Corporation and The Boston Company Asset Management, LLC. Had these
expenses not been absorbed, returns would have been lower.
2 SOURCE: LIPPER INC. — Reflects the reinvestment of dividends and, where applicable, capital gain
distributions.The Russell 2500 Value Index is a widely accepted, unmanaged index, which measures the performance
of those Russell 2500 companies with lower price-to-book ratios and lower forecasted growth value.
The Fund 5
FUND PERFORMANCE
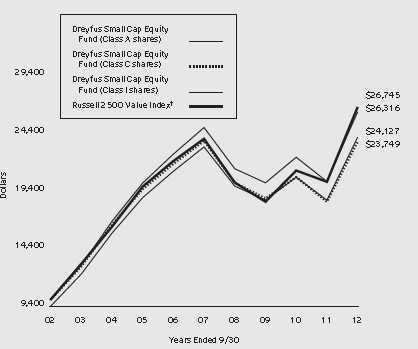
Comparison of change in value of $10,000 investment in Dreyfus Small Cap Equity Fund Class A shares, Class C shares and Class I shares and the Russell 2500 Value Index
† Source: Lipper Inc.
Past performance is not predictive of future performance.
The above graph compares a $10,000 investment made in each of the Class A, Class C and Class I shares of Dreyfus Small Cap Equity Fund on 9/30/02 to a $10,000 investment made in the Russell 2500 Value Index (the “Index”) on that date.All dividends and capital gain distributions are reinvested.
Prior to 8/1/07, the fund invested its assets in a “master portfolio” that had the same investment objective and policies as the fund. This master/feeder arrangement was terminated on 8/1/07 and the fund operates as a stand alone fund. Performance information represents the performance of the predecessor master portfolio (and its predecessor fund) and the expenses of the master portfolio’s predecessor fund through January 31, 2003, and the fund’s performance and expense structure thereafter. The master portfolio’s predecessor fund contributed all of its assets to the master portfolio before the fund commenced investment operations on 2/1/03.
The fund’s performance shown in the line graph above takes into account the maximum initial sales charge on Class A shares and all other applicable fees and expenses on all classes.The Index is an unmanaged index which measures the performance of those Russell 2500 companies with lower price-to-book ratios and lower forecasted growth values. Unlike a mutual fund, the Index is not subject to charges, fees and other expenses. Investors cannot invest directly in any index. Further information relating to fund performance, including expense reimbursements, if applicable, is contained in the Financial Highlights section of the prospectus and elsewhere in this report.
6
| | | | | | |
| Average Annual Total Returns as of 9/30/12 | | | | | |
| | 1 | Year | 5 Years | | 10 Years | |
| Class A shares | | | | | | |
| with maximum sales charge (5.75%) | 21.95 | % | –0.46 | % | 9.21 | % |
| without sales charge | 29.39 | % | 0.72 | % | 9.85 | % |
| Class C shares | | | | | | |
| with applicable redemption charge † | 27.31 | % | –0.04 | % | 9.04 | % |
| without redemption | 28.31 | % | –0.04 | % | 9.04 | % |
| Class I shares | 29.80 | % | 1.05 | % | 10.16 | % |
| Russell 2500 Value Index | 32.15 | % | 2.21 | % | 10.34 | % |
Past performance is not predictive of future performance.The fund’s performance shown in the graph and table does not
reflect the deduction of taxes that a shareholder would pay on fund distributions or the redemption of fund shares.
† The maximum contingent deferred sales charge for Class C shares is 1% for shares redeemed within one year of the
date of purchase.
The Fund 7
UNDERSTANDING YOUR FUND’S EXPENSES (Unaudited)
As a mutual fund investor, you pay ongoing expenses, such as management fees and other expenses. Using the information below, you can estimate how these expenses affect your investment and compare them with the expenses of other funds.You also may pay one-time transaction expenses, including sales charges (loads) and redemption fees, which are not shown in this section and would have resulted in higher total expenses. For more information, see your fund’s prospectus or talk to your financial adviser.
Review your fund’s expenses
The table below shows the expenses you would have paid on a $1,000 investment in Dreyfus Small Cap Equity Fund from April 1, 2012 to September 30, 2012. It also shows how much a $1,000 investment would be worth at the close of the period, assuming actual returns and expenses.
Expenses and Value of a $1,000 Investment
assuming actual returns for the six months ended September 30, 2012
| | | | | | |
| | | Class A | | Class C | | Class I |
| Expenses paid per $1,000† | $ | 6.94 | $ | 10.98 | $ | 5.01 |
| Ending value (after expenses) | $ | 983.00 | $ | 978.90 | $ | 985.20 |
COMPARING YOUR FUND’S EXPENSES WITH THOSE OF OTHER FUNDS (Unaudited)
Using the SEC’s method to compare expenses
The Securities and Exchange Commission (SEC) has established guidelines to help investors assess fund expenses. Per these guidelines, the table below shows your fund’s expenses based on a $1,000 investment, assuming a hypothetical 5% annualized return. You can use this information to compare the ongoing expenses (but not transaction expenses or total cost) of investing in the fund with those of other funds.All mutual fund shareholder reports will provide this information to help you make this comparison. Please note that you cannot use this information to estimate your actual ending account balance and expenses paid during the period.
Expenses and Value of a $1,000 Investment
assuming a hypothetical 5% annualized return for the six months ended September 30, 2012
| | | | | | |
| | | Class A | | Class C | | Class I |
| Expenses paid per $1,000† | $ | 7.06 | $ | 11.18 | $ | 5.10 |
| Ending value (after expenses) | $ | 1,018.00 | $ | 1,013.90 | $ | 1,019.95 |
† Expenses are equal to the fund’s annualized expense ratio of 1.40% for Class A, 2.22% for Class C and 1.01%
for Class I, multiplied by the average account value over the period, multiplied by 183/366 (to reflect the one-half
year period).
8
STATEMENT OF INVESTMENTS
September 30, 2012
| | | | |
| Common Stocks—99.2% | Shares | | | Value ($) |
| Automobiles & Components—1.9% | | | | |
| Dana Holding | 65,150 | | | 801,345 |
| Thor Industries | 33,170 | | | 1,204,734 |
| | | | | 2,006,079 |
| Banks—10.2% | | | | |
| Associated Banc-Corp | 40,710 | | | 536,151 |
| City National | 34,997 | | | 1,802,695 |
| Comerica | 56,300 | | | 1,748,115 |
| First Horizon National | 121,285 | | | 1,167,975 |
| First Republic Bank | 37,300 | | | 1,285,358 |
| Hancock Holding | 29,930 | | | 926,333 |
| Huntington Bancshares | 192,360 | | | 1,327,284 |
| Susquehanna Bancshares | 85,780 | | | 897,259 |
| Webster Financial | 46,840 | | | 1,110,108 |
| | | | | 10,801,278 |
| Capital Goods—6.3% | | | | |
| AGCO | 22,770 | a | 1,081,120 |
| Armstrong World Industries | 23,900 | | | 1,108,243 |
| Carlisle | 22,320 | | | 1,158,854 |
| Snap-on | 21,340 | | | 1,533,706 |
| Spirit Aerosystems Holdings, Cl. A | 81,410 | a | | 1,808,116 |
| | | | | 6,690,039 |
| Commercial & Professional Services—5.1% | | | | |
| Brink’s | 43,470 | | | 1,116,744 |
| Clean Harbors | 11,092 | a | | 541,844 |
| Equifax | 21,760 | | | 1,013,581 |
| Herman Miller | 54,890 | | | 1,067,062 |
| Robert Half International | 39,320 | | | 1,047,092 |
| Tetra Tech | 22,300 | a | 585,598 |
| | | | | 5,371,921 |
The Fund 9
STATEMENT OF INVESTMENTS (continued)
| | | | |
| Common Stocks (continued) | Shares | | | Value ($) |
| Consumer Durables & Apparel—4.8% | | | | |
| Brunswick | 34,700 | | | 785,261 |
| Lennar, Cl. A | 38,080 | b | | 1,324,042 |
| Tempur-Pedic International | 8,700 | a | | 260,043 |
| Toll Brothers | 54,980 | a | 1,826,985 |
| Warnaco Group | 17,590 | a | 912,921 |
| | | | | 5,109,252 |
| Consumer Services—2.6% | | | | |
| Brinker International | 25,940 | | | 915,682 |
| Hyatt Hotels, Cl. A | 26,830 | a | | 1,077,224 |
| WMS Industries | 49,490 | a | 810,646 |
| | | | | 2,803,552 |
| Diversified Financials—2.8% | | | | |
| E*TRADE Financial | 137,730 | a | | 1,213,401 |
| Raymond James Financial | 49,370 | | | 1,809,410 |
| | | | | 3,022,811 |
| Energy—7.7% | | | | |
| Cabot Oil & Gas | 31,092 | | | 1,396,031 |
| Gulfport Energy | 36,150 | a | 1,130,049 |
| Helmerich & Payne | 17,310 | | | 824,129 |
| McDermott International | 92,270 | a | | 1,127,539 |
| Oceaneering International | 22,100 | | | 1,221,025 |
| Oil States International | 19,640 | a | | 1,560,594 |
| Unit | 23,030 | a | 955,745 |
| | | | | 8,215,112 |
| Exchange-Traded Funds—.9% | | | | |
| iShares Russell 2000 Value Index Fund | 12,220 | | | 903,547 |
| Food & Staples Retailing—2.0% | | | | |
| Casey’s General Stores | 16,220 | | | 926,811 |
| Harris Teeter Supermarkets | 30,070 | | | 1,167,919 |
| | | | | 2,094,730 |
| Food, Beverage & Tobacco—1.6% | | | | |
| Flowers Foods | 55,785 | | | 1,125,741 |
| Sanderson Farms | 12,380 | | | 549,301 |
| | | | | 1,675,042 |
10
| | | | |
| Common Stocks (continued) | Shares | | | Value ($) |
| Health Care Equipment & Services—6.2% | | | | |
| Haemonetics | 13,450 | a | | 1,078,690 |
| HealthSouth | 52,490 | a | | 1,262,909 |
| LifePoint Hospitals | 25,590 | a | | 1,094,740 |
| MEDNAX | 24,480 | a | | 1,822,536 |
| Universal Health Services, Cl. B | 28,690 | | | 1,311,994 |
| | | | | 6,570,869 |
| Insurance—4.1% | | | | |
| Fidelity National Financial, Cl. A | 68,134 | | | 1,457,386 |
| ProAssurance | 10,100 | | | 913,444 |
| Protective Life | 38,290 | | | 1,003,581 |
| W.R. Berkley | 27,340 | | | 1,024,977 |
| | | | | 4,399,388 |
| Materials—6.3% | | | | |
| Allegheny Technologies | 23,800 | | | 759,220 |
| Coeur d’Alene Mines | 41,640 | a | | 1,200,481 |
| Cytec Industries | 22,980 | | | 1,505,650 |
| Louisiana-Pacific | 76,530 | a | | 956,625 |
| MeadWestvaco | 35,200 | | | 1,077,120 |
| Packaging Corp. of America | 32,910 | | | 1,194,633 |
| | | | | 6,693,729 |
| Media—1.5% | | | | |
| DreamWorks Animation SKG, Cl. A | 40,360 | a,b | | 776,123 |
| Meredith | 23,910 | b | | 836,850 |
| | | | | 1,612,973 |
| Pharmaceuticals, Biotech & Life Sciences—.7% | | | | |
| Salix Pharmaceuticals | 18,020 | a | | 762,967 |
| Real Estate—5.8% | | | | |
| BioMed Realty Trust | 73,790 | c | | |
| | | | 1,381,349 |
| DCT Industrial Trust | 182,560 | c | | 1,181,163 |
| DiamondRock Hospitality | 79,736 | c | | 767,858 |
| Douglas Emmett | 36,970 | c | | 852,898 |
| Hospitality Properties Trust | 40,490 | c | | 962,852 |
| LaSalle Hotel Properties | 37,020 | c | | 988,064 |
| | | | | 6,134,184 |
The Fund 11
STATEMENT OF INVESTMENTS (continued)
| | | | |
| Common Stocks (continued) | Shares | | | Value ($) |
| Retailing—4.9% | | | | |
| Abercrombie & Fitch, Cl. A | 17,130 | b | | 581,050 |
| American Eagle Outfitters | 45,960 | | | 968,837 |
| Children’s Place Retail Stores | 19,470 | a | | 1,168,200 |
| Express | 44,630 | a | | 661,417 |
| Finish Line, Cl. A | 38,590 | | | 877,537 |
| Saks | 96,480 | a,b | | 994,709 |
| | | | | 5,251,750 |
| Semiconductors & Semiconductor | | | | |
| Equipment—2.0% | | | | |
| Microchip Technology | 25,870 | b | | 846,984 |
| Semtech | 30,270 | a | | 761,291 |
| Teradyne | 38,170 | a | | 542,777 |
| | | | | 2,151,052 |
| Software & Services—10.5% | | | | |
| Cadence Design Systems | 77,500 | a | | 997,037 |
| CoreLogic | 56,610 | a | | 1,501,863 |
| Electronic Arts | 54,980 | a | | 697,696 |
| Global Payments | 21,330 | | | 892,234 |
| Informatica | 24,730 | a | | 860,851 |
| Jack Henry & Associates | 27,530 | | | 1,043,387 |
| MAXIMUS | 18,850 | | | 1,125,722 |
| Parametric Technology | 17,000 | a | | 370,600 |
| Riverbed Technology | 37,160 | a | | 864,713 |
| Synopsys | 30,315 | a | | 1,001,001 |
| Take-Two Interactive Software | 81,280 | a | | 847,750 |
| VeriFone Systems | 32,620 | a | | 908,467 |
| | | | | 11,111,321 |
12
| | | | |
| Common Stocks (continued) | Shares | | | Value ($) |
| Technology Hardware & Equipment—2.9% | | | | |
| IPG Photonics | 5,110 | a,b | | 292,803 |
| Molex | 30,380 | b | | 798,386 |
| NETGEAR | 22,090 | a | | 842,513 |
| Synaptics | 18,420 | a,b | | 442,448 |
| Vishay Intertechnology | 74,680 | a | | 734,104 |
| | | | | 3,110,254 |
| Transportation—1.9% | | | | |
| Alaska Air Group | 30,850 | a | | 1,081,601 |
| Atlas Air Worldwide Holdings | 18,070 | a | | 932,954 |
| | | | | 2,014,555 |
| Utilities—6.5% | | | | |
| Great Plains Energy | 49,460 | | | 1,100,980 |
| Hawaiian Electric Industries | 53,330 | | | 1,403,112 |
| MDU Resources Group | 26,410 | | | 582,076 |
| NiSource | 30,800 | | | 784,784 |
| Portland General Electric | 34,890 | | | 943,426 |
| UGI | 39,850 | | | 1,265,238 |
| WGL Holdings | 20,670 | | | 831,968 |
| | | | | 6,911,584 |
| Total Common Stocks | | | | |
| (cost $96,848,917) | | | | 105,417,989 |
| |
| Other Investment—.7% | | | | |
| Registered Investment Company; | | | | |
| Dreyfus Institutional Preferred | | | | |
| Plus Money Market Fund | | | | |
| (cost $719,459) | 719,459 | d | | 719,459 |
The Fund 13
STATEMENT OF INVESTMENTS (continued)
| | | | |
| Investment of Cash Collateral | | | | |
| for Securities Loaned—5.1% | Shares | | Value ($) | |
| Registered Investment Company; | | | | |
| Dreyfus Institutional Cash Advantage Fund | | | | |
| (cost $5,382,842) | 5,382,842 | d | 5,382,842 | |
| Total Investments (cost $102,951,218) | 105.0 | % | 111,520,290 | |
| Liabilities, Less Cash and Receivables | (5.0 | %) | (5,307,281 | ) |
| Net Assets | 100.0 | % | 106,213,009 | |
a Non-income producing security.
b Security, or portion thereof, on loan.At September 30, 2012, the value of the fund’s securities on loan was
$5,219,753 and the value of the collateral held by the fund was $5,382,842.
c Investment in real estate investment trust.
d Investment in affiliated money market mutual fund.
| | | |
| Portfolio Summary (Unaudited)† | | |
| |
| | Value (%) | | Value (%) |
| Software & Services | 10.5 | Diversified Financials | 2.8 |
| Banks | 10.2 | Consumer Services | 2.6 |
| Energy | 7.7 | Food & Staples Retailing | 2.0 |
| Utilities | 6.5 | Semiconductors & | |
| Capital Goods | 6.3 | Semiconductor Equipment | 2.0 |
| Materials | 6.3 | Automobiles & Components | 1.9 |
| Health Care Equipment & Services | 6.2 | Transportation | 1.9 |
| Money Market Investments | 5.8 | Food, Beverage & Tobacco | 1.6 |
| Real Estate | 5.8 | Media | 1.5 |
| Commercial & Professional Services | 5.1 | Exchange-Traded Funds | .9 |
| Retailing | 4.9 | Pharmaceuticals, | |
| Consumer Durables & Apparel | 4.8 | Biotech & Life Sciences | .7 |
| Insurance | 4.1 | | |
| Technology Hardware & Equipment | 2.9 | | 105.0 |
| |
| † Based on net assets. | | | |
| See notes to financial statements. | | | |
14
STATEMENT OF ASSETS AND LIABILITIES
September 30, 2012
| | | | |
| | | Cost | Value | |
| Assets ($): | | | | |
| Investments in securities—See Statement of Investments (including | | | |
| securities on loan, valued at $5,219,753)—Note 1(b): | | | |
| Unaffiliated issuers | | 96,848,917 | 105,417,989 | |
| Affiliated issuers | | 6,102,301 | 6,102,301 | |
| Receivable for investment securities sold | | | 1,770,304 | |
| Dividends and securities lending income receivable | | | 196,532 | |
| Receivable for shares of Beneficial Interest subscribed | | 1,066 | |
| Prepaid expenses | | | 18,015 | |
| | | | 113,506,207 | |
| Liabilities ($): | | | | |
| Due to The Boston Company Asset | | | | |
| Management, LLC and affiliates—Note 3(c) | | | 111,032 | |
| Cash overdraft due to Custodian | | | 62,783 | |
| Liability for securities on loan—Note 1(b) | | | 5,382,842 | |
| Payable for investment securities purchased | | | 1,542,577 | |
| Payable for shares of Beneficial Interest redeemed | | | 129,852 | |
| Interest payable—Note 2 | | | 1,039 | |
| Accrued expenses | | | 63,073 | |
| | | | 7,293,198 | |
| Net Assets ($) | | | 106,213,009 | |
| Composition of Net Assets ($): | | | | |
| Paid-in capital | | | 107,852,532 | |
| Accumulated undistributed investment income—net | | | 329,975 | |
| Accumulated net realized gain (loss) on investments | | | (10,538,570 | ) |
| Accumulated net unrealized appreciation | | | | |
| (depreciation) on investments | | | 8,569,072 | |
| Net Assets ($) | | | 106,213,009 | |
| |
| |
| Net Asset Value Per Share | | | | |
| | Class A | Class C | Class I | |
| Net Assets ($) | 45,805,989 | 10,854,741 | 49,552,279 | |
| Shares Outstanding | 1,718,672 | 442,131 | 1,812,559 | |
| Net Asset Value Per Share ($) | 26.65 | 24.55 | 27.34 | |
| |
| See notes to financial statements. | | | | |
The Fund 15
| | |
| STATEMENT OF OPERATIONS | | |
| Year Ended September 30, 2012 | | |
| |
| |
| |
| |
| Investment Income ($): | | |
| Income: | | |
| Cash dividends: | | |
| Unaffiliated issuers | 1,901,517 | |
| Affiliated issuers | 1,033 | |
| Income from securities lending—Note 1(b) | 88,838 | |
| Total Income | 1,991,388 | |
| Expenses: | | |
| Investment advisory fee—Note 3(a) | 1,010,241 | |
| Administration fee—Note 3(a) | 126,280 | |
| Shareholder servicing costs—Note 3(c) | 396,037 | |
| Distribution fees—Note 3(b) | 86,119 | |
| Professional fees | 73,941 | |
| Registration fees | 54,318 | |
| Custodian fees—Note 3(c) | 37,973 | |
| Prospectus and shareholders’ reports | 24,843 | |
| Trustees’ fees and expenses—Note 3(d) | 18,748 | |
| Interest expense—Note 2 | 5,474 | |
| Loan commitment fees—Note 2 | 1,211 | |
| Miscellaneous | 17,851 | |
| Total Expenses | 1,853,036 | |
| Less—reduction in expenses due to undertaking—Note 3(a) | (202,729 | ) |
| Less—reduction in fees due to earnings credits—Note 3(c) | (183 | ) |
| Net Expenses | 1,650,124 | |
| Investment Income—Net | 341,264 | |
| Realized and Unrealized Gain (Loss) on Investments—Note 4 ($): | | |
| Net realized gain (loss) on investments | 12,382,419 | |
| Net unrealized appreciation (depreciation) on investments | 23,599,111 | |
| Net Realized and Unrealized Gain (Loss) on Investments | 35,981,530 | |
| Net Increase in Net Assets Resulting from Operations | 36,322,794 | |
| |
| See notes to financial statements. | | |
16
STATEMENT OF CHANGES IN NET ASSETS
| | | | |
| | Year Ended September 30, | |
| | 2012 | a | 2011 | |
| Operations ($): | | | | |
| Investment income—net | 341,264 | | 66,146 | |
| Net realized gain (loss) on investments | 12,382,419 | | 7,912,158 | |
| Net unrealized appreciation | | | | |
| (depreciation) on investments | 23,599,111 | | (22,651,410 | ) |
| Net Increase (Decrease) in Net Assets | | | | |
| Resulting from Operations | 36,322,794 | | (14,673,106 | ) |
| Dividends to Shareholders from ($): | | | | |
| Investment income—net: | | | | |
| Class I Shares | (109,625 | ) | (8,901 | ) |
| Net realized gain on investments: | | | | |
| Class A Shares | (4,601,198 | ) | — | |
| Class B Shares | (63,518 | ) | — | |
| Class C Shares | (1,146,302 | ) | — | |
| Class I Shares | (6,879,648 | ) | — | |
| Total Dividends | (12,800,291 | ) | (8,901 | ) |
| Beneficial Interest Transactions ($): | | | | |
| Net proceeds from shares sold: | | | | |
| Class A Shares | 4,821,340 | | 12,866,064 | |
| Class B Shares | 4,418 | | 27,897 | |
| Class C Shares | 1,129,509 | | 1,014,246 | |
| Class I Shares | 16,009,699 | | 41,069,215 | |
| Dividends reinvested: | | | | |
| Class A Shares | 4,267,499 | | — | |
| Class B Shares | 57,711 | | — | |
| Class C Shares | 910,871 | | — | |
| Class I Shares | 6,965,025 | | 8,746 | |
| Cost of shares redeemed: | | | | |
| Class A Shares | (16,202,956 | ) | (25,856,370 | ) |
| Class B Shares | (918,204 | ) | (1,131,420 | ) |
| Class C Shares | (3,521,170 | ) | (3,807,511 | ) |
| Class I Shares | (77,504,676 | ) | (29,678,016 | ) |
| Increase (Decrease) in Net Assets from | | | | |
| Beneficial Interest Transactions | (63,980,934 | ) | (5,487,149 | ) |
| Total Increase (Decrease) in Net Assets | (40,458,431 | ) | (20,169,156 | ) |
| Net Assets ($): | | | | |
| Beginning of Period | 146,671,440 | | 166,840,596 | |
| End of Period | 106,213,009 | | 146,671,440 | |
| Undistributed investment income—net | 329,975 | | 108,534 | |
The Fund 17
STATEMENT OF CHANGES IN NET ASSETS (continued)
| | | | |
| | Year Ended September 30, | |
| | 2012 | a | 2011 | |
| Capital Share Transactions: | | | | |
| Class Ab | | | | |
| Shares sold | 188,293 | | 453,515 | |
| Shares issued for dividends reinvested | 185,624 | | — | |
| Shares redeemed | (631,663 | ) | (926,430 | ) |
| Net Increase (Decrease) in Shares Outstanding | (257,746 | ) | (472,915 | ) |
| Class Bb | | | | |
| Shares sold | 207 | | 1,011 | |
| Shares issued for dividends reinvested | 2,708 | | — | |
| Shares redeemed | (37,658 | ) | (43,155 | ) |
| Net Increase (Decrease) in Shares Outstanding | (34,743 | ) | (42,144 | ) |
| Class C | | | | |
| Shares sold | 47,968 | | 38,344 | |
| Shares issued for dividends reinvested | 42,724 | | — | |
| Shares redeemed | (146,999 | ) | (146,526 | ) |
| Net Increase (Decrease) in Shares Outstanding | (56,307 | ) | (108,182 | ) |
| Class I | | | | |
| Shares sold | 614,938 | | 1,460,941 | |
| Shares issued for dividends reinvested | 296,132 | | 288 | |
| Shares redeemed | (2,973,994 | ) | (1,038,441 | ) |
| Net Increase (Decrease) in Shares Outstanding | (2,062,924 | ) | 422,788 | |
a Effective as of the close of business on March 13, 2012, the fund no longer offers Class B shares.
b During the period ended September 30, 2012, 14,640 Class B shares representing $357,225 were automatically
converted to 13,579 Class A shares and during the period ended September 30, 2011, 18,121 Class B shares
representing $482,883 were automatically converted to 17,032 Class A shares.
See notes to financial statements.
18
FINANCIAL HIGHLIGHTS
The following tables describe the performance for each share class for the fiscal periods indicated.All information (except portfolio turnover rate) reflects financial results for a single fund share.Total return shows how much your investment in the fund would have increased (or decreased) during each period, assuming you had reinvested all dividends and distributions.These figures have been derived from the fund’s financial statements.
| | | | | | | | | | |
| | | | Year Ended September 30, | | | |
| Class A Shares | 2012 | | 2011 | | 2010 | | 2009 | | 2008 | |
| Per Share Data ($): | | | | | | | | | | |
| Net asset value, beginning of period | 22.79 | | 25.23 | | 22.84 | | 24.48 | | 32.64 | |
| Investment Operations: | | | | | | | | | | |
| Investment income (loss)—neta | .05 | | (.01 | ) | (.00 | )b | .07 | | .19 | |
| Net realized and unrealized | | | | | | | | | | |
| gain (loss) on investments | 6.26 | | (2.43 | ) | 2.42 | | (1.60 | ) | (4.61 | ) |
| Total from Investment Operations | 6.31 | | (2.44 | ) | 2.42 | | (1.53 | ) | (4.42 | ) |
| Distributions: | | | | | | | | | | |
| Dividends from investment income—net | — | | — | | (.03 | ) | (.11 | ) | — | |
| Dividends from net realized | | | | | | | | | | |
| gain on investments | (2.45 | ) | — | | — | | — | | (3.74 | ) |
| Total Distributions | (2.45 | ) | — | | (.03 | ) | (.11 | ) | (3.74 | ) |
| Net asset value, end of period | 26.65 | | 22.79 | | 25.23 | | 22.84 | | 24.48 | |
| Total Return (%)c | 29.39 | | (9.67 | ) | 10.62 | | (6.11 | ) | (14.59 | ) |
| Ratios/Supplemental Data (%): | | | | | | | | | | |
| Ratio of total expenses | | | | | | | | | | |
| to average net assets | 1.57 | | 1.49 | | 1.59 | | 1.72 | | 1.56 | |
| Ratio of net expenses | | | | | | | | | | |
| to average net assets | 1.40 | | 1.39 | | 1.38 | | 1.37 | | 1.39 | |
| Ratio of net investment income | | | | | | | | | | |
| (loss) to average net assets | .21 | | (.05 | ) | (.00 | )d | .35 | | .72 | |
| Portfolio Turnover Rate | 93.40 | | 76.95 | | 78.90 | | 110.88 | | 92.67 | |
| Net Assets, end of period ($ x 1,000) | 45,806 | | 45,048 | | 61,796 | | 60,030 | | 27,467 | |
a Based on average shares outstanding at each month end.
b Amount represents less than $.01 per share.
c Exclusive of sales charge.
d Amount represents less than .01%.
See notes to financial statements.
The Fund 19
FINANCIAL HIGHLIGHTS (continued)
| | | | | | | | | | |
| | | | Year Ended September 30, | | | |
| Class C Shares | 2012 | | 2011 | | 2010 | | 2009 | | 2008 | |
| Per Share Data ($): | | | | | | | | | | |
| Net asset value, beginning of period | 21.33 | | 23.80 | | 21.69 | | 23.23 | | 31.41 | |
| Investment Operations: | | | | | | | | | | |
| Investment (loss)—neta | (.15 | ) | (.22 | ) | (.19 | ) | (.09 | ) | (.03 | ) |
| Net realized and unrealized | | | | | | | | | | |
| gain (loss) on investments | 5.82 | | (2.25 | ) | 2.30 | | (1.45 | ) | (4.41 | ) |
| Total from Investment Operations | 5.67 | | (2.47 | ) | 2.11 | | (1.54 | ) | (4.44 | ) |
| Distributions: | | | | | | | | | | |
| Dividends from net realized | | | | | | | | | | |
| gain on investments | (2.45 | ) | — | | — | | — | | (3.74 | ) |
| Net asset value, end of period | 24.55 | | 21.33 | | 23.80 | | 21.69 | | 23.23 | |
| Total Return (%)b | 28.31 | | (10.38 | ) | 9.78 | | (6.67 | ) | (15.29 | ) |
| Ratios/Supplemental Data (%): | | | | | | | | | | |
| Ratio of total expenses | | | | | | | | | | |
| to average net assets | 2.31 | | 2.19 | | 2.24 | | 2.40 | | 2.36 | |
| Ratio of net expenses | | | | | | | | | | |
| to average net assets | 2.22 | | 2.17 | | 2.20 | | 2.20 | | 2.22 | |
| Ratio of net investment (loss) | | | | | | | | | | |
| to average net assets | (.62 | ) | (.84 | ) | (.81 | ) | (.48 | ) | (.11 | ) |
| Portfolio Turnover Rate | 93.40 | | 76.95 | | 78.90 | | 110.88 | | 92.67 | |
| Net Assets, end of period ($ x 1,000) | 10,855 | | 10,632 | | 14,436 | | 14,037 | | 6,556 | |
a Based on average shares outstanding at each month end.
b Exclusive of sales charge.
See notes to financial statements.
20
| | | | | | | | | | |
| | | | Year Ended September 30, | | | |
| Class I Shares | 2012 | | 2011 | | 2010 | | 2009 | | 2008 | |
| Per Share Data ($): | | | | | | | | | | |
| Net asset value, beginning of period | 23.29 | | 25.71 | | 23.24 | | 24.88 | | 33.03 | |
| Investment Operations: | | | | | | | | | | |
| Investment income—neta | .12 | | .06 | | .07 | | .13 | | .25 | |
| Net realized and unrealized | | | | | | | | | | |
| gain (loss) on investments | 6.42 | | (2.48 | ) | 2.47 | | (1.60 | ) | (4.66 | ) |
| Total from Investment Operations | 6.54 | | (2.42 | ) | 2.54 | | (1.47 | ) | (4.41 | ) |
| Distributions: | | | | | | | | | | |
| Dividends from investment income—net | (.04 | ) | (.00 | )b | (.07 | ) | (.17 | ) | — | |
| Dividends from net realized | | | | | | | | | | |
| gain on investments | (2.45 | ) | — | | — | | — | | (3.74 | ) |
| Total Distributions | (2.49 | ) | (.00 | )b | (.07 | ) | (.17 | ) | (3.74 | ) |
| Net asset value, end of period | 27.34 | | 23.29 | | 25.71 | | 23.24 | | 24.88 | |
| Total Return (%) | 29.80 | | (9.41 | ) | 10.94 | | (5.67 | ) | (14.37 | ) |
| Ratios/Supplemental Data (%): | | | | | | | | | | |
| Ratio of total expenses | | | | | | | | | | |
| to average net assets | 1.24 | | 1.28 | | 1.14 | | 1.20 | | 1.22 | |
| Ratio of net expenses | | | | | | | | | | |
| to average net assets | 1.08 | | 1.13 | | 1.11 | | 1.13 | | 1.15 | |
| Ratio of net investment income | | | | | | | | | | |
| to average net assets | .47 | | .22 | | .27 | | .65 | | .98 | |
| Portfolio Turnover Rate | 93.40 | | 76.95 | | 78.90 | | 110.88 | | 92.67 | |
| Net Assets, end of period ($ x 1,000) | 49,552 | | 90,251 | | 88,779 | | 68,758 | | 39,424 | |
a Based on average shares outstanding at each month end.
b Amount represents less than $.01 per share.
See notes to financial statements.
The Fund 21
NOTES TO FINANCIAL STATEMENTS
NOTE 1—Significant Accounting Policies:
Dreyfus Small Cap Equity Fund (the “fund”) is a separate diversified series of Dreyfus Stock Funds (the “Company”), which is registered under the Investment Company Act of 1940, as amended (the “Act”), as an open-end management investment company and operates as a series company currently offering two series, including the fund.The fund’s investment objective is to seek long-term growth of capital.The Boston Company Asset Management, LLC (“TBCAM”), a wholly-owned subsidiary of The Bank of New York Mellon Corporation (“BNY Mellon”), serves as the fund’s investment adviser.The Dreyfus Corporation (the “Administrator” or “Dreyfus”), a wholly-owned subsidiary of BNY Mellon and an affiliate of TBCAM, serves as the fund’s Administrator.
MBSC Securities Corporation (the “Distributor”), a wholly-owned subsidiary of Dreyfus, is the distributor of the fund’s shares.The fund is authorized to issue an unlimited number of $.001 par value shares of Beneficial Interest in each of the following classes of shares: Class A, Class C and Class I. Class A shares are subject to a sales charge imposed at the time of purchase. Class C shares are subject to a contingent deferred sales charge (“CDSC”) imposed on Class C shares redeemed within one year of purchase. Class I shares are sold at net asset value per share only to institutional investors. Class B shares were subject to a CDSC imposed on Class B share redemptions made within six years of purchase and automatically converted to Class A shares after six years. The fund no longer offers Class B shares. Effective March 13, 2012, all outstanding Class B shares were automatically converted to Class A shares. Other differences between the classes include the services offered to and the expenses borne by each class, the allocation of certain transfer agency costs and certain voting rights. Income, expenses (other than expenses attributable to a specific class), and realized and unrealized gains or losses on investments are allocated to each class of shares based on its relative net assets.
22
The Company accounts separately for the assets, liabilities and operations of each series. Expenses directly attributable to each series are charged to that series’ operations; expenses which are applicable to all series are allocated among them on a pro rata basis.
The Financial Accounting Standards Board (“FASB”) Accounting Standards Codification is the exclusive reference of authoritative U.S. generally accepted accounting principles (“GAAP”) recognized by the FASB to be applied by nongovernmental entities. Rules and interpretive releases of the Securities and Exchange Commission (“SEC”) under authority of federal laws are also sources of authoritative GAAP for SEC registrants. The fund’s financial statements are prepared in accordance with GAAP, which may require the use of management estimates and assumptions.Actual results could differ from those estimates.
The Company enters into contracts that contain a variety of indemnifications.The fund’s maximum exposure under these arrangements is unknown.The fund does not anticipate recognizing any loss related to these arrangements.
(a) Portfolio valuation: The fair value of a financial instrument is the amount that would be received to sell an asset or paid to transfer a liability in an orderly transaction between market participants at the measurement date (i.e., the exit price). GAAP establishes a fair value hierarchy that prioritizes the inputs of valuation techniques used to measure fair value.This hierarchy gives the highest priority to unadjusted quoted prices in active markets for identical assets or liabilities (Level 1 measurements) and the lowest priority to unobservable inputs (Level 3 measurements).
Additionally, GAAP provides guidance on determining whether the volume and activity in a market has decreased significantly and whether such a decrease in activity results in transactions that are not
The Fund 23
NOTES TO FINANCIAL STATEMENTS (continued)
orderly. GAAP requires enhanced disclosures around valuation inputs and techniques used during annual and interim periods.
Various inputs are used in determining the value of the fund’s investments relating to fair value measurements.These inputs are summarized in the three broad levels listed below:
Level 1—unadjusted quoted prices in active markets for identical investments.
Level 2—other significant observable inputs (including quoted prices for similar investments, interest rates, prepayment speeds, credit risk, etc.).
Level 3—significant unobservable inputs (including the fund’s own assumptions in determining the fair value of investments).
The inputs or methodology used for valuing securities are not necessarily an indication of the risk associated with investing in those securities.
Changes in valuation techniques may result in transfers in or out of an assigned level within the disclosure hierarchy. Valuation techniques used to value the fund’s investments are as follows:
Investments in securities are valued at the last sales price on the securities exchange or national securities market on which such securities are primarily traded. Securities listed on the National Market System for which market quotations are available are valued at the official closing price or, if there is no official closing price that day, at the last sales price. Securities not listed on an exchange or the national securities market, or securities for which there were no transactions, are valued at the average of the most recent bid and asked prices, except for open short positions, where the asked price is used for valuation purposes. Bid price is used when no asked price is available. Registered investment companies that are not traded on an exchange are valued at their net asset value. All of the preceding securities are categorized within Level 1 of the fair value hierarchy.
Fair valuing of securities may be determined with the assistance of a pricing service using calculations based on indices of domestic secu-
24
rities and other appropriate indicators, such as prices of relevant American Depository Receipts and financial futures. Utilizing these techniques may result in transfers between Level 1 and Level 2 of the fair value hierarchy.
When market quotations or official closing prices are not readily available, or are determined not to reflect accurately fair value, such as when the value of a security has been significantly affected by events after the close of the exchange or market on which the security is principally traded (for example, a foreign exchange or market), but before the fund calculates its net asset value, the fund may value these investments at fair value as determined in accordance with the procedures approved by the Company’s Board of Trustees (the “Board”). Certain factors may be considered when fair valuing investments such as: fundamental analytical data, the nature and duration of restrictions on disposition, an evaluation of the forces that influence the market in which the securities are purchased and sold, and public trading in similar securities of the issuer or comparable issuers. These securities are either categorized as Level 2 or 3 depending on the relevant inputs used.
For restricted securities where observable inputs are limited, assumptions about market activity and risk are used and are categorized within Level 3 of the fair value hierarchy.
The following is a summary of the inputs used as of September 30, 2012 in valuing the fund’s investments:
| | | | |
| | | Level 2—Other | Level 3— | |
| | Level 1— | Significant | Significant | |
| | Unadjusted | Observable | Unobservable | |
| | Quoted Prices | Inputs | Inputs | Total |
| Assets ($) | | | | |
| Investments in Securities: | | | |
| Equity Securities—Domestic | | | |
| Common Stocks† | 104,514,442 | — | — | 104,514,442 |
| Exchange-Traded Funds | 903,547 | — | — | 903,547 |
| Mutual Funds | 6,102,301 | — | — | 6,102,301 |
† See Statement of Investments for additional detailed categorizations.
The Fund 25
NOTES TO FINANCIAL STATEMENTS (continued)
At September 30, 2012, there were no transfers between Level 1 and Level 2 of the fair value hierarchy.
(b) Securities transactions and investment income: Securities transactions are recorded on a trade date basis. Realized gains and losses from securities transactions are recorded on the identified cost basis. Dividend income is recognized on the ex-dividend date and interest income, including, where applicable, accretion of discount and amortization of premium on investments, is recognized on the accrual basis.
Pursuant to a securities lending agreement withThe Bank of NewYork Mellon, a subsidiary of BNY Mellon and an affiliate of Dreyfus, the fund may lend securities to qualified institutions. It is the fund’s policy that, at origination, all loans are secured by collateral of at least 102% of the value of U.S. securities loaned and 105% of the value of foreign securities loaned. Collateral equivalent to at least 100% of the market value of securities on loan is maintained at all times. Collateral is either in the form of cash, which can be invested in certain money market mutual funds managed by Dreyfus, U.S. Government and Agency securities or letters of credit.The fund is entitled to receive all income on securities loaned, in addition to income earned as a result of the lending transaction. Although each security loaned is fully collateralized, the fund bears the risk of delay in recovery of, or loss of rights in, the securities loaned should a borrower fail to return the securities in a timely manner. During the period ended September 30, 2012, The Bank of New York Mellon earned $29,613 from lending portfolio securities, pursuant to the securities lending agreement.
(c) Affiliated issuers: Investments in other investment companies advised by Dreyfus are defined as “affiliated” in the Act. Investments
26
in affiliated investment companies for the period ended September 30, 2012 were as follows:
| | | | | | |
| Affiliated | | | | | | |
| Investment | Value | | | | Value | Net |
| Company | 9/30/2011 | ($) | Purchases ($) | Sales | ($) 9/30/2012 ($) | Assets (%) |
| Dreyfus | | | | | | |
| Institutional | | | | | | |
| Preferred | | | | | | |
| Plus Money | | | | | | |
| Market Fund | 1,912,000 | | 41,710,609 | | 42,903,150 719,459 | .7 |
| Dreyfus | | | | | | |
| Institutional | | | | | | |
| Cash | | | | | | |
| Advantage | | | | | | |
| Fund | 39,059,346 | | 56,730,285 | | 90,406,789 5,382,842 | 5.1 |
| Total | 40,971,346 | | 98,440,894 133,309,939 6,102,301 | 5.8 |
(d) Dividends to shareholders: Dividends are recorded on the ex-dividend date. Dividends from investment income-net and dividends from net realized capital gains, if any, are normally declared and paid annually, but the fund may make distributions on a more frequent basis to comply with the distribution requirements of the Internal Revenue Code of 1986, as amended (the “Code”).To the extent that net realized capital gains can be offset by capital loss carryovers, it is the policy of the fund not to distribute such gains. Income and capital gain distributions are determined in accordance with income tax regulations, which may differ from GAAP.
(e) Federal income taxes: It is the policy of the fund to continue to qualify as a regulated investment company, if such qualification is in the best interests of its shareholders, by complying with the applicable provisions of the Code, and to make distributions of taxable income sufficient to relieve it from substantially all federal income and excise taxes.
The Fund 27
NOTES TO FINANCIAL STATEMENTS (continued)
As of and during the period ended September 30, 2012, the fund did not have any liabilities for any uncertain tax positions.The fund recognizes interest and penalties, if any, related to uncertain tax positions as income tax expense in the Statement of Operations. During the period, the fund did not incur any interest or penalties.
Each of the tax years in the four-year period ended September 30, 2012 remains subject to examination by the Internal Revenue Service and state taxing authorities.
At September 30, 2012, the components of accumulated earnings on a tax basis were as follows: undistributed ordinary income $329,975, undistributed capital gains $9,165,130, accumulated capital losses $19,633,534 and unrealized appreciation $8,498,906.
Under the Regulated Investment Company Modernization Act of 2010 (the “2010 Act”), the fund is permitted to carry forward capital losses incurred in taxable years beginning after December 22, 2010 (“post-enactment losses”) for an unlimited period. Furthermore, post-enactment capital loss carryovers retain their character as either short-term or long-term capital losses rather than short-term as they were under previous statute.The 2010 Act requires post-enactment losses to be utilized before the utilization of losses incurred in taxable years prior to the effective date of the 2010 Act (“pre-enactment losses”).As a result of this ordering rule, pre-enactment losses may be more likely to expire unused.
The accumulated capital loss carryover is available for federal income tax purposes to be applied against future net realized capital gains, if any, realized subsequent to September 30, 2012. If not applied, $3,267,427 of the carryover expires in fiscal year 2016, $16,299,657 expires in fiscal year 2017 and $66,450 expires in fiscal year 2018. Acquired losses as a result of the fund’s merger with Dreyfus Premier Future Leaders Fund can be utilized in subsequent years but will be subject to annual limitations based on certain provisions in the Code.
28
The tax character of distributions paid to shareholders during the fiscal periods ended September 30, 2012 and September 30, 2011 were as follows: ordinary income $3,316,124 and $8,901 and long-term capital gains $9,484,167 and $0, respectively.
During the period ended September 30, 2012, as a result of permanent book to tax differences, primarily due to the tax treatment for dividend reclassification, the fund decreased accumulated undistributed investment income-net by $10,198 and increased accumulated net realized gain (loss) on investments by the same amount. Net assets and net asset value per share were not affected by this reclassification.
NOTE 2—Bank Lines of Credit:
The fund participates with other Dreyfus-managed funds in a $225 million unsecured credit facility led by Citibank, N.A. and a $300 million unsecured credit facility provided by The Bank of New York Mellon (each, a “Facility”), each to be utilized primarily for temporary or emergency purposes, including the financing of redemptions. In connection therewith, the fund has agreed to pay its pro rata portion of commitment fees for each Facility. Interest is charged to the fund based on rates determined pursuant to the terms of the respective Facility at the time of borrowing.
The average amount of borrowings outstanding under the Facilities during the period ended September 30, 2012, was approximately $454,400 with a related weighted average annualized interest rate of 1.20%.
NOTE 3—Investment Advisory Fee, Administration Fee and Other Transactions with Affiliates:
(a) Pursuant to an investment advisory agreement with TBCAM, the investment advisory fee is computed at the annual rate of .80% of the value of the fund’s average daily net assets and is payable monthly.
The Fund 29
NOTES TO FINANCIAL STATEMENTS (continued)
Dreyfus and TBCAM have contractually agreed, to assume the expenses of Class A, C and I shares and had agreed to assume the expenses of Class B shares so that such expenses of the fund’s Class A, B, C and I shares (excluding taxes, interest expense, brokerage commissions, commitment fees on borrowings and extraordinary expenses) do not exceed 1.39%, 2.24%, 2.22% and 1.16%, respectively, of the value of such class’ daily net assets, until the fiscal year end following such time as the expenses are equal to or less than such annual rate for the applicable class.The reduction in expenses, pursuant to the undertaking, amounted to $202,729 during the period ended September 30, 2012.
The fund compensates Dreyfus under an administration agreement for providing personnel and facilities to perform accounting and administration services for the fund at an annual rate of .10% of the value of the fund’s average daily net assets.
During the period ended September 30, 2012, the Distributor retained $4,837 from commissions earned on sales of the fund’s Class A shares and $105 and $697 from CDSCs on redemptions of the fund’s Class B and Class C shares, respectively.
(b) Under the Distribution Plan adopted pursuant to Rule 12b-1 under the Act, Class B shares paid and Class C shares pay the Distributor for distributing their shares at an annual rate of .75% of the value of the average daily net assets of Class B and Class C shares. During the period ended September 30, 2012, Class B and Class C shares were charged $2,104 and $84,015, respectively, pursuant to the Distribution Plan.
(c) Under the Shareholder Services Plan, Class A and Class C shares pay and Class B shares paid the Distributor at an annual rate of .25% of the value of their average daily net assets for the provision of certain services. The services provided may include personal services relating to shareholder accounts, such as answering shareholder inquiries regarding the fund and providing reports and other information, and services related to the maintenance of shareholder accounts. The Distributor
30
may make payments to Service Agents (securities dealers, financial institutions or other industry professionals) in respect of these services.The Distributor determines the amounts to be paid to Service Agents. During the period ended September 30, 2012, Class A, Class B and Class C shares were charged $122,223, $701 and $28,005, respectively, pursuant to the Shareholder Services Plan.
The fund has arrangements with the transfer agent and the custodian whereby the fund may receive earnings credits when positive cash balances are maintained, which are used to offset transfer agency and custody fees. For financial reporting purposes, the fund includes net earnings credits as an expense offset in the Statement of Operations.
The fund compensates DreyfusTransfer, Inc. (“DTI”), a wholly-owned subsidiary of Dreyfus, under a transfer agency agreement for providing transfer agency services for the fund and, since May 29, 2012, cash management services related to fund subscriptions and redemptions. During the period ended September 30, 2012, the fund was charged $38,570 for transfer agency services and $629 for cash management services. Cash management fees were partially offset by earnings credits of $75. These fees are included in Shareholder servicing costs in the Statement of Operations.
The fund compensatesThe Bank of NewYork Mellon under a custody agreement for providing custodial services for the fund. During the period ended September 30, 2012, the fund was charged $37,973 pursuant to the custody agreement.
Prior to May 29, 2012, the fund compensated The Bank of New York Mellon under a cash management agreement for performing cash management services related to fund subscriptions and redemptions. During the period ended September 30, 2012, the fund was charged $3,597 pursuant to the cash management agreement, which is included in Shareholder servicing costs in the Statement of Operations.These fees were partially offset by earnings credits of $108.
The Fund 31
NOTES TO FINANCIAL STATEMENTS (continued)
During the period ended September 30, 2012, the fund was charged $8,384 for services performed by the Chief Compliance Officer and his staff.
The components of “Due to TBCAM and affiliates” in the Statement of Assets and Liabilities consist of: investment advisory fees $70,720, administration fees $8,840, Rule 12b-1 distribution plan fees $6,731, shareholder services plan fees $11,810, custodian fees $8,898, chief compliance officer fees $1,991 and transfer agency per account fees $9,900, which are offset against an expense reimbursement currently in effect in the amount of $7,858.
(d) Each Board member also serves as a Board member of other funds within the Dreyfus complex. Annual retainer fees and attendance fees are allocated to each fund based on net assets.
NOTE 4—Securities Transactions:
The aggregate amount of purchases and sales of investment securities, excluding short-term securities and financial futures, during the period ended September 30, 2012, amounted to $117,850,195 and $193,654,694, respectively.
At September 30, 2012, the cost of investments for federal income tax purposes was $103,021,384; accordingly, accumulated net unrealized appreciation on investments was $8,498,906, consisting of $13,119,099 gross unrealized appreciation and $4,620,193 gross unrealized depreciation.
32
REPORT OF INDEPENDENT REGISTERED
PUBLIC ACCOUNTING FIRM
Shareholders and Board of Trustees
Dreyfus Small Cap Equity Fund
We have audited the accompanying statement of assets and liabilities, including the statement of investments, of Dreyfus Small Cap Equity Fund (one of the series comprising Dreyfus Stock Funds) as of September 30, 2012, and the related statement of operations for the year then ended, the statement of changes in net assets for each of the two years in the period then ended, and the financial highlights for each of the five years in the period then ended.These financial statements and financial highlights are the responsibility of the Fund’s management. Our responsibility is to express an opinion on these financial statements and financial highlights based on our audits.
We conducted our audits in accordance with the standards of the Public Company Accounting Oversight Board (United States).Those standards require that we plan and perform the audit to obtain reasonable assurance about whether the financial statements and financial highlights are free of material misstatement.We were not engaged to perform an audit of the Fund’s internal control over financial reporting. Our audits included consideration of internal control over financial reporting as a basis for designing audit procedures that are appropriate in the circumstances, but not for the purpose of expressing an opinion on the effectiveness of the Fund’s internal control over financial reporting. Accordingly, we express no such opinion.An audit also includes examining, on a test basis, evidence supporting the amounts and disclosures in the financial statements and financial highlights, assessing the accounting principles used and significant estimates made by management, and evaluating the overall financial statement presentation. Our procedures included confirmation of securities owned as of September 30, 2012 by correspondence with the custodian and others. We believe that our audits provide a reasonable basis for our opinion.
In our opinion, the financial statements and financial highlights referred to above present fairly, in all material respects, the financial position of Dreyfus Small Cap Equity Fund at September 30, 2012, the results of its operations for the year then ended, the changes in its net assets for each of the two years in the period then ended, and the financial highlights for each of the five years in the period then ended, in conformity with U.S. generally accepted accounting principles.

New York, New York
November 27, 2012
The Fund 33
IMPORTATION TAX INFORMATION (Unaudited)
For federal tax purposes, the fund hereby reports 51.65% of the ordinary dividends paid during the fiscal year ended September 30, 2012 as qualifying for the corporate dividends received deduction.Also, certain dividends paid by the fund may be subject to a maximum tax rate of 15%, as provided for by the Jobs and Growth Tax Relief Reconciliation Act of 2003. Of the distributions paid during the fiscal year, $1,325,640 represents the maximum amount that may be considered qualified dividend income.The fund also hereby reports $.6184 per share as a short-term capital gain distribution and $1.8291 per share as a long-term capital gain distribution paid on December 14, 2011. Shareholders will receive notification in early 2013 of the percentage applicable to the preparation of their 2012 income tax returns.
34
The Fund 35
36
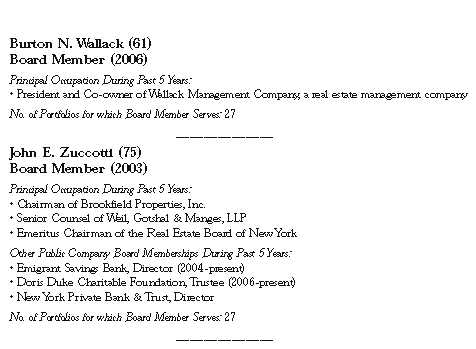
Once elected all Board Members serve for an indefinite term, but achieve Emeritus status upon reaching age 80.The address of the Board Members and Officers is c/o The Dreyfus Corporation, 200 Park Avenue, NewYork, NewYork 10166.Additional information about the Board Members is available in the fund’s Statement of Additional Information which can be obtained from Dreyfus free of charge by calling this toll free number: 1-800-DREYFUS.
David W. Burke, Emeritus Board Member
Arnold S. Hiatt, Emeritus Board Member
The Fund 37
OFFICERS OF THE FUND (Unaudited)
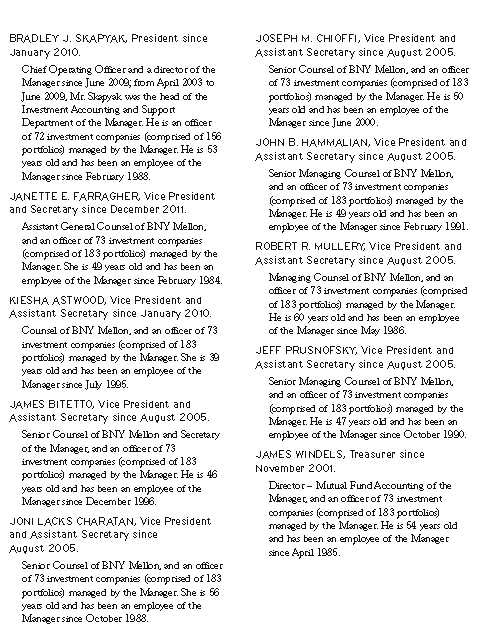
38
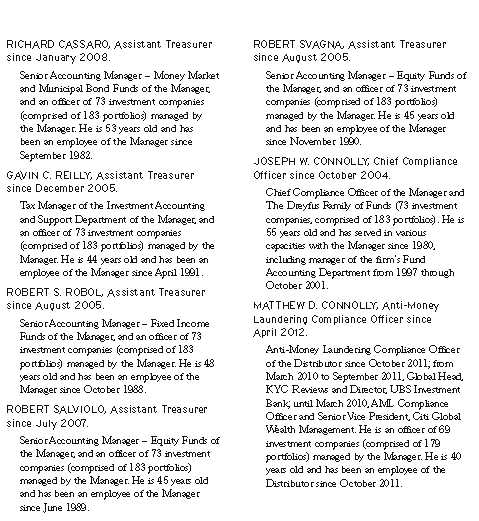
TheFund 39
For More Information
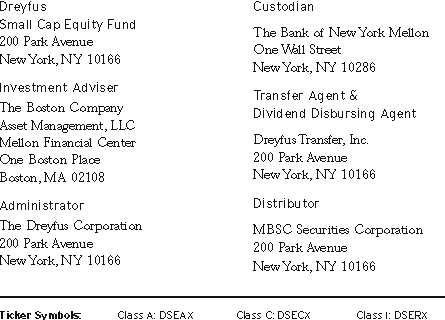
Telephone Call your financial representative or 1-800-DREYFUS
Mail The Dreyfus Family of Funds, 144 Glenn Curtiss Boulevard, Uniondale, NY 11556-0144
The fund files its complete schedule of portfolio holdings with the Securities and Exchange Commission (“SEC”) for the first and third quarters of each fiscal year on Form N-Q. The fund’s Forms N-Q are available on the SEC’s website at http://www.sec.gov and may be reviewed and copied at the SEC’s Public Reference Room in Washington, DC. Information on the operation of the Public Reference Room may be obtained by calling 1-800-SEC-0330.
A description of the policies and procedures that the fund uses to determine how to vote proxies relating to portfolio securities, and information regarding how the fund voted these proxies for the most recent 12-month period ended June 30 is available at http://www.dreyfus.com and on the SEC’s website at http://www.sec.gov. The description of the policies and procedures is also available without charge, upon request, by calling 1-800-DREYFUS.

|
| © 2012 MBSC Securities Corporation |
Item 2. Code of Ethics.
The Registrant has adopted a code of ethics that applies to the Registrant's principal executive officer, principal financial officer, principal accounting officer or controller, or persons performing similar functions. There have been no amendments to, or waivers in connection with, the Code of Ethics during the period covered by this Report.
Item 3. Audit Committee Financial Expert.
The Registrant's Board has determined that Ehud Houminer, a member of the Audit Committee of the Board, is an audit committee financial expert as defined by the Securities and Exchange Commission (the "SEC"). Ehud Houminer is "independent" as defined by the SEC for purposes of audit committee financial expert determinations.
Item 4. Principal Accountant Fees and Services.
(a) Audit Fees. The aggregate fees billed for each of the last two fiscal years (the "Reporting Periods") for professional services rendered by the Registrant's principal accountant (the "Auditor") for the audit of the Registrant's annual financial statements or services that are normally provided by the Auditor in connection with the statutory and regulatory filings or engagements for the Reporting Periods, were $ 71,232 in 2011 and $72,481 in 2012.
(b) Audit-Related Fees. The aggregate fees billed in the Reporting Periods for assurance and related services by the Auditor that are reasonably related to the performance of the audit of the Registrant's financial statements and are not reported under paragraph (a) of this Item 4 were $12,000 in 2011 and $24,000 in 2012. These services consisted of one or more of the following: (i) agreed upon procedures related to compliance with Internal Revenue Code section 817(h), (ii) security counts required by Rule 17f-2 under the Investment Company Act of 1940, as amended, (iii) advisory services as to the accounting or disclosure treatment of Registrant transactions or events and (iv) advisory services to the accounting or disclosure treatment of the actual or potential impact to the Registrant of final or proposed rules, standards or interpretations by the Securities and Exchange Commission, the Financial Accounting Standards Boards or other regulatory or standard-setting bodies.
The aggregate fees billed in the Reporting Periods for non-audit assurance and related services by the Auditor to the Registrant's investment adviser (not including any sub-investment adviser whose role is primarily portfolio management and is subcontracted with or overseen by another investment adviser), and any entity controlling, controlled by or under common control with the investment adviser that provides ongoing services to the Registrant ("Service Affiliates"), that were reasonably related to the performance of the annual audit of the Service Affiliate, which required pre-approval by the Audit Committee were $0 in 2011 and $0 in 2012.
(c) Tax Fees. The aggregate fees billed in the Reporting Periods for professional services rendered by the Auditor for tax compliance, tax advice, and tax planning ("Tax Services") were $6,323 in 2011 and $8,457 in 2012. These services consisted of: (i) review or preparation of U.S. federal, state, local and excise tax returns; (ii) U.S. federal, state and local tax planning, advice and assistance regarding statutory, regulatory or administrative developments; (iii) tax advice regarding tax qualification matters and/or treatment of various financial instruments held or proposed to be acquired or held, and (iv) determination of Passive Foreign Investment Companies. The aggregate fees billed in the Reporting Periods for Tax Services by the Auditor to Service Affiliates, which required pre-approval by the Audit Committee were $0 in 2011 and $0 in 2012.
(d) All Other Fees. The aggregate fees billed in the Reporting Periods for products and services provided by the Auditor, other than the services reported in paragraphs (a) through (c) of this Item, were $175 in 2011 and $510 in 2012. [These services consisted of a review of the Registrant's anti-money laundering program].
The aggregate fees billed in the Reporting Periods for Non-Audit Services by the Auditor to Service Affiliates, other than the services reported in paragraphs (b) through (c) of this Item, which required pre-approval by the Audit Committee, were $0 in 2011 and $200,000 in 2012.
(e)(1) Audit Committee Pre-Approval Policies and Procedures. The Registrant's Audit Committee has established policies and procedures (the "Policy") for pre-approval (within specified fee limits) of the Auditor's engagements for non-audit services to the Registrant and Service Affiliates without specific case-by-case consideration. The pre-approved services in the Policy can include pre-approved audit services, pre-approved audit-related services, pre-approved tax services and pre-approved all other services. Pre-approval considerations include whether the proposed services are compatible with maintaining the Auditor's independence. Pre-approvals pursuant to the Policy are considered annually.
(e)(2) Note: None of the services described in paragraphs (b) through (d) of this Item 4 were approved by the Audit Committee pursuant to paragraph (c)(7)(i)(C) of Rule 2-01 of Regulation S-X.
(f) None of the hours expended on the principal accountant's engagement to audit the registrant's financial statements for the most recent fiscal year were attributed to work performed by persons other than the principal account's full-time, permanent employees.
Non-Audit Fees. The aggregate non-audit fees billed by the Auditor for services rendered to the Registrant, and rendered to Service Affiliates, for the Reporting Periods were $16,565,389 in 2011 and $43,887,310 in 2012.
Auditor Independence. The Registrant's Audit Committee has considered whether the provision of non-audit services that were rendered to Service Affiliates, which were not pre-approved (not requiring pre-approval), is compatible with maintaining the Auditor's independence.
Item 5. Audit Committee of Listed Registrants.
Not applicable. [CLOSED-END FUNDS ONLY]
Item 6. Investments.
(a) Not applicable.
Item 7. Disclosure of Proxy Voting Policies and Procedures for Closed-End Management Investment Companies.
Not applicable. [CLOSED-END FUNDS ONLY]
Item 8. Portfolio Managers of Closed-End Management Investment Companies.
Not applicable. [CLOSED-END FUNDS ONLY, beginning with reports for periods ended on and after December 31, 2005]
Item 9. Purchases of Equity Securities by Closed-End Management Investment Companies and Affiliated Purchasers.
Not applicable. [CLOSED-END FUNDS ONLY]
Item 10. Submission of Matters to a Vote of Security Holders.
There have been no material changes to the procedures applicable to Item 10.
Item 11. Controls and Procedures.
(a) The Registrant's principal executive and principal financial officers have concluded, based on their evaluation of the Registrant's disclosure controls and procedures as of a date within 90 days of the filing date of this report, that the Registrant's disclosure controls and procedures are reasonably designed to ensure that information required to be disclosed by the Registrant on Form N-CSR is recorded, processed, summarized and reported within the required time periods and that information required to be disclosed by the Registrant in the reports that it files or submits on Form N-CSR is accumulated and communicated to the Registrant's management, including its principal executive and principal financial officers, as appropriate to allow timely decisions regarding required disclosure.
(b) There were no changes to the Registrant's internal control over financial reporting that occurred during the second fiscal quarter of the period covered by this report that have materially affected, or are reasonably likely to materially affect, the Registrant's internal control over financial reporting.
Item 12. Exhibits.
(a)(1) Code of ethics referred to in Item 2.
(a)(2) Certifications of principal executive and principal financial officers as required by Rule 30a-2(a) under the Investment Company Act of 1940.
(a)(3) Not applicable.
(b) Certification of principal executive and principal financial officers as required by Rule 30a-2(b) under the Investment Company Act of 1940.
SIGNATURES
Pursuant to the requirements of the Securities Exchange Act of 1934 and the Investment Company Act of 1940, the Registrant has duly caused this Report to be signed on its behalf by the undersigned, thereunto duly authorized.
DREYFUS STOCK FUNDS
By: /s/ Bradley J. Skapyak |
Bradley J. Skapyak, President |
Date: | November 20, 2012 |
|
Pursuant to the requirements of the Securities Exchange Act of 1934 and the Investment Company Act of 1940, this Report has been signed below by the following persons on behalf of the Registrant and in the capacities and on the dates indicated. |
|
By: /s/ Bradley J. Skapyak |
Bradley J. Skapyak, President |
Date: | November 20, 2012 |
|
By: /s/ James Windels |
James Windels, Treasurer |
Date: | November 20, 2012 |
|
EXHIBIT INDEX
(a)(1) Code of ethics referred to in Item 2.
(a)(2) Certifications of principal executive and principal financial officers as required by Rule 30a-2(a) under the Investment Company Act of 1940. (EX-99.CERT)
(b) Certification of principal executive and principal financial officers as required by Rule 30a-2(b) under the Investment Company Act of 1940. (EX-99.906CERT)