UNITED STATES
SECURITIES AND EXCHANGE COMMISSION
Washington, D.C. 20549
FORM N-CSR
CERTIFIED SHAREHOLDER REPORT OF REGISTERED MANAGEMENT
INVESTMENT COMPANIES
Investment Company Act file number | 811-21236 |
| |
| Dreyfus Stock Funds | |
| (Exact name of Registrant as specified in charter) | |
| | |
| c/o The Dreyfus Corporation 200 Park Avenue New York, New York 10166 | |
| (Address of principal executive offices) (Zip code) | |
| | |
| Bennett A. MacDougall, Esq. 200 Park Avenue New York, New York 10166 | |
| (Name and address of agent for service) | |
|
Registrant's telephone number, including area code: | (212) 922-6400 |
| |
Date of fiscal year end: | 10/31 | |
Date of reporting period: | 10/31/18 | |
| | | | | | | |
The following N-CSR relates only to the Registrant's series listed below and does not relate to any series of the Registrant with a different fiscal year end and, therefore, different N-CSR reporting requirements. A separate N-CSR will be filed for any series with a different fiscal year end, as appropriate.
Dreyfus International Small Cap Fund
FORM N-CSR
Item 1. Reports to Stockholders.
Dreyfus International Small Cap Fund
| | | |

| | ANNUAL REPORT October 31, 2018 |
| |
Save time. Save paper. View your next shareholder report online as soon as it’s available. Log into www.dreyfus.com and sign up for Dreyfus eCommunications. It’s simple and only takes a few minutes. |
| |
The views expressed in this report reflect those of the portfolio manager(s) only through the end of the period covered and do not necessarily represent the views of Dreyfus or any other person in the Dreyfus organization. Any such views are subject to change at any time based upon market or other conditions and Dreyfus disclaims any responsibility to update such views. These views may not be relied on as investment advice and, because investment decisions for a Dreyfus fund are based on numerous factors, may not be relied on as an indication of trading intent on behalf of any Dreyfus fund. |
| |
Not FDIC-Insured • Not Bank-Guaranteed • May Lose Value |
Contents
THE FUND
FOR MORE INFORMATION
Back Cover
| | | | |
| |
Dreyfus International Small Cap Fund
| | The Fund |
A LETTER FROM THE PRESIDENT OF DREYFUS
Dear Shareholder:
We are pleased to present this annual report for Dreyfus International Small Cap Fund, covering the 12-month period from November 1, 2017 through October 31, 2018. For information about how the fund performed during the reporting period, as well as general market perspectives, we provide a Discussion of Fund Performance on the pages that follow.
Markets began the reporting period on solid footing as major global economies experienced above-trend growth across the board. In the United States, the Federal Reserve continued to move away from its accommodative monetary policy while other major central banks also began to consider monetary tightening. In the equity markets, both U.S. and non-U.S. markets enjoyed an upward trend, though investor concerns about volatility and inflation later began to weigh on returns. Interest rates rose across the curve, putting pressure on bond prices.
Later in the reporting period, global growth trends began to diverge. While a strong economic performance continued to bolster U.S. equity markets, slower growth and political concerns pressured markets in the Eurozone. Emerging markets also came under pressure as weakness in their currencies added to investors’ uneasiness. Fixed income markets continued to struggle as interest rates rose; the yield on the benchmark 10-year Treasury bond surged late in the reporting period, but growing investor concerns about global growth helped keep it from rising further.
Despite continuing doubts regarding trade, U.S. inflationary pressures, and global growth, we are optimistic that the U.S. economy will remain strong in the near term. However, we will stay attentive to signs that signal potential changes on the horizon. As always, we encourage you to discuss the risks and opportunities of today’s investment environment with your financial advisor.
Thank you for your continued confidence and support.
Sincerely,

Renee Laroche-Morris
President
The Dreyfus Corporation
November 15, 2018
2
DISCUSSION OF FUND PERFORMANCE (Unaudited)
For the period from November 1, 2017 through October 31, 2018, as provided by portfolio managers Mark A. Bogar, James A. Lydotes, and Andrew Leger of BNY Mellon Asset Management North America Corporation, Sub-Investment Adviser
Market and Fund Performance Overview
For the 12-month period ended October 31, 2018, Dreyfus International Small Cap Fund’s Class A shares produced a total return of -8.90%, Class C shares returned -9.54%, Class I shares returned -8.64%, and Class Y shares returned -8.56%.1 In comparison, the fund’s benchmark, the S&P Developed Ex-U.S. SmallCap Index (the “Index”), produced a total return of -7.70% for the same period.2
International small-cap stocks lost ground over the reporting period despite rising corporate earnings and steady global economic conditions. The fund lagged the Index, mostly due to stock selections and country allocations.
The Fund’s Investment Approach
The fund seeks long-term growth of capital. To pursue its goal, the fund normally invests at least 80% of its net assets, plus any borrowings for investment purposes, in common stocks and other equity securities of small-cap foreign companies. The fund considers foreign companies to be those companies organized or with their principal place of business, or majority of assets or business, in countries represented in the Index. The fund considers small-cap companies to be those companies with total market capitalizations that fall within the range of the capitalizations of the companies that comprise the Index.
The fund invests in stocks that appear to be undervalued (as measured by their price/earnings ratios) and that may have value and/or growth characteristics. The fund’s portfolio managers employ a bottom-up investment approach using proprietary quantitative models and traditional qualitative analysis to identify attractive stocks. The portfolio managers seek to allocate country weights generally in accordance with the Index and use the sector weightings of the Index as a guide, but the fund’s country and sector weightings may vary from those of the Index.
The fund’s stock selection process is designed to produce a diversified portfolio that, relative to the Index, has a below-average price/earnings ratio and an above-average earnings growth trend.
Global Economy Weakens Amid Trade Tensions and Currency Weakness
Developed international markets gained ground early in the reporting period, supported by continuing economic recoveries in Europe and Asia and rising corporate earnings. Asian equity markets led the advance, with Japanese stocks benefiting from rising economic growth forecasts and unexpectedly strong corporate earnings reports. Global growth trends enabled U.K. equities to post gains as well despite concerns regarding the country’s impending exit (Brexit) from the European Union. Eurozone markets proved more sluggish despite improving regional economic fundamentals, including rising GDP figures and declining unemployment rates.
3
DISCUSSION OF FUND PERFORMANCE (Unaudited) (continued)
February 2018 saw a sharp global dip in equity prices, prompted by rising volatility and perceived inflationary pressures in the United States. Uncertainties regarding potentially more protectionist U.S. trade policies took an additional toll on equity markets in March. International stocks later turned broadly positive again as trade and inflationary concerns eased, and petroleum prices rallied due to limited supplies and rising demand.
Later in the period, global economic performance began to diverge. While the U.S. economy remained robust, the economies of Europe and emerging-market countries began to weaken as trade tensions heated up. Tightening monetary policy among developed markets and a strengthening U.S. dollar led to weakness in emerging-market currencies, which added to investors’ concerns. In addition, geopolitical events in Europe, including concerns about Brexit negotiations and Italy’s budget stand-off with the European Union, heightened market uncertainty. Equity markets sold off worldwide late in the period on concerns about higher interest rates, tariffs, and slower economic growth.
Fund Performance Hindered by Stock Selection and Country Allocations
The fund’s relative performance was constrained by a variety of holdings. Julius Baer Group, a Swiss wealth management firm, was hurt by weak revenues and the global sell-off in equities. Oriflame, a Swedish cosmetics company, was hindered as its financial results were hamstrung by exposure to the Russian and Turkish markets. An overweight to the U.K. market, which declined during the period, and an underweight to South Korea, which rose, also weighed on the fund’s performance.
On the other hand, a number of holdings contributed positively to the fund’s performance. SodaStream International, an Israel-based maker of a home carbonation product, benefited as PepsiCo made an offer to purchase the company. ComfortDelGro, a Singapore-based transportation group, was the beneficiary of tighter regulation of competing ride-sharing services, such as Uber and Grab. Holdings in the energy sector contributed positively to performance as well; Australian exploration-and-production company Beach Energy gained from higher oil prices and an acquisition that extended the life of its oil reserves. Other strong performers included Entertainment One, a U.K./Canadian media group that specializes in the production and distribution of film and TV content, including family titles such as “Peppa Pig,” as well as Spanish real estate investment trust Hispania Activos Inmobiliarios, which was acquired by private equity group Blackstone. In addition, an underweight to Spain enhanced the fund’s performance, as the market lagged the broader Index during the period.
Global Trends Remain Modestly Positive
While concerns about higher rates, a strong U.S. dollar and U.S. trade policy have continued to spark heightened market volatility, we believe that underlying economic fundamentals remain positive in most of the developed world. In addition, although interest rates have risen, we believe the Federal Reserve is in the latter stages of its tightening cycle. With at least three more rate hikes already priced into the market, any near-term pause or explicit signal of a rate cycle peak would likely ease pressure on international markets.
4
As of the reporting period’s end, we believe we have found attractively valued investments in a variety of markets and industry groups. We have positioned the fund to potentially take advantage of these opportunities by increasing exposure to the relatively undervalued Italian market and to Australia while trimming exposure to the Japanese and Spanish markets. Among market sectors, we have increased exposure to the health care and consumer staples sectors while trimming holdings in information technology and financials.
November 15, 2018
1 Total return includes reinvestment of dividends and any capital gains paid, and does not take into consideration the maximum initial sales charge in the case of Class A shares, or the applicable contingent deferred sales charge imposed on redemptions in the case of Class C shares. Had these charges been reflected, returns would have been lower. Share price, yield, and investment return fluctuate such that upon redemption, fund shares may be worth more or less than their original cost. Return figures provided reflect an undertaking for the absorption of certain fund expenses by The Dreyfus Corporation through March 1, 2019, at which time it may be extended, terminated, or modified. Had these expenses not been absorbed, the fund’s returns would have been lower. Past performance is no guarantee of future results.
2 Source: Lipper Inc. — The S&P Developed Ex-U.S. SmallCap Index comprises the stocks representing the lowest 15% of float-adjusted market capitalization in each developed country, excluding the U.S. It is a subset of the S&P Global BMI, a comprehensive, rules-based index measuring global stock market performance. Investors cannot invest directly in any index.
Please note: the position in any security highlighted with italicized typeface was sold during the reporting period.
Equities are subject generally to market, market sector, market liquidity, issuer, and investment style risks, among other factors, to varying degrees, all of which are more fully described in the fund’s prospectus.
Stocks of small- and/or mid-cap companies often experience sharper price fluctuations than stocks of large-cap companies.
The fund’s performance will be influenced by political, social, and economic factors affecting investments in foreign companies. Special risks associated with investments in foreign companies include exposure to currency fluctuations, less liquidity, less developed or less efficient trading markets, lack of comprehensive company information, political instability, and differing auditing and legal standards. These risks are enhanced in emerging-market countries. Please read the prospectus for further discussion of these risks.
5
FUND PERFORMANCE (Unaudited)
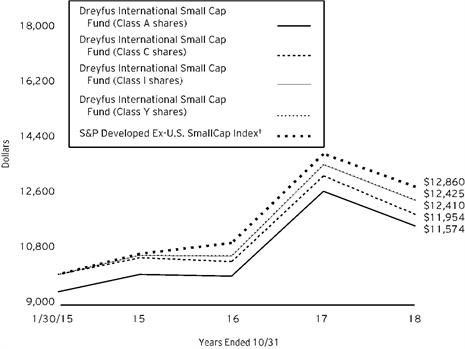
Comparison of change in value of $10,000 investment in Dreyfus International Small Cap Fund Class A shares, Class C shares, Class I shares and Class Y shares and the S&P Developed Ex-U.S. SmallCap Index (the “Index”)
† Source: Lipper Inc.
Past performance is not predictive of future performance.
The above graph compares a $10,000 investment made in each of the Class A, Class C, Class I and Class Y shares of Dreyfus International Small Cap Fund on 1/30/15 (inception date) to a $10,000 investment made in the Index on that date. All dividends and capital gain distributions are reinvested.
The fund’s performance shown in the line graph above takes into account the maximum initial sales charge on Class A shares and all other applicable fees and expenses on all classes. The Index comprises the stocks representing the lowest 15% of float-adjusted market cap in each developed country excluding the U.S. It is a subset of the S&P Global BMI, a comprehensive, rules-based index measuring global stock market performance. Unlike a mutual fund, the Index is not subject to charges, fees and other expenses. Investors cannot invest directly in any index. Further information relating to fund performance, including expense reimbursements, if applicable, is contained in the Financial Highlights section of the prospectus and elsewhere in this report.
6
| | | | |
Average Annual Total Returns as of 10/31/18 |
| Inception
Date | 1 Year | From
Inception |
Class A shares | | | |
with maximum sales charge (5.75%) | 1/30/15 | -14.15% | 3.97% |
without sales charge | 1/30/15 | -8.90% | 5.62% |
Class C shares | | | |
with applicable redemption charge† | 1/30/15 | -10.44% | 4.88% |
without redemption | 1/30/15 | -9.54% | 4.88% |
Class I shares | 1/30/15 | -8.64% | 5.93% |
Class Y shares | 1/30/15 | -8.56% | 5.96% |
S&P Developed Ex-U.S. Small Cap Index | 1/31/15 | -7.70% | 6.94%†† |
† The maximum contingent deferred sales charge for Class C shares is 1% for shares redeemed within one year of the date of purchase.
†† For comparative purposes, the value of the Index as of 1/31/15 is used as the beginning value on 1/30/15.
The performance data quoted represents past performance, which is no guarantee of future results. Share price and investment return fluctuate and an investor’s shares may be worth more or less than original cost upon redemption. Current performance may be lower or higher than the performance quoted. Go to Dreyfus.com for the fund’s most recent month-end returns.
The fund’s performance shown in the graph and table does not reflect the deduction of taxes that a shareholder would pay on fund distributions or the redemption of fund shares. In addition to the performance of Class A shares shown with and without a maximum sales charge, the fund’s performance shown in the table takes into account all other applicable fees and expenses on all classes.
7
UNDERSTANDING YOUR FUND’S EXPENSES (Unaudited)
As a mutual fund investor, you pay ongoing expenses, such as management fees and other expenses. Using the information below, you can estimate how these expenses affect your investment and compare them with the expenses of other funds. You also may pay one-time transaction expenses, including sales charges (loads) and redemption fees, which are not shown in this section and would have resulted in higher total expenses. For more information, see your fund’s prospectus or talk to your financial adviser.
Review your fund’s expenses
The table below shows the expenses you would have paid on a $1,000 investment in Dreyfus International Small Cap Fund from May 1, 2018 to October 31, 2018. It also shows how much a $1,000 investment would be worth at the close of the period, assuming actual returns and expenses.
| | | | | | | | | | | |
Expenses and Value of a $1,000 Investment | | |
assuming actual returns for the six months ended October 31, 2018 |
| | | Class A | | Class C | | Class I | | Class Y |
Expenses paid per $1,000† | | $6.56 | | $9.91 | | $5.11 | | $5.02 |
Ending value (after expenses) | | $858.00 | | $855.00 | | $859.50 | | $860.00 |
COMPARING YOUR FUND’S EXPENSES
WITH THOSE OF OTHER FUNDS (Unaudited)
Using the SEC’s method to compare expenses
The Securities and Exchange Commission (“SEC”) has established guidelines to help investors assess fund expenses. Per these guidelines, the table below shows your fund’s expenses based on a $1,000 investment, assuming a hypothetical 5% annualized return. You can use this information to compare the ongoing expenses (but not transaction expenses or total cost) of investing in the fund with those of other funds. All mutual fund shareholder reports will provide this information to help you make this comparison. Please note that you cannot use this information to estimate your actual ending account balance and expenses paid during the period.
| | | | | | | | | |
Expenses and Value of a $1,000 Investment |
assuming a hypothetical 5% annualized return for the six months ended October 31, 2018 |
| | | Class A | | Class C | | Class I | | Class Y |
Expenses paid per $1,000† | | $7.12 | | $10.76 | | $5.55 | | $5.45 |
Ending value (after expenses) | | $1,018.15 | | $1,014.52 | | $1,019.71 | | $1,019.81 |
† Expenses are equal to the fund’s annualized expense ratio of 1.40% for Class A, 2.12% for Class C, 1.09% for Class I and 1.07% for Class Y, multiplied by the average account value over the period, multiplied by 184/365 (to reflect the one-half year period).
8
STATEMENT OF INVESTMENTS
October 31, 2018
| | | | | | | | |
| |
Description | | | | Shares | | Value ($) | |
Common Stocks - 96.4% | | | | | |
Australia - 7.5% | | | | | |
Alumina | | | | 3,537,676 | | 6,378,908 | |
Beach Energy | | | | 6,767,008 | | 8,384,268 | |
Challenger | | | | 757,768 | | 5,522,606 | |
Charter Hall Retail REIT | | | | 1,101,835 | | 3,319,145 | |
Evolution Mining | | | | 2,395,357 | | 5,085,458 | |
IOOF Holdings | | | | 1,588,460 | | 7,655,448 | |
Link Administration Holdings | | | | 692,121 | | 3,671,236 | |
oOh!media | | | | 1,695,827 | | 5,690,311 | |
Shopping Centres Australasia Property Group | | | | 1,976,408 | | 3,599,865 | |
SmartGroup | | | | 698,332 | | 4,938,991 | |
Webjet | | | | 450,036 | | 4,166,184 | |
Western Areas | | | | 3,247,529 | | 5,186,451 | |
| | | | | 63,598,871 | |
Austria - .3% | | | | | |
Lenzing | | | | 33,343 | | 3,027,849 | |
Belgium - 1.5% | | | | | |
Galapagos | | | | 123,608 | a | 12,692,170 | |
Bermuda - .5% | | | | | |
Golar Lng | | | | 172,589 | | 4,621,933 | |
Canada - 6.1% | | | | | |
Air Canada | | | | 292,370 | a | 5,547,801 | |
Canadian Apartment Properties REIT | | | | 240,591 | | 8,554,875 | |
Centerra Gold | | | | 859,773 | a | 3,356,932 | |
Cogeco Communications | | | | 78,148 | | 3,831,861 | |
Entertainment One | | | | 2,422,826 | | 12,662,152 | |
Genworth MI Canada | | | | 177,105 | | 5,813,139 | |
Interfor | | | | 327,155 | a | 3,618,350 | |
Parex Resources | | | | 597,728 | a | 8,704,049 | |
| | | | | 52,089,159 | |
Denmark - 1.7% | | | | | |
DFDS | | | | 68,164 | | 2,918,024 | |
GN Store Nord | | | | 115,564 | | 4,893,521 | |
Royal Unibrew | | | | 99,869 | | 7,084,210 | |
| | | | | 14,895,755 | |
Finland - .5% | | | | | |
Metsa Board | | | | 498,663 | | 4,366,989 | |
France - 6.8% | | | | | |
COVIVIO | | | | 89,011 | | 8,936,879 | |
Edenred | | | | 242,176 | | 9,176,496 | |
Eiffage | | | | 99,378 | | 9,718,694 | |
9
STATEMENT OF INVESTMENTS (continued)
| | | | | | | | |
| |
Description | | | | Shares | | Value ($) | |
Common Stocks - 96.4% (continued) | | | | | |
France - 6.8% (continued) | | | | | |
Korian | | | | 61,445 | | 2,421,491 | |
Maisons du Monde | | | | 258,048 | b | 6,469,742 | |
Nexity | | | | 152,620 | | 7,303,168 | |
Plastic Omnium | | | | 197,101 | | 5,484,591 | |
Teleperformance | | | | 51,282 | | 8,450,921 | |
| | | | | 57,961,982 | |
Georgia - .6% | | | | | |
Bank of Georgia Group | | | | 256,576 | | 5,113,902 | |
Germany - 4.0% | | | | | |
Rheinmetall | | | | 98,050 | | 8,499,419 | |
Siltronic | | | | 48,884 | | 4,489,360 | |
Sixt | | | | 48,231 | | 4,918,267 | |
Stroeer SE & Co. | | | | 169,320 | | 8,863,402 | |
Talanx | | | | 205,481 | | 7,358,199 | |
| | | | | 34,128,647 | |
Hong Kong - .6% | | | | | |
Melco International Development | | | | 2,918,000 | | 5,015,885 | |
Ireland - 1.6% | | | | | |
Icon | | | | 67,371 | a | 9,302,588 | |
UDG Healthcare | | | | 504,034 | | 4,069,582 | |
| | | | | 13,372,170 | |
Isle Of Man - .8% | | | | | |
GVC Holdings | | | | 567,956 | | 6,800,449 | |
Israel - .9% | | | | | |
Sodastream International | | | | 55,055 | a | 7,894,336 | |
Italy - 4.7% | | | | | |
ANIMA Holding | | | | 1,679,698 | b | 7,035,845 | |
Italgas | | | | 2,078,043 | | 10,738,868 | |
Maire Tecnimont | | | | 1,778,364 | | 7,780,406 | |
Societa Iniziative Autostradali e Servizi | | | | 379,097 | | 5,330,942 | |
Unipol Gruppo | | | | 2,184,343 | | 8,794,489 | |
| | | | | 39,680,550 | |
Japan - 22.8% | | | | | |
Amano | | | | 237,900 | | 5,115,606 | |
Azbil | | | | 187,600 | | 3,478,397 | |
DIC | | | | 215,100 | | 6,329,863 | |
DTS | | | | 169,200 | | 5,853,876 | |
en-japan | | | | 304,500 | | 12,099,711 | |
Horiba | | | | 51,100 | | 2,386,312 | |
IHI | | | | 252,200 | | 9,201,432 | |
Invincible Investment | | | | 18,268 | a | 7,568,410 | |
Itochu Techno-Solutions | | | | 234,200 | | 4,424,721 | |
Japan Aviation Electronics Industry | | | | 287,000 | | 3,798,924 | |
10
| | | | | | | | |
| |
Description | | | | Shares | | Value ($) | |
Common Stocks - 96.4% (continued) | | | | | |
Japan - 22.8% (continued) | | | | | |
Japan Hotel REIT Investment | | | | 12,318 | | 8,773,820 | |
Kanamoto | | | | 208,800 | | 6,960,503 | |
Makino Milling Machine | | | | 108,200 | | 4,102,574 | |
Matsumotokiyoshi Holdings | | | | 308,700 | | 11,207,923 | |
Modec | | | | 330,000 | | 9,901,969 | |
Morinaga & Co. | | | | 133,300 | | 5,371,624 | |
Nippon Electric Glass | | | | 142,700 | | 3,589,835 | |
Rengo | | | | 883,100 | | 7,665,064 | |
Rohto Pharmaceutical | | | | 171,800 | | 5,432,501 | |
Round One | | | | 591,000 | | 6,974,559 | |
Sawai Pharmaceutical | | | | 122,600 | | 6,214,407 | |
Seino Holdings | | | | 425,000 | | 5,857,819 | |
Tadano | | | | 338,900 | | 3,639,446 | |
Taiyo Yuden | | | | 183,800 | | 3,686,925 | |
TIS | | | | 97,400 | | 4,348,287 | |
Tokai Carbon | | | | 360,500 | | 5,596,061 | |
Tokyo Seimitsu | | | | 101,000 | | 2,413,187 | |
Toridoll Holdings | | | | 309,200 | | 5,256,997 | |
Toyo Tire & Rubber | | | | 524,900 | | 8,754,034 | |
Wacom | | | | 1,413,100 | | 6,630,803 | |
Yamato Kogyo | | | | 177,400 | | 4,647,233 | |
Zeon | | | | 710,000 | | 6,922,571 | |
| | | | | 194,205,394 | |
Luxembourg - 1.2% | | | | | |
Eurofins Scientific | | | | 8,235 | | 4,161,287 | |
Stabilus | | | | 86,445 | | 5,802,285 | |
| | | | | 9,963,572 | |
Malta - 1.0% | | | | | |
Kindred Group, SDR | | | | 795,001 | | 8,455,707 | |
Netherlands - 3.3% | | | | | |
AMG Advanced Metallurgical Group | | | | 149,306 | | 7,134,952 | |
Euronext | | | | 163,874 | b | 10,102,161 | |
Signify | | | | 260,635 | b | 6,434,297 | |
TKH Group | | | | 92,314 | | 4,666,963 | |
| | | | | 28,338,373 | |
Norway - 2.4% | | | | | |
Evry | | | | 1,371,195 | b | 5,033,049 | |
Leroy Seafood Group | | | | 467,791 | | 4,301,181 | |
Norway Royal Salmon | | | | 161,988 | | 4,762,227 | |
Storebrand | | | | 757,742 | | 6,291,327 | |
| | | | | 20,387,784 | |
Singapore - 3.3% | | | | | |
ComfortDelGro | | | | 3,939,800 | | 6,401,278 | |
11
STATEMENT OF INVESTMENTS (continued)
| | | | | | | | |
| |
Description | | | | Shares | | Value ($) | |
Common Stocks - 96.4% (continued) | | | | | |
Singapore - 3.3% (continued) | | | | | |
IGG | | | | 3,136,000 | | 3,324,038 | |
Mapletree Industrial Trust | | | | 5,105,000 | | 6,816,817 | |
Mapletree Logistics Trust | | | | 12,795,440 | | 11,178,953 | |
| | | | | 27,721,086 | |
South Korea - 1.9% | | | | | |
CJ E&M | | | | 22,133 | | 4,401,473 | |
Dentium | | | | 54,502 | | 3,470,799 | |
DGB Financial Group | | | | 568,015 | | 4,695,607 | |
Doosan Infracore | | | | 507,854 | a | 3,452,780 | |
| | | | | 16,020,659 | |
Spain - 1.8% | | | | | |
Acciona | | | | 86,996 | | 7,337,066 | |
Euskaltel | | | | 921,216 | b | 7,719,189 | |
| | | | | 15,056,255 | |
Sweden - 1.5% | | | | | |
SSAB | | | | 1,004,426 | | 4,006,207 | |
Swedish Orphan Biovitrum | | | | 415,343 | a | 8,469,308 | |
| | | | | 12,475,515 | |
Switzerland - 5.0% | | | | | |
Baloise Holding | | | | 41,722 | | 5,959,993 | |
Georg Fischer | | | | 5,334 | | 4,948,585 | |
Julius Baer Group | | | | 130,955 | a | 5,971,340 | |
Landis+Gyr Group | | | | 50,644 | a | 3,072,722 | |
OC Oerlikon | | | | 720,128 | a | 8,544,626 | |
Oriflame Holding | | | | 234,017 | a | 5,525,522 | |
Swissquote Group Holding | | | | 105,783 | | 5,487,871 | |
VAT Group | | | | 28,765 | a,b | 2,883,248 | |
| | | | | 42,393,907 | |
United Kingdom - 13.0% | | | | | |
Auto Trader Group | | | | 1,037,877 | b | 5,430,253 | |
Avast | | | | 2,339,467 | b | 8,263,341 | |
B&M European Value Retail | | | | 1,582,281 | | 8,428,102 | |
Britvic | | | | 1,083,388 | | 10,948,579 | |
Cairn Energy | | | | 2,691,457 | a | 6,784,712 | |
Cineworld Group | | | | 2,478,917 | | 9,331,408 | |
ConvaTec | | | | 2,860,516 | b | 5,920,767 | |
Halma | | | | 380,755 | | 6,455,569 | |
Indivior | | | | 1,629,088 | a | 3,917,887 | |
Just Eat | | | | 448,739 | a | 3,481,785 | |
Meggitt | | | | 974,977 | | 6,594,990 | |
NewRiver REIT | | | | 1,218,390 | | 3,939,306 | |
Pagegroup | | | | 777,372 | | 4,985,089 | |
Rotork | | | | 1,550,057 | | 5,936,203 | |
12
| | | | | | | | |
| |
Description | | | | Shares | | Value ($) | |
Common Stocks - 96.4% (continued) | | | | | |
United Kingdom - 13.0% (continued) | | | | | |
Severn Trent | | | | 545,300 | | 12,980,234 | |
Spectris | | | | 256,101 | | 7,014,108 | |
| | | | | 110,412,333 | |
United States - 1.1% | | | | | |
Nexteer Automotive Group | | | | 5,371,000 | | 7,570,530 | |
Tahoe Resources | | | | 889,763 | a | 2,101,989 | |
| | | | | 9,672,519 | |
Total Common Stocks (cost $840,751,050) | | | | 820,363,751 | |
| | | | | | | | |
Exchange-Traded Funds - 1.0% | | | | | |
United States - 1.0% | | | | | |
iShares MSCI EAFE Small-Cap ETF
(cost $8,873,334) | | | | 150,057 | | 8,440,706 | |
| | | Preferred Dividend
Yield (%) | | | | | |
Preferred Stocks - .8% | | | | | |
Germany - .8% | | | | | |
Sartorius
(cost $7,185,132) | | 0.45 | | 48,619 | | 7,042,752 | |
| | | 7-Day
Yield (%) | | | | | |
Investment Companies - .6% | | | | | |
Registered Investment Companies - .6% | | | | | |
Dreyfus Institutional Preferred Government Plus Money Market Fund
(cost $4,815,754) | | 2.21 | | 4,815,754 | c | 4,815,754 | |
Total Investments (cost $861,625,270) | | 98.8% | | 840,662,963 | |
Cash and Receivables (Net) | | 1.2% | | 10,604,948 | |
Net Assets | | 100.0% | | 851,267,911 | |
ETF—Exchange-Traded Fund
REIT—Real Estate Investment Trust
SDR—Swedish Depository Receipts
a Non-income producing security.
b Security exempt from registration pursuant to Rule 144A under the Securities Act of 1933. These securities may be resold in transactions exempt from registration, normally to qualified institutional buyers. At October 31, 2018, these securities were valued at $65,291,892 or 7.67% of net assets.
c Investment in affiliated issuer. The investment objective of this investment company is publicly available and can be found within the investment company’s prospectus.
13
STATEMENT OF INVESTMENTS (continued)
| | |
Portfolio Summary (Unaudited) † | Value (%) |
Capital Goods | 11.7 |
Materials | 8.9 |
Real Estate | 8.2 |
Pharmaceuticals Biotechnology & Life Sciences | 5.9 |
Media & Entertainment | 5.8 |
Technology Hardware & Equipment | 5.3 |
Diversified Financials | 4.9 |
Commercial & Professional Services | 4.7 |
Energy | 4.5 |
Consumer Services | 3.8 |
Food, Beverage & Tobacco | 3.8 |
Software & Services | 3.7 |
Utilities | 3.6 |
Transportation | 3.6 |
Insurance | 3.3 |
Health Care Equipment & Services | 3.3 |
Retailing | 3.2 |
Automobiles & Components | 2.6 |
Banks | 1.8 |
Registered Investment Companies | 1.6 |
Food & Staples Retailing | 1.3 |
Consumer Durables & Apparel | .9 |
Telecommunication Services | .9 |
Semiconductors & Semiconductor Equipment | .8 |
Household & Personal Products | .7 |
| | 98.8 |
† Based on net assets.
See notes to financial statements.
14
STATEMENT OF INVESTMENTS IN AFFILIATED ISSUERS
| | | | | | | |
Registered Investment Company | Value
10/31/17 ($) | Purchases ($) | Sales ($) | Value
10/31/18 ($) | Net
Assets (%) | Dividends/
Distributions ($) |
Dreyfus Institutional Preferred Government Plus Money Market Fund | 5,053,970 | 238,867,368 | 239,105,584 | 4,815,754 | .6 | 104,930 |
See notes to financial statements.
15
STATEMENT OF ASSETS AND LIABILITIES
October 31, 2018
| | | | | | | |
| | | | | | |
| | | Cost | | Value | |
Assets ($): | | | | |
Investments in securities—See Statement of Investments: | | | |
Unaffiliated issuers | 856,809,516 | | 835,847,209 | |
Affiliated issuers | | 4,815,754 | | 4,815,754 | |
Cash denominated in foreign currency | | | 3,174,969 | | 3,139,395 | |
Receivable for investment securities sold | | 5,319,188 | |
Tax reclaim receivable | | 1,341,883 | |
Dividends receivable | | 1,280,561 | |
Receivable for shares of Beneficial Interest subscribed | | 964,799 | |
Prepaid expenses | | | | | 12,133 | |
| | | | | 852,720,922 | |
Liabilities ($): | | | | |
Due to The Dreyfus Corporation and affiliates—Note 3(c) | | | | 837,886 | |
Payable for shares of Beneficial Interest redeemed | | 490,267 | |
Unrealized depreciation on foreign currency transactions | | 36,274 | |
Trustees fees and expenses payable | | 15,483 | |
Accrued expenses | | | | | 73,101 | |
| | | | | 1,453,011 | |
Net Assets ($) | | | 851,267,911 | |
Composition of Net Assets ($): | | | | |
Paid-in capital | | | | | 796,234,743 | |
Total distributable earnings (loss) | | | | | 55,033,168 | |
Net Assets ($) | | | 851,267,911 | |
| | | | | | |
Net Asset Value Per Share | Class A | Class C | Class I | Class Y | |
Net Assets ($) | 584,450 | 132,839 | 21,064,489 | 829,486,133 | |
Shares Outstanding | 39,453 | 9,046 | 1,417,257 | 55,798,126 | |
Net Asset Value Per Share ($) | 14.81 | 14.68 | 14.86 | 14.87 | |
| | | | | | |
See notes to financial statements. | | | | | |
16
STATEMENT OF OPERATIONS
Year Ended October 31, 2018
| | | | | | | |
| | | | | | |
| | | �� | | | |
Investment Income ($): | | | | |
Income: | | | | |
Cash dividends (net of $2,259,368 foreign taxes withheld at source): | |
Unaffiliated issuers | | | 19,075,469 | |
Affiliated issuers | | | 104,930 | |
Total Income | | | 19,180,399 | |
Expenses: | | | | |
Investment advisory fee—Note 3(a) | | | 9,450,724 | |
Custodian fees—Note 3(c) | | | 247,166 | |
Professional fees | | | 105,395 | |
Trustees’ fees and expenses—Note 3(d) | | | 97,552 | |
Registration fees | | | 61,914 | |
Loan commitment fees—Note 2 | | | 21,779 | |
Shareholder servicing costs—Note 3(c) | | | 11,055 | |
Prospectus and shareholders’ reports | | | 10,369 | |
Distribution fees—Note 3(b) | | | 1,085 | |
Miscellaneous | | | 72,405 | |
Total Expenses | | | 10,079,444 | |
Less—reduction in expenses due to undertaking—Note 3(a) | | | (2,665) | |
Less—reduction in fees due to earnings credits—Note 3(c) | | | (114) | |
Net Expenses | | | 10,076,665 | |
Investment Income—Net | | | 9,103,734 | |
Realized and Unrealized Gain (Loss) on Investments—Note 4 ($): | | |
Net realized gain (loss) on investments and foreign currency transactions | 82,062,723 | |
Net realized gain (loss) on forward foreign currency exchange contracts | (206,961) | |
Net Realized Gain (Loss) | | | 81,855,762 | |
Net unrealized appreciation (depreciation) on investments
and foreign currency transactions | | | (173,795,403) | |
Net unrealized appreciation (depreciation) on
forward foreign currency exchange contracts | | | (1,804) | |
Net Unrealized Appreciation (Depreciation) | | | (173,797,207) | |
Net Realized and Unrealized Gain (Loss) on Investments | | | (91,941,445) | |
Net (Decrease) in Net Assets Resulting from Operations | | (82,837,711) | |
| | | | | | | |
See notes to financial statements. | | | | | |
17
STATEMENT OF CHANGES IN NET ASSETS
| | | | | | | | | | |
| | | | Year Ended October 31, |
| | | | 2018 | | 2017a | |
Operations ($): | | | | | | | | |
Investment income—net | | | 9,103,734 | | | | 8,227,493 | |
Net realized gain (loss) on investments | | 81,855,762 | | | | 56,504,822 | |
Net unrealized appreciation (depreciation)
on investments | | (173,797,207) | | | | 123,849,690 | |
Net Increase (Decrease) in Net Assets
Resulting from Operations | (82,837,711) | | | | 188,582,005 | |
Distributions ($): | |
Distributions to shareholders: | | | | | | | | |
Class A | | | (9,446) | | | | (8,998) | |
Class C | | | (1,326) | | | | (800) | |
Class I | | | (274,991) | | | | (61,181) | |
Class Y | | | (16,875,613) | | | | (12,032,623) | |
Total Distributions | | | (17,161,376) | | | | (12,103,602) | |
Beneficial Interest Transactions ($): | |
Net proceeds from shares sold: | | | | | | | | |
Class A | | | 300,319 | | | | 156,427 | |
Class C | | | 18,002 | | | | - | |
Class I | | | 22,335,422 | | | | 18,684,529 | |
Class Y | | | 132,343,261 | | | | 135,336,956 | |
Distributions reinvested: | | | | | | | | |
Class A | | | 7,280 | | | | 7,462 | |
Class I | | | 216,273 | | | | 43,832 | |
Class Y | | | 4,361,605 | | | | 3,174,915 | |
Cost of shares redeemed: | | | | | | | | |
Class A | | | (144,507) | | | | (383,158) | |
Class I | | | (11,057,702) | | | | (10,990,359) | |
Class Y | | | (87,941,715) | | | | (180,933,940) | |
Increase (Decrease) in Net Assets
from Beneficial Interest Transactions | 60,438,238 | | | | (34,903,336) | |
Total Increase (Decrease) in Net Assets | (39,560,849) | | | | 141,575,067 | |
Net Assets ($): | |
Beginning of Period | | | 890,828,760 | | | | 749,253,693 | |
End of Period | | | 851,267,911 | | | | 890,828,760 | |
18
| | | | | | | | | | |
| | | | Year Ended October 31, |
| | | | 2018 | | 2017a | |
Capital Share Transactions (Shares): | |
Class A | | | | | | | | |
Shares sold | | | 17,539 | | | | 10,903 | |
Shares issued for distributions reinvested | | | 435 | | | | 587 | |
Shares redeemed | | | (8,582) | | | | (24,152) | |
Net Increase (Decrease) in Shares Outstanding | 9,392 | | | | (12,662) | |
Class C | | | | | | | | |
Shares sold | | | 1,046 | | | | - | |
Net Increase (Decrease) in Shares Outstanding | 1,046 | | | | - | |
Class Ib | | | | | | | | |
Shares sold | | | 1,339,132 | | | | 1,280,603 | |
Shares issued for distributions reinvested | | | 12,920 | | | | 3,449 | |
Shares redeemed | | | (675,737) | | | | (767,469) | |
Net Increase (Decrease) in Shares Outstanding | 676,315 | | | | 516,583 | |
Class Yb | | | | | | | | |
Shares sold | | | 7,802,722 | | | | 9,380,862 | |
Shares issued for distributions reinvested | | | 260,706 | | | | 249,797 | |
Shares redeemed | | | (5,236,396) | | | | (13,295,712) | |
Net Increase (Decrease) in Shares Outstanding | 2,827,032 | | | | (3,665,053) | |
| | | | | | | | | | |
aDistributions to shareholders include only distributions from net investment income. Undistributed investment income—net was 6,013,521 in 2017 and is no longer presented as a result of the adoption of SEC’s Disclosure Update and Simplification Rule. | |
bDuring the period ended October 31, 2018, 645,527 Class Y shares representing $10,882,023 were exchanged for 645,492 Class I shares and during the period ended October 31, 2017, 420,666 Class Y shares representing $6,139,912 were exchanged for 420,684 Class I shares. | |
See notes to financial statements. | | | | | | | | |
19
FINANCIAL HIGHLIGHTS
The following tables describe the performance for each share class for the fiscal periods indicated. All information (except portfolio turnover rate) reflects financial results for a single fund share. Total return shows how much your investment in the fund would have increased (or decreased) during each period, assuming you had reinvested all dividends and distributions. These figures have been derived from the fund’s financial statements.
| | | | | | | | |
| | | | | | |
| | Year Ended October 31, |
Class A Shares | | 2018 | 2017 | 2016 | 2015a |
Per Share Data ($): | | | | | |
Net asset value, beginning of period | | 16.51 | 13.12 | 13.26 | 12.50 |
Investment Operations: | | | | | |
Investment income—netb | | .12 | .12 | .09 | .11 |
Net realized and unrealized
gain (loss) on investments | | (1.56) | 3.46 | (.16) | .65c |
Total from
Investment Operations | | (1.44) | 3.58 | (.07) | .76 |
Distributions: | | | | | |
Dividends from
investment income―net | | (.25) | (.19) | (.07) | – |
Dividends from net realized
gain on investment | | (.01) | – | – | – |
Total Distributions | | (.26) | (.19) | (.07) | – |
Net asset value, end of period | | 14.81 | 16.51 | 13.12 | 13.26 |
Total Return (%)d | | (8.90) | 27.74 | (.54) | 6.08e |
Ratios/Supplemental Data (%): | | | | | |
Ratio of total expenses
to average net assets | | 1.47 | 1.41 | 1.44 | 1.71f |
Ratio of net expenses
to average net assets | | 1.40 | 1.40 | 1.40 | 1.40f |
Ratio of net investment income
to average net assets | | .69 | .84 | .71 | 1.15f |
Portfolio Turnover Rate | | 71.34 | 88.11 | 117.57 | 97.46e |
Net Assets, end of period ($ x 1,000) | | 584 | 496 | 561 | 621 |
a From January 30, 2015 (commencement of operations) to October 31, 2015.
b Based on average shares outstanding.
c In addition to net realized and unrealized losses on investments, this amount includes an increase in net asset value per share resulting from the timing of issuances and redemptions of shares in relation to fluctuating market values for the portfolio investments.
d Exclusive of sales charge.
e Not annualized.
f Annualized.
See notes to financial statements.
20
| | | | | | | | | |
| | | | | | |
| | | Year Ended October 31, |
Class C Shares | | 2018 | 2017 | 2016 | 2015a |
Per Share Data ($): | | | | | |
Net asset value, beginning of period | | 16.39 | 13.02 | 13.18 | 12.50 |
Investment Operations: | | | | | |
Investment income (loss)—netb | | (.01) | .01 | (.00)c | .02 |
Net realized and unrealized
gain (loss) on investments | | (1.53) | 3.46 | (.16) | .66d |
Total from
Investment Operations | | (1.54) | 3.47 | (.16) | .68 |
Distributions: | | | | | |
Dividends from
investment income―net | | (.16) | (.10) | – | – |
Dividends from net realized
gain on investment | | (.01) | – | – | – |
Total Distributions | | (.17) | (.10) | – | – |
Net asset value, end of period | | 14.68 | 16.39 | 13.02 | 13.18 |
Total Return (%)e | | (9.54) | 26.88 | (1.21) | 5.44f |
Ratios/Supplemental Data (%): | | | | | |
Ratio of total expenses
to average net assets | | 2.15 | 2.09 | 2.12 | 2.88g |
Ratio of net expenses
to average net assets | | 2.10 | 2.09 | 2.12 | 2.15g |
Ratio of net investment
income (loss)
to average net assets | | (.03) | .07 | (.02) | .23g |
Portfolio Turnover Rate | | 71.34 | 88.11 | 117.57 | 97.46f |
Net Assets, end of period ($ x 1,000) | | 133 | 131 | 104 | 105 |
a From January 30, 2015 (commencement of operations) to October 31, 2015.
b Based on average shares outstanding.
c Amount represents less than $.01 per share.
d In addition to net realized and unrealized losses on investments, this amount includes an increase in net asset value per share resulting from the timing of issuances and redemptions of shares in relation to fluctuating market values for the portfolio investments.
e Exclusive of sales charge.
f Not annualized.
g Annualized.
See notes to financial statements.
21
FINANCIAL HIGHLIGHTS (continued)
| | | | | | | | | |
| | | | | | |
| | | Year Ended October 31, |
Class I Shares | | 2018 | 2017 | 2016 | 2015a |
Per Share Data ($): | | | | | |
Net asset value, beginning of period | | 16.57 | 13.16 | 13.28 | 12.50 |
Investment Operations: | | | | | |
Investment income—netb | | .16 | .13 | .15 | .12 |
Net realized and unrealized
gain (loss) on investments | | (1.55) | 3.51 | (.18) | .66c |
Total from
Investment Operations | | (1.39) | 3.64 | (.03) | .78 |
Distributions: | | | | | |
Dividends from
investment income―net | | (.31) | (.23) | (.09) | – |
Dividends from net realized
gain on investment | | (.01) | – | – | – |
Total Distributions | | (.32) | (.23) | (.09) | – |
Net asset value, end of period | | 14.86 | 16.57 | 13.16 | 13.28 |
Total Return (%) | | (8.64) | 28.15 | (.23) | 6.24d |
Ratios/Supplemental Data (%): | | | | | |
Ratio of total expenses
to average net assets | | 1.10 | 1.12 | 1.12 | 1.26e |
Ratio of net expenses
to average net assets | | 1.09 | 1.12 | 1.12 | 1.15e |
Ratio of net investment income
to average net assets | | .97 | .91 | 1.16 | 1.32e |
Portfolio Turnover Rate | | 71.34 | 88.11 | 117.57 | 97.46d |
Net Assets, end of period ($ x 1,000) | | 21,064 | 12,280 | 2,952 | 3,086 |
a From January 30, 2015 (commencement of operations) to October 31, 2015.
b Based on average shares outstanding.
c In addition to net realized and unrealized losses on investments, this amount includes an increase in net asset value per share resulting from the timing of issuances and redemptions of shares in relation to fluctuating market values for the portfolio investments.
d Not annualized.
e Annualized.
See notes to financial statements.
22
| | | | | | | | | |
| | | | | | |
| | | Year Ended October 31, |
Class Y Shares | | 2018 | 2017 | 2016 | 2015a |
Per Share Data ($): | | | | | |
Net asset value, beginning of period | | 16.57 | 13.17 | 13.28 | 12.50 |
Investment Operations: | | | | | |
Investment income—netb | | .16 | .16 | .14 | .12 |
Net realized and unrealized
gain (loss) on investments | | (1.54) | 3.47 | (.16) | .66c |
Total from
Investment Operations | | (1.38) | 3.63 | (.02) | .78 |
Distributions: | | | | | |
Dividends from
investment income―net | | (.31) | (.23) | (.09) | – |
Dividends from net realized
gain on investment | | (.01) | – | – | – |
Total Distributions | | (.32) | (.23) | (.09) | – |
Net asset value, end of period | | 14.87 | 16.57 | 13.17 | 13.28 |
Total Return (%) | | (8.56) | 28.10 | (.16) | 6.24d |
Ratios/Supplemental Data (%): | | | | | |
Ratio of total expenses
to average net assets | | 1.07 | 1.07 | 1.09 | 1.22e |
Ratio of net expenses
to average net assets | | 1.07 | 1.07 | 1.09 | 1.15e |
Ratio of net investment income
to average net assets | | .96 | 1.08 | 1.07 | 1.30e |
Portfolio Turnover Rate | | 71.34 | 88.11 | 117.57 | 97.46d |
Net Assets, end of period ($ x 1,000) | | 829,486 | 877,921 | 745,636 | 764,708 |
a From January 30, 2015 (commencement of operations) to October 31, 2015.
b Based on average shares outstanding.
c In addition to net realized and unrealized losses on investments, this amount includes an increase in net asset value per share resulting from the timing of issuances and redemptions of shares in relation to fluctuating market values for the portfolio investments.
d Not annualized.
e Annualized.
See notes to financial statements.
23
NOTES TO FINANCIAL STATEMENTS
NOTE 1—Significant Accounting Policies:
Dreyfus International Small Cap Fund (the “fund”) is a separate diversified series of Dreyfus Stock Funds (the “Company”), which is registered under the Investment Company Act of 1940, as amended (the “Act”), as an open-end management investment company and operates as a series company currently offering two series, including the fund. The fund’s investment objective is to seek long-term growth of capital. The Dreyfus Corporation (the “Manager” or “Dreyfus”), a wholly-owned subsidiary of The Bank of New York Mellon Corporation (“BNY Mellon”), serves as the fund’s investment adviser. Effective January 31, 2018, BNY Mellon Asset Management North America Corporation (the “Sub-Adviser ”), a wholly-owned subsidiary of BNY Mellon and an affiliate of Dreyfus, serves as the fund’s sub-investment adviser. The Sub-Adviser is a specialist multi-asset investment manager formed by the combination of certain BNY Mellon affiliated investment management firms, including The Boston Company Asset Management, LLC, which served as the fund’s sub-investment adviser prior to January 31, 2018.
MBSC Securities Corporation (the “Distributor”), a wholly-owned subsidiary of Dreyfus, is the distributor of the fund’s shares. The fund is authorized to issue an unlimited number of $.001 par value shares of Beneficial Interest in each of the following classes of shares: Class A, Class C, Class I, Class T and Class Y. Class A and Class T shares generally are subject to a sales charge imposed at the time of purchase. Class C shares are subject to a contingent deferred sales charge (“CDSC”) imposed on Class C shares redeemed within one year of purchase. Class C shares automatically convert to Class A shares ten years after the date of purchase, without the imposition of a sales charge. Class I and Class Y shares are sold at net asset value per share generally to institutional investors. As of the date of this report, the fund did not offer Class T shares for purchase. Other differences between the classes include the services offered to and the expenses borne by each class, the allocation of certain transfer agency costs, and certain voting rights. Income, expenses (other than expenses attributable to a specific class), and realized and unrealized gains or losses on investments are allocated to each class of shares based on its relative net assets.
As of October 31, 2018, MBC Investments Corp., an indirect subsidiary of BNY Mellon, held 8,000 Class A and 8,000 Class C shares of the fund.
The Company accounts separately for the assets, liabilities and operations of each series. Expenses directly attributable to each series are charged to
24
that series’ operations; expenses which are applicable to all series are allocated among them on a pro rata basis.
The Financial Accounting Standards Board (“FASB”) Accounting Standards Codification (“ASC”) is the exclusive reference of authoritative U.S. generally accepted accounting principles (“GAAP”) recognized by the FASB to be applied by nongovernmental entities. Rules and interpretive releases of the Securities and Exchange Commission (“SEC”) under authority of federal laws are also sources of authoritative GAAP for SEC registrants. The fund’s financial statements are prepared in accordance with GAAP, which may require the use of management estimates and assumptions. Actual results could differ from those estimates.
The Company enters into contracts that contain a variety of indemnifications. The fund’s maximum exposure under these arrangements is unknown. The fund does not anticipate recognizing any loss related to these arrangements.
(a) Portfolio valuation: The fair value of a financial instrument is the amount that would be received to sell an asset or paid to transfer a liability in an orderly transaction between market participants at the measurement date (i.e., the exit price). GAAP establishes a fair value hierarchy that prioritizes the inputs of valuation techniques used to measure fair value. This hierarchy gives the highest priority to unadjusted quoted prices in active markets for identical assets or liabilities (Level 1 measurements) and the lowest priority to unobservable inputs (Level 3 measurements).
Additionally, GAAP provides guidance on determining whether the volume and activity in a market has decreased significantly and whether such a decrease in activity results in transactions that are not orderly. GAAP requires enhanced disclosures around valuation inputs and techniques used during annual and interim periods.
Various inputs are used in determining the value of the fund’s investments relating to fair value measurements. These inputs are summarized in the three broad levels listed below:
Level 1—unadjusted quoted prices in active markets for identical investments.
Level 2—other significant observable inputs (including quoted prices for similar investments, interest rates, prepayment speeds, credit risk, etc.).
Level 3—significant unobservable inputs (including the fund’s own assumptions in determining the fair value of investments).
25
NOTES TO FINANCIAL STATEMENTS (continued)
The inputs or methodology used for valuing securities are not necessarily an indication of the risk associated with investing in those securities.
Changes in valuation techniques may result in transfers in or out of an assigned level within the disclosure hierarchy. Valuation techniques used to value the fund’s investments are as follows:
Investments in securities are valued at the last sales price on the securities exchange or national securities market on which such securities are primarily traded. Securities listed on the National Market System for which market quotations are available are valued at the official closing price or, if there is no official closing price that day, at the last sales price. For open short positions, asked prices are used for valuation purposes. Bid price is used when no asked price is available. Registered investment companies that are not traded on an exchange are valued at their net asset value. All of the preceding securities are generally categorized within Level 1 of the fair value hierarchy.
Securities not listed on an exchange or the national securities market, or securities for which there were no transactions, are valued at the average of the most recent bid and asked prices. These securities are generally categorized within Level 2 of the fair value hierarchy.
Fair valuing of securities may be determined with the assistance of a pricing service using calculations based on indices of domestic securities and other appropriate indicators, such as prices of relevant American Depository Receipts and futures. Utilizing these techniques may result in transfers between Level 1 and Level 2 of the fair value hierarchy.
When market quotations or official closing prices are not readily available, or are determined not to accurately reflect fair value, such as when the value of a security has been significantly affected by events after the close of the exchange or market on which the security is principally traded (for example, a foreign exchange or market), but before the fund calculates its net asset value, the fund may value these investments at fair value as determined in accordance with the procedures approved by the Company’s Board of Trustees (the “Board”). Certain factors may be considered when fair valuing investments such as: fundamental analytical data, the nature and duration of restrictions on disposition, an evaluation of the forces that influence the market in which the securities are purchased and sold, and public trading in similar securities of the issuer or comparable issuers. These securities are either categorized within Level 2 or 3 of the fair value hierarchy depending on the relevant inputs used.
26
For restricted securities where observable inputs are limited, assumptions about market activity and risk are used and such securities are generally categorized within Level 3 of the fair value hierarchy.
Investments denominated in foreign currencies are translated to U.S. dollars at the prevailing rates of exchange.
The following is a summary of the inputs used as of October 31, 2018 in valuing the fund’s investments:
| | | | | | |
| | Level 1 - Unadjusted Quoted Prices | Level 2 - Other Significant Observable Inputs | | Level 3 -Significant Unobservable Inputs | Total |
Assets ($) | | | | |
Investments in Securities: | | | | |
Equity Securities - Common Stocks | 63,347,855 | 757,015,896† | | - | 820,363,751 |
Equity Securities - Preferred Stocks | - | 7,042,752† | | - | 7,042,752 |
Exchange-Traded Funds | 8,440,706 | - | | - | 8,440,706 |
Investment Company | 4,815,754 | - | | - | 4,815,754 |
† Securities classified within Level 2 at period end as the values were determined pursuant to the fund’s fair valuation procedures.
At October 31, 2018, the amount of securities transferred between levels equals fair value of exchange traded equity securities reported as Level 2 in the table above. At October 31, 2017, there was no transfer between levels of the fair value hierarchy. It is the fund’s policy to recognize transfers between levels at the end of the reporting period.
(b) Foreign currency transactions: The fund does not isolate that portion of the results of operations resulting from changes in foreign exchange rates on investments from the fluctuations arising from changes in the market prices of securities held. Such fluctuations are included with the net realized and unrealized gain or loss on investments.
Net realized foreign exchange gains or losses arise from sales of foreign currencies, currency gains or losses realized on securities transactions between trade and settlement date, and the difference between the amounts of dividends, interest and foreign withholding taxes recorded on the fund’s books and the U.S. dollar equivalent of the amounts actually received or paid. Net unrealized foreign exchange gains and losses arise from changes in the value of assets and liabilities other than investments
27
NOTES TO FINANCIAL STATEMENTS (continued)
resulting from changes in exchange rates. Foreign currency gains and losses on foreign currency transactions are also included with net realized and unrealized gain or loss on investments.
(c) Securities transactions and investment income: Securities transactions are recorded on a trade date basis. Realized gains and losses from securities transactions are recorded on the identified cost basis. Dividend income is recognized on the ex-dividend date and interest income, including, where applicable, accretion of discount and amortization of premium on investments, is recognized on the accrual basis.
(d) Affiliated issuers: Investments in other investment companies advised by Dreyfus are considered “affiliated” under the Act.
(e) Risk: Investing in foreign markets may involve special risks and considerations not typically associated with investing in the U.S. These risks include revaluation of currencies, high rates of inflation, repatriation restrictions on income and capital, and adverse political and economic developments. Moreover, securities issued in these markets may be less liquid, subject to government ownership controls and delayed settlements, and their prices may be more volatile than those of comparable securities in the U.S.
(f) Dividends and distributions to shareholders: Dividends and distributions are recorded on the ex-dividend date. Dividends from investment income-net and dividends from net realized capital gains, if any, are normally declared and paid annually, but the fund may make distributions on a more frequent basis to comply with the distribution requirements of the Internal Revenue Code of 1986, as amended (the “Code”). To the extent that net realized capital gains can be offset by capital loss carryovers, it is the policy of the fund not to distribute such gains. Income and capital gain distributions are determined in accordance with income tax regulations, which may differ from GAAP.
(g) Federal income taxes: It is the policy of the fund to continue to qualify as a regulated investment company, if such qualification is in the best interests of its shareholders, by complying with the applicable provisions of the Code, and to make distributions of taxable income and net realized capital gain sufficient to relieve it from substantially all federal income and excise taxes.
As of and during the period ended October 31, 2018, the fund did not have any liabilities for any uncertain tax positions. The fund recognizes interest and penalties, if any, related to uncertain tax positions as income
28
tax expense in the Statement of Operations. During the period ended October 31, 2018, the fund did not incur any interest or penalties.
Each of the tax years in the four-year period ended October 31, 2018 remains subject to examination by the Internal Revenue Service and state taxing authorities.
At October 31, 2018, the components of accumulated earnings on a tax basis were as follows: undistributed ordinary income $28,143,809, undistributed capital gains $58,235,975 and unrealized depreciation $31,346,616.
The tax character of distributions paid to shareholders during the fiscal periods ended October 31, 2018 and October 31, 2017 were as follows: ordinary income $16,799,109 and $12,103,602 and long-term capital gains of $362,267 and $0, respectively.
(h) New Accounting Pronouncements: In August 2018, the FASB issued Accounting Standards Update 2018-13, Fair Value Measurement (Topic 820): Disclosure Framework—Changes to the Disclosure Requirements for Fair Value Measurement (“ASU 2018-13”). The update provides guidance that eliminates, adds and modifies certain disclosure requirements for fair value measurements. ASU 2018-13 will be effective for annual periods beginning after December 15, 2019. Management is currently assessing the potential impact of these changes to future financial statements.
NOTE 2—Bank Lines of Credit:
The fund participates with other Dreyfus-managed funds in an $830 million unsecured credit facility led by Citibank, N.A. and a $300 million unsecured credit facility provided by The Bank of New York Mellon, a subsidiary of BNY Mellon and an affiliate of Dreyfus (each, a “Facility”), each to be utilized primarily for temporary or emergency purposes, including the financing of redemptions. In connection therewith, the fund has agreed to pay its pro rata portion of commitment fees for each Facility. Interest is charged to the fund based on rates determined pursuant to the terms of the respective Facility at the time of borrowing. During the period ended October 31, 2018, the fund did not borrow under the Facilities.
NOTE 3—Investment Advisory Fee, Sub-Investment Advisory Fee and Other Transactions with Affiliates:
(a) Pursuant to an investment advisory agreement with Dreyfus, the investment advisory fee is computed at the annual rate of 1.00% of the value of the fund’s average daily net assets and is payable monthly. Dreyfus has contractually agreed, from November 1, 2017 through March 1, 2019,
29
NOTES TO FINANCIAL STATEMENTS (continued)
to waive receipt of its fees and/or assume the direct expenses of the fund, so that the direct expenses of none of the classes (excluding Rule 12b-1 Distribution Plan fees, Shareholder Services Plan fees, taxes, interest expense, brokerage commissions, commitment fees on borrowings and extraordinary expenses) exceed 1.15% of the value of the fund’s average daily net assets. On or after March 1, 2019, Dreyfus may terminate this expense limitation at any time. The reduction in expenses, pursuant to the undertaking, amounted to $2,665 during the period ended October 31, 2018.
Pursuant to a sub-investment advisory agreement between Dreyfus and the Sub-Adviser, the Sub-Adviser serves as the fund’s sub-investment adviser responsible for the day-to-day management of the fund’s portfolio. Dreyfus pays the sub-investment adviser a monthly fee at an annual percentage of the value of the fund’s average daily net assets. Dreyfus has obtained an exemptive order from the SEC (the “Order”), upon which the fund may rely, to use a manager of managers approach that permits Dreyfus, subject to certain conditions and approval by the Board, to enter into and materially amend sub-investment advisory agreements with one or more sub-investment advisers who are either unaffiliated with Dreyfus or are wholly-owned subsidiaries (as defined under the Act) of Dreyfus’ ultimate parent company, BNY Mellon, without obtaining shareholder approval. The Order also allows the fund to disclose the sub-investment advisory fee paid by Dreyfus to any unaffiliated sub-investment adviser in the aggregate with other unaffiliated sub-investment advisers in documents filed with the SEC and provided to shareholders. In addition, pursuant to the Order, it is not necessary to disclose the sub-investment advisory fee payable by Dreyfus separately to a sub-investment adviser that is a wholly-owned subsidiary of BNY Mellon in documents filed with the SEC and provided to shareholders; such fees are to be aggregated with fees payable to Dreyfus. Dreyfus has ultimate responsibility (subject to oversight by the Board) to supervise any sub-investment adviser and recommend the hiring, termination, and replacement of any sub-investment adviser to the Board.
During the period ended October 31, 2018, the Distributor retained $265 from commissions earned on sales of the fund’s Class A shares.
(b) Under the Distribution Plan adopted pursuant to Rule 12b-1 under the Act, Class C shares pay the Distributor for distributing its shares at an annual rate of .75% of the value of its average daily net assets. During the period ended October 31, 2018, Class C shares were charged $1,085 pursuant to the Distribution Plan.
(c) Under the Shareholder Services Plan, Class A and Class C shares pay the Distributor at an annual rate of .25% of the value of their average daily
30
net assets for the provision of certain services. The services provided may include personal services relating to shareholder accounts, such as answering shareholder inquiries regarding the fund and providing reports and other information, and services related to the maintenance of shareholder accounts. The Distributor may make payments to Service Agents (securities dealers, financial institutions or other industry professionals) with respect to these services. The Distributor determines the amounts to be paid to Service Agents. During the period ended October 31, 2018, Class A and Class C shares were charged $1,674 and $361, respectively, pursuant to the Shareholder Services Plan.
The fund has arrangements with the transfer agent and the custodian whereby the fund may receive earnings credits when positive cash balances are maintained, which are used to offset transfer agency and custody fees. For financial reporting purposes, the fund includes net earnings credits, if any, as an expense offset in the Statement of Operations.
The fund compensates Dreyfus Transfer, Inc., a wholly-owned subsidiary of Dreyfus, under a transfer agency agreement for providing transfer agency and cash management services for the fund. The majority of transfer agency fees are comprised of amounts paid on a per account basis, while cash management fees are related to fund subscriptions and redemptions. During the period ended October 31, 2018, the fund was charged $3,310 for transfer agency services. These fees are included in Shareholder servicing costs in the Statement of Operations.
The fund compensates The Bank of New York Mellon under a custody agreement for providing custodial services for the fund. These fees are determined based on net assets, geographic region and transaction activity. During the period ended October 31, 2018, the fund was charged $247,166 pursuant to the custody agreement. These fees were offset by earnings credits of $114.
During the period ended October 31, 2018, the fund was charged $12,797 for services performed by the Chief Compliance Officer and his staff. These fees are included in Miscellaneous in the Statement of Operations.
The components of “Due to The Dreyfus Corporation and affiliates” in the Statement of Assets and Liabilities consist of: investment advisory fees $747,844, Distribution Plan fees $88, Shareholder Services Plan fees $157, custodian fees $84,979, Chief Compliance Officer fees $4,193 and transfer agency fees $625.
(d) Each Board member also serves as a Board member of other funds within the Dreyfus complex. Annual retainer fees and attendance fees are allocated to each fund based on net assets.
31
NOTES TO FINANCIAL STATEMENTS (continued)
NOTE 4—Securities Transactions:
The aggregate amount of purchases and sales of investment securities, excluding short-term securities and forward contracts, during the period ended October 31, 2018, amounted to $711,729,074 and $660,342,593, respectively.
Derivatives: A derivative is a financial instrument whose performance is derived from the performance of another asset. The fund enters into International Swaps and Derivatives Association, Inc. Master Agreements or similar agreements (collectively, “Master Agreements”) with its over-the-counter (“OTC”) derivative contract counterparties in order to, among other things, reduce its credit risk to counterparties. Master Agreements include provisions for general obligations, representations, collateral and events of default or termination. Under a Master Agreement, the fund may offset with the counterparty certain derivative financial instrument’s payables and/or receivables with collateral held and/or posted and create one single net payment in the event of default or termination.
Each type of derivative instrument that was held by the fund during the period ended October 31, 2018 is discussed below.
Forward Foreign Currency Exchange Contracts: The fund enters into forward contracts in order to hedge its exposure to changes in foreign currency exchange rates on its foreign portfolio holdings, to settle foreign currency transactions or as a part of its investment strategy. When executing forward contracts, the fund is obligated to buy or sell a foreign currency at a specified rate on a certain date in the future. With respect to sales of forward contracts, the fund incurs a loss if the value of the contract increases between the date the forward contract is opened and the date the forward contract is closed. The fund realizes a gain if the value of the contract decreases between those dates. With respect to purchases of forward contracts, the fund incurs a loss if the value of the contract decreases between the date the forward contract is opened and the date the forward contract is closed. The fund realizes a gain if the value of the contract increases between those dates. Any realized or unrealized gains or losses which occurred during the period are reflected in the Statement of Operations. The fund is exposed to foreign currency risk as a result of changes in value of underlying financial instruments. The fund is also exposed to credit risk associated with counterparty nonperformance on these forward contracts, which is generally limited to the unrealized gain on each open contract. This risk may be mitigated by Master Agreements, if any, between the fund and the counterparty and the posting of collateral, if any, by the counterparty to the fund to cover the fund’s exposure to the
32
counterparty. At October 31, 2018, there were no forward contracts outstanding.
The following summarizes the average market value of derivatives outstanding during the period ended October 31, 2018:
| | | |
| | Average Market Value ($) |
Forward contracts | | 3,238,424 |
| | | |
At October 31, 2018, the cost of investments for federal income tax purposes was $871,937,731; accordingly, accumulated net unrealized depreciation on investments was $31,274,768 consisting of $83,433,259 gross unrealized appreciation and $114,708,027 gross unrealized depreciation.
33
REPORT OF INDEPENDENT REGISTERED PUBLIC ACCOUNTING FIRM
To the Shareholders and the Board of Trustees of Dreyfus International Small Cap Fund
Opinion on the Financial Statements
We have audited the accompanying statement of assets and liabilities of Dreyfus International Small Cap Fund (the “Fund”) (one of the funds constituting Dreyfus Stock Funds), including the statements of investments and investments in affiliated issuers, as of October 31, 2018, and the related statement of operations for the year then ended, the statements of changes in net assets for each of the two years in the period then ended, the financial highlights for each of the three years in the period then ended and the period from January 30, 2015 (commencement of operations) to October 31, 2015 and the related notes (collectively referred to as the “financial statements”). In our opinion, the financial statements present fairly, in all material respects, the financial position of the Fund (one of the funds constituting Dreyfus Stock Funds) at October 31, 2018, the results of its operations for the year then ended, the changes in its net assets for each of the two years in the period then ended and its financial highlights for each of the three years in the period then ended and the period from January 30, 2015 (commencement of operations) to October 31, 2015, in conformity with U.S. generally accepted accounting principles.
Basis for Opinion
These financial statements are the responsibility of the Fund’s management. Our responsibility is to express an opinion on the Fund’s financial statements based on our audits. We are a public accounting firm registered with the Public Company Accounting Oversight Board (United States) (“PCAOB”) and are required to be independent with respect to the Fund in accordance with the U.S. federal securities laws and the applicable rules and regulations of the Securities and Exchange Commission and the PCAOB.
We conducted our audits in accordance with the standards of the PCAOB. Those standards require that we plan and perform the audit to obtain reasonable assurance about whether the financial statements are free of material misstatement, whether due to error or fraud. The Fund is not required to have, nor were we engaged to perform, an audit of the Fund’s internal control over financial reporting. As part of our audits, we are required to obtain an understanding of internal control over financial reporting, but not for the purpose of expressing an opinion on the effectiveness of the Fund’s internal control over financial reporting. Accordingly, we express no such opinion.
Our audits included performing procedures to assess the risks of material misstatement of the financial statements, whether due to error or fraud, and performing procedures that respond to those risks. Such procedures included examining, on a test basis, evidence regarding the amounts and disclosures in the financial statements. Our procedures included confirmation of securities owned as of October 31, 2018, by correspondence with the custodian and others or by other appropriate auditing procedures where replies from others were not received. Our audits also included evaluating the accounting principles used and significant estimates made by management, as well as evaluating the overall presentation of the financial statements. We believe that our audits provide a reasonable basis for our opinion.

We have served as the auditor of one or more Dreyfus investment companies since at least 1957, but we are unable to determine the specific year.
New York, New York
December 28, 2018
34
IMPORTANT TAX INFORMATION (Unaudited)
In accordance with federal tax law, the fund elects to provide each shareholder with their portion of the fund’s foreign taxes paid and the income sourced from foreign countries. Accordingly, the fund hereby reports the following information regarding its fiscal year ended October 31, 2018:
- the total amount of taxes paid to foreign countries was $2,123,335
- the total amount of income sourced from foreign countries was $21,204,019.
Where required by federal tax law rules, shareholders will receive notification of their proportionate share of foreign taxes paid and foreign sourced income for the 2018 calendar year with Form 1099-DIV which will be mailed in early 2019.
For the fiscal year ended October 31, 2018, certain dividends paid by the fund may be subject to a maximum tax rate of 15%, as provided for by the Jobs and Growth Tax Relief Reconciliation Act of 2003. Of the distributions paid during the fiscal year, $13,763,813 represents the maximum amount that may be considered qualified dividend income. The fund also hereby reports $.0067 per share as a long-term capital gain distribution paid on December 22, 2018.
35
BOARD MEMBERS INFORMATION (Unaudited)
INDEPENDENT BOARD MEMBERS
Joseph S. DiMartino (74)
Chairman of the Board (2003)
Principal Occupation During Past 5 Years:
· Corporate Director and Trustee (1995-present)
Other Public Company Board Memberships During Past 5 Years:
· CBIZ (formerly, Century Business Services, Inc.), a provider of outsourcing functions for small and medium size companies, Director (1997-present)
No. of Portfolios for which Board Member Serves: 125
———————
Joni Evans (76)
Board Member (2006)
Principal Occupation During Past 5 Years:
· Chief Executive Officer, www.wowOwow.com, an online community dedicated to women’s conversations and publications (2007-present)
· Principal, Joni Evans Ltd. (publishing) (2006-present)
No. of Portfolios for which Board Member Serves: 21
———————
Joan Gulley (71)
Board Member (2017)
Principal Occupation During Past 5 Years:
· PNC Financial Services Group, Inc.(1993-2014), Executive Vice President and Chief Human Resources Officer and Executive Committee Member (2008-2014)
No. of Portfolios for which Board Member Serves: 52
———————
Ehud Houminer (78)
Board Member (2003)
Principal Occupation During Past 5 Years:
· Board of Overseers at the Columbia Business School, Columbia
University (1992-present)
Trustee, Ben Gurion University
No. of Portfolios for which Board Member Serves: 52
———————
36
Alan H. Howard (59)
Board Member (2018)
Principal Occupation During Past 5 Years:
· Managing Partner of Heathcote Advisors LLC, a financial advisory services firm (2008 – present)
· President of Dynatech/MPX Holdings LLC (2012 – present), a global supplier and service provider of military aircraft parts, including Chief Executive Officer of an operating subsidiary, Dynatech International LLC (2013 – present)
· Senior Advisor, Rossoff & Co., an independent investment banking firm (2014 – present)
Other Public Company Board Memberships During Past 5 Years:
· Movado Group, a designer and manufacturer of watches, Director (1997-present)
No. of Portfolios for which Board Member Serves: 21
———————
Robin A. Melvin (55)
Board Member (2003)
Principal Occupation During Past 5 Years:
· Co-chairman, Illinois Mentoring Partnership, non-profit organization dedicated to increasing the quantity and quality of mentoring services in Illinois; (2014-present; board member since 2013)
No. of Portfolios for which Board Member Serves: 100
———————
Burton N. Wallack (67)
Board Member (2006)
Principal Occupation During Past 5 Years:
· President and Co-owner of Wallack Management Company, a real estate management
company (1987-present)
No. of Portfolios for which Board Member Serves: 21
———————
Benaree Pratt Wiley (72)
Board Member (2003)
Principal Occupation During Past 5 Years:
· Principal, The Wiley Group, a firm specializing in strategy and business development (2005-present)
Other Public Company Board Memberships During Past 5 Years:
· CBIZ (formerly, Century Business Services, Inc.), a provider of outsourcing functions for small and medium size companies, Director (2008-present)
No. of Portfolios for which Board Member Serves: 80
———————
37
BOARD MEMBERS INFORMATION (Unaudited) (continued)
INTERESTED BOARD MEMBERs
Gordon J. Davis (77)
Board Member (2006)
Principal Occupation During Past 5 Years:
· Partner in the law firm of Venable LLP (2012-present)
Other Public Company Board Memberships During Past 5 Years:
· Consolidated Edison, Inc., a utility company, Director (1997-2014)
· The Phoenix Companies, Inc., a life insurance company, Director (2000-2014)
No. of Portfolios for which Board Member Serves: 55
Gordon J. Davis is deemed to be an “interested person” (as defined under the Act) of the Company as a result of his affiliation with Venable LLP, which provides legal services to the Company.
———————
Once elected all Board Members serve for an indefinite term, but achieve Emeritus status upon reaching age 80. The address of the Board Members and Officers is c/o The Dreyfus Corporation, 200 Park Avenue, New York, New York 10166. Additional information about the Board Members is available in the fund’s Statement of Additional Information which can be obtained from Dreyfus free of charge by calling this toll free number: 1-800-DREYFUS.
William Hodding Carter III, Emeritus Board Member
Hans C. Mautner, Emeritus Board Member
38
OFFICERS OF THE FUND (Unaudited)
BRADLEY J. SKAPYAK, President since January 2010.
Chief Operating Officer and a director of the Manager since June 2009, Chairman of Dreyfus Transfer, Inc., an affiliate of the Manager and the transfer agent of the funds, since May 2011 and Chief Executive Officer of MBSC Securities Corporation since August 2016. He is an officer of 62 investment companies (comprised of 124 portfolios) managed by the Manager. He is 59 years old and has been an employee of the Manager since February 1988.
BENNETT A. MACDOUGALL, Chief Legal Officer since October 2015.
Chief Legal Officer of the Manager and Associate General Counsel and Managing Director of BNY Mellon since June 2015; from June 2005 to June 2015, he served in various capacities with Deutsche Bank – Asset & Wealth Management Division, including as Director and Associate General Counsel, and Chief Legal Officer of Deutsche Investment Management Americas Inc. from June 2012 to May 2015. He is an officer of 63 investment companies (comprised of 149 portfolios) managed by the Manager. He is 47 years old and has been an employee of the Manager since June 2015.
JAMES BITETTO, Vice President since August 2005 and Secretary since February 2018.
Managing Counsel of BNY Mellon and Secretary of the Manager, and an officer of 63 investment companies (comprised of 149 portfolios) managed by the Manager. He is 52 years old and has been an employee of the Manager since December 1996.
JOSEPH M. CHIOFFI, Vice President and Assistant Secretary since August 2005.
Managing Counsel of BNY Mellon, and an officer of 63 investment companies (comprised of 149 portfolios) managed by the Manager. He is 56 years old and has been an employee of the Manager since June 2000.
SONALEE CROSS, Vice President and Assistant Secretary since March 2018.
Counsel of BNY Mellon since October 2016; Associate at Proskauer Rose LLP from April 2016 to September 2016; Attorney at EnTrust Capital from August 2015 to February 2016; Associate at Sidley Austin LLP from September 2013 until August 2015. She is an officer of 63 investment companies (comprised of 149 portfolios) managed by Dreyfus. She is 31 years old and has been an employee of the Manager since October 2016.
MAUREEN E. KANE, Vice President and Assistant Secretary since April 2015.
Managing Counsel of BNY Mellon since July 2014; from October 2004 until July 2014, General Counsel, and from May 2009 until July 2014, Chief Compliance Officer of Century Capital Management. She is an officer of 63 investment companies (comprised of 149 portfolios) managed by the Manager. She is 56 years old and has been an employee of the Manager since July 2014.
SARAH S. KELLEHER, Vice President and Assistant Secretary since April 2014.
Managing Counsel of BNY Mellon since December 2017, from March 2013 to December 2017, Senior Counsel of BNY Mellon. She is an officer of 63 investment companies (comprised of 149 portfolios) managed by the Manager. She is 43 years old and has been an employee of the Manager since March 2013.
JEFF PRUSNOFSKY, Vice President and Assistant Secretary since August 2005.
Senior Managing Counsel of BNY Mellon, and an officer of 63 investment companies (comprised of 149 portfolios) managed by the Manager. He is 53 years old and has been an employee of the Manager since October 1990.
NATALYA ZELENSKY, Vice President and Assistant Secretary since March 2017.
Counsel of BNY Mellon since May 2016; Attorney at Wildermuth Endowment Strategy Fund/Wildermuth Advisory, LLC from November 2015 until May 2016; Assistant General Counsel at RCS Advisory Services from July 2014 until November 2015; Associate at Sutherland, Asbill & Brennan from January 2013 until January 2014. She is an officer of 63 investment companies (comprised of 149 portfolios) managed by Dreyfus. She is 33 years old and has been an employee of the Manager since May 2016.
JAMES WINDELS, Treasurer since November 2001.
Director – Mutual Fund Accounting of the Manager, and an officer of 63 investment companies (comprised of 149 portfolios) managed by the Manager. He is 60 years old and has been an employee of the Manager since April 1985.
39
OFFICERS OF THE FUND (Unaudited) (continued)
GAVIN C. REILLY, Assistant Treasurer since December 2005.
Tax Manager of the Investment Accounting and Support Department of the Manager, and an officer of 63 investment companies (comprised of 149 portfolios) managed by the Manager. He is 50 years old and has been an employee of the Manager since April 1991.
ROBERT S. ROBOL, Assistant Treasurer since August 2005.
Senior Accounting Manager – Dreyfus Financial Reporting of the Manager, and an officer of 63 investment companies (comprised of 149 portfolios) managed by the Manager. He is 54 years old and has been an employee of the Manager since October 1988.
ROBERT SALVIOLO, Assistant Treasurer since July 2007.
Senior Accounting Manager – Equity Funds of the Manager, and an officer of 63 investment companies (comprised of 149 portfolios) managed by the Manager. He is 51 years old and has been an employee of the Manager since June 1989.
ROBERT SVAGNA, Assistant Treasurer since December 2002.
Senior Accounting Manager – Fixed Income and Equity Funds of the Manager, and an officer of 63 investment companies (comprised of 149 portfolios) managed by the Manager. He is 51 years old and has been an employee of the Manager since November 1990.
JOSEPH W. CONNOLLY, Chief Compliance Officer since October 2004.
Chief Compliance Officer of the Manager, the Dreyfus Family of Funds and BNY Mellon Funds Trust (63 investment companies, comprised of 149 portfolios). He is 61 years old and has served in various capacities with the Manager since 1980, including manager of the firm’s Fund Accounting Department from 1997 through October 2001.
CARIDAD M. CAROSELLA, Anti-Money Laundering Compliance Officer since January 2016.
Anti-Money Laundering Compliance Officer of the Dreyfus Family of Funds and BNY Mellon Funds Trust since January 2016; from May 2015 to December 2015, Interim Anti-Money Laundering Compliance Officer of the Dreyfus Family of Funds and BNY Mellon Funds Trust and the Distributor; from January 2012 to May 2015, AML Surveillance Officer of the Distributor and from 2007 to December 2011, Financial Processing Manager of the Distributor. She is an officer of 57 investment companies (comprised of 143 portfolios) managed by the Manager. She is 50 years old and has been an employee of the Distributor since 1997.
40
NOTES
41
Dreyfus International Small Cap Fund
200 Park Avenue
New York, NY 10166
Manager
The Dreyfus Corporation
200 Park Avenue
New York, NY 10166
Sub-Investment Adviser
BNY Mellon Asset Management
North America Corporation
BNY Mellon Center
One Boston Place
Boston, MA 02108-4408
Custodian
The Bank of New York Mellon
240 Greenwich Street
New York, NY 10286
Transfer Agent &
Dividend Disbursing Agent
Dreyfus Transfer, Inc.
200 Park Avenue
New York, NY 10166
Distributor
MBSC Securities Corporation
200 Park Avenue
New York, NY 10166
| | |
Ticker Symbols: | Class A: DYAPX Class C: DYCPX Class I: DYIPX Class Y: DYYPX |
Telephone Call your financial representative or 1-800-DREYFUS
Mail The Dreyfus Family of Funds, 144 Glenn Curtiss Boulevard, Uniondale, NY 11556-0144
E-mail Send your request to info@dreyfus.com
Internet Information can be viewed online or downloaded at www.dreyfus.com
The fund files its complete schedule of portfolio holdings with the Securities and Exchange Commission (“SEC”) for the first and third quarters of each fiscal year on Form N-Q. The fund’s Forms N-Q are available on the SEC’s website at www.sec.gov.
A description of the policies and procedures that the fund uses to determine how to vote proxies relating to portfolio securities and information regarding how the fund voted these proxies for the most recent 12-month period ended June 30 is available at www.dreyfus.com and on the SEC’s website at www.sec.gov and without charge, upon request, by calling 1-800-DREYFUS.
| | |
© 2018 MBSC Securities Corporation
4006AR1018 | 
|
Item 2. Code of Ethics.
The Registrant has adopted a code of ethics that applies to the Registrant's principal executive officer, principal financial officer, principal accounting officer or controller, or persons performing similar functions. There have been no amendments to, or waivers in connection with, the Code of Ethics during the period covered by this Report.
Item 3. Audit Committee Financial Expert.
The Registrant's Board has determined that Ehud Houminer, a member of the Audit Committee of the Board, is an audit committee financial expert as defined by the Securities and Exchange Commission (the "SEC"). Ehud Houminer is "independent" as defined by the SEC for purposes of audit committee financial expert determinations.
Item 4. Principal Accountant Fees and Services.
(a) Audit Fees. The aggregate fees billed for each of the last two fiscal years (the "Reporting Periods") for professional services rendered by the Registrant's principal accountant (the "Auditor") for the audit of the Registrant's annual financial statements or services that are normally provided by the Auditor in connection with the statutory and regulatory filings or engagements for the Reporting Periods, were $46,766 in 2017 and $47,467 in 2018.
(b) Audit-Related Fees. The aggregate fees billed in the Reporting Periods for assurance and related services by the Auditor that are reasonably related to the performance of the audit of the Registrant's financial statements and are not reported under paragraph (a) of this Item 4 were $11,039 in 2017 and $11,402 in 2018. These services consisted of one or more of the following: (i) agreed upon procedures related to compliance with Internal Revenue Code section 817(h), (ii) security counts required by Rule 17f-2 under the Investment Company Act of 1940, as amended, (iii) advisory services as to the accounting or disclosure treatment of Registrant transactions or events and (iv) advisory services to the accounting or disclosure treatment of the actual or potential impact to the Registrant of final or proposed rules, standards or interpretations by the Securities and Exchange Commission, the Financial Accounting Standards Boards or other regulatory or standard-setting bodies.
The aggregate fees billed in the Reporting Periods for non-audit assurance and related services by the Auditor to the Registrant's investment adviser (not including any sub-investment adviser whose role is primarily portfolio management and is subcontracted with or overseen by another investment adviser), and any entity controlling, controlled by or under common control with the investment adviser that provides ongoing services to the Registrant ("Service Affiliates"), that were reasonably related to the performance of the annual audit of the Service Affiliate, which required pre-approval by the Audit Committee were $0 in 2017 and $0 in 2018.
(c) Tax Fees. The aggregate fees billed in the Reporting Periods for professional services rendered by the Auditor for tax compliance, tax advice, and tax planning ("Tax Services") were $6,551 in 2017 and $7,292 in 2018. These services consisted of: (i) review or preparation of U.S. federal, state, local and excise tax returns; (ii) U.S. federal, state and local tax planning, advice and assistance regarding statutory, regulatory or administrative developments; (iii) tax advice regarding tax qualification matters and/or treatment of various financial instruments held or proposed to be acquired or held, and (iv) determination of Passive Foreign Investment Companies. The aggregate fees billed in the Reporting Periods for Tax Services by the Auditor to Service Affiliates, which required pre-approval by the Audit Committee were $0 in 2017 and $0 in 2018.
(d) All Other Fees. The aggregate fees billed in the Reporting Periods for products and services provided by the Auditor, other than the services reported in paragraphs (a) through (c) of this Item, were $18 in 2017 and $27 in 2018. These services consisted of a review of the Registrant's anti-money laundering program.
The aggregate fees billed in the Reporting Periods for Non-Audit Services by the Auditor to Service Affiliates, other than the services reported in paragraphs (b) through (c) of this Item, which required pre-approval by the Audit Committee, were $0 in 2017 and $0 in 2018.
(e)(1) Audit Committee Pre-Approval Policies and Procedures. The Registrant's Audit Committee has established policies and procedures (the "Policy") for pre-approval (within specified fee limits) of the Auditor's engagements for non-audit services to the Registrant and Service Affiliates without specific case-by-case consideration. The pre-approved services in the Policy can include pre-approved audit services, pre-approved audit-related services, pre-approved tax services and pre-approved all other services. Pre-approval considerations include whether the proposed services are compatible with maintaining the Auditor's independence. Pre-approvals pursuant to the Policy are considered annually.
(e)(2) Note. None of the services described in paragraphs (b) through (d) of this Item 4 were approved by the Audit Committee pursuant to paragraph (c)(7)(i)(C) of Rule 2-01 of Regulation S-X.
(f) None of the hours expended on the principal accountant's engagement to audit the registrant's financial statements for the most recent fiscal year were attributed to work performed by persons other than the principal account's full-time, permanent employees.
Non-Audit Fees. The aggregate non-audit fees billed by the Auditor for services rendered to the Registrant, and rendered to Service Affiliates, for the Reporting Periods were $32,905,415 in 2017 and $30,820,284 in 2018.
Auditor Independence. The Registrant's Audit Committee has considered whether the provision of non-audit services that were rendered to Service Affiliates, which were not pre-approved (not requiring pre-approval), is compatible with maintaining the Auditor's independence.
Item 5. Audit Committee of Listed Registrants.
Not applicable.
Item 6. Investments.
(a) Not applicable.
Item 7. Disclosure of Proxy Voting Policies and Procedures for Closed-End Management Investment Companies.
Not applicable.
Item 8. Portfolio Managers of Closed-End Management Investment Companies.
Not applicable.
Item 9. Purchases of Equity Securities by Closed-End Management Investment Companies and Affiliated Purchasers.
Not applicable.
Item 10. Submission of Matters to a Vote of Security Holders.
There have been no material changes to the procedures applicable to Item 10.
Item 11. Controls and Procedures.
(a) The Registrant's principal executive and principal financial officers have concluded, based on their evaluation of the Registrant's disclosure controls and procedures as of a date within 90 days of the filing date of this report, that the Registrant's disclosure controls and procedures are reasonably designed to ensure that information required to be disclosed by the Registrant on Form N-CSR is recorded, processed, summarized and reported within the required time periods and that information required to be disclosed by the Registrant in the reports that it files or submits on Form N-CSR is accumulated and communicated to the Registrant's management, including its principal executive and principal financial officers, as appropriate to allow timely decisions regarding required disclosure.
(b) There were no changes to the Registrant's internal control over financial reporting that occurred during the second fiscal quarter of the period covered by this report that have materially affected, or are reasonably likely to materially affect, the Registrant's internal control over financial reporting.
Item 12. Disclosure of Securities Lending Activities for Closed-End Management Investment Companies.
Not applicable.
Item 13. Exhibits.
(a)(1) Code of ethics referred to in Item 2.
(a)(2) Certifications of principal executive and principal financial officers as required by Rule 30a-2(a) under the Investment Company Act of 1940.
(a)(3) Not applicable.
(b) Certification of principal executive and principal financial officers as required by Rule 30a-2(b) under the Investment Company Act of 1940.
SIGNATURES
Pursuant to the requirements of the Securities Exchange Act of 1934 and the Investment Company Act of 1940, the Registrant has duly caused this Report to be signed on its behalf by the undersigned, thereunto duly authorized.
Dreyfus Stock Funds
By: /s/ Bradley J. Skapyak
Bradley J. Skapyak
President
Date: January 2, 2019
Pursuant to the requirements of the Securities Exchange Act of 1934 and the Investment Company Act of 1940, this Report has been signed below by the following persons on behalf of the Registrant and in the capacities and on the dates indicated.
By: /s/ Bradley J. Skapyak
Bradley J. Skapyak
President
Date: January 2, 2019
By: /s/ James Windels
James Windels
Treasurer
Date: January 2, 2019
EXHIBIT INDEX
(a)(1) Code of ethics referred to in Item 2.
(a)(2) Certifications of principal executive and principal financial officers as required by Rule 30a-2(a) under the Investment Company Act of 1940. (EX-99.CERT)
(b) Certification of principal executive and principal financial officers as required by Rule 30a-2(b) under the Investment Company Act of 1940. (EX-99.906CERT)
