We are pleased to present this annual report for BNY Mellon International Core Equity Fund (formerly Dreyfus International Equity Fund), covering the 12-month period from October 1, 2018 through September 30, 2019. For information about how the fund performed during the reporting period, as well as general market perspectives, we provide a Discussion of Fund Performance on the pages that follow.
Equity markets weakened in the fourth calendar quarter of 2018, as concerns about rising interest rates, trade tensions and slowing global growth provided downward pressure on returns. In December 2018, stocks experienced a sharp sell-off, as it appeared that the US Federal Reserve (the “Fed”) would maintain its hawkish stance on monetary policy. In January 2019, the Fed commented that it would slow the pace of interest-rate increases, which helped stimulate a rebound across equity markets that continued into the second quarter. Escalating trade tensions disrupted equity markets again in May. The dip was short-lived, as markets rose once again in June. However, despite continued supportive central bank policies, pockets of volatility persisted through the end of the period. Despite the turbulence, several major US equity indices posted modestly positive returns for the 12-month period. In general, small-cap stocks lagged their mid- and large-cap counterparts and non-US markets trailed US performance.
In fixed-income markets, October brought a risk-off mentality, fueled in part by equity market volatility. A flight to quality supported price increases for US Treasuries, which continued through the end of the calendar year, leading to a flattening yield curve. After the Fed’s supportive statements in January 2019, other developed market central banks followed suit and reiterated their abilities to bolster flagging growth by continuing supportive policies. This helped to further buoy fixed-income instrument prices. At the end of July and in mid-September, the Fed cut the federal funds rate by 25 basis points, for a total reduction of 50 basis points during 2019. Both the US and Global Bloomberg Barclays Aggregate Bond indices produced strong returns for the 12 months.
We believe that over the near term, the outlook for the US remains positive, but we will monitor relevant data for any signs of a change. As always, we encourage you to discuss the risks and opportunities in today’s investment environment with your financial advisor.
Thank you for your continued confidence and support.
DISCUSSION OF FUND PERFORMANCE(Unaudited)
For the period from October 1, 2018 through September 30, 2019, as provided by Mark A. Bogar, Andrew R. Leger, and James A. Lydotes, portfolio managers
Market and Fund Performance Overview
For the 12-month period ended September 30, 2019, BNY Mellon International Core Equity Fund’s (formerly, Dreyfus International Equity Fund) Class A shares produced a total return of -5.22%, Class C shares returned -5.94%, Class I shares returned -4.94% and Class Y shares returned -4.94%.1In comparison, the fund’s benchmark, the MSCI EAFE Index (the “Index”), produced a total return of
-1.34% for the same period.2
International equity markets provided negative returns over the reporting period, resulting from market volatility fueled by geopolitical, trade and economic uncertainty. The fund underperformed the Index, primarily due to stock selection in the health care and industrials sectors.
The Fund’s Investment Approach
The fund seeks long-term growth of capital. The fund normally invests at least 80% of its net assets, plus any borrowings for investment purposes, in shares of companies located in the foreign countries represented in the Index and Canada, and may also invest up to 20% of its assets in securities of issuers located in emerging-market countries.
We employ a bottom-up investment approach using proprietary quantitative models and traditional qualitative analysis to identify attractive stocks. We seek to allocate country weights generally in accordance with the Index, but deviations from the Index country weightings may occur. We use the sector allocations of the Index as a guide, but allocations may differ from those of the Index. The fund’s stock selection process is designed to produce a diversified portfolio that, relative to the Index, has a below-average price/earnings ratio and an above-average earnings growth trend.
Geopolitical Events Drive Market Volatility
Financial markets faced a broad array of problematic geopolitical developments over the 12 months. These ranged from civil protests in Hong Kong, attacks on Saudi Arabia’s oil infrastructure, the initiation of an impeachment inquiry against the U.S. president and the Brexit saga in the UK. In addition, continuing trade tensions between the U.S. and China remained a key variable shaping investor sentiment for much of the period.
The review period began with a significant equity-market sell-off, stoked by a renewed articulation of hawkish narrative by U.S. Federal Reserve (“Fed”) officials. The possibility that the Fed might continue to raise interest rates in the face of unsupportive data spooked investors. In January 2019, the Fed emphasized its focus on data as the primary driver for rate-hike decisions, and its ability to suspend additional rate increases when the data is not supportive. These statements heralded a rebound in international equities over the start of the year. Nevertheless, mounting structural, cyclical and geopolitical concerns ensured that market volatility persisted. Equity prices sharply rose and fell throughout the remainder of the period, as the Fed cut interest rates twice, and the European Central Bank announced another phase of quantitative easing.
Stock Selections Drove Fund Performance
The fund underperformed the Index during the reporting period, due in part to security selection shortfalls within the health care and industrials sectors. Stock choices among companies based in Switzerland, Japan and Sweden also hurt relative results.Fresenius SE & Co., a Germany-based health care company that provides products and services for dialysis, was among the top overall detractors within the health care sector and the portfolio as a whole. The company missed earnings and downgraded its guidance for 2019. We have since exited the position. In industrials, a position in UK-
3
DISCUSSION OF FUND PERFORMANCE(Unaudited) (continued)
based Bunzl provided a headwind, as the stock fell during the period on the back of softening earnings from a slowdown in its North American business. Elsewhere in the markets, a lack of exposure to Swiss-based food product manufacturer Nestlé hurt relative returns as its stock price rose throughout the latter half of the period. A position in Swiss financial company Julius Baer Group also provided a headwind. Japan-based Suzuki Motor also weighed on results, as the price fell on reduced demand for its products in India.
Conversely, positive contributors to the fund’s performance included positions in the utilities and energy sectors, as well as companies based in Hong Kong, France and Italy. Italy-based utility company Enel was a top individual contributor to sector, country and portfolio returns. The electric utility group experienced earnings beats and recovering demand during the period, particularly in its Latin American business. Performance in the energy sector was bolstered by a lack of exposure to France- and Japan-based energy companies, which underperformed the broader sector during the period. A position in Royal Dutch Shell also helped results. In other sectors, a position in Hong Kong-based insurer AIA Group was among the top individual contributors. The stock rose during the 12 months on strong demand for its products, particularly in China. France-based business service provider Edenred was also among the top-performing securities.
A Constructive Investment Posture
We have observed less of a rotation into value securities in non-U.S. markets than has occurred recently in the U.S. Non-U.S. equity investors remain focused on quality and growth factors in light of the macroeconomic slowdown in Europe and Japan. We believe pessimistic earnings expectations are already incorporated into non-U.S. equity prices, and that investing outside of the U.S. gives access to valuations that are currently more in line with their long-term averages versus more richly valued U.S. markets. The good news is that positive earnings surprises could potentially have an uplifting effect on stock prices, as would a trade deal between the U.S. and China. That said, geopolitical uncertainty may continue to affect the markets for the near term. However, ongoing support from central banks could provide a positive tailwind over the next 12 months. As a result of this outlook, we continue to maintain balanced exposures to quality growth and value attributes, as we believe this design is better equipped to weather volatility than strategies with a distinct style bias.
October 15, 2019
1 Total return includes reinvestment of dividends and any capital gains paid and does not take into consideration the maximum initial sales charge in the case of Class A shares, or the applicable contingent deferred sales charge imposed on redemptions in the case of Class C shares. Share price and investment return fluctuate such that upon redemption, fund shares may be worth more or less than their original cost. The fund’s Class Y return reflects the absorption of certain fund expenses by BNY Mellon Investment Adviser, Inc. and Mellon Investments Corporation pursuant to an agreement in effect through February 1, 2020, at which time it may be extended, modified, or terminated. Had these expenses not been absorbed, returns would have been lower. Past performance is no guarantee of future results.
2 Source: Lipper Inc. — The MSCI EAFE Index (Europe, Australasia, Far East) is a free float-adjusted, market capitalization-weighted index that is designed to measure the equity market performance of developed markets, excluding the U.S. and Canada. It reflects reinvestment of net dividends and, where applicable, capital gain distributions. Investors cannot invest directly in any index.
Please note: the position in any security highlighted with italicized typeface was sold during the reporting period.
Equities are subject generally to market, market sector, market liquidity, issuer, and investment style risks, among other factors, to varying degrees, all of which are more fully described in the fund’s prospectus.
The fund’s performance will be influenced by political, social, and economic factors affecting investments in foreign companies. Special risks associated with investments in foreign companies include exposure to currency fluctuations, less liquidity, less developed or less efficient trading markets, lack of comprehensive company information, political instability, and differing auditing and legal standards. These risks are enhanced in emerging market countries. Investments in foreign currencies are subject to the risk that those currencies will decline in value relative to the U.S. dollar, or, in the case of hedged positions, that the U.S. dollar will decline relative to the currency being hedged. Each of these risks could increase the fund’s volatility.
The fund may use derivative instruments, such as options, futures, options on futures, forward contracts and swaps. A small investment in derivatives could have a potentially large impact on the fund’s performance. The use of derivatives involves risks different from, or possibly greater than, the risks associated with investing directly in the underlying assets.
4
FUND PERFORMANCE(Unaudited)
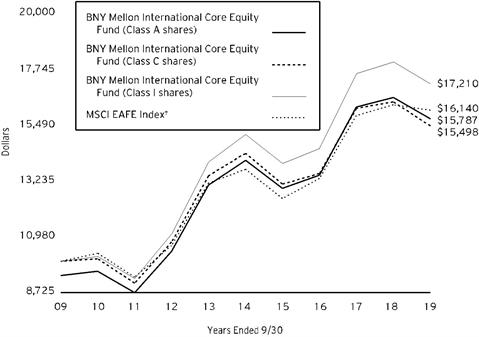 Comparison of change in value of a $10,000 investment in Class A shares, Class C shares and Class I shares of BNY Mellon International Core Equity Fund with a hypothetical investment of $10,000 in the MSCI EAFE Index (the “Index”)
† Source: Lipper Inc.
Past performance is not predictive of future performance.
The above graph compares a hypothetical $10,000 investment made in Class A, Class C and Class I shares of BNY Mellon International Core Equity Fund on 9/30/09 to a hypothetical investment of $10,000 made in the Index on that date. All dividends and capital gain distributions are reinvested.
The fund’s performance shown in the line graph above takes into account the maximum initial sales charge on Class A shares and all other applicable fees and expenses on all classes. The Index is a free float-adjusted market capitalization-weighted index that is designed to measure the equity market performance of developed markets, excluding the U.S. and Canada. Unlike a mutual fund, the Index is not subject to charges, fees and other expenses. Investors cannot invest directly in any index. Further information relating to fund performance, including expense reimbursements, if applicable, is contained in the Financial Highlights section of the prospectus and elsewhere in this report.
5
FUND PERFORMANCE(Unaudited) (continued)
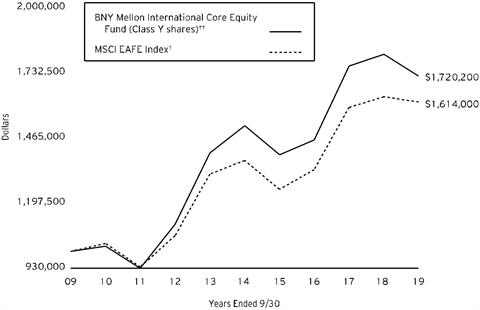 Comparison of change in value of a $1,000,000 investment in Class Y shares of BNY Mellon International Core Equity Fund with a hypothetical investment of $1,000,000 in the MSCI EAFE Index (the “Index”)
† Source: Lipper Inc.
†† The total return figures presented for Class Y shares of the fund reflect the performance of the fund’s Class I shares for the period prior to 6/1/15 (the inception date for Class Y shares).
Past performance is not predictive of future performance.
The above graph compares a hypothetical $1,000,000 investment made in Class Y shares of BNY Mellon International Core Equity Fund on 9/30/09 to a hypothetical investment of $1,000,000 made in the Index on that date. All dividends and capital gain distributions are reinvested.
The fund’s performance shown in the line graph above takes into account all applicable fees and expenses of the fund’s Class Y shares. The Index is a free float-adjusted market capitalization-weighted index that is designed to measure the equity market performance of developed markets, excluding the U.S. and Canada. Unlike a mutual fund, the Index is not subject to charges, fees and other expenses. Investors cannot invest directly in any index. Further information relating to fund performance, including expense reimbursements, if applicable, is contained in the Financial Highlights section of the prospectus and elsewhere in this report.
6
| | | | | |
Average Annual Total Returns as of 9/30/19 | |
| Inception Date | 1 Year | 5 Years | 10 Years |
Class A shares | | | | |
with maximum sales charge (5.75%) | 12/8/88 | -10.67% | 1.08% | 4.67% |
without sales charge | 12/8/88 | -5.22% | 2.29% | 5.30% |
Class C shares | | | | |
with applicable redemption charge† | 12/8/88 | -6.87% | 1.49% | 4.48% |
without redemption | 12/8/88 | -5.94% | 1.49% | 4.48% |
Class I shares | 12/8/88 | -4.94% | 2.57% | 5.58% |
Class Y shares | 6/1/15 | -4.94% | 2.56%†† | 5.57%†† |
MSCI EAFE Index | | -1.34% | 3.27% | 4.90% |
† The maximum contingent deferred sales charge for Class C shares is 1% for shares redeemed within one year of the date of purchase.
†† The total return performance figures presented for Class Y shares of the fund reflect the performance of the fund’s Class I shares for the period prior to 6/1/15 (the inception date for Class Y shares).
The performance data quoted represents past performance, which is no guarantee of future results. Share price and investment return fluctuate and an investor’s shares may be worth more or less than original cost upon redemption. Current performance may be lower or higher than the performance quoted. Go to im.bnymellon.com for the fund’s most recent month-end returns.
The fund’s performance shown in the graphs and table does not reflect the deduction of taxes that a shareholder would pay on fund distributions or the redemption of fund shares. In addition to the performance of Class A shares shown with and without a maximum sales charge, the fund’s performance shown in the table takes into account all other applicable fees and expenses on all classes.
7
UNDERSTANDING YOUR FUND’S EXPENSES(Unaudited)
As a mutual fund investor, you pay ongoing expenses, such as management fees and other expenses. Using the information below, you can estimate how these expenses affect your investment and compare them with the expenses of other funds. You also may pay one-time transaction expenses, including sales charges (loads) and redemption fees, which are not shown in this section and would have resulted in higher total expenses. For more information, see your fund’s prospectus or talk to your financial adviser.
Review your fund’s expenses
The table below shows the expenses you would have paid on a $1,000 investment in BNY Mellon International Core Equity Fund from April 1, 2019 to September 30, 2019. It also shows how much a $1,000 investment would be worth at the close of the period, assuming actual returns and expenses.
| | | | | | | |
Expenses and Value of a $1,000 Investment | |
Assume actual returns for the six months ended September 30, 2019 | |
| | | | | | |
| | Class A | Class C | Class I | Class Y | |
Expense paid per $1,000† | $5.65 | $9.57 | $4.29 | $4.29 | |
Ending value (after expenses) | $1,012.30 | $1,008.40 | $1,014.00 | $1,014.00 | |
COMPARING YOUR FUND’S EXPENSES
WITH THOSE OF OTHER FUNDS(Unaudited)
Using the SEC’s method to compare expenses
The Securities and Exchange Commission (“SEC”) has established guidelines to help investors assess fund expenses. Per these guidelines, the table below shows your fund’s expenses based on a $1,000 investment, assuming a hypothetical 5% annualized return. You can use this information to compare the ongoing expenses (but not transaction expenses or total cost) of investing in the fund with those of other funds. All mutual fund shareholder reports will provide this information to help you make this comparison. Please note that you cannot use this information to estimate your actual ending account balance and expenses paid during the period.
| | | | | | | |
Expenses and Value of a $1,000 Investment | |
Assuming a hypothetical 5% annualized return for the six months ended September 30, 2019 | |
| | | | | | |
| | Class A | Class C | Class I | Class Y | |
Expense paid per $1,000† | $5.67 | $9.60 | $4.31 | $4.31 | |
Ending value (after expenses) | $1,019.45 | $1,015.54 | $1,020.81 | $1,020.81 | |
†Expenses are equal to the fund‘s annualized expense ratio of 1.12% for Class A, 1.90% for Class C, .85% for Class I and .85% for Class Y, multiplied by the average account value over the period, multiplied by 183/365 (to reflect the one-half year period). |
8
STATEMENT OF INVESTMENTS
September 30, 2019
| | | | | | | | |
| |
Description | | | | Shares | | Value ($) | |
Common Stocks - 97.2% | | | | | |
Australia - 4.7% | | | | | |
Aristocrat Leisure | | | | 285,866 | | 5,927,771 | |
Brambles | | | | 353,502 | | 2,723,424 | |
Macquarie Group | | | | 150,989 | | 13,378,778 | |
Northern Star Resources | | | | 419,190 | | 3,095,823 | |
Woodside Petroleum | | | | 217,952 | | 4,784,255 | |
| | | | | 29,910,051 | |
Austria - 1.4% | | | | | |
OMV | | | | 169,762 | | 9,094,708 | |
Belgium - 1.1% | | | | | |
UCB | | | | 92,448 | | 6,713,023 | |
Denmark - 1.3% | | | | | |
Vestas Wind Systems | | | | 106,935 | | 8,307,492 | |
Finland - 1.2% | | | | | |
Nokia | | | | 1,482,836 | | 7,514,643 | |
France - 11.7% | | | | | |
Atos | | | | 105,857 | | 7,471,241 | |
BNP Paribas | | | | 225,441 | | 10,991,774 | |
Cie Generale des Etablissements Michelin | | | | 63,110 | | 7,052,539 | |
Edenred | | | | 134,048 | | 6,437,122 | |
Klepierre | | | | 202,562 | | 6,878,391 | |
LVMH Moet Hennessy Louis Vuitton | | | | 27,386 | | 10,901,531 | |
Sanofi | | | | 193,928 | | 17,982,649 | |
Vinci | | | | 68,402 | | 7,372,924 | |
| | | | | 75,088,171 | |
Germany - 7.3% | | | | | |
Allianz | | | | 52,627 | | 12,272,397 | |
Deutsche Boerse | | | | 68,194 | | 10,660,145 | |
Deutsche Post | | | | 158,266 | | 5,286,441 | |
Deutsche Telekom | | | | 858,407 | | 14,410,521 | |
Evonik Industries | | | | 160,546 | | 3,963,292 | |
| | | | | 46,592,796 | |
Hong Kong - 3.4% | | | | | |
AIA Group | | | | 1,161,800 | | 10,901,354 | |
Galaxy Entertainment Group | | | | 624,000 | | 3,914,984 | |
Sun Hung Kai Properties | | | | 457,500 | | 6,614,078 | |
| | | | | 21,430,416 | |
Ireland - .8% | | | | | |
ICON | | | | 34,683 | a | 5,110,193 | |
Italy - 2.7% | | | | | |
Enel | | | | 1,286,107 | | 9,609,643 | |
9
STATEMENT OF INVESTMENTS (continued)
| | | | | | | | |
| |
Description | | | | Shares | | Value ($) | |
Common Stocks - 97.2% (continued) | | | | | |
Italy - 2.7% (continued) | | | | | |
Leonardo | | | | 661,753 | | 7,791,295 | |
| | | | | 17,400,938 | |
Japan - 23.4% | | | | | |
Asahi Kasei | | | | 550,100 | | 5,454,460 | |
Bandai Namco Holdings | | | | 90,100 | | 5,613,233 | |
Chubu Electric Power | | | | 802,400 | | 11,621,895 | |
Denso | | | | 206,700 | | 9,131,769 | |
Fujitsu | | | | 88,800 | | 7,132,032 | |
Hitachi | | | | 288,000 | | 10,785,367 | |
ITOCHU | | | | 208,700 | | 4,326,267 | |
Mitsubishi Electric | | | | 731,800 | | 9,777,208 | |
Recruit Holdings | | | | 178,900 | | 5,468,015 | |
Seven & i Holdings | | | | 237,200 | | 9,102,504 | |
Shin-Etsu Chemical | | | | 53,700 | | 5,786,008 | |
Shionogi & Co. | | | | 187,900 | | 10,483,130 | |
Shiseido | | | | 115,000 | | 9,187,476 | |
Sony | | | | 236,200 | | 13,879,233 | |
Sumitomo Mitsui Financial Group | | | | 444,400 | | 15,264,237 | |
Suzuki Motor | | | | 197,700 | | 8,397,803 | |
West Japan Railway | | | | 70,900 | | 6,005,766 | |
Yamato Holdings | | | | 155,700 | | 2,354,451 | |
| | | | | 149,770,854 | |
Netherlands - 8.1% | | | | | |
Heineken | | | | 112,587 | | 12,174,558 | |
ING Groep | | | | 657,909 | | 6,896,616 | |
Koninklijke Ahold Delhaize | | | | 319,555 | | 7,993,812 | |
Koninklijke DSM | | | | 53,351 | | 6,417,639 | |
NN Group | | | | 186,814 | | 6,632,081 | |
Royal Dutch Shell, Cl. B | | | | 404,933 | | 11,895,740 | |
| | | | | 52,010,446 | |
Portugal - .8% | | | | | |
Galp Energia | | | | 342,117 | | 5,145,987 | |
Singapore - 1.2% | | | | | |
United Overseas Bank | | | | 396,700 | | 7,348,975 | |
Spain - 5.6% | | | | | |
ACS Actividades de Construccion y Servicios | | | | 179,375 | | 7,175,975 | |
Amadeus IT Group | | | | 113,967 | | 8,172,960 | |
Iberdrola | | | | 1,177,497 | | 12,236,814 | |
Industria de Diseno Textil | | | | 275,030 | | 8,519,398 | |
| | | | | 36,105,147 | |
Sweden - 1.1% | | | | | |
Swedish Match | | | | 162,069 | | 6,704,403 | |
10
| | | | | | | | |
| |
Description | | | | Shares | | Value ($) | |
Common Stocks - 97.2% (continued) | | | | | |
Switzerland - 7.7% | | | | | |
Julius Baer Group | | | | 158,332 | | 7,023,588 | |
Lonza Group | | | | 29,986 | | 10,146,826 | |
Novartis | | | | 240,870 | | 20,911,202 | |
OC Oerlikon | | | | 297,608 | | 2,986,894 | |
STMicroelectronics | | | | 418,308 | | 8,104,936 | |
| | | | | 49,173,446 | |
United Kingdom - 13.7% | | | | | |
Anglo American | | | | 348,620 | | 8,031,318 | |
BAE Systems | | | | 1,011,643 | | 7,088,673 | |
Bunzl | | | | 125,055 | | 3,269,498 | |
Cineworld Group | | | | 1,041,283 | | 2,918,583 | |
Diageo | | | | 315,097 | | 12,893,822 | |
Ferguson | | | | 99,967 | | 7,303,637 | |
GlaxoSmithKline | | | | 563,694 | | 12,066,207 | |
Legal & General Group | | | | 3,412,311 | | 10,418,980 | |
Melrose Industries | | | | 1,324,936 | | 3,282,291 | |
Tesco | | | | 2,178,266 | | 6,459,448 | |
Unilever | | | | 232,032 | | 13,951,718 | |
| | | | | 87,684,175 | |
Total Common Stocks(cost $609,842,587) | | | | 621,105,864 | |
| | | | | | | | |
Exchange-Traded Funds - 1.4% | | | | | |
United States - 1.4% | | | | | |
iShares MSCI EAFE ETF
(cost $8,682,139) | | | | 133,315 | b | 8,693,471 | |
| | | 1-Day
Yield (%) | | | | | |
Investment Companies - .5% | | | | | |
Registered Investment Companies - .5% | | | | | |
Dreyfus Institutional Preferred Government Plus Money Market Fund
(cost $3,495,318) | | 1.89 | | 3,495,318 | c | 3,495,318 | |
Total Investments(cost $622,020,044) | | 99.1% | | 633,294,653 | |
Cash and Receivables (Net) | | .9% | | 6,027,026 | |
Net Assets | | 100.0% | | 639,321,679 | |
ETF—Exchange-Traded Fund
a Non-income producing security.
b Security, or portion thereof, on loan. At September 30, 2019, the value of the fund’s securities on loan was $2,406,249 and the value of the collateral was $2,446,050, consisting of U.S. Government & Agency securities.
c Investment in affiliated issuer. The investment objective of this investment company is publicly available and can be found within the investment company’s prospectus.
11
STATEMENT OF INVESTMENTS (continued)
| | |
Portfolio Summary (Unaudited)† | Value (%) |
Pharmaceuticals Biotechnology & Life Sciences | 13.1 |
Capital Goods | 10.7 |
Banks | 6.3 |
Insurance | 6.3 |
Utilities | 5.2 |
Materials | 5.1 |
Food, Beverage & Tobacco | 5.0 |
Diversified Financials | 4.9 |
Energy | 4.8 |
Consumer Durables & Apparel | 4.8 |
Automobiles & Components | 3.8 |
Food & Staples Retailing | 3.7 |
Household & Personal Products | 3.6 |
Software & Services | 3.6 |
Technology Hardware & Equipment | 2.9 |
Commercial & Professional Services | 2.3 |
Telecommunication Services | 2.3 |
Transportation | 2.1 |
Real Estate | 2.1 |
Investment Companies | 1.9 |
Consumer Services | 1.5 |
Retailing | 1.3 |
Semiconductors & Semiconductor Equipment | 1.3 |
Media & Entertainment | .5 |
| | 99.1 |
† Based on net assets.
See notes to financial statements.
12
STATEMENT OF INVESTMENTS IN AFFILIATED ISSUERS
| | | | | | | |
Investment Companies | Value
9/30/18($) | Purchases($) | Sales ($) | Value
9/30/19($) | Net
Assets(%) | Dividends/
Distributions($) |
Registered Investment
Companies; | | | | |
Dreyfus Institutional Preferred Government Plus Money Market Fund | 7,325,498 | 174,395,155 | 178,225,335 | 3,495,318 | .5 | 90,806 |
Investment
of Cash
Collateral
for Securities
Loaned; | | |
Dreyfus Institutional Preferred Government Plus Money Market Fund | - | 21,394,885 | 21,394,885 | - | - | - |
Total | 7,325,498 | 195,790,040 | 199,620,220 | 3,495,318 | .5 | 90,806 |
See notes to financial statements.
13
STATEMENT OF ASSETS AND LIABILITIES
September 30, 2019
| | | | | | | |
| | | | | | |
| | | Cost | | Value | |
Assets ($): | | | | |
Investments in securities—See Statement of Investments
(including securities on loan, valued at $2,406,249)—Note 1(c): | | | |
Unaffiliated issuers | 618,524,726 | | 629,799,335 | |
Affiliated issuers | | 3,495,318 | | 3,495,318 | |
Cash denominated in foreign currency | | | 2,886,837 | | 2,843,346 | |
Tax reclaim receivable | | 1,898,897 | |
Dividends, interest and securities lending income receivable | | 1,797,253 | |
Receivable for shares of Beneficial Interest subscribed | | 423,312 | |
Prepaid expenses | | | | | 36,969 | |
| | | | | 640,294,430 | |
Liabilities ($): | | | | |
Due to Mellon Investments Corporation and affiliates—Note 3(c) | | 413,299 | |
Payable for shares of Beneficial Interest redeemed | | 332,908 | |
Trustees fees and expenses payable | | 9,442 | |
Other accrued expenses | | | | | 217,102 | |
| | | | | 972,751 | |
Net Assets ($) | | | 639,321,679 | |
Composition of Net Assets ($): | | | | |
Paid-in capital | | | | | 662,107,224 | |
Total distributable earnings (loss) | | | | | (22,785,545) | |
Net Assets ($) | | | 639,321,679 | |
| | | | | | |
Net Asset Value Per Share | Class A | Class C | Class I | Class Y | |
Net Assets ($) | 100,661,111 | 4,829,407 | 178,309,779 | 355,521,382 | |
Shares Outstanding | 2,720,967 | 129,216 | 4,733,779 | 9,443,566 | |
Net Asset Value Per Share ($) | 36.99 | 37.37 | 37.67 | 37.65 | |
| | | | | |
See notes to financial statements. | | | | | |
14
STATEMENT OF OPERATIONS
Year Ended September 30, 2019
| | | | | | | |
| | | | | | |
| | | | | | |
Investment Income ($): | | | | |
Income: | | | | |
Cash dividends (net of $2,088,715 foreign taxes withheld at source): | |
Unaffiliated issuers | | | 23,413,913 | |
Affiliated issuers | | | 90,806 | |
Income from securities lending—Note 1(c) | | | 2,477 | |
Total Income | | | 23,507,196 | |
Expenses: | | | | |
Investment advisory fee—Note 3(a) | | | 5,187,049 | |
Shareholder servicing costs—Note 3(c) | | | 1,160,843 | |
Administration fee—Note 3(a) | | | 658,273 | |
Custodian fees—Note 3(c) | | | 119,157 | |
Professional fees | | | 100,054 | |
Registration fees | | | 87,386 | |
Trustees’ fees and expenses—Note 3(d) | | | 74,836 | |
Distribution fees—Note 3(b) | | | 42,483 | |
Prospectus and shareholders’ reports | | | 25,135 | |
Loan commitment fees—Note 2 | | | 15,332 | |
Interest expense—Note 2 | | | 7,849 | |
Miscellaneous | | | 46,756 | |
Total Expenses | | | 7,525,153 | |
Less—reduction in expenses due to undertaking—Note 3(a) | | | (1,537,977) | |
Net Expenses | | | 5,987,176 | |
Investment Income—Net | | | 17,520,020 | |
Realized and Unrealized Gain (Loss) on Investments—Note 4 ($): | | |
Net realized gain (loss) on investments and foreign currency transactions | (13,303,029) | |
Net realized gain (loss) on forward foreign currency exchange contracts | 71,329 | |
Net Realized Gain (Loss) | | | (13,231,700) | |
Net change in unrealized appreciation (depreciation) on investments
and foreign currency transactions | (43,735,389) | |
Net Realized and Unrealized Gain (Loss) on Investments | | | (56,967,089) | |
Net (Decrease) in Net Assets Resulting from Operations | | (39,447,069) | |
| | | | | | |
See notes to financial statements. | | | | | |
15
STATEMENT OF CHANGES IN NET ASSETS
| | | | | | | | | | |
| | | | Year Ended September 30, |
| | | | 2019 | | 2018 | |
Operations ($): | | | | | | | | |
Investment income—net | | | 17,520,020 | | | | 13,377,889 | |
Net realized gain (loss) on investments | | (13,231,700) | | | | 39,003,005 | |
Net change in unrealized appreciation
(depreciation) on investments | | (43,735,389) | | | | (34,470,113) | |
Net Increase (Decrease) in Net Assets
Resulting from Operations | (39,447,069) | | | | 17,910,781 | |
Distributions ($): | |
Distributions to shareholders: | | | | | | | | |
Class A | | | (2,258,427) | | | | (2,391,883) | |
Class C | | | (54,880) | | | | (32,954) | |
Class I | | | (3,729,763) | | | | (3,179,056) | |
Class Y | | | (7,106,468) | | | | (5,996,138) | |
Total Distributions | | | (13,149,538) | | | | (11,600,031) | |
Beneficial Interest Transactions ($): | |
Net proceeds from shares sold: | | | | | | | | |
Class A | | | 26,393,594 | | | | 38,361,884 | |
Class C | | | 176,236 | | | | 1,110,468 | |
Class I | | | 100,323,134 | | | | 108,995,123 | |
Class Y | | | 24,970,840 | | | | 40,070,573 | |
Distributions reinvested: | | | | | | | | |
Class A | | | 1,472,407 | | | | 1,415,328 | |
Class C | | | 43,255 | | | | 24,371 | |
Class I | | | 3,307,036 | | | | 2,656,559 | |
Class Y | | | 7,106,218 | | | | 5,996,120 | |
Cost of shares redeemed: | | | | | | | | |
Class A | | | (50,065,665) | | | | (62,206,726) | |
Class C | | | (2,153,873) | | | | (6,008,129) | |
Class I | | | (132,380,572) | | | | (76,943,896) | |
Class Y | | | (32,091,978) | | | | (18,542,894) | |
Increase (Decrease) in Net Assets
from Beneficial Interest Transactions | (52,899,368) | | | | 34,928,781 | |
Total Increase (Decrease) in Net Assets | (105,495,975) | | | | 41,239,531 | |
Net Assets ($): | |
Beginning of Period | | | 744,817,654 | | | | 703,578,123 | |
End of Period | | | 639,321,679 | | | | 744,817,654 | |
16
| | | | | | | | | | |
| | | | Year Ended September 30, |
| | | | 2019 | | 2018 | |
Capital Share Transactions (Shares): | |
Class Aa | | | | | | | | |
Shares sold | | | 736,764 | | | | 950,497 | |
Shares issued for distributions reinvested | | | 45,055 | | | | 35,059 | |
Shares redeemed | | | (1,377,849) | | | | (1,544,851) | |
Net Increase (Decrease) in Shares Outstanding | (596,030) | | | | (559,295) | |
Class Ca | | | | | | | | |
Shares sold | | | 4,782 | | | | 27,198 | |
Shares issued for distributions reinvested | | | 1,303 | | | | 596 | |
Shares redeemed | | | (58,687) | | | | (148,383) | |
Net Increase (Decrease) in Shares Outstanding | (52,602) | | | | (120,589) | |
Class Ia | | | | | | | | |
Shares sold | | | 2,733,263 | | | | 2,658,507 | |
Shares issued for distributions reinvested | | | 99,579 | | | | 64,826 | |
Shares redeemed | | | (3,616,748) | | | | (1,880,362) | |
Net Increase (Decrease) in Shares Outstanding | (783,906) | | | | 842,971 | |
Class Y | | | | | | | | |
Shares sold | | | 702,348 | | | | 975,559 | |
Shares issued for distributions reinvested | | | 214,107 | | | | 146,390 | |
Shares redeemed | | | (890,664) | | | | (454,292) | |
Net Increase (Decrease) in Shares Outstanding | 25,791 | | | | 667,657 | |
| | | | | | | | | |
aDuring the period ended September 30, 2019, 600 Class A shares representing $22,160 were exchanged for 590 Class I shares and 278 Class C shares representing $10,124 were automatically converted to 281 Class A shares and during the period ended September 30, 2018, 104 Class A shares representing $4,014 were exchanged for 102 Class I shares and 6,902 Class C shares representing $279,214 were automatically converted to 6,913 Class A shares. | |
See notes to financial statements. | | | | | | | | |
17
FINANCIAL HIGHLIGHTS
The following tables describe the performance for each share class for the fiscal periods indicated. All information (except portfolio turnover rate) reflects financial results for a single fund share. Total return shows how much your investment in the fund would have increased (or decreased) during each period, assuming you had reinvested all dividends and distributions. These figures have been derived from the fund’s financial statements.
| | | | | | | | | | |
| | | | |
| | | | |
| | | |
Class A Shares | | Year Ended September 30, |
| | 2019 | 2018 | 2017 | 2016 | 2015 |
Per Share Data ($): | | | | | | |
Net asset value, beginning of period | | 39.86 | 39.51 | 33.37 | 32.37 | 35.69 |
Investment Operations: | | | | | | |
Investment income—neta | | .89 | .63 | .52 | .58 | .39 |
Net realized and unrealized
gain (loss) on investments | | (3.06) | .34 | 6.18 | .74 | (3.23) |
Total from Investment Operations | | (2.17) | .97 | 6.70 | 1.32 | (2.84) |
Distributions: | | | | | | |
Dividends from
investment income—net | | (.70) | (.62) | (.56) | (.32) | (.48) |
Net asset value, end of period | | 36.99 | 39.86 | 39.51 | 33.37 | 32.37 |
Total Return (%)b | | (5.22) | 2.44 | 20.47 | 4.06 | (8.01) |
Ratios/Supplemental Data (%): | | | | | | |
Ratio of total expenses
to average net assets | | 1.64 | 1.56 | 1.64 | 1.59 | 1.37 |
Ratio of net expenses
to average net assets | | 1.12 | 1.12 | 1.12 | 1.12 | 1.12 |
Ratio of net investment income
to average net assets | | 2.45 | 1.55 | 1.50 | 1.79 | 1.12 |
Portfolio Turnover Rate | | 63.16 | 54.84 | 90.15 | 79.90 | 87.33 |
Net Assets,
end of period ($ x 1,000) | | 100,661 | 132,208 | 153,146 | 156,949 | 77,052 |
a Based on average shares outstanding.
b Exclusive of sales charge.
See notes to financial statements.
18
| | | | | | | | | |
| | | | |
| | | |
Class C Shares | | Year Ended September 30, |
| | 2019 | 2018 | 2017 | 2016 | 2015 |
Per Share Data ($): | | | | | | |
Net asset value, beginning of period | | 40.13 | 39.63 | 33.43 | 32.46 | 35.79 |
Investment Operations: | | | | | | |
Investment income—neta | | .57 | .25 | .26 | .31 | .14 |
Net realized and unrealized
gain (loss) on investments | | (3.00) | .40 | 6.20 | .75 | (3.25) |
Total from Investment Operations | | (2.43) | .65 | 6.46 | 1.06 | (3.11) |
Distributions: | | | | | | |
Dividends from
investment income—net | | (.33) | (.15) | (.26) | (.09) | (.22) |
Net asset value, end of period | | 37.37 | 40.13 | 39.63 | 33.43 | 32.46 |
Total Return (%)b | | (5.94) | 1.63 | 19.52 | 3.27 | (8.73) |
Ratios/Supplemental Data (%): | | | | | | |
Ratio of total expenses
to average net assets | | 2.11 | 2.06 | 2.13 | 2.16 | 2.14 |
Ratio of net expenses
to average net assets | | 1.90 | 1.90 | 1.90 | 1.90 | 1.90 |
Ratio of net investment income
to average net assets | | 1.55 | .63 | .75 | .95 | .39 |
Portfolio Turnover Rate | | 63.16 | 54.84 | 90.15 | 79.90 | 87.33 |
Net Assets, end of period ($ x 1,000) | | 4,829 | 7,297 | 11,985 | 15,582 | 11,079 |
a Based on average shares outstanding.
b Exclusive of sales charge.
See notes to financial statements.
19
FINANCIAL HIGHLIGHTS (continued)
| | | | | | | | | | |
| | | | |
| | | |
Class I Shares | | Year Ended September 30, |
| | 2019 | 2018 | 2017 | 2016 | 2015 |
Per Share Data ($): | | | | | | |
Net asset value, beginning of period | | 40.54 | 40.12 | 33.82 | 32.74 | 36.03 |
Investment Operations: | | | | | | |
Investment income—neta | | 1.01 | .78 | .67 | .66 | .56 |
Net realized and unrealized
gain (loss) on investments | | (3.11) | .32 | 6.22 | .77 | (3.34) |
Total from Investment Operations | | (2.10) | 1.10 | 6.89 | 1.43 | (2.78) |
Distributions: | | | | | | |
Dividends from
investment income—net | | (.77) | (.68) | (.59) | (.35) | (.51) |
Net asset value, end of period | | 37.67 | 40.54 | 40.12 | 33.82 | 32.74 |
Total Return (%) | | (4.94) | 2.71 | 20.80 | 4.37 | (7.77) |
Ratios/Supplemental Data (%): | | | | | | |
Ratio of total expenses
to average net assets | | 1.15 | 1.10 | 1.19 | 1.18 | 1.03 |
Ratio of net expenses
to average net assets | | .85 | .85 | .85 | .85 | .85 |
Ratio of net investment income
to average net assets | | 2.75 | 1.91 | 1.89 | 1.99 | 1.57 |
Portfolio Turnover Rate | | 63.16 | 54.84 | 90.15 | 79.90 | 87.33 |
Net Assets,
end of period ($ x 1,000) | | 178,310 | 223,699 | 187,558 | 139,214 | 83,179 |
a Based on average shares outstanding.
See notes to financial statements.
20
| | | | | | | | | | |
| | | | | |
| | | |
Class Y Shares | | Year Ended September 30, |
| | 2019 | 2018 | 2017 | 2016 | 2015a |
Per Share Data ($): | | | | | | |
Net asset value, beginning of period | | 40.52 | 40.10 | 33.80 | 32.73 | 36.66 |
Investment Operations: | | | | | | |
Investment income—netb | | 1.00 | .76 | .67 | .62 | .10 |
Net realized and unrealized
gain (loss) on investments | | (3.10) | .34 | 6.22 | .80 | (4.03) |
Total from Investment Operations | | (2.10) | 1.10 | 6.89 | 1.42 | (3.93) |
Distributions: | | | | | | |
Dividends from
investment income—net | | (.77) | (.68) | (.59) | (.35) | − |
Net asset value, end of period | | 37.65 | 40.52 | 40.10 | 33.80 | 32.73 |
Total Return (%) | | (4.94) | 2.71 | 20.81 | 4.33 | (10.72)c |
Ratios/Supplemental Data (%): | | | | | | |
Ratio of total expenses
to average net assets | | .96 | .95 | .99 | 1.00 | 1.01d |
Ratio of net expenses
to average net assets | | .85 | .85 | .85 | .85 | .85d |
Ratio of net investment income
to average net assets | | 2.70 | 1.86 | 1.87 | 1.89 | .95d |
Portfolio Turnover Rate | | 63.16 | 54.84 | 90.15 | 79.90 | 87.33 |
Net Assets, end of period ($ x 1,000) | | 355,521 | 381,613 | 350,889 | 260,069 | 221,483 |
a From June 1, 2015 (commencement of initial offering) to September 30, 2015.
b Based on average shares outstanding.
c Not annualized.
d Annualized.
See notes to financial statements.
21
NOTES TO FINANCIAL STATEMENTS
NOTE 1—Significant Accounting Policies:
BNY Mellon International Core Equity Fund (the “fund”) is a separate diversified series of BNY Mellon Stock Funds (the “Company”), which is registered under the Investment Company Act of 1940, as amended (the “Act”), as an open-end management investment company and operates as a series company currently offering two series, including the fund. The fund’s investment objective is to seek long-term growth of capital. Effective January 2, 2019, BNY Mellon Asset Management North America Corporation was renamed Mellon Investments Corporation. Mellon Investments Corporation, a wholly-owned subsidiary of The Bank of New York Mellon Corporation (“BNY Mellon”), serves as the fund’s investment adviser. BNY Mellon Investment Adviser, Inc. (the “Administrator”), a wholly-owned subsidiary of BNY Mellon and an affiliate of Mellon Investments Corporation, serves as the fund’s Administrator.
Effective June 3, 2019, the fund changed its name from Dreyfus International Equity Fund to BNY Mellon International Core Equity Fund and the Company changed its name from Dreyfus Stock Funds to BNY Mellon Stock Funds. In addition, The Dreyfus Corporation, the fund’s Administrator, changed its name to “BNY Mellon Investment Adviser, Inc.”, MBSC Securities Corporation, the fund’s distributor, changed its name to “BNY Mellon Securities Corporation” and Dreyfus Transfer, Inc., the fund’s transfer agent, changed its name to “BNY Mellon Transfer, Inc.”
BNY Mellon Securities Corporation (the “Distributor”), a wholly-owned subsidiary of the Administrator, is the distributor of the fund’s shares. The fund is authorized to issue an unlimited number of $.001 par value shares of Beneficial Interest in each of the following classes of shares: Class A, Class C, Class I, Class T and Class Y. Class A and Class T shares generally are subject to a sales charge imposed at the time of purchase. Class C shares are subject to a contingent deferred sales charge (“CDSC”) imposed on Class C shares redeemed within one year of purchase. Class C shares automatically convert to Class A shares ten years after the date of purchase, without the imposition of a sales charge. Class I and Class Y shares are sold at net asset value per share generally to institutional investors. As of the date of this report, the fund did not offer Class T shares for purchase. Other differences between the classes include the services offered to and the expenses borne by each class, the allocation of certain transfer agency costs, and certain voting rights. Income, expenses
22
(other than expenses attributable to a specific class), and realized and unrealized gains or losses on investments are allocated to each class of shares based on its relative net assets.
The Company accounts separately for the assets, liabilities and operations of each series. Expenses directly attributable to each series are charged to that series’ operations; expenses which are applicable to all series are allocated among them on a pro rata basis.
The Financial Accounting Standards Board (“FASB”) Accounting Standards Codification (“ASC”) is the exclusive reference of authoritative U.S. generally accepted accounting principles (“GAAP”) recognized by the FASB to be applied by nongovernmental entities. Rules and interpretive releases of the Securities and Exchange Commission (“SEC”) under authority of federal laws are also sources of authoritative GAAP for SEC registrants. The fund is an investment company and applies the accounting and reporting guidance of the FASB ASC Topic 946 Financial Services-Investment Companies. The fund’s financial statements are prepared in accordance with GAAP, which may require the use of management estimates and assumptions. Actual results could differ from those estimates.
The Companyenters into contracts that contain a variety of indemnifications. The fund’s maximum exposure under these arrangements is unknown. The fund does not anticipate recognizing any loss related to these arrangements.
(a) Portfolio valuation: The fair value of a financial instrument is the amount that would be received to sell an asset or paid to transfer a liability in an orderly transaction between market participants at the measurement date (i.e., the exit price). GAAP establishes a fair value hierarchy that prioritizes the inputs of valuation techniques used to measure fair value. This hierarchy gives the highest priority to unadjusted quoted prices in active markets for identical assets or liabilities (Level 1 measurements) and the lowest priority to unobservable inputs (Level 3 measurements).
Additionally, GAAP provides guidance on determining whether the volume and activity in a market has decreased significantly and whether such a decrease in activity results in transactions that are not orderly. GAAP requires enhanced disclosures around valuation inputs and techniques used during annual and interim periods.
Various inputs are used in determining the value of the fund’s investments relating to fair value measurements. These inputs are summarized in the three broad levels listed below:
23
NOTES TO FINANCIAL STATEMENTS(continued)
Level 1—unadjusted quoted prices in active markets for identical investments.
Level 2—other significant observable inputs (including quoted prices for similar investments, interest rates, prepayment speeds, credit risk, etc.).
Level 3—significant unobservable inputs (including the fund’s own assumptions in determining the fair value of investments).
The inputs or methodology used for valuing securities are not necessarily an indication of the risk associated with investing in those securities.
Changes in valuation techniques may result in transfers in or out of an assigned level within the disclosure hierarchy. Valuation techniques used to value the fund’s investments are as follows:
Investments in securities are valued at the last sales price on the securities exchange or national securities market on which such securities are primarily traded. Securities listed on the National Market System for which market quotations are available are valued at the official closing price or, if there is no official closing price that day, at the last sales price. For open short positions, asked prices are used for valuation purposes. Bid price is used when no asked price is available. Registered investment companies that are not traded on an exchange are valued at their net asset value. All of the preceding securities are generally categorized within Level 1 of the fair value hierarchy.
Securities not listed on an exchange or the national securities market, or securities for which there were no transactions, are valued at the average of the most recent bid and asked prices. These securities are generally categorized within Level 2 of the fair value hierarchy.
Fair valuing of securities may be determined with the assistance of a pricing service using calculations based on indices of domestic securities and other appropriate indicators, such as prices of relevant American Depository Receipts and futures. Utilizing these techniques may result in transfers between Level 1 and Level 2 of the fair value hierarchy.
When market quotations or official closing prices are not readily available, or are determined not to accurately reflect fair value, such as when the value of a security has been significantly affected by events after the close of the exchange or market on which the security is principally traded (for example, a foreign exchange or market), but before the fund calculates its net asset value, the fund may value these investments at fair value as determined in accordance with the procedures approved by the Company’s Board of Trustees (the “Board”). Certain factors may be considered when
24
fair valuing investments such as: fundamental analytical data, the nature and duration of restrictions on disposition, an evaluation of the forces that influence the market in which the securities are purchased and sold, and public trading in similar securities of the issuer or comparable issuers. These securities are either categorized within Level 2 or 3 of the fair value hierarchy depending on the relevant inputs used.
For restricted securities where observable inputs are limited, assumptions about market activity and risk are used and such securities are generally categorized within Level 3 of the fair value hierarchy.
Investments denominated in foreign currencies are translated to U.S. dollars at the prevailing rates of exchange.
The following is a summary of the inputs used as of September 30, 2019in valuing the fund’s investments:
| | | | | | |
| | Level 1- Unadjusted Quoted Prices | Level 2 - Other Significant Observable Inputs | | Level 3- Significant Unobservable Inputs | Total |
Assets ($) | | | |
Investments in Securities: † | | | |
Equity Securities -
Common Stocks | 5,110,193 | 615,995,671 | †† | - | 621,105,864 |
Exchange-Traded Funds | 8,693,471 | - | | - | 8,693,471 |
Investment Companies | 3,495,318 | - | | - | 3,495,318 |
† See Statement of Investments for additional detailed categorizations, if any.
†† Securities classified within Level 2 at period end as the values were determined pursuant to the fund’s fair valuation procedures.
(b) Foreign currency transactions: The fund does not isolate that portion of the results of operations resulting from changes in foreign exchange rates on investments from the fluctuations arising from changes in the market prices of securities held. Such fluctuations are included with the net realized and unrealized gain or loss on investments.
Net realized foreign exchange gains or losses arise from sales of foreign currencies, currency gains or losses realized on securities transactions between trade and settlement date, and the difference between the amounts of dividends, interest and foreign withholding taxes recorded on the fund’s books and the U.S. dollar equivalent of the amounts actually received or paid. Net unrealized foreign exchange gains and losses arise from changes in the value of assets and liabilities other than investments resulting from changes in exchange rates. Foreign currency gains and losses on foreign currency transactions are also included with net realized and unrealized gain or loss on investments.
25
NOTES TO FINANCIAL STATEMENTS(continued)
(c)Securities transactions and investment income: Securities transactions are recorded on a trade date basis. Realized gains and losses from securities transactions are recorded on the identified cost basis. Dividend income is recognized on the ex-dividend date and interest income, including, where applicable, accretion of discount and amortization of premium on investments, is recognized on the accrual basis.
Pursuant to a securities lending agreement with The Bank of New York Mellon, a subsidiary of BNY Mellon and an affiliate of the Administrator, the fund may lend securities to qualified institutions. It is the fund’s policy that, at origination, all loans are secured by collateral of at least 102% of the value of U.S. securities loaned and 105% of the value of foreign securities loaned. Collateral equivalent to at least 100% of the market value of securities on loan is maintained at all times. Collateral is either in the form of cash, which can be invested in certain money market mutual funds managed by the Administrator, or U.S. Government and Agency securities. The fund is entitled to receive all dividends, interest and distributions on securities loaned, in addition to income earned as a result of the lending transaction. Should a borrower fail to return the securities in a timely manner, The Bank of New York Mellon is required to replace the securities for the benefit of the fund or credit the fund with the market value of the unreturned securities and is subrogated to the fund’s rights against the borrower and the collateral. Additionally, the contractual maturity of security lending transactions are on an overnight and continuous basis. During the period ended September 30, 2019, The Bank of New York Mellon earned $456 from the lending of the fund’s portfolio securities, pursuant to the securities lending agreement.
(d) Affiliated issuers: Investments in other investment companies advised by the Administrator are considered “affiliated” under the Act.
Certain affiliated investment companies may also invest in the fund. At September 30, 2019, BNY Mellon Diversified International Fund, an affiliate of the fund, held 8,613,798 Class Y shares representing approximately 51% of the fund’s net assets.
(e) Risk: Investing in foreign markets may involve special risks and considerations not typically associated with investing in the U.S. These risks include revaluation of currencies, high rates of inflation, repatriation restrictions on income and capital, and adverse political and economic developments. Moreover, securities issued in these markets may be less liquid, subject to government ownership controls and delayed settlements, and their prices may be more volatile than those of comparable securities in the U.S.
26
(f) Dividends and distributions to shareholders: Dividends and distributions are recorded on the ex-dividend date. Dividends from investment income-net and dividends from net realized capital gains, if any, are normally declared and paid annually, but the fund may make distributions on a more frequent basis to comply with the distribution requirements of the Internal Revenue Code of 1986, as amended (the “Code”). To the extent that net realized capital gains can be offset by capital loss carryovers, it is the policy of the fund not to distribute such gains. Income and capital gain distributions are determined in accordance with income tax regulations, which may differ from GAAP.
(g) Federal income taxes: It is the policy of the fund to continue to qualify as a regulated investment company, if such qualification is in the best interests of its shareholders, by complying with the applicable provisions of the Code, and to make distributions of taxable income and net realized capital gain sufficient to relieve it from substantially all federal income and excise taxes.
As of and during the period ended September 30, 2019, the fund did not have any liabilities for any uncertain tax positions. The fund recognizes interest and penalties, if any, related to uncertain tax positions as income tax expense in the Statement of Operations. During the period ended September 30, 2019, the fund did not incur any interest or penalties.
Each tax year in the four-year period ended September 30, 2019 remains subject to examination by the Internal Revenue Service and state taxing authorities.
At September 30, 2019, the components of accumulated earnings on a tax basis were as follows: undistributed ordinary income $17,191,229, accumulated capital losses $50,748,801 and unrealized appreciation $10,772,027.
The fund is permitted to carry forward capital losses for an unlimited period. Furthermore, capital loss carryovers retain their character as either short-term or long-term capital losses.
The accumulated capital loss carryover is available for federal income tax purposes to be applied against future netrealized capital gains, if any, realized subsequent to September 30, 2019. The fund has $15,694,787 of short-term capital losses and $35,054,014 of long-term capital losses which can be carried forward for an unlimited period.
As a result of the fund’s merger with Dreyfus International Value Fund, capital losses of $36,277,602 are available to offset future realized gains, if any. Based on certain provisions in the Code, the amount of losses which
27
NOTES TO FINANCIAL STATEMENTS(continued)
can be utilized in subsequent years is subject to an annual limitation. The acquired fund had these capital losses which can be carried forward for an unlimited period but are also subject to an annual limitation.
The tax character of distributions paid to shareholders during the fiscal periods ended September 30, 2019 and September 30, 2018 were as follows: ordinary income $13,149,538 and $11,600,031, respectively.
During the period ended September 30, 2019, as a result of permanent book to tax differences, primarily due to the tax treatment for capital loss carryover expiration, the fund increased total distributable earnings (loss) by $688,080 and decreased paid-in capital by the same amount. Net assets and net asset value per share were not affected by this reclassification.
(h) New Accounting Pronouncements: Effective June 1, 2019, the fund adopted Accounting Standards Update 2018-13, Fair Value Measurement (Topic 820): Disclosure Framework—Changes to the Disclosure Requirements for Fair Value Measurement (“ASU 2018-13”). The update provides guidance that eliminates, adds and modifies certain disclosure requirements for fair value measurements. The adoption of ASU 2018-13 had no impact on the operations of the fund for the period ended September 30, 2019.
NOTE 2—Bank Lines of Credit:
The fund participates with other long-term open-end funds managed by the Administrator in a $1.030 billion unsecured credit facility led by Citibank, N.A. (the “Citibank Credit Facility”) and a $300 million unsecured credit facility provided by The Bank of New York Mellon (the “BNYM Credit Facility”), each to be utilized primarily for temporary or emergency purposes, including the financing of redemptions (each, a “Facility”). The Citibank Credit Facility is available in two tranches: (i) Tranche A is in an amount equal to $830 million and is available to all long-term open-ended funds, including the fund, and (ii) Tranche B is in amount equal to $200 million and is available only to BNY Mellon Floating Rate Income Fund, a series of BNY Mellon Investment Funds IV, Inc. Prior to October 3, 2018, the unsecured credit facility with Citibank, N.A. was $830 million. In connection therewith, the fund has agreed to pay its pro rata portion of commitment fees for Tranche A of the Citibank Credit Facility and the BNYM Credit Facility. Interest is charged to the fund based on rates determined pursuant to the terms of the respective Facility at the time of borrowing.
The average amount of borrowings outstanding under the Facilities during the period ended September 30, 2019 was approximately $237,000 with a related weighted average annualized interest rate of 3.31%.
28
NOTE 3—Investment Advisory Fee, Administration Fee and Other Transactions with Affiliates:
(a)Pursuant to an investment advisory agreement with Mellon Investments Corporation, the investment advisory fee is computed at the annual rate of .80% of the value of the fund’s average daily net assets up to $500 million, .75% of the next $500 million of such assets, .70% of the next $500 million of such assets, .60% of the next $500 million of such assets and .50% of the fund’s average daily net assets in excess of $2 billion and is payable monthly. The investment advisory fee rate during the period ended September 30, 2019 was .79%.
The Administrator and Mellon Investments Corporation have contractually agreed to waive receipt of their fees and/or assume the direct expenses of the fund, so that such expenses (excluding taxes, interest expense, brokerage commissions, commitment fees on borrowings and extraordinary expenses) do not exceed an annual rate of 1.12% for Class A shares, 1.90% for Class C shares, .85% for Class I shares and .85% for Class Y shares of the value of the respective class’ average daily net assets. With respect to Class A, Class C and Class I shares, this agreement will continue in effect, with respect to each class, until the fiscal year end following such time as the expenses are equal to or less than such annual rate for the applicable class. With respect to Class Y shares, this agreement will continue until February 1, 2020, after which the expense limitation can be terminated at any time. The reduction in expenses, pursuant to the undertaking, amounted to $1,537,977 during the period ended September 30, 2019.
The fund compensates the Administrator under an administration agreement for providing personnel and facilities to perform accounting and administration services for the fund at an annual rate of .10% of the value of the fund’s average daily net assets. Pursuant to the administration agreement, the fund was charged $658,273 during the period ended September 30, 2019.
During the period ended September 30, 2019, the Distributor retained $828 from commissions earned on sales of the fund’s Class A shares and $328 from CDSC fees on redemptions of the fund’s Class C shares.
(b) Under the Distribution Plan adopted pursuant to Rule 12b-1 under the Act, Class C shares pay the Distributor for distributing its shares at an annual rate of .75% of the value of its average daily net assets. During the period ended September 30, 2019, Class C shares were charged $42,483 pursuant to the Distribution Plan.
29
NOTES TO FINANCIAL STATEMENTS(continued)
(c)Under the Shareholder Services Plan, Class A and Class C shares pay the Distributor at an annual rate of .25% of the value of their average daily net assets for the provision of certain services. The services provided may include personal services relating to shareholder accounts, such as answering shareholder inquiries regarding the fund and providing reports and other information, and services related to the maintenance of shareholder accounts. The Distributor may make payments to Service Agents (securities dealers, financial institutions or other industry professionals) with respect to these services. The Distributor determines the amounts to be paid to Service Agents. During the period ended September 30, 2019, Class A and Class C shares were charged $286,404and $14,161, respectively, pursuant to the Shareholder Services Plan.
The fund has an arrangement with the transfer agent whereby the fund may receive earnings credits when positive cash balances are maintained, which are used to offset transfer agency fees. The fund had an arrangement with the custodian to receive earnings credits when positive cash balances were maintained, which were used to offset custody fees. Effective February 1, 2019, the arrangement with the custodian changed whereby the fund will no longer receive earnings credits to offset its custody fees and will receive interest income or overdraft fees going forward. For financial reporting purposes, the fund includes net earnings credits, if any, as an expense offset in the Statement of Operations.
The fund compensates BNY Mellon Transfer, Inc., a wholly-owned subsidiary of the Administrator, under a transfer agency agreement for providing transfer agency and cash management services for the fund. The majority of transfer agency fees are comprised of amounts paid on a per account basis, while cash management fees are related to fund subscriptions and redemptions. During the period ended September 30, 2019, the fund was charged $36,723 for transfer agency services. These fees are included in Shareholder servicing costs in the Statement of Operations.
The fund compensates The Bank of New York Mellon under a custody agreement for providing custodial services for the fund. These fees are determined based on net assets, geographic region and transaction activity. During the period ended September 30, 2019, the fund was charged $119,157 pursuant to the custody agreement.
During the period ended September 30, 2019, the fund was charged $11,614 for services performed by the Chief Compliance Officer and his staff. These fees are included in Miscellaneous in the Statement of Operations.
30
The components of “Due to Mellon Investments Corporation and affiliates” in the Statement of Assets and Liabilities consist of: investment advisory fees $415,948, administration fees $52,720, Distribution Plan fees $2,994, Shareholder Services Plan fees $21,978, custodian fees $53,675, Chief Compliance Officer fees $3,378 and transfer agency fees $6,920, which are offset against an expense reimbursement currently in effect in the amount of $144,314.
(d) Each Board member also serves as a Board member of other funds in the BNY Mellon Family of Funds complex. Annual retainer fees and attendance fees are allocated to each fund based on net assets.
NOTE 4—Securities Transactions:
The aggregate amount of purchases and sales of investment securities, excluding short-term securities and forward contracts, during the period ended September 30, 2019, amounted to $411,260,845 and $458,399,738, respectively.
Derivatives: A derivative is a financial instrument whose performance is derived from the performance of another asset. The fund enters into International Swaps and Derivatives Association, Inc. Master Agreements or similar agreements (collectively, “Master Agreements”) with its over-the-counter (“OTC”) derivative contract counterparties in order to, among other things, reduce its credit risk to counterparties. Master Agreements include provisions for general obligations, representations, collateral and events of default or termination. Under a Master Agreement, the fund may offset with the counterparty certain derivative financial instruments’ payables and/or receivables with collateral held and/or posted and create one single net payment in the event of default or termination.
Each type of derivative instrument that was held by the fund during the period ended September 30, 2019 is discussed below.
Forward Foreign Currency Exchange Contracts: The fund enters into forward contracts in order to hedge its exposure to changes in foreign currency exchange rates on its foreign portfolio holdings, to settle foreign currency transactions or as a part of its investment strategy. When executing forward contracts, the fund is obligated to buy or sell a foreign currency at a specified rate on a certain date in the future. With respect to sales of forward contracts, the fund incurs a loss if the value of the contract increases between the date the forward contract is opened and the date the forward contract is closed. The fund realizes a gain if the value of the contract decreases between those dates. With respect to purchases of forward contracts, the fund incurs a loss if the value of the contract decreases between the date the forward contract is opened and the date the
31
NOTES TO FINANCIAL STATEMENTS(continued)
forward contract is closed. The fund realizes a gain if the value of the contract increases between those dates. Any realized or unrealized gains or losses which occurred during the period are reflected in the Statement of Operations. The fund is exposed to foreign currency risk as a result of changes in value of underlying financial instruments. The fund is also exposed to credit risk associated with counterparty nonperformance on these forward contracts, which is generally limited to the unrealized gain on each open contract. This risk may be mitigated by Master Agreements, if any, between the fund and the counterparty and the posting of collateral, if any, by the counterparty to the fund to cover the fund’s exposure to the counterparty. At September 30, 2019, there were no forward contracts outstanding.
The following summarizes the average market value of derivatives outstanding duringthe period ended September 30, 2019:
| | | |
| | Average Market Value ($) |
Forward contracts | | 771,091 |
| | |
At September 30, 2019, the cost of investments for federal income tax purposes was $622,413,578; accordingly, accumulated net unrealized appreciation on investments was $10,881,075, consisting of $49,501,039 gross unrealized appreciation and $38,619,964 gross unrealized depreciation.
32
REPORT OF INDEPENDENT REGISTERED PUBLIC ACCOUNTING FIRM
To the Shareholders and the Board of Trustees of BNY Mellon International Core Equity Fund (formerly, Dreyfus International Equity Fund)
Opinion on the Financial Statements
We have audited the accompanying statement of assets and liabilities of BNY Mellon International Core Equity Fund (the “Fund”) (formerly, Dreyfus International Equity Fund) (one of the funds constituting BNY Mellon Stock Funds), including the statements of investments and investments in affiliated issuers, as of September 30, 2019, and the related statement of operations for the year then ended, the statements of changes in net assets for each of the two years in the period then ended, the financial highlights for each of the five years in the period then ended and the related notes (collectively referred to as the “financial statements”). In our opinion, the financial statements present fairly, in all material respects, the financial position of the Fund (one of the funds constituting BNY Mellon Stock Funds) at September 30, 2019, the results of its operations for the year then ended, the changes in its net assets for each of the two years in the period then ended and its financial highlights for each of the five years in the period then ended, in conformity with U.S. generally accepted accounting principles.
Basis for Opinion
These financial statements are the responsibility of the Fund’s management. Our responsibility is to express an opinion on the Fund’s financial statements based on our audits. We are a public accounting firm registered with the Public Company Accounting Oversight Board (United States) (“PCAOB”) and are required to be independent with respect to the Fund in accordance with the U.S. federal securities laws and the applicable rules and regulations of the Securities and Exchange Commission and the PCAOB.
We conducted our audits in accordance with the standards of the PCAOB. Those standards require that we plan and perform the audit to obtain reasonable assurance about whether the financial statements are free of material misstatement, whether due to error or fraud. The Fund is not required to have, nor were we engaged to perform, an audit of the Fund’s internal control over financial reporting. As part of our audits, we are required to obtain an understanding of internal control over financial reporting, but not for the purpose of expressing an opinion on the effectiveness of the Fund’s internal control over financial reporting. Accordingly, we express no such opinion.
Our audits included performing procedures to assess the risks of material misstatement of the financial statements, whether due to error or fraud, and performing procedures that respond to those risks. Such procedures included examining, on a test basis, evidence regarding the amounts and disclosures in the financial statements. Our procedures included confirmation of securities owned as of September 30, 2019, by correspondence with the custodian and others or by other appropriate auditing procedures where replies from others were not received. Our audits also included evaluating the accounting principles used and significant estimates made by management, as well as evaluating the overall presentation of the financial statements. We believe that our audits provide a reasonable basis for our opinion.

We have served as the auditor of one or more investment companies in the BNY Mellon Family of Funds since at least 1957, but we are unable to determine the specific year.
New York, New York
November 26, 2019
33
IMPORTANT TAX INFORMATION(Unaudited)
In accordance with federal tax law, the fund elects to provide each shareholder with their portion of the fund’s foreign taxes paid and the income sourced from foreign countries. Accordingly, the fund hereby reports the following information regarding its fiscal year ended September 30, 2019:
- the total amount of taxes paid to foreign countries was $2,088,715.
- the total amount of income sourced from foreign countries was $25,323,511.
As required by federal tax law rules, shareholders will receive notification of their proportionate share of foreign taxes paid and foreign sourced income for the 2019 calendar year with Form 1099-DIV which will be mailed in early 2020. Also, certain dividends paid by the fund may be subject to a maximum tax rate of 15%, as provided for by the Jobs and Growth Tax Relief Reconciliation Act of 2003. Of the distributions paid during the fiscal year, $13,149,538 represents the maximum amount that may be considered qualified dividend income.
34
BOARD MEMBERS INFORMATION(Unaudited)
INDEPENDENT BOARD MEMBERS
Joseph S. DiMartino (76)
Chairman of the Board (2003)
Principal Occupation During Past 5 Years:
· Corporate Director and Trustee (1995-Present)
Other Public Company Board Memberships During Past 5 Years:
· CBIZ (formerly, Century Business Services, Inc.), a provider of outsourcing functions for small and medium size companies, Director (1997-Present)
No. of Portfolios for which Board Member Serves:120
———————
Joni Evans (77)
Board Member (2006)
Principal Occupation During Past 5 Years:
· Chief Executive Officer, www.wowOwow.com, an online community dedicated to women’s conversations and publications (2007-Present)
· Principal, Joni Evans Ltd. (publishing) (2006-Present)
No. of Portfolios for which Board Member Serves:20
———————
Joan Gulley (72)
Board Member (2017)
Principal Occupation During Past 5 Years:
· PNC Financial Services Group, Inc.(1993-2014), Executive Vice President and Chief Human Resources Officer and Executive Committee Member (2008-2014)
· Director, Nantucket Library (2015-Present)
No. of Portfolios for which Board Member Serves:50
———————
Ehud Houminer (79)
Board Member (2003)
Principal Occupation During Past 5 Years:
· Board of Overseers at the Columbia Business School, Columbia
University (1992-Present)
Trustee, Ben Gurion University (2012-2018)
No. of Portfolios for which Board Member Serves: 50
———————
35
BOARD MEMBERS INFORMATION (Unaudited) (continued)
INDEPENDENT BOARD MEMBERS (continued)
Alan H. Howard (60)
Board Member (2018)
Principal Occupation During Past 5 Years:
· Managing Partner of Heathcote Advisors LLC, a financial advisory services firm (2008 – Present)
· President of Dynatech/MPX Holdings LLC (2012 – 2019), a global supplier and service provider of military aircraft parts, including Board Member of two operating subsidiaries, Dynatech International LLC and Military Parts Exchange LLC (2012-2019); Chief Executive Officer of an operating subsidiary, Dynatech International LLC (2013 – 2019)
· Senior Advisor, Rossoff & Co., an independent investment banking firm (2013 – Present)
Other Public Company Board Memberships During Past 5 Years:
· Movado Group, Inc., a designer and manufacturer of watches, Director (1997-Present)
No. of Portfolios for which Board Member Serves:20
———————
Robin A. Melvin (56)
Board Member (2003)
Principal Occupation During Past 5 Years:
· Co-chairman, Mentor Illinois, a non-profit organization dedicated to increasing the quantity and quality of mentoring services in Illinois; (2014-Present; Board member (2013-Present)
No. of Portfolios for which Board Member Serves:97
———————
Burton N. Wallack (68)
Board Member (2006)
Principal Occupation During Past 5 Years:
President and Co-owner of Wallack Management Company, a real estate management company (1987-Present)
Mount Sinai Hospital Urology Board Member (2017-Present)
No. of Portfolios for which Board Member Serves:20
———————
Benaree Pratt Wiley (73)
Board Member (2003)
Principal Occupation During Past 5 Years:
· Principal, The Wiley Group, a firm specializing in strategy and business development (2005-Present)
Other Public Company Board Memberships During Past 5 Years:
· CBIZ (formerly, Century Business Services, Inc.), a provider of outsourcing functions for small and medium size companies, Director (2008-Present)
· Blue Cross Blue Shield of Massachusetts Director (2004-Present)
No. of Portfolios for which Board Member Serves: 76
———————
36
INTERESTED BOARD MEMBER
Gordon J. Davis (78)
Board Member (2006)
Principal Occupation During Past 5 Years:
· Partner in the law firm of Venable LLP (2012-Present)
Other Public Company Board Memberships During Past 5 Years:
· Consolidated Edison, Inc., a utility company, Director (1989-2014)
· The Phoenix Companies, Inc., a life insurance company, Director (2000-2014)
No. of Portfolios for which Board Member Serves:54
Gordon J. Davis is deemed to be an “interested person” (as defined under the Act) of the Company as a result of his affiliation with Venable LLP, which provides legal services to the Company.
———————
Once elected all Board Members serve for an indefinite term, but achieve Emeritus status upon reaching age 80. The address of the Board Members and Officers is c/o BNY Mellon Investment Adviser, Inc. 240 Greenwich Street, New York, New York 10286. Additional information about the Board Members is available in the fund’s Statement of Additional Information which can be obtained from the Adviser free of charge by calling this toll free number: 1-800-373-9387.
William Hodding Carter III, Emeritus Board Member
Hans C. Mautner, Emeritus Board Member
37
OFFICERS OF THE FUND(Unaudited)
RENEE LAROCHE-MORRIS, President since May 2019.
President and a director of BNY Mellon Investment Adviser, Inc. since January 2018. She is an officer of 63 investment companies (comprised of 120 portfolios) managed by the Administrator. She is 48 years old and has been an employee of BNY Mellon since 2003.
JAMES WINDELS, Treasurer since November 2001.
Director- BNY Mellon Fund Administration, and an officer of 64 investment companies (comprised of 143 portfolios) managed by the Administrator. He is 61 years old and has been an employee of the Administrator since April 1985.
BENNETT A. MACDOUGALL, Chief Legal Officer since October 2015.
Chief Legal Officer of the Adviser and Associate General Counsel and Managing Director of BNY Mellon since June 2015; Director and Associate General Counsel of Deutsche Bank – Asset & Wealth Management Division from June 2005 to June 2015, and as Chief Legal Officer of Deutsche Investment Management Americas Inc. from June 2012 to May 2015. He is an officer of 64 investment companies (comprised of 143 portfolios) managed by the Administrator. He is 48 years old and has been an employee of the Administrator since June 2015.
DAVID DIPETRILLO, Vice President since May 2019.
Head of North America Product, BNY Mellon Investment Management since January 2018, Director of Product Strategy, BNY Mellon Investment Management from January 2016 to December 2017; Head of US Retail Product and Channel Marketing, BNY Mellon Investment Management from January 2014 to December 2015. He is an officer of 63 investment companies (comprised of 120 portfolios) managed by the Administrator. He is 41 years old and has been an employee of BNY Mellon since 2005.
JAMES BITETTO, Vice President since August 2005 and Secretary since February 2018.
Managing Counsel of BNY Mellon and Secretary of the Adviser, and an officer of 64 investment companies (comprised of 143 portfolios) managed by the Administrator. He is 53 years old and has been an employee of the Administrator since December 1996.
SONALEE CROSS, Vice President and Assistant Secretary since March 2018.
Counsel of BNY Mellon since October 2016; Associate at Proskauer Rose LLP from April 2016 to September 2016; Attorney at EnTrust Capital from August 2015 to February 2016; Associate at Sidley Austin LLP from September 2013 to August 2015. She is an officer of 64 investment companies (comprised of 143 portfolios) managed by the Administrator. She is 32 years old and has been an employee of the Administrator since October 2016.
DEIRDRE CUNNANE, Vice President and Assistant Secretary since March 2019.
Counsel of BNY Mellon since August 2018; Senior Regulatory Specialist at BNY Mellon Investment Management Services from February 2016 to August 2018; Trustee Associate at BNY Mellon Trust Company (Ireland) Limited from August 2013 to February 2016. She is an officer of 64 investment companies (comprised of 143 portfolios) managed by the Administrator. She is 29 years old and has been an employee of the Administrator since August 2018.
SARAH S. KELLEHER, Vice President and Assistant Secretary since April 2014.
Managing Counsel of BNY Mellon since December 2017, Senior Counsel of BNY Mellon from March 2013 to December 2017. She is an officer of 64 investment companies (comprised of 143 portfolios) managed by the Administrator. She is 44 years old and has been an employee of the Administrator since March 2013.
JEFF PRUSNOFSKY, Vice President and Assistant Secretary since August 2005.
Senior Managing Counsel of BNY Mellon, and an officer of 64 investment companies (comprised of 143 portfolios) managed by the Administrator. He is 54 years old and has been an employee of the Administrator since October 1990.
PETER M. SULLIVAN, Vice President and Assistant Secretary since March 2019.
Managing Counsel of BNY Mellon, and an officer of 64 investment companies (comprised of 143 portfolios) managed by the Administrator. He is 51 years old and has been an employee of the Administrator since April 2004.
38
NATALYA ZELENSKY, Vice President and Assistant Secretary since March 2017.
Counsel of BNY Mellon since May 2016; Attorney at Wildermuth Endowment Strategy Fund/Wildermuth Advisory, LLC from November 2015 to May 2016 and Assistant General Counsel at RCS Advisory Services from July 2014 to November 2015. She is an officer of 64 investment companies (comprised of 143 portfolios) managed by the Administrator. She is 34 years old and has been an employee of the Administrator since May 2016.
GAVIN C. REILLY, Assistant Treasurer since December 2005.
Tax Manager - BNY Mellon Fund Administration, and an officer of 64 investment companies (comprised of 143 portfolios) managed by the Administrator. He is 51 years old and has been an employee of the Administrator since April 1991.
ROBERT S. ROBOL, Assistant Treasurer since August 2005.
Senior Accounting Manager- BNY Mellon Fund Administration, and an officer of 64 investment companies (comprised of 143 portfolios) managed by the Administrator. He is 55 years old and has been an employee of the Administrator since October 1988.
ROBERT SALVIOLO, Assistant Treasurer since July 2007.
Senior Accounting Manager – BNY Mellon Fund Administration, and an officer of 64 investment companies (comprised of 143 portfolios) managed by the Administrator. He is 52 years old and has been an employee of the Administrator since June 1989.
ROBERT SVAGNA, Assistant Treasurer since December 2002.
Senior Accounting Manager – BNY Mellon Fund Administration, and an officer of 64 investment companies (comprised of 143 portfolios) managed by the Administrator. He is 52 years old and has been an employee of the Administrator since November 1990.
JOSEPH W. CONNOLLY, Chief Compliance Officer since October 2004.
Chief Compliance Officer of the Adviser, the BNY Mellon Family of Funds and BNY Mellon Funds Trust (64 investment companies, comprised of 143 portfolios). He is 62 years old and has served in various capacities with the the Administrator since 1980, including manager of the firm’s Fund Accounting Department from 1997 through October 2001.
CARIDAD M. CAROSELLA, Anti-Money Laundering Compliance Officer since January 2016.
Anti-Money Laundering Compliance Officer of the BNY Mellon Family of Funds and BNY Mellon Funds Trust since January 2016; from May 2015 to December 2015, Interim Anti-Money Laundering Compliance Officer of the BNY Mellon Family of Funds and BNY Mellon Funds Trust and the Distributor; from January 2012 to May 2015, AML Surveillance Officer of the Distributor. She is an officer of 57 investment companies (comprised of 136 portfolios) managed by the Administrator. She is 51 years old and has been an employee of the Distributor since 1997.
39
NOTES
40
NOTES
41
BNY Mellon International Core Equity Fund
240 Greenwich Street
New York, NY 10286
Investment Adviser
Mellon Investments Corporation
BNY Mellon Center
One Boston Place
Boston, MA 02108-4408
Administrator
BNY Mellon Investment Adviser, Inc.
240 Greenwich Street
New York, NY 10286
Custodian
The Bank of New York Mellon
240 Greenwich Street
New York, NY 10286
Transfer Agent &
Dividend Disbursing Agent
BNY Mellon Transfer, Inc.
240 Greenwich Street
New York, NY 10286
Distributor
BNY Mellon Securities Corporation
240 Greenwich Street
New York, NY 10286
| | |
Ticker Symbols: Class A: DIEAX Class C: DIECX Class I: DIERX Class Y: DIEYX |
Telephone Call your financial representative or 1-800-373-9387
Mail The BNY Mellon Family of Funds, 144 Glenn Curtiss Boulevard, Uniondale, NY 11556-0144
E-mailSend your request toinfo@bnymellon.com
InternetInformation can be viewed online or downloaded atwww.bnymellonim.com/us
The fund files its complete schedule of portfolio holdings with the Securities and Exchange Commission (“SEC”) for the first and third quarters of each fiscal year on Form N-PORT. The fund’s Forms N-PORT are available on the SEC’s website atwww.sec.gov.
A description of the policies and procedures that the fund uses to determine how to vote proxies relating to portfolio securities and information regarding how the fund voted these proxies for the most recent 12-month period ended June 30 is available atwww.bnymellonim.com/us and on the SEC’s website atwww.sec.gov and without charge, upon request, by calling 1-800-373-9387.
| | |
© 2019 BNY Mellon Securities Corporation
0720AR0919 | 
|