International small-cap stocks lost ground over the reporting period due to the economic effects of the COVID-19 virus. The fund underperformed the Index, due primarily to unfavorable allocations to Japan, South Korea and Australia, as well as to the industrials and consumer discretionary sectors.
The fund seeks long-term growth of capital. To pursue its goal, the fund normally invests at least 80% of its net assets, plus any borrowings for investment purposes, in common stocks and other equity securities of small-cap, foreign companies. The fund considers foreign companies to be those companies organized or with their principal place of business, or majority of assets or business, in countries represented in the Index. The fund considers small-cap companies to be those companies with total market capitalizations that fall within the range of the capitalizations of the companies that comprise the Index.
The fund invests in stocks that appear to be undervalued (as measured by their price/earnings ratios) and that may have value and/or growth characteristics. The fund’s portfolio managers employ a bottom-up investment approach using proprietary quantitative models and traditional qualitative analysis to identify attractive stocks. The portfolio managers seek to allocate country weights generally in accordance with the Index and use the sector weightings of the Index as a guide, but the fund’s country and sector weightings may vary from those of the Index.
The fund’s stock selection process is designed to produce a diversified portfolio that, relative to the Index, has a below-average price/earnings ratio and an above-average earnings growth trend.
The reporting period began with the market continuing to benefit from a shift in Federal Reserve (the “Fed”) policy, which had been prompted by concerns about economic growth and corporate earnings. Late in 2019, the Fed implemented three rate cuts, as trade tensions and other geopolitical concerns appeared to be weighing on economic growth. Other major central banks also enacted supportive policies. Stocks also benefited from the announcement of a “Phase One” trade deal between the U.S. and China, and from the approval of the new U.S.-Mexico-Canada Trade Agreement.
Early in 2020, developed markets experienced a correction amid growing concerns about the COVID-19 virus. As a result, the Fed reduced the federal funds rate twice in March, bringing the target rate down to 0.00-0.25%. In addition, the Fed and other central banks initiated various programs to ease liquidity concerns in certain markets, and government authorities introduced programs to keep small businesses afloat. Steps were also taken to provide relief to employees who had lost their jobs as a result of government-mandated business shutdowns.
DISCUSSION OF FUND PERFORMANCE (Unaudited) (continued)
In the second half of the reporting period, the economy began to show signs of recovery. Retail sales rebounded, and the outlook for manufacturing also improved. Job creation surged, beating economists’ expectations, and markets began to rebound as relief programs took effect, government shutdowns began to ease and hope for a COVID-19 vaccine or effective therapy took hold.
Late in the reporting period, markets benefited from the growing prospect that one or more vaccines would be available within a few months. Uncertainty surrounding the November 2020 election also eased, and investors began to factor the likelihood of additional stimulus and infrastructure spending into their calculations. With the end of the pandemic in view and continued economic rebound likely, investors began to shift away from growth-oriented stocks and into value-oriented stocks.
Small-cap stocks were harder hit by the market decline and have been slower to recover, due primarily to their greater risk profile. In addition, growth-oriented stocks recovered more quickly than value-oriented stocks. U.S. markets have rebounded relatively quickly, but prospects for international stocks began to improve late in the reporting period, as investors began to anticipate weakening of the U.S. dollar due to the Fed’s more tolerant stance on inflation.
Allocations to Industrial and Consumer Discretionary Sectors Hampered Performance
The fund’s underperformance versus the Index was driven largely by allocations to industrial and consumer discretionary sectors. In the industrial sector, the fund’s position in Air Canada hindered returns, as the stock declined 69% as a result of COVID-19. Shares of En-Japan, an Internet-based employment recruiting firm, also detracted from performance, as they declined 47% due to the economic slowdown resulting from the pandemic. In the consumer discretionary sector, the fund had an underweight position, and the sector rose 0.5% during the period. In addition, shares of Schaeffler, a Germany-based supplier to the auto industry, fell 30% on concerns about auto sales in the near term and on reduced production due to COVID-19. Shares of Webjet, an Australian online travel agency, also detracted from returns, as travel restrictions reduced demand.
On a more positive note, stock selections in the communication services and energy sectors contributed positively to performance. In the communication services sector, a position in Internet Initiative Japan, a network services firm, rose 90%, driven by ongoing strength in capital spending. Shares of IGG, a Singaporean maker of videogames, also contributed positively, rising 79% on strong demand. In the energy sector, although Index returns were negative, the fund’s positions in Canadian and UK exploration and production companies were beneficial, partially offsetting the sector’s declines.
From a country perspective, positions in Japan, South Korea and Australia were most detrimental. In addition to the unfavorable performance of en-japan, shares of Invincible Investment, a Japanese real estate investment trust (REIT) focused on the industrial and office sector, hindered returns. Japan Hotel REIT Investment, a REIT that owns property in the hospitality sector, also detracted from performance. In South Korea, shares of Dentium, a maker of dental implants, declined 36%, as COVID-19 restrictions hurt demand for elective surgical procedures. In Australia, the position in Webjet, mentioned above, also contributed negatively to returns.
On a more positive note, the fund’s performance versus the Index was helped by stock selections in Singapore, Ireland and Spain. In Singapore, shares of AEM Holdings, a precision engineering firm that serves the semiconductor industry, rose 130% on strong demand related to electric
4
vehicles, cloud computing, autonomous vehicles and other industries. In Ireland, shares of ICON, a clinical research organization, rose 23% on strong demand for outsourced drug research. In Spain, the fund’s position in Euskaltel, a telecom company, rose 23%, benefiting returns.
Positioned for a Shift to Value-oriented Stocks
Although uncertainty about the duration of the pandemic remains, we believe that with one or more vaccines becoming available soon, the worst of it may soon be over. In addition, markets will be supported by ongoing monetary stimulus, and although a fiscal stimulus package is likely to be smaller than expected a few months ago, it is still likely to be significant.
The prospects of ongoing economic recovery have resulted in a shift in investor sentiment, leading to stronger performance among value-oriented stocks. In addition, given the weak earnings of value-oriented stocks during the pandemic, these companies are likely to benefit from favorable earnings comparisons in the coming months. In contrast, growth-oriented stocks have enjoyed strong earnings and will face challenges in improving on those over the next year. In light of this environment, we have repositioned the fund, adding exposure to the health care and industrial sectors and reducing exposure to the consumer staples and materials sectors.
November 16, 2020
1 Total return includes reinvestment of dividends and any capital gains paid and does not take into consideration the maximum initial sales charge in the case of Class A shares, or the applicable contingent deferred sales charge imposed on redemptions in the case of Class C shares. Had these charges been reflected, returns would have been lower. Share price, yield and investment return fluctuate such that upon redemption, fund shares may be worth more or less than their original cost. Return figures provided reflect an undertaking for the absorption of certain fund expenses by BNY Mellon Investment Adviser, Inc. through March 1, 2021, at which time it may be extended, terminated or modified. Had these expenses not been absorbed, the fund’s returns would have been lower. Past performance is no guarantee of future results.
2 Source: Lipper Inc. — The S&P Developed Ex-US SmallCap Index comprises the stocks representing the lowest 15% of float-adjusted, market capitalization in each developed country, excluding the U.S. It is a subset of the S&P Global BMI, a comprehensive, rules-based index measuring global stock market performance. Investors cannot invest directly in any index.
Please note: the position in any security highlighted with italicized typeface was sold during the reporting period.
Equities are subject generally to market, market sector, market liquidity, issuer and investment style risks, among other factors, to varying degrees, all of which are more fully described in the fund’s prospectus.
Stocks of small- and/or mid-cap companies often experience sharper price fluctuations than stocks of large-cap companies.
The fund’s performance will be influenced by political, social and economic factors affecting investments in foreign companies. Special risks associated with investments in foreign companies include exposure to currency fluctuations, less liquidity, less developed or less efficient trading markets, lack of comprehensive company information, political instability and differing auditing and legal standards. These risks are enhanced in emerging market countries. Please read the prospectus for further discussion of these risks.
Recent market risks include pandemic risks related to COVID-19. The effects of COVID-19 have contributed to increased volatility in global markets and will likely affect certain countries, companies, industries and market sectors more dramatically than others. To the extent the fund may overweight its investments in certain countries, companies, industries or market sectors, such positions will increase the fund’s exposure to risk of loss from adverse developments affecting those countries, companies, industries or sectors.
The fund may, but is not required to, use derivative instruments. A small investment in derivatives could have a potentially large impact on the fund’s performance. The use of derivatives involves risks different from, or possibly greater than, the risks associated with investing directly in the underlying assets.
5
FUND PERFORMANCE (Unaudited)

Comparison of change in value of a $10,000 investment in Class A shares, Class C shares, and Class I shares of BNY Mellon International Small Cap Fund with a hypothetical investment of $10,000 in the S&P Developed Ex-U.S. SmallCap Index (the “Index”)
† Source: Lipper Inc.
Past performance is not predictive of future performance.
The above graph compares a hypothetical $10,000 investment made in each of the Class A shares, Class C shares, and Class I shares of BNY Mellon International Small Cap Fund on 1/30/15 (inception date) to a hypothetical investment of $10,000 made in the Index on that date. All dividends and capital gain distributions are reinvested.
The fund’s performance shown in the line graph above takes into account the maximum initial sales charge on Class A shares and all other applicable fees and expenses on all classes. The Index comprises the stocks representing the lowest 15% of float-adjusted market cap in each developed country excluding the U.S. It is a subset of the S&P Global BMI, a comprehensive, rules-based index measuring global stock market performance. Unlike a mutual fund, the Index is not subject to charges, fees and other expenses. Investors cannot invest directly in any index. Further information relating to fund performance, including expense reimbursements, if applicable, is contained in the Financial Highlights section of the prospectus and elsewhere in this report.
6
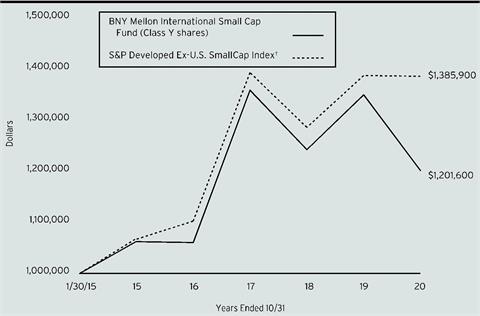
Comparison of change in value of a $1,000,000 investment in Class Y shares of BNY Mellon International Small Cap Fund with a hypothetical investment of $1,000,000 in the S&P Developed Ex-U.S. SmallCap Index (the “Index”)
† Source: Lipper Inc.
Past performance is not predictive of future performance.
The above graph compares a hypothetical $1,000,000 investment made in Class Y shares of BNY Mellon International Small Cap Fund on 1/30/15 (inception date) to a hypothetical investment of $1,000,000 made in the Index on that date. All dividends and capital gain distributions are reinvested.
The fund’s performance shown in the line graph above takes into account all applicable fees and expenses of the fund’s Class Y shares. The Index comprises the stocks representing the lowest 15% of float-adjusted market cap in each developed country excluding the U.S. It is a subset of the S&P Global BMI, a comprehensive, rules-based index measuring global stock market performance. Unlike a mutual fund, the Index is not subject to charges, fees and other expenses. Investors cannot invest directly in any index. Further information relating to fund performance, including expense reimbursements, if applicable, is contained in the Financial Highlights section of the prospectus and elsewhere in this report.
7
FUND PERFORMANCE (Unaudited) (continued)
| | | | | | | | |
Average Annual Total Returns as of 10/31/2020 |
| Inception
Date | 1 Year | 5 Year | From
Inception |
Class A shares | | | | |
with maximum sales charge (5.75%) | 1/30/15 | -16.36% | 0.96% | 1.88% |
without sales charge | 1/30/15 | -11.24% | 2.17% | 2.94% |
Class C shares | | | | |
with applicable redemption charge† | 1/30/15 | -12.78% | 1.44% | 2.19% |
without redemption | 1/30/15 | -11.92% | 1.44% | 2.19% |
Class I shares | 1/30/15 | -11.05% | 2.45% | 3.21% |
Class Y shares | 1/30/15 | -10.98% | 2.49% | 3.25% |
S&P Developed Ex-U.S. SmallCap Index | 1/31/15 | -0.13% | 5.37% | 5.84%†† |
† The maximum contingent deferred sales charge for Class C shares is 1% for shares redeemed within one year of the date of purchase.
†† For comparative purposes, the value of the Index as of 1/31/15 is used as the beginning value on 1/30/15.
The performance data quoted represents past performance, which is no guarantee of future results. Share price and investment return fluctuate and an investor’s shares may be worth more or less than original cost upon redemption. Current performance may be lower or higher than the performance quoted. Go to www.bnymellonim.com/us for the fund’s most recent month-end returns.
The fund’s performance shown in the graphs and table does not reflect the deduction of taxes that a shareholder would pay on fund distributions or the redemption of fund shares. In addition to the performance of Class A shares shown with and without a maximum sales charge, the fund’s performance shown in the table takes into account all other applicable fees and expenses on all classes.
8
UNDERSTANDING YOUR FUND’S EXPENSES (Unaudited)
As a mutual fund investor, you pay ongoing expenses, such as management fees and other expenses. Using the information below, you can estimate how these expenses affect your investment and compare them with the expenses of other funds. You also may pay one-time transaction expenses, including sales charges (loads) and redemption fees, which are not shown in this section and would have resulted in higher total expenses. For more information, see your fund’s prospectus or talk to your financial adviser.
Review your fund’s expenses
The table below shows the expenses you would have paid on a $1,000 investment in BNY Mellon International Small Cap Fund from May 1, 2020 to October 31, 2020. It also shows how much a $1,000 investment would be worth at the close of the period, assuming actual returns and expenses.
| | | | | | | |
Expenses and Value of a $1,000 Investment | |
Assume actual returns for the six months ended October 31, 2020 | |
| | | | | | |
| | Class A | Class C | Class I | Class Y | |
Expense paid per $1,000† | $7.51 | $11.51 | $6.17 | $6.07 | |
Ending value (after expenses) | $1,134.30 | $1,129.70 | $1,135.10 | $1,136.00 | |
COMPARING YOUR FUND’S EXPENSES
WITH THOSE OF OTHER FUNDS (Unaudited)
Using the SEC’s method to compare expenses
The Securities and Exchange Commission (“SEC”) has established guidelines to help investors assess fund expenses. Per these guidelines, the table below shows your fund’s expenses based on a $1,000 investment, assuming a hypothetical 5% annualized return. You can use this information to compare the ongoing expenses (but not transaction expenses or total cost) of investing in the fund with those of other funds. All mutual fund shareholder reports will provide this information to help you make this comparison. Please note that you cannot use this information to estimate your actual ending account balance and expenses paid during the period.
| | | | | | | |
Expenses and Value of a $1,000 Investment | |
Assuming a hypothetical 5% annualized return for the six months ended October 31, 2020 | |
| | | | | | |
| | Class A | Class C | Class I | Class Y | |
Expense paid per $1,000† | $7.10 | $10.89 | $5.84 | $5.74 | |
Ending value (after expenses) | $1,018.10 | $1,014.33 | $1,019.36 | $1,019.46 | |
† Expenses are equal to the fund’s annualized expense ratio of 1.40% for Class A, 2.15% for Class C, 1.15% for Class I and 1.13% for Class Y, multiplied by the average account value over the period, multiplied by 184/366 (to reflect the one-half year period). |
9
STATEMENT OF INVESTMENTS
October 31, 2020
| | | | | | | | |
| |
Description | | | | Shares | | Value ($) | |
Common Stocks - 95.9% | | | | | |
Australia - 6.4% | | | | | |
Abacus Property Group | | | | 895,660 | | 1,748,953 | |
Adairs | | | | 772,211 | | 2,066,630 | |
Ansell | | | | 105,097 | | 2,977,131 | |
Beach Energy | | | | 1,108,470 | | 926,971 | |
Charter Hall Retail REIT | | | | 540,828 | | 1,311,758 | |
Cromwell Property Group | | | | 3,464,722 | | 2,130,248 | |
Evolution Mining | | | | 1,571,548 | | 6,157,115 | |
IOOF Holdings | | | | 1,304,314 | | 2,686,893 | |
JB Hi-Fi | | | | 113,178 | | 3,782,299 | |
Shopping Centres Australasia Property Group | | | | 970,106 | | 1,586,739 | |
Silver Lake Resources | | | | 1,581,307 | a | 2,359,120 | |
| | | | | 27,733,857 | |
Austria - 1.7% | | | | | |
BAWAG Group | | | | 140,327 | a,b | 5,144,897 | |
Wienerberger | | | | 82,162 | | 2,073,957 | |
| | | | | 7,218,854 | |
Belgium - .2% | | | | | |
Euronav | | | | 144,446 | | 1,058,319 | |
Canada - 3.1% | | | | | |
Aecon Group | | | | 232,111 | | 2,477,384 | |
Air Canada | | | | 90,215 | a | 997,423 | |
BRP | | | | 66,412 | | 3,587,036 | |
Cogeco Communications | | | | 38,447 | | 2,677,987 | |
Parex Resources | | | | 249,067 | a | 2,424,678 | |
SunOpta | | | | 156,656 | a | 1,074,660 | |
| | | | | 13,239,168 | |
Czech Republic - 1.4% | | | | | |
Avast | | | | 957,484 | b | 5,890,063 | |
Denmark - 2.2% | | | | | |
GN Store Nord | | | | 40,537 | | 2,919,402 | |
Pandora | | | | 53,016 | a | 4,203,495 | |
Scandinavian Tobacco Group | | | | 165,597 | b | 2,341,837 | |
| | | | | 9,464,734 | |
Finland - 1.5% | | | | | |
Cargotec, Cl. B | | | | 58,822 | | 2,022,005 | |
TietoEVRY | | | | 89,977 | | 2,242,899 | |
Valmet | | | | 96,178 | | 2,294,470 | |
| | | | | 6,559,374 | |
France - 6.6% | | | | | |
Covivio | | | | 43,697 | | 2,603,276 | |
10
| | | | | | | | |
| |
Description | | | | Shares | | Value ($) | |
Common Stocks - 95.9% (continued) | | | | | |
France - 6.6% (continued) | | | | | |
Eiffage | | | | 72,809 | | 5,308,213 | |
Klepierre | | | | 172,040 | | 2,194,157 | |
Korian | | | | 58,121 | | 1,644,224 | |
Maisons du Monde | | | | 126,522 | b | 1,694,708 | |
Nexity | | | | 93,040 | | 2,613,806 | |
Teleperformance | | | | 28,868 | | 8,685,588 | |
Ubisoft Entertainment | | | | 41,658 | a | 3,680,079 | |
| | | | | 28,424,051 | |
Georgia - .4% | | | | | |
Bank of Georgia Group | | | | 147,217 | | 1,711,735 | |
Germany - 3.8% | | | | | |
DWS Group GmbH & Co. | | | | 97,119 | b | 3,303,301 | |
Hornbach Holding & Co. | | | | 16,293 | | 1,572,131 | |
Rheinmetall | | | | 38,964 | | 2,844,496 | |
Stroeer SE & Co. | | | | 78,076 | | 5,644,223 | |
Talanx | | | | 100,732 | | 2,965,778 | |
| | | | | 16,329,929 | |
Ireland - 2.8% | | | | | |
Greencore Group | | | | 803,472 | | 941,956 | |
ICON | | | | 33,147 | a | 5,976,404 | |
UDG Healthcare | | | | 538,334 | | 5,062,479 | |
| | | | | 11,980,839 | |
Isle Of Man - 1.4% | | | | | |
GVC Holdings | | | | 477,678 | | 5,982,819 | |
Italy - 4.2% | | | | | |
ANIMA Holding | | | | 830,050 | b | 3,104,743 | |
Buzzi Unicem | | | | 136,550 | | 2,956,397 | |
Iren | | | | 547,490 | | 1,244,472 | |
Italgas | | | | 1,010,825 | | 5,844,331 | |
Unipol Gruppo | | | | 1,397,123 | | 5,092,869 | |
| | | | | 18,242,812 | |
Japan - 25.7% | | | | | |
Adastria | | | | 86,600 | | 1,511,896 | |
Anritsu | | | | 319,200 | | 6,931,255 | |
DTS | | | | 210,000 | | 4,092,732 | |
FCC | | | | 161,200 | | 3,097,900 | |
GLP J-REIT | | | | 2,973 | | 4,565,466 | |
Hanwa | | | | 93,400 | | 1,815,434 | |
Internet Initiative Japan | | | | 182,000 | | 8,178,457 | |
Invincible Investment | | | | 8,920 | | 2,851,754 | |
Itochu Techno-Solutions | | | | 84,900 | | 2,883,947 | |
Japan Aviation Electronics Industry | | | | 186,900 | | 2,583,046 | |
Japan Hotel REIT Investment | | | | 6,977 | | 3,376,740 | |
11
STATEMENT OF INVESTMENTS (continued)
| | | | | | | | |
| |
Description | | | | Shares | | Value ($) | |
Common Stocks - 95.9% (continued) | | | | | |
Japan - 25.7% (continued) | | | | | |
Jeol | | | | 53,500 | | 1,697,169 | |
Kamigumi | | | | 84,900 | | 1,521,061 | |
Kanamoto | | | | 171,000 | | 3,525,315 | |
Kenedix Retail REIT | | | | 1,308 | | 2,500,707 | |
K's Holdings | | | | 173,300 | | 2,219,899 | |
Kyoei Steel | | | | 105,300 | | 1,327,009 | |
Matsumotokiyoshi Holdings | | | | 122,300 | | 4,521,440 | |
NICHIAS | | | | 188,000 | | 4,083,263 | |
Nichirei | | | | 139,300 | | 3,511,648 | |
Nissha | | | | 147,800 | | 1,737,736 | |
PALTAC | | | | 99,400 | | 5,582,604 | |
Rengo | | | | 433,200 | | 3,339,027 | |
Rohto Pharmaceutical | | | | 155,700 | | 4,874,237 | |
Sanwa Holdings | | | | 454,600 | | 5,210,569 | |
Sawai Pharmaceutical | | | | 45,900 | | 2,215,601 | |
Seino Holdings | | | | 98,600 | | 1,275,684 | |
Tamron | | | | 86,600 | | 1,292,822 | |
TechnoPro Holdings | | | | 59,500 | | 3,708,471 | |
TIS | | | | 144,400 | | 2,776,756 | |
Tomy | | | | 214,000 | | 1,872,406 | |
Toyoda Gosei | | | | 124,000 | | 3,148,196 | |
Yamato Kogyo | | | | 101,000 | | 2,428,387 | |
Zeon | | | | 412,100 | | 5,013,321 | |
| | | | | 111,271,955 | |
Jersey - .5% | | | | | |
Centamin | | | | 1,396,452 | | 2,249,140 | |
Jordan - 1.2% | | | | | |
Hikma Pharmaceuticals | | | | 160,200 | | 5,210,763 | |
Luxembourg - 1.9% | | | | | |
Aperam | | | | 61,927 | | 1,665,666 | |
Eurofins Scientific | | | | 8,400 | | 6,703,745 | |
| | | | | 8,369,411 | |
Malta - .3% | | | | | |
Kindred Group, SDR | | | | 196,264 | | 1,495,806 | |
Netherlands - 5.1% | | | | | |
Arcadis | | | | 94,020 | | 2,191,602 | |
ASM International | | | | 48,875 | | 6,993,962 | |
PostNL | | | | 817,231 | a | 2,710,505 | |
Signify | | | | 243,955 | b | 8,693,079 | |
TKH Group | | | | 45,413 | | 1,462,474 | |
| | | | | 22,051,622 | |
Portugal - .4% | | | | | |
NOS | | | | 522,991 | | 1,795,705 | |
12
| | | | | | | | |
| |
Description | | | | Shares | | Value ($) | |
Common Stocks - 95.9% (continued) | | | | | |
Singapore - 1.9% | | | | | |
AEM Holdings | | | | 1,554,600 | | 3,884,088 | |
BW LPG | | | | 307,086 | b | 1,335,333 | |
IGG | | | | 2,752,000 | | 2,967,423 | |
| | | | | 8,186,844 | |
South Korea - 4.3% | | | | | |
CJ ENM | | | | 10,873 | | 1,268,507 | |
Daelim Industrial | | | | 36,833 | | 2,546,351 | |
Dentium | | | | 37,955 | | 1,252,484 | |
DGB Financial Group | | | | 279,480 | | 1,531,288 | |
DoubleUGames | | | | 23,276 | | 1,266,844 | |
Hyundai Wia | | | | 55,437 | | 2,056,204 | |
KEPCO Plant Service & Engineering | | | | 77,302 | | 1,879,315 | |
Kumho Petrochemical | | | | 22,410 | | 2,657,458 | |
Posco International | | | | 166,932 | | 1,962,550 | |
Seegene | | | | 8,851 | | 2,047,394 | |
| | | | | 18,468,395 | |
Spain - 1.8% | | | | | |
Almirall | | | | 271,594 | | 2,909,494 | |
Euskaltel | | | | 537,345 | b | 5,113,554 | |
| | | | | 8,023,048 | |
Sweden - 3.4% | | | | | |
Betsson | | | | 175,231 | | 1,335,355 | |
Getinge, Cl. B | | | | 130,310 | | 2,553,501 | |
Intrum | | | | 137,311 | | 3,357,622 | |
Inwido | | | | 184,660 | | 1,959,792 | |
NCC, Cl. B | | | | 78,322 | | 1,250,218 | |
Samhallsbyggnadsbolaget i Norden | | | | 659,265 | | 1,818,340 | |
Swedish Orphan Biovitrum | | | | 151,259 | a | 2,610,127 | |
| | | | | 14,884,955 | |
Switzerland - 5.8% | | | | | |
ALSO Holding | | | | 7,577 | | 1,770,361 | |
BKW | | | | 32,076 | | 3,191,452 | |
Galenica | | | | 45,555 | b | 2,874,405 | |
Landis+Gyr Group | | | | 47,098 | a | 2,627,886 | |
Logitech International | | | | 48,080 | | 4,049,979 | |
Sulzer | | | | 18,757 | | 1,368,964 | |
Swissquote Group Holding | | | | 74,041 | | 5,905,324 | |
VAT Group | | | | 17,992 | b | 3,372,938 | |
| | | | | 25,161,309 | |
United Kingdom - 7.5% | | | | | |
Aggreko | | | | 292,901 | | 1,675,694 | |
Britvic | | | | 643,057 | | 6,161,960 | |
Cairn Energy | | | | 2,738,548 | a | 4,933,828 | |
13
STATEMENT OF INVESTMENTS (continued)
| | | | | | | | |
| |
Description | | | | Shares | | Value ($) | |
Common Stocks - 95.9% (continued) | | | | | |
United Kingdom - 7.5% (continued) | | | | | |
Dialog Semiconductor | | | | 97,957 | a | 3,745,598 | |
Halma | | | | 122,580 | | 3,762,930 | |
IG Group Holdings | | | | 200,817 | | 1,980,894 | |
Man Group | | | | 1,843,871 | | 2,576,478 | |
Pagegroup | | | | 635,524 | | 2,946,697 | |
Tate & Lyle | | | | 304,522 | | 2,348,895 | |
Vistry Group | | | | 322,896 | a | 2,286,126 | |
| | | | | 32,419,100 | |
United States - .4% | | | | | |
Nexteer Automotive Group | | | | 2,124,000 | | 1,779,364 | |
Total Common Stocks (cost $411,582,388) | | | | 415,203,971 | |
| | | | | | | | |
Exchange-Traded Funds - .4% | | | | | |
United States - .4% | | | | | |
iShares MSCI EAFE Small-Cap ETF
(cost $1,602,655) | | | | 28,273 | | 1,610,147 | |
| | | Preferred Dividend
Yield (%) | | | | | |
Preferred Stocks - 1.8% | | | | | |
Germany - 1.8% | | | | | |
Sartorius | | 0.10 | | 11,179 | | 4,728,535 | |
Schaeffler | | 7.68 | | 490,626 | | 2,987,787 | |
Total Preferred Stocks (cost $7,178,989) | | | | 7,716,322 | |
| | | 1-Day
Yield (%) | | | | | |
Investment Companies - .9% | | | | | |
Registered Investment Companies - .9% | | | | | |
Dreyfus Institutional Preferred Government Plus Money Market Fund
(cost $3,865,889) | | 0.10 | | 3,865,889 | c | 3,865,889 | |
Total Investments (cost $424,229,921) | | 99.0% | | 428,396,329 | |
Cash and Receivables (Net) | | 1.0% | | 4,500,005 | |
Net Assets | | 100.0% | | 432,896,334 | |
ETF—Exchange-Traded Fund
REIT—Real Estate Investment Trust
SDR—Swedish Depository Receipts
aNon-income producing security.
bSecurity exempt from registration pursuant to Rule 144A under the Securities Act of 1933. These securities may be resold in transactions exempt from registration, normally to qualified institutional buyers. At October 31, 2020, these securities were valued at $42,868,858 or 9.9% of net assets.
cInvestment in affiliated issuer. The investment objective of this investment company is publicly available and can be found within the investment company’s prospectus.
14
| | |
Portfolio Summary (Unaudited) † | Value (%) |
Capital Goods | 12.6 |
Materials | 7.4 |
Real Estate | 6.8 |
Pharmaceuticals Biotechnology & Life Sciences | 6.4 |
Health Care Equipment & Services | 5.9 |
Technology Hardware & Equipment | 5.4 |
Commercial & Professional Services | 5.1 |
Retailing | 4.6 |
Diversified Financials | 4.5 |
Software & Services | 4.1 |
Food, Beverage & Tobacco | 3.8 |
Telecommunication Services | 3.5 |
Media & Entertainment | 3.5 |
Semiconductors & Semiconductor Equipment | 3.4 |
Consumer Durables & Apparel | 3.1 |
Automobiles & Components | 3.0 |
Energy | 2.5 |
Utilities | 2.4 |
Consumer Services | 2.3 |
Banks | 1.9 |
Insurance | 1.9 |
Transportation | 1.5 |
Investment Companies | 1.3 |
Household & Personal Products | 1.1 |
Food & Staples Retailing | 1.0 |
| | 99.0 |
† Based on net assets.
See notes to financial statements.
15
STATEMENT OF INVESTMENTS IN AFFILIATED ISSUERS
| | | | | | | |
Investment Companies | Value
10/31/19 ($) | Purchases ($)† | Sales ($) | Value
10/31/20 ($) | Net
Assets (%) | Dividends/
Distributions ($) |
Registered Investment Companies; | | | | |
Dreyfus Institutional Preferred Government Plus Money Market Fund | 4,496,609 | 473,803,359 | (474,434,079) | 3,865,889 | .9 | 42,676 |
† Includes reinvested dividends/distributions.
See notes to financial statements.
16
STATEMENT OF ASSETS AND LIABILITIES
October 31, 2020
| | | | | | | |
| | | | | | |
| | | Cost | | Value | |
Assets ($): | | | | |
Investments in securities—See Statement of Investments | | | |
Unaffiliated issuers | 420,364,032 | | 424,530,440 | |
Affiliated issuers | | 3,865,889 | | 3,865,889 | |
Cash denominated in foreign currency | | | 1,952,786 | | 1,950,674 | |
Receivable for investment securities sold | | 3,636,818 | |
Tax reclaim receivable | | 1,264,058 | |
Receivable for shares of Beneficial Interest subscribed | | 1,060,870 | |
Dividends receivable | | 992,188 | |
Prepaid expenses | | | | | 17,062 | |
| | | | | 437,317,999 | |
Liabilities ($): | | | | |
Due to BNY Mellon Investment Adviser, Inc. and affiliates—Note 3(c) | | 430,461 | |
Payable for investment securities purchased | | 3,161,117 | |
Payable for shares of Beneficial Interest redeemed | | 738,890 | |
Trustees’ fees and expenses payable | | 8,426 | |
Other accrued expenses | | | | | 82,771 | |
| | | | | 4,421,665 | |
Net Assets ($) | | | 432,896,334 | |
Composition of Net Assets ($): | | | | |
Paid-in capital | | | | | 549,852,589 | |
Total distributable earnings (loss) | | | | | (116,956,255) | |
Net Assets ($) | | | 432,896,334 | |
| | | | | | |
Net Asset Value Per Share | Class A | Class C | Class I | Class Y | |
Net Assets ($) | 567,759 | 100,196 | 4,827,480 | 427,400,899 | |
Shares Outstanding | 47,016 | 8,336 | 398,915 | 35,298,740 | |
Net Asset Value Per Share ($) | 12.08 | 12.02 | 12.10 | 12.11 | |
| | | | | |
See notes to financial statements. | | | | | |
17
STATEMENT OF OPERATIONS
Year Ended October 31, 2020
| | | | | | | |
| | | | | | |
| | | | | | |
Investment Income ($): | | | | |
Income: | | | | |
Cash dividends (net of $1,080,404 foreign taxes withheld at source): | |
Unaffiliated issuers | | | 11,171,170 | |
Affiliated issuers | | | 42,289 | |
Total Income | | | 11,213,459 | |
Expenses: | | | | |
Investment advisory fee—Note 3(a) | | | 4,771,625 | |
Custodian fees—Note 3(c) | | | 169,340 | |
Professional fees | | | 111,717 | |
Registration fees | | | 69,696 | |
Trustees’ fees and expenses—Note 3(d) | | | 47,036 | |
Shareholder servicing costs—Note 3(c) | | | 15,774 | |
Loan commitment fees—Note 2 | | | 15,656 | |
Chief Compliance Officer fees—Note 3(c) | | | 14,076 | |
Prospectus and shareholders’ reports | | | 11,278 | |
Interest expense—Note 2 | | | 3,852 | |
Distribution fees—Note 3(b) | | | 778 | |
Miscellaneous | | | 29,663 | |
Total Expenses | | | 5,260,491 | |
Less—reduction in expenses due to undertaking—Note 3(a) | | | (5,285) | |
Net Expenses | | | 5,255,206 | |
Investment Income—Net | | | 5,958,253 | |
Realized and Unrealized Gain (Loss) on Investments—Note 4 ($): | | |
Net realized gain (loss) on investments and foreign currency transactions | (43,850,914) | |
Net realized gain (loss) on forward foreign currency exchange contracts | 65,522 | |
Capital gain distributions from affiliated issuers | 387 | |
Net Realized Gain (Loss) | | | (43,785,005) | |
Net change in unrealized appreciation (depreciation) on investments
and foreign currency transactions | (53,377,414) | |
Net Realized and Unrealized Gain (Loss) on Investments | | | (97,162,419) | |
Net (Decrease) in Net Assets Resulting from Operations | | (91,204,166) | |
| | | | | | |
See notes to financial statements. | | | | | |
18
STATEMENT OF CHANGES IN NET ASSETS
| | | | | | | | | | |
| | | | Year Ended October 31, |
| | | | 2020 | | 2019 | |
Operations ($): | | | | | | | | |
Investment income—net | | | 5,958,253 | | | | 9,734,601 | |
Net realized gain (loss) on investments | | (43,785,005) | | | | (60,187,045) | |
Net change in unrealized appreciation
(depreciation) on investments | | (53,377,414) | | | | 78,620,719 | |
Net Increase (Decrease) in Net Assets
Resulting from Operations | (91,204,166) | | | | 28,168,275 | |
Distributions ($): | |
Distributions to shareholders: | | | | | | | | |
Class A | | | (23,647) | | | | (65,972) | |
Class C | | | (2,580) | | | | (14,012) | |
Class I | | | (634,912) | | | | (1,960,228) | |
Class Y | | | (21,340,163) | | | | (84,912,018) | |
Total Distributions | | | (22,001,302) | | | | (86,952,230) | |
Beneficial Interest Transactions ($): | |
Net proceeds from shares sold: | | | | | | | | |
Class A | | | 167,339 | | | | 193,369 | |
Class C | | | - | | | | 13,886 | |
Class I | | | 10,148,588 | | | | 15,309,717 | |
Class Y | | | 160,233,709 | | | | 116,760,038 | |
Distributions reinvested: | | | | | | | | |
Class A | | | 19,939 | | | | 52,715 | |
Class C | | | 160 | | | | 1,620 | |
Class I | | | 561,834 | | | | 1,573,261 | |
Class Y | | | 6,569,014 | | | | 34,990,214 | |
Cost of shares redeemed: | | | | | | | | |
Class A | | | (184,646) | | | | (137,126) | |
Class C | | | (2,506) | | | | (24,087) | |
Class I | | | (20,257,552) | | | | (18,938,120) | |
Class Y | | | (241,463,911) | | | | (311,969,609) | |
Increase (Decrease) in Net Assets
from Beneficial Interest Transactions | (84,208,032) | | | | (162,174,122) | |
Total Increase (Decrease) in Net Assets | (197,413,500) | | | | (220,958,077) | |
Net Assets ($): | |
Beginning of Period | | | 630,309,834 | | | | 851,267,911 | |
End of Period | | | 432,896,334 | | | | 630,309,834 | |
19
STATEMENT OF CHANGES IN NET ASSETS (continued)
| | | | | | | | | | |
| | | | Year Ended October 31, |
| | | | 2020 | | 2019 | |
Capital Share Transactions (Shares): | |
Class Aa | | | | | | | | |
Shares sold | | | 12,394 | | | | 14,915 | |
Shares issued for distributions reinvested | | | 1,422 | | | | 4,502 | |
Shares redeemed | | | (15,119) | | | | (10,551) | |
Net Increase (Decrease) in Shares Outstanding | (1,303) | | | | 8,866 | |
Class C | | | | | | | | |
Shares sold | | | - | | | | 1,146 | |
Shares issued for distributions reinvested | | | 11 | | | | 138 | |
Shares redeemed | | | (203) | | | | (1,802) | |
Net Increase (Decrease) in Shares Outstanding | (192) | | | | (518) | |
Class Ia | | | | | | | | |
Shares sold | | | 899,012 | | | | 1,155,545 | |
Shares issued for distributions reinvested | | | 40,074 | | | | 134,352 | |
Shares redeemed | | | (1,817,195) | | | | (1,430,130) | |
Net Increase (Decrease) in Shares Outstanding | (878,109) | | | | (140,233) | |
Class Ya | | | | | | | | |
Shares sold | | | 13,534,632 | | | | 8,979,716 | |
Shares issued for distributions reinvested | | | 468,546 | | | | 2,988,063 | |
Shares redeemed | | | (22,105,798) | | | | (24,364,545) | |
Net Increase (Decrease) in Shares Outstanding | (8,102,620) | | | | (12,396,766) | |
| | | | | | | | | |
a During the period ended October 31, 2020, 582,482 Class Y shares representing $7,005,429 were exchanged for 582,672 Class I shares. During the period ended October 31, 2019, 546,459 Class Y shares representing $7,394,682 were exchanged for 546,551 Class I shares, 1,710 Class A shares representing $22,707 were exchanged for 1,709 Class I shares | |
See notes to financial statements. | | | | | | | | |
20
FINANCIAL HIGHLIGHTS
The following tables describe the performance for each share class for the fiscal periods indicated. All information (except portfolio turnover rate) reflects financial results for a single fund share. Total return shows how much your investment in the fund would have increased (or decreased) during each period, assuming you had reinvested all dividends and distributions. These figures have been derived from the fund’s financial statements.
| | | | | | | |
| | | |
| | | Year Ended October 31, |
Class A Shares | | 2020 | 2019 | 2018 | 2017 | 2016 |
Per Share Data ($): | | | | | | |
Net asset value, beginning of period | | 14.06 | 14.81 | 16.51 | 13.12 | 13.26 |
Investment Operations: | | | | | | |
Investment income—neta | | .12 | .17 | .12 | .12 | .09 |
Net realized and unrealized
gain (loss) on investments | | (1.64) | .74 | (1.56) | 3.46 | (.16) |
Total from
Investment Operations | | (1.52) | .91 | (1.44) | 3.58 | (.07) |
Distributions: | | | | | | |
Dividends from
investment income―net | | (.46) | (.19) | (.25) | (.19) | (.07) |
Dividends from net realized
gain on investment | | – | (1.47) | (.01) | – | – |
Total Distributions | | (.46) | (1.66) | (.26) | (.19) | (.07) |
Net asset value, end of period | | 12.08 | 14.06 | 14.81 | 16.51 | 13.12 |
Total Return (%)b | | (11.24) | 8.37 | (8.90) | 27.74 | (.54) |
Ratios/Supplemental Data (%): | | | | | | |
Ratio of total expenses
to average net assets | | 1.60 | 1.56 | 1.47 | 1.41 | 1.44 |
Ratio of net expenses
to average net assets | | 1.40 | 1.40 | 1.40 | 1.40 | 1.40 |
Ratio of net investment income
to average net assets | | .98 | 1.29 | .69 | .84 | .71 |
Portfolio Turnover Rate | | 86.07 | 61.08 | 71.34 | 88.11 | 117.57 |
Net Assets, end of period ($ x 1,000) | | 568 | 679 | 584 | 496 | 561 |
a Based on average shares outstanding.
b Exclusive of sales charge.
See notes to financial statements.
21
FINANCIAL HIGHLIGHTS (continued)
| | | | | | | |
| | | |
| | | Year Ended October 31, |
Class C Shares | | 2020 | 2019 | 2018 | 2017 | 2016 |
Per Share Data ($): | | | | | | |
Net asset value, beginning of period | | 13.94 | 14.68 | 16.39 | 13.02 | 13.18 |
Investment Operations: | | | | | | |
Investment income (loss)—neta | | .03 | .07 | (.01) | .01 | (.00)b |
Net realized and unrealized
gain (loss) on investments | | (1.65) | .74 | (1.53) | 3.46 | (.16) |
Total from
Investment Operations | | (1.62) | .81 | (1.54) | 3.47 | (.16) |
Distributions: | | | | | | |
Dividends from
investment income―net | | (.30) | (.08) | (.16) | (.10) | – |
Dividends from net realized
gain on investment | | – | (1.47) | (.01) | – | – |
Total Distributions | | (.30) | (1.55) | (.17) | (.10) | – |
Net asset value, end of period | | 12.02 | 13.94 | 14.68 | 16.39 | 13.02 |
Total Return (%)c | | (11.92) | 7.54 | (9.54) | 26.88 | (1.21) |
Ratios/Supplemental Data (%): | | | | | | |
Ratio of total expenses
to average net assets | | 2.27 | 2.29 | 2.15 | 2.09 | 2.12 |
Ratio of net expenses
to average net assets | | 2.15 | 2.15 | 2.10 | 2.09 | 2.12 |
Ratio of net investment
income (loss)
to average net assets | | .23 | .51 | (.03) | .07 | (.02) |
Portfolio Turnover Rate | | 86.07 | 61.08 | 71.34 | 88.11 | 117.57 |
Net Assets, end of period ($ x 1,000) | | 100 | 119 | 133 | 131 | 104 |
a Based on average shares outstanding.
b Amount represents less than $.01 per share.
c Exclusive of sales charge.
See notes to financial statements.
22
| | | | | | | |
| | | |
| | | Year Ended October 31, |
Class I Shares | | 2020 | 2019 | 2018 | 2017 | 2016 |
Per Share Data ($): | | | | | | |
Net asset value, beginning of period | | 14.08 | 14.86 | 16.57 | 13.16 | 13.28 |
Investment Operations: | | | | | | |
Investment income—neta | | .16 | .19 | .16 | .13 | .15 |
Net realized and unrealized
gain (loss) on investments | | (1.65) | .74 | (1.55) | 3.51 | (.18) |
Total from
Investment Operations | | (1.49) | .93 | (1.39) | 3.64 | (.03) |
Distributions: | | | | | | |
Dividends from
investment income―net | | (.49) | (.24) | (.31) | (.23) | (.09) |
Dividends from net realized
gain on investment | | – | (1.47) | (.01) | – | – |
Total Distributions | | (.49) | (1.71) | (.32) | (.23) | (.09) |
Net asset value, end of period | | 12.10 | 14.08 | 14.86 | 16.57 | 13.16 |
Total Return (%) | | (11.05) | 8.60 | (8.64) | 28.15 | (.23) |
Ratios/Supplemental Data (%): | | | | | | |
Ratio of total expenses
to average net assets | | 1.19 | 1.19 | 1.10 | 1.12 | 1.12 |
Ratio of net expenses
to average net assets | | 1.15 | 1.15 | 1.09 | 1.12 | 1.12 |
Ratio of net investment income
to average net assets | | 1.28 | 1.45 | .97 | .91 | 1.16 |
Portfolio Turnover Rate | | 86.07 | 61.08 | 71.34 | 88.11 | 117.57 |
Net Assets, end of period ($ x 1,000) | | 4,827 | 17,983 | 21,064 | 12,280 | 2,952 |
a Based on average shares outstanding.
See notes to financial statements.
23
FINANCIAL HIGHLIGHTS (continued)
| | | | | | | |
| | | |
| | | Year Ended October 31, |
Class Y Shares | | 2020 | 2019 | 2018 | 2017 | 2016 |
Per Share Data ($): | | | | | | |
Net asset value, beginning of period | | 14.09 | 14.87 | 16.57 | 13.17 | 13.28 |
Investment Operations: | | | | | | |
Investment income—neta | | .16 | .21 | .16 | .16 | .14 |
Net realized and unrealized
gain (loss) on investments | | (1.64) | .73 | (1.54) | 3.47 | (.16) |
Total from
Investment Operations | | (1.48) | .94 | (1.38) | 3.63 | (.02) |
Distributions: | | | | | | |
Dividends from
investment income―net | | (.50) | (.25) | (.31) | (.23) | (.09) |
Dividends from net realized
gain on investment | | – | (1.47) | (.01) | – | – |
Total Distributions | | (.50) | (1.72) | (.32) | (.23) | (.09) |
Net asset value, end of period | | 12.11 | 14.09 | 14.87 | 16.57 | 13.17 |
Total Return (%) | | (10.98) | 8.64 | (8.56) | 28.10 | (.16) |
Ratios/Supplemental Data (%): | | | | | | |
Ratio of total expenses
to average net assets | | 1.10 | 1.08 | 1.07 | 1.07 | 1.09 |
Ratio of net expenses
to average net assets | | 1.10 | 1.08 | 1.07 | 1.07 | 1.09 |
Ratio of net investment income
to average net assets | | 1.25 | 1.54 | .96 | 1.08 | 1.07 |
Portfolio Turnover Rate | | 86.07 | 61.08 | 71.34 | 88.11 | 117.57 |
Net Assets, end of period ($ x 1,000) | | 427,401 | 611,528 | 829,486 | 877,921 | 745,636 |
a Based on average shares outstanding.
See notes to financial statements.
24
NOTES TO FINANCIAL STATEMENTS
NOTE 1—Significant Accounting Policies:
BNY Mellon International Small Cap Fund (the “fund”) is a separate diversified series of BNY Mellon Stock Funds (the “Company”), which is registered under the Investment Company Act of 1940, as amended (the “Act”), as an open-end management investment company and operates as a series company currently offering two series, including the fund. The fund’s investment objective is to seek long-term growth of capital. BNY Mellon Investment Adviser, Inc. (the “Adviser”), a wholly-owned subsidiary of The Bank of New York Mellon Corporation (“BNY Mellon”), serves as the fund’s investment adviser. Mellon Investments Corporation (the “Sub-Adviser”), a wholly-owned subsidiary of BNY Mellon and an affiliate of the Adviser, serves as the fund’s sub-investment adviser.
The Company’s Board of Trustees (the “Board”) approved, effective December 31, 2019 (the “Effective Date”), the termination of the fund’s authorized Class T shares. Prior to the Effective Date, the fund did not offer such Class T shares for purchase.
BNY Mellon Securities Corporation (the “Distributor”), a wholly-owned subsidiary of the Adviser, is the distributor of the fund’s shares. The fund is authorized to issue an unlimited number of $.001 par value shares of Beneficial Interest in each of the following classes of shares: Class A, Class C, Class I and Class Y. Class A shares generally are subject to a sales charge imposed at the time of purchase. Class A shares bought without an initial sales charge as part of an investment of $1 million or more may be charged a contingent deferred sales charge (“CDSC”) of 1.00% if redeemed within one year. Class C shares are subject to a CDSC imposed on Class C shares redeemed within one year of purchase. Class C shares automatically convert to Class A shares ten years after the date of purchase, without the imposition of a sales charge. Class I and Class Y shares are sold at net asset value per share generally to institutional investors. Other differences between the classes include the services offered to and the expenses borne by each class, the allocation of certain transfer agency costs, and certain voting rights. Income, expenses (other than expenses attributable to a specific class), and realized and unrealized gains or losses on investments are allocated to each class of shares based on its relative net assets.
As of October 31, 2020, MBC Investments Corp., an indirect subsidiary of BNY Mellon, held 8,000 Class A and 8,000 Class C shares of the fund.
25
NOTES TO FINANCIAL STATEMENTS (continued)
The Company accounts separately for the assets, liabilities and operations of each series. Expenses directly attributable to each series are charged to that series’ operations; expenses which are applicable to all series are allocated among them on a pro rata basis.
The Financial Accounting Standards Board (“FASB”) Accounting Standards Codification (“ASC”) is the exclusive reference of authoritative U.S. generally accepted accounting principles (“GAAP”) recognized by the FASB to be applied by nongovernmental entities. Rules and interpretive releases of the Securities and Exchange Commission (“SEC”) under authority of federal laws are also sources of authoritative GAAP for SEC registrants. The fund is an investment company and applies the accounting and reporting guidance of the FASB ASC Topic 946 Financial Services-Investment Companies. The fund’s financial statements are prepared in accordance with GAAP, which may require the use of management estimates and assumptions. Actual results could differ from those estimates.
The Company enters into contracts that contain a variety of indemnifications. The fund’s maximum exposure under these arrangements is unknown. The fund does not anticipate recognizing any loss related to these arrangements.
(a) Portfolio valuation: The fair value of a financial instrument is the amount that would be received to sell an asset or paid to transfer a liability in an orderly transaction between market participants at the measurement date (i.e., the exit price). GAAP establishes a fair value hierarchy that prioritizes the inputs of valuation techniques used to measure fair value. This hierarchy gives the highest priority to unadjusted quoted prices in active markets for identical assets or liabilities (Level 1 measurements) and the lowest priority to unobservable inputs (Level 3 measurements).
Additionally, GAAP provides guidance on determining whether the volume and activity in a market has decreased significantly and whether such a decrease in activity results in transactions that are not orderly. GAAP requires enhanced disclosures around valuation inputs and techniques used during annual and interim periods.
Various inputs are used in determining the value of the fund’s investments relating to fair value measurements. These inputs are summarized in the three broad levels listed below:
Level 1—unadjusted quoted prices in active markets for identical investments.
26
Level 2—other significant observable inputs (including quoted prices for similar investments, interest rates, prepayment speeds, credit risk, etc.).
Level 3—significant unobservable inputs (including the fund’s own assumptions in determining the fair value of investments).
The inputs or methodology used for valuing securities are not necessarily an indication of the risk associated with investing in those securities.
Changes in valuation techniques may result in transfers in or out of an assigned level within the disclosure hierarchy. Valuation techniques used to value the fund’s investments are as follows:
Investments in equity securities are valued at the last sales price on the securities exchange or national securities market on which such securities are primarily traded. Securities listed on the National Market System for which market quotations are available are valued at the official closing price or, if there is no official closing price that day, at the last sales price. For open short positions, asked prices are used for valuation purposes. Bid price is used when no asked price is available. Registered investment companies that are not traded on an exchange are valued at their net asset value. All of the preceding securities are generally categorized within Level 1 of the fair value hierarchy.
Securities not listed on an exchange or the national securities market, or securities for which there were no transactions, are valued at the average of the most recent bid and asked prices. These securities are generally categorized within Level 2 of the fair value hierarchy.
Fair valuing of securities may be determined with the assistance of a pricing service using calculations based on indices of domestic securities and other appropriate indicators, such as prices of relevant American Depository Receipts and futures. Utilizing these techniques may result in transfers between Level 1 and Level 2 of the fair value hierarchy.
When market quotations or official closing prices are not readily available, or are determined not to accurately reflect fair value, such as when the value of a security has been significantly affected by events after the close of the exchange or market on which the security is principally traded (for example, a foreign exchange or market), but before the fund calculates its net asset value, the fund may value these investments at fair value as determined in accordance with the procedures approved by the Board. Certain factors may be considered when fair valuing investments such as: fundamental analytical data, the nature and duration of restrictions on disposition, an evaluation of the forces that influence the market in which
27
NOTES TO FINANCIAL STATEMENTS (continued)
the securities are purchased and sold, and public trading in similar securities of the issuer or comparable issuers. These securities are either categorized within Level 2 or 3 of the fair value hierarchy depending on the relevant inputs used.
For securities where observable inputs are limited, assumptions about market activity and risk are used and such securities are generally categorized within Level 3 of the fair value hierarchy.
Investments denominated in foreign currencies are translated to U.S. dollars at the prevailing rates of exchange.
The following is a summary of the inputs used as of October 31, 2020 in valuing the fund’s investments:
| | | | | | |
| | Level 1 - Unadjusted Quoted Prices | Level 2 - Other Significant Observable Inputs | | Level 3 -Significant Unobservable Inputs | Total |
Assets ($) | | | | |
Investments in Securities:† | | | | |
Equity Securities - Common Stocks | 19,215,572 | 395,988,399 | †† | - | 415,203,971 |
Equity Securities - Preferred Stocks | - | 7,716,322 | †† | - | 7,716,322 |
Exchange-Traded Funds | 1,610,147 | - | | - | 1,610,147 |
Investment Companies | 3,865,889 | - | | - | 3,865,889 |
† See Statement of Investments for additional detailed categorizations, if any.
†† Securities classified within Level 2 at period end as the values were determined pursuant to the fund’s fair valuation procedures.
(b) Foreign currency transactions: The fund does not isolate that portion of the results of operations resulting from changes in foreign exchange rates on investments from the fluctuations arising from changes in the market prices of securities held. Such fluctuations are included with the net realized and unrealized gain or loss on investments.
Net realized foreign exchange gains or losses arise from sales of foreign currencies, currency gains or losses realized on securities transactions between trade and settlement date, and the difference between the amounts of dividends, interest and foreign withholding taxes recorded on the fund’s books and the U.S. dollar equivalent of the amounts actually received or paid. Net unrealized foreign exchange gains and losses arise from changes in the value of assets and liabilities other than investments resulting from changes in exchange rates. Foreign currency gains and losses
28
on foreign currency transactions are also included with net realized and unrealized gain or loss on investments.
Foreign Taxes: The fund may be subject to foreign taxes (a portion of which may be reclaimable) on income, stock dividends, realized and unrealized capital gains on investments or certain foreign currency transactions. Foreign taxes are recorded in accordance with the fund’s understanding of the applicable foreign tax regulations and rates that exist in the foreign jurisdictions in which the fund invests. These foreign taxes, if any, are paid by the fund and are reflected in the Statement of Operations. Foreign taxes payable or deferred as of October 31, 2020, if any, are disclosed in the fund’s Statement of Assets and Liabilities.
(c) Securities transactions and investment income: Securities transactions are recorded on a trade date basis. Realized gains and losses from securities transactions are recorded on the identified cost basis. Dividend income is recognized on the ex-dividend date and interest income, including, where applicable, accretion of discount and amortization of premium on investments, is recognized on the accrual basis.
(d) Affiliated issuers: Investments in other investment companies advised by the Adviser are considered “affiliated” under the Act.
(e) Risk: Investing in foreign markets may involve special risks and considerations not typically associated with investing in the U.S. These risks include revaluation of currencies, high rates of inflation, repatriation restrictions on income and capital, and adverse political, economic developments and public health conditions. Moreover, securities issued in these markets may be less liquid, subject to government ownership controls and delayed settlements, and their prices may be more volatile than those of comparable securities in the U.S. In addition, turbulence in financial markets and reduced liquidity in equity, credit and/or fixed income markets may negatively affect many issuers, which could adversely affect the fund. Global economies and financial markets are becoming increasingly interconnected, and conditions and events in one country, region or financial market may adversely impact issuers in a different country, region or financial market. These risks may be magnified if certain events or developments adversely interrupt the global supply chain; in these and other circumstances, such risks might affect companies world-wide. Recent examples include pandemic risks related to COVID-19 and aggressive measures taken world-wide in response by governments, including closing borders, restricting international and domestic travel, and the imposition of prolonged quarantines of large populations, and by businesses, including changes to operations and reducing staff. To the
29
NOTES TO FINANCIAL STATEMENTS (continued)
extent the fund may overweight its investments in certain countries, companies, industries or market sectors, such positions will increase the fund’s exposure to risk of loss from adverse developments affecting those countries, companies, industries or sectors.
(f) Dividends and distributions to shareholders: Dividends and distributions are recorded on the ex-dividend date. Dividends from investment income-net and dividends from net realized capital gains, if any, are normally declared and paid annually, but the fund may make distributions on a more frequent basis to comply with the distribution requirements of the Internal Revenue Code of 1986, as amended (the “Code”). To the extent that net realized capital gains can be offset by capital loss carryovers, it is the policy of the fund not to distribute such gains. Income and capital gain distributions are determined in accordance with income tax regulations, which may differ from GAAP.
(g) Federal income taxes: It is the policy of the fund to continue to qualify as a regulated investment company, if such qualification is in the best interests of its shareholders, by complying with the applicable provisions of the Code, and to make distributions of taxable income and net realized capital gain sufficient to relieve it from substantially all federal income and excise taxes.
As of and during the period ended October 31, 2020, the fund did not have any liabilities for any uncertain tax positions. The fund recognizes interest and penalties, if any, related to uncertain tax positions as income tax expense in the Statement of Operations. During the period ended October 31, 2020, the fund did not incur any interest or penalties.
Each of the tax years in the four-year period ended October 31, 2020 remains subject to examination by the Internal Revenue Service and state taxing authorities.
At October 31, 2020, the components of accumulated earnings on a tax basis were as follows: undistributed ordinary income $1,359,237, accumulated capital losses $109,701,469 and unrealized depreciation $8,614,023.
The fund is permitted to carry forward capital losses for an unlimited period. Furthermore, capital loss carryovers retain their character as either short-term or long-term capital losses.
The accumulated capital loss carryover is available for federal income tax purposes to be applied against future net realized capital gains, if any, realized subsequent to October 31, 2020. The fund has $63,719,457 of
30
short-term capital losses and $45,982,012 of long-term capital losses which can be carried forward for an unlimited period.
The tax character of distributions paid to shareholders during the fiscal periods ended October 31, 2020 and October 31, 2019 were as follows: ordinary income $22,001,302 and $28,716,256 and long-term capital gains of $0 and $58,235,974, respectively.
NOTE 2—Bank Lines of Credit:
The fund participates with other long-term open-end funds managed by the Adviser in a $823.5 million unsecured credit facility led by Citibank, N.A. (the “Citibank Credit Facility”) and a $300 million unsecured credit facility provided by The Bank of New York Mellon (the “BNYM Credit Facility”), a subsidiary of BNY Mellon and an affiliate of the Adviser, each to be utilized primarily for temporary or emergency purposes, including the financing of redemptions (each, a “Facility”). The Citibank Credit Facility is available in two tranches: (i) Tranche A is in an amount equal to $688.5 million and is available to all long-term open-ended funds, including the fund, and (ii) Tranche B is an amount equal to $135 million and is available only to BNY Mellon Floating Rate Income Fund, a series of BNY Mellon Investment Funds IV, Inc. Prior to September 30, 2020, the Citibank Credit Facility was $927 million with Tranche A available in an amount equal to $747 million and Tranche B available in an amount equal to $180 million. Prior to March 11, 2020, the Citibank Credit Facility was $1.030 billion with Tranche A available in an amount equal to $830 million and Tranche B available in an amount equal to $200 million. In connection therewith, the fund has agreed to pay its pro rata portion of commitment fees for Tranche A of the Citibank Credit Facility and the BNYM Credit Facility. Interest is charged to the fund based on rates determined pursuant to the terms of the respective Facility at the time of borrowing.
The average amount of borrowings outstanding under the Facilities during the period ended October 31, 2020 was approximately $222,951 with a related weighted average annualized interest rate of 1.73%.
NOTE 3—Investment Advisory Fee, Sub-Investment Advisory Fee and Other Transactions with Affiliates:
(a) Pursuant to an investment advisory agreement with the Adviser, the investment advisory fee is computed at the annual rate of 1.00% of the value of the fund’s average daily net assets and is payable monthly. The Adviser has contractually agreed, from November 1, 2019 through February 28, 2021, to waive receipt of its fees and/or assume the direct expenses of the fund, so that the direct expenses of none of the classes (excluding Rule 12b-1 Distribution Plan fees, Shareholder Services Plan
31
NOTES TO FINANCIAL STATEMENTS (continued)
fees, taxes, interest expense, brokerage commissions, commitment fees on borrowings and extraordinary expenses) exceed 1.15% of the value of the fund’s average daily net assets. On or after February 28, 2021, the Adviser may terminate this expense limitation at any time. The reduction in expenses, pursuant to the undertaking, amounted to $5,285 during the period ended October 31, 2020.
Pursuant to a sub-investment advisory agreement between the Adviser and the Sub-Adviser, the Sub-Adviser serves as the fund’s sub-investment adviser responsible for the day-to-day management of the fund’s portfolio.The Adviser pays the sub-investment adviser a monthly fee at an annual percentage of the value of the fund’s average daily net assets. The Adviser has obtained an exemptive order from the SEC (the “Order”), upon which the fund may rely, to use a manager of managers approach that permits the Adviser, subject to certain conditions and approval by the Board, to enter into and materially amend sub-investment advisory agreements with one or more sub-investment advisers who are either unaffiliated with the Adviser or are wholly-owned subsidiaries (as defined under the Act) of the Adviser’s ultimate parent company, BNY Mellon, without obtaining shareholder approval. The Order also allows the fund to disclose the sub-investment advisory fee paid by the Adviser to any unaffiliated sub-investment adviser in the aggregate with other unaffiliated sub-investment advisers in documents filed with the SEC and provided to shareholders. In addition, pursuant to the Order, it is not necessary to disclose the sub-investment advisory fee payable by the Adviser separately to a sub-investment adviser that is a wholly-owned subsidiary of BNY Mellon in documents filed with the SEC and provided to shareholders; such fees are to be aggregated with fees payable to the Adviser. The Adviser has ultimate responsibility (subject to oversight by the Board) to supervise any sub-investment adviser and recommend the hiring, termination, and replacement of any sub-investment adviser to the Board.
During the period ended October 31, 2020, the Distributor retained $330 from commissions earned on sales of the fund’s Class A shares.
(b) Under the Distribution Plan adopted pursuant to Rule 12b-1 under the Act, Class C shares pay the Distributor for distributing its shares at an annual rate of .75% of the value of its average daily net assets. During the period ended October 31, 2020, Class C shares were charged $778 pursuant to the Distribution Plan.
(c) Under the Shareholder Services Plan, Class A and Class C shares pay the Distributor at an annual rate of .25% of the value of their average daily net assets for the provision of certain services. The services provided may include personal services relating to shareholder accounts, such as
32
answering shareholder inquiries regarding the fund and providing reports and other information, and services related to the maintenance of shareholder accounts. The Distributor may make payments to Service Agents (securities dealers, financial institutions or other industry professionals) with respect to these services. The Distributor determines the amounts to be paid to Service Agents. During the period ended October 31, 2020, Class A and Class C shares were charged $1,531 and $259, respectively, pursuant to the Shareholder Services Plan.
The fund has an arrangement with the transfer agent whereby the fund may receive earnings credits when positive cash balances are maintained, which are used to offset transfer agency fees. For financial reporting purposes, the fund includes net earnings credits, if any, as an expense offset in the Statement of Operations.
The fund has an arrangement with the custodian whereby the fund will receive interest income or be charged an overdraft fees when cash balances are maintained. For financial reporting purposes, the fund includes this interest income and overdraft fees, if any, as interest income in the Statement of Operations.
The fund compensates BNY Mellon Transfer, Inc., a wholly-owned subsidiary of the Adviser, under a transfer agency agreement for providing transfer agency and cash management services for the fund. The majority of transfer agency fees are comprised of amounts paid on a per account basis, while cash management fees are related to fund subscriptions and redemptions. During the period ended October 31, 2020, the fund was charged $4,118 for transfer agency services. These fees are included in Shareholder servicing costs in the Statement of Operations.
The fund compensates The Bank of New York Mellon under a custody agreement for providing custodial services for the fund. These fees are determined based on net assets, geographic region and transaction activity. During the period ended October 31, 2020, the fund was charged $169,340 pursuant to the custody agreement.
During the period ended October 31, 2020, the fund was charged $14,076 for services performed by the Chief Compliance Officer and his staff. These fees are included in Chief Compliance Officer fees in the Statement of Operations.
The components of “Due to BNY Mellon Investment Adviser, Inc. and affiliates” in the Statement of Assets and Liabilities consist of: Investment advisory fees of $387,955, Distribution Plan fees of $67, Shareholder Services Plan fees of $150, custodian fees of $37,500, Chief Compliance Officer fees of $4,546 and transfer agency fees of $639 which are offset
33
NOTES TO FINANCIAL STATEMENTS (continued)
against an expense reimbursement currently in effect in the amount of $396.
(d) Each Board member also serves as a Board member of other funds in the BNY Mellon Family of Funds complex. Annual retainer fees and attendance fees are allocated to each fund based on net assets.
NOTE 4—Securities Transactions:
The aggregate amount of purchases and sales of investment securities, excluding short-term securities and forward foreign currency exchange contracts (“forward contracts”), during the period ended October 31, 2020, amounted to $404,660,371 and $503,238,618, respectively.
Derivatives: A derivative is a financial instrument whose performance is derived from the performance of another asset. The fund enters into International Swaps and Derivatives Association, Inc. Master Agreements or similar agreements (collectively, “Master Agreements”) with its over-the-counter (“OTC”) derivative contract counterparties in order to, among other things, reduce its credit risk to counterparties. Master Agreements include provisions for general obligations, representations, collateral and events of default or termination. Under a Master Agreement, the fund may offset with the counterparty certain derivative financial instruments’ payables and/or receivables with collateral held and/or posted and create one single net payment in the event of default or termination.
Each type of derivative instrument that was held by the fund during the period ended October 31, 2020 is discussed below.
Forward Foreign Currency Exchange Contracts: The fund enters into forward contracts in order to hedge its exposure to changes in foreign currency exchange rates on its foreign portfolio holdings, to settle foreign currency transactions or as a part of its investment strategy. When executing forward contracts, the fund is obligated to buy or sell a foreign currency at a specified rate on a certain date in the future. With respect to sales of forward contracts, the fund incurs a loss if the value of the contract increases between the date the forward contract is opened and the date the forward contract is closed. The fund realizes a gain if the value of the contract decreases between those dates. With respect to purchases of forward contracts, the fund incurs a loss if the value of the contract decreases between the date the forward contract is opened and the date the forward contract is closed. The fund realizes a gain if the value of the contract increases between those dates. Any realized or unrealized gains or losses which occurred during the period are reflected in the Statement of Operations. The fund is exposed to foreign currency risk as a result of changes in value of underlying financial instruments. The fund is also
34
exposed to credit risk associated with counterparty nonperformance on these forward contracts, which is generally limited to the unrealized gain on each open contract. This risk may be mitigated by Master Agreements, if any, between the fund and the counterparty and the posting of collateral, if any, by the counterparty to the fund to cover the fund’s exposure to the counterparty. At October 31, 2020, there were no forward contracts outstanding.
The following summarizes the average market value of derivatives outstanding during the period ended October 31, 2020:
| | | |
| | Average Market Value ($) |
Forward contracts | | 268,126 |
| | |
At October 31, 2020, the cost of investments for federal income tax purposes was $437,053,094; accordingly, accumulated net unrealized depreciation on investments was $8,656,765 consisting of $60,989,827 gross unrealized appreciation and $69,646,592 gross unrealized depreciation.
35
REPORT OF INDEPENDENT REGISTERED PUBLIC ACCOUNTING FIRM
To the Shareholders and the Board of Trustees of BNY Mellon International Small Cap Fund
Opinion on the Financial Statements
We have audited the accompanying statement of assets and liabilities of BNY Mellon International Small Cap Fund (the “Fund”) (one of the funds constituting BNY Mellon Stock Funds), including the statements of investments and investments in affiliated issuers, as of October 31, 2020, and the related statement of operations for the year then ended, the statements of changes in net assets for each of the two years in the period then ended, the financial highlights for each of the five years in the period then ended and the related notes (collectively referred to as the “financial statements”). In our opinion, the financial statements present fairly, in all material respects, the financial position of the Fund (one of the funds constituting BNY Mellon Stock Funds) at October 31, 2020, the results of its operations for the year then ended, the changes in its net assets for each of the two years in the period then ended and its financial highlights for each of the five years in the period then ended, in conformity with U.S. generally accepted accounting principles.
Basis for Opinion
These financial statements are the responsibility of the Fund’s management. Our responsibility is to express an opinion on the Fund’s financial statements based on our audits. We are a public accounting firm registered with the Public Company Accounting Oversight Board (United States) (“PCAOB”) and are required to be independent with respect to the Fund in accordance with the U.S. federal securities laws and the applicable rules and regulations of the Securities and Exchange Commission and the PCAOB.
We conducted our audits in accordance with the standards of the PCAOB. Those standards require that we plan and perform the audit to obtain reasonable assurance about whether the financial statements are free of material misstatement, whether due to error or fraud. The Fund is not required to have, nor were we engaged to perform, an audit of the Fund’s internal control over financial reporting. As part of our audits, we are required to obtain an understanding of internal control over financial reporting, but not for the purpose of expressing an opinion on the effectiveness of the Fund’s internal control over financial reporting. Accordingly, we express no such opinion.
Our audits included performing procedures to assess the risks of material misstatement of the financial statements, whether due to error or fraud, and performing procedures that respond to those risks. Such procedures included examining, on a test basis, evidence regarding the amounts and disclosures in the financial statements. Our procedures included confirmation of securities owned as of October 31, 2020, by correspondence with the custodian and others or by other appropriate auditing procedures where replies from others were not received. Our audits also included evaluating the accounting principles used and significant estimates made by management, as well as evaluating the overall presentation of the financial statements. We believe that our audits provide a reasonable basis for our opinion.

We have served as the auditor of one or more investment companies in the BNY Mellon Family of Funds since at least 1957, but we are unable to determine the specific year.
New York, New York
December 23, 2020
36
IMPORTANT TAX INFORMATION (Unaudited)
In accordance with federal tax law, the fund elects to provide each shareholder with their portion of the fund’s foreign taxes paid and the income sourced from foreign countries. Accordingly, the fund hereby reports the following information regarding its fiscal year ended October 31, 2020
- the total amount of taxes paid to foreign countries was $1,008,977
- the total amount of income sourced from foreign countries was $12,126,421
Where required by federal tax law rules, shareholders will receive notification of their proportionate share of foreign taxes paid and foreign sourced income for the 2020 calendar year with Form 1099-DIV which will be mailed in early 2021.
For the fiscal year ended October 31, 2020, certain dividends paid by the fund may be subject to a maximum tax rate of 15%, as provided for by the Jobs and Growth Tax Relief Reconciliation Act of 2003. Of the distributions paid during the fiscal year, $15,820,230 represents the maximum amount that may be considered qualified dividend income.
37
INFORMATION ABOUT THE RENEWAL OF THE FUND’S MANAGEMENT AND SUB-INVESTMENT ADVISORY AGREEMENTS (Unaudited)
At a meeting of the fund’s Board of Trustees held on May 11, 2020, the Board considered the renewal of the fund’s Management Agreement pursuant to which the Adviser provides the fund with investment advisory and administrative services (the “Agreement”), and the Sub-Investment Advisory Agreement (together, the “Agreements”), pursuant to which Mellon Investments Corporation (the “Subadviser”) provides day-to-day management of the fund’s investments. The Board members, none of whom are “interested persons” (as defined in the Investment Company Act of 1940, as amended) of the fund, were assisted in their review by independent legal counsel and met with counsel in executive session separate from representatives of the Adviser and the Subadviser. In considering the renewal of the Agreements, the Board considered several factors that it believed to be relevant, including those discussed below. The Board did not identify any one factor as dispositive, and each Board member may have attributed different weights to the factors considered.
Analysis of Nature, Extent, and Quality of Services Provided to the Fund. The Board considered information provided to it at the meeting and in previous presentations from representatives of the Adviser regarding the nature, extent, and quality of the services provided to funds in the BNY Mellon fund complex, including the fund. The Adviser provided the number of open accounts in the fund, the fund’s asset size and the allocation of fund assets among distribution channels. The Adviser also had previously provided information regarding the diverse intermediary relationships and distribution channels of funds in the BNY Mellon fund complex (such as retail direct or intermediary, in which intermediaries typically are paid by the fund and/or the Adviser) and the Adviser’s corresponding need for broad, deep, and diverse resources to be able to provide ongoing shareholder services to each intermediary or distribution channel, as applicable to the fund.
The Board also considered research support available to, and portfolio management capabilities of, the fund’s portfolio management personnel and that the Adviser also provides oversight of day-to-day fund operations, including fund accounting and administration and assistance in meeting legal and regulatory requirements. The Board also considered the Adviser’s extensive administrative, accounting and compliance infrastructures, as well as the Adviser’s supervisory activities over the Subadviser. The Board also considered portfolio management’s brokerage policies and practices (including policies and practices regarding soft dollars) and the standards applied in seeking best execution.
Comparative Analysis of the Fund’s Performance and Management Fee and Expense Ratio. The Board reviewed reports prepared by Broadridge Financial Solutions, Inc. (“Broadridge”), an independent provider of investment company data based on classifications provided by Thomson Reuters Lipper, which included information comparing (1) the performance of the fund’s Class I shares with the performance of a group of institutional international small-/mid-cap growth funds selected by Broadridge as comparable to the fund (the “Performance Group”) and with a broader group of
38
retail and institutional international small-/mid-cap growth funds (the “Performance Universe”), all for various periods ended March 31, 2020, and (2) the fund’s actual and contractual management fees and total expenses with those of the same group of funds in the Performance Group (the “Expense Group”) and with a broader group of institutional international small-/mid-cap growth funds, excluding outliers (the “Expense Universe”), the information for which was derived in part from fund financial statements available to Broadridge as of the date of its analysis. The Adviser previously had furnished the Board with a description of the methodology Broadridge used to select the Performance Group and Performance Universe and the Expense Group and Expense Universe.
Performance Comparisons. Representatives of the Adviser stated that the usefulness of performance comparisons may be affected by a number of factors, including different investment limitations and policies that may be applicable to the fund and comparison funds and the end date selected. The Board discussed with representatives of the Adviser and the Subadviser the results of the comparisons and considered that the fund’s total return performance was below the Performance Group and Performance Universe medians for all periods shown. The Adviser also provided a comparison of the fund’s calendar year total returns to the returns of the fund’s benchmark index, and it was noted that the fund’s return was above the returns of the index in one of the four periods shown.
Management Fee and Expense Ratio Comparisons. The Board reviewed and considered the contractual management fee rate payable by the fund to the Adviser in light of the nature, extent and quality of the management and sub-advisory services provided by the Adviser and the Subadviser, respectively. In addition, the Board reviewed and considered the actual management fee rate paid by the fund.
The Board also reviewed the range of actual and contractual management fees and total expenses as a percentage of average net assets of the Expense Group and Expense Universe funds and discussed the results of the comparisons. The Board considered that the fund’s contractual management fee was equal to the Expense Group median contractual management fee, the fund’s actual management fee was lower than the Expense Group median and higher than the Expense Universe median actual management fee and the fund’s total expenses were lower than the Expense Group median and Expense Universe median total expenses.
Representatives of the Adviser stated that the Adviser has contractually agreed, until February 28, 2021, to waive receipt of its fees and/or assume the direct expenses of the fund so that the direct expenses of none of its classes (excluding Rule 12b-1 fees, shareholder services fees, taxes, interest, brokerage commissions, commitment fees on borrowings and extraordinary expenses) exceed 1.15% of the fund’s average daily net assets.
Representatives of the Adviser reviewed with the Board the management or investment advisory fees paid to the Adviser or the Subadviser or its affiliates for advising any separate accounts and/or other types of client portfolios that are considered to have
39
INFORMATION ABOUT THE RENEWAL OF THE FUND’S MANAGEMENT AND SUB-INVESTMENT ADVISORY AGREEMENTS (Unaudited) (continued)
similar investment strategies and policies as the fund (the “Similar Clients”), and explained the nature of the Similar Clients. They discussed differences in fees paid and the relationship of the fees paid in light of any differences in the services provided and other relevant factors. The Board considered the relevance of the fee information provided for the Similar Clients to evaluate the appropriateness of the fund’s management fee. Representatives of the Adviser noted that there were no other funds advised or administered by the Adviser that are in the same Lipper category as the fund.
The Board considered the fee to the Subadviser in relation to the fee paid to the Adviser by the fund and the respective services provided by the Subadviser and the Adviser. The Board also took into consideration that the Subadviser’s fee is paid by the Adviser (out of its fee from the fund) and not the fund.
Analysis of Profitability and Economies of Scale. Representatives of the Adviser reviewed the expenses allocated and profit received by the Adviser and its affiliates and the resulting profitability percentage for managing the fund and the aggregate profitability percentage to the Adviser and its affiliates for managing the funds in the BNY Mellon fund complex, and the method used to determine the expenses and profit. The Board concluded that the profitability results were not excessive, given the services rendered and service levels provided by the Adviser and its affiliates. The Board also had been provided with information prepared by an independent consulting firm regarding the Adviser’s approach to allocating costs to, and determining the profitability of, individual funds and the entire BNY Mellon fund complex. The consulting firm also had analyzed where any economies of scale might emerge in connection with the management of a fund.
The Board considered on the advice of its counsel the profitability analysis (1) as part of its evaluation of whether the fees under the Agreements, considered in relation to the mix of services provided by the Adviser and the Subadviser, including the nature, extent and quality of such services, supported the renewal of the Agreements and (2) in light of the relevant circumstances for the fund and the extent to which economies of scale would be realized if the fund grows and whether fee levels reflect these economies of scale for the benefit of fund shareholders. Since the Adviser, and not the fund, pays the Subadviser pursuant to the Sub-Investment Advisory Agreement, the Board did not consider the Subadviser’s profitability to be relevant to its deliberations. Representatives of the Adviser stated that a discussion of economies of scale is predicated on a fund having achieved a substantial size with increasing assets and that, if a fund’s assets had been stable or decreasing, the possibility that the Adviser may have realized any economies of scale would be less. Representatives of the Adviser also stated that, as a result of shared and allocated costs among funds in the BNY Mellon fund complex, the extent of economies of scale could depend substantially on the level of assets in the complex as a whole, so that increases and decreases in complex-wide assets can affect potential economies of scale in a manner that is disproportionate to, or even in the opposite direction from, changes in the fund’s asset level. The Board also considered potential benefits to the Adviser and the Subadviser from acting as investment adviser
40
and sub-investment adviser, respectively, and took into consideration the soft dollar arrangements in effect for trading the fund’s investments.
At the conclusion of these discussions, the Board agreed that it had been furnished with sufficient information to make an informed business decision with respect to the renewal of the Agreements. Based on the discussions and considerations as described above, the Board concluded and determined as follows.
· The Board concluded that the nature, extent and quality of the services provided by the Adviser and the Subadviser are adequate and appropriate.
· The Board agreed to closely monitor performance and determined to approve renewal of the Agreements for the remainder of the one-year term.
· The Board concluded that the fees paid to the Adviser and the Subadviser continued to be appropriate under the circumstances and in light of the factors and the totality of the services provided as discussed above, subject to review no later than the next renewal consideration.
· The Board determined that the economies of scale which may accrue to the Adviser and its affiliates in connection with the management of the fund had been adequately considered by the Adviser in connection with the fee rate charged to the fund pursuant to the Agreement and that, to the extent in the future it were determined that material economies of scale had not been shared with the fund, the Board would seek to have those economies of scale shared with the fund.
In evaluating the Agreements, the Board considered these conclusions and determinations and also relied on its previous knowledge, gained through meetings and other interactions with the Adviser and its affiliates and the Subadviser, of the Adviser and the Subadviser and the services provided to the fund by the Adviser and the Subadviser. The Board also relied on information received on a routine and regular basis throughout the year relating to the operations of the fund and the investment management and other services provided under the Agreements, including information on the investment performance of the fund in comparison to similar mutual funds and benchmark performance indices; general market outlook as applicable to the fund; and compliance reports. In addition, the Board’s consideration of the contractual fee arrangements for the fund had the benefit of a number of years of reviews of the Agreements for the fund, or substantially similar agreements for other BNY Mellon funds that the Board oversees, during which lengthy discussions took place between the Board and representatives of the Adviser. Certain aspects of the arrangements may receive greater scrutiny in some years than in others, and the Board’s conclusions may be based, in part, on their consideration of the fund’s arrangements, or substantially similar arrangements for other BNY Mellon funds that the Board oversees, in prior years. The Board determined to renew the Agreements for the remainder of the one-year term.
41
LIQUIDITY RISK MANAGEMENT PROGRAM (Unaudited)
Effective June 1, 2019, the fund adopted a liquidity risk management program (the “Liquidity Risk Management Program”) pursuant to the requirements of Rule 22e-4 under the Investment Company Act of 1940, as amended. Rule 22e-4 requires registered open-end funds, including mutual funds and exchange-traded funds but not money market funds, to establish liquidity risk management programs in order to effectively manage fund liquidity and shareholder redemptions. The rule is designed to mitigate the risk that a fund could not meet redemption requests without significantly diluting the interests of remaining investors.
The rule requires the funds to assess, manage and review their liquidity risk at least annually considering applicable factors such as investment strategy and liquidity during normal and foreseeable stressed conditions, including whether the strategy is appropriate for an open-end fund and whether the fund has a relatively concentrated portfolio or large positions in particular issuers. The fund must also assess its use of borrowings and derivatives, short-term and long-term cash flow projections in normal and stressed conditions, holdings of cash and cash equivalents, and borrowing arrangements and other funding sources.
The rule also requires the fund to classify its investments as highly liquid, moderately liquid, less liquid or illiquid based on the number of days the fund expects it would take to liquidate the investment, and to review these classifications at least monthly or more often under certain conditions. The periods range from three or fewer business days for a highly liquid investment to greater than seven calendar days for settlement of a less liquid investment. Illiquid investments are those a fund does not expect to be able to sell or dispose of within seven calendar days without significantly changing the market value. The fund is prohibited from acquiring an investment if, after the acquisition, its holdings of illiquid assets will exceed 15% of its net assets. In addition, if a fund permits redemptions in-kind, the rule requires the fund to establish redemption in-kind policies and procedures governing how and when it will engage in such redemptions.
Pursuant to the rule’s requirements, the Liquidity Risk Management Program has been reviewed and approved by the fund’s board. Furthermore, the board has received a written report prepared by the Program’s Administrator that addresses the operation of the Program, assesses its adequacy and effectiveness and describes any material changes made to the Program.
Assessment of Program
In the opinion of the Program Administrator, the Program approved by the fund board continues to be adequate for the fund and the Program has been implemented effectively. The Program Administrator has monitored the fund’s liquidity risk and the liquidity classification of the securities held by the fund and has determined that the Program is operating effectively.
During the period from June 1, 2019 to March 31, 2020, there were no material changes to the Program and no material liquidity events that impacted the fund. During the period, the fund held sufficient highly liquid assets to meet fund redemptions.
42
Under normal expected foreseeable fund redemption forecasts and foreseeable stressed fund redemption forecasts, the Program Administrator believes that the fund maintains sufficient highly liquid assets to meet expected fund redemptions.
43
BOARD MEMBERS INFORMATION (Unaudited)
INDEPENDENT BOARD MEMBERS
Joseph S. DiMartino (77)
Chairman of the Board (2003)
Principal Occupation During Past 5 Years:
· Director and Trustee of funds in the BNY Mellon Family of Funds and certain other entities (as described in the fund’s Statement of Additional Information) (1995-Present)
Other Public Company Board Memberships During Past 5 Years:
· CBIZ, Inc., a public company providing professional business services, products and solutions, Director (1997-Present)
No. of Portfolios for which Board Member Serves: 110
———————
Joni Evans (78)
Board Member (2006)
Principal Occupation During Past 5 Years:
· Chief Executive Officer, www.wowOwow.com, an online community dedicated to women’s conversations and publications (2007-Present)
· Principal, Joni Evans Ltd. (publishing) (2006-Present)
No. of Portfolios for which Board Member Serves: 18
———————
Joan Gulley (73)
Board Member (2017)
Principal Occupation During Past 5 Years:
· PNC Financial Services Group, Inc.(1993-2014), Executive Vice President and Chief Human Resources Officer and Executive Committee Member (2008-2014)
· Director, Nantucket Library (2015-Present)
No. of Portfolios for which Board Member Serves: 43
———————
Alan H. Howard (61)
Board Member (2018)
Principal Occupation During Past 5 Years:
· Managing Partner of Heathcote Advisors LLC, a financial advisory services firm (2008 – Present)
· President of Dynatech/MPX Holdings LLC (2012 – 2019), a global supplier and service provider of military aircraft parts, including Board Member of two operating subsidiaries, Dynatech International LLC and Military Parts Exchange LLC (2012-2019); Chief Executive Officer of an operating subsidiary, Dynatech International LLC (2013 – 2019)
· Senior Advisor, Rossoff & Co., an independent investment banking firm (2013 – Present)
Other Public Company Board Memberships During Past 5 Years:
· Diamond Offshore Drilling, Inc., a public company that provides contract drilling services, Director (2020-Present)
44
· Movado Group, Inc., a public company that designs, sources, markets and distributes watches, Director (1997-Present)
No. of Portfolios for which Board Member Serves: 18
———————
Robin A. Melvin (57)
Board Member (2003)
Principal Occupation During Past 5 Years:
· Trustee, Westover School, a private girls’ boarding school in Middlebury, Connecticut (2019 – Present); Co-chairman, Mentor Illinois, a non-profit organization dedicated to increasing the quality of mentoring services in Illinois (2014 – 2020); Board member, Mentor Illinois (2013 – 2020)
No. of Portfolios for which Board Member Serves: 88
———————
Burton N. Wallack (69)
Board Member (2006)
Principal Occupation During Past 5 Years:
President and Co-owner of Wallack Management Company, a real estate management company (1987-Present)
Mount Sinai Hospital Urology Board Member (2017-Present)
No. of Portfolios for which Board Member Serves: 18
———————
Benaree Pratt Wiley (74)
Board Member (2003)
Principal Occupation During Past 5 Years:
· Principal, The Wiley Group, a firm specializing in strategy and business development (2005-Present)
Other Public Company Board Memberships During Past 5 Years:
· CBIZ, Inc., a public company providing professional business services, products and solutions, Director (2008-Present)
· Blue Cross Blue Shield of Massachusetts Director (2004-Present)
No. of Portfolios for which Board Member Serves: 72
———————
45
BOARD MEMBERS INFORMATION (Unaudited) (continued)
INTERESTED BOARD MEMBER
Gordon J. Davis (79)
Board Member (2006)
Principal Occupation During Past 5 Years:
· Partner in the law firm of Venable LLP (2012-Present)
No. of Portfolios for which Board Member Serves: 50
Gordon J. Davis is deemed to be an “interested person” (as defined under the Act) of the Company as a result of his affiliation with Venable LLP, which provides legal services to the Company.
———————
Once elected all Board Members serve for an indefinite term, but achieve Emeritus status upon reaching age 80. The address of the Board Members and Officers is c/o BNY Mellon Investment Adviser, Inc. 240 Greenwich Street, New York, New York 10286. Additional information about the Board Members is available in the fund’s Statement of Additional Information which can be obtained from the Adviser free of charge by calling this toll free number: 1-800-373-9387.
William Hodding Carter III, Emeritus Board Member
Ehud Houminer, Emeritus Board Member
Hans C. Mautner, Emeritus Board Member
46
OFFICERS OF THE FUND (Unaudited)
RENEE LAROCHE-MORRIS, President since May 2019.
President and a director of BNY Mellon Investment Adviser, Inc. since January 2018. She is an officer of 61 investment companies (comprised of 110 portfolios) managed by the Adviser. She is 49 years old and has been an employee of BNY Mellon since 2003.
JAMES WINDELS, Treasurer since November 2001.
Director-BNY Mellon Fund Administration, and an officer of 63 investment companies (comprised of 141 portfolios) managed by the Adviser or an affiliate of the Adviser. He is 62 years old and has been an employee of the Adviser since April 1985.
BENNETT A. MACDOUGALL, Chief Legal Officer since October 2015.
Chief Legal Officer of the Adviser and Associate General Counsel and Managing Director of BNY Mellon since June 2015; Director and Associate General Counsel of Deutsche Bank–Asset & Wealth Management Division from June 2005 to June 2015, and as Chief Legal Officer of Deutsche Investment Management Americas Inc. from June 2012 to May 2015. He is an officer of 63 investment companies (comprised of 141 portfolios) managed by the Adviser or an affiliate of the Adviser. He is 49 years old and has been an employee of the Adviser since June 2015.
DAVID DIPETRILLO, Vice President since May 2019.
Head of North America Product, BNY Mellon Investment Management since January 2018, Director of Product Strategy, BNY Mellon Investment Management from January 2016 to December 2017; Head of US Retail Product and Channel Marketing, BNY Mellon Investment Management from January 2014 to December 2015. He is an officer of 62 investment companies (comprised of 118 portfolios) managed by the Adviser or an affiliate of the Adviser. He is 42 years old and has been an employee of BNY Mellon since 2005.
JAMES BITETTO, Vice President since August 2005 and Secretary since February 2018.
Senior Managing Counsel of BNY Mellon since December 2019; Managing Counsel of BNY Mellon from April 2014 to December 2019; Secretary of the Adviser, and an officer of 63 investment companies (comprised of 141 portfolios) managed by the Adviser or an affiliate of the Adviser. He is 54 years old and has been an employee of the Adviser since December 1996.
SONALEE CROSS, Vice President and Assistant Secretary since March 2018.
Counsel of BNY Mellon since October 2016; Associate at Proskauer Rose LLP from April 2016 to September 2016; Attorney at EnTrust Capital from August 2015 to February 2016; Associate at Sidley Austin LLP from September 2013 to August 2015. She is an officer of 63 investment companies (comprised of 141 portfolios) managed by the Adviser or an affiliate of the Adviser. She is 33 years old and has been an employee of the Adviser since October 2016.
DEIRDRE CUNNANE, Vice President and Assistant Secretary since March 2019.
Counsel of BNY Mellon since August 2018; Senior Regulatory Specialist at BNY Mellon Investment Management Services from February 2016 to August 2018; Trustee Associate at BNY Mellon Trust Company (Ireland) Limited from August 2013 to February 2016. She is an officer of 63 investment companies (comprised of 141 portfolios) managed by the Adviser or an affiliate of the Adviser. She is 30 years old and has been an employee of the Adviser since August 2018.
SARAH S. KELLEHER, Vice President and Assistant Secretary since April 2014.
Managing Counsel of BNY Mellon since December 2017, Senior Counsel of BNY Mellon from March 2013 to December 2017. She is an officer of 63 investment companies (comprised of 141 portfolios) managed by the Adviser or an affiliate of the Adviser. She is 45 years old and has been an employee of the Adviser since March 2013.
JEFF PRUSNOFSKY, Vice President and Assistant Secretary since August 2005.
Senior Managing Counsel of BNY Mellon, and an officer of 63 investment companies (comprised of 141 portfolios) managed by the Adviser or an affiliate of the Adviser. He is 55 years old and has been an employee of the Adviser since October 1990.
47
OFFICERS OF THE FUND (Unaudited) (continued)
AMANDA QUINN, Vice President and Assistant Secretary since March 2020.
Counsel of BNY Mellon since June 2019; Regulatory Administration Manager at BNY Mellon Investment Management Services from September 2018 to May 2019; Senior Regulatory Specialist at BNY Mellon Investment Management Services from April 2015 to August 2018. She is an officer of 63 investment companies (comprised of 141 portfolios) managed by the Adviser or an affiliate of the Adviser. She is 35 years old and has been an employee of the Adviser since June 2019.
PETER M. SULLIVAN, Vice President and Assistant Secretary since March 2019.
Managing Counsel of BNY Mellon since March 2009, Senior Counsel of BNY Mellon from April 2004 to March 2009, and an officer of 63 investment companies (comprised of 141 portfolios) managed by the Adviser or an affiliate of the Adviser. He is 52 years old and has been an employee of the Adviser since January 2019.
NATALYA ZELENSKY, Vice President and Assistant Secretary since March 2017.
Managing Counsel of BNY Mellon since December 2019; Counsel of BNY Mellon from May 2016 to December 2019; Attorney at Wildermuth Endowment Strategy Fund/Wildermuth Advisory, LLC from November 2015 to May 2016 and Assistant General Counsel at RCS Advisory Services from July 2014 to November 2015. She is an officer of 63 investment companies (comprised of 141 portfolios) managed by the Adviser or an affiliate of the Adviser. She is 35 years old and has been an employee of the Adviser since May 2016.
GAVIN C. REILLY, Assistant Treasurer since December 2005.
Tax Manager-BNY Mellon Fund Administration, and an officer of 63 investment companies (comprised of 141 portfolios) managed by the Adviser or an affiliate of the Adviser. He is 52 years old and has been an employee of the Adviser since April 1991.
ROBERT S. ROBOL, Assistant Treasurer since August 2005.
Senior Accounting Manager-BNY Mellon Fund Administration, and an officer of 63 investment companies (comprised of 141 portfolios) managed by the Adviser or an affiliate of the Adviser. He is 56 years old and has been an employee of the Adviser since October 1988.
ROBERT SALVIOLO, Assistant Treasurer since July 2007.
Senior Accounting Manager–BNY Mellon Fund Administration, and an officer of 63 investment companies (comprised of 141 portfolios) managed by the Adviser or an affiliate of the Adviser. He is 53 years old and has been an employee of the Adviser since June 1989.
ROBERT SVAGNA, Assistant Treasurer since December 2002.
Senior Accounting Manager–BNY Mellon Fund Administration, and an officer of 63 investment companies (comprised of 141 portfolios) managed by the Adviser or an affiliate of the Adviser. He is 53 years old and has been an employee of the Adviser since November 1990.
JOSEPH W. CONNOLLY, Chief Compliance Officer since October 2004.
Chief Compliance Officer of the Adviser, the BNY Mellon Family of Funds and BNY Mellon Funds Trust (62 investment companies, comprised of 133 portfolios). He is 63 years old and has served in various capacities with the Adviser since 1980, including manager of the firm’s Fund Accounting Department from 1997 through October 2001.
CARIDAD M. CAROSELLA, Anti-Money Laundering Compliance Officer since January 2016.
Anti-Money Laundering Compliance Officer of the BNY Mellon Family of Funds and BNY Mellon Funds Trust since January 2016; from May 2015 to December 2015, Interim Anti-Money Laundering Compliance Officer of the BNY Mellon Family of Funds and BNY Mellon Funds Trust and the Distributor; from January 2012 to May 2015, AML Surveillance Officer of the Distributor. She is an officer of 56 investment companies (comprised of 134 portfolios) managed by the Adviser or an affiliate of the Adviser. She is 52 years old and has been an employee of the Distributor since 1997.
48
This page intentionally left blank.
49
BNY Mellon International Small Cap Fund
240 Greenwich Street
New York, NY 10286
Adviser
BNY Mellon Investment Adviser, Inc.
240 Greenwich Street
New York, NY 10286
Sub-Adviser
Mellon Investments Corporation
BNY Mellon Center
One Boston Place
Boston, MA 02108-4408
Custodian
The Bank of New York Mellon
240 Greenwich Street
New York, NY 10286
Transfer Agent &
Dividend Disbursing Agent
BNY Mellon Transfer, Inc.
240 Greenwich Street
New York, NY 10286
Distributor
BNY Mellon Securities Corporation
240 Greenwich Street
New York, NY 10286
| | |
Ticker Symbols: | Class A: DYAPX Class C: DYCPX Class I: DYIPX Class Y: DYYPX |
Telephone Call your financial representative or 1-800-373-9387
Mail The BNY Mellon Family of Funds, 144 Glenn Curtiss Boulevard, Uniondale, NY 11556-0144
E-mail Send your request to info@bnymellon.com
Internet Information can be viewed online or downloaded at www.bnymellonim.com/us
The fund files its complete schedule of portfolio holdings with the Securities and Exchange Commission (“SEC”) for the first and third quarters of each fiscal year on Form N-PORT. The fund’s Forms N-PORT are available on the SEC’s website at www.sec.gov.
A description of the policies and procedures that the fund uses to determine how to vote proxies relating to portfolio securities and information regarding how the fund voted these proxies for the most recent 12-month period ended June 30 is available at www.bnymellonim.com/us and on the SEC’s website at www.sec.gov and without charge, upon request, by calling 1-800-373-9387.
| | |
© 2020 BNY Mellon Securities Corporation
4006AR1020 | 
|

