UNITED STATES
SECURITIES AND EXCHANGE COMMISSION
Washington, D.C. 20549
Form 10-K
(Mark One)
| þ | ANNUAL REPORT PURSUANT TO SECTION 13 OR 15(d) OF THE SECURITIES EXCHANGE ACT OF 1934 |
For the fiscal year ended December 31, 2008
or
| ¨ | TRANSITION REPORT PURSUANT TO SECTION 13 OR 15(d) OF THE SECURITIES EXCHANGE ACT OF 1934 |
For the transition period from to
Commission File Number 001-31717
Maguire Properties, Inc.
(Exact name of registrant as specified in its charter)
| | |
| Maryland | | 04-3692625 |
State or other jurisdiction of incorporation or organization | | (I.R.S. Employer Identification No.) |
| |
355 South Grand Avenue, Suite 3300 Los Angeles, California | | 90071 |
| (Address of principal executive offices) | | (Zip Code) |
Registrant’s telephone number, including area code 213-626-3300
Securities registered pursuant to Section 12(b) of the Act:
| | |
Title of each class | | Name of each exchange on which registered |
| Common Stock, $0.01 par value per share | | New York Stock Exchange |
| Series A Preferred Stock, $0.01 par value per share | | New York Stock Exchange |
Securities registered pursuant to Section 12(g) of the Act: None
Indicate by check mark if the registrant is a well-known seasoned issuer, as defined in Rule 405 of the Securities Act. Yes ¨ No þ
Indicate by check mark if the registrant is not required to file reports pursuant to Section 13 or Section 15(d) of the Act. Yes ¨ No þ
Indicate by check mark whether the registrant (1) has filed all reports required to be filed by Section 13 or 15(d) of the Securities Exchange Act of 1934 during the preceding 12 months (or for such shorter period that the registrant was required to file such reports), and (2) has been subject to such filing requirements for the past 90 days. Yes þ No ¨
Indicate by check mark if disclosure of delinquent filers pursuant to Item 405 of Regulation S-K (§229.405 of this chapter) is not contained herein, and will not be contained, to the best of registrant’s knowledge, in definitive proxy or information statements incorporated by reference in Part III of this Form 10-K or any amendment to this Form 10-K. ¨
Indicate by check mark whether the registrant is a large accelerated filer, an accelerated filer, a non-accelerated filer, or a smaller reporting company. See the definitions of “large accelerated filer,” “accelerated filer” and “smaller reporting company” in Rule 12b-2 of the Exchange Act. (Check one):
Large accelerated filer ¨ Accelerated filer þ Non-accelerated filer ¨ Smaller reporting company ¨
Indicate by check mark whether the registrant is a shell company (as defined in Rule 12b-2 of the Act). Yes ¨ No þ
The aggregate market value of the voting and non-voting common equity held by non-affiliates calculated using the market price as of the close of business on June 30, 2008 was $492,844,450.
Indicate the number of shares outstanding of each of the registrant’s classes of common stock, as of the latest practicable date.
| | |
Class | | Outstanding as of March 13, 2009 |
| Common Stock, $0.01 par value per share | | 47,981,347 shares |
DOCUMENTS INCORPORATED BY REFERENCE
Portions of the Maguire Properties, Inc. 2009 Notice of Annual Meeting of Stockholders and Proxy Statement or Annual Report on Form 10-K/A, to be filed with the Securities and Exchange Commission (“SEC”) within 120 days after the close of the registrant’s fiscal year (incorporated into Part III).
PART I
Our Company
The terms “Maguire Properties,” the “Company,” “us,” “we” and “our” as used in this Annual Report on Form 10-K refer to Maguire Properties, Inc., which was incorporated in Maryland in 2002. Through our controlling interest in Maguire Properties, L.P. (our “Operating Partnership”), of which we are the sole general partner and hold an approximate 87.8% interest, and the subsidiaries of our Operating Partnership, including Maguire Properties TRS Holdings, Inc., Maguire Properties TRS Holdings II, Inc., and Maguire Properties Services, Inc. and its subsidiaries (collectively known as the “Services Companies”), we own, manage, lease, acquire and develop real estate. We are a self-administered and self-managed real estate investment trust (“REIT”), and we operate as a REIT for federal income tax purposes. We are the largest owner and operator of Class A office properties in the Los Angeles Central Business District (“LACBD”), have a significant presence in Orange County, California and are primarily focused on owning and operating high-quality office properties in the high-barrier-to-entry Southern California market.
As of December 31, 2008, our Operating Partnership indirectly owns whole or partial interests in 36 office and retail properties, a 350-room hotel and off-site parking garages and on-site structured and surface parking (our “Total Portfolio”). We hold an approximate 87.8% interest in our Operating Partnership, and therefore do not completely own the Total Portfolio. Excluding the 80% interest that our Operating Partnership does not own in Maguire Macquarie Office, LLC, an unconsolidated joint venture formed in conjunction with Macquarie Office Trust, our Operating Partnership’s share of the Total Portfolio is 17.3 million square feet and is referred to as our “Effective Portfolio.” Our Effective Portfolio represents our Operating Partnership’s economic interest in the office, hotel and retail properties from which we derive our net income or loss, which we recognize in accordance with accounting principles generally accepted in the United States of America (“GAAP”). The aggregate square footage of our Effective Portfolio has not been reduced to reflect our minority interest partners’ share of our Operating Partnership.
Our property statistics as of December 31, 2008 are as follows:
| | | | | | | | | | | | | | | | | | |
| | | Number of | | Total Portfolio | | Effective Portfolio |
| | Properties | | Buildings | | Square Feet | | | Parking
Square
Footage | | Parking
Spaces | | Square Feet | | | Parking
Square
Footage | | Parking
Spaces |
Wholly owned properties | | 30 | | 69 | | 16,526,452 | | | 11,215,359 | | 37,247 | | 16,526,452 | | | 11,215,359 | | 37,247 |
Unconsolidated joint venture | | 6 | | 20 | | 3,865,132 | | | 2,271,248 | | 7,349 | | 773,026 | | | 454,250 | | 1,470 |
| | | | | | | | | | | | | | | | | | |
| | 36 | | 89 | | 20,391,584 | | | 13,486,607 | | 44,596 | | 17,299,478 | | | 11,669,609 | | 38,717 |
| | | | | | | | | | | | | | | | | | |
Percentage leased | | | | | | 81.1 | % | | | | | | 79.3 | % | | | | |
| | | | | | | | | | | | | | | | | | |
As of December 31, 2008, the majority of our Total Portfolio is located in ten Southern California markets: the LACBD; the Tri-Cities area of Pasadena, Glendale and Burbank; the Cerritos submarket; the Santa Monica Professional and Entertainment submarket; the John Wayne Airport, Costa Mesa, Central Orange County and Brea submarkets of Orange County; and the Sorrento Mesa and Mission Valley submarkets of San Diego County. We also have an interest in one property in Denver, Colorado (a joint venture property). We directly manage the properties in our Total Portfolio through our Operating Partnership and/or our Services Companies, except for Cerritos Corporate Center and certain buildings at the Quintana Campus, as well as the Westin® Pasadena Hotel.
We receive income primarily from rental revenue (including tenant reimbursements) from our office properties, and to a lesser extent, from our hotel property and on- and off-site parking garages. We also receive
1
income from providing management, leasing and real estate development services to our joint venture with Macquarie Office Trust and prior to June 30, 2008, certain properties owned by Robert F. Maguire III, our former Chairman and Chief Executive Officer.
Corporate Strategy
Our long-term corporate strategy is to continue to own and develop high-quality office buildings concentrated in strong, supply-constrained markets. Our leasing strategy focuses on executing long-term leases with creditworthy tenants. The success of our corporate and leasing strategy is dependent upon general economic conditions in the U.S. and Southern California, primarily in the Los Angeles metropolitan and Orange County areas.
Liquidity
Our business requires continued access to adequate cash to fund our liquidity needs. Until the economic picture becomes clearer, our foremost priorities for 2009 are the preservation and generation of cash, including addressing debt maturities coming due.
Toward the aims of cash preservation and generation, in 2008 we: (1) disposed of City Plaza, a non-strategic asset with negative cash flow; (2) disposed of 1920 and 2010 Main Plaza, also a non-strategic asset, generating approximately $48 million of net proceeds; (3) completed a $100.0 million financing secured by Plaza Las Fuentes and the Westin® Pasadena Hotel, which provided net proceeds of approximately $95 million; (4) suspended our common and preferred dividends; (5) reduced or deferred discretionary costs (including certain development activities and capital expenditures); and (6) extended several loans with near-term maturities that would otherwise have required significant cash outlays.
Going into 2009, we continue to be focused on preserving and generating cash sufficient to fund our liquidity needs. As of the date of this report, management believes that our estimated liquidity during the remainder of 2009 will be at or near the minimum amount necessary to operate our business. Given the deterioration and uncertainty in the economy and financial markets, management is assuming that access to any source of cash will be challenging and is planning accordingly. See Part II, Item 7. “Management’s Discussion and Analysis of Financial Condition and Results of Operations—Liquidity and Capital Resources” for a description of our actual and potential sources and uses of liquidity in 2009, as well as the significant liquidity challenges we face in the current economic environment.
Investment in Joint Ventures
Maguire Macquarie Office, LLC
We own a 20% interest in our joint venture with Macquarie Office Trust and are responsible for day-to-day operations of the properties. We receive fees for asset management, property management (after January 5, 2009), leasing, construction management, acquisitions, dispositions and financing.
DH Von Karman Maguire, LLC
We own a 1% common equity interest and a 2% preferred interest in our joint venture with DH Von Karman Maguire, LLC.
Competition
We compete in the leasing of office space with a considerable number of other real estate companies, some of which may have greater marketing and financial resources. In addition, our hotel property competes for guests with other hotels, some of which may have greater marketing and financial resources than are available to us and our hotel operator, Westin® Hotels and Resorts.
2
Principal factors of competition in our primary business of owning, acquiring and developing office properties are: the quality of properties, leasing terms (including rent and other charges and allowances for tenant improvements), attractiveness and convenience of location, the quality and breadth of tenant services provided, and reputation as an owner and operator of quality office properties in the relevant market. Additionally, our ability to compete depends upon, among other factors, trends in the national and local economies, investment alternatives, financial condition and operating results of current and prospective tenants, availability and cost of capital, construction and renovation costs, taxes, governmental regulations, legislation and population trends.
Segment, Geographical and Tenant Concentration Information
We have two reportable segments: office properties and hotel. Due to the size of our hotel property in relation to our consolidated financial position and results of operations, we are not required to report segment information in our consolidated financial statements. Additionally, because we do not allocate our investment in real estate between the hotel and office portions of the Plaza Las Fuentes property, separate information related to our investment in real estate, expenditures for investments in real estate, and depreciation and amortization is not available for the office properties and hotel segments.
All of our business is conducted in the U.S., and we do not derive any revenue from foreign sources.
Our office properties are typically leased to high credit tenants for terms ranging from five to ten years. As of December 31, 2008, investment-grade-rated tenants generated 34.0% of the annualized rent of our Effective Portfolio, and nationally recognized professional service firms generated an additional 26.9% of the annualized rent of our Effective Portfolio.
As of December 31, 2008, approximately 31% of our Effective Portfolio is leased to finance and insurance tenants. Our finance and insurance tenants account for six of our top ten investment-grade tenants as of December 31, 2008, with annualized rents totaling $24.4 million. Various recent events have led to increased market concerns regarding the viability of tenants in the finance and insurance sectors, including the federal government conservatorship of the Federal Home Loan Mortgage Corporation and the Federal National Mortgage Association, the declared bankruptcy of Lehman Brothers Holdings Inc., the U.S. government-provided loans to American International Group, Inc., Citibank, Bank of America and other federal government interventions in the U.S. credit markets.
During 2008, our four largest tenants accounted for approximately 16% of our rental and tenant reimbursements revenue. No individual tenant accounted for 10% or more of our total rental and tenant reimbursements revenue during 2008. In addition, no single office property contributed in excess of 10% of our consolidated revenue during 2008.
Government and Environmental Regulations
Office properties in our submarkets are subject to various laws, ordinances and regulations, including regulations relating to common areas. We believe that each of our existing properties has the necessary permits and approvals to operate its business.
Our properties must comply with Title III of the Americans with Disabilities Act of 1990 (the “ADA”) to the extent that such properties are “public accommodations” as defined by the ADA. The ADA may require removal of structural barriers to access by persons with disabilities in certain public areas of our properties where such removal is readily achievable. We believe that our properties are in substantial compliance with the ADA, and we continue to make capital expenditures to address the requirements of the ADA. Noncompliance with the ADA could result in the imposition of fines or an award of damages to private litigants. The obligation to make readily achievable accommodations is an ongoing one, and we continue to assess our properties and to make alterations as appropriate in this respect.
3
Some of the properties in our portfolio contain, or may have contained, or are adjacent to or near other properties that have contained or currently contain, underground storage tanks for the storage of petroleum products or other hazardous or toxic substances. These operations create a potential for the release of petroleum products or other hazardous or toxic substances. Also, some of our properties contain asbestos-containing building materials (“ACBM”). Environmental laws require that ACBM be properly managed and maintained, and may impose fines and penalties on building owners or operators for failure to comply with these requirements. These laws may also allow third parties to seek recovery from owners or operators for personal injury associated with exposure to asbestos fibers. We can make no assurance that costs of future environmental compliance will not affect our ability to make distributions to our stockholders or that such cost or other remedial measures will not have a material adverse effect on our business, financial condition or results of operations. None of our recent site assessments revealed any past or present environmental liability that we believe would have a material adverse effect on our business, financial condition or results of operations.
From time to time, the United States Environmental Protection Agency (“EPA”) designates certain sites affected by hazardous substances as “Superfund” sites pursuant to the Comprehensive Environmental Response, Compensation, and Liability Act. Superfund sites can cover large areas, affecting many different parcels of land. The EPA identifies parties who are considered to be potentially responsible for the hazardous substances at Superfund sites and makes them liable for the costs of responding to the hazardous substances. The parcel of land on which Glendale Center is located lies within a large Superfund site. The site was designated as a Superfund site because the groundwater beneath the site is contaminated. We have not been named, and do not expect to be named, as a potentially responsible party for the site. If we were named, we would likely be required to enter into a de minimis settlement with the EPA and pay nominal damages.
Independent environmental consultants have conducted Phase I or other environmental site assessments on all of the properties in our portfolio within the last 36 months. Site assessments are intended to discover and evaluate information regarding the environmental condition of the surveyed property and surrounding properties. These assessments do not generally include soil samplings, subsurface investigations or an asbestos survey. None of the recent site assessments revealed any past or present environmental liability that we believe would have a material adverse effect on our business, financial condition or results of operations.
Insurance
We carry commercial liability, fire, extended coverage, earthquake, terrorism, flood, pollution legal liability, boiler and machinery, earthquake sprinkler leakage, business interruption and rental loss insurance covering all of the properties in our portfolio under a blanket policy. We believe the policy specifications and insured limits are appropriate given the relative risk of loss, the cost of the coverage and industry practice and, in the opinion of management, the properties in our portfolio are adequately insured. Our terrorism insurance, which covers both certified and non-certified terrorism loss, is subject to exclusions for loss or damage caused by nuclear substances, pollutants, contaminants and biological and chemical weapons. We do not carry insurance for generally uninsured losses such as loss from riots. Most of the properties in our portfolio are located in areas known to be seismically active. See Item 1A. “Risk Factors—Potential losses may not be covered by insurance.”
Employees
As of December 31, 2008, we employed 214 persons. None of these employees are currently represented by a labor union.
Corporate Offices
We own the buildings in which our executive, leasing, marketing, development and accounting offices are located: the KPMG Tower at 355 South Grand Avenue in Los Angeles, California and the Wells Fargo Tower at 333 South Grand Avenue in Los Angeles, California. Our executive offices are located at 355 South Grand
4
Avenue, Suite 3300, Los Angeles, California 90071, telephone number 213-626-3300. We believe that our current facilities are adequate for our present needs. We may add regional offices or relocate our offices depending on our future development projects and alternative uses for available space.
Available Information
We file our Annual Report on Form 10-K, Quarterly Reports on Form 10-Q, Current Reports on Form 8-K, Proxy Statements and amendments to those reports filed or furnished pursuant to Section 13(a) or 15(d) of the Securities Exchange Act of 1934 (the “Exchange Act”) with the SEC. The public may read and copy any materials that we file with the SEC at the SEC’s Office of Investor Education and Advocacy at 100 F Street, N.E., Washington, D.C. 20549-0213. The public may obtain information on the operation of the Office of Investor Education and Advocacy by calling the SEC at 1-800-SEC-0330. The SEC maintains a website that contains reports, proxy details and other information regarding issuers that file electronically with the SEC athttp://www.sec.gov.
Our website address ishttp://www.maguireproperties.com. We make available on our website, free of charge, our Annual Report on Form 10-K, Quarterly Reports on Form 10-Q, Current Reports on Form 8-K, Proxy Statements and amendments to those reports filed or furnished pursuant to Section 13(a) or 15(d) of the Exchange Act as soon as reasonably practicable after such materials are electronically filed with, or furnished to, the SEC.
Our board of directors maintains charters for each of its committees and has adopted a written set of corporate governance guidelines and a code of business conduct and ethics applicable to independent directors, executive officers, employees and agents, each of which is available for viewing on our website athttp://www.maguireproperties.com under the heading “Investor Relations—Corporate Governance.” Each of these documents is also available in print to any stockholder who sends a written request to that effect to the attention of Jonathan L. Abrams, Secretary, Maguire Properties, Inc., 355 South Grand Avenue, Suite 3300, Los Angeles, California 90071.
Website addresses referred to in this Annual Report on Form 10-K are not intended to function as hyperlinks, and the information contained on our website is not a part of this Annual Report on Form 10-K.
Factors That May Affect Future Results
(Cautionary Statement Under the Private Securities Litigation Reform Act of 1995)
Certain written and oral statements made or incorporated by reference from time to time by us or our representatives in this Annual Report on Form 10-K, other filings or reports filed with the SEC, press releases, conferences, or otherwise, are “forward-looking statements” within the meaning of the Private Securities Litigation Reform Act of 1995 (set forth in Section 27A of the Securities Act of 1933 and Section 21E of the Exchange Act). In particular, statements relating to our capital resources, portfolio performance and results of operations contain forward-looking statements. Furthermore, all of the statements regarding future financial performance (including anticipated funds from operations (“FFO”), market conditions and demographics) are forward-looking statements. We are including this cautionary statement to make applicable and take advantage of the safe harbor provisions of the Private Securities Litigation Reform Act of 1995 for any such forward-looking statements. We caution investors that any forward-looking statements presented in this Annual Report on Form 10-K, or that management may make orally or in writing from time to time, are based on management’s beliefs and assumptions made by, and information currently available to, management. When used, the words “anticipate,” “believe,” “expect,” “intend,” “may,” “might,” “plan,” “estimate,” “project,” “should,” “will,” “result” and similar expressions that do not relate solely to historical matters are intended to identify forward-looking statements. Such statements are subject to risks, uncertainties and assumptions and may be affected by known and unknown risks, trends, uncertainties and factors that are beyond our control. Should one or more of
5
these risks or uncertainties materialize, or should underlying assumptions prove incorrect, actual results may vary materially from those anticipated, estimated or projected. We expressly disclaim any responsibility to update forward-looking statements, whether as a result of new information, future events or otherwise. Accordingly, investors should use caution in relying on past forward-looking statements, which were based on results and trends at the time they were made, to anticipate future results or trends.
Some of the risks and uncertainties that may cause our actual results, performance, liquidity or achievements to differ materially from those expressed or implied by forward-looking statements include, among others, the following:
| | • | | The negative impact of the current credit crisis and global economic slowdown; |
| | • | | Adverse economic or real estate developments in Southern California, particularly in the LACBD or Orange County region; |
| | • | | Difficulties in disposing of identified properties at attractive prices or at all; |
| | • | | Our failure to obtain additional capital or refinance debt maturities; |
| | • | | Our dependence on significant tenants, many of which are in industries that have been severely impacted by the current credit crisis and global economic slowdown; |
| | • | | Defaults on or non-renewal of leases by tenants; |
| | • | | Decreased rental rates or failure to achieve occupancy targets; |
| | • | | Our failure to reduce our level of indebtedness; |
| | • | | Decreases in the market value of our properties; |
| | • | | Future terrorist attacks in the U.S.; |
| | • | | Increased interest rates and operating costs; |
| | • | | Potential loss of key personnel; |
| | • | | Our failure to maintain our status as a REIT; |
| | • | | Our failure to successfully operate acquired properties and operations; |
| | • | | Difficulty in operating the properties owned through our joint venture; |
| | • | | Our failure to successfully develop or redevelop properties; |
| | • | | Environmental uncertainties and risks related to natural disasters; and |
| | • | | Changes in real estate and zoning laws and increases in real property tax rates. |
Set forth below are some (but not all) of the factors that could adversely affect our business and financial performance. Moreover, we operate in a highly competitive and rapidly changing environment. New risk factors emerge from time to time and it is not possible for management to predict all of such risk factors, nor can it assess the impact of all of such risk factors on our business or the extent to which any factor, or combination of factors, may cause actual results to differ materially from those contained in any forward-looking statements. Given these risks and uncertainties, investors should not place undue reliance on forward-looking statements as a prediction of actual results.
We believe the following risks are material to our stockholders. You should carefully consider the following factors in evaluating our company, our properties and our business. The occurrence of any of the following risks might cause our stockholders to lose all or part of their investment. For purposes of this section, the term “stockholders” means the holders of shares of our common stock and of our Series A Preferred Stock.
6
Our senior management’s focus on refinancing alternatives and capital raising opportunities may adversely affect us.
As discussed throughout this report, we are currently exploring many refinancing alternatives and capital raising opportunities. This focus could adversely affect our operations in a number of ways, including the risks that such activities could, among other things:
| | • | | Disrupt operations and distract management; |
| | • | | Fail to successfully achieve their expected benefits; |
| | • | | Be time consuming and expensive and result in the loss of business opportunities; |
| | • | | Subject us to litigation; |
| | • | | Result in increased difficulties due to uncertainties regarding our future operations; and |
| | • | | Cause the trading price of our common stock to further decrease and/or continue to be highly volatile. |
Recent U.S. economic conditions have been uncertain and challenging.
Recent U.S. economic conditions have been uncertain and challenging, particularly in the credit and financial markets. Continued concerns about the systemic impact of inflation, energy costs and geopolitical issues have contributed to increased market volatility and diminished expectations for the U.S. economy. In the second half of 2008, added concerns fueled by various federal government interventions in the U.S. credit markets led to increased market uncertainty and instability in both U.S. and international capital and credit markets. These conditions, combined with volatile oil prices, declining business and consumer confidence and increased unemployment, contributed to unprecedented volatility in 2008 and in the first quarter of 2009.
As a result of these market conditions, the cost and availability of credit has been and may continue to be adversely affected by illiquid credit markets and wider credit spreads. Concerns about the stability of the markets generally and the strength of counterparties specifically has led many lenders and institutional investors to reduce, and in some cases cease to provide, funding to borrowers. Continued turbulence in the U.S. and international markets and economies may adversely affect our liquidity and financial condition, and the liquidity and financial condition of our tenants. If these market conditions continue or deteriorate further, they may limit our ability, and the ability of our tenants, to timely replace maturing liabilities, and access the capital markets to meet liquidity needs, resulting in an adverse effect on our, and our tenants’, financial condition and results of operations.
There can be no assurance that the recent actions of the U.S. government, Federal Reserve and other governmental and regulatory bodies, or the market’s response to these actions, will achieve its intended effect, and our business may not benefit from these or any future actions.
In response to the financial issues affecting the banking system and financial markets, and going concern threats to investment banks and other financial institutions, the Emergency Economic Stabilization Act of 2008 (the “EESA”) was enacted. The EESA provides the U.S. Secretary of the Treasury with the authority to purchase from financial institutions up to $700 billion of residential or commercial mortgages and any securities, obligations, or other instruments that are based on or related to such mortgages, pursuant to the Troubled Asset Relief Program, now renamed the Financial Stability Plan, provided that certain conditions are met. In addition, the U.S. Secretary of the Treasury has the authority to establish a program to guarantee, upon request from a financial institution, the timely payment of principal and interest on these financial assets.
There can be no assurance that the EESA will have a beneficial impact on the financial markets, particularly given the current extreme level of volatility. Moreover, the market may not respond favorably to the Financial Stability Plan, it may not function as intended or our business may not receive the anticipated positive impact
7
from the legislation. In addition to the Financial Stability Plan, the U.S. Government, Federal Reserve and other governmental and regulatory bodies have taken or are considering taking other actions to address the financial crisis. We cannot predict whether or when such actions may occur or what impact, if any, such actions could have on our business, financial condition and results of operations.
Deteriorating economic conditions may have an adverse effect on our revenue and available cash, and may also impact our ability to sell certain properties if or when we decide to do so.
Our business requires continued access to adequate cash to finance our operations, dividends, capital expenditures, indebtedness repayment obligations and development costs. We may not be able to generate sufficient cash for these purposes. Given the current market conditions, we believe there is a significantly increased risk that rental revenue generated from our tenants will decrease due to their deteriorating ability to make rent payments and the increasing risk of tenant bankruptcies. In addition to the direct adverse effect of tenant failures on our operations, these events also negatively affect our ability to attract and maintain rent levels for new tenants. Further, the actual or perceived adverse impact of recent economic conditions on certain industries in which many of our tenants operate, including the mortgage, financial, insurance and professional services industries, may also negatively impact our revenue and our ability to complete any sale of our properties. These circumstances negatively affect our revenue and available cash, and also decrease the value of our properties, reducing the likelihood that we would be able to sell such properties, if or when we decide to do so, on attractive terms or at all.
Inflation may adversely affect our financial condition and results of operations.
Should inflation increase in the future, we may experience:
| | • | | Difficulty in replacing or renewing expiring leases; and/or |
| | • | | An inability to receive reimbursement from our tenants for their share of certain operating expenses, including common area maintenance, real estate taxes and insurance. |
Inflation also poses a potential threat to us due to the probability of future increases in interest rates. Such increases would adversely impact us due to our outstanding variable-rate debt as well as result in higher interest rates on new fixed-rate debt.
Real properties are illiquid investments and we may be unable to adjust our portfolio in response to changes in economic or other conditions or sell properties if or when we decide to do so.
Real properties are illiquid investments and we may be unable to adjust our portfolio in response to changes in economic or other conditions. In addition, the real estate market is affected by many factors, such as general economic conditions, availability of financing, interest rates and other factors, including supply and demand, that are beyond our control. Particularly in light of the current economic conditions, we cannot predict whether we will be able to sell any property for the price or on the terms set by us, or whether any price or other terms offered by a prospective buyer would be acceptable to us. We also cannot predict the length of time needed to find a willing buyer and to close the sale of a property. In addition, the availability of financing and current market conditions may delay or prevent the closing of a sale of a property even if the price and other terms of the transaction were acceptable to us. The foregoing could mean that we may be unable to complete the sale of identified properties in the near term or at all.
Our debt covenants restrict our ability to enter into certain transactions if or when we decide to do so.
Certain of our material debt obligations require us to comply with financial and other covenants, including, but not limited to, net worth and liquidity covenants, due on sale clauses, change in control restrictions, listing
8
requirements and other financial requirements. Some or all of these covenants could prevent or delay our ability to enter into certain transactions that may be in the best interests of our stockholders, including our ability to:
| | • | | Sell identified properties or portfolios of properties; |
| | • | | Engage in a change in control of the Company; |
| | • | | Merge with or into another company; or |
| | • | | Sell all or substantially all of our assets. |
Specifically, some or all of these covenants may delay or prevent a change in control of the Company, even if a change in control might be beneficial to our stockholders, deter tender offers that may be beneficial to our stockholders, or limit stockholders’ opportunity to receive a potential premium for their shares. Absent any waiver of, or modification to, such covenants or the refinancing of the indebtedness containing such covenants, our ability to structure and consummate a transaction is restricted by our need to remain in compliance with such covenants.
We may not be able to refinance or repay our substantial indebtedness, which could have a materially adverse effect on our business, financial condition, results of operations and common stock price.
We have a substantial amount of debt that we may not be able to refinance or repay. As of December 31, 2008, we have approximately $260 million of debt maturing in 2009. Due to continued weakness in the credit markets, there can be no assurance that we will be able to refinance this debt on acceptable terms or at all. Our ability to successfully refinance our debt is negatively affected by the real or perceived decline in the value of our properties based on deteriorating economic conditions. Our substantial indebtedness also requires us to use a material portion of our cash flow to service principal and interest on our debt, which limits the cash flow available for other business expenses or opportunities. Also, our agreement with Mr. Maguire and other contributors to use commercially reasonable efforts to maintain certain debt levels may limit our flexibility to refinance the debt encumbering our properties.
We may not have the cash necessary to repay our debt as it matures. Therefore, failure to refinance or extend our debt as it comes due, or a failure to satisfy the conditions and requirements of such debt, could result in an event of default that could potentially allow lenders to accelerate such debt. If our debt is accelerated, our assets may not be sufficient to repay such debt in full, and our available cash flow may not be adequate to maintain our current operations. If we are unable to refinance or repay our debt as it comes due and maintain sufficient cash flow, our business, financial condition, results of operations and common stock price will be materially and adversely affected, and we may be required to file for bankruptcy protection.
Furthermore, even if we are able to obtain extensions on our existing debt, such extensions may include operational and financial covenants significantly more restrictive than our current debt covenants. Any such extensions will also require us to pay certain fees to, and expenses of, our lenders. These fees and cash flow restrictions will affect our ability of fund our ongoing operations from our operating cash flows, as discussed in this report.
Our substantial indebtedness adversely affects our financial health and operating flexibility.
As of December 31, 2008, our total consolidated indebtedness was approximately $4.9 billion. Payments of principal and interest on borrowings may leave us with insufficient cash resources to operate our properties. We may not generate sufficient cash flow after debt service to pay distributions on our common stock and/or Series A Preferred Stock. In the event of default, our debt agreements may also prevent us from paying distributions necessary to maintain our REIT qualification. Our existing mortgage agreements contain lockbox and cash management provisions, which, under certain circumstances, limit our ability to utilize available cash flows at the specific property, including paying distributions. Our level of debt and the limitations imposed on us
9
by our debt agreements could have significant adverse consequences to us and the value of our common stock, regardless of our ability to refinance or extend our debt, including:
| | • | | Limiting our ability to borrow additional amounts for working capital, capital expenditures, debt service requirements, execution of our business plan or other purposes; |
| | • | | Limiting our ability to use operating cash flow in other areas of our business or to pay dividends because we must dedicate a substantial portion of these funds to service our debt; |
| | • | | Increasing our vulnerability to general adverse economic and industry conditions; |
| | • | | Limiting our ability to capitalize on business opportunities and to react to competitive pressures and adverse changes in government regulation; |
| | • | | Limiting our ability to fund capital expenditures, tenant improvements and leasing commissions; |
| | • | | Limiting our ability or increasing the costs to refinance our indebtedness; and |
| | • | | Limiting our ability to enter into marketing and hedging transactions by reducing the number of counterparties with whom we can enter into such transactions as well as the volume of those transactions. |
The lockbox and cash management arrangements contained in our debt agreements provide that substantially all of the income generated by our properties is deposited directly into lockbox accounts and then swept into cash management accounts for the benefit of our various lenders. Cash is distributed to us only after funding of improvement, leasing and maintenance reserves and the payment of debt service, insurance, taxes, operating expenses, and extraordinary capital expenditures and leasing expenses.
Furthermore, foreclosures could create taxable income without accompanying cash proceeds, a circumstance which could hinder our ability to meet the REIT distribution requirements imposed by the Internal Revenue Code of 1986, as amended (the “Code”). Foreclosures could also trigger our tax indemnification obligations under the terms of our agreements with Nelson C. Rising, our President and Chief Executive Officer, Mr. Maguire and others with respect to sales of certain properties, obligating us to use commercially reasonable efforts to make certain levels of indebtedness available for them to guarantee.
Given the restrictions in our debt covenants and in any loan extensions we may obtain in the future, we may be significantly limited in our operating and financial flexibility and may be limited in our ability to respond to changes in our business or competitive activities.
If our common stock is delisted from the New York Stock Exchange (the “NYSE”), there could be a negative effect on our business that could impact our financial condition, results of operations and ability to service our debt obligations.
Our lowered stock price increases the risk that our stock will be delisted from the NYSE. The delisting of our common stock or threat thereof could have adverse effects by, among other things:
| | • | | Reducing the liquidity and market price of our common stock; |
| | • | | Reducing the number of investors willing to hold or acquire our common stock, thereby further restricting our ability to obtain equity financing; |
| | • | | Damaging our reputation with current or potential tenants, lenders, vendors and other third parties; |
| | • | | Potentially giving rise to lender consent rights with respect to future change in control arrangements, property dispositions and certain other transactions under several of our debt agreements; |
| | • | | Reducing our ability to retain, attract and motivate our directors, officers and employees; and |
| | • | | Requiring the time and attention of our management and key employees on this issue, diverting attention from other responsibilities. |
10
Our stock price may continue to be adversely affected.
The price of our common stock has decreased materially and will continue to be affected by the factors described under this Item 1A. “Risk Factors.” The price at which our common stock will trade may be volatile and may fluctuate due to factors such as:
| | • | | Our financial condition and performance, including the risk of insolvency; |
| | • | | Our quarterly and annual operating results; |
| | • | | Variations between our actual results and analyst and investor expectations or changes in financial estimates and recommendations by securities analysts; |
| | • | | The performance and prospects of our industry; |
| | • | | The depth and liquidity of the market for our common stock; |
| | • | | Concentration of ownership; |
| | • | | Short sales of our stock triggered by hedging activities, including the purchase of credit default swaps by certain of our lenders; |
| | • | | U.S. and international economic conditions; |
| | • | | The extent of institutional investors’ interest in us; |
| | • | | The reputation of REITs generally and the attractiveness of their equity securities in comparison to other equity securities; and |
| | • | | General market volatility, conditions and trends. |
Fluctuations may be unrelated to or disproportionate to our financial performance. These fluctuations may result in a material decline in the trading price of our common stock.
Most of our properties depend upon the Southern California economy and the demand for office space.
Most of our properties are located in Los Angeles County, Orange County and San Diego County, California, and many of them are concentrated in the LACBD, which exposes us to greater economic risks than if we owned properties in several geographic regions. Moreover, because our portfolio of properties consists primarily of office buildings, a decrease in the demand for office space, and Class A office space in particular, may have a greater adverse effect on our business and financial condition than if we owned a more diversified real estate portfolio. We are susceptible to adverse developments in the Southern California region (such as business layoffs or downsizing, industry slowdowns (such as the current significant downturns in the mortgage and finance industries), relocations of businesses, changing demographics, increased telecommuting, terrorist targeting of high-rise structures, infrastructure quality, California state budgetary constraints and priorities (particularly during challenging financial times like the present), increases in real estate and other taxes, costs of complying with government regulations or increased regulation and other factors) and the national and Southern California regional office space market (such as oversupply of, reduced demand for or decline in property values in such office space). The State of California is also generally regarded as more litigious and more highly regulated and taxed than many states, which may reduce demand for office space in California. Any adverse economic or real estate developments in the Southern California region, or any decrease in demand for office space resulting from California’s regulatory environment, business climate or energy or fiscal problems, could adversely impact our financial condition, results of operations, cash flow, the per share trading price of our common stock and Series A Preferred Stock and our ability to satisfy our debt service obligations and to pay dividends to our stockholders. We cannot assure you of the growth of the Southern California economy or the national economy or our future growth rate.
11
We depend on significant tenants.
As of December 31, 2008, our 20 largest tenants represented approximately 35.6% of our Effective Portfolio’s total annualized rental revenue.
Our rental revenue depends on entering into leases with and collecting rents from tenants. General and regional economic conditions, such as the current challenging economic climate described above, may adversely affect our major tenants and potential tenants in our markets. Some of our tenants are in the mortgage, financial, insurance and professional services industries and these industries have been severely impacted by the current economic climate. Many of our major tenants have experienced or may experience a notable business downturn, weakening their financial condition, and in turn, resulting in their failure to make timely rental payments and/or a default under their leases. In many cases, we have made substantial up-front investments in the applicable leases, through tenant improvement allowances and other concessions, as well as typical transaction costs (including professional fees and commissions). In the event of any tenant default, we may experience delays in enforcing our rights as landlord and may incur substantial costs in protecting our investment.
The bankruptcy or insolvency of a major tenant also may adversely affect the income produced by our properties. If any tenant becomes a debtor in a case under the United States Bankruptcy Code, we cannot evict the tenant solely because of the bankruptcy. In addition, the bankruptcy court might authorize the tenant to reject and terminate their lease with us. Our claim against the tenant for unpaid future rent would be subject to a statutory cap that might be substantially less than the remaining rent actually owed under the lease. Even so, our claim for unpaid rent would likely not be paid in full.
There have recently been a number of high profile bank failures, and several of our banking tenants faced distress in 2008 and continue to face distress in 2009. Failed banks or banks involved in government-facilitated sales are subject to the Federal Deposit Insurance Corporation’s (“FDIC”) statutory authority and receivership process. The FDIC has receivership powers that are substantially broader than those of a bankruptcy trustee. In dealing with the FDIC in any repudiation of a lease, the Company as landlord is likely in a less favorable position than with a debtor in a bankruptcy proceeding. Many of the creditor protections that exist in a bankruptcy proceeding do not exist in a FDIC receivership.
Our revenue and cash flow could be materially adversely affected if any of our significant tenants were to become bankrupt or insolvent, or suffer a downturn in their business, default under their leases or fail to renew their leases at all or renew on terms less favorable to us than their current terms.
Tax indemnification obligations in the event that we sell certain properties could limit our operating flexibility.
At the time of our initial public offering, we agreed to indemnify Maguire Partners – Master Investments, LLC (“Master Investments”), an entity in which Mr. Rising has a minority interest, against adverse tax consequences to them in the event that our Operating Partnership directly or indirectly sells, exchanges or otherwise disposes (including by way of merger, sale of assets or otherwise) of any portion of its interests, in a taxable transaction. This tax indemnification covers five of the office properties in our portfolio, which represented 37.8% of our Effective Portfolio’s aggregate annualized rent as of December 31, 2008. These obligations apply for periods of up to 12 years from the date that these properties were contributed to our Operating Partnership at the time of our initial public offering in June 2003 (the “lock-out period”). In connection with the tax indemnification agreement, Master Investments has also guaranteed a portion of our mortgage loans, which totals $65.0 million as of December 31, 2008.
Also at the time of our initial public offering, we entered into a tax indemnification agreement with Mr. Maguire. Under this agreement, we agreed not to dispose of five of the office properties in our portfolio for periods of up to 12 years from the date these properties were contributed to our Operating Partnership at the time
12
of our initial public offering as long as certain conditions under Mr. Maguire’s contribution agreement were met. Mr. Maguire’s separation agreement modified his tax indemnification agreement. As modified, for purposes of determining whether Mr. Maguire and related entities maintain ownership of Operating Partnership units equal to 50% of the units received by them in the formation transactions (which is a condition to the continuation of the lock-out period to its maximum length), shares of our common stock received by Mr. Maguire in exchange for Operating Partnership units in accordance with Section 8.6B of the Amended and Restated Agreement of Limited Partnership of Maguire Properties, L.P., as amended, shall be treated as Operating Partnership units received in the formation transactions. In addition, Mr. Maguire and certain entities owned or controlled by Mr. Maguire and entities controlled by certain former senior executives of the Maguire Properties predecessor have guaranteed $591.8 million of our mortgage loans as of December 31, 2008.
We agreed to these provisions in order to assist Mr. Rising, Mr. Maguire and certain other contributors in preserving their tax position after their contribution of property interests to us. While we do not intend to sell any of these properties in transactions that would trigger these tax indemnifications obligations, if we were to trigger our tax indemnification obligations under these agreements, we would be required to pay damages for the resulting tax consequences to Mr. Rising, Mr. Maguire and other contributors, and we have acknowledged that a calculation of damages in the event these tax indemnification obligations are triggered will not be based on the time value of money nor the time remaining within the lock-out period, but will also give consideration to the tax effect of the disposition on the contributor or contributors. In addition, we could involuntarily trigger our tax indemnification obligations under these provisions in the event of a condemnation of one of these properties. The tax indemnification obligations may serve to prevent the sale of certain assets that might otherwise provide valuable liquidity alternatives to us.
Potential losses may not be covered by insurance.
We carry commercial liability, fire, extended coverage, earthquake, flood, pollution legal liability, boiler and machinery, earthquake sprinkler leakage, terrorism, business interruption and rental loss insurance covering all of the properties in our portfolio under a blanket policy. We believe the policy specifications and insured limits are appropriate and adequate given the relative risk of loss, the cost of the coverage and industry practice. We do not carry insurance for generally uninsured losses such as loss from riots or war. Some of our policies, such as those covering losses due to terrorism, earthquake and floods, are insured subject to limitations involving large deductibles or co-payments and policy limits, which may not be sufficient to cover such losses. Most of our properties are located in Southern California, an area especially subject to earthquakes. Six of the eight largest properties in our office portfolio – US Bank Tower, Gas Company Tower, Wells Fargo Tower, KPMG Tower, Two California Plaza and One California Plaza (one of our joint venture properties) – are all located within the Bunker Hill section of downtown Los Angeles. Together, these properties represented roughly 45.4% of our Effective Portfolio’s aggregate annualized rent as of December 31, 2008. Because these properties are located so closely together, an earthquake in downtown Los Angeles could materially damage, destroy or impair the use by tenants of all of these properties. While we presently carry earthquake insurance on our properties, the amount of our earthquake insurance coverage may not be sufficient to fully cover losses from earthquakes, particularly losses from an earthquake in downtown Los Angeles. In addition, we may discontinue earthquake, terrorism or other insurance on some or all of our properties in the future if the cost of premiums for any of these policies exceeds, in our judgment, the value of the coverage discounted for the risk of loss.
If we experience a loss that is uninsured or that exceeds policy limits, we could lose the capital invested in the damaged properties as well as the anticipated future cash flow from those properties. In addition, if the damaged properties are subject to recourse indebtedness, we would continue to be liable for the indebtedness, even if these properties were irreparably damaged. In such event, securing additional insurance, if possible, could be significantly more expensive than our current policy.
13
Future terrorist attacks in the United States could harm the demand for and the value of our properties.
Future terrorist attacks in the U.S., such as the attacks that occurred in New York and Washington, D.C. on September 11, 2001, and other acts of terrorism or war could harm the demand for and the value of our properties. Certain of our properties (including US Bank Tower) are well-known landmarks and may be perceived as more likely terrorist targets than similar, less recognizable properties, which could potentially reduce the demand for and value of these properties. A decrease in demand or value could make it difficult for us to renew leases or re-lease space at lease rates equal to or above historical rates or then-prevailing market rates. Terrorist attacks also could directly impact the value of our properties through damage, destruction, loss, or increased security costs, and the availability of insurance for such acts may be limited or cost more. Six of the eight largest properties in our office portfolio – US Bank Tower, Gas Company Tower, Wells Fargo Tower, KPMG Tower, Two California Plaza and One California Plaza (one of our joint venture properties) – are all located within the Bunker Hill section of downtown Los Angeles. Together, these properties represented roughly 45.4% of our Effective Portfolio’s aggregate annualized rent as of December 31, 2008. Because these properties are located so closely together, a terrorist attack on any one of these properties, or in the downtown Los Angeles or Bunker Hill areas generally, could materially damage, destroy or impair the use by tenants of all of these properties. To the extent that our tenants are impacted by future attacks, their ability to continue to honor obligations under their existing leases with us could be adversely affected. Additionally, certain tenants have termination rights or purchase options in respect of certain casualties. If we receive casualty proceeds, we may not be able to reinvest such proceeds profitably or at all, and we may be forced to recognize a taxable gain on the affected property. Failure to reinvest casualty proceeds in the affected property or properties could also trigger our tax indemnification obligations under our agreements with certain limited partners of our Operating Partnership with respect to sales of specified properties.
Market interest rates and other factors may affect the value of our common stock and Series A Preferred Stock.
One of the factors that influence the price of our common stock and Series A Preferred Stock is the dividend yield on our common stock and Series A Preferred Stock relative to market interest rates. An increase in market interest rates, which are currently at low levels relative to historical rates, could cause the market price of our common stock and Series A Preferred Stock to go down. The trading price of our common stock and Series A Preferred Stock would also depend on many other factors, which may change from time to time, including:
| | • | | Whether we are paying dividends on our common stock and/or Series A Preferred Stock; |
| | • | | Prevailing interest rates; |
| | • | | The market for similar securities; |
| | • | | The attractiveness of REIT securities in comparison to the securities of other companies, taking into account, among other things, the higher tax rates imposed on dividends paid by REITs; |
| | • | | Government action or regulation; |
| | • | | General economic conditions; and |
| | • | | Our financial condition, performance and prospects. |
Failure to hedge effectively against interest rate changes may adversely affect results of operations.
We seek to manage our exposure to interest rate volatility by using interest rate hedging arrangements that involve risk, such as the risk that counterparties may fail to honor their obligations under these arrangements and that such arrangements may not be effective in reducing our exposure to interest rate changes. Failure to hedge effectively against interest rate changes may adversely affect our results of operations.
14
We may be unable to complete acquisitions or successfully operate acquired properties.
Our ability to acquire properties on favorable terms and successfully operate them may be adversely affected by the following significant risks:
| | • | | Our potential inability to acquire a desired property because of competition from other real estate investors with significant capital, including both publicly-traded REITs and institutional investment funds; |
| | • | | Even if we are able to acquire a desired property, competition from other potential acquirers may significantly increase the purchase price; |
| | • | | Even if we enter into agreements for the acquisition of office properties, these agreements are subject to customary conditions to closing, including completion of due diligence investigations to our satisfaction; |
| | • | | We may be unable to finance the acquisition on favorable terms or at all, particularly in light of the current lack of financing available and general economic conditions; |
| | • | | We may spend more than budgeted amounts to make necessary improvements or renovations to acquired properties; |
| | • | | We may be unable to quickly and efficiently integrate new acquisitions, particularly acquisitions of portfolios of properties, into our existing operations, and as a result our results of operations and financial condition could be adversely affected; |
| | • | | Acquired properties may be subject to reassessment, which may result in higher than expected property tax payments; |
| | • | | Market conditions may result in higher than expected vacancy rates and lower than expected rental rates; |
| | • | | We may not be able to obtain adequate insurance coverage for acquired properties; |
| | • | | Acquired properties may be located in new markets where we may face risks associated with a lack of market knowledge or understanding of the local economy, lack of business relationship in the area and unfamiliarity with local governmental and permitting procedures; |
| | • | | We may acquire properties subject to liabilities and without any recourse, or with only limited recourse, with respect to unknown liabilities such as liabilities for clean-up of undisclosed environmental contamination, claims by tenants, vendors or other persons dealing with the former owners of the properties and claims for indemnification by general partners, directors, officers and others indemnified by the former owners of the properties; and |
| | • | | In connection with certain potential acquisitions, we have entered into a right of first opportunity agreement with Macquarie Office Trust, whereby for any potential acquisition or development property prospect located in Southern California meeting certain investment criteria, we are obligated to offer Macquarie Office Trust the first opportunity to acquire a participating interest in that property. |
If we cannot finance property acquisitions on favorable terms, or operate acquired properties to meet our financial expectations, our financial condition, results of operations, cash flow, per share trading price of our common stock and Series A Preferred Stock and ability to satisfy our debt service obligations and to pay dividends to our stockholders could be adversely affected.
We may be unable to successfully complete and operate developed properties.
Our future development and construction activities involve the following significant risks:
| | • | | We may be unable to obtain construction financing at all or on favorable terms; |
15
| | • | | We may be unable to obtain permanent financing at all or on advantageous terms if we finance development projects through construction loans; |
| | • | | We may not complete development projects on schedule or within budgeted amounts; and |
| | • | | We may encounter delays or refusals in obtaining all necessary zoning, land use, building, occupancy, and other required governmental permits and authorizations; and occupancy rates and rents at newly developed or renovated properties may fluctuate depending on a number of factors, including market and economic conditions, and may result in our investment not being profitable. |
While we intend to develop office properties primarily in the Southern California market, we may in the future develop properties for commercial, retail or other use and expand our business to other geographic regions where we expect the development of property to result in favorable risk-adjusted returns on our investment. Presently, we do not possess the same level of familiarity with development of other property types or other markets, which could adversely affect our ability to develop such properties successfully or at all or to achieve expected performance.
We may encounter problems during development and construction activities.
We are currently developing projects at Lantana Media Campus and 207 Goode Avenue. These construction projects, and others that we may undertake from time to time, are subject to significant development and construction risks, any of which could cause unanticipated cost increases and delays. These include the following:
| | • | | Adverse weather that damages the project or causes delays; |
| | • | | Delays in obtaining or inability to obtain necessary permits, licenses and approvals; |
| | • | | Changes to the plans or specifications; |
| | • | | Shortages of materials and skilled labor; |
| | • | | Increases in material and labor costs; |
| | • | | Labor disputes and work stoppages with contractors, subcontractors or others that are constructing the project; |
| | • | | Shortages of qualified employees; |
| | • | | Fire, flooding and other natural disasters; |
| | • | | Expenditure of funds on, and the devotion of management time to, projects that may not be completed; and |
| | • | | Geological, construction, excavation, regulatory and equipment problems. |
We may not be able to complete the development of any projects we begin and, if completed, our development and construction activities may not be completed in a timely manner or within budget, which could have a material adverse effect on our results of operations and prospects.
Our performance and value are subject to risks associated with real estate assets and with the real estate industry.
Our ability to pay dividends to our stockholders depends on our ability to generate revenue in excess of expenses, scheduled principal payments on debt and capital expenditure requirements. Events and conditions
16
generally applicable to owners and operators of real property that are beyond our control may decrease cash available for distribution and the value of our properties. These events include:
| | • | | Local oversupply, increased competition or reduction in demand for office space; |
| | • | | Inability to collect rent from tenants; |
| | • | | Vacancies or our inability to rent space on favorable terms; |
| | • | | Inability to finance property development and acquisitions on favorable terms; |
| | • | | Increased operating costs, including insurance premiums, utilities and real estate taxes; |
| | • | | Costs of complying with changes in governmental regulations; |
| | • | | The relative illiquidity of real estate investments; |
| | • | | Property damage resulting from seismic activity or other natural disasters; and |
| | • | | Changing submarket demographics. |
In addition, we are subject to risks generally incident to the ownership of real property, including changes in global, national, regional or local economic or real estate market conditions. For example, the current credit crisis and global economic slowdown makes it more difficult for us to lease space in or dispose of our properties. In addition, rising interest rates could also make alternative interest-bearing and other investments more attractive and therefore potentially lower the relative value of our existing real estate investments. These conditions, or the public perception that any of these conditions may occur, could result in a general decline in rents or an increased incidence of defaults under existing leases, which would adversely affect our financial condition, results of operations, cash flow, per share trading price of our common stock and Series A Preferred Stock and ability to satisfy our debt service obligations and to pay dividends to our stockholders.
Increasing utility costs in California may have an adverse effect on our operating results and occupancy levels.
The State of California continues to address issues related to the supply of electricity, water and natural gas. In recent years, shortages of electricity have resulted in increased costs for consumers and certain interruptions in service. Increased consumer costs and consumer perception that the State is not able to effectively manage its utility needs may reduce demand for leased space in California office properties. A significant reduction in demand for office space could adversely affect our future financial condition, results of operations, cash flow, quoted trading prices of our securities and ability to satisfy our debt service obligations and to pay distributions to stockholders.
We face significant competition, which may decrease or prevent increases of the occupancy and rental rates of our properties.
We compete with numerous developers, owners and operators of office and commercial real estate, many of whom own properties similar to ours in the same submarkets in which our properties are located. If our competitors offer space at rental rates below current market rates, or below the rental rates we currently charge our tenants, some of which are significantly above current market rates, we may lose potential tenants and may be pressured to reduce our rental rates below those we currently charge in order to retain tenants when their leases expire. As a result, our financial condition, results of operations, cash flow, per share trading price of our common stock and Series A Preferred Stock and ability to satisfy our debt service obligations and to pay dividends to our stockholders may be adversely affected.
We could default on leases for land on which some of our properties are located.
We possess leasehold interests on the land at Two California Plaza that, including renewal options, expires in 2082. We also have a lease for the land at Brea Corporate Place that expires in 2083. As of December 31, 2008, we
17
had 1,657,271 net rentable square feet of office space located on these parcels. If we default under the terms of these long-term leases, we may be liable for damages and lose our interest in these properties, including our options to purchase the land subject to the leases.
We may be unable to renew leases, lease vacant space or re-lease space as leases expire.
As of December 31, 2008, leases representing 5.4% and 9.5% of the square footage of the properties in our Effective Portfolio will expire in 2009 and 2010, respectively, and an additional 20.7% of the square footage of the properties in our Effective Portfolio was available for lease. Above-market rental rates at some of our properties will force us to renew or re-lease some expiring leases at lower rates. We cannot assure you that leases will be renewed or that our properties will be re-leased at net effective rental rates equal to or above their current net effective rental rates (particularly in the current softened leasing market). If the rental rates for our properties decrease, our existing tenants do not renew their leases or we do not re-lease a significant portion of our available space and space for which leases will expire, our financial condition, results of operations, cash flow, per share trading price of our common stock and Series A Preferred Stock and our ability to satisfy our debt service obligations and to pay dividends to our stockholders would be adversely affected.
Because we own a hotel property, we face the risks associated with the hospitality industry.
We own the Westin® Pasadena Hotel located in Pasadena, California and are susceptible to risks associated with the hospitality industry, including:
| | • | | Competition for guests with other hotels, some of which may have greater marketing and financial resources than the manager of our hotel; |
| | • | | Increases in operating costs from inflation and other factors that the manager of our hotel may not be able to offset through higher room rates; |
| | • | | Future terrorist attacks that could adversely affect the travel and tourism industries and decrease demand for our hotel; |
| | • | | Fluctuating and seasonal demands of business travelers and tourism; |
| | • | | General and local economic conditions (such as the current economic downturn) may affect demand for travel in general; and |
| | • | | Potential oversupply of hotel rooms resulting from excessive new development. |
If our hotel does not generate sufficient revenue, our financial position, results of operations, cash flow, per share trading price of our common stock and Series A Preferred Stock and ability to satisfy our debt service obligations and to pay dividends to our stockholders may be adversely affected.
We could incur significant costs related to government regulation and private litigation over environmental matters.
Under various laws relating to the protection of the environment, a current or previous owner or operator of real estate may be liable for contamination resulting from the presence or discharge of hazardous or toxic substances at that property, and may be required to investigate and clean up such contamination at that property or emanating from that property. Such laws often impose liability without regard to whether the owner or operator knew of, or was responsible for, the presence of the contaminants, and the liability may be joint and several. The presence of contamination or the failure to remedy contamination in our properties may expose us to third-party liability or adversely affect our ability to sell, lease or develop the real estate or to borrow using the real estate as collateral.
These environmental laws also govern the presence, maintenance and removal of ACBM, and may impose fines and penalties for failure to comply with these requirements or expose us to third-party liability. Some of our
18
properties contain ACBM and we could be liable for such fines or penalties. We cannot assure our stockholders that costs of future environmental compliance will not affect our ability to make distributions to our stockholders or such costs or other remedial measures will not have a material adverse effect on our business, assets or results of operations. None of the recent site assessments revealed any past or present environmental liability that we believe would have a material adverse effect on our business, assets or results of operations.
Some of the properties in our portfolio contain, or may have contained, or are adjacent to or near other properties that have contained or currently contain, underground storage tanks for the storage of petroleum products or other hazardous or toxic substances. If hazardous or toxic substances were released from these tanks, we could incur significant costs or be liable to third parties with respect to the releases. From time to time, the EPA designates certain sites affected by hazardous substances as “Superfund” sites pursuant to the Comprehensive Environmental Response, Compensation, and Liability Act. The EPA identifies parties who are considered to be potentially responsible for the hazardous substances at Superfund sites and makes them liable for the costs of responding to the hazardous substances. The parcel of land on which the Glendale Center is located lies within a large Superfund site, and we could be named as a potentially responsible party with respect to that site.
Existing conditions at some of our properties may expose us to liability related to environmental matters.
Independent environmental consultants have conducted Phase I or other environmental site assessments on all of the properties in our existing portfolio. Site assessments are intended to discover and evaluate information regarding the environmental condition of the surveyed property and surrounding properties. These assessments do not generally include soil samplings, subsurface investigations or an asbestos survey and the assessments may fail to reveal all environmental conditions, liabilities or compliance concerns.
None of the site assessments revealed any past or present environmental liability that we believe would have a material adverse effect on our business, assets or results of operations. However, the assessments may have failed to reveal all environmental conditions, liabilities or compliance concerns. Material environmental conditions, liabilities, or compliance concerns may have arisen after the review was completed or may arise in the future and future laws, ordinances or regulations may impose material additional environmental liability. We cannot assure our stockholders that costs of future environmental compliance will not affect our ability to make distributions to our stockholders or such costs or other remedial measures will not have a material adverse effect on our business, assets or results of operations.
Potential environmental liabilities may exceed our environmental insurance coverage limits.
We carry environmental insurance to cover likely and reasonably anticipated potential environmental liability associated with above-ground and underground storage tanks at all of our properties where such tanks are located. While we believe this coverage is sufficient to protect us against likely environmental risks, we cannot assure you that our insurance coverage will be sufficient or that our liability, if any, will not have a material adverse effect on our financial condition, results of operations, cash flow, per share trading price of our common stock and Series A Preferred Stock and our ability to satisfy our debt service obligations and to pay dividends to our stockholders.
We may incur significant costs complying with the ADA and similar laws.
Under the ADA, all public accommodations must meet federal requirements related to access and use by disabled persons. Although we believe that the properties in our portfolio substantially comply with present requirements of the ADA and we continue to make capital expenditures to address the requirements of the ADA, we have not conducted an audit or investigation of all of our properties to determine our compliance. If one or more of our properties is not in compliance with the ADA, then we would be required to incur additional costs to bring the property into compliance. Additional federal, state and local laws also may require modifications to our
19
properties, or restrict our ability to renovate our properties. We cannot predict the ultimate amount of the cost of compliance with the ADA or other legislation. If we incur substantial costs to comply with the ADA and any other legislation, our financial condition, results of operations, cash flow, per share trading price of our common stock and Series A Preferred Stock and our ability to satisfy our debt service obligations and to pay dividends to our stockholders could be adversely affected.
We may incur significant costs complying with other regulations.
The properties in our portfolio are subject to various federal, state and local regulatory requirements, such as state and local fire and life safety requirements. If we fail to comply with these various requirements, we might incur governmental fines or private damage awards. We believe that the properties in our portfolio are currently in material compliance with all applicable regulatory requirements. However, we do not know whether existing requirements will change or whether future requirements will require us to make significant unanticipated expenditures that will adversely impact our financial condition, results of operations, cash flow, the per share trading price of our common stock and Series A Preferred Stock and our ability to satisfy our debt service obligations and to pay dividends to our stockholders.
Joint venture investments, including our joint venture with Macquarie Office Trust, could be adversely affected by our lack of sole decision-making authority, our reliance on co-venturers’ financial condition and disputes between us and our co-venturers.
We are currently partners with Macquarie Office Trust and DH Von Karman, LLC in joint ventures. We may also co-invest in the future with third parties through partnerships, joint ventures or other entities, acquiring non-controlling interests in or sharing responsibility for managing the affairs of a property, partnership, joint venture or other entity. In the case of our existing joint ventures and any additional joint ventures, we would not be in a position to exercise sole decision-making authority regarding the property, partnership, joint venture or other entities. Additionally we have a right of first opportunity agreement with Macquarie Office Trust, which obligates us to offer Macquarie Office Trust the first opportunity to invest in any potential acquisition property. Investments in partnerships, joint ventures, or other entities may, under certain circumstances, involve risks not present were a third party not involved, including the possibility that partners or co-venturers might become bankrupt or fail to fund their share of required capital contributions. Partners or co-venturers may have economic or other business interests or goals that are inconsistent with our business interests or goals, and may be in a position to take actions contrary to our policies or objectives. Such investments may also have the potential risk of impasses on decisions, such as a sale, because neither we nor the partner or co-venturer would have full control over the partnership or joint venture. Impasses could also result in either the sale of a building or buildings, the sale of our joint venture interest or the purchase of Macquarie Office Trust’s interest. Disputes between us and partners or co-venturers may result in litigation or arbitration that would increase our expenses and prevent our officers and/or directors from focusing their time and effort on our business. Consequently, actions by or disputes with partners or co-venturers might result in subjecting properties owned by the partnership or joint venture to additional risk. In addition, we may in certain circumstances be liable for the actions of our third-party partners or co-venturers. We will seek to maintain sufficient control of such entities to permit them to achieve our business objectives.
Failure to qualify as a REIT would have significant adverse consequences to us and the value of our stock.
We operate in a manner that is intended to allow us to qualify as a REIT for federal income tax purposes under the Code. We have not requested and do not plan to request a ruling from the IRS that we qualify as a REIT, and the statements in this Annual Report on Form 10-K are not binding on the IRS or any court. If we lose our REIT status, we will face serious tax consequences that would substantially reduce the funds available for distribution to our stockholders for each of the years involved because: (i) we would not be allowed a deduction for dividends paid to stockholders in computing our taxable income and we would be subject to federal and state
20
income tax at regular corporate rates; (ii) we could be subject to the federal alternative minimum tax and possibly increased state and local taxes; and (iii) unless we are entitled to relief under applicable statutory provisions, we could not elect to be taxed as a REIT for four taxable years following the year during which we were disqualified. In addition, if we fail to qualify as a REIT, we will not be required to make distributions to stockholders, and all distributions to stockholders will be subject to tax as regular corporate dividends to the extent of our current and accumulated earnings and profits. As a result of all these factors, our failure to qualify as a REIT also could impair our ability to expand our business and raise capital, and would adversely affect the value of our common stock and Series A Preferred Stock. Qualification as a REIT involves the application of highly technical and complex Code provisions for which there are only limited judicial and administrative interpretations. The complexity of these provisions and of the applicable U.S. Treasury Department regulations that have been promulgated under the Code is greater in the case of a REIT that, like us, holds its assets through a partnership. The determination of various factual matters and circumstances not entirely within our control may affect our ability to qualify as a REIT. To qualify as a REIT, we must satisfy a number of asset, income, organizational, distribution, stock ownership and other requirements. Also, we must make distributions to our stockholders aggregating annually at least 90% of our REIT taxable income, excluding capital gains. In addition, legislation, new regulations, administrative interpretations or court decisions may adversely affect our investors, our ability to qualify as a REIT for federal income tax purposes or the desirability of an investment in a REIT relative to other investments. Even if we qualify as a REIT for federal income tax purposes, we may be subject to some federal, state and local taxes on our income or property and, in certain cases, a 100% penalty tax in the event we sell property as a dealer or if our services company enters into agreements with us or our tenants on a basis that is determined to be other than on an arm’s-length basis.
To maintain our REIT status, we may be forced to borrow funds on a short-term basis during unfavorable market conditions.
To qualify as a REIT, we generally must distribute to our stockholders at least 90% of our REIT taxable income each year, excluding capital gains, and we will be subject to regular corporate income taxes to the extent that we distribute less than 100% of our net taxable income each year. In addition, we will be subject to a 4% nondeductible excise tax on the amount, if any, by which distributions paid by us in any calendar year are less than the sum of 85% of our ordinary income, 95% of our capital gain net income and 100% of our undistributed income from prior years. In order to maintain our REIT status and avoid the payment of income and excise taxes, we may need to borrow funds on a short-term basis to meet the REIT distribution requirements even if the then-prevailing market conditions are not favorable for these borrowings. These short-term borrowing needs could result from differences in timing between the actual receipt of cash and inclusion of income for federal income tax purposes, or the effect of non-deductible capital expenditures, the creation of reserves or required debt or amortization payments.
Our success depends on key personnel whose continued service is not guaranteed.
We depend on the efforts of key personnel, particularly Nelson C. Rising, our President and Chief Executive Officer. Among the reasons that Mr. Rising is important to our success is that he has a national industry reputation that attracts business and investment opportunities and assists us in negotiations with lenders, existing and potential tenants and industry personnel. If we lost his services, our relationships with such personnel could diminish. Many of our other senior executives also have strong regional industry reputations, which aid us in identifying opportunities, having opportunities brought to us, and negotiating with tenants and build-to-suit prospects. While we believe that we could find replacements for all of these key personnel, the loss of their services could materially and adversely affect our operations because of diminished relationships with lenders, existing and prospective tenants and industry personnel.
21
Our charter and Maryland law contain provisions that may delay, defer or prevent transactions that may be beneficial to the holders of our common stock and Series A Preferred Stock.
Our charter contains a 9.8% ownership limit.Our Articles of Amendment and Restatement (our “charter”), subject to certain exceptions, authorizes our directors to take such actions as are necessary and desirable to preserve our qualification as a REIT and to limit any person to actual or constructive ownership of no more than 9.8% of the outstanding shares of our common stock. Our board of directors, in its sole discretion, may exempt a proposed transferee from the ownership limit. However, our board of directors may not grant an exemption from the ownership limit to any proposed transferee whose ownership, direct or indirect, in excess of 9.8% of the value of our outstanding shares of our common stock could jeopardize our status as a REIT. These restrictions on transferability and ownership will not apply if our board of directors determines that it is no longer in our best interests to attempt to qualify, or to continue to qualify, as a REIT. The ownership limit may delay or impede a transaction or a change in control that might be in the best interest of our stockholders.
We could authorize and issue stock without stockholder approval. Our charter authorizes our board of directors to amend the charter to increase or decrease the aggregate number of shares of stock or the number of shares of stock of any class or series that we have the authority to issue, to issue authorized but unissued shares of our common stock or Series A Preferred Stock and to classify or reclassify any unissued shares of our common stock or Series A Preferred Stock and to set the preferences, rights and other terms of such classified or unclassified shares. Although our board of directors has no such intention at the present time, it could establish another series of stock that could, depending on the terms of such series, delay, defer or prevent a transaction that might be in the best interest of our stockholders.
Certain provisions of Maryland law could inhibit changes in control. Certain provisions of the Maryland General Corporation Law (“MGCL”) may have the effect of inhibiting a third party from making a proposal to acquire us or of impeding a change in control under circumstances that otherwise could be in the best interest of our stockholders, including: (i) “business combination” provisions that, subject to limitations, prohibit certain business combinations between us and an “interested stockholder” (defined generally as any person who beneficially owns 10% or more of the voting power of our outstanding voting shares or any affiliate or associate of ours who, at any time within the two-year period prior to the date in question, was the beneficial owner of 10% or more of the voting power of our then outstanding voting shares) or an affiliate thereof for five years after the most recent date on which the stockholder becomes an interested stockholder, and thereafter imposes special appraisal rights and special stockholder voting requirements on these combinations; and (ii) “control share” provisions that provide that “control shares” of our company (defined as shares that, when aggregated with other shares controlled by the stockholder except solely by virtue of a revocable proxy, entitle the stockholder to exercise one of three increasing ranges of voting power in electing directors) acquired in a “control share acquisition” (defined as the direct or indirect acquisition of ownership or control of “control shares”) have no voting rights except to the extent approved by our stockholders by the affirmative vote of at least two-thirds of all the votes entitled to be cast on the matter, excluding all interested shares. We have opted out of these provisions of the MGCL, in the case of the business combination provisions of the MGCL by resolution of our board of directors, and in the case of the control share provisions of the MGCL pursuant to a provision in our bylaws. However, our board of directors may by resolution elect to opt in to the business combination provisions of the MGCL and we may, by amendment to our bylaws, opt in to the control share provisions of the MGCL in the future. In addition, provided that we have a class of equity securities registered under the Exchange Act and at least three independent directors, Subtitle 8 of Title 3 of the MGCL permits us to elect to be subject, by provision in our charter or bylaws or a resolution of our board of directors and notwithstanding any contrary provision in the charter or bylaws, to certain provisions, including a classified board and a requirement that a vacancy on the board be filled only by the remaining directors and for the remainder of the full term of the class of directors in which the vacancy occurred. Our charter, bylaws, the partnership agreement and Maryland law also contain other provisions that may delay, defer or prevent a transaction or a change in control that might otherwise be in the best interest of our stockholders.
22
| Item 1B. | Unresolved Staff Comments. |
None.
Lease Terms
Our leases are typically structured for terms of five to ten years (though in the current leasing market, we may enter into more short-term leases), and usually require the purchase of a minimum number of monthly parking spaces at the property. Leases usually contain provisions permitting tenants to renew expiring leases at prevailing market rates. Most of our leases are either triple net or modified gross leases. Triple net and modified gross leases are those in which tenants pay not only base rent, but also some or all real estate taxes and operating expenses of the leased property. Tenants typically reimburse us the full direct cost, without regard to a base year or expense stop, for use of lighting, heating and air conditioning during non-business hours, and for a certain number of parking spaces. We are generally responsible for structural repairs.
Historical Percentage Leased and Rental Rates
The following table sets forth, as of the indicated dates, the percentage leased and annualized rent per leased square foot for our Effective Portfolio:
| | | | | |
| | | Percentage Leased | | Annualized Rent
per Square Foot(1) |
December 31, 2008 | | 79.3% | | $ | 22.09 |
December 31, 2007 | | 81.1% | | | 20.56 |
December 31, 2006 | | 87.6% | | | 21.34 |
| (1) | Annualized rent per leased square foot represents the annualized monthly contractual rent under existing leases as of the date indicated. This amount reflects total base rent before any one-time or nonrecurring rent abatements, but after annually recurring rent credits, and is shown on a net basis; thus, for any tenant under a partial gross lease, the expense stop, or under a full gross lease, the current year operating expenses (which may be estimates as of such date) are subtracted from gross rent. |
23
Property Statistics
The following table summarizes our Total Portfolio as of December 31, 2008:
| | | | | | | | | | | | | | | | | | | | | | | | | | | | |
| | | Number
of
Buildings | | Number
of
Tenants | | Year Built /
Renovated | | Ownership
% | | | Square Feet | | | Leased % and In-Place Rents |
| | | | | | Net
Building
Rentable | | Effective(1) | | % of Net
Rentable | | | %
Leased | | | Total
Annualized
Rents(2) | | Effective
Annualized
Rents(2) | | Annualized
Rent $/
RSF(3) |
Office Properties | | | | | | | | | | | | | | | | | | | | | | | | | |
Los Angeles County | | | | | | | | | | | | | | | | | | | | | | | | | |
Los Angeles Central Business District: | | | | | | | | | | | | | | | | | | | | | | | | | | | | |
Gas Company Tower | | 1 | | 18 | | 1991 | | 100 | % | | 1,323,651 | | 1,323,651 | | 6.50 | % | | 92.1 | % | | $ | 33,946,252 | | $ | 33,946,252 | | $ | 27.86 |
US Bank Tower | | 1 | | 51 | | 1989 | | 100 | % | | 1,412,351 | | 1,412,351 | | 6.93 | % | | 65.6 | % | | | 24,392,936 | | | 24,392,936 | | | 26.33 |
Wells Fargo Tower | | 2 | | 64 | | 1982 | | 100 | % | | 1,396,121 | | 1,396,121 | | 6.85 | % | | 93.9 | % | | | 27,350,771 | | | 27,350,771 | | | 20.85 |
Two California Plaza | | 1 | | 65 | | 1992 | | 100 | % | | 1,328,275 | | 1,328,275 | | 6.51 | % | | 94.0 | % | | | 24,961,679 | | | 24,961,679 | | | 19.98 |
KPMG Tower | | 1 | | 20 | | 1983 | | 100 | % | | 1,143,654 | | 1,143,654 | | 5.61 | % | | 92.5 | % | | | 23,826,900 | | | 23,826,900 | | | 22.54 |
777 Tower | | 1 | | 36 | | 1991 | | 100 | % | | 1,010,123 | | 1,010,123 | | 4.95 | % | | 91.9 | % | | | 19,139,555 | | | 19,139,555 | | | 20.61 |
550 South Hope Street | | 1 | | 42 | | 1991 | | 100 | % | | 565,738 | | 565,738 | | 2.77 | % | | 87.3 | % | | | 8,402,809 | | | 8,402,809 | | | 17.01 |
One California Plaza | | 1 | | 31 | | 1985 | | 20 | % | | 993,469 | | 198,694 | | 4.87 | % | | 77.3 | % | | | 15,638,157 | | | 3,127,631 | | | 20.37 |
| | | | | | | | | | | | | | | | | | | | | | | | | | | | |
Total LACBD Submarket | | 9 | | 327 | | | | | | | 9,173,382 | | 8,378,607 | | 44.99 | % | | 86.7 | % | | | 177,659,059 | | | 165,148,533 | | | 22.34 |
| | | | | | | | | | | |
Tri-Cities Submarket: | | | | | | | | | | | | | | | | | | | | | | | | | | | | |
Glendale Center | | 2 | | 4 | | 1973/1996 | | 100 | % | | 387,545 | | 387,545 | | 1.90 | % | | 100.0 | % | | | 8,649,073 | | | 8,649,073 | | | 22.32 |
801 North Brand | | 1 | | 31 | | 1987 | | 100 | % | | 282,770 | | 282,770 | | 1.39 | % | | 88.8 | % | | | 4,782,164 | | | 4,782,164 | | | 19.05 |
701 North Brand | | 1 | | 13 | | 1978 | | 100 | % | | 131,129 | | 131,129 | | 0.64 | % | | 100.0 | % | | | 2,267,347 | | | 2,267,347 | | | 17.29 |
700 North Central | | 1 | | 18 | | 1979 | | 100 | % | | 134,168 | | 134,168 | | 0.66 | % | | 92.0 | % | | | 1,927,596 | | | 1,927,596 | | | 15.62 |
Plaza Las Fuentes | | 3 | | 9 | | 1989 | | 100 | % | | 192,958 | | 192,958 | | 0.94 | % | | 100.0 | % | | | 5,081,285 | | | 5,081,285 | | | 26.33 |
| | | | | | | | | | | | | | | | | | | | | | | | | | | | |
Total Tri-Cities Submarket | | 8 | | 75 | | | | | | | 1,128,570 | | 1,128,570 | | 5.53 | % | | 96.2 | % | | | 22,707,465 | | | 22,707,465 | | | 20.91 |
| | | | | | | | | | | |
Santa Monica Professional and Entertainment Submarket: | | | | | | | | | | | | | | | | | | | | | | | | | | | | |
Lantana Media Campus | | 4 | | 25 | | 1989/2001/2008 | | 100 | % | | 464,475 | | 464,475 | | 2.28 | % | | 82.8 | % | | | 15,734,321 | | | 15,734,321 | | | 40.89 |
| | | | | | | | | | | | | | | | | | | | | | | | | | | | |
Total Entertainment Submarket | | 4 | | 25 | | | | | | | 464,475 | | 464,475 | | 2.28 | % | | 82.8 | % | | | 15,734,321 | | | 15,734,321 | | | 40.89 |
| | | | | | | | | | | |
Cerritos Office Submarket: | | | | | | | | | | | | | | | | | | | | | | | | | | | | |
Cerritos—Phase I | | 1 | | 1 | | 1999 | | 20 | % | | 221,968 | | 44,394 | | 1.09 | % | | 100.0 | % | | | 5,982,037 | | | 1,196,408 | | | 26.95 |
Cerritos—Phase II | | 1 | | — | | 2001 | | 20 | % | | 104,567 | | 20,913 | | 0.51 | % | | 100.0 | % | | | 2,482,421 | | | 496,484 | | | 23.74 |
| | | | | | | | | | | | | | | | | | | | | | | | | | | | |
Total Cerritos Submarket | | 2 | | 1 | | | | | | | 326,535 | | 65,307 | | 1.60 | % | | 100.0 | % | | | 8,464,458 | | | 1,692,892 | | | 25.92 |
| | | | | | | | | | | | | | | | | | | | | | | | | | | | |
Total Los Angeles County | | 23 | | 428 | | | | | | | 11,092,962 | | 10,036,959 | | 54.40 | % | | 87.9 | % | | $ | 224,565,303 | | $ | 205,283,211 | | $ | 23.03 |
| | | | | | | | | | | | | | | | | | | | | | | | | | | | |
24
| | | | | | | | | | | | | | | | | | | | | | | | | | | | |
| | | Number
of
Buildings | | Number
of
Tenants | | Year Built /
Renovated | | Ownership
% | | | Square Feet | | | Leased % and In-Place Rents |
| | | | | | Net
Building
Rentable | | Effective(1) | | % of Net
Rentable | | | %
Leased | | | Total
Annualized
Rents(2) | | Effective
Annualized
Rents(2) | | Annualized
Rent $/
RSF(3) |
Office Properties | | | | | | | | | | | | | | | | | | | | | | | | | |
Orange County | | | | | | | | | | | | | | | | | | | | | | | | | |
John Wayne Airport Submarket: | | | | | | | | | | | | | | | | | | | | | | | | | | | | |
Park Place | | 8 | | 36 | | 1977/2002 | | 100 | % | | 1,787,440 | | 1,787,440 | | 8.77 | % | | 60.3 | % | | $ | 17,241,952 | | $ | 17,241,952 | | $ | 15.99 |
3161 Michelson(4) | | 1 | | 5 | | 2007 | | 100 | % | | 532,141 | | 532,141 | | 2.61 | % | | 61.9 | % | | | 10,044,441 | | | 10,044,441 | | | 30.51 |
2600 Michelson | | 1 | | 29 | | 1986 | | 100 | % | | 308,109 | | 308,109 | | 1.51 | % | | 76.1 | % | | | 4,822,474 | | | 4,822,474 | | | 20.58 |
18581 Teller | | 1 | | 3 | | 1983 | | 100 | % | | 86,087 | | 86,087 | | 0.42 | % | | 100.0 | % | | | 1,382,426 | | | 1,382,426 | | | 16.06 |
Quintana Campus | | 4 | | 2 | | 1989/2004 | | 20 | % | | 414,595 | | 82,919 | | 2.03 | % | | 100.0 | % | | | 9,314,466 | | | 1,862,893 | | | 22.47 |
17885 Von Karman Avenue | | 1 | | — | | 2008 | | 100 | % | | 151,370 | | 151,370 | | 0.74 | % | | 0.0 | % | | | — | | | — | | | — |
| | | | | | | | | | | | | | | | | | | | | | | | | | | | |
Total Airport Submarket | | 16 | | 75 | | | | | | | 3,279,742 | | 2,948,066 | | 16.08 | % | | 65.3 | % | | | 42,805,759 | | | 35,354,186 | | | 19.98 |
| | | | | | | | | | | |
Costa Mesa Submarket: | | | | | | | | | | | | | | | | | | | | | | | | | | | | |
Griffin Towers | | 2 | | 36 | | 1987 | | 100 | % | | 543,988 | | 543,988 | | 2.67 | % | | 64.3 | % | | | 5,805,217 | | | 5,805,217 | | | 16.59 |
Pacific Arts Plaza | | 8 | | 42 | | 1982 | | 100 | % | | 785,173 | | 785,173 | | 3.85 | % | | 80.1 | % | | | 14,022,970 | | | 14,022,970 | | | 22.30 |
| | | | | | | | | | | | | | | | | | | | | | | | | | | | |
Total Costa Mesa Submarket | | 10 | | 78 | | | | | | | 1,329,161 | | 1,329,161 | | 6.52 | % | | 73.6 | % | | | 19,828,187 | | | 19,828,187 | | | 20.26 |
| | | | | | | | | | | |
Central Orange Submarket: | | | | | | | | | | | | | | | | | | | | | | | | | | | | |
3800 Chapman | | 1 | | 1 | | 1984 | | 100 | % | | 157,231 | | 157,231 | | 0.77 | % | | 63.4 | % | | | 2,159,701 | | | 2,159,701 | | | 21.66 |
500-600 City Parkway | | 3 | | 12 | | 1978 | | 100 | % | | 457,475 | | 457,475 | | 2.24 | % | | 28.7 | % | | | 2,119,332 | | | 2,119,332 | | | 16.13 |
City Tower | | 1 | | 25 | | 1988 | | 100 | % | | 411,843 | | 411,843 | | 2.02 | % | | 78.1 | % | | | 7,128,670 | | | 7,128,670 | | | 22.15 |
500 Orange Tower | | 3 | | 35 | | 1987 | | 100 | % | | 334,998 | | 334,998 | | 1.64 | % | | 79.6 | % | | | 5,346,266 | | | 5,346,266 | | | 20.06 |
Stadium Towers Plaza | | 1 | | 26 | | 1988 | | 100 | % | | 258,257 | | 258,257 | | 1.27 | % | | 63.1 | % | | | 3,317,963 | | | 3,317,963 | | | 20.36 |
Stadium Gateway | | 1 | | 7 | | 2001 | | 20 | % | | 272,826 | | 54,565 | | 1.34 | % | | 79.0 | % | | | 4,633,088 | | | 926,618 | | | 21.48 |
| | | | | | | | | | | | | | | | | | | | | | | | | | | | |
Total Central Orange Submarket | | 10 | | 106 | | | | | | | 1,892,630 | | 1,674,369 | | 9.28 | % | | 63.3 | % | | | 24,705,020 | | | 20,998,550 | | | 20.62 |
| | | | | | | | | | | |
Other: | | | | | | | | | | | | | | | | | | | | | | | | | | | | |
Brea Corporate Place | | 2 | | 16 | | 1987 | | 100 | % | | 328,996 | | 328,996 | | 1.62 | % | | 48.6 | % | | | 2,935,767 | | | 2,935,767 | | | 18.34 |
Brea Financial Commons | | 3 | | 2 | | 1987 | | 100 | % | | 165,540 | | 165,540 | | 0.81 | % | | 90.7 | % | | | 2,845,219 | | | 2,845,219 | | | 18.96 |
130 State College | | 1 | | 1 | | 1983 | | 100 | % | | 42,884 | | 42,884 | | 0.21 | % | | 100.0 | % | | | 614,956 | | | 614,956 | | | 14.34 |
| | | | | | | | | | | | | | | | | | | | | | | | | | | | |
Total Other | | 6 | | 19 | | | | | | | 537,420 | | 537,420 | | 2.64 | % | | 65.7 | % | | | 6,395,942 | | | 6,395,942 | | | 18.12 |
| | | | | | | | | | | | | | | | | | | | | | | | | | | | |
| | | | | | | | | | | |
Total Orange County | | 42 | | 278 | | | | | | | 7,038,953 | | 6,489,016 | | 34.52 | % | | 66.4 | % | | $ | 93,734,908 | | $ | 82,576,865 | | $ | 20.06 |
| | | | | | | | | | | | | | | | | | | | | | | | | | | | |
| | | | | | | | | | | |
San Diego County | | | | | | | | | | | | | | | | | | | | | | | | | |
Sorrento Mesa Submarket: | | | | | | | | | | | | | | | | | | | | | | | | | | | | |
San Diego Tech Center | | 11 | | 29 | | 1984/1986 | | 20 | % | | 645,934 | | 129,187 | | 3.17 | % | | 96.8 | % | | $ | 12,680,555 | | $ | 2,536,111 | | $ | 20.29 |
| | | | | | | | | | | | | | | | | | | | | | | | | | | | |
Total Sorento Mesa Submarket | | 11 | | 29 | | | | | | | 645,934 | | 129,187 | | 3.17 | % | | 96.8 | % | | | 12,680,555 | | | 2,536,111 | | | 20.29 |
| | | | | | | | | | | |
Mission Valley Submarket: | | | | | | | | | | | | | | | | | | | | | | | | | | | | |
Mission City Corporate Center | | 3 | | 14 | | 1990 | | 100 | % | | 190,634 | | 190,634 | | 0.93 | % | | 86.9 | % | | | 4,081,007 | | | 4,081,007 | | | 24.63 |
2385 Northside Drive | | 1 | | 1 | | 2008 | | 100 | % | | 88,795 | | 88,795 | | 0.44 | % | | 51.7 | % | | | 798,288 | | | 798,288 | | | 17.37 |
| | | | | | | | | | | | | | | | | | | | | | | | | | | | |
Total Mission Valley Submarket | | 4 | | 15 | | | | | | | 279,429 | | 279,429 | | 1.37 | % | | 75.7 | % | | | 4,879,295 | | | 4,879,295 | | | 23.06 |
| | | | | | | | | | | | | | | | | | | | | | | | | | | | |
Total San Diego County | | 15 | | 44 | | | | | | | 925,363 | | 408,616 | | 4.54 | % | | 90.4 | % | | $ | 17,559,850 | | $ | 7,415,406 | | $ | 20.99 |
| | | | | | | | | | | | | | | | | | | | | | | | | | | | |
25
| | | | | | | | | | | | | | | | | | | | | | | | | | | | |
| | | Number
of
Buildings | | Number
of
Tenants | | Year Built /
Renovated | | Ownership
% | | | Square Feet | | | Leased % and In-Place Rents |
| | | | | | Net
Building
Rentable | | Effective(1) | | % of Net
Rentable | | | %
Leased | | | Total
Annualized
Rents(2) | | Effective
Annualized
Rents(2) | | Annualized
Rent $/
RSF(3) |
Office Properties | | | | | | | | | | | | | | | | | | | | | | | | | |
Other | | | | | | | | | | | | | | | | | | | | | | | | | |
Denver, CO—Downtown Submarket: | | | | | | | | | | | | | | | | | | | | | | | | | | | | |
Wells Fargo Center—Denver | | 1 | | 41 | | 1983 | | 20 | % | | 1,211,773 | | 242,354 | | 5.94 | % | | 95.9 | % | | $ | 22,744,849 | | $ | 4,548,970 | | $ | 19.56 |
| | | | | | | | | | | | | | | | | | | | | | | | | | | | |
Total Office Properties | | 81 | | 791 | | | | | | | 20,269,051 | | 17,176,945 | | 99.40 | % | | 81.0 | % | | $ | 358,604,910 | | $ | 299,824,452 | | $ | 21.84 |
| | | | | | | | | | | | | | | | | | | | | | | | | | | | |
Retail Property | | | | | | | | | | | | | | | | | | | | | | | | | |
John Wayne Airport Submarket: | | | | | | | | | | | | | | | | | | | | | | | | | | | | |
Park Place | | 8 | | 25 | | 1981 | | 100 | % | | 122,533 | | 122,533 | | 0.60 | % | | 91.8 | % | | $ | 3,409,080 | | $ | 3,409,080 | | $ | 30.30 |
| | | | | | | | | | | | | | | | | | | | | | | | | | | | |
Total Office and Retail Properties | | 89 | | 816 | | | | | | | 20,391,584 | | 17,299,478 | | 100.00 | % | | 81.1 | % | | $ | 362,013,990 | | $ | 303,233,532 | | $ | 21.89 |
| | | | | | | | | | | | | | | | | | | | | | | | | | | | |
Effective Office and Retail Properties | | | | | | | | | | | 17,299,478 | | | | | | | 79.3 | % | | | | | | | | $ | 22.09 |
| | | | | | | | | | | | | | | | | | | | | | | | | | | | |
| | | | | | | | | | | |
Hotel Property | | | | | | | | | | | SQFT | | Effective
SQFT | | Number
of
Rooms | | | | | | | | | | |
Westin Hotel, Pasadena, CA | | | | | | | | 100 | % | | 266,000 | | 266,000 | | 350 | | | | | | | | | | | | | |
| | | | | | | | | | | | | | | | | | | | | | | | | | | | |
Total Office, Retail and Hotel Properties | | | | | | | | | | | 20,657,584 | | 17,565,478 | | | | | | | | | | | | | | | |
| | | | | | | | | | | | | | | | | | | | | | | | | | | | |
| | | | | | | | | | | |
Parking Properties | | | | | | | | | | | SQFT | | Effective
SQFT | | Vehicle
Capacity | | | Effective
Vehicle
Capacity | | | Annualized
Parking
Revenue(5) | | Effective
Annualized
Parking
Revenue(6) | | Effective
Annualized
Parking
Revenue per
Vehicle
Capacity(7) |
On-Site Parking | | | | | | | | | | | 11,772,172 | | 9,955,174 | | 38,867 | | | 32,988 | | | $ | 50,747,924 | | $ | 44,215,752 | | $ | 1,340 |
Off-Site Garages | | | | | | | | | | | 1,714,435 | | 1,714,435 | | 5,729 | | | 5,729 | | | | 12,305,545 | | | 12,305,545 | | | 2,148 |
| | | | | | | | | | | | | | | | | | | | | | | | | | | | |
Total Parking Properties | | | | | | | | | | | 13,486,607 | | 11,669,609 | | 44,596 | | | 38,717 | | | $ | 63,053,469 | | $ | 56,521,297 | | | 1,460 |
| | | | | | | | | | | | | | | | | | | | | | | | | | | | |
Total Office, Retail, Hotel and Parking Properties | | | | | | | | | | | 34,144,191 | | 29,235,087 | | | | | | | | | | | | | | | |
| | | | | | | | | | | | | | | | | | | | | | | | | | | | |
| (1) | Includes 100% of our consolidated portfolio and 20% of our joint venture properties with Macquarie Office Trust. |
| (2) | Annualized rent represents the annualized monthly contractual rent under existing leases as of December 31, 2008. This amount reflects total base rent before any one-time or non-recurring rent abatements but after annually recurring rent credits and is shown on a net basis; thus, for any tenant under a partial gross lease, the expense stop, or under a full gross lease, the current year operating expenses (which may be estimates as of such date), are subtracted from gross rent. |
| (3) | Annualized rent per rentable square foot represents annualized rent as computed above, divided by the total square footage under lease as of the same date. |
| (4) | As of December 31, 2008, our 3161 Michelson property is classified as held for sale. |
| (5) | Annualized parking revenue represents the annualized quarterly parking revenue as of December 31, 2008. |
| (6) | Effective annualized parking revenue represents the annualized quarterly parking revenue as of December 31, 2008 adjusted to include 100% of our consolidated portfolio and 20% of our joint venture properties with Macquarie Office Trust. |
| (7) | Effective annualized parking revenue per vehicle capacity represents the effective annualized parking revenue divided by the effective vehicle capacity. |
26
Tenant Information
Our Total Portfolio is currently leased to 816 tenants, many of which are nationally recognized firms in the financial services, entertainment, accounting and law sectors. The following table sets forth information regarding the 20 largest tenants in our office portfolio based on annualized rent for our Effective Portfolio as of December 31, 2008:
| | | | | | | | | | | | | | | | | | | |
| | | Tenant | | Number
of
Locations | | Annualized
Rent(1) | | % of Total
Annualized
Rent | | | Total
Leased
Square
Feet | | % of Aggregate
Leased Square
Feet of
Effective Portfolio | | | Weighted
Average
Remaining
Lease
Term in Months | | S & P Credit Rating /
National Recognition(2) |
| | Rated | | | | | | | | | | | | | | | | | |
| 1 | | Southern California Gas Company | | 1 | | $ | 21,283,883 | | 7.0 | % | | 576,516 | | 4.2 | % | | 34 | | A |
| 2 | | Sempra (Pacific Enterprises) | | 1 | | | 8,189,591 | | 2.7 | % | | 217,413 | | 1.6 | % | | 18 | | A |
| 3 | | Wells Fargo Bank(3),(4) | | 5 | | | 7,202,745 | | 2.4 | % | | 415,057 | | 3.0 | % | | 68 | | AAA |
| 4 | | AT&T(3) | | 5 | | | 4,810,836 | | 1.6 | % | | 202,813 | | 1.5 | % | | 48 | | A |
| 5 | | Bank of America(3),(5) | | 6 | | | 4,651,768 | | 1.5 | % | | 220,515 | | 1.6 | % | | 37 | | AA- |
| 6 | | US Bank, National Association(6) | | 3 | | | 4,295,815 | | 1.4 | % | | 164,561 | | 1.3 | % | | 74 | | AA+ |
| 7 | | Disney Enterprises | | 1 | | | 3,706,960 | | 1.2 | % | | 156,215 | | 1.1 | % | | 30 | | A |
| 8 | | JP Morgan Chase & Co.(3),(7) | | 3 | | | 3,029,151 | | 1.0 | % | | 126,447 | | 0.9 | % | | 12 | | A+ |
| 9 | | State Farm Mutual Auto Insurance Company | | 3 | | | 2,702,753 | | 0.9 | % | | 172,170 | | 1.3 | % | | 62 | | AA |
| 10 | | GMAC Mortgage Corporation | | 1 | | | 2,499,091 | | 0.8 | % | | 130,161 | | 0.9 | % | | 60 | | AA |
| | | | | | | | | | | | | | | | | | | |
| | Total Rated / Weighted Average(3),(8) | | | | | 62,372,593 | | 20.5 | % | | 2,381,868 | | 17.4 | % | | 45 | | |
| | | | | | | | | | | | | | | | | | | |
| | Total Investment Grade Tenants(3) | | | | $ | 103,139,357 | | 34.0 | % | | 4,411,114 | | 32.1 | % | | | | |
| | | | | | | | | | | | | | | | | | | |
| | Unrated - Nationally Recognized | | | | | | | | | | | | | | | | | |
| 11 | | Latham & Watkins LLP | | 2 | | | 8,941,649 | | 3.0 | % | | 397,991 | | 2.9 | % | | 167 | | 2nd Largest US Law Firm |
| 12 | | Gibson, Dunn & Crutcher LLP | | 2 | | | 8,903,257 | | 2.9 | % | | 354,721 | | 2.6 | % | | 106 | | 20th Largest US Law Firm |
| 13 | | Deloitte & Touche LLP | | 1 | | | 5,216,904 | | 1.7 | % | | 342,094 | | 2.5 | % | | 75 | | Largest US Accounting Firm |
| 14 | | Marsh USA, Inc. | | 1 | | | 3,727,695 | | 1.2 | % | | 212,721 | | 1.5 | % | | 112 | | World’s Largest Insurance Broker |
| 15 | | KPMG LLP | | 1 | | | 3,636,822 | | 1.2 | % | | 175,971 | | 1.3 | % | | 66 | | 4th Largest US Accounting Firm |
| 16 | | Morrison & Foerster LLP | | 1 | | | 3,469,400 | | 1.2 | % | | 138,776 | | 1.0 | % | | 57 | | 21st Largest US Law Firm |
| 17 | | Munger, Tolles & Olson LLP | | 1 | | | 3,374,322 | | 1.1 | % | | 160,682 | | 1.2 | % | | 158 | | 125th Largest US Law Firm |
| 18 | | PricewaterhouseCoopers LLP | | 1 | | | 2,988,225 | | 1.0 | % | | 160,784 | | 1.2 | % | | 53 | | 3rd Largest US Accounting Firm |
| 19 | | Sidley Austin LLP | | 1 | | | 2,984,193 | | 1.0 | % | | 187,362 | | 1.4 | % | | 180 | | 5th Largest US Law Firm |
| 20 | | Bingham McCutchen, LLP | | 1 | | | 2,442,677 | | 0.8 | % | | 104,712 | | 0.7 | % | | 49 | | 30th Largest US Law Firm |
| | | | | | | | | | | | | | | | | | | |
| | Total Unrated / Weighted Average(3),(8) | | | | | 45,685,144 | | 15.1 | % | | 2,235,814 | | 16.3 | % | | 110 | | |
| | | | | | | | | | | | | | | | | | | |
| | Total Nationally Recognized Tenants(3) | | | | | 81,420,718 | | 26.9 | % | | 3,875,849 | | 28.2 | % | | | | |
| | | | | | | | | | | | | | | | | | | |
| | Total / Weighted Average(3),(8) | | | | $ | 108,057,737 | | 35.6 | % | | 4,617,682 | | 33.7 | % | | 76 | | |
| | | | | | | | | | | | | | | | | | | |
| | Total Investment Grade or Nationally RecognizedTenants(3) | | | | $ | 184,560,075 | | 60.9 | % | | 8,286,963 | | 60.4 | % | | | | |
| | | | | | | | | | | | | | | | | | | |
| (1) | Annualized base rent is calculated as monthly contractual base rent under existing leases as of December 31, 2008, multiplied by 12. For those leases where rent has not yet commenced, the first month in which rent is to be received is used to determine annualized base rent. |
| (2) | S&P credit ratings are as of December 31, 2008. Rankings of law firms are based on total gross revenue in 2007 as reported by American Lawyer Media’s LAW.com. |
| (3) | Includes 20% of annualized rent and leased square footage for our joint venture properties with Macquarie Office Trust. |
| (4) | Amounts shown for Wells Fargo Bank include leases with Wachovia, which was acquired by Wells Fargo on December 31, 2008. |
| (5) | Amounts shown for Bank of America include leases with Countrywide Home Loans, which was acquired by Bank of America on July 1, 2008. |
| (6) | Amounts shown for US Bank include leases with Downey Savings and Loan, which was acquired by US Bank on November 21, 2008. |
| (7) | On September 25, 2008, JP Morgan Chase entered into an agreement with the FDIC to purchase substantially all of the assets and assume certain of the liabilities of Washington Mutual Bank. As part of this agreement, JP Morgan Chase had the right to assume or reject our leases with Washington Mutual. During December 2008, we were notified by JP Morgan Chase that they had rejected all but one of the Washington Mutual leases. We will continue to receive rent on the spaces that were rejected by JP Morgan Chase until the earlier of the move-out date or March 31, 2009. As of December 31, 2008, leases totaling 102,335 effective square feet have been rejected. The effective annualized rent associated with the rejected leases totals approximately $2.6 million. We have entered into a new lease with JP Morgan Chase for 24,112 effective square feet for a term ending in 2010 with a one-year renewal option. One of the rejected leases totaling 26,311 effective square feet is currently occupied by a subtenant. We are currently negotiating a direct lease with the subtenant. |
| (8) | The weighted average calculation is based on the effective net rentable square feet leased by each tenant, which reflects our pro-rata share of our joint venture with Macquarie Office Trust. |
27
The following table presents the diversification of tenants occupying space in our Effective Portfolio by industry as of December 31, 2008:
| | | | | | | |
NAICS Code | | North American Industrial Classification System Description | | Total
Effective
Leased
Square Feet | | Percentage of
Effective
Leased
Square Feet | |
221 | | Utilities | | 801,098 | | 6 | % |
311 - 339 | | Manufacturing | | 318,811 | | 2 | % |
511 - 518 | | Information | | 1,175,953 | | 9 | % |
521 - 525 | | Finance and Insurance | | 4,278,230 | | 31 | % |
531 - 532 | | Real Estate and Rental and Leasing | | 456,616 | | 3 | % |
541 | | Professional, Scientific and Technical Services (except Legal Services) | | 1,504,621 | | 11 | % |
5411 | | Legal Services | | 3,399,774 | | 25 | % |
611 | | Educational Services | | 277,767 | | 2 | % |
721 - 722 | | Accommodation and Food Services | | 229,894 | | 2 | % |
921 - 923 | | Public Administration | | 290,987 | | 2 | % |
| | All Other Services | | 991,459 | | 7 | % |
| | | | | | | |
| | | | 13,725,210 | | 100 | % |
| | | | | | | |
Lease Distribution
The following table presents information relating to the distribution of leases in our Effective Portfolio based on the effective net rentable square feet under lease as of December 31, 2008:
| | | | | | | | | | | | | | | | |
Square Feet under Lease | | Number of
Leases | | Percent of
All Leases | | | Total
Effective
Leased
Square Feet | | Percentage of
Aggregate
Leased
Square Feet | | | Annualized
Rent | | Percentage of
Annualized
Rent | |
2,500 or less | | 254 | | 30 | % | | 333,306 | | 3 | % | | $ | 8,365,441 | | 3 | % |
2,501-10,000 | | 303 | | 35 | % | | 1,521,993 | | 11 | % | | | 33,600,755 | | 11 | % |
10,001-20,000 | | 124 | | 14 | % | | 1,395,966 | | 10 | % | | | 29,107,303 | | 10 | % |
20,001-40,000 | | 78 | | 9 | % | | 1,828,145 | | 13 | % | | | 38,691,335 | | 13 | % |
40,001-100,000 | | 67 | | 8 | % | | 3,197,679 | | 23 | % | | | 70,982,707 | | 23 | % |
greater than 100,000 | | 37 | | 4 | % | | 5,448,121 | | 40 | % | | | 122,485,991 | | 40 | % |
| | | | | | | | | | | | | | | | |
| | 863 | | 100 | % | | 13,725,210 | | 100 | % | | $ | 303,233,532 | | 100 | % |
| | | | | | | | | | | | | | | | |
28
Lease Expirations
The following table presents a summary of lease expirations for our wholly-owned portfolio (excluding our joint venture properties) for leases in place at December 31, 2008, plus available space, for each of the ten calendar years beginning January 1, 2009. This table assumes that none of our tenants exercise renewal options or early termination rights, if any, at or prior to their scheduled expirations.
| | | | | | | | | | | | | | | | | |
Year | | Total Area in
Square Feet Covered
by Expiring Leases | | Percentage
of Aggregate
Square Feet | | | Annualized
Rent | | Percentage
of Total
Annualized
Rent | | | Current Rent
per Square Foot(1) | | Rent per
Square Foot
at Expiration(2) |
Available | | 3,503,645 | | 21.2 | % | | | | | | | | | | | | |
2009 | | 794,421 | | 4.8 | % | | $ | 16,534,691 | | 5.7 | % | | $ | 20.81 | | $ | 20.84 |
2010 | | 1,531,638 | | 9.3 | % | | | 35,040,169 | | 12.2 | % | | | 22.88 | | | 23.61 |
2011 | | 2,416,713 | | 14.6 | % | | | 58,221,234 | | 20.2 | % | | | 24.09 | | | 25.35 |
2012 | | 1,096,713 | | 6.6 | % | | | 23,398,420 | | 8.1 | % | | | 21.34 | | | 23.14 |
2013 | | 2,337,973 | | 14.2 | % | | | 48,183,691 | | 16.7 | % | | | 20.61 | | | 23.43 |
2014 | | 814,778 | | 4.9 | % | | | 15,370,103 | | 5.3 | % | | | 18.86 | | | 22.87 |
2015 | | 813,015 | | 4.9 | % | | | 16,219,711 | | 5.6 | % | | | 19.95 | | | 23.50 |
2016 | | 177,243 | | 1.1 | % | | | 3,689,929 | | 1.3 | % | | | 20.82 | | | 26.74 |
2017 | | 1,060,769 | | 6.4 | % | | | 22,800,250 | | 7.9 | % | | | 21.49 | | | 24.83 |
2018 | | 701,680 | | 4.3 | % | | | 19,316,861 | | 6.7 | % | | | 27.53 | | | 37.66 |
Thereafter | | 1,277,864 | | 7.7 | % | | | 29,763,358 | | 10.3 | % | | | 23.29 | | | 35.00 |
| | | | | | | | | | | | | | | | | |
| | 16,526,452 | | 100.0 | % | | $ | 288,538,417 | | 100.0 | % | | $ | 22.16 | | $ | 25.69 |
| | | | | | | | | | | | | | | | | |
| (1) | Current rent per leased square foot represents current base rent, divided by total square footage under lease as of the same date. |
| (2) | Rent per leased square foot at expiration represents base rent including any future rent steps, and thus represents the base rent that will be in place at lease expiration. |
The following table presents a summary of lease expirations for our joint venture with Macquarie Office Trust for leases in place at December 31, 2008, plus available space, for each of the ten calendar years beginning January 1, 2009. This table assumes that none of the tenants exercise renewal options or early termination rights, if any, at or prior to the scheduled expirations.
| | | | | | | | | | | | | | | | | |
Year | | Total Area in
Square Feet Covered
by Expiring Leases | | Percentage
of Aggregate
Square Feet | | | Annualized
Rent | | Percentage
of Total
Annualized
Rent | | | Current Rent
per Square Foot(1) | | Rent per
Square Foot
at Expiration(2) |
Available | | 353,119 | | 9.1 | % | | | | | | | | | | | | |
2009 | | 708,107 | | 18.3 | % | | $ | 13,936,571 | | 19.0 | % | | $ | 19.68 | | $ | 20.65 |
2010 | | 573,574 | | 14.9 | % | | | 13,697,064 | | 18.6 | % | | | 23.88 | | | 24.87 |
2011 | | 341,252 | | 8.8 | % | | | 6,536,498 | | 9.0 | % | | | 19.15 | | | 20.83 |
2012 | | 330,990 | | 8.6 | % | | | 6,943,816 | | 9.5 | % | | | 20.98 | | | 22.11 |
2013 | | 230,514 | | 6.0 | % | | | 5,013,992 | | 6.8 | % | | | 21.75 | | | 25.48 |
2014 | | 593,913 | | 15.4 | % | | | 12,508,619 | | 17.0 | % | | | 21.06 | | | 24.71 |
2015 | | 117,650 | | 3.0 | % | | | 2,350,833 | | 3.2 | % | | | 19.98 | | | 23.44 |
2016 | | 81,033 | | 2.1 | % | | | 1,394,978 | | 1.9 | % | | | 17.21 | | | 23.08 |
2017 | | 1,164 | | — | | | | 30,264 | | — | | | | 26.00 | | | 30.00 |
2018 | | 81,744 | | 2.1 | % | | | 1,640,924 | | 2.2 | % | | | 20.07 | | | 29.50 |
Thereafter | | 452,072 | | 11.7 | % | | | 9,422,014 | | 12.8 | % | | | 20.84 | | | 30.42 |
| | | | | | | | | | | | | | | | | |
| | 3,865,132 | | 100.0 | % | | $ | 73,475,573 | | 100.0 | % | | $ | 20.92 | | $ | 22.95 |
| | | | | | | | | | | | | | | | | |
29
| (1) | Current rent per leased square foot represents current base rent, divided by total square footage under lease as of the same date. |
| (2) | Rent per leased square foot at expiration represents base rent including any future rent steps, and thus represents the base rent that will be in place at lease expiration. |
Historical Tenant Improvements and Leasing Commissions (1), (2)
The following table sets forth certain historical information regarding tenant improvement and leasing commission costs for tenants in our Effective Portfolio for 2008, 2007 and 2006. The information presented assumes all tenant concessions and leasing commissions are paid in the calendar year in which the lease was executed, which may be different from the year in which the lease commences or in which they were actually paid.
| | | | | | | | | |
| | | For the Year Ended December 31, |
| | | 2008 | | 2007 | | 2006 |
Renewals(3) | | | | | | | | | |
Number of leases | | | 130 | | | 152 | | | 74 |
Square feet | | | 664,524 | | | 881,406 | | | 824,516 |
Tenant improvement costs per square foot(4) | | $ | 13.95 | | $ | 11.69 | | $ | 29.22 |
Leasing commission costs per square foot | | $ | 5.53 | | $ | 5.14 | | $ | 8.18 |
Total tenant improvements and leasing commissions | | | | | | | | | |
Costs per square foot | | $ | 19.48 | | $ | 16.83 | | $ | 37.40 |
Costs per square foot per year | | $ | 4.36 | | $ | 3.41 | | $ | 4.78 |
| | | |
New/Modified Leases(5) | | | | | | | | | |
Number of leases | | | 163 | | | 141 | | | 147 |
Square feet | | | 1,115,055 | | | 893,634 | | | 1,015,192 |
Tenant improvement costs per square foot(4) | | $ | 41.97 | | $ | 22.89 | | $ | 20.93 |
Leasing commission costs per square foot | | $ | 10.11 | | $ | 6.52 | | $ | 6.34 |
Total tenant improvements and leasing commissions | | | | | | | | | |
Costs per square foot | | $ | 52.08 | | $ | 29.41 | | $ | 27.27 |
Costs per square foot per year | | $ | 5.98 | | $ | 5.00 | | $ | 4.33 |
| | | |
Total | | | | | | | | | |
Number of leases | | | 293 | | | 293 | | | 221 |
Square feet | | | 1,779,579 | | | 1,775,040 | | | 1,839,708 |
Tenant improvement costs per square foot(4) | | $ | 31.51 | | $ | 17.33 | | $ | 24.64 |
Leasing commission costs per square foot | | $ | 8.40 | | $ | 5.84 | | $ | 7.16 |
Total tenant improvements and leasing commissions | | | | | | | | | |
Costs per square foot | | $ | 39.91 | | $ | 23.17 | | $ | 31.80 |
Costs per square foot per year | | $ | 5.60 | | $ | 4.28 | | $ | 4.55 |
| (1) | Based on leases executed during the period. Excludes leases to related parties, short-term leases of less than six months, and leases for raw space. |
| (2) | Tenant improvement and leasing commission information for 2008 and 2007 reflects 100% of the consolidated portfolio and 20% of our joint venture properties with Macquarie Office Trust. Information for 2006 reflects 100% of the consolidated portfolio and 100% of the joint venture properties. |
| (3) | Does not include retained tenants that have relocated to new space or expanded into new space. |
| (4) | Tenant improvement costs include improvements and lease concessions. |
| (5) | Includes retained tenants that have relocated or expanded into new space and lease modifications. |
30
Historical Capital Expenditures — Office Properties(1)
The following table sets forth certain information regarding historical non-recoverable and recoverable capital expenditures for office properties in our Effective Portfolio for 2008, 2007 and 2006. Recoverable capital expenditures are reimbursed by tenants under the terms of their leases, but are borne by us to the extent of any unleased space in our portfolio.
| | | | | | | | | |
| | | For the Year Ended December 31, |
| | | 2008 | | 2007 | | 2006 |
Non-recoverable capital expenditures(2) | | $ | 10,792,689 | | $ | 11,377,206 | | $ | 2,607,195 |
Total square feet | | | 16,134,307 | | | 16,675,985 | | | 12,247,589 |
Non-recoverable capital expenditures per square foot | | $ | 0.67 | | $ | 0.68 | | $ | 0.21 |
Recoverable capital expenditures(3) | | $ | 1,227,790 | | $ | 2,863,262 | | $ | 1,451,773 |
Total square feet | | | 16,134,307 | | | 16,675,985 | | | 12,247,589 |
Recoverable capital expenditures per square foot | | $ | 0.08 | | $ | 0.17 | | $ | 0.12 |
| (1) | Historical capital expenditures for each period shown reflect properties owned for the entire period. For properties acquired during each period, the capital expenditures will be reflected in the following full period of ownership. For properties sold during each period, the capital expenditures will be excluded for that period. Any capital expenditures incurred during the period of acquisition or disposition will be footnoted separately. |
| (2) | For 2008, excludes $6.4 million of non-recoverable capital expenditures as a result of discretionary renovation costs of $6.1 million at KPMG Tower and $0.3 million of planned renovation costs at Lantana Media Campus. For 2007, excludes $3.8 million of non-recoverable capital expenditures as a result of discretionary renovation costs of $1.9 million at KPMG Tower and $1.9 million of planned renovation costs at Lantana Media Campus. For 2006, excludes $0.5 million of non-recoverable capital expenditures incurred at acquired properties following their acquisition. |
| (3) | Recoverable capital improvements, such as equipment upgrades, are generally financed through capital leases. The annual amortization, based on each asset’s useful life, as well as any financing costs, are generally billed to tenants on an annual basis as payments are made. The amounts presented represent the total value of the improvements in the year they are made. |
The following table sets forth certain information regarding historical capital expenditures at our hotel property for 2008, 2007 and 2006:
| | | | | | | | | | | | |
| | | For the Year Ended December 31, | |
Westin® Hotel, Pasadena, CA | | 2008 | | | 2007 | | | 2006 | |
Hotel improvements and equipment replacement | | $ | 669,531 | | | $ | 712,955 | | | $ | 730,531 | |
Total hotel revenue | | | 26,615,726 | | | | 27,214,156 | | | | 27,053,648 | |
Hotel improvements as a percentage of hotel revenue | | | 2.6 | % | | | 2.6 | % | | | 2.7 | % |
31
Construction in Progress and Development Pipeline
As of December 31, 2008, we had the following projects under construction as well as in our development pipeline:
| | | | | | | | |
Property | | Location | | As of December 31, 2008 |
| | | Developable
Square Feet(1) | | Structured
Parking
Square Feet | | Type of Planned Development |
Construction in Progress | | | | | | | | |
Lantana Media Campus
(East building) | | Santa Monica, CA | | 66,000 | | | | Office |
207 Goode Avenue | | Glendale, CA | | 189,000 | | | | Office |
| | | | | | | | |
| | Total construction in progress | | 255,000 | | | | |
| | | | | | | | |
Development Pipeline | | | | | | | | |
755 South Figueroa | | Los Angeles, CA | | 930,000 | | 266,000 | | Office |
Glendale Center—Phase II | | Glendale, CA | | 264,000 | | 158,000 | | Mixed Use |
Stadium Tower II | | Anaheim, CA | | 282,000 | | 367,000 | | Office |
Brea Financial Commons/Brea Corporate Place(2) | | Brea, CA | | 550,000 | | 784,000 | | Office, Mixed Use |
Pacific Arts Plaza | | Costa Mesa, CA | | 468,000 | | 260,000 | | Office |
| | | | 225,000 | | | | Residential(3) |
Park Place | | Irvine, CA | | 1,237,000 | | 2,376,000 | | Office, Retail & Hotel |
| | | | 1,048,000 | | | | Residential |
2600 Michelson(4) | | Irvine, CA | | 270,000 | | 154,000 | | Office |
500 Orange Center(5) | | Orange, CA | | 900,000 | | 960,000 | | Office |
605 City Parkway | | Orange, CA | | 200,000 | | 228,000 | | Office |
City Tower II(6) | | Orange, CA | | 465,000 | | 696,000 | | Office |
San Diego Tech Center(7),(8) | | Sorrento Mesa, CA | | 1,320,000 | | 1,674,000 | | Office |
| | | | | | | | |
| | Total development pipeline | | 8,159,000 | | 7,923,000 | | |
| | | | | | | | |
| (1) | The developable square feet presented represents the office, retail, hotel and residential footages that we estimate can be developed on the referenced property. |
| (2) | The developable square feet presented represents management’s estimate of the development potential for the referenced property based on the allowed density under current zoning and capacity considerations for the site still under planning review. |
| (3) | The developable square feet presented represents management’s estimate of the development potential for the referenced property based on the construction of 180 residential units as contemplated under a Program EIR completed by the City of Costa Mesa for this and other surrounding properties. This residential development would replace an existing 67,450 square foot office building at Pacific Arts Plaza. |
| (4) | The developable square feet presented represents management’s estimate of the development potential for the referenced property based on an allocation of excess trips reserved from our disposition of Inwood Park, which we have been in discussion with the City of Irvine over securing, and the potential utilization of excess trips from our other assets in the Irvine Business Complex (i.e., Park Place). |
| (5) | The developable square feet presented represents management’s estimate of the development potential for the referenced property based on the allowed density under current zoning. Approximately 60,000 square feet of the estimated development potential will require the consolidation of an adjacent remnant parcel in cooperation with the City of Orange. |
32
| (6) | The developable square feet presented represents management’s estimate of the development potential for the referenced property based on the allowed density under a Conditional Use Permit obtained for the property in 2001, which has since expired. |
| (7) | Land held for development was not contributed to our joint venture with Macquarie Office Trust. |
| (8) | The third phase contemplates the demolition of 120,000 square feet of existing space. |
Secured Debt
As of December 31, 2008, our consolidated debt was comprised of mortgages secured by 27 properties and five construction loans. A summary of our consolidated debt as of December 31, 2008 is as follows (in millions, except percentage and year amounts):
| | | | | | | | | | | |
| | | Principal
Amount | | Percent of
Total Debt | | | Effective
Interest
Rate | | | Debt to
Maturity |
Fixed-rate | | $ | 3,695.0 | | 75.67 | % | | 5.51 | % | | 7 years |
Variable-rate swapped to fixed-rate | | | 424.3 | | 8.69 | % | | 7.18 | % | | 4 years |
Variable-rate | | | 763.5 | | 15.64 | % | | 3.64 | % | | 1 year |
| | | | | | | | | | | |
| | $ | 4,882.8 | | 100.00 | % | | 5.37 | % | | 6 years |
| | | | | | | | | | | |
As of December 31, 2008, approximately 84% of our outstanding debt was fixed (or swapped to a fixed rate) at a weighted average interest rate of approximately 5.7% on an interest-only basis with a weighted average remaining term of approximately six years. Our variable-rate debt bears interest at a rate based on one-month LIBOR, which was 0.44% as of December 31, 2008, except for our 17885 Von Karman and 2385 Northside construction loans, which bear interest at prime, which was 3.25% as of December 31, 2008. Our variable-rate debt at December 31, 2008 had a weighted average term to initial maturity of approximately one year (approximately three years assuming exercise of extension options).
See Part II, Item 7. “Management’s Discussion and Analysis of Financial Condition and Results of Operations—Liquidity and Capital Resources” and Part II, Item 8. “Financial Statements and Supplementary Data—Note 7 to the Consolidated Financial Statements” included in this Annual Report on Form 10-K.
| Item 3. | Legal Proceedings. |
We are involved in various litigation and other legal matters, including personal injury claims and administrative proceedings, which we are addressing or defending in the ordinary course of business. Management believes that any liability that may potentially result upon resolution of such matters will not have a material adverse effect on our business, financial condition or results of operations.
| Item 4. | Submission of Matters to a Vote of Security Holders. |
The results of voting at our 2008 Annual Meeting of Stockholders held on October 2, 2008 were reported in Part II, Item 4 of our Quarterly Report on Form 10-Q filed with the SEC on November 10, 2008.
33
PART II
| Item 5. | Market for Registrant’s Common Equity, Related Stockholder Matters and Issuer Purchases of Equity Securities. |
Market Information
For information regarding the market in which our common stock is traded, see the cover page of this report. For information regarding the high and low closing prices of our common stock for the last two calendar years, see Item 8. “Financial Statements and Supplementary Data – Note 21 to the Consolidated Financial Statements.”
Holders of Record
As of March 13, 2009, there were 230 holders of record of our common stock.
Dividends
In 2007, we declared quarterly distributions of $0.40 per share to holders of our common stock. These distributions were paid in the month following our quarter end. Our board of directors did not declare a dividend on our common stock during 2008. The actual amount and timing of distributions in 2009 and beyond, if any, will be at the discretion of our board of directors and will depend upon our financial condition in addition to the requirements of the Code, and no assurance can be given as to the amounts or timing of future distributions.
Subject to the distribution requirements applicable to REITs under the Code, we intend, to the extent practicable, to invest substantially all of the proceeds from dispositions and refinancing of our assets in real estate-related assets and other assets. We may, however, under certain circumstances, make a distribution of capital or assets. Such distributions, if any, will be made at the discretion of our board of directors. Distributions will be made in cash to the extent that cash is available for distribution.
Securities Authorized for Issuance under Equity Compensation Plans
The following table provides information as of December 31, 2008 regarding compensation plans (including individual compensation arrangements) under which our equity securities are authorized for issuance:
Equity Compensation Plan Information
| | | | | | | |
Plan Category | | Number of Securities to
be Issued upon
Exercise of Outstanding
Options, Warrants and
Rights | | Weighted-Average
Exercise Price of
Outstanding
Options, Warrants
and Rights | | | Number of Securities
Remaining Available
for Future Issuance
under Equity
Compensation Plans
(Excluding
Securities Reflected
in Column (a)) |
| | | (a) | | (b) | | | (c) |
Equity compensation plans approved by security holders(1) | | 2,298,738 | | (2 | ) | | 1,978,544 |
Equity compensation plans not approved by security holders | | — | | | | | — |
| | | | | | | |
| | 2,298,738 | | | | | 1,978,544 |
| | | | | | | |
| (1) | Issued under the Second Amended and Restated 2003 Incentive Award Plan approved by stockholders on June 5, 2007. |
34
| (2) | Weighted average exercise price is $17.55 per share for 140,000 nonqualified stock options outstanding. Restricted stock and restricted stock units totaling 2,158,738 shares have a par value of $0.01 per share. |
Recent Sales of Unregistered Securities
None.
Issuer Purchases of Equity Securities
During 2008, we accepted the return of 109,088 shares of our common stock from certain employees in accordance with the provisions of the Second Amended and Restated 2003 Incentive Award Plan to satisfy the employees’ minimum statutory tax withholding requirements related to restricted stock awards that vested during 2008. The value of the returned shares was calculated based on the closing market price of our common stock on the day prior to the applicable vesting date.
35
Performance Graph
The following graph compares the performance of our common stock for the five-year period ended December 31, 2008 with that of the S&P 500 Index, the National Association of Real Estate Investment Trusts (“NAREIT”) Equity Index and the NAREIT Office Index. Upon written request, we will provide any stockholder with a list of the companies included in the NAREIT Equity and NAREIT Office indices. The Cumulative Total Return shown below assumes an initial investment of $100 on December 31, 2003 and reinvestment of dividends. The historical information included in the performance graph and Cumulative Total Return is not necessarily indicative of future performance. The data shown is based on the closing share prices or index values, as applicable, at the end of the last trading day of each month shown.
COMPARISON OF 5 YEAR CUMULATIVE TOTAL RETURN*
Among Maguire Properties, Inc., the S&P 500 Index,
the NAREIT Equity Index and the NAREIT Office Index
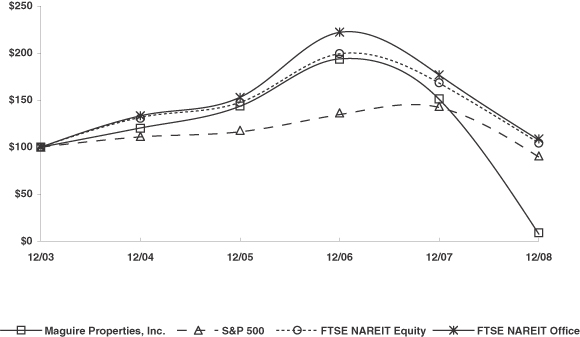
| * | $100 invested on 12/31/03 in stock or index, including reinvestment of dividends. Fiscal year ending December 31. |
| | | | | | | | | | | | | | | | | | |
| | | 12/03 | | 12/04 | | 12/05 | | 12/06 | | 12/07 | | 12/08 |
Maguire Properties, Inc. | | $ | 100.00 | | $ | 120.38 | | $ | 143.46 | | $ | 193.84 | | $ | 150.59 | | $ | 7.46 |
S&P 500 | | | 100.00 | | | 110.88 | | | 116.33 | | | 134.70 | | | 142.10 | | | 89.53 |
NAREIT Equity | | | 100.00 | | | 131.58 | | | 147.58 | | | 199.32 | | | 168.05 | | | 104.65 |
NAREIT Office | | | 100.00 | | | 133.41 | | | 152.94 | | | 222.11 | | | 176.65 | | | 107.59 |
36
| Item 6. | Selected Financial Data. |
The following table sets forth selected consolidated financial and operating data for our company:
| | | | | | | | | | | | | | | | | | | | |
| | | For the Year Ended December 31, | |
| | | 2008 | | | 2007 | | | 2006 | | | 2005 | | | 2004 | |
| | | (In thousands, except per share amounts) | |
Operating Results:(1), (2), (3), (4) | | | | | | | | | | | | | | | | | | | | |
Revenue: | | | | | | | | | | | | | | | | | | | | |
Rental | | $ | 337,234 | | | $ | 321,600 | | | $ | 240,496 | | | $ | 286,754 | | | $ | 187,748 | |
Tenant reimbursements | | | 112,092 | | | | 104,025 | | | | 84,985 | | | | 107,438 | | | | 79,664 | |
Hotel operations | | | 26,616 | | | | 27,214 | | | | 27,054 | | | | 24,037 | | | | 20,519 | |
Other revenues | | | 71,091 | | | | 71,173 | | | | 78,867 | | | | 54,944 | | | | 38,783 | |
| | | | | | | | | | | | | | | | | | | | |
Total revenue | | | 547,033 | | | | 524,012 | | | | 431,402 | | | | 473,173 | | | | 326,714 | |
| | | | | | | | | | | | | | | | | | | | |
Expenses: | | | | | | | | | | | | | | | | | | | | |
Rental property operating and maintenance | | | 129,392 | | | | 117,880 | | | | 84,651 | | | | 96,579 | | | | 69,245 | |
Hotel operating and maintenance | | | 17,105 | | | | 17,146 | | | | 17,324 | | | | 15,739 | | | | 14,497 | |
Real estate taxes | | | 52,163 | | | | 46,585 | | | | 31,736 | | | | 40,743 | | | | 24,430 | |
Parking | | | 15,738 | | | | 13,942 | | | | 12,236 | | | | 11,860 | | | | 9,293 | |
General and administrative(5) | | | 60,835 | | | | 37,677 | | | | 36,909 | | | | 21,707 | | | | 17,530 | |
Other expense | | | 5,866 | | | | 5,177 | | | | 649 | | | | 2,649 | | | | 2,657 | |
Depreciation and amortization | | | 183,300 | | | | 183,690 | | | | 129,774 | | | | 156,957 | | | | 86,587 | |
Interest | | | 258,134 | | | | 219,853 | | | | 121,927 | | | | 149,787 | | | | 64,235 | |
Loss from early extinguishment of debt | | | 1,463 | | | | 21,662 | | | | 11,440 | | | | 1,769 | | | | 791 | |
| | | | | | | | | | | | | | | | | | | | |
Total expenses | | | 723,996 | | | | 663,612 | | | | 446,646 | | | | 497,790 | | | | 289,265 | |
| | | | | | | | | | | | | | | | | | | | |
(Loss) income from continuing operations before equity in net loss of unconsolidated joint venture, gain on sale of real estate and minority interests | | | (176,963 | ) | | | (139,600 | ) | | | (15,244 | ) | | | (24,617 | ) | | | 37,449 | |
Equity in net loss of unconsolidated joint venture | | | (1,092 | ) | | | (2,149 | ) | | | (3,746 | ) | | | — | | | | — | |
Gain on sale of real estate(6) | | | — | | | | — | | | | 108,469 | | | | — | | | | — | |
Minority interests allocated to continuing operations | | | 9,991 | | | | 21,813 | | | | (10,523 | ) | | | 7,998 | | | | (3,982 | ) |
| | | | | | | | | | | | | | | | | | | | |
(Loss) income from continuing operations | | | (168,064 | ) | | | (119,936 | ) | | | 78,956 | | | | (16,619 | ) | | | 33,467 | |
| | | | | | | | | | | | | | | | | | | | |
Loss from discontinued operations before gain on sale of real estate and minority interests(7) | | | (145,283 | ) | | | (34,279 | ) | | | (10,007 | ) | | | (8,788 | ) | | | — | |
Gain on sale of real estate | | | — | | | | 195,387 | | | | — | | | | — | | | | — | |
Minority interests allocated to discontinued operations | | | 4,363 | | | | (21,853 | ) | | | 1,377 | | | | 1,589 | | | | — | |
| | | | | | | | | | | | | | | | | | | | |
(Loss) income from discontinued operations | | | (140,920 | ) | | | 139,255 | | | | (8,630 | ) | | | (7,199 | ) | | | — | |
| | | | | | | | | | | | | | | | | | | | |
Net (loss) income | | | (308,984 | ) | | | 19,319 | | | | 70,326 | | | | (23,818 | ) | | | 33,467 | |
Preferred stock dividends | | | (19,064 | ) | | | (19,064 | ) | | | (19,064 | ) | | | (19,064 | ) | | | (17,899 | ) |
| | | | | | | | | | | | | | | | | | | | |
Net (loss) income available to common stockholders | | $ | (328,048 | ) | | $ | 255 | | | $ | 51,262 | | | $ | (42,882 | ) | | $ | 15,568 | |
| | | | | | | | | | | | | | | | | | | | |
Net (loss) income available to common stockholders—basic | | $ | (6.90 | ) | | $ | 0.01 | | | $ | 1.11 | | | $ | (0.99 | ) | | $ | 0.37 | |
| | | | | | | | | | | | | | | | | | | | |
Weighted average number of common shares outstanding | | | 47,538,457 | | | | 46,750,597 | | | | 46,257,573 | | | | 43,513,810 | | | | 42,504,134 | |
| | | | | | | | | | | | | | | | | | | | |
Net (loss) income available to common stockholders—diluted | | $ | (6.90 | ) | | $ | 0.01 | | | $ | 1.09 | | | $ | (0.99 | ) | | $ | 0.36 | |
| | | | | | | | | | | | | | | | | | | | |
Weighted average number of common and common equivalent shares outstanding | | | 47,538,457 | | | | 46,833,002 | | | | 46,931,433 | | | | 43,513,810 | | | | 42,679,124 | |
| | | | | | | | | | | | | | | | | | | | |
Distributions declared per common share | | $ | — | | | $ | 1.60 | | | $ | 1.60 | | | $ | 1.60 | | | $ | 1.60 | |
| | | | | | | | | | | | | | | | | | | | |
37
| | | | | | | | | | | | | | | | | | | | |
| | | As of December 31, | |
| | | 2008 | | | 2007 | | | 2006 | | | 2005 | | | 2004 | |
| | | (In thousands) | |
Financial Position: | | | | | | | | | | | | | | | | | | | | |
Investments in real estate, net | | $ | 4,422,386 | | | $ | 4,962,707 | | | $ | 3,017,249 | | | $ | 3,588,623 | | | $ | 2,220,665 | |
Assets associated with real estate held for sale | | | 182,597 | | | | — | | | | — | | | | — | | | | — | |
Total assets | | | 5,199,015 | | | | 5,749,778 | | | | 3,511,729 | | | | 4,069,191 | | | | 2,603,894 | |
Mortgage and other secured loans | | | 4,714,090 | | | | 5,003,341 | | | | 2,794,349 | | | | 3,353,234 | | | | 1,805,450 | |
Obligations associated with real estate held for sale | | | 171,348 | | | | — | | | | — | | | | — | | | | — | |
Total liabilities | | | 5,218,677 | | | | 5,391,794 | | | | 3,051,146 | | | | 3,592,484 | | | | 1,994,329 | |
Minority interests | | | — | | | | 14,670 | | | | 28,671 | | | | 40,070 | | | | 72,198 | |
Stockholders’ (deficit) equity | | | (19,662 | ) | | | 343,314 | | | | 431,912 | | | | 436,637 | | | | 537,367 | |
| |
| | | For the Year Ended December 31, | |
| | | 2008 | | | 2007 | | | 2006 | | | 2005 | | | 2004 | |
| | | (In thousands) | |
Other Information: | | | | | | | | | | | | | | | | | | | | |
Cash flows (used in) provided by operating activities | | $ | (42,658 | ) | | $ | 45,742 | | | $ | 105,992 | | | $ | 104,817 | | | $ | 105,113 | |
Cash flows used in investing activities | | | (138,759 | ) | | | (2,635,790 | ) | | | (65,426 | ) | | | (1,494,618 | ) | | | (614,155 | ) |
Cash flows provided by financing activities | | | 87,072 | | | | 2,663,772 | | | | 15,523 | | | | 1,370,340 | | | | 529,802 | |
| (1) | Our selected financial data has been reclassified to reflect the disposition of 1920 and 2010 Main Plaza and City Plaza during 2008, which have been presented as discontinued operations in our consolidated statement of operations. Additionally, our 3161 Michelson property is classified as held for sale as of December 31, 2008 and its results of operations have been reclassified to discontinued operations. Therefore, amounts presented in the table above for 2007 will not agree to those previously reported in our Annual Report on Form 10-K/A for the year ended December 31, 2007. |
| (2) | Our selected financial data has been reclassified to reflect the disposition of Wateridge Plaza, Pacific Center and Regents Square during 2007, which have been presented as discontinued operations in our consolidated statements of operations. Therefore, amounts presented in the table above for 2006 and 2005 will not agree to those previously reported in our Annual Reports on Form 10-K/A and 10-K for the years ended December 31, 2006 and 2005, respectively. |
| (3) | During 2007, we purchased 24 office properties and development sites from Blackstone Real Estate Advisors. The consolidated statements of operations include the results of operations for these properties commencing with their date of acquisition, April 24, 2007. |
| (4) | During 2005, we purchased ten office properties and three development sites from CommonWealth Partners. The consolidated statements of operations include the results of operations for these properties commencing with their date of acquisition, March 15, 2005. |
| (5) | General and administrative expense for 2008 includes $23.9 million of costs associated with the review of strategic alternatives and subsequent management changes. |
| (6) | Gain on sale of real estate for 2006 represents the gain recorded on the contribution of an 80% interest in five previously wholly owned properties to our joint venture with Macquarie Office Trust. |
| (7) | Loss from discontinued operations for 2008 includes non-cash impairment charges totaling $73.7 million resulting from the disposition of 1920 and 2010 Main Plaza and City Plaza combined with a $50.0 million non-cash impairment charge related to the writedown of 3161 Michelson to its estimated fair value, less estimated costs to sell, as of December 31, 2008. |
38
| Item 7. | Management’s Discussion and Analysis of Financial Condition and Results of Operations. |
The following discussion should be read in conjunction with our consolidated financial statements and the related notes. See Item 8. “Financial Statements and Supplementary Data.”
Overview and Background
We are a self-administered and self-managed real estate investment trust, and we operate as a REIT for federal income tax purposes. We are the largest owner and operator of Class A office properties in the LACBD, have a significant presence in Orange County, California and are primarily focused on owning and operating high-quality office properties in the high-barrier-to-entry Southern California market.
As of December 31, 2008, our Operating Partnership indirectly owns whole or partial interests in 36 office and retail properties, a 350-room hotel and offsite parking garages and on-site structured and surface parking (our “Total Portfolio”). We hold an approximate 87.8% interest in our Operating Partnership, and therefore do not completely own the Total Portfolio. Excluding the 80% interest that our Operating Partnership does not own in Maguire Macquarie Office, LLC, an unconsolidated joint venture formed in conjunction with Macquarie Office Trust, our Operating Partnership’s share of the Total Portfolio is 17.3 million square feet and is referred to as our “Effective Portfolio.” Our Effective Portfolio represents our Operating Partnership’s economic interest in the office, hotel and retail properties from which we derive our net income or loss, which we recognize in accordance with GAAP. The aggregate square footage of our Effective Portfolio has not been reduced to reflect our minority interest partners’ share of our Operating Partnership.
Our property statistics as of December 31, 2008 are as follows:
| | | | | | | | | | | | | | | | | | |
| | | Number of | | Total Portfolio | | Effective Portfolio |
| | Properties | | Buildings | | Square Feet | | | Parking
Square
Footage | | Parking
Spaces | | Square Feet | | | Parking
Square
Footage | | Parking
Spaces |
Wholly owned properties | | 30 | | 69 | | 16,526,452 | | | 11,215,359 | | 37,247 | | 16,526,452 | | | 11,215,359 | | 37,247 |
Unconsolidated joint venture | | 6 | | 20 | | 3,865,132 | | | 2,271,248 | | 7,349 | | 773,026 | | | 454,250 | | 1,470 |
| | | | | | | | | | | | | | | | | | |
| | 36 | | 89 | | 20,391,584 | | | 13,486,607 | | 44,596 | | 17,299,478 | | | 11,669,609 | | 38,717 |
| | | | | | | | | | | | | | | | | | |
Percentage leased | | | | | | 81.1 | % | | | | | | 79.3 | % | | | | |
| | | | | | | | | | | | | | | | | | |
As of December 31, 2008, the majority of our Total Portfolio is located in ten submarkets in Southern California: the LACBD; the Tri-Cities area of Pasadena, Glendale and Burbank; the Cerritos submarket; the Santa Monica Professional and Entertainment submarket; the John Wayne Airport, Costa Mesa, Central Orange County and Brea submarkets of Orange County; and the Sorrento Mesa and Mission Valley submarkets of San Diego County. We also have an interest in one property in Denver, Colorado (a joint venture property). We directly manage the properties in our Total Portfolio through our Operating Partnership and/or our Services Companies, except for Cerritos Corporate Center and certain buildings at the Quintana Campus, as well as the Westin® Pasadena Hotel.
We receive income primarily from rental revenue (including tenant reimbursements) from our office properties, and to a lesser extent, from our hotel property and on- and off-site parking garages. We also receive income from providing management, leasing and real estate development services to our joint venture with Macquarie Office Trust and prior to June 30, 2008, certain properties owned by Mr. Maguire.
39
Results of Operations
2008 Compared to 2007
Our results of operations for the year ended December 31, 2008 compared to the same period in 2007 were significantly affected by acquisitions made during 2007 and dispositions made in both years. Therefore, our results are not comparable from period to period. To eliminate the effect of the changes in our Total Portfolio due to acquisitions and dispositions, we have separately presented the results of our “Same Properties Portfolio.”
Properties included in our Same Properties Portfolio analysis are our hotel and the properties in our office portfolio, with the exception of our joint venture properties, the Wateridge Plaza, Pacific Center and Regents Square that were disposed of during 2007, properties acquired in the Southern California Equity Office Properties portfolio (the “Blackstone Transaction”) in April 2007, 130 State College that was acquired in July 2007 and 3161 Michelson that was placed in service in September 2007.
40
Consolidated Statement of Operations Information
| | | | | | | | | | | | | | | | | | | | | | | | | | | | | | |
| | | Same Properties | | | Total Portfolio | |
| | | For the
Year Ended | | | Increase/
Decrease | | | %
Change | | | For the
Year Ended | | | Increase/
Decrease | | | %
Change | |
| | | 12/31/08 | | | 12/31/07 | | | | | 12/31/08 | | | 12/31/07 | | | |
| | | (In millions, except for percentages) | |
Revenue: | | | | | | | | | | | | | | | | | | | | | | | | | | | | | | |
Rental | | $ | 229.1 | | | $ | 232.8 | | | $ | (3.7 | ) | | -2 | % | | $ | 337.2 | | | $ | 321.6 | | | $ | 15.6 | | | 5 | % |
Tenant reimbursements | | | 83.1 | | | | 82.7 | | | | 0.4 | | | | | | | 112.1 | | | | 104.0 | | | | 8.1 | | | 8 | % |
Hotel operations | | | 26.6 | | | | 27.2 | | | | (0.6 | ) | | -2 | % | | | 26.6 | | | | 27.2 | | | | (0.6 | ) | | -2 | % |
Parking | | | 42.1 | | | | 40.3 | | | | 1.8 | | | 4 | % | | | 53.3 | | | | 47.5 | | | | 5.8 | | | 12 | % |
Management, leasing and development services | | | — | | | | — | | | | — | | | | | | | 6.6 | | | | 9.1 | | | | (2.5 | ) | | -27 | % |
Interest and other | | | 4.2 | | | | 3.5 | | | | 0.7 | | | 20 | % | | | 11.2 | | | | 14.6 | | | | (3.4 | ) | | -23 | % |
| | | | | | | | | | | | | | | | | | | | | | | | | | | | | | |
Total revenue | | | 385.1 | | | | 386.5 | | | | (1.4 | ) | | — | | | | 547.0 | | | | 524.0 | | | | 23.0 | | | 4 | % |
| | | | | | | | | | | | | | | | | | | | | | | | | | | | | | |
Expenses: | | | | | | | | | | | | | | | | | | | | | | | | | | | | | | |
Rental property operating and maintenance | | | 93.8 | | | | 93.3 | | | | 0.5 | | | | | | | 129.4 | | | | 117.9 | | | | 11.5 | | | 10 | % |
Hotel operating and maintenance | | | 17.1 | | | | 17.1 | | | | — | | | | | | | 17.1 | | | | 17.1 | | | | — | | | | |
Real estate taxes | | | 30.9 | | | | 30.7 | | | | 0.2 | | | | | | | 52.2 | | | | 46.6 | | | | 5.6 | | | 12 | % |
Parking | | | 11.7 | | | | 11.7 | | | | — | | | | | | | 15.7 | | | | 13.9 | | | | 1.8 | | | 13 | % |
General and administrative | | | — | | | | — | | | | — | | | | | | | 60.8 | | | | 37.7 | | | | 23.1 | | | 61 | % |
Other expense | | | 0.2 | | | | 0.2 | | | | — | | | | | | | 5.9 | | | | 5.2 | | | | 0.7 | | | 13 | % |
Depreciation and amortization | | | 110.7 | | | | 112.3 | | | | (1.6 | ) | | -1 | % | | | 183.3 | | | | 183.7 | | | | (0.4 | ) | | | |
Interest | | | 160.4 | | | | 149.6 | | | | 10.8 | | | 7 | % | | | 258.1 | | | | 219.8 | | | | 38.3 | | | 17 | % |
Loss from early extinguishment of debt | | | — | | | | 13.2 | | | | (13.2 | ) | | | | | | 1.5 | | | | 21.7 | | | | (20.2 | ) | | | |
| | | | | | | | | | | | | | | | | | | | | | | | | | | | | | |
Total expenses | | | 424.8 | | | | 428.1 | | | | (3.3 | ) | | 1 | % | | | 724.0 | | | | 663.6 | | | | 60.4 | | | 9 | % |
| | | | | | | | | | | | | | | | | | | | | | | | | | | | | | |
Loss from continuing operations before equity in net loss of unconsolidated joint venture and minority interests | | | (39.7 | ) | | | (41.6 | ) | | | 1.9 | | | | | | | (177.0 | ) | | | (139.6 | ) | | | (37.4 | ) | | 27 | % |
Equity in net loss of unconsolidated joint venture | | | — | | | | — | | | | — | | | | | | | (1.1 | ) | | | (2.1 | ) | | | 1.0 | | | -49 | % |
Minority interests allocated to continuing operations | | | — | | | | — | | | | — | | | | | | | 10.0 | | | | 21.8 | | | | (11.8 | ) | | -54 | % |
| | | | | | | | | | | | | | | | | | | | | | | | | | | | | | |
Loss from continuing operations | | $ | (39.7 | ) | | $ | (41.6 | ) | | $ | 1.9 | | | | | | $ | (168.1 | ) | | $ | (119.9 | ) | | $ | (48.2 | ) | | | |
| | | | | | | | | | | | | | | | | | | | | | | | | | | | | | |
(Loss) income from discontinued operations | | | | | | | | | | | | | | | | | $ | (140.9 | ) | | $ | 139.2 | | | $ | (280.1 | ) | | | |
| | | | | | | | | | | | | | | | | | | | | | | | | | | | | | |
Rental Revenue
Rental revenue for our Same Properties Portfolio decreased $3.7 million, or 2%, during 2008 as compared to 2007, primarily due to a decrease in occupancy at our Park Place and Pacific Arts Plaza properties located in Orange County, California, partially offset by rent increases on new lease commencements in our Los Angeles County portfolio.
Total Portfolio rental revenue increased $15.6 million, or 5%, during 2008 as compared to 2007 due to a full year of activity for properties acquired in the Blackstone Transaction during 2008 versus eight months of activity during 2007, partially offset by lower average occupancy during 2008 in properties acquired in the Blackstone Transaction and at our Park Place and Pacific Arts Plaza properties located in Orange County, California.
41
Tenant Reimbursements
Total Portfolio tenant reimbursements increased $8.1 million, or 8%, during 2008 as compared to 2007, primarily due to properties acquired in the Blackstone Transaction.
Parking Revenue
Parking revenue for our Same Properties Portfolio increased $1.8 million, or 4%, during 2008 as compared to 2007 as a result of annual parking rate increases of 5% made in July each year.
Total Portfolio parking revenue increased $5.8 million, or 12%, during 2008 as compared to 2007, mainly due to properties acquired in the Blackstone Transaction and, to a lesser extent, the Same Properties Portfolio.
Management, Leasing and Development Services
Total Portfolio management, leasing and development services revenue to affiliates decreased $2.5 million, or 27%, during 2008 as compared to 2007 as a result of a decrease in leasing commissions earned from our joint venture with Macquarie Office Trust combined with reduced revenues earned from Mr. Maguire due to termination of these services pursuant to his separation agreement.
Interest and Other Revenue
Total Portfolio interest and other revenue decreased $3.4 million, or 23%, during 2008 as compared to 2007 due to lower interest income, partially offset by settlement income earned in 2008 with no comparable activity during 2007.
Rental Property Operating and Maintenance Expense
Total Portfolio rental property operating and maintenance expense increased $11.5 million, or 10%, during 2008 as compared to 2007, primarily due to properties acquired in the Blackstone Transaction.
Real Estate Taxes
Total Portfolio real estate taxes increased $5.6 million, or 12%, during 2008 as compared to 2007, primarily due to properties acquired in the Blackstone Transaction.
Parking Expense
Total Portfolio parking expense increased $1.8 million, or 13%, during 2008 as compared to 2007, primarily due to properties acquired in the Blackstone Transaction.
General and Administrative Expense
Total Portfolio general and administrative expense increased $23.1 million, or 61%, during 2008 as compared to 2007, mainly due to $15.6 million of costs incurred in connection with changes in management, primarily due to separation obligations for our former senior executives, and exit costs and tenant improvement writeoffs related to the 1733 Ocean lease, combined with $8.3 million of investment banking, legal and other professional fees incurred in connection with the strategic review that was concluded by the Special Committee of our board of directors during the second quarter of 2008, with no comparable activity during 2007.
Interest Expense
Interest expense for our Same Properties Portfolio increased $10.8 million, or 7%, during 2008 as compared to 2007, primarily due to the refinancing of Wells Fargo Tower (in April 2007) and KPMG Tower (in September 2007). The refinancing of these properties resulted in increased loan balances and higher interest rates than the loans previously encumbering these properties.
42
Total Portfolio interest expense increased $38.3 million, or 17%, during 2008 as compared to 2007, primarily due to mortgage loans on the properties acquired in the Blackstone Transaction and, to a lesser extent, the refinancing of the Wells Fargo and KPMG Towers and the new financing obtained in September 2008 on Plaza Las Fuentes.
Loss from Early Extinguishment of Debt
Loss from early extinguishment for our Same Properties Portfolio decreased $13.2 million during 2008 as compared to 2007, largely due to the writeoff of unamortized loan costs and other costs incurred in connection with the refinancing of KPMG Tower in September 2007 and Wells Fargo Tower in April 2007. We had no comparable activity during 2008.
Loss from early extinguishment for our Total Portfolio was $1.5 million during 2008 as compared to $21.7 million in 2007. Activity in 2008 reflects the writeoff of unamortized loan costs related to the termination of our $130.0 million revolving credit facility (the “Revolver”). For 2007, activity includes costs incurred with the refinancing of the KPMG and Wells Fargo Towers along with the writeoff of unamortized loans costs for these loans and the loan on 18301 Von Karman, which was assumed by the joint venture upon contribution, as well as the repayment of the bridge mortgage loan and the term loan, each of which was used to help fund the Blackstone Transaction.
Minority Interests
Minority interests allocated to continuing operations decreased $11.8 million, or 54%, during 2008 as compared to 2007 due to our increased net loss. In accordance with Accounting Research Bulletin (“ARB”) No. 51,Consolidated Financial Statements, during 2008 we were unable to allocate $33.3 million of our net loss to our minority partners since to do so would have reduced their investment in the equity of our Operating Partnership to less than zero. Should we record net income in future periods, we will allocate 100% of such income to our common stockholders until such point in time that the losses in excess of our minority partners’ basis previously allocated to our common stockholders is restored.
Discontinued Operations
Our loss from discontinued operations in 2008 is primarily due to non-cash impairment charges totaling $73.7 million to write down 1920 and 2010 Main Plaza and City Plaza due to their disposition and $50.0 million to reduce our carrying value on 3161 Michelson to estimated fair value, less estimated costs to sell, due to the decision to classify this property as held for sale as of December 31, 2008. Our income from discontinued operations in 2007 includes a $195.4 million gain (and related allocation of $21.9 million in minority interests) from the sale of Pacific Center, Regents Square and Wateridge Plaza.
2007 Compared to 2006
Our results of operations for the year ended December 31, 2007 compared to the same period in 2006 were significantly affected by acquisitions and dispositions made during 2007. Therefore, our results are not comparable from year to year. To eliminate the effect of changes in our Total Portfolio due to acquisitions and dispositions, we have separately presented the results of our “Same Properties Portfolio.”
Properties included in our Same Properties Portfolio analysis are our hotel and the properties in our office portfolio, with the exception of our joint venture properties, properties acquired in the Blackstone Transaction in April 2007, the Wateridge Plaza, Pacific Center and Regents Square properties that were disposed of during 2007, 701 North Brand that was acquired in third quarter 2006, 130 State College that was acquired in third quarter 2007 and 3161 Michelson that was placed in service in third quarter 2007.
43
Consolidated Statement of Operations Information
| | | | | | | | | | | | | | | | | | | | | | | | | | | | | |
| | | Same Properties | | | Total Portfolio | |
| | | For the
Year Ended | | Increase/
Decrease | | | %
Change | | | For the
Year Ended | | | Increase/
Decrease | | | %
Change | |
| | | 12/31/07 | | | 12/31/06 | | | | 12/31/07 | | | 12/31/06 | | | |
| | | (In millions, except for percentages) | |
Revenue: | | | | | | | | | | | | | | | | | | | | | | | | | | | | | |
Rental | | $ | 230.5 | | | $ | 238.7 | | $ | (8.2 | ) | | -3 | % | | $ | 321.6 | | | $ | 240.5 | | | $ | 81.1 | | | 34 | % |
Tenant reimbursements | | | 82.2 | | | | 84.5 | | | (2.3 | ) | | -3 | % | | | 104.0 | | | | 85.0 | | | | 19.0 | | | 22 | % |
Hotel operations | | | 27.2 | | | | 27.1 | | | 0.1 | | | | | | | 27.2 | | | | 27.1 | | | | 0.1 | | | | |
Parking | | | 39.6 | | | | 38.6 | | | 1.0 | | | 2 | % | | | 47.5 | | | | 39.3 | | | | 8.2 | | | 21 | % |
Management, leasing and development services | | | — | | | | — | | | — | | | — | | | | 9.1 | | | | 7.9 | | | | 1.2 | | | 15 | % |
Interest and other | | | 5.6 | | | | 23.8 | | | (18.2 | ) | | -76 | % | | | 14.6 | | | | 31.6 | | | | (17.0 | ) | | -54 | % |
| | | | | | | | | | | | | | | | | | | | | | | | | | | | | |
Total revenue | | | 385.1 | | | | 412.7 | | | (27.6 | ) | | -7 | % | | | 524.0 | | | | 431.4 | | | | 92.6 | | | 22 | % |
| | | | | | | | | | | | | | | | | | | | | | | | | | | | | |
Expenses: | | | | | | | | | | | | | | | | | | | | | | | | | | | | | |
Rental property operating and maintenance | | | 90.5 | | | | 83.7 | | | 6.8 | | | 8 | % | | | 117.9 | | | | 84.7 | | | | 33.2 | | | 39 | % |
Hotel operating and maintenance | | | 17.1 | | | | 17.3 | | | (0.2 | ) | | -1 | % | | | 17.1 | | | | 17.3 | | | | (0.2 | ) | | -1 | % |
Real estate taxes | | | 31.8 | | | | 31.5 | | | 0.3 | | | 1 | % | | | 46.6 | | | | 31.7 | | | | 14.9 | | | 47 | % |
Parking | | | 14.5 | | | | 12.2 | | | 2.3 | | | 19 | % | | | 13.9 | | | | 12.2 | | | | 1.7 | | | 14 | % |
General and administrative | | | — | | | | — | | | — | | | | | | | 37.7 | | | | 36.9 | | | | 0.8 | | | 2 | % |
Other expense | | | 0.2 | | | | 0.2 | | | — | | | | | | | 5.2 | | | | 0.6 | | | | 4.6 | | | | |
Depreciation and amortization | | | 119.0 | | | | 128.7 | | | (9.7 | ) | | -8 | % | | | 183.7 | | | | 129.8 | | | | 53.9 | | | 42 | % |
Interest | | | 140.4 | | | | 120.8 | | | 19.6 | | | 16 | % | | | 219.8 | | | | 121.9 | | | | 97.9 | | | 80 | % |
Loss from early extinguishment of debt | | | 13.2 | | | | 6.6 | | | 6.6 | | | 100 | % | | | 21.7 | | | | 11.5 | | | | 10.2 | | | 89 | % |
| | | | | | | | | | | | | | | | | | | | | | | | | | | | | |
Total expenses | | | 426.7 | | | | 401.0 | | | 25.7 | | | 6 | % | | | 663.6 | | | | 446.6 | | | | 217.0 | | | 49 | % |
| | | | | | | | | | | | | | | | | | | | | | | | | | | | | |
Loss from continuing operations before equity in net loss of unconsolidated joint venture, gain on sale of real estate and minority interests | | | (41.6 | ) | | | 11.7 | | | (53.3 | ) | | | | | | (139.6 | ) | | | (15.2 | ) | | | (124.4 | ) | | | |
Equity in net loss of unconsolidated joint venture | | | — | | | | — | | | — | | | | | | | (2.1 | ) | | | (3.8 | ) | | | 1.7 | | | | |
Gain on sale of real estate | | | — | | | | — | | | — | | | | | | | — | | | | 108.4 | | | | (108.4 | ) | | | |
Minority interests allocated to continuing operations | | | — | | | | — | | | — | | | | | | | 21.8 | | | | (10.5 | ) | | | 32.3 | | | | |
| | | | | | | | | | | | | | | | | | | | | | | | | | | | | |
(Loss) income from continuing operations | | $ | (41.6 | ) | | $ | 11.7 | | $ | (53.3 | ) | | | | | $ | (119.9 | ) | | $ | 78.9 | | | $ | (198.8 | ) | | | |
| | | | | | | | | | | | | | | | | | | | | | | | | | | | | |
Income (loss) from discontinued operations | | | | | | | | | | | | | | | | $ | 139.2 | | | $ | (8.6 | ) | | $ | 147.8 | | | | |
| | | | | | | | | | | | | | | | | | | | | | | | | | | | | |
Rental Revenue
Rental revenue for our Same Properties Portfolio decreased $8.2 million, or 3%, during 2007 as compared to 2006, primarily due to lower tenant occupancy and significant lease terminations/expirations at KPMG Tower, Gas Company Tower and Park Place, which space has not been re-leased.
Total Portfolio rental revenue increased $81.1 million, or 34%, during 2007 as compared to 2006, mainly due to properties acquired in the Blackstone Transaction.
44
Tenant Reimbursements
Tenant reimbursements for our Same Properties Portfolio decreased $2.3 million, or 3%, during 2007 as compared to 2006 as a result of decreases in tenant reimbursements due to 2006 lease terminations/expirations, which were partially offset by an overall increase in operating expenses.
Total Portfolio tenant reimbursement revenue increased $19.0 million, or 22%, during 2007 as compared to 2006, primarily due to the properties acquired in the Blackstone Transaction.
Parking Revenue
Parking revenue for our Same Properties Portfolio increased $1.0 million, or 2%, during 2007 as compared to 2006, primarily due to an annual increase in rates, partially offset by lease terminations and expirations
Total Portfolio parking revenue increased $8.2 million, or 21%, during 2007 as compared to 2006, primarily due to properties acquired in the Blackstone Transaction.
Management, Leasing and Development Services
Total Portfolio management, leasing and development services increased $1.2 million, or 15%, during 2007 as compared to 2006, primarily due to lease commissions earned from our joint venture properties.
Interest and Other Revenue
Total Portfolio interest and other revenue decreased $17.0 million, or 54%, during 2007 as compared to 2006, primarily due to the recognition of $20.3 million in income associated with a significant lease termination at Park Place in December 2006 offset by interest income earned during 2007 on restricted lender reserves associated with the assets acquired in the Blackstone Transaction.
Rental Property Operating and Maintenance Expense
Rental property operating and maintenance expense for our Same Properties Portfolio increased $6.8 million, or 8%, during 2007 as compared to 2006, primarily due to a general increase in various property operating expenses across our portfolio.
Total Portfolio rental property operating and maintenance expense increased $33.2 million, or 39%, during 2007 as compared to 2006, primarily due to properties acquired in the Blackstone Transaction and, to a lesser extent, the Same Properties Portfolio.
Real Estate Taxes
Total Portfolio real estate taxes increased $14.9 million, or 47%, during 2007 as compared to 2006, primarily due to the properties acquired in the Blackstone Transaction.
Parking Expense
Total Portfolio parking expense increased $1.7 million, or 14%, during 2007 as compared to 2006, primarily due to the properties acquired in the Blackstone Transaction and due to the operation of two new garages located at our Park Place property.
45
General and Administrative Expense
Total Portfolio general and administrative expense increased $0.8 million, or 2%, during 2007 as compared to 2006. Our results for 2007 include costs incurred pursuant to consulting and separation agreements with Dallas E. Lucas, our previous Chief Financial Officer, and increased expenses due to additional corporate employees hired and office expense incurred as a result of our growth.
Other Expense
Other expense for our Total Portfolio increased $4.6 million during 2007 as compared to 2006, primarily due to an increase in ground lease expense associated with properties purchased in the Blackstone Transaction and an increase in our income tax provision with no comparable activity in the prior period.
Depreciation and Amortization Expense
Depreciation and amortization expense for our Same Properties Portfolio decreased $9.7 million, or 8%, during 2007 as compared to 2006, primarily due to lower in-place amortization as a result of lease expirations and lease terminations that occurred in 2006 in spaces that have not been re-leased.
Total Portfolio depreciation and amortization expense increased $53.9 million, or 42%, during 2007 as compared to 2006, primarily due to properties acquired in the Blackstone Transaction.
Interest Expense
Interest expense for our Same Properties Portfolio increased $19.6 million, or 16%, during 2007 as compared to 2006, primarily due to an increase in interest expense related to the refinancing of the 777 Tower, Gas Company Tower and Glendale Center mortgage loans in the latter half of 2006, the Wells Fargo Tower mortgage in April 2007 and the KPMG Tower mortgage in September 2007, partially offset by $17.0 million of savings due to the payoff of a previous term loan in 2006.
Total Portfolio interest expense increased $97.9 million, or 80%, during 2007 as compared to 2006, primarily due to interest incurred on the mortgage loans for properties acquired in the Blackstone Transaction and, to a lesser extent, our Same Properties Portfolio.
Loss from Early Extinguishment of Debt
Total Portfolio loss from early extinguishment of debt was $21.7 million for 2007, which includes $8.4 million related to the KPMG Tower refinancing; $4.3 million in defeasance costs related to the financing of the Wells Fargo Tower; $6.7 million in connection with the repayment of the $400.0 million term loan used to fund the Blackstone Transaction; $0.8 million related to the contribution of our office property located at 18301 Von Karman to a joint venture; and $1.5 million related the repayment of the $223.0 million bridge loan. Loss from early extinguishment of debt was $11.5 million for 2006, which includes the payment of $3.0 million in prepayment penalties and the recognition of a $0.6 million write off of unamortized loan fees related to the Glendale Center refinancing; the write off of $4.8 million of unamortized loan fees related to the repayment of our previous term loan; the write off of $1.8 million of unamortized loan fees related to the Gas Company Tower refinancing; and the payment of $0.6 million in prepayment penalties and the recognition of a $0.4 million write off of unamortized loan fees related to the 777 Tower refinancing.
Minority Interests
Minority interests allocated to continuing operations were $21.8 million for 2007 compared to minority interest attributable to continuing operations of $(10.5) million for 2006, primarily due to a $239.1 million
46
reduction in income from continuing operations as a result of the impact of the Blackstone Transaction in 2007 and a non-recurring gain of $108.4 million in 2006 from our contribution of an 80% interest in five properties to our joint venture with Macquarie Office Trust.
Gain on Sale of Real Estate
We recorded a gain on sale of real estate of $108.4 million during 2006 related to our contribution of five properties to our joint venture with Macquarie Office Trust, with no comparable activity during 2007.
Discontinued Operations
Our 2007 results include a $195.4 million gain on sale (and related allocation of $21.9 million in minority interests) due to the sale of Pacific Center, Regents Square and Wateridge Plaza with no comparable activity in the same period last year. Discontinued operations generated income of $139.2 million for 2007 compared to an $8.6 million loss for 2006.
Indebtedness
Mortgage Loans
As of December 31, 2008, our consolidated debt was comprised of mortgages secured by 27 properties and five construction loans. A summary of our consolidated debt as of December 31, 2008 is as follows (in millions, except percentage and year amounts):
| | | | | | | | | | | |
| | | Principal
Amount | | Percent of
Total Debt | | | Effective
Interest
Rate | | | Debt to
Maturity
(in years) |
Fixed rate | | $ | 3,695.0 | | 75.67 | % | | 5.51 | % | | 7 years |
Variable-rate swapped to fixed-rate | | | 424.3 | | 8.69 | % | | 7.18 | % | | 4 years |
Variable-rate | | | 763.5 | | 15.64 | % | | 3.64 | % | | 1 year |
| | | | | | | | | | | |
| | $ | 4,882.8 | | 100.00 | % | | 5.37 | % | | 6 years |
| | | | | | | | | | | |
As of December 31, 2008, approximately 84% of our outstanding debt was fixed (or swapped to a fixed rate) at a weighted average interest rate of approximately 5.7% on an interest-only basis with a weighted average remaining term of approximately six years. Our variable-rate debt bears interest at a rate based on one-month LIBOR, which was 0.44% as of December 31, 2008, except for our 17885 Von Karman and 2385 Northside construction loans, which bear interest at prime, which was 3.25% as of December 31, 2008. Our variable-rate debt at December 31, 2008 had a weighted average term to initial maturity of approximately one year (approximately three years assuming exercise of extension options).
As of December 31, 2008, our ratio of total consolidated debt to total consolidated market capitalization was approximately 93.7% of our total market capitalization of $5.2 billion (based on the closing price of our common stock of $1.46 per share on the NYSE on December 31, 2008). Our ratio of total consolidated debt plus liquidation preference to total consolidated market capitalization was approximately 98.5% as of December 31, 2008. Our total consolidated market capitalization includes the book value of our consolidated debt, the liquidation preference of 10.0 million shares of Series A Preferred Stock and the market value of our outstanding common stock and limited partnership units as of December 31, 2008.
47
Certain information with respect to our indebtedness as of December 31, 2008 is as follows (in thousands, except percentages):
| | | | | | | | | | | | | | | | | |
| | | Interest
Rate | | | Maturity
Date | | Principal
Amount | | | Annual
Debt
Service(1) | | | Balance at
Maturity(2) | |
Floating-Rate Debt | | | | | | | | | | | | | | | | | |
Repurchase facility(3) | | 2.19 | % | | 5/1/2011 | | $ | 35,000 | | | $ | 776 | | | $ | 35,000 | |
Construction Loans: | | | | | | | | | | | | | | | | | |
3161 Michelson(4) | | 3.44 | % | | 9/28/2009 | | | 168,719 | | | | 5,878 | | | | 168,719 | |
Lantana Media Campus(5) | | 3.44 | % | | 6/13/2009 | | | 79,953 | | | | 2,786 | | | | 79,953 | |
17885 Von Karman | | 5.50 | % | | 6/30/2010 | | | 24,145 | | | | 1,346 | | | | 24,145 | |
2385 Northside Drive | | 5.50 | % | | 8/6/2010 | | | 13,991 | | | | 780 | | | | 13,991 | |
207 Goode(6) | | 2.24 | % | | 5/1/2010 | | | 9,133 | | | | 207 | | | | 9,133 | |
| | | | | | | | | | | | | | | | | |
Total construction loans | | | | | | | | 295,941 | | | | 10,997 | | | | 295,941 | |
| | | | | | | | | | | | | | | | | |
Variable Rate Mortgage Loans: | | | | | | | | | | | | | | | | | |
Griffin Towers(7) | | 6.50 | % | | 5/1/2010 | | | 125,000 | | | | 8,238 | | | | 125,000 | |
Plaza Las Fuentes(8) | | 3.69 | % | | 9/29/2010 | | | 99,800 | | | | 3,730 | | | | 99,800 | |
500-600 City Parkway(9) | | 1.79 | % | | 5/9/2010 | | | 98,751 | | | | 1,788 | | | | 98,751 | |
Brea Corporate Place(10) | | 2.39 | % | | 5/1/2010 | | | 70,469 | | | | 1,705 | | | | 70,469 | |
Brea Financial Commons(10) | | 2.39 | % | | 5/1/2010 | | | 38,532 | | | | 932 | | | | 38,532 | |
| | | | | | | | | | | | | | | | | |
Total variable rate mortgage loans | | | | | | | | 432,552 | | | | 16,393 | | | | 432,552 | |
| | | | | | | | | | | | | | | | | |
Variable-Rate Swapped to Fixed-Rate: | | | | | | | | | | | | | | | | | |
KPMG Tower(11) | | 7.16 | % | | 10/9/2012 | | | 399,318 | | | | 29,004 | | | | 399,318 | |
207 Goode(6) | | 7.36 | % | | 5/1/2010 | | | 25,000 | | | | 1,867 | | | | 25,000 | |
| | | | | | | | | | | | | | | | | |
Total variable rate swapped to fixed-rate loans | | | | | | | | 424,318 | | | | 30,871 | | | | 424,318 | |
| | | | | | | | | | | | | | | | | |
Total floating-rate debt | | | | | | | | 1,187,811 | | | | 59,037 | | | | 1,187,811 | |
| | | | | | | | | | | | | | | | | |
Fixed-Rate Debt | | | | | | | | | | | | | | | | | |
Wells Fargo Tower (Los Angeles, CA) | | 5.68 | % | | 4/6/2017 | | | 550,000 | | | | 31,649 | | | | 550,000 | |
Two California Plaza(12) | | 5.50 | % | | 5/6/2017 | | | 466,217 | | | | 26,208 | | | | 470,000 | |
Gas Company Tower | | 5.10 | % | | 8/11/2016 | | | 458,000 | | | | 23,692 | | | | 458,000 | |
Pacific Arts Plaza | | 5.15 | % | | 4/1/2012 | | | 270,000 | | | | 14,105 | | | | 270,000 | |
777 Tower(12) | | 5.84 | % | | 11/1/2013 | | | 269,835 | | | | 16,176 | | | | 273,000 | |
US Bank Tower | | 4.66 | % | | 7/1/2013 | | | 260,000 | | | | 12,284 | | | | 260,000 | |
550 South Hope Street(12) | | 5.67 | % | | 5/6/2017 | | | 198,444 | | | | 11,499 | | | | 200,000 | |
Park Place I | | 5.64 | % | | 11/1/2014 | | | 170,000 | | | | 9,588 | | | | 170,000 | |
City Tower(12) | | 5.85 | % | | 5/10/2017 | | | 139,834 | | | | 8,301 | | | | 140,000 | |
Glendale Center | | 5.82 | % | | 8/11/2016 | | | 125,000 | | | | 7,373 | | | | 125,000 | |
500 Orange Tower(12) | | 5.88 | % | | 5/6/2017 | | | 109,127 | | | | 6,560 | | | | 110,000 | |
2600 Michelson(12) | | 5.69 | % | | 5/10/2017 | | | 109,101 | | | | 6,351 | | | | 110,000 | |
Park Place II | | 5.39 | % | | 3/11/2012 | | | 99,268 | | | | 5,425 | | | | 99,268 | |
Stadium Towers Plaza(12) | | 5.78 | % | | 5/11/2017 | | | 99,213 | | | | 5,865 | | | | 100,000 | |
Lantana Media Campus | | 4.94 | % | | 1/6/2010 | | | 98,000 | | | | 4,903 | | | | 98,000 | |
801 North Brand | | 5.73 | % | | 4/6/2015 | | | 75,540 | | | | 4,386 | | | | 75,540 | |
Mission City Corporate Center | | 5.09 | % | | 4/1/2012 | | | 52,000 | | | | 2,685 | | | | 52,000 | |
The City—3800 Chapman | | 5.93 | % | | 5/6/2017 | | | 44,370 | | | | 2,666 | | | | 44,370 | |
701 North Brand | | 5.87 | % | | 10/1/2016 | | | 33,750 | | | | 2,009 | | | | 33,750 | |
700 North Central | | 5.73 | % | | 4/6/2015 | | | 27,460 | | | | 1,594 | | | | 27,460 | |
Griffin Towers Senior Mezzanine | | 13.00 | % | | 5/1/2011 | | | 20,000 | | | | 2,636 | | | | 20,000 | |
18581 Teller(12) | | 5.65 | % | | 5/6/2017 | | | 19,839 | | | | 1,146 | | | | 20,000 | |
| | | | | | | | | | | | | | | | | |
Total fixed-rate debt | | | | | | | | 3,694,998 | | | | 207,101 | | | | 3,706,388 | |
| | | | | | | | | | | | | | | | | |
Total consolidated debt | | | | | | | | 4,882,809 | | | | 266,138 | | | | 4,894,199 | |
Less: mortgage loan associated with real estate held for sale | | | | | | | | (168,719 | ) | | | (5,878 | ) | | | (168,719 | ) |
| | | | | | | | | | | | | | | | | |
Total debt—continuing operations | | | | | | | $ | 4,714,090 | | | $ | 260,260 | | | $ | 4,725,480 | |
| | | | | | | | | | | | | | | | | |
48
| (1) | The December 31, 2008 one-month LIBOR rate of 0.44% was used to calculate interest on the variable-rate loans, except for the 17885 Von Karman and 2385 Northside Drive construction loans, which were calculated using the prime rate of 3.25% as of December 31, 2008. |
| (2) | Assuming no payment has been made in advance of its due date. |
| (3) | This loan bears interest at a variable rate of (i) LIBOR plus 1.75% for the first year, (ii) LIBOR plus 2.75% for the second year and (iii) LIBOR plus 3.75% for the third year. |
| (4) | As required by the loan agreement, we have entered into an interest rate cap agreement that limits the LIBOR portion of the interest rate to 5.50% for 75.0% of the maximum loan balance during the loan term, excluding extension periods. Two one-year extensions are available at our option, subject to certain conditions. As of December 31, 2008, our 3161 Michelson property is classified as held for sale. |
| (5) | One one-year extension is available at our option, subject to certain conditions. |
| (6) | This loan bears interest at a rate of LIBOR plus 1.80%. We have entered into an interest rate swap agreement to hedge this loan up to $25.0 million, which effectively fixes the LIBOR rate at 5.564%. One one-year extension is available at our option, subject to certain conditions. |
| (7) | This loan bears interest at a rate of the greater of LIBOR or 3.00%, plus 3.50%. As required by the loan agreement, we have entered into an interest rate cap agreement that limits the LIBOR portion of the interest rate to 5.00% during the loan term, excluding the extension period. One one-year extension is available at our option, subject to certain conditions. |
| (8) | As required by the loan agreement, we have entered into an interest rate cap agreement that limits the LIBOR portion of the interest rate to 4.75% during the loan term, excluding extension periods. Three one-year extensions are available at our option, subject to certain conditions. |
| (9) | As required by the loan agreement, we have entered into an interest rate cap agreement that limits the LIBOR portion of the interest rate to 6.00% during the loan term, excluding extension periods. Two one-year extensions are available at our option, subject to certain conditions. |
| (10) | As required by the loan agreement, we have entered into an interest rate cap agreement that limits the LIBOR portion of the interest rate to 6.50% during the loan term, excluding extension periods. Two one-year extensions are available at our option, subject to certain conditions. |
| (11) | This loan bears interest at a rate of LIBOR plus 1.60%. We have entered into an interest rate swap agreement to hedge this loan, which effectively fixes the LIBOR rate at 5.564%. |
| (12) | These loans are reflected net of the related debt discount. At December 31, 2008, the discount for all loans referenced totals approximately $11 million. |
Financing and Refinancing Activity
Plaza Las Fuentes –
On September 29, 2008, we completed a $100.0 million financing secured by Plaza Las Fuentes and the Westin® Pasadena Hotel. Net proceeds totaled approximately $95 million, of which approximately $65 million was used to extend three of our construction loans, including paying down principal balances, securing letters of credit, funding leasing reserves, and paying closing costs (as described below), leaving approximately $30 million available for general corporate purposes.
This loan bears interest at (i) LIBOR plus 3.25% or (ii) the base rate, as defined in the loan agreement, plus 2.25%. This loan matures on September 29, 2010, with three one-year extensions available at our option, subject to certain conditions. As required by the loan agreement, we entered into an interest rate cap agreement which limits the LIBOR portion of the interest rate to 4.75% during the loan term, excluding extension periods. This loan requires principal payments of $100.0 thousand per month during the term of the loan, including any extension periods. Additional principal paydowns will be required if the property’s debt service coverage ratio (as defined in the loan agreement) is less than specified amounts as of the applicable quarterly measurement date.
Concurrent with the completion of the financing of Plaza Las Fuentes, we terminated the Revolver. All standby letters of credit that were secured by the Revolver have been continued with the issuing financial institution and are no longer secured by the Revolver.
49
The terms of the Plaza Las Fuentes loan require our Operating Partnership to comply with financial ratios relating to minimum amounts of tangible net worth, interest coverage, fixed charge coverage and cash liquidity, and a maximum amount of leverage.
Griffin Towers –
On April 21, 2008, we repaid the existing $200.0 million mortgage loan secured by Griffin Towers. The repayment was funded through the issuance of $180.0 million in new debt and $20.0 million of cash on hand.
The new debt is comprised of (i) a $125.0 million mortgage loan (the “Mortgage Loan”) secured by Griffin Towers, (ii) a $20.0 million senior mezzanine loan (the “Senior Mezzanine Loan”) secured by an equity interest in Griffin Towers and (iii) a $55.0 million junior mezzanine loan secured by an equity interest in Griffin Towers. Simultaneously at closing, our Operating Partnership repurchased the $55.0 million junior mezzanine loan which was funded through a separate $35.0 million repurchase facility (the “Repurchase Facility”) issued by the lender and $20.0 million of cash on hand. The Repurchase Facility is recourse to our Operating Partnership and secured by the $55.0 million intercompany junior mezzanine loan on Griffin Towers. The net effect of these financing transactions was the issuance of $145.0 million in new mortgage and mezzanine loans secured by Griffin Towers and $35.0 million in new secured recourse debt issued by our Operating Partnership.
The Mortgage Loan bears interest at a variable rate of LIBOR plus 3.5% (with a LIBOR floor of 3.0%) and matures on May 1, 2010, with a one-year extension available at our option. We purchased an interest rate cap agreement which caps LIBOR at 5% during the initial term. The Senior Mezzanine Loan bears interest at a fixed rate of 13.0% per annum and matures on May 1, 2011.
The Repurchase Facility bears interest at a variable rate of (i) LIBOR plus 1.75% through and including May 31, 2009, (ii) LIBOR plus 2.75% from June 1, 2009 through and including May 31, 2010 and (iii) LIBOR plus 3.75% from June 1, 2010 and thereafter. The Repurchase Facility requires repayments of $10.0 million on June 1, 2009 and June 1, 2010 with the remaining balance due upon maturity on May 1, 2011.
Loan Extensions
3161 Michelson –
On September 29, 2008, we extended our 3161 Michelson construction loan for a period of one year. The loan is now scheduled to mature on September 28, 2009. The amended loan bears interest at (i) LIBOR plus 3.00% or (ii) the base rate, as defined in the original loan agreement, plus 2.25%. There are two one-year extension periods available under this loan at our option, subject to certain conditions. As required by the amended loan agreement, we entered into an interest rate cap agreement which limits the LIBOR portion of the interest rate to 5.50% for 75% of the maximum available amount as of the extension.
As part of the conditions to extend the maturity date of this loan, we made a principal payment totaling $33.0 million and funded a $7.5 million increase in tenant improvement reserves using proceeds from the financing of Plaza Las Fuentes. Subsequent to the refinancing of this loan, the principal balance of this loan was reduced by $16.3 million by application of funds received by the lender, mainly from drawdowns of standby letters of credit and sweeping of restricted cash held in accounts controlled by the lender.
The terms of the amended loan agreement require our Operating Partnership to comply with financial ratios relating to minimum amounts of tangible net worth, interest coverage and fixed charge coverage, and a maximum amount of leverage.
50
17885 Von Karman –
On September 30, 2008, we extended our 17885 Von Karman construction loan for a period of eighteen months. This loan is now scheduled to mature on June 30, 2010. The modified loan bears interest at (i) LIBOR plus 2.50% or (ii) the base rate, as defined in the modification agreement, plus 0.50%. A floor interest rate of 5.00% applies to both LIBOR and base rate loans. As part of the conditions to extend the maturity date of this loan, we made a principal payment of $4.8 million using proceeds received from the financing of Plaza Las Fuentes.
2385 Northside Drive –
On September 30, 2008, we extended our 2385 Northside Drive construction loan for a period of eighteen months. This loan is now scheduled to mature on August 6, 2010. The modified loan bears interest at (i) LIBOR plus 2.50% or (ii) the base rate, as defined in the modification agreement, plus 0.50%. A floor interest rate of 5.00% applies to both LIBOR and base rate loans. As part of the conditions to extend the maturity date of this loan, we made a principal payment of $6.5 million using proceeds received from the financing of Plaza Las Fuentes.
City Parkway –
On October 31, 2008, we exercised our first one-year extension option available under the City Parkway mortgage, which now matures on May 9, 2010. We have two one-year extensions available at our option that would allow us to extend the maturity of this loan to May 9, 2012, subject to certain conditions. The terms of the extended loan remain the same as the original loan, including the interest rate spread. As required by the modified loan agreement, we have entered into an interest rate cap agreement that limits the LIBOR portion of the interest rate to 6.00% during the loan term, excluding extension periods.
Brea Corporate Place and Brea Financial Commons –
On November 3, 2008, we exercised our first one-year extension option available under the mortgage loan secured by Brea Corporate Place and Brea Financial Commons. This loan now matures on May 1, 2010. We have two one-year extensions available at our option that would allow us to extend the maturity of this loan to May 1, 2012, subject to certain conditions. The terms of the extended loan remain the same as the original loan, including the interest rate spread. As required by the modified loan agreement, we have entered into an interest rate cap agreement that limits the LIBOR portion of the interest rate to 6.50% during the loan term, excluding extension periods.
Dispositions
We disposed of two office properties during 2008: 1920 and 2010 Main Plaza and City Plaza. A total of $261.7 million in mortgage loans related to these properties were assumed by the buyers upon disposal.
Amounts Available for Future Funding under Construction Loans
A summary of our construction loans as of December 31, 2008 is as follows (in thousands):
| | | | | | | | | | | | |
Project | | Maximum Loan
Amount | | Balance as of
December 31, 2008 | | Available for Future
Funding | | Operating
Partnership
Repayment
Guarantee |
3161 Michelson | | $ | 190,696 | | $ | 168,719 | | $ | 21,977 | | $ | 24,000 |
Lantana Media Campus | | | 88,000 | | | 79,953 | | | 8,047 | | | 22,000 |
207 Goode | | | 64,497 | | | 34,133 | | | 30,364 | | | 34,133 |
17885 Von Karman | | | 33,600 | | | 24,145 | | | 9,455 | | | 6,720 |
2385 Northside Drive | | | 19,860 | | | 13,991 | | | 5,869 | | | 3,972 |
| | | | | | | | | | | | |
| | $ | 396,653 | | $ | 320,941 | | $ | 75,712 | | | |
| | | | | | | | | | | | |
51
Amounts shown as available for future funding as of December 31, 2008 represent funds that can be drawn to pay for remaining project development costs, including construction, tenant improvement and leasing costs.
Each of our construction loans is guaranteed by our Operating Partnership. The amounts guaranteed at any point in time are based on the stage of the development cycle that the project is in and are subject to reduction when certain financial ratios have been met. For our project at 3161 Michelson, the $24.0 million is guaranteed until the loan is repaid.
Operating Partnership Contingent Obligations
In connection with the issuance of non-recourse mortgage loans secured by certain wholly owned subsidiaries of our Operating Partnership, our Operating Partnership provided various forms of partial guaranties to the lenders originating those loans. These guaranties are contingent obligations that could give rise to defined amounts of recourse against our Operating Partnership, should the wholly owned subsidiaries be unable to satisfy certain obligations under otherwise non-recourse mortgage loans. These guaranties are in the form of (1) master leases whereby our Operating Partnership agreed to guarantee the payment of rents and/or re-tenanting costs for certain tenant leases existing at the time of loan origination should the tenants not satisfy their obligations through their lease term, (2) the guaranty of debt service payments (as defined) for a period of time (but not the guaranty of repayment of principal), (3) master leases of a defined amount of space over a defined period of time, with offsetting credit received for actual rents collected through third-party leases entered into with respect to the master leased space, and (4) customary repayment guaranties under construction loans. These partial guaranties of certain non-recourse mortgage debt of wholly owned subsidiaries of our Operating Partnership, for which the interest expense and debt is included in our consolidated financial statements, are more fully described below.
Master Lease Agreements with Lenders
As a condition to closing the mortgage loans on City Plaza, City Tower, 2600 Michelson and City Parkway in 2007, our Operating Partnership entered into a number of master lease agreements to guarantee rents on space leased by Ameriquest. On July 1, 2007, Ameriquest terminated leases at each of these properties, which triggered our master lease obligations at City Tower and 2600 Michelson, and increased the likelihood that future payments will be required to be made by our Operating Partnership under master lease obligations at City Parkway. On September 2, 2008, we sold City Plaza to Hudson Capital, LLC, which included the assumption of the existing $101.0 million mortgage. Accordingly we have no further master lease obligations with respect to City Plaza.
City Tower –
In connection with the entry into a $140.0 million mortgage loan on City Tower in 2007 by a wholly owned subsidiary of our Operating Partnership, our Operating Partnership entered into a guaranty with the lender for all rents derived from 71,657 rentable square feet leased to Ameriquest through February 28, 2010 (the “City Tower Master Lease”). The City Tower Master Lease was triggered on July 1, 2007 upon the termination of Ameriquest’s leases at City Tower. As a result, our obligations to fund the remaining $4.3 million in rents payable by Ameriquest under their City Tower leases from July 1, 2007 to February 28, 2010, as well as to pay for the first $34.00 per square foot, or approximately $2.4 million, in costs associated with re-leasing this space, was triggered under the City Tower Master Lease.
We received a termination fee from Ameriquest in the amount of $2.4 million, which we deposited in lender-controlled restricted cash interest reserves as a prepayment of a portion of our City Tower Master Lease obligations. Subsequent to July 1, 2007, we leased 34,353 rentable square feet to new tenants whose leases will generate another $2.0 million in rents through February 28, 2010. A combination of the Ameriquest termination fees deposited in the lender-controlled restricted cash interest reserves, as well as future rents payable under the space re-leased to date, satisfies our obligations as it relates to paying rents under our City Tower Master Lease.
52
We are still obligated to fund approximately $1 million of leasing costs related to the City Tower Master Lease space. City Tower is a 411,843 rentable square foot building that is 78.1% leased as of December 31, 2008.
2600 Michelson –
In connection with the entry into a $110.0 million mortgage loan on 2600 Michelson in 2007 by a wholly owned subsidiary of our Operating Partnership, our Operating Partnership entered into a guaranty for all rents derived from 97,798 rentable square feet leased to Ameriquest through January 31, 2011 (the “2600 Michelson Master Lease”). The 2600 Michelson Master Lease would have been triggered upon the July 1, 2007 termination of Ameriquest’s leases at 2600 Michelson; however, we simultaneously entered into direct leases with subtenants of Ameriquest that were in occupancy and paying rents on all 97,798 rentable square feet of space covered by the 2600 Michelson Master Lease. The lender agreed to transfer our 2600 Michelson Master Lease obligations to these new tenants.
During the fourth quarter of 2007, one of these new tenants terminated their lease on 20,025 square feet. As a result, our obligations to fund the remaining $0.9 million in rents payable under their 20,025 rentable square foot lease from October 1, 2007 to January 31, 2011, as well as to pay for the first $34.00 per square foot, or approximately $0.7 million, in costs associated with re-leasing this space, was triggered under our 2600 Michelson Master Lease. We received a termination fee from this tenant in the amount of $0.3 million, which we deposited in lender-controlled restricted cash interest reserves as a prepayment of a portion of our 2600 Michelson Master Lease obligations. Unless we re-lease this space to a new tenant, we will be required to fund the remaining $0.6 million in rental obligations on a monthly basis commencing in November 2008 and then deposit $0.7 million into a lender-controlled restricted cash leasing reserve on January 31, 2011.
As of December 31, 2008, the tenants occupying the remaining 77,773 rentable square feet covered under the 2600 Michelson Master Lease are current under their lease agreements. Our remaining exposure related to these tenants is approximately $3.8 million as of December 31, 2008. As long as these tenants are not in default under their lease agreements, our contingent obligations under the 2600 Michelson Master Lease will decrease to zero by January 31, 2011, at a rate of approximately $0.4 million per quarter. Should these tenants default under their lease agreements prior to that date, in addition to our responsibility to guarantee their remaining future rental payments, our Operating Partnership will also be liable for the first $34.00 per square foot, or $2.6 million, of leasing costs incurred to re-lease this space. 2600 Michelson is a 308,109 rentable square foot building that is 76.1% leased as of December 31, 2008.
City Parkway –
In connection with the entry into a $98.7 million ($117.0 million when fully drawn) mortgage loan on City Parkway during 2007 by a wholly owned subsidiary of our Operating Partnership, our Operating Partnership entered into a guaranty with the lender for all rents derived from 261,288 rentable square feet leased to Ameriquest (the “City Parkway Master Lease”). The likelihood that the City Parkway Master Lease will be triggered significantly increased on July 1, 2007 upon the termination of Ameriquest’s leases at City Parkway. The master lease requires rental payments by our Operating Partnership calculated as $23.00 per square foot multiplied by the vacant City Parkway Master Lease space (up to $6.0 million per year). The master lease will be reduced and/or terminated in part or in full upon the earlier of two years from the commencement date (for a maximum exposure of $12.0 million over two years), or as the vacant space is re-leased. The master lease commencement date begins upon the later of the termination of the Ameriquest space (which has occurred) and when the combined amount available under the Future Interest Advance and the Interest Reserve (as defined in the loan agreement) is less than $2.0 million and the Underwritten Debt Service Coverage Ratio (as defined in the loan agreement) is less than 1.05:1.00. The commencement date has not yet occurred as the Future Interest Advance, which was $10.0 million as of December 31, 2008, currently exceeds the $2.0 million trigger. City Parkway is a 457,475 rentable square foot office complex that is 28.7% leased as of December 31, 2008.
53
Debt Service Guaranties
As a condition to closing the fixed-rate mortgage loans on 18581 Teller, 3800 Chapman, 500 Orange Tower and the $109.0 million variable-rate mortgage secured by both Brea Corporate Place and Brea Financial Commons (the “Brea Campus”) in 2007, our Operating Partnership entered into various debt service guaranty agreements. Under each of the debt service guaranties, our Operating Partnership agreed to guarantee the prompt payment of the monthly debt service amount (but not the repayment of any principal amount) and all amounts to be deposited into (i) the Tax and Insurance Reserve, (ii) the Capital Reserve, (iii) the Rollover Reserve, and (iv) the Ground Lease Reserve (Brea Corporate Place only). Each guaranty commences on January 1, 2009 and expires on December 31, 2009 for 18581 Teller and 500 Orange Tower and on May 6, 2017 for 3800 Chapman. For the loan secured by our Brea Campus, our guaranty expires on May 1, 2010, unless we exercise our extension options, through which the guaranty can be extended until May 1, 2012 if the two remaining one-year extension options are exercised. Each of the guaranties can expire before its respective term upon determination by the lender that the relevant property has achieved a Debt Service Coverage Ratio (as defined in the loan agreements) of at least 1.10:1.00 for two consecutive calculation dates.
The following table provides information regarding each debt service guaranty as of December 31, 2008:
| | | | | | | | | | | | | | | |
Property | | Rentable Square
Feet | | Leased Percentage | | | Guaranty
Commence Date | | Guaranty
Expiration Date | | Annual Debt
Service(1) | | In-Place Annual
Cash NOI(2) |
500 Orange Tower | | 334,998 | | 79.6 | % | | 1-1-09 | | 12-31-09 | | $ | 6.6M | | $ | 4.2M |
18581 Teller | | 86,087 | | 100.0 | % | | 1-1-09 | | 12-31-09 | | | 1.2M | | | 1.4M |
3800 Chapman | | 157,231 | | 63.4 | % | | 1-1-09 | | 5-06-17 | | | 2.7M | | | 1.8M |
Brea Campus | | 494,536 | | 62.7 | % | | 1-1-09 | | 5-01-10 | | | 2.6M | | | 2.7M |
| (1) | Annual Debt Service represents annual interest expense only. |
| (2) | Tax and Insurance Reserve payment obligations and ground lease payment obligations (Brea Corporate Place only) are reflected as deductions to derive In-Place Annual Cash Net Operating Income (“NOI”). In-Place Annual Cash NOI represents actual fourth quarter 2008 Cash NOI multiplied by four. |
| (3) | In-Place Annual Cash NOI for Brea Campus of $0.4 million has been increased to eliminate the effect of a free rent period (which free rent will expire prior to the commencement date of the Debt Service Guaranty) for a 78,056 square foot lease. |
During the term of the respective guaranties shown in the table above, we also fund a Capital Reserve on a monthly basis at an annualized rate of $0.20 per square foot and commencing in June 2009 are obligated to fund a Rollover Reserve on a monthly basis at an annualized rate of $0.75 per square foot.
3161 Michelson Master Lease Obligations
In connection with the funding of the construction loan on 3161 Michelson, our Operating Partnership entered into a guaranty relating to an amount equal to 60 monthly rental payments under the New Century lease (the “New Century Occupancy Guaranty”). Our obligations under the New Century Occupancy Guaranty terminate upon the earlier of (i) New Century (or a replacement tenant acceptable to lender) taking possession and commencing to pay rent in accordance with its lease, or (ii) the date on which at least 90% of the rentable square footage of the property has been occupied for six consecutive months. Our obligations under these guaranties were triggered upon the bankruptcy filing of New Century. As of December 31, 2008, our unmitigated obligation under the New Century Occupancy Guaranty over the next five years is as follows (in millions):
| | | | | | | | | | | | | | | |
| | | 2009 | | 2010 | | 2011 | | 2012 | | 2013 |
Annual obligation | | $ | 7.4 | | $ | 7.5 | | $ | 7.8 | | $ | 6.2 | | $ | 2.8 |
Less: amount mitigated through re-leasing | | | 1.9 | | | 3.8 | | | 4.6 | | | 3.6 | | | — |
| | | | | | | | | | | | | | | |
Unmitigated obligation | | $ | 5.5 | | $ | 3.7 | | $ | 3.2 | | $ | 2.6 | | $ | 2.8 |
| | | | | | | | | | | | | | | |
54
In addition, our Operating Partnership entered into a Parking Master Lease for the parking structures secured by the 3161 Michelson construction loan in the amount of $9.0 million annually for a term of ten years commencing September 2007. The rent obligations under the Parking Master Lease are reduced by the amount of rent or other contractual income derived from sub-tenants or the parking operator. For the quarter ended December 31, 2008, annualized in-place parking revenue was approximately $3 million. Our Operating Partnership is currently making annualized Parking Master Lease payments of approximately $6 million to the lender. We expect to mitigate our future obligations under the Parking Master Lease by actively seeking new tenants to lease vacant space at our Park Place Campus, which we expect will generate additional parking revenue.
On September 29, 2008, we extended the maturity date of the 3161 Michelson construction loan to September 28, 2009. In connection with this extension, we agreed that any termination or reduction of our obligation under the New Century Occupancy Guaranty resulting from leasing the space to a new tenant will be disallowed if the new tenant defaults under the terms of its lease. In addition, our letter of credit was increased from $9.0 million to $12.6 million in order to collateralize one year’s unmitigated exposure under the New Century Occupancy Guaranty and the Parking Master Lease as of the extension date. The lender has the right to draw on the full amount of this letter of credit and apply the proceeds received to reduce the outstanding principal balance of this loan, which it did on October 3, 2008. We have no obligation to replace the $12.6 million letter of credit. We may be required to provide a new letter of credit of up to approximately $4 million in the event our annual unmitigated exposure under our New Century Occupancy Guaranty and Parking Master Lease increases as a result of defaults by tenants on re-leased New Century space or reductions in in-place parking revenue.
Plaza Las Fuentes Mortgage Guarantee Obligations
In connection with our wholly-owned subsidiary’s entry into a $100.0 million mortgage loan secured by Plaza Las Fuentes and the Westin® Pasadena Hotel, our Operating Partnership entered into two guarantees on September 29, 2008 related to space leased to East West Bank (90,773 rentable square feet) and Fannie Mae (61,655 rentable square feet). If either tenant defaults on its lease payments, as defined in the loan agreement, our Operating Partnership is required to either post a standby letter of credit or deposit cash with the lender’s agent equal to: (1) $50.00 per square foot of space leased by the defaulting tenant (“PLF Leasing Reserve”) and (2) one year of rent based on the defaulting tenant’s contractual rate (“PLF Interest Reserve”). The PLF Leasing Reserve would be available to us for reimbursement of tenant improvements and leasing commissions incurred to re-lease the defaulted space, and the PLF Interest Reserve would be available for payment of loan interest. We are required to replenish the PLF Interest Reserve if the remaining balance falls below six months worth of rent, provided that, in no event will the deposited amount (initial and subsequent deposits) exceed 24 months of rent for the defaulting tenant. As of December 31, 2008, our total contingent obligation related to our guaranty of the PLF Leasing Reserve is approximately $8 million, while our total contingent obligation related to our guaranty of the PLF Interest Reserve is approximately $5 million. To date, we have made no payments related to these contingent obligations.
Liquidity and Capital Resources
General
Our business requires continued access to adequate cash to fund our liquidity needs. Until the economic picture becomes clearer, our foremost priorities for 2009 are the preservation and generation of cash, including addressing debt maturities coming due.
Toward the aims of cash preservation and generation, in 2008 we: (1) disposed of City Plaza, a non-strategic asset with negative cash flow; (2) disposed of 1920 and 2010 Main Plaza, also a non-strategic asset, generating approximately $48 million of net proceeds; (3) completed a $100.0 million financing secured by Plaza Las Fuentes and the Westin® Pasadena Hotel, which provided net proceeds of approximately $95 million;
55
(4) suspended our common and preferred dividends; (5) reduced or deferred discretionary spending (including certain development activities and capital expenditures); and (6) extended several loans with near-term maturities that would otherwise have required significant cash outlays.
Going into 2009, we continue to be focused on preserving and generating cash sufficient to fund our liquidity needs. As of the date of this report, management believes that our estimated liquidity during the remainder of 2009 will be at or near the minimum amount necessary to operate our business. Given the deterioration and uncertainty in the economy and financial markets, management is assuming that access to any source of cash will be challenging and is planning accordingly.
Sources and Uses of Liquidity
Our expected actual and potential liquidity sources and uses are as follows:
| | |
Sources | | Uses |
• Unrestricted and restricted cash; • Cash generated from operations; • Asset dispositions; • Contribution of existing assets to joint ventures; • Proceeds from additional secured or unsecured debt financings; and/or • Proceeds from public or private issuance of debt or equity securities. | | • Property operations and corporate expenses; • Capital expenditures (including commissions and tenant improvements); • Development and redevelopment costs; • Debt service and principal payment obligations; • Swap obligations; and/or • Distributions to common and preferred stockholders and unit holders. |
Actual and Potential Sources of Liquidity –
Listed below are our actual and potential sources of liquidity in 2009, which we currently believe will be sufficient to fund our 2009 liquidity needs. These sources are essential to our short-term liquidity and financial position, and we cannot assure you that we will be able to successfully access them (particularly in the current economic environment). If we are unable to generate adequate cash from these sources, we will have liquidity- related problems and may be exposed to significant risks. While we believe that we will have adequate cash for our 2009 uses, significant and extended issues with access to the liquidity sources identified below could lead to our insolvency. For a further discussion of such risks associated with current economic conditions, our liquidity position and our substantial indebtedness, see Part I, Item 1A. “Risk Factors.”
Unrestricted and Restricted Cash –
A summary of our cash position as of December 31, 2008 is as follows (in millions):
| | | | | | |
| | | Continuing
Operations | | Assets Held
for Sale |
Unrestricted cash and cash equivalents | | $ | 80.5 | | $ | — |
Restricted cash: | | | | | | |
Leasing and capital expenditure reserves | | | 74.0 | | | 7.6 |
Tax, insurance and other working capital reserves | | | 19.3 | | | 0.9 |
Prepaid rent | | | 17.8 | | | — |
Debt service reserves | | | 8.5 | | | — |
Collateral accounts | | | 80.1 | | | 3.1 |
| | | | | | |
| | | 199.7 | | | 11.6 |
| | | | | | |
| | $ | 280.2 | | $ | 11.6 |
| | | | | | |
56
The leasing and capital expenditure, tax, insurance and other working capital, prepaid rent and interest reserves are held in restricted accounts by our lenders in connection with our mortgage loans. The collateral accounts are held by our counterparties or lenders in connection with our interest rate swap agreements and other obligations.
In connection with property acquisitions and the refinancing of existing loans, we typically reserve a portion of the loan proceeds at closing in restricted cash accounts to fund: (1) anticipated leasing expenditures (primarily commissions and tenant improvement costs) for both existing and prospective tenants; (2) non-recurring discretionary capital expenditures, such as major lobby renovations; and (3) future payments of interest (debt service). As of December 31, 2008, we had a total of approximately $79.3 million of leasing reserves, $2.3 million of non-recurring discretionary capital expenditure reserves and $8.5 million of debt service reserves. At a number of the properties with such reserves, particularly in Orange County, the monthly debt service requirements exceed the monthly cash generated from operations. We expect this cash flow deficit to continue until we are able to stabilize those properties through lease up. Stabilization is challenging in the current market, and lease up may be costly and take a significant period of time.
The following is a summary of our available leasing reserves as of December 31, 2008 (in millions):
| | | | | | | | | |
| | | Restricted Cash
Accounts | | Undrawn Debt
Proceeds | | Total Leasing
Reserves |
LACBD | | $ | 25.7 | | $ | 0.7 | | $ | 26.4 |
Orange County | | | 41.8 | | | 8.2 | | | 50.0 |
Tri-Cities | | | 4.3 | | | — | | | 4.3 |
Completed developments(1) | | | 7.5 | | | 42.8 | | | 50.3 |
| | | | | | | | | |
| | $ | 79.3 | | $ | 51.7 | | $ | 131.0 |
| | | | | | | | | |
| (1) | Includes 3161 Michelson, which is classified as held for sale as of December 31, 2008. |
Cash Generated from Operations –
Our cash generated from operations is primarily dependent upon: (1) the occupancy level of our portfolio; (2) the rental rates achieved on our leases; and (3) the collectibility of rent from our tenants. Net cash generated from operations is tied to our level of operating expenses and other general and administrative costs, described below under “Actual and Potential Uses of Liquidity.”
Occupancy level. There was negative absorption in 2008 in most submarkets, and our overall occupancy levels declined in 2008. Sustaining or improving our year-end 2008 occupancy rates through 2009 will be challenging, for the following reasons (among others):
| | • | | While we have been able to execute a number of significant leases in the last several quarters, leasing activity in general continues to be soft in all of our submarkets. |
| | • | | Many of our current tenants and potential tenants rely heavily on the availability of financing to support operating costs (including rent), and there is currently limited availability of credit. |
| | • | | The financial crisis has resulted in many companies shifting to a more cautionary mode with respect to leasing. Rather than expanding, many current and potential tenants are looking to consolidate, cut overhead and preserve operating capital. Many existing and potential tenants are also deferring strategic decisions, including entering into new, long-term leases. |
| | • | | Increased firm failures and rising unemployment have limited the tenant base. |
For a discussion of other factors that may affect our ability to sustain or improve our occupancy rates, see Part I, Item 1A. “Risk Factors.”
57
Rental rates. In 2008, as a result of the economic crisis, average asking rental rates dropped in most of our submarkets (particularly in Orange County), and remained relatively flat in the LACBD. In 2008, many Orange County landlords focused on tenant retention by reducing rental rates and focusing on short-term lease extensions. In 2009, management does not expect significant rental rate increases or decreases from 2008 levels in the Company’s submarkets. However, because of economic volatility and uncertainty, there can be no assurance that rental rates will not decline in 2009, particularly in the LACBD (where rates have been relatively stable).
Collectibility of rent from our tenants. Our rental revenue depends on collecting rents from tenants, and in particular from our major tenants. As of December 31, 2008, our 20 largest tenants represented approximately 35.6% of our Effective Portfolio’s total annualized rental revenue. Some of our tenants are in the mortgage, financial, insurance and professional services industries, and these industries have been severely impacted by the current economic climate. Many of our major tenants have experienced or may experience a notable business downturn, weakening their financial condition. This resulted in increased lease defaults and decreased rent collectibility in 2008. That trend has continued in the first quarter of 2009, and may continue or worsen through year-end 2009 and beyond. In many cases, we made substantial up-front investments in the applicable leases, through tenant improvement allowances and other concessions, as well as incurring typical transaction costs (including professional fees and commissions). In the event of any tenant default, we may experience delays in enforcing our rights as landlord and may incur substantial costs in protecting our investment. This is particularly true in the case of the bankruptcy or insolvency of a major tenant or where the FDIC is acting as receiver.
Asset Dispositions –
In 2008, we announced our intention to sell certain assets, which we expect will help us to: (1) preserve cash, through the potential disposition of properties with negative cash flow and/or other potential near-term cash outlay requirements (including debt maturities); and (2) generate cash, through the potential disposition of strategically identified non-core properties which we believe have equity value above the debt. In addition to the 2008 dispositions described above, in 2009 we are actively marketing our 3161 Michelson property located in Irvine, California, and several other non-core assets.
Our ability to sell assets is impacted by a number of factors. Many of these factors are beyond our control, including general economic conditions, availability of financing and interest rates. In light of the current economic conditions and the limited number of recently completed dispositions in our submarkets, we cannot predict:
| | • | | Whether we will be able to find any buyers for identified assets at prices and/or other terms acceptable to us; |
| | • | | Whether potential buyers will be able to secure financing; and |
| | • | | The length of time needed to find a willing buyer and to close the sale of a property. |
The foregoing means that we may be unable to complete our sales of identified properties in the near term or at all, which would significantly impact our liquidity situation.
In addition, certain of our material debt obligations require us to comply with financial and other covenants, including, but not limited to, net worth and liquidity covenants, due on sale clauses, change in control restrictions, listing requirements and other financial requirements. Some or all of these covenants could prevent or delay our ability to sell identified properties. For a discussion of other factors that may affect our ability to dispose of certain assets, see Part I, Item 1A. “Risk Factors.”
Furthermore, as described in Part I, Item 1A. “Risk Factors—Tax indemnification obligations in the event that we sell certain properties could limit our operating flexibility,” we agreed to indemnify Master Investments and Mr. Maguire against adverse tax consequences to them in the event that our Operating Partnership directly or
58
indirectly sells, exchanges or otherwise disposes (including by way of merger, sale of assets or otherwise) of any portion of its interests, in a taxable transaction. These tax indemnification obligations cover five of the office properties in our portfolio, which represented 37.8% of our Effective Portfolio’s aggregate annualized rent as of December 31, 2008. These obligations apply for periods of up to 12 years from the date that these properties were contributed to our Operating Partnership at the time of our initial public offering in June 2003. The tax indemnification obligations may serve to prevent the disposition of the following assets that might otherwise provide liquidity alternatives to us:
| | • | | Plaza Las Fuentes (excluding the Westin® Pasadena Hotel). |
Contribution of Existing Assets to Joint Ventures –
We are currently partners with Macquarie Office Trust and DH Von Karman, LLC in joint ventures. In 2009, we may seek to raise capital through contributing one or more of our existing assets into a joint venture with a third party. Investments in joint ventures may, under certain circumstances, involve risks not present were a third party not involved, as described in Part I, Item 1A. “Risk Factors—Joint venture investments, including our joint venture with Macquarie Office Trust, could be adversely affected by our lack of sole decision-making authority, our reliance on co-venturers’ financial condition and disputes between us and our co-venturers.” Our ability to successfully identify, negotiate and close joint venture transactions on acceptable terms or at all is highly uncertain in the current economic environment.
Proceeds from Additional Secured or Unsecured Debt Financings –
We have historically financed our asset acquisitions and operations largely from secured debt financings. We currently do not have any arrangements for future financings. Substantially all of our assets are currently encumbered, and most of our existing debt arrangements contain rates and other terms that are unlikely to be obtained in the market at this time. Given the current severely limited access to credit, it will also be challenging to obtain any significant unsecured financings in the near term.
Proceeds from Public or Private Issuance of Debt or Equity Securities –
While we currently have no plans for the public or private issuance of debt or equity securities, we may explore this liquidity source in 2009. The capitals markets have seen minimal activity in 2008 and in the first quarter of 2009, and we may not be able to raise cash through the issuance of securities on favorable terms or at all.
Actual and Potential Uses of Liquidity –
The following are the projected uses, and some of the potential uses, of our cash in 2009. Because of the current uncertainty in the real estate market and the economy as a whole, there may be other uses of our cash that are unexpected (and that are not identified below).
Property Operations and Corporate Expenses –
Management is focused on a careful and efficient use of cash to fund property operating and corporate expenses. All business units underwent a thorough budgeting process in the fourth quarter of 2008 to allow for
59
support of the Company’s 2009 business plan while preserving capital. In particular, management has taken various steps to reduce general and administrative expenses for 2009. Regardless of these efforts, operating our properties and our business requires a significant amount of capital.
Capital Expenditures and Leasing Costs (Including Commissions and Tenant Improvements) –
Capital expenditures fluctuate in any given period, subject to the nature, extent and timing of improvements required to maintain our properties. Leasing costs also fluctuate in any given period, depending upon such factors as the type of property, the term of the lease, the type of lease, the involvement of external leasing agents and overall market conditions. Our costs for capital expenditures and leasing fall into two categories: (1) amounts that we are contractually obligated to spend, and (2) discretionary amounts.
As of December 31, 2008, we have executed leases that contractually commit us to pay approximately $63.8 million in unpaid leasing costs, of which approximately $5.6 million is contractually due in 2010, $4.4 million in 2011 and $7.5 million in 2012 and beyond. The remaining $46.3 million is contractually available for payment to tenants upon request during 2009, but actual payment is largely determined by the timing of requests from those tenants. Depending on leasing activity, we expect to become contractually obligated to spend an additional $40 million to $60 million in capital expenditures and leasing costs during 2009 (excluding construction in progress, discussed below). The amounts we ultimately will incur will depend on the individual leases that we enter into.
As part of our effort to preserve cash, we intend to limit the amount of funds allocated to discretionary capital expenditures and leasing costs in 2009. Given the current economic environment, this is likely to result in a decrease in the number of leases we execute and in average rental rates.
As included in the summary table of available leasing reserves shown above, we have approximately $131.0 million in available leasing reserves as of December 31, 2008. We believe these reserves are adequate to pay up to $45.0 million in existing obligations, which tenants can contractually require us to fund prior to December 31, 2009, with remaining reserves that can fund between approximately 1.4 million to 1.7 million square feet of leasing costs assuming a rate of $50.00 to $60.00 per square foot. We incurred approximately $40 per square foot, $24 per square foot and $32 per square foot in leasing costs on new and renewal leases executed during 2008, 2007 and 2006, respectively. Actual leasing costs incurred will fluctuate as described above. Future leasing costs anticipated to be incurred at our recently completed development projects will be higher than our historical averages on a per square foot basis, as these projects require the build out of raw space. However, we expect to fund the majority of these costs through construction loan proceeds.
Development and Redevelopment Costs –
We continually evaluate the size, timing, costs and scope of our development and redevelopment programs and, as necessary, scale activity to reflect our financial position, overall economic conditions and the real estate fundamentals that exist in our submarkets. We intend to limit the amount of cash allocated to discretionary development and redevelopment projects in 2009. We currently have two office projects in various stages of development, both of which are being funded by construction loans: the Lantana Media Campus and 207 Goode. The total amount of the construction loan for Lantana Media Campus is $88.0 million, of which $79.9 million was drawn as of December 31, 2008, leaving $8.1 million available for future draws. The Lantana East building is expected to be delivered during the first quarter of 2009. The total amount of the construction loan for 207 Goode is $64.5 million, of which $34.1 million was drawn as of December 31, 2008, leaving approximately $30.4 million available for future construction funding. The 207 Goode project is expected to be delivered during the second half of 2009. We also have approximately $37.3 million available under our 3161 Michelson, 17885 Von Karman and 2385 Northside Drive construction loans, funds which are primarily available for anticipated leasing costs. The timing of our construction expenditures may fluctuate given the actual
60
progress and status of the development properties and leasing activity. We believe that the undrawn construction loans available as of December 31, 2008 will be sufficient to substantially cover remaining development and tenanting costs.
Debt Service and Principal Payment Obligations –
As of December 31, 2008, we had approximately $4.9 billion of total consolidated debt. Our substantial indebtedness requires us to use a material portion of our cash flow to service principal and interest on our debt, which limits the cash flow available for other business expenses or opportunities. Our debt maturities also present significant future cash obligations. By extending the maturities of our 3161 Michelson and 17885 Von Karman construction loans in September 2008, we addressed our debt maturities for 2008. We also extended our 2385 Northside Drive construction loan and our City Parkway and Brea Corporate Place and Brea Financial Commons mortgage loans during 2008, which were scheduled to mature in 2009. We may not be able to successfully extend, refinance or repay our remaining debt due to a number of factors, including decreased property valuations, limited availability of credit and deteriorating economic conditions. For a further discussion of our debt’s effect on our financial condition and operating flexibility, see Part I, Item 1A. “Risk Factors.”
A summary of our debt maturing in 2009 and 2010 is as follows (in millions):
| | | | | | | | |
| | | 2009 | | 2010 | | Maturity Date if
Fully Extended |
Repurchase facility | | $ | 10.0 | | $ | 10.0 | | |
Construction loans: | | | | | | | | |
3161 Michelson | | | 168.7 | | | — | | 2011 |
Lantana Media Campus | | | 79.9 | | | — | | 2010 |
17885 Von Karman | | | — | | | 24.1 | | |
2385 Northside Drive | | | — | | | 14.0 | | |
207 Goode | | | — | | | 34.1 | | 2011 |
Mortgage loans: | | | | | | | | |
Plaza Las Fuentes | | | — | | | 98.6 | | 2013 |
Griffin Towers | | | — | | | 125.0 | | 2011 |
500-600 City Parkway | | | — | | | 98.8 | | 2012 |
Brea Corporate Place/Brea Financial Commons | | | — | | | 109.0 | | 2012 |
Lantana Media Campus | | | — | | | 98.0 | | |
Other regular principal payments | | | 2.5 | | | 3.5 | | |
| | | | | | | | |
| | $ | 261.1 | | $ | 615.1 | | |
| | | | | | | | |
We are currently endeavoring to sell the properties subject to the indebtedness that matures in 2009. Failure to sell these properties, or alternatively, to extend or refinance such debt as it comes due, or a failure to satisfy the conditions and requirements of such debt, could result in an event of default that could potentially allow lenders to accelerate such debt. In addition, although most of our property-level indebtedness is non-recourse, our Operating Partnership has several potential contingent obligations described in Item 7. “Management’s Discussion and Analysis of Financial Condition and Results of Operations – Indebtedness – Operating Partnership Contingent Obligations.” If our debt is accelerated, our assets may not be sufficient to repay such debt in full, and our available cash flow may not be adequate to maintain our current operations. If we are unable to refinance or repay our debt as it comes due and maintain sufficient cash flow, our business, financial condition, results of operations and common stock price will be materially and adversely affected and we could become insolvent.
Furthermore, even if we are able to extend or refinance our existing debt, the terms of the extensions or refinancings may include operational and financial covenants significantly more restrictive than our current debt
61
covenants. Any such extensions or refinancings will also require us to pay certain fees to, and expenses of, our lenders. These fees and cash flow restrictions will affect our ability of fund our other liquidity uses.
We have financial covenants under many existing loan agreements. The terms of the 3161 Michelson construction loan and the Plaza Las Fuentes mortgage require our Operating Partnership to comply with financial ratios relating to minimum amounts of tangible net worth, interest coverage, fixed charge coverage, liquidity and maximum leverage. Certain of our other construction loans require our Operating Partnership to comply with minimum amounts of tangible net worth and liquidity. We also have significant covenants in other loan agreements, including: (1) that we will not engage in certain types of transactions without lender consent unless our stock is listed on the NYSE and/or another nationally recognized stock exchange (see Part I, Item 1A. “Risk Factors—If our common stock is delisted from the NYSE, there could be a negative effect on our business that could impact our financial condition, results of operations and ability to service our debt obligations”); (2) a minimum net worth requirement for the Operating Partnership; and (3) receipt of an unqualified audit opinion on our annual financial statements. Although we were in compliance with these covenants as of December 31, 2008, some of the actions we may take in connection with our liquidity situation or other circumstances outside of our control could result in non-compliance under one or more of these covenants. We are taking active steps to address any potential non-compliance issues, and any modifications to the covenants would likely require a payment by us to secure lender approval. No assurance can be given that we will be able to secure modifications to the covenants on terms acceptable to us or at all. The impact of non-compliance varies based on the terms of the applicable loan, but in some cases could result in the acceleration of a significant financial obligation.
Swap Obligations –
KPMG Tower –
We hold an interest rate swap agreement with a notional amount of $425.0 million, under which we are the fixed-rate payer at a rate of 5.564% per annum and we receive one-month LIBOR from our counterparty, an AA- rated financial institution. The swap requires net settlement on the 9th of each month and expires on August 9, 2012. We are required to post collateral with our counterparty, primarily in the form of cash, to the extent that the termination value of the swap exceeds a $5.0 million obligation (“Swap Liability”). As of December 31, 2008 and 2007, the Swap Liability was $55.1 million and $28.7 million, respectively, which is included in accounts payable and other liabilities in the consolidated balance sheets. As of December 31, 2008 and 2007, we had transferred $54.2 million and $20.0 million in cash, respectively, to our counterparty to satisfy our collateral posting requirement under the swap, which is included in restricted cash in the consolidated balance sheets. This collateral will be returned to us during the remaining term of the swap agreement as we settle our monthly obligations.
The increase in the KPMG Tower swap liability during 2008, along with an increase in our requirement to post cash collateral, was driven by the significant decrease in both actual LIBOR rates during 2008 as well as market expectations towards future LIBOR rates as of December 31, 2008 as compared to December 31, 2007. Future changes in both actual and expected LIBOR rates will continue to have a significant impact on both our Swap Liability as well as our requirement to either post additional cash collateral or receive a return of previously-posted cash collateral. As of December 31, 2008 and 2007, one-month LIBOR was 0.44% and 4.60%, respectively. As of December 31, 2008, each 0.25% weighted average decrease in future expected LIBOR rates during the remaining swap term would result in the requirement to post approximately $4 million in additional cash collateral, while each 0.25% weighted average increase in future expected LIBOR rates during the remaining swap term would result in the return to us of approximately $4 million in cash collateral from our counterparty. Accordingly, movements in future expected LIBOR rates will require us to either post additional cash collateral or receive a refund of previously-posted cash collateral during 2009.
Excluding the impact of movements in future LIBOR rates, our Swap Liability will also decrease each month as we settle our monthly obligations, and accordingly we will receive a return of previously posted cash
62
collateral. During 2009, we expect to receive a return of approximately $15 million to $20 million of posted cash collateral from our counterparty, which is comprised of a combination of return of collateral as a result of the satisfaction of our monthly obligations under the swap agreement, as well as a return of cash collateral due to the anticipated increase in LIBOR rates during 2009.
Lantana Media Campus Construction Loan –
We hold a forward starting interest rate swap agreement with a notional amount of $88.0 million, under which we are the fixed-rate payer at a rate of 5.883% per annum and we will receive three-month LIBOR from our counterparty, an A+ rated financial institution. The swap commences on June 19, 2009 and has a ten-year term. There is no collateral posting requirement under this swap agreement. However, the swap has a mandatory early termination date of September 19, 2009, at which point we will either pay to or receive from our counterparty, the termination value under the swap. As of December 31, 2008 and 2007, the termination value was a liability of $17.7 million and $6.6 million, respectively, which is included in accounts payable and other in the consolidated balance sheets. As of December 31, 2008, each 0.25% weighted average decrease in future expected LIBOR rates during the remaining swap term will result in a $2 million increase in the termination value of the swap, while each 0.25% weighted average increase in future expected LIBOR rates during the remaining swap term will result in a $2 million decrease in the termination value of the swap. Accordingly, movements in future expected LIBOR rates may have a significant impact on the ultimate termination payment we make in September 2009.
Distributions to Common and Preferred Stockholders and Unit Holders –
We are required to distribute 90% of our REIT taxable income (excluding capital gains) on an annual basis in order to qualify as a REIT for federal income tax purposes. We have historically funded a portion of our distributions from borrowings, and have distributed amounts in excess of our REIT taxable income. We may be required to use future borrowings, if necessary, to meet REIT distribution requirements and maintain our REIT status. We consider market factors and our performance in addition to REIT requirements in determining distribution levels. As of December 31, 2008, our parent REIT entity has a net operating loss carryforward of approximately $270 million. Unless we generate significant net operating income through asset dispositions, we do not expect the need to pay distributions to our stockholders during 2009 to maintain our REIT status.
From the date of our initial public offering on June 27, 2003 through December 31, 2007, we paid quarterly dividends on our common stock and Operating Partnership units at a rate of $0.40 per common share and unit, equivalent to an annual rate of $1.60 per common share and Operating Partnership unit. The board of directors did not declare a dividend on our common stock during 2008.
From January 23, 2004 until October 31, 2008, we paid quarterly dividends on our Series A Preferred Stock at a rate of $0.4766 per share of preferred stock. On December 19, 2008, our board of directors, as part of its capital management initiatives, suspended the payment of dividends on our Series A Preferred Stock. Dividends on our Series A Preferred Stock are cumulative, and therefore, will continue to accrue at an annual rate of $1.9064 per share.
All distributions to preferred stockholders, common stockholders and Operating Partnership unit holders are at the discretion of the board of directors, and no assurance can be given as to the amounts or timing of future distributions.
63
Cash Flow
The following summary discussion of our cash flow is based on the consolidated statements of cash flows in Item 8. “Financial Statements and Supplementary Data” and is not meant to be an all-inclusive discussion of the changes in our cash flow for the periods presented below.
| | | | | | | | | | | | |
| | | For the Year Ended
December 31, | | | Increase/
Decrease | |
| | | 2008 | | | 2007 | | |
| | | (In thousands) | |
Net cash (used in) provided by operating activities | | $ | (42,658 | ) | | $ | 45,742 | | | $ | (88,400 | ) |
Net cash used in investing activities | | | (138,759 | ) | | | (2,635,790 | ) | | | (2,497,031 | ) |
Net cash provided by financing activities | | | 87,072 | | | | 2,663,772 | | | | (2,575,697 | ) |
Comparison of Cash Flows for 2008 and 2007
Net cash used in operating activities during 2008 was $42.7 million compared to net cash provided by operating activities of $45.7 million during 2007. Our cash flow from operating activities decreased $88.4 million, mainly due to our net loss during 2008 combined with a decrease in working capital.
Net cash used in investing activities was $138.8 million during 2008 compared to $2.6 billion during 2007. During 2008, our primary use of cash was for improvements to real estate, partially offset by proceeds from the disposition of 1920 and 2010 Main Plaza and a net reduction in restricted cash balances resulting mainly from the transfer of restricted cash balances to the buyers of 1920 and 2010 Main Plaza and City Plaza. The Blackstone Transaction, valued at $2.875 billion, was the primary use of cash for investing activities during 2007. Net proceeds of $663.5 million from the sale of office properties and development sites, eleven of which were acquired as part of the Blackstone Transaction, along with the disposition of Wateridge Plaza, Regents Square and Pacific Center, partially offset the impact of the Blackstone Transaction on cash flow used in investing activities during 2007.
Net cash flow provided by financing activities was $87.1 million during 2008 as compared to $2.7 billion during 2007. Proceeds from the Plaza Las Fuentes mortgage loan, additional borrowings on the KPMG Tower mortgage and net construction loan draws, partially offset by the net effect of a paydown of $20.0 million from the refinancing of the Griffin Towers mortgage, were the primary factors in the net cash provided by financing activities during 2008. Financing activities during 2007 related to the Blackstone Transaction, including fixed- and floating-rate mortgage loans totaling $2.28 billion, a bridge loan of $223.0 million, and a $400.0 million term loan, as well as net proceeds from the refinancing of the mortgage loans related to the Wells Fargo and KPMG Towers were the sources of financing cash flow during this period. These increases were partially offset by principal repayments on mortgage loans due to property dispositions, and full repayment of the bridge mortgage and term loans with proceeds received from property dispositions and, to a lesser extent, the KPMG Tower refinancing.
Development Properties
As of December 31, 2008, we had two projects under construction:
| | • | | Our project at the Lantana Media Campus (East building), a 66,000 square foot office building located in Santa Monica, California; and |
| | • | | Our project at 207 Goode Avenue, an eight-story, 189,000 square foot office building located in Glendale, California. |
Land cost related to these projects was $20.6 million as of December 31, 2008. The total estimated construction budget (excluding land) for these projects is approximately $100.5 million, of which $73.5 million
64
has been incurred as of December 31, 2008. We expect the funding for these projects to be provided from our existing construction loans.
We have a proactive planning process by which we continually evaluate the size, timing and scope of our development programs and, as necessary, scale activity to reflect the economic conditions and the real estate fundamentals that exist in our strategic submarkets. Based on current conditions, we expect to engage in limited new development activities and otherwise reduce or defer discretionary development costs in the near term. We may be unable to lease committed development projects at expected rental rates or within projected time frames or complete projects on schedule or within budgeted amounts, which could adversely affect our financial condition, results of operations and cash flow.
During 2008, we completed the following development projects:
| | • | | 17885 Von Karman, a 151,370 square foot office building located in Irvine, California; |
| | • | | 2385 Northside Drive, an 88,795 square foot office building with 128,000 square feet of structured parking located at the Mission City Corporate Center in San Diego, California; and |
| | • | | Lantana South, a 132,976 square foot office building located in Santa Monica, California. |
As we lease these properties to stabilization, we will continue to incur tenant improvement and leasing commission costs, which will be funded through our existing construction loans.
We also own undeveloped land adjacent to certain of our other properties, primarily located in the downtown Los Angeles, the Tri-Cities, Orange County and San Diego County submarkets that we believe can support approximately 8 million net rentable square feet of office, retail, hotel and residential uses as well as 8 million square feet of structured parking.
Investment in Unconsolidated Joint Ventures
Maguire Macquarie Office, LLC
We own a 20% interest in our joint venture with Macquarie Office Trust and are responsible for the day-to-day operations of the properties owned by the joint venture. We receive fees for asset management, property management (after January 5, 2009), leasing, construction management, acquisitions, dispositions and financing.
DH Von Karman Maguire, LLC
We hold a 1% common equity interest and a 2% preferred interest in DH Von Karman Maguire, LLC.
Outcome of Strategic Review Process and Resulting Management Changes
During the second quarter of 2008, the Special Committee of our board of directors concluded their review of strategic alternatives for our company. The costs incurred related to this review totaled $8.3 million, mainly comprised of investment banking, legal and other professional fees, are included as part of general and administrative in our consolidated statements of operations.
During 2008, we recorded $15.6 million of costs in connection with the management changes that occurred in the second quarter of 2008, primarily contractual separation obligations for our former senior executives, and exit costs and tenant improvement writeoffs related to the 1733 Ocean lease and the Rand sub-lease. These costs are included as part of general and administrative in our consolidated statement of operations. Of these costs, $16.7 million represent cash charges, $1.6 million is a non-cash writeoff of tenant improvements, and $(2.7) million is a non-cash reversal of previously recorded stock-based compensation costs, net of non-cash compensation cost related to accelerated vesting of restricted stock.
65
Off Balance Sheet Items
We do not have any off-balance sheet arrangements that we believe have or are reasonably likely to have a material effect on our financial condition, results of operations, liquidity or capital resources.
Contractual Obligations
The following table provides information with respect to our commitments at December 31, 2008, including any guaranteed or minimum commitments under contractual obligations. The table does not reflect available debt extension options.
| | | | | | | | | | | | | | | | | | | | | |
| | | 2009 | | 2010 | | 2011 | | 2012 | | 2013 | | Thereafter | | Total |
| | | (In thousands) |
Principal payments on mortgage loans— | | | | | | | | | | | | | | | | | | | | | |
Continuing operations | | $ | 92,419 | | $ | 615,119 | | $ | 38,627 | | $ | 819,286 | | $ | 532,477 | | $ | 2,616,162 | | $ | 4,714,090 |
Assets held for sale(1) | | | 168,719 | | | — | | | — | | | — | | | — | | | — | | | 168,719 |
Our share of unconsolidated joint venture(2) | | | 597 | | | 27,885 | | | 21,393 | | | 266 | | | 281 | | | 110,998 | | | 161,420 |
Interest payments— | | | | | | | | | | | | | | | | | | | | | |
Continuing operations— fixed—rate (3) | | | 207,067 | | | 202,113 | | | 200,074 | | | 182,517 | | | 168,034 | | | 436,314 | | | 1,396,119 |
Continuing operations— variable-rate (4) | | | 51,561 | | | 38,684 | | | 29,266 | | | 22,488 | | | — | | | — | | | 141,999 |
Assets held for sale—variable-rate(1),(4) | | | 4,364 | | | — | | | — | | | — | | | — | | | — | | | 4,364 |
Our share of unconsolidated joint venture(2) | | | 8,592 | | | 8,563 | | | 7,219 | | | 6,124 | | | 6,095 | | | 9,410 | | | 46,003 |
Capital leases(5)— | | | | | | | | | | | | | | | | | | | | | |
Consolidated | | | 1,749 | | | 1,265 | | | 596 | | | 348 | | | 266 | | | 489 | | | 4,713 |
Our share of unconsolidated joint venture(2) | | | 23 | | | 24 | | | 23 | | | 24 | | | 4 | | | — | | | 98 |
Operating leases(6) | | | 1,528 | | | 1,571 | | | 1,609 | | | 1,658 | | | 1,311 | | | 2,897 | | | 10,574 |
Property disposition obligations(7) | | | 1,495 | | | 418 | | | 418 | | | 308 | | | 383 | | | 105 | | | 3,127 |
Tenant-related commitments(8)— | | | | | | | | | | | | | | | | | | | | | |
Continuing operations | | | 35,412 | | | 5,635 | | | 2,256 | | | 3,704 | | | 245 | | | 3,496 | | | 50,748 |
Assets held for sale(1) | | | 10,887 | | | — | | | 2,151 | | | — | | | — | | | — | | | 13,038 |
Our share of unconsolidated joint venture(2) | | | 2,125 | | | 5 | | | 12 | | | 12 | | | — | | | — | | | 2,154 |
Construction obligations(9) | | | 9,782 | | | — | | | — | | | — | | | — | | | — | | | 9,782 |
Parking easement obligations(10) | | | 1,515 | | | 1,416 | | | 1,233 | | | — | | | — | | | — | | | 4,164 |
Air space and ground leases(11)— | | | | | | | | | | | | | | | | | | | | | |
Consolidated | | | 3,330 | | | 3,330 | | | 3,330 | | | 3,330 | | | 3,330 | | | 349,212 | | | 365,862 |
Our share of unconsolidated joint venture(2),(12) | | | 261 | | | 261 | | | 261 | | | 261 | | | 261 | | | 25,613 | | | 26,918 |
| | | | | | | | | | | | | | | | | | | | | |
| | $ | 601,426 | | $ | 906,289 | | $ | 308,468 | | $ | 1,040,326 | | $ | 712,687 | | $ | 3,554,696 | | $ | 7,123,892 |
| | | | | | | | | | | | | | | | | | | | | |
| (1) | Amounts shown relate to our 3161 Michelson property which is classified as held for sale as of December 31, 2008. |
| (2) | Our share of the unconsolidated Maguire Macquarie joint venture debt is 20%. |
| (3) | The interest payments on our fixed-rate debt are calculated based on contractual interest rates and scheduled maturity dates. |
| (4) | The interest payments on our variable-rate debt are calculated based on scheduled maturity dates and the one-month LIBOR rate of 0.44% as of December 31, 2008 plus the contractual spread per the loan agreement, except for the 17885 Von Karman and 2385 Northside Drive construction loans which are calculated using the prime rate of 3.25% as of December 31, 2008. |
| (5) | Includes interest and principal payments. |
| (6) | Includes operating lease obligations for office space at 1733 Ocean. |
| (7) | Includes master lease and tenant obligations related to our joint venture. |
| (8) | Tenant-related commitments are based on executed leases as of December 31, 2008. Excludes a $5.1 million lease takeover obligation which we have mitigated through a sub-lease of that space to a third-party tenant. |
| (9) | Based on executed contracts with general contractors as of December 31, 2008. |
| (10) | Includes payments required under the amended parking easement for the 808 South Olive garage. |
66
| (11) | Includes an air lease for Plaza Las Fuentes and ground leases for Two California Plaza and Brea Corporate Place. The air space rent for Plaza Las Fuentes and ground rent for Two California Plaza are calculated through their lease expiration dates in years 2017 and 2082, respectively. The ground rent for Brea Corporate Place is calculated through the year of first reappraisal. |
| (12) | Includes ground leases for One California Plaza and Cerritos Corporate Center which are calculated through their lease expiration dates in years 2082 and 2098, respectively. |
Related Party Transactions
Nelson C. Rising
At the time of our initial public offering, we entered into a tax indemnification agreement with Master Investments, an entity in which Mr. Rising has a minority interest. Under this agreement, we agreed not to dispose of US Bank Tower, Wells Fargo Tower, KPMG Tower, Gas Company Tower and Plaza Las Fuentes (excluding the hotel) during the lock-out period. We also agreed to indemnify Master Investments and its members from all direct and indirect tax consequences if any of these properties were sold during the lock-out period. The lock-out period does not apply if a property is disposed of in a non-taxable transaction (i.e., Section 1031 exchange). In connection with the tax indemnification agreement, Master Investments has also guaranteed a portion of our mortgage loans. As of December 31, 2008 and 2007, $65.0 million of our debt is subject to such guarantees by Master Investments.
Robert F. Maguire III
Pursuant to a separation agreement effective May 17, 2008, Mr. Maguire resigned as the Chief Executive Officer and Chairman of the Board of the Company. In accordance with the terms of his separation agreement, Mr. Maguire received a lump-sum cash severance payment of $2.8 million. Also pursuant to the separation agreement, Mr. Maguire is entitled to serve as the Company’s Chairman Emeritus through May 2010, after which the arrangement may be terminated by the Company. Such position does not entitle Mr. Maguire to any authority or responsibility with respect to the management or operation of the Company. For as long as Mr. Maguire serves as Chairman Emeritus, he is entitled to receive $750.0 thousand per year to defray the costs of maintaining an office in a location other than the Company’s offices and the cost of services of two assistants and a personal driver. During 2008, we recorded $4.4 million of charges in connection with the entry into the separation agreement. As of December 31, 2008, the balance due to Mr. Maguire under these agreements totals $0.8 million.
On May 17, 2008, Mr. Maguire also entered into a consulting agreement with the Company for a term of two years, with a termination payment due for earlier termination by the Company. Pursuant to this agreement, Mr. Maguire is entitled to receive $10.0 thousand per month plus reimbursement of reasonable expenses incurred. During 2008, we recorded $0.2 million of charges in connection with this agreement. As of December 31, 2008, the balance due to Mr. Maguire under this agreement totals $0.2 million.
Pursuant to the terms of his separation agreement, Mr. Maguire and the Company terminated certain property management and service contracts under which the Company or its subsidiaries provided property management, operating, maintenance, repair and/or leasing services in return for management fees, leasing commissions and reimbursement of actual direct costs and expenses incurred by the Company or its subsidiaries, as applicable.
Prior to the termination of his employment, Mr. Maguire, entities controlled by him and the Company were parties to an insurance sharing agreement whereby certain properties owned by entities controlled by him shared coverage with Company properties under a blanket insurance policy. Per the terms of his separation agreement, Mr. Maguire’s properties were removed from the Company’s insurance policies as of June 27, 2008.
Prior to Mr. Maguire’s termination of employment, we leased office space located at 1733 Ocean in Santa Monica, California, a property beneficially owned by Mr. Maguire. In June 2008, we relocated our
67
corporate offices to downtown Los Angeles, California and vacated the space at 1733 Ocean. Pursuant to his separation agreement, Mr. Maguire agreed to use his best efforts for a period of 180 days to obtain the necessary consents to terminate the direct lease and, if such consents were not obtained, to take certain actions to facilitate our Operating Partnership’s efforts to sublet those premises. Mr. Maguire did not obtain the necessary consents within the 180-day period. During 2008, we accrued $2.0 million for management’s best estimate of the leasing commissions and tenant improvements to be paid to sub-lease the direct space and the differential between: (i) the rent we are contractually obligated to pay Mr. Maguire until the lease for the fourth floor expires in 2016 and (ii) the rent we expect to receive upon sub-leasing the space. As of December 31, 2008, $1.7 million is available to pay for leasing commissions, tenant improvements and rent related to this space.
At the time of our initial public offering, we entered into a tax indemnification agreement with Mr. Maguire. Under this agreement, we agreed not to dispose of US Bank Tower, Wells Fargo Tower, KPMG Tower, Gas Company Tower and Plaza Las Fuentes (excluding the hotel) during the lock-out period as long as certain conditions under Mr. Maguire’s contribution agreement were met. We agreed to indemnify Mr. Maguire from all direct and indirect tax consequences if any of these properties were sold during the lock-out period. The lock-out period does not apply if a property is disposed of in a non-taxable transaction (i.e., Section 1031 exchange). Mr. Maguire’s separation agreement modified his tax indemnification agreement. As modified, for purposes of determining whether Mr. Maguire and related entities maintain ownership of Operating Partnership units equal to 50% of the units received by them in the formation transactions (which is a condition to the continuation of the lock-out period to its maximum length), shares of our common stock received by Mr. Maguire in exchange for Operating Partnership units in accordance with Section 8.6B of the Amended and Restated Agreement of Limited Partnership of Maguire Properties, L.P., as amended, shall be treated as Operating Partnership units received in the formation transactions. As of December 31, 2008, Mr. Maguire meets the 50% ownership requirement.
In connection with the tax indemnification agreement, Mr. Maguire and certain entities owned or controlled by Mr. Maguire, and entities controlled by certain former senior executives of the Maguire Properties predecessor have guaranteed a portion of our mortgage loans. As of December 31, 2008 and 2007, $591.8 million of our debt is subject to such guarantees.
A summary of our transactions and balances with Mr. Maguire related to agreements in place prior to his termination of employment is as follows (in thousands):
| | | | | | | | | |
| | | For the Year Ended
December 31, |
| | | 2008 | | 2007 | | 2006 |
Management and development fees and leasing commissions | | $ | 1,005 | | $ | 2,352 | | $ | 3,359 |
Rent payments | | | 771 | | | 702 | | | 316 |
| | | | | | |
| | | December 31,
2008 | | December 31,
2007 |
Accounts receivable | | $ | — | | $ | 202 |
Fees and commissions earned from Mr. Maguire are included in management, leasing and development services in our consolidated statements of operations. Balances due from Mr. Maguire are included in due from affiliates in the consolidated balance sheets.
68
Joint Venture with Macquarie Office Trust
We earn management and investment advisory fees and leasing commissions from our joint venture with Macquarie Office Trust. A summary of our transactions and balances with the joint venture is as follows (in thousands):
| | | | | | | | | |
| | | For the Year Ended
December 31, |
| | | 2008 | | 2007 | | 2006 |
Management and development fees and leasing commissions | | $ | 5,534 | | $ | 6,669 | | $ | 4,509 |
| | | | | | | | |
| | | December 31,
2008 | | | December 31,
2007 | |
Accounts receivable | | $ | 1,665 | | | $ | 1,538 | |
Accounts payable | | | (78 | ) | | | (80 | ) |
| | | | | | | | |
| | $ | 1,587 | | | $ | 1,458 | |
| | | | | | | | |
Fees and commissions earned from the joint venture are included in management, leasing and development services in our consolidated statements of operations. Balances due from the joint venture are included in due from affiliates while balances due to the joint venture are included in accounts payable and other liabilities in the consolidated balance sheets. The joint venture’s balances were current as of December 31, 2008 and 2007.
Litigation
We are involved in various litigation and other legal matters, including personal injury claims and administrative proceedings, which we are addressing or defending in the ordinary course of business. Management believes that any liability that may potentially arise upon resolution of such matters will not have a material adverse effect on our business, financial condition or results of operations.
Critical Accounting Policies
Investments in Real Estate and Real Estate Entities including Property Acquisitions
The price that we pay to acquire a property is impacted by many factors, including the condition of the buildings and improvements, the occupancy of the building, the existence of above- and below-market tenant leases, the creditworthiness of the tenants, favorable or unfavorable financing, above- or below-market ground leases and numerous other factors. Accordingly, we are required to make subjective assessments to allocate the purchase price paid to acquire investments in real estate among the assets acquired and liabilities assumed based on our estimate of the fair values of such assets and liabilities. This includes determining the value of the buildings and improvements, land, any ground leases, tenant improvements, in-place tenant leases, tenant relationships, the value (or negative value) of above- (or below-) market leases and any debt assumed from the seller or loans made by the seller to us. Each of these estimates requires a great deal of judgment and some of the estimates involve complex calculations. Our calculation methodology is summarized in Item 8. “Financial Statements and Supplementary Data – Note 2 to Consolidated Financial Statements.” These allocation assessments have a direct impact on our results of operations because if we were to allocate more value to land there would be no depreciation with respect to such amount or if we were to allocate more value to the buildings as opposed to allocating to the value of tenant leases, this amount would be recognized as an expense over a much longer period of time, since the amounts allocated to buildings are depreciated over the estimated lives of the buildings whereas amounts allocated to tenant leases are amortized over the terms of the leases. Additionally, the amortization of value (or negative value) assigned to non-market rate leases is recorded as an adjustment to rental revenue as compared to amortization of the value of in-place leases and tenant relationships, which is included in depreciation and amortization in our consolidated statements of operations.
69
We are required to make subjective assessments as to the useful lives of our properties for purposes of determining the amount of depreciation to record on an annual basis with respect to our investments in real estate. These assessments have a direct impact on our net income because if we were to shorten the expected useful lives of our investments in real estate we would depreciate such investments over fewer years, resulting in more depreciation expense and lower net income on an annual basis.
Impairment Evaluation
In accordance with Statement of Financial Accounting Standards (“SFAS”) No. 144,Accounting for Impairment or Disposal of Long-Lived Assets, we assess whether there has been impairment in the value of our investments in real estate whenever events or changes in circumstances indicate the carrying amount of an asset may not be recoverable. Our portfolio is evaluated for impairment on a property-by-property basis. Indicators of potential impairment include the following:
| | • | | Change in strategy resulting in an increased or decreased holding period; |
| | • | | Deterioration of the rental market as evidenced by rent decreases over numerous quarters; |
| | • | | Properties adjacent to or located in the same submarket as those with recent impairment issues; |
| | • | | Significant decrease in market price; |
| | • | | Tenant financial problems; and/or |
| | • | | Experience of our competitors in the same submarket. |
During 2008, we recorded non-cash impairment charges totaling $123.7 million. Of these charges, $73.7 million represents the fair value of 1920 and 2010 Main Plaza and City Plaza as of the date of their respective disposition as calculated based on the difference between their contractual sales prices and costs to sell and their carrying amounts. We also recorded a $50.0 million non-cash impairment charge based on the difference between the carrying amount of 3161 Michelson and its estimated fair value, less estimated costs to sell, as of December 31, 2008. We estimated the fair value of 3161 Michelson using a projected sales price analysis, incorporating available market information including indications of interest from third parties.
As of December 31, 2008, we also performed an impairment analysis on our properties that showed indications of potential impairment based on the indicators described above. Based on this analysis, no other real estate assets in our portfolio were determined to be impaired as of December 31, 2008.
The assessment as to whether our investments in real estate are impaired is highly subjective. The calculations involve management’s best estimate of the holding period, future occupancy levels, rental rates, capitalization rates, lease-up periods and capital requirements for each property. A change in any one or more of these factors could materially impact whether a property is impaired as of any given valuation date.
One of the more significant assumptions is probability weighting whereby management may contemplate more than one holding period in its test for impairment. These scenarios can include long-, intermediate- and short-term holding periods which are probability weighted based on management’s best estimate of the likelihood of such a holding period as of the valuation date. A shift in the probability weighting towards a shorter hold scenario can increase the likelihood of impairment. Many factors may influence management’s estimate of holding periods, including market conditions, accessibility of capital and credit markets and recent sales activity of properties in the same submarket, among others. These conditions may change in a relatively short period of time, especially in light of the current economic environment. As a result, key assumptions used in testing the recoverability of our investments in real estate, particularly with respect to holding periods, can change period-over-period.
70
Revenue Recognition
We commence revenue recognition on our leases based on a number of factors. In most cases, revenue recognition begins when the lessee takes possession of or controls the physical use of the leased asset. Generally, this occurs on the lease commencement date. In determining what constitutes the leased asset, we evaluate whether we or the lessee is the owner, for accounting purposes, of the tenant improvements. If we are the owner, for accounting purposes, of the tenant improvements, then the leased asset is the finished space and revenue recognition begins when the lessee takes possession of the finished space, typically when the improvements are substantially complete. If we conclude we are not the owner, for accounting purposes, of the tenant improvements (the lessee is the owner), then the leased asset is the unimproved space and any tenant improvement allowances funded under the lease are treated as lease incentives which reduce revenue recognized over the term of the lease. In these circumstances, revenue recognition begins when the lessee takes possession of the unimproved space for the lessee to construct improvements. The determination of who is the owner, for accounting purposes, of the tenant improvements determines the nature of the leased asset and when revenue recognition under a lease begins. We consider a number of different factors to evaluate whether we or the lessee is the owner of the tenant improvements for accounting purposes. These factors include:
| | • | | Whether the lease stipulates how and on what a tenant improvement allowance may be spent; |
| | • | | Whether the tenant or landlord retain legal title to the improvements; |
| | • | | The uniqueness of the improvements; |
| | • | | The expected economic life of the tenant improvements relative to the length of the lease; and |
| | • | | Who constructs or directs the construction of the improvements. |
The determination of who owns the tenant improvements, for accounting purposes, is subject to significant judgment. In making that determination we consider all of the above factors. However, no one factor is determinative in reaching a conclusion.
All tenant leases are classified as operating leases, and minimum rents are recognized on a straight-line basis over the terms of the leases. The excess of rents recognized over amounts contractually due, pursuant to the underlying leases, is included in deferred rents, and contractually due but unpaid rents are included in rents and other receivables, net in the consolidated balance sheets.
We maintain an allowance for doubtful accounts for estimated losses resulting from the inability of tenants to make required rent payments. The computation of this allowance is based on the tenants’ payment history and current credit status, as well as certain industry or specific credit considerations. If estimates of collectibility differ from the cash received, then the timing and amount of our reported revenue could be impacted. When circumstances arise, such as the bankruptcy filing of a tenant, the allowance is reviewed for adequacy and adjusted to reflect the change in the estimated amount to be received from the tenant. Our credit risk is mitigated by the high quality of our existing tenant base, reviews of prospective tenant’s risk profiles prior to lease execution, and continual monitoring of our tenant portfolio to identify problem tenants.
Tenant reimbursements for real estate taxes, common area maintenance, and other recoverable costs are recognized in the period that the expenses are incurred.
Hotel operations revenue is recognized when services are rendered to guests.
Parking revenue is recognized in the period the revenue is earned.
Property management fees are based on a percentage of the revenue earned by a property under management and are recorded on a monthly basis as earned. Lease commission revenue is recognized when legally earned under the provisions of the underlying lease commission agreement with the landlord. Revenue
71
recognition generally occurs 50% upon lease signing, when the first half of the lease commission becomes legally payable with no right of refund, and 50% upon tenant move-in, when the second half of the lease commission becomes legally payable with no right of refund. In circumstances where the landlord has a right of refund or no legal obligation to pay if the tenant does not move in, we defer revenue recognition until the tenant moves in or the landlord no longer legally has a right of refund. Development fees are recognized as the real estate development services are rendered using the percentage-of-completion method of accounting.
Lease termination fees, which are included as part of interest and other in the consolidated statements of operations, are recognized when the related leases are canceled, the leased space has been vacated, and we have no continuing obligation to provide services to such former tenants. Upon a tenant’s agreement to terminate a lease early, we accelerate the remaining unamortized assets associated with the tenant through the termination date. These accelerated depreciation and amortization charges are included in depreciation and amortization in the consolidated statements of operations.
We must make subjective estimates related to when our revenue is earned and the collectibility of our accounts receivable related to minimum rent, deferred rent, expense reimbursements, lease termination fees and other income. We specifically analyze accounts receivable and historical bad debts, tenant concentrations, tenant creditworthiness, and current economic trends when evaluating the adequacy of the allowance for doubtful accounts receivable. These estimates have a direct impact on our net income because a higher bad debt allowance would result in lower net income, and recognizing rental revenue as earned in one period versus another would result in higher or lower net income for a particular period.
Effects of Inflation
Substantially all of our office leases provide for separate real estate tax and operating expense escalations. In addition, many of the leases provide for fixed base rent increases. We believe that inflationary increases may be at least partially offset by the contractual rent increases and expense escalations described above. Our hotel property is able to change room rates on a daily basis so the impact of higher inflation can often be passed on to customers. However, a weak economic environment may restrict our ability to raise room rates to offset rising costs.
New Accounting Pronouncements
SFAS No. 141R
In December 2007, the FASB issued SFAS No. 141R,Business Combinations, which replaces SFAS No. 141,Business Combinations. SFAS No. 141R applies to all transactions and other events in which one entity obtains control over one or more other businesses. It broadens the fair value measurement and recognition of assets acquired, liabilities assumed and interests transferred as a result of business combinations. Under this pronouncement, acquisition-related costs must be expensed rather than capitalized as part of the basis of the acquired. SFAS No. 141R also expands required disclosure to improve financial statement users’ the ability to evaluate the nature and financial effects of business combinations. SFAS No. 141R is effective for all transactions entered into on or after January 1, 2009. The adoption of this standard on January 1, 2009 could materially impact our future financial results to the extent that we acquire significant amounts of real estate, as related acquisition costs will be expensed as incurred compared to our current practice of capitalizing such costs and amortizing them over the estimated useful life of the assets acquired.
SFAS No. 160
In December 2007, the FASB issued SFAS No. 160,Noncontrolling Interests in Consolidated Financial Statements—An Amendment to ARB No. 51. SFAS No. 160 requires a noncontrolling interest in a subsidiary to be reported as equity and the amount of consolidated net income specifically attributable to the noncontrolling
72
interest to be identified in the consolidated financial statements. SFAS No. 160 also calls for consistency in the manner of reporting changes in the parent’s ownership interest and requires fair value measurement of any noncontrolling equity investment retained in a deconsolidation. SFAS No. 160 is effective on January 1, 2009. We are currently evaluating the impact SFAS No. 160 will have on our results of operations and financial condition.
SFAS No. 161
In March 2008, the FASB issued SFAS No. 161,Disclosures about Derivative Instruments and Hedging Activities—an amendment of FASB Statement No. 133. SFAS No. 161 amends and expands the disclosure requirements of SFAS No. 133,Accounting for Derivative Instruments and Hedging Activities, to provide financial statement users with an enhanced understanding of (a) how and why an entity uses derivative instruments, (b) how derivative instruments and related hedged items are accounting for under SFAS No. 133 and its related interpretations, and (c) how derivative instruments and related hedged items affect an entity’s financial position, financial performance and cash flows. SFAS No. 161 requires (a) qualitative disclosures about objectives for using derivative instruments classified by primary underlying risk exposure, (b) information about the volume of derivative activity, (c) tabular disclosures about the balance sheet location and fair value amounts of derivative instruments, income statement and other comprehensive (loss) income location and amounts of gains and losses on derivative instruments by type of contract, and (d) disclosures about credit risk-related contingent features in derivative agreements. SFAS No. 161 is effective for financial statements issued for fiscal years and interim periods beginning after November 15, 2008. We are currently evaluating the impact SFAS No. 161 will have on our results of operations and financial condition.
SFAS No. 162
In May 2008, the FASB issued SFAS No. 162,The Hierarchy of Generally Accepted Accounting Principles. SFAS No. 162 is intended to improve financial reporting by identifying a consistent framework, or hierarchy, for selecting accounting principles to be used in preparing financial statements that are presented in conformity with accounting principles generally accepted in the United States of America for nongovernmental entities. SFAS No. 162 is effective 60 days following the SEC’s approval of the Public Company Accounting Oversight Board’s related amendments to AU Section 411,The Meaning of Present Fairly in Conformity with Generally Accepted Accounting Principles. We do not expect the adoption of SFAS No. 162 to have an impact on our results of operations or financial condition.
Non-GAAP Supplemental Measure
FFO is a widely recognized measure of REIT performance. We calculate FFO as defined by NAREIT. FFO represents net income (loss) (as computed in accordance with GAAP), excluding gains from disposition of property (but including impairments and provisions for losses on property held for sale), plus real estate-related depreciation and amortization (including capitalized leasing costs and tenant allowances or improvements). Adjustments for our unconsolidated joint venture are calculated to reflect FFO on the same basis.
Management uses FFO as a supplemental performance measure because, in excluding real estate-related depreciation and amortization and gains from property dispositions, it provides a performance measure that, when compared year over year, captures trends in occupancy rates, rental rates and operating costs. We also believe that, as a widely recognized measure of the performance of REITs, FFO will be used by investors as a basis to compare our operating performance with that of other REITs.
However, because FFO excludes depreciation and amortization and captures neither the changes in the value of our properties that result from use or market conditions nor the level of capital expenditures and leasing commissions necessary to maintain the operating performance of our properties, all of which have real economic effect and could materially impact our results of operations, the utility of FFO as a measure of our performance is
73
limited. Other Equity REITs may not calculate FFO in accordance with the NAREIT definition and, accordingly, our FFO may not be comparable to such other Equity REITs’ FFO. As a result, FFO should be considered only as a supplement to net income as a measure of our performance. FFO should not be used as a measure of our liquidity, nor is it indicative of funds available to meet our cash needs, including our ability to pay dividends or make distributions. FFO also should not be used as a supplement to or substitute for cash flow from operating activities (as computed in accordance with GAAP).
A reconciliation of net (loss) income available to common stockholders to FFO is as follows (in thousands, except per share amounts):
| | | | | | | | | | | | |
| | | | | For the Year Ended December 31, |
| | | | | 2008 | | | 2007 | | 2006 |
Net (loss) income available to common stockholders | | $ | (328,048 | ) | | $ | 255 | | $ | 51,262 |
Add: | | Depreciation and amortization of real estate assets | | | 196,816 | | | | 207,577 | | | 144,350 |
| | Depreciation and amortization of real estate assets— unconsolidated joint ventures(1) | | | 9,559 | | | | 9,764 | | | 10,464 |
| | Minority interests | | | (14,354 | ) | | | 40 | | | 9,146 |
Deduct: | | Gain on sale of real estate | | | — | | | | 195,387 | | | 108,469 |
| | | | | | | | | | | | |
| | Funds from operations available to common stockholders and unit holders (FFO) | | $ | (136,027 | ) | | $ | 22,249 | | $ | 106,753 |
| | | | | | | | | | | | |
| | Company share of FFO(2) | | $ | (119,399 | ) | | $ | 19,226 | | $ | 91,916 |
| | | | | | | | | | | | |
| | FFO per share—basic | | $ | (2.51 | ) | | $ | 0.41 | | $ | 1.99 |
| | | | | | | | | | | | |
| | FFO per share—diluted | | $ | (2.51 | ) | | $ | 0.41 | | $ | 1.96 |
| | | | | | | | | | | | |
| (1) | Amount represents our 20% ownership interest in our joint venture with Macquarie Office Trust. |
| (2) | Based on a weighted average interest in our Operating Partnership of approximately 87.5%, 86.4% and 86.1% for 2008, 2007 and 2006, respectively. |
| Item 7A. | Quantitative and Qualitative Disclosures About Market Risk. |
Interest Rate Risk
Interest rate fluctuations may impact our results of operations and cash flow. Our construction loans as well as some of our mortgage loans bear interest at a variable rate. We seek to minimize the volatility that changes in interest rates have on our variable-rate debt by entering into interest rate swap and cap agreements with major financial institutions based on their credit rating and other factors. We do not trade in financial instruments for speculative purposes. Our derivatives are designated as cash flow hedges under SFAS No. 133,Accounting for Derivative Instruments and Hedging Activities.
As of December 31, 2008, approximately $1.2 billion, or 24.3%, of our consolidated debt bears interest at variable rates based on one-month LIBOR or Prime.
During 2008, we entered into the following contracts to help mitigate our exposure to interest rate risk on our variable-rate debt:
| | • | | An interest rate cap agreement for our 3161 Michelson construction loan which limits the LIBOR portion of the interest rate to 5.50% for 75% of the maximum available loan amount as of the date we extended the loan. The notional amount of the cap is $155.3 million, effective in September 2008, terminating in October 2009; |
| | • | | An interest rate cap agreement for our Griffin Towers mortgage that limits the LIBOR portion of the interest rate to 5.00% during the loan term. The notional amount of the cap is $125.0 million, effective in May 2008, terminating in May 2010; |
74
| | • | | An interest rate cap agreement for our City Parkway mortgage that limits the LIBOR portion of the interest rate to 6.00% during the loan term. The notional amount of the cap is $117.0 million, effective in May 2009, terminating in May 2010; |
| | • | | An interest rate cap agreement for our Brea Corporate Place and Brea Financial Commons mortgage that limits the LIBOR portion of the interest rate to 6.50% during the loan term. The notional amount of the cap is $109.0 million, effective in May 2009, terminating in May 2010; and |
| | • | | An interest rate cap agreement for our Plaza Las Fuentes mortgage that limits the LIBOR portion of the interest rate to 4.75% during the loan term. The notional amount of the cap is $100.0 million, effective in September 2008, terminating in October 2010. |
Our interest rate swap and cap agreements outstanding as of December 31, 2008 are as follows (in millions, except rates and date information):
| | | | | | | | | | | | | | |
| | | Notional
Value | | Strike
Rate | | | Effective
Date | | Expiration
Date | | Fair
Value | |
Interest rate swap | | $ | 425,000 | | 5.564 | % | | 9/9/2007 | | 8/9/2012 | | $ | (55,065 | ) |
Forward-starting interest rate swap | | | 88,000 | | 5.883 | % | | 6/19/2009 | | 6/19/2019 | | | (17,697 | ) |
Interest rate cap | | | 155,250 | | 5.500 | % | | 9/26/2008 | | 10/1/2009 | | | — | |
Interest rate cap | | | 125,000 | | 5.000 | % | | 5/1/2008 | | 5/1/2010 | | | — | |
Interest rate cap | | | 117,000 | | 6.000 | % | | 6/9/2007 | | 5/9/2009 | | | — | |
Interest rate cap | | | 117,000 | | 6.000 | % | | 5/9/2009 | | 5/9/2010 | | | — | |
Interest rate cap | | | 109,000 | | 6.500 | % | | 4/24/2007 | | 5/1/2009 | | | — | |
Interest rate cap | | | 109,000 | | 6.500 | % | | 5/1/2009 | | 5/1/2010 | | | — | |
Interest rate cap | | | 100,000 | | 4.750 | % | | 9/26/2008 | | 10/12/2010 | | | — | |
| | | | | | | | | | | | | | |
| | | | | | | | | | | | $ | (72,762 | ) |
| | | | | | | | | | | | | | |
Interest Rate Sensitivity
The impact of an assumed 50 basis point movement in interest rates would have had the following impact during 2008 (in millions):
| | | | | | | | | | | | |
| | | Interest
Expense | | | Fair Value of | |
| | | | Fixed-
Rate
Mortgage
Debt | | | Interest
Rate
Swaps | |
50 basis point increase | | $ | 3.0 | | | $ | (115.6 | ) | | $ | 12.2 | |
50 basis point decrease | | | (2.6 | ) | | | 119.7 | | | | (12.6 | ) |
The impact of a 50 basis point increase or decrease in interest rates would have an immaterial effect on the fair value of our interest rate cap agreements as of December 31, 2008.
These amounts were determined considering the impact of hypothetical interest rates on our financial instruments. Our analyses do not consider the effect of any change in overall economic activity that could occur in that environment. Furthermore, in the event of a change of the magnitude discussed above, management may take actions to further mitigate our exposure to the change. However, due to the uncertainty of the specific actions that would be taken and their possible effects, these analyses assume no changes in our financial structure.
We have posted collateral with our counterparty, primarily in the form of cash, to the extent that the termination value of the KPMG ($425.0 million) interest rate swap exceeds a $5.0 million obligation. As of
75
December 31, 2008, we had transferred $54.2 million in cash to our counterparty. This collateral will be returned to us during the remaining term of the swap agreement as we settle our monthly obligations. Future changes in both expected and actual LIBOR rates will continue to have a significant impact on both the fair value of the swap as well as our requirement to either post additional cash collateral or receive a return of previously-posted cash collateral. As of December 31, 2008, each 0.25% weighted average decrease in future expected LIBOR rates during the remaining swap term would result in the requirement to post approximately $4 million in additional cash collateral, while each 0.25% weighted average increase in future expected LIBOR rates during the remaining swap term would result in the return to us of approximately $4 million in cash collateral from our counterparty.
We do not have a requirement to post collateral under our Lantana Media Campus construction loan ($88.0 million) forward-starting interest rate swap. However, the swap has a mandatory early termination date of September 19, 2009, at which point we will either pay or receive from our counterparty, the termination value under the swap. As of December 31, 2008, the termination value of the swap was a liability of $17.7 million. As of December 31, 2008, each 0.25% weighted average decrease in future expected LIBOR rates during the remaining swap term will result in a $2 million increase in the termination value of the swap, while each 0.25% weighted average increase in future expected LIBOR rates during the remaining swap term will result in a $2 million decrease in the termination value of the swap. Accordingly, movements in future expected LIBOR rates may have a significant impact on the ultimate termination payment we make in September 2009.
76
| Item 8. | Financial Statements and Supplementary Data. |
Index to the Consolidated Financial Statements
77
Report of Independent Registered Public Accounting Firm
The Board of Directors and Stockholders
Maguire Properties, Inc.:
We have audited the accompanying consolidated balance sheets of Maguire Properties, Inc. and subsidiaries (the Company) as of December 31, 2008 and 2007, and the related consolidated statements of operations, stockholders’ (deficit) equity and comprehensive (loss) income, and cash flows for each of the years in the three-year period ended December 31, 2008. These consolidated financial statements are the responsibility of the Company’s management. Our responsibility is to express an opinion on these consolidated financial statements based on our audits.
We conducted our audits in accordance with the standards of the Public Company Accounting Oversight Board (United States). Those standards require that we plan and perform the audit to obtain reasonable assurance about whether the financial statements are free of material misstatement. An audit includes examining, on a test basis, evidence supporting the amounts and disclosures in the financial statements. An audit also includes assessing the accounting principles used and significant estimates made by management, as well as evaluating the overall financial statement presentation. We believe that our audits provide a reasonable basis for our opinion.
In our opinion, the consolidated financial statements referred to above present fairly, in all material respects, the financial position of the Company as of December 31, 2008 and 2007, and the results of its operations and its cash flows for each of the years in the three-year period ended December 31, 2008, in conformity with U.S. generally accepted accounting principles.
We also have audited, in accordance with the standards of the Public Company Accounting Oversight Board (United States), the Company’s internal control over financial reporting as of December 31, 2008, based on criteria established inInternal Control—Integrated Framework issued by the Committee of Sponsoring Organizations of the Treadway Commission (COSO), and our report dated March 16, 2009 expressed an unqualified opinion on the effectiveness of the Company’s internal control over financial reporting.
/s/ KPMG LLP
Los Angeles, California
March 16, 2009
78
Report of Independent Registered Public Accounting Firm
The Board of Directors and Stockholders
Maguire Properties, Inc.:
We have audited Maguire Properties, Inc.’s (the Company) internal control over financial reporting as of December 31, 2008, based on criteria established inInternal Control—Integrated Framework issued by the Committee of Sponsoring Organizations of the Treadway Commission (COSO).The Company’s management is responsible for maintaining effective internal control over financial reporting and for its assessment of the effectiveness of internal control over financial reporting. Our responsibility is to express an opinion on the Company’s internal control over financial reporting based on our audit.
We conducted our audit in accordance with the standards of the Public Company Accounting Oversight Board (United States). Those standards require that we plan and perform the audit to obtain reasonable assurance about whether effective internal control over financial reporting was maintained in all material respects. Our audit included obtaining an understanding of internal control over financial reporting, assessing the risk that a material weakness exists, and testing and evaluating the design and operating effectiveness of internal control based on the assessed risk. Our audit also included performing such other procedures as we considered necessary in the circumstances. We believe that our audit provides a reasonable basis for our opinion.
A company’s internal control over financial reporting is a process designed to provide reasonable assurance regarding the reliability of financial reporting and the preparation of financial statements for external purposes in accordance with generally accepted accounting principles. A company’s internal control over financial reporting includes those policies and procedures that (1) pertain to the maintenance of records that, in reasonable detail, accurately and fairly reflect the transactions and dispositions of the assets of the company; (2) provide reasonable assurance that transactions are recorded as necessary to permit preparation of financial statements in accordance with generally accepted accounting principles, and that receipts and expenditures of the company are being made only in accordance with authorizations of management and directors of the company; and (3) provide reasonable assurance regarding prevention or timely detection of unauthorized acquisition, use, or disposition of the company’s assets that could have a material effect on the financial statements.
Because of its inherent limitations, internal control over financial reporting may not prevent or detect misstatements. Also, projections of any evaluation of effectiveness to future periods are subject to the risk that controls may become inadequate because of changes in conditions, or that the degree of compliance with the policies or procedures may deteriorate.
In our opinion, the Company maintained, in all material respects, effective internal control over financial reporting as of December 31, 2008, based on criteria established inInternal Control—Integrated Framework issued by the Committee of Sponsoring Organizations of the Treadway Commission (COSO).
We also have audited, in accordance with the standards of the Public Company Accounting Oversight Board (United States), the consolidated balance sheets of the Company as of December 31, 2008 and 2007, and the related consolidated statements of operations, stockholders’ (deficit) equity and comprehensive (loss) income, and cash flows for each of the years in the three-year period ended December 31, 2008, and our report dated March 16, 2009 expressed an unqualified opinion on those consolidated financial statements.
/s/ KPMG LLP
Los Angeles, California
March 16, 2009
79
MAGUIRE PROPERTIES, INC.
CONSOLIDATED BALANCE SHEETS
| | | | | | | | |
| | | December 31, 2008 | | | December 31, 2007 | |
| | | (In thousands, except share amounts) | |
ASSETS | | | | | | | | |
Investments in real estate: | | | | | | | | |
Land | | $ | 567,640 | | | $ | 625,271 | |
Acquired ground lease | | | 55,801 | | | | 55,801 | |
Buildings and improvements | | | 3,733,508 | | | | 4,084,555 | |
Land held for development and construction in progress | | | 308,913 | | | | 350,051 | |
Tenant improvements | | | 341,474 | | | | 305,672 | |
Furniture, fixtures and equipment | | | 19,352 | | | | 17,694 | |
| | | | | | | | |
| | | 5,026,688 | | | | 5,439,044 | |
Less: accumulated depreciation | | | (604,302 | ) | | | (476,337 | ) |
| | | | | | | | |
Net investments in real estate | | | 4,422,386 | | | | 4,962,707 | |
Cash and cash equivalents | | | 80,502 | | | | 174,847 | |
Restricted cash | | | 199,664 | | | | 239,245 | |
| | |
Rents and other receivables, net | | | 22,625 | | | | 30,422 | |
Deferred rents | | | 62,229 | | | | 49,292 | |
Due from affiliates | | | 1,665 | | | | 1,740 | |
Deferred leasing costs and value of in-place leases, net | | | 153,660 | | | | 192,269 | |
Deferred loan costs, net | | | 30,496 | | | | 38,725 | |
Acquired above-market leases, net | | | 19,503 | | | | 28,058 | |
Other assets | | | 12,082 | | | | 14,148 | |
Investment in unconsolidated joint ventures | | | 11,606 | | | | 18,325 | |
Assets associated with real estate held for sale | | | 182,597 | | | | — | |
| | | | | | | | |
Total assets | | $ | 5,199,015 | | | $ | 5,749,778 | |
| | | | | | | | |
LIABILITIES, MINORITY INTERESTS AND STOCKHOLDERS’ (DEFICIT) EQUITY | | | | | | | | |
Mortgage and other secured loans | | $ | 4,714,090 | | | $ | 5,003,341 | |
Accounts payable and other liabilities | | | 216,920 | | | | 202,509 | |
Dividends and distributions payable | | | — | | | | 24,888 | |
Capital leases payable | | | 4,146 | | | | 5,232 | |
Acquired below-market leases, net | | | 112,173 | | | | 155,824 | |
Obligations associated with real estate held for sale | | | 171,348 | | | | — | |
| | | | | | | | |
Total liabilities | | | 5,218,677 | | | | 5,391,794 | |
Commitments and Contingencies (See Note 19) | | | | | | | | |
Minority interests, with an aggregate redemption value of $9.7 million and $218.3 million as of December 31, 2008 and 2007, respectively | | | — | | | | 14,670 | |
Stockholders’ (deficit) equity: | | | | | | | | |
Preferred stock, $0.01 par value, 50,000,000 shares authorized; 7.625% Series A Cumulative Redeemable Preferred Stock, $25.00 liquidation preference, 10,000,000 shares issued and outstanding | | | 100 | | | | 100 | |
Common stock, $0.01 par value, 100,000,000 shares authorized; 47,974,955 and 47,185,636 shares issued and outstanding at December 31, 2008 and 2007, respectively | | | 480 | | | | 472 | |
Additional paid-in capital | | | 696,260 | | | | 691,518 | |
Accumulated deficit and dividends | | | (656,606 | ) | | | (331,735 | ) |
Accumulated other comprehensive loss, net | | | (59,896 | ) | | | (17,041 | ) |
| | | | | | | | |
Total stockholders’ (deficit) equity | | | (19,662 | ) | | | 343,314 | |
| | | | | | | | |
Total liabilities, minority interests and stockholders’ (deficit) equity | | $ | 5,199,015 | | | $ | 5,749,778 | |
| | | | | | | | |
See accompanying notes to consolidated financial statements.
80
MAGUIRE PROPERTIES, INC.
CONSOLIDATED STATEMENTS OF OPERATIONS
| | | | | | | | | | | | |
| | | For the Year Ended December 31, | |
| | | 2008 | | | 2007 | | | 2006 | |
| | | (In thousands, except share and
per share amounts) | |
Revenue: | | | | | | | | | | | | |
Rental | | $ | 337,234 | | | $ | 321,600 | | | $ | 240,496 | |
Tenant reimbursements | | | 112,092 | | | | 104,025 | | | | 84,985 | |
Hotel operations | | | 26,616 | | | | 27,214 | | | | 27,054 | |
Parking | | | 53,246 | | | | 47,504 | | | | 39,326 | |
Management, leasing and development services | | | 6,637 | | | | 9,096 | | | | 7,943 | |
Interest and other | | | 11,208 | | | | 14,573 | | | | 31,598 | |
| | | | | | | | | | | | |
Total revenue | | | 547,033 | | | | 524,012 | | | | 431,402 | |
| | | | | | | | | | | | |
Expenses: | | | | | | | | | | | | |
Rental property operating and maintenance | | | 129,392 | | | | 117,880 | | | | 84,651 | |
Hotel operating and maintenance | | | 17,105 | | | | 17,146 | | | | 17,324 | |
Real estate taxes | | | 52,163 | | | | 46,585 | | | | 31,736 | |
Parking | | | 15,738 | | | | 13,942 | | | | 12,236 | |
General and administrative | | | 60,835 | | | | 37,677 | | | | 36,909 | |
Other expense | | | 5,866 | | | | 5,177 | | | | 649 | |
Depreciation and amortization | | | 183,300 | | | | 183,690 | | | | 129,774 | |
Interest | | | 258,134 | | | | 219,853 | | | | 121,927 | |
Loss from early extinguishment of debt | | | 1,463 | | | | 21,662 | | | | 11,440 | |
| | | | | | | | | | | | |
Total expenses | | | 723,996 | | | | 663,612 | | | | 446,646 | |
| | | | | | | | | | | | |
Loss from continuing operations before equity in net loss of unconsolidated joint venture, gain on sale of real estate and minority interests | | | (176,963 | ) | | | (139,600 | ) | | | (15,244 | ) |
Equity in net loss of unconsolidated joint venture | | | (1,092 | ) | | | (2,149 | ) | | | (3,746 | ) |
Gain on sale of real estate | | | — | | | | — | | | | 108,469 | |
Minority interests allocated to continuing operations | | | 9,991 | | | | 21,813 | | | | (10,523 | ) |
| | | | | | | | | | | | |
(Loss) income from continuing operations | | | (168,064 | ) | | | (119,936 | ) | | | 78,956 | |
| | | | | | | | | | | | |
Discontinued Operations: | | | | | | | | | | | | |
Loss from discontinued operations before gain on sale of real estate and minority interests | | | (145,283 | ) | | | (34,279 | ) | | | (10,007 | ) |
Gain on sale of real estate | | | — | | | | 195,387 | | | | — | |
Minority interests allocated to discontinued operations | | | 4,363 | | | | (21,853 | ) | | | 1,377 | |
| | | | | | | | | | | | |
(Loss) income from discontinued operations | | | (140,920 | ) | | | 139,255 | | | | (8,630 | ) |
| | | | | | | | | | | | |
Net (loss) income | | | (308,984 | ) | | | 19,319 | | | | 70,326 | |
Preferred stock dividends | | | (19,064 | ) | | | (19,064 | ) | | | (19,064 | ) |
| | | | | | | | | | | | |
Net (loss) income available to common stockholders | | $ | (328,048 | ) | | $ | 255 | | | $ | 51,262 | |
| | | | | | | | | | | | |
Basic income (loss) per common share: | | | | | | | | | | | | |
(Loss) income from continuing operations available to common stockholders | | $ | (3.94 | ) | | $ | (2.97 | ) | | $ | 1.29 | |
(Loss) income from discontinued operations | | | (2.96 | ) | | | 2.98 | | | | (0.18 | ) |
| | | | | | | | | | | | |
Net (loss) income available to common stockholders | | $ | (6.90 | ) | | $ | 0.01 | | | $ | 1.11 | |
| | | | | | | | | | | | |
Weighted average number of common shares outstanding | | | 47,538,457 | | | | 46,750,597 | | | | 46,257,573 | |
| | | | | | | | | | | | |
Diluted income (loss) per common share: | | | | | | | | | | | | |
(Loss) income from continuing operations available to common stockholders | | $ | (3.94 | ) | | $ | (2.96 | ) | | $ | 1.27 | |
(Loss) income from discontinued operations | | | (2.96 | ) | | | 2.97 | | | | (0.18 | ) |
| | | | | | | | | | | | |
Net (loss) income available to common stockholders | | $ | (6.90 | ) | | $ | 0.01 | | | $ | 1.09 | |
| | | | | | | | | | | | |
Weighted average number of common and common equivalent shares outstanding | | | 47,538,457 | | | | 46,833,002 | | | | 46,931,433 | |
| | | | | | | | | | | | |
See accompanying notes to consolidated financial statements.
81
MAGUIRE PROPERTIES, INC.
CONSOLIDATED STATEMENTS OF STOCKHOLDERS’ (DEFICIT) EQUITY AND COMPREHENSIVE (LOSS) INCOME
| | | | | | | | | | | | | | | | | | | | | | | | | | | | |
| | | Number of Shares | | | Preferred
Stock | | Common
Stock | | | Additional
Paid-in
Capital | | | Accumulated
Deficit and
Dividends | | | Accumulated
Other
Comprehensive
Income (Loss),
Net | | | Total | |
| | | Preferred
Stock | | Common
Stock | | | | | | | |
| | | (In thousands, except share amounts) | |
Balance, December 31, 2005 | | 10,000,000 | | 45,814,651 | | | $ | 100 | | $ | 458 | | | $ | 664,428 | | | $ | (233,481 | ) | | $ | 5,132 | | | $ | 436,637 | |
| | | | | | | | |
Comprehensive income: | | | | | | | | | | | | | | | | | | | | | | | | | | | | |
Net income | | | | | | | | | | | | | | | | | | | 70,326 | | | | | | | | 70,326 | |
Other comprehensive income, net of minority interests | | | | | | | | | | | | | | | | | | | | | | | 2,254 | | | | 2,254 | |
| | | | | | | | | | | | | | | | | | | | | | | | | | | | |
Comprehensive income | | | | | | | | | | | | | | | | | | | 70,326 | | | | 2,254 | | | | 72,580 | |
Common dividends and Operating Partnership distributions declared | | | | | | | | | | | | | | | | | | | (74,893 | ) | | | | | | | (74,893 | ) |
Preferred dividends declared | | | | | | | | | | | | | | | | | | | (19,064 | ) | | | | | | | (19,064 | ) |
Share-based compensation, net of minority interests | | | | 287,327 | | | | | | | 3 | | | | 6,823 | | | | | | | | | | | | 6,826 | |
Stock option exercises, net of minority interests | | | | 295,400 | | | | | | | 3 | | | | 4,852 | | | | | | | | | | | | 4,855 | |
Operating Partnership units converted into common stock | | | | 587,863 | | | | | | | 6 | | | | 4,877 | | | | (12 | ) | | | 100 | | | | 4,971 | |
| | | | | | | | | | | | | | | | | | | | | | | | | | | | |
Balance, December 31, 2006 | | 10,000,000 | | 46,985,241 | | | | 100 | | | 470 | | | | 680,980 | | | | (257,124 | ) | | | 7,486 | | | | 431,912 | |
| | | | | | | | |
Comprehensive loss: | | | | | | | | | | | | | | | | | | | | | | | | | | | | |
Net income | | | | | | | | | | | | | | | | | | | 19,319 | | | | | | | | 19,319 | |
Other comprehensive loss, net of minority interests | | | | | | | | | | | | | | | | | | | | | | | (24,527 | ) | | | (24,527 | ) |
| | | | | | | | | | | | | | | | | | | | | | | | | | | | |
Comprehensive loss | | | | | | | | | | | | | | | | | | | 19,319 | | | | (24,527 | ) | | | (5,208 | ) |
Common dividends and Operating Partnership distributions declared | | | | | | | | | | | | | | | | | | | (74,866 | ) | | | | | | | (74,866 | ) |
Preferred dividends declared | | | | | | | | | | | | | | | | | | | (19,064 | ) | | | | | | | (19,064 | ) |
Share-based compensation, net of minority interests | | | | (6,705 | ) | | | | | | | | | | 6,021 | | | | | | | | | | | | 6,021 | |
Stock option exercises, net of minority interests | | | | 207,100 | | | | | | | 2 | | | | 4,517 | | | | | | | | | | | | 4,519 | |
| | | | | | | | | | | | | | | | | | | | | | | | | | | | |
Balance, December 31, 2007 | | 10,000,000 | | 47,185,636 | | | | 100 | | | 472 | | | | 691,518 | | | | (331,735 | ) | | | (17,041 | ) | | | 343,314 | |
| | | | | | | | |
Comprehensive loss: | | | | | | | | | | | | | | | | | | | | | | | | | | | | |
Net loss | | | | | | | | | | | | | | | | | | | (308,984 | ) | | | | | | | (308,984 | ) |
Other comprehensive loss, net of minority interests | | | | | | | | | | | | | | | | | | | | | | | (42,587 | ) | | | (42,587 | ) |
| | | | | | | | | | | | | | | | | | | | | | | | | | | | |
Comprehensive loss | | | | | | | | | | | | | | | | | | | (308,984 | ) | | | (42,587 | ) | | | (351,571 | ) |
Preferred dividends declared | | | | | | | | | | | | | | | | | | | (15,887 | ) | | | | | | | (15,887 | ) |
Share-based compensation, net of minority interests | | | | 167,064 | | | | | | | 2 | | | | 4,395 | | | | | | | | | | | | 4,397 | |
Repurchase of common stock | | | | (109,088 | ) | | | | | | (1 | ) | | | (1,384 | ) | | | | | | | | | | | (1,385 | ) |
Operating Partnership units converted into common stock | | | | 731,343 | | | | | | | 7 | | | | 1,731 | | | | | | | | (268 | ) | | | 1,470 | |
| | | | | | | | | | | | | | | | | | | | | | | | | | | | |
Balance, December 31, 2008 | | 10,000,000 | | 47,974,955 | | | $ | 100 | | $ | 480 | | | $ | 696,260 | | | $ | (656,606 | ) | | $ | (59,896 | ) | | $ | (19,662 | ) |
| | | | | | | | | | | | | | | | | | | | | | | | | | | | |
See accompanying notes to consolidated financial statements.
82
MAGUIRE PROPERTIES, INC.
CONSOLIDATED STATEMENTS OF CASH FLOWS
| | | | | | | | | | | | |
| | | For the Year Ended December 31, | |
| | | 2008 | | | 2007 | | | 2006 | |
| | | (In thousands) | |
Cash flows from operating activities: | | | | | | | | | | | | |
Net (loss) income: | | $ | (308,984 | ) | | $ | 19,319 | | | $ | 70,326 | |
Adjustments to reconcile net (loss) income to net cash (used in) provided by operating activities (including discontinued operations): | | | | | | | | | | | | |
Minority interests | | | (14,354 | ) | | | 40 | | | | 9,146 | |
Equity in net loss of unconsolidated joint venture | | | 1,092 | | | | 2,149 | | | | 3,746 | |
Operating distributions received from unconsolidated joint venture | | | 4,600 | | | | 3,570 | | | | 5,422 | |
Depreciation and amortization | | | 197,253 | | | | 208,032 | | | | 144,690 | |
Impairment of long-lived assets | | | 123,694 | | | | — | | | | — | |
Gain on sale of real estate | | | — | | | | (195,387 | ) | | | (108,469 | ) |
Writeoff of tenant improvements due to relocation of corporate offices | | | 1,572 | | | | — | | | | — | |
Loss from early extinguishment of debt | | | 3,264 | | | | 31,544 | | | | 7,841 | |
Deferred rent expense | | | 1,829 | | | | 1,558 | | | | (66 | ) |
Provision for doubtful accounts | | | 3,470 | | | | 1,546 | | | | 331 | |
Revenue recognized related to below-market leases, net of acquired above-market leases | | | (28,339 | ) | | | (29,664 | ) | | | (7,742 | ) |
Deferred rents | | | (16,687 | ) | | | (11,956 | ) | | | (7,354 | ) |
Compensation cost for share-based awards, net | | | 5,001 | | | | 7,853 | | | | 7,833 | |
Amortization of deferred loan costs | | | 9,864 | | | | 7,421 | | | | 4,954 | |
Amortization of hedge ineffectiveness | | | (149 | ) | | | 187 | | | | — | |
Amortization of deferred gain from sale of interest rate swaps | | | — | | | | (325 | ) | | | (5,820 | ) |
Changes in assets and liabilities: | | | | | | | | | | | | |
Rents and other receivables | | | 5,290 | | | | (4,817 | ) | | | (5,473 | ) |
Due from affiliates | | | 75 | | | | 6,477 | | | | 2,087 | |
Deferred leasing costs | | | (20,024 | ) | | | (20,084 | ) | | | (15,922 | ) |
Other assets | | | 2,302 | | | | (3,742 | ) | | | 17,547 | |
Accounts payable and other liabilities | | | (13,427 | ) | | | 22,021 | | | | (17,085 | ) |
| | | | | | | | | | | | |
Net cash (used in) provided by operating activities | | | (42,658 | ) | | | 45,742 | | | | 105,992 | |
| | | | | | | | | | | | |
| | | |
Cash flows from investing activities: | | | | | | | | | | | | |
Expenditures for improvements to real estate | | | (189,245 | ) | | | (250,286 | ) | | | (170,888 | ) |
Acquisition of real estate | | | — | | | | (2,908,322 | ) | | | (194,807 | ) |
Proceeds from disposition of real estate, net | | | 47,154 | | | | 663,533 | | | | — | |
Proceeds from sale of real estate to unconsolidated joint
venture, net | | | — | | | | 6,765 | | | | 343,488 | |
Other investing activities | | | — | | | | (7,385 | ) | | | — | |
Decrease (increase) in restricted cash | | | 3,332 | | | | (140,095 | ) | | | (43,219 | ) |
| | | | | | | | | | | | |
Net cash used in investing activities | | | (138,759 | ) | | | (2,635,790 | ) | | | (65,426 | ) |
| | | | | | | | | | | | |
83
MAGUIRE PROPERTIES, INC.
CONSOLIDATED STATEMENTS OF CASH FLOWS—(continued)
| | | | | | | | | | | | |
| | | For the Year Ended December 31, | |
| | | 2008 | | | 2007 | | | 2006 | |
| | | (In thousands) | |
Cash flows from financing activities: | | | | | | | | | | | | |
Proceeds from: | | | | | | | | | | | | |
Mortgage loans | | $ | 256,949 | | | $ | 3,399,121 | | | $ | 1,010,950 | |
Construction loans | | | 86,615 | | | | 180,969 | | | | 113,974 | |
Repurchase facility | | | 35,000 | | | | — | | | | — | |
Senior Mezzanine loan | | | 20,000 | | | | — | | | | — | |
Term loan | | | — | | | | 400,000 | | | | — | |
Principal payments on: | | | | | | | | | | | | |
Mortgage loans | | | (200,932 | ) | | | (755,163 | ) | | | (466,669 | ) |
Construction loans | | | (60,617 | ) | | | — | | | | — | |
Term loan | | | — | | | | (400,000 | ) | | | (415,000 | ) |
Other secured loans | | | — | | | | (15,000 | ) | | | (50,000 | ) |
Capital leases | | | (2,362 | ) | | | (2,251 | ) | | | (2,012 | ) |
Repayment of revolving credit facility | | | — | | | | — | | | | (83,000 | ) |
Payment of loan costs | | | (6,073 | ) | | | (45,601 | ) | | | (13,836 | ) |
Payment of refinancing deposits | | | — | | | | — | | | | (3,266 | ) |
Other financing activities | | | (733 | ) | | | 3,464 | | | | (978 | ) |
Proceeds from sale leaseback of real estate | | | — | | | | — | | | | 25,319 | |
Proceeds from stock option exercises | | | — | | | | 3,934 | | | | 5,614 | |
Payment of dividends to preferred stockholders | | | (19,064 | ) | | | (19,064 | ) | | | (19,064 | ) |
Payment of dividends to common stockholders and distributions to limited partners of Operating Partnership | | | (21,711 | ) | | | (86,637 | ) | | | (86,509 | ) |
| | | | | | | | | | | | |
Net cash provided by financing activities | | | 87,072 | | | | 2,663,772 | | | | 15,523 | |
| | | | | | | | | | | | |
Net (decrease) increase in cash and cash equivalents | | | (94,345 | ) | | | 73,724 | | | | 56,089 | |
Cash and cash equivalents at beginning of year | | | 174,847 | | | | 101,123 | | | | 45,034 | |
| | | | | | | | | | | | |
Cash and cash equivalents at end of year | | $ | 80,502 | | | $ | 174,847 | | | $ | 101,123 | |
| | | | | | | | | | | | |
| | | |
Supplemental disclosure of cash flow information: | | | | | | | | | | | | |
Cash paid for interest, net of amounts capitalized | | $ | 267,122 | | | $ | 233,890 | | | $ | 138,695 | |
| | | |
Supplemental disclosure of noncash investing and financing activities: | | | | | | | | | | | | |
Accrual for real estate improvements and purchases of furniture, fixtures and equipment | | $ | 10,010 | | | $ | 18,771 | | | $ | 28,251 | |
Accrual for dividends and distributions declared | | | — | | | | 24,888 | | | | 24,934 | |
Buyer assumption of mortgage loans secured by properties
disposed of | | | 261,679 | | | | 593,800 | | | | 661,250 | |
(Decrease) increase in fair value of interest rate swaps and caps | | | (38,084 | ) | | | (35,363 | ) | | | 8,685 | |
Fair value of forward-starting interest rate swaps assigned to mortgage lenders | | | — | | | | 14,745 | | | | 8,810 | |
Operating Partnership units converted to common stock | | | 1,470 | | | | — | | | | 4,971 | |
See accompanying notes to consolidated financial statements.
84
MAGUIRE PROPERTIES, INC.
NOTES TO CONSOLIDATED FINANCIAL STATEMENTS
Note 1—Organization and Description of Business
We are a self-administered and self-managed real estate investment trust (“REIT”), and we operate as a REIT for federal income tax purposes. We are the largest owner and operator of Class A office properties in the Los Angeles Central Business District (“LACBD”), have a significant presence in Orange County, California and are primarily focused on owning and operating high-quality office properties in the high-barrier-to-entry Southern California market.
Through our controlling interest in Maguire Properties, L.P. (the “Operating Partnership”), of which we are the sole general partner and hold an approximate 87.8% interest, and the subsidiaries of our Operating Partnership, including Maguire Properties TRS Holdings, Inc., Maguire Properties TRS Holdings II, Inc., and Maguire Properties Services, Inc. and its subsidiaries (collectively known as the “Services Companies”), we own, manage, lease, acquire and develop real estate located in: the greater Los Angeles area of California; Orange County, California; San Diego, California; and Denver, Colorado. These locales primarily consist of office properties, parking garages, a retail property and a hotel.
As of December 31, 2008, our Operating Partnership indirectly owns whole or partial interests in 36 office and retail properties, a 350-room hotel and off-site parking garages and on-site structured and surface parking (our “Total Portfolio”). We hold an approximate 87.8% interest in our Operating Partnership, and therefore do not completely own the Total Portfolio. Excluding the 80% interest that our Operating Partnership does not own in Maguire Macquarie Office, LLC, an unconsolidated joint venture formed in conjunction with Macquarie Office Trust, our Operating Partnership’s share of the Total Portfolio is 17.3 million square feet and is referred to as our “Effective Portfolio.” Our Effective Portfolio represents our Operating Partnership’s economic interest in the office, hotel and retail properties from which we derive our net income or loss, which we recognize in accordance with accounting principles generally accepted in the United States of America (“GAAP”). The aggregate square footage of our Effective Portfolio has not been reduced to reflect our minority interest partners’ share of our Operating Partnership.
Our property statistics as of December 31, 2008 are as follows:
| | | | | | | | | | | | | | | | | | |
| | | Number of | | Total Portfolio | | Effective Portfolio |
| | Properties | | Buildings | | Square
Feet | | | Parking
Square
Footage | | Parking
Spaces | | Square
Feet | | | Parking
Square
Footage | | Parking
Spaces |
Wholly owned properties | | 30 | | 69 | | 16,526,452 | | | 11,215,359 | | 37,247 | | 16,526,452 | | | 11,215,359 | | 37,247 |
Unconsolidated joint venture | | 6 | | 20 | | 3,865,132 | | | 2,271,248 | | 7,349 | | 773,026 | | | 454,250 | | 1,470 |
| | | | | | | | | | | | | | | | | | |
| | 36 | | 89 | | 20,391,584 | | | 13,486,607 | | 44,596 | | 17,299,478 | | | 11,669,609 | | 38,717 |
| | | | | | | | | | | | | | | | | | |
Percentage leased | | | | | | 81.1 | % | | | | | | 79.3 | % | | | | |
| | | | | | | | | | | | | | | | | | |
As of December 31, 2008, the majority of our Total Portfolio is located in ten Southern California markets: the LACBD; the Tri-Cities area of Pasadena, Glendale and Burbank; the Cerritos submarket; the Santa Monica Professional and Entertainment submarket; the John Wayne Airport, Costa Mesa, Central Orange County and Brea submarkets of Orange County; and the Sorrento Mesa and Mission Valley submarkets of San Diego County. We also have an interest in one property in Denver, Colorado (a joint venture property). We directly manage the properties in our Total Portfolio through our Operating Partnership and/or our Services Companies, except for Cerritos Corporate Center and certain buildings at the Quintana Campus, as well as the Westin® Pasadena Hotel.
85
MAGUIRE PROPERTIES, INC.
NOTES TO CONSOLIDATED FINANCIAL STATEMENTS—(continued)
Note 2—Basis of Presentation and Summary of Significant Accounting Policies
Principles of Consolidation and Basis of Preparation
The accompanying consolidated financial statements include the accounts of Maguire Properties, Inc., our Operating Partnership and the wholly owned subsidiaries of our Operating Partnership. All majority-owned subsidiaries are consolidated and included in our consolidated financial statements. All significant intercompany accounts and transactions have been eliminated in consolidation. Certain amounts in the consolidated financial statements for prior years have been reclassified to reflect the activity of discontinued operations.
Use of Estimates
The preparation of consolidated financial statements in conformity with GAAP requires management to make estimates and assumptions that affect the amounts reported in the consolidated financial statements and accompanying notes. Actual results could ultimately differ from those estimates.
Liquidity
Our business requires continued access to adequate cash to fund our liquidity needs. Until the economic picture becomes clearer, our foremost priorities for 2009 are the preservation and generation of cash, including addressing debt maturities coming due.
Toward the aims of cash preservation and generation, in 2008 we: (1) disposed of City Plaza, a non-strategic asset with negative cash flow; (2) disposed of 1920 and 2010 Main Plaza, also a non-strategic asset, generating approximately $48 million of net proceeds; (3) completed a $100.0 million financing secured by Plaza Las Fuentes and the Westin® Pasadena Hotel, which provided net proceeds of approximately $95 million; (4) suspended our common and preferred dividends; (5) reduced or deferred discretionary spending (including certain development activities and capital expenditures); and (6) extended several loans with near-term maturities that would otherwise have required significant cash outlays.
Going into 2009, we continue to be focused on preserving and generating cash sufficient to fund our liquidity needs. As of the date of this report, management believes that our estimated liquidity during the remainder of 2009 will be at or near the minimum amount necessary to operate our business. Given the deterioration and uncertainty in the economy and financial markets, management is assuming that access to any source of cash will be challenging and is planning accordingly. The following are our actual and potential sources of liquidity in 2009, which we currently believe will be sufficient to fund our 2009 liquidity needs:
| | • | | Unrestricted and restricted cash; |
| | • | | Cash generated from operations; |
| | • | | Contribution of existing assets to joint ventures; |
| | • | | Proceeds from additional secured or unsecured debt financings; and/or |
| | • | | Proceeds from public or private issuance of debt or equity securities. |
These sources are essential to our short-term liquidity and financial position, and we cannot assure you that we will be able to successfully access them (particularly in the current economic environment). If we are unable to generate adequate cash from these sources, we will have liquidity-related problems and may be exposed to significant risks.
86
MAGUIRE PROPERTIES, INC.
NOTES TO CONSOLIDATED FINANCIAL STATEMENTS—(continued)
As of December 31, 2008, we had approximately $4.9 billion of total consolidated debt. By extending the maturities of our 3161 Michelson and 17885 Von Karman construction loans in September 2008, we addressed our debt maturities for 2008. We also extended our 2385 Northside Drive construction loan and our City Parkway and Brea Corporate Place and Brea Financial Commons mortgage loans during 2008, which were originally scheduled to mature in 2009. We may not be able to successfully extend, refinance or repay our remaining debt due to a number of factors, including decreased property valuations, limited availability of credit and deteriorating economic conditions. Our substantial indebtedness also requires us to use a material portion of our cash flow to service principal and interest on our debt, which limits the cash flow available for other business expenses or opportunities.
As more fully described in Note 7 “Mortgage and Other Secured Loans,” we have approximately $260 million of debt maturing during 2009, of which approximately $11 million represents scheduled principal payments, $80 million is related to the Lantana Media Campus construction loan and $169 million to the 3161 Michelson construction loan, which are due in June 2009 and September 2009, respectively. Both the Lantana and 3161 Michelson construction loans include extension options that would allow us to extend each loan for an additional year; however, there is uncertainty as to whether we will meet the conditions to allow such loans to be extended. We are currently endeavoring either to sell these two properties or extend or refinance the related indebtedness. Failure to extend or refinance our debt as it comes due, or a failure to satisfy the conditions and requirements of such debt, could result in an event of default that could potentially allow lenders to accelerate such debt. If our debt is accelerated, our assets may not be sufficient to repay such debt in full, and our available cash flow may not be adequate to maintain our current operations.
Furthermore, even if we are able to extend or refinance our existing debt, the terms of the extensions or refinancings may include operational and financial covenants significantly more restrictive than our current debt covenants. Any such extensions or refinancings will also require us to pay certain fees to, and expenses of, our lenders. These fees and cash flow restrictions will affect our ability of fund our other liquidity uses.
Investments in Real Estate
Assets Acquired –
Purchase accounting is applied to the assets and liabilities related to all real estate investments acquired from third parties. In accordance with Statement of Financial Accounting Standards (“SFAS”) No. 141,Business Combinations, the fair value of real estate acquired is allocated to tangible assets, consisting primarily of land, building and tenant improvements, and identified intangible assets and liabilities, consisting of the value of above- and below-market leases, in-place leases, tenant relationships and acquired ground leases, based in each case on their fair values. Loan premiums, in the case of above-market rate loans, or loan discounts, in the case of below-market loans, are recorded based on the fair value of the loans assumed in connection with the real estate acquired.
The fair value of tangible assets acquired is determined based on comparable sales prices for land and replacement costs, as adjusted for physical and market obsolescence, for improvements. The fair value of tangible assets acquired is also determined by valuing the property as if it were vacant, and the “as-if-vacant” value is then allocated to land, building and tenant improvements based on management’s determination of the relative fair value of these assets. Management determines the as-if-vacant fair value of a property using methods similar to those used by independent appraisers. Factors considered by management in performing these analyses include an estimate of carrying costs during the expected lease-up periods considering current market conditions and costs to execute similar leases. In estimating carrying costs, management includes real estate taxes, insurance and other operating expenses and estimates of lost rental revenue during the expected lease-up periods based on
87
MAGUIRE PROPERTIES, INC.
NOTES TO CONSOLIDATED FINANCIAL STATEMENTS—(continued)
current market demand. Management also estimates costs to execute similar leases including leasing commissions, legal and other related costs.
In allocating the fair value of identified intangible assets and liabilities of an acquired property, above- and below-market in-place lease values are recorded based on the present value (using an interest rate which reflects the risks associated with the leases acquired) of the difference between (i) the contractual amounts to be paid pursuant to the in-place leases and (ii) management’s estimate of fair market lease rates for the corresponding in-place leases, measured over a period equal to the remaining non-cancelable term of the lease and, for below-market leases, over a period equal to the initial term plus any below market fixed-rate renewal periods. Above-market lease values are amortized as a reduction of rental income in the consolidated statements of operations over the remaining non-cancelable terms of the respective leases while below-market lease values, also referred to as acquired lease obligations, are amortized as an increase to rental income in the consolidated statements of operations over the initial terms of the respective leases and any below market fixed-rate renewal periods.
In addition to the value of above- and below-market leases, there is intangible value related to having tenants leasing space in the purchased property, which is referred to as in-place lease value. Such value results primarily from the buyer of a property avoiding the costs associated with leasing the property and also avoiding rent losses and unreimbursed operating expenses during the lease up period. The estimated avoided costs and revenue losses are calculated, and this aggregate value is allocated between in-place lease value and tenant relationships based on management’s evaluation of the specific characteristics of each tenant’s lease; however, the value of tenant relationships has not been separated from in-place lease value for our investment in real estate because such value and its consequence to amortization expense is immaterial. Should future acquisitions of properties result in allocating material amounts to the value of tenant relationships, an amount would be separately allocated and amortized over the estimated life of the relationship. The value of in-place leases, exclusive of the value of above-market in-place leases, is amortized over the remaining non-cancelable periods of the respective leases and is included in depreciation and amortization in the consolidated statements of operations. If a lease is terminated prior to its stated expiration, we accelerate the amortization of the remaining unamortized assets associated with the tenant through the termination date. However, if we expect a loss on early lease termination, the unamortized amount is recognized in the consolidated statements of operations immediately. These amortization charges are included in depreciation and amortization in the consolidated statements of operations.
Assets Developed –
We capitalize direct project costs that are clearly associated with the development and construction of real estate projects as a component of land held for development and construction in progress in the consolidated balance sheets. Additionally, we capitalize interest and loan fees related to construction loans, real estate taxes, general and administrative expenses that are directly associated with and incremental to our development activities and other costs, including corporate interest, during the pre-development, construction and lease-up phases of real estate projects. These costs become part of the historical cost of the project and are included in buildings and improvements in the consolidated balance sheets once the project has been placed in service.
A summary of the costs capitalized in connection with our real estate projects is as follows (in millions):
| | | | | | | | | |
| | | For the Year Ended December 31, |
| | | 2008 | | 2007 | | 2006 |
Interest expense | | $ | 21.9 | | $ | 30.5 | | $ | 14.8 |
Indirect project costs | | | 1.7 | | | 3.8 | | | 2.0 |
| | | | | | | | | |
| | $ | 23.6 | | $ | 34.3 | | $ | 16.8 |
| | | | | | | | | |
88
MAGUIRE PROPERTIES, INC.
NOTES TO CONSOLIDATED FINANCIAL STATEMENTS—(continued)
Discontinued Operations and Assets Held for Sale –
In accordance with SFAS No. 144,Accounting for Impairment or Disposal of Long-Lived Assets, the revenue, expenses, impairments and gain on sale of operating properties are reported as discontinued operations in the consolidated statements of operations from the date acquired or placed in service through the date of disposition. A gain on sale, if any, is recognized in the period the property is disposed of.
In determining whether to report the results of operations, impairment and gain on sale of operating properties as discontinued operations, we evaluate whether we have any significant continuing involvement in the operations, leasing or management of the property disposed of in accordance with Emerging Issues Task Force Issue No. 03-13,Applying the Conditions in Paragraph 42 of Statement No. 144 in Determining Whether to Report Discontinued Operations. If we determine that we have significant continuing involvement after disposition, we do not record the revenue, expenses, impairment and/or gain on sale as part of discontinued operations.
We classify properties as held for sale when certain criteria set forth in SFAS No. 144 are met. At that time, we present the assets and liabilities of the property held for sale separately in our consolidated balance sheet. We cease recording depreciation and amortization expense at the time the property is classified as held for sale. Properties held for sale are reported at the lower of their carrying amount or their estimated fair value, less estimated costs to sell. As of December 31, 2008, our 3161 Michelson property is classified as held for sale.
Impairment Evaluation –
In accordance with SFAS No. 144, we assess whether there has been impairment in the value of our investments in real estate whenever events or changes in circumstances indicate the carrying amount of an asset may not be recoverable. Our portfolio is evaluated for impairment on a property-by-property basis. Indicators of potential impairment include the following:
| | • | | Change in strategy resulting in an increased or decreased holding period; |
| | • | | Deterioration of the rental market as evidenced by rent decreases over numerous quarters; |
| | • | | Properties adjacent to or located in the same submarket as those with recent impairment issues; |
| | • | | Significant decrease in market price; |
| | • | | Tenant financial problems; and/or |
| | • | | Experience of our competitors in the same submarket. |
We performed an impairment analysis as of June 30, 2008 and determined that our investment in 1920 and 2010 Main Plaza was impaired as a result of a decrease in the expected holding period due to its pending sale. We recorded a non-cash impairment charge totaling $51.9 million during the three months ended June 30, 2008, representing the fair value of 1920 and 2010 Main Plaza as of June 30, 2008 as calculated based on the sales price being negotiated at the time of the charge. We recognized an additional non-cash impairment charge totaling $0.6 million during the three months ended September 30, 2008 related to the disposition of 1920 and 2010 Main Plaza, representing the difference between the estimated impairment measured as of June 30, 2008 and the actual net disposition price.
We performed an impairment analysis as of September 30, 2008 on our investment in City Plaza as a result of a decrease in the holding period due to its sale and recorded a non-cash impairment charge totaling $21.2 million, representing the fair value of City Plaza as of the date of disposition as calculated based on the contractual sales price.
89
MAGUIRE PROPERTIES, INC.
NOTES TO CONSOLIDATED FINANCIAL STATEMENTS—(continued)
As of December 31, 2008, we classified our 3161 Michelson property as held for sale. We compared the carrying amount of 3161 Michelson to its estimated fair value, less estimated costs to sell, and recorded a non-cash impairment charge of $50.0 million during the three months ended December 31, 2008. We estimated the fair value of 3161 Michelson using a projected sales price analysis, incorporating available market information including indications of interest from third parties.
As of December 31, 2008, we also performed an impairment analysis on our properties that showed indications of potential impairment based on the indicators described above. Based on this analysis, no other real estate assets in our portfolio were determined to be impaired as of December 31, 2008. We recorded no impairment charges during 2007 and 2006 due to management’s intention to hold these properties over the long-term as of the analysis date.
As discussed in Item 7 “Management’s Discussion and Analysis of Financial Condition and Results of Operations – Critical Accounting Policies,” the assessment as to whether our investments in real estate are impaired is highly subjective. The calculations involve management’s best estimate of the holding period, future occupancy levels, rental rates, capitalization rates, lease-up periods and capital requirements for each property. A change in any one or more of these factors could materially impact whether a property is impaired as of any given valuation date.
One of the more significant assumptions is probability weighting whereby management may contemplate more than one holding period in its test for impairment. These scenarios can include long-, intermediate- and short-term holding periods which are probability weighted based on management’s best estimate of the likelihood of such a holding period as of the valuation date. A shift in the probability weighting towards a shorter hold scenario can increase the likelihood of impairment. Many factors may influence management’s estimate of holding periods, including market conditions, accessibility of capital and credit markets and recent sales activity of properties in the same submarket, among others. These conditions may change in a relatively short period of time, especially in light of the current economic environment. As a result, key assumptions used in testing the recoverability of our investments in real estate, particularly with respect to holding periods, can change period-over-period.
Useful Lives –
Improvements and replacements are capitalized when they extend the useful life, increase capacity or improve the efficiency of the asset. Repairs and maintenance are charged to expense in the consolidated statements of operations as incurred. Depreciation and amortization are recorded on a straight-line basis over the following estimated useful lives:
| | |
• Buildings and improvements | | 25 to 50 years |
| |
• Acquired ground lease | | Remaining life of the related lease as of the date of assumption of the lease |
| |
• Tenant improvements | | Shorter of the useful life or lease term |
| |
• Furniture, fixtures, and equipment | | 5 years |
Depreciation expense, including discontinued operations, related to our investments in real estate during 2008, 2007 and 2006 was $149.3 million, $139.2 million and $98.4 million, respectively.
90
MAGUIRE PROPERTIES, INC.
NOTES TO CONSOLIDATED FINANCIAL STATEMENTS—(continued)
Cash and Cash Equivalents
Cash and cash equivalents consist of highly liquid investments with original maturities of three months or less when acquired. Such investments are stated at cost, which approximates market value.
Cash and cash equivalents are deposited with financial institutions that we believe are creditworthy. Cash is invested with quality federally insured institutions that are members of the Federal Deposit Insurance Corporation (“FDIC”). Cash balances with institutions may be in excess of federally insured limits or may be invested in time deposits that are not insured by the institution, the FDIC, or any other government agency. We have not realized any losses in such cash investments and we believe that these investments are not exposed to any significant credit risk.
Restricted Cash
Restricted cash consists primarily of deposits for tenant improvements and leasing commissions, real estate taxes and insurance reserves, debt service reserves and other items as required by certain of our loan agreements as well as collateral accounts required by our interest rate swap counterparties.
Rents and Other Receivables, Net
Rents and other receivables are net of allowances for doubtful accounts of $3.1 million and $1.0 million as of December 31, 2008 and 2007, respectively. For 2008, 2007 and 2006, we recorded a provision for doubtful accounts of $3.5 million, $1.5 million and $0.3 million, respectively.
We maintain an allowance for doubtful accounts for estimated losses resulting from the inability of tenants to make required rent payments. The computation of this allowance is based on the tenants’ payment history and current credit status, as well as certain industry or specific credit considerations. If estimates of collectibility differ from the cash received, then the timing and amount of our reported revenue could be impacted. When circumstances arise, such as the bankruptcy filing of a tenant, the allowance is reviewed for adequacy and adjusted to reflect the change in the estimated amount to be received from the tenant.
Deferred Leasing Costs
Deferred leasing commissions and other direct costs associated with the acquisition of tenants (including direct internal costs) are capitalized and amortized on a straight-line basis over the terms of the related leases. Deferred leasing costs also include the net carrying value of acquired in-place leases and tenant relationships.
Deferred Loan Costs
Loan costs are capitalized and amortized to interest expense on a straight-line basis over the terms of the related loans.
Other Assets
Other assets include prepaid expenses, interest receivable, deposits, corporate-related furniture and fixtures (net of accumulated depreciation) and other miscellaneous assets.
Investment in Unconsolidated Joint Ventures
Our investment in joint ventures is accounted for under the equity method of accounting because we exercise significant influence over, but do not control, our joint ventures. We evaluated our investment in each of
91
MAGUIRE PROPERTIES, INC.
NOTES TO CONSOLIDATED FINANCIAL STATEMENTS—(continued)
our joint ventures and have concluded that they are not variable interest entities under Financial Accounting Standards Board (“FASB”) Interpretation No. 46(R),Consolidation of Variable Interest Entities. Our partners have substantive participating rights including approval of and participation in setting operating budgets and strategic plans, capital spending, and sale or financing transactions. Accordingly, we have concluded that the equity method of accounting is appropriate. Our investment in our joint ventures is recorded initially at cost and is subsequently adjusted for our proportionate share of net earnings or losses, cash contributions made and distributions received and other adjustments, as appropriate. Any difference between the carrying amount of the investment in our consolidated balance sheet and the underlying equity in net assets is amortized as an adjustment to equity in earnings or loss of the joint venture over 40 years. We record distributions of operating profit from our investment as part of operating cash flows and distributions related to a capital transaction, such as a refinancing transaction or sale, as investing activities.
Accounts Payable and Other Liabilities
Accounts payable and other liabilities include accounts payable, accrued expenses, prepaid tenant rents and accrued interest payable.
Derivative Financial Instruments
Interest rate fluctuations may impact our results of operations and cash flows. Our construction loans as well as some of our mortgage loans bear interest at a variable rate. We seek to minimize the volatility that changes in interest rates have on our variable-rate debt by entering into interest rate swap and cap agreements. We do not trade in financial instruments for speculative purposes. Our derivatives are designated as cash flow hedges under SFAS No. 133,Accounting for Derivative Instruments and Hedging Activities.
For derivatives designated as cash flow hedges, the effective portion of changes in the fair value of the derivative is initially reported in other accumulated comprehensive (loss) income in the consolidated balance sheets and recognized as part of interest expense in the consolidated statements of operations when the hedged transaction affects earnings.
Revenue Recognition
We commence revenue recognition on our leases based on a number of factors. In most cases, revenue recognition begins when the lessee takes possession of or controls the physical use of the leased asset. Generally, this occurs on the lease commencement date. In determining what constitutes the leased asset, we evaluate whether we or the lessee is the owner, for accounting purposes, of the tenant improvements. If we are the owner, for accounting purposes, of the tenant improvements, then the leased asset is the finished space and revenue recognition begins when the lessee takes possession of the finished space, typically when the improvements are substantially complete. If we conclude we are not the owner, for accounting purposes, of the tenant improvements (the lessee is the owner), then the leased asset is the unimproved space and any tenant improvement allowances funded under the lease are treated as lease incentives which reduce revenue recognized over the term of the lease. In these circumstances, we begin revenue recognition when the lessee takes possession of the unimproved space for the lessee to construct improvements. The determination of who is the owner, for accounting purposes, of the tenant improvements determines the nature of the leased asset and when revenue recognition under a lease begins. We consider a number of different factors to evaluate whether we or the lessee is the owner of the tenant improvements for accounting purposes. These factors include:
| | • | | Whether the lease stipulates how and on what a tenant improvement allowance may be spent; |
| | • | | Whether the tenant or landlord retain legal title to the improvements; |
92
MAGUIRE PROPERTIES, INC.
NOTES TO CONSOLIDATED FINANCIAL STATEMENTS—(continued)
| | • | | The uniqueness of the improvements; |
| | • | | The expected economic life of the tenant improvements relative to the length of the lease; and |
| | • | | Who constructs or directs the construction of the improvements. |
The determination of who owns the tenant improvements, for accounting purposes, is subject to significant judgment. In making that determination we consider all of the above factors. However, no one factor is determinative in reaching a conclusion.
All tenant leases are classified as operating leases, and minimum rents are recognized on a straight-line basis over the terms of the leases. The excess of rents recognized over amounts contractually due, pursuant to the underlying leases, is included in deferred rents, and contractually due but unpaid rents are included in rents and other receivables, net in the consolidated balance sheets.
Tenant reimbursements for real estate taxes, common area maintenance, and other recoverable costs are recognized in the period that the expenses are incurred.
Hotel operations revenue is recognized when services are rendered to guests.
Parking revenue is recognized in the period earned.
Property management fees are based on a percentage of the revenue earned by a property under management and are recorded on a monthly basis as earned. Lease commission revenue is recognized when legally earned under the provisions of the underlying lease commission agreement with the landlord. Revenue recognition generally occurs 50% upon lease signing, when the first half of the lease commission becomes legally payable with no right of refund, and 50% upon tenant move-in, when the second half of the lease commission becomes legally payable with no right of refund. In circumstances where the landlord has a right of refund or no legal obligation to pay if the tenant does not move in, we defer revenue recognition until the tenant moves in or the landlord no longer legally has a right of refund. Development fees are recognized as the real estate development services are rendered using the percentage-of-completion method of accounting.
Prior to his termination of employment, we earned management fees, leasing commissions and development fees from Robert F. Maguire III, our former Chairman and Chief Executive Officer. We recognized management fees and leasing commissions in the manner indicated above. We recognized development fees as the real estate development services were rendered using the percentage-of-completion method of accounting.
Lease termination fees, which are included as part of interest and other in the consolidated statements of operations, are recognized when the related leases are canceled, the leased space has been vacated, and we have no continuing obligation to provide services to such former tenants. Upon a tenant’s agreement to terminate a lease early, we accelerate the depreciation and amortization of the remaining unamortized assets associated with the tenant through the termination date. These accelerated depreciation and amortization charges are included in depreciation and amortization in the consolidated statements of operations.
Loss from Early Extinguishment of Debt
We incur prepayment penalties, exit fees and/or defeasance costs when we repay or defease our mortgage and other secured loans. These costs, along with the write off of unamortized loan costs and loan premiums or discounts, are recorded as a loss from early extinguishment of debt in the consolidated statements of operations.
93
MAGUIRE PROPERTIES, INC.
NOTES TO CONSOLIDATED FINANCIAL STATEMENTS—(continued)
Gain on Sale of Real Estate
Gains on the disposition of real estate assets are recorded when the recognition criteria in SFAS No. 66,Accounting for Sales of Real Estate, have been met, generally at the time title is transferred and we no longer have substantial continuing involvement with the real estate asset disposed of.
When we contribute property to a joint venture in which we have an ownership interest, we do not recognize a portion of the proceeds in our computation of the gain resulting from the contribution. The amount of proceeds not recognized is based on our ownership interest in the joint venture acquiring the property.
Income Taxes
We elected to be taxed as a REIT under Sections 856 to 860 of the Internal Revenue Code of 1986, as amended (the “Code”), commencing with our taxable year ended December 31, 2003. We believe that we have always operated so as to continue to qualify as a REIT. Accordingly, we will not be subject to U.S. federal income tax, provided that we continue to qualify as a REIT and our distributions to our stockholders equal or exceed our taxable income.
However, qualification and taxation as a REIT depends upon our ability to meet the various qualification tests imposed under the Code related to annual operating results, asset diversification, distribution levels and diversity of stock ownership. Accordingly, no assurance can be given that we will be organized or be able to operate in a manner so as to qualify or remain qualified as a REIT. If we fail to qualify as a REIT in any taxable year, we will be subject to federal and state income tax (including any applicable alternative minimum tax) on our taxable income at regular corporate tax rates, and we may be ineligible to qualify as a REIT for four subsequent tax years. We may also be subject to certain state or local income taxes, or franchise taxes on our REIT activities.
We have elected to treat certain of our subsidiaries as a taxable REIT subsidiary (“TRS”). Certain activities that we undertake must be conducted by a TRS, such as non-customary services for our tenants, and holding assets that we cannot hold directly. A TRS is subject to both federal and state income taxes. In 2008 and 2007, we recorded tax provisions of approximately $1.2 million and $0.9 million, respectively, which are included in other expense in our consolidated statements of operations. There was no income tax provision or benefit recorded during 2006.
Certain of our TRS entities have combined net operating loss (“NOL”) carryforwards of approximately $145 million and $34 million as of December 31, 2008 and 2007, respectively. The parent REIT entity also has NOL carryforwards of approximately $270 million and $124 million as of December 31, 2008 and 2007, respectively. These amounts can be used to offset future taxable income (and/or taxable income for prior years if the audit of any prior year’s return determines that amounts are owed), if any. The REIT may utilize NOL carryforwards only to the extent that REIT taxable income exceeds our deduction for dividends paid to our stockholders. The NOL carryforwards begin to expire in 2025 with respect to the TRS entities and in 2023 for the parent REIT.
SFAS No. 109,Accounting for Income Taxes, requires a valuation allowance to reduce the deferred tax assets reported if, based on the weight of the evidence, it is more likely than not that some portion or all of the deferred tax assets will not be realized. Our TRS entities with NOL carryforwards have reported cumulative losses since inception, and there is uncertainty as to whether taxable income will be generated in the future. Accordingly, we have recorded a full valuation allowance for all periods presented since we do not expect to realize any of our deferred tax assets.
94
MAGUIRE PROPERTIES, INC.
NOTES TO CONSOLIDATED FINANCIAL STATEMENTS—(continued)
In accordance with FASB Interpretation No. 48,Accounting for Uncertainty in Income Taxes – an Interpretation of FASB Statement No. 109, the tax benefit of uncertain tax positions is recognized only if it is “more likely than not” that the tax position will be sustained, based solely on its technical merits, with the taxing authority having full knowledge of relevant information. The measurement of a tax benefit for an uncertain tax position that meets the “more likely than not” threshold is based on a cumulative probability model under which the largest amount of tax benefit recognized is the amount with a greater than 50% likelihood of being realized upon ultimate settlement with the taxing authority having full knowledge of all the relevant information. As of December 31, 2008 and 2007, we had no unrecognized tax benefits. We do not anticipate a significant change to the total amount of unrecognized tax benefits within the next 12 months.
Share-Based Payments
We account for share-based compensation arrangements under SFAS No. 123 (Revised),Share-Based Payment (“SFAS No. 123(R)”). Stock-based compensation cost recorded as part of general and administrative and other in the consolidated statements of operations for 2008, 2007 and 2006 was $5.0 million, $7.5 million and $7.6 million, respectively. During 2008 and 2007, $0.5 million and $0.8 million, respectively, of stock-based compensation cost was capitalized as part of construction in progress. As of December 31, 2008, the total unrecognized compensation cost related to unvested share-based payments totaled $20.4 million and is expected to be recognized in the consolidated statements of operations over a weighted average period of approximately four years.
The fair value of nonqualified stock options granted is estimated on the date of the grant using the Cox, Ross and Rubenstein binomial tree option-pricing model using the following weighted-average assumptions:
| | | | | | |
| | | For the Year Ended December 31, |
| | | 2008 | | 2007 | | 2006 |
Dividend yield | | — | | 4.66% - 5.82% | | 4.6% |
Expected life of option | | 36 months | | 36 months | | 36 months |
Contractual term of option | | 10 years | | 10 years | | 10 years |
Risk-free interest rate | | 3.66% - 4.10% | | 4.54% - 5.03% | | 5.14% |
Expected stock price volatility | | 71.10% | | 25.83% | | 25.83% |
Number of steps | | 500 | | 500 | | 500 |
Fair value of options (per share) on grant date | | $2.95 - $5.85 | | $3.90 - $4.93 | | $6.12 |
Many factors are considered when determining the fair value of share-based awards at the measurement date. Our dividend yield assumption is based on our most recent actual annual dividend payout. The expected life of our options is based on the period of time the options are expected to be outstanding, and the contractual term is based on the agreement set forth when the options were granted. The risk-free interest rate is based on the implied yield available on 10-year treasury notes, while the number of steps is used in a standard deviation calculation of our expected stock price volatility based on a 60 business day period comparison of our share price.
Segment Reporting
We report our consolidated financial statements in accordance with SFAS No. 131,Disclosures about Segments of an Enterprise and Related Information. We have two reportable segments: office properties and a hotel property. The components of the office properties segment include rental of office, retail and storage space to tenants, parking and other tenant services. The components of the hotel property segment include rooms, sales
95
MAGUIRE PROPERTIES, INC.
NOTES TO CONSOLIDATED FINANCIAL STATEMENTS—(continued)
of food and beverages, and other services to hotel guests. We also have certain corporate level activities including legal, human resources, accounting, finance, and management information systems which are not considered separate operating segments.
We do not allocate our investment in real estate between the hotel and the office portions of the Plaza Las Fuentes property; therefore, separate information related to investment in real estate and depreciation and amortization is not available for the office property and hotel property segments. Due to the size of the hotel property segment in relation to our consolidated financial statements, we are not required to report segment information for 2008, 2007 and 2006.
Note 3—Acquisitions and Dispositions
2008 Dispositions
A summary of our 2008 property dispositions is as follows:
| | | | |
| | | Location | | Net Rentable
Square Feet |
Properties Disposed of: | | | | |
1920 and 2010 Main Plaza | | Irvine, CA | | 587,000 |
City Plaza | | Orange, CA | | 328,000 |
| | | | |
| | | | 915,000 |
| | | | |
In August 2008, we completed the sale of 1920 and 2010 Main Plaza for approximately $211 million, including the buyer’s assumption of the $160.7 million mortgage loan on the property and the transfer to the buyer of approximately $10 million of restricted leasing reserves. We received net proceeds from this transaction of approximately $48 million which were used for general corporate purposes.
In September 2008, we completed the sale of City Plaza. The disposition consisted of (1) the conveyance of the property to a third party (including the release of approximately $15 million of existing loan reserves to the third party), and (2) an approximate $1 million cash payment by us (which is offset by our release from an approximate $1 million future obligation). We received no net proceeds from this transaction, and we have no further obligations with respect to the property-level debt.
96
MAGUIRE PROPERTIES, INC.
NOTES TO CONSOLIDATED FINANCIAL STATEMENTS—(continued)
2007 Acquisitions and Dispositions
A summary of our 2007 property acquisitions and dispositions is as follows (in millions, except square footage amounts):
| | | | | | | |
| | | Location | | Net Rentable
Square Feet | | Mortgage Debt
Incurred at
Purchase(1) |
Properties Acquired: | | | | | | | |
130 State College | | Brea, CA | | 43,000 | | | |
| | | | | | | |
| | | |
Blackstone properties: | | | | | | | |
Griffin Towers | | Santa Ana, CA | | 544,000 | | $ | 200.0 |
500-600 City Parkway(2) | | Orange, CA | | 459,000 | | | 117.0 |
Brea Corporate Place | | Brea, CA | | 328,000 | | | 70.5 |
Brea Financial Commons | | Brea, CA | | 165,000 | | | 38.5 |
Two California Plaza | | Los Angeles, CA | | 1,330,000 | | | 470.0 |
550 South Hope Street | | Los Angeles, CA | | 566,000 | | | 200.0 |
City Tower | | Orange, CA | | 409,000 | | | 140.0 |
City Plaza | | Orange, CA | | 324,000 | | | 111.0 |
500 Orange Tower | | Orange, CA | | 333,000 | | | 110.0 |
Stadium Towers Plaza | | Anaheim, CA | | 255,000 | | | 100.0 |
1920 Main Plaza | | Irvine, CA | | 306,000 | | | 80.9 |
2010 Main Plaza | | Irvine, CA | | 281,000 | | | 79.8 |
2600 Michelson | | Irvine, CA | | 308,000 | | | 110.0 |
The City – 3800 Chapman | | Orange, CA | | 157,000 | | | 44.4 |
18581 Teller | | Irvine, CA | | 86,000 | | | 20.0 |
| | | | | | | |
| | | | 5,851,000 | | $ | 1,892.1 |
| | | | | | | |
Properties Acquired and Disposed of:(3) | | | | | | | |
Blackstone properties: | | | | | | | |
Inwood Park | | Irvine, CA | | 157,000 | | $ | 39.6 |
1201 Dove Street | | Newport Beach, CA | | 78,000 | | | 21.4 |
Fairchild Corporate Center | | Irvine, CA | | 105,000 | | | 29.2 |
Redstone Plaza | | Newport Beach, CA | | 168,000 | | | 49.7 |
Bixby Ranch | | Seal Beach, CA | | 295,000 | | | 82.6 |
Lincoln Town Center | | Orange, CA | | 215,000 | | | 71.4 |
Tower 17 | | Irvine, CA | | 231,000 | | | 92.0 |
1100 Executive Tower | | Orange, CA | | 367,000 | | | 127.0 |
18301 Von Karman | | Irvine, CA | | 220,000 | | | 95.0 |
| | | | | | | |
| | | | 1,836,000 | | | 607.9 |
| | | | | | | |
| | | | 7,687,000 | | $ | 2,500.0 |
| | | | | | | |
Properties Disposed of: | | | | | | | |
Wateridge Plaza | | San Diego, CA | | 268,000 | | | |
Pacific Center | | Mission Valley, CA | | 439,000 | | | |
Regents Square | | La Jolla, CA | | 312,000 | | | |
| | | | | | | |
| | | | 1,019,000 | | | |
| | | | | | | |
| (1) | For purposes of this schedule, the amount of debt shown is the face value of the debt before any related discounts. |
| (2) | The amount available under this loan totals $117.0 million, of which $98.8 million was outstanding as of December 31, 2008. |
97
MAGUIRE PROPERTIES, INC.
NOTES TO CONSOLIDATED FINANCIAL STATEMENTS—(continued)
| (3) | We also disposed of three development sites as part of these transactions: Inwood Park, Bixby Ranch and 1100 Executive Tower. |
Acquisitions –
We purchased 24 properties and 11 development sites from Blackstone Real Estate Advisors in April 2007 for $2.875 billion. The purchase price (before reserves and closing costs) was funded through new mortgage financings of $2.28 billion, a bridge mortgage financing of $223.0 million, and a $530.0 million corporate facility, which was comprised of a $400.0 million term loan, which was fully drawn at closing, and a $130.0 million revolving credit facility (the “Revolver”), which was not drawn at closing. We funded our $175.0 million cash requirement to close this transaction with excess proceeds from the Wells Fargo Tower refinancing.
We acquired 130 State College, an office property located in Brea, California, in 2007 for approximately $11 million.
Dispositions –
We acquired eight office properties and three development sites as part of the Blackstone Transaction: Inwood Park, 1201 Dove Street, Fairchild Corporate Center, Redstone Plaza, Bixby Ranch, Lincoln Town Center, Tower 17, 1100 Executive Tower and the Inwood Park, Bixby Ranch and 1100 Executive Tower development sites. We disposed of these properties shortly after their acquisition. A total of $274.0 million of the debt encumbering these properties was assumed by the buyers upon disposition while $238.9 million was repaid. We recorded no gain or loss on the disposal of these properties since the purchase price allocated to them at the date of acquisition equaled the value recorded upon disposal.
We disposed of three office properties: Wateridge Plaza, Pacific Center and Regents Square and recorded a total gain on disposition of $195.4 million. The mortgage loans related to Pacific Center and Regents Square of $121.2 million and $103.6 million, respectively, were assumed by the buyers of these properties. The mortgage loan of $47.9 and mezzanine loan of $15.0 million related to Wateridge Plaza were repaid upon disposition.
We contributed our office property located at 18301 Von Karman in Irvine, California to DH Von Karman Maguire, LLC in 2007 for an agreed upon value of approximately $112 million, less approximately $2 million of credits and the transfer of loan reserves of approximately $7 million in connection with the joint venture’s assumption of the existing $95.0 million mortgage loan on the property. We retain a 1% common equity interest and a 2% preferred interest in this joint venture. We recorded no gain or loss on the contribution of this property since the purchase price allocated to this property at the date of acquisition in April 2007 equaled the value recorded upon disposal.
98
MAGUIRE PROPERTIES, INC.
NOTES TO CONSOLIDATED FINANCIAL STATEMENTS—(continued)
2006 Acquisitions and Dispositions
A summary of our 2006 property acquisitions and dispositions is as follows (in millions, except square footage amounts):
| | | | | | | |
| | | Location | | Net Rentable
Square Feet | | Mortgage Debt
Incurred at
Purchase |
Properties Acquired: | | | | | | | |
Pacific Center | | Mission Valley, CA | | 439,000 | | | |
701 North Brand | | Glendale, CA | | 131,000 | | $ | 33.8 |
| | | | | | | |
| | | | 570,000 | | | |
| | | | | | | |
Properties Contributed to Joint Venture: | | | | | | | |
One California Plaza | | Los Angeles, CA | | 984,000 | | | |
Cerritos Corporate Center | | Cerritos, CA | | 326,000 | | | |
Washington Mutual Campus | | Irvine, CA | | 415,000 | | | |
San Diego Tech Center | | San Diego, CA | | 645,000 | | | |
Wells Fargo Center | | Denver, CO | | 1,201,000 | | | |
| | | | | | | |
| | | | 3,571,000 | | | |
| | | | | | | |
Property Disposed of: | | | | | | | |
808 South Olive | | Los Angeles, CA | | | | | |
Acquisitions –
We acquired Pacific Center, an office property located in Mission Valley, California, in 2006 for approximately $149.0 million using net proceeds received from the contribution of properties to our joint venture with Macquarie Office Trust.
We purchased 701 North Brand and the remaining 50% interest in an adjacent garage which we did not previously own in 2006 for $45.0 million using the net proceeds received from mortgaging the property.
Dispositions –
We contributed Wells Fargo Center (Denver), One California Plaza, San Diego Tech Center, Washington Mutual Campus and Cerritos Corporate Center to our joint venture with Macquarie Office Trust in January 2006. We retain a 20% interest in the joint venture. We received net cash proceeds of $376.4 million and recognized a gain on sale of $108.5 million related to the establishment of the joint venture. The joint venture assumed the existing mortgage loans on these properties totaling $661.3 million.
We sold the 808 South Olive garage, a parking garage located in downtown Los Angeles, California, for $26.5 million in 2006. In connection with the sale of the garage, we entered into an amended and restated parking easement with the buyer of the garage, which expires in 2011, in order to continue to meet the terms of our leases with tenants in the Gas Company and US Bank Towers. The gain on sale of this property has been deferred until such time as the amended and restated parking easement expires. The $13.2 million mortgage related to the garage was reallocated to our Gas Company Tower property upon completion of the sale.
99
MAGUIRE PROPERTIES, INC.
NOTES TO CONSOLIDATED FINANCIAL STATEMENTS—(continued)
Note 4—Land Held for Development and Construction in Progress
Land held for development and construction in progress includes the following (in thousands):
| | | | | | |
| | | December 31, 2008 | | December 31, 2007 |
Land held for development | | $ | 214,726 | | $ | 202,630 |
Construction in progress | | | 94,187 | | | 147,421 |
| | | | | | |
| | $ | 308,913 | | $ | 350,051 |
| | | | | | |
As of December 31, 2008, we had two projects under construction:
| | • | | Our project at Lantana Media Campus (East building), a 66,000 square foot office building located in Santa Monica, California; and |
| | • | | Our project at 207 Goode Avenue, an eight-story, 189,000 square foot office building located in Glendale, California. |
During 2008, we completed the following development projects:
| | • | | 17885 Von Karman, a 151,370 square foot office building located at the Quintana Campus in Irvine, California; |
| | • | | 2385 Northside Drive, an 88,795 square foot office building with 128,000 square feet of structured parking located at the Mission City Corporate Center in San Diego, California; and |
| | • | | Lantana South, a 132,976 square foot office building located in Santa Monica, California. |
We also own undeveloped land adjacent to certain of our other properties, primarily located in the downtown Los Angeles, the Tri-Cities, Orange County and San Diego County submarkets that we believe can support approximately 8 million net rentable square feet of office, retail, hotel and residential uses as well as approximately 8 million square feet of structured parking.
Note 5—Intangible Assets and Liabilities
Our identifiable intangible assets and liabilities are summarized as follows (in thousands):
| | | | | | | | |
| | | December 31, 2008 | | | December 31, 2007 | |
Acquired above-market leases | | | | | | | | |
Gross amount | | $ | 44,593 | | | $ | 44,684 | |
Accumulated amortization | | | (25,090 | ) | | | (16,626 | ) |
| | | | | | | | |
Net amount | | $ | 19,503 | | | $ | 28,058 | |
| | | | | | | | |
Acquired in-place leases | | | | | | | | |
Gross amount | | $ | 205,392 | | | $ | 220,518 | |
Accumulated amortization | | | (135,648 | ) | | | (110,339 | ) |
| | | | | | | | |
Net amount | | $ | 69,744 | | | $ | 110,179 | |
| | | | | | | | |
Acquired below-market leases | | | | | | | | |
Gross amount | | $ | (205,060 | ) | | $ | (218,372 | ) |
Accumulated amortization | | | 92,887 | | | | 62,548 | |
| | | | | | | | |
Net amount | | $ | (112,173 | ) | | $ | (155,824 | ) |
| | | | | | | | |
100
MAGUIRE PROPERTIES, INC.
NOTES TO CONSOLIDATED FINANCIAL STATEMENTS—(continued)
Amortization of acquired below-market leases, net of acquired above-market leases, increased our rental income in continuing operations by $25.7 million, $25.1 million and $6.6 million for 2008, 2007 and 2006, respectively. Rental income in discontinued operations benefited from amortization of acquired below-market leases, net of acquired above-market leases, by $2.6 million, $4.5 million and $1.1 million in 2008, 2007 and 2006, respectively.
Amortization of acquired in-place leases included as part of depreciation and amortization in continuing operations for 2008, 2007 and 2006 was $31.8 million, $46.2 million and $26.6 million, respectively. Amortization related to discontinued operations for 2008, 2007 and 2006 was $2.5 million, $8.5 million and $5.6 million, respectively.
Our estimate of the amortization of these intangible assets and liabilities over the next five years is as follows (in thousands):
| | | | | | | | | | |
| | | Acquired Above-
Market Leases | | Acquired
In-place Leases | | Acquired Below-
Market Leases | |
2009 | | $ | 8,066 | | $ | 21,316 | | $ | (28,090 | ) |
2010 | | | 4,499 | | | 16,065 | | | (24,337 | ) |
2011 | | | 3,561 | | | 11,075 | | | (19,772 | ) |
2012 | | | 2,293 | | | 8,453 | | | (15,491 | ) |
2013 | | | 960 | | | 4,948 | | | (9,022 | ) |
Thereafter | | | 124 | | | 7,887 | | | (15,461 | ) |
| | | | | | | | | | |
| | $ | 19,503 | | $ | 69,744 | | $ | (112,173 | ) |
| | | | | | | | | | |
Note 6—Investment in Unconsolidated Joint Ventures
Maguire Macquarie Office, LLC
Maguire Properties, L.P. and Macquarie Office Trust entered into a joint venture agreement during 2005, which resulted in the creation of Maguire Macquarie Office, LLC. In 2006, the series of transactions contemplated by the joint venture agreements were completed, including:
By Maguire Properties, L.P. –
| | • | | Contribution of the Wells Fargo Center (Denver), One California Plaza, San Diego Tech Center, Quintana Campus and Cerritos Corporate Center office properties to the joint venture; |
By Macquarie Office Trust –
| | • | | Contribution of the Stadium Gateway office property and cash; |
By the Joint Venture –
| | • | | Assumption of $661.3 million of mortgage debt from Maguire Properties, L.P. secured by Wells Fargo Center (Denver), One California Plaza, San Diego Tech Center and Quintana Campus; and |
| | • | | Completion of a $95.0 million mortgage financing secured by Cerritos Corporate Center. |
As a result of the these transactions, we received net cash proceeds of $376.4 million during 2006, consisting of $363.0 million relating to Macquarie Office Trust’s acquisition of an 80% interest in the five office properties we contributed to the joint venture, $19.0 million representing the distribution of our 20% pro rata
101
MAGUIRE PROPERTIES, INC.
NOTES TO CONSOLIDATED FINANCIAL STATEMENTS—(continued)
share of Cerritos Corporate Center mortgage financing net proceeds received by the joint venture, net of $5.6 million in cash we paid to fund the acquisition of our 20% interest in Stadium Gateway. After these transactions, our interest in the joint venture is 20% and Macquarie Office Trust’s interest is 80%.
We recognized a net gain on sale of real estate in the 2006 consolidated statement of operations of $108.5 million related to the joint venture transactions. We recorded our investment in the joint venture based on 20% of our historical net book value of the five properties we contributed and the fair value paid for Stadium Gateway.
As further described below, we reduced our gain on sale and established reserves totaling $57.2 million at the time of the joint venture transactions. All amounts are included in accounts payable and accrued liabilities in the consolidated balance sheets.
| | | | | | | | | | | | | | | | | | | |
| | | Master
Lease
Obligation | | | Tenant
Improvements/
Leasing
Commissions | | | Contingent
Purchase
Obligation | | | Property
Management
Fees | | | Loan
Guarantee |
| | | (In millions) |
Amount reserved at inception | | $ | 5.0 | | | $ | 15.7 | | | $ | 7.5 | | | $ | 8.6 | | | $ | 20.4 |
Payments/fees earned | | | (5.0 | ) | | | (0.1 | ) | | | (2.3 | ) | | | (2.7 | ) | | | — |
Restricted cash transferred | | | — | | | | (7.7 | ) | | | — | | | | — | | | | — |
| | | | | | | | | | | | | | | | | | | |
Balance, December 31, 2006 | | | — | | | | 7.9 | | | | 5.2 | | | | 5.9 | | | | 20.4 |
Payments/fees earned | | | — | | | | (4.3 | ) | | | (3.2 | ) | | | (2.9 | ) | | | — |
| | | | | | | | | | | | | | | | | | | |
Balance, December 31, 2007 | | | — | | | | 3.6 | | | | 2.0 | | | | 3.0 | | | | 20.4 |
Payments/fees earned | | | — | | | | (0.5 | ) | | | (2.0 | ) | | | (3.0 | ) | | | — |
| | | | | | | | | | | | | | | | | | | |
Balance, December 31, 2008 | | $ | — | | | $ | 3.1 | | | | — | | | $ | — | | | $ | 20.4 |
| | | | | | | | | | | | | | | | | | | |
In connection with the joint venture contribution agreements for One California Plaza, Wells Fargo Center (Denver) and San Diego Tech Center, we agreed to fund certain existing and contingent obligations, including $5.0 million of master lease payments through January 4, 2007 and $15.7 million of future tenant lease obligations, including tenant improvement allowances and leasing commissions.
In addition, $7.5 million of the purchase price is refundable to Macquarie Office Trust if the five properties we contributed to the joint venture do not meet certain pre-defined annual income targets for the three-year period ended January 5, 2009. Since the five properties did not meet the annual income targets during 2008, 2007 and 2006, we paid $2.0 million, $3.2 million and $2.3 million, respectively, to Macquarie Office Trust to cover the shortfalls.
We provide property management services to the five properties we contributed to the joint venture for the
three-year period ending January 5, 2009 at no charge, other than the reimbursement of direct property management expenses incurred. At the time of sale, we reduced our gain by $8.6 million, representing prepaid revenue for the property management services we are providing through January 2009. During 2008, 2007 and 2006, we recognized $3.0 million, $2.9 million and $2.7 million, respectively, of management fee income in our consolidated statements of operations related to services provided under our agreement with the joint venture.
Maguire Properties, L.P. was the guarantor on the $95.0 million mortgage loan secured by Cerritos Corporate Center through January 4, 2009. As a result of this guarantee (which is considered continuing involvement that precludes gain recognition under GAAP), we deferred the $20.4 million gain on sale related to
102
MAGUIRE PROPERTIES, INC.
NOTES TO CONSOLIDATED FINANCIAL STATEMENTS—(continued)
that property, which is included in accounts payable and other liabilities in the consolidated balance sheets as of December 31, 2008 and 2007. This gain will be recognized upon the expiration of our debt guarantee in first quarter 2009.
The joint venture’s condensed balance sheets are as follows (in thousands):
| | | | | | | | |
| | | December 31, 2008 | | | December 31, 2007 | |
Assets | | | | | | | | |
Investments in real estate | | $ | 1,090,278 | | | $ | 1,083,105 | |
Less: accumulated depreciation | | | (109,337 | ) | | | (75,652 | ) |
| | | | | | | | |
| | | 980,941 | | | | 1,007,453 | |
Cash and cash equivalents, including restricted cash | | | 18,688 | | | | 17,330 | |
Rents, deferred rents and other receivables, net | | | 17,878 | | | | 16,889 | |
Deferred charges, net | | | 43,399 | | | | 55,760 | |
Other assets | | | 5,872 | | | | 11,009 | |
| | | | | | | | |
Total assets | | $ | 1,066,778 | | | $ | 1,108,441 | |
| | | | | | | | |
Liabilities and Members’ Equity | | | | | | | | |
Mortgage loans | | $ | 807,101 | | | $ | 809,935 | |
Accounts payable, accrued interest payable and other liabilities | | | 25,427 | | | | 25,114 | |
Acquired below-market leases, net | | | 7,903 | | | | 12,418 | |
| | | | | | | | |
Total liabilities | | | 840,431 | | | | 847,467 | |
| | |
Members’ equity | | | 226,347 | | | | 260,974 | |
| | | | | | | | |
Total liabilities and members’ equity | | $ | 1,066,778 | | | $ | 1,108,441 | |
| | | | | | | | |
The aggregate amount of the joint venture’s mortgage loans maturing in the next five years is as follows (in thousands):
| | | |
2009 | | $ | 2,984 |
2010 | | | 139,427 |
2011 | | | 106,963 |
2012 | | | 1,330 |
2013 | | | 1,406 |
Thereafter | | | 554,991 |
| | | |
| | $ | 807,101 |
| | | |
Except for the One California Plaza and Cerritos Corporate Center loans, the joint venture’s mortgage loans require the payment of interest-only until maturity. The joint venture is currently making monthly principal payments on its One California Plaza loan and, beginning in 2011, will be making monthly principal payments on its Cerritos Corporate Center loan based on a 30-year amortization table.
The weighted average interest rate on the joint venture’s mortgage loans was 5.27% as of December 31, 2008 and 2007.
103
MAGUIRE PROPERTIES, INC.
NOTES TO CONSOLIDATED FINANCIAL STATEMENTS—(continued)
The joint venture’s condensed statements of operations are as follows (in thousands):
| | | | | | | | | | | | |
| | | For the Year Ended
December 31, | | | Period from
January 5, 2006 to
December 31, 2006 | |
| | | 2008 | | | 2007 | | |
Revenue: | | | | | | | | | | | | |
Rental | | $ | 88,005 | | | $ | 83,108 | | | $ | 75,982 | |
Tenant reimbursements | | | 25,383 | | | | 30,100 | | | | 28,649 | |
Parking | | | 8,801 | | | | 8,924 | | | | 7,666 | |
Interest and other | | | 2,621 | | | | 482 | | | | 1,537 | |
| | | | | | | | | | | | |
Total revenue | | | 124,810 | | | | 122,614 | | | | 113,834 | |
| | | | | | | | | | | | |
Expenses: | | | | | | | | | | | | |
Rental property operating and maintenance | | | 25,944 | | | | 24,982 | | | | 23,809 | |
Real estate taxes | | | 11,566 | | | | 14,497 | | | | 12,529 | |
Parking | | | 1,740 | | | | 1,757 | | | | 1,603 | |
Depreciation and amortization | | | 47,791 | | | | 48,819 | | | | 52,322 | |
Interest | | | 43,846 | | | | 43,849 | | | | 43,350 | |
Other | | | 5,550 | | | | 4,608 | | | | 4,227 | |
| | | | | | | | | | | | |
Total expenses | | | 136,437 | | | | 138,512 | | | | 137,840 | |
| | | | | | | | | | | | |
Net loss | | $ | (11,627 | ) | | $ | (15,898 | ) | | $ | (24,006 | ) |
| | | | | | | | | | | | |
Company share | | $ | (2,325 | ) | | $ | (3,180 | ) | | $ | (4,801 | ) |
Intercompany eliminations | | | 1,233 | | | | 1,031 | | | | 1,055 | |
| | | | | | | | | | | | |
Equity in net loss of unconsolidated joint venture | | $ | (1,092 | ) | | $ | (2,149 | ) | | $ | (3,746 | ) |
| | | | | | | | | | | | |
In accordance with the joint venture agreement, Maguire Properties, L.P. and Macquarie Office Trust have rights of first offer to co-invest in any Southern California acquisition opportunities meeting certain defined criteria that the other party intends to acquire. In addition, Macquarie Office Trust has a right to acquire up to a 50% interest in our development projects at Quintana Campus and San Diego Tech Center at 92.5% of stabilized value, which will be determined when the projects are 90% leased.
DH Von Karman Maguire, LLC
In 2007, we contributed our office property located at 18301 Von Karman in Irvine, California to DH Von Karman Maguire, LLC for an agreed upon value of approximately $112 million, less approximately $2 million of credits and the transfer of loan reserves of approximately $7 million in connection with the joint venture’s assumption of the existing $95 million mortgage loan on the property. We retain a 1% common equity interest and a 2% preferred interest in DH Von Karman Maguire, LLC.
In connection with the contribution of 18301 Von Karman, we entered into a master lease with DH Von Karman SPE, LLC. During 2008 and 2007, we paid DH Von Karman SPE, LLC $1.6 million and $0.3 million, respectively, related to this lease. We have no further obligation under this master lease as of December 31, 2008.
104
MAGUIRE PROPERTIES, INC.
NOTES TO CONSOLIDATED FINANCIAL STATEMENTS—(continued)
Note 7—Mortgage and Other Secured Loans
Consolidated Debt
Our consolidated debt is as follows (in thousands, except percentages):
| | | | | | | | | | | |
| | | | | | | Principal Outstanding as of |
| | | Maturity Date | | Interest Rate | | December 31, 2008 | | | December 31, 2007 |
Floating-Rate Debt | | | | | | | | | | | |
Repurchase facility(1) | | 5/1/2011 | | LIBOR + 1.75% | | $ | 35,000 | | | $ | — |
Construction Loans: | | | | | | | | | | | |
3161 Michelson(2) | | 9/28/2009 | | LIBOR + 3.00% | | | 168,719 | | | | 210,325 |
Lantana Media Campus(3) | | 6/13/2009 | | LIBOR + 3.00% | | | 79,953 | | | | 40,639 |
17885 Von Karman | | 6/30/2010 | | Greater of 5% or
Prime + 0.50% | | | 24,145 | | | | 25,935 |
2385 Northside Drive | | 8/6/2010 | | Greater of 5% or
Prime + 0.50% | | | 13,991 | | | | 17,568 |
207 Goode(4) | | 5/1/2010 | | LIBOR + 1.80% | | | 9,133 | | | | — |
| | | | | | | | | | | |
Total construction loans | | | | | | | 295,941 | | | | 294,467 |
| | | | | | | | | | | |
Variable-Rate Mortgage Loans: | | | | | | | | | | | |
Griffin Towers(5) | | 5/1/2010 | | (Greater of LIBOR
or 3%) + 3.5% | | | 125,000 | | | | — |
Griffin Towers | | 5/1/2008 | | LIBOR + 1.90% | | | — | | | | 200,000 |
Plaza Las Fuentes(6) | | 9/29/2010 | | LIBOR + 3.25% | | | 99,800 | | | | — |
500-600 City Parkway(7) | | 5/9/2010 | | LIBOR + 1.35% | | | 98,751 | | | | 97,750 |
Brea Corporate Place(8) | | 5/1/2010 | | LIBOR + 1.95% | | | 70,469 | | | | 70,468 |
Brea Financial Commons(8) | | 5/1/2010 | | LIBOR + 1.95% | | | 38,532 | | | | 38,532 |
| | | | | | | | | | | |
Total variable-rate mortgage loans | | | | | | | 432,552 | | | | 406,750 |
| | | | | | | | | | | |
Variable-Rate Swapped to Fixed-Rate: | | | | | | | | | | | |
KPMG Tower(9) | | 10/9/2012 | | LIBOR + 1.60% | | | 399,318 | | | | 368,370 |
207 Goode(4) | | 5/1/2010 | | LIBOR + 1.80% | | | 25,000 | | | | 476 |
| | | | | | | | | | | |
Total variable-rate swapped to fixed-rate loans | | | | | | | 424,318 | | | | 368,846 |
| | | | | | | | | | | |
Total floating-rate debt | | | | | | | 1,187,811 | | | | 1,070,063 |
| | | | | | | | | | | |
Fixed-Rate Debt | | | | | | | | | | | |
Wells Fargo Tower | | 4/6/2017 | | 5.68% | | | 550,000 | | | | 550,000 |
Two California Plaza(10) | | 5/6/2017 | | 5.50% | | | 466,217 | | | | 465,762 |
Gas Company Tower | | 8/11/2016 | | 5.10% | | | 458,000 | | | | 458,000 |
Pacific Arts Plaza | | 4/1/2012 | | 5.15% | | | 270,000 | | | | 270,000 |
777 Tower(10) | | 11/1/2013 | | 5.84% | | | 269,835 | | | | 269,180 |
US Bank Tower | | 7/1/2013 | | 4.66% | | | 260,000 | | | | 260,000 |
550 South Hope Street(10) | | 5/6/2017 | | 5.67% | | | 198,444 | | | | 198,257 |
Park Place I | | 11/1/2014 | | 5.64% | | | 170,000 | | | | 170,000 |
City Tower(10) | | 5/10/2017 | | 5.85% | | | 139,834 | | | | 139,814 |
Glendale Center | | 8/11/2016 | | 5.82% | | | 125,000 | | | | 125,000 |
500 Orange Tower(10) | | 5/6/2017 | | 5.88% | | | 109,127 | | | | 109,022 |
2600 Michelson(10) | | 5/10/2017 | | 5.69% | | | 109,101 | | | | 108,993 |
Park Place II | | 3/11/2012 | | 5.39% | | | 99,268 | | | | 100,000 |
Stadium Towers Plaza(10) | | 5/11/2017 | | 5.78% | | | 99,213 | | | | 99,119 |
Lantana Media Campus | | 1/6/2010 | | 4.94% | | | 98,000 | | | | 98,000 |
801 North Brand | | 4/6/2015 | | 5.73% | | | 75,540 | | | | 75,540 |
Mission City Corporate Center | | 4/1/2012 | | 5.09% | | | 52,000 | | | | 52,000 |
The City—3800 Chapman | | 5/6/2017 | | 5.93% | | | 44,370 | | | | 44,370 |
701 North Brand | | 10/1/2016 | | 5.87% | | | 33,750 | | | | 33,750 |
700 North Central | | 4/6/2015 | | 5.73% | | | 27,460 | | | | 27,460 |
Griffin Towers Senior Mezzanine | | 5/1/2011 | | 13.00% | | | 20,000 | | | | — |
18581 Teller(10) | | 5/6/2017 | | 5.65% | | | 19,839 | | | | 19,820 |
| | | | | | | | | | | |
Total fixed-rate debt | | | | | | | 3,694,998 | | | | 3,674,087 |
| | | | | | | | | | | |
Properties disposed of during 2008: | | | | | | | | | | | |
City Plaza | | 5/10/2017 | | 5.80% | | | — | | | | 99,984 |
1920 Main Plaza | | 5/10/2017 | | 5.51% | | | — | | | | 80,135 |
2010 Main Plaza | | 5/10/2017 | | 5.51% | | | — | | | | 79,072 |
| | | | | | | | | | | |
Total properties disposed of during 2008 | | | | | | | — | | | | 259,191 |
| | | | | | | | | | | |
Total consolidated debt | | | | | | | 4,882,809 | | | | 5,003,341 |
Less: mortgage loan associated with real estate held for sale | | | | | | | (168,719 | ) | | | — |
| | | | | | | | | | | |
Total debt – continuing operations | | | | | | $ | 4,714,090 | | | $ | 5,003,341 |
| | | | | | | | | | | |
105
MAGUIRE PROPERTIES, INC.
NOTES TO CONSOLIDATED FINANCIAL STATEMENTS—(continued)
| (1) | This loan bears interest at a variable rate of (i) LIBOR plus 1.75% for the first year, (ii) LIBOR plus 2.75% for the second year and (iii) LIBOR plus 3.75% for the third year. |
| (2) | As required by the loan agreement, we have entered into an interest rate cap agreement that limits the LIBOR portion of the interest rate to 5.50% for 75.0% of the maximum loan balance during the loan term, excluding extension periods. Two one-year extensions are available at our option, subject to certain conditions. As of December 31, 2008, our 3161 Michelson property is classified as held for sale. |
| (3) | One one-year extension is available at our option, subject to certain conditions. |
| (4) | This loan bears interest at a rate of LIBOR plus 1.80%. We have entered into an interest rate swap agreement to hedge this loan up to $25.0 million, which effectively fixes the LIBOR rate at 5.564%. One one-year extension is available at our option, subject to certain conditions. |
| (5) | This loan bears interest at a rate of the greater of LIBOR or 3.00%, plus 3.50%. As required by the loan agreement, we have entered into an interest rate cap agreement that limits the LIBOR portion of the interest rate to 5.00% during the loan term, excluding the extension period. One one-year extension is available at our option, subject to certain conditions. |
| (6) | As required by the loan agreement, we have entered into an interest rate cap agreement that limits the LIBOR portion of the interest rate to 4.75% during the loan term, excluding extension periods. Three one-year extensions are available at our option, subject to certain conditions. |
| (7) | As required by the loan agreement, we have entered into an interest rate cap agreement that limits the LIBOR portion of the interest rate to 6.00% during the loan term, excluding extension periods. Two one-year extensions are available at our option, subject to certain conditions. |
| (8) | As required by the loan agreement, we have entered into an interest rate cap agreement that limits the LIBOR portion of the interest rate to 6.50% during the loan term, excluding extension periods. Two one-year extensions are available at our option, subject to certain conditions. |
| (9) | This loan bears interest at a rate of LIBOR plus 1.60%. We have entered into an interest rate swap agreement to hedge this loan, which effectively fixes the LIBOR rate at 5.564%. |
| (10) | These loans are reflected net of the related debt discount. At December 31, 2008, the discount for all loans referenced totals approximately $11 million. |
The majority of our debt requires the payment of interest-only until maturity. We are currently making monthly principal payments on our Park Place II loan, based on a 30-year amortization table, and $0.1 million per month on our Plaza Las Fuentes loan, as specified in the loan agreement. Our annual repayments in 2009, 2010 and 2011 for our Griffin Towers repurchase facility are in the amounts specified in the loan agreement. Beginning in 2010, we will begin making monthly principal payments on our Park Place I loan based on a 30-year amortization table.
As of December 31, 2008 and 2007, one-month LIBOR was 0.44% and 4.60%, respectively, while the prime rate was 3.25% as of December 31, 2008. The weighted average interest rate of our consolidated debt was 5.37% and 5.76% as of December 31, 2008 and 2007, respectively.
The aggregate amount of our consolidated debt to be repaid in the next five years is as follows (in thousands):
| | | |
2009 | | $ | 261,138 |
2010 | | | 615,119 |
2011 | | | 38,627 |
2012 | | | 819,286 |
2013 | | | 532,477 |
Thereafter | | | 2,616,162 |
| | | |
| | $ | 4,882,809 |
| | | |
As of December 31, 2008, $1.1 billion of our consolidated debt may be prepaid without penalty, $2.0 billion may be defeased after various lock-out periods (as defined in the underlying loan agreements), $0.4 billion
106
MAGUIRE PROPERTIES, INC.
NOTES TO CONSOLIDATED FINANCIAL STATEMENTS—(continued)
contains restrictions that would require the payment of prepayment penalties for the repayment of debt prior to various dates (as specified in the underlying loan agreements) and $1.4 billion may be prepaid with prepayment penalties or defeased after various lock-out periods (as defined in the underlying loan agreements) at our option.
In connection with the issuance of non-recourse mortgage loans secured by certain wholly owned subsidiaries of our Operating Partnership, our Operating Partnership provided various forms of partial guaranties to the lenders originating those loans. These guaranties are contingent obligations that could give rise to defined amounts of recourse against our Operating Partnership, should the wholly owned subsidiaries be unable to satisfy certain obligations under otherwise non-recourse mortgage loans. These guaranties are in the form of (1) master leases whereby our Operating Partnership agreed to guarantee the payment of rents and/or re-tenanting costs for certain tenant leases existing at the time of loan origination should the tenants not satisfy their obligations through their lease term, (2) the guaranty of debt service payments (as defined in the applicable loan documents) for a period of time (but not the guaranty of repayment of principal), (3) master leases of a defined amount of space over a defined period of time, with offsetting credit received for actual rents collected through third-party leases entered into with respect to the master leased space, and (4) customary repayment guaranties under construction loans. These are partial guaranties of certain non-recourse mortgage debt of wholly owned subsidiaries of our Operating Partnership, for which the interest expense and debt is included in our consolidated financial statements. See Item 7. “Management’s Discussion and Analysis of Financial Condition and Results of Operations – Indebtedness – Operating Partnership Contingent Obligations” for a discussion of these arrangements.
Except as described in Item 7. “Management’s Discussion and Analysis of Results of Operations and Financial Condition – Indebtedness – Operating Partnership Contingent Obligations,” the separate assets and liabilities of our property-specific subsidiaries are neither available to pay the debts of the consolidated entity nor constitute obligations of the consolidated entity, respectively.
Amounts Available for Future Funding under Construction Loans
A summary of our construction loans as of December 31, 2008 is as follows (in thousands):
| | | | | | | | | | | | |
Project | | Maximum Loan
Amount | | Balance as of
December 31, 2008 | | Available for Future
Funding | | Operating Partnership
Repayment
Guarantee |
3161 Michelson | | $ | 190,696 | | $ | 168,719 | | $ | 21,977 | | $ | 24,000 |
Lantana Media Campus | | | 88,000 | | | 79,953 | | | 8,047 | | | 22,000 |
207 Goode | | | 64,497 | | | 34,133 | | | 30,364 | | | 34,133 |
17885 Von Karman | | | 33,600 | | | 24,145 | | | 9,455 | | | 6,720 |
2385 Northside Drive | | | 19,860 | | | 13,991 | | | 5,869 | | | 3,972 |
| | | | | | | | | | | | |
| | $ | 396,653 | | $ | 320,941 | | $ | 75,712 | | | |
| | | | | | | | | | | | |
Amounts shown as available for future funding as of December 31, 2008 represent funds that can be drawn to pay for remaining project development costs, including construction, tenant improvement and leasing costs.
Each of our construction loans is guaranteed by our Operating Partnership. The amounts guaranteed at any point in time are based on the stage of the development cycle that the project is in and are subject to reduction when certain financial ratios have been met. For our project at 3161 Michelson, the $24.0 million is guaranteed until the loan is repaid.
107
MAGUIRE PROPERTIES, INC.
NOTES TO CONSOLIDATED FINANCIAL STATEMENTS—(continued)
2008 Financing and Refinancing Activity
Plaza Las Fuentes –
On September 29, 2008, we completed a $100.0 million financing secured by Plaza Las Fuentes and the Westin® Pasadena Hotel. Net proceeds totaled approximately $95 million, of which approximately $65 million was used to extend three of our construction loans, including paying down principal balances, securing letters of credit, funding leasing reserves, and paying closing costs (as described below), leaving approximately $30 million available for general corporate purposes.
This loan bears interest at (i) LIBOR plus 3.25% or (ii) the base rate, as defined in the loan agreement, plus 2.25%. This loan matures on September 29, 2010, with three one-year extensions available at our option, subject to certain conditions. As required by the loan agreement, we entered into an interest rate cap agreement which limits the LIBOR portion of the interest rate to 4.75% during the loan term, excluding extension periods. This loan requires principal payments of $100.0 thousand per month during the term of the loan, including any extension periods. Additional principal paydowns will be required if the property’s debt service coverage ratio (as defined in the loan agreement) is less than specified amounts as of the applicable quarterly measurement date.
The terms of the Plaza Las Fuentes loan require our Operating Partnership to comply with financial ratios relating to minimum amounts of tangible net worth, interest coverage, fixed charge coverage and cash liquidity, and a maximum amount of leverage.
In connection with this loan, our Operating Partnership entered into guarantees for space leased to certain tenants at Plaza Las Fuentes. See Item 7. “Management’s Discussion and Analysis of Results of Operations and Financial Condition – Indebtedness – Operating Partnership Contingent Obligations – Plaza Las Fuentes Mortgage Guarantee Obligations” for a discussion of this guaranty.
Griffin Towers –
On April 21, 2008, we repaid the existing $200.0 million mortgage loan secured by Griffin Towers. The repayment was funded through the issuance of $180.0 million in new debt and $20.0 million of cash on hand.
The new debt is comprised of (i) a $125.0 million mortgage loan (the “Mortgage Loan”) secured by Griffin Towers, (ii) a $20.0 million senior mezzanine loan (the “Senior Mezzanine Loan”) secured by an equity interest in Griffin Towers and (iii) a $55.0 million junior mezzanine loan secured by an equity interest in Griffin Towers. Simultaneously at closing, our Operating Partnership repurchased the $55.0 million junior mezzanine loan which was funded through a separate $35.0 million repurchase facility (the “Repurchase Facility”) issued by the lender and $20.0 million of cash on hand. The Repurchase Facility is recourse to our Operating Partnership and secured by the $55.0 million intercompany junior mezzanine loan on Griffin Towers. The net effect of these financing transactions was the issuance of $145.0 million in new mortgage and mezzanine loans secured by Griffin Towers and $35.0 million in new secured recourse debt issued by our Operating Partnership.
The Mortgage Loan bears interest at a variable rate of LIBOR plus 3.5% (with a LIBOR floor of 3.0%) and matures on May 1, 2010, with a one-year extension available at our option. We purchased an interest rate cap agreement which caps LIBOR at 5% during the initial term. The Senior Mezzanine Loan bears interest at a fixed rate of 13.0% per annum and matures on May 1, 2011.
The Repurchase Facility bears interest at a variable rate of (i) LIBOR plus 1.75% through and including May 31, 2009, (ii) LIBOR plus 2.75% from June 1, 2009 through and including May 31, 2010 and (iii) LIBOR
108
MAGUIRE PROPERTIES, INC.
NOTES TO CONSOLIDATED FINANCIAL STATEMENTS—(continued)
plus 3.75% from June 1, 2010 and thereafter. The Repurchase Facility requires repayments of $10.0 million on June 1, 2009 and June 1, 2010 with the remaining balance due upon maturity on May 1, 2011.
2008 Loan Extensions
3161 Michelson –
On September 29, 2008, we extended our 3161 Michelson construction loan for a period of one year. The loan is now scheduled to mature on September 28, 2009. The amended loan bears interest at (i) LIBOR plus 3.00% or (ii) the base rate, as defined in the original loan agreement, plus 2.25%. There are two one-year extension periods available under this loan at our option, subject to certain conditions. As required by the amended loan agreement, we entered into an interest rate cap agreement which limits the LIBOR portion of the interest rate to 5.50% for 75% of the maximum available amount as of the extension.
As part of the conditions to extend the maturity date of this loan, we made a principal payment totaling $33.0 million and funded a $7.5 million increase in tenant improvement reserves using proceeds from the financing of Plaza Las Fuentes. Subsequent to the refinancing of this loan, the principal balance of this loan was reduced by $16.3 million using funds received by the lender, mainly from drawdowns of standby letters of credit and sweeping of restricted cash held in accounts controlled by the lender.
The terms of the amended loan agreement require our Operating Partnership to comply with financial ratios relating to minimum amounts of tangible net worth, interest coverage and fixed charge coverage, and a maximum amount of leverage.
In connection with this loan, our Operating Partnership has entered into certain guaranties, some of which were modified by the amended loan agreement. See Item 7. “Management’s Discussion and Analysis of Financial Condition and Results of Operations – Indebtedness – Operating Partnership Contingent Obligations – 3161 Michelson Master Lease Obligations.”
17885 Von Karman –
On September 30, 2008, we extended our 17885 Von Karman construction loan for a period of eighteen months. This loan is now scheduled to mature on June 30, 2010. The modified loan bears interest at (i) LIBOR plus 2.50% or (ii) the base rate, as defined in the modification agreement, plus 0.50%. A floor interest rate of 5.00% applies to both LIBOR and base rate loans. As part of the conditions to extend the maturity date of this loan, we made a principal payment of $4.8 million using proceeds received from the financing of Plaza Las Fuentes.
2385 Northside Drive –
On September 30, 2008, we extended our 2385 Northside Drive construction loan for a period of eighteen months. This loan is now scheduled to mature on August 6, 2010. The modified loan bears interest at (i) LIBOR plus 2.50% or (ii) the base rate, as defined in the modification agreement, plus 0.50%. A floor interest rate of 5.00% applies to both LIBOR and base rate loans. As part of the conditions to extend the maturity date of this loan, we made a principal payment of $6.5 million using proceeds received from the financing of Plaza Las Fuentes.
City Parkway –
On October 31, 2008, we exercised our first one-year extension option available under the City Parkway mortgage, which now matures on May 9, 2010. We have two one-year extensions available at our option that
109
MAGUIRE PROPERTIES, INC.
NOTES TO CONSOLIDATED FINANCIAL STATEMENTS—(continued)
would allow us to extend the maturity of this loan to May 9, 2012, subject to certain conditions. The terms of the extended loan remain the same as the original loan, including the interest rate spread. As required by the modified loan agreement, we have entered into an interest rate cap agreement that limits the LIBOR portion of the interest rate to 6.00% during the loan term, excluding extension periods.
Brea Corporate Place and Brea Financial Commons –
On November 3, 2008, we exercised our first one-year extension option available under the mortgage loan secured by Brea Corporate Place and Brea Financial Commons. This loan now matures on May 1, 2010. We have two one-year extensions available at our option that would allow us to extend the maturity of this loan to May 1, 2012, subject to certain conditions. The terms of the extended loan remain the same as the original loan, including the interest rate spread. As required by the modified loan agreement, we have entered into an interest rate cap agreement that limits the LIBOR portion of the interest rate to 6.50% during the loan term, excluding extension periods.
2008 Dispositions
We disposed of two office properties during 2008: 1920 and 2010 Main Plaza and City Plaza. A total of $261.7 million in mortgage loans related to these properties were assumed by the buyers upon disposal. A loss from early extinguishment of debt totaling $1.8 million was recorded as part of discontinued operations in 2008 related to the writeoff of unamortized loan costs on these loans.
2007 Financing and Refinancing Activity
Wells Fargo Tower –
We completed a new $550.0 million, ten-year fixed-rate interest-only financing on the Wells Fargo Tower in April 2007. This mortgage loan bears interest at a fixed rate of 5.68% and matures in April 2017. The net proceeds from the financing, after repayment of the existing $247.1 million mortgage loan and payment of defeasance costs, closing costs and loan reserves, were approximately $290 million. The net proceeds were used to fund $175.0 million of the purchase price for the Southern California Equity Office Properties portfolio (the “Blackstone Transaction”) and for general corporate purposes. A loss from early extinguishment of debt of $4.3 million was recorded in 2007 as part of continuing operations in connection with the defeasance of the $247.1 million mortgage loan.
KPMG Tower –
We also completed a new $400.0 million, five-year variable-rate interest-only refinancing for our KPMG Tower property in September 2007. This mortgage loan bears interest at a variable rate of LIBOR plus 1.60%. We entered into an interest rate swap agreement to hedge this loan, which effectively fixes the LIBOR rate at 5.564%, resulting in an all inclusive rate of 7.16%.
The net proceeds from the KPMG Tower refinancing, after repayment of the existing $210.0 million mortgage loan and payment of closing costs and loan reserves, were approximately $130 million. The net proceeds were used to repay the outstanding balance on our term loan and for general corporate purposes. A loss from early extinguishment of debt of $8.4 million was recorded as part of continuing operations during 2007 in connection with the refinancing of this loan.
110
MAGUIRE PROPERTIES, INC.
NOTES TO CONSOLIDATED FINANCIAL STATEMENTS—(continued)
Blackstone Transaction –
We purchased 24 office properties and 11 development sites in the Blackstone Transaction, of which eight of the office properties and three of the development sites were determined to be non-core assets and were subsequently disposed of. We secured mortgage financing for the remaining 16 office properties. In connection with these financings, we entered into interest rate cap agreements for the variable-rate loans and an interest rate swap agreement for the fixed-rate mortgage loans.
The interest rate swap agreement was assigned to each of the three lenders that provided fixed-rate mortgages for the properties acquired in the Blackstone Transaction in exchange for lower stated interest rates on the underlying debt. The deferred gain on the assignment of the swap agreement was recorded in accumulated other comprehensive loss in the consolidated balance sheet and is being amortized as a reduction of interest expense in the consolidated statement of operations over the life of the swap. The corresponding debt discount was recorded in the consolidated balance sheet as a reduction of the principal amount of the underlying debt and is being amortized as an increase to interest expense in the consolidated statement of operations over the life of the swap.
We obtained a $223.0 million, five-year, interest-only bridge mortgage loan to help fund the Blackstone Transaction. We used net proceeds received from the subsequent disposition of certain properties acquired in the Blackstone Transaction to fully repay this loan in 2007. A loss from early extinguishment of debt totaling $1.5 million was recorded in continuing operations during 2007 in connection with the repayment of the bridge loan.
2385 Northside Drive –
We entered into a $26.8 million variable-rate construction loan for our development project at Mission City Corporate Center located in San Diego, California in 2007.
Lantana Media Campus –
We entered into an $88.0 million variable-rate construction loan for our development project at the Lantana Media Campus located in Santa Monica, California in 2007.
207 Goode –
In 2007, we entered into a variable-rate construction loan for our development project at 207 Goode Avenue located in Glendale, California. The first $25.0 million of this loan has been hedged using an interest rate swap that effectively fixes the LIBOR rate at 5.564%.
2007 Dispositions and Paydowns
We acquired eight office properties and three development sites as part of the Blackstone Transaction in April 2007: Inwood Park, 1201 Dove Street, Fairchild Corporate Center, Redstone Plaza, Bixby Ranch, Lincoln Town Center, Tower 17, 1100 Executive Tower and the Inwood Park, Bixby Ranch and 1100 Executive Tower development sites. We disposed of these properties shortly after their acquisition. A total of $274.0 million of the debt encumbered by these properties was assumed by the buyers upon disposition while $238.9 million was repaid. A loss from early extinguishment of debt totaling $8.6 million was recorded as part of discontinued operations in 2007 related to these loans.
111
MAGUIRE PROPERTIES, INC.
NOTES TO CONSOLIDATED FINANCIAL STATEMENTS—(continued)
We disposed of three office properties: Wateridge Plaza, Pacific Center and Regents Square. The mortgage loans related to Pacific Center and Regents Square totaling $224.8 million were assumed by the buyers upon disposal while the Wateridge Plaza loans totaling $62.9 million were repaid upon disposition. A loss from early extinguishment of debt totaling $1.3 million was recorded as part of discontinued operations in 2007 related to these loans.
We contributed our office property located at 18301 Von Karman in Irvine, California to a joint venture with DH Von Karman Maguire, LLC in October 2007. The $95.0 million mortgage loan related to this property was assumed by the joint venture. A loss from early extinguishment of debt totaling $0.8 million was recorded as part of continuing operations in 2007 related to this loan.
We paid down $10.0 million on our City Plaza mortgage loan.
Corporate Credit Facility
In connection with the Blackstone Transaction, we obtained a $530.0 million corporate credit facility, which was comprised of a $400.0 million term loan and the Revolver. The term loan was completely drawn and then repaid during 2007.
Concurrent with the completion of the financing of Plaza Las Fuentes, we terminated the Revolver. All standby letters of credit that were secured by the Revolver have been continued with the issuing financial institution and are no longer secured by the Revolver. A loss from early extinguishment of debt totaling $1.5 million was recorded as part of continuing operations in 2008 related to the writeoff of unamortized loan costs upon the termination of this facility.
Debt Covenants
The terms of the 3161 Michelson construction loan and the Plaza Las Fuentes mortgage require our Operating Partnership to comply with financial ratios relating to minimum amounts of tangible net worth, interest coverage, fixed charge coverage, liquidity (Plaza Las Fuentes only) and maximum leverage. Certain of our other construction loans require our Operating Partnership to comply with minimum amounts of tangible net worth and liquidity. We were in compliance with such covenants as of December 31, 2008.
As described above, concurrent with the completion of the financing of Plaza Las Fuentes, we terminated the Revolver. Our Lantana Media Campus construction loan previously included negative financial covenants that were the same as those in the Revolver. In November 2008, the lenders agreed to amend the Lantana Media Campus construction loan to replace the financial covenants with tangible net worth and liquidity covenants applicable to the Company. We were in compliance with such covenants as of December 31, 2008.
Note 8—Minority Interests
Minority interests relate to the interests in our Operating Partnership that are not owned by Maguire Properties, Inc. In conjunction with the formation of Maguire Properties, Inc., Mr. Maguire, entities controlled by Mr. Maguire, and certain other persons and entities who contributed ownership interests in properties to our Operating Partnership received limited partnership units in our Operating Partnership.
Operating Partnership units have essentially the same economic characteristics as shares of our common stock as they share equally in the net income or loss and distributions of our Operating Partnership. Our limited partners have the right to redeem all or part of their Operating Partnership units at any time. At the time of
112
MAGUIRE PROPERTIES, INC.
NOTES TO CONSOLIDATED FINANCIAL STATEMENTS—(continued)
redemption, we have the right to determine whether to redeem the Operating Partnership units for cash, based upon the fair market value of an equivalent number of shares of our common stock at the time of redemption, or exchange them for shares of our common stock on a one-for-one basis, subject to adjustment in the event of stock splits, stock dividends, issuance of stock rights, specified extraordinary distribution and similar events.
During 2008 and 2006, we issued 731,343 shares and 587,863 shares, respectively, of our common stock in exchange for Operating Partnership units redeemed by our limited partners. There were no Operating Partnership units redeemed during 2007.
As of December 31, 2008 and 2007, 6,674,573 shares and 7,405,916 shares, respectively, of our common stock were reserved for issuance upon conversion of outstanding Operating Partnership units. As of December 31, 2008 and 2007, the aggregate redemption value of outstanding limited partnership units in our Operating Partnership was approximately $9.7 million and $218.3 million, respectively.
As of December 31, 2008, our limited partners’ ownership interest in Maguire Properties, L.P. was approximately 12.2%, while their ownership interest as of December 31, 2007 was approximately 13.6%.
During the three months ended September 30, 2008 and December 31, 2008, we did not allocate any of our net loss to our minority partners as their investment in the equity of our Operating Partnership was reduced to zero during the second quarter of 2008. In accordance with Accounting Research Bulletin No. 51,Consolidated Financial Statements, we allocated $33.3 million of losses during 2008 to our common stockholders that would have been allocated to our minority partners if they had basis. Should we record net income in future periods, we will allocate 100% of such income to our common stockholders until such point in time that the losses in excess of our minority partners’ basis previously allocated to our common stockholders is restored. During 2007 and 2006, our limited partners’ weighted average share of our net income (loss) available to common stock holders was approximately 13.6% and 13.9%, respectively.
Note 9—Stockholders’ (Deficit) Equity
Preferred Stock
We are authorized to issue up to 50.0 million shares of $0.01 par value 7.625% Series A Cumulative Redeemable Preferred Stock, of which 10.0 million shares were outstanding as of December 31, 2008 and 2007.
Our Series A Preferred Stock does not have a stated maturity and is not subject to any sinking fund or mandatory redemption provisions. Upon liquidation, dissolution or winding up, our Series A Preferred Stock will rank senior to our common stock with respect to the payment of distributions. We are not allowed to redeem our Series A Preferred Stock before January 30, 2009, except in limited circumstances to preserve our status as a REIT. On or after January 30, 2009, we may, at our option, redeem our Series A Preferred Stock, in whole or in part, for cash at a redemption price of $25.00 per share, plus all accumulated and unpaid dividends on such Series A Preferred Stock up to and including the redemption date. Holders of our Series A Preferred Stock generally have no voting rights except for limited voting rights if we fail to pay dividends for six or more quarterly periods (whether or not consecutive) and in certain other events. Our Series A Preferred Stock is not convertible into or exchangeable for any other property or securities of our company.
Preferred Units
We own 10.0 million 7.625% Series A Cumulative Preferred Units, representing limited partnership units in our Operating Partnership, the terms of which have essentially the same economic characteristics as the Series A Preferred Stock.
113
MAGUIRE PROPERTIES, INC.
NOTES TO CONSOLIDATED FINANCIAL STATEMENTS—(continued)
Common Stock
We are authorized to issue up to 100.0 million shares of $0.01 par value common stock, of which 48.0 million and 47.2 million shares were outstanding as of December 31, 2008 and 2007, respectively.
Distributions
Certain income and expense items are accounted for differently for financial reporting and income tax purposes. Earnings and profits, which determine the taxability of distributions to stockholders, will differ from the net income or loss reported in our consolidated statements of operations due to these differences.
Our board of directors did not declare a dividend on our common stock during 2008. The actual amount and timing of distributions in 2009 and beyond, if any, will be at the discretion of our board of directors and will depend upon our financial condition in addition to the requirements of the Code, and no assurance can be given as to the amounts or timing of future distributions.
On December 19, 2008, our board of directors, as part of its capital management initiatives, suspended the payment of dividends on our Series A Preferred Stock. Dividends on our Series A Preferred Stock are cumulative, and therefore, will continue to accrue at an annual rate of $1.9064 per share.
The following table reconciles the dividends declared per common share to the dividends paid per common share during 2008, 2007 and 2006:
| | | | | | | | | | | |
| | | For the Year Ended December 31, | |
| | | 2008 | | 2007 | | | 2006 | |
Dividends declared per common share | | $ | — | | $ | 1.6000 | | | $ | 1.6000 | |
Deduct: Dividends declared in the current year and paid in the
following year | | | — | | | (0.4000 | ) | | | (0.4000 | ) |
Add: Dividends declared in the prior year and paid in the
current year | | | 0.4000 | | | 0.4000 | | | | 0.4000 | |
| | | | | | | | | | | |
Dividends paid per common share | | $ | 0.4000 | | $ | 1.6000 | | | $ | 1.6000 | |
| | | | | | | | | | | |
The income tax treatment for dividends reportable for our common stock for 2008, 2007 and 2006 is as follows (unaudited):
| | | | | | | | | | | | | | | | | | |
| | | Common Stock Distribution Characterization (Per Share) | |
| | | For the Year Ended December 31, | |
| | | 2008 | | | 2007 | | | 2006 | |
Ordinary income | | $ | — | | — | | | $ | — | | — | | | $ | 0.0188 | | 1.18 | % |
Capital gain | | | — | | — | | | | 1.4144 | | 88.40 | % | | | 0.0140 | | 0.87 | % |
Return of capital | | | 0.4000 | | 100.00 | % | | | 0.1856 | | 11.60 | % | | | 1.5672 | | 97.95 | % |
| | | | | | | | | | | | | | | | | | |
| | $ | 0.4000 | | 100.00 | % | | $ | 1.6000 | | 100.00 | % | | $ | 1.6000 | | 100.00 | % |
| | | | | | | | | | | | | | | | | | |
114
MAGUIRE PROPERTIES, INC.
NOTES TO CONSOLIDATED FINANCIAL STATEMENTS—(continued)
The income tax treatment for dividends on our Series A Preferred Stock for 2008, 2007 and 2006 is as follows (unaudited):
| | | | | | | | | | | | | | | | | | | |
| | | Series A Preferred Stock Distribution Characterization (Per Share) | |
| | | For the Year Ended December 31, | |
| | | 2008 | | | 2007 | | | 2006 | |
Ordinary income | | $ | — | | — | | | $ | — | | $ | — | | | $ | 1.0900 | | 57.18 | % |
Capital gain | | | — | | — | | | | 1.9064 | | | 100.00 | % | | | 0.8164 | | 42.82 | % |
Return of capital | | | 1.4298 | | 100.00 | % | | | — | | | — | | | | — | | — | |
| | | | | | | | | | | | | | | | | | | |
| | $ | 1.4298 | | 100.00 | % | | $ | 1.9064 | | | 100.00 | % | | $ | 1.9064 | | 100.00 | % |
| | | | | | | | | | | | | | | | | | | |
Comprehensive (Loss) Income
The changes in the components of other comprehensive (loss) income are as follows (in thousands, net of minority interests):
| | | | | | | | | | | | |
| | | For the Year Ended December 31, | |
| | | 2008 | | | 2007 | | | 2006 | |
Net (loss) income | | $ | (308,984 | ) | | $ | 19,319 | | | $ | 70,326 | |
Interest rate swaps assigned to lenders: | | | | | | | | | | | | |
Unrealized holding gains | | | — | | | | 12,734 | | | | 7,577 | |
Reclassification adjustment for realized gains included in net (loss) income | | | (4,014 | ) | | | (6,573 | ) | | | (368 | ) |
| | | | | | | | | | | | |
| | | (4,014 | ) | | | 6,161 | | | | 7,209 | |
| | | | | | | | | | | | |
Interest rate swaps: | | | | | | | | | | | | |
Unrealized holding losses | | | (37,754 | ) | | | (30,583 | ) | | | (40 | ) |
Reclassification adjustment for realized gains included in net (loss) income | | | (146 | ) | | | (152 | ) | | | (4,951 | ) |
| | | | | | | | | | | | |
| | | (37,900 | ) | | | (30,735 | ) | | | (4,991 | ) |
| | | | | | | | | | | | |
Interest rate caps: | | | | | | | | | | | | |
Unrealized holding losses | | | (690 | ) | | | (106 | ) | | | (35 | ) |
Reclassification adjustment for realized losses included in net (loss) income | | | 17 | | | | 153 | | | | 71 | |
| | | | | | | | | | | | |
| | | (673 | ) | | | 47 | | | | 36 | |
| | | | | | | | | | | | |
Comprehensive (loss) income | | $ | (351,571 | ) | | $ | (5,208 | ) | | $ | 72,580 | |
| | | | | | | | | | | | |
The components of accumulated other comprehensive loss are as follows (in thousands, net of minority interests):
| | | | | | | | |
| | | December 31,
2008 | | | December 31,
2007 | |
Deferred gain on assignment of interest rate swap agreements, net | | $ | 9,610 | | | $ | 13,370 | |
Interest rate caps | | | (671 | ) | | | 83 | |
Interest rate swaps | | | (68,835 | ) | | | (30,494 | ) |
| | | | | | | | |
| | $ | (59,896 | ) | | $ | (17,041 | ) |
| | | | | | | | |
115
MAGUIRE PROPERTIES, INC.
NOTES TO CONSOLIDATED FINANCIAL STATEMENTS—(continued)
Note 10—Share-Based Payments
In June 2007, our stockholders approved the Second Amended and Restated 2003 Incentive Award Plan of Maguire Properties, Inc., Maguire Properties Services, Inc. and Maguire Properties, L.P. (the “Incentive Award Plan”), which amended and restated in its entirety our previous plan, the Amended and Restated 2003 Incentive Award Plan. The number of shares of common stock available for grant under the Incentive Award Plan is subject to an aggregate limit of 6,050,000 shares. The Incentive Award Plan expires on November 12, 2012, except as to any grants then outstanding. As of December 31, 2008, there were 2.0 million shares of common stock available for grant under the Incentive Award Plan.
Under the Incentive Award Plan, we have the ability to grant nonqualified stock options, incentive stock options, restricted stock, restricted stock units, dividend equivalents, stock appreciation rights and other awards to our officers, employees, directors and other persons providing services to our Operating Partnership and its subsidiaries.
Stock Options
Nonqualified stock options are granted at not less than 100% of the fair market value of our common stock on the date of grant. These stock options vest over three equal annual installments on each of the first, second and third anniversaries of the date of grant. Vested options can be exercised up to ten years from the date of grant, up to 12 months from the date of termination of directorship by death or permanent and total disability, or up to six months from the date of termination of directorship by reasons other than death or permanent and total disability.
The following table summarizes the number and weighted average exercise prices of our stock option grants:
| | | | | | |
| | | Number | | | Weighted
Average
Exercise Price |
Options outstanding at December 31, 2005 | | 577,500 | | | $ | 19.61 |
Granted | | 25,000 | | | | 34.51 |
Exercised | | (295,400 | ) | | | 19.00 |
Forfeited | | — | | | | — |
| | | | | | |
Options outstanding at December 31, 2006 | | 307,100 | | | | 21.41 |
Granted | | 32,500 | | | | 34.08 |
Exercised | | (207,100 | ) | | | 19.00 |
Forfeited | | (23,333 | ) | | | 34.02 |
| | | | | | |
Options outstanding at December 31, 2007 | | 109,167 | | | | 27.07 |
Granted | | 67,500 | | | | 8.64 |
Exercised | | — | | | | — |
Forfeited | | (36,667 | ) | | | 29.51 |
| | | | | | |
Options outstanding at December 31, 2008 | | 140,000 | | | $ | 17.55 |
| | | | | | |
Options exercisable as of December 31, 2008 | | 67,500 | | | $ | 25.77 |
| | | | | | |
The intrinsic value of a stock option is the amount by which the current market value of the underlying stock exceeds the exercise price of an option. As of December 31, 2008, our stock options outstanding and/or exercisable had no intrinsic value. As of December 31, 2008, the average remaining life of stock options outstanding was approximately 5 years, while the average remaining life of stock options exercisable was less than 1 year.
116
MAGUIRE PROPERTIES, INC.
NOTES TO CONSOLIDATED FINANCIAL STATEMENTS—(continued)
We received cash proceeds from stock options exercised during 2007 and 2006 totaling $3.9 million and $5.6 million, respectively. The total intrinsic value of options exercised during 2007 and 2006 was $3.5 million and $4.6 million, respectively.
Restricted Stock and Restricted Stock Units
Restricted stock awards are generally accompanied by dividend equivalent rights and vest over a period of three to five years from the date of grant for time-based awards or contingent upon the attainment of performance criteria outlined in the grant agreement within five years from the date of grant for performance-based awards. Any unvested restricted stock is forfeited or subject to our right of repurchase, except in limited circumstances, as determined by the Compensation Committee of the board of directors when the recipient is no longer employed by us or when a director leaves the board for any reason.
We grant both time-based and performance-based restricted stock units, usually accompanied by dividend equivalents. Each vested restricted stock unit represents the right to receive one share of our common stock. The time-based restricted stock units vest over a period of five years, with 20% vesting on the first anniversary of the date of grant, and the remaining 80% vesting pro rata on a daily basis over the next four years, subject to the recipient’s continued employment with us. The performance-based restricted stock units have a time-based vesting component and a performance-based vesting component, both of which must be satisfied in order for them to vest. The time-based component is similar to the five-year vesting schedule described above. The performance-based component will be satisfied in cumulative installments with respect to 20% of the restricted stock units in the event we attain stock price targets of $25.00, $30.00, $35.00, $40.00 and $45.00, respectively, prior to the fifth anniversary of the grant date. Both the time-based and performance-based restricted stock units are subject to full or partial accelerated vesting under certain circumstances, as described in the applicable restricted stock unit agreement. All vested restricted stock units will be distributed in shares of our common stock or, at our option, paid in cash upon the earliest to occur of: (1) the fifth anniversary of the grant date; (2) the occurrence of a change in control (as defined in the restricted stock agreements); or (3) the recipient’s separation from service. It is our intent to settle all restricted stock unit awards with shares of our common stock
The following table summarizes the number and weighted average grant date fair value of our unvested restricted stock and restricted stock unit awards:
| | | | | | |
| | | Number | | | Weighted Average
Grant Date
Fair Value |
Unvested at December 31, 2005 | | 267,316 | | | $ | 20.97 |
Granted | | 443,401 | | | | 34.48 |
Vested | | (140,414 | ) | | | 28.99 |
Forfeited | | (163,126 | ) | | | 19.38 |
| | | | | | |
Unvested at December 31, 2006 | | 407,177 | | | | 33.56 |
Granted | | 25,614 | | | | 37.88 |
Vested | | (92,670 | ) | | | 31.78 |
Forfeited | | (6,023 | ) | | | 36.27 |
| | | | | | |
Unvested at December 31, 2007 | | 334,098 | | | | 34.34 |
Granted | | 2,307,441 | | | | 8.64 |
Vested | | (282,186 | ) | | | 33.08 |
Forfeited | | (7,296 | ) | | | 34.91 |
| | | | | | |
Unvested at December 31, 2008 | | 2,352,057 | | | $ | 9.27 |
| | | | | | |
117
MAGUIRE PROPERTIES, INC.
NOTES TO CONSOLIDATED FINANCIAL STATEMENTS—(continued)
Restricted stock and time-based restricted stock unit awards are valued at market value on the date of grant and are recorded as compensation expense on a straight-line basis over the vesting period. The fair value of the performance based restricted stock units granted during 2008 was $7.8 million (as determined using the Monte Carlo Simulation method), which is recorded as compensation expense on a straight-line basis over the vesting period.
During the second quarter of 2008, certain of our senior management terminated their employment resulting in the accelerated vesting of restricted stock awards totaling 227,468 shares. Stock-based compensation cost totaling $6.0 million was recorded in 2008 as a result of the acceleration of vesting.
During 2008, we accepted the return of 109,088 shares of our common stock from certain employees in accordance with the provisions of our Incentive Award Plan to satisfy the employees’ minimum statutory tax withholding requirements related to restricted stock awards that vested during 2008. The value of the returned shares totaled $1.4 million and was calculated based on the closing market price of our common stock on the day prior to the applicable vesting date.
Executive Equity Plan
Effective April 1, 2005, our board of directors adopted a five-year compensation program for senior management. The Executive Equity Plan provides for an award pool equal to a percentage of the value created in excess of a base value. Each participant is entitled to a given percentage of the total award pool, which may be adjusted over time to accommodate new employees and exceptional performers. The program, which measures our performance over a 60-month period (unless full vesting of the program occurs earlier) commencing April 1, 2005, provides for awards to be vested and earned based upon the participant’s continued employment and the achievement of certain performance goals based on annualized total stockholder returns on an absolute and relative basis.
The amount payable for the absolute component of Executive Equity Plan awards is based upon the amount by which our annualized total stockholder return over the measurement period exceeds 9%. The amount payable for the relative component requires us to achieve an annualized total stockholder return that is above the greater of an annualized total stockholder return of 9% or the NAREIT Office Index during the same period. Participants will receive a total award in an amount between 2.5% and 10% of the excess return over a base of $23.91 per common share.
Awards under this plan will be paid in shares of our common stock or, at the discretion of the Compensation Committee of the board of directors, in cash (in whole or in part) at the end of the applicable performance period; however, it is our intent to settle all awards with shares of our common stock. The awards may vest in whole or in part on March 31, 2008, 2009 and 2010. In no case shall the total value of awards under the Executive Equity Plan exceed $50.0 million, and the number of common shares to be issued cannot exceed 3.0 million shares. As of December 31, 2008, 45.5% of the award has been allocated to participants and no awards have vested.
The aggregate fair value of Executive Equity Plan awards on the date of the grant was $1.7 million and $5.3 million for 2007 and 2006, respectively (as determined using the Monte Carlo Simulation method), which is recorded as compensation expense on a straight-line basis over the derived requisite service period ranging from 2- 1/2 to 5 years. During 2008, certain of our senior management terminated their employment, resulting in the forfeiture of their Executive Equity Plan awards. These forfeitures resulted in the reversal of $2.6 million of stock-based compensation cost during 2008. For 2008, 2007 and 2006, the compensation cost related to this plan was $1.4 million (excluding the reversal for forfeitures), $2.0 million and $1.4 million, respectively.
118
MAGUIRE PROPERTIES, INC.
NOTES TO CONSOLIDATED FINANCIAL STATEMENTS—(continued)
Performance Award Agreement for Mr. Maguire
On August 1, 2006, we entered into a definitive agreement with Mr. Maguire, pursuant to which he was granted a performance award under our Incentive Award Plan. The aggregate fair value of this award at the date of grant was estimated to be $10.9 million. Mr. Maguire’s receipt of a performance award was conditioned on his continued employment as our Chief Executive Officer until July 13, 2010 and a compound annual “total shareholder return” (as such term was defined in his award agreement) by the Company equivalent to at least 15% during the period commencing on July 14, 2006 and ending on July 13, 2010. As a result of Mr. Maguire’s termination of employment, he forfeited his performance award. This forfeiture resulted in the reversal of $4.0 million of stock-based compensation cost during 2008. During 2007 and 2006, we recognized $2.7 million and $1.3 million, respectively, of compensation cost related to this award.
Note 11—Earnings per Share
Basic net (loss) income available to common stockholders is computed by dividing reported net (loss) income available to common stockholders by the weighted average number of common shares outstanding during each period. Diluted net (loss) income available to common stockholders is computed by dividing reported net (loss) income available to common stockholders by the weighted average number of common and common equivalent shares outstanding during each period.
A reconciliation of earnings per share is as follows (in thousands, except share and per share amounts):
| | | | | | | | | | | | |
| | | For the Year Ended December 31, | |
| | | 2008 | | | 2007 | | | 2006 | |
Income (Numerator) | | | | | | | | | | | | |
Net (loss) income | | $ | (308,984 | ) | | $ | 19,319 | | | $ | 70,326 | |
Preferred stock dividends | | | (19,064 | ) | | | (19,064 | ) | | | (19,064 | ) |
| | | | | | | | | | | | |
(Loss) income available to common stockholders | | $ | (328,048 | ) | | $ | 255 | | | $ | 51,262 | |
| | | | | | | | | | | | |
Shares (Denominator) | | | | | | | | | | | | |
Weighted average number of common shares outstanding (basic) | | | 47,538,457 | | | | 46,750,597 | | | | 46,257,573 | |
| | | |
Effect of dilutive securities: | | | | | | | | | | | | |
Contingently issuable shares | | | — | | | | — | | | | 470,891 | |
Restricted stock units | | | — | | | | — | | | | — | |
Nonvested restricted stock | | | — | | | | 18,828 | | | | 74,972 | |
Nonqualified stock options | | | — | | | | 63,577 | | | | 127,997 | |
| | | | | | | | | | | | |
Weighted average number of common and common equivalent shares (diluted) | | | 47,538,457 | | | | 46,833,002 | | | | 46,931,433 | |
| | | | | | | | | | | | |
Basic (loss) income per share | | $ | (6.90 | ) | | $ | 0.01 | | | $ | 1.11 | |
| | | | | | | | | | | | |
Diluted (loss) income per share | | $ | (6.90 | ) | | $ | 0.01 | | | $ | 1.09 | |
| | | | | | | | | | | | |
In 2008, approximately 461,000 restricted stock units, 100,000 shares of nonvested restricted stock and 73,000 nonqualified stock options were excluded from the calculation of diluted earnings per share because they were anti-dilutive due to our net loss position. In 2007, approximately 227,000 shares of nonvested restricted stock and nonqualified stock options totaling 32,000 shares were excluded from the calculation of diluted earnings per share because they were anti-dilutive.
119
MAGUIRE PROPERTIES, INC.
NOTES TO CONSOLIDATED FINANCIAL STATEMENTS—(continued)
Note 12—Costs Associated with the Strategic Alternatives Review and Management Changes
During the second quarter of 2008, the Special Committee of our Board of Directors concluded its review of strategic alternatives for the Company, and as a result, certain changes in management were made. The costs associated with the review and subsequent management changes are included as part of general and administrative in our 2008 consolidated statement of operations. The following is a summary of these costs (in millions):
| | | | | | | |
| | | Total Charge(1) | | | Balance at
December 31, 2008(2) |
Strategic review costs | | $ | 8.3 | | | $ | — |
Separation obligations | | | 12.7 | | | | 1.6 |
1733 Ocean lease costs | | | 3.6 | | | | 1.7 |
Rand sub-lease costs | | | 2.0 | | | | 1.6 |
Stock-based compensation costs(3) | | | (2.7 | ) | | | — |
| | | | | | | |
| | $ | 23.9 | | | $ | 4.9 |
| | | | | | | |
| (1) | The total charge represents the amount expensed for each item during 2008. |
| (2) | The balance at December 31, 2008 represents the amount remaining to be paid as of year end. This amount is included in accounts payable and other liabilities in the consolidated balance sheet. |
| (3) | The stock-based compensation costs represent the reversal of $8.7 million of previously recorded expense for performance awards, which was partially offset by $6.0 million of expense related to the accelerated vesting of restricted stock, as a result of the termination of employment of Mr. Maguire and certain other senior executives. |
The costs associated with the strategic review process are comprised mainly of investment banking, legal and other professional fees. The separation obligations and stock-based compensation costs arose from the termination of employment of Mr. Maguire as our Chairman and Chief Executive Officer and certain other senior executives in the second quarter of 2008.
See Note 19 “Commitments and Contingencies” for a discussion of the costs associated with the 1733 Ocean lease.
In addition to our direct lease, we entered into sub-lease agreements with Rand Corporation (“Rand”) for the second and third floors at 1733 Ocean in Santa Monica, California to provide additional space for our corporate offices. As a result of the relocation of our corporate offices to downtown Los Angeles, we vacated the Rand space. During 2008, we accrued $2.0 million for management’s best estimate of the leasing commissions and tenant improvements to be paid to sub-lease the space to another tenant or tenants and the differential between: (i) the rent we are contractually obligated to pay Rand until our sub-leases expire in 2014 and (ii) the rent we expect to receive upon sub-leasing the space to another tenant or tenants.
120
MAGUIRE PROPERTIES, INC.
NOTES TO CONSOLIDATED FINANCIAL STATEMENTS—(continued)
Note 13—Discontinued Operations and Assets Held for Sale
A summary of property dispositions is as follows (amounts in millions, except square footage amounts):
| | | | | | | | | | | | | | | | | | |
| | | Location | | Net
Rentable
Square
Feet | | Year | | Debt Repaid
or Assumed
by Buyer at
Disposition | | | (Impairment)/
Gain on
Disposition | | | Loss from
Early
Extinguishment | |
Properties Disposed of: | | | | | | | | | | | | | | | | | | |
1920 and 2010 Main Plaza | | Irvine, CA | | 587,000 | | 2008 | | $ | (160.7 | ) | | $ | (52.5 | ) | | $ | (1.0 | ) |
City Plaza | | Orange, CA | | 328,000 | | 2008 | | | (101.0 | ) | | | (21.2 | ) | | | (0.8 | ) |
| | | | | | | | | | | | | | | | | | |
| | | | 915,000 | | | | $ | (261.7 | ) | | $ | (73.7 | ) | | $ | (1.8 | ) |
| | | | | | | | | | | | | | | | | | |
| | | | | | |
Wateridge Plaza | | San Diego, CA | | 268,000 | | 2007 | | $ | (62.9 | ) | | $ | 33.9 | | | $ | (0.4 | ) |
Pacific Center | | Mission Valley, CA | | 439,000 | | 2007 | | | (121.2 | ) | | | 47.4 | | | | (0.8 | ) |
Regents Square | | La Jolla, CA | | 312,000 | | 2007 | | | (103.6 | ) | | | 114.1 | | | | (0.1 | ) |
| | | | | | | | | | | | | | | | | | |
| | | | 1,019,000 | | | | $ | (287.7 | ) | | $ | 195.4 | | | $ | (1.3 | ) |
| | | | | | | | | | | | | | | | | | |
Properties Acquired and Disposed of:(1) | | | | | | | | | | | | | | | | | | |
Blackstone properties: | | | | | | | | | | | | | | | | | | |
Inwood Park | | Irvine, CA | | 157,000 | | 2007 | | $ | (39.6 | ) | | | None | | | $ | (1.2 | ) |
1201 Dove Street | | Newport Beach, CA | | 78,000 | | 2007 | | | (21.4 | ) | | | None | | | | (0.6 | ) |
Fairchild Corporate Center | | Irvine, CA | | 105,000 | | 2007 | | | (29.2 | ) | | | None | | | | (0.9 | ) |
Redstone Plaza | | Newport Beach, CA | | 168,000 | | 2007 | | | (49.7 | ) | | | None | | | | (1.5 | ) |
Bixby Ranch | | Seal Beach, CA | | 295,000 | | 2007 | | | (82.6 | ) | | | None | | | | (2.4 | ) |
Lincoln Town Center | | Orange, CA | | 215,000 | | 2007 | | | (71.4 | ) | | | None | | | | (0.5 | ) |
Tower 17 | | Irvine, CA | | 231,000 | | 2007 | | | (92.0 | ) | | | None | | | | (0.6 | ) |
1100 Executive Tower | | Orange, CA | | 367,000 | | 2007 | | | (127.0 | ) | | | None | | | | (0.9 | ) |
| | | | | | | | | | | | | | | | | | |
| | | | 1,616,000 | | | | $ | (512.9 | ) | | | | | | $ | (8.6 | ) |
| | | | | | | | | | | | | | | | | | |
| (1) | We also disposed of three development sites acquired in the Blackstone Transaction: Inwood Park, Bixby Ranch and 1100 Executive Tower. |
In December 2008, we made the decision to dispose of our 3161 Michelson property located in Irvine, California and have classified this property as held for sale. We recorded a $50.0 million non-cash impairment charge to reduce our investment in this property to its estimated fair value, less estimated costs to sell, as of December 31, 2008. See Note 2 “Basis of Presentation and Summary of Significant of Accounting Policies – Investments in Real Estate – Impairment Evaluation.”
In accordance with SFAS No. 144, the results of operations for 1920 and 2010 Main Plaza, City Plaza and 3161 Michelson are reflected in the consolidated statements of operations as discontinued operations for 2008 and 2007, while the results of operations for Wateridge Plaza, Pacific Center and Regents Square are reflected in the consolidated statements of operations as discontinued operations for 2007 and 2006.
The results of the Blackstone Transaction office properties are included in the consolidated statements of operations as discontinued operations from April 24, 2007, the date these properties were acquired. No gain or loss on the disposal of these properties was recorded in the consolidated statements of operations since the purchase price allocated to these properties at the date of acquisition equals the value recorded upon disposal.
121
MAGUIRE PROPERTIES, INC.
NOTES TO CONSOLIDATED FINANCIAL STATEMENTS—(continued)
The results of discontinued operations are as follows (in thousands):
| | | | | | | | | | | | |
| | | For the Year Ended December 31, | |
| | | 2008 | | | 2007 | | | 2006 | |
Revenue: | | | | | | | | | | | | |
Rental | | $ | 19,978 | | | $ | 40,094 | | | $ | 26,388 | |
Tenant reimbursements | | | 1,782 | | | | 3,885 | | | | 3,570 | |
Parking | | | 1,660 | | | | 2,066 | | | | 562 | |
Other | | | 638 | | | | 1,080 | | | | 283 | |
| | | | | | | | | | | | |
Total revenue | | | 24,058 | | | | 47,125 | | | | 30,803 | |
| | | | | | | | | | | | |
Expenses: | | | | | | | | | | | | |
Rental property operating and maintenance | | | 6,881 | | | | 12,507 | | | | 7,067 | |
Real estate taxes | | | 3,690 | | | | 5,742 | | | | 3,445 | |
Parking | | | 2,056 | | | | 1,280 | | | | 131 | |
Depreciation and amortization | | | 13,953 | | | | 24,342 | | | | 14,916 | |
Impairment of long-lived assets | | | 123,694 | | | | — | | | | — | |
Interest | | | 17,266 | | | | 27,651 | | | | 15,251 | |
Loss from early extinguishment of debt | | | 1,801 | | | | 9,882 | | | | — | |
| | | | | | | | | | | | |
Total expenses | | | 169,341 | | | | 81,404 | | | | 40,810 | |
| | | | | | | | | | | | |
Loss from discontinued operations before gain on sale of real estate and minority interests | | | (145,283 | ) | | | (34,279 | ) | | | (10,007 | ) |
Gain on sale of real estate | | | — | | | | 195,387 | | | | — | |
Minority interests allocated to discontinued operations | | | 4,363 | | | | (21,853 | ) | | | 1,377 | |
| | | | | | | | | | | | |
(Loss) income from discontinued operations | | $ | (140,920 | ) | | $ | 139,255 | | | $ | (8,630 | ) |
| | | | | | | | | | | | |
Interest expense included in discontinued operations relates to interest on mortgage loans secured by the properties disposed of or held for sale. No interest expense associated with our corporate-level debt has been allocated to properties subsequent to their classification as discontinued operations.
The major classes of assets and liabilities of real estate held for sale are as follows (in thousands):
| | | |
| | | December 31, 2008 |
Net investment in real estate | | $ | 163,273 |
Restricted cash | | | 11,553 |
Other | | | 7,771 |
| | | |
Assets associated with real estate held for sale | | $ | 182,597 |
| | | |
| |
Mortgage loan | | $ | 168,719 |
Accounts payable and other liabilities | | | 2,629 |
| | | |
Obligations associated with real estate held for sale | | $ | 171,348 |
| | | |
Note 14—Fair Value Measurements
On January 1, 2008, we adopted SFAS No. 157,Fair Value Measurements, for our financial assets and liabilities. SFAS No. 157 defines fair value, establishes a framework for measuring fair value and provides expanded disclosure about how fair value measurements are determined. FASB Staff Position (“FSP”) No. 157-2
122
MAGUIRE PROPERTIES, INC.
NOTES TO CONSOLIDATED FINANCIAL STATEMENTS—(continued)
delayed the adoption date for non-financial assets and liabilities that are remeasured at fair value on a non-recurring basis, such as identifiable intangible assets and liabilities, until January 1, 2009. Our adoption of SFAS No. 157 did not require a cumulative effect adjustment to the opening balance of our accumulated deficit and dividends.
SFAS No. 157 emphasizes that fair value is a market-based measurement, not an entity-specific measurement. Therefore, a fair value measurement should be determined based on the assumptions that market participants would use in pricing the asset or liability. As a basis for considering market participant assumptions in fair value measurements, SFAS No. 157 establishes a fair value hierarchy that distinguishes between market participant assumptions based on market data obtained from sources independent of the reporting entity (observable inputs that are classified within Levels 1 and 2 of the hierarchy) and the reporting entity’s own assumptions about market participant assumptions (unobservable inputs classified with Level 3 of the hierarchy). The three levels of inputs used to measure fair value are as follows:
| | • | | Level 1 – Valuations based on quoted market prices in active markets for identical assets or liabilities that the reporting entity has the ability to access. |
| | • | | Level 2 – Valuations based on quoted market prices for similar assets or liabilities, quoted market prices in markets that are not active, or other inputs that are observable or can be corroborated by observable data for substantially the full term of the assets or liabilities. |
| | • | | Level 3 – Valuations based on inputs that are supported by little or no market activity and that are significant to the fair value of the assets or liabilities, which are typically based on the reporting entity’s own assumptions. |
The valuation of our derivative financial instruments is determined using widely accepted valuation techniques, including discounted cash flow analysis on the expected cash flow of each derivative. This analysis reflects the contractual terms of the derivatives, including the period to maturity, and uses observable market-based inputs, including interest rate curves and implied volatilities. To comply with the provisions of SFAS No. 157, we have incorporated credit valuation adjustments to appropriately reflect both our own and the respective counterparty’s non-performance risk in the fair value measurements.
Although we have determined that the majority of the inputs used to value our derivatives fall within Level 2 of the fair value hierarchy, our credit valuation adjustments utilize Level 3 inputs, such as estimates of current credit spreads to evaluate the likelihood of default by us or our counterparties.
As of December 31, 2008, our assets and liabilities measured at fair value on a recurring basis, aggregated by the level in the fair value hierarchy within which those measurements fall, are as follows (in thousands):
| | | | | | | | | | | | | | |
| | | | | | Fair Value Measurements at December 31, 2008 Using |
Liabilities: | | December 31, 2008 | | | Quoted Prices in Active
Markets for Identical
Liabilities
(Level 1) | | Significant Other
Observable
Inputs
(Level 2) | | | Significant Unobservable
Inputs
(Level 3) |
Interest rate swaps | | $ | (72,762 | ) | | $ | — | | $ | (83,026 | ) | | $ | 10,264 |
The estimated fair value of our interest rate swaps is included in our consolidated balance sheet in accounts payable and other liabilities. Our interest rate swaps assigned to lenders have not been revalued as of December 31, 2008 because these contracts have been settled and the value of our interest rate caps is immaterial. The estimated fair value of our interest rate swaps as of December 31, 2007 was $35.4 million.
123
MAGUIRE PROPERTIES, INC.
NOTES TO CONSOLIDATED FINANCIAL STATEMENTS—(continued)
A reconciliation of the changes in the significant unobservable inputs component of fair value for our interest rate swaps for 2008 is as follows (in thousands):
| | | |
| | | Fair Value Measurements Using
Significant Unobservable Inputs
(Level 3) |
Balance, December 31, 2007 | | $ | — |
Gain included in other comprehensive loss | | | 10,264 |
| | | |
Balance, December 31, 2008 | | $ | 10,264 |
| | | |
Note 15—Financial Instruments
Derivative Financial Instruments
Interest rate fluctuations may impact our results of operations and cash flow. Our construction loans as well as some of our mortgage loans bear interest at a variable rate. We seek to minimize the volatility that changes in interest rates have on our variable-rate debt by entering into interest rate swap and cap agreements. We do not trade in financial instruments for speculative purposes. Our derivatives are designated as cash flow hedges under SFAS No. 133.
The net gain on derivative financial instruments reclassified from accumulated other comprehensive (loss) to our consolidated statements of operations was $4.3 million, $6.4 million and $6.1 million during 2008, 2007 and 2006, respectively. As of December 31, 2008, $62.1 million of unrealized losses ($59.9 million net of minority interests) and as of December 31, 2007, $19.7 million of unrealized losses ($17.0 million net of minority interests) related to derivative instruments have been recorded in accumulated other comprehensive (loss).
Interest Rate Swaps
As of December 31, 2008 and 2007, we held an interest rate swap with a notional amount of $425.0 million, which was equal to the exposure hedged. We also held a forward-starting interest rate swap with a notional amount of $88.0 million.
Prior to 2005, we settled certain interest rate swap agreements at a gain. These gains were deferred and are being amortized in the consolidated statements of operations as a reduction of interest expense over the terms of the underlying loans. During 2007 and 2006, we recognized $0.3 million and $5.8 million, respectively, in the consolidated statements of operations related to these agreements. As of December 31, 2007, there are no unrecognized gains deferred in accumulated other comprehensive (loss) related to settled contracts.
Interest Rate Caps
As of December 31, 2008 and 2007, we held interest rate caps with notional amounts totaling $832.3 million and $606.0 million, respectively.
Interest Rate Swaps Assigned to Lenders
During 2007 and 2006, we assigned certain interest rate swap agreements to our lenders in exchange for lower stated interest rates on the underlying debt. Deferred gains on the assignment of the swap agreements totaling $14.7 million and $8.8 million in 2007 and 2006, respectively, were recorded in accumulated other
124
MAGUIRE PROPERTIES, INC.
NOTES TO CONSOLIDATED FINANCIAL STATEMENTS—(continued)
comprehensive (loss) income in the consolidated balance sheets at the time of assignment. The deferred gains recorded during 2007 relate to loans maturing in 2017, while the deferred gain recorded in 2006 relates to a loan that matures in 2013.
These deferred gains are being amortized over the life of the swaps as a reduction of interest expense. The corresponding debt discounts were recorded in the consolidated balance sheets as a reduction of the principal amount of the underlying debt and are being amortized as an increase to interest expense in the consolidated statements of operations over the life of the swaps. The deferred gains recognized during 2008, 2007 and 2006 were $4.1 million, $7.6 million and $0.4 million, respectively. These were mostly offset by the amortization of the related debt discounts as interest expense.
Fair Value of Financial Instruments
Our financial instruments include cash, cash equivalents, restricted cash, rents and other receivables, amounts due from affiliates, accounts payable, dividends and distributions payable and accrued liabilities. The carrying amount of these instruments approximates fair value because of their short-term nature.
The estimated fair value of our mortgage and other secured loans is $5,344.4 million (compared to a carrying amount of $4,882.8 million) as of December 31, 2008 and $5,195.8 million (compared to a carrying value of $5,003.3 million) as of December 31, 2007. We calculated the fair value of our mortgage and other secured loans based on currently available market rates assuming the loans are outstanding through maturity and considering the collateral. In determining the current market rate for fixed-rate debt, a market spread is added to the quoted yields on federal government treasury securities with similar maturity dates to our debt.
Note 16—Related Party Transactions
Nelson C. Rising
At the time of our initial public offering, we entered into a tax indemnification agreement with Maguire Partners – Master Investments, LLC (“Master Investments”), an entity in which our President and Chief Executive Officer, Nelson C. Rising, has a minority interest. Under this agreement, we agreed not to dispose of US Bank Tower, Wells Fargo Tower, KPMG Tower, Gas Company Tower and Plaza Las Fuentes (excluding the hotel) for periods of up to 12 years from the date these properties were contributed to our Operating Partnership at the time of our initial public offering in June 2003 (the “lock-out period”). We also agreed to indemnify Master Investments and its members from all direct and indirect tax consequences if any of these properties were sold during the lock-out period. The lock-out period does not apply if a property is disposed of in a non-taxable transaction (i.e., Section 1031 exchange). In connection with the tax indemnification agreement, Master Investments has also guaranteed a portion of our mortgage loans. As of December 31, 2008 and 2007, $65.0 million of our debt is subject to such guarantees by Master Investments.
Robert F. Maguire III
Pursuant to a separation agreement effective May 17, 2008, Mr. Maguire resigned as the Chief Executive Officer and Chairman of the Board of the Company. In accordance with the terms of his separation agreement, Mr. Maguire received a lump-sum cash severance payment of $2.8 million. Also pursuant to the separation agreement, Mr. Maguire is entitled to serve as the Company’s Chairman Emeritus through May 2010, after which the arrangement may be terminated by the Company. For as long as Mr. Maguire serves as Chairman Emeritus, he is entitled to receive $750.0 thousand per year to defray the costs of maintaining an office in a location other than the Company’s offices and the cost of services of two assistants and a personal driver. During 2008, we
125
MAGUIRE PROPERTIES, INC.
NOTES TO CONSOLIDATED FINANCIAL STATEMENTS—(continued)
recorded $4.4 million of charges in connection with the entry into the separation agreement. As of December 31, 2008, the balance due to Mr. Maguire under these agreements totals $0.8 million.
On May 17, 2008, Mr. Maguire also entered into a consulting agreement with the Company for a term of two years, with a termination payment due for earlier termination by the Company. Pursuant to this agreement, Mr. Maguire is entitled to receive $10.0 thousand per month plus reimbursement of reasonable expenses incurred. During 2008, we recorded $0.2 million of charges in connection with this agreement. As of December 31, 2008, the balance due to Mr. Maguire under this agreement totals $0.2 million.
Pursuant to the terms of his separation agreement, Mr. Maguire and the Company terminated certain property management and service contracts under which the Company or its subsidiaries provided property management, operating, maintenance, repair and/or leasing services in return for management fees, leasing commissions and reimbursement of actual direct costs and expenses incurred by the Company or its subsidiaries, as applicable.
Prior to the termination of his employment, Mr. Maguire, entities controlled by him and the Company were parties to an insurance sharing agreement whereby certain properties owned by entities controlled by him shared coverage with Company properties under a blanket insurance policy. Per the terms of his separation agreement, Mr. Maguire’s properties were removed from the Company’s insurance policies as of June 27, 2008.
Prior to Mr. Maguire’s termination of employment, we leased office space located at 1733 Ocean in Santa Monica, California, a property beneficially owned by Mr. Maguire. See Note 19 “Commitments and Contingencies.”
At the time of our initial public offering, we entered into a tax indemnification agreement with Mr. Maguire. Under this agreement, we agreed not to dispose of US Bank Tower, Wells Fargo Tower, KPMG Tower, Gas Company Tower and Plaza Las Fuentes (excluding the hotel) during the lock-out period as long as certain conditions under Mr. Maguire’s contribution agreement were met. We agreed to indemnify Mr. Maguire from all direct and indirect tax consequences if any of these properties were sold during the lock-out period. The lock-out period does not apply if a property is disposed of in a non-taxable transaction (i.e., Section 1031 exchange). Mr. Maguire’s separation agreement modified his tax indemnification agreement. As modified, for purposes of determining whether Mr. Maguire and related entities maintain ownership of Operating Partnership units equal to 50% of the units received by them in the formation transactions (which is a condition to the continuation of the lock-out period to its maximum length), shares of our common stock received by Mr. Maguire in exchange for Operating Partnership units in accordance with Section 8.6B of the Amended and Restated Agreement of Limited Partnership of Maguire Properties, L.P., as amended, shall be treated as Operating Partnership units received in the formation transactions. As of December 31, 2008, Mr. Maguire meets the 50% ownership requirement.
In connection with the tax indemnification agreement, Mr. Maguire and certain entities owned or controlled by Mr. Maguire, and entities controlled by certain former senior executives of the Maguire Properties predecessor have guaranteed a portion of our mortgage loans. As of December 31, 2008 and 2007, $591.8 million of our debt is subject to such guarantees.
126
MAGUIRE PROPERTIES, INC.
NOTES TO CONSOLIDATED FINANCIAL STATEMENTS—(continued)
A summary of our transactions and balances with Mr. Maguire related to agreements in place prior to his termination of employment is as follows (in thousands):
| | | | | | | | | |
| | | For the Year Ended
December 31, |
| | | 2008 | | 2007 | | 2006 |
| | | | | | | | | |
Management and development fees and leasing commissions | | $ | 1,005 | | $ | 2,352 | | $ | 3,359 |
Rent payments | | | 771 | | | 702 | | | 316 |
| | | | | | |
| | | December 31,
2008 | | December 31,
2007 |
Accounts receivable | | $ | — | | $ | 202 |
Fees and commissions earned from Mr. Maguire are included in management, leasing and development services in our consolidated statements of operations. Balances due from Mr. Maguire are included in due from affiliates in the consolidated balance sheets.
Joint Venture with Macquarie Office Trust
We earn property management and investment advisory fees and leasing commissions from our joint venture with Macquarie Office Trust. A summary of our transactions and balances with the joint venture is as follows (in thousands):
| | | | | | | | | |
| | | For the Year Ended
December 31, |
| | | 2008 | | 2007 | | 2006 |
| | | | | | | | | |
Management, investment advisory and development fees and leasing commissions | | $ | 5,534 | | $ | 6,669 | | $ | 4,509 |
| | | | | | | | |
| | | December 31,
2008 | | | December 31,
2007 | |
Accounts receivable | | $ | 1,665 | | | $ | 1,538 | |
Accounts payable | | | (78 | ) | | | (80 | ) |
| | | | | | | | |
| | $ | 1,587 | | | $ | 1,458 | |
| | | | | | | | |
Fees and commissions earned from the joint venture are included in management, leasing and development services in our consolidated statements of operations. Balances due from the joint venture are included in due from affiliates while balances due to the joint venture are included in accounts payable and other liabilities in the consolidated balance sheets. The joint venture’s balances were current as of December 31, 2008 and 2007.
Note 17—Employee Benefit Plan
Our full-time employees who have completed 30 days of service (or prior to March 1, 2007, 12 months of service) are eligible to participate in a 401(k) savings plan sponsored by Maguire Properties, L.P., which is a funded defined contribution plan that satisfies ERISA requirements. We make employer nondiscretionary matching contributions as well as discretionary profit sharing contributions, if any, in cash. The plan allows employees to allocate their voluntary contributions and employer matching and profit sharing contributions to a variety of investment funds. Our 401(k) plan does not have a fund that invests directly in Maguire Properties, Inc.
127
MAGUIRE PROPERTIES, INC.
NOTES TO CONSOLIDATED FINANCIAL STATEMENTS—(continued)
common or preferred stock. Employees are fully vested in their voluntary contributions and vest in company contributions from the second through the sixth year of employment at a rate of 20% per year. During 2008, 2007 and 2006, we contributed $0.7 million, $0.6 million and $0.3 million, respectively, to the 401(k) plan.
Note 18—Rental Revenue
Our properties are leased to tenants under net operating leases with initial expiration dates ranging from 2009 to 2025. The future minimum lease payments to be received from tenants (excluding tenant reimbursements) as of December 31, 2008 are as follows (in thousands):
| | | |
| | | Minimum Future
Rental Revenue |
2009 | | $ | 313,613 |
2010 | | | 295,825 |
2011 | | | 253,473 |
2012 | | | 205,542 |
2013 | | | 155,897 |
Thereafter | | | 622,937 |
| | | |
| | $ | 1,847,287 |
| | | |
Our rental revenue in continuing operations was increased by straight-line rent adjustments totaling $14.1 million, $11.3 million and $7.4 million in 2008, 2007 and 2006, respectively, while rental revenue in discontinued operations was increased by $2.6 million and $1.1 million in 2008 and 2007, respectively. Rental revenue in discontinued operations for 2006 was reduced by $0.4 million from straight-line rent adjustments.
Note 19—Commitments and Contingencies
Capital Leases
We enter into capital lease agreements for equipment used in the normal course of business. These leases have expiration dates from 2009 to 2016. The future minimum obligation under our capital leases as of December 31, 2008 is as follows (in thousands):
| | | | |
| | | Minimum
Obligation | |
2009 | | $ | 1,749 | |
2010 | | | 1,265 | |
2011 | | | 596 | |
2012 | | | 348 | |
2013 | | | 266 | |
Thereafter | | | 489 | |
| | | | |
| | | 4,713 | |
Less: interest | | | (567 | ) |
| | | | |
| | $ | 4,146 | |
| | | | |
128
MAGUIRE PROPERTIES, INC.
NOTES TO CONSOLIDATED FINANCIAL STATEMENTS—(continued)
The following amounts have been capitalized as part of building and improvements in the consolidated balance sheets related to equipment acquired through capital leases (in thousands):
| | | | | | | | |
| | | December 31, 2008 | | | December 31, 2007 | |
Gross amount | | $ | 13,958 | | | $ | 12,199 | |
Accumulated depreciation | | | (10,829 | ) | | | (8,882 | ) |
| | | | | | | | |
Net amount | | $ | 3,129 | | | $ | 3,317 | |
| | | | | | | | |
Ground and Air Space Leases
Two of the properties acquired as part of the Blackstone Transaction are subject to ground lease obligations: Two California Plaza and Brea Corporate Place. The ground lease for Two California Plaza expires in 2082 while the ground lease for Brea Corporate Place expires in 2083. Ground lease expense for 2008 and 2007 totaled $4.6 million and $3.7 million, respectively, and is reported as part of other expense in the consolidated statements of operations. We had no ground lease expense during 2006 because we contributed One California Plaza to our joint venture with Macquarie Office Trust in late 2005.
We have an air space lease at Plaza Las Fuentes and the Westin® Pasadena Hotel that expires in 2017, with options to renew for three additional ten-year periods and an option to purchase the air space. Air space lease expense for 2008, 2007 and 2006 totaled $0.5 million in each year and is reported as part of other expense in the consolidated statements of operations.
Our ground and air space leases require us to pay minimum fixed rental amounts, are subject to scheduled rent adjustments and include formulas for variable contingent rents. The ground lease for Two California Plaza is subject to rent adjustments every ten years beginning September 2013 and continuing through expiration. The lease for Brea Corporate Place is subject to rent adjustments on varying anniversary and reappraisal dates. The future minimum obligation under our ground and air space leases, excluding any contingent rents, as of December 31, 2008 is as follows (in thousands):
| | | |
| | | Minimum
Obligation |
2009 | | $ | 3,330 |
2010 | | | 3,330 |
2011 | | | 3,330 |
2012 | | | 3,330 |
2013 | | | 3,330 |
Thereafter | | | 349,212 |
| | | |
| | $ | 365,862 |
| | | |
Operating Lease
We have a full-service, ten-year operating lease for office space at 1733 Ocean, a property beneficially owned by Mr. Maguire, which commenced in July 2006 and expires in 2016. The lease is for 17,207 square feet of rentable area on the fourth floor. The lease had an initial annual stated rent of $929,178 and an effective initial annual rent of $680,245, after accounting for priority cash flow participation for the amount of $248,933 for the first lease year in our favor. The priority cash flow participation is a rent credit that effectively decreases our net rent to rates comparable to rates in downtown Los Angeles that went into effect upon lease commencement. The
129
MAGUIRE PROPERTIES, INC.
NOTES TO CONSOLIDATED FINANCIAL STATEMENTS—(continued)
priority cash flow participation increases at the rate of three percent (3%) per annum on each anniversary of the lease commencement date throughout the initial lease term.
In addition to our direct lease, we entered into a sublease agreement with Rand for the second and third floors at 1733 Ocean. The sublease is for 10,232 square feet of rentable area located on the second floor which commenced in August 2006 and for 5,344 square feet of rentable area located on the third floor which commenced in April 2006. Both subleases expire in 2014.
Our future minimum obligation under these leases as of December 31, 2008 is as follows (in thousands):
| | | |
| | | Minimum
Obligation |
2009 | | $ | 1,528 |
2010 | | | 1,571 |
2011 | | | 1,609 |
2012 | | | 1,658 |
2013 | | | 1,311 |
Thereafter | | | 2,897 |
| | | |
| | $ | 10,574 |
| | | |
Rent payments related to our direct lease totaled $0.8 million in 2008, $0.7 million in 2007 and $0.3 million in 2006, while rent payments related to our sublease with Rand totaled $0.8 million in 2008 and 2007, respectively, and $0.3 million in 2006.
In June 2008, we relocated our corporate offices to downtown Los Angeles, California and vacated the direct and Rand space at 1733 Ocean. Pursuant to his separation agreement, Mr. Maguire agreed to use his best efforts for a period of 180 days to obtain the necessary consents to terminate the direct lease and, if such consents were not obtained, to take certain actions to facilitate our Operating Partnership’s efforts to sublet those premises. Mr. Maguire did not obtain the necessary consents within the 180-day period.
During 2008, we accrued $2.0 million for management’s best estimate of the leasing commissions and tenant improvements to be paid to sub-lease the direct space and the differential between: (i) the rent we are contractually obligated to pay Mr. Maguire until the lease for the fourth floor expires in 2016 and (ii) the rent we expect to receive upon sub-leasing the space. Additionally during 2008, we accrued $2.0 million for management’s best estimate of the leasing commissions and tenant improvements to be paid to sub-lease the Rand space to another tenant or tenants and the differential between: (i) the rent we are contractually obligated to pay Rand until our sub-leases expire in 2014 and (ii) the rent we expect to receive upon sub-leasing the space to another tenant or tenants. As of December 31, 2008, $3.3 million is available to pay for leasing commissions, tenant improvements and rent related to the direct and Rand space.
Parking Easement
In connection with the sale of the 808 South Olive garage, we entered into an amended and restated parking easement with the buyer of the garage, which expires in 2011. The buyer is obligated to provide a specified number of monthly spaces, which decrease over the term of the easement, for use by tenants of Gas Company and US Bank Towers in exchange for monthly payments as consideration for both the parking spaces and a pro rata share of the operating expenses of the garage.
130
MAGUIRE PROPERTIES, INC.
NOTES TO CONSOLIDATED FINANCIAL STATEMENTS—(continued)
Our future minimum obligation under the parking easement as of December 31, 2008 is as follows (in thousands):
| | | |
| | | Minimum
Obligation |
2009 | | $ | 1,515 |
2010 | | | 1,416 |
2011 | | | 1,233 |
| | | |
| | $ | 4,164 |
| | | |
Expense related to the parking easement totaled $1.5 million in each of 2008 and 2007, respectively, and $1.4 million in 2006 and is recorded as part of parking expense in the consolidated statements of operations.
Joint Venture Obligations
Master Leases –
In connection with the contribution of 18301 Von Karman to a joint venture in 2007, we entered into a master lease with DH Von Karman SPE, LLC. During 2008 and 2007, we paid DH Von Karman SPE, LLC $1.6 million and $0.3 million, respectively, related to this lease. We have no further obligation under this master lease as of December 31, 2008.
During 2005, we entered into master leases with the purchasers of Austin Research Park I and II and One Renaissance Square. During 2007 and 2006, we paid $0.4 million and $1.5 million, respectively, related to these leases. We had no further obligations under these master leases as of December 31, 2007.
Tenant Improvements –
In connection with the joint venture contribution agreements with Macquarie Office Trust for One California Plaza, Wells Fargo Center (Denver) and San Diego Tech Center, we agreed to fund $15.7 million of future tenant lease obligations, including tenant improvement allowances and leasing commissions. During 2008, 2007 and 2006, we paid $0.5 million, $4.3 million and $7.8 million, respectively, related to this obligation. As of December 31, 2008, we have a liability of $3.1 million related to this obligation.
Contingent Consideration –
We are obligated to refund $7.5 million of the purchase price to Macquarie Office Trust if the five properties we contributed to our joint venture do not meet certain pre-defined annual income targets for the three-year period ended January 5, 2009. Since the five properties did not meet the annual income targets during 2008, 2007 and 2006, we paid $2.0 million, $3.2 million and $2.3 million, respectively, to Macquarie Office Trust to cover the shortfalls. We have no further obligation under this agreement as of December 31, 2008.
Loan Guarantee –
Maguire Properties, L.P. was the guarantor on the mortgage loan secured by Cerritos Corporate Center through January 4, 2009.
131
MAGUIRE PROPERTIES, INC.
NOTES TO CONSOLIDATED FINANCIAL STATEMENTS—(continued)
Capital Commitments
As of December 31, 2008, we had $63.8 million in capital commitments related to tenant improvements, renovation costs and general property-related capital expenditures, of which $13.0 million is related to 3161 Michelson which is classified as held for sale as of December 31, 2008. In addition, we had $9.8 million in capital commitments related to development projects under construction as of December 31, 2008.
Tenant Concentration
We generally do not require collateral or other security from our tenants, other than security deposits or letters of credit. Our credit risk is mitigated by the high quality of our existing tenant base, review of prospective tenants’ risk profiles prior to lease execution, and frequent monitoring of our tenant portfolio to identify problem tenants. However, since we have a significant concentration of rental revenue from certain tenants, the inability of those tenants to make their lease payments could have a material adverse effect on our results of operations, cash flow or financial condition.
Rental and tenant reimbursements revenue from our four largest tenants accounted for approximately 16%, 16% and 21% in 2008, 2007 and 2006, respectively. No individual tenant accounted for 10% or more of our total rental and tenant reimbursements revenue during 2008 and 2007. During 2006, one tenant accounted for approximately 11% of our rental and tenant reimbursements revenue.
Insurance
We carry commercial liability, fire, extended coverage, earthquake, terrorism, flood, pollution legal liability, boiler and machinery, earthquake sprinkler leakage, business interruption and rental loss insurance covering all of the properties in our portfolio under a blanket policy. Management believes the policy specifications and insured limits are appropriate given the relative risk of loss, the cost of coverage and industry practice and that the properties in our portfolio are adequately insured. Our terrorism insurance is subject to exclusions for loss or damage caused by nuclear substances, pollutants, contaminants and biological and chemical weapons. We do not carry insurance for generally uninsured losses, such as loss from riots. In addition, we carry earthquake insurance on our properties located in seismically-active areas and terrorism insurance on all of our properties, in each case in an amount and with deductibles which management believes are commercially reasonable. All of the properties in our portfolio are located in areas known to be seismically active, except for one joint venture property located in Denver, Colorado.
Hotel Management Agreement
In 2002, we entered into a hotel management agreement with Westin® Management Company West (“Westin®“) to operate the Westin® Pasadena Hotel. This agreement has a 15-year term and calls for base management fees of 3.0% of gross operating revenue and incentive management fees, if applicable, as defined in the agreement. Additionally, we received a $3.5 million payment from Westin® at the inception of agreement, which we are amortizing as a reduction of management fee income over a 10-year period. Any unamortized amount is refundable to Westin® in the event that the management agreement is terminated prior to its expiration.
Litigation
We are involved in various litigation and other legal matters, including personal injury claims and administrative proceedings, which we are addressing or defending in the ordinary course of business. Management believes that any liability that may potentially arise upon resolution of such matters will not have a material adverse effect on our business, financial condition or results of operations.
132
MAGUIRE PROPERTIES, INC.
NOTES TO CONSOLIDATED FINANCIAL STATEMENTS—(continued)
Note 20—Recent Accounting Pronouncements
SFAS No. 141R
In December 2007, the FASB issued SFAS No. 141R,Business Combinations, which replaces SFAS No. 141,Business Combinations. SFAS No. 141R applies to all transactions and other events in which one entity obtains control over one or more other businesses. It broadens the fair value measurement and recognition of assets acquired, liabilities assumed and interests transferred as a result of business combinations. Under this pronouncement, acquisition-related costs must be expensed rather than capitalized as part of the basis of the acquired. SFAS No. 141R also expands required disclosure to improve financial statement users’ the ability to evaluate the nature and financial effects of business combinations. SFAS No. 141R is effective for all transactions entered into on or after January 1, 2009. The adoption of this standard on January 1, 2009 could materially impact our future financial results to the extent that we acquire significant amounts of real estate, as related acquisition costs will be expensed as incurred compared to our current practice of capitalizing such costs and amortizing them over the estimated useful life of the assets acquired.
SFAS No. 160
In December 2007, the FASB issued SFAS No. 160,Noncontrolling Interests in Consolidated Financial Statements—An Amendment to ARB No. 51. SFAS No. 160 requires a noncontrolling interest in a subsidiary to be reported as equity and the amount of consolidated net income specifically attributable to the noncontrolling interest to be identified in the consolidated financial statements. SFAS No. 160 also calls for consistency in the manner of reporting changes in the parent’s ownership interest and requires fair value measurement of any noncontrolling equity investment retained in a deconsolidation. SFAS No. 160 is effective on January 1, 2009. We are currently evaluating the impact SFAS No. 160 will have on our results of operations and financial condition.
SFAS No. 161
In March 2008, the FASB issued SFAS No. 161,Disclosures about Derivative Instruments and Hedging Activities—an amendment of FASB Statement No. 133. SFAS No. 161 amends and expands the disclosure requirements of SFAS No. 133,Accounting for Derivative Instruments and Hedging Activities, to provide financial statement users with an enhanced understanding of (a) how and why an entity uses derivative instruments, (b) how derivative instruments and related hedged items are accounting for under SFAS No. 133 and its related interpretations, and (c) how derivative instruments and related hedged items affect an entity’s financial position, financial performance and cash flows. SFAS No. 161 requires (a) qualitative disclosures about objectives for using derivative instruments classified by primary underlying risk exposure, (b) information about the volume of derivative activity, (c) tabular disclosures about the balance sheet location and fair value amounts of derivative instruments, income statement and other comprehensive (loss) income location and amounts of gains and losses on derivative instruments by type of contract, and (d) disclosures about credit risk-related contingent features in derivative agreements. SFAS No. 161 is effective for financial statements issued for fiscal years and interim periods beginning after November 15, 2008. We are currently evaluating the impact SFAS No. 161 will have on our results of operations and financial condition.
SFAS No. 162
In May 2008, the FASB issued SFAS No. 162,The Hierarchy of Generally Accepted Accounting Principles. SFAS No. 162 is intended to improve financial reporting by identifying a consistent framework, or hierarchy, for selecting accounting principles to be used in preparing financial statements that are presented in conformity with accounting principles generally accepted in the United States of America for nongovernmental entities. SFAS No. 162 is effective 60 days following the SEC’s approval of the Public Company Accounting Oversight
133
MAGUIRE PROPERTIES, INC.
NOTES TO CONSOLIDATED FINANCIAL STATEMENTS—(continued)
Board’s related amendments to AU Section 411,The Meaning of Present Fairly in Conformity with GenerallyAccepted Accounting Principles. We do not expect the adoption of SFAS No. 162 to have an impact on our results of operations or financial condition.
Note 21—Quarterly Financial Information (Unaudited)
| | | | | | | | | | | | | | | | |
| | | First
Quarter | | | Second
Quarter | | | Third
Quarter | | | Fourth
Quarter | |
| | | (In thousands, except share and per share amounts) | |
Year Ended December 31, 2008 | | | | | | | | | | | | | | | | |
Revenue from continuing operations | | $ | 139,433 | | | $ | 135,999 | | | $ | 133,687 | | | $ | 137,914 | |
Loss from continuing operations | | | (37,762 | ) | | | (50,607 | ) | | | (40,675 | ) | | | (39,020 | ) |
Loss from discontinued operations | | | (6,063 | ) | | | (55,255 | ) | | | (27,083 | ) | | | (52,519 | ) |
Preferred stock dividends | | | (4,766 | ) | | | (4,766 | ) | | | (4,766 | ) | | | (4,766 | ) |
Net loss available to common stockholders | | | (48,591 | ) | | | (110,628 | ) | | | (72,524 | ) | | | (96,305 | ) |
| | | | |
Net loss available to common stockholders—
basic and diluted | | $ | (1.03 | ) | | $ | (2.32 | ) | | $ | (1.52 | ) | | $ | (2.02 | ) |
Weighted average number of common shares outstanding | | | 46,982,531 | | | | 47,615,421 | | | | 47,773,575 | | | | 47,777,101 | |
| | | | |
Distributions declared per common share | | $ | — | | | $ | — | | | $ | — | | | $ | — | |
Common stock market price: | | | | | | | | | | | | | | | | |
High | | $ | 29.90 | | | $ | 17.65 | | | $ | 16.32 | | | $ | 6.79 | |
Low | | | 12.42 | | | | 11.83 | | | | 4.75 | | | | 1.03 | |
| | | | |
Year Ended December 31, 2007 | | | | | | | | | | | | | | | | |
Revenue from continuing operations (1) | | $ | 97,917 | | | $ | 135,799 | | | $ | 144,104 | | | $ | 146,192 | |
Loss from continuing operations | | | (5,864 | ) | | | (37,112 | ) | | | (44,075 | ) | | | (32,885 | ) |
(Loss) income from discontinued operations | | | (1,957 | ) | | | 17,448 | | | | 130,575 | | | | (6,811 | ) |
Preferred stock dividends | | | (4,766 | ) | | | (4,766 | ) | | | (4,766 | ) | | | (4,766 | ) |
Net (loss) income available to common stockholders | | | (12,587 | ) | | | (24,430 | ) | | | 81,734 | | | | (44,462 | ) |
| | | | |
Net (loss) income available to common stockholders—basic | | $ | (0.27 | ) | | $ | (0.52 | ) | | $ | 1.74 | | | $ | (0.95 | ) |
Weighted average number of common shares outstanding | | | 46,578,064 | | | | 46,678,583 | | | | 46,870,588 | | | | 46,870,622 | |
| | | | |
Net (loss) income available to common
stockholders—diluted | | $ | (0.27 | ) | | $ | (0.52 | ) | | $ | 1.74 | | | $ | (0.95 | ) |
Weighted average number of common and common equivalent shares outstanding | | | 46,578,064 | | | | 46,678,583 | | | | 46,893,916 | | | | 46,870,622 | |
| | | | |
Distributions declared per common share | | $ | 0.40 | | | $ | 0.40 | | | $ | 0.40 | | | $ | 0.40 | |
Common stock market price: | | | | | | | | | | | | | | | | |
High | | $ | 44.69 | | | $ | 38.08 | | | $ | 36.00 | | | $ | 30.73 | |
Low | | | 34.81 | | | | 33.26 | | | | 21.95 | | | | 23.84 | |
| (1) | During the second quarter of 2007, we purchased 24 office properties and development sites from Blackstone Real Estate Advisors. The consolidated statements of operations include the results of operations for these properties commencing with the date of acquisition, April 24, 2007. |
Our quarterly financial information has been reclassified to reflect the classification of 3161 Michelson as held for sale as of December 31, 2008, which has been presented as discontinued operations in our consolidated statements of operations from the second quarter of 2007 when it was placed in service. During the fourth quarter of 2008, we recorded a $50.0 million impairment charge related to 3161 Michelson, which is included in discontinued operations. We have also reclassified the results of operations of 1920 and 2010 Main Plaza and City Plaza as a result of their disposition during the third quarter of 2008, which have been presented as discontinued operations in our consolidated statements of operations from their date of acquisition, April 24, 2007. Additionally, our quarterly financial information has been reclassified to reflect the disposition of Wateridge Plaza, Pacific Center and Regents Square during the second and third quarters of 2007. Therefore, amounts presented in the table above will not agree to those previously reported in our Quarterly Reports on Form 10-Q.
134
MAGUIRE PROPERTIES, INC.
NOTES TO CONSOLIDATED FINANCIAL STATEMENTS—(continued)
Note 22—Investments in Real Estate
A summary of information related to our investments in real estate as of December 31, 2008 is as follows (in thousands):
| | | | | | | | | | | | | | | | | | | | | | | | | | | | | | | | | | | |
| | | Encum-
brances | | Initial Cost | | Costs Capitalized
Subsequent to
Acquisition | | Total Costs | | Accu-
mulated
Depre-
ciation | | | Year
Acquired
(a) or
Con-
structed(c) | | | Life on
which
depre-
ciation
in latest
income
statements
is computed | |
| | | Land,
Acquired
Ground
Lease and
Land Held
for Devel-
opment and
Disposition | | Building
&
Improve-
ments | | Carrying
Costs | | | Improve-
ments | | Land,
Acquired
Ground
Lease and
Land Held
for Devel-
opment and
Disposition | | Building
&
Improve-
ments | | Total | | | |
Office Properties: | | | | | | | | | | | | | | | | | | | | | | | | | | |
| | | | | | | | | | | |
Los Angeles, CA | | | | | | | | | | | | | | | | | | | | | | | | | | | | | | | | | | | |
Wells Fargo Tower | | $ | 550,000 | | $ | 4,073 | | $ | — | | $ | * | * | | $ | 315,014 | | $ | 33,795 | | $ | 285,292 | | $ | 319,087 | | $ | (74,173 | ) | | 1982 | (c) | | | (3) |
333 S. Grand Avenue | | | | | | | | | | | | | | | | | | | | | | | | | | | | | | | | | | | |
Two California Plaza(1) | | | 470,000 | | | 57,564 | | | 522,055 | | | — | | | | 6,218 | | | 57,564 | | | 528,273 | | | 585,837 | | | (27,165 | ) | | 2007 | (a) | | | (3) |
350 S. Grand Avenue | | | | | | | | | | | | | | | | | | | | | | | | | | | | | | | | | | | |
Gas Company Tower | | | 458,000 | | | 39,337 | | | 24,668 | | | 54,464 | | | | 271,355 | | | 65,572 | | | 324,252 | | | 389,824 | | | (85,225 | ) | | 1991 | (c) | | | (3) |
525-555 W. Fifth Street | | | | | | | | | | | | | | | | | | | | | | | | | | | | | | | | | | | |
777 Tower | | | 273,000 | | | 34,864 | | | 251,556 | | | — | | | | 18,453 | | | 34,864 | | | 270,009 | | | 304,873 | | | (34,836 | ) | | 2005 | (a) | | | (3) |
777 S. Figueroa Street | | | | | | | | | | | | | | | | | | | | | | | | | | | | | | | | | | | |
US Bank Tower(2) | | | 260,000 | | | 21,233 | | | — | | | 38,122 | | | | 272,181 | | | 41,183 | | | 290,353 | | | 331,536 | | | (56,432 | ) | | 1989 | (c) | | | (3) |
633 W. Fifth Street | | | | | | | | | | | | | | | | | | | | | | | | | | | | | | | | | | | |
KPMG Tower(2) | | | 399,318 | | | 4,666 | | | — | | | * | * | | | 237,099 | | | 15,386 | | | 226,379 | | | 241,765 | | | (68,014 | ) | | 1983 | (c) | | | (3) |
355 S. Grand Avenue | | | | | | | | | | | | | | | | | | | | | | | | | | | | | | | | | | | |
550 S. Hope Street | | | 200,000 | | | 33,028 | | | 182,342 | | | — | | | | 1,070 | | | 33,028 | | | 183,412 | | | 216,440 | | | (9,800 | ) | | 2007 | (a) | | | (3) |
| | | | | | | | | | | |
Santa Monica, CA | | | | | | | | | | | | | | | | | | | | | | | | | | | | | | | | | | | |
Lantana Media Campus | | | 98,000 | | | 24,732 | | | 82,768 | | | — | | | | 11,167 | | | 24,732 | | | 93,935 | | | 118,667 | | | (11,910 | ) | | 2004 | (a) | | | (3) |
2900/3000 W. Olympic Boulevard | | | | | | | | | | | | | | | | | | | | | | | | | | | | | | | | | | | |
3003 Exposition Boulevard | | | | | | | | | | | | | | | | | | | | | | | | | | | | | | | | | | | |
3301 Exposition Boulevard(4) (South building) | | | — | | | 9,690 | | | 48,544 | | | — | | | | 4,760 | | | 9,690 | | | 53,304 | | | 62,994 | | | (252 | ) | | 2008 | (c) | | | (3) |
| | | | | | | | | | | |
Glendale, CA | | | | | | | | | | | | | | | | | | | | | | | | | | | | | | | | | | | |
Glendale Center | | | 125,000 | | | 12,596 | | | 22,882 | | | — | | | | 61,130 | | | 12,596 | | | 84,012 | | | 96,608 | | | (17,787 | ) | | 1995 | (a) | | | (3) |
611 N. Brand Boulevard | | | | | | | | | | | | | | | | | | | | | | | | | | | | | | | | | | | |
801 N. Brand Boulevard | | | 75,540 | | | 9,465 | | | 83,796 | | | — | | | | 3,379 | | | 9,465 | | | 87,175 | | | 96,640 | | | (10,800 | ) | | 2005 | (a) | | | (3) |
701 N. Brand Boulevard | | | 33,750 | | | 5,031 | | | 35,849 | | | — | | | | 565 | | | 5,031 | | | 36,414 | | | 41,445 | | | (2,831 | ) | | 2006 | (a) | | | (3) |
700 N. Central Avenue | | | 27,460 | | | 3,341 | | | 31,952 | | | — | | | | 3,412 | | | 3,341 | | | 35,364 | | | 38,705 | | | (4,629 | ) | | 2005 | (a) | | | (3) |
| | | | | | | | | | | |
Pasadena, CA | | | | | | | | | | | | | | | | | | | | | | | | | | | | | | | | | | | |
Plaza Las Fuentes | | | 99,800 | | | — | | | — | | | 5,654 | | | | 124,288 | | | — | | | 129,942 | | | 129,942 | | | (61,319 | ) | | 1989 | (c) | | | (3) |
99/111/135 N. Los Robles Avenue | | | | | | | | | | | | | | | | | | | | | | | | | | | | | | | | | | | |
| | | | | | | | | | | |
Irvine, CA | | | | | | | | | | | | | | | | | | | | | | | | | | | | | | | | | | | |
Park Place I | | | 170,000 | | | 32,923 | | | 199,296 | | | — | | | | 10,105 | | | 32,923 | | | 209,401 | | | 242,324 | | | (42,476 | ) | | 2004 | (a) | | | (3) |
3333 Michelson Drive | | | | | | | | | | | | | | | | | | | | | | | | | | | | | | | | | | | |
3337/3345/3347/3349/3351 | | | | | | | | | | | | | | | | | | | | | | | | | | | | | | | | | | | |
Michelson Drive | | | | | | | | | | | | | | | | | | | | | | | | | | | | | | | | | | | |
3353/3355 Michelson Drive | | | | | | | | | | | | | | | | | | | | | | | | | | | | | | | | | | | |
Park Place II | | | 99,268 | | | 15,706 | | | 107,434 | | | — | | | | 4,042 | | | 15,706 | | | 111,476 | | | 127,182 | | | (15,365 | ) | | 2004 | (a) | | | (3) |
3121 Michelson Drive | | | | | | | | | | | | | | | | | | | | | | | | | | | | | | | | | | | |
2957/2961-2963/2967/2981- | | | | | | | | | | | | | | | | | | | | | | | | | | | | | | | | | | | |
2983 Michelson Drive | | | | | | | | | | | | | | | | | | | | | | | | | | | | | | | | | | | |
2991/3021-3041/3309/3101/ | | | | | | | | | | | | | | | | | | | | | | | | | | | | | | | | | | | |
3323 Michelson Drive | | | | | | | | | | | | | | | | | | | | | | | | | | | | | | | | | | | |
3377 Michelson Drive(5) | | | — | | | 3,400 | | | 23,878 | | | — | | | | — | | | 3,400 | | | 23,878 | | | 27,278 | | | (845 | ) | | 2007 | (c) | | | (3) |
2600 Michelson Drive | | | 110,000 | | | 23,237 | | | 75,257 | | | — | | | | 778 | | | 23,237 | | | 76,035 | | | 99,272 | | | (4,812 | ) | | 2007 | (a) | | | (3) |
17885 Von Karman Avenue | | | 24,145 | | | 6,305 | | | 29,866 | | | 2,125 | | | | — | | | 6,305 | | | 31,991 | | | 38,296 | | | — | | | 2008 | (c) | | | |
18581 Teller Avenue | | | 20,000 | | | 6,312 | | | 12,734 | | | — | | | | 29 | | | 6,312 | | | 12,763 | | | 19,075 | | | (1,019 | ) | | 2007 | (a) | | | (3) |
135
MAGUIRE PROPERTIES, INC.
NOTES TO CONSOLIDATED FINANCIAL STATEMENTS—(continued)
| | | | | | | | | | | | | | | | | | | | | | | | | | | | | | | | | | | | |
| | | Encum-
brances | | Initial Cost | | Costs Capitalized
Subsequent to
Acquisition | | Total Costs | | Accu-
mulated
Depre-
ciation | | | Year
Acquired
(a) or
Con-
structed(c) | | | Life on
which
depre-
ciation
in latest
income
statements
is computed | |
| | | Land,
Acquired
Ground
Lease and
Land Held
for Devel-
opment and
Disposition | | | Building
&
Improve-
ments | | Carrying
Costs | | Improve-
ments | | Land,
Acquired
Ground
Lease and
Land Held
for Devel-
opment and
Disposition | | | Building
&
Improve-
ments | | Total | | | |
Office Properties: | | | | | | | | | | | | | | | | | | | | | | | | | | | |
Santa Ana, CA | | | | | | | | | | | | | | | | | | | | | | | | | | | | | | | | | | | | |
Griffin Towers | | $ | 145,000 | | $ | 35,792 | | | $ | 147,746 | | $ | — | | $ | 3,600 | | $ | 35,792 | | | $ | 151,346 | | $ | 187,138 | | $ | (8,413 | ) | | 2007 | (a) | | | (3) |
5/6 Hutton Centre Drive | | | | | | | | | | | | | | | | | | | | | | | | | | | | | | | | | | | | |
| | | | | | | | | | | |
Costa Mesa, CA | | | | | | | | | | | | | | | | | | | | | | | | | | | | | | | | | | | | |
Pacific Arts Plaza | | | 270,000 | | | 30,765 | | | | 239,914 | | | — | | | 20,694 | | | 30,765 | | | | 260,608 | | | 291,373 | | | (29,356 | ) | | 2005 | (a) | | | (3) |
601/611/633/655/675 Anton Boulevard | | | | | | | | | | | | | | | | | | | | | | | | | | | | | | | | | | | | |
3180/3199/3200/3210 Park Center Drive | | | | | | | | | | | | | | | | | | | | | | | | | | | | | | | | | | | | |
3200 Bristol Street | | | | | | | | | | | | | | | | | | | | | | | | | | | | | | | | | | | | |
3201 Avenue of the Arts | | | | | | | | | | | | | | | | | | | | | | | | | | | | | | | | | | | | |
| | | | | | | | | | | |
Orange, CA | | | | | | | | | | | | | | | | | | | | | | | | | | | | | | | | | | | | |
The City—3800 Chapman | | | 44,370 | | | 10,068 | | | | 32,892 | | | — | | | 537 | | | 10,068 | | | | 33,429 | | | 43,497 | | | (1,922 | ) | | 2007 | (a) | | | (3) |
3800 West Chapman | | | | | | | | | | | | | | | | | | | | | | | | | | | | | | | | | | | | |
City Parkway | | | 98,751 | | | 27,865 | | | | 111,708 | | | — | | | 764 | | | 27,865 | | | | 112,472 | | | 140,337 | | | (5,959 | ) | | 2007 | (a) | | | (3) |
500/505/600 City Parkway West | | | | | | | | | | | | | | | | | | | | | | | | | | | | | | | | | | | | |
4050 W. Metropolitan | | | — | | | 3,500 | | | | — | | | — | | | 1 | | | 3,500 | | | | 1 | | | 3,501 | | | — | | | | | | | |
City Tower | | | 140,000 | | | 23,984 | | | | 114,872 | | | — | | | 2,623 | | | 23,984 | | | | 117,495 | | | 141,479 | | | (6,656 | ) | | 2007 | (a) | | | (3) |
333 City Boulevard West | | | | | | | | | | | | | | | | | | | | | | | | | | | | | | | | | | | | |
500 Orange Tower | | | 110,000 | | | 20,086 | | | | 63,318 | | | — | | | 1,348 | | | 20,086 | | | | 64,666 | | | 84,752 | | | (4,496 | ) | | 2007 | (a) | | | (3) |
450/500 N. State College Boulevard | | | | | | | | | | | | | | | | | | | | | | | | | | | | | | | | | | | | |
| | | | | | | | | | | |
Anaheim, CA | | | | | | | | | | | | | | | | | | | | | | | | | | | | | | | | | | | | |
Stadium Towers | | | 100,000 | | | 16,656 | | | | 71,031 | | | — | | | 380 | | | 16,656 | | | | 71,411 | | | 88,067 | | | (4,238 | ) | | 2007 | (a) | | | (3) |
2400 E. Katella Avenue | | | | | | | | | | | | | | | | | | | | | | | | | | | | | | | | | | | | |
| | | | | | | | | | | |
Brea, CA | | | | | | | | | | | | | | | | | | | | | | | | | | | | | | | | | | | | |
Brea Corporate Place(1) | | | 70,469 | | | (1,763 | ) | | | 78,823 | | | — | | | 681 | | | (1,763 | ) | | | 79,504 | | | 77,741 | | | (4,452 | ) | | 2007 | (a) | | | (3) |
135/145 S. State College Boulevard | | | | | | | | | | | | | | | | | | | | | | | | | | | | | | | | | | | | |
Brea Financial Commons | | | 38,532 | | | 9,896 | | | | 26,181 | | | — | | | 6,068 | | | 9,896 | | | | 32,249 | | | 42,145 | | | (1,989 | ) | | 2007 | (a) | | | (3) |
100/120/140 S. State College Boulevard | | | | | | | | | | | | | | | | | | | | | | | | | | | | | | | | | | | | |
130 State College | | | — | | | 1,590 | | | | 8,325 | | | — | | | 98 | | | 1,590 | | | | 8,423 | | | 10,013 | | | (402 | ) | | 2007 | (a) | | | (3) |
130 S. State College Boulevard | | | | | | | | | | | | | | | | | | | | | | | | | | | | | | | | | | | | |
| | | | | | | | | | | |
San Diego, CA | | | | | | | | | | | | | | | | | | | | | | | | | | | | | | | | | | | | |
Mission City Center | | | 52,000 | | | 7,362 | | | | 43,900 | | | — | | | 2,660 | | | 7,362 | | | | 46,560 | | | 53,922 | | | (6,729 | ) | | 2005 | (a) | | | (3) |
2355/2365/2375 Northside Drive | | | | | | | | | | | | | | | | | | | | | | | | | | | | | | | | | | | | |
2385 Northside Drive | | | 13,991 | | | 3,510 | | | | 20,490 | | | 1,936 | | | 84 | | | 3,510 | | | | 22,510 | | | 26,020 | | | — | | | 2008 | (c) | | | |
| | | | | | | | | | | | | | | | | | | | | | | | | | | | | | | | | | | | |
Total office properties | | | 4,576,394 | | | 536,814 | | | | 2,694,077 | | | 102,301 | | | 1,384,583 | | | 623,441 | | | | 4,094,334 | | | 4,717,775 | | | (604,302 | ) | | | | | | |
| | | | | | | | | | | | | | | | | | | | | | | | | | | | | | | | | | | | |
136
MAGUIRE PROPERTIES, INC.
NOTES TO CONSOLIDATED FINANCIAL STATEMENTS—(continued)
| | | | | | | | | | | | | | | | | | | | | | | | | | | | | | | | | |
| | | Encum-
brances | | Initial Cost | | Costs Capitalized
Subsequent to
Acquisition | | Total Costs | | Accu-
mulated
Depre-
ciation | | | Year
Acquired
(a) or
Con-
structed(c) | | | Life on
which
depre-
ciation
in latest
income
statements
is computed |
| | | Land,
Acquired
Ground
Lease and
Land Held
for Devel-
opment and
Disposition | | Building
&
Improve-
ments | | Carrying
Costs | | Improve-
ments | | Land,
Acquired
Ground
Lease and
Land Held
for Devel-
opment and
Disposition | | Building
&
Improve-
ments | | Total | | | |
Construction in Progress: | | | | | | | | | | | | | | | | | | | | | | | | |
Santa Monica, CA | | | | | | | | | | | | | | | | | | | | | | | | | | | | | | | | | |
Lantana Media Campus | | $ | 79,953 | | $ | 6,281 | | $ | — | | $ | 34,141 | | $ | — | | $ | 40,422 | | $ | — | | $ | 40,422 | | $ | — | | | | | | |
3030 Olympic Boulevard | | | | | | | | | | | | | | | | | | | | | | | | | | | | | | | | | |
(East building) | | | | | | | | | | | | | | | | | | | | | | | | | | | | | | | | | |
Glendale, CA | | | | | | | | | | | | | | | | | | | | | | | | | | | | | | | | | |
207 Goode Avenue | | | 34,133 | | | 14,329 | | | — | | | 39,436 | | | — | | | 53,765 | | | — | | | 53,765 | | | — | | | | | | |
| | | | | | | | | | | | | | | | | | | | | | | | | | | | | | | | | |
Total construction in progress | | | 114,086 | | | 20,610 | | | — | | | 73,577 | | | — | | | 94,187 | | | — | | | 94,187 | | | — | | | | | | |
| | | | | | | | | | | | | | | | | | | | | | | | | | | | | | | | | |
Land Held for Development: | | | | | | | | | | | | | | | | | | | | | | | | |
Los Angeles County | | | | | | | | | | | | | | | | | | | | | | | | | | | | | | | | | |
755 S. Figueroa Street | | | — | | | 41,430 | | | — | | | 3,197 | | | — | | | 44,627 | | | — | | | 44,627 | | | — | | | | | | |
Glendale Center—Phase II | | | | | | 5,761 | | | — | | | 213 | | | — | | | 5,974 | | | — | | | 5,974 | | | — | | | | | | |
| | | | | | | | | | | |
Orange County | | | | | | | | | | | | | | | | | | | | | | | | | | | | | | | | | |
Pacific Arts Plaza | | | — | | | 17,050 | | | — | | | 1,154 | | | — | | | 18,204 | | | — | | | 18,204 | | | — | | | | | | |
Park Place/2600 Michelson Drive | | | — | | | 59,309 | | | — | | | 5,923 | | | — | | | 65,232 | | | — | | | 65,232 | | | — | | | | | | |
Brea Financial Commons/Brea Corporate Place | | | — | | | 419 | | | — | | | 79 | | | — | | | 498 | | | — | | | 498 | | | — | | | | | | |
Stadium Tower II | | | — | | | 12,700 | | | — | | | 25 | | | — | | | 12,725 | | | — | | | 12,725 | | | — | | | | | | |
500 Orange Center | | | — | | | 17,903 | | | — | | | 368 | | | — | | | 18,271 | | | — | | | 18,271 | | | — | | | | | | |
City Tower II | | | — | | | 25,200 | | | — | | | 10 | | | — | | | 25,210 | | | — | | | 25,210 | | | — | | | | | | |
| | | | | | | | | | | |
San Diego County | | | | | | | | | | | | | | | | | | | | | | | | | | | | | | | | | |
San Diego Tech Center | | | — | | | 18,341 | | | — | | | 4,922 | | | — | | | 23,263 | | | — | | | 23,263 | | | — | | | | | | |
| | | | | | | | | | | |
Other | | | | | | | | | | | | | | | | | | | | | | | | | | | | | | | | | |
Corporate assets | | | — | | | — | | | — | | | 722 | | | — | | | 722 | | | — | | | 722 | | | — | | | | | | |
| | | | | | | | | | | | | | | | | | | | | | | | | | | | | | | | | |
Total land held for development | | | — | | | 198,113 | | | — | | | 16,613 | | | — | | | 214,726 | | | — | | | 214,726 | | | — | | | | | | |
| | | | | | | | | | | | | | | | | | | | | | | | | | | | | | | | | |
Total | | $ | 4,690,480 | | $ | 755,537 | | $ | 2,694,077 | | $ | 192,491 | | $ | 1,384,583 | | $ | 932,354 | | $ | 4,094,334 | | $ | 5,026,688 | | $ | (604,302 | ) | | | | | |
| | | | | | | | | | | | | | | | | | | | | | | | | | | | | | | | | |
Assets held for sale: | | | | | | | | | | | | | | | | | | | | | | | | |
3161 Michelson Drive(6) | | $ | 168,719 | | $ | 12,000 | | $ | 159,669 | | $ | — | | $ | — | | $ | 12,000 | | $ | 159,669 | | $ | 171,669 | | $ | (8,396 | ) | | 2007 | (c) | | (3) |
| | | | | | | | | | | | | | | | | | | | | | | | | | | | | | | | | |
| ** | Information on carrying costs capitalized is not available; such costs are included with improvements for the Wells Fargo Tower and KPMG Tower. |
| (1) | Amounts shown in land, acquired ground lease, and land held for development and disposition include the fair value of the ground lease on the property at the date of acquisition. |
| (2) | US Bank Tower includes the Westlawn off-site parking garage and the KPMG Tower includes the X-2 off-site parking garage. |
| (3) | The cost of buildings and improvements is depreciated on a straight-line basis over 25 to 50 years. Acquired ground leases are depreciated on a straight-line basis over the remaining life of the ground leases as of the date of assumption. Tenant improvements are depreciated on a straight-line basis over the shorter of the useful life or lease term. Furniture, fixtures and equipment are depreciated on a straight-line basis over five years. |
| (4) | 3301 Exposition Boulevard (South Building) is encumbered by an $80.0 million construction loan which is included in Construction in Progress below—see 3030 Olympic Boulevard (East Building). |
| (5) | 3377 Michelson Drive is encumbered by a $168.7 million construction loan which has been allocated to Assets Held for Sale below—see 3161 Michelson Drive. |
| (6) | Building and improvements for 3161 Michelson reflects a $50.0 million impairment charge recorded in the fourth quarter of 2008 upon transfer to assets held for sale. |
137
MAGUIRE PROPERTIES, INC.
NOTES TO CONSOLIDATED FINANCIAL STATEMENTS—(continued)
The aggregate gross cost of our investments in real estate for federal income tax purposes approximated $5.0 billion (unaudited) as of December 31, 2008.
The following is a reconciliation of our real estate assets and accumulated depreciation (in thousands):
| | | | | | | | | | | | |
| | | For the Year Ended December 31, | |
| | | 2008 | | | 2007 | | | 2006 | |
Investments in Real Estate | | | | | | | | | | | | |
Balance, beginning of year | | $ | 5,439,044 | | | $ | 3,374,671 | | | $ | 3,897,893 | |
Additions— | | | | | | | | | | | | |
Acquisitions | | | — | | | | 2,858,574 | | | | 182,987 | |
Improvements | | | 180,564 | | | | 248,682 | | | | 152,407 | |
Deductions— | | | | | | | | | | | | |
Dispositions | | | (368,845 | ) | | | (1,042,211 | ) | | | (849,503 | ) |
Transfer to assets held for sale | | | (221,669 | ) | | | — | | | | — | |
Other | | | (2,406 | ) | | | (672 | ) | | | (9,113 | ) |
| | | | | | | | | | | | |
Balance, end of year | | $ | 5,026,688 | | | $ | 5,439,044 | | | $ | 3,374,671 | |
| | | | | | | | | | | | |
Accumulated Depreciation | | | | | | | | | | | | |
Balance, beginning of year | | $ | 476,337 | | | $ | 357,422 | | | $ | 309,270 | |
Additions— | | | | | | | | | | | | |
Depreciation expense | | | 149,303 | | | | 139,196 | | | | 98,377 | |
Deductions— | | | | | | | | | | | | |
Dispositions | | | (12,501 | ) | | | (19,634 | ) | | | (40,941 | ) |
Transfer to assets held for sale | | | (8,396 | ) | | | — | | | | — | |
Other | | | (441 | ) | | | (647 | ) | | | (9,284 | ) |
| | | | | | | | | | | | |
Balance, end of year | | $ | 604,302 | | | $ | 476,337 | | | $ | 357,422 | |
| | | | | | | | | | | | |
138
| Item 9. | Changes in and Disagreements with Accountants on Accounting and Financial Disclosure. |
None.
| Item 9A. | Controls and Procedures. |
Evaluation of Disclosure Controls and Procedures
We maintain disclosure controls and procedures (as defined in Rule 13a-15(e) or Rule 15d-15(e) under the Exchange Act) that are designed to ensure that information required to be disclosed in our reports under the Exchange Act is processed, recorded, summarized and reported within the time periods specified in the SEC’s rules and forms and that such information is accumulated and communicated to our management, including our principal executive officer and principal financial officer, as appropriate, to allow for timely decisions regarding required disclosure. In designing and evaluating the disclosure controls and procedures, management recognizes that any controls and procedures, no matter how well designed and operated, can provide only reasonable assurance of achieving the desired control objectives, and management is required to apply its judgment in evaluating the cost-benefit relationship of possible controls and procedures.
As required by SEC Rule 13a-15(b), we carried out an evaluation, under the supervision and with the participation of our management, including our principal executive officer and our principal financial officer, of the effectiveness of the design and operation of our disclosure controls and procedures as of the end of the period covered by this report. Based on this evaluation, Nelson C. Rising, our principal executive officer, and Shant Koumriqian, our principal financial officer, concluded that these disclosure controls and procedures were effective at the reasonable assurance level as of December 31, 2008.
Management’s Annual Report on Internal Control over Financial Reporting
Management is responsible for establishing and maintaining adequate internal control over financial reporting (as defined in Exchange Act Rules 13a-15(f) and 15d-15(f)). Our management, including Messrs. Rising and Koumriqian, evaluated the effectiveness of our internal control over financial reporting using the framework inInternal Control—Integrated Framework issued by the Committee of Sponsoring Organizations of the Treadway Commission. Based on this evaluation, management concluded that our internal control over financial reporting was effective as of December 31, 2008. KPMG LLP, our independent registered public accounting firm, has audited our internal control over financial reporting as of December 31, 2008 and their attestation report is included in this Annual Report on Form 10-K.
Changes in Internal Control over Financial Reporting
There was no change in our internal control over financial reporting that occurred during the three months ended December 31, 2008 that has materially affected, or is reasonably likely to materially affect, our internal control over financial reporting. We may make changes in our internal control processes from time to time in the future.
| Item 9B. | Other Information. |
Effective as of March 12, 2009, we entered into an amended and restated employment agreement with Shant Koumriqian. Mr. Koumriqian was previously promoted from Senior Vice President and Chief Accounting Officer to Executive Vice President, Chief Financial Officer on December 31, 2008. The amended and restated employment agreement provides for terms and conditions that are comparable to the Company’s other Executive Vice Presidents.
Mr. Koumriqian’s employment agreement has a term of five years. The target annual bonus for Mr. Koumriqian has been increased from 60% of his base salary to 100% of his base salary.
139
In addition, under the Second Amended and Restated 2003 Incentive Award Plan, as of the effective date of his employment agreement, the Company granted Mr. Koumriqian 52,000 restricted stock units subject to time-based vesting with dividend equivalent rights. Each vested restricted stock unit represents the right to receive one share of common stock of Maguire Properties, Inc.
Mr. Koumriqian’s previous employment terms provided for him to receive severance only upon a termination of employment by the Company without cause in an amount equal to the sum of 100% of his then-current annual base salary and 50% of his target annual bonus. Mr. Koumriqian’s new employment agreement provides that if his employment is terminated by the Company without cause or by Mr. Koumriqian for good reason, he will receive severance, including an amount equal to 150% of the sum of his then-current annual base salary plus the average annual bonus received for the three preceding fiscal years. If Mr. Koumriqian’s employment is terminated by the Company without cause or by Mr. Koumriqian for good reason within two years after a change in control or by Mr. Koumriqian for any reason within 30 days after the one-year anniversary of the change in control, then Mr. Koumriqian will receive the severance described in the preceding sentence, except that the severance multiple will be 200%. Severance is also payable in the event of Mr. Koumriqian’s death or disability.
Mr. Koumriqian is not eligible to receive an additional tax gross-up payment for amounts subject to excise tax imposed on certain so-called “excess parachute payments” under Section 4999 of the Code, as amended.
Mr. Koumriqian’s responsibilities in his role as Executive Vice President, Chief Financial Officer remain unchanged. All other material terms of Mr. Koumriqian’s employment, including his annual base salary, remain the same as those contained in his employment letter dated as of December 31, 2008, previously filed with the SEC.
The description of Mr. Koumriqian’s employment agreement is qualified in its entirety by reference to the full text of the document filed as Exhibit 10.3 to this Annual Report on Form 10-K.
140
PART III
| Item 10. | Directors, Executive Officers and Corporate Governance. |
The information required under this Item is incorporated herein by reference to our 2009 Notice of Annual Meeting of Stockholders and Proxy Statement or Annual Report on Form 10-K/A, which we intend to file with the SEC within 120 days after December 31, 2008.
Our Chief Executive Officer has filed his annual certification with the New York Stock Exchange (“NYSE”) for 2008, as required pursuant to Section 303A.12(a) of the NYSE Listed Company Manual. In addition, we have filed the Sarbanes-Oxley Act Section 302 certifications of our principal executive officer and principal financial officer with the SEC, which are filed with this report as Exhibits 31.1 and 31.2, respectively.
| Item 11. | Executive Compensation. |
The information required under this Item is incorporated herein by reference to our 2009 Notice of Annual Meeting of Stockholders and Proxy Statement or Annual Report on Form 10-K/A, which we intend to file with the SEC within 120 days after December 31, 2008.
| Item 12. | Security Ownership of Certain Beneficial Owners and Management and Related Stockholder Matters. |
The information required under this Item is incorporated herein by reference to our 2009 Notice of Annual Meeting of Stockholders and Proxy Statement or Annual Report on Form 10-K/A, which we intend to file with the SEC within 120 days after December 31, 2008.
| Item 13. | Certain Relationships and Related Transactions, and Director Independence. |
The information required under this Item is incorporated herein by reference to our 2009 Notice of Annual Meeting of Stockholders and Proxy Statement or Annual Report on Form 10-K/A, which we intend to file with the SEC within 120 days after December 31, 2008.
| Item 14. | Principal Accounting Fees and Services. |
The information required under this Item is incorporated herein by reference to our 2009 Notice of Annual Meeting of Stockholders and Proxy Statement or Annual Report on Form 10-K/A, which we intend to file with the SEC within 120 days after December 31, 2008.
141
PART IV
| Item 15. | Exhibits and Financial Statement Schedules. |
| | (a) | The following documents are filed as part of this report: |
See Part II, Item 8. “Financial Statements and Supplementary Data.”
| | 2. | Financial Statement Schedules for the Years Ended December 31, 2008, 2007 and 2006 |
All financial statement schedules are omitted because they are not applicable, or the required information is shown in the consolidated financial statements or notes thereto. See Part II, Item 8. “Financial Statements and Supplementary Data.”
| | 3. | Exhibits (listed by numbers corresponding to Item 601 of Regulation S-K) |
142
| | | | | | | | | | |
| | | | | Incorporated by Reference |
Exhibit No. | | Exhibit Description | | Form | | File No. | | Exhibit(s) | | Filing Date |
| | | | | |
| 3.1 | | Articles of Amendment and Restatement of Maguire Properties, Inc. | | 10-Q | | 001-31717 | | 3.1 | | August 13, 2003 |
| | | | | |
| 3.2 | | Form of Articles Supplementary of Maguire Properties, Inc. | | S-11/A | | 333-111577 | | 3.2 | | January 14, 2004 |
| | | | | |
| 3.3 | | Second Amended and Restated Bylaws of Maguire Properties, Inc. | | 8-K | | 001-31717 | | 3.1 | | May 19, 2008 |
| | | | | |
| 3.4 | | Amendment No. 1 to the Second Amended and Restated Bylaws of Maguire Properties, Inc. | | 8-K | | 001-31717 | | 3.1 | | July 7, 2008 |
| | | | | |
| 4.1 | | Form of Certificate of Common Stock of Maguire Properties, Inc. | | 10-Q | | 001-31717 | | 4.1 | | August 11, 2008 |
| | | | | |
| 4.2 | | Form of Certificate for Series A Preferred Stock of Maguire Properties, Inc. | | 10-Q | | 001-31717 | | 4.2 | | August 11, 2008 |
| | | | | |
| 10.1 | | Form of Indemnification Agreement | | 10-Q | | 001-31717 | | 10.1 | | August 11, 2008 |
| | | | | |
| 10.2 | | Employment Agreement, effective as of May 17, 2008, between Maguire Properties, Inc., Maguire Properties, L.P. and Nelson C. Rising | | 8-K | | 001-31717 | | 10.1 | | May 19, 2008 |
| | | | | |
| 10.3* | | Amended and Restated Employment Agreement, effective as of March 12, 2009, between Maguire Properties, Inc., Maguire Properties, L.P. and Shant Koumriqian | | | | | | | | |
| | | | | |
| 10.4 | | Employment Agreement, effective as of May 17, 2008, between Maguire Properties, Inc., Maguire Properties, L.P. and Douglas J. Gardner | | 8-K | | 001-31717 | | 10.6 | | May 19, 2008 |
| | | | | |
| 10.5 | | Amendment No. 1 to Employment Agreement, effective as of December 31, 2008, between Maguire Properties, Inc., Maguire Properties, L.P. and Douglas J. Gardner | | 8-K | | 001-31717 | | 99.1 | | January 6, 2009 |
| | | | | |
| 10.6 | | Amended and Restated Employment Agreement, effective as of December 31, 2008 between Maguire Properties, Inc., Maguire Properties, L.P. and Mark Lammas | | 8-K | | 001-31717 | | 99.2 | | January 6, 2009 |
| | | | | |
| 10.7* | | Amended and Restated Employment Terms, effective as of December 31, 2008, between Maguire Properties, Inc., Maguire Properties, L.P. and Robert P. Goodwin | | | | | | | | |
| | | | | |
| 10.8* | | Amended and Restated Employment Terms, effective as of December 31, 2008, between Maguire Properties, Inc., Maguire Properties, L.P. and Peter K. Johnston | | | | | | | | |
143
| | | | | | | | | | |
| | | | | Incorporated by Reference |
Exhibit No. | | Exhibit Description | | Form | | File No. | | Exhibit(s) | | Filing Date |
| | | | | |
| 10.9 | | Employment Letter, effective as of May 17, 2008, between Maguire Properties, Inc., Maguire Properties, L.P. and Christopher C. Rising | | 8-K | | 001-31717 | | 10.8 | | May 19, 2008 |
| | | | | |
| 10.10 | | Employment Agreement , effective as of June 27, 2003, between Maguire Properties, Inc., Maguire Properties, L.P. and Robert F. Maguire III | | S-11/A | | 333-101170 | | 10.5 | | February 5, 2003 |
| | | | | |
| 10.11 | | Separation Agreement, dated as of May 17, 2008, among Maguire Properties, Inc., Maguire Properties, L.P. and Robert F. Maguire III | | 8-K | | 001-31717 | | 10.10 | | May 19, 2008 |
| | | | | |
| 10.12 | | Consulting Agreement, dated as of May 17, 2008, among Robert F. Maguire III, Maguire Properties, Inc. and Maguire Properties, L.P. | | 8-K | | 001-31717 | | 10.11 | | May 19, 2008 |
| | | | | |
| 10.13 | | Employment Agreement, dated as of June 30, 2006, between Maguire Properties, Inc., Maguire Properties, L.P. and Martin Griffiths | | 10-Q | | 001-31717 | | 10.1 | | August 9, 2006 |
| | | | | |
| 10.14 | | Consulting Services Agreement, dated as of June 30, 2008, between Maguire Properties, Inc., Maguire Properties, L.P. and Martin A. Griffiths | | 8-K | | 001-31717 | | 10.1 | | July 7, 2008 |
| | | | | |
| 10.15 | | Second Amended and Restated 2003 Incentive Award Plan of Maguire Properties, Inc., Maguire Properties Services, Inc. and Maguire Properties, L.P. | | DEFR14A | | 001-31717 | | Appendix I | | May 11, 2007 |
| | | | | |
| 10.16 | | Maguire Properties, Inc., Maguire Properties Services, Inc. and Maguire Properties, L.P. Incentive Bonus Plan | | S-11/A | | 333-101170 | | 10.41 | | May 30, 2003 |
| | | | | |
| 10.17 | | Performance Award Agreement form for grants to the Company’s named executive officers | | 8-K | | 001-31717 | | 99.1 | | April 28, 2005 |
| | | | | |
| 10.18 | | Time-Based Restricted Stock Units Agreement, effective as of May 17, 2008, between Maguire Properties, Inc., Maguire Properties, L.P. and Nelson C. Rising | | 8-K | | 0031-31717 | | 10.2 | | May 19, 2008 |
| | | | | |
| 10.19 | | Performance-Based Restricted Stock Units Agreement, effective as of May 17, 2008, between Maguire Properties, Inc., Maguire Properties, L.P. and Nelson C. Rising | | 8-K | | 0031-31717 | | 10.3 | | May 19, 2008 |
144
| | | | | | | | | | |
| | | | | Incorporated by Reference |
Exhibit No. | | Exhibit Description | | Form | | File No. | | Exhibit(s) | | Filing Date |
| | | | | |
| 10.20 | | Form of Dividend Equivalents Agreement for Ordinary Quarterly Cash Dividends Pursuant to Time-Based Restricted Stock Units Agreement between Maguire Properties, Inc., Maguire Properties, L.P. and Nelson C. Rising | | 8-K | | 0031-31717 | | 10.4 | | May 19, 2008 |
| | | | | |
| 10.21 | | Form of Dividend Equivalents Agreement for Ordinary Quarterly Cash Dividends Pursuant to Performance-Based Restricted Stock Units Agreement between Maguire Properties, Inc., Maguire Properties, L.P. and Nelson C. Rising | | 8-K | | 0031-31717 | | 10.5 | | May 19, 2008 |
| | | | | |
| 10.22* | | Form of Time-Based Restricted Stock Units Agreement for grants to the Company’s named executive officers | | | | | | | | |
| | | | | |
| 10.23 | | Form of Second Amended and Restated Agreement of Limited Partnership of Maguire Properties, L.P. | | S-11/A | | 333-111577 | | 10.2 | | January 14, 2004 |
| | | | | |
| 10.24 | | Contribution Agreement between Robert F. Maguire III, certain other contributors and Maguire Properties, L.P., dated as of November 11, 2002 | | S-11/A | | 333-101170 | | 10.19 | | June 2, 2003 |
| | | | | |
| 10.25 | | Contribution Agreement between Maguire/Thomas Partners - Master Investments, LLC and Maguire Properties, L.P., dated as of November 5, 2002 | | S-11/A | | 333-101170 | | 10.20 | | June 2, 2003 |
| | | | | |
| 10.26 | | Contribution Agreement between William Thomas Allen and Maguire Properties, L.P., dated as of November 7, 2002 | | S-11/A | | 333-101170 | | 10.21 | | February 5, 2003 |
| | | | | |
| 10.27 | | Registration Rights Agreement, dated as of June 27, 2003, among Maguire Properties, Inc., Maguire Properties, L.P. and the persons named therein | | 10-Q | | 001-31717 | | 10.2 | | August 13, 2003 |
| | | | | |
| 10.28 | | Services Agreement (Development), dated as of June 27, 2003, between Maguire Properties, L.P. and Maguire Partners Development, Ltd. | | 10-Q | | 001-31717 | | 10.27 | | August 13, 2003 |
| | | | | |
| 10.29 | | First Amendment to Services Agreement (Development), dated as of May 8, 2008 | | 10-Q | | 001-31717 | | 99.5 | | May 12, 2008 |
| | | | | |
| 10.30 | | Lease, dated as of November 15, 2005, between Maguire Partners - 1733 Ocean, LLC and Maguire Properties, L.P. | | 10-K | | 001-31717 | | 10.191 | | March 16, 2006 |
| | | | | |
| 10.31 | | Second Amendment to the Amended and Restated Property Insurance Sharing Agreement, dated February 28, 2008, among Maguire Properties, L.P., Maguire Properties Services, Inc. and the entities named therein | | 10-K | | 001-31717 | | 10.44 | | February 29, 2008 |
145
| | | | | | | | | | |
| | | | | Incorporated by Reference |
Exhibit No. | | Exhibit Description | | Form | | File No. | | Exhibit(s) | | Filing Date |
| | | | | |
| 10.32 | | Form of Amended and Restated Property Insurance Sharing Agreement, among Maguire Properties, L.P., Maguire Properties Services, Inc. and the entities named therein | | S-11/A | | 333-101170 | | 10.42 | | May 30, 2003 |
| | | | | |
| 10.33 | | Air Space Lease between Pasadena Community Development Commission and Maguire Thomas Partners/Pasadena Center, Ltd. dated December 19, 1985, Memorandum Agreements Regarding the Air Space Lease dated December 20, 1985, December 22, 1986, December 21, 1990 and February 25, 1991, Estoppel Certificates dated December 3, 1987, December 17, 1990 and November 1997 and Estoppel Certificate, Consent and Amendment dated March 2001 | | S-11/A | | 333-101170 | | 10.23 | | February 5, 2003 |
| | | | | |
| 10.34 | | Lease of Phase 1A dated August 26, 1983 between The Community Redevelopment Agency of the City of Los Angeles, California and Bunker Hill Associates and Amendments, dated September 13, 1985 and December 29, 1989 | | 8-K | | 001-31717 | | 99.5 | | November 20, 2003 |
| | | | | |
| 10.35 | | Limited Liability Company Agreement of Maguire Macquarie Office, LLC, dated as of October 26, 2005, between Macquarie Office II LLC and Maguire Properties, L.P. | | 8-K | | 001-31717 | | 10.1 | | January 11, 2006 |
| | | | | |
| 10.36 | | First Amended and Restated Limited Liability Company Agreement of Maguire Macquarie Office, LLC, dated as of January 5, 2006, among Maguire MO Manager, LLC, Macquarie Office II LLC and Maguire Properties, L.P. | | 8-K | | 001-31717 | | 10.2 | | January 11, 2006 |
| | | | | |
| 10.37 | | Contribution and Investment Agreement, dated as of October 26, 2005, among Maguire Properties, L.P., Macquarie Office II LLC and Maguire Macquarie Office, LLC | | 8-K | | 001-31717 | | 10.3 | | January 11, 2006 |
| | | | | |
| 10.38 | | Purchase and Sale Agreement (Cerritos Corporate Center), dated as of October 26, 2005, between Macquarie Office II LLC and Maguire Properties, L.P. | | 8-K | | 001-31717 | | 10.4 | | January 11, 2006 |
| | | | | |
| 10.39 | | Contribution Agreement (Cerritos Corporate Center I and II), dated as of October 26, 2005, between Macquarie Office II LLC and Maguire Macquarie Office, LLC | | 8-K | | 001-31717 | | 10.5 | | January 11, 2006 |
| | | | | |
| 10.40 | | Contribution Agreement (Stadium Gateway), dated as of October 26, 2005, among Maguire Properties, L.P., Macquarie Office II LLC and Maguire Macquarie Office, LLC | | 8-K | | 001-31717 | | 10.6 | | January 11, 2006 |
146
| | | | | | | | | | |
| | | | | Incorporated by Reference |
Exhibit No. | | Exhibit Description | | Form | | File No. | | Exhibit(s) | | Filing Date |
| | | | | |
| 10.41 | | Right of First Opportunity Agreement, dated as of January 5, 2006, between Macquarie Office Management Limited and Maguire Properties, L.P. | | 8-K | | 001-31717 | | 10.8 | | January 11, 2006 |
| | | | | |
| 10.42 | | Leasehold Deed of Trust, Security Agreement and Fixture Filing, dated as of January 5, 2006, by Maguire Macquarie - Cerritos I, LLC to First American Title Insurance Company | | 8-K | | 001-31717 | | 10.9 | | January 11, 2006 |
| | | | | |
| 10.43 | | Guaranty, dated as of January 5, 2006, by Maguire Macquarie Office, LLC for the benefit of LaSalle Bank National Association | | 8-K | | 001-31717 | | 10.10 | | January 11, 2006 |
| | | | | |
| 10.44 | | Contribution Agreement, dated as of January 5, 2006, by and between Maguire Properties, L.P. and Maguire Macquarie Office, LLC | | 8-K | | 001-31717 | | 10.11 | | January 11, 2006 |
| | | | | |
| 10.45 | | Loan Agreement, dated as of April 4, 2007, between North Tower, LLC, as Borrower, and Lehman Ali Inc. and Greenwich Capital Financial Products, Inc., together, as Lender | | 10-Q/A | | 001-31717 | | 99.3 | | September 28, 2007 |
| | | | | |
| 10.46 | | Loan Agreement, dated as of April 24, 2007, between Maguire Properties - Two Cal Plaza, LLC, as Borrower, and Greenwich Capital Financial Products, Inc., as Lender | | 10-Q/A | | 001-31717 | | 99.6 | | September 28, 2007 |
| | | | | |
| 10.47 | | Loan Agreement, dated as of August 7, 2006, between Maguire Properties - 555 W. Fifth, LLC, Maguire Properties - 350 S. Figueroa, LLC and Nomura Credit & Capital, Inc. | | 8-K | | 001-31717 | | 99.1 | | August 11, 2006 |
| | | | | |
| 10.48 | | Promissory Note A-1, dated as of August 7, 2006, between Maguire Properties - 555 W. Fifth, LLC, Maguire Properties - 350 S. Figueroa, LLC and Nomura Credit & Capital, Inc. | | 8-K | | 001-31717 | | 99.3 | | August 11, 2006 |
| | | | | |
| 10.49 | | Promissory Note A-2, dated as of August 7, 2006, between Maguire Properties - 555 W. Fifth, LLC, Maguire Properties - 350 S. Figueroa, LLC and Nomura Credit & Capital, Inc. | | 8-K | | 001-31717 | | 99.4 | | August 11, 2006 |
| | | | | |
| 10.50 | | Guaranty Agreement, dated as of August 7, 2006, by Maguire Properties, L.P. in favor of Nomura Credit & Capital, Inc. | | 8-K | | 001-31717 | | 99.2 | | August 11, 2006 |
| | | | | |
| 10.51 | | Loan Agreement, dated as of September 12, 2007, between Maguire Properties - 355 S. Grand, LLC, as Borrower, and Eurohypo AG, New York Branch, as Lender | | 10-Q | | 001-31717 | | 99.1 | | November 9, 2007 |
| | | | | |
| 10.52 | | Loan Agreement, dated as of March 15, 2005, between Maguire Properties - Pacific Arts Plaza, LLC and Bank of America, N.A. | | 10-Q | | 001-31717 | | 99.9 | | May 10, 2005 |
147
| | | | | | | | | | |
| | | | | Incorporated by Reference |
Exhibit No. | | Exhibit Description | | Form | | File No. | | Exhibit(s) | | Filing Date |
| | | | | |
| 10.53 | | Promissory Note, dated as of March 15, 2005, between Maguire Properties - Pacific Arts Plaza, LLC and Bank of America, N.A. | | 10-Q | | 001-31717 | | 99.10 | | May 10, 2005 |
| | | | | |
| 10.54 | | Loan Agreement, dated as of October 10, 2006, between Maguire Properties - 777 Tower, LLC and Bank of America, N.A. | | 8-K | | 001-31717 | | 99.1 | | October 16, 2006 |
| | | | | |
| 10.55 | | Promissory Note, dated as of October 10, 2006, between Maguire Properties - 777 Tower, LLC and Bank of America, N.A. | | 8-K | | 001-31717 | | 99.2 | | October 16, 2006 |
| | | | | |
| 10.56 | | Deed of Trust, Assignment of Rents, Security Agreement and Fixture Filing, dated as of June 26, 2003, among Library Square Associates, LLC, as Borrower, Commonwealth Title Company, as Trustee, and Greenwich Financial Products, Inc., as Lender | | 10-Q | | 001-31717 | | 10.8 | | August 13, 2003 |
| | | | | |
| 10.57 | | Loan Agreement, dated as of April 21, 2008, between Maguire Properties - Griffin Towers, LLC, as Borrower, and Greenwich Capital Financial Products, Inc., as Lender | | 10-Q | | 001-31717 | | 99.1 | | May 12, 2008 |
| | | | | |
| 10.58 | | Senior Mezzanine Loan Agreement, dated as of April 21, 2008, between Maguire Properties - Griffin Towers Senior Mezzanine, LLC, as Borrower, and Greenwich Capital Financial Products, Inc., as Lender | | 10-Q | | 001-31717 | | 99.2 | | May 12, 2008 |
| | | | | |
| 10.59 | | Junior Mezzanine Loan Agreement, dated as of April 21, 2008, between Maguire Properties - Griffin Towers Junior Mezzanine, LLC, as Borrower, and Greenwich Capital Financial Products, Inc., as Lender | | 10-Q | | 001-31717 | | 99.3 | | May 12, 2008 |
| | | | | |
| 10.60 | | Master Repurchase Agreement, dated as of April 21, 2008, between Maguire Properties-Holdings V, LLC, as Seller, and Greenwich Capital Financial Products, Inc., as Buyer | | 10-Q | | 001-31717 | | 99.4 | | May 12, 2008 |
| | | | | |
| 10.61 | | Loan Agreement, dated as of April 24, 2007, between Maguire Properties - 550 South Hope, LLC, as Borrower, and Greenwich Capital Financial Products, Inc., as Lender | | 10-Q/A | | 001-31717 | | 99.4 | | September 28, 2007 |
| | | | | |
| 10.62 | | Letter to Eurohypo AG, New York Branch regarding Maguire Properties-3161 Michelson LLC, Maguire Properties-Park Place PS2, LLC, Maguire Properties-Park Place PS5 Financing, dated as of September 29, 2008 | | 10-Q | | 001-31717 | | 99.5 | | November 10, 2008 |
148
| | | | | | | | | | |
| | | | | Incorporated by Reference |
Exhibit No. | | Exhibit Description | | Form | | File No. | | Exhibit(s) | | Filing Date |
| | | | | |
| 10.63 | | Third Amendment to Loan Agreement and Reaffirmation of Loan Documents among Maguire Properties-3161 Michelson, LLC, Maguire Properties-Park Place PS2, LLC and Maguire Properties-Park Place PS5, LLC, as Borrower, the lenders party hereto and Eurohypo AG, New York Branch, as Administrative Agent, dated as of September 29, 2008 | | 10-Q | | 001-31717 | | 99.4 | | November 10, 2008 |
| | | | | |
| 10.64 | | Second Amendment to Loan Agreement and Reaffirmation of Loan Documents among Maguire Properties-3161 Michelson, LLC, Maguire Properties-Park Place PS2, LLC and Maguire Properties-Park Place PS5, LLC, as Borrower, the lenders party hereto and Eurohypo AG, New York Branch, as Administrative Agent, dated as of September 29, 2008 | | 10-Q | | 001-31717 | | 99.3 | | November 10, 2008 |
| | | | | |
| 10.65 | | Construction Loan Agreement between Maguire Properties-3161 Michelson, LLC, Maguire Properties-Park Place PS2, LLC and Maguire Properties-Park Place PS5, LLC, as Borrower, the lenders party hereto and Eurohypo AG, New York Branch, as Administrative Agent, dated as of September 29, 2006 | | 10-Q | | 001-31717 | | 10.1 | | November 9, 2006 |
| | | | | |
| 10.66 | | Minimum Equity Guaranty Agreement, dated as of September 29, 2006, by Maguire Properties, L.P. in favor of Eurohypo AG, New York Branch | | 10-Q | | 001-31717 | | 10.2 | | November 9, 2006 |
| | | | | |
| 10.67 | | New Century Guaranty Agreement, dated as of September 29, 2006, by Maguire Properties, L.P. in favor of Eurohypo AG, New York Branch | | 10-Q | | 001-31717 | | 10.3 | | November 9, 2006 |
| | | | | |
| 10.68 | | Repayment Guaranty Agreement, dated as of September 29, 2006, by Maguire Properties, L.P. in favor of Eurohypo AG, New York Branch | | 10-Q | | 001-31717 | | 10.4 | | November 9, 2006 |
| | | | | |
| 10.69 | | Promissory Note for the promise to pay $60.0 million, dated as of September 29, 2006, between Maguire Properties-3161 Michelson, LLC, Maguire Properties-Park Place PS2, LLC and Maguire Properties-Park Place PS5, LLC and Capmark Bank | | 10-Q | | 001-31717 | | 10.5 | | November 9, 2006 |
| | | | | |
| 10.70 | | Promissory Note for the promise to pay $180.0 million, dated as of September 29, 2006, between Maguire Properties-3161 Michelson, LLC, Maguire Properties-Park Place PS2, LLC and Maguire Properties-Park Place PS5, LLC and Capmark Bank | | 10-Q | | 001-31717 | | 10.6 | | November 9, 2006 |
149
| | | | | | | | | | |
| | | | | Incorporated by Reference |
Exhibit No. | | Exhibit Description | | Form | | File No. | | Exhibit(s) | | Filing Date |
| | | | | |
| 10.71 | | Deed of Trust, Assignment of Leases and Rents, Security Agreement and Fixture Filing Statement, dated as of November 5, 2004, between Maguire Properties - Park Place, LLC and Teachers Insurance and Annuity Association of America | | 8-K | | 001-31717 | | 99.1 | | November 10, 2004 |
| | | | | |
| 10.72 | | Promissory Note, dated as of November 5, 2004, between Maguire Properties - Park Place, LLC and Teachers Insurance and Annuity Association of America | | 8-K | | 001-31717 | | 99.2 | | November 10, 2004 |
| | | | | |
| 10.73 | | Guaranty of Recourse Obligation of Borrower, dated as of November 5, 2004, between Maguire Properties - Park Place, LLC and Teachers Insurance and Annuity Association of America | | 8-K | | 001-31717 | | 99.3 | | November 10, 2004 |
| | | | | |
| 10.74 | | Loan Agreement between Maguire Partners-Plaza Las Fuentes, LLC, as Borrower, the lenders party hereto, as Lenders, Eurohypo AG, New York Branch, as Administrative Agent, and Wells Fargo Bank, N.A., as Syndication Agent, dated as of September 29, 2008 | | 10-Q | | 001-31717 | | 99.1 | | November 10, 2008 |
| | | | | |
| 10.75 | | Lease Reserve and Interest Carry Guarantee made by Maguire Properties, L.P. in favor of Eurohypo AG, New York Branch, dated as of September 29, 2008 | | 10-Q | | 001-31717 | | 99.2 | | November 10, 2008 |
| | | | | |
| 10.76 | | Park Place Development Agreement, dated as of October 14, 2002, among the City of Irvine and Crow Winthrop Development Limited Partnership, Shops at Park Place LLC, 3121 Michelson Drive LLC, 3161 Michelson Drive LLC, Park Place Parking Company LLC, Park Place Hotel Company LLC, Park Place Residential Highrise I LLC and Park Place Development LLC | | 10-Q | | 001-31717 | | 10.5 | | August 12, 2004 |
| | | | | |
| 10.77 | | Purchase Agreement dated as of February 13, 2007 | | 8-K | | 001-31717 | | 99.2 | | February 20, 2007 |
| | | | | |
| 10.78 | | Purchase and Sale Contract between Maguire Properties - 1920 Main Plaza, LLC and Maguire Properties - 2010 Main Plaza, LLC, as Sellers, and Shorenstein Properties LLC, as Buyer, dated as of June 26, 2008 | | 10-Q | | 001-31717 | | 99.1 | | August 11, 2008 |
| | | | | |
| 10.79 | | First Amendment to Purchase and Sale Contract between Maguire Properties – 1920 Main Plaza, LLC and Maguire Properties – 2010 Main Plaza, LLC, as Sellers, and Shorenstein Properties LLC, as Buyer, dated as of July 3, 2008 | | 10-Q | | 001-31717 | | 99.2 | | August 11, 2008 |
| | | | | |
| 10.80 | | Stockholder Agreement dated July 28, 2008 | | 8-K | | 001-31717 | | 99.1 | | July 29, 2008 |
150
| | | | | | | | | | |
| | | | | Incorporated by Reference |
Exhibit No. | | Exhibit Description | | Form | | File No. | | Exhibit(s) | | Filing
Date |
| | | | | |
| 12.1* | | Statement of Computation of Earnings to Fixed Charges and Preferred Stock Dividends | | | | | | | | |
| | | | | |
| 21.1* | | List of Subsidiaries of the Registrant as of December 31, 2008 | | | | | | | | |
| | | | | |
| 23.1* | | Consent of Independent Registered Public Accounting Firm | | | | | | | | |
| | | | | |
| 31.1* | | Certification of Principal Executive Officer dated March 16, 2009 pursuant to Section 302 of the Sarbanes-Oxley Act of 2002 | | | | | | | | |
| | | | | |
| 31.2* | | Certification of Principal Financial Officer dated March 16, 2009 pursuant to Section 302 of the Sarbanes-Oxley Act of 2002 | | | | | | | | |
| | | | | |
| 32.1** | | Certification of Principal Executive Officer and Principal Financial Officer dated March 16, 2009 pursuant to 18 U.S.C. Section 1350, as adopted pursuant to Section 906 of the Sarbanes-Oxley Act of 2002 (1) | | | | | | | | |
| (1) | This exhibit should not be deemed to be “filed” for purposes of Section 18 of the Exchange Act. |
We have not filed certain long-term debt instruments under which the principal amount of securities authorized to be issued does not exceed 10% of our total assets. Copies of such agreements will be provided to the SEC upon request.
| | (b) | Exhibits Required by Item 601 of Regulation SK |
See Item (3) above.
| | (c) | Financial Statement Schedules |
See Item (2) above.
151
SIGNATURES
Pursuant to the requirements of Section 13 or 15 (d) of the Securities Exchange Act of 1934, the registrant has duly caused this report to be signed on its behalf by the undersigned, thereunto duly authorized.
Date: As of March 16, 2009
| | |
| MAGUIRE PROPERTIES, INC. |
| Registrant |
| |
By: | | /S/ NELSON C. RISING |
| | Nelson C. Rising President and Chief Executive Officer (Principal executive officer) |
| |
By: | | /S/ SHANT KOUMRIQIAN |
| | Shant Koumriqian Executive Vice President, Chief Financial Officer (Principal financial officer) |
Pursuant to the requirements of the Securities Exchange Act of 1934, this report has been signed below by the following persons on behalf of the registrant and in the capacities and on the dates indicated.
| | | | | | |
| Date: As of | | March 16, 2009 | | By: | | /S/ NELSON C. RISING |
| | | | | | | Nelson C. Rising President and Chief Executive Officer (Principal executive officer) |
| | | |
| | March 16, 2009 | | By: | | /S/ SHANT KOUMRIQIAN |
| | | | | | Shant Koumriqian Executive Vice President, Chief Financial Officer (Principal financial officer) |
| | | |
| | March 16, 2009 | | By: | | /S/ GEORGE A. VANDEMAN |
| | | | | | George A. Vandeman Chairman of the Board |
| | | |
| | March 16, 2009 | | By: | | /S/ JONATHAN M. BROOKS |
| | | | | | Jonathan M. Brooks Director |
| | | |
| | March 16, 2009 | | By: | | /S/ CHRISTINE N. GARVEY |
| | | | | | Christine N. Garvey Director |
| | | |
| | March 16, 2009 | | By: | | /S/ CYRUS S. HADIDI |
| | | | | | Cyrus S. Hadidi Director |
| | | |
| | March 16, 2009 | | By: | | /S/ PAUL M. WATSON |
| | | | | | Paul M. Watson Director |
| | | |
| | March 16, 2009 | | By: | | /S/ DAVID L. WEINSTEIN |
| | | | | | David L. Weinstein Director |
152