Exhibit 99.2
Maguire Properties, Inc.
Supplemental Operating and Financial Data
Fourth Quarter 2008
| | PAGE |
| Corporate Data | 1 |
| | Quarterly Highlights | 2 |
| | Investor Information | 3 |
| | Common Stock Data | 5 |
| Consolidated Financial Results | 6 |
| | Financial Highlights | 7 |
| | Consolidated Balance Sheets | 9 |
| | Consolidated Statements of Operations | 10 |
| | Consolidated Statements of Discontinued Operations | 11 |
| | MMO Unconsolidated Joint Venture Statements of Operations | 12 |
| | Funds from Operations | 13 |
| | Adjusted Funds from Operations | 14 |
| | Reconciliation of Earnings before Interest, Taxes and Depreciation and Amortization and Adjusted Funds From Operations | 15 |
| | Capital Structure | 16 |
| | Debt Summary | 17 |
| | MMO Joint Venture Debt Summary | 19 |
| | Debt Maturities | 20 |
| | MMO Joint Venture Debt Maturities | 21 |
| Portfolio Data | 22 |
| | Same Store Analysis | 23 |
| | Portfolio Overview | 24 |
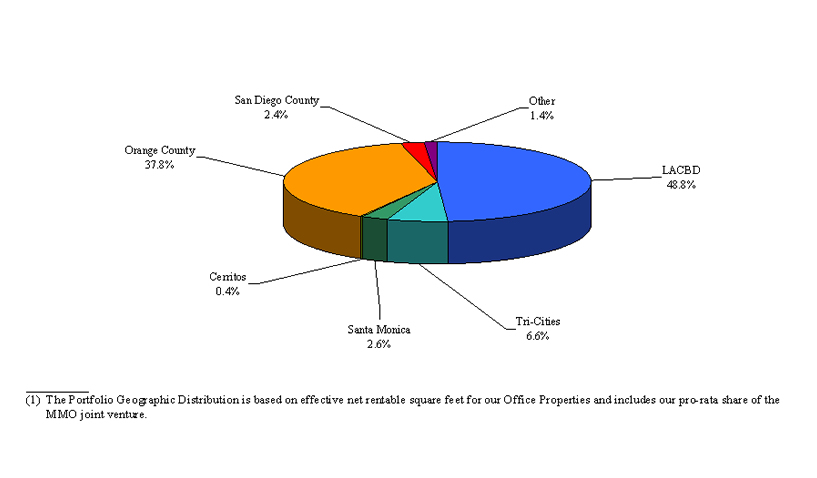
| | Portfolio Geographic Distribution | 28 |
| | Portfolio Overview — Leased Rates and Weighted Average Remaining Lease Term | 29 |
| | Major Tenants — Office Properties | 30 |
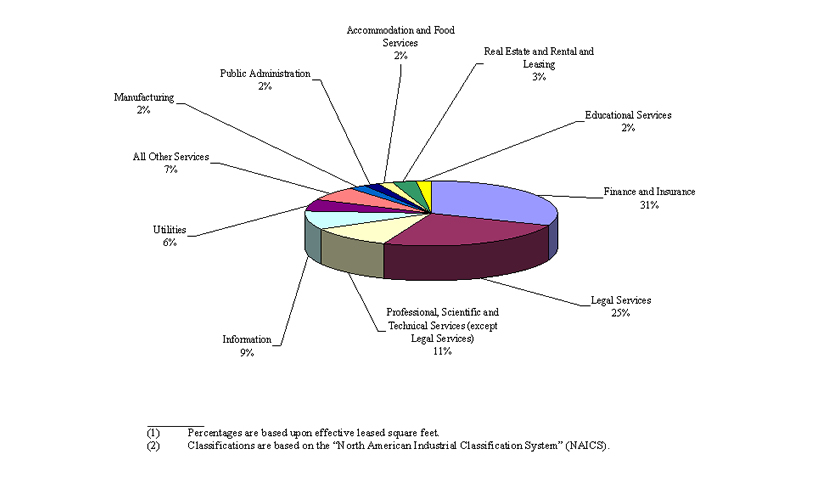
| | Portfolio Tenant Classification Description | 32 |
| | Lease Expirations — Wholly Owned Portfolio | 33 |
| | Lease Expirations — Wholly Owned Portfolio (Los Angeles County) | 34 |
| | Lease Expirations — Wholly Owned Portfolio (Orange County) | 35 |
| | Lease Expirations — MMO Joint Venture Portfolio | 36 |
| | Leasing Activity — Total Portfolio and Effective Portfolio | 37 |
| | Leasing Activity — Los Angeles Central Business District | 38 |
| | Leasing Activity — Orange County | 39 |
| | Tenant Improvements and Leasing Commissions | 40 |
| | Historical Capital Expenditures — Office Properties | 41 |
| | Hotel Performance and Hotel Historical Capital Expenditures | 42 |
| | Construction in Progress | 43 |
| | Development Pipeline | 44 |
| | Management Statements on Non-GAAP Supplemental Measures | 46 |
This supplemental package contains “forward-looking statements” within the meaning of the Private Securities Litigation Reform Act of 1995. We caution investors that any forward-looking statements presented herein are based on management’s beliefs and assumptions made by, and information currently available to management. Such statements are subject to risks, uncertainties and assumptions and may be affected by known and unknown risks, trends, uncertainties and factors that are beyond our control. Should one or more of these risks or uncertainties materialize or should underlying assumptions prove incorrect, actual results may vary materially from those anticipated, estimated or projected. These factors include, without limitation: general risks affecting the real estate industry (including, without limitation, the inability to enter into or renew leases at favorable rates, dependence on tenants’ financial condition, and competition from other developers, owners and operators of real estate); risks associated with the availability and terms of financing and the use of debt to fund acquisitions and developments; risks associated with our ability to dispose of properties, if and when we decide to do so, at prices or terms set by or acceptable to us; risks associated with the potential failure to effectively manage our growth and expansion into new markets, to identify properties to acquire, to complete acquisitions or to integrate acquisitions successfully; risks and uncertainties affecting property development and construction; risks associated with downturns in the national and local economies, increases in interest rates, volatility in the securities markets, and contraction in the credit markets affecting our ability to refinance existing loans as they come due; risks associated with joint ventures; potential liability for uninsured losses and environmental contamination; risks associated with our potential failure to qualify as a REIT under the Internal Revenue Code of 1986, as amended, and possible adverse changes in tax and environmental laws; and risks associated with our dependence on key personnel whose continued service is not guaranteed.
Maguire Properties, Inc.
Supplemental Operating and Financial Data
Fourth Quarter 2008
Corporate Data
Maguire Properties, Inc.
Supplemental Operating and Financial Data
Fourth Quarter 2008
Maguire Properties, Inc. (the “Company”), a self-administered and self-managed real estate investment trust, is the largest owner and operator of Class A office properties in the Los Angeles central business district and is primarily focused on owning and operating high-quality office properties in the Southern California market. We are a full-service real estate company with substantial in-house expertise and resources in property management, marketing, leasing, acquisitions, development and financing.
As of December 31, 2008, our office portfolio was comprised of whole or partial interests in 36 properties totaling approximately 20 million net rentable square feet, one 350-room hotel with 266,000 square feet, and on- and off-site structured parking plus surface parking totaling approximately 14 million square feet, which accommodates almost 45,000 vehicles. We have two projects under development that total approximately 255,000 square feet of office space. We also own undeveloped land that we believe can support up to approximately 8 million square feet of office, hotel, retail and residential development and approximately 8 million square feet of structured parking.
This Supplemental Operating and Financial Data package should be read in conjunction with our consolidated financial statements for the year ended December 31, 2008 that will subsequently be reported in our Annual Report on Form 10-K to be filed with the Securities and Exchange Commission (SEC) on or before March 16, 2009. For more information on Maguire Properties, visit our website at www.maguireproperties.com.
Debt:
During October 2008, we extended our City Parkway mortgage loan for one year to May 9, 2010. We have two one-year extensions available at our option that would allow us to extend the maturity of this loan to May 9, 2012, subject to certain conditions.
During November 2008, we also extended our Brea Corporate Place and Brea Financial Commons mortgage loan for one year to May 1, 2010. We have two one-year extensions available at our option that would allow us to extend the maturity of this loan to May 1, 2012, subject to certain conditions.
As of December 31, 2008, approximately 84% of our outstanding debt is fixed (or swapped to a fixed rate) at a weighted average interest rate of approximately 5.7% with a weighted average remaining term of approximately six years.
Leasing Activities:
During the fourth quarter, new leases and renewals were executed for approximately 0.6 million square feet (including our pro rata share of our joint venture properties). Cash rent on new leases completed during the quarter increased 8% in our Effective Portfolio, compared to cash rents on those spaces immediately prior to their expiration, and GAAP rent increased 24% compared to prior GAAP rents. Leases totaling approximately 0.5 million square feet expired during the fourth quarter (including our pro rata share of our joint venture properties). | | Development Activities:
We placed the Lantana South building in service during the fourth quarter of 2008. The Lantana South building is a 132,976 square foot office building and is approximately 72% leased as of December 31, 2008.
Tenant improvement work at Lantana East began in fourth quarter 2008. Tenant improvements are scheduled according to our tenants’ expected move-in dates. The Lantana East building is a 66,000 square foot office building located, along with Lantana South, in Santa Monica, California. As of the date of this report, 100% of Lantana East has been pre-leased.
Construction activities continued at 207 Goode during the fourth quarter of 2008. Roofing activities are 50% complete, and interior work is 50% complete in common areas. Installation of the elevator cabs has begun and is approximately 65% complete. We expect to complete construction of the building in mid-2009. 207 Goode is an eight-story, 189,000 square foot office building located in Glendale, California. Orange County Asset Disposition Program:
In December 2008, we made the decision to dispose of our property at 3161 Michelson located in Irvine, California and have classified this property as held for sale in our consolidated financial statements. We recorded a non-cash impairment charge totaling $50.0 million during the fourth quarter of 2008 pursuant to Statement of Financial Accounting Standards No. 144, Accounting for Impairment or Disposal of Long-Lived Assets, related to the writedown of 3161 Michelson to its estimated fair value, less estimated costs to sell, as of December 31, 2008. |
Maguire Properties, Inc.
Supplemental Operating and Financial Data
Fourth Quarter 2008
| 355 South Grand Avenue, Suite 3300 |
| Los Angeles, CA 90071 |
| Tel. (213) 626-3300 |
| Fax (213) 687-4758 |
| Nelson C. Rising | President and Chief Executive Officer | Ted J. Bischak | Senior Vice President, Asset Management |
| Douglas J. Gardner | Executive Vice President, Operations | Robert P. Goodwin | Senior Vice President, Construction and Development |
| Mark T. Lammas | Executive Vice President, Investments | Peter K. Johnston | Senior Vice President, Leasing |
| Shant Koumriqian | Executive Vice President, Chief Financial Officer | Peggy M. Moretti | Senior Vice President, Investor and Public Relations |
| Jonathan L. Abrams | Senior Vice President, General Counsel and Secretary | Christopher C. Rising | Senior Vice President, Strategic Initiatives |
| Investor Relations Contact: Peggy M. Moretti at (213) 613-4558 |
Please visit our corporate website at: www.maguireproperties.com |
| Transfer Agent | | Timing |
American Stock Transfer & Trust Company 59 Maiden Lane New York, NY 10038 (718) 921-8201 www.amstock.com | | Quarterly results for 2009 will be announced according to the following schedule: |
| | First Quarter | May 2009 |
| | Second Quarter | August 2009 |
| | Third Quarter | November 2009 |
| | Fourth Quarter | March 2010 |
Maguire Properties, Inc.
Supplemental Operating and Financial Data
Fourth Quarter 2008
Investor Information (continued)
| | Citigroup Global Markets Inc. | Michael Bilerman | (212) 816-1383 |
| | Credit Suisse | Steven Benyik | (212) 538-0239 |
| | Deutsche Bank Securities, Inc. | Louis Taylor | (212) 250-4912 |
| | Friedman, Billings, Ramsey & Co., Inc. | Wilkes J. Graham | (703) 312-9737 |
| | Goldman Sachs & Co. | Jay Haberman | (917) 343-4260 |
| | Green Street Advisors | Michael Knott | (949) 640-8780 |
| | KeyBanc Capital Markets | Jordan Sadler | (917) 368-2280 |
| | Merrill Lynch & Co., Inc. | Steve Sakwa | (212) 449-0335 |
| | Raymond James Financial, Inc. | Paul Puryear | (727) 567-2253 |
| | RBC Capital Markets | Dave Rodgers | (440) 715-2647 |
| | Robert W. Baird & Company | David Aubuchon | (314) 863-4235 |
| | Stifel, Nicolaus & Co., Inc. | John Guinee | (443) 224-1307 |
| | Wachovia Securities, LLC | Christopher Haley | (443) 263-6773 |
Maguire Properties, Inc. is currently followed by the sell-side analysts listed above, with the exception of Green Street Advisors, which is an independent research firm. This list may not be complete and is subject to change as firms add or delete coverage of our company. Please note that any opinions, estimates or forecasts regarding our historical or predicted performance made by these analysts are theirs alone and do not represent opinions, forecasts or predictions of Maguire Properties, Inc. or its management. We are providing this listing as a service to our stockholders and do not by listing these firms imply our endorsement of or concurrence with such information, conclusions or recommendations. Interested persons may obtain copies of analysts’ reports on their own; we do not distribute these reports. Various of these firms may from time-to-time own our stock and/or hold other long or short positions in our stock, and may provide compensated services to us.
Maguire Properties, Inc.
Supplemental Operating and Financial Data
Fourth Quarter 2008
Our common stock is traded on the New York Stock Exchange under the symbol MPG. Selected information about our common stock for the past five quarters (based on NYSE prices) is as follows: |
| | | 2008 | | | 2007 | |
| | | 4th Quarter | | | 3rd Quarter | | | 2nd Quarter | | | 1st Quarter | | | 4th Quarter | |
| High price | | $ | 6.79 | | | $ | 16.32 | | | $ | 17.65 | | | $ | 29.90 | | | $ | 30.73 | |
| Low price | | $ | 1.03 | | | $ | 4.75 | | | $ | 11.83 | | | $ | 12.42 | | | $ | 23.84 | |
| Closing price | | $ | 1.46 | | | $ | 5.96 | | | $ | 12.17 | | | $ | 14.31 | | | $ | 29.47 | |
| Dividends per share - annualized | | $ | – | | | $ | – | | | $ | – | | | $ | – | | | $ | 1.60 | |
| Closing dividend yield - annualized | | | (1 | ) | | | (1 | ) | | | (1 | ) | | | (1 | ) | | | 5.43 | % |
Closing common shares and Operating Partnership units outstanding (in thousands) | | | 54,650 | | | | 54,559 | | | | 54,655 | | | | 54,610 | | | | 54,592 | |
Closing market value of common shares and Operating Partnership units outstanding (in thousands) | | $ | 79,788 | | | $ | 325,173 | | | $ | 665,152 | | | $ | 781,457 | | | $ | 1,608,813 | |
| | | | | | | | | | | | | | | | | | | | | |
| | | | | | | | | | | | | | | | | | | | | |
| Dividend Information: | | | | | | | | | | | | | | | | | | | | |
| | | | | | | | | | | | | | | | | | | | | |
| Common Stock | | | | | | | | | | | | | | | | | | | | |
| Dividend amount per share | | | (1 | ) | | | (1 | ) | | | (1 | ) | | | (1 | ) | | $ | 0.4000 | |
| Declaration date | | | | | | | | | | | | | | | | | | December 17, 2007 | |
| Record date | | | | | | | | | | | | | | | | | | December 31, 2007 | |
| Payment date | | | | | | | | | | | | | | | | | | January 31, 2008 | |
| | | | | | | | | | | | | | | | | | | | | |
| Series A Preferred Stock | | | | | | | | | | | | | | | | | | | | |
| Dividend amount per share | | | (2 | ) | | $ | 0.4766 | | | $ | 0.4766 | | | $ | 0.4766 | | | $ | 0.4766 | |
| Declaration date | | | | | | September 18, 2008 | | | June 24, 2008 | | | April 1, 2008 | | | December 17, 2007 | |
| Record date | | | | | | October 10, 2008 | | | July 11, 2008 | | | April 11, 2008 | | | December 31, 2007 | |
| Payment date | | | | | | October 31, 2008 | | | July 31, 2008 | | | April 30, 2008 | | | January 31, 2008 | |
__________
| (1) | The Board of Directors did not declare a dividend on our common stock for the quarters ended December 31, September 30, June 30 and March 31, 2008. There can be no assurance given that we will continue to make distributions on our common stock at historical levels or at all. |
| (2) | The Board of Directors did not declare a dividend on our Series A Preferred Stock for the quarter ended December 31, 2008. Dividends on our Series A Preferred Stock are cumulative, and therefore, will continue to accrue at an annual rate of $1.9064 per share. |
Maguire Properties, Inc.
Supplemental Operating and Financial Data
Fourth Quarter 2008
Consolidated Financial Results
Maguire Properties, Inc.
Supplemental Operating and Financial Data
Fourth Quarter 2008
(unaudited and in thousands, except share, per share, percentage and ratio amounts)
| | | For the Three Months Ended | |
| | | December 31, 2008 | | | September 30, 2008 | | | June 30, 2008 | | | March 31, 2008 | | | December 31, 2007 | |
| Income Items: | | | | | | | | | | | | | | | |
| Revenue (1) | | $ | 137,914 | | | $ | 133,687 | | | $ | 135,999 | | | $ | 139,433 | | | $ | 146,192 | |
| Straight line rent | | | 3,011 | | | | 3,944 | | | | 3,805 | | | | 3,320 | | | | 2,540 | |
| Fair value lease revenue (2) | | | 5,643 | | | | 5,930 | | | | 6,985 | | | | 7,200 | | | | 8,374 | |
| Lease termination fees | | | 590 | | | | 13 | | | | 86 | | | | 416 | | | | 342 | |
| Office property operating margin (3) | | | 60.1 | % | | | 60.2 | % | | | 61.3 | % | | | 61.5 | % | | | 60.9 | % |
| | | | | | | | | | | | | | | | | | | | | |
| Loss income available to common stockholders | | $ | (96,305 | ) | | $ | (72,524 | ) | | $ | (110,628 | ) | | $ | (48,591 | ) | | $ | (44,462 | ) |
Loss income available to common stockholders - basic and diluted | | | (2.02 | ) | | | (1.52 | ) | | | (2.32 | ) | | | (1.03 | ) | | | (0.95 | ) |
| | | | | | | | | | | | | | | | | | | | | |
Funds from operations (FFO) available to common stockholders (4) | | $ | (42,180 | ) | | $ | (20,158 | ) | | $ | (56,383 | ) | | $ | (678 | ) | | $ | 6,715 | |
| FFO per share - basic (4) | | | (0.88 | ) | | | (0.42 | ) | | | (1.18 | ) | | | (0.01 | ) | | | 0.14 | |
| FFO per share - diluted (4) | | | (0.88 | ) | | | (0.42 | ) | | | (1.18 | ) | | | (0.01 | ) | | | 0.14 | |
| FFO per share before specified items - basic (4) | | | 0.04 | | | | 0.04 | | | | 0.10 | | | | 0.10 | | | | 0.16 | |
| FFO per share before specified items - diluted (4) | | | 0.04 | | | | 0.04 | | | | 0.09 | | | | 0.10 | | | | 0.16 | |
| | | | | | | | | | | | | | | | | | | | | |
| Dividends declared per common share | | $ | – | | | $ | – | | | $ | – | | | $ | – | | | $ | 0.4000 | |
| Dividends declared per preferred share (5) | | | – | | | | 0.4766 | | | | 0.4766 | | | | 0.4766 | | | | 0.4766 | |
| | | | | | | | | | | | | | | | | | | | | |
| Ratios: | | | | | | | | | | | | | | | | | | | | |
| Interest coverage ratio (6) | | | 0.40 | | | | 0.70 | | | | 0.14 | | | | 1.01 | | | | 1.07 | |
| Interest coverage ratio before specified items (7) | | | 1.08 | | | | 1.05 | | | | 1.08 | | | | 1.10 | | | | 1.09 | |
| Fixed-charge coverage ratio (8) | | | 0.37 | | | | 0.65 | | | | 0.13 | | | | 0.94 | | | | 1.01 | |
| Fixed-charge coverage ratio before specified items (9) | | | 1.00 | | | | 0.97 | | | | 1.00 | | | | 1.02 | | | | 1.02 | |
| FFO payout ratio (10) | | | – | | | | – | | | | – | | | | – | | | | 279.4 | % |
| FFO payout ratio before specified items (11) | | | – | | | | – | | | | – | | | | – | | | | 250.9 | % |
| AFFO payout ratio (12) | | | – | | | | – | | | | – | | | | – | | | | -104.3 | % |
| | | | | | | | | | | | | | | | | | | | | |
| Capitalization: | | | | | | | | | | | | | | | | | | | | |
| Common stock price @ quarter end | | $ | 1.46 | | | $ | 5.96 | | | $ | 12.17 | | | $ | 14.31 | | | $ | 29.47 | |
| | | | | | | | | | | | | | | | | | | | | |
| Total consolidated debt | | $ | 4,882,809 | | | $ | 4,874,471 | | | $ | 5,052,546 | | | $ | 5,033,505 | | | $ | 5,003,341 | |
| Preferred stock liquidation preference | | | 250,000 | | | | 250,000 | | | | 250,000 | | | | 250,000 | | | | 250,000 | |
| Common equity value @ quarter end (13) | | | 79,788 | | | | 325,173 | | | | 665,152 | | | | 781,457 | | | | 1,608,813 | |
| Total consolidated market capitalization | | $ | 5,212,597 | | | $ | 5,449,644 | | | $ | 5,967,698 | | | $ | 6,064,962 | | | $ | 6,862,154 | |
| | | | | | | | | | | | | | | | | | | | | |
| Company share of MMO joint venture debt | | | 161,420 | | | | 161,566 | | | | 161,707 | | | | 161,846 | | | | 161,987 | |
| Total combined market capitalization | | $ | 5,374,017 | | | $ | 5,611,210 | | | $ | 6,129,405 | | | $ | 6,226,808 | | | $ | 7,024,141 | |
| | | | | | | | | | | | | | | | | | | | | |
Total consolidated debt / total consolidated market capitalization | | | 93.7 | % | | | 89.4 | % | | | 84.7 | % | | | 83.0 | % | | | 72.9 | % |
Total combined debt / total combined market capitalization | | | 93.9 | % | | | 89.7 | % | | | 85.1 | % | | | 83.4 | % | | | 73.5 | % |
Total consolidated debt plus liquidation preference / total consolidated market capitalization | | | 98.5 | % | | | 94.0 | % | | | 88.9 | % | | | 87.1 | % | | | 76.6 | % |
Total combined debt plus liquidation preference / total combined market capitalization | | | 98.5 | % | | | 94.2 | % | | | 89.1 | % | | | 87.5 | % | | | 77.1 | % |
Maguire Properties, Inc.
Supplemental Operating and Financial Data
Fourth Quarter 2008
(unaudited and in thousands, except share, per share, percentage and ratio amounts)
| (1) | Excludes revenue from discontinued operations of approximately $2 million, $6 million, $8 million, $8 million and $9 million for the three months ended December 31, September 30, June 30, March 31, 2008 and December 31, 2007, respectively. |
| (2) | Represents the net adjustment for above- and below-market leases, which are being amortized over the remaining term of the respective leases from the date of acquisition. |
| (3) | Calculated as follows: (rental, tenant reimbursement and parking revenues - rental property operating and maintenance, real estate taxes and parking expenses) / (rental, tenant reimbursement and parking revenues). Lease termination fees are reported as part of interest and other revenue in the consolidated statements of operations. |
| (4) | For a definition and discussion of FFO, see page 46. For a quantitative reconciliation of the differences between FFO and net income, see page 13. |
| (5) | Preferred dividends were declared for the three months ended October 31, July 31, April 30 and January 31, 2008, respectively. |
| (6) | Calculated as earnings before interest, taxes and depreciation and amortization and preferred dividends, or EBITDA, of $28,970, $51,839, $10,806, $76,028 and $86,573, respectively, divided by cash paid for interest of $73,055, $73,547, $74,570, $75,084 and $80,577, respectively. For a discussion of EBITDA, see page 48. For a quantitative reconciliation of the differences between EBITDA and net income, see page 15. |
| (7) | Calculated as Adjusted EBITDA of $78,970, $76,899, $80,194, $82,430 and $87,459, respectively, divided by cash paid for interest of $73,055, $73,547, $74,570, $75,084 and $80,577, respectively. For a discussion of Adjusted EBITDA, see page 48. |
| (8) | Calculated as EBITDA of $28,970, $51,839, $10,806, $76,028 and $86,573, respectively, divided by fixed charges of $79,166, $79,342, $80,150, $80,529 and $85,870, respectively. |
| (9) | Calculated as Adjusted EBITDA of $78,970, $76,899, $80,194, $82,430 and $87,459, respectively, divided by fixed charges of $79,166, $79,342, $80,150, $80,529 and $85,870, respectively. |
| (10) | Calculated as dividends declared per common share divided by FFO per share - diluted. |
| (11) | Calculated as dividends declared per common share divided by FFO per share before specified items – diluted. |
| (12) | Calculated as common stock dividends and Operating Partnership distributions declared of $21,710 for the three months ended December 31, 2007 divided by AFFO of ($20,822) for the three months ended December 31, 2007. The Board of Directors did not declare a dividend on our common stock for the quarters ended December 31, September 30, June 30 and March 31, 2008. There can be no assurance given that we will continue to make distributions on our common stock at historical levels or at all. For a definition of AFFO, see page 47. For a quantitative reconciliation of the differences between AFFO and FFO, see page 14. |
| (13) | Assuming 100% conversion of the limited partnership units in the Operating Partnership into shares of our common stock. Our limited partners have the right to redeem all or part of their Operating Partnership units at any time. At the time of redemption, we have the right to determine whether to redeem the Operating Partnership units for cash, based upon the fair market value of an equivalent number of shares of our common stock at the time of redemption, or exchange them for shares of our common stock on a one-for-one basis, subject to adjustment in the event of stock splits, stock dividends, issuance of stock rights, specified extraordinary distribution and similar events. |
Maguire Properties, Inc.
Supplemental Operating and Financial Data
Fourth Quarter 2008
(unaudited and in thousands)
| | | December 31, 2008 | | | September 30, 2008 | | | June 30, 2008 | | | March 31, 2008 | | | December 31, 2007 | |
| | | | | | | | | | | | | | | | |
| Assets | | | | | | | | | | | | | | | |
| Investments in real estate | | $ | 5,026,688 | | | $ | 5,219,538 | | | $ | 5,492,942 | | | $ | 5,490,807 | | | $ | 5,439,044 | |
| Less: accumulated depreciation | | | (604,302 | ) | | | (576,329 | ) | | | (552,300 | ) | | | (514,454 | ) | | | (476,337 | ) |
| | | | 4,422,386 | | | | 4,643,209 | | | | 4,940,642 | | | | 4,976,353 | | | | 4,962,707 | |
| | | | | | | | | | | | | | | | | | | | | |
| Cash, cash equivalents and restricted cash | | | 280,166 | | | | 351,246 | | | | 308,382 | | | | 345,384 | | | | 414,092 | |
| Rents, deferred rents and other receivables, net | | | 86,519 | | | | 85,778 | | | | 87,576 | | | | 85,116 | | | | 81,454 | |
| Deferred charges, net | | | 184,156 | | | | 193,384 | | | | 207,202 | | | | 217,291 | | | | 230,994 | |
| Other assets | | | 31,585 | | | | 36,096 | | | | 33,486 | | | | 46,903 | | | | 42,206 | |
| Investment in unconsolidated joint ventures | | | 11,606 | | | | 13,326 | | | | 14,886 | | | | 16,759 | | | | 18,325 | |
| Assets associated with real estate held for sale | | | 182,597 | | | | – | | | | – | | | | – | | | | – | |
| Total assets | | $ | 5,199,015 | | | $ | 5,323,039 | | | $ | 5,592,174 | | | $ | 5,687,806 | | | $ | 5,749,778 | |
| | | | | | | | | | | | | | | | | | | | | |
| Liabilities, minority interests and stockholders' (deficit) equity | | | | | | | | | | | | | | | | | | | | |
| Mortgage and other secured loans | | $ | 4,714,090 | | | $ | 4,874,471 | | | $ | 5,052,546 | | | $ | 5,033,505 | | | $ | 5,003,341 | |
| Dividends and distributions payable | | | – | | | | 3,177 | | | | 3,177 | | | | – | | | | 24,888 | |
| Accounts payable, accrued interest payable and other liabilities | | | 221,066 | | | | 214,119 | | | | 212,558 | | | | 215,632 | | | | 207,741 | |
| Acquired below-market leases, net | | | 112,173 | | | | 119,895 | | | | 135,268 | | | | 145,365 | | | | 155,824 | |
| Obligations associated with real estate held for sale | | | 171,348 | | | | – | | | | – | | | | – | | | | – | |
| Total liabilities | | | 5,218,677 | | | | 5,211,662 | | | | 5,403,549 | | | | 5,394,502 | | | | 5,391,794 | |
| | | | | | | | | | | | | | | | | | | | | |
| Minority interests | | | – | | | | – | | | | – | | | | 4,904 | | | | 14,670 | |
| | | | | | | | | | | | | | | | | | | | | |
| Stockholders' (deficit) equity | | | | | | | | | | | | | | | | | | | | |
| Common and preferred stock and additional paid-in capital | | | 696,840 | | | | 695,361 | | | | 695,206 | | | | 695,235 | | | | 692,090 | |
| Accumulated deficit and dividends | | | (656,606 | ) | | | (563,478 | ) | | | (490,954 | ) | | | (377,149 | ) | | | (331,735 | ) |
| Accumulated other comprehensive loss, net | | | (59,896 | ) | | | (20,506 | ) | | | (15,627 | ) | | | (29,686 | ) | | | (17,041 | ) |
Total stockholders' (deficit) equity | | | (19,662 | ) | | | 111,377 | | | | 188,625 | | | | 288,400 | | | | 343,314 | |
| Total liabilities, minority interests and stockholders' (deficit) equity | | $ | 5,199,015 | | | $ | 5,323,039 | | | $ | 5,592,174 | | | $ | 5,687,806 | | | $ | 5,749,778 | |
Maguire Properties, Inc.
Supplemental Operating and Financial Data
Fourth Quarter 2008
(unaudited and in thousands, except share and per share data)
| | | For the Three Months Ended | |
| | | December 31, 2008 | | | September 30, 2008 | | | June 30, 2008 | | | March 31, 2008 | | | December 31, 2007 | |
| Revenue: | | | | | | | | | | | | | | | |
| Rental | | $ | 84,587 | | | $ | 82,869 | | | $ | 84,615 | | | $ | 85,163 | | | $ | 88,573 | |
| Tenant reimbursements | | | 29,875 | | | | 27,929 | | | | 26,058 | | | | 28,230 | | | | 28,786 | |
| Hotel operations | | | 6,448 | | | | 6,301 | | | | 6,986 | | | | 6,881 | | | | 7,260 | |
| Parking | | | 13,382 | | | | 12,914 | | | | 13,263 | | | | 13,687 | | | | 13,319 | |
| Management, leasing and development services | | | 1,305 | | | | 1,518 | | | | 1,857 | | | | 1,957 | | | | 2,510 | |
| Interest and other | | | 2,317 | | | | 2,156 | | | | 3,220 | | | | 3,515 | | | | 5,744 | |
| Total revenue | | | 137,914 | | | | 133,687 | | | | 135,999 | | | | 139,433 | | | | 146,192 | |
| | | | | | | | | | | | | | | | | | | | | |
| Expenses: | | | | | | | | | | | | | | | | | | | | |
| Rental property operating and maintenance | | | 33,539 | | | | 32,665 | | | | 30,901 | | | | 32,287 | | | | 32,957 | |
| Hotel operating and maintenance | | | 4,021 | | | | 4,102 | | | | 4,567 | | | | 4,415 | | | | 4,548 | |
| Real estate taxes | | | 13,314 | | | | 12,499 | | | | 13,462 | | | | 12,888 | | | | 13,571 | |
| Parking | | | 4,210 | | | | 4,125 | | | | 3,616 | | | | 3,787 | | | | 4,588 | |
| General and administrative | | | 8,038 | | | | 9,052 | | | | 27,071 | | | | 16,674 | | | | 9,789 | |
| Other expense | | | 1,359 | | | | 1,574 | | | | 1,405 | | | | 1,528 | | | | 2,050 | |
| Depreciation and amortization | | | 44,502 | | | | 45,087 | | | | 46,030 | | | | 47,681 | | | | 50,040 | |
| Interest | | | 67,621 | | | | 63,697 | | | | 62,602 | | | | 64,214 | | | | 66,114 | |
| Loss from early extinguishment of debt | | | – | | | | 1,463 | | | | – | | | | – | | | | 886 | |
| Total expenses | | | 176,604 | | | | 174,264 | | | | 189,654 | | | | 183,474 | | | | 184,543 | |
| | | | | | | | | | | | | | | | | | | | | |
| Loss from continuing operations before equity in net | | | | | | | | | | | | | | | | | | | | |
loss of unconsolidated joint venture and minority interests | | | (38,690 | ) | | | (40,577 | ) | | | (53,655 | ) | | | (44,041 | ) | | | (38,351 | ) |
| Equity in net loss of unconsolidated joint venture | | | (330 | ) | | | (98 | ) | | | (388 | ) | | | (276 | ) | | | (426 | ) |
| Minority interests allocated to continuing operations | | | – | | | | – | | | | 3,436 | | | | 6,555 | | | | 5,892 | |
| Loss from continuing operations | | | (39,020 | ) | | | (40,675 | ) | | | (50,607 | ) | | | (37,762 | ) | | | (32,885 | ) |
| | | | | | | | | | | | | | | | | | | | | |
| Discontinued Operations: | | | | | | | | | | | | | | | | | | | | |
Loss from discontinued operations before minority interests | | | (52,519 | ) | | | (27,083 | ) | | | (58,683 | ) | | | (6,998 | ) | | | (7,877 | ) |
Minority interests allocated to discontinued operations | | | – | | | | – | | | | 3,428 | | | | 935 | | | | 1,066 | |
| Loss from discontinued operations | | | (52,519 | ) | | | (27,083 | ) | | | (55,255 | ) | | | (6,063 | ) | | | (6,811 | ) |
| | | | | | | | | | | | | | | | | | | | | |
| Net loss | | | (91,539 | ) | | | (67,758 | ) | | | (105,862 | ) | | | (43,825 | ) | | | (39,696 | ) |
| | | | | | | | | | | | | | | | | | | | | |
| Preferred stock dividends | | | (4,766 | ) | | | (4,766 | ) | | | (4,766 | ) | | | (4,766 | ) | | | (4,766 | ) |
| | | | | | | | | | | | | | | | | | | | | |
| Net loss available to common stockholders | | $ | (96,305 | ) | | $ | (72,524 | ) | | $ | (110,628 | ) | | $ | (48,591 | ) | | $ | (44,462 | ) |
| | | | | | | | | | | | | | | | | | | | | |
| | | | | | | | | | | | | | | | | | | | | |
| Basic and diluted loss per common share: | | | | | | | | | | | | | | | | | | | | |
Loss from continuing operations available to common stockholders | | $ | (0.92 | ) | | $ | (0.95 | ) | | $ | (1.16 | ) | | $ | (0.90 | ) | | $ | (0.80 | ) |
| Loss from discontinued operations | | | (1.10 | ) | | | (0.57 | ) | | | (1.16 | ) | | | (0.13 | ) | | | (0.15 | ) |
| Net loss available to common stockholders | | $ | (2.02 | ) | | $ | (1.52 | ) | | $ | (2.32 | ) | | $ | (1.03 | ) | | $ | (0.95 | ) |
Weighted average number of common shares outstanding | | | 47,777,101 | | | | 47,773,575 | | | | 47,615,421 | | | | 46,982,531 | | | | 46,870,622 | |
Maguire Properties, Inc.
Supplemental Operating and Financial Data
Fourth Quarter 2008
(unaudited and in thousands)
| | | For the Three Months Ended | |
| | | December 31, 2008 | | | September 30, 2008 | | | June 30, 2008 | | | March 31, 2008 | | | December 31, 2007 | |
| Revenue: | | | | | | | | | | | | | | | |
| Rental | | $ | 1,911 | | | $ | 4,452 | | | $ | 6,620 | | | $ | 6,995 | | | $ | 7,563 | |
| Tenant reimbursements | | | (30 | ) | | | 718 | | | | 558 | | | | 536 | | | | 371 | |
| Parking | | | 113 | | | | 392 | | | | 632 | | | | 523 | | | | 647 | |
| Interest and other | | | 270 | | | | 51 | | | | 95 | | | | 222 | | | | 177 | |
| Total revenue | | | 2,264 | | | | 5,613 | | | | 7,905 | | | | 8,276 | | | | 8,758 | |
| | | | | | | | | | | | | | | | | | | | | |
| Expenses: | | | | | | | | | | | | | | | | | | | | |
| Rental property operating and maintenance | | | 448 | | | | 1,629 | | | | 2,326 | | | | 2,478 | | | | 2,617 | |
| Real estate taxes | | | (98 | ) | | | 1,018 | | | | 1,414 | | | | 1,356 | | | | 1,112 | |
| Parking | | | 453 | | | | 517 | | | | 608 | | | | 478 | | | | 496 | |
| Depreciation and amortization | | | 1,649 | | | | 1,880 | | | | 4,997 | | | | 5,427 | | | | 6,816 | |
| Impairment of long-lived assets | | | 50,000 | | | | 21,796 | | | | 51,898 | | | | – | | | | – | |
| Interest | | | 2,331 | | | | 4,055 | | | | 5,345 | | | | 5,535 | | | | 5,594 | |
| Loss from early extinguishment of debt | | | – | | | | 1,801 | | | | – | | | | – | | | | – | |
| Total expenses | | | 54,783 | | | | 32,696 | | | | 66,588 | | | | 15,274 | | | | 16,635 | |
| | | | | | | | | | | | | | | | | | | | | |
| Loss from discontinued operations before minority interests | | | (52,519 | ) | | | (27,083 | ) | | | (58,683 | ) | | | (6,998 | ) | | | (7,877 | ) |
| Minority interests allocated to discontinued operations | | | – | | | | – | | | | 3,428 | | | | 935 | | | | 1,066 | |
| | | | | | | | | | | | | | | | | | | | | |
| Loss from discontinued operations | | $ | (52,519 | ) | | $ | (27,083 | ) | | $ | (55,255 | ) | | $ | (6,063 | ) | | $ | (6,811 | ) |
Maguire Properties, Inc.
Supplemental Operating and Financial Data
Fourth Quarter 2008
(unaudited and in thousands)
| | | For the Three Months Ended | |
| | | December 31, 2008 | | | September 30, 2008 | | | June 30, 2008 | | | March 31, 2008 | | | December 31, 2007 | |
| | | | | | | | | | | | | | | | |
| Revenue: | | | | | | | | | | | | | | | |
| Rental | | $ | 21,445 | | | $ | 22,562 | | | $ | 21,888 | | | $ | 22,110 | | | $ | 21,458 | |
| Tenant reimbursements | | | 6,579 | | | | 6,684 | | | | 5,148 | | | | 6,972 | | | | 7,857 | |
| Parking | | | 2,041 | | | | 2,210 | | | | 2,318 | | | | 2,232 | | | | 2,426 | |
| Interest and other | | | 85 | | | | 2,422 | | | | 48 | | | | 66 | | | | 67 | |
| Total revenue | | | 30,150 | | | | 33,878 | | | | 29,402 | | | | 31,380 | | | | 31,808 | |
| | | | | | | | | | | | | | | | | | | | | |
| Expenses: | | | | | | | | | | | | | | | | | | | | |
| Rental property operating and maintenance | | | 7,049 | | | | 6,467 | | | | 6,309 | | | | 6,119 | | | | 6,563 | |
| Real estate taxes | | | 2,419 | | | | 3,298 | | | | 2,034 | | | | 3,815 | | | | 3,797 | |
| Parking | | | 445 | | | | 422 | | | | 424 | | | | 449 | | | | 411 | |
| Depreciation and amortization | | | 11,018 | | | | 13,375 | | | | 11,884 | | | | 11,514 | | | | 12,250 | |
| Interest | | | 11,008 | | | | 11,014 | | | | 10,907 | | | | 10,917 | | | | 11,061 | |
| Other | | | 1,370 | | | | 1,359 | | | | 1,566 | | | | 1,255 | | | | 1,195 | |
| Total expenses | | | 33,309 | | | | 35,935 | | | | 33,124 | | | | 34,069 | | | | 35,277 | |
| | | | | | | | | | | | | | | | | | | | | |
| Net loss | | $ | (3,159 | ) | | $ | (2,057 | ) | | $ | (3,722 | ) | | $ | (2,689 | ) | | $ | (3,469 | ) |
| | | | | | | | | | | | | | | | | | | | | |
| Company share | | $ | (631 | ) | | $ | (412 | ) | | $ | (744 | ) | | $ | (538 | ) | | $ | (694 | ) |
| Intercompany eliminations | | | 301 | | | | 314 | | | | 356 | | | | 262 | | | | 268 | |
| | | | | | | | | | | | | | | | | | | | | |
| Equity in net loss of unconsolidated joint venture | | $ | (330 | ) | | $ | (98 | ) | | $ | (388 | ) | | $ | (276 | ) | | $ | (426 | ) |
Maguire Properties, Inc.
Supplemental Operating and Financial Data
Fourth Quarter 2008
(unaudited and in thousands, except share and per share data)
| | | For the Three Months Ended | |
| | | December 31, 2008 | | | September 30, 2008 | | | June 30, 2008 | | | March 31, 2008 | | | December 31, 2007 | |
| | | | | | | | | | | | | | | | |
| Reconciliation of net loss to funds from operations: | | | | | | | | | | | | | | | |
| | | | | | | | | | | | | | | | |
| Net loss available to common stockholders | | $ | (96,305 | ) | | $ | (72,524 | ) | | $ | (110,628 | ) | | $ | (48,591 | ) | | $ | (44,462 | ) |
| | | | | | | | | | | | | | | | | | | | | |
| Add: | Depreciation and amortization of real estate assets | | | 46,052 | | | | 46,881 | | | | 50,888 | | | | 52,995 | | | | 56,733 | |
| Depreciation and amortization of real estate assets - unconsolidated joint venture (1) | | | 2,204 | | | | 2,675 | | | | 2,377 | | | | 2,303 | | | | 2,451 | |
| Minority interests | | | – | | | | – | | | | (6,864 | ) | | | (7,490 | ) | | | (6,958 | ) |
| | | | | | | | | | | | | | | | | | | | | |
Funds from operations available to common stockholders and unit holders (FFO) (2) | | $ | (48,049 | ) | | $ | (22,968 | ) | | $ | (64,227 | ) | | $ | (783 | ) | | $ | 7,764 | |
| | | | | | | | | | | | | | | | | | | | | |
| Company share of FFO (3) | | $ | (42,180 | ) | | $ | (20,158 | ) | | $ | (56,383 | ) | | $ | (678 | ) | | $ | 6,715 | |
| | | | | | | | | | | | | | | | | | | | | |
| FFO per share - basic | | $ | (0.88 | ) | | $ | (0.42 | ) | | $ | (1.18 | ) | | $ | (0.01 | ) | | $ | 0.14 | |
| FFO per share - diluted | | $ | (0.88 | ) | | $ | (0.42 | ) | | $ | (1.18 | ) | | $ | (0.01 | ) | | $ | 0.14 | |
| | | | | | | | | | | | | | | | | | | | | |
Weighted average number of common shares outstanding - basic | | | 47,777,101 | | | | 47,773,575 | | | | 47,615,421 | | | | 46,982,531 | | | | 46,870,622 | |
Weighted average number of common and common equivalent shares outstanding - diluted | | | 47,777,868 | | | | 47,778,955 | | | | 47,875,984 | | | | 47,026,291 | | | | 46,899,660 | |
| Weighted average diluted shares and units | | | 54,452,441 | | | | 54,453,528 | | | | 54,550,557 | | | | 54,319,693 | | | | 54,305,576 | |
| | | | | | | | | | | | | | | | | | | | | |
Reconciliation of FFO to FFO before specified items: (2) | | | | | | | | | | | | | | | | | | | | |
| | | | | | | | | | | | | | | | | | | | | |
FFO available to common stockholders and unit holders (FFO) | | $ | (48,049 | ) | | $ | (22,968 | ) | | $ | (64,227 | ) | | $ | (783 | ) | | $ | 7,764 | |
| Add: | Loss from early extinguishment of debt included in continuing operations | | | – | | | | 1,463 | | | | – | | | | – | | | | 886 | |
| Loss from early extinguishment of debt included in discontinued operations | | | – | | | | 1,801 | | | | – | | | | – | | | | – | |
| | Impairment of long-lived assets included in discontinued operations | | | 50,000 | | | | 21,796 | | | | 51,898 | | | | – | | | | – | |
| | Costs associated with strategic alternatives and management changes | | | – | | | | – | | | | 17,490 | | | | 6,402 | | | | – | |
| FFO before specified items | | $ | 1,951 | | | $ | 2,092 | | | $ | 5,161 | | | $ | 5,619 | | | $ | 8,650 | |
| | | | | | | | | | | | | | | | | | | | | |
| Company share of FFO before specified items (3) | | $ | 1,713 | | | $ | 1,836 | | | $ | 4,531 | | | $ | 4,869 | | | $ | 7,477 | |
| | | | | | | | | | | | | | | | | | | | | |
| FFO per share before specified items - basic | | $ | 0.04 | | | $ | 0.04 | | | $ | 0.10 | | | $ | 0.10 | | | $ | 0.16 | |
| FFO per share before specified items - diluted | | $ | 0.04 | | | $ | 0.04 | | | $ | 0.09 | | | $ | 0.10 | | | $ | 0.16 | |
__________ | (1) | Amount represents our 20% ownership interest in the MMO joint venture. |
| (2) | For the definition and discussion of FFO and FFO before specified items, see page 46. |
| (3) | Based on a weighted average interest in our Operating Partnership of approximately 87.8% for the three months ended December 31, September 30 and June 30, 2008, 86.6% for the three months ended March 31, 2008 and 86.4% for the three months ended December 31, 2007. |
Maguire Properties, Inc.
Supplemental Operating and Financial Data
Fourth Quarter 2008
(unaudited and in thousands)
| | | For the Three Months Ended | |
| | | December 31, 2008 | | | September 30, 2008 | | | June 30, 2008 | | | March 31, 2008 | | | December 31, 2007 | |
| | | | | | | | | | | | | | | | |
| FFO | | $ | (48,049 | ) | | $ | (22,968 | ) | | $ | (64,227 | ) | | $ | (783 | ) | | $ | 7,764 | |
| Add: | Non-real estate depreciation | | | 99 | | | | 86 | | | | 1,711 | | | | 113 | | | | 123 | |
| | Straight line ground lease expense | | | 51 | | | | 620 | | | | 582 | | | | 609 | | | | 609 | |
| | Amortization of deferred financing costs | | | 2,243 | | | | 1,790 | | | | 2,085 | | | | 3,597 | | | | 3,321 | |
| | Non-cash stock compensation | | | 1,443 | | | | 1,385 | | | | (93 | ) | | | 2,266 | | | | 1,653 | |
| | Impairment of long-lived assets | | | 50,000 | | | | 21,796 | | | | 51,898 | | | | – | | | | – | |
| | Loss from early extinguishment of debt (2) | | | – | | | | 3,264 | | | | – | | | | – | | | | 886 | |
| | | | | | | | | | | | | | | | | | | | | |
| Deduct: | Straight line rent | | | 3,784 | | | | 4,909 | | | | 4,281 | | | | 3,713 | | | | 2,907 | |
| | Fair value lease revenue | | | 5,643 | | | | 6,457 | | | | 7,972 | | | | 8,267 | | | | 9,749 | |
| | Capitalized payments (3) | | | 5,520 | | | | 7,137 | | | | 8,664 | | | | 8,852 | | | | 12,173 | |
| | Non-recoverable capital expenditures (4), (5) | | | 620 | | | | 2,959 | | | | 2,523 | | | | 4,470 | | | | 3,413 | |
| | Recoverable capital expenditures | | | 704 | | | | 145 | | | | 56 | | | | 292 | | | | 1,133 | |
| | Hotel improvements, equipment upgrades and replacements | | | 290 | | | | 254 | | | | 111 | | | | 45 | | | | 172 | |
| | 2nd generation tenant improvements and leasing commissions (6), (7) | | | 7,878 | | | | 3,614 | | | | 6,617 | | | | 3,530 | | | | 5,048 | |
| | MMO joint venture AFFO adjustments | | | 532 | | | | 638 | | | | 610 | | | | 418 | | | | 583 | |
| | | | | | | | | | | | | | | | | | | | | |
| Adjusted funds from operations (AFFO) | | $ | (19,184 | ) | | $ | (20,140 | ) | | $ | (38,878 | ) | | $ | (23,785 | ) | | $ | (20,822 | ) |
__________ | (1) | For the definition and computation method of AFFO, see page 47. For a quantitative reconciliation of the differences between AFFO and cash flows from operating activities, see page 15. |
| (2) | The three months ended September 30, 2008 includes approximately $2 million in losses from early extinguishment of debt attributable to discontinued operations and approximately $1 million related to the termination of the $130.0 million revolving credit facility. |
| (3) | Includes capital lease principal payments, regular principal payments required to service our debt, capitalized leasing and development payroll, and capitalized interest. |
| (4) | Excludes $2.8 million and $3.3 million of non-recoverable capital expenditures for the three months ended June 30 and March 31, 2008, respectively, as a result of discretionary renovation costs at KPMG Tower. Excludes $0.3 million of non-recoverable capital expenditures for the three months ended March 31, 2008 as a result of planned renovation at Lantana Media Campus. |
| (5) | Excludes $1.9 million of non-recoverable capital expenditures for the three months ended December 31, 2007 at KPMG Tower as a result of discretionary renovation costs. Excludes $0.2 million of expenditures for the three months ended December 31, 2007 related to planned renovation at Lantana Media Campus. |
| (6) | Excludes 1st generation tenant improvements and leasing commissions of $6.2 million, $0.4 million, $0.4 million, $1.1 million and $1.1 million for the three months ended December 31, September 30, June 30 and March 31, 2008, and December 31, 2007, respectively. |
| (7) | Excludes tenant improvements and leasing commissions paid using cash reserves that were funded through loan proceeds upon acquisition or debt refinancing of $6.2 million, $5.5 million, $12.7 million, $11.3 million and $14.0 million for the three months ended December 31, September 30, June 30 and March 31, 2008, and December 31, 2007, respectively. |
Maguire Properties, Inc.
Supplemental Operating and Financial Data
Fourth Quarter 2008
(unaudited and in thousands)
| | | For the Three Months Ended | |
| | | December 31, 2008 | | | September 30, 2008 | | | June 30, 2008 | | | March 31, 2008 | | | December 31, 2007 | |
Reconciliation of net loss to earnings before interest, taxes and depreciation and amortization (EBITDA): | | | | | | | | | | | | | | | |
| | | | | | | | | | | | | | | | |
| | | | | | | | | | | | | | | | |
| Net loss | | $ | (91,539 | ) | | $ | (67,758 | ) | | $ | (105,862 | ) | | $ | (43,825 | ) | | $ | (39,696 | ) |
| Add: | Minority interests | | | – | | | | – | | | | (6,864 | ) | | | (7,490 | ) | | | (6,958 | ) |
| Interest expense (3) | | | 69,952 | | | | 67,752 | | | | 67,947 | | | | 69,749 | | | | 71,708 | |
| Company share of interest expense included in unconsolidated joint venture | | | 2,202 | | | | 2,203 | | | | 2,181 | | | | 2,183 | | | | 2,212 | |
| Depreciation and amortization (4) | | | 46,151 | | | | 46,967 | | | | 51,027 | | | | 53,108 | | | | 56,856 | |
| Company share of depreciation and amortization included in unconsolidated joint venture | | | 2,204 | | | | 2,675 | | | | 2,377 | | | | 2,303 | | | | 2,451 | |
| | | | | | | | | | | | | | | | | | | | | |
| EBITDA | | $ | 28,970 | | | $ | 51,839 | | | $ | 10,806 | | | $ | 76,028 | | | $ | 86,573 | |
| | | | | | | | | | | | | | | | | | | | | |
| EBITDA | | $ | 28,970 | | | $ | 51,839 | | | $ | 10,806 | | | $ | 76,028 | | | $ | 86,573 | |
| Add: | Loss from early extinguishment of debt included in continuing operations | | | – | | | | 1,463 | | | | – | | | | – | | | | 886 | |
| | Loss from early extinguishment of debt included in discontinued operations | | | – | | | | 1,801 | | | | – | | | | – | | | | – | |
| Impairment of long-lived assets included in discontinued operations | | | 50,000 | | | | 21,796 | | | | 51,898 | | | | – | | | | – | |
| Costs associated with strategic alternatives and management changes | | | – | | | | – | | | | 17,490 | | | | 6,402 | | | | – | |
| | | | | | | | | | | | | | | | | | | | | |
| Adjusted EBITDA | | $ | 78,970 | | | $ | 76,899 | | | $ | 80,194 | | | $ | 82,430 | | | $ | 87,459 | |
| | | | | | | | | | | | | | | | | | | | | |
| | | | | | | | | | | | | | | | | | | | | |
Reconciliation of cash flows from operating activities to adjusted funds from operations (AFFO): | | | | | | | | | | | | | | | | | | | | |
| | | | | | | | | | | | | | | | | | | | | |
| Cash flows from operating activities | | $ | (26,978 | ) | | $ | (7,588 | ) | | $ | 4,109 | | | $ | (12,201 | ) | | $ | (11,838 | ) |
| Changes in other assets and liabilities | | | 17,286 | | | | (5,580 | ) | | | (33,680 | ) | | | (3,247 | ) | | | 782 | |
| Non-recoverable capital expenditures | | | (620 | ) | | | (2,959 | ) | | | (2,523 | ) | | | (4,470 | ) | | | (3,413 | ) |
| Recoverable capital expenditures | | | (704 | ) | | | (145 | ) | | | (56 | ) | | | (292 | ) | | | (1,133 | ) |
| Hotel improvements, equipment upgrades and replacements | | | (290 | ) | | | (254 | ) | | | (111 | ) | | | (45 | ) | | | (172 | ) |
2nd generation tenant improvements and leasing commissions (5), (6) | | | (7,878 | ) | | | (3,614 | ) | | | (6,617 | ) | | | (3,530 | ) | | | (5,048 | ) |
| | | | | | | | | | | | | | | | | | | | | |
| AFFO | | $ | (19,184 | ) | | $ | (20,140 | ) | | $ | (38,878 | ) | | $ | (23,785 | ) | | $ | (20,822 | ) |
__________ | (1) | For the definition and discussion of EBITDA and Adjusted EBITDA, see page 48. |
| (2) | For the definition and discussion of AFFO, see page 47. |
| (3) | Includes interest expense of $2.3 million, $4.1 million, $5.3 million, $5.5 million and $5.6 million for the three months ended December 31, September 30, June 30, March 31, 2008, and December 31, 2007, respectively, related to discontinued operations. |
| (4) | Includes depreciation and amortization of $1.6 million, $1.9 million, $5.0 million, $5.4 million and $6.8 million for the three months ended December 31, September 30, June 30 and March 31, 2008, and December 31, 2007, respectively, related to discontinued operations. |
| (5) | Excludes 1st generation tenant improvements and leasing commissions of $6.2 million, $0.4 million, $0.4 million, $1.1 million and $1.1 million for the three months ended December 31, September 30, June 30 and March 31, 2008, and December 31, 2007, respectively. |
| (6) | Excludes tenant improvements and leasing commissions paid by cash reserves that were funded through loan proceeds upon acquisition or debt refinancing of $6.2 million, $5.5 million, $12.7 million, $11.3 million and $14.0 million for the three months ended December 31, September 30, June 30 and March 31, 2008, and December 31, 2007, respectively. |
Maguire Properties, Inc.
Supplemental Operating and Financial Data
Fourth Quarter 2008
| Debt | |
| (in thousands) | |
| | | | | | Balance as of | |
| | | | | | December 31, 2008 | |
| | | | | | | |
| Mortgage and other secured loans (including mortgage associated with real estate held for sale) | | | | | $ | 4,882,809 | |
| Company share of MMO joint venture debt | | | | | | 161,420 | |
| Total combined debt | | | | | $ | 5,044,229 | |
| | | | | | | | |
| Equity | |
| (in thousands) | |
| | | | | | | | |
| | | | | | | | |
| | | Shares Outstanding | | | Total Liquidation Preference | |
| | | | | | | | |
| Preferred stock | | | 10,000 | | | $ | 250,000 | |
| | | | | | | |
| | | Shares & Units Outstanding | | | Market Value (1) | |
| | | | | | | | | |
| Common stock | | | 47,975 | | | $ | 70,043 | |
| | | | | | | | | |
| Operating Partnership units | | | 6,675 | | | | 9,745 | |
| Total common equity | | | 54,650 | | | $ | 79,788 | |
| | | | | | | | | |
| Total consolidated market capitalization | | | | | | $ | 5,212,597 | |
| | | | | | | | | |
| Total combined market capitalization (2) | | | | | | $ | 5,374,017 | |
__________ | (1) | Value based on the New York Stock Exchange closing price of $1.46 on December 31, 2008. |
| (2) | Includes our share of Maguire Macquarie Office ("MMO") joint venture debt. |
Maguire Properties, Inc.
Supplemental Operating and Financial Data
Fourth Quarter 2008
(in thousands, except percentages)
| | Maturity Date | | Principal Balance as of December 31, 2008 | | | % of Debt | | | Interest Rate as of December 31, 2008 (1) | |
| Floating-Rate Debt | | | | | | | | | | |
| Repurchase facility (2) | May 1, 2011 | | $ | 35,000 | | | | 0.72 | % | | | 2.19 | % |
| | | | | | | | | | | | | | |
| Construction Loans: | | | | | | | | | | | | | |
| 3161 Michelson (3) | September 28, 2009 | | | 168,719 | | | | 3.46 | % | | | 3.44 | % |
| Lantana Media Campus (4) | June 13, 2009 | | | 79,953 | | | | 1.64 | % | | | 3.44 | % |
| 17885 Von Karman | June 30, 2010 | | | 24,145 | | | | 0.49 | % | | | 5.50 | % |
| 2385 Northside Drive | August 6, 2010 | | | 13,991 | | | | 0.29 | % | | | 5.50 | % |
| 207 Goode (5) | May 1, 2010 | | | 9,133 | | | | 0.19 | % | | | 2.24 | % |
| Total construction loans | | | | 295,941 | | | | 6.07 | % | | | 3.67 | % |
| | | | | | | | | | | | | | |
| Variable-Rate Mortgage Loans: | | | | | | | | | | | | | |
| Griffin Towers (6) | May 1, 2010 | | | 125,000 | | | | 2.56 | % | | | 6.50 | % |
| Plaza Las Fuentes (7) | September 29, 2010 | | | 99,800 | | | | 2.04 | % | | | 3.69 | % |
| 500-600 City Parkway (8) | May 9, 2010 | | | 98,751 | | | | 2.02 | % | | | 1.79 | % |
| Brea Corporate Place (9) | May 1, 2010 | | | 70,469 | | | | 1.44 | % | | | 2.39 | % |
| Brea Financial Commons (9) | May 1, 2010 | | | 38,532 | | | | 0.79 | % | | | 2.39 | % |
| Total variable-rate mortgage loans | | | | 432,552 | | | | 8.85 | % | | | 3.74 | % |
| | | | | | | | | | | | | | |
| Variable-Rate Swapped to Fixed-Rate: | | | | | | | | | | | | | |
| KPMG Tower (10) | October 9, 2012 | | | 399,318 | | | | 8.18 | % | | | 7.16 | % |
| 207 Goode (5) | May 1, 2010 | | | 25,000 | | | | 0.51 | % | | | 7.36 | % |
| Total variable-rate swapped to fixed-rate loans | | | | 424,318 | | | | 8.69 | % | | | 7.18 | % |
| | | | | | | | | | | | | | |
| Total floating-rate debt | | | | 1,187,811 | | | | 24.33 | % | | | 4.90 | % |
| | | | | | | | | | | | | | |
| Fixed-Rate Debt | | | | | | | | | | | | | |
| Wells Fargo Tower | April 6, 2017 | | | 550,000 | | | | 11.26 | % | | | 5.68 | % |
| Two California Plaza (11) | May 6, 2017 | | | 466,217 | | | | 9.55 | % | | | 5.50 | % |
| Gas Company Tower | August 11, 2016 | | | 458,000 | | | | 9.38 | % | | | 5.10 | % |
| Pacific Arts Plaza | April 1, 2012 | | | 270,000 | | | | 5.53 | % | | | 5.15 | % |
| 777 Tower (11) | November 1, 2013 | | | 269,835 | | | | 5.53 | % | | | 5.84 | % |
| US Bank Tower | July 1, 2013 | | | 260,000 | | | | 5.32 | % | | | 4.66 | % |
| 550 South Hope Street (11) | May 6, 2017 | | | 198,444 | | | | 4.07 | % | | | 5.67 | % |
| Park Place I | November 1, 2014 | | | 170,000 | | | | 3.48 | % | | | 5.64 | % |
| City Tower (11) | May 10, 2017 | | | 139,834 | | | | 2.86 | % | | | 5.85 | % |
| Glendale Center | August 11, 2016 | | | 125,000 | | | | 2.56 | % | | | 5.82 | % |
| 500 Orange Tower (11) | May 6, 2017 | | | 109,127 | | | | 2.23 | % | | | 5.88 | % |
| 2600 Michelson (11) | May 10, 2017 | | | 109,101 | | | | 2.23 | % | | | 5.69 | % |
| Park Place II | March 11, 2012 | | | 99,268 | | | | 2.03 | % | | | 5.39 | % |
| Stadium Towers Plaza (11) | May 11, 2017 | | | 99,213 | | | | 2.03 | % | | | 5.78 | % |
| Lantana Media Campus | January 6, 2010 | | | 98,000 | | | | 2.01 | % | | | 4.94 | % |
| 801 North Brand | April 6, 2015 | | | 75,540 | | | | 1.55 | % | | | 5.73 | % |
| Mission City Corporate Center | April 1, 2012 | | | 52,000 | | | | 1.07 | % | | | 5.09 | % |
| The City - 3800 Chapman | May 6, 2017 | | | 44,370 | | | | 0.91 | % | | | 5.93 | % |
| 701 North Brand | October 1, 2016 | | | 33,750 | | | | 0.69 | % | | | 5.87 | % |
| 700 North Central | April 6, 2015 | | | 27,460 | | | | 0.56 | % | | | 5.73 | % |
| Griffin Towers Senior Mezzanine | May 1, 2011 | | | 20,000 | | | | 0.41 | % | | | 13.00 | % |
| 18581 Teller (11) | May 6, 2017 | | | 19,839 | | | | 0.41 | % | | | 5.65 | % |
| Total fixed-rate debt | | | | 3,694,998 | | | | 75.67 | % | | | 5.51 | % |
| | | | | | | | | | | | | | |
| Total consolidated debt | | | | 4,882,809 | | | | 100.00 | % | | | 5.37 | % |
| Less: mortgage loan associated with real estate held for sale | | | | (168,719 | ) | | | | | | | | |
| Total debt - continuing operations | | | $ | 4,714,090 | | | | | | | | | |
Maguire Properties, Inc.
Supplemental Operating and Financial Data
Fourth Quarter 2008
(in thousands, except percentages)
__________
| (1) | The December 31, 2008 one-month LIBOR rate of 0.44% was used to calculate interest on the variable-rate loans, except for the 17885 Von Karman and 2385 Northside Drive construction loans which were calculated using the prime rate of 3.25% as of December 31, 2008. |
| (2) | This loan bears interest at a variable rate of (i) LIBOR plus 1.75% for the first year, (ii) LIBOR plus 2.75% for the second year and (iii) LIBOR plus 3.75% for the third year. |
| (3) | As required by the loan agreement, we have entered into an interest rate cap agreement that limits the LIBOR portion of the interest rate to 5.50% for 75.0% of the maximum loan balance during the loan term, excluding extension periods. Two one-year extensions are available at our option, subject to certain conditions. As of December 31, 2008, our 3161 Michelson property is classified as held for sale. |
| (4) | One one-year extension is available at our option, subject to certain conditions. |
| (5) | This loan bears interest at a rate of LIBOR plus 1.80%. We have entered into an interest rate swap agreement to hedge this loan up to $25.0 million, which effectively fixes the LIBOR rate at 5.564%. One one-year extension is available at our option, subject to certain conditions. |
| (6) | This loan bears interest at a rate of the greater of LIBOR or 3.00%, plus 3.50%. As required by the loan agreement, we have entered into an interest rate cap agreement that limits the LIBOR portion of the interest rate to 5.00% during the loan term, excluding the extension period. One one-year extension is available at our option, subject to certain conditions. |
| (7) | As required by the loan agreement, we have entered into an interest rate cap agreement that limits the LIBOR portion of the interest rate to 4.75% during the loan term, excluding extension periods. Three one-year extensions are available at our option, subject to certain conditions. |
| (8) | As required by the loan agreement, we have entered into an interest rate cap agreement that limits the LIBOR portion of the interest rate to 6.00% during the loan term, excluding extension periods. Two one-year extensions are available at our option, subject to certain conditions. |
| (9) | As required by the loan agreement, we have entered into an interest rate cap agreement that limits the LIBOR portion of the interest rate to 6.50% during the loan term, excluding extension periods. Two one-year extensions are available at our option, subject to certain conditions. |
| (10) | This loan bears interest at a rate of LIBOR plus 1.60%. We have entered into an interest rate swap agreement to hedge this loan, which effectively fixes the LIBOR rate at 5.564%. |
| (11) | These loans are reflected net of the related debt discount. At December 31, 2008, the discount for all loans referenced totals approximately $11 million. |
Maguire Properties, Inc.
Washington Mutual IrvineSupplemental Operating and Financial Data
Fourth Quarter 2008
(in thousands, except percentages)
| | Maturity Date | | Principal Balance as of December 31, 2008 | | | % of Debt | | | Interest Rate as of December 31, 2008 | |
| | | | | | | | | | | |
| Fixed-Rate Debt | | | | | | | | | | |
| Wells Fargo Center (Denver, CO) | April 6, 2015 | | $ | 276,000 | | | | 34.20 | % | | | 5.26 | % |
| One California Plaza (1) | December 1, 2010 | | | 142,410 | | | | 17.65 | % | | | 4.73 | % |
| San Diego Tech Center (2) | April 11, 2015 | | | 135,782 | | | | 16.82 | % | | | 5.70 | % |
| Quintana Campus (1) | December 11, 2011 | | | 105,909 | | | | 13.12 | % | | | 5.07 | % |
| Cerritos Corporate Center (3) | February 1, 2016 | | | 95,000 | | | | 11.77 | % | | | 5.54 | % |
| Stadium Gateway | February 1, 2016 | | | 52,000 | | | | 6.44 | % | | | 5.66 | % |
| Total fixed-rate debt | | | | 807,101 | | | | 100.00 | % | | | 5.27 | % |
| | | | | | | | | | | | | | |
| Total joint venture debt | | | $ | 807,101 | | | | 100.00 | % | | | 5.27 | % |
| | | | | | | | | | | | | | |
| Our portion of joint venture debt (4) | | | $ | 161,420 | | | | | | | | | |
__________ | (1) | These loans are reflected net of the related discount. At December 31, 2008, the total discount for all loans referenced totals approximately $1 million. |
| (2) | This loan includes the related premium of approximately $3 million as of December 31, 2008. |
| (3) | All monthly debt service payments are made by the joint venture. We were the guarantor on the loan through January 4, 2009. |
| (4) | We own 20% of the MMO joint venture. |
Maguire Properties, Inc.
Supplemental Operating and Financial Data
Fourth Quarter 2008
(in thousands, except percentages)
| | | 2009 | | | 2010 | | | 2011 | | | 2012 | | | 2013 | | | Thereafter | | | Total | |
| Floating-Rate Debt | | | | | | | | | | | | | | | | | | | | | |
| Repurchase facility | | $ | 10,000 | | | $ | 10,000 | | | $ | 15,000 | | | $ | – | | | $ | – | | | $ | – | | | $ | 35,000 | |
| | | | | | | | | | | | | | | | | | | | | | | | | | | | | |
| Construction Loans: | | | | | | | | | | | | | | | | | | | | | | | | | | | | |
| 3161 Michelson (1), (2) | | | 168,719 | | | | – | | | | – | | | | – | | | | – | | | | – | | | | 168,719 | |
| Lantana Media Campus (3) | | | 79,953 | | | | – | | | | – | | | | – | | | | – | | | | – | | | | 79,953 | |
| 17885 Von Karman | | | – | | | | 24,145 | | | | – | | | | – | | | | – | | | | – | | | | 24,145 | |
| 2385 Northside Drive | | | – | | | | 13,991 | | | | – | | | | – | | | | – | | | | – | | | | 13,991 | |
| 207 Goode (3) | | | – | | | | 9,133 | | | | – | | | | – | | | | – | | | | – | | | | 9,133 | |
| Total construction loans | | | 248,672 | | | | 47,269 | | | | – | | | | – | | | | – | | | | – | | | | 295,941 | |
| | | | | | | | | | | | | | | | | | | | | | | | | | | | | |
| Variable-Rate Mortgage Loans: | | | | | | | | | | | | | | | | | | | | | | | | | | | | |
| Griffin Towers (3) | | | – | | | | 125,000 | | | | – | | | | – | | | | – | | | | – | | | | 125,000 | |
| Plaza Las Fuentes (4) | | | 1,200 | | | | 98,600 | | | | – | | | | – | | | | – | | | | – | | | | 99,800 | |
| 500-600 City Parkway (1) | | | – | | | | 98,751 | | | | – | | | | – | | | | – | | | | – | | | | 98,751 | |
| Brea Corporate Place (1) | | | – | | | | 70,469 | | | | – | | | | – | | | | – | | | | – | | | | 70,469 | |
| Brea Financial Commons (1) | | | – | | | | 38,532 | | | | – | | | | – | | | | – | | | | – | | | | 38,532 | |
| Total variable-rate mortgage loans | | | 1,200 | | | | 431,352 | | | | – | | | | – | | | | – | | | | – | | | | 432,552 | |
| | | | | | | | | | | | | | | | | | | | | | | | | | | | | |
| Variable-Rate Swapped to Fixed-Rate: | | | | | | | | | | | | | | | | | | | | | | | | | | | | |
| KPMG Tower | | | – | | | | – | | | | – | | | | 399,318 | | | | – | | | | – | | | | 399,318 | |
| 207 Goode (3) | | | – | | | | 25,000 | | | | – | | | | – | | | | – | | | | – | | | | 25,000 | |
Total variable-rate swapped to fixed-rate loans | | | – | | | | 25,000 | | | | – | | | | 399,318 | | | | – | | | | – | | | | 424,318 | |
| Total floating-rate debt | | | 259,872 | | | | 513,621 | | | | 15,000 | | | | 399,318 | | | | – | | | | – | | | | 1,187,811 | |
| | | | | | | | | | | | | | | | | | | | | | | | | | | | | |
| Fixed-Rate Debt | | | | | | | | | | | | | | | | | | | | | | | | | | | | |
| Wells Fargo Tower (Los Angeles, CA) | | | – | | | | – | | | | – | | | | – | | | | – | | | | 550,000 | | | | 550,000 | |
| Two California Plaza | | | – | | | | – | | | | – | | | | – | | | | – | | | | 470,000 | | | | 470,000 | |
| Gas Company Tower | | | – | | | | – | | | | – | | | | – | | | | – | | | | 458,000 | | | | 458,000 | |
| 777 Tower | | | – | | | | – | | | | – | | | | – | | | | 273,000 | | | | – | | | | 273,000 | |
| Pacific Arts Plaza | | | – | | | | – | | | | – | | | | 270,000 | | | | – | | | | – | | | | 270,000 | |
| US Bank Tower | | | – | | | | – | | | | – | | | | – | | | | 260,000 | | | | – | | | | 260,000 | |
| 550 South Hope Street | | | – | | | | – | | | | – | | | | – | | | | – | | | | 200,000 | | | | 200,000 | |
| Park Place I | | | – | | | | 2,232 | | | | 2,361 | | | | 2,498 | | | | 2,642 | | | | 160,267 | | | | 170,000 | |
| City Tower | | | – | | | | – | | | | – | | | | – | | | | – | | | | 140,000 | | | | 140,000 | |
| Glendale Center | | | – | | | | – | | | | – | | | | – | | | | – | | | | 125,000 | | | | 125,000 | |
| 500 Orange Tower | | | – | | | | – | | | | – | | | | – | | | | – | | | | 110,000 | | | | 110,000 | |
| 2600 Michelson | | | – | | | | – | | | | – | | | | – | | | | – | | | | 110,000 | | | | 110,000 | |
| Stadium Towers Plaza | | | – | | | | – | | | | – | | | | – | | | | – | | | | 100,000 | | | | 100,000 | |
| Park Place II | | | 1,266 | | | | 1,266 | | | | 1,266 | | | | 95,470 | | | | – | | | | – | | | | 99,268 | |
| Lantana Media Campus | | | – | | | | 98,000 | | | | – | | | | – | | | | – | | | | – | | | | 98,000 | |
| 801 North Brand | | | – | | | | – | | | | – | | | | – | | | | – | | | | 75,540 | | | | 75,540 | |
| Mission City Corporate Center | | | – | | | | – | | | | – | | | | 52,000 | | | | – | | | | – | | | | 52,000 | |
| The City - 3800 Chapman | | | – | | | | – | | | | – | | | | – | | | | – | | | | 44,370 | | | | 44,370 | |
| 701 North Brand | | | – | | | | – | | | | – | | | | – | | | | – | | | | 33,750 | | | | 33,750 | |
| 700 North Central | | | – | | | | – | | | | – | | | | – | | | | – | | | | 27,460 | | | | 27,460 | |
| Griffin Towers Senior Mezzanine | | | – | | | | – | | | | 20,000 | | | | – | | | | – | | | | – | | | | 20,000 | |
| 18581 Teller | | | – | | | | – | | | | – | | | | – | | | | – | | | | 20,000 | | | | 20,000 | |
| Total fixed-rate debt | | | 1,266 | | | | 101,498 | | | | 23,627 | | | | 419,968 | | | | 535,642 | | | | 2,624,387 | | | | 3,706,388 | |
| Total consolidated debt | | | 261,138 | | | | 615,119 | | | | 38,627 | | | | 819,286 | | | | 535,642 | | | | 2,624,387 | | | | 4,894,199 | |
| Debt discount | | | – | | | | – | | | | – | | | | – | | | | (3,165 | ) | | | (8,225 | ) | | | (11,390 | ) |
| Total consolidated debt, net of discount | | | 261,138 | | | | 615,119 | | | | 38,627 | | | | 819,286 | | | | 532,477 | | | | 2,616,162 | | | | 4,882,809 | |
Less: mortgage loan associated with real estate held for sale | | | (168,719 | ) | | | – | | | | – | | | | – | | | | – | | | | – | | | | (168,719 | ) |
| Total debt - continuing operations | | $ | 92,419 | | | $ | 615,119 | | | $ | 38,627 | | | $ | 819,286 | | | $ | 532,477 | | | $ | 2,616,162 | | | $ | 4,714,090 | |
| Weighted average interest rate | | | 3.40 | % | | | 4.15 | % | | | 8.10 | % | | | 6.16 | % | | | 5.27 | % | | | 5.58 | % | | | 5.37 | % |
__________
| (1) | Two one-year extensions are available at our option, subject to certain conditions. |
| (2) | As of December 31, 2008, our 3161 Michelson property is classified as held for sale. |
| (3) | One one-year extension is available at our option, subject to certain conditions. |
| (4) | Three one-year extensions are available at our option, subject to certain conditions. |
Maguire Properties, Inc.
Supplemental Operating and Financial Data
Fourth Quarter 2008
(in thousands, except percentages)
| | | 2009 | | | 2010 | | | 2011 | | | 2012 | | | 2013 | | | Thereafter | | | Total | |
| | | | | | | | | | | | | | | | | | | | | | |
| Fixed-Rate Debt | | | | | | | | | | | | | | | | | | | | | |
| Wells Fargo Center (Denver, CO) | | $ | – | | | $ | – | | | $ | – | | | $ | – | | | $ | – | | | $ | 276,000 | | | $ | 276,000 | |
| One California Plaza | | | 2,984 | | | | 140,202 | | | | – | | | | – | | | | – | | | | – | | | | 143,186 | |
| San Diego Tech Center | | | – | | | | – | | | | – | | | | – | | | | – | | | | 133,000 | | | | 133,000 | |
| Quintana Campus | | | – | | | | – | | | | 106,000 | | | | – | | | | – | | | | – | | | | 106,000 | |
| Cerritos Corporate Center | | | – | | | | – | | | | 1,054 | | | | 1,330 | | | | 1,406 | | | | 91,210 | | | | 95,000 | |
| Stadium Gateway | | | – | | | | – | | | | – | | | | – | | | | – | | | | 52,000 | | | | 52,000 | |
| | | | 2,984 | | | | 140,202 | | | | 107,054 | | | | 1,330 | | | | 1,406 | | | | 552,210 | | | | 805,186 | |
| | | | | | | | | | | | | | | | | | | | | | | | | | | | | |
| Debt premium, net of discount | | | – | | | | (775 | ) | | | (91 | ) | | | – | | | | – | | | | 2,781 | | | | 1,915 | |
| | | | | | | | | | | | | | | | | | | | | | | | | | | | | |
| Total joint venture debt | | $ | 2,984 | | | $ | 139,427 | | | $ | 106,963 | | | $ | 1,330 | | | $ | 1,406 | | | $ | 554,991 | | | $ | 807,101 | |
| | | | | | | | | | | | | | | | | | | | | | | | | | | | | |
| Weighted average interest rate | | | 4.73 | % | | | 4.73 | % | | | 5.07 | % | | | 5.54 | % | | | 5.54 | % | | | 5.45 | % | | | 5.27 | % |
Maguire Properties, Inc.
Supplemental Operating and Financial Data
Fourth Quarter 2008
Portfolio Data
Maguire Properties, Inc.
Supplemental Operating and Financial Data
Fourth Quarter 2008
(unaudited and in thousands, except percentages)
| | | For the Three Months Ended December 31, (1) | | | | For the Year Ended December 31, (2) | |
| | | 2008 | | | 2007 | | | % Change | | | | 2008 | | | 2007 | | | % Change | |
| Total Same Store Portfolio | | | | | | | | | | | | | | | | | | | |
| Number of properties | | | 27 | | | | 27 | | | | | | | | 14 | | | | 14 | | | | |
| Square feet as of December 31 | | | 15,257,886 | | | | 15,236,317 | | | | | | | | 10,268,465 | | | | 10,254,288 | | | | |
| Percentage of wholly-owned Office Portfolio | | | 94.4 | % | | | 96.6 | % | | | | | | | 63.5 | % | | | 65.0 | % | | | |
| Weighted average leased percentage (3) | | | 80.9 | % | | | 84.0 | % | | | | | | | 84.7 | % | | | 86.3 | % | | | |
| | | | | | | | | | | | | | | | | | | | | | | | |
| GAAP | | | | | | | | | | | | | | | | | | | | | | | |
| Breakdown of Net Operating Income: | | | | | | | | | | | | | | | | | | | | | | | |
| Operating revenue | | $ | 129,251 | | | $ | 134,209 | | | | (3.7 | )% | (4) | | $ | 358,518 | | | $ | 359,311 | | | | (0.2 | )% |
| Operating expenses | | | 50,614 | | | | 51,031 | | | | (0.8 | )% | | | | 136,339 | | | | 135,630 | | | | 0.5 | % |
| Other expense | | | 804 | | | | 1,440 | | | | (44.2 | )% | (5) | | | 223 | | | | 223 | | | | | |
| Net operating income | | $ | 77,833 | | | $ | 81,738 | | | | (4.8 | )% | | | $ | 221,956 | | | $ | 223,458 | | | | (0.7 | )% |
| | | | | | | | | | | | | | | | | | | | | | | | | | |
| CASH BASIS | | | | | | | | | | | | | | | | | | | | | | | | | |
| Breakdown of Net Operating Income: | | | | | | | | | | | | | | | | | | | | | | | | | |
| Operating revenue | | $ | 120,321 | | | $ | 123,392 | | | | (2.5 | )% | | | $ | 346,960 | | | $ | 347,047 | | | | | |
| Operating expenses | | | 50,614 | | | | 51,031 | | | | (0.8 | )% | | | | 136,340 | | | | 135,630 | | | | 0.5 | % |
| Other expense | | | 743 | | | | 838 | | | | (11.4 | )% | (5) | | | 249 | | | | 249 | | | | | |
| Net operating income | | $ | 68,964 | | | $ | 71,523 | | | | (3.6 | )% | | | $ | 210,371 | | | $ | 211,168 | | | | (0.4 | )% |
__________ | (1) | Properties included in the Same Store analysis are the properties in our Office Portfolio, with the exception of our joint venture properties, the 1920 and 2010 Main Plaza and City Plaza properties that were disposed of during 2008, 2385 Northside Drive and the Lantana South building, which were placed in service in fourth quarter 2008, and 3161 Michelson, which was classified as held for sale as of December 31, 2008. |
| (2) | Properties included in the Same Store analysis are the properties in our Office Portfolio, with the exception of our joint venture properties, the Wateridge Plaza, Pacific Center and Regents Square properties that were disposed of during 2007, properties acquired in the Blackstone Transaction in April 2007, 130 State College which was acquired in July 2007, 3161 Michelson which was placed in service in September 2007, and 2385 Northside Drive and the Lantana South building, which were placed in service in fourth quarter 2008. |
| (3) | Represents weighted average leased amounts for the Same Store portfolio. |
| (4) | Decrease primarily due to lower fair value lease revenue and interest income during 2008. |
| (5) | Decrease due to lower ground lease expense during 2008. |
Maguire Properties, Inc.
Supplemental Operating and Financial Data
Fourth Quarter 2008
| | Ownership | | Square Feet | | | Leased % and In-Place Rents | |
| Property | | Number of Buildings | | | Number of Tenants | | Year Built / Renovated | | % | | Net Building Rentable | | | Effective (1) | | | % of Net Rentable | | | % Leased | | | Total Annualized Rents (2) | | | Effective Annualized Rents (2) | | | Annualized Rent $/RSF (3) | |
| | | | | | | | | | | | | | | | | | | | | | | | | | | | | | | |
| Office Properties | | | | | | | | | | | | | | | | | | | | | | | | | | | | | | |
| Los Angeles County | | | | | | | | | | | | | | | | | | | | | | | | | | | | | | |
| Los Angeles Central Business District: | | | | | | | | | | | | | | | | | | | | | | | | | | | | | | |
| Gas Company Tower | | | 1 | | | | 18 | | 1991 | | 100% | | | 1,323,651 | | | | 1,323,651 | | | | 6.50 | % | | | 92.1 | % | | $ | 33,946,252 | | | $ | 33,946,252 | | | $ | 27.86 | |
| US Bank Tower | | | 1 | | | | 51 | | 1989 | | 100% | | | 1,412,351 | | | | 1,412,351 | | | | 6.93 | % | | | 65.6 | % | | | 24,392,936 | | | | 24,392,936 | | | | 26.33 | |
| Wells Fargo Tower | | | 2 | | | | 64 | | 1982 | | 100% | | | 1,396,121 | | | | 1,396,121 | | | | 6.85 | % | | | 93.9 | % | | | 27,350,771 | | | | 27,350,771 | | | | 20.85 | |
| Two California Plaza | | | 1 | | | | 65 | | 1992 | | 100% | | | 1,328,275 | | | | 1,328,275 | | | | 6.51 | % | | | 94.0 | % | | | 24,961,679 | | | | 24,961,679 | | | | 19.98 | |
| KPMG Tower | | | 1 | | | | 20 | | 1983 | | 100% | | | 1,143,654 | | | | 1,143,654 | | | | 5.61 | % | | | 92.5 | % | | | 23,826,900 | | | | 23,826,900 | | | | 22.54 | |
| 777 Tower | | | 1 | | | | 36 | | 1991 | | 100% | | | 1,010,123 | | | | 1,010,123 | | | | 4.95 | % | | | 91.9 | % | | | 19,139,555 | | | | 19,139,555 | | | | 20.61 | |
| 550 South Hope Street | | | 1 | | | | 42 | | 1991 | | 100% | | | 565,738 | | | | 565,738 | | | | 2.77 | % | | | 87.3 | % | | | 8,402,809 | | | | 8,402,809 | | | | 17.01 | |
| One California Plaza | | | 1 | | | | 31 | | 1985 | | 20% | | | 993,469 | | | | 198,694 | | | | 4.87 | % | | | 77.3 | % | | | 15,638,157 | | | | 3,127,631 | | | | 20.37 | |
| Total LACBD Submarket | | | 9 | | | | 327 | | | | | | | 9,173,382 | | | | 8,378,607 | | | | 44.99 | % | | | 86.7 | % | | | 177,659,059 | | | | 165,148,533 | | | | 22.34 | |
| | | | | | | | | | | | | | | | | | | | | | | | | | | | | | | | | | | | | | | | |
| Tri-Cities Submarket: | | | | | | | | | | | | | | | | | | | | | | | | | | | | | | | | | | | | | | | |
| Glendale Center | | | 2 | | | | 4 | | 1973/1996 | | 100% | | | 387,545 | | | | 387,545 | | | | 1.90 | % | | | 100.0 | % | | | 8,649,073 | | | | 8,649,073 | | | | 22.32 | |
| 801 North Brand | | | 1 | | | | 31 | | 1987 | | 100% | | | 282,770 | | | | 282,770 | | | | 1.39 | % | | | 88.8 | % | | | 4,782,164 | | | | 4,782,164 | | | | 19.05 | |
| 701 North Brand | | | 1 | | | | 13 | | 1978 | | 100% | | | 131,129 | | | | 131,129 | | | | 0.64 | % | | | 100.0 | % | | | 2,267,347 | | | | 2,267,347 | | | | 17.29 | |
| 700 North Central | | | 1 | | | | 18 | | 1979 | | 100% | | | 134,168 | | | | 134,168 | | | | 0.66 | % | | | 92.0 | % | | | 1,927,596 | | | | 1,927,596 | | | | 15.62 | |
| Plaza Las Fuentes | | | 3 | | | | 9 | | 1989 | | 100% | | | 192,958 | | | | 192,958 | | | | 0.94 | % | | | 100.0 | % | | | 5,081,285 | | | | 5,081,285 | | | | 26.33 | |
| Total Tri-Cities Submarket | | | 8 | | | | 75 | | | | | | | 1,128,570 | | | | 1,128,570 | | | | 5.53 | % | | | 96.2 | % | | | 22,707,465 | | | | 22,707,465 | | | | 20.91 | |
| | | | | | | | | | | | | | | | | | | | | | | | | | | | | | | | | | | | | | | | |
Santa Monica Professional and Entertainment Submarket: | | | | | | | | | | | | | | | | | | | | | | | | | | | | | | | | | | | | | | | |
| Lantana Media Campus | | | 4 | | | | 25 | | 1989/2001/2008 | | 100% | | | 464,475 | | | | 464,475 | | | | 2.28 | % | | | 82.8 | % | | | 15,734,321 | | | | 15,734,321 | | | | 40.89 | |
| Total Entertainment Submarket | | | 4 | | | | 25 | | | | | | | 464,475 | | | | 464,475 | | | | 2.28 | % | | | 82.8 | % | | | 15,734,321 | | | | 15,734,321 | | | | 40.89 | |
| | | | | | | | | | | | | | | | | | | | | | | | | | | | | | | | | | | | | | | | |
| Cerritos Office Submarket: | | | | | | | | | | | | | | | | | | | | | | | | | | | | | | | | | | | | | | | |
| Cerritos - Phase I | | | 1 | | | | 1 | | 1999 | | 20% | | | 221,968 | | | | 44,394 | | | | 1.09 | % | | | 100.0 | % | | | 5,982,037 | | | | 1,196,408 | | | | 26.95 | |
| Cerritos - Phase II | | | 1 | | | | - | | 2001 | | 20% | | | 104,567 | | | | 20,913 | | | | 0.51 | % | | | 100.0 | % | | | 2,482,421 | | | | 496,484 | | | | 23.74 | |
| Total Cerritos Submarket | | | 2 | | | | 1 | | | | | | | 326,535 | | | | 65,307 | | | | 1.60 | % | | | 100.0 | % | | | 8,464,458 | | | | 1,692,892 | | | | 25.92 | |
| | | | | | | | | | | | | | | | | | | | | | | | | | | | | | | | | | | | | | | | |
| Total Los Angeles County | | | 23 | | | | 428 | | | | | | | 11,092,962 | | | | 10,036,959 | | | | 54.40 | % | | | 87.9 | % | | $ | 224,565,303 | | | $ | 205,283,211 | | | $ | 23.03 | |
Maguire Properties, Inc.
Supplemental Operating and Financial Data
Fourth Quarter 2008
Portfolio Overview (continued)
| | Ownership | | Square Feet | | | Leased % and In-Place Rents | |
| Property | | Number of Buildings | | | Number of Tenants | | Year Built / Renovated | | % | | Net Building Rentable | | | Effective (1) | | | % of Net Rentable | | | % Leased | | | Total Annualized Rents (2) | | | Effective Annualized Rents (2) | | | Annualized Rent $/RSF (3) | |
| | | | | | | | | | | | | | | | | | | | | | | | | | | | | | | |
| Office Properties | | | | | | | | | | | | | | | | | | | | | | | | | | | | | | |
| Orange County | | | | | | | | | | | | | | | | | | | | | | | | | | | | | | |
| John Wayne Airport Submarket: | | | | | | | | | | | | | | | | | | | | | | | | | | | | | | |
| Park Place | | | 8 | | | | 36 | | 1977/2002 | | 100% | | | 1,787,440 | | | | 1,787,440 | | | | 8.77 | % | | | 60.3 | % | | $ | 17,241,952 | | | $ | 17,241,952 | | | $ | 15.99 | |
| 3161 Michelson (4) | | | 1 | | | | 5 | | 2007 | | 100% | | | 532,141 | | | | 532,141 | | | | 2.61 | % | | | 61.9 | % | | | 10,044,441 | | | | 10,044,441 | | | | 30.51 | |
| 2600 Michelson | | | 1 | | | | 29 | | 1986 | | 100% | | | 308,109 | | | | 308,109 | | | | 1.51 | % | | | 76.1 | % | | | 4,822,474 | | | | 4,822,474 | | | | 20.58 | |
| 18581 Teller | | | 1 | | | | 3 | | 1983 | | 100% | | | 86,087 | | | | 86,087 | | | | 0.42 | % | | | 100.0 | % | | | 1,382,426 | | | | 1,382,426 | | | | 16.06 | |
| Quintana Campus | | | 4 | | | | 2 | | 1989/2004 | | 20% | | | 414,595 | | | | 82,919 | | | | 2.03 | % | | | 100.0 | % | | | 9,314,466 | | | | 1,862,893 | | | | 22.47 | |
| 17885 Von Karman Avenue | | | 1 | | | | - | | 2008 | | 100% | | | 151,370 | | | | 151,370 | | | | 0.74 | % | | | 0.0 | % | | | - | | | | - | | | | - | |
| Total Airport Submarket | | | 16 | | | | 75 | | | | | | | 3,279,742 | | | | 2,948,066 | | | | 16.08 | % | | | 65.3 | % | | | 42,805,759 | | | | 35,354,186 | | | | 19.98 | |
| | | | | | | | | | | | | | | | | | | | | | | | | | | | | | | | | | | | | | | | |
| Costa Mesa Submarket: | | | | | | | | | | | | | | | | | | | | | | | | | | | | | | | | | | | | | | | |
| Griffin Towers | | | 2 | | | | 36 | | 1987 | | 100% | | | 543,988 | | | | 543,988 | | | | 2.67 | % | | | 64.3 | % | | | 5,805,217 | | | | 5,805,217 | | | | 16.59 | |
| Pacific Arts Plaza | | | 8 | | | | 42 | | 1982 | | 100% | | | 785,173 | | | | 785,173 | | | | 3.85 | % | | | 80.1 | % | | | 14,022,970 | | | | 14,022,970 | | | | 22.30 | |
| Total Costa Mesa Submarket | | | 10 | | | | 78 | | | | | | | 1,329,161 | | | | 1,329,161 | | | | 6.52 | % | | | 73.6 | % | | | 19,828,187 | | | | 19,828,187 | | | | 20.26 | |
| | | | | | | | | | | | | | | | | | | | | | | | | | | | | | | | | | | | | | | | |
| Central Orange Submarket: | | | | | | | | | | | | | | | | | | | | | | | | | | | | | | | | | | | | | | | |
| 3800 Chapman | | | 1 | | | | 1 | | 1984 | | 100% | | | 157,231 | | | | 157,231 | | | | 0.77 | % | | | 63.4 | % | | | 2,159,701 | | | | 2,159,701 | | | | 21.66 | |
| 500-600 Parkway | | | 3 | | | | 12 | | 1978 | | 100% | | | 457,475 | | | | 457,475 | | | | 2.24 | % | | | 28.7 | % | | | 2,119,332 | | | | 2,119,332 | | | | 16.13 | |
| City Tower | | | 1 | | | | 25 | | 1988 | | 100% | | | 411,843 | | | | 411,843 | | | | 2.02 | % | | | 78.1 | % | | | 7,128,670 | | | | 7,128,670 | | | | 22.15 | |
| 500 Orange Tower | | | 3 | | | | 35 | | 1987 | | 100% | | | 334,998 | | | | 334,998 | | | | 1.64 | % | | | 79.6 | % | | | 5,346,266 | | | | 5,346,266 | | | | 20.06 | |
| Stadium Towers Plaza | | | 1 | | | | 26 | | 1988 | | 100% | | | 258,257 | | | | 258,257 | | | | 1.27 | % | | | 63.1 | % | | | 3,317,963 | | | | 3,317,963 | | | | 20.36 | |
| Stadium Gateway | | | 1 | | | | 7 | | 2001 | | 20% | | | 272,826 | | | | 54,565 | | | | 1.34 | % | | | 79.0 | % | | | 4,633,088 | | | | 926,618 | | | | 21.48 | |
| Total Central Orange Submarket | | | 10 | | | | 106 | | | | | | | 1,892,630 | | | | 1,674,369 | | | | 9.28 | % | | | 63.3 | % | | | 24,705,020 | | | | 20,998,550 | | | | 20.62 | |
| | | | | | | | | | | | | | | | | | | | | | | | | | | | | | | | | | | | | | | | |
| Other: | | | | | | | | | | | | | | | | | | | | | | | | | | | | | | | | | | | | | | | |
| Brea Corporate Place | | | 2 | | | | 16 | | 1987 | | 100% | | | 328,996 | | | | 328,996 | | | | 1.62 | % | | | 48.6 | % | | | 2,935,767 | | | | 2,935,767 | | | | 18.34 | |
| Brea Financial Commons | | | 3 | | | | 2 | | 1987 | | 100% | | | 165,540 | | | | 165,540 | | | | 0.81 | % | | | 90.7 | % | | | 2,845,219 | | | | 2,845,219 | | | | 18.96 | |
| 130 State College | | | 1 | | | | 1 | | 1983 | | 100% | | | 42,884 | | | | 42,884 | | | | 0.21 | % | | | 100.0 | % | | | 614,956 | | | | 614,956 | | | | 14.34 | |
| Total Other | | | 6 | | | | 19 | | | | | | | 537,420 | | | | 537,420 | | | | 2.64 | % | | | 65.7 | % | | | 6,395,942 | | | | 6,395,942 | | | | 18.12 | |
| | | | | | | | | | | | | | | | | | | | | | | | | | | | | | | | | | | | | | | | |
| Total Orange County | | | 42 | | | | 278 | | | | | | | 7,038,953 | | | | 6,489,016 | | | | 34.52 | % | | | 66.4 | % | | $ | 93,734,908 | | | $ | 82,576,865 | | | $ | 20.06 | |
Maguire Properties, Inc.
Supplemental Operating and Financial Data
Fourth Quarter 2008
Portfolio Overview (continued)
| Property by Submarket | | Ownership | | Square Feet | | | Leased % and In-Place Rents | |
| Property | | Number of Buildings | | | Number of Tenants | | Year Built / Renovated | | % | | Net Building Rentable | | | Effective (1) | | | % of Net Rentable | | | % Leased | | | Total Annualized Rents (2) | | | Effective Annualized Rents (2) | | | Annualized Rent $/RSF (3) | |
| | | | | | | | | | | | | | | | | | | | | | | | | | | | | | | |
| Office Properties | | | | | | | | | | | | | | | | | | | | | | | | | | | | | | |
| San Diego County | | | | | | | | | | | | | | | | | | | | | | | | | | | | | | |
| | | | | | | | | | | | | | | | | | | | | | | | | | | | | | | |
| Sorrento Mesa Submarket: | | | | | | | | | | | | | | | | | | | | | | | | | | | | | | |
| San Diego Tech Center | | | 11 | | | | 29 | | 1984/1986 | | 20% | | | 645,934 | | | | 129,187 | | | | 3.17 | % | | | 96.8 | % | | $ | 12,680,555 | | | $ | 2,536,111 | | | $ | 20.29 | |
| Total Sorento Mesa Submarket | | | 11 | | | | 29 | | | | | | | 645,934 | | | | 129,187 | | | | 3.17 | % | | | 96.8 | % | | | 12,680,555 | | | | 2,536,111 | | | | 20.29 | |
| | | | | | | | | | | | | | | | | | | | | | | | | | | | | | | | | | | | | | | | |
| Mission Valley Submarket: | | | | | | | | | | | | | | | | | | | | | | | | | | | | | | | | | | | | | | | |
| Mission City Corporate Center | | | 3 | | | | 14 | | 1990 | | 100% | | | 190,634 | | | | 190,634 | | | | 0.93 | % | | | 86.9 | % | | | 4,081,007 | | | | 4,081,007 | | | | 24.63 | |
| 2385 Northside Drive | | | 1 | | | | 1 | | 2008 | | 100% | | | 88,795 | | | | 88,795 | | | | 0.44 | % | | | 51.7 | % | | | 798,288 | | | | 798,288 | | | | 17.37 | |
| Total Mission Valley Submarket | | | 4 | | | | 15 | | | | | | | 279,429 | | | | 279,429 | | | | 1.37 | % | | | 75.7 | % | | | 4,879,295 | | | | 4,879,295 | | | | 23.06 | |
| | | | | | | | | | | | | | | | | | | | | | | | | | | | | | | | | | | | | | | | |
| Total San Diego County | | | 15 | | | | 44 | | | | | | | 925,363 | | | | 408,616 | | | | 4.54 | % | | | 90.4 | % | | $ | 17,559,850 | | | $ | 7,415,406 | | | $ | 20.99 | |
| | | | | | | | | | | | | | | | | | | | | | | | | | | | | | | | | | | | | | | | |
| Other | | | | | | | | | | | | | | | | | | | | | | | | | | | | | | | | | | | | | | | |
| Denver, CO - Downtown Submarket: | | | | | | | | | | | | | | | | | | | | | | | | | | | | | | | | | | | | | | | |
| Wells Fargo Center - Denver | | | 1 | | | | 41 | | 1983 | | 20% | | | 1,211,773 | | | | 242,354 | | | | 5.94 | % | | | 95.9 | % | | $ | 22,744,849 | | | $ | 4,548,970 | | | $ | 19.56 | |
| Total Other | | | 1 | | | | 41 | | | | | | | 1,211,773 | | | | 242,354 | | | | 5.94 | % | | | 95.9 | % | | | 22,744,849 | | | | 4,548,970 | | | | 19.56 | |
| | | | | | | | | | | | | | | | | | | | | | | | | | | | | | | | | | | | | | | | |
| | | | | | | | | | | | | | | | | | | | | | | | | | | | | | | | | | | | | | | | |
| Total Office Properties | | | 81 | | | | 791 | | | | | | | 20,269,051 | | | | 17,176,945 | | | | 99.40 | % | | | 81.0 | % | | $ | 358,604,910 | | | $ | 299,824,452 | | | $ | 21.84 | |
Maguire Properties, Inc.
Supplemental Operating and Financial Data
Fourth Quarter 2008
Portfolio Overview (continued)
| Property by Submarket | | Ownership | | Square Feet | | | Leased % and In-Place Rents | |
| Property | | Number of Buildings | | | Number of Tenants | | Year Built / Renovated | | % | | Net Building Rentable | | | Effective (1) | | | % of Net Rentable | | | % Leased | | | Total Annualized Rents (2) | | | Effective Annualized Rents (2) | | | Annualized Rent $/RSF (3) | |
| Retail Property | | | | | | | | | | | | | | | | | | | | | | | | | | | | | | |
| John Wayne Airport Submarket: | | | | | | | | | | | | | | | | | | | | | | | | | | | | | | |
| Park Place | | | 8 | | | | 25 | | 1981 | | 100% | | | 122,533 | | | | 122,533 | | | | 0.60 | % | | | 91.8 | % | | $ | 3,409,080 | | | $ | 3,409,080 | | | $ | 30.30 | |
| Total Retail Properties | | | 8 | | | | 25 | | | | | | | 122,533 | | | | 122,533 | | | | 0.60 | % | | | 91.8 | % | | | 3,409,080 | | | | 3,409,080 | | | | 30.30 | |
| | | | | | | | | | | | | | | | | | | | | | | | | | | | | | | | | | | | | | | | |
| Total Office and Retail Properties | | | 89 | | | | 816 | | | | | | | 20,391,584 | | | | 17,299,478 | | | | 100.00 | % | | | 81.1 | % | | $ | 362,013,990 | | | $ | 303,233,532 | | | $ | 21.89 | |
Effective Office and Retail Properties | | | | | | | | | | | | | | 17,299,478 | | | | | | | | | | | | 79.3 | % | | | | | | | | | | $ | 22.09 | |
| | | | | | | | | | | | | | | | | | | | | | | | | | | | | | | | | | | | | | | | |
| | | | | | | | | | | | | | | | | | | | | | | | | | | | | | | | | | | | | | | | |
| Hotel Property | | | | | | | | | | | | | SQFT | | | Effective SQFT | | | Number of Rooms | | | | | | | | | | | | | | | | | |
| Westin Hotel, Pasadena, CA | | | | | | | | | | | 100% | | | 266,000 | | | | 266,000 | | | | 350 | | | | | | | | | | | | | | | | | |
| Total Hotel Property | | | | | | | | | | | | | | 266,000 | | | | 266,000 | | | | 350 | | | | | | | | | | | | | | | | | |
| | | | | | | | | | | | | | | | | | | | | | | | | | | | | | | | | | | | | | | | |
Total Office, Retail and Hotel Properties | | | | | | | | | | | | | | 20,657,584 | | | | 17,565,478 | | | | | | | | | | | | | | | | | | | | | |
| Parking Properties | | | | | | | | | | | | | SQFT | | | Effective SQFT | | | Vehicle Capacity | | | Effective Vehicle Capacity | | | Annualized Parking Revenue (5) | | | Effective Annualized Parking Revenue (6) | | | Effective Annualized Parking Revenue per Vehicle Capacity (7) | |
| On-Site Parking | | | | | | | | | | | | | | 11,772,172 | | | | 9,955,174 | | | | 38,867 | | | | 32,988 | | | $ | 50,747,924 | | | $ | 44,215,752 | | | $ | 1,340 | |
| Off-Site Garages | | | | | | | | | | | | | | 1,714,435 | | | | 1,714,435 | | | | 5,729 | | | | 5,729 | | | | 12,305,545 | | | | 12,305,545 | | | | 2,148 | |
| Total Parking Properties | | | | | | | | | | | | | | 13,486,607 | | | | 11,669,609 | | | | 44,596 | | | | 38,717 | | | $ | 63,053,469 | | | $ | 56,521,297 | | | | 1,460 | |
| | | | | | | | | | | | | | | | | | | | | | | | | | | | | | | | | | | | | | | | |
Total Office, Retail, Hotel and Parking Properties | | | | | | | | | | | | | | 34,144,191 | | | | 29,235,087 | | | | | | | | | | | | | | | | | | | | | |
__________
| (1) | Includes 100% of our consolidated portfolio and 20% of our MMO joint venture portfolio. |
| (2) | Annualized rent represents the annualized monthly contractual rent under existing leases as of December 31, 2008. This amount reflects total base rent before any one-time or non-recurring rent abatements but after annually recurring rent credits and is shown on a net basis; thus, for any tenant under a partial gross lease, the expense stop, or under a fully gross lease, the current year operating expenses (which may be estimates as of such date), are subtracted from gross rent. |
| (3) | Annualized rent per rentable square foot represents annualized rent as computed above, divided by the total square footage under lease as of the same date. |
| (4) | As of December 31, 2008, our 3161 Michelson property is classified as held for sale. |
| Annualized parking revenue represents the annualized quarterly parking revenue as of December 31, 2008. |
| Effective annualized parking revenue represents the annualized quarterly parking revenue as of December 31, 2008 adjusted to include 100% of our consolidated portfolio and 20% of our MMO joint venture portfolio. |
| Effective annualized parking revenue per vehicle capacity represents the effective annualized parking revenue divided by the effective vehicle capacity. |
Maguire Properties, Inc.
Supplemental Operating and Financial Data
Fourth Quarter 2008
Maguire Properties, Inc.
Supplemental Operating and Financial Data
Fourth Quarter 2008
| | Ownership Interest ( % ) | | Weighted Average Remaining Lease Term (in years) | | % Leased Q4 2008 | | % Leased Q3 2008 | | % Leased Q2 2008 | | % Leased Q1 2008 | | % Leased Q4 2007 |
| | | | | | | | | | | | | | | | | | | |
| Gas Company Tower | 100% | | 5.8 | | | 92.1 | % | | | 92.0 | % | | | 91.8 | % | | | 90.1 | % | | | 89.4 | % |
| US Bank Tower | 100% | | 4.0 | | | 65.6 | % | | | 65.1 | % | | | 64.8 | % | | | 85.0 | % | | | 85.4 | % |
| Wells Fargo Tower | 100% | | 5.6 | | | 93.9 | % | | | 93.8 | % | | | 93.9 | % | | | 94.0 | % | | | 92.8 | % |
| KPMG Tower | 100% | | 9.2 | | | 92.5 | % | | | 92.5 | % | | | 92.5 | % | | | 68.9 | % | | | 69.0 | % |
| 777 Tower | 100% | | 5.0 | | | 91.9 | % | | | 94.1 | % | | | 94.5 | % | | | 94.7 | % | | | 94.1 | % |
| One California Plaza | 20% | | 4.7 | | | 77.3 | % | | | 81.2 | % | | | 89.0 | % | | | 88.9 | % | | | 89.3 | % |
| Glendale Center | 100% | | 3.3 | | | 100.0 | % | | | 100.0 | % | | | 100.0 | % | | | 100.0 | % | | | 100.0 | % |
| 801 North Brand | 100% | | 3.1 | | | 88.8 | % | | | 91.0 | % | | | 90.1 | % | | | 85.2 | % | | | 85.8 | % |
| 701 North Brand | 100% | | 5.4 | | | 100.0 | % | | | 100.0 | % | | | 100.0 | % | | | 100.0 | % | | | 100.0 | % |
| 700 North Central | 100% | | 3.5 | | | 92.0 | % | | | 91.1 | % | | | 94.3 | % | | | 94.3 | % | | | 92.2 | % |
| Plaza Las Fuentes | 100% | | 9.2 | | | 100.0 | % | | | 100.0 | % | | | 100.0 | % | | | 100.0 | % | | | 100.0 | % |
| Lantana Media Campus | 100% | | 5.3 | | | 82.8 | % | | | 88.8 | % | | | 86.5 | % | | | 86.5 | % | | | 85.8 | % |
| Cerritos - Phase I | 20% | | 5.8 | | | 100.0 | % | | | 100.0 | % | | | 100.0 | % | | | 100.0 | % | | | 100.0 | % |
| Cerritos - Phase II | 20% | | 2.4 | | | 100.0 | % | | | 100.0 | % | | | 100.0 | % | | | 100.0 | % | | | 100.0 | % |
| Park Place | 100% | | 2.9 | | | 60.3 | % | | | 64.9 | % | | | 65.0 | % | | | 66.4 | % | | | 71.0 | % |
| 3161 Michelson | 100% | | 10.6 | | | 61.9 | % | | | 51.9 | % | | | 32.4 | % | | | 32.4 | % | | | 32.4 | % |
| Quintana Campus | 20% | | 1.2 | | | 100.0 | % | | | 100.0 | % | | | 100.0 | % | | | 100.0 | % | | | 100.0 | % |
| 17885 Von Karman Avenue | 100% | | 0.0 | | | 0.0 | % | | | 0.0 | % | | | 0.0 | % | | | 0.0 | % | | | | |
| Pacific Arts Plaza | 100% | | 5.6 | | | 80.1 | % | | | 79.7 | % | | | 81.2 | % | | | 84.4 | % | | | 85.0 | % |
| Stadium Gateway | 20% | | 4.4 | | | 79.0 | % | | | 77.5 | % | | | 94.7 | % | | | 90.2 | % | | | 91.8 | % |
| Mission City Corporate Center | 100% | | 3.0 | | | 86.9 | % | | | 82.8 | % | | | 82.8 | % | | | 82.8 | % | | | 84.6 | % |
| 2385 Northside Drive | 100% | | 11.3 | | | 51.7 | % | | | 0.0 | % | | | 0.0 | % | | | 0.0 | % | | | | |
| San Diego Tech Center | 20% | | 1.8 | | | 96.8 | % | | | 96.8 | % | | | 96.8 | % | | | 97.3 | % | | | 98.6 | % |
| Wells Fargo Center - Denver | 20% | | 6.6 | | | 95.9 | % | | | 95.5 | % | | | 95.2 | % | | | 95.2 | % | | | 95.2 | % |
| Park Place - Retail | 100% | | 6.3 | | | 91.8 | % | | | 91.8 | % | | | 91.8 | % | | | 91.8 | % | | | 95.1 | % |
| Two California Plaza | 100% | | 5.0 | | | 94.0 | % | | | 93.2 | % | | | 93.2 | % | | | 94.2 | % | | | 93.1 | % |
| 550 South Hope Street | 100% | | 5.5 | | | 87.3 | % | | | 88.3 | % | | | 90.3 | % | | | 91.0 | % | | | 91.0 | % |
| 2600 Michelson | 100% | | 2.5 | | | 76.1 | % | | | 82.0 | % | | | 84.9 | % | | | 88.0 | % | | | 85.1 | % |
| 3800 Chapman | 100% | | 4.4 | | | 63.4 | % | | | 63.4 | % | | | 63.4 | % | | | 100.0 | % | | | 100.0 | % |
| 18581 Teller | 100% | | 1.5 | | | 100.0 | % | | | 100.0 | % | | | 100.0 | % | | | 100.0 | % | | | 100.0 | % |
| Griffin Towers | 100% | | 4.5 | | | 64.3 | % | | | 62.6 | % | | | 65.0 | % | | | 62.8 | % | | | 77.1 | % |
| 500-600 Parkway | 100% | | 2.4 | | | 28.7 | % | | | 26.6 | % | | | 21.7 | % | | | 14.0 | % | | | 13.6 | % |
| City Tower | 100% | | 3.2 | | | 78.1 | % | | | 78.9 | % | | | 81.1 | % | | | 89.9 | % | | | 90.2 | % |
| 500 Orange Tower | 100% | | 4.2 | | | 79.6 | % | | | 80.2 | % | | | 80.9 | % | | | 86.9 | % | | | 94.4 | % |
| Stadium Towers Plaza | 100% | | 3.1 | | | 63.1 | % | | | 61.0 | % | | | 74.4 | % | | | 79.4 | % | | | 79.4 | % |
| Brea Corporate Place | 100% | | 2.8 | | | 48.6 | % | | | 47.7 | % | | | 47.9 | % | | | 46.7 | % | | | 66.8 | % |
| Brea Financial Commons | 100% | | 5.3 | | | 90.7 | % | | | 90.7 | % | | | 90.7 | % | | | 49.1 | % | | | 49.1 | % |
| 130 State College | 100% | | 5.8 | | | 100.0 | % | | | 0.0 | % | | | 0.0 | % | | | 0.0 | % | | | 0.0 | % |
| Total Portfolio | | | 5.0 | | | 81.1 | % | | | 81.0 | % | | | 80.6 | % | | | 81.1 | % | | | 83.2 | % |
| | | | | | | | | | | | | | | | | | | | | | | | |
| Effective Portfolio (1) | | | 5.1 | | | 79.3 | % | | | 79.1 | % | | | 78.2 | % | | | 78.8 | % | | | 81.1 | % |
__________
| (1) | Includes 100% of our consolidated portfolio and 20% of our MMO joint venture portfolio. |
Maguire Properties, Inc.
Supplemental Operating and Financial Data
Fourth Quarter 2008
| | | Tenant | | Number of Locations | | Annualized Rent (1) | | % of Total Annualized Rent | | Total Leased Square Feet | | % of Aggregate Leased Square Feet of Effective Portfolio | | Weighted Average Remaining Lease Term in Months | | S & P Credit Rating / National Recognition (2) |
| | | Rated | | | | | | | | | | | | | | |
| 1 | | Southern California Gas Company | | 1 | | $ | 21,283,883 | | 7.0% | | | 576,516 | | 4.2% | | 34 | | A |
| 2 | | Sempra (Pacific Enterprises) | | 1 | | | 8,189,591 | | 2.7% | | | 217,413 | | 1.6% | | 18 | | A |
| 3 | | Wells Fargo Bank (3), (4) | | 5 | | | 7,202,745 | | 2.4% | | | 415,057 | | 3.0% | | 68 | | AAA |
| 4 | | AT&T (3) | | 5 | | | 4,810,836 | | 1.6% | | | 202,813 | | 1.5% | | 48 | | A |
| 5 | | Bank of America (3), (5) | | 6 | | | 4,651,768 | | 1.5% | | | 220,515 | | 1.6% | | 37 | | AA- |
| 6 | | US Bank, National Association (6) | | 3 | | | 4,295,815 | | 1.4% | | | 164,561 | | 1.3% | | 74 | | AA+ |
| 7 | | Disney Enterprises | | 1 | | | 3,706,960 | | 1.2% | | | 156,215 | | 1.1% | | 30 | | A |
| 8 | | JP Morgan Chase & Co. (3), (7) | | 3 | | | 3,029,151 | | 1.0% | | | 126,447 | | 0.9% | | 12 | | A+ |
| 9 | | State Farm Mutual Auto Insurance Company | | 3 | | | 2,702,753 | | 0.9% | | | 172,170 | | 1.3% | | 62 | | AA |
| 10 | | GMAC Mortgage Corporation | | 1 | | | 2,499,091 | | 0.8% | | | 130,161 | | 0.9% | | 60 | | AA |
| | | Total Rated / Weighted Average (3), (8) | | | | | 62,372,593 | | 20.5% | | | 2,381,868 | | 17.4% | | 45 | | |
| | | Total Investment Grade Tenants (3) | | | | $ | 103,139,357 | | 34.0% | | | 4,411,114 | | 32.1% | | | | |
| | | | | | | | | | | | | | | | | | | |
| | | Unrated - Nationally Recognized | | | | | | | | | | | | | | | | |
| 11 | | Latham & Watkins LLP | | 2 | | | 8,941,649 | | 3.0% | | | 397,991 | | 2.9% | | 167 | | 2nd Largest US Law Firm |
| 12 | | Gibson, Dunn & Crutcher LLP | | 2 | | | 8,903,257 | | 2.9% | | | 354,721 | | 2.6% | | 106 | | 20th Largest US Law Firm |
| 13 | | Deloitte & Touche LLP | | 1 | | | 5,216,904 | | 1.7% | | | 342,094 | | 2.5% | | 75 | | Largest US Accounting Firm |
| 14 | | Marsh USA, Inc. | | 1 | | | 3,727,695 | | 1.2% | | | 212,721 | | 1.5% | | 112 | | World's Largest Insurance Broker |
| 15 | | KPMG LLP | | 1 | | | 3,636,822 | | 1.2% | | | 175,971 | | 1.3% | | 66 | | 4th Largest US Accounting Firm |
| 16 | | Morrison & Foerster LLP | | 1 | | | 3,469,400 | | 1.2% | | | 138,776 | | 1.0% | | 57 | | 21st Largest US Law Firm |
| 17 | | Munger, Tolles & Olson LLP | | 1 | | | 3,374,322 | | 1.1% | | | 160,682 | | 1.2% | | 158 | | 125th Largest US Law Firm |
| 18 | | PricewaterhouseCoopers LLP | | 1 | | | 2,988,225 | | 1.0% | | | 160,784 | | 1.2% | | 53 | | 3rd Largest US Accounting Firm |
| 19 | | Sidley Austin LLP | | 1 | | | 2,984,193 | | 1.0% | | | 187,362 | | 1.4% | | 180 | | 5th Largest US Law Firm |
| 20 | | Bingham McCutchen LLP | | 1 | | | 2,442,677 | | 0.8% | | | 104,712 | | 0.7% | | 49 | | 30th Largest US Law Firm |
| | | Total Unrated / Weighted Average (3), (8) | | | | | 45,685,144 | | 15.1% | | | 2,235,814 | | 16.3% | | 110 | | |
| | | Total Nationally Recognized Tenants (3) | | | | | 81,420,718 | | 26.9% | | | 3,875,849 | | 28.2% | | | | |
| | | | | | | | | | | | | | | | | | | |
| | | Total / Weighted Average (3), (8) | | | | $ | 108,057,737 | | 35.6% | | | 4,617,682 | | 33.7% | | 76 | | |
| | | | | | | | | | | | | | | | | | | |
| | | Total Investment Grade or Nationally Recognized Tenants (3) | | | | $ | 184,560,075 | | 60.9% | | | 8,286,963 | | 60.4% | | | | |
Maguire Properties, Inc.
Supplemental Operating and Financial Data
Fourth Quarter 2008
| (1) | Annualized base rent is calculated as monthly contractual base rent under existing leases as of December 31, 2008, multiplied by 12. For those leases where rent has not yet commenced, the first month in which rent is to be received is used to determine annualized base rent. |
| (2) | S&P credit ratings are as of December 31, 2008. Rankings of law firms are based on total gross revenue in 2007 as reported by American Lawyer Media's LAW.com. |
| (3) | Includes 20% of annualized rent and leased square footage for our MMO joint venture properties. |
| (4) | Amounts shown for Wells Fargo Bank include leases with Wachovia, which was acquired by Wells Fargo on December 31, 2008. |
| (5) | Amounts shown for Bank of America include leases with Countrywide Home Loans, which was acquired by Bank of America on July 1, 2008. |
| (6) | Amounts shown for US Bank include leases with Downey Savings and Loan, which was acquired by US Bank on November 21, 2008. |
| (7) | On September 25, 2008, JP Morgan Chase entered into an agreement with the FDIC to purchase substantially all of the assets and assume certain of the liabilities of Washington Mutual Bank. As part of this agreement, JP Morgan Chase had the right to assume or reject our leases with Washington Mutual. During December 2008, we were notified by JP Morgan Chase that they had rejected all but one of the Washington Mutual leases. We will continue to receive rent on the spaces that were rejected by JP Morgan Chase until the earlier of the move-out date or March 31, 2009. As of December 31, 2008, leases totaling 102,335 effective square feet have been rejected. The effective annualized rent associated with the rejected leases totals approximately $2.6 million. We have entered into a new lease with JP Morgan Chase for 24,112 effective square feet for a term ending in 2010 with a one-year renewal option. One of the rejected leases totaling 26,311 effective square feet is currently occupied by a subtenant. We are currently negotiating a direct lease with the subtenant. |
| (8) | The weighted average calculation is based on the effective net rentable square feet leased by each tenant, which reflects our pro-rata share of our MMO joint venture. |
Maguire Properties, Inc.
Supplemental Operating and Financial Data
Fourth Quarter 2008
Maguire Properties, Inc.
Supplemental Operating and Financial Data
Fourth Quarter 2008
| Year | | Total Area in Square Feet Covered by Expiring Leases | | | Percentage of Aggregate Square Feet | | | Annualized Rent | | | Percentage of Total Annualized Rent | | | Current Rent per Square Foot (1) | | | Rent per Square Foot at Expiration (2) | |
| | | | | | | | | | | | | | | | | | | |
| Available | | | 3,503,645 | | | | 21.2 | % | | | | | | | | | | | | |
| 2009 | | | 794,421 | | | | 4.8 | % | | $ | 16,534,691 | | | | 5.7 | % | | $ | 20.81 | | | $ | 20.84 | |
| 2010 | | | 1,531,638 | | | | 9.3 | % | | | 35,040,169 | | | | 12.2 | % | | | 22.88 | | | | 23.61 | |
| 2011 | | | 2,416,713 | | | | 14.6 | % | | | 58,221,234 | | | | 20.2 | % | | | 24.09 | | | | 25.35 | |
| 2012 | | | 1,096,713 | | | | 6.6 | % | | | 23,398,420 | | | | 8.1 | % | | | 21.34 | | | | 23.14 | |
| 2013 | | | 2,337,973 | | | | 14.2 | % | | | 48,183,691 | | | | 16.7 | % | | | 20.61 | | | | 23.43 | |
| 2014 | | | 814,778 | | | | 4.9 | % | | | 15,370,103 | | | | 5.3 | % | | | 18.86 | | | | 22.87 | |
| 2015 | | | 813,015 | | | | 4.9 | % | | | 16,219,711 | | | | 5.6 | % | | | 19.95 | | | | 23.50 | |
| 2016 | | | 177,243 | | | | 1.1 | % | | | 3,689,929 | | | | 1.3 | % | | | 20.82 | | | | 26.74 | |
| 2017 | | | 1,060,769 | | | | 6.4 | % | | | 22,800,250 | | | | 7.9 | % | | | 21.49 | | | | 24.83 | |
| 2018 | | | 701,680 | | | | 4.3 | % | | | 19,316,861 | | | | 6.7 | % | | | 27.53 | | | | 37.66 | |
| Thereafter | | | 1,277,864 | | | | 7.7 | % | | | 29,763,358 | | | | 10.3 | % | | | 23.29 | | | | 35.00 | |
| Total | | | 16,526,452 | | | | 100.0 | % | | $ | 288,538,417 | | | | 100.0 | % | | $ | 22.16 | | | $ | 25.69 | |
| | | | | | | | | | | | | | | | | | | | | | | | | |
| Leases Expiring in the Next 4 Quarters: | |
| | | | | | | | | | | | | | | | | | | | | | | | | |
| 1st Quarter 2009 | | | 131,150 | | | | 0.8 | % | | $ | 2,568,235 | | | | 0.9 | % | | $ | 19.58 | | | $ | 19.60 | |
| 2nd Quarter 2009 (3) | | | 320,239 | | | | 1.9 | % | | | 6,534,175 | | | | 2.3 | % | | | 20.40 | | | | 20.58 | |
| 3rd Quarter 2009 | | | 123,262 | | | | 0.8 | % | | | 3,017,036 | | | | 1.0 | % | | | 24.48 | | | | 24.56 | |
| 4th Quarter 2009 | | | 219,770 | | | | 1.3 | % | | | 4,415,245 | | | | 1.5 | % | | | 20.09 | | | | 19.86 | |
| Total | | | 794,421 | | | | 4.8 | % | | $ | 16,534,691 | | | | 5.7 | % | | $ | 20.81 | | | $ | 20.84 | |
__________
| (1) | Current rent per leased square foot represents current base rent, divided by total square footage under lease as of the same date. |
| (2) | Rent per leased square foot at expiration represents base rent including any future rent steps, and thus represents the base rent that will be in place at lease expiration. |
| (3) | Includes tenants leasing on a month-to-month basis. |
Maguire Properties, Inc.
Supplemental Operating and Financial Data
Fourth Quarter 2008
Los Angeles County
| Year | | Total Area in Square Feet Covered by Expiring Leases | | | Percentage of Aggregate Square Feet | | | Annualized Rent | | | Percentage of Total Annualized Rent | | | Current Rent per Square Foot (1) | | | Rent per Square Foot at Expiration (2) | |
| | | | | | | | | | | | | | | | | | | |
| Available | | | 1,116,855 | | | | 11.4 | % | | | | | | | | | | | | |
| 2009 | | | 362,585 | | | | 3.7 | % | | $ | 7,289,847 | | | | 3.6 | % | | $ | 20.11 | | | $ | 20.33 | |
| 2010 | | | 915,426 | | | | 9.4 | % | | | 24,735,201 | | | | 12.3 | % | | | 27.02 | | | | 27.70 | |
| 2011 | | | 1,425,053 | | | | 14.6 | % | | | 40,114,701 | | | | 20.0 | % | | | 28.15 | | | | 28.85 | |
| 2012 | | | 760,551 | | | | 7.8 | % | | | 16,573,712 | | | | 8.3 | % | | | 21.79 | | | | 24.00 | |
| 2013 | | | 1,502,976 | | | | 15.4 | % | | | 30,833,913 | | | | 15.4 | % | | | 20.52 | | | | 23.15 | |
| 2014 | | | 461,644 | | | | 4.7 | % | | | 9,536,836 | | | | 4.8 | % | | | 20.66 | | | | 24.94 | |
| 2015 | | | 712,488 | | | | 7.3 | % | | | 13,943,240 | | | | 7.0 | % | | | 19.57 | | | | 23.08 | |
| 2016 | | | 176,249 | | | | 1.8 | % | | | 3,672,928 | | | | 1.8 | % | | | 20.84 | | | | 26.79 | |
| 2017 | | | 868,813 | | | | 8.9 | % | | | 18,332,472 | | | | 9.1 | % | | | 21.10 | | | | 23.70 | |
| 2018 | | | 615,704 | | | | 6.3 | % | | | 17,461,107 | | | | 8.7 | % | | | 28.36 | | | | 38.47 | |
| Thereafter | | | 854,614 | | | | 8.7 | % | | | 17,968,731 | | | | 9.0 | % | | | 21.03 | | | | 32.63 | |
| Total | | | 9,772,958 | | | | 100.0 | % | | $ | 200,462,688 | | | | 100.0 | % | | $ | 23.16 | | | $ | 26.78 | |
| | | | | | | | | | | | | | | | | | | | | | | | | |
| Leases Expiring in the Next 4 Quarters: | |
| | | | | | | | | | | | | | | | | | | | | | | | | |
| 1st Quarter 2009 | | | 39,736 | | | | 0.4 | % | | $ | 651,900 | | | | 0.3 | % | | $ | 16.41 | | | $ | 16.47 | |
| 2nd Quarter 2009 (3) | | | 161,382 | | | | 1.6 | % | | | 3,252,252 | | | | 1.6 | % | | | 20.15 | | | | 20.49 | |
| 3rd Quarter 2009 | | | 44,937 | | | | 0.5 | % | | | 1,065,866 | | | | 0.5 | % | | | 23.72 | | | | 23.72 | |
| 4th Quarter 2009 | | | 116,530 | | | | 1.2 | % | | | 2,319,829 | | | | 1.2 | % | | | 19.91 | | | | 20.13 | |
| Total | | | 362,585 | | | | 3.7 | % | | $ | 7,289,847 | | | | 3.6 | % | | $ | 20.11 | | | $ | 20.33 | |
__________
| (1) | Current rent per leased square foot represents current base rent, divided by total square footage under lease as of the same date. |
| (2) | Rent per leased square foot at expiration represents base rent including any future rent steps, and thus represents the base rent that will be in place at lease expiration. |
| (3) | Includes tenants leasing on a month-to-month basis. |
Maguire Properties, Inc.
Supplemental Operating and Financial Data
Fourth Quarter 2008
Lease Expirations - Wholly Owned Portfolio
| | Total Area in Square Feet Covered by Expiring Leases | | | Percentage of Aggregate Square Feet | | | Annualized Rent | | | Percentage of Total Annualized Rent | | | Current Rent per Square Foot (1) | | | Rent per Square Foot at Expiration (2) | |
| | | | | | | | | | | | | | | | | | | |
| Available | | | 2,318,982 | | | | 35.8 | % | | | | | | | | | | | | |
| 2009 | | | 390,810 | | | | 6.0 | % | | $ | 8,251,762 | | | | 9.9 | % | | $ | 21.11 | | | $ | 20.92 | |
| 2010 | | | 602,114 | | | | 9.3 | % | | | 9,920,853 | | | | 11.9 | % | | | 16.48 | | | | 17.28 | |
| 2011 | | | 934,753 | | | | 14.5 | % | | | 16,716,962 | | | | 20.1 | % | | | 17.88 | | | | 19.85 | |
| 2012 | | | 313,698 | | | | 4.9 | % | | | 6,280,017 | | | | 7.6 | % | | | 20.02 | | | | 20.77 | |
| 2013 | | | 834,997 | | | | 12.9 | % | | | 17,328,913 | | | | 20.8 | % | | | 20.75 | | | | 23.94 | |
| 2014 | | | 345,275 | | | | 5.3 | % | | | 5,695,315 | | | | 6.9 | % | | | 16.50 | | | | 20.15 | |
| 2015 | | | 77,206 | | | | 1.2 | % | | | 1,665,741 | | | | 2.0 | % | | | 21.58 | | | | 24.72 | |
| 2016 | | | 994 | | | | 0.0 | % | | | 17,001 | | | | 0.0 | % | | | 17.10 | | | | 17.10 | |
| 2017 | | | 191,956 | | | | 3.0 | % | | | 4,467,779 | | | | 5.4 | % | | | 23.28 | | | | 29.95 | |
| 2018 | | | 85,976 | | | | 1.3 | % | | | 1,855,754 | | | | 2.2 | % | | | 21.58 | | | | 31.86 | |
| Thereafter | | | 377,304 | | | | 5.8 | % | | | 10,996,337 | | | | 13.2 | % | | | 29.14 | | | | 41.79 | |
| Total | | | 6,474,065 | | | | 100.0 | % | | $ | 83,196,434 | | | | 100.0 | % | | $ | 20.02 | | | $ | 23.36 | |
| | | | | | | | | | | | | | | | | | | | | | | | | |
| Leases Expiring in the Next 4 Quarters: | |
| | | | | | | | | | | | | | | | | | | | | | | | | |
| 1st Quarter 2009 | | | 91,414 | | | | 1.4 | % | | $ | 1,916,335 | | | | 2.3 | % | | $ | 20.96 | | | $ | 20.96 | |
| 2nd Quarter 2009 (3) | | | 158,857 | | | | 2.4 | % | | | 3,273,941 | | | | 3.9 | % | | | 20.61 | | | | 20.63 | |
| 3rd Quarter 2009 | | | 78,325 | | | | 1.2 | % | | | 1,896,640 | | | | 2.3 | % | | | 24.22 | | | | 24.22 | |
| 4th Quarter 2009 | | | 62,214 | | | | 1.0 | % | | | 1,164,846 | | | | 1.4 | % | | | 18.72 | | | | 17.46 | |
| Total | | | 390,810 | | | | 6.0 | % | | $ | 8,251,762 | | | | 9.9 | % | | $ | 21.11 | | | $ | 20.92 | |
__________
| (1) | Current rent per leased square foot represents current base rent, divided by total square footage under lease as of the same date. |
| (2) | Rent per leased square foot at expiration represents base rent including any future rent steps, and thus represents the base rent that will be in place at lease expiration. |
| (3) | Includes tenants leasing on a month-to-month basis. |
Maguire Properties, Inc.
Supplemental Operating and Financial Data
Fourth Quarter 2008
| Year | | Total Area in Square Feet Covered by Expiring Leases | | | Perc entage of Aggregate Square Feet | | | Annualized Rent | | | Percentage of Total Annualized Rent | | | Current Rent per Square Foot (1) | | | Rent per Square Foot at Expiration (2) | |
| | | | | | | | | | | | | | | | | | | |
| Available | | | 353,119 | | | | 9.1 | % | | | | | | | | | | | | |
| 2009 | | | 708,107 | | | | 18.3 | % | | $ | 13,936,571 | | | | 19.0 | % | | $ | 19.68 | | | $ | 20.65 | |
| 2010 | | | 573,574 | | | | 14.9 | % | | | 13,697,064 | | | | 18.6 | % | | | 23.88 | | | | 24.87 | |
| 2011 | | | 341,252 | | | | 8.8 | % | | | 6,536,498 | | | | 9.0 | % | | | 19.15 | | | | 20.83 | |
| 2012 | | | 330,990 | | | | 8.6 | % | | | 6,943,816 | | | | 9.5 | % | | | 20.98 | | | | 22.11 | |
| 2013 | | | 230,514 | | | | 6.0 | % | | | 5,013,992 | | | | 6.8 | % | | | 21.75 | | | | 25.48 | |
| 2014 | | | 593,913 | | | | 15.4 | % | | | 12,508,619 | | | | 17.0 | % | | | 21.06 | | | | 24.71 | |
| 2015 | | | 117,650 | | | | 3.0 | % | | | 2,350,833 | | | | 3.2 | % | | | 19.98 | | | | 23.44 | |
| 2016 | | | 81,033 | | | | 2.1 | % | | | 1,394,978 | | | | 1.9 | % | | | 17.21 | | | | 23.08 | |
| 2017 | | | 1,164 | | | | 0.0 | % | | | 30,264 | | | | 0.0 | % | | | 26.00 | | | | 30.00 | |
| 2018 | | | 81,744 | | | | 2.1 | % | | | 1,640,924 | | | | 2.2 | % | | | 20.07 | | | | 29.50 | |
| Thereafter | | | 452,072 | | | | 11.7 | % | | | 9,422,014 | | | | 12.8 | % | | | 20.84 | | | | 30.42 | |
| Total | | | 3,865,132 | | | | 100.0 | % | | $ | 73,475,573 | | | | 100.0 | % | | $ | 20.92 | | | $ | 22.95 | |
| | | | | | | | | | | | | | | | | | | | | | | | | |
| Leases Expiring in the Next 4 Quarters: | |
| | | | | | | | | | | | | | | | | | | | | | | | | |
| 1st Quarter 2009 | | | 277,106 | | | | 7.2 | % | | $ | 6,003,537 | | | | 8.2 | % | | $ | 21.67 | | | $ | 23.51 | |
| 2nd Quarter 2009 (3) | | | 45,807 | | | | 1.2 | % | | | 989,322 | | | | 1.4 | % | | | 21.60 | | | | 21.60 | |
| 3rd Quarter 2009 | | | 63,310 | | | | 1.6 | % | | | 1,280,843 | | | | 1.7 | % | | | 20.23 | | | | 20.24 | |
| 4th Quarter 2009 | | | 321,884 | | | | 8.3 | % | | | 5,662,869 | | | | 7.7 | % | | | 17.59 | | | | 18.14 | |
| Total | | | 708,107 | | | | 18.3 | % | | $ | 13,936,571 | | | | 19.0 | % | | $ | 19.68 | | | $ | 20.65 | |
__________
| (1) | Current rent per leased square foot represents current base rent, divided by total square footage under lease as of the same date. |
| (2) | Rent per leased square foot at expiration represents base rent including any future rent steps, and thus represents the base rent that will be in place at lease expiration. |
| (3) | Includes tenants leasing on a month-to-month basis. |
Maguire Properties, Inc.
Supplemental Operating and Financial Data
Fourth Quarter 2008
| | | Total Portfolio | | | Effective Portfolio (1) | |
| | | For the Three Months Ended December 31, 2008 | | | % Leased | | | For the Three Months Ended December 31, 2008 | | | % Leased | |
| | | | | | | | | | | | | |
| Leased Square Feet as of September 30, 2008, as reported | | | 16,407,643 | | | | 81.0 | % | | | 13,574,510 | | | | 79.1 | % |
| Property Placed in Service - Lantana South (2) | | | 95,304 | | | | | | | | 95,304 | | | | | |
| Leased Square Feet as of September 30, 2008, as adjusted | | | 16,502,947 | | | | 80.9 | % | | | 13,669,814 | | | | 79.0 | % |
| Expirations | | | (586,743 | ) | | | (2.9 | )% | | | (544,844 | ) | | | (3.2 | )% |
| New Leases | | | 334,783 | | | | 1.7 | % | | | 322,586 | | | | 1.9 | % |
| Renewals | | | 283,833 | | | | 1.4 | % | | | 277,654 | | | | 1.6 | % |
| Leased Square Feet as of December 31, 2008 | | | 16,534,820 | | | | 81.1 | % | | | 13,725,210 | | | | 79.3 | % |
| | | | | | | | | | | | | | | | | |
| | | | | | | | | | | | | | | | | |
| | | | | | | | | | | | | | | | | |
| | | | | | | | | | | | | | | | | |
Cash Rent Growth (3), (4) | | | | | | | | | | | | | | | | |
| Expiring Rate per Square Foot | | | | | | | | | | | | | | $ | 15.65 | |
| New / Renewed Rate per Square Foot | | | | | | | | | | | | | | $ | 16.88 | |
| Percentage Change | | | | | | | | | | | | | | | 7.9 | % |
| | | | | | | | | | | | | | | | | |
GAAP Rent Growth (4), (5) | | | | | | | | | | | | | | | | |
| Expiring Rate per Square Foot | | | | | | | | | | | | | | $ | 14.27 | |
| New / Renewed Rate per Square Foot | | | | | | | | | | | | | | $ | 17.72 | |
| Percentage Change | | | | | | | | | | | | | | | 24.2 | % |
| | | | | | | | | | | | | | | | | |
| Weighted Average Lease Term - New (in months) | | | | | | | | | | | | | | | 84 | |
| Weighted Average Lease Term - Renewal (in months) | | | | | | | | | | | | | | | 51 | |
__________ | (1) | Includes 100% of our consolidated portfolio and 20% of our MMO joint venture properties. |
| (2) | During the fourth quarter of 2008, we placed the Lantana South building (132,976 SF) in service. |
| (3) | Represents the difference between (i) initial market rents on new and renewed leases and (ii) the cash rents on those spaces immediately prior to the expiration or termination. |
| (4) | For newly acquired properties, cash and GAAP rent growth is excluded for spaces that expired prior to our ownership and were re-leased after acquisition. |
| | Excludes new and renewed leases for spaces with more than twelve months of downtime and early renewals commencing after December 31, 2009. |
| (5) | Represents estimated cash rent growth adjusted for straight-line rents in accordance with GAAP. |
Maguire Properties, Inc.
Supplemental Operating and Financial Data
Fourth Quarter 2008
| | | Total Portfolio | | | Effective Portfolio (1) | |
| | | For the Three Months Ended December 31, 2008 | | | % Leased | | | For the Three Months Ended December 31, 2008 | | | % Leased | |
| | | | | | | | | | | | | |
| Leased Square Feet as of September 30, 2008, Los Angeles Central Business District | | | 7,999,661 | | | | 87.2 | % | | | 7,354,481 | | | | 87.8 | % |
| Expirations | | | (159,043 | ) | | | (1.8 | )% | | | (127,969 | ) | | | (1.5 | )% |
| New Leases | | | 35,996 | | | | 0.5 | % | | | 35,996 | | | | 0.4 | % |
| Renewals | | | 76,223 | | | | 0.8 | % | | | 76,223 | | | | 0.9 | % |
| Leased Square Feet as of December 31, 2008, Los Angeles Central Business District | | | 7,952,837 | | | | 86.7 | % | | | 7,338,731 | | | | 87.6 | % |
| | | | | | | | | | | | | | | | | |
Cash Rent Growth (2), (3) | | | | | | | | | | | | | | | | |
| Expiring Rate per Square Foot | | | | | | | | | | | | | | $ | 21.37 | |
| New / Renewed Rate per Square Foot | | | | | | | | | | | | | | $ | 25.97 | |
| Percentage Change | | | | | | | | | | | | | | | 21.5 | % |
| | | | | | | | | | | | | | | | | |
GAAP Rent Growth (3), (4) | | | | | | | | | | | | | | | | |
| Expiring Rate per Square Foot | | | | | | | | | | | | | | $ | 20.46 | |
| New / Renewed Rate per Square Foot | | | | | | | | | | | | | | $ | 26.48 | |
| Percentage Change | | | | | | | | | | | | | | | 29.4 | % |
| | | | | | | | | | | | | | | | | |
| Weighted Average Lease Term - New (in months) | | | | | | | | | | | | | | | 71 | |
| Weighted Average Lease Term - Renewal (in months) | | | | | | | | | | | | | | | 50 | |
__________ | (1) | Includes 100% of our consolidated portfolio and 20% of our MMO joint venture properties. |
| (2) | Represents the difference between (i) initial market rents on new and renewed leases and (ii) the cash rents on those spaces immediately prior to the expiration or termination. |
| (3) | For newly acquired properties, cash and GAAP rent growth is excluded for spaces that expired prior to our ownership and were re-leased after acquisition. |
| | Excludes new and renewed leases for spaces with more than twelve months of downtime and early renewals commencing after December 31, 2009. |
| (4) | Represents estimated cash rent growth adjusted for straight-line rents in accordance with GAAP. |
Maguire Properties, Inc.
Supplemental Operating and Financial Data
Fourth Quarter 2008
| | | Total Portfolio | | | Effective Portfolio (1) | |
| | | For the Three Months Ended December 31, 2008 | | | % Leased | | | For the Three Months Ended December 31, 2008 | | | % Leased | |
| | | | | | | | | | | | | |
| Leased Square Feet as of September 30, 2008, Orange County | | | 4,757,065 | | | | 66.4 | % | | | 4,256,248 | | | | 64.4 | % |
| Expirations | | | (374,759 | ) | | | (5.3 | )% | | | (374,758 | ) | | | (5.7 | )% |
| New Leases | | | 204,400 | | | | 2.9 | % | | | 201,018 | | | | 3.1 | % |
| Renewals | | | 198,625 | | | | 2.8 | % | | | 198,625 | | | | 3.0 | % |
| Leased Square Feet as of December 31, 2008, Orange County | | | 4,785,331 | | | | 66.8 | % | | | 4,281,133 | | | | 64.8 | % |
| | | | | | | | | | | | | | | | | |
| | | | | | | | | | | | | | | | | |
Cash Rent Growth (2), (3) | | | | | | | | | | | | | | | | |
| Expiring Rate per Square Foot | | | | | | | | | | | | | | $ | 13.64 | |
| New / Renewed Rate per Square Foot | | | | | | | | | | | | | | $ | 12.69 | |
| Percentage Change | | | | | | | | | | | | | | | (7.0 | )% |
| | | | | | | | | | | | | | | | | |
GAAP Rent Growth (3), (4) | | | | | | | | | | | | | | | | |
| Expiring Rate per Square Foot | | | | | | | | | | | | | | $ | 12.17 | |
| New / Renewed Rate per Square Foot | | | | | | | | | | | | | | $ | 13.73 | |
| Percentage Change | | | | | | | | | | | | | | | 12.8 | % |
| | | | | | | | | | | | | | | | | |
| Weighted Average Lease Term - New (in months) | | | | | | | | | | | | | | | 36 | |
| Weighted Average Lease Term - Renewal (in months) | | | | | | | | | | | | | | | 51 | |
___________ | (1) | Includes 100% of our consolidated portfolio and 20% of our MMO joint venture properties. |
| (2) | Represents the difference between (i) initial market rents on new and renewed leases and (ii) the cash rents on those spaces immediately prior to the expiration or termination. |
| (3) | For newly acquired properties, cash and GAAP rent growth is excluded for spaces that expired prior to our ownership and were re-leased after acquisition. |
| | Excludes new and renewed leases for spaces with more than twelve months of downtime and early renewals commencing after December 31, 2009. |
| (4) | Represents estimated cash rent growth adjusted for straight-line rents in accordance with GAAP. |
Maguire Properties, Inc.
Supplemental Operating and Financial Data
Fourth Quarter 2008
| | | For the Three Months Ended | | | | For the Year Ended December 31, | |
| | | December 31, 2008 | | | September 30, 2008 | | | June 30, 2008 | | | March 31, 2008 | | | | 2008 | | | 2007 | | | 2006 | |
Renewals (3) | | | | | | | | | | | | | | | | | | | | | | |
| Number of Leases | | | 42 | | | | 20 | | | | 28 | | | | 40 | | | | | 130 | | | | 152 | | | | 74 | |
| Square Feet | | | 277,654 | | | | 70,505 | | | | 149,651 | | | | 166,714 | | | | | 664,524 | | | | 881,406 | | | | 824,516 | |
Tenant Improvement Costs per Square Foot (4) | | $ | 13.38 | | | $ | 9.28 | | | $ | 11.39 | | | $ | 19.17 | | | | $ | 13.95 | | | $ | 11.69 | | | $ | 29.22 | |
Leasing Commission Costs per Square Foot | | $ | 5.92 | | | $ | 4.60 | | | $ | 4.50 | | | $ | 6.21 | | | | $ | 5.53 | | | $ | 5.14 | | | $ | 8.18 | |
Total Tenant Improvements and Leasing Commissions | | | | | | | | | | | | | | | | | | | | | | | | | | | | | |
| Costs per Square Foot | | $ | 19.30 | | | $ | 13.88 | | | $ | 15.89 | | | $ | 25.38 | | | | $ | 19.48 | | | $ | 16.83 | | | $ | 37.40 | |
| Costs per Square Foot per Year | | $ | 4.57 | | | $ | 3.84 | | | $ | 3.42 | | | $ | 4.98 | | | | $ | 4.36 | | | $ | 3.41 | | | $ | 4.78 | |
| | | | | | | | | | | | | | | | | | | | | | | | | | | | | | |
New / Modified Leases (5) | | | | | | | | | | | | | | | | | | | | | | | | | | | | | |
| Number of Leases | | | 44 | | | | 32 | | | | 42 | | | | 45 | | | | | 163 | | | | 141 | | | | 147 | |
| Square Feet | | | 220,474 | | | | 103,587 | | | | 598,209 | | | | 192,785 | | | | | 1,115,055 | | | | 893,634 | | | | 1,015,192 | |
Tenant Improvement Costs per Square Foot (4) | | $ | 33.13 | | | $ | 11.71 | | | $ | 55.55 | | | $ | 26.20 | | | | $ | 41.97 | | | $ | 22.89 | | | $ | 20.93 | |
Leasing Commission Costs per Square Foot | | $ | 6.45 | | | $ | 4.22 | | | $ | 13.55 | | | $ | 6.81 | | | | $ | 10.11 | | | $ | 6.52 | | | $ | 6.34 | |
Total Tenant Improvements and Leasing Commissions | | | | | | | | | | | | | | | | | | | | | | | | | | | | | |
| Costs per Square Foot | | $ | 39.58 | | | $ | 15.93 | | | $ | 69.10 | | | $ | 33.01 | | | | $ | 52.08 | | | $ | 29.41 | | | $ | 27.27 | |
| Costs per Square Foot per Year | | $ | 7.16 | | | $ | 4.16 | | | $ | 5.92 | | | $ | 5.75 | | | | $ | 5.98 | | | $ | 5.00 | | | $ | 4.33 | |
| | | | | | | | | | | | | | | | | | | | | | | | | | | | | | |
| Total | | | | | | | | | | | | | | | | | | | | | | | | | | | | | |
| Number of Leases | | | 86 | | | | 52 | | | | 70 | | | | 85 | | | | | 293 | | | | 293 | | | | 221 | |
| Square Feet | | | 498,128 | | | | 174,092 | | | | 747,860 | | | | 359,499 | | | | | 1,779,579 | | | | 1,775,040 | | | | 1,839,708 | |
Tenant Improvement Costs per Square Foot (4) | | $ | 22.12 | | | $ | 10.73 | | | $ | 46.72 | | | $ | 22.94 | | | | $ | 31.51 | | | $ | 17.33 | | | $ | 24.64 | |
Leasing Commission Costs per Square Foot | | $ | 6.15 | | | $ | 4.37 | | | $ | 11.74 | | | $ | 6.53 | | | | $ | 8.40 | | | $ | 5.84 | | | $ | 7.16 | |
Total Tenant Improvements and Leasing Commissions | | | | | | | | | | | | | | | | | | | | | | | | | | | | | |
| Costs per Square Foot | | $ | 28.27 | | | $ | 15.10 | | | $ | 58.46 | | | $ | 29.47 | | | | $ | 39.91 | | | $ | 23.17 | | | $ | 31.80 | |
| Costs per Square Foot per Year | | $ | 5.89 | | | $ | 4.03 | | | $ | 5.69 | | | $ | 5.41 | | | | $ | 5.60 | | | $ | 4.28 | | | $ | 4.55 | |
__________
| (1) | Based on leases executed during the period. Excludes leases to related parties, short-term leases of less than six months, and leases for raw space. |
| (2) | Tenant improvements and leasing commission information for 2008 and 2007 reflects 100% of the consolidated portfolio and 20% of the MMO joint venture properties. Information for 2006 reflects 100% of the consolidated portfolio and 100% of the MMO joint venture properties. |
| (3) | Does not include retained tenants that have relocated to new space or expanded into new space. |
| (4) | Tenant improvements include improvements and lease concessions. |
| (5) | Includes retained tenants that have relocated or expanded into new space and lease modifications. |
Maguire Properties, Inc.
Supplemental Operating and Financial Data
Fourth Quarter 2008
| | | For the Three Months Ended | | | | For the Year Ended December 31, | |
| | | December 31, 2008 | | | September 30, 2008 | | | June 30, 2008 | | | March 31, 2008 | | | | 2008 | | | 2007 | | | 2006 | |
| | | | | | | | | | | | | | | | | | | | | | | |
| Consolidated | | | | | | | | | | | | | | | | | | | | | | |
Non-recoverable capital expenditures (2), (3) | | $ | 620,399 | | | $ | 2,958,753 | | | $ | 2,522,826 | | | $ | 4,469,765 | | | | $ | 10,571,743 | | | $ | 11,326,800 | | | $ | 2,454,126 | |
| Total square feet | | | 15,498,637 | | | | 15,495,673 | | | | 16,080,783 | | | | 16,054,577 | | | | | 15,498,637 | | | | 16,051,311 | | | | 11,625,028 | |
Non-recoverable capital expenditures per square foot | | $ | 0.04 | | | $ | 0.19 | | | $ | 0.16 | | | $ | 0.28 | | | | $ | 0.68 | | | $ | 0.71 | | | $ | 0.21 | |
| Unconsolidated | | | | | | | | | | | | | | | | | | | | | | | | | | | | | |
| Non-recoverable capital expenditures (4) | | $ | 22,177 | | | $ | 87,288 | | | $ | 83,172 | | | $ | 28,309 | | | | $ | 220,946 | | | $ | 50,406 | | | $ | 153,069 | |
Total square feet (5) | | | 635,670 | | | | 635,670 | | | | 635,581 | | | | 635,556 | | | | | 635,670 | | | | 624,674 | | | | 622,561 | |
Non-recoverable capital expenditures per square foot | | $ | 0.03 | | | $ | 0.14 | | | $ | 0.13 | | | $ | 0.04 | | | | $ | 0.35 | | | $ | 0.08 | | | $ | 0.25 | |
| | | | | | | | | | | | | | | | | | | | | | | | | | | | | | |
| Consolidated | | | | | | | | | | | | | | | | | | | | | | | | | | | | | |
| Recoverable capital expenditures (6) | | $ | 704,188 | | | $ | 145,145 | | | $ | 56,406 | | | $ | 291,527 | | | | $ | 1,197,266 | | | $ | 2,857,483 | | | $ | 1,329,624 | |
| Total square feet | | | 15,498,637 | | | | 15,495,673 | | | | 16,080,783 | | | | 16,054,577 | | | | | 15,498,637 | | | | 16,051,311 | | | | 11,625,028 | |
Recoverable capital expenditures per square foot | | $ | 0.05 | | | $ | 0.01 | | | $ | – | | | $ | 0.02 | | | | $ | 0.08 | | | $ | 0.18 | | | $ | 0.11 | |
| Unconsolidated | | | | | | | | | | | | | | | | | | | | | | | | | | | | | |
| Recoverable capital expenditures (4), (6) | | $ | 30,524 | | | $ | – | | | $ | – | | | $ | – | | | | $ | 30,524 | | | $ | 5,779 | | | $ | 122,149 | |
| Total square feet (5) | | | 635,670 | | | | 635,670 | | | | 635,581 | | | | 635,556 | | | | | 635,670 | | | | 624,674 | | | | 622,561 | |
Recoverable capital expenditures per square foot | | $ | 0.05 | | | $ | – | | | $ | – | | | $ | – | | | | $ | 0.05 | | | $ | 0.01 | | | $ | 0.20 | |
__________ | (1) | Historical capital expenditures for each period shown reflect properties owned for the entire period. For properties acquired during each period, the capital expenditures will be reflected in the following full period of ownership. For properties sold during each period, the capital expenditures will be excluded for that period. Any capital expenditures incurred during the period of acquisition or disposition will be footnoted separately. |
| (2) | Excludes approximately $2.8 million of non-recoverable capital expenditures for the three months ended June 30, 2008 as a result of discretionary renovation costs at KPMG Tower. Excludes approximately $3.6 million of non-recoverable capital expenditures for the three months ended March 31, 2008 as a result of discretionary renovation costs totaling $3.3 million at KPMG Tower and $0.3 million of planned renovation costs at Lantana Media Campus. |
| (3) | Excludes approximately $3.8 million of non-recoverable capital expenditures for 2007 as a result of discretionary renovation costs of $1.9 million at KPMG Tower and $1.9 million of planned renovation costs at Lantana Media Campus. For 2006, excludes $0.5 million of non-recoverable capital expenditures incurred at acquired properties following their acquisition. |
| (4) | Amount represents our 20% ownership interest in our joint venture with Macquarie Office Trust. |
| (5) | The square footages of Cerritos Corporate Center Phases I and II and a portion of the Quintana Campus are deducted from the total square feet amount as the tenants pay for all capital expenditures. |
| (6) | Recoverable capital improvements, such as equipment upgrades, are generally financed through capital leases. The annual amortization, based on each asset’s useful life, as well as any financing costs, are generally billed to tenants on an annual basis as payments are made. The amounts presented represent the total value of the improvements in the year they are made. |
Maguire Properties, Inc.
Supplemental Operating and Financial Data
Fourth Quarter 2008
| | | For the Three Months Ended December 31, | | | For the Year Ended December 31, | |
| | | | | | | | | Percent | | | | | | | |
| Westin Hotel, Pasadena, CA | | 2008 | | | 2007 | | | Change | | | 2008 | | | 2007 | |
| | | | | | | | | | | | | | | | |
| Occupancy | | | 71.1 | % | | | 79.9 | % | | | (11.0 | )% | | | 79.2 | % | | | 80.2 | % |
| | | | | | | | | | | | | | | | | | | | | |
| Average daily rate | | $ | 185.28 | | | $ | 177.25 | | | | 4.5 | % | | $ | 178.47 | | | $ | 173.78 | |
| | | | | | | | | | | | | | | | | | | | | |
| Revenue per available room (REVPAR) | | $ | 131.75 | | | $ | 141.59 | | | | (6.9 | )% | | $ | 141.37 | | | $ | 139.38 | |
| | | | | | | | | | | | | | | | | | | | | |
| Hotel net operating income | | $ | 2,426,398 | | | $ | 2,621,864 | | | | (7.5 | )% | | $ | 9,510,547 | | | $ | 9,708,924 | |
| | | | | | | | | | | | | | | | | | | | | |
| | | | | | | | | | | | | | | | | | | | | |
| Hotel Historical Capital Expenditures |
| | | | | | | | | | | | | | | | | | | | | |
| | | | | | | | | | | | | | | | | | | | | |
| | | For the Three Months Ended December 31, | | | For the Year Ended December 31, | |
| Westin Hotel, Pasadena, CA | | 2008 | | | 2007 | | | 2008 | | | 2007 | | | 2006 | |
| | | | | | | | | | | | | | | | | | | | | |
| Hotel improvements and equipment replacements | | $ | 290,323 | | | $ | 172,373 | | | $ | 699,531 | | | $ | 712,955 | | | $ | 730,531 | |
| | | | | | | | | | | | | | | | | | | | | |
| Total hotel revenue | | $ | 6,448,044 | | | $ | 7,259,541 | | | $ | 26,615,726 | | | $ | 27,214,156 | | | $ | 27,053,648 | |
| | | | | | | | | | | | | | | | | | | | | |
| Hotel improvements as a percentage of hotel revenue | | | 4.5 | % | | | 2.4 | % | | | 2.6 | % | | | 2.6 | % | | | 2.7 | % |
| | | | | | | | | | | | | | | | | | | | | |
| Renovation and upgrade costs | | $ | – | | | $ | – | | | $ | – | | | $ | – | | | $ | 164,072 | |