Exhibit 99.2
Maguire Properties, Inc.
Supplemental Operating and Financial Data
Second Quarter 2009
| | PAGE |
| Corporate Data | 1 |
| | | 2 |
| | | 4 |
| | | 6 |
| Consolidated Financial Results | 7 |
| | | 8 |
| | | 10 |
| | | 11 |
| | | 12 |
| | | 13 |
| | | 14 |
| | | 15 |
| | | 16 |
| | | 17 |
| | | 18 |
| | | 20 |
| | | 21 |
| | | 22 |
| Portfolio Data | 23 |
| | | 24 |
| | | 25 |
| | | 29 |
| | | 30 |
| | | 31 |
| | | 32 |
| | | 33 |
| | | 34 |
| | | 35 |
| | | 36 |
| | | 37 |
| | | 38 |
| | | 39 |
| | | 40 |
| | | 41 |
| | | 42 |
| | | 43 |
| | | 44 |
| | | 46 |
This supplemental package contains “forward-looking statements” within the meaning of the Private Securities Litigation Reform Act of 1995. We caution investors that any forward-looking statements presented herein are based on management’s beliefs and assumptions made by, and information currently available to management. Such statements are subject to risks, uncertainties and assumptions and may be affected by known and unknown risks, trends, uncertainties and factors that are beyond our control. Should one or more of these risks or uncertainties materialize or should underlying assumptions prove incorrect, actual results may vary materially from those anticipated, estimated or projected. These factors include, without limitation: general risks affecting the real estate industry (including, without limitation, the inability to enter into or renew leases at favorable rates, dependence on tenants’ financial condition, and competition from other developers, owners and operators of real estate); risks associated with the availability and terms of financing and the use of debt to fund acquisitions and developments; risks associated with our ability to dispose of properties, if and when we decide to do so, at prices or terms set by or acceptable to us; risks associated with the potential failure to effectively manage our growth and expansion into new markets, to identify properties to acquire, to complete acquisitions or to integrate acquisitions successfully; risks and uncertainties affecting property development and construction; risks associated with downturns in the national and local economies, increases in interest rates, volatility in the securities markets, and contraction in the credit markets affecting our ability to refinance existing loans as they come due; risks associated with joint ventures; potential liability for uninsured losses and environmental contamination; risks associated with our potential failure to qualify as a REIT under the Internal Revenue Code of 1986, as amended, and possible adverse changes in tax and environmental laws; and risks associated with our dependence on key personnel whose continued service is not guaranteed.
Maguire Properties, Inc.
Supplemental Operating and Financial Data
Second Quarter 2009
Corporate Data
Maguire Properties, Inc.
Supplemental Operating and Financial Data
Second Quarter 2009
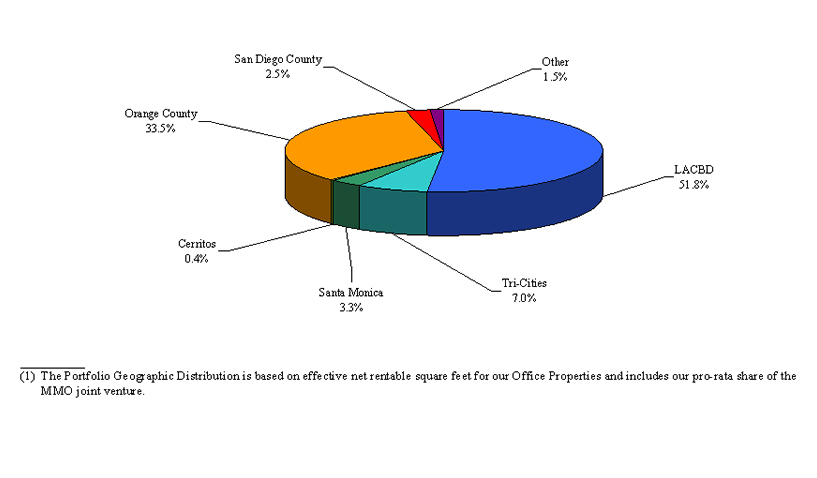
Maguire Properties, Inc. (the “Company”), a self-administered and self-managed real estate investment trust, is the largest owner and operator of Class A office properties in the Los Angeles central business district and is primarily focused on owning and operating high-quality office properties in the Southern California market. We are a full-service real estate company with substantial in-house expertise and resources in property management, marketing, leasing, acquisitions, development and financing.
As of June 30, 2009, our office portfolio was comprised of whole or partial interests in 33 properties totaling approximately 19 million net rentable square feet, one 350-room hotel with 266,000 square feet, and on- and off-site structured parking plus surface parking totaling approximately 12 million square feet, which accommodates almost 41,000 vehicles. We have one project under development that totals approximately 189,000 square feet of office space. We also own undeveloped land that we believe can support up to approximately 8 million square feet of office, hotel, retail and residential development and approximately 8 million square feet of structured parking.
This Supplemental Operating and Financial Data package should be read in conjunction with our consolidated financial statements for the year ended December 31, 2008 in our Annual Report on Form 10-K/A filed with the Securities and Exchange Commission (SEC) on April 30, 2009 and our consolidated financial statements for the six months ended June 30, 2009 in our Quarterly Report on Form 10-Q filed with the SEC on August 10, 2009. For more information on Maguire Properties, visit our website at www.maguireproperties.com.
Debt:
During the second quarter, we extended the maturity date of our Lantana Media Campus construction loan to September 30, 2009. We have the option to extend the maturity date of this loan to June 13, 2010, subject to certain conditions.
During June 2009, we reached an agreement with our counterparty to terminate a forward-starting interest rate swap on the Lantana construction loan for $11.3 million.
Subsequent to quarter end, we entered into loan modifications to amend the financial covenants of our Plaza Las Fuentes mortgage and Lantana Media Campus construction loan effective as of June 30, 2009. We made certain principal paydowns and agreed to other changes to the loan agreements, as described in our Quarterly Report on Form 10-Q for the quarter ended June 30, 2009.
As of June 30, 2009, approximately 89% of our outstanding debt is fixed (or swapped to a fixed rate) at a weighted average interest rate of approximately 5.7% with a weighted average remaining term of approximately six years. | | Asset Disposition Program:
During the three months ended June 30, 2009, we conducted an evaluation of our portfolio, with a focus on our financial position and core assets. As a result of this evaluation, our board of directors has approved management’s plan to cease funding cash shortfalls at (and ultimately dispose of) the following non-core assets: (1) Stadium Towers Plaza in Central Orange County, California, (2) Park Place I in Irvine, California, (3) Park Place II in Irvine, California, (4) 2600 Michelson in Irvine, California, (5) Pacific Arts Plaza in Costa Mesa, California, (6) 550 South Hope in Los Angeles, California and (7) 500 Orange Tower in Central Orange County, California. We have been in contact with the lenders or master servicers (with respect to CMBS and/or securitized loans) and expect to be in contact with the special servicers (where applicable) in the near future to work cooperatively to achieve a favorable result for all parties. We have apprised these lenders or master servicers that our special purpose property-owning subsidiaries that are parties to the loans encumbering the above properties may no longer continue to fund cash shortfalls and may stop making monthly debt service payments under such loans. In addition, two of our special purpose property-owning subsidiaries that own two of the above properties are currently in default for their failure to make debt service payments on the non-recourse mortgage loans associated with such properties. On August 1, 2009, our special purpose property-owning subsidiary that owns the Park Place I property did not make the debt service payment due under its loan. On August 6, 2009, our special purpose property-owning subsidiary that owns the 550 South Hope property did not make the debt service payment due under its loan. |
Maguire Properties, Inc.
Supplemental Operating and Financial Data
Second Quarter 2009
Asset Disposition Program (continued):
On June 2, 2009, we announced we had completed the disposition of City Parkway located in Orange, California. We received no proceeds in connection with the disposition. We have no further obligations with respect to the property-level debt and have eliminated a master lease obligation on the property.
On June 15, 2009, we announced we had completed the disposition of 3161 Michelson located at the Park Place campus in Irvine, California. The transaction was valued at $160.0 million, prior to $6.6 million in credits provided to the buyer. We received proceeds from the transaction of approximately $152 million, net of transaction costs. The net proceeds from this transaction, combined with approximately $6.5 million of unrestricted cash and approximately $5.0 million of restricted cash for leasing and debt service released to us by the lender, were used to repay the $163.5 million outstanding balance under the construction loan on the property. We have no further obligations with respect to the construction loan as well as the New Century master lease and parking master lease. Additionally, our Operating Partnership has no further obligation to guarantee the repayment of the construction loan.
On August 6, 2009, we entered into a deed in lieu of foreclosure with the lender to dispose of Park Place I. Additionally, we have entered into an agreement to sell certain parking areas with related development rights under which we have received an non-refundable deposit.
Impairment:
During the three months ended June 30, 2009, we recorded a non-cash impairment charge totaling $384.7 million, of which $344.6 million has been recorded in continuing operations and $40.1 million in discontinued operations.
Of the $344.6 million impairment charge recorded in continuing operations, $336.4 million was the result of an analysis as of June 30, 2009 of our properties that showed indications of potential impairment. Based on this analysis, we recorded an impairment charge to reduce the seven non-core assets identified for disposition: Stadium Towers Plaza, Park Place I, Park Place II, 2600 Michelson, Pacific Arts Plaza, 550 South Hope, 500 Orange Tower and any adjacent parking areas and development sites to the lower of carrying value or fair value. We estimated fair value using recent comparable market transactions and unsolicited offers received from third parties. The remaining $8.2 million represents the writeoff of assets related to our investment in DH Von Karman Maguire, LLC. | | The $40.1 million charge recorded in discontinued operations is in connection with the disposition of City Parkway pursuant to a cooperative agreement reached with an unsolicited buyer during the second quarter of 2009 for the assumption of the debt encumbering the property, which approximated fair value.
Leasing Activities:
During the second quarter, new leases and renewals were executed for approximately 0.5 million square feet (including our pro rata share of our joint venture properties). Cash rent on new leases completed during the quarter decreased 9% in our Effective Portfolio, compared to cash rents on those spaces immediately prior to their expiration, and GAAP rent increased 4% compared to prior GAAP rents. Leases totaling approximately 0.6 million square feet expired during the second quarter (including our pro rata share of our joint venture properties).
Development Activities:
Construction activities are 100% complete at 207 Goode as of the end of second quarter of 2009, and we expect to receive a certificate of occupancy in the third quarter of 2009. 207 Goode is an eight-story, 189,000 square foot office building located in Glendale, California. |
3
Maguire Properties, Inc.
Supplemental Operating and Financial Data
Second Quarter 2009
| 355 South Grand Avenue, Suite 3300 |
| Los Angeles, CA 90071 |
| Tel. (213) 626-3300 |
| Fax (213) 687-4758 |
| Nelson C. Rising | President and Chief Executive Officer | Jonathan L. Abrams | Senior Vice President, General Counsel and Secretary |
| Mark T. Lammas | Executive Vice President, Investments | Ted J. Bischak | Senior Vice President, Asset Management |
| Shant Koumriqian | Executive Vice President, Chief Financial Officer | Robert P. Goodwin | Senior Vice President, Construction and Development |
| Peggy M. Moretti | Senior Vice President, Investor and Public Relations | Peter K. Johnston | Senior Vice President, Leasing |
| | & Chief Administrative Officer | Christopher C. Rising | Senior Vice President, Strategic Initiatives |
| Investor Relations Contact: Peggy M. Moretti at (213) 613-4558 |
Please visit our corporate website at: www.maguireproperties.com |
| Transfer Agent | | Timing |
American Stock Transfer & Trust Company 59 Maiden Lane New York, NY 10038 (718) 921-8201 www.amstock.com | | Quarterly results for 2009 will be announced according to the following schedule: |
| | Third Quarter | |
| | Fourth Quarter | |
| | | |
| | | |
Maguire Properties, Inc.
Supplemental Operating and Financial Data
Second Quarter 2009
Investor Information (continued)
| | Citigroup Global Markets Inc. | Michael Bilerman | (212) 816-1383 |
| | Credit Suisse | Steven Benyik | (212) 538-0239 |
| | Deutsche Bank Securities, Inc. | Vincent Chao | (212) 250-6799 |
| | Friedman, Billings, Ramsey & Co., Inc. | Wilkes J. Graham | (703) 312-9737 |
| | Goldman Sachs & Co. | Jay Haberman | (917) 343-4260 |
| | Green Street Advisors | Michael Knott | (949) 640-8780 |
| | KeyBanc Capital Markets | Jordan Sadler | (917) 368-2280 |
| | Raymond James Associates | Paul Puryear | (727) 567-2253 |
| | RBC Capital Markets | Dave Rodgers | (440) 715-2647 |
| | Robert W. Baird & Company | David Aubuchon | (314) 863-4235 |
| | Stifel, Nicolaus & Co., Inc. | John Guinee | (443) 224-1307 |
Maguire Properties, Inc. is currently followed by the sell-side analysts listed above, with the exception of Green Street Advisors, which is an independent research firm. This list may not be complete and is subject to change as firms add or delete coverage of our company. Please note that any opinions, estimates or forecasts regarding our historical or predicted performance made by these analysts are theirs alone and do not represent opinions, forecasts or predictions of Maguire Properties, Inc. or its management. We are providing this listing as a service to our stockholders and do not by listing these firms imply our endorsement of or concurrence with such information, conclusions or recommendations. Interested persons may obtain copies of analysts’ reports on their own; we do not distribute these reports. Various of these firms may from time-to-time own our stock and/or hold other long or short positions in our stock, and may provide compensated services to us.
Maguire Properties, Inc.
Supplemental Operating and Financial Data
Second Quarter 2009
Our common stock is traded on the New York Stock Exchange under the symbol MPG. Selected information about our common stock for the past five quarters (based on NYSE prices) is as follows: |
| | | 2009 | | | 2008 | |
| | | 2nd Quarter | | | 1st Quarter | | | 4th Quarter | | | 3rd Quarter | | | 2nd Quarter | |
| High price | | $ | 2.05 | | | $ | 3.12 | | | $ | 6.79 | | | $ | 16.32 | | | $ | 17.65 | |
| Low price | | $ | 0.66 | | | $ | 0.33 | | | $ | 1.03 | | | $ | 4.75 | | | $ | 11.83 | |
| Closing price | | $ | 0.85 | | | $ | 0.72 | | | $ | 1.46 | | | $ | 5.96 | | | $ | 12.17 | |
| Dividends per share - annualized | | $ | – | | | $ | – | | | $ | – | | | $ | – | | | $ | – | |
| Closing dividend yield - annualized | | | (1) | | | | (1) | | | | (1) | | | | (1) | | | | (1) | |
Closing common shares and Operating Partnership units outstanding (in thousands) | | | 54,642 | | | | 54,656 | | | | 54,650 | | | | 54,559 | | | | 54,655 | |
Closing market value of common shares and Operating Partnership units outstanding (in thousands) | | $ | 46,446 | | | $ | 39,352 | | | $ | 79,788 | | | $ | 325,173 | | | $ | 665,152 | |
| | | | | | | | | | | | | | | | | | | | | |
| Dividend Information: | | | | | | | | | | | | | | | | | | | | |
| | | | | | | | | | | | | | | | | | | | | |
| Common Stock | | | | | | | | | | | | | | | | | | | | |
| Dividend amount per share | | | (1) | | | | (1 | ) | | | (1) | | | | (1) | | | | (1) | |
| Declaration date | | | | | | | | | | | | | | | | | | | | |
| Record date | | | | | | | | | | | | | | | | | | | | |
| Payment date | | | | | | | | | | | | | | | | | | | | |
| | | | | | | | | | | | | | | | | | | | | |
| Series A Preferred Stock | | | | | | | | | | | | | | | | | | | | |
| Dividend amount per share | | | (2) | | | | (2) | | | | (2) | | | $ | 0.4766 | | | $ | 0.4766 | |
| Declaration date | | | | | | | | | | | | | | September 18, 2008 | | | June 24, 2008 | |
| Record date | | | | | | | | | | | | | | October 10, 2008 | | | July 11, 2008 | |
| Payment date | | | | | | | | | | | | | | October 31, 2008 | | | July 31, 2008 | |
__________
| (1) | The Board of Directors did not declare a dividend on our common stock for the quarters ended June 30 and March 31, 2009 and December 31, September 30 and June 30, 2008. There can be no assurance that we will make distributions on our common stock at historical levels or at all. |
| (2) | The Board of Directors did not declare a dividend on our Series A Preferred Stock during the three months ended July 31, April 30 and January 31, 2009. Dividends on our Series A Preferred Stock are cumulative, and therefore, will continue to accrue at an annual rate of $1.9064 per share. |
Maguire Properties, Inc.
Supplemental Operating and Financial Data
Second Quarter 2009
Consolidated Financial Results
Maguire Properties, Inc.
Supplemental Operating and Financial Data
Second Quarter 2009
(unaudited and in thousands, except share, per share, percentage and ratio amounts)
| | | For the Three Months Ended |
| | | June 30, 2009 | | March 31, 2009 | | December 31, 2008 | | September 30, 2008 | | June 30, 2008 |
| Income Items: | | | | | | | | | | | | | | | |
| Revenue (1) | | $ | 134,776 | | | $ | 132,069 | | | $ | 136,101 | | | $ | 132,109 | | | $ | 134,528 | |
| Straight line rent | | | 4,382 | | | | 3,565 | | | | 2,959 | | | | 3,941 | | | | 3,804 | |
| Fair value lease revenue (2) | | | 5,774 | | | | 4,753 | | | | 5,332 | | | | 5,619 | | | | 6,674 | |
| Lease termination fees | | | 1,152 | | | | 81 | | | | 590 | | | | 13 | | | | 86 | |
| Office property operating margin (3) | | | 61.4 | % | | | 62.1 | % | | | 60.5 | % | | | 60.9 | % | | | 61.9 | % |
| | | | | | | | | | | | | | | | | | | | | |
| Net loss available to common stockholders | | $ | (380,450 | ) | | $ | (53,890 | ) | | $ | (96,305 | ) | | $ | (72,524 | ) | | $ | (110,628 | ) |
| Net loss available to common stockholders - basic and diluted | | | (7.95 | ) | | | (1.13 | ) | | | (2.02 | ) | | | (1.52 | ) | | | (2.32 | ) |
| | | | | | | | | | | | | | | | | | | | | |
| Funds from operations (FFO) available to common stockholders (4) | | $ | (339,712 | ) | | $ | (30,786 | ) | | $ | (42,180 | ) | | $ | (20,158 | ) | | $ | (56,383 | ) |
| FFO per share - basic (4) | | | (7.10 | ) | | | (0.64 | ) | | | (0.88 | ) | | | (0.42 | ) | | | (1.18 | ) |
| FFO per share - diluted (4) | | | (7.10 | ) | | | (0.64 | ) | | | (0.88 | ) | | | (0.42 | ) | | | (1.18 | ) |
| FFO per share before specified items - basic (4) | | | 0.08 | | | | 0.07 | | | | 0.04 | | | | 0.04 | | | | 0.10 | |
| FFO per share before specified items - diluted (4) | | | 0.08 | | | | 0.07 | | | | 0.04 | | | | 0.04 | | | | 0.09 | |
| | | | | | | | | | | | | | | | | | | | | |
| Dividends declared per common share | | $ | – | | | $ | – | | | $ | – | | | $ | – | | | $ | – | |
| Dividends declared per preferred share (5) | | | – | | | | – | | | | – | | | | 0.4766 | | | | 0.4766 | |
| | | | | | | | | | | | | | | | | | | | | |
| Ratios: | | | | | | | | | | | | | | | | | | | | |
| Interest coverage ratio (6) | | | (4.66 | ) | | | 1.11 | | | | 0.40 | | | | 0.70 | | | | 0.14 | |
| Interest coverage ratio before specified items (7) | | | 1.14 | | | | 1.13 | | | | 1.08 | | | | 1.05 | | | | 1.08 | |
| Fixed-charge coverage ratio (8) | | | (4.29 | ) | | | 1.02 | | | | 0.37 | | | | 0.65 | | | | 0.13 | |
| Fixed-charge coverage ratio before specified items (9) | | | 1.05 | | | | 1.04 | | | | 1.00 | | | | 0.97 | | | | 1.00 | |
| | | | | | | | | | | | | | | | | | | | | |
| Capitalization: | | | | | | | | | | | | | | | | | | | | |
| Common stock price @ quarter end | | $ | 0.85 | | | $ | 0.72 | | | $ | 1.46 | | | $ | 5.96 | | | $ | 12.17 | |
| | | | | | | | | | | | | | | | | | | | | |
| Total consolidated debt | | $ | 4,600,771 | | | $ | 4,869,916 | | | $ | 4,882,809 | | | $ | 4,874,471 | | | $ | 5,052,546 | |
| Preferred stock liquidation preference | | | 250,000 | | | | 250,000 | | | | 250,000 | | | | 250,000 | | | | 250,000 | |
| Common equity value @ quarter end (10) | | | 46,446 | | | | 39,352 | | | | 79,788 | | | | 325,173 | | | | 665,152 | |
| Total consolidated market capitalization | | $ | 4,897,217 | | | $ | 5,159,268 | | | $ | 5,212,597 | | | $ | 5,449,644 | | | $ | 5,967,698 | |
| | | | | | | | | | | | | | | | | | | | | |
| Company share of MMO joint venture debt | | | 161,123 | | | | 161,268 | | | | 161,420 | | | | 161,566 | | | | 161,707 | |
| Total combined market capitalization | | $ | 5,058,340 | | | $ | 5,320,536 | | | $ | 5,374,017 | | | $ | 5,611,210 | | | $ | 6,129,405 | |
| | | | | | | | | | | | | | | | | | | | | |
| Total consolidated debt / total consolidated market capitalization | | | 93.9 | % | | | 94.4 | % | | | 93.7 | % | | | 89.4 | % | | | 84.7 | % |
| Total combined debt / total combined market capitalization | | | 94.1 | % | | | 94.6 | % | | | 93.9 | % | | | 89.7 | % | | | 85.1 | % |
Total consolidated debt plus liquidation preference / total consolidated market capitalization | | | 99.1 | % | | | 99.2 | % | | | 98.5 | % | | | 94.0 | % | | | 88.9 | % |
Total combined debt plus liquidation preference / total combined market capitalization | | | 99.1 | % | | | 99.3 | % | | | 98.5 | % | | | 94.2 | % | | | 89.1 | % |
Maguire Properties, Inc.
Supplemental Operating and Financial Data
Second Quarter 2009
(unaudited and in thousands, except share, per share, percentage and ratio amounts)
__________
| (1) | Excludes revenue from discontinued operations of approximately $3 million, $4 million, $4 million, $7 million and $9 million for the three months ended June 30 and March 31, 2009 and December 31, September 30 and June 30, 2008, respectively. |
| (2) | Represents the net adjustment for above- and below-market leases, which are being amortized over the remaining term of the respective leases from the date of acquisition. |
| (3) | Calculated as follows: (rental, tenant reimbursement and parking revenues - rental property operating and maintenance, real estate taxes and parking expenses) / (rental, tenant reimbursement and parking revenues). Lease termination fees are reported as part of interest and other revenue in the consolidated statements of operations. |
| (4) | For a definition and discussion of FFO, see page 46. For a quantitative reconciliation of the differences between FFO and net income, see page 14. |
| (5) | Preferred dividends were declared for the three months ended October 31 and July 31, 2008, respectively. |
| (6) | Calculated as earnings before interest, taxes and depreciation and amortization and preferred dividends, or EBITDA, of $(317,416), $76,027, $28,970, $51,839 and $10,806, respectively, divided by cash paid for interest of $68,159, $68,288, $73,055, $73,547 and $74,570, respectively. For a discussion of EBITDA, see page 48. For a quantitative reconciliation of the differences between EBITDA and net income, see page 16. |
| (7) | Calculated as Adjusted EBITDA of $77,684, $77,218, $78,970, $76,899 and $80,194, respectively, divided by cash paid for interest of $68,159, $68,288, $73,055, $73,547 and $74,570, respectively. For a discussion of Adjusted EBITDA, see page 48. |
| (8) | Calculated as EBITDA of $(317,416), $76,027, $28,970, $51,839 and $10,806, respectively, divided by fixed charges of $74,033, $74,371, $79,166, $79,342 and $80,150, respectively. |
| (9) | Calculated as Adjusted EBITDA of $77,684, $77,218, $78,970, $76,899 and $80,194, respectively, divided by fixed charges of $74,033, $74,371, $79,166, $79,342 and $80,150, respectively. |
| (10) | Assumes 100% conversion of the limited partnership units in the Operating Partnership into shares of our common stock. Our limited partners have the right to redeem all or part of their Operating Partnership units at any time. At the time of redemption, we have the right to determine whether to redeem the Operating Partnership units for cash, based upon the fair market value of an equivalent number of shares of our common stock at the time of redemption, or exchange them for shares of our common stock on a one-for-one basis, subject to adjustment in the event of stock splits, stock dividends, issuance of stock rights, specified extraordinary distribution and similar events. |
Maguire Properties, Inc.
Supplemental Operating and Financial Data
Second Quarter 2009
(unaudited and in thousands)
| | | June 30, 2009 | | | March 31, 2009 | | | December 31, 2008 | | | September 30, 2008 | | | June 30, 2008 | |
| | | | | | | | | | | | | | | | |
| Assets | | | | | | | | | | | | | | | |
| Investments in real estate | | $ | 4,559,872 | | | $ | 5,024,534 | | | $ | 5,026,688 | | | $ | 5,219,538 | | | $ | 5,492,942 | |
| Less: accumulated depreciation | | | (666,092 | ) | | | (638,343 | ) | | | (604,302 | ) | | | (576,329 | ) | | | (552,300 | ) |
| | | | 3,893,780 | | | | 4,386,191 | | | | 4,422,386 | | | | 4,643,209 | | | | 4,940,642 | |
| | | | | | | | | | | | | | | | | | | | | |
| Cash, cash equivalents and restricted cash | | | 223,223 | | | | 256,558 | | | | 280,166 | | | | 351,246 | | | | 308,382 | |
| Rents, deferred rents and other receivables, net | | | 84,206 | | | | 82,024 | | | | 78,938 | | | | 78,242 | | | | 80,084 | |
| Deferred charges, net | | | 165,696 | | | | 176,916 | | | | 184,156 | | | | 193,384 | | | | 207,202 | |
| Other assets | | | 25,396 | | | | 43,601 | | | | 39,166 | | | | 43,632 | | | | 40,978 | |
| Investment in unconsolidated joint ventures | | | – | | | | 9,428 | | | | 11,606 | | | | 13,326 | | | | 14,886 | |
| Assets associated with real estate held for sale | | | – | | | | 161,668 | | | | 182,597 | | | | – | | | | – | |
| Total assets | | $ | 4,392,301 | | | $ | 5,116,386 | | | $ | 5,199,015 | | | $ | 5,323,039 | | | $ | 5,592,174 | |
| | | | | | | | | | | | | | | | | | | | | |
| Liabilities and Deficit | | | | | | | | | | | | | | | | | | | | |
| Liabilities: | | | | | | | | | | | | | | | | | | | | |
| Mortgage and other secured loans | | $ | 4,600,771 | | | $ | 4,704,696 | | | $ | 4,714,090 | | | $ | 4,874,471 | | | $ | 5,052,546 | |
| Dividends and distributions payable | | | – | | | | – | | | | – | | | | 3,177 | | | | 3,177 | |
| Accounts payable, accrued interest payable and other liabilities | | | 174,467 | | | | 194,062 | | | | 221,066 | | | | 214,119 | | | | 212,558 | |
| Acquired below-market leases, net | | | 91,015 | | | | 104,359 | | | | 112,173 | | | | 119,895 | | | | 135,268 | |
| Obligations associated with real estate held for sale | | | – | | | | 169,929 | | | | 171,348 | | | | – | | | | – | |
| Total liabilities | | | 4,866,253 | | | | 5,173,046 | | | | 5,218,677 | | | | 5,211,662 | | | | 5,403,549 | |
| | | | | | | | | | | | | | | | | | | | | |
| Deficit: | | | | | | | | | | | | | | | | | | | | |
| Stockholders' Deficit: | | | | | | | | | | | | | | | | | | | | |
| Common and preferred stock and additional paid-in capital | | | 699,931 | | | | 698,377 | | | | 696,840 | | | | 695,361 | | | | 695,206 | |
| Accumulated deficit and dividends | | | (1,082,577 | ) | | | (705,730 | ) | | | (656,606 | ) | | | (563,478 | ) | | | (490,954 | ) |
| Accumulated other comprehensive loss, net | | | (35,451 | ) | | | (44,020 | ) | | | (59,896 | ) | | | (20,506 | ) | | | (15,627 | ) |
| Total stockholders' deficit | | | (418,097 | ) | | | (51,373 | ) | | | (19,662 | ) | | | 111,377 | | | | 188,625 | |
| Noncontrolling Interests: | | | | | | | | | | | | | | | | | | | | |
| Common units of our Operating Partnership | | | (55,855 | ) | | | (5,287 | ) | | | – | | | | – | | | | – | |
| Total deficit | | | (473,952 | ) | | | (56,660 | ) | | | (19,662 | ) | | | 111,377 | | | | 188,625 | |
| Total liabilities and deficit | | $ | 4,392,301 | | | $ | 5,116,386 | | | $ | 5,199,015 | | | $ | 5,323,039 | | | $ | 5,592,174 | |
Maguire Properties, Inc.
Supplemental Operating and Financial Data
Second Quarter 2009
(unaudited and in thousands, except share and per share data)
| | | For the Three Months Ended | |
| | | June 30, 2009 | | | March 31, 2009 | | | December 31, 2008 | | | September 30, 2008 | | | June 30, 2008 | |
| Revenue: | | | | | | | | | | | | | | | |
| Rental | | $ | 86,240 | | | $ | 82,982 | | | $ | 82,909 | | | $ | 81,452 | | | $ | 83,238 | |
| Tenant reimbursements | | | 26,537 | | | | 27,827 | | | | 29,771 | | | | 27,802 | | | | 26,000 | |
| Hotel operations | | | 5,148 | | | | 4,994 | | | | 6,448 | | | | 6,301 | | | | 6,986 | |
| Parking | | | 12,711 | | | | 13,083 | | | | 13,355 | | | | 12,893 | | | | 13,239 | |
| Management, leasing and development services | | | 1,747 | | | | 2,030 | | | | 1,305 | | | | 1,518 | | | | 1,857 | |
| Interest and other | | | 2,393 | | | | 1,153 | | | | 2,313 | | | | 2,143 | | | | 3,208 | |
| Total revenue | | | 134,776 | | | | 132,069 | | | | 136,101 | | | | 132,109 | | | | 134,528 | |
| | | | | | | | | | | | | | | | | | | | | |
| Expenses: | | | | | | | | | | | | | | | | | | | | |
| Rental property operating and maintenance | | | 31,739 | | | | 30,230 | | | | 32,744 | | | | 31,602 | | | | 30,081 | |
| Hotel operating and maintenance | | | 3,481 | | | | 3,449 | | | | 4,021 | | | | 4,102 | | | | 4,567 | |
| Real estate taxes | | | 12,885 | | | | 12,681 | | | | 12,813 | | | | 12,049 | | | | 13,039 | |
| Parking | | | 3,807 | | | | 4,068 | | | | 4,179 | | | | 4,093 | | | | 3,589 | |
| General and administrative | | | 7,914 | | | | 8,264 | | | | 8,038 | | | | 9,052 | | | | 27,071 | |
| Other expense | | | 1,639 | | | | 1,504 | | | | 1,359 | | | | 1,574 | | | | 1,405 | |
| Depreciation and amortization | | | 45,664 | | | | 44,393 | | | | 43,271 | | | | 43,880 | | | | 44,834 | |
Impairment of long-lived assets | | | 344,540 | | | | – | | | | – | | | | – | | | | – | |
| Interest | | | 61,018 | | | | 79,246 | | | | 66,178 | | | | 62,271 | | | | 61,145 | |
| Loss from early extinguishment of debt | | | – | | | | – | | | | – | | | | 1,463 | | | | – | |
| Total expenses | | | 512,687 | | | | 183,835 | | | | 172,603 | | | | 170,086 | | | | 185,731 | |
| | | | | | | | | | | | | | | | | | | | | |
| Loss from continuing operations before equity in net | | | | | | | | | | | | | | | | | | | | |
| loss of unconsolidated joint venture and gain on sale of real estate | | | (377,911 | ) | | | (51,766 | ) | | | (36,502 | ) | | | (37,977 | ) | | | (51,203 | ) |
| Equity in net loss of unconsolidated joint venture | | | (9,120 | ) | | | (1,739 | ) | | | (330 | ) | | | (98 | ) | | | (388 | ) |
| Gain on sale of real estate | | | – | | | | 20,350 | | | | – | | | | – | | | | – | |
| Loss from continuing operations | | | (387,031 | ) | | | (33,155 | ) | | | (36,832 | ) | | | (38,075 | ) | | | (51,591 | ) |
| | | | | | | | | | | | | | | | | | | | | |
| Discontinued Operations: | | | | | | | | | | | | | | | | | | | | |
| Loss from discontinued operations before gain on sale of real estate | | | (41,577 | ) | | | (25,635 | ) | | | (54,707 | ) | | | (29,683 | ) | | | (61,135 | ) |
| Gain on sale of real estate | | | – | | | | 2,170 | | | | – | | | | – | | | | – | |
| Loss from discontinued operations | | | (41,577 | ) | | | (23,465 | ) | | | (54,707 | ) | | | (29,683 | ) | | | (61,135 | ) |
| | | | | | | | | | | | | | | | | | | | | |
| Net loss | | | (428,608 | ) | | | (56,620 | ) | | | (91,539 | ) | | | (67,758 | ) | | | (112,726 | ) |
| Net loss attributable to common units of our Operating Partnership | | | 52,924 | | | | 7,496 | | | | – | | | | – | | | | 6,864 | |
| | | | | | | | | | | | | | | | | | | | | |
| Net loss attributable to Maguire Properties, Inc. | | | (375,684 | ) | | | (49,124 | ) | | | (91,539 | ) | | | (67,758 | ) | | | (105,862 | ) |
| | | | | | | | | | | | | | | | | | | | | |
| Preferred stock dividends | | | (4,766 | ) | | | (4,766 | ) | | | (4,766 | ) | | | (4,766 | ) | | | (4,766 | ) |
| | | | | | | | | | | | | | | | | | | | | |
| Net loss available to common stockholders | | $ | (380,450 | ) | | $ | (53,890 | ) | | $ | (96,305 | ) | | $ | (72,524 | ) | | $ | (110,628 | ) |
| | | | | | | | | | | | | | | | | | | | | |
| | | | | | | | | | | | | | | | | | | | | |
| Basic and diluted loss per common share: | | | | | | | | | | | | | | | | | | | | |
| Loss from continuing operations | | $ | (7.19 | ) | | $ | (0.70 | ) | | $ | (0.87 | ) | | $ | (0.90 | ) | | $ | (1.11 | ) |
| Loss from discontinued operations | | | (0.76 | ) | | | (0.43 | ) | | | (1.15 | ) | | | (0.62 | ) | | | (1.21 | ) |
| Net loss available to common stockholders per share | | $ | (7.95 | ) | | $ | (1.13 | ) | | $ | (2.02 | ) | | $ | (1.52 | ) | | $ | (2.32 | ) |
| Weighted average number of common shares outstanding | | | 47,836,591 | | | | 47,788,028 | | | | 47,777,101 | | | | 47,773,575 | | | | 47,615,421 | |
Maguire Properties, Inc.
Supplemental Operating and Financial Data
Second Quarter 2009
(unaudited and in thousands)
| | | For the Three Months Ended | |
| | | June 30, 2009 | | | March 31, 2009 | | | December 31, 2008 | | | September 30, 2008 | | | June 30, 2008 | |
| Revenue: | | | | | | | | | | | | | | | |
| Rental | | $ | 2,585 | | | $ | 3,606 | | | $ | 3,589 | | | $ | 5,869 | | | $ | 7,997 | |
| Tenant reimbursements | | | 100 | | | | 12 | | | | 74 | | | | 845 | | | | 616 | |
| Parking | | | 93 | | | | 175 | | | | 140 | | | | 413 | | | | 656 | |
| Interest and other | | | 9 | | | | 142 | | | | 274 | | | | 64 | | | | 107 | |
| Total revenue | | | 2,787 | | | | 3,935 | | | | 4,077 | | | | 7,191 | | | | 9,376 | |
| | | | | | | | | | | | | | | | | | | | | |
| Expenses: | | | | | | | | | | | | | | | | | | | | |
| Rental property operating and maintenance | | | 906 | | | | 1,235 | | | | 1,243 | | | | 2,692 | | | | 3,146 | |
| Real estate taxes | | | 454 | | | | 690 | | | | 403 | | | | 1,468 | | | | 1,837 | |
| Parking | | | 381 | | | | 400 | | | | 484 | | | | 549 | | | | 635 | |
| Depreciation and amortization | | | 603 | | | | 1,217 | | | | 2,880 | | | | 3,087 | | | | 6,193 | |
| Impairment of long-lived assets | | | 40,133 | | | | 23,500 | | | | 50,000 | | | | 21,796 | | | | 51,898 | |
| Interest | | | 1,510 | | | | 2,317 | | | | 3,774 | | | | 5,481 | | | | 6,802 | |
| Loss from early extinguishment of debt | | | 377 | | | | 211 | | | | – | | | | 1,801 | | | | – | |
| Total expenses | | | 44,364 | | | | 29,570 | | | | 58,784 | | | | 36,874 | | | | 70,511 | |
| | | | | | | | | | | | | | | | | | | | | |
| Loss from discontinued operations before gain on sale of real estate | | | (41,577 | ) | | | (25,635 | ) | | | (54,707 | ) | | | (29,683 | ) | | | (61,135 | ) |
| Gain on sale of real estate | | | – | | | | 2,170 | | | | – | | | | – | | | | – | |
| Loss from discontinued operations | | $ | (41,577 | ) | | $ | (23,465 | ) | | $ | (54,707 | ) | | $ | (29,683 | ) | | $ | (61,135 | ) |
Maguire Properties, Inc.
Supplemental Operating and Financial Data
Second Quarter 2009
(unaudited and in thousands)
| | | For the Three Months Ended | |
| | | June 30, 2009 | | | March 31, 2009 | | | December 31, 2008 | | | September 30, 2008 | | | June 30, 2008 | |
| | | | | | | | | | | | | | | | |
| Revenue: | | | | | | | | | | | | | | | |
| Rental | | $ | 19,848 | | | $ | 20,389 | | | $ | 21,445 | | | $ | 22,562 | | | $ | 21,888 | |
| Tenant reimbursements | | | 5,885 | | | | 6,439 | | | | 6,579 | | | | 6,684 | | | | 5,148 | |
| Parking | | | 1,655 | | | | 2,035 | | | | 2,041 | | | | 2,210 | | | | 2,318 | |
| Interest and other | | | 21 | | | | 27 | | | | 85 | | | | 2,422 | | | | 48 | |
| Total revenue | | | 27,409 | | | | 28,890 | | | | 30,150 | | | | 33,878 | | | | 29,402 | |
| | | | | | | | | | | | | | | | | | | | | |
| Expenses: | | | | | | | | | | | | | | | | | | | | |
| Rental property operating and maintenance | | | 6,329 | | | | 6,305 | | | | 7,049 | | | | 6,467 | | | | 6,309 | |
| Real estate taxes | | | 4,061 | | | | 3,441 | | | | 2,419 | | | | 3,298 | | | | 2,034 | |
| Parking | | | 519 | | | | 422 | | | | 445 | | | | 422 | | | | 424 | |
| Depreciation and amortization | | | 10,039 | | | | 16,560 | | | | 11,018 | | | | 13,375 | | | | 11,884 | |
Impairment of long-lived assets | | | 50,254 | | | | – | | | | – | | | | – | | | | – | |
| Interest | | | 10,872 | | | | 10,809 | | | | 11,008 | | | | 11,014 | | | | 10,907 | |
| Other | | | 1,257 | | | | 1,247 | | | | 1,370 | | | | 1,359 | | | | 1,566 | |
| Total expenses | | | 83,331 | | | | 38,784 | | | | 33,309 | | | | 35,935 | | | | 33,124 | |
| | | | | | | | | | | | | | | | | | | | | |
| Net loss | | $ | (55,922 | ) | | $ | (9,894 | ) | | $ | (3,159 | ) | | $ | (2,057 | ) | | $ | (3,722 | ) |
| | | | | | | | | | | | | | | | | | | | | |
| Company share | | $ | (11,184 | ) | | $ | (1,979 | ) | | $ | (631 | ) | | $ | (412 | ) | | $ | (744 | ) |
| Intercompany eliminations | | | 279 | | | | 240 | | | | 301 | | | | 314 | | | | 356 | |
Unallocated losses | | | 1,785 | | | | – | | | | – | | | | – | | | | – | |
| | | | | | | | | | | | | | | | | | | | | |
| Equity in net loss of unconsolidated joint venture | | $ | (9,120 | ) | | $ | (1,739 | ) | | $ | (330 | ) | | $ | (98 | ) | | $ | (388 | ) |
Maguire Properties, Inc.
Supplemental Operating and Financial Data
Second Quarter 2009
(unaudited and in thousands, except share and per share data)
| | | For the Three Months Ended | |
| | | June 30, 2009 | | | March 31, 2009 | | | December 31, 2008 | | | September 30, 2008 | | | June 30, 2008 | |
| | | | | | | | | | | | | | | | |
Reconciliation of net loss available to common stockholders to funds from operations: | | | | | | | | | | | | | | | |
| | | | | | | | | | | | | | | | |
| Net loss available to common stockholders | | $ | (380,450 | ) | | $ | (53,890 | ) | | $ | (96,305 | ) | | $ | (72,524 | ) | | $ | (110,628 | ) |
| | | | | | | | | | | | | | | | | | | | | |
| Add: | Depreciation and amortization of real estate assets | | | 46,183 | | | | 45,526 | | | | 46,052 | | | | 46,881 | | | | 50,888 | |
| | Depreciation and amortization of real estate assets - unconsolidated joint venture (1) | | | 2,008 | | | | 3,312 | | | | 2,204 | | | | 2,675 | | | | 2,377 | |
| | Net loss attributable to common units of our Operating Partnership | | | (52,924 | ) | | | (7,496 | ) | | | – | | | | – | | | | (6,864 | ) |
| | Unallocated losses - unconsolidated joint venture (1) | | | (1,785 | ) | | | – | | | | – | | | | – | | | | – | |
| Deduct: | Gains on sale of real estate | | | – | | | | 22,520 | | | | – | | | | – | | | | – | |
| | | | | | | | | | | | | | | | | | | | | |
Funds from operations available to common stockholders and unit holders (FFO) (2) | | $ | (386,968 | ) | | $ | (35,068 | ) | | $ | (48,049 | ) | | $ | (22,968 | ) | | $ | (64,227 | ) |
| | | | | | | | | | | | | | | | | | | | | |
| Company share of FFO (3) | | $ | (339,712 | ) | | $ | (30,786 | ) | | $ | (42,180 | ) | | $ | (20,158 | ) | | $ | (56,383 | ) |
| | | | | | | | | | | | | | | | | | | | | |
| FFO per share - basic | | $ | (7.10 | ) | | $ | (0.64 | ) | | $ | (0.88 | ) | | $ | (0.42 | ) | | $ | (1.18 | ) |
| FFO per share - diluted | | $ | (7.10 | ) | | $ | (0.64 | ) | | $ | (0.88 | ) | | $ | (0.42 | ) | | $ | (1.18 | ) |
| | | | | | | | | | | | | | | | | | | | | |
| Weighted average number of common shares outstanding - basic | | | 47,836,591 | | | | 47,788,028 | | | | 47,777,101 | | | | 47,773,575 | | | | 47,615,421 | |
Weighted average number of common and common equivalent shares outstanding - diluted | | | 47,837,083 | | | | 47,788,795 | | | | 47,777,868 | | | | 47,778,955 | | | | 47,875,984 | |
| Weighted average diluted shares and units | | | 54,511,656 | | | | 54,463,368 | | | | 54,452,441 | | | | 54,453,528 | | | | 54,550,557 | |
| | | | | | | | | | | | | | | | | | | | | |
| Reconciliation of FFO to FFO before specified items: (2) | | | | | | | | | | | | | | | | | | | | |
| | | | | | | | | | | | | | | | | | | | | |
| FFO available to common stockholders and unit holders (FFO) | | $ | (386,968 | ) | | $ | (35,068 | ) | | $ | (48,049 | ) | | $ | (22,968 | ) | | $ | (64,227 | ) |
| Add: | Loss from early extinguishment of debt included in continuing operations | | | – | | | | – | | | | – | | | | 1,463 | | | | – | |
| | Loss from early extinguishment of debt included in discontinued operations | | | 377 | | | | 211 | | | | – | | | | 1,801 | | | | – | |
| | Unrealized loss on forward-starting interest rate swap | | | (15,255 | ) | | | 15,255 | | | | – | | | | – | | | | – | |
| | Realized loss on forward-starting interest rate swap | | | 11,340 | | | | – | | | | – | | | | – | | | | – | |
| | Impairment of long-lived assets included in continuing operations | | | 344,540 | | | | – | | | | – | | | | – | | | | – | |
| | Impairment of long-lived assets included in discontinued operations | | | 40,133 | | | | 23,500 | | | | 50,000 | | | | 21,796 | | | | 51,898 | |
| | Impairment of long-lived assets included in unconsolidated joint venture (1) | | | 10,050 | | | | – | | | | – | | | | – | | | | – | |
| | Costs associated with strategic alternatives and management changes | | | – | | | | – | | | | – | | | | – | | | | 17,490 | |
| FFO before specified items | | $ | 4,217 | | | $ | 3,898 | | | $ | 1,951 | | | $ | 2,092 | | | $ | 5,161 | |
| | | | | | | | | | | | | | | | | | | | | |
| Company share of FFO before specified items (3) | | $ | 3,702 | | | $ | 3,422 | | | $ | 1,713 | | | $ | 1,836 | | | $ | 4,531 | |
| | | | | | | | | | | | | | | | | | | | | |
| FFO per share before specified items - basic | | $ | 0.08 | | | $ | 0.07 | | | $ | 0.04 | | | $ | 0.04 | | | $ | 0.10 | |
| FFO per share before specified items - diluted | | $ | 0.08 | | | $ | 0.07 | | | $ | 0.04 | | | $ | 0.04 | | | $ | 0.09 | |
__________ | (1) | Amount represents our 20% ownership interest in the MMO joint venture. |
| (2) | For the definition and discussion of FFO and FFO before specified items, see page 46. |
| (3) | Based on a weighted average interest in our Operating Partnership of approximately 87.8% for all periods presented. |
Maguire Properties, Inc.
Supplemental Operating and Financial Data
Second Quarter 2009
(unaudited and in thousands)
| | | For the Three Months Ended | |
| | | June 30, 2009 | | | March 31, 2009 | | | December 31, 2008 | | | September 30, 2008 | | | June 30, 2008 | |
| | | | | | | | | | | | | | | | |
| FFO | | $ | (386,968 | ) | | $ | (35,068 | ) | | $ | (48,049 | ) | | $ | (22,968 | ) | | $ | (64,227 | ) |
| Add: | Non-real estate depreciation | | | 84 | | | | 84 | | | | 99 | | | | 86 | | | | 1,711 | |
| | Straight line ground lease expense | | | 511 | | | | 511 | | | | 51 | | | | 620 | | | | 582 | |
| | Amortization of deferred financing costs | | | 1,955 | | | | 2,259 | | | | 2,243 | | | | 1,790 | | | | 2,085 | |
| | Unrealized loss on forward-starting interest rate swap | | | (15,255 | ) | | | 15,255 | | | | – | | | | – | | | | – | |
| | Realized loss on forward-starting interest rate swap | | | 11,340 | | | | – | | | | – | | | | – | | | | – | |
| | Non-cash stock compensation | | | 1,539 | | | | 1,500 | | | | 1,443 | | | | 1,385 | | | | (93 | ) |
| | Impairment of long-lived assets included in continuing operations | | | 344,540 | | | | – | | | | – | | | | – | | | | – | |
| | Impairment of long-lived assets included in discontinued operations | | | 40,133 | | | | 23,500 | | | | 50,000 | | | | 21,796 | | | | 51,898 | |
| | Impairment of long-lived assets - unconsolidated joint venture | | | 10,050 | | | | – | | | | – | | | | – | | | | – | |
| | Loss from early extinguishment of debt | | | 377 | | | | 211 | | | | – | | | | 3,264 | | | | – | |
| | | | | | | | | | | | | | | | | | | | | |
| Deduct: | Straight line rent | | | 5,023 | | | | 4,094 | | | | 3,784 | | | | 4,909 | | | | 4,281 | |
| | Fair value lease revenue | | | 5,900 | | | | 5,057 | | | | 5,643 | | | | 6,457 | | | | 7,972 | |
| | Capitalized payments (2) | | | 3,550 | | | | 4,877 | | | | 5,520 | | | | 7,137 | | | | 8,664 | |
| | Non-recoverable capital expenditures (3) | | | 923 | | | | 1,077 | | | | 620 | | | | 2,959 | | | | 2,523 | |
| | Recoverable capital expenditures | | | 320 | | | | 90 | | | | 704 | | | | 145 | | | | 56 | |
| | Hotel improvements, equipment upgrades and replacements | | | 251 | | | | 113 | | | | 290 | | | | 254 | | | | 111 | |
| | 2nd generation tenant improvements and leasing commissions (4), (5) | | | 1,664 | | | | 2,336 | | | | 7,878 | | | | 3,614 | | | | 6,617 | |
| | MMO joint venture AFFO adjustments | | | 1,294 | | | | 611 | | | | 532 | | | | 638 | | | | 610 | |
| | | | | | | | | | | | | | | | | | | | | |
| Adjusted funds from operations (AFFO) | | $ | (10,619 | ) | | $ | (10,003 | ) | | $ | (19,184 | ) | | $ | (20,140 | ) | | $ | (38,878 | ) |
__________ | (1) | For the definition and computation method of AFFO, see page 47. For a quantitative reconciliation of the differences between AFFO and cash flows from operating activities, see page 16. |
| (2) | Includes capital lease principal payments, regular principal payments required to service our debt, capitalized leasing and development payroll, and capitalized interest. |
| (3) | Excludes $2.8 million of non-recoverable capital expenditures for the three months ended June 30, 2008 as a result of discretionary renovation costs at KPMG Tower. |
| (4) | Excludes 1st generation tenant improvements and leasing commissions of $4.9 million, $1.4 million, $6.2 million, $0.4 million and $0.4 million for the three months ended June 30 and March 31, 2009 and December 31, September 30 and June 30, 2008, respectively. |
| (5) | Excludes tenant improvements and leasing commissions paid using cash reserves that were funded through loan proceeds upon acquisition or debt refinancing of $0.7 million, $4.7 million, $6.2 million, $5.5 million and $12.7 million for the three months ended June 30 and March 31, 2009 and December 31, September 30 and June 30, 2008, respectively. |
Maguire Properties, Inc.
Supplemental Operating and Financial Data
Second Quarter 2009
(unaudited and in thousands)
| | | For the Three Months Ended | |
| | | June 30, 2009 | | | March 31, 2009 | | | December 31, 2008 | | | September 30, 2008 | | | June 30, 2008 | |
| Reconciliation of net loss to earnings before interest, taxes and depreciation and | | | | | | | | | | | | | | | |
| amortization (EBITDA): | | | | | | | | | | | | | | | |
| | | | | | | | | | | | | | | | |
| Net loss | | $ | (428,608 | ) | | $ | (56,620 | ) | | $ | (91,539 | ) | | $ | (67,758 | ) | | $ | (112,726 | ) |
| Add: | Interest expense (3) | | | 62,528 | | | | 81,563 | | | | 69,952 | | | | 67,752 | | | | 67,947 | |
| | Company share of interest expense included in unconsolidated joint venture | | | 2,174 | | | | 2,162 | | | | 2,202 | | | | 2,203 | | | | 2,181 | |
| | Depreciation and amortization (4) | | | 46,267 | | | | 45,610 | | | | 46,151 | | | | 46,967 | | | | 51,027 | |
| | Company share of depreciation and amortization included in unconsolidated joint venture | | | 2,008 | | | | 3,312 | | | | 2,204 | | | | 2,675 | | | | 2,377 | |
| Deduct: | Unallocated losses from unconsolidated joint venture | | | 1,785 | | | | – | | | | – | | | | – | | | | – | |
| | | | | | | | | | | | | | | | | | | | | |
| EBITDA | | $ | (317,416 | ) | | $ | 76,027 | | | $ | 28,970 | | | $ | 51,839 | | | $ | 10,806 | |
| | | | | | | | | | | | | | | | | | | | | |
| EBITDA | | $ | (317,416 | ) | | $ | 76,027 | | | $ | 28,970 | | | $ | 51,839 | | | $ | 10,806 | |
| Add: | Loss from early extinguishment of debt included in continuing operations | | | – | | | | – | | | | – | | | | 1,463 | | | | – | |
| | Loss from early extinguishment of debt included in discontinued operations | | | 377 | | | | 211 | | | | – | | | | 1,801 | | | | – | |
| | Impairment of long-lived assets included in continuing operations | | | 344,540 | | | | – | | | | – | | | | – | | | | – | |
| | Impairment of long-lived assets included in discontinued operations | | | 40,133 | | | | 23,500 | | | | 50,000 | | | | 21,796 | | | | 51,898 | |
| | Impairment of long-lived assets included in unconsolidated joint venture | | | 10,050 | | | | – | | | | – | | | | – | | | | – | |
| | Costs associated with strategic alternatives and management changes | | | – | | | | – | | | | – | | | | – | | | | 17,490 | |
| Deduct: | Gain on sale of real estate included in continuing operations | | | – | | | | 20,350 | | | | – | | | | – | | | | – | |
| | Gain on sale of real estate included in discontinued operations | | | – | | | | 2,170 | | | | – | | | | – | | | | – | |
| | | | | | | | | | | | | | | | | | | | | |
| Adjusted EBITDA | | $ | 77,684 | | | $ | 77,218 | | | $ | 78,970 | | | $ | 76,899 | | | $ | 80,194 | |
| | | | | | | | | | | | | | | | | | | | | |
| | | | | | | | | | | | | | | | | | | | | |
Reconciliation of cash flows from operating activities to adjusted funds from operations (AFFO): | | | | | | | | | | | | | | | | | | | | |
| | | | | | | | | | | | | | | | | | | | | |
| Cash flows from operating activities | | $ | (248 | ) | | $ | (8,254 | ) | | $ | (26,978 | ) | | $ | (7,588 | ) | | $ | 4,109 | |
| Changes in other assets and liabilities | | | (7,213 | ) | | | 1,867 | | | | 17,286 | | | | (5,580 | ) | | | (33,680 | ) |
| Non-recoverable capital expenditures | | | (923 | ) | | | (1,077 | ) | | | (620 | ) | | | (2,959 | ) | | | (2,523 | ) |
| Recoverable capital expenditures | | | (320 | ) | | | (90 | ) | | | (704 | ) | | | (145 | ) | | | (56 | ) |
| Hotel improvements, equipment upgrades and replacements | | | (251 | ) | | | (113 | ) | | | (290 | ) | | | (254 | ) | | | (111 | ) |
| 2nd generation tenant improvements and leasing commissions (5), (6) | | | (1,664 | ) | | | (2,336 | ) | | | (7,878 | ) | | | (3,614 | ) | | | (6,617 | ) |
| | | | | | | | | | | | | | | | | | | | | |
| AFFO | | $ | (10,619 | ) | | $ | (10,003 | ) | | $ | (19,184 | ) | | $ | (20,140 | ) | | $ | (38,878 | ) |
__________ | (1) | For the definition and discussion of EBITDA and Adjusted EBITDA, see page 48. |
| (2) | For the definition and discussion of AFFO, see page 47. |
| (3) | Includes interest expense of $1.5 million $2.3 million, $3.8 million, $5.5 million and $6.8 million for the three months ended June 30 and March 31, 2009 and December 31, September 30 and June 30, 2008, respectively, related to discontinued operations. |
| (4) | Includes depreciation and amortization of $0.6 million, $1.2 million, $2.9 million, $3.1 million and $6.2 million for the three months ended June 30 and March 31, 2009 and December 31, September 30 and June 30, 2008, respectively, related to discontinued operations. |
| (5) | Excludes 1st generation tenant improvements and leasing commissions of $4.9 million, $1.4 million, $6.2 million, $0.4 million and $0.4 million for the three months ended June 30 and March 31, 2009 and December 31, September 30, June 30, 2008, respectively. |
| (6) | Excludes tenant improvements and leasing commissions paid by cash reserves that were funded through loan proceeds upon acquisition or debt refinancing of $0.7 million, $4.7 million, $6.2 million, $5.5 million and $12.7 million for the three months ended June 30 and March 31, 2009 and December 31, September 30 and June 30, 2008, respectively. |
Maguire Properties, Inc.
Supplemental Operating and Financial Data
Second Quarter 2009
| Debt |
| (in thousands) |
| | | | | | | |
| | | | | | | |
| | | | | | Balance as of | |
| | | | | | June 30, 2009 | |
| | | | | | | |
| Mortgage and other secured loans | | | | | $ | 4,600,771 | |
| Company share of MMO joint venture debt | | | | | | 161,123 | |
| Total combined debt | | | | | $ | 4,761,894 | |
| | | | | | | | |
| Equity |
| (in thousands) |
| | | | | | | | |
| | | | | | | | |
| | | Shares Outstanding | | | Total Liquidation Preference | |
| | | | | | | | |
| Preferred stock | | | 10,000 | | | $ | 250,000 | |
| | | Shares & Units Outstanding | | | Market Value (1) | |
| | | | | | | | | |
| Common stock | | | 47,967 | | | $ | 40,773 | |
| | | | | | | | | |
| Noncontrolling common units of our Operating Partnership | | | 6,675 | | | | 5,673 | |
| Total common equity | | | 54,642 | | | $ | 46,446 | |
| | | | | | | | | |
| Total consolidated market capitalization | | | | | | $ | 4,897,217 | |
| | | | | | | | | |
| Total combined market capitalization (2) | | | | | | $ | 5,058,340 | |
__________ | (1) | Value based on the New York Stock Exchange closing price of $0.85 on June 30, 2009. |
| (2) | Includes our share of Maguire Macquarie Office ("MMO") joint venture debt. |
Maguire Properties, Inc.
Supplemental Operating and Financial Data
Second Quarter 2009
(in thousands, except percentages)
| | Maturity Date | | Principal Amount as of June 30, 2009 | | | % of Debt | | Interest Rate as of June 30, 2009 (1) |
| Floating-Rate Debt | | | | | | | | | | |
| | | | | | | | | | | |
| Repurchase facility (2) | May 1, 2011 | | $ | 23,212 | | | | 0.50 | % | | | 3.06 | % |
| | | | | | | | | | | | | | |
| Construction Loans: | | | | | | | | | | | | | |
| Lantana Media Campus (3) | September 30, 2009 | | | 83,865 | | | | 1.82 | % | | | 4.31 | % |
| 17885 Von Karman | June 30, 2010 | | | 24,154 | | | | 0.52 | % | | | 5.00 | % |
| 207 Goode (4) | May 1, 2010 | | | 19,818 | | | | 0.43 | % | | | 2.11 | % |
| 2385 Northside Drive | August 6, 2010 | | | 16,220 | | | | 0.35 | % | | | 5.00 | % |
| Total construction loans | | | | 144,057 | | | | 3.12 | % | | | 4.20 | % |
| | | | | | | | | | | | | | |
| Variable-Rate Mortgage Loans: | | | | | | | | | | | | | |
| Griffin Towers (5) | May 1, 2010 | | | 125,000 | | | | 2.71 | % | | | 6.50 | % |
| Plaza Las Fuentes (6) | September 29, 2010 | | | 99,200 | | | | 2.15 | % | | | 3.56 | % |
| Brea Corporate Place (7) | May 1, 2010 | | | 70,468 | | | | 1.53 | % | | | 2.26 | % |
| Brea Financial Commons (7) | May 1, 2010 | | | 38,532 | | | | 0.83 | % | | | 2.26 | % |
| Total variable-rate mortgage loans | | | | 333,200 | | | | 7.22 | % | | | 4.24 | % |
| | | | | | | | | | | | | | |
| Variable-Rate Swapped to Fixed-Rate: | | | | | | | | | | | | | |
| KPMG Tower (8) | October 9, 2012 | | | 400,000 | | | | 8.67 | % | | | 7.16 | % |
| 207 Goode (4) | May 1, 2010 | | | 25,000 | | | | 0.54 | % | | | 7.36 | % |
| Total variable-rate swapped to fixed-rate loans | | | | 425,000 | | | | 9.21 | % | | | 7.18 | % |
| | | | | | | | | | | | | | |
| Total floating-rate debt | | | | 925,469 | | | | 20.05 | % | | | 5.55 | % |
| | | | | | | | | | | | | | |
| Fixed-Rate Debt | | | | | | | | | | | | | |
| Wells Fargo Tower | April 6, 2017 | | | 550,000 | | | | 11.93 | % | | | 5.68 | % |
| Two California Plaza | May 6, 2017 | | | 470,000 | | | | 10.19 | % | | | 5.50 | % |
| Gas Company Tower | August 11, 2016 | | | 458,000 | | | | 9.93 | % | | | 5.10 | % |
| 777 Tower | November 1, 2013 | | | 273,000 | | | | 5.92 | % | | | 5.84 | % |
| Pacific Arts Plaza | April 1, 2012 | | | 270,000 | | | | 5.85 | % | | | 5.15 | % |
| US Bank Tower | July 1, 2013 | | | 260,000 | | | | 5.64 | % | | | 4.66 | % |
| 550 South Hope Street (9) | May 6, 2017 | | | 200,000 | | | | 4.34 | % | | | 5.67 | % |
| Park Place I (10) | November 1, 2014 | | | 170,000 | | | | 3.69 | % | | | 5.64 | % |
| City Tower | May 10, 2017 | | | 140,000 | | | | 3.04 | % | | | 5.85 | % |
| Glendale Center | August 11, 2016 | | | 125,000 | | | | 2.71 | % | | | 5.82 | % |
| 500 Orange Tower | May 6, 2017 | | | 110,000 | | | | 2.39 | % | | | 5.88 | % |
| 2600 Michelson | May 10, 2017 | | | 110,000 | | | | 2.39 | % | | | 5.69 | % |
| Stadium Towers Plaza | May 11, 2017 | | | 100,000 | | | | 2.17 | % | | | 5.78 | % |
| Park Place II | March 11, 2012 | | | 98,600 | | | | 2.14 | % | | | 5.39 | % |
| Lantana Media Campus | January 6, 2010 | | | 98,000 | | | | 2.13 | % | | | 4.94 | % |
| 801 North Brand | April 6, 2015 | | | 75,540 | | | | 1.64 | % | | | 5.73 | % |
| Mission City Corporate Center | April 1, 2012 | | | 52,000 | | | | 1.13 | % | | | 5.09 | % |
| The City - 3800 Chapman | May 6, 2017 | | | 44,370 | | | | 0.96 | % | | | 5.93 | % |
| 701 North Brand | October 1, 2016 | | | 33,750 | | | | 0.73 | % | | | 5.87 | % |
| 700 North Central | April 6, 2015 | | | 27,460 | | | | 0.60 | % | | | 5.73 | % |
| Griffin Towers Senior Mezzanine | May 1, 2011 | | | 20,000 | | | | 0.43 | % | | | 13.00 | % |
| | | | | | | | | | | | | | |
| Total fixed-rate debt | | | | 3,685,720 | | | | 79.95 | % | | | 5.51 | % |
| | | | | | | | | | | | | | |
| Total consolidated debt | | | | 4,611,189 | | | | 100.00 | % | | | 5.52 | % |
| | | | | | | | | | | | | | |
| Debt discount | | | | (10,418 | ) | | | | | | | | |
| | | | | | | | | | | | | | |
| Total consolidated debt, net of discount | | | $ | 4,600,771 | | | | | | | | | |
Maguire Properties, Inc.
Supplemental Operating and Financial Data
Second Quarter 2009
(in thousands, except percentages)
__________
| (1) | The June 30, 2009 one-month LIBOR rate of 0.31% was used to calculate interest on the variable-rate loans, except for the 17885 Von Karman and 2385 Northside Drive construction loans which were calculated using the floor interest rate under the loan agreements of 5.00%. |
| (2) | This loan currently bears interest at a variable rate of LIBOR plus 2.75% and increasing to LIBOR plus 3.75% in May 2010. |
| (3) | We are able to further extend the maturity date of this loan to June 13, 2010, subject to certain conditions, some of which we may be unable to fulfill. |
| (4) | This loan bears interest at LIBOR plus 1.80%. We have entered into an interest rate swap agreement to hedge this loan up to $25.0 million, which effectively fixes the LIBOR rate at 5.564%. One one-year extension is available at our option, subject to certain conditions, some of which we may be unable to fulfill. |
| (5) | This loan bears interest at a rate of the greater of LIBOR or 3.00%, plus 3.50%. As required by the loan agreement, we have entered into an interest rate cap agreement that limits the LIBOR portion of the interest rate to 5.00% during the loan term, excluding the extension period. One one-year extension is available at our option, subject to certain conditions, some of which we may be unable to fulfill. |
| (6) | As required by the loan agreement, we have entered into an interest rate cap agreement that limits the LIBOR portion of the interest rate to 4.75% during the loan term, excluding extension periods. Three one-year extensions are available at our option, subject to certain conditions, some of which we may be unable to fulfill. |
| (7) | As required by the loan agreement, we have entered into an interest rate cap agreement that limits the LIBOR portion of the interest rate to 6.50% during the loan term, excluding extension periods. Two one-year extensions are available at our option, subject to certain conditions, some of which we may be unable to fulfill. |
| (8) | This loan bears interest at a rate of LIBOR plus 1.60%. We have entered into an interest rate swap agreement to hedge this loan, which effectively fixes the LIBOR rate at 5.564%. |
| (9) | Our special purpose property-owning subsidiary that owns the 550 South Hope property failed to make the debt service payment under this loan that was due on August 6, 2009. |
| (10) | Our special purpose property-owning subsidiary that owns the Park Place I property failed to make the debt service payment under this loan that was due on August 1, 2009. |
Maguire Properties, Inc.
Supplemental Operating and Financial Data
Second Quarter 2009
(in thousands, except percentages)
| | Maturity Date | | Principal Amount as of June 30, 2009 | | | % of Debt | | Interest Rate as of June 30, 2009 |
| | | | | | | | | | | |
| Fixed-Rate Debt | | | | | | | | | | |
| Wells Fargo Center (Denver, CO) | April 6, 2015 | | $ | 276,000 | | | | 34.34 | % | | | 5.26 | % |
| One California Plaza | December 1, 2010 | | | 141,702 | | | | 17.63 | % | | | 4.73 | % |
| San Diego Tech Center | April 11, 2015 | | | 133,000 | | | | 16.55 | % | | | 5.70 | % |
| Quintana Campus (2) | December 11, 2011 | | | 106,000 | | | | 13.19 | % | | | 5.07 | % |
| Cerritos Corporate Center | February 1, 2016 | | | 95,000 | | | | 11.82 | % | | | 5.54 | % |
| Stadium Gateway | February 1, 2016 | | | 52,000 | | | | 6.47 | % | | | 5.66 | % |
| Total fixed-rate debt | | | | 803,702 | | | | 100.00 | % | | | 5.27 | % |
| Debt premium, net of discount | | | | 1,912 | | | | | | | | | |
| | | | | | | | | | | | | | |
| Total joint venture debt, net | | | $ | 805,614 | | | | | | | | | |
| | | | | | | | | | | | | | |
| Our portion of joint venture debt (1) | | | $ | 161,123 | | | | | | | | | |
__________ | (1) | We own 20% of the MMO joint venture. |
| (2) | The MMO joint venture defaulted on its Quintana mortgage loan by failing to make its required debt service payment. |
Maguire Properties, Inc.
Supplemental Operating and Financial Data
Second Quarter 2009
(in thousands, except percentages)
| | | 2009 | | | 2010 | | | 2011 | | | 2012 | | | 2013 | | | Thereafter | | | Total | |
| Floating-Rate Debt | | | | | | | | | | | | | | | | | | | | | |
| | | | | | | | | | | | | | | | | | | | | | |
| Repurchase facility | | $ | 971 | | | $ | 11,833 | | | $ | 10,358 | | | $ | – | | | $ | – | | | $ | – | | | $ | 23,212 | |
| | | | | | | | | | | | | | | | | | | | | | | | | | | | | |
| Construction Loans: | | | | | | | | | | | | | | | | | | | | | | | | | | | | |
| Lantana Media Campus (1) | | | 83,865 | | | | – | | | | – | | | | – | | | | – | | | | – | | | | 83,865 | |
| 17885 Von Karman | | | – | | | | 24,154 | | | | – | | | | – | | | | – | | | | – | | | | 24,154 | |
| 207 Goode (2) | | | – | | | | 19,818 | | | | – | | | | – | | | | – | | | | – | | | | 19,818 | |
| 2385 Northside Drive | | | – | | | | 16,220 | | | | – | | | | – | | | | – | | | | – | | | | 16,220 | |
| Total construction loans | | | 83,865 | | | | 60,192 | | | | – | | | | – | | | | – | | | | – | | | | 144,057 | |
| | | | | | | | | | | | | | | | | | | | | | | | | | | | | |
| Variable-Rate Mortgage Loans: | | | | | | | | | | | | | | | | | | | | | | | | | | | | |
| Griffin Towers (2) | | | – | | | | 125,000 | | | | – | | | | – | | | | – | | | | – | | | | 125,000 | |
| Plaza Las Fuentes (3) | | | 600 | | | | 98,600 | | | | – | | | | – | | | | – | | | | – | | | | 99,200 | |
| Brea Corporate Place (4) | | | – | | | | 70,468 | | | | – | | | | – | | | | – | | | | – | | | | 70,468 | |
| Brea Financial Commons (4) | | | – | | | | 38,532 | | | | – | | | | – | | | | – | | | | – | | | | 38,532 | |
| | | | | | | | | | | | | | | | | | | | | | | | | | | | | |
| Total variable-rate mortgage loans | | | 600 | | | | 332,600 | | | | – | | | | – | | | | – | | | | – | | | | 333,200 | |
| | | | | | | | | | | | | | | | | | | | | | | | | | | | | |
| Variable-Rate Swapped to Fixed-Rate: | | | | | | | | | | | | | | | | | | | | | | | | | | | | |
| KPMG Tower | | | – | | | | – | | | | – | | | | 400,000 | | | | – | | | | – | | | | 400,000 | |
| 207 Goode (2) | | | – | | | | 25,000 | | | | – | | | | – | | | | – | | | | – | | | | 25,000 | |
| | | | | | | | | | | | | | | | | | | | | | | | | | | | | |
| Total variable-rate swapped to fixed-rate loans | | | – | | | | 25,000 | | | | – | | | | 400,000 | | | | – | | | | – | | | | 425,000 | |
| | | | | | | | | | | | | | | | | | | | | | | | | | | | | |
| Total floating-rate debt | | | 85,436 | | | | 429,675 | | | | 10,358 | | | | 400,000 | | | | – | | | | – | | | | 925,469 | |
| | | | | | | | | | | | | | | | | | | | | | | | | | | | | |
| Fixed-Rate Debt | | | | | | | | | | | | | | | | | | | | | | | | | | | | |
| Wells Fargo Tower (Los Angeles, CA) | | | – | | | | – | | | | – | | | | – | | | | – | | | | 550,000 | | | | 550,000 | |
| Two California Plaza | | | – | | | | – | | | | – | | | | – | | | | – | | | | 470,000 | | | | 470,000 | |
| Gas Company Tower | | | – | | | | – | | | | – | | | | – | | | | – | | | | 458,000 | | | | 458,000 | |
| 777 Tower | | | – | | | | – | | | | – | | | | – | | | | 273,000 | | | | – | | | | 273,000 | |
| Pacific Arts Plaza | | | – | | | | – | | | | – | | | | 270,000 | | | | – | | | | – | | | | 270,000 | |
| US Bank Tower | | | – | | | | – | | | | – | | | | – | | | | 260,000 | | | | – | | | | 260,000 | |
| 550 South Hope Street | | | – | | | | – | | | | – | | | | – | | | | – | | | | 200,000 | | | | 200,000 | |
| Park Place I | | | – | | | | 2,232 | | | | 2,361 | | | | 2,498 | | | | 2,642 | | | | 160,267 | | | | 170,000 | |
| City Tower | | | – | | | | – | | | | – | | | | – | | | | – | | | | 140,000 | | | | 140,000 | |
| Glendale Center | | | – | | | | – | | | | – | | | | – | | | | – | | | | 125,000 | | | | 125,000 | |
| 500 Orange Tower | | | – | | | | – | | | | – | | | | – | | | | – | | | | 110,000 | | | | 110,000 | |
| 2600 Michelson | | | – | | | | – | | | | – | | | | – | | | | – | | | | 110,000 | | | | 110,000 | |
| Stadium Towers Plaza | | | – | | | | – | | | | – | | | | – | | | | – | | | | 100,000 | | | | 100,000 | |
| Park Place II | | | 598 | | | | 1,266 | | | | 1,266 | | | | 95,470 | | | | – | | | | – | | | | 98,600 | |
| Lantana Media Campus | | | – | | | | 98,000 | | | | – | | | | – | | | | – | | | | – | | | | 98,000 | |
| 801 North Brand | | | – | | | | – | | | | – | | | | – | | | | – | | | | 75,540 | | | | 75,540 | |
| Mission City Corporate Center | | | – | | | | – | | | | – | | | | 52,000 | | | | – | | | | – | | | | 52,000 | |
| The City - 3800 Chapman | | | – | | | | – | | | | – | | | | – | | | | – | | | | 44,370 | | | | 44,370 | |
| 701 North Brand | | | – | | | | – | | | | – | | | | – | | | | – | | | | 33,750 | | | | 33,750 | |
| 700 North Central | | | – | | | | – | | | | – | | | | – | | | | – | | | | 27,460 | | | | 27,460 | |
| Griffin Towers Senior Mezzanine | | | – | | | | – | | | | 20,000 | | | | – | | | | – | | | | – | | | | 20,000 | |
| | | | | | | | | | | | | | | | | | | | | | | | | | | | | |
| Total fixed-rate debt | | | 598 | | | | 101,498 | | | | 23,627 | | | | 419,968 | | | | 535,642 | | | | 2,604,387 | | | | 3,685,720 | |
| | | | | | | | | | | | | | | | | | | | | | | | | | | | | |
| Total consolidated debt | | | 86,034 | | | | 531,173 | | | | 33,985 | | | | 819,968 | | | | 535,642 | | | | 2,604,387 | | | | 4,611,189 | |
| | | | | | | | | | | | | | | | | | | | | | | | | | | | | |
| Debt discount | | | – | | | | – | | | | – | | | | – | | | | (2,840 | ) | | | (7,578 | ) | | | (10,418 | ) |
| | | | | | | | | | | | | | | | | | | | | | | | | | | | | |
| Total consolidated debt, net | | $ | 86,034 | | | $ | 531,173 | | | $ | 33,985 | | | $ | 819,968 | | | $ | 532,802 | | | $ | 2,596,809 | | | $ | 4,600,771 | |
| | | | | | | | | | | | | | | | | | | | | | | | | | | | | |
| Weighted average interest rate | | | 4.30 | % | | | 4.47 | % | | | 9.18 | % | | | 6.16 | % | | | 5.27 | % | | | 5.58 | % | | | 5.52 | % |
__________
| (1) | We are able to further extend the maturity date of this loan to June 13, 2010, subject to certain conditions, some of which we may be unable to fulfill. |
| (2) | One one-year extension is available at our option, subject to certain conditions, some of which we may be unable to fulfill. |
| (3) | Three one-year extensions are available at our option, subject to certain conditions, some of which we may be unable to fulfill. |
| (4) | Two one-year extensions are available at our option, subject to certain conditions, some of which we may be unable to fulfill. |
Maguire Properties, Inc.
Supplemental Operating and Financial Data
Second Quarter 2009
(in thousands, except percentages)
| | | 2009 | | | 2010 | | | 2011 | | | 2012 | | | 2013 | | | Thereafter | | | Total | |
| | | | | | | | | | | | | | | | | | | | | | |
| Fixed-Rate Debt | | | | | | | | | | | | | | | | | | | | | |
| Wells Fargo Center (Denver, CO) | | $ | – | | | $ | – | | | $ | – | | | $ | – | | | $ | – | | | $ | 276,000 | | | $ | 276,000 | |
| One California Plaza | | | 1,500 | | | | 140,202 | | | | – | | | | – | | | | – | | | | – | | | | 141,702 | |
| San Diego Tech Center | | | – | | | | – | | | | – | | | | – | | | | – | | | | 133,000 | | | | 133,000 | |
| Quintana Campus | | | – | | | | – | | | | 106,000 | | | | – | | | | – | | | | – | | | | 106,000 | |
| Cerritos Corporate Center | | | – | | | | – | | | | 1,054 | | | | 1,330 | | | | 1,406 | | | | 91,210 | | | | 95,000 | |
| Stadium Gateway | | | – | | | | – | | | | – | | | | – | | | | – | | | | 52,000 | | | | 52,000 | |
| | | | 1,500 | | | | 140,202 | | | | 107,054 | | | | 1,330 | | | | 1,406 | | | | 552,210 | | | | 803,702 | |
| | | | | | | | | | | | | | | | | | | | | | | | | | | | | |
| Debt premium, net of discount | | | – | | | | (575 | ) | | | (75 | ) | | | – | | | | – | | | | 2,562 | | | | 1,912 | |
| | | | | | | | | | | | | | | | | | | | | | | | | | | | | |
| Total joint venture debt, net | | $ | 1,500 | | | $ | 139,627 | | | $ | 106,979 | | | $ | 1,330 | | | $ | 1,406 | | | $ | 554,772 | | | $ | 805,614 | |
| | | | | | | | | | | | | | | | | | | | | | | | | | | | | |
| Weighted average interest rate | | | 4.73 | % | | | 4.73 | % | | | 5.07 | % | | | 5.54 | % | | | 5.54 | % | | | 5.45 | % | | | 5.27 | % |
Maguire Properties, Inc.
Supplemental Operating and Financial Data
Second Quarter 2009
Portfolio Data
Maguire Properties, Inc.
Supplemental Operating and Financial Data
Second Quarter 2009
(unaudited and in thousands, except percentages)
| | | For the Three Months Ended June 30, (1) | | For the Six Months Ended June 30, (2) | |
| | | 2009 | | 2008 | | % Change | | 2009 | | 2008 | | % Change | |
| Total Same Store Portfolio | | | | | | | | | | | | | | | | | | | |
| Number of properties | | | 27 | | | | 27 | | | | | | | 25 | | | | 25 | | | | | |
| Square feet as of June 30 | | | 14,965,222 | | | | 14,953,253 | | | | | | | 14,725,057 | | | | 14,713,088 | | | | | |
| Percentage of wholly-owned Office Portfolio | | | 98.7 | % | | | 100.0 | % | | | | | | 97.1 | % | | | 98.4 | % | | | | |
| Weighted average leased percentage (3) | | | 79.9 | % | | | 82.0 | % | | | | | | 81.4 | % | | | 83.8 | % | | | | |
| | | | | | | | | | | | | | | | | | | | | | | | |
| GAAP | | | | | | | | | | | | | | | | | | | | | | | |
| Breakdown of Net Operating Income: | | | | | | | | | | | | | | | | | | | | | | | |
| Operating revenue | | $ | 123,724 | | | $ | 125,049 | | | | (1.1 | )% | | $ | 246,164 | | | $ | 254,093 | | | | (3.1 | )% | (4) |
| Operating expenses | | | 46,790 | | | | 46,397 | | | | 0.8 | % | | | 93,045 | | | | 94,412 | | | | (1.4 | )% | |
| Other expense | | | 1,264 | | | | 1,318 | | | | (4.1 | )% | | | 2,528 | | | | 2,657 | | | | (4.9 | )% | |
| Net operating income | | $ | 75,670 | | | $ | 77,334 | | | | (2.2 | )% | | $ | 150,591 | | | $ | 157,024 | | | | (4.1 | )% | |
| | | | | | | | | | | | | | | | | | | | | | | | | | |
| CASH BASIS | | | | | | | | | | | | | | | | | | | | | | | | | |
| Breakdown of Net Operating Income: | | | | | | | | | | | | | | | | | | | | | | | | | |
| Operating revenue | | $ | 115,195 | | | $ | 114,572 | | | | 0.5 | % | | $ | 230,920 | | | $ | 233,441 | | | | (1.1 | )% | |
| Operating expenses | | | 46,790 | | | | 46,397 | | | | 0.8 | % | | | 93,045 | | | | 94,412 | | | | (1.4 | )% | |
| Other expense | | | 743 | | | | 743 | | | | - | | | | 1,486 | | | | 1,480 | | | | 0.4 | % | |
| Net operating income | | $ | 67,662 | | | $ | 67,432 | �� | | | (0.3 | )% | | $ | 136,389 | | | $ | 137,549 | | | | (0.8 | )% | |
__________ | (1) | Properties included in the Same Store analysis are the properties in our Office Portfolio, with the exception of our joint venture properties and the Lantana South and East buildings. |
| (2) | Properties included in the Same Store analysis are the properties in our Office Portfolio, with the exception of our joint venture properties, 2385 Northside Drive, 17885 Von Karman and the Lantana South and East buildings. |
| (3) | Represents weighted average leased amounts for the Same Store portfolio. |
| (4) | Decrease primarily due to lower fair value lease revenue during 2009. |
Maguire Properties, Inc.
Supplemental Operating and Financial Data
Second Quarter 2009
| | Ownership | | Square Feet | | Leased % and In-Place Rents | |
| Property | | Number of Buildings | | | Number of Tenants | | Year Built / Renovated | | % | | Net Building Rentable | | | Effective (1) | | | % of Net Rentable | | % Leased | | Total Annualized Rents (2) | | | Effective Annualized Rents (2) | | | Annualized Rent $/RSF (3) | |
| | | | | | | | | | | | | | | | | | | | | | | | | | | | | | | |
| Office Properties | | | | | | | | | | | | | | | | | | | | | | | | | | | | | | |
| Los Angeles County | | | | | | | | | | | | | | | | | | | | | | | | | | | | | | |
Los Angeles Central Business District: | | | | | | | | | | | | | | | | | | | | | | | | | | | | | | |
| Gas Company Tower | | | 1 | | | | 16 | | 1991 | | 100% | | | 1,323,825 | | | | 1,323,825 | | | | 6.83 | % | | | 92.4 | % | | $ | 34,661,874 | | | $ | 34,661,874 | | | $ | 28.34 | |
| US Bank Tower | | | 1 | | | | 46 | | 1989 | | 100% | | | 1,413,942 | | | | 1,413,942 | | | | 7.29 | % | | | 62.6 | % | | | 23,778,216 | | | | 23,778,216 | | | | 26.86 | |
| Wells Fargo Tower | | | 2 | | | | 62 | | 1982 | | 100% | | | 1,396,121 | | | | 1,396,121 | | | | 7.20 | % | | | 93.6 | % | | | 27,784,120 | | | | 27,784,120 | | | | 21.26 | |
| Two California Plaza | | | 1 | | | | 62 | | 1992 | | 100% | | | 1,327,607 | | | | 1,327,607 | | | | 6.84 | % | | | 83.7 | % | | | 21,804,819 | | | | 21,804,819 | | | | 19.62 | |
| KPMG Tower | | | 1 | | | | 22 | | 1983 | | 100% | | | 1,143,654 | | | | 1,143,654 | | | | 5.90 | % | | | 93.8 | % | | | 24,314,931 | | | | 24,314,931 | | | | 22.67 | |
| 777 Tower | | | 1 | | | | 36 | | 1991 | | 100% | | | 1,010,206 | | | | 1,010,206 | | | | 5.21 | % | | | 92.0 | % | | | 19,491,179 | | | | 19,491,179 | | | | 20.97 | |
| 550 South Hope Street | | | 1 | | | | 40 | | 1991 | | 100% | | | 565,738 | | | | 565,738 | | | | 2.92 | % | | | 87.3 | % | | | 8,789,847 | | | | 8,789,847 | | | | 17.80 | |
| One California Plaza | | | 1 | | | | 30 | | 1985 | | 20% | | | 1,002,628 | | | | 200,526 | | | | 5.17 | % | | | 76.7 | % | | | 15,732,772 | | | | 3,146,554 | | | | 20.46 | |
| Total LACBD Submarket | | | 9 | | | | 314 | | | | | | | 9,183,721 | | | | 8,381,619 | | | | 47.35 | % | | | 84.8 | % | | | 176,357,758 | | | | 163,771,540 | | | | 22.64 | |
| | | | | | | | | | | | | | | | | | | | | | | | | | | | | | | | | | | | | | | | |
| Tri-Cities Submarket: | | | | | | | | | | | | | | | | | | | | | | | | | | | | | | | | | | | | | | | |
| Glendale Center | | | 2 | | | | 4 | | 1973/1996 | | 100% | | | 387,545 | | | | 387,545 | | | | 2.00 | % | | | 100.0 | % | | | 8,719,740 | | | | 8,719,740 | | | | 22.50 | |
| 801 North Brand | | | 1 | | | | 30 | | 1987 | | 100% | | | 282,770 | | | | 282,770 | | | | 1.46 | % | | | 83.9 | % | | | 4,701,850 | | | | 4,701,850 | | | | 19.82 | |
| 701 North Brand | | | 1 | | | | 13 | | 1978 | | 100% | | | 131,129 | | | | 131,129 | | | | 0.68 | % | | | 97.2 | % | | | 2,225,194 | | | | 2,225,194 | | | | 17.46 | |
| 700 North Central | | | 1 | | | | 14 | | 1979 | | 100% | | | 134,168 | | | | 134,168 | | | | 0.69 | % | | | 75.5 | % | | | 1,690,563 | | | | 1,690,563 | | | | 16.69 | |
| Plaza Las Fuentes | | | 3 | | | | 9 | | 1989 | | 100% | | | 192,958 | | | | 192,958 | | | | 0.99 | % | | | 100.0 | % | | | 5,178,263 | | | | 5,178,263 | | | | 26.84 | |
| Total Tri-Cities Submarket | | | 8 | | | | 70 | | | | | | | 1,128,570 | | | | 1,128,570 | | | | 5.82 | % | | | 92.7 | % | | | 22,515,610 | | | | 22,515,610 | | | | 21.52 | |
| | | | | | | | | | | | | | | | | | | | | | | | | | | | | | | | | | | | | | | | |
Santa Monica Professional and Entertainment Submarket: | | | | | | | | | | | | | | | | | | | | | | | | | | | | | | | | | | | | | | | |
| Lantana Media Campus | | | 5 | | | | 26 | | 1989/2001/2008/2009 | | 100% | | | 531,363 | | | | 531,363 | | | | 2.74 | % | | | 83.6 | % | | | 19,577,846 | | | | 19,577,846 | | | | 44.07 | |
Total Entertainment Submarket | | | 5 | | | | 26 | | | | | | | 531,363 | | | | 531,363 | | | | 2.74 | % | | | 83.6 | % | | | 19,577,846 | | | | 19,577,846 | | | | 44.09 | |
| | | | | | | | | | | | | | | | | | | | | | | | | | | | | | | | | | | | | | | | |
| Cerritos Office Submarket: | | | | | | | | | | | | | | | | | | | | | | | | | | | | | | | | | | | | | | | |
| Cerritos - Phase I | | | 1 | | | | 1 | | 1999 | | 20% | | | 221,968 | | | | 44,394 | | | | 1.14 | % | | | 100.0 | % | | | 5,982,037 | | | | 1,196,408 | | | | 26.95 | |
| Cerritos - Phase II | | | 1 | | | | – | | 2001 | | 20% | | | 104,567 | | | | 20,913 | | | | 0.54 | % | | | 100.0 | % | | | 2,482,421 | | | | 496,484 | | | | 23.74 | |
| Total Cerritos Submarket | | | 2 | | | | 1 | | | | | | | 326,535 | | | | 65,307 | | | | 1.68 | % | | | 100.0 | % | | | 8,464,458 | | | | 1,692,892 | | | | 25.92 | |
| | | | | | | | | | | | | | | | | | | | | | | | | | | | | | | | | | | | | | | | |
| Total Los Angeles County | | | 24 | | | | 411 | | | | | | | 11,170,189 | | | | 10,106,859 | | | | 57.59 | % | | | 86.0 | % | | $ | 226,915,672 | | | $ | 207,557,888 | | | $ | 23.62 | |
Maguire Properties, Inc.
Supplemental Operating and Financial Data
Second Quarter 2009
Portfolio Overview (continued)
| | Ownership | | Square Feet | | Leased % and In-Place Rents | |
| Property | | Number of Buildings | | | Number of Tenants | | Year Built / Renovated | | % | | Net Building Rentable | | | Effective (1) | | | % of Net Rentable | | % Leased | | Total Annualized Rents (2) | | | Effective Annualized Rents (2) | | | Annualized Rent $/RSF (3) | |
| | | | | | | | | | | | | | | | | | | | | | | | | | | | | | | |
| Office Properties | | | | | | | | | | | | | | | | | | | | | | | | | | | | | | |
| Orange County | | | | | | | | | | | | | | | | | | | | | | | | | | | | | | |
| John Wayne Airport Submarket: | | | | | | | | | | | | | | | | | | | | | | | | | | | | | | |
| Park Place | | | 8 | | | | 37 | | 1977/2002 | | 100% | | | 1,787,620 | | | | 1,787,620 | | | | 9.21 | % | | | 64.7 | % | | $ | 18,631,483 | | | $ | 18,631,483 | | | $ | 16.11 | |
| 2600 Michelson | | | 1 | | | | 27 | | 1986 | | 100% | | | 308,195 | | | | 308,195 | | | | 1.59 | % | | | 72.5 | % | | | 4,535,761 | | | | 4,535,761 | | | | 20.30 | |
| Quintana Campus | | | 4 | | | | 2 | | 1989/2004 | | 20% | | | 414,595 | | | | 82,919 | | | | 2.14 | % | | | 39.6 | % | | | 2,614,977 | | | | 522,995 | | | | 15.93 | |
| 17885 Von Karman Avenue | | | 1 | | | | – | | 2008 | | 100% | | | 151,370 | | | | 151,370 | | | | 0.78 | % | | | 0.0 | % | | | – | | | | – | | | | – | |
| Total Airport Submarket | | | 14 | | | | 66 | | | | | | | 2,661,780 | | | | 2,330,104 | | | | 13.72 | % | | | 58.0 | % | | | 25,782,221 | | | | 23,690,239 | | | | 16.70 | |
| | | | | | | | | | | | | | | | | | | | | | | | | | | | | | | | | | | | | | | | |
| Costa Mesa Submarket: | | | | | | | | | | | | | | | | | | | | | | | | | | | | | | | | | | | | | | | |
| Griffin Towers | | | 2 | | | | 37 | | 1987 | | 100% | | | 544,760 | | | | 544,760 | | | | 2.81 | % | | | 68.8 | % | | | 5,923,614 | | | | 5,923,614 | | | | 15.80 | |
| Pacific Arts Plaza | | | 8 | | | | 42 | | 1982 | | 100% | | | 786,283 | | | | 786,283 | | | | 4.05 | % | | | 77.8 | % | | | 13,384,035 | | | | 13,384,035 | | | | 21.88 | |
Total Costa Mesa Submarket | | | 10 | | | | 79 | | | | | | | 1,331,043 | | | | 1,331,043 | | | | 6.86 | % | | | 74.1 | % | | | 19,307,649 | | | | 19,307,649 | | | | 19.58 | |
| | | | | | | | | | | | | | | | | | | | | | | | | | | | | | | | | | | | | | | | |
| Central Orange Submarket: | | | | | | | | | | | | | | | | | | | | | | | | | | | | | | | | | | | | | | | |
| 3800 Chapman | | | 1 | | | | 1 | | 1984 | | 100% | | | 157,231 | | | | 157,231 | | | | 0.81 | % | | | 63.4 | % | | | 2,243,454 | | | | 2,243,454 | | | | 22.51 | |
| City Tower | | | 1 | | | | 25 | | 1988 | | 100% | | | 412,275 | | | | 412,275 | | | | 2.13 | % | | | 81.8 | % | | | 7,309,780 | | | | 7,309,780 | | | | 21.68 | |
| 500 Orange Tower | | | 3 | | | | 32 | | 1987 | | 100% | | | 335,276 | | | | 335,276 | | | | 1.73 | % | | | 68.6 | % | | | 4,371,406 | | | | 4,371,406 | | | | 19.01 | |
| Stadium Towers Plaza | | | 1 | | | | 26 | | 1988 | | 100% | | | 258,358 | | | | 258,358 | | | | 1.33 | % | | | 59.7 | % | | | 3,175,480 | | | | 3,175,480 | | | | 20.59 | |
| Stadium Gateway | | | 1 | | | | 8 | | 2001 | | 20% | | | 272,826 | | | | 54,565 | | | | 1.41 | % | | | 87.6 | % | | | 5,174,124 | | | | 1,034,825 | | | | 21.65 | |
Total Central Orange Submarket | | | 7 | | | | 92 | | | | | | | 1,435,966 | | | | 1,217,705 | | | | 7.41 | % | | | 73.8 | % | | | 22,274,244 | | | | 18,134,945 | | | | 21.02 | |
| | | | | | | | | | | | | | | | | | | | | | | | | | | | | | | | | | | | | | | | |
| Other: | | | | | | | | | | | | | | | | | | | | | | | | | | | | | | | | | | | | | | | |
| Brea Corporate Place | | | 2 | | | | 18 | | 1987 | | 100% | | | 328,934 | | | | 328,934 | | | | 1.70 | % | | | 55.7 | % | | | 3,170,575 | | | | 3,170,575 | | | | 17.31 | |
| Brea Financial Commons | | | 3 | | | | 2 | | 1987 | | 100% | | | 165,540 | | | | 165,540 | | | | 0.85 | % | | | 90.7 | % | | | 2,845,219 | | | | 2,845,219 | | | | 18.95 | |
| 130 State College | | | 1 | | | | 1 | | 1983 | | 100% | | | 42,884 | | | | 42,884 | | | | 0.22 | % | | | 100.0 | % | | | 614,957 | | | | 614,957 | | | | 14.34 | |
| Total Other | | | 6 | | | | 21 | | | | | | | 537,358 | | | | 537,358 | | | | 2.77 | % | | | 70.0 | % | | | 6,630,751 | | | | 6,630,751 | | | | 17.63 | |
| | | | | | | | | | | | | | | | | | | | | | | | | | | | | | | | | | | | | | | | |
| Total Orange County | | | 37 | | | | 258 | | | | | | | 5,966,147 | | | | 5,416,210 | | | | 30.76 | % | | | 66.5 | % | | $ | 73,994,865 | | | $ | 67,763,584 | | | $ | 18.65 | |
Maguire Properties, Inc.
Supplemental Operating and Financial Data
Second Quarter 2009
Portfolio Overview (continued)
| Property by Submarket | | Ownership | | Square Feet | | Leased % and In-Place Rents | |
| Property | | Number of Buildings | | | Number of Tenants | | Year Built / Renovated | | % | | Net Building Rentable | | | Effective (1) | | | % of Net Rentable | | % Leased | | Total Annualized Rents (2) | | | Effective Annualized Rents (2) | | | Annualized Rent $/RSF (3) | |
| | | | | | | | | | | | | | | | | | | | | | | | | | | | | | | |
| Office Properties | | | | | | | | | | | | | | | | | | | | | | | | | | | | | | |
| San Diego County | | | | | | | | | | | | | | | | | | | | | | | | | | | | | | |
| Sorrento Mesa Submarket: | | | | | | | | | | | | | | | | | | | | | | | | | | | | | | |
| San Diego Tech Center | | | 11 | | | | 26 | | 1984/1986 | | 20% | | | 645,934 | | | | 129,187 | | | | 3.33 | % | | | 93.7 | % | | $ | 12,543,599 | | | $ | 2,508,720 | | | $ | 20.72 | |
Total Sorento Mesa Submarket | | | 11 | | | | 26 | | | | | | | 645,934 | | | | 129,187 | | | | 3.33 | % | | | 93.7 | % | | | 12,543,599 | | | | 2,508,720 | | | | 20.72 | |
| | | | | | | | | | | | | | | | | | | | | | | | | | | | | | | | | | | | | | | | |
| Mission Valley Submarket: | | | | | | | | | | | | | | | | | | | | | | | | | | | | | | | | | | | | | | | |
| Mission City Corporate Center | | | 3 | | | | 14 | | 1990 | | 100% | | | 190,634 | | | | 190,634 | | | | 0.98 | % | | | 86.9 | % | | | 4,129,175 | | | | 4,129,175 | | | | 24.93 | |
| 2385 Northside Drive | | | 1 | | | | 1 | | 2008 | | 100% | | | 88,795 | | | | 88,795 | | | | 0.46 | % | | | 51.7 | % | | | 798,288 | | | | 798,288 | | | | 17.39 | |
Total Mission Valley Submarket | | | 4 | | | | 15 | | | | | | | 279,429 | | | | 279,429 | | | | 1.44 | % | | | 75.7 | % | | | 4,927,463 | | | | 4,927,463 | | | | 23.29 | |
| | | | | | | | | | | | | | | | | | | | | | | | | | | | | | | | | | | | | | | | |
| Total San Diego County | | | 15 | | | | 41 | | | | | | | 925,363 | | | | 408,616 | | | | 4.77 | % | | | 88.3 | % | | $ | 17,471,062 | | | $ | 7,436,183 | | | $ | 21.38 | |
| | | | | | | | | | | | | | | | | | | | | | | | | | | | | | | | | | | | | | | | |
| Other | | | | | | | | | | | | | | | | | | | | | | | | | | | | | | | | | | | | | | | |
Denver, CO - Downtown Submarket: | | | | | | | | | | | | | | | | | | | | | | | | | | | | | | | | | | | | | | | |
| Wells Fargo Center - Denver | | | 1 | | | | 39 | | 1983 | | 20% | | | 1,211,746 | | | | 242,349 | | | | 6.25 | % | | | 94.0 | % | | $ | 22,504,364 | | | $ | 4,500,873 | | | $ | 19.76 | |
| Total Other | | | 1 | | | | 39 | | | | | | | 1,211,746 | | | | 242,349 | | | | 6.25 | % | | | 94.0 | % | | | 22,504,364 | | | | 4,500,873 | | | | 19.75 | |
| | | | | | | | | | | | | | | | | | | | | | | | | | | | | | | | | | | | | | | | |
| | | | | | | | | | | | | | | | | | | | | | | | | | | | | | | | | | | | | | | | |
| Total Office Properties | | | 77 | | | | 749 | | | | | | | 19,273,445 | | | | 16,174,034 | | | | 99.37 | % | | | 80.6 | % | | $ | 340,885,963 | | | $ | 287,258,528 | | | $ | 21.94 | |
Maguire Properties, Inc.
Supplemental Operating and Financial Data
Second Quarter 2009
Portfolio Overview (continued)
| Property by Submarket | | Ownership | | Square Feet | | Leased % and In-Place Rents | |
| Property | | Number of Buildings | | | Number of Tenants | | Year Built / Renovated | | % | | Net Building Rentable | | | Effective (1) | | | % of Net Rentable | | % Leased | | Total Annualized Rents (2) | | | Effective Annualized Rents (2) | | | Annualized Rent $/RSF (3) | |
| | | | | | | | | | | | | | | | | | | | | | | | | | | | | | | |
| Retail Property | | | | | | | | | | | | | | | | | | | | | | | | | | | | | | |
| John Wayne Airport Submarket: | | | | | | | | | | | | | | | | | | | | | | | | | | | | | | |
| Park Place | | | 8 | | | | 22 | | 1981 | | 100% | | | 122,533 | | | | 122,533 | | | | 0.63 | % | | | 86.9 | % | | $ | 3,214,659 | | | $ | 3,214,659 | | | $ | 30.19 | |
| Total Retail Properties | | | 8 | | | | 22 | | | | | | | 122,533 | | | | 122,533 | | | | 0.63 | % | | | 86.9 | % | | | 3,214,659 | | | | 3,214,659 | | | | 30.20 | |
| | | | | | | | | | | | | | | | | | | | | | | | | | | | | | | | | | | | | | | | |
| Total Office and Retail Properties | | | 85 | | | | 771 | | | | | | | 19,395,978 | | | | 16,296,567 | | | | 100.00 | % | | | 80.6 | % | | $ | 344,100,622 | | | $ | 290,473,187 | | | $ | 22.01 | |
Effective Office and Retail Properties | | | | | | | | | | | | | | 16,296,567 | | | | | | | | | | | | 80.0 | % | | | | | | | | | | $ | 22.27 | |
| | | | | | | | | | | | | | | | | | | | | | | | | | | | | | | | | | | | | | | | |
| | | | | | | | | | | | | | | | | | | | | | | | | | | | | | | | | | | | | | | | |
| Hotel Property | | | | | | | | | | | | | SQFT | | | Effective SQFT | | | Number of Rooms | | | | | | | | | | | | | | | | | |
| Westin Hotel, Pasadena, CA | | | | | | | | | | | 100% | | | 266,000 | | | | 266,000 | | | | 350 | | | | | | | | | | | | | | | | | |
| Total Hotel Property | | | | | | | | | | | | | | 266,000 | | | | 266,000 | | | | 350 | | | | | | | | | | | | | | | | | |
| | | | | | | | | | | | | | | | | | | | | | | | | | | | | | | | | | | | | | | | |
Total Office, Retail and Hotel Properties | | | | | | | | | | | | | | 19,661,978 | | | | 16,562,567 | | | | | | | | | | | | | | | | | | | | | |
| Parking Properties | | | | | | | | | | | | | SQFT | | | Effective SQFT | | | Vehicle Capacity | | | Effective Vehicle Capacity | | | Annualized Parking Revenue (4) | | | Effective Annualized Parking Revenue (5) | | | Effective Annualized Parking Revenue per Vehicle Capacity (6) | |
| On-Site Parking | | | | | | | | | | | | | | 10,457,459 | | | | 8,640,461 | | | | 34,832 | | | | 28,953 | | | $ | 44,974,411 | | | $ | 39,677,781 | | | $ | 1,370 | |
| Off-Site Garages | | | | | | | | | | | | | | 1,714,435 | | | | 1,714,435 | | | | 5,729 | | | | 5,729 | | | | 12,874,750 | | | | 12,874,750 | | | | 2,247 | |
| Total Parking Properties | | | | | | | | | | | | | | 12,171,894 | | | | 10,354,896 | | | | 40,561 | | | | 34,682 | | | $ | 57,849,161 | | | $ | 52,552,531 | | | | 1,515 | |
| | | | | | | | | | | | | | | | | | | | | | | | | | | | | | | | | | | | | | | | |
Total Office, Retail, Hotel and Parking Properties | | | | | | | | | | | | | | 31,833,872 | | | | 26,917,463 | | | | | | | | | | | | | | | | | | | | | |
__________
| (1) | Includes 100% of our consolidated portfolio and 20% of our MMO joint venture portfolio. |
| (2) | Annualized rent represents the annualized monthly contractual rent under existing leases as of June 30, 2009. This amount reflects total base rent before any one-time or non-recurring rent abatements but after annually recurring rent credits and is shown on a net basis; thus, for any tenant under a partial gross lease, the expense stop, or under a fully gross lease, the current year operating expenses (which may be estimates as of such date), are subtracted from gross rent. |
| (3) | Annualized rent per rentable square foot represents annualized rent as computed above, divided by the total square footage under lease as of the same date. |
| (4) | Annualized parking revenue represents the annualized quarterly parking revenue as of June 30, 2009. |
| (5) | Effective annualized parking revenue represents the annualized quarterly parking revenue as of June 30, 2009 adjusted to include 100% of our consolidated portfolio and 20% of our MMO joint venture portfolio. |
| (6) | Effective annualized parking revenue per vehicle capacity represents the effective annualized parking revenue divided by the effective vehicle capacity. |
Maguire Properties, Inc.
Supplemental Operating and Financial Data
Second Quarter 2009
Maguire Properties, Inc.
Supplemental Operating and Financial Data
Second Quarter 2009
| | Ownership Interest | | Weighted Average Remaining Lease Term | | % Leased |
| | ( % ) | | (in years) | | Q2 2009 | | Q1 2009 | | Q4 2008 | | Q3 2008 | | Q2 2008 |
| Gas Company Tower | 100% | | 5.4 | | | 92.4 | % | | | 92.1 | % | | | 92.1 | % | | | 92.0 | % | | | 91.8 | % |
| US Bank Tower | 100% | | 4.2 | | | 62.6 | % | | | 65.1 | % | | | 65.6 | % | | | 65.1 | % | | | 64.8 | % |
| Wells Fargo Tower | 100% | | 5.1 | | | 93.6 | % | | | 93.7 | % | | | 93.9 | % | | | 93.8 | % | | | 93.9 | % |
| KPMG Tower | 100% | | 8.7 | | | 93.8 | % | | | 93.8 | % | | | 92.5 | % | | | 92.5 | % | | | 92.5 | % |
| 777 Tower | 100% | | 4.6 | | | 92.0 | % | | | 91.9 | % | | | 91.9 | % | | | 94.1 | % | | | 94.5 | % |
| One California Plaza | 20% | | 4.2 | | | 76.7 | % | | | 77.1 | % | | | 77.3 | % | | | 81.2 | % | | | 89.0 | % |
| Glendale Center | 100% | | 2.8 | | | 100.0 | % | | | 100.0 | % | | | 100.0 | % | | | 100.0 | % | | | 100.0 | % |
| 801 North Brand | 100% | | 2.9 | | | 83.9 | % | | | 83.1 | % | | | 88.8 | % | | | 91.0 | % | | | 90.1 | % |
| 701 North Brand | 100% | | 5.0 | | | 97.2 | % | | | 100.0 | % | | | 100.0 | % | | | 100.0 | % | | | 100.0 | % |
| 700 North Central | 100% | | 3.9 | | | 75.5 | % | | | 96.7 | % | | | 92.0 | % | | | 91.1 | % | | | 94.3 | % |
| Plaza Las Fuentes | 100% | | 8.7 | | | 100.0 | % | | | 100.0 | % | | | 100.0 | % | | | 100.0 | % | | | 100.0 | % |
| Lantana Media Campus | 100% | | 6.6 | | | 83.6 | % | | | 84.4 | % | | | 82.8 | % | | | 88.8 | % | | | 86.5 | % |
| Cerritos - Phase I | 20% | | 5.3 | | | 100.0 | % | | | 100.0 | % | | | 100.0 | % | | | 100.0 | % | | | 100.0 | % |
| Cerritos - Phase II | 20% | | 1.9 | | | 100.0 | % | | | 100.0 | % | | | 100.0 | % | | | 100.0 | % | | | 100.0 | % |
| Park Place | 100% | | 3.2 | | | 64.7 | % | | | 60.2 | % | | | 60.3 | % | | | 64.9 | % | | | 65.0 | % |
| Quintana Campus (1) | 20% | | 2.2 | | | 39.6 | % | | | 42.2 | % | | | 100.0 | % | | | 100.0 | % | | | 100.0 | % |
| 17885 Von Karman Avenue | 100% | | 0.0 | | | 0.0 | % | | | 0.0 | % | | | 0.0 | % | | | 0.0 | % | | | 0.0 | % |
| Pacific Arts Plaza | 100% | | 5.5 | | | 77.8 | % | | | 76.0 | % | | | 80.1 | % | | | 79.7 | % | | | 81.2 | % |
| Stadium Gateway | 20% | | 4.2 | | | 87.6 | % | | | 79.0 | % | | | 79.0 | % | | | 77.5 | % | | | 94.7 | % |
| Mission City Corporate Center | 100% | | 2.5 | | | 86.9 | % | | | 86.9 | % | | | 86.9 | % | | | 82.8 | % | | | 82.8 | % |
| 2385 Northside Drive | 100% | | 10.8 | | | 51.7 | % | | | 51.7 | % | | | 51.7 | % | | | 0.0 | % | | | 0.0 | % |
| San Diego Tech Center | 20% | | 3.0 | | | 93.7 | % | | | 93.7 | % | | | 96.8 | % | | | 96.8 | % | | | 96.8 | % |
| Wells Fargo Center - Denver | 20% | | 7.6 | | | 94.0 | % | | | 95.2 | % | | | 95.9 | % | | | 95.5 | % | | | 95.2 | % |
| Park Place - Retail | 100% | | 6.5 | | | 86.9 | % | | | 88.5 | % | | | 91.8 | % | | | 91.8 | % | | | 91.8 | % |
| Two California Plaza | 100% | | 5.0 | | | 83.7 | % | | | 92.6 | % | | | 94.0 | % | | | 93.2 | % | | | 93.2 | % |
| 550 South Hope Street | 100% | | 5.1 | | | 87.3 | % | | | 87.7 | % | | | 87.3 | % | | | 88.3 | % | | | 90.3 | % |
| 2600 Michelson | 100% | | 2.6 | | | 72.5 | % | | | 76.4 | % | | | 76.1 | % | | | 82.0 | % | | | 84.9 | % |
| 3800 Chapman | 100% | | 3.9 | | | 63.4 | % | | | 63.4 | % | | | 63.4 | % | | | 63.4 | % | | | 63.4 | % |
| Griffin Towers | 100% | | 4.3 | | | 68.8 | % | | | 64.7 | % | | | 64.3 | % | | | 62.6 | % | | | 65.0 | % |
| City Tower | 100% | | 3.3 | | | 81.8 | % | | | 78.9 | % | | | 78.1 | % | | | 78.9 | % | | | 81.1 | % |
| 500 Orange Tower | 100% | | 4.5 | | | 68.6 | % | | | 78.5 | % | | | 79.6 | % | | | 80.2 | % | | | 80.9 | % |
| Stadium Towers Plaza | 100% | | 3.0 | | | 59.7 | % | | | 59.0 | % | | | 63.1 | % | | | 61.0 | % | | | 74.4 | % |
| Brea Corporate Place | 100% | | 2.8 | | | 55.7 | % | | | 55.0 | % | | | 48.6 | % | | | 47.7 | % | | | 47.9 | % |
| Brea Financial Commons | 100% | | 4.8 | | | 90.7 | % | | | 90.7 | % | | | 90.7 | % | | | 90.7 | % | | | 90.7 | % |
| 130 State College | 100% | | 5.3 | | | 100.0 | % | | | 100.0 | % | | | 100.0 | % | | | 0.0 | % | | | 0.0 | % |
| | | | | | | | | | | | | | | | | | | | | | | | |
| Total Portfolio | | | 5.0 | | | 80.6 | % | | | 79.4 | % | | | 81.1 | % | | | 81.0 | % | | | 80.6 | % |
| | | | | | | | | | | | | | | | | | | | | | | | |
| Effective Portfolio (2) | | | 5.0 | | | 80.0 | % | | | 78.7 | % | | | 79.3 | % | | | 79.1 | % | | | 78.2 | % |
__________
| (1) | Reduction in leased percentage between Q4 2008 and Q1 2009 reflects space vacated by Washington Mutual in Q1 2009 pursuant to the rejection of leases by JP Morgan Chase. |
| (2) | Includes 100% of our consolidated portfolio and 20% of our MMO joint venture portfolio. |
Maguire Properties, Inc.
Supplemental Operating and Financial Data
Second Quarter 2009
| | | Tenant | | Number of Locations | | Annualized Rent (1) | | % of Total Annualized Rent | | Total Leased Square Feet | | % of Aggregate Leased Square Feet of Effective Portfolio | | Weighted Average Remaining Lease Term in Months | | S & P Credit Rating / National Recognition (2) |
| | | Rated | | | | | | | | | | | | | | |
| 1 | | Southern California Gas Company | | 1 | | $ | 21,283,883 | | 7.3% | | | 576,516 | | 4.4% | | 28 | | A |
| 2 | | Sempra (Pacific Enterprises) | | 1 | | | 8,189,591 | | 2.8% | | | 217,413 | | 1.7% | | 12 | | A |
| 3 | | Wells Fargo Bank (3) | | 5 | | | 7,291,062 | | 2.5% | | | 419,606 | | 3.2% | | 61 | | AA- |
| 4 | | Bank of America (3) | | 7 | | | 6,570,150 | | 2.3% | | | 304,000 | | 2.3% | | 37 | | A+ |
| 5 | | US Bank, National Association | | 4 | | | 5,098,520 | | 1.8% | | | 247,061 | | 1.9% | | 86 | | AA- |
| 6 | | AT&T (3) | | 5 | | | 4,883,955 | | 1.7% | | | 202,813 | | 1.6% | | 42 | | A |
| 7 | | Disney Enterprises | | 1 | | | 3,706,960 | | 1.3% | | | 156,215 | | 1.2% | | 24 | | A |
| 8 | | Caltrans (Dept of Transportation) | | 1 | | | 3,484,425 | | 1.2% | | | 208,156 | | 1.6% | | 20 | | AAA |
| 9 | | State Farm Mutual Auto Insurance Company | | 3 | | | 2,702,753 | | 0.9% | | | 172,170 | | 1.3% | | 56 | | AA |
| 10 | | GMAC Mortgage Corporation | | 1 | | | 2,499,091 | | 0.9% | | | 130,161 | | 1.0% | | 54 | | A- |
| | | | | | | | | | | | | | | | | | | |
| | | Total Rated / Weighted Average (3), (4) | | | | | 65,710,390 | | 22.7 % | | | 2,634,111 | | 20.2% | | 42 | | |
| | | | | | | | | | | | | | | | | | | |
| | | Total Investment Grade Tenants (3) | | | | $ | 100,852,302 | | 34.7% | | | 4,313,501 | | 33.1% | | | | |
| | | | | | | | | | | | | | | | | | | |
| | | Nationally Recognized | | | | | | | | | | | | | | | | |
| 11 | | Latham & Watkins LLP | | 2 | | | 8,943,369 | | 3.1% | | | 397,991 | | 3.1% | | 161 | | 3rd Largest US Law Firm |
| 12 | | Gibson, Dunn & Crutcher LLP | | 1 | | | 6,410,038 | | 2.2% | | | 268,268 | | 2.1% | | 101 | | 20th Largest US Law Firm |
| 13 | | Deloitte & Touche LLP | | 1 | | | 5,216,904 | | 1.8% | | | 342,094 | | 2.6% | | 69 | | Largest US Accounting Firm |
| 14 | | Marsh USA, Inc. | | 1 | | | 3,727,695 | | 1.3% | | | 212,721 | | 1.6% | | 106 | | World's Largest Insurance Broker |
| 15 | | Sidley Austin LLP | | 1 | | | 3,638,360 | | 1.3% | | | 192,457 | | 1.5% | | 174 | | 5th Largest US Law Firm |
| 16 | | KPMG LLP | | 1 | | | 3,636,822 | | 1.3% | | | 175,971 | | 1.3% | | 60 | | 4th Largest US Accounting Firm |
| 17 | | Morrison & Foerster LLP | | 1 | | | 3,469,400 | | 1.2% | | | 138,776 | | 1.1% | | 51 | | 23rd Largest US Law Firm |
| 18 | | Munger, Tolles & Olson LLP | | 1 | | | 3,374,322 | | 1.2% | | | 160,682 | | 1.2% | | 152 | | 129th Largest US Law Firm |
| 19 | | PricewaterhouseCoopers LLP | | 1 | | | 2,988,225 | | 1.0% | | | 160,784 | | 1.2% | | 47 | | 3rd Largest US Accounting Firm |
| 20 | | Bingham McCutchen LLP | | 1 | | | 2,442,677 | | 0.8% | | | 104,712 | | 0.8% | | 43 | | 32nd Largest US Law Firm |
| | | | | | | | | | | | | | | | | | | |
| | | Total Nationally Recognized / Weighted Average (3), (4) | | | | | 43,847,812 | | 15.2% | | | 2,154,456 | | 16.5% | | 104 | | |
| | | | | | | | | | | | | | | | | | | |
| | | Total Nationally Recognized Tenants (3) | | | | | 86,622,720 | | 29.8% | | | 4,167,448 | | 32.0% | | | | |
| | | | | | | | | | | | | | | | | | | |
| | | Total / Weighted Average (3), (4) | | | | $ | 109,558,202 | | 37.9% | | | 4,788,567 | | 36.7% | | 70 | | |
| | | | | | | | | | | | | | | | | | | |
| | | Total Investment Grade or Nationally Recognized Tenants (3) | | | | $ | 187,475,021 | | 64.5% | | | 8,480,949 | | 65.0% | | | | |
__________
| (1) | Annualized base rent is calculated as monthly contractual base rent under existing leases as of June 30, 2009, multiplied by 12. For those leases where rent has not yet commenced, the first month in which rent is to be received is used to determine annualized base rent. |
| (2) | S&P credit ratings are as of June 30, 2009. Rankings of law firms are based on total gross revenue in 2008 as reported by American Lawyer Media's LAW.com. |
| (3) | Includes 20% of annualized rent and leased square footage for our MMO joint venture properties. |
| (4) | The weighted average calculation is based on the effective net rentable square feet leased by each tenant, which reflects our pro-rata share of our MMO joint venture. |
Maguire Properties, Inc.
Supplemental Operating and Financial Data
Second Quarter 2009
Maguire Properties, Inc.
Supplemental Operating and Financial Data
Second Quarter 2009
| Year | | Total Area in Square Feet Covered by Expiring Leases | | | Percentage of Aggregate Square Feet | | Annualized Rent | | | Percentage of Total Annualized Rent | | Current Rent per Square Foot (1) | | | Rent per Square Foot at Expiration (2) | |
| | | | | | | | | | | | | | | | | | | |
| Available | | | 3,128,213 | | | | 20.2 | % | | | | | | | | | | | | |
| 2009 | | | 332,106 | | | | 2.1 | % | | $ | 7,390,949 | | | | 2.7 | % | | $ | 22.25 | | | $ | 22.33 | |
| 2010 | | | 1,440,328 | | | | 9.3 | % | | | 33,780,628 | | | | 12.2 | % | | | 23.45 | | | | 23.80 | |
| 2011 | | | 2,321,910 | | | | 15.0 | % | | | 57,480,377 | | | | 20.8 | % | | | 24.76 | | | | 25.39 | |
| 2012 | | | 967,414 | | | | 6.2 | % | | | 20,747,123 | | | | 7.5 | % | | | 21.45 | | | | 23.51 | |
| 2013 | | | 2,389,838 | | | | 15.4 | % | | | 49,697,942 | | | | 17.9 | % | | | 20.80 | | | | 23.39 | |
| 2014 | | | 923,400 | | | | 5.9 | % | | | 17,530,546 | | | | 6.3 | % | | | 18.98 | | | | 22.25 | |
| 2015 | | | 857,572 | | | | 5.5 | % | | | 16,872,016 | | | | 6.1 | % | | | 19.67 | | | | 23.25 | |
| 2016 | | | 209,477 | | | | 1.4 | % | | | 3,932,326 | | | | 1.4 | % | | | 18.77 | | | | 25.09 | |
| 2017 | | | 962,143 | | | | 6.2 | % | | | 20,710,496 | | | | 7.5 | % | | | 21.53 | | | | 23.74 | |
| 2018 | | | 696,619 | | | | 4.5 | % | | | 19,463,469 | | | | 7.0 | % | | | 27.94 | | | | 38.52 | |
| Thereafter | | | 1,292,694 | | | | 8.3 | % | | | 29,460,456 | | | | 10.6 | % | | | 22.79 | | | | 34.82 | |
| Total | | | 15,521,714 | | | | 100.0 | % | | $ | 277,066,328 | | | | 100.0 | % | | $ | 22.36 | | | $ | 25.81 | |
| | | | | | | | | | | | | | | | | | | | | | | | | |
| Leases Expiring in the Next 4 Quarters: | |
| | | | | | | | | | | | | | | | | | | | | | | | | |
| 3rd Quarter 2009 | | | 84,170 | | | | 0.5 | % | | $ | 2,241,207 | | | | 0.8 | % | | $ | 26.63 | | | $ | 26.63 | |
| 4th Quarter 2009 (3) | | | 247,936 | | | | 1.6 | % | | | 5,149,742 | | | | 1.9 | % | | | 20.77 | | | | 20.87 | |
| 1st Quarter 2010 | | | 431,201 | | | | 2.8 | % | | | 9,247,205 | | | | 3.3 | % | | | 21.45 | | | | 21.45 | |
| 2nd Quarter 2010 | | | 400,336 | | | | 2.6 | % | | | 11,722,689 | | | | 4.2 | % | | | 29.28 | | | | 29.41 | |
| | | | 1,163,643 | | | | 7.5 | % | | $ | 28,360,843 | | | | 10.2 | % | | $ | 24.37 | | | $ | 24.44 | |
__________
| (1) | Current rent per leased square foot represents current base rent, divided by total square footage under lease as of the same date. |
| (2) | Rent per leased square foot at expiration represents base rent including any future rent steps, and thus represents the base rent that will be in place at lease expiration. |
| (3) | Includes tenants leasing on a month-to-month basis. |
Maguire Properties, Inc.
Supplemental Operating and Financial Data
Second Quarter 2009
Los Angeles County
| Year | | Total Area in Square Feet Covered by Expiring Leases | | | Percentage of Aggregate Square Feet | | Annualized Rent | | | Percentage of Total Annualized Rent | | Current Rent per Square Foot (1) | | | Rent per Square Foot at Expiration (2) | |
| | | | | | | | | | | | | | | | | | | |
| Available | | | 1,328,837 | | | | 13.5 | % | | | | | | | | | | | | |
| 2009 | | | 188,583 | | | | 1.9 | % | | $ | 4,070,896 | | | | 2.0 | % | | $ | 21.59 | | | $ | 21.71 | |
| 2010 | | | 888,947 | | | | 9.0 | % | | | 24,586,511 | | | | 12.1 | % | | | 27.66 | | | | 27.89 | |
| 2011 | | | 1,386,434 | | | | 14.1 | % | | | 39,546,663 | | | | 19.5 | % | | | 28.52 | | | | 29.03 | |
| 2012 | | | 634,904 | | | | 6.5 | % | | | 14,031,536 | | | | 6.9 | % | | | 22.10 | | | | 24.17 | |
| 2013 | | | 1,527,181 | | | | 15.5 | % | | | 31,536,818 | | | | 15.6 | % | | | 20.65 | | | | 23.13 | |
| 2014 | | | 506,880 | | | | 5.1 | % | | | 10,792,430 | | | | 5.3 | % | | | 21.29 | | | | 24.95 | |
| 2015 | | | 714,390 | | | | 7.3 | % | | | 13,967,500 | | | | 6.9 | % | | | 19.55 | | | | 23.06 | |
| 2016 | | | 176,577 | | | | 1.8 | % | | | 3,690,654 | | | | 1.8 | % | | | 20.90 | | | | 26.79 | |
| 2017 | | | 891,059 | | | | 9.1 | % | | | 19,258,080 | | | | 9.5 | % | | | 21.61 | | | | 23.77 | |
| 2018 | | | 610,643 | | | | 6.2 | % | | | 17,607,715 | | | | 8.7 | % | | | 28.83 | | | | 39.46 | |
| Thereafter | | | 986,591 | | | | 10.0 | % | | | 23,629,639 | | | | 11.7 | % | | | 23.95 | | | | 37.19 | |
| | | | 9,841,026 | | | | 100.0 | % | | $ | 202,718,442 | | | | 100.0 | % | | $ | 23.82 | | | $ | 27.69 | |
| | | | | | | | | | | | | | | | | | | | | | | | | |
| Leases Expiring in the Next 4 Quarters: | |
| | | | | | | | | | | | | | | | | | | | | | | | | |
| 3rd Quarter 2009 | | | 33,563 | | | | 0.3 | % | | $ | 816,955 | | | | 0.4 | % | | $ | 24.34 | | | $ | 24.34 | |
| 4th Quarter 2009 (3) | | | 155,020 | | | | 1.6 | % | | | 3,253,941 | | | | 1.6 | % | | | 20.99 | | | | 21.14 | |
| 1st Quarter 2010 | | | 295,537 | | | | 3.0 | % | | | 7,090,683 | | | | 3.5 | % | | | 23.99 | | | | 23.99 | |
| 2nd Quarter 2010 | | | 326,162 | | | | 3.3 | % | | | 10,440,943 | | | | 5.2 | % | | | 32.01 | | | | 32.17 | |
| | | | 810,282 | | | | 8.2 | % | | $ | 21,602,522 | | | | 10.7 | % | | $ | 26.66 | | | $ | 26.75 | |
__________
| (1) | Current rent per leased square foot represents current base rent, divided by total square footage under lease as of the same date. |
| (2) | Rent per leased square foot at expiration represents base rent including any future rent steps, and thus represents the base rent that will be in place at lease expiration. |
| (3) | Includes tenants leasing on a month-to-month basis. |
Maguire Properties, Inc.
Supplemental Operating and Financial Data
Second Quarter 2009
Lease Expirations - Wholly Owned Portfolio
| Year | | Total Area in Square Feet Covered by Expiring Leases | | | Percentage of Aggregate Square Feet | | Annualized Rent | | | Percentage of Total Annualized Rent | | Current Rent per Square Foot (1) | | | Rent per Square Foot at Expiration (2) | |
| | | | | | | | | | | | | | | | | | | |
| Available | | | 1,731,568 | | | | 32.1 | % | | | | | | | | | | | | |
| 2009 | | | 102,497 | | | | 1.9 | % | | $ | 2,326,971 | | | | 3.4 | % | | $ | 22.70 | | | $ | 22.70 | |
| 2010 | | | 537,283 | | | | 9.9 | % | | | 8,810,003 | | | | 12.7 | % | | | 16.40 | | | | 16.91 | |
| 2011 | | | 878,569 | | | | 16.3 | % | | | 16,518,100 | | | | 23.8 | % | | | 18.80 | | | | 19.47 | |
| 2012 | | | 310,046 | | | | 5.7 | % | | | 6,170,897 | | | | 8.9 | % | | | 19.90 | | | | 21.87 | |
| 2013 | | | 862,657 | | | | 16.0 | % | | | 18,140,258 | | | | 26.1 | % | | | 21.03 | | | | 23.85 | |
| 2014 | | | 408,661 | | | | 7.6 | % | | | 6,600,164 | | | | 9.5 | % | | | 16.15 | | | | 18.91 | |
| 2015 | | | 119,861 | | | | 2.2 | % | | | 2,271,662 | | | | 3.3 | % | | | 18.95 | | | | 22.63 | |
| 2016 | | | 32,900 | | | | 0.6 | % | | | 241,672 | | | | 0.3 | % | | | 7.35 | | | | 15.94 | |
| 2017 | | | 71,084 | | | | 1.3 | % | | | 1,452,416 | | | | 2.1 | % | | | 20.43 | | | | 23.39 | |
| 2018 | | | 85,976 | | | | 1.6 | % | | | 1,855,754 | | | | 2.7 | % | | | 21.58 | | | | 31.86 | |
| Thereafter | | | 260,157 | | | | 4.8 | % | | | 5,032,526 | | | | 7.2 | % | | | 19.34 | | | | 27.86 | |
| | | | 5,401,259 | | | | 100.0 | % | | $ | 69,420,423 | | | | 100.0 | % | | $ | 18.92 | | | $ | 21.39 | |
| | | | | | | | | | | | | | | | | | | | | | | | | |
| Leases Expiring in the Next 4 Quarters: | |
| | | | | | | | | | | | | | | | | | | | | | | | | |
| 3rd Quarter 2009 | | | 50,607 | | | | 0.9 | % | | $ | 1,369,723 | | | | 2.0 | % | | $ | 27.07 | | | $ | 27.07 | |
| 4th Quarter 2009 (3) | | | 51,890 | | | | 1.0 | % | | | 957,248 | | | | 1.4 | % | | | 18.45 | | | | 18.45 | |
| 1st Quarter 2010 | | | 135,664 | | | | 2.5 | % | | | 2,156,523 | | | | 3.1 | % | | | 15.90 | | | | 15.90 | |
| 2nd Quarter 2010 | | | 74,174 | | | | 1.4 | % | | | 1,281,746 | | | | 1.8 | % | | | 17.28 | | | | 17.28 | |
| | | | 312,335 | | | | 5.8 | % | | $ | 5,765,240 | | | | 8.3 | % | | $ | 18.46 | | | $ | 18.46 | |
__________
| (1) | Current rent per leased square foot represents current base rent, divided by total square footage under lease as of the same date. |
| (2) | Rent per leased square foot at expiration represents base rent including any future rent steps, and thus represents the base rent that will be in place at lease expiration. |
| (3) | Includes tenants leasing on a month-to-month basis. |
Maguire Properties, Inc.
Supplemental Operating and Financial Data
Second Quarter 2009
| Year | | Total Area in Square Feet Covered by Expiring Leases | | | Percentage of Aggregate Square Feet | | | Annualized Rent | | | Percentage of Total Annualized Rent | | Current Rent per Square Foot (1) | | | Rent per Square Foot at Expiration (2) | |
| | | | | | | | | | | | | | | | | | | |
| Available | | | 630,915 | | | | 16.3 | % | | | | | | | | | | | | |
| 2009 | | | 188,431 | | | | 4.9 | % | | $ | 3,902,752 | | | | 5.8 | % | | $ | 20.71 | | | $ | 20.78 | |
| 2010 | | | 457,294 | | | | 11.8 | % | | | 9,605,082 | | | | 14.3 | % | | | 21.00 | | | | 21.77 | |
| 2011 | | | 336,872 | | | | 8.7 | % | | | 6,473,885 | | | | 9.7 | % | | | 19.22 | | | | 20.83 | |
| 2012 | | | 338,646 | | | | 8.7 | % | | | 7,161,316 | | | | 10.7 | % | | | 21.15 | | | | 22.23 | |
| 2013 | | | 230,716 | | | | 6.0 | % | | | 5,088,550 | | | | 7.6 | % | | | 22.06 | | | | 25.47 | |
| 2014 | | | 805,800 | | | | 20.8 | % | | | 16,073,494 | | | | 24.0 | % | | | 19.95 | | | | 24.50 | |
| 2015 | | | 141,274 | | | | 3.6 | % | | | 2,814,740 | | | | 4.2 | % | | | 19.92 | | | | 23.38 | |
| 2016 | | | 89,923 | | | | 2.3 | % | | | 1,667,249 | | | | 2.5 | % | | | 18.54 | | | | 24.38 | |
| 2017 | | | 1,164 | | | | 0.0 | % | | | 30,264 | | | | 0.0 | % | | | 26.00 | | | | 30.00 | |
| 2018 | | | 81,744 | | | | 2.1 | % | | | 1,684,240 | | | | 2.5 | % | | | 20.60 | | | | 29.50 | |
| Thereafter | | | 571,485 | | | | 14.8 | % | | | 12,532,722 | | | | 18.7 | % | | | 21.93 | | | | 30.19 | |
| | | | 3,874,264 | | | | 100.0 | % | | $ | 67,034,294 | | | | 100.0 | % | | $ | 20.67 | | | $ | 24.43 | |
| | | | | | | | | | | | | | | | | | | | | | | | | |
| Leases Expiring in the Next 4 Quarters: | |
| | | | | | | | | | | | | | | | | | | | | | | | | |
| 3rd Quarter 2009 | | | 53,237 | | | | 1.4 | % | | $ | 1,160,898 | | | | 1.7 | % | | $ | 21.81 | | | $ | 21.82 | |
| 4th Quarter 2009 (3) | | | 135,194 | | | | 3.5 | % | | | 2,741,854 | | | | 4.1 | % | | | 20.28 | | | | 20.38 | |
| 1st Quarter 2010 | | | 150,503 | | | | 3.8 | % | | | 2,157,570 | | | | 3.2 | % | | | 14.34 | | | | 14.36 | |
| 2nd Quarter 2010 | | | 19,017 | | | | 0.5 | % | | | 446,101 | | | | 0.7 | % | | | 23.46 | | | | 24.20 | |
| | | | 357,951 | | | | 9.2 | % | | $ | 6,506,423 | | | | 9.7 | % | | $ | 18.18 | | | $ | 18.27 | |
__________
| (1) | Current rent per leased square foot represents current base rent, divided by total square footage under lease as of the same date. |
| (2) | Rent per leased square foot at expiration represents base rent including any future rent steps, and thus represents the base rent that will be in place at lease expiration. |
| (3) | Includes tenants leasing on a month-to-month basis. |
Maguire Properties, Inc.
Supplemental Operating and Financial Data
Second Quarter 2009
| | | Total Portfolio | | Effective Portfolio (1) |
| | | For the Three Months Ended June 30, 2009 | | | % Leased | | For the Three Months Ended June 30, 2009 | | | % Leased |
| | | | | | | | | | | | | |
| Leased Square Feet as of March 31, 2009 | | | 16,187,286 | | | | 79.4 | % | | | 13,593,224 | | | | 78.7 | % |
| Disposition - 500-600 City Parkway | | | (122,768 | ) | | | | | | | (122,768 | ) | | | | |
| Disposition - 3161 Michelson | | | (330,113 | ) | | | | | | | (330,113 | ) | | | | |
| Revised Leased Square Feet | | | 15,734,405 | | | | 81.2 | % | | | 13,140,343 | | | | 80.7 | % |
| Expirations | | | (739,665 | ) | | | (3.8 | )% | | | (550,506 | ) | | | (3.4 | )% |
| New Leases | | | 310,368 | | | | 1.6 | % | | | 282,670 | | | | 1.7 | % |
| Renewals | | | 331,742 | | | | 1.6 | % | | | 169,664 | | | | 1.0 | % |
| Leased Square Feet as of June 30, 2009 | | | 15,636,850 | | | | 80.6 | % | | | 13,042,171 | | | | 80.0 | % |
| | | | | | | | | | | | | | | | | |
| | | | | | | | | | | | | | | | | |
| | | | | | | | | | | | | | | | | |
| | | | | | | | | | | | | | | | | |
Cash Rent Growth (2), (3) | | | | | | | | | | | | | | | | |
| Expiring Rate per Square Foot | | | | | | | | | | | | | | $ | 19.75 | |
| New / Renewed Rate per Square Foot | | | | | | | | | | | | | | $ | 18.05 | |
| Percentage Change | | | | | | | | | | | | | | | (8.6 | )% |
| | | | | | | | | | | | | | | | | |
GAAP Rent Growth (3), (4) | | | | | | | | | | | | | | | | |
| Expiring Rate per Square Foot | | | | | | | | | | | | | | $ | 17.49 | |
| New / Renewed Rate per Square Foot | | | | | | | | | | | | | | $ | 18.25 | |
| Percentage Change | | | | | | | | | | | | | | | 4.4 | % |
| | | | | | | | | | | | | | | | | |
| Weighted Average Lease Term - New (in months) | | | | | | | | | | | | | | | 79 | |
| Weighted Average Lease Term - Renewal (in months) | | | | | | | | | | | | | | | 58 | |
__________ | (1) | Includes 100% of our consolidated portfolio and 20% of our MMO joint venture properties. |
| (2) | Represents the difference between (i) initial market rents on new and renewed leases and (ii) the cash rents on those spaces immediately prior to the expiration or termination. |
| (3) | For newly acquired properties, cash and GAAP rent growth is excluded for spaces that expired prior to our ownership and were re-leased after acquisition. |
| | Excludes new and renewed leases for spaces with more than twelve months of downtime and early renewals commencing after June 30, 2010. |
| (4) | Represents estimated cash rent growth adjusted for straight-line rents in accordance with GAAP. |
Maguire Properties, Inc.
Supplemental Operating and Financial Data
Second Quarter 2009
| | | Total Portfolio | | Effective Portfolio (1) |
| | | For the Three Months Ended June 30, 2009 | | | % Leased | | For the Three Months Ended June 30, 2009 | | | % Leased |
| | | | | | | | | | | | | |
| Leased Square Feet as of March 31, 2009, Los Angeles Central Business District | | | 7,940,096 | | | | 86.5 | % | | | 7,326,754 | | | | 87.4 | % |
| Expirations | | | (280,657 | ) | | | (3.1 | )% | | | (280,463 | ) | | | (3.4 | )% |
| New Leases | | | 84,189 | | | | 0.9 | % | | | 82,183 | | | | 1.0 | % |
| Renewals | | | 47,122 | | | | 0.5 | % | | | 47,122 | | | | 0.6 | % |
| Leased Square Feet as of June 30, 2009, Los Angeles Central Business District | | | 7,790,750 | | | | 84.8 | % | | | 7,175,596 | | | | 85.6 | % |
| | | | | | | | | | | | | | | | | |
Cash Rent Growth (2), (3) | | | | | | | | | | | | | | | | |
| Expiring Rate per Square Foot | | | | | | | | | | | | | | $ | 21.89 | |
| New / Renewed Rate per Square Foot | | | | | | | | | | | | | | $ | 20.44 | |
| Percentage Change | | | | | | | | | | | | | | | (6.6 | )% |
| | | | | | | | | | | | | | | | | |
GAAP Rent Growth (3), (4) | | | | | | | | | | | | | | | | |
| Expiring Rate per Square Foot | | | | | | | | | | | | | | $ | 19.31 | |
| New / Renewed Rate per Square Foot | | | | | | | | | | | | | | $ | 20.47 | |
| Percentage Change | | | | | | | | | | | | | | | 6.0 | % |
| | | | | | | | | | | | | | | | | |
| Weighted Average Lease Term - New (in months) | | | | | | | | | | | | | | | 74 | |
| Weighted Average Lease Term - Renewal (in months) | | | | | | | | | | | | | | | 65 | |
__________ | (1) | Includes 100% of our consolidated portfolio and 20% of our MMO joint venture properties. |
| (2) | Represents the difference between (i) initial market rents on new and renewed leases and (ii) the cash rents on those spaces immediately prior to the expiration or termination. |
| (3) | For newly acquired properties, cash and GAAP rent growth is excluded for spaces that expired prior to our ownership and were re-leased after acquisition. |
| | Excludes new and renewed leases for spaces with more than twelve months of downtime and early renewals commencing after June 30, 2010. |
| (4) | Represents estimated cash rent growth adjusted for straight-line rents in accordance with GAAP. |
Maguire Properties, Inc.
Supplemental Operating and Financial Data
Second Quarter 2009
| | | Total Portfolio | | Effective Portfolio (1) |
| | | For the Three Months Ended June 30, 2009 | | | % Leased | | For the Three Months Ended June 30, 2009 | | | % Leased |
| | | | | | | | | | | | | |
| Leased Square Feet as of March 31, 2009, Orange County | | | 4,425,633 | | | | 62.5 | % | | | 4,113,183 | | | | 63.0 | % |
| Disposition - 500-600 City Parkway | | | (122,768 | ) | | | | | | | (122,768 | ) | | | | |
| Disposition - 3161 Michelson | | | (330,113 | ) | | | | | | | (330,113 | ) | | | | |
| Revised Leased Square Feet | | | 3,972,752 | | | | 65.3 | % | | | 3,660,302 | | | | 66.1 | % |
| Expirations | | | (187,380 | ) | | | (3.1 | )% | | | (178,826 | ) | | | (3.2 | )% |
| New Leases | | | 214,063 | | | | 3.5 | % | | | 195,484 | | | | 3.5 | % |
| Renewals | | | 73,350 | | | | 1.2 | % | | | 73,350 | | | | 1.3 | % |
| Leased Square Feet as of June 30, 2009, Orange County | | | 4,072,785 | | | | 66.9 | % | | | 3,750,310 | | | | 67.7 | % |
| | | | | | | | | | | | | | | | | |
| | | | | | | | | | | | | | | | | |
Cash Rent Growth (2), (3) | | | | | | | | | | | | | | | | |
| Expiring Rate per Square Foot | | | | | | | | | | | | | | $ | 18.69 | |
| New / Renewed Rate per Square Foot | | | | | | | | | | | | | | $ | 13.88 | |
| Percentage Change | | | | | | | | | | | | | | | (25.7 | )% |
| | | | | | | | | | | | | | | | | |
GAAP Rent Growth (3), (4) | | | | | | | | | | | | | | | | |
| Expiring Rate per Square Foot | | | | | | | | | | | | | | $ | 16.16 | |
| New / Renewed Rate per Square Foot | | | | | | | | | | | | | | $ | 14.66 | |
| Percentage Change | | | | | | | | | | | | | | | (9.3 | )% |
| | | | | | | | | | | | | | | | | |
| Weighted Average Lease Term - New (in months) | | | | | | | | | | | | | | | 81 | |
| Weighted Average Lease Term - Renewal (in months) | | | | | | | | | | | | | | | 53 | |
___________ | (1) | Includes 100% of our consolidated portfolio and 20% of our MMO joint venture properties. |
| (2) | Represents the difference between (i) initial market rents on new and renewed leases and (ii) the cash rents on those spaces immediately prior to the expiration or termination. |
| (3) | For newly acquired properties, cash and GAAP rent growth is excluded for spaces that expired prior to our ownership and were re-leased after acquisition. |
| | Excludes new and renewed leases for spaces with more than twelve months of downtime and early renewals commencing after June 30, 2010. |
| (4) | Represents estimated cash rent growth adjusted for straight-line rents in accordance with GAAP. |
Maguire Properties, Inc.
Supplemental Operating and Financial Data
Second Quarter 2009
| | | For the Three Months Ended | | | | For the Year Ended December 31, | |
| | | June 30, 2009 | | | March 31, 2009 | | | | 2008 | | | 2007 | | | 2006 | |
Renewals (3) | | | | | | | | | | | | | | | | |
| Number of Leases | | | 26 | | | | 25 | | | | | 130 | | | | 152 | | | | 74 | |
| Square Feet | | | 143,204 | | | | 146,677 | | | | | 664,524 | | | | 881,406 | | | | 824,516 | |
| Tenant Improvement Costs per Square Foot (4) | | $ | 10.44 | | | $ | 10.91 | | | | $ | 13.95 | | | $ | 11.69 | | | $ | 29.22 | |
| Leasing Commission Costs per Square Foot | | $ | 5.28 | | | $ | 6.05 | | | | $ | 5.53 | | | $ | 5.14 | | | $ | 8.18 | |
| Total Tenant Improvements and Leasing Commissions | | | | | | | | | | | | | | | | | | | | | |
| Costs per Square Foot | | $ | 15.72 | | | $ | 16.96 | | | | $ | 19.48 | | | $ | 16.83 | | | $ | 37.40 | |
| Costs per Square Foot per Year | | $ | 3.00 | | | $ | 3.12 | | | | $ | 4.36 | | | $ | 3.41 | | | $ | 4.78 | |
| | | | | | | | | | | | | | | | | | | | | | |
New / Modified Leases (5) | | | | | | | | | | | | | | | | | | | | | |
| Number of Leases | | | 31 | | | | 23 | | | | | 163 | | | | 141 | | | | 147 | |
| Square Feet | | | 281,409 | | | | 116,771 | | | | | 1,115,055 | | | | 893,634 | | | | 1,015,192 | |
| Tenant Improvement Costs per Square Foot (4) | | $ | 14.47 | | | $ | 17.94 | | | | $ | 41.97 | | | $ | 22.89 | | | $ | 20.93 | |
| Leasing Commission Costs per Square Foot | | $ | 6.20 | | | $ | 4.70 | | | | $ | 10.11 | | | $ | 6.52 | | | $ | 6.34 | |
| Total Tenant Improvements and Leasing Commissions | | | | | | | | | | | | | | | | | | | | | |
| Costs per Square Foot | | $ | 20.67 | | | $ | 22.64 | | | | $ | 52.08 | | | $ | 29.41 | | | $ | 27.27 | |
| Costs per Square Foot per Year | | $ | 3.14 | | | $ | 5.20 | | | | $ | 5.98 | | | $ | 5.00 | | | $ | 4.33 | |
| | | | | | | | | | | | | | | | | | | | | | |
| Total | | | | | | | | | | | | | | | | | | | | | |
| Number of Leases | | | 57 | | | | 48 | | | | | 293 | | | | 293 | | | | 221 | |
| Square Feet | | | 424,613 | | | | 263,448 | | | | | 1,779,579 | | | | 1,775,040 | | | | 1,839,708 | |
| Tenant Improvement Costs per Square Foot (4) | | $ | 13.11 | | | $ | 14.02 | | | | $ | 31.51 | | | $ | 17.33 | | | $ | 24.64 | |
| Leasing Commission Costs per Square Foot | | $ | 5.89 | | | $ | 5.45 | | | | $ | 8.40 | | | $ | 5.84 | | | $ | 7.16 | |
| Total Tenant Improvements and Leasing Commissions | | | | | | | | | | | | | | | | | | | | | |
| Costs per Square Foot | | $ | 19.00 | | | $ | 19.47 | | | | $ | 39.91 | | | $ | 23.17 | | | $ | 31.80 | |
| Costs per Square Foot per Year | | $ | 3.10 | | | $ | 3.93 | | | | $ | 5.60 | | | $ | 4.28 | | | $ | 4.55 | |
__________
| (1) | Based on leases executed during the period. Excludes leases to related parties, short-term leases less than six months, and leases for raw space. |
| (2) | Tenant improvements and leasing commission information for 2009, 2008 and 2007 reflects 100% of the consolidated portfolio and 20% of the MMO joint venture properties. Information for 2006 reflects 100% of the consolidated portfolio and 100% of the MMO joint venture properties. |
| (3) | Does not include retained tenants that have relocated to new space or expanded into new space. |
| (4) | Tenant improvements include improvements and lease concessions. |
| (5) | Includes retained tenants that have relocated or expanded into new space and lease modifications. |
Maguire Properties, Inc.
Supplemental Operating and Financial Data
Second Quarter 2009
Historical Capital Expenditures — Office Properties (1)
| | | For the Three Months Ended | | | | For the Year Ended December 31, | |
| | | June 30, 2009 | | | March 31, 2009 | | | | 2008 | | | 2007 | | | 2006 | |
| | | | | | | | | | | | | | | | | |
| Consolidated | | | | | | | | | | | | | | | | |
| Non-recoverable capital expenditures (2) | | $ | 922,650 | | | $ | 1,076,771 | | | | $ | 10,571,743 | | | $ | 11,326,800 | | | $ | 2,454,126 | |
| Total square feet | | | 14,996,814 | | | | 15,452,055 | | | | | 15,498,637 | | | | 16,051,311 | | | | 11,625,028 | |
| Non-recoverable capital expenditures per square foot | | $ | 0.06 | | | $ | 0.07 | | | | $ | 0.68 | | | $ | 0.71 | | | $ | 0.21 | |
| Unconsolidated | | | | | | | | | | | | | | | | | | | | | |
| Non-recoverable capital expenditures (3) | | $ | 20,784 | | | $ | 197,799 | | | | $ | 220,946 | | | $ | 50,406 | | | $ | 153,069 | |
Total square feet (4) | | | 709,546 | | | | 682,614 | | | | | 635,670 | | | | 624,674 | | | | 622,561 | |
| Non-recoverable capital expenditures per square foot | | $ | 0.03 | | | $ | 0.29 | | | | $ | 0.35 | | | $ | 0.08 | | | $ | 0.25 | |
| | | | | | | | | | | | | | | | | | | | | | |
| Consolidated | | | | | | | | | | | | | | | | | | | | | |
| Recoverable capital expenditures (5) | | $ | 320,148 | | | $ | 89,670 | | | | $ | 1,197,266 | | | $ | 2,857,483 | | | $ | 1,329,624 | |
| Total square feet | | | 14,996,814 | | | | 15,452,055 | | | | | 15,498,637 | | | | 16,051,311 | | | | 11,625,028 | |
| Recoverable capital expenditures per square foot | | $ | 0.02 | | | $ | 0.01 | | | | $ | 0.08 | | | $ | 0.18 | | | $ | 0.11 | |
| Unconsolidated | | | | | | | | | | | | | | | | | | | | | |
| Recoverable capital expenditures (3), (5) | | $ | 792 | | | $ | 17,128 | | | | $ | 30,524 | | | $ | 5,779 | | | $ | 122,149 | |
| Total square feet (4) | | | 709,546 | | | | 682,614 | | | | | 635,670 | | | | 624,674 | | | | 622,561 | |
| Recoverable capital expenditures per square foot | | $ | – | | | $ | 0.03 | | | | $ | 0.05 | | | $ | 0.01 | | | $ | 0.20 | |
__________ | (1) | Historical capital expenditures for each period shown reflect properties owned for the entire period. For properties acquired during each period, the capital expenditures will be reflected in the following full period of ownership. For properties sold during each period, the capital expenditures will be excluded for that period. Any capital expenditures incurred during the period of acquisition or disposition will be footnoted separately. |
| (2) | For 2008, excludes $6.4 million of non-recoverable capital expenditures as a result of discretionary renovation costs of $6.1 million at KPMG Tower and $0.3 million of planned renovation costs at Lantana Media Campus. For 2007, excludes $3.8 million of non-recoverable capital expenditures as a result of discretionary renovation costs of $1.9 million at KPMG Tower and $1.9 million of planned renovation costs at Lantana Media Campus. For 2006, excludes $0.5 million of non-recoverable capital expenditures incurred at acquired properties following their acquisition. |
| (3) | Amount represents our 20% ownership interest in our joint venture with Macquarie Office Trust. |
| (4) | The square footages of Cerritos Corporate Center Phases I and II are deducted from the total square feet amount as the tenants pay for all capital expenditures. |
| (5) | Recoverable capital improvements, such as equipment upgrades, are generally financed through capital leases. The annual amortization, based on each asset’s useful life, as well as any financing costs, are generally billed to tenants on an annual basis as payments are made. The amounts presented represent the total value of the improvements in the year they are made. |
Maguire Properties, Inc.
Supplemental Operating and Financial Data
Second Quarter 2009
| Hotel Performance |
| | | | | |
| | | For the Three Months Ended June 30, | | For the Six Months Ended June 30, |
| | | | | | | | | Percent | | | | | | |
| Westin Hotel, Pasadena, CA | | 2009 | | 2008 | | Change | | 2009 | | 2008 |
| Occupancy | | | 72.6 | % | | | 86.9 | % | | | (16.4 | )% | | | 69.8 | % | | | 83.4 | % |
| Average daily rate | | $ | 155.69 | | | $ | 176.54 | | | | (11.8 | )% | | $ | 161.25 | | | $ | 178.15 | |
| Revenue per available room (REVPAR) | | $ | 113.05 | | | $ | 153.49 | | | | (26.3 | )% | | $ | 112.50 | | | $ | 148.58 | |
| Hotel net operating income | | $ | 1,667,515 | | | $ | 2,508,723 | | | | (33.5 | )% | | $ | 3,212,508 | | | $ | 4,884,711 | |
| | | | | | | | | | | | | | | | | | | | | |
| | | | | | | | | | | | | | | | | | | | | |
| Hotel Historical Capital Expenditures |
| | | | | | | | | | | | | | | | | | | | | |
| | | For the Three Months Ended June 30, | | For the Year Ended December 31, |
| Westin Hotel, Pasadena, CA | | 2009 | | 2008 | | 2008 | | 2007 | | 2006 |
| Hotel improvements and equipment replacements | | $ | 251,498 | | | $ | 110,703 | | | $ | 699,531 | | | $ | 712,955 | | | $ | 730,531 | |
| Total hotel revenue | | $ | 5,148,478 | | | $ | 6,986,098 | | | $ | 26,615,726 | | | $ | 27,214,156 | | | $ | 27,053,648 | |
| Hotel improvements as a percentage of hotel revenue | | | 4.9 | % | | | 1.6 | % | | | 2.6 | % | | | 2.6 | % | | | 2.7 | % |
| Renovation and upgrade costs | | $ | – | | | $ | – | | | $ | – | | | $ | – | | | $ | 164,072 | |
Maguire Properties, Inc.
Supplemental Operating and Financial Data
Second Quarter 2009
| | | | | | | | As of June 30, 2009 | | | | | | | |
| Property | | Location | | | Percentage Pre-Leased | | Land Value (1) | | | Construction Costs Incurred | | | Estimated Cost of Development (2) | | | Developed / Developable Square Feet (3) | | | Estimated Date of Completion | |
| | | | | | | | | (in millions) | | | (in millions) | | | (in millions) | | | | | | | |
| Los Angeles County | | | | | | | | | | | | | | | | | | | | | | | | | | | | |
| | | | | | | | | | | | | | | | | | | | | | | | | | | | | |
| 207 Goode Avenue | | Glendale, CA | | | | 0 | % | | $ | 14.8 | | | $ | 47.8 | | | $ | 64.5 | | | | 189,000 | | | 2009 | |
__________ | (1) | Land value represents the total land cost attributable to the entire project and includes amounts capitalized for interest in excess of construction loan interest reserves and property taxes totaling approximately $3 million. |
| (2) | The estimated cost of development excludes land. |
| (3) | The developable square feet represents the office square footage that we estimate can be developed on the referenced property. |
Maguire Properties, Inc.
Supplemental Operating and Financial Data
Second Quarter 2009
| | | | | As of June 30, 2009 | | |
| Property | | Location | | Developable Square Feet (1) | | | Structured Parking Square Feet | | Type of Planned Development |
| | | | | | | | | | |
| Los Angeles County | | | | | | | | | |
| 755 South Figueroa | | Los Angeles, CA | | | 930,000 | | | | 266,000 | | Office |
| Glendale Center - Phase II | | Glendale, CA | | | 264,000 | | | | 158,000 | | Mixed Use |
| | | Total Los Angeles County | | | 1,194,000 | | | | 424,000 | | |
| | | | | | | | | | | | |
| Orange County | | | | | | | | | | | |
| | | | | | | | | | | | |
| Stadium Tower II | | Anaheim, CA | | | 282,000 | | | | 367,000 | | Office |
| Brea Financial Commons/Brea Corporate Place (2) | | Brea, CA | | | 550,000 | | | | 784,000 | | Office, Mixed Use |
| Pacific Arts Plaza | | Costa Mesa, CA | | | 468,000 | | | | 260,000 | | Office |
| | | | | | 225,000 | | | | | | Residential (3) |
| Park Place | | Irvine, CA | | | 1,237,000 | | | | 2,376,000 | | Office, Retail & Hotel |
| | | | | | 1,048,000 | | | | | | Residential |
| 2600 Michelson (4) | | Irvine, CA | | | 270,000 | | | | 154,000 | | Office |
| 500 Orange Center (5) | | Orange, CA | | | 900,000 | | | | 960,000 | | Office |
| City Tower II (6) | | Orange, CA | | | 465,000 | | | | 696,000 | | Office |
| | | Total Orange County | | | 5,445,000 | | | | 5,597,000 | | |
| | | | | | | | | | | | |
| San Diego | | | | | | | | | | | |
| San Diego Tech Center (7), (8) | | Sorrento Mesa, CA | | | 1,320,000 | | | | 1,674,000 | | Office |
| | | Total San Diego County | | | 1,320,000 | | | | 1,674,000 | | |
| | | Total Portfolio | | | 7,959,000 | | | | 7,695,000 | | |
Maguire Properties, Inc.
Supplemental Operating and Financial Data
Second Quarter 2009
__________
| (1) | The developable square feet presented represents the office, retail, hotel and residential footages that we estimate can be developed on the referenced property. |
| (2) | The developable square feet presented represents management’s estimate of the development potential for the referenced property based on the allowed density under current zoning and capacity considerations for the site still under planning review. |
| (3) | The developable square feet presented represents management’s estimate of the development potential for the referenced property based on the construction of 180 residential units as contemplated under a Program EIR completed by the City of Costa Mesa for this and other surrounding properties. This residential development would replace an existing 67,450 square foot office building at Pacific Arts Plaza. |
| (4) | The developable square feet presented represents management’s estimate of the development potential for the referenced property based on an allocation of excess trips reserved from our disposition of Inwood Park, which we have been in discussion with the City of Irvine over securing, and the potential utilization of excess trips from our other assets in the Irvine Business Complex (i.e., Park Place). |
| (5) | The developable square feet presented represents management’s estimate of the development potential for the referenced property based on the allowed density under current zoning. Approximately 60,000 square feet of the estimated development potential will require the consolidation of an adjacent remnant parcel in cooperation with the City of Orange. |
| (6) | The developable square feet presented represents management’s estimate of the development potential for the referenced property based on the allowed density under a Conditional Use Permit obtained for the property in 2001, which has since expired. |
| (7) | Land held for development was not contributed to the MMO joint venture. |
| (8) | The third phase contemplates the demolition of 120,000 square feet of existing space. |
Maguire Properties, Inc.
Supplemental Operating and Financial Data
Second Quarter 2009
Funds from Operations:
Fund from Operations, or FFO, is a widely recognized measure of REIT performance. We calculate FFO as defined by the National Association of Real Estate Investment Trusts, or NAREIT. FFO represents net income (loss) (as computed in accordance with accounting principles generally accepted in the United States of America, or GAAP), excluding gains from disposition of property (but including impairments and provisions for losses on property held for sale), plus real estate-related depreciation and amortization (including capitalized leasing costs and tenant allowances or improvements). Adjustments for our unconsolidated joint venture are calculated to reflect FFO on the same basis.
Management uses FFO as a supplemental performance measure because, in excluding real estate-related depreciation and amortization and gains from property dispositions, it provides a performance measure that, when compared year over year, captures trends in occupancy rates, rental rates and operating costs. We also believe that, as a widely recognized measure of the performance of REITs, FFO will be used by investors as a basis to compare our operating performance with that of other REITs.
However, because FFO excludes depreciation and amortization and captures neither the changes in the value of our properties that result from use or market conditions nor the level of capital expenditures and leasing commissions necessary to maintain the operating performance of our properties, all of which have real economic effect and could materially impact our results of operations, the utility of FFO as a measure of our performance is limited. Other Equity REITs may not calculate FFO in accordance with the NAREIT definition and, accordingly, our FFO may not be comparable to such other Equity REITs’ FFO. As a result, FFO should be considered only as a supplement to net income as a measure of our performance. FFO should not be used as a measure of our liquidity, nor is it indicative of funds available to meet our cash needs, including our ability to pay dividends or make distributions. FFO also should not be used as a supplement to or substitute for cash flows from operating activities (as computed in accordance with GAAP).
FFO before specified items:
Management also uses FFO before specified items as a supplemental performance measure because losses from early extinguishment of debt and the impairment of long-lived assets create significant earnings volatility which in turn results in less comparability between reporting periods and less predictability regarding future earnings potential.
Losses from early extinguishment of debt represent costs to extinguish debt prior to the stated maturity and the write off of unamortized loan costs on the date of extinguishment. The decision to extinguish debt prior to its maturity generally results from (i) the assumption of debt in connection with property acquisitions that is priced or structured at less than desirable terms (for example, a variable interest rate instead of a fixed interest rate), (ii) short-term bridge financing obtained in connection with the acquisition of a property or portfolio of properties until such time as the company completes its long-term financing strategy, (iii) the early repayment of debt associated with properties disposed of, or (iv) the restructuring or replacement of property or corporate-level financing to accommodate property acquisitions. Consequently, management views these losses as costs to complete the respective acquisition or disposition of properties.
Maguire Properties, Inc.
Supplemental Operating and Financial Data
Second Quarter 2009
Management Statements on Non-GAAP Supplemental Measures (continued)
FFO before specified items: (continued)
Impairment of long-lived assets represents non-cash charges taken to write down depreciable real estate assets to fair value estimated when events or changes in circumstances indicate that the carrying amount may not be recoverable. Per the NAREIT definition of FFO, gains from property dispositions are excluded from the calculation of FFO; however, impairment losses are required to be included. Management excludes both gains on disposal and impairment losses from the calculation of FFO before specified items because they both relate to the financial statement impact of decisions made to dispose of property, whether in the period of disposition or in advance of disposition. These types of gains or losses create volatility in our earnings and make it difficult for investors to determine the funds generated by our ongoing business operations.
Additionally, during the second quarter of 2008, we have excluded from the calculation of FFO before specified items costs associated with our review of strategic alternatives and management changes, primarily contractual separation obligations for our former senior executives, and exit costs and tenant improvement writeoffs related to the 1733 Ocean lease. These costs are associated with the Special Committee’s review of strategic alternatives, including the potential sale of our company, and the resulting management changes made after the Special Committee concluded its review. Management views these costs as non-recurring and believes that including these costs in the calculation of FFO would make it difficult for investors to determine the funds generated by our ongoing business operations.
Adjusted Funds from Operations:
We calculate adjusted funds from operations, or AFFO, by adding to or subtracting from FFO (i) non-cash operating revenues and expenses, (ii) capitalized operating expenditures such as leasing and development payroll and interest expense, (iii) recurring and non-recurring capital expenditures required to maintain and re-tenant our properties, (iv) regular principal payments required to service our debt, and (v) 2nd generation tenant improvements and leasing commissions. Management uses AFFO as a supplemental liquidity measure because, when compared year over year, it assesses our ability to fund our dividend and distribution requirements from our operating activities. We also believe that, as a widely recognized measure of the liquidity of REITs, AFFO will be used by investors as a basis to assess our ability to fund dividend payments in comparison to other REITs.
However, because AFFO may exclude certain non-recurring capital expenditures and leasing costs, the utility of AFFO as a measure of our liquidity is limited. Additionally, other Equity REITs may not calculate AFFO using the method we do. As a result, our AFFO may not be comparable to such other Equity REITs’ AFFO. AFFO should be considered only as a supplement to cash flows from operating activities (as computed in accordance with GAAP) as a measure of our liquidity.
Maguire Properties, Inc.
Supplemental Operating and Financial Data
Second Quarter 2009
Management Statements on Non-GAAP Supplemental Measures (continued)
EBITDA:
Management uses EBITDA as an indicator of our ability to incur and service debt. We believe EBITDA is an appropriate supplemental measure for such purposes, because the amounts spent on interest are, by definition, available to pay interest, income tax expense is inversely correlated to interest expense because tax expense goes down as deductible interest expense goes up, and depreciation and amortization are non-cash charges. In addition, we believe EBITDA is frequently used by securities analysts, investors and other interested parties in the evaluation of Equity REITs. However, because EBITDA is calculated before recurring cash charges including interest expense and income taxes, and is not adjusted for capital expenditures or other recurring cash requirements of our business, its utility as a measure of our liquidity is limited. Accordingly, EBITDA should not be considered an alternative to cash flows from operating activities (as computed in accordance with GAAP) as a measure of our liquidity. EBITDA should not be considered as an alternative to net income as an indicator of our operating performance. Other Equity REITs may calculate EBITDA differently than we do; accordingly, our EBITDA may not be comparable to such other Equity REITs’ EBITDA.
Adjusted EBITDA:
Management also uses Adjusted EBITDA as a supplemental performance measure because losses from early extinguishment of debt and the impairment of long-lived assets create significant earnings volatility which in turn results in less comparability between reporting periods and less predictability regarding future earnings potential.
Losses from early extinguishment of debt represent costs to extinguish debt prior to the stated maturity and the write off of unamortized loan costs on the date of extinguishment. The decision to extinguish debt prior to its maturity generally results from (i) the assumption of debt in connection with property acquisitions that is priced or structured at less than desirable terms (for example, a variable interest rate instead of a fixed interest rate), (ii) short-term bridge financing obtained in connection with the acquisition of a property or portfolio of properties until such time as the company completes its long-term financing strategy, (iii) the early repayment of debt associated with properties disposed of, or (iv) the restructuring or replacement of property or corporate-level financing to accommodate property acquisitions. Consequently, management views these losses as costs to complete the respective acquisition or disposition of properties.
Impairment of long-lived assets represents non-cash charges taken to write down depreciable real estate assets to fair value estimated when events or changes in circumstances indicate that the carrying amount may not be recoverable. Management excludes both gains on disposal and impairment losses from the calculation of Adjusted EBITDA because they both relate to the financial statement impact of decisions made to dispose of property, whether in the period of disposition or in advance of disposition. These types of gains or losses create volatility in our earnings and make it difficult for investors to determine the earnings generated by our ongoing business operations.
Maguire Properties, Inc.
Supplemental Operating and Financial Data
Second Quarter 2009
Management Statements on Non-GAAP Supplemental Measures (continued)
Adjusted EBITDA: (continued)
Additionally, during the second quarter of 2008, we have excluded from the calculation of Adjusted EBITDA costs associated with our review of strategic alternatives and management changes, primarily contractual separation obligations for our former senior executives, and exit costs and tenant improvement writeoffs related to the 1733 Ocean lease. These costs are associated with the Special Committee’s review of strategic alternatives, including the potential sale of our company, and the resulting management changes made after the Special Committee concluded its review. Management views these costs as non-recurring and believes that including these costs in the calculation of EBITDA would make it difficult for investors to determine the earnings generated by our ongoing business operations.
Coverage Ratios:
We present interest and fixed charge coverage ratios as supplemental liquidity measures. Management uses these ratios as indicators of our financial flexibility to service current interest expense and debt amortization from current cash net operating income. In addition, we believe that these coverage ratios represent common metrics used by securities analysts, investors and other interested parties to evaluate our ability to service fixed cash payments. However, because these ratios are derived from EBITDA, their utility is limited by the same factors that limit the usefulness of EBITDA as a liquidity measure. Accordingly, our interest coverage ratio should not be considered as an alternative to cash flows from operating activities (as computed in accordance with GAAP) as a measure of our liquidity.
49