UNITED STATES
SECURITIES AND EXCHANGE COMMISSION
Washington, D.C. 20549
FORM N-CSR
CERTIFIED SHAREHOLDER REPORT OF REGISTERED
MANAGEMENT INVESTMENT COMPANIES
Investment Company Act file number 811-21279
The Merger Fund VL
(Exact name of registrant as specified in charter)
100 Summit Lake Drive
Valhalla, New York 10595
(Address of principal executive offices) (Zip code)
Bonnie L. Smith
100 Summit Lake Drive
Valhalla, New York 10595
(Name and address of agent for service)
914-741-5600
Registrant's telephone number, including area code
Date of fiscal year end: December 31, 2009
Date of reporting period: December 31, 2009
Item 1. Reports to Stockholders.
THE MERGER FUND VL
ANNUAL REPORT
DECEMBER 31, 2009
February 8, 2010
Dear Fellow Shareholder:
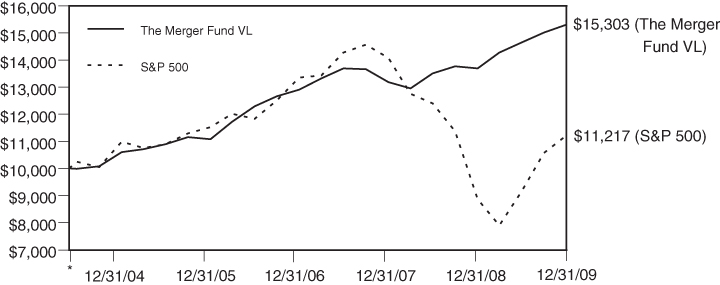
As previously reported, The Merger Fund VL posted a gain of 11.8% in 2009, comfortably meeting our rate-of-return targets. From inception in May of 2004 through the end of last year, the Fund showed an average annualized return of 7.9%. Not only does this performance compare favorably to the 2.1% annualized return recorded by the S&P 500 over the same period, but our results have also been far less volatile—especially during the global financial meltdown—than those shown by most other equity mutual funds.
Much of this exemplary track record has to do with the Fund’s highly specialized investment approach. Instead of making directional, open-ended bets whose success is largely dependent on where the stock market is headed, virtually all of our investments are tied to announced corporate reorganizations that have a “date with destiny.” If we do our job well, The Merger Fund VL should continue to deliver attractive risk-adjusted returns to its shareholders.
Deal selection is normally the key driver of the Fund’s results, and last year was no exception. Of the 126 mergers, takeovers and other corporate reorganizations in which we held positions during 2009, 115 proceeded more or less as expected. Of the remaining six deals that were subject to definitive agreements, three were terminated—although one of the targets ended up in a transaction with another buyer—one was completed at a lower price and two were completed at a higher price after interlopers came in with topping bids. Five “pre-deal” situations fell into the failed-transaction category. All in all, our batting average was pretty good.
Going Against the Odds
Once again, we have included a series of charts which reflect the nature of the arbitrage opportunities in which the Fund has recently invested. Chart 1 shows that as of December 31, friendly transactions comprised about 92% of the dollar value of our long positions, while unsolicited, or hostile, takeover attempts accounted for approximately 8%. A year earlier, hostile deals also represented about 8% of our portfolio.
Whereas the S&P 500’s 37% decline in 2008 caused many potential takeover candidates to trade at prices that were perceived to be well below intrinsic value—thereby encouraging hostile approaches by opportunistic corporate acquirers—the stock market’s strong recovery since its March 2009 lows has made it harder for prospective buyers to offer the big takeover premiums required to force their reluctant targets to the negotiating table. Nonetheless, with hostile deals accounting for 8% of our recent investments, a relatively high percentage by historical standards, it’s clear that a number of companies are still identifying acquisition opportunities sufficiently compelling to warrant an aggressive approach to deal-making.
That’s not to say that these would-be acquirers will be any more successful in their efforts than the other companies which have gone down this path in the past. We have frequently written about how difficult it is to complete an unwelcome takeover, and little has changed in this regard over the past year or so. For most targets, the standard defenses against unsolicited offers—poison pills, staggered boards and target-friendly state laws—remain in place. What is different, however, is that hostile buyers, like corporate acquirers in general, now possess more financial firepower with which to pursue deals, thanks to stronger balance sheets, improved access to the debt markets and higher-valued shares to use as an acquisition currency. Unsolicited takeover attempts, in other words, aren’t going away and could accelerate should more companies conclude that opportunities for organic growth are limited and that going hostile is worth the risk.
From an arbitrage standpoint, we generally don’t care whether the target of an unsolicited offer ends up in a deal with the original bidder or with a white knight that agrees to pay more, as long as the ultimate deal price is above our cost. It’s also worth noting that whether a proposed takeover is friendly or hostile, we apply the same qualitative and quantitative analysis to evaluate the potential investment.
Private Equity Regroups
Chart 2 shows that virtually all of the pending takeovers in the Fund’s portfolio as of December 31 were strategic in nature. By “strategic,” we mean combinations that involve a corporate buyer—typically operating in the same industry as the target—whose objective in doing the transaction is to enhance shareholder value over the long term. Financial, or going-private, deals, in which an investor group with a shorter time horizon uses mostly debt to buy out the target’s public shareholders, have been few and far between over the past 12 months. In contrast to two or three years ago, a time when private equity gobbled up big chunks of Corporate America, financial buyers no longer have access to vast amounts of debt carrying low interest rates and few protections for the lenders. The big banks, having lost billions on these borrower-friendly loans, are determined not to make the same mistake again. Tighter lending standards mean that financial buyers must fund their deals with less debt and more equity. And with less leverage, it’s harder to make the numbers work, especially when a private-equity firm is in competition with a strategic buyer able to realize greater deal-related synergies.
Faced with a less favorable environment for takeovers of public companies, some private-equity firms are diversifying into money management and investment banking. And instead of doing the mega deals that were common just a few years ago, financial players will probably use a good portion of their estimated $400 billion in uncommitted capital to do smaller transactions, including buying divisions or product lines from companies that no longer view them as strategically important. The bottom line is that leveraged buyouts are likely to remain a relatively small percentage of the Fund’s investments unless private-equity firms decide to accept lower rates of return on public deals.
A Big Change in the Mix
Chart 3 shows the type of merger consideration to be received by the selling company’s shareholders in transactions in which the Fund held positions at the end of December. Cash appears to be losing some of its luster when it comes to deal-making. A year ago, all-cash takeovers accounted for 75% of our investments, but by this December the number had fallen to 22%. Cash-and-stock deals now represent 30% of the portfolio, up from less than 1% at the end of 2008. Over the same period, all-stock transactions rose from 14% to 36% of the Fund’s investments.
These significant changes in merger consideration shouldn’t come as a surprise. When stocks are unusually volatile and valuations depressed, as was the case in the middle of the financial crisis, both buyers and sellers tend to show a preference for cash deals. Buyers don’t want to issue shares at what they view as bargain-basement levels, while sellers who are spooked by the market’s volatility and worried that stock prices could go even lower want the certainty of a cash transaction.
The environment is different now. With equity valuations having improved, buyers can feel more comfortable using their shares as an acquisition currency. And many sellers, after being reminded in 2009 that stocks can go up almost as fast as they go down, seem willing to take at least some equity. From an arbitrage standpoint, we generally have no preference when it comes to the type of merger consideration we are to receive. Whether it’s cash or stock or some combination of the two, we routinely attempt to hedge away the market risk associated with the investment.
Where the Deals Are
Chart 4 shows the Fund’s investments grouped by economic sector. The oil patch has recently been a fertile area for M&A activity, as smaller exploration and production companies seek greater scale through mergers, while the oil giants attempt to offset a runoff in reserves with much larger deals of their own. At the end of 2009, mergers and acquisitions in the energy sector represented about 16% of the Fund’s investments. Largely due to a mega deal in the railroad industry, the industrials sector ranked second, accounting for roughly 15% of the portfolio.
Transactions involving consumer companies comprised nearly 24% of our arbitrage positions at the end of December, split almost evenly between the consumer discretionary and consumer staples sectors. Recent high-profile deals in the food and beverage industry highlight another strategic motivation for many corporate acquirers, namely the desire to increase exposure to faster-growing emerging markets at a time when domestic revenue gains are harder to come by.
Information technology has also seen a fair amount of M&A activity recently. IT managers’ preference for dealing with fewer vendors, each offering a broader suite of compatible products, has fostered combinations in this sector, as have evolving business models that place a higher value on recurring revenue from IT services and support than on one-time hardware sales.
Making Sure It’s Safe to Drink the Water
Chart 5 shows the Fund’s investments grouped by the geographic region in which the target company is domiciled. As was the case a year earlier, a little over 70% of the Fund’s arbitrage investments, by dollar value, involved U.S.-based targets at the end of 2009. What’s different this year is that our non-U.S. positions are more spread out geographically. In addition to identifying attractive investment opportunities in Canada, Australia and Europe, areas where the Fund has been active for a long time, we’ve also recently established positions in takeover targets based in Japan, Hong Kong, Mexico and Brazil.
Successful overseas investing requires more than the basic arb toolkit. Although there is considerable overlap in the way we evaluate domestic deals and those involving non-U.S. targets, it’s important to recognize that foreign transactions unfold in the context of political, regulatory and corporate-governance systems that may be very different from the U.S. model. And the process of settling foreign trades, hedging currencies and dealing with the other technical aspects of cross-border investing adds another layer of complexity. Fortunately, with nearly three decades of experience in overseas M&A and access to an international network of research analysts, advisers and trading partners, our portfolio-management team should be up to the task.
Looking Across the Valley
Chart 6 shows the total dollar value of U.S. mergers and acquisitions, by quarter, since 2000. The financial meltdown and the ensuing Great Recession took their toll on deal-making last year. Despite a substantial recovery in the fourth quarter, M&A volume fell 40% from year-earlier levels in the 12 months ended December 2009, making it the slowest period for business combinations since 2003.
The outlook for the next year or so is considerably more encouraging. Confidence is returning to corporate boardrooms, the credit markets have unthawed and balance sheets are bulging with cash. More stability in equity valuations should also make it easier for buyers and sellers to come to terms on price.
Regardless of economic conditions, there are always management teams who believe that organic growth can only take their companies so far. But at a time when many firms are struggling to increase revenues and unable to do much more to cut costs, an increasing number of executives seem likely to conclude that a strategic business combination or other type of corporate reorganization offers one of the best opportunities to enhance shareholder value.
| | Sincerely, |
| | |
| |  |
| | |
| | Frederick W. Green |
| | President |
| Chart 1 | Chart 2 |
| | |
| PORTFOLIO COMPOSITION | PORTFOLIO COMPOSITION |
| By Type of Deal* | By Type of Buyer* |
| | |
 |  |
Chart 3
PORTFOLIO COMPOSITION
By Deal Terms*
* Data expressed as a percentage of long equity positions as of December 31, 2009
Chart 4
PORTFOLIO COMPOSITION
By Sector*
Chart 5
PORTFOLIO COMPOSITION
By Region*
* Data expressed as a percentage of long equity positions as of December 31, 2009
Chart 6
MERGER ACTIVITY
2000 – 2009
Source: Securities Data Corp.
COMPARISON OF CHANGE IN VALUE OF $10,000 INVESTMENT
IN THE MERGER FUND VL AND S&P 500
* Inception Date 5/26/04
| | Average Annual Total Return |
| | 1 Year | 3 Year | 5 Year | Since Inception |
| The Merger Fund VL | 11.80% | 5.82% | 7.62% | 7.89% |
| The Standard & Poor’s 500 Index | 26.46% | -5.63% | 0.42% | 2.07% |
The Standard & Poor’s 500 Index (S&P 500) is a capitalization-weighted index, representing the aggregate market value of the common equity of 500 stocks primarily traded on the New York Stock Exchange. This chart assumes an initial gross investment of $10,000 made on May 26, 2004. Returns shown include the reinvestment of all dividends. Past performance is not predictive of future performance. The graph and table do not reflect the deduction of taxes that a shareholder would pay on fund distributions or the redemption of fund shares. Investment return and principal value will fluctuate, so that your shares, when redeemed, may be worth more or less than the original cost.
EXPENSE EXAMPLE
December 31, 2009
(Unaudited)
As a shareholder of the Fund, you incur ongoing costs, including management fees and other Fund expenses. This example is intended to help you understand your ongoing costs (in dollars) of investing in the Fund and to compare these costs with the ongoing costs of investing in other mutual funds. The example is based on an investment of $1,000 invested at the beginning of the period and held for the entire period 7/1/09 – 12/31/09.
Actual Expenses
The first line of the table below provides information about actual account values and actual expenses. To the extent the Fund invests in shares of other investment companies as part of its investment strategy, you will indirectly bear your proportionate share of any fees and expenses charged by the underlying funds in which the Fund invests in addition to the expenses of the Fund. Actual expenses of the underlying funds are expected to vary among the various underlying funds. These expenses are not included in the example below. The example below includes, but is not limited to, management fees, fund accounting, custody and transfer agent fees. However, the example below does not include portfolio trading commissions and related expenses, and other extraordinary expenses as determined under generally accepted accounting principles. You may use the information in this line, together with the amount you invested, to estimate the expenses that you paid over the period. Simply divide your account value by $1,000 (for example, an $8,600 account value divided by $1,000 = 8.6), then multiply the result by the number in the first line under the heading entitled “Expenses Paid During Period” to estimate the expenses you paid on your account during this period.
Hypothetical Example for Comparison Purposes
The second line of the table below provides information about hypothetical account values and hypothetical expenses based on the Fund’s actual expense ratio and an assumed rate of return of 5% per year before expenses, which is not the Fund’s actual return. The hypothetical account values and expenses may not be used to estimate the actual ending account balance or expenses you paid for the period. You may use this information to compare the ongoing costs of investing in the Fund and other funds. To do so, compare this 5% hypothetical example with the 5% hypothetical examples that appear in the shareholder reports of the other funds. Please note that the expenses shown in the table are meant to highlight your ongoing costs only and do not reflect any transactional costs. Therefore, the second line of the table is useful in comparing ongoing costs only, and will not help you determine the relative total costs of owning different funds. In addition, if these transactional costs were included, your costs would have been higher.
| | Beginning Account | Ending Account | Expenses Paid During |
| | Value 7/1/09 | Value 12/31/09 | Period 7/1/09 – 12/31/09* |
Actual + (1) | $1,000.00 | $1,045.00 | $16.24 |
Hypothetical ++ (2) | $1,000.00 | $1,009.33 | $15.95 |
| + | Excluding interest expense, borrowing expense on securities sold short and dividends on securities sold short, your actual cost of investment in the Fund would be $7.22. |
| ++ | Excluding interest expense, borrowing expense on securities sold short and dividends on securities sold short, your hypothetical cost of investment in the Fund would be $7.12. |
| (1) | Ending account values and expenses paid during period based on a 4.50% return. This actual return is net of expenses. |
| (2) | Ending account values and expenses paid during period based on a 5.00% annual return before expenses. |
| * | Expenses are equal to the Fund’s annualized expense ratio of 3.15%, multiplied by the average account value over the period, multiplied by 184/365 (to reflect the one-half year period). |
The Merger Fund VL
SCHEDULE OF INVESTMENTS
December 31, 2009
| Shares | | | | Value | |
| | | | |
| COMMON STOCKS — 71.31% | | | |
| | | | | | |
| | | ACQUISITION CORPORATIONS — 3.46% | | | |
| | 11,800 | | Liberty Acquisition Holdings Corp. (a) | | $ | 114,106 | |
| | 7,182 | | Pearl Group Ltd. (a)(g) | | | 76,598 | |
| | 14,500 | | Sapphire Industrials Corp. (a) | | | 145,580 | |
| | | | | | | 336,284 | |
| | | | ASSET MANAGEMENT & CUSTODY BANKS — 1.26% | | | | |
| | 200 | | The Blackstone Group, LP | | | 2,624 | |
| | 14,146 | | KKR Co. (a)(g) | | | 120,241 | |
| | | | | | | 122,865 | |
| | | | BROADCASTING & CABLE TV — 0.03% | | | | |
| | 1,100 | | CC Media Holdings, Inc. (a)(b) | | | 3,410 | |
| | | | | | | | |
| | | | CABLE & SATELLITE TV — 1.37% | | | | |
| | 8,300 | | Comcast Corporation Special Class A | | | 132,883 | |
| | 12 | | DirecTV Group Inc. Class A (a) | | | 400 | |
| | | | | | | 133,283 | |
| | | | COMMODITY CHEMICALS — 1.51% | | | | |
| | 36,700 | | Mitsubishi Rayon Co., Ltd. (g) | | | 146,981 | |
| | | | | | | | |
| | | | COMMUNICATIONS EQUIPMENT — 3.35% | | | | |
| | 13,000 | | 3Com Corporation (a)(d) | | | 97,500 | |
| | 1,100 | | Brocade Communications Systems, Inc. (a) | | | 8,393 | |
| | 7,700 | | Tandberg ASA (g) | | | 219,438 | |
| | | | | | | 325,331 | |
| | | | COMPUTER HARDWARE — 2.60% | | | | |
| | 27,000 | | Sun Microsystems, Inc. (a)(e) | | | 252,990 | |
| | | | | | | | |
| | | | DATA PROCESSING & OUTSOURCED SERVICES — 1.11% | | | | |
| | 1,800 | | Affiliated Computer Services, Inc. (a) | | | 107,442 | |
| | | | | | | | |
| | | | DIVERSIFIED CHEMICALS — 0.41% | | | | |
| | 3,500 | | Huntsman Corporation | | | 39,515 | |
| | | | | | | | |
| | | | DIVERSIFIED METALS & MINING — 2.20% | | | | |
| | 1,300 | | BHP Billiton plc – ADR (e)(g) | | | 83,005 | |
| | 256,944 | | Hillgrove Resources Ltd. (g) | | | 98,090 | |
| | 150 | | Rio Tinto plc – ADR (g) | | | 32,308 | |
| | | | | | | 213,403 | |
| | | | ELECTRICAL COMPONENTS & EQUIPMENT — 1.07% | | | | |
| | 4,960 | | Sunpower Corp. Class B (a) | | | 103,912 | |
The accompanying notes are an integral part of these financial statements.
The Merger Fund VL
SCHEDULE OF INVESTMENTS (continued)
December 31, 2009
| Shares | | | | Value | |
| | | FERTILIZERS & AGRICULTURAL CHEMICALS — 4.14% | | | |
| | 1,000 | | CF Industries Holdings Inc. (c) | | $ | 90,780 | |
| | 1,500 | | Nufarm Limited (g) | | | 14,673 | |
| | 9,200 | | Terra Industries Inc. (b) | | | 296,148 | |
| | | | | | | 401,601 | |
| | | | HEALTH CARE SUPPLIES — 2.37% | | | | |
| | 1,400 | | Alcon Inc. – ADR (d)(g) | | | 230,090 | |
| | | | | | | | |
| | | | HEALTH CARE TECHNOLOGY — 1.06% | | | | |
| | 4,900 | | IMS Health Inc. | | | 103,194 | |
| | | | | | | | |
| | | | HOUSEHOLD APPLIANCES — 4.10% | | | | |
| | 6,100 | | Black & Decker Corp. (c) | | | 397,863 | |
| | | | | | | | |
| | | | HUMAN RESOURCES & EMPLOYMENT SERVICES — 2.31% | | | | |
| | 16,300 | | MPS Group Inc. (a) | | | 223,962 | |
| | | | | | | | |
| | | | INDEPENDENT POWER PRODUCERS & ENERGY TRADERS — 1.54% | | | | |
| | 119,200 | | Infigen Energy (g) | | | 149,364 | |
| | | | | | | | |
| | | | INTERNET SOFTWARE & SERVICES — 2.08% | | | | |
| | 10,000 | | Switch & Data Facilities Co., Inc. (a) | | | 202,100 | |
| | | | | | | | |
| | | | LIFE & HEALTH INSURANCE — 2.02% | | | | |
| | 33,225 | | AXA Asia Pacific Holdings Ltd. (g) | | | 195,778 | |
| | | | | | | | |
| | | | LIFE SCIENCES TOOLS & SERVICES — 1.11% | | | | |
| | 2,100 | | Varian, Inc. (a)(b) | | | 108,234 | |
| | | | | | | | |
| | | | MOVIES & ENTERTAINMENT — 4.07% | | | | |
| | 7,300 | | Marvel Entertainment, Inc. (a)(c) | | | 394,784 | |
| | | | | | | | |
| | | | OIL & GAS EQUIPMENT & SERVICES — 1.43% | | | | |
| | 7,450 | | BJ Services Company | | | 138,570 | |
| | | | | | | | |
| | | | OIL & GAS EXPLORATION & PRODUCTION — 9.33% | | | | |
| | 1,500 | | Cenovus Energy Inc. (g) | | | 37,800 | |
| | 1,500 | | EnCana Corporation (g) | | | 48,585 | |
| | 3,300 | | EnCore Acquisition Company (a) | | | 158,466 | |
| | 14,200 | | XTO Energy Inc. (b) | | | 660,726 | |
| | | | | | | 905,577 | |
| | | | OIL & GAS REFINING & MARKETING — 0.79% | | | | |
| | 17,900 | | Nippon Mining Holdings Inc. (g) | | | 76,301 | |
| | | | | | | | |
| | | | PACKAGED FOODS & MEATS — 1.25% | | | | |
| | 2,360 | | Cadbury plc – ADR (g) | | | 121,281 | |
The accompanying notes are an integral part of these financial statements.
The Merger Fund VL
SCHEDULE OF INVESTMENTS (continued)
December 31, 2009
| Shares | | | | Value | |
| | | PRECIOUS METALS & MINERALS — 1.18% | | | |
| | 23,300 | | Canplats Resources Corp. (a)(g) | | $ | 114,289 | |
| | | | | | | | |
| | | | RAILROADS — 7.62% | | | | |
| | 7,500 | | Burlington Northern Santa Fe Corp. (b) | | | 739,650 | |
| | | | | | | | |
| | | | SOFT DRINKS — 6.54% | | | | |
| | 2,600 | | Fomento Economico Mexicano SAB de CV – ADR (g) | | | 124,488 | |
| | 13,000 | | Pepsi Bottling Group Inc. (e) | | | 487,500 | |
| | 800 | | PepsiAmericas Inc. | | | 23,408 | |
| | | | | | | 635,396 | |
| | | | TOTAL COMMON STOCKS (Cost $6,746,142) | | | 6,923,450 | |
| | | | | |
| CONVERTIBLE PREFERRED STOCKS — 3.26% | | | | |
| | 21,200 | | Bank of America Corporation, 10% | | | 316,304 | |
| | | | TOTAL CONVERTIBLE PREFERRED STOCKS (Cost $339,913) | | | 316,304 | |
| | | | | | | | |
| Contracts (100 shares per contract) | | | | |
| | | | | |
| PURCHASED PUT OPTIONS — 0.26% | | | | |
| | | | The Blackstone Group, LP | | | | |
| | 32 | | Expiration: January, 2010, Exercise Price: $15.00 | | | 6,080 | |
| | | | Market Vectors Global Alternative Energy ETF | | | | |
| | 61 | | Expiration: January, 2010, Exercise Price: $27.50 | | | 15,708 | |
| | | | iShares MSCI Mexico Investable Market Fund | | | | |
| | 7 | | Expiration: January, 2010, Exercise Price: $51.00 | | | 1,680 | |
| | | | Material Select Sector SPDR Trust | | | | |
| | 24 | | Expiration: January, 2010, Exercise Price: $33.00 | | | 1,440 | |
| | | | Sun Microsystems, Inc. | | | | |
| | 55 | | Expiration: January, 2010, Exercise Price: $7.50 | | | 110 | |
| | | | Technology Select Sector SPDR Fund | | | | |
| | 8 | | Expiration: January, 2010, Exercise Price: $22.00 | | | 40 | |
| | | | The Walt Disney Company | | | | |
| | 4 | | Expiration: January, 2010, Exercise Price: $15.00 | | | 10 | |
| | 4 | | Expiration: January, 2010, Exercise Price: $17.50 | | | 10 | |
| | 1 | | Expiration: January, 2010, Exercise Price: $20.00 | | | 2 | |
| | 2 | | Expiration: January, 2010, Exercise Price: $21.00 | | | 5 | |
| | 1 | | Expiration: January, 2010, Exercise Price: $24.00 | | | 3 | |
| | 1 | | Expiration: January, 2010, Exercise Price: $25.00 | | | 2 | |
| | | | TOTAL PURCHASED PUT OPTIONS (Cost $41,284) | | | 25,090 | |
The accompanying notes are an integral part of these financial statements.
The Merger Fund VL
SCHEDULE OF INVESTMENTS (continued)
December 31, 2009
| Principal Amount | | | Value | |
| | | | |
| ESCROW NOTES — 0.08% | | | |
| $ | 18,300 | | Price Communications Liquidating Trust (a)(f) | | $ | 7,869 | |
| | | | TOTAL ESCROW NOTES (Cost $7,869) | | | 7,869 | |
| | | | | | | | |
| Shares | | | | | | |
| | | | | |
| SHORT-TERM INVESTMENTS — 17.23% | | | | |
| | | | | | | | |
| | | | MONEY MARKETS — 17.23% | | | | |
| | 173,402 | | Fidelity Institutional Prime Money Market Portfolio, 0.20% | | | 173,402 | |
| | 500,000 | | First American Government Obligations Fund, 0.40% (b) | | | 500,000 | |
| | 500,000 | | First American Prime Obligations Fund, 0.15% (e) | | | 500,000 | |
| | 500,000 | | First American Treasury Obligations Fund, 0.38% (b) | | | 500,000 | |
| | | | | | | 1,673,402 | |
| | | | TOTAL SHORT-TERM INVESTMENTS (Cost $1,673,402) | | | 1,673,402 | |
| | | | TOTAL INVESTMENTS (Cost $8,808,610) — 92.14% | | $ | 8,946,115 | |
Percentages are stated as a percent of net assets.
ADR – American Depository Receipt
| (a) | Non-income producing security. |
| (b) | All or a portion of the shares have been committed as collateral for open securities sold short. |
| (c) | All or a portion of the shares have been committed as collateral for written option contracts. |
| (d) | All or a portion of the shares have been committed as collateral for swap contracts. |
| (e) | All or a portion of the shares have been committed as collateral for forward currency exchange contracts. |
| (f) | Fair-valued security. |
The accompanying notes are an integral part of these financial statements.
The Merger Fund VL
SCHEDULE OF SECURITIES SOLD SHORT
December 31, 2009
| Shares | | | | Value | |
| | 2,999 | | Baker Hughes Incorporated | | $ | 121,400 | |
| | 15,400 | | Bank of America Corporation | | | 231,924 | |
| | 1,300 | | BHP Billiton Ltd. – ADR (a) | | | 99,554 | |
| | 8,300 | | Comcast Corporation Class A | | | 139,938 | |
| | 4,466 | | Denbury Resources Inc. | | | 66,097 | |
| | 65 | | Eldorado Gold Corporation (a) | | | 921 | |
| | 1,500 | | Energy Select Sector SPDR Fund | | | 85,515 | |
| | 1,552 | | Equinix Inc. | | | 164,745 | |
| | 10,038 | | Exxon Mobil Corp. | | | 684,491 | |
| | 1,002 | | Kraft Foods, Inc. | | | 27,234 | |
| | 1,280 | | National Australia Bank Ltd. (a) | | | 31,503 | |
| | 16,683 | | Nippon Oil Corp. (a) | | | 77,025 | |
| | 4,414 | | PepsiCo Inc. | | | 268,371 | |
| | 600 | | Rio Tinto Ltd. (a) | | | 40,063 | |
| | 7,765 | | Stanley Works | | | 399,975 | |
| | 4,960 | | Sunpower Corp. Class A | | | 117,453 | |
| | 5,400 | | The Walt Disney Company | | | 174,150 | |
| | 8,914 | | Xerox Corporation | | | 75,412 | |
| | | | TOTAL SECURITIES SOLD SHORT (Proceeds $2,728,977) | | $ | 2,805,771 | |
ADR – American Depository Receipt
(a)Foreign security.
The accompanying notes are an integral part of these financial statements.
The Merger Fund VL
SCHEDULE OF OPTIONS WRITTEN
December 31, 2009
| Contracts (100 shares per contract) | | Value | |
| | | | |
| CALL OPTIONS | | | |
| | | Alcon Inc. – ADR | | | |
| | 2 | | Expiration: January, 2010, Exercise Price: $145.00 | | $ | 4,060 | |
| | 12 | | Expiration: January, 2010, Exercise Price: $155.00 | | | 12,900 | |
| | | | Bank of America Corporation | | | | |
| | 58 | | Expiration: January, 2010, Exercise Price: $15.00 | | | 2,610 | |
| | | | Brocade Communications Systems, Inc. | | | | |
| | 6 | | Expiration: January, 2010, Exercise Price: $7.50 | | | 210 | |
| | | | Cadbury plc – ADR | | | | |
| | 11 | | Expiration: January, 2010, Exercise Price: $50.00 | | | 2,200 | |
| | | | CF Industries Holdings Inc. | | | | |
| | 10 | | Expiration: January, 2010, Exercise Price: $75.00 | | | 16,100 | |
| | | | Fomento Economico Mexicano SAB de CV – ADR | | | | |
| | 18 | | Expiration: January, 2010, Exercise Price: $45.00 | | | 5,940 | |
| | | | Huntsman Corporation | | | | |
| | 9 | | Expiration: January, 2010, Exercise Price: $10.00 | | | 1,215 | |
| | | | Sun Microsystems, Inc. | | | | |
| | 16 | | Expiration: January, 2010, Exercise Price: $10.00 | | | 8 | |
| | | | Terra Industries Inc. | | | | |
| | 56 | | Expiration: January, 2010, Exercise Price: $30.00 | | | 15,120 | |
| | 13 | | Expiration: January, 2010, Exercise Price: $31.00 | | | 2,730 | |
| | 23 | | Expiration: January, 2010, Exercise Price: $36.00 | | | 9,085 | |
| | | | TOTAL CALL OPTIONS WRITTEN (Premiums received $86,286) | | $ | 72,178 | |
ADR – American Depository Receipt
The accompanying notes are an integral part of these financial statements.
The Merger Fund VL
STATEMENT OF ASSETS AND LIABILITIES
December 31, 2009
| ASSETS: | | | | | | |
| Investments, at value (Cost $8,808,610) | | | | | $ | 8,946,115 | |
| Cash | | | | | | 949 | |
| Cash held in foreign currency (Cost $177,866) | | | | | | 180,290 | |
| Deposit at brokers | | | | | | 679,720 | |
| Receivable from brokers | | | | | | 2,981,411 | |
| Receivable for forward currency exchange contracts | | | | | | 8,056 | |
| Receivable for investments sold | | | | | | 140,193 | |
| Receivable for swap contracts | | | | | | 2,786 | |
| Receivable for fund shares issued | | | | | | 465 | |
| Receivable from the investment adviser | | | | | | 9,633 | |
| Dividends and interest receivable | | | | | | 7,632 | |
| Prepaid expenses | | | | | | 57 | |
| Total Assets | | | | | | 12,957,307 | |
| LIABILITIES: | | | | | | | |
| Securities sold short, at value (Proceeds of $2,728,977) | | $ | 2,805,771 | | | | | |
| Written option contracts, at value (Premiums received $86,286) | | | 72,178 | | | | | |
| Payable for swap contracts | | | 1,764 | | | | | |
| Payable for investments purchased | | | 313,836 | | | | | |
| Payable for swap interest | | | 155 | | | | | |
| Payable for fund shares redeemed | | | 54 | | | | | |
| Dividends and interest payable | | | 5,368 | | | | | |
| Accrued expenses and other liabilities | | | 48,505 | | | | | |
| Total Liabilities | | | | | | | 3,247,631 | |
| NET ASSETS | | | | | | $ | 9,709,676 | |
| NET ASSETS Consist Of: | | | | | | | | |
| Accumulated undistributed net investment loss | | | | | | $ | (27,721 | ) |
| Accumulated undistributed net realized gain on investments, | | | | | | | | |
| securities sold short, written option contracts expired or closed, | | | | | | | | |
| swap contracts, foreign currency translation and forward | | | | | | | | |
| currency exchange contracts | | | | | | | 238,143 | |
| Net unrealized appreciation (depreciation) on:Investments | | $ | 137,505 | | | | | |
| Securities sold short | | | (76,794 | ) | | | | |
| Written option contracts | | | 14,108 | | | | | |
| Swap contracts | | | 1,022 | | | | | |
| Foreign currency translation | | | 2,424 | | | | | |
| Forward currency exchange contracts | | | 8,056 | | | | | |
| Net unrealized appreciation | | | | | | | 86,321 | |
| Paid-in capital | | | | | | | 9,412,933 | |
| Total Net Assets | | | | | | $ | 9,709,676 | |
| NET ASSET VALUE, offering price and redemption price per share | | | | | | | | |
| ($9,709,676 / 907,746 shares of beneficial interest outstanding) | | | | | | $ | 10.70 | |
The accompanying notes are an integral part of these financial statements.
The Merger Fund VL
STATEMENT OF OPERATIONS
For the Year Ended December 31, 2009
| INVESTMENT INCOME: | | | | | | |
| Interest | | | | | $ | 7,928 | |
| Dividend income on long positions (net of foreign withholding taxes of $386) | | | | | | 124,393 | |
| Total investment income | | | | | | 132,321 | |
| EXPENSES: | | | | | | | |
| Investment advisory fee | | $ | 77,603 | | | | | |
| Transfer agent and shareholder servicing agent fees | | | 26,692 | | | | | |
| Federal and state registration fees | | | 834 | | | | | |
| Professional fees | | | 85,037 | | | | | |
| Trustees’ fees and expenses | | | 23,910 | | | | | |
| Custody fees | | | 1,443 | | | | | |
| Administration fee | | | 39,696 | | | | | |
| Fund accounting expense | | | 44,288 | | | | | |
| Reports to shareholders | | | 6,965 | | | | | |
| Miscellaneous expenses | | | 475 | | | | | |
| Borrowing expense on securities sold short | | | 138,756 | | | | | |
| Dividends on securities sold short (net of foreign withholding taxes of $274) | | | 40,068 | | | | | |
| Total expenses before reimbursement by adviser | | | | | | | 485,767 | |
| Expense reimbursement by adviser (Note 3) | | | | | | | (220,029 | ) |
| Net expenses | | | | | | | 265,738 | |
| NET INVESTMENT LOSS | | | | | | | (133,417 | ) |
| REALIZED AND UNREALIZED GAIN/(LOSS) ON INVESTMENTS: | | | | | | | | |
| Realized gain/(loss) on: | | | | | | | | |
| Investments | | | 544,305 | | | | | |
| Securities sold short | | | (39,470 | ) | | | | |
| Written option contracts expired or closed | | | 12,893 | | | | | |
| Swap contracts | | | 12,984 | | | | | |
| Foreign currency translation | | | (4,708 | ) | | | | |
| Forward currency exchange contracts | | | (67,240 | ) | | | | |
| Net realized gain | | | | | | | 458,764 | |
| Change in unrealized appreciation/(depreciation) on: | | | | | | | | |
| Investments | | | 405,142 | | | | | |
| Securities sold short | | | (92,826 | ) | | | | |
| Written option contracts | | | 13,668 | | | | | |
| Swap contracts | | | 34,569 | | | | | |
| Foreign currency translation | | | 2,456 | | | | | |
| Forward currency exchange contracts | | | (54 | ) | | | | |
| Net change in unrealized appreciation | | | | | | | 362,955 | |
| NET REALIZED AND UNREALIZED GAIN ON INVESTMENTS | | | | | | | 821,719 | |
| NET INCREASE IN NET ASSETS RESULTING FROM OPERATIONS | | | | | | $ | 688,302 | |
The accompanying notes are an integral part of these financial statements.
The Merger Fund VL
STATEMENT OF CHANGES IN NET ASSETS
| | | Year Ended | | | Year Ended | |
| | | December 31, 2009 | | | December 31, 2008 | |
| Net investment loss | | $ | (133,417 | ) | | $ | (65,851 | ) |
| Net realized gain on investments, securities sold short, | | | | | | | | |
| written option contracts expired or closed, swap contracts, | | | | | | | | |
| foreign currency translation and forward currency | | | | | | | | |
| exchange contracts | | | 458,764 | | | | 315,603 | |
| Change in unrealized appreciation/(depreciation) on | | | | | | | | |
| investments, securities sold short, written option contracts, | | | | | | | | |
| swap contracts, foreign currency translation and forward | | | | | | | | |
| currency exchange contracts | | | 362,955 | | | | (113,214 | ) |
| Net increase in net assets resulting from operations | | | 688,302 | | | | 136,538 | |
| | | | | | | | | |
| Distributions to shareholders from: | | | | | | | | |
| Net investment income | | | (305,678 | ) | | | — | |
| Net realized gains | | | (7,130 | ) | | | (214,451 | ) |
| Total distributions | | | (312,808 | ) | | | (214,451 | ) |
| Net increase in net assets from | | | | | | | | |
| capital share transactions (Note 4) | | | 4,436,488 | | | | 491,664 | |
| Net increase in net assets | | | 4,811,982 | | | | 413,751 | |
| | | | | | | | | |
| NET ASSETS: | | | | | | | | |
| Beginning of year | | | 4,897,694 | | | | 4,483,943 | |
| End of year (including accumulated undistributed | | | | | | | | |
| net investment income (loss) of $(27,721) | | | | | | | | |
| and $331,115, respectively) | | $ | 9,709,676 | | | $ | 4,897,694 | |
The accompanying notes are an integral part of these financial statements.
The Merger Fund VL
FINANCIAL HIGHLIGHTS
| | | Year Ended December 31, | |
| | | 2009 | | | 2008 | | | 2007 | | | 2006 | | | 2005 | |
| Per Share Data: | | | | | | | | | | | | | | | |
| Net Asset Value, beginning of year | | $ | 9.88 | | | $ | 9.96 | | | $ | 11.56 | | | $ | 10.96 | | | $ | 10.60 | |
| Income from investment operations: | | | | | | | | | | | | | | | | | | | | |
| Net investment income (loss) | | | (0.35 | ) | | | (0.13 | ) | | | 0.03 | | | | (0.02 | ) | | | (0.05 | ) |
| Net realized and unrealized | | | | | | | | | | | | | | | | | | | | |
| gain on investments | | | 1.53 | | | | 0.50 | | | | 0.20 | | | | 1.83 | | | | 0.53 | |
| Total from investment operations | | | 1.18 | | | | 0.37 | | | | 0.23 | | | | 1.81 | | | | 0.48 | |
| Less distributions: | | | | | | | | | | | | | | | | | | | | |
| Distributions from net investment income | | | (0.35 | ) | | | — | | | | — | | | | — | | | | — | |
| Distributions from net realized gains | | | (0.01 | ) | | | (0.45 | ) | | | (1.83 | ) | | | (1.21 | ) | | | (0.12 | ) |
| Total distributions | | | (0.36 | ) | | | (0.45 | ) | | | (1.83 | ) | | | (1.21 | ) | | | (0.12 | ) |
| Net Asset Value, end of year | | $ | 10.70 | | | $ | 9.88 | | | $ | 9.96 | | | $ | 11.56 | | | $ | 10.96 | |
| Total Return | | | 11.80 | % | | | 3.79 | %(1) | | | 2.11 | % | | | 16.55 | % | | | 4.53 | % |
| Supplemental data and ratios: | | | | | | | | | | | | | | | | | | | | |
| Net assets, end of year (000’s) | | $ | 9,710 | | | $ | 4,898 | | | $ | 4,484 | | | $ | 3,794 | | | $ | 5,574 | |
| Ratio of operating expenses to average | | | | | | | | | | | | | | | | | | | | |
| net assets including interest expense, | | | | | | | | | | | | | | | | | | | | |
| borrowing expense on securities sold short | | | | | | | | | | | | | | | | | | | | |
| and dividends on securities sold short: | | | | | | | | | | | | | | | | | | | | |
| Before expense waiver | | | 7.82 | % | | | 7.85 | % | | | 8.53 | % | | | 8.06 | % | | | 7.40 | % |
| After expense waiver | | | 4.28 | % | | | 2.98 | % | | | 4.27 | % | | | 3.43 | % | | | 2.39 | % |
| Ratio of operating expenses to average | | | | | | | | | | | | | | | | | | | | |
| net assets excluding interest expense, | | | | | | | | | | | | | | | | | | | | |
| borrowing expense on securities sold short | | | | | | | | | | | | | | | | | | | | |
| and dividends on securities sold short: | | | | | | | | | | | | | | | | | | | | |
| Before expense waiver | | | 4.94 | % | | | 6.27 | % | | | 5.66 | % | | | 6.03 | % | | | 6.41 | % |
| After expense waiver | | | 1.40 | % | | | 1.40 | % | | | 1.40 | % | | | 1.40 | % | | | 1.40 | % |
| Ratio of net investment loss | | | | | | | | | | | | | | | | | | | | |
| to average net assets | | | | | | | | | | | | | | | | | | | | |
| Before expense waiver | | | (5.69 | )% | | | (6.28 | )% | | | (5.52 | )% | | | (5.99 | )% | | | (5.58 | )% |
| After expense waiver | | | (2.15 | )% | | | (1.41 | )% | | | (1.26 | )% | | | (1.36 | )% | | | (0.57 | )% |
Portfolio turnover rate(2) | | | 373.07 | % | | | 743.72 | % | | | 418.22 | % | | | 555.55 | % | | | 497.59 | % |
| (1) | The return would have been 3.06% without the expense credit from the service provider. |
| (2) | The numerator for the portfolio turnover rate includes the lesser of purchases or sales (excluding securities sold short). The denominator includes the average long positions throughout the year. |
The accompanying notes are an integral part of these financial statements.
The Merger Fund VL
NOTES TO THE FINANCIAL STATEMENTS
December 31, 2009
Note 1 — ORGANIZATION
The Merger Fund VL (the “Fund”) is a no-load, open-end, non-diversified investment company organized as a statutory trust under the laws of Delaware on November 22, 2002, and registered under the Investment Company Act of 1940, as amended (the “1940 Act”). The Fund commenced operations on May 26, 2004. The investment objective of the Fund is to seek to achieve capital growth by engaging in merger arbitrage. Merger arbitrage is a highly specialized investment approach generally designed to profit from the successful completion of proposed mergers, takeovers, tender offers, leveraged buyouts, liquidations and other types of corporate reorganizations. Shares of the Fund are not offered directly to the public. The Fund’s shares are currently offered only to separate accounts funding variable annuity and variable life insurance contracts. At December 31, 2009, 98.4% of the shares outstanding of the Fund were owned by two insurance companies.
Note 2 — SIGNIFICANT ACCOUNTING POLICIES
The following is a summary of significant accounting policies followed by the Fund in the preparation of its financial statements. These policies are in conformity with generally accepted accounting principles. In preparing these financial statements, the Fund has evaluated subsequent events and transactions for potential recognition or disclosure through February 22, 2010, the date the financial statements were issued.
A.Investment Valuation
Securities listed on the NASDAQ Global Market and the NASDAQ Global Select Market are valued at the NASDAQ Official Closing Price (“NOCP”). Other listed securities are valued at the last sale price on the exchange on which such securities are primarily traded or, in the case of options, at the last sale price. Securities not listed on an exchange and securities for which there are no transactions are valued at the average of the closing bid and asked prices. When pricing options, if no sales are reported or if the last sale is outside the bid and asked parameters, the higher of the intrinsic value of the option or the mean between the last reported bid and asked prices will be used. Securities for which there are no such valuations are valued at fair value as determined in good faith by management under the supervision of the Board of Trustees. The Adviser (as defined herein) reserves the right to value securities, including options, at prices other than last-sale prices, intrinsic value prices, or the average of closing bid and asked prices, when such prices are believed unrepresentative of fair market value as determined in good faith by the Adviser. When fair-value pricing is employed, the prices of securities used by the Fund to calculate its NAV may differ from quoted or published prices for the same securities. In addition, due to the subjective and variable nature of fair-value pricing, it is possible that the value determined for a particular asset may be materially different from the value realized upon such asset’s sale. At December 31, 2009, fair-valued long securities represented 0.08% of investments, at value. Investments in United States government securities (other than short-term securities) are valued at the average of the quoted bid and asked prices in the over-the-counter market. Short-term investments are carried at amortized cost, which approximates market value.
The Merger Fund VL
NOTES TO THE FINANCIAL STATEMENTS (continued)
December 31, 2009
Note 2 — SIGNIFICANT ACCOUNTING POLICIES (continued)
The Fund has performed an analysis of all existing investments to determine the significance and character of all inputs to their fair value determination. Various inputs are used in determining the value of the Fund’s investments. These inputs are summarized in the three broad levels listed below:
| Level 1 — | Quoted prices in active markets for identical securities. |
| Level 2 — | Other significant observable inputs (including quoted prices for similar securities, interest rates, prepayment speeds, credit risk, etc.). |
| Level 3 — | Model derived valuations in which one or more significant inputs or significant value drivers are unobservable. Unobservable inputs are those inputs that reflect the Fund’s own assumptions that market participants would use to price the asset or liability based on the best available information. |
The inputs or methodology used for valuing securities are not an indication of the risk associated with investing in those securities.
The following tables provide the fair value measurements of applicable Fund assets and liabilities by level within the fair value hierarchy for the Fund as of December 31, 2009. These assets and liabilities are measured on a recurring basis.
| | | Level 1 | | | Level 2 | | | Level 3 | | | Total | |
| Assets | | | | | | | | | | | | |
| Common Stocks | | $ | 6,923,450 | | | $ | — | | | $ | — | | | $ | 6,923,450 | |
| Convertible Preferred Stocks | | | 316,304 | | | | — | | | | — | | | | 316,304 | |
| Purchased Put Options | | | 25,090 | | | | — | | | | — | | | | 25,090 | |
| Escrow Notes | | | — | | | | — | | | | 7,869 | | | | 7,869 | |
| Short-Term Investments | | | 1,673,402 | | | | — | | | | — | | | | 1,673,402 | |
| Swap Contracts * | | | — | | | | 2,786 | | | | — | | | | 2,786 | |
| Forward Currency Exchange Contracts * | | | — | | | | 8,056 | | | | — | | | | 8,056 | |
| Total Investments and Derivatives | | $ | 8,938,246 | | | $ | 10,842 | | | $ | 7,869 | | | $ | 8,956,957 | |
| | | | | | | | | | | | | | | | | |
| Liabilities | | | | | | | | | | | | | | | | |
| Securities Sold Short | | $ | 2,805,771 | | | $ | — | | | $ | — | | | $ | 2,805,771 | |
| Written Option Contracts | | | 72,178 | | | | — | | | | — | | | | 72,178 | |
| Swap Contracts * | | | — | | | | 1,764 | | | | — | | | | 1,764 | |
| * | Swap contracts and forward currency exchange contracts are valued at the unrealized appreciation on the instrument. |
The Merger Fund VL
NOTES TO THE FINANCIAL STATEMENTS (continued)
December 31, 2009
Note 2 — SIGNIFICANT ACCOUNTING POLICIES (continued)
Level 3 Reconciliation Disclosure
Following is a reconciliation of Level 3 assets for which significant unobservable inputs were used to determine fair value.
| Balance as of December 31, 2008 | | $ | 21,974 | |
| Accrued discounts/premiums | | | — | |
| Realized gain (loss) | | | (21,267 | ) |
| Change in unrealized appreciation (depreciation) | | | 16,554 | |
| Net purchases (sales) | | | (9,392 | ) |
| Transfers in and/or out of Level 3 | | | — | |
| Balance as of December 31, 2009 | | $ | 7,869 | |
B.Securities Sold Short
The Fund may sell securities or currencies short for hedging purposes. For financial statement purposes, an amount equal to the settlement amount is initially included in the Statement of Assets and Liabilities as an asset and an equivalent liability. The amount of the liability is subsequently marked-to-market to reflect the current value of the short position. Subsequent fluctuations in the market prices of securities or currencies sold, but not yet purchased, may require purchasing the securities or currencies at prices which may differ from the market value reflected on the Statement of Assets and Liabilities. Short sale transactions result in off balance sheet risk because the ultimate obligation may exceed the related amounts shown in the Statement of Assets and Liabilities. The Fund will incur a loss if the price of the security increases between the date of the short sale and the date on which the Fund replaces the borrowed security. The Fund’s loss on a short sale is potentially unlimited because there is no upward limit on the price a borrowed security could attain.
The Fund is liable for any dividends payable on securities while those securities are sold short. Until the security is replaced, the Fund is required to pay to the lender any income earned which is recorded as an expense by the Fund. As collateral for its securities sold short, the Fund is required under the 1940 Act to maintain assets consisting of cash, cash equivalents or liquid securities. These assets are required to be adjusted daily to reflect changes in the value of the securities or currencies sold short.
| C. | Transactions with Brokers for Securities Sold Short |
The Fund’s receivables from brokers for proceeds on securities sold short and deposit at brokers for securities sold short are with three major securities dealers. The Fund does not require the brokers to maintain collateral in support of the receivable from the brokers for proceeds on securities sold short.
No provision for federal income taxes has been made since the Fund has complied to date with the provisions of the Internal Revenue Code applicable to regulated investment companies and intends to continue to so comply in future years and to distribute investment company net taxable income and net capital gains to shareholders. Additionally, the Fund intends to make all required distributions to avoid federal excise tax.
The Merger Fund VL
NOTES TO THE FINANCIAL STATEMENTS (continued)
December 31, 2009
Note 2 — SIGNIFICANT ACCOUNTING POLICIES (continued)
The Fund has reviewed all open tax years and major jurisdictions and concluded that there is no impact on the Fund’s net assets and there is no tax liability resulting from unrecognized tax benefits relating to income tax positions taken or expected to be taken on a tax return. The Fund is also not aware of any tax positions for which it is reasonably possible that the total amounts of unrecognized tax benefits will significantly change in the next twelve months. As of December 31, 2009, open Federal and New York tax years include the tax years ended December 31, 2006 through 2009. The Fund has no examination in progress.
| E. | Written Option Contracts |
The Fund is subject to equity price risk in the normal course of pursuing its investment objectives. The Fund writes (sells) call options to hedge portfolio investments. Uncovered put options can also be written by the Fund as part of a merger arbitrage strategy involving a pending corporate reorganization. When the Fund writes (sells) an option, an amount equal to the premium received by the Fund is included in the Statement of Assets and Liabilities as an asset and an equivalent liability. The amount of the liability is subsequently marked-to-market to reflect the current value of the written option contracts. By writing an option, the Fund may become obligated during the term of the option to deliver or purchase the securities underlying the option at the exercise price if the option is exercised. Written option contracts are valued at the higher of the intrinsic value of the option or the last sales price reported on the date of valuation. If no sale is reported or if the last sale is outside the parameters of the closing bid and asked prices, the written option contract is valued at the higher of the intrinsic value of the option or the mean of the last reported bid and asked prices on the day of valuation. When an option expires on its stipulated expiration date or the Fund enters into a closing purchase transaction, the Fund realizes a gain or loss if the cost of the closing purchase transaction differs from the premium received when the option was sold without regard to any unrealized gain or loss on the underlying security, and the liability related to such option is eliminated. When an option is exercised, the premium originally received decreases the cost basis of the security (or increases the proceeds on a sale of the security), and the Fund realizes a gain or loss from the sale of the underlying security. With written option contracts, there is minimal counterparty credit risk to the Fund since written option contracts are exchange traded.
The Fund is subject to equity price risk in the normal course of pursuing its investment objectives. The Fund purchases put or call options to hedge portfolio investments. Premiums paid for option contracts purchased are included in the Statement of Assets and Liabilities as an asset. Option contracts are valued daily at the higher of the intrinsic value of the option or the last sales price reported on the date of valuation. If no sale is reported or if the last sale is outside the parameters of the closing bid and asked prices, the option contract purchased is valued at the higher of the intrinsic value of the option or the mean between the last reported bid and asked prices on the day of valuation. When option contracts expire or are closed, realized gains or losses are recognized without regard to any unrealized gains or losses on the underlying securities. With purchased options, there is minimal counterparty credit risk to the Fund since purchased options are exchange traded.
The Merger Fund VL
NOTES TO THE FINANCIAL STATEMENTS (continued)
December 31, 2009
Note 2 — SIGNIFICANT ACCOUNTING POLICIES (continued)
G.Forward Currency Exchange Contracts
The Fund is subject to foreign currency exchange rate risk in the normal course of pursuing its investment objectives. The Fund may use forward currency exchange contracts to hedge against changes in the value of foreign currencies. The Fund may enter into forward currency exchange contracts obligating the Fund to deliver or receive a currency at a specified future date. Forward contracts are valued daily, and unrealized appreciation or depreciation is recorded daily as the difference between the contract exchange rate and the closing forward rate applied to the face amount of the contract. A realized gain or loss is recorded at the time the forward contract expired. With forward contracts, there is minimal counterparty credit risk to the Fund since forward contracts are exchange traded.
The use of forward currency exchange contracts does not eliminate fluctuations in the underlying prices of the Fund’s investment securities; however, it does establish a rate of exchange that can be achieved in the future. The use of forward currency exchange contracts involves the risk that anticipated currency movements will not be accurately predicted. A forward currency exchange contract would limit the risk of loss due to a decline in the value of a particular currency; however it would also limit any potential gain that might result should the value of the currency increase instead of decrease. These contracts may involve market risk in excess of the amount of receivable or payable reflected on the Statement of Assets and Liabilities.
| H. | Distributions to Shareholders |
Dividends from net investment income and net realized capital gains, if any, are declared and paid annually. Income and capital gain distributions are determined in accordance with income tax regulations which may differ from generally accepted accounting principles. These differences are due primarily to wash sale-loss deferrals, constructive sales, straddle-loss deferrals, adjustments on swap contracts, and unrealized gains or losses on Section 1256 contracts, which were realized, for tax purposes, at December 31, 2009. Accordingly, reclassifications are made within the net asset accounts for such amounts, as well as amounts related to permanent differences in the character of certain income and expense items for income tax and financial reporting purposes. The Fund increased net investment income by $80,259, reduced realized accumulated gains by $80,259, and did not change paid-in capital.
Investing in securities of foreign companies and foreign governments involves special risks and considerations not typically associated with investing in U.S. companies and the U.S. government. These risks include revaluation of currencies and adverse political and economic developments. Moreover, securities of many foreign companies and foreign governments and their markets may be less liquid and their prices more volatile than those of securities of comparable U.S. companies and the U.S. government.
The Merger Fund VL
NOTES TO THE FINANCIAL STATEMENTS (continued)
December 31, 2009
Note 2 — SIGNIFICANT ACCOUNTING POLICIES (continued)
| J. | Foreign Currency Translations |
The books and records of the Fund are maintained in U.S. dollars. Foreign currency transactions are translated into U.S. dollars on the following basis: (i) market value of investment securities, assets and liabilities at the daily rates of exchange, and (ii) purchases and sales of investment securities, dividend and interest income and certain expenses at the rates of exchange prevailing on the respective dates of such transactions. For financial reporting purposes, the Fund does not isolate changes in the exchange rate of investment securities from the fluctuations arising from changes in the market prices of securities. However, for federal income tax purposes, the Fund does isolate and treat as ordinary income the effect of changes in foreign exchange rates on realized gain or loss from the sale of investment securities and payables and receivables arising from trade-date and settlement-date differences.
The Fund may engage in security transactions on a when-issued or delayed-delivery basis. Although the payment and interest terms of these securities are established at the time the Fund enters into the agreement, these securities may be delivered for cash proceeds at a future date. During this period, the securities are subject to market fluctuation. The Fund records sales of when-issued securities and reflects the values of such securities in determining net asset value in the same manner as other open short-sale positions. When delayed-delivery purchases are outstanding, the Fund segregates and maintains at all times cash, cash equivalents or other liquid securities in an amount at least equal to the market value.
L.Cash Equivalents
The Fund considers highly liquid temporary cash investments purchased with an original maturity of less than three months to be cash equivalents. Cash equivalents are included in short-term investments on the Schedule of Investments as well as in investments on the Statement of Assets and Liabilities.
| M. | Guarantees and Indemnifications |
In the normal course of business, the Fund enters into contracts with service providers that contain general indemnification clauses. The Fund’s maximum exposure under these arrangements is unknown, as this would involve future claims that may be made against the Fund that have not yet occurred. However, based on experience, the Fund expects the risk of loss to be remote.
The preparation of financial statements in conformity with generally accepted accounting principles requires management to make estimates and assumptions that affect the reported amounts of assets and liabilities and disclosure of contingent assets and liabilities at the date of the financial statements and the reported amounts of revenues and expenses during the reporting period. Actual results could differ from those estimates.
The Merger Fund VL
NOTES TO THE FINANCIAL STATEMENTS (continued)
December 31, 2009
Note 2 — SIGNIFICANT ACCOUNTING POLICIES (continued)
Investment and shareholder transactions are recorded on the trade date. Realized gains and losses from security transactions are recorded on the identified cost basis. Dividend income and distributions to shareholders are recorded on the ex-dividend date. Interest is accounted for on the accrual basis and includes amortization of premiums and discounts on the interest method. The Fund may utilize derivative instruments including options, forward currency exchange contracts and other instruments with similar characteristics to the extent that they are consistent with the Fund’s investment objectives and limitations. The use of these instruments may involve additional investment risks, including the possibility of illiquid markets or imperfect correlation between the value of the instruments and the underlying securities.
P.Counterparty Risk
The Fund helps manage counterparty credit risk by entering into agreements only with counterparties the Adviser believes have the financial resources to honor their obligations and by having the Adviser monitor the financial stability of the counterparties. Collateral pledges are monitored and subsequently adjusted if and when the valuations fluctuate, either up or down, by at least the predetermined threshold amount.
Q.The Right to Offset
Financial assets and liabilities as well as cash collateral received and posted are offset by the counterparty, and the net amount is reported in the consolidated statement of financial condition when the Fund believes there exists a legally enforceable right to set off the recognized amounts.
R.Derivatives
The Fund has adopted authoritative standards regarding disclosure about derivatives and hedging activities and how they affect the Fund’s Statement of Assets and Liabilities and Statement of Operations. For the year ended December 31, 2009: long option contracts (959 contracts) were purchased and $291,348 premiums were paid, written option contracts (2,677 contracts) were opened and $718,273 premiums were received, equity swap contracts were opened for a notional value of $1,272,640 and closed for a notional value of $1,734,809 and an average of 9 forward currency exchange contract positions were open during the year.
The Merger Fund VL
NOTES TO THE FINANCIAL STATEMENTS (continued)
December 31, 2009
Note 2 — SIGNIFICANT ACCOUNTING POLICIES (continued)
Statement of Assets and Liabilities:
Fair values of derivative instruments as of December 31, 2009:
| | | Asset Derivatives | | | Liability Derivatives | |
| | | Statement of | | | | | | Statement of | | | | |
| | | Assets and | | | | | | Assets and | | | | |
| | | Liabilities | | | | | | Liabilities | | | | |
| Derivatives | | Location | | | Fair Value | | | Location | | | Fair Value | |
| Equity contracts: | | | | | | | | | | | | |
| Purchased Options | | Investments | | | $ | 25,090 | | | N/A | | | $ | — | |
| Written Option Contracts | | N/A | | | | — | | | Written Options | | | | 72,178 | |
| Swap Contracts | | Receivables | | | | 2,786 | | | Payables | | | | 1,764 | |
| | | | | | | | | | | | | | | | | |
| Foreign exchange contracts: | | | | | | | | | | | | | | | | |
| Forward Currency | | | | | | | | | | | | | | | | |
| Exchange Contracts | | Receivables | | | | 8,056 | | | N/A | | | | — | |
| Total | | | | | | $ | 35,932 | | | | | | | $ | 73,942 | |
Statement of Operations:
The effect of derivative instruments on the Statement of Operations for the year ended December 31, 2009:
Amount of Realized Gain (Loss) on Derivatives
| | | | | | | | | | Forward | | | | | | | |
| | | | | | | Written | | | Currency | | | | | | | |
| | | | Purchased | | | Option | | | Exchange | | | Swap | | | | |
| Derivatives | | | Options | | | Contracts | | | Contracts | | | Contracts | | | Total | |
| Equity contracts | | | $ | (107,551 | ) | | $ | 12,893 | | | $ | — | | | $ | 12,984 | | | $ | (81,674 | ) |
| Foreign exchange contracts | | | | — | | | | — | | | | (67,240 | ) | | | — | | | | (67,240 | ) |
| Total | | | $ | (107,551 | ) | | $ | 12,893 | | | $ | (67,240 | ) | | $ | 12,984 | | | $ | (148,914 | ) |
Change in Unrealized Appreciation (Depreciation) on Derivatives
| | | | | | | | | | Forward | | | | | | | |
| | | | | | | Written | | | Currency | | | | | | | |
| | | | Purchased | | | Option | | | Exchange | | | Swap | | | | |
| Derivatives | | | Options | | | Contracts | | | Contracts | | | Contracts | | | Total | |
| Equity contracts | | | $ | (11,075 | ) | | $ | 13,668 | | | $ | — | | | $ | 34,569 | | | $ | 37,162 | |
| Foreign exchange contracts | | | | — | | | | — | | | | (54 | ) | | | — | | | | (54 | ) |
| Total | | | $ | (11,075 | ) | | $ | 13,668 | | | $ | (54 | ) | | $ | 34,569 | | | $ | 37,108 | |
The Merger Fund VL
NOTES TO THE FINANCIAL STATEMENTS (continued)
December 31, 2009
Note 3 — AGREEMENTS
The Fund’s investment adviser is Westchester Capital Management, Inc. (the “Adviser”) pursuant to an investment advisory agreement dated July 1, 2003. Under the terms of this agreement, the Adviser is entitled to receive a fee, calculated daily and payable monthly, at the annual rate of 1.25% of the Fund’s average daily net assets. Certain officers of the Fund are also officers of the Adviser.
The Adviser has agreed to reduce its fees and reimburse the Fundto the extent total annualized expenses, excluding interest expense, borrowing expense on securities sold short and dividends on securities sold short, exceed 1.40% of average daily net assets. The agreement expires on July 1, 2013. The agreement permits the Adviser to recover the expenses paid in excess of the cap on expenses for the three previous years, as long as the recovery does not cause the Fund’s operating expenses, excluding interest expense, borrowing expense on securities sold short and dividends on securities sold short, to exceed the cap on expenses. For the year ended December 31, 2009, the Adviser reimbursed $220,029 to the Fund.
Reimbursed expenses subject to potential recovery by year of expiration are as follows:
| Year of Expiration | Potential Recovery |
| 12/31/10 | $209,476 |
| 12/31/11 | $227,119 |
| 12/31/12 | $220,029 |
U.S. Bancorp Fund Services, LLC, a subsidiary of U.S. Bancorp, a publicly held bank holding company, serves as transfer agent, administrator, dividend paying agent and shareholder servicing agent for the Fund. U.S. Bank, N.A. serves as custodian for the Fund.
Note 4 — SHARES OF BENEFICIAL INTEREST
The Board of Trustees has the authority to issue an unlimited amount of shares of beneficial interest without par value.
Changes in shares of beneficial interest were as follows:
| | | Year Ended | | | Year Ended | |
| | | December 31, 2009 | | | December 31, 2008 | |
| | | Shares | | | Amount | | | Shares | | | Amount | |
| Issued | | | 491,549 | | | $ | 5,257,980 | | | | 76,111 | | | $ | 813,115 | |
| Issued as reinvestment of dividends | | | 29,234 | | | | 312,808 | | | | 21,950 | | | | 214,451 | |
| Redeemed | | | (108,598 | ) | | | (1,134,300 | ) | | | (52,807 | ) | | | (535,902 | ) |
| Net increase | | | 412,185 | | | $ | 4,436,488 | | | | 45,254 | | | $ | 491,664 | |
The Merger Fund VL
NOTES TO THE FINANCIAL STATEMENTS (continued)
December 31, 2009
Note 5 — INVESTMENT TRANSACTIONS
Purchases and sales of securities for the year ended December 31, 2009 (excluding short-term investments, options and securities sold short) aggregated $26,874,220 and $23,244,220, respectively. There were no purchases or sales of U.S. Government securities.
At December 31, 2009, the components of accumulated earnings (losses) on a tax basis were as follows:
| Cost of Investments* | | $ | 8,867,621 | |
| Gross Unrealized Appreciation | | $ | 251,484 | |
| Gross Unrealized Depreciation | | | (172,990 | ) |
| Net Unrealized Appreciation | | $ | 78,494 | |
| Undistributed Ordinary Income | | $ | 303,259 | |
| Undistributed Long-Term Capital Gain | | | — | |
| Total Distributable Earnings | | | 303,259 | |
| Other Accumulated Losses | | $ | (85,010 | ) |
| Total Accumulated Gains | | $ | 296,743 | |
| * | Represents cost for federal income tax purposes and differs from the cost for financial reporting purposes due to wash sales and constructive sales. |
The tax components of dividends paid during the fiscal year ended December 31, 2009 and December 31, 2008 were as follows:
| | | 2009 | | | 2008 | |
| Ordinary Income | | $ | 305,684 | | | $ | 16,501 | |
| Long-Term Capital Gains | | | 7,124 | | | | 197,950 | |
The Fund designated as long-term capital gain dividends, pursuant to Internal Revenue Code Section 852(b)(3), the amount necessary to reduce the earnings and profits for the Fund related to net capital gains to zero for the tax year ended December 31, 2009.
For the fiscal year ended December 31, 2009, certain dividends paid by the Fund may be subject to a maximum tax rate of 15%, as provided for by the Jobs and Growth Tax Relief Reconciliation Act of 2003. The percentage of dividends declared from net investments income designated as qualified dividend income for the fiscal year ended December 31, 2009 was 12.14% for the Fund (unaudited).
For corporate shareholders, the percent of ordinary income distributions qualifying for the corporate dividends-received deduction for the fiscal year ended December 31, 2009 was 8.64% for the Fund (unaudited).
The percentage of taxable ordinary income distributions that are designated as short-term capital gain distributions under Internal Revenue Code Section 871(k)(2)(c) for the fiscal year ended December 31, 2009 was 100.00% for the Fund (unaudited).
The Merger Fund VL
NOTES TO THE FINANCIAL STATEMENTS (continued)
December 31, 2009
Note 6 — WRITTEN OPTION CONTRACTS
The premium amount and the number of written option contracts during the year ended December 31, 2009 were as follows:
| | | Premium | | | Number of | |
| | | Amount | | | Contracts | |
| Options outstanding at December 31, 2008 | | $ | 2,475 | | | | 14 | |
| Options written | | | 718,273 | | | | 2,677 | |
| Options closed | | | (302,533 | ) | | | (952 | ) |
| Options exercised | | | (253,793 | ) | | | (938 | ) |
| Options expired | | | (78,136 | ) | | | (567 | ) |
| Options outstanding at December 31, 2009 | | $ | 86,286 | | | | 234 | |
Note 7 — FORWARD CURRENCY EXCHANGE CONTRACTS
At December 31, 2009, the Fund had entered into forward currency exchange contracts that obligated the Fund to deliver or receive currencies at a specified future date. The net unrealized appreciation of $8,056 is included in the net unrealized appreciation (depreciation) section of the Statement of Assets and Liabilities. The terms of the open contracts are as follows:
| | | | | | | U.S. $ Value at | | | | | | | U.S. $ Value at | | | | |
| Settlement | | Currency to | | December 31, | | | Currency to | | December 31, | | | | |
| Date | | be Delivered | | 2009 | | | be Received | | 2009 | | | Unrealized | |
| 1/28/10 | | | 5,220 | | Australian Dollars | | $ | 4,675 | | | | 4,772 | | U.S. Dollars | | $ | 4,722 | | | $ | 47 | |
| 1/28/10 | | | 4,780 | | U.S. Dollars | | | 4,780 | | | | 5,220 | | Australian Dollars | | | 4,675 | | | | (105 | ) |
| 1/29/10 | | | 179,250 | | Australian Dollars | | | 160,527 | | | | 159,057 | | U.S. Dollars | | | 159,057 | | | | (1,470 | ) |
| 1/29/10 | | | 146,144 | | U.S. Dollars | | | 146,144 | | | | 159,854 | | Australian Dollars | | | 143,157 | | | | (2,987 | ) |
| 2/12/10 | | | 166,880 | | Australian Dollars | | | 149,244 | | | | 153,853 | | U.S. Dollars | | | 153,853 | | | | 4,609 | |
| 2/18/10 | | | 62,330 | | Australian Dollars | | | 55,710 | | | | 57,344 | | U.S. Dollars | | | 57,344 | | | | 1,634 | |
| 2/18/10 | | | 57,166 | | U.S. Dollars | | | 57,166 | | | | 62,330 | | Australian Dollars | | | 55,710 | | | | (1,456 | ) |
| 2/26/10 | | | 102,778 | | Australian Dollars | | | 91,791 | | | | 91,372 | | U.S. Dollars | | | 91,372 | | | | (419 | ) |
| 6/18/10 | | | 213,637 | | Australian Dollars | | | 188,347 | | | | 188,173 | | U.S. Dollars | | | 188,173 | | | | (174 | ) |
| 1/15/10 | | | 45,955 | | British Pound | | | 74,220 | | | | 76,067 | | U.S. Dollars | | | 76,067 | | | | 1,847 | |
| 3/5/10 | | | 80,465 | | British Pound | | | 129,916 | | | | 128,572 | | U.S. Dollars | | | 128,572 | | | | (1,344 | ) |
| 3/31/10 | | | 28,280 | | British Pound | | | 45,652 | | | | 45,248 | | U.S. Dollars | | | 45,248 | | | | (404 | ) |
| 1/8/10 | | | 270,000 | | Canadian Dollars | | | 258,162 | | | | 255,608 | | U.S. Dollars | | | 255,608 | | | | (2,554 | ) |
| 1/8/10 | | | 28,367 | | U.S. Dollars | | | 28,367 | | | | 30,000 | | Canadian Dollars | | | 28,685 | | | | 318 | |
| 1/29/10 | | | 62,392 | | Canadian Dollars | | | 59,658 | | | | 58,583 | | U.S. Dollars | | | 58,583 | | | | (1,075 | ) |
| 2/26/10 | | | 116,500 | | Canadian Dollars | | | 111,392 | | | | 111,122 | | U.S. Dollars | | | 111,122 | | | | (270 | ) |
| 3/30/10 | | | 53,720 | | Euros | | | 76,999 | | | | 76,820 | | U.S. Dollars | | | 76,820 | | | | (179 | ) |
| 2/26/10 | | | 1,199,740 | | Hong Kong Dollars | | | 154,798 | | | | 154,929 | | U.S. Dollars | | | 154,929 | | | | 131 | |
| 2/26/10 | | | 154,750 | | U.S. Dollars | | | 154,750 | | | | 1,199,740 | | Hong Kong Dollars | | | 154,798 | | | | 48 | |
| 3/31/10 | | | 13,946,000 | | Japanese Yen | | | 149,811 | | | | 155,145 | | U.S. Dollars | | | 155,145 | | | | 5,334 | |
| 2/25/10 | | | 1,309,000 | | Norwegian Krone | | | 225,522 | | | | 232,047 | | U.S. Dollars | | | 232,047 | | | | 6,525 | |
| | | | | | | | $ | 2,327,631 | | | | | | | | $ | 2,335,687 | | | $ | 8,056 | |
The Merger Fund VL
NOTES TO THE FINANCIAL STATEMENTS (continued)
December 31, 2009
Note 8 — SWAP CONTRACTS
Equity Swap Contracts
The Fund is subject to equity price risk and interest rate risk in the normal course of pursuing its investment objectives. The Fund has entered into both long and short equity swap contracts with multiple broker-dealers. A long equity swap contract entitles the Fund to receive from the counterparty any appreciation and dividends paid on an individual security, while obligating the Fund to pay the counterparty any depreciation on the security as well as interest on the notional amount of the contract at a rate equal to LIBOR plus 25 to 100 basis points. A short equity swap contract obligates the Fund to pay the counterparty any appreciation and dividends paid on an individual security, while entitling the Fund to receive from the counterparty any depreciation on the security as well as interest on the notional value of the contract at a rate equal to LIBOR less 25 to 100 basis points.
The Fund may also enter into equity swap contracts whose value is determined by the spread between a long equity position and a short equity position. This type of swap contract obligates the Fund to pay the counterparty an amount tied to any increase in the spread between the two securities over the term of the contract. The Fund is also obligated to pay the counterparty any dividends paid on the short equity holding as well as any net financing costs. This type of swap contract entitles the Fund to receive from the counterparty any gains based on a decrease in the spread as well as any dividends paid on the long equity holding and any net interest income.
Fluctuations in the value of an open contract are recorded daily as a net unrealized gain or loss. The Fund will realize a gain or loss upon termination or reset of the contract. Either party, under certain conditions, may terminate the contract prior to the contract’s expiration date.
Credit risk may arise as a result of the failure of the counterparty to comply with the terms of the contract. The Fund considers the creditworthiness of each counterparty to a contract in evaluating potential credit risk quarterly. The counterparty risk to the Fund is limited to the net unrealized gain, if any, on the contract, along with dividends receivable on long equity contracts and interest receivable on short equity contracts. Additionally, risk may arise from unanticipated movements in interest rates or in the value of the underlying securities. At December 31, 2009, the Fund had the following open equity swap contracts:
| | | | | | | | | Unrealized | | |
| | | | | | | | | Appreciation | | |
| Termination Date | | Security | | Shares | | | (Depreciation) | | Counterparty |
| 2/15/10 | | | Cadbury plc | | | 7,900 | | | | 1,032 | | JPMorgan Chase & Co. Inc. |
| 1/14/10 | | | Dragon Oil plc | | | 10,400 | | | | (1,764 | ) | Merrill Lynch & Co. Inc. |
| 12/31/10 | | | National Express plc | | | 24,206 | | | | 2,172 | | JPMorgan Chase & Co. Inc. |
| 12/31/10 | | | Stagecoach Group plc | | | (4,310 | ) | | | (418 | ) | JPMorgan Chase & Co. Inc. |
| | | | | | | | | | $ | 1,022 | | |
REPORT OF INDEPENDENT REGISTERED PUBLIC ACCOUNTING FIRM
To the Board of Trustees and Shareholders of
The Merger Fund VL:
In our opinion, the accompanying statement of assets and liabilities, including the schedules of investments, of securities sold short, of options written, and the related statements of operations and of changes in net assets and the financial highlights present fairly, in all material respects, the financial position of The Merger Fund VL (the "Fund") at December 31, 2009, the results of its operations for the year then ended, the changes in its net assets for each of the two years in the period then ended and the financial highlights for each of the five years in the period then ended, in conformity with accounting principles generally accepted in the United States of America. These financial statements and financial highlights (hereafter referred to as "financial statements") are the responsibility of the Fund's management; our responsibility is to express an opinion on these financial statements based on our audits. We conducted our audits of these financial statements in accordance with the standards of the Public Company Accounting Oversight Board (United States). Those standards require that we plan and perform the audit to obtain reasonable assurance about whether the financial statements are free of material misstatement. An audit includes examining, on a test basis, evidence supporting the amounts and disclosures in the financial statements, assessing the accounting principles used and significant estimates made by management, and evaluating the overall financial statement presentation. We believe that our audits, which included confirmation of securities at December 31, 2009 by correspondence with the custodian and brokers, provide a reasonable basis for our opinion.

Milwaukee, WI
February 22, 2010
INFORMATION ABOUT TRUSTEES AND OFFICERS
The business and affairs of the Fund are managed under the direction of the Fund’s Board of Trustees. Information pertaining to the Fund’s Trustees and Officers is set forth below. The Statement of Additional Information includes additional information about the Fund’s Trustees and Officers and is available, without charge, upon request by calling 1-800-343-8959.
| | | Term of | | # of Portfolios | Other |
| | Positions(s) | Office and | | in Fund Complex | Directorships |
| | Held with | Length of | Principal Occupation | Overseen by | Held by |
| Name, Address and Age | the Fund | Time Served | During Past Five Years | Trustee** | Trustee |
| Frederick W. Green* | President | Indefinite; | President of | 2 | None |
| Westchester Capital | and | since | Westchester Capital | | |
| Management, Inc. | Trustee | inception | Management, Inc., | | |
| 100 Summit Lake Drive | | | the Fund’s Adviser. | | |
| Valhalla, NY 10595 | | | | | |
| Age: 63 | | | | | |
| | | | | | |
| Bonnie L. Smith | Vice | One-year | Chief Operating | N/A | N/A |
| Westchester Capital | President, | term; since | Officer, Vice President | | |
| Management, Inc. | Secretary | inception | and Treasurer of | | |
| 100 Summit Lake Drive | and | | Westchester Capital | | |
| Valhalla, NY 10595 | Treasurer; | | Management, Inc., | | |
| Age: 62 | Anti-Money | | the Fund’s Adviser. | | |
| | Laundering | | | | |
| | Compliance | | | | |
| | Officer | | | | |
| | | | | | |
| Michael J. Downey | Independent | Indefinite; | Private investor. | 2 | Chairman and |
| c/o Westchester Capital | Trustee | since | Managing Partner of | | Director of The |
| Management, Inc. | | inception | Lexington Capital | | Asia Pacific Fund, |
| 100 Summit Lake Drive | | | Investments until 2003. | | Inc; Director of the |
| Valhalla, NY 10595 | | | Consultant and | | AllianceBernstein |
| Age: 65 | | | independent financial | | core mutual fund |
| | | | adviser since July | | group; Director of |
| | | | 1993. | | Prospect |
| | | | | | Acquisition Corp. |
| | | | | | |
| James P. Logan, III | Independent | Indefinite; | Chairman of J.P. | 2 | None |
| c/o Westchester Capital | Trustee | since | Logan & Company. | | |
| Management, Inc. | | inception | Chairman of Logan- | | |
| 100 Summit Lake Drive | | | Chace, LLC, an | | |
| Valhalla, NY 10595 | | | executive search firm. | | |
| Age: 73 | | | | | |
| | | | | | |
| Barry Hamerling | Independent | Indefinite; | Managing Partner of | 2 | Trustee of AXA |
| c/o Westchester Capital | Trustee | since 2007 | Premium Ice Cream of | | Premier VIP |
| Management, Inc. | | | America. Managing | | Trust |
| 100 Summit Lake Drive | | | Partner of Premium | | |
| Valhalla, NY 10595 | | | Salads of America. | | |
| Age: 63 | | | | | |
INFORMATION ABOUT TRUSTEES AND OFFICERS (Continued)
| | | Term of | | # of Portfolios | Other |
| | Positions(s) | Office and | | in Fund Complex | Directorships |
| | Held with | Length of | Principal Occupation | Overseen by | Held by |
| Name, Address and Age | the Fund | Time Served | During Past Five Years | Trustee** | Trustee |
| Roy D. Behren | Chief | One-year | Co-Portfolio Manager | N/A | N/A |
| Westchester Capital | Compliance | term; | and Chief Compliance | | |
| Management, Inc. | Officer | since | Officer of Westchester | | |
| 100 Summit Lake Drive | | inception | Capital Management, | | |
| Valhalla, NY 10595 | | | Inc., the Fund’s Adviser. | | |
| Age: 49 | | | | | |
| * | Denotes a trustee who is an “interested person” (as that term is defined in Section 2(a)(19) of the Investment Company Act of 1940, as amended) of the Fund or of the Fund’s Adviser. Mr. Green is deemed to be an interested person because of his affiliation with the Fund’s Investment Adviser, Westchester Capital Management, Inc., and because he is an officer of the Fund. |
| ** | The fund complex consists of the Fund and The Merger Fund. |
AVAILABILITY OF PROXY VOTING INFORMATION
Information regarding how the Fund generally votes proxies relating to portfolio securities may be obtained without charge by calling the Fund’s Transfer Agent at 1-800-343-8959 or by visiting the SEC’s website at www.sec.gov. Information regarding how the Fund voted proxies during the most recent 12-month period ended June 30 is available on the SEC’s website or by calling the toll-free number listed above.
AVAILABILITY OF QUARTERLY PORTFOLIO SCHEDULE
The Fund files its complete schedule of portfolio holdings with the SEC for the first and third quarters of each fiscal year on Form N-Q. The Fund’s Forms N-Q are available on the SEC’s website at www.sec.gov and may be reviewed and copied at the SEC’s Public Reference Room in Washington, DC. Information on the operation of the Public Reference Room may be obtained by calling 1-202-551-8090.
Investment Adviser
Westchester Capital Management, Inc.
100 Summit Lake Drive
Valhalla, NY 10595
(914) 741-5600
Administrator, Transfer Agent, Dividend Paying
Agent and Shareholder Servicing Agent
U.S. Bancorp Fund Services, LLC
615 East Michigan Street
P.O. Box 701
Milwaukee, WI 53201-0701
(800) 343-8959
Custodian
U.S. Bank, N.A.
1555 North RiverCenter Drive, Suite 302
Milwaukee, WI 53212
(800) 343-8959
Trustees
Frederick W. Green
Michael J. Downey
James P. Logan, III
Barry Hamerling
Executive Officers
Frederick W. Green, President
Bonnie L. Smith, Vice President,
Secretary and Treasurer
Roy Behren, Chief Compliance Officer
Counsel
Fulbright & Jaworski L.L.P.
666 Fifth Avenue
New York, NY 10103
Independent Registered Public Accounting Firm
PricewaterhouseCoopers LLP
100 East Wisconsin Avenue
Milwaukee, WI 53202
Item 2. Code of Ethics.
The registrant has adopted a code of ethics that applies to the registrant’s principal executive officer and principal financial officer. The registrant has not made any amendments to its code of ethics during the period covered by this report. The registrant has not granted any waivers from any provisions of the code of ethics during the period covered by this report. A copy of the registrant’s Code of Ethics is filed herewith.
Item 3. Audit Committee Financial Expert.
The registrant’s board of trustees has determined that there is at least one audit committee financial expert serving on its audit committee. Michael J. Downey, James P. Logan, III and Barry Hamerling are “audit committee financial experts” and are considered to be “independent” as each term is defined in Item 3 of Form N-CSR.
Item 4. Principal Accountant Fees and Services.
The registrant has engaged its principal accountant to perform audit services, audit-related services, tax services and other services during the past two fiscal years. “Audit services” refer to performing an audit of the registrant's annual financial statements or services that are normally provided by the accountant in connection with statutory and regulatory filings or engagements for those fiscal years. “Tax services” refer to professional services rendered by the principal accountant for tax compliance, tax advice, and tax planning. The following table details the aggregate fees billed or expected to be billed for each of the last two fiscal years for audit fees, audit-related fees, tax fees and other fees by the principal accountant.
| | FYE 12/31/2009 | FYE 12/31/2008 |
| Audit Fees | 40,000 | 40,000 |
| Audit-Related Fees | | |
| Tax Fees | 5,000 | 5,000 |
| All Other Fees | | |
The audit committee has adopted pre-approval policies and procedures that require the audit committee to pre-approve all audit and non-audit services of the registrant, including services provided to any entity affiliated with the registrant. The audit committee did not approve any services for which the preapproval requirement was waived. All of the principal accountant’s hours spent on auditing the registrant’s financial statements were attributed to work performed by full-time, permanent employees of the principal accountant.
There were no non-audit fees billed by the registrant's accountant for services to the registrant and to the registrant's investment adviser, and any entity controlling, controlled by, or under common control with the investment adviser that provides ongoing services to the registrant for each of the last two fiscal years of the registrant.
Item 5. Audit Committee of Listed Registrants.
Not applicable to registrants who are not listed issuers (as defined in Rule 10A-3 under the Securities Exchange Act of 1934).
Item 6. Investments.
Schedule of Investments is included as part of the report to shareholders filed under Item 1 of this Form.
Item 7. Disclosure of Proxy Voting Policies and Procedures for Closed-End Management Investment Companies.
Not applicable to open-end investment companies.
Item 8. Portfolio Managers of Closed-End Management Investment Companies.
Not applicable to open-end investment companies.
Item 9. Purchases of Equity Securities by Closed-End Management Investment Company and Affiliated Purchasers.
Not applicable to open-end investment companies.
Item 10. Submission of Matters to a Vote of Security Holders.
There have been no material changes to the procedures by which shareholders may recommend nominees to the registrant’s board of trustees.
Item 11. Controls and Procedures.
| (a) | The Registrant’s President/Principal Executive Officer and Treasurer/Principal Financial Officer have reviewed the Registrant's disclosure controls and procedures (as defined in Rule 30a-3(c) under the Investment Company Act of 1940 (the “Act”)) as of a date within 90 days of the filing of this report, as required by Rule 30a-3(b) under the Act and Rules 13a-15(b) or 15d-15(b) under the Securities Exchange Act of 1934. Based on their review, such officers have concluded that the disclosure controls and procedures are reasonably designed to ensure that information required to be disclosed in this report is appropriately recorded, processed, summarized and reported and made known to them by others within the Registrant and by the Registrant’s service provider. |
| (b) | There were no changes in the Registrant's internal control over financial reporting (as defined in Rule 30a-3(d) under the Act) that occurred during the second fiscal quarter of the period covered by this report that has materially affected, or is reasonably likely to materially affect, the Registrant's internal control over financial reporting. |
Item 12. Exhibits.
| (a) | (1) Any code of ethics or amendment thereto, that is the subject of the disclosure required by Item 2, to the extent that the registrant intends to satisfy Item 2 requirements through filing an exhibit. Filed herewith. |
(2) A separate certification for each principal executive and principal financial officer pursuant to Section 302 of the Sarbanes-Oxley Act of 2002. Filed herewith.
(3) Any written solicitation to purchase securities under Rule 23c-1 under the Act sent or given during the period covered by the report by or on behalf of the registrant to 10 or more persons. Not applicable to open-end investment companies.
| (b) | Certifications pursuant to Section 906 of the Sarbanes-Oxley Act of 2002. Furnished herewith. |
SIGNATURES
Pursuant to the requirements of the Securities Exchange Act of 1934 and the Investment Company Act of 1940, the registrant has duly caused this report to be signed on its behalf by the undersigned, thereunto duly authorized.
(Registrant) The Merger Fund VL
By (Signature and Title)* /s/ Frederick W. Green
Frederick W. Green, President
Date 2/8/2010
Pursuant to the requirements of the Securities Exchange Act of 1934 and the Investment Company Act of 1940, this report has been signed below by the following persons on behalf of the registrant and in the capacities and on the dates indicated.
By (Signature and Title)* /s/ Frederick W. Green � 0;
Frederick W. Green, President
Date 2/8/2010
By (Signature and Title)* /s/ Bonnie L. Smith
Bonnie L. Smith, Treasurer
Date 2/4/2010
* Print the name and title of each signing officer under his or her signature.