UNITED STATES
SECURITIES AND EXCHANGE COMMISSION
Washington, D.C. 20549
FORM N-CSR
CERTIFIED SHAREHOLDER REPORT OF REGISTERED
MANAGEMENT INVESTMENT COMPANIES
Investment Company Act file number 811-21279
The Merger Fund VL
(Exact name of registrant as specified in charter)
100 Summit Lake Drive
Valhalla, New York 10595
(Address of principal executive offices) (Zip code)
Roy Behren and Michael T. Shannon
The Merger Fund VL
100 Summit Lake Drive
Valhalla, New York 10595
(Name and address of agent for service)
914-741-5600
Registrant's telephone number, including area code
Date of fiscal year end: December 31
Date of reporting period: December 31, 2010
Item 1. Reports to Stockholders.
THE MERGER FUND VL
ANNUAL REPORT
DECEMBER 31, 2010
February 7, 2011
Dear Shareholder:
The Merger Fund VL posted an increase of 1.2% for the quarter ending December 31, 2010, bringing the Fund’s gain to 5.3% for the calendar year, which was below our targeted rate of return. Some mid-year glitches in Australia as well as a sluggish deal environment and an extremely low interest rate climate contributed to the shortfall. The S&P 500, however, surpassed most expectations with a gain of 10.8% for the period, capping a surprising year in which the index logged a +15.1% rate of return and continued its bounce back from early-2009 recession lows. We routinely mention this equity market index in our letters, not just to compare performance, but also to highlight our lack of correlation (although in Q4 correlation would have been a good thing). There were eight broken deals out of 192 arbitrage investments made during the year, a greater than usual proportion. In any event, this quarter produced a positive return for the 20th time in the past 26 quarters (we have had no down years since our inception in 2004), and our standard deviation for the year was 2.95%, compared to the S&P 500’s 22.04%. Standard deviation is a measure of the volatility, or risk, of the Fund’s monthly returns and is a good gauge of our ability to provide our investors with a low volatility product, in both good markets and bad.
Our winners outnumbered our losers by approximately 4 to 1 during the last three months. We added 40 new positions during the quarter, in such diverse sectors as technology, coal mining, oil and gas production, construction equipment, consumer goods and financials. The portfolio continues to be invested globally. Most recent foreign action has been in Australia, as European activity continues to be tepid at best. In all, deal activity was disappointing in 2010. Consider the following data (by cumulative value):1
| • | Western European deal activity was down 27% from 2009, the third consecutive yearly decline |
| • | North American activity was down 28% from 2009, the third consecutive annual decline |
| • | Asia Pacific regional activity, including China (surprisingly) was down 23% from 2009, the first decline in 3 years |
| • | Activity in the rest of the world was up 30% year-over-year, with the big surprise being that Brazilian transactions, valued at $161 billion USD, outpaced Russian deals by a billion dollars |
However, there are many causes for optimism regarding future transaction activity. For one, interest rates remain at historically low levels, enabling the cheapest borrowing costs in decades. Secondly, equity markets have rebounded smartly, rising 101% since the lows of March 2009, making acquirers’ currencies more valuable should a company want to pay for its acquisition with stock. Additionally, corporate balance sheets are flush with cash. Cash levels at U.S. non-financial companies exceed $2 trillion, which provide incentives for buyers to deploy their excess cash and increase return on equity. This further provides built-in financing when purchasing a cash-rich target company. Finally, many companies had fueled temporary growth by cutting costs during the recession, and now have limited ways of growing their top and bottom lines other than through acquisitions.
Private equity has a role to play as well. There is thought to be in excess of $500 billion in private equity capital commitments that are waiting to be deployed in LBO and “club” acquisitions. Worth noting is that, on average, these commitments expire within 2½ years, providing additional incentive for sponsors to transact in the near term.
A possible harbinger of returning corporate confidence is the increase in unsolicited bids, which totaled 8 percent of global deal flow in 2010, according to Ernst & Young’s year-end merger and acquisition study.2 Gordon Dyal, the global head of mergers and acquisitions at Goldman Sachs, quoted in the New York Times Dealbook, has opined, “…looking at our backlog, we see continued, steady growth.”3
1 Zephyr Annual M&A report 2010, published by BvD
2 NY Times Dealbook, January 3, 2011
3 Ibid.
Regardless of the level of deal activity, it is our job to make intelligent investment decisions. There are times when that entails avoiding a merger altogether or investing in the situation in a more conservative manner. For example, the high profile unsolicited offer for Potash Corp. of Saskatchewan Inc. (“Potash”) by BHP Billiton Limited (“BHP”) provides an illustration of our risk management philosophy.
In August of 2010, BHP announced its intention to make an offer to acquire all of the shares of Potash for $130 per share, or $40 billion USD. Potash, which had traded at $112.15 on the prior day, formed an independent committee of directors to consider the proposal, rejected the offer the following day, and implemented a poison-pill shareholder-rights plan. BHP then commenced its tender offer, but because of the poison pill, it would have been unable to purchase all of the shares without a negotiated agreement in which management cancelled the rights plan. The poison pill would be triggered if any shareholder’s ownership exceeded 20% of the outstanding shares without management approval, making a purchase unacceptably expensive. Thus, the game was on.
BHP dwarfs Potash in market capitalization, revenues and profits and would have had no problem financing its offer. Additionally, BHP had recently been rejected as a suitor of Rio Tinto plc, and its management team was motivated to prove it could successfully complete a large transaction. The parties’ deal, legal and defense teams suited up for a high-stakes battle. Both sides lobbied the press, shareholders and most importantly, the regulators. In addition to typical anti-trust approvals, BHP’s proposal required local Saskatchewan Financial Services Commission approval. Rumors of counter-bidders and Chinese interest in Potash swirled while the parties filed suit against each other. Potash management claimed to be evaluating several undisclosed alternatives for the company, while simultaneously assuring shareholders that its goal was to do what was best for shareholders as well as the company itself.
In the meantime, over a month had passed and a funny thing happened. Fertilizer prices began to lift, corn prices increased, and the underlying value of the target company ballooned. To compress the story a bit, the stock traded up through the offer price and into the mid-$140s. Speculation ran wild that BHP, which could afford to sweeten its offer, would pay as much as $170 per share for Potash.
We, along with our regulatory counsel, had determined by that point that local government approval was not a layup, but that values had indeed gone up significantly and a deal price in excess of $160 would still be accretive to BHP’s earnings. In fact, our assessment was that if there was a way to purchase stock at or below $140, our downside, if any, would be limited, and we were willing to cap our potential profits in order to reduce our risk. While other investors and hedge funds were paying $147 for stock or purchasing call options as a cheap way to take a 3-point shot (to keep the metaphor going), we were happy to purchase stock and sell deep in-the-money 135 and 140 strike call options on Potash. While this strategy could not guarantee a profitable investment, it would have the effect of creating a nice rate of return if the stock was higher than the strike price at expiration but would cap our profits if a deal was struck at an extraordinary price. We thought the risk/reward profile fit our philosophy perfectly, and we were happy with the downside protection we had put in place.
Ultimately, the Saskatchewan government rejected BHP’s bid, and BHP walked away from its prey. Potash stock traded down from $147 to as low as $137 before settling in at approximately $142. Although most event-driven investors lost money on this situation, The Merger Fund VL profited because the stock remained above our strike price beyond the options’ expiration date. Our unique and collaborative approach to portfolio management enabled us to creatively structure an investment with the conservative characteristics that are the hallmark of our Fund.
The quality of the team managing your assets has always been a priority for us. Westchester Capital Management’s infrastructure has continued to expand along with the Fund’s assets, and we have been fortunate to attract talented partners and employees. This year, Bruce Rubin joined us as Chief Operating Officer and Chief Compliance Officer. His wealth of experience in the investment management business should keep the company and its operations running smoothly. We have also hired Jody Harris-Stern as Director of Business Development. In addition to helping to plan our new initiatives, such as possible sister funds in the alternative investment space, Jody’s senior background in client-facing roles at UBS Global Asset Management will allow us to continue to
service investors in the manner to which they have become accustomed for the past 22 years. Our head trader, Abe Cary, has also continued to assume new portfolio-related responsibilities, and with the addition of Ben Kunofsky as our secondary trader, Abe has been able to provide valuable input into our investment process. Needless to say, the strong team that we have assembled in both the front and middle office will continue to allow your portfolio managers to focus on investment management, and nothing but investment management.
We remain optimistic about an upturn in deal activity in 2011. We are close to one hundred percent invested, and the Fund currently holds positions in 65 arbitrage situations around the globe.
Finally, thanks very much for your continued support. We take our risk-management responsibilities seriously.
Best wishes for a happy and peaceful 2011.
Sincerely,
 |  |
| Roy Behren | Mike Shannon |
| | |
| Top Ten Winners for 2010 | | Top Ten Losers for 2010 |
| Deal | Attribution | | Deal | Attribution |
| Chloride Group plc. | 0.81% | | Nufarm Limited/Sinochem | -0.53% |
| KKR Private Equity Investors LP/ | | | Savient Pharmaceuticals Inc. | -0.47% |
| The Blackstone Group | 0.53% | | Infigen Energy | -0.45% |
| Smith International, Inc./ | | | Hillgrove Resources Ltd. | -0.40% |
| Schlumberger NV | 0.32% | | Macarthur Coal Ltd./Peabody Energy | -0.25% |
| Potash Corporation of Saskatchewan/ | | | Perpetual Ltd. | -0.16% |
| BHP Billiton Ltd. | 0.29% | | Indophil Resources NL | -0.13% |
| XTO Energy Inc./Exxon Mobil Corp. | 0.24% | | AXA Asia Pacific Holdings/AMP Ltd. | -0.12% |
| Allegheny Energy Inc./First Energy Inc. | 0.23% | | McAfee Inc./Intel Corp. | -0.11% |
| Undisclosed Chemical Corporation | 0.21% | | California Pizza Kitchen | -0.08% |
| Genzyme Corporation | 0.20% | | | |
| Qwest Communications International/ | | | | |
| CenturyLink, Inc. | 0.18% | | | |
| Undisclosed UK Media | 0.18% | | | |
Note: Before investing in The Merger Fund VL, consider its investment objectives, risks, charges and expenses. For a prospectus containing this and other information, including current performance data that may be lower or higher than the data included herein, contact your life insurance company or The Merger Fund VL c/o U.S. Bancorp Fund Services, LLC at (800) 343-8959. Please read it carefully. The performance data included herein represents past performance and does not guarantee future results. The Merger Fund VL’s share price and return will vary, and investors may have a gain or loss when they redeem their shares.
The S&P 500 Index is an unmanaged index that contains securities typically selected by growth managers as being representative of the U.S. stock market. The Index does not reflect investment management fees, brokerage commission and other expenses associated with investing in equity securities. You cannot invest directly in an index.
Please refer to the Schedule of Investments in this report for holding information. Fund holdings are subject to change at any time and should not be considered recommendations to buy or sell any security. Current and future portfolio holdings are subject to risk.
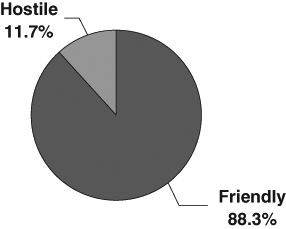
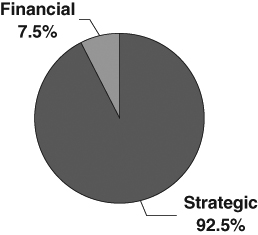
| Chart 1 | Chart 2 |
| | |
| PORTFOLIO COMPOSITION | PORTFOLIO COMPOSITION |
| By Type of Deal* | By Type of Buyer* |
| | |
 |  |
| Chart 3 |
| |
| PORTFOLIO COMPOSITION |
| By Deal Terms* |
| |
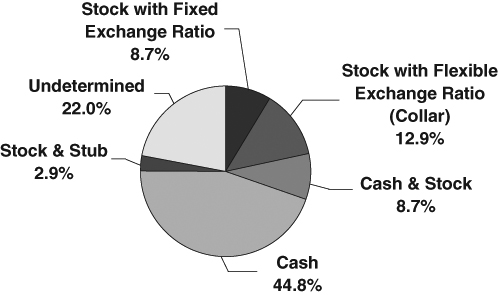 |
* Data expressed as a percentage of long equity positions as of December 31, 2010
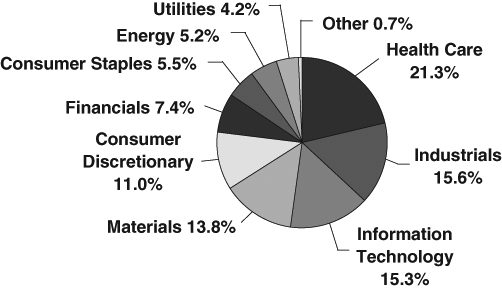
| Chart 4 |
| |
| PORTFOLIO COMPOSITION |
| By Sector* |
| |
 |
| Chart 5 |
| |
| PORTFOLIO COMPOSITION |
| By Region* |
| |
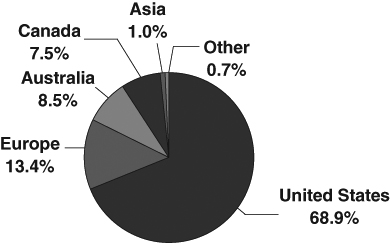 |
* Data expressed as a percentage of long equity positions as of December 31, 2010
The Global Industry Classifications Standard (GICS®) was developed by and/or is the exclusive property of MSCI, Inc. and Standard & Poor Financial Services LLC (“S&P”). GICS is a service mark of MSCI and S&P and has been licensed for use by U.S. Bancorp Fund Services, LLC.
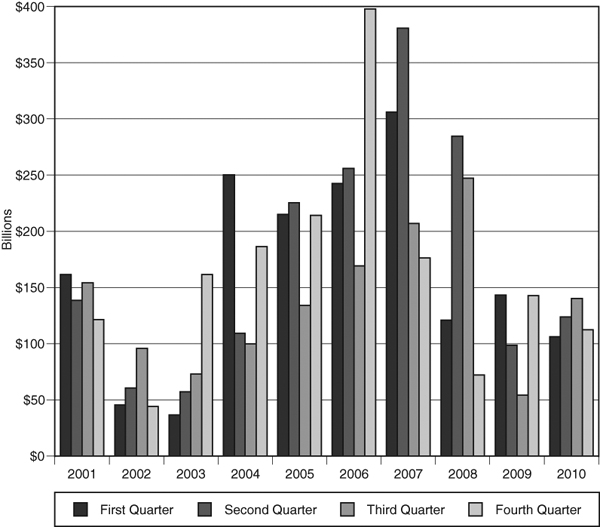
Chart 6
MERGER ACTIVITY
2001 – 2010
Source: Securities Data Corp.
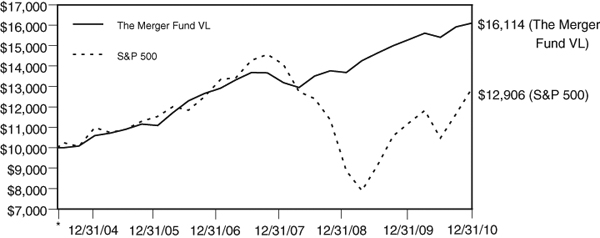
COMPARISON OF CHANGE IN VALUE OF $10,000 INVESTMENT
IN THE MERGER FUND VL AND S&P 500
* Inception Date 5/26/04
| | Average Annual Total Return |
| | 1 Year | 3 Year | 5 Year | Since Inception |
| The Merger Fund VL | 5.30% | 6.91% | 7.78% | 7.50% |
| The Standard & Poor’s 500 Index | 15.06% | -2.86% | 2.29% | 3.94% |
The Standard & Poor’s 500 Index (S&P 500) is a capitalization-weighted index, representing the aggregate market value of the common equity of 500 stocks primarily traded on the New York Stock Exchange. This chart assumes an initial gross investment of $10,000 made on May 26, 2004. Returns shown include the reinvestment of all dividends. Past performance is not predictive of future performance. The graph and table do not reflect the deduction of taxes that a shareholder would pay on fund distributions or the redemption of fund shares. Investment return and principal value will fluctuate, so that your shares, when redeemed, may be worth more or less than the original cost.
The Merger Fund VL
EXPENSE EXAMPLE
December 31, 2010
(Unaudited)
As a shareholder of the Fund, you incur ongoing costs, including management fees and other Fund expenses. This example is intended to help you understand your ongoing costs (in dollars) of investing in the Fund and to compare these costs with the ongoing costs of investing in other mutual funds. The example is based on an investment of $1,000 for the period 7/1/10 – 12/31/10.
Actual Expenses
The first line of the table below provides information about actual account values and actual expenses. To the extent the Fund invests in shares of other investment companies as part of its investment strategy, you will indirectly bear your proportionate share of any fees and expenses charged by the underlying funds in which the Fund invests in addition to the expenses of the Fund. Actual expenses of the underlying funds are expected to vary among the various underlying funds. These expenses are not included in the example below. The example below includes, but is not limited to, management fees, fund accounting, custody and transfer agent fees. However, the example below does not include portfolio trading commissions and related expenses, and other extraordinary expenses as determined under generally accepted accounting principles. You may use the information in this line, together with the amount you invested, to estimate the expenses that you paid over the period. Simply divide your account value by $1,000 (for example, an $8,600 account value divided by $1,000 = 8.6), then multiply the result by the number in the first line under the heading entitled “Expenses Paid During Period” to estimate the expenses you paid on your account during this period.
Hypothetical Example for Comparison Purposes
The second line of the table below provides information about hypothetical account values and hypothetical expenses based on the Fund’s actual expense ratio and an assumed rate of return of 5% per year before expenses, which is not the Fund’s actual return. The hypothetical account values and expenses may not be used to estimate the actual ending account balance or expenses you paid for the period. You may use this information to compare the ongoing costs of investing in the Fund and other funds. To do so, compare this 5% hypothetical example with the 5% hypothetical examples that appear in the shareholder reports of the other funds. Please note that the expenses shown in the table are meant to highlight your ongoing costs only and do not reflect any transactional costs, such as redemption fees. Therefore, the second line of the table is useful in comparing ongoing costs only, and will not help you determine the relative total costs of owning different funds. In addition, if these transactional costs were included, your costs would have been higher.
| | Beginning Account | Ending Account | Expenses Paid During |
| | Value 7/1/10 | Value 12/31/10 | Period 7/1/10 – 12/31/10* |
Actual + (1) | $1,000.00 | $1,046.10 | $18.26 |
Hypothetical ++ (2) | $1,000.00 | $1,007.36 | $17.91 |
| + | Excluding dividends on securities sold short, borrowing expense on securities sold short and interest expense, your actual cost of investment in the Fund would be $7.22. |
| ++ | Excluding dividends on securities sold short, borrowing expense on securities sold short and interest expense, your hypothetical cost of investment in the Fund would be $7.12. |
| (1) | Ending account values and expenses paid during period based on a 4.61% return. This actual return is net of expenses. |
| (2) | Ending account values and expenses paid during period based on a 5.00% annual return before expenses. |
| * | Expenses are equal to the Fund’s annualized expense ratio of 3.54%, multiplied by the average account value over the period, multiplied by 184/365 (to reflect the one-half year period). |
The Merger Fund VL
SCHEDULE OF INVESTMENTS
December 31, 2010
| Shares | | | | Value | |
| | | | |
| COMMON STOCKS — 91.33% | | | |
| | | | | | |
| | | AIRLINES — 2.29% | | | |
| | 46,000 | | AirTran Holdings, Inc. (a)(d) | | $ | 339,940 | |
| | | | APPAREL RETAIL — 3.51% | | | | |
| | 10,900 | | J.C. Penney Company, Inc. (c) | | | 352,179 | |
| | 3,900 | | J. Crew Group, Inc. (a)(c) | | | 168,246 | |
| | | | | | | 520,425 | |
| | | | ASSET MANAGEMENT & CUSTODY BANKS — 0.16% | | | | |
| | 1,686 | | The Blackstone Group, LP | | | 23,857 | |
| | | | BIOTECHNOLOGY — 6.48% | | | | |
| | 3,700 | | Crucell NV (a)(f) | | | 116,687 | |
| | 6,900 | | Genzyme Corporation (a)(c) | | | 491,280 | |
| | 8,400 | | Savient Pharmaceuticals Inc. (a) | | | 93,576 | |
| | 11,100 | | Talecris Biotherapeutics Holdings Corp. (a)(d) | | | 258,630 | |
| | | | | | | 960,173 | |
| | | | BROADCASTING — 0.69% | | | | |
| | 1,100 | | CC Media Holdings, Inc. (a)(e) | | | 9,900 | |
| | 1,700 | | Discovery Communications, Inc. Series K (a)(d) | | | 62,373 | |
| | 1,125 | | Promotora De Informaciones S.A. — ADR (a)(f) | | | 9,023 | |
| | 2,250 | | Promotora De Informaciones S.A. Class B — ADR (a)(f) | | | 21,465 | |
| | | | | | | 102,761 | |
| | | | CABLE & SATELLITE — 1.46% | | | | |
| | 10,400 | | Comcast Corporation Special Class A (e) | | | 216,424 | |
| | | | COMMUNICATIONS EQUIPMENT — 2.39% | | | | |
| | 39,100 | | Motorola, Inc. (a)(c) | | | 354,637 | |
| | | | COMPUTER STORAGE & PERIPHERALS — 2.75% | | | | |
| | 2,200 | | Compellent Technologies, Inc. (a) | | | 60,698 | |
| | 5,100 | | EMC Corp. (a) | | | 116,790 | |
| | 15,300 | | Seagate Technology LLC (a)(d)(f) | | | 229,959 | |
| | | | | | | 407,447 | |
| | | | CONSTRUCTION & ENGINEERING — 1.34% | | | | |
| | 3,700 | | Massey Energy Company (c) | | | 198,505 | |
The accompanying notes are an integral part of these financial statements.
The Merger Fund VL
SCHEDULE OF INVESTMENTS (continued)
December 31, 2010
| Shares | | | | Value | |
| | | CONSTRUCTION, FARM MACHINERY & HEAVY TRUCKS — 6.64% | | | |
| | 11,000 | | Bucyrus International Inc. (b) | | $ | 983,400 | |
| | | | DIVERSIFIED BANKS — 0.23% | | | | |
| | 600 | | Bank of Montreal (c) | | | 34,542 | |
| | | | DIVERSIFIED CHEMICALS — 0.12% | | | | |
| | 1,100 | | Huntsman Corporation | | | 17,171 | |
| | | | DIVERSIFIED METALS & MINING — 3.63% | | | | |
| | 1,800 | | Indophil Resources NL (a)(f) | | | 1,952 | |
| | 600 | | Rio Tinto plc — ADR (f) | | | 42,996 | |
| | 39,800 | | Western Coal Corp. (a)(d)(f) | | | 492,346 | |
| | | | | | | 537,294 | |
| | | | ELECTRIC UTILITIES — 1.91% | | | | |
| | 11,700 | | Allegheny Energy Inc. (d) | | | 283,608 | |
| | | | ELECTRICAL COMPONENTS & EQUIPMENT — 4.08% | | | | |
| | 8,306 | | Baldor Electric Company (d) | | | 523,610 | |
| | 6,570 | | SunPower Corp. Class B (a)(d) | | | 81,534 | |
| | | | | | | 605,144 | |
| | | | ELECTRONIC EQUIPMENT & INSTRUMENTS — 0.25% | | | | |
| | 3,100 | | L-1 Identity Solutions, Inc. (a) | | | 36,921 | |
| | | | FERTILIZERS & AGRICULTURAL CHEMICALS — 4.70% | | | | |
| | 4,500 | | Potash Corporation of Saskatchewan (e)(f) | | | 696,735 | |
| | | | FOOD RETAIL — 0.06% | | | | |
| | 200 | | Casey’s General Stores, Inc. (c) | | | 8,502 | |
| | | | GAS UTILITIES — 1.03% | | | | |
| | 3,050 | | Nicor Inc. | | | 152,256 | |
| | | | HEALTH CARE FACILITIES — 0.44% | | | | |
| | 9,800 | | Tenet Healthcare Corp. (a) | | | 65,562 | |
| | | | HEALTH CARE SERVICES — 0.92% | | | | |
| | 2,100 | | Emergency Medical Services Corporation (a)(c) | | | 135,681 | |
| | | | HEALTH CARE SUPPLIES — 8.06% | | | | |
| | 7,313 | | Alcon Inc. — ADR (c)(f) | | | 1,194,944 | |
| | | | HOUSEWARES & SPECIALTIES — 0.85% | | | | |
| | 2,100 | | Fortune Brands, Inc. (c) | | | 126,525 | |
| | | | INDUSTRIAL GASES — 3.63% | | | | |
| | 8,600 | | Airgas, Inc. (c) | | | 537,156 | |
The accompanying notes are an integral part of these financial statements.
The Merger Fund VL
SCHEDULE OF INVESTMENTS (continued)
December 31, 2010
| Shares | | | | Value | |
| | | INTERNET SOFTWARE & SERVICES — 0.55% | | | |
| | 4,900 | | Yahoo! Inc. (a) | | $ | 81,487 | |
| | | | LIFE & HEALTH INSURANCE — 0.73% | | | | |
| | 11,318 | | Phoenix Group Holdings (d)(f) | | | 107,814 | |
| | | | MOVIES & ENTERTAINMENT — 0.29% | | | | |
| | 3,000 | | News Corporation Class A | | | 43,680 | |
| | | | OIL & GAS DRILLING — 0.31% | | | | |
| | 1,400 | | Pride International, Inc. (a) | | | 46,200 | |
| | | | OIL & GAS EXPLORATION & PRODUCTION — 3.32% | | | | |
| | 2,800 | | Atlas Energy, Inc. (a) | | | 123,116 | |
| | 18,000 | | EXCO Resources, Inc. (c) | | | 349,560 | |
| | 1,300 | | Quicksilver Resources, Inc. (a) | | | 19,162 | |
| | | | | | | 491,838 | |
| | | | PACKAGED FOODS & MEATS — 1.73% | | | | |
| | 13,600 | | Del Monte Foods Co. (b) | | | 255,680 | |
| | | | PERSONAL PRODUCTS — 1.81% | | | | |
| | 4,300 | | Mead Johnson Nutrition Co. (e) | | | 267,675 | |
| | | | PHARMACEUTICALS — 5.73% | | | | |
| | 60,400 | | King Pharmaceuticals, Inc. (a)(b) | | | 848,620 | |
| | | | REGIONAL BANKS — 2.80% | | | | |
| | 60,000 | | Marshall & lsley Corporation (e) | | | 415,200 | |
| | | | SOFT DRINKS — 2.38% | | | | |
| | 14,100 | | Coca-Cola Enterprises, Inc. (c) | | | 352,923 | |
| | | | SPECIALTY STORES — 1.18% | | | | |
| | 2,896 | | Jo-Ann Stores, Inc. (a) | | | 174,397 | |
| | | | SYSTEMS SOFTWARE — 10.52% | | | | |
| | 25,875 | | McAfee Inc. (a)(e) | | | 1,198,271 | |
| | 43,400 | | Novell, Inc. (a) | | | 256,928 | |
| | 6,200 | | Symantec Corp. (a) | | | 103,788 | |
| | | | | | | 1,558,987 | |
| | | | TRUCKING — 2.36% | | | | |
| | 7,400 | | Dollar Thrifty Automotive Group, Inc. (a)(c) | | | 349,724 | |
| | | | TOTAL COMMON STOCKS (Cost $13,423,139) | | | 13,533,835 | |
The accompanying notes are an integral part of these financial statements.
The Merger Fund VL
SCHEDULE OF INVESTMENTS (continued)
December 31, 2010
| Shares | | | | Value | |
| WARRANTS — 0.02% | | | |
| | | Kinross Gold Corporation Class D (f) | | | |
| | 668 | | Expiration: September, 2014, Exercise Price: $21.30 (a) | | $ | 3,151 | |
| | | | TOTAL WARRANTS (Cost $2,560) | | | 3,151 | |
| | | | | | | | |
| Principal Amount | | | | |
| CORPORATE BONDS — 1.50% | | | | |
| | | | Mirant Corporation | | | | |
| | $218,000 | | 7.375%, 12/31/2013 (c) | | | 222,107 | |
| | | | TOTAL CORPORATE BONDS (Cost $223,910) | | | 222,107 | |
| | | | | | | | |
| Contracts (100 shares per contract) | | | | |
| PURCHASED PUT OPTIONS — 0.11% | | | | |
| | | | Bank Of Montreal | | | | |
| | 5 | | Expiration: January, 2011, Exercise Price: $50.00 | | | 12 | |
| | 1 | | Expiration: February, 2011, Exercise Price: $50.00 | | | 15 | |
| | | | Coca-Cola Enterprises, Inc. | | | | |
| | 130 | | Expiration: January, 2011, Exercise Price: $23.00 | | | 975 | |
| | | | Compellent Technologies, Inc. | | | | |
| | 22 | | Expiration: January, 2011, Exercise Price: $22.50 | | | 55 | |
| | | | Energy Select Sector SPDR | | | | |
| | 4 | | Expiration: January, 2011, Exercise Price: $69.00 | | | 654 | |
| | | | Fortune Brands, Inc. | | | | |
| | 21 | | Expiration: January, 2011, Exercise Price: $55.00 | | | 105 | |
| | | | Global Alternative Energy ETF | | | | |
| | 13 | | Expiration: January, 2011, Exercise Price: $21.00 | | | 1,397 | |
| | | | J.C. Penney Company, Inc. | | | | |
| | 109 | | Expiration: January, 2011, Exercise Price: $29.00 | | | 2,398 | |
| | | | Market Vectors Agribusiness | | | | |
| | 47 | | Expiration: January, 2011, Exercise Price: $52.00 | | | 1,998 | |
| | | | Massey Energy Company | | | | |
| | 11 | | Expiration: January, 2011, Exercise Price: $38.00 | | | 55 | |
| | | | Materials Select Sector SPDR | | | | |
| | 13 | | Expiration: March, 2011, Exercise Price: $39.00 | | | 2,756 | |
| | | | Mead Johnson Nutrition Co. | | | | |
| | 43 | | Expiration: February, 2011, Exercise Price: $55.00 | | | 3,418 | |
| | | | Nicor Inc. | | | | |
| | 28 | | Expiration: February, 2011, Exercise Price: $45.00 | | | 210 | |
The accompanying notes are an integral part of these financial statements.
The Merger Fund VL
SCHEDULE OF INVESTMENTS (continued)
December 31, 2010
| Contracts (100 shares per contract) | | Value | |
| | | Pride International, Inc. | | | |
| | 14 | | Expiration: January, 2011, Exercise Price: $27.50 | | $ | 70 | |
| | | | Quicksilver Resources, Inc. | | | | |
| | 13 | | Expiration: January, 2011, Exercise Price: $12.50 | | | 33 | |
| | | | Symantec Corp. | | | | |
| | 62 | | Expiration: January, 2011, Exercise Price: $14.00 | | | 372 | |
| | | | Technology Select Sector SPDR | | | | |
| | 36 | | Expiration: January, 2011, Exercise Price: $25.00 | | | 1,080 | |
| | | | iShares Nasdaq Biotech | | | | |
| | 2 | | Expiration: January, 2011, Exercise Price: $95.00 | | | 470 | |
| | | | | | | 16,073 | |
| PURCHASED CALL OPTIONS — 0.00% | | | | |
| | | | Novartis AG | | | | |
| | 15 | | Expiration: January, 2011, Exercise Price: $65.00 | | | 75 | |
| | | | TOTAL PURCHASED OPTIONS (Cost $39,073) | | | 16,148 | |
| | | | TOTAL INVESTMENTS (Cost $13,688,682) — 92.96% | | $ | 13,775,241 | |
| | | | | | | | |
ADR – American Depository Receipt
| (a) | Non-income producing security. |
| (b) | All or a portion of the shares have been committed as collateral for open securities sold short. |
| (c) | All or a portion of the shares have been committed as collateral for written option contracts. |
| (d) | All or a portion of the shares have been committed as collateral for swap contracts. |
| (e) | All or a portion of the shares have been committed as collateral for forward currency exchange contracts. |
The Global Industry Classifications Standard (GICS®) was developed by and/or is the exclusive property of MSCI, Inc. and Standard & Poor Financial Services LLC (“S&P”). GICS is a service mark of MSCI and S&P and has been licensed for use by U.S. Bancorp Fund Services, LLC.
The accompanying notes are an integral part of these financial statements.
The Merger Fund VL
SCHEDULE OF SECURITIES SOLD SHORT
December 31, 2010
| Shares | | | | Value | |
| | 142 | | AGL Resources Inc. | | $ | 5,091 | |
| | 1,601 | | Avis Budget Group, Inc. | | | 24,912 | |
| | 7,569 | | Bank of Montreal (a) | | | 435,747 | |
| | 1,686 | | The Blackstone Group, LP | | | 23,857 | |
| | 10,400 | | Comcast Corporation Class A | | | 228,488 | |
| | 1,700 | | Discovery Communications, Inc. | | | 70,890 | |
| | 7,835 | | FirstEnergy Corp. | | | 290,052 | |
| | 154 | | Goldcorp Inc. (a) | | | 7,106 | |
| | 7,146 | | Grifols SA (a) | | | 97,402 | |
| | 400 | | Hertz Global Holdings, Inc. | | | 5,796 | |
| | 27 | | Kinross Gold Corporation (a) | | | 513 | |
| | 3,000 | | News Corporation Class B | | | 49,260 | |
| | 6,441 | | Novartis AG - ADR (a) | | | 379,697 | |
| | 601 | | Rio Tinto Ltd. (a)(b) | | | 53,081 | |
| | 3,818 | | Southwest Airlines Co. | | | 49,558 | |
| | 6,570 | | SunPower Corp. Class A | | | 84,293 | |
| | 408 | | VMware Inc. | | | 36,275 | |
| | 1,363 | | Walter Energy Inc. | | | 174,246 | |
| | | | TOTAL SECURITIES SOLD SHORT | | | | |
| | | | (Proceeds $1,942,083) | | $ | 2,016,264 | |
ADR – American Depository Receipt
| (b) | Level 2 Investment (see Note 2). |
The accompanying notes are an integral part of these financial statements.
The Merger Fund VL
SCHEDULE OF OPTIONS WRITTEN
December 31, 2010
| Contracts (100 shares per contract) | | Value | |
| CALL OPTIONS WRITTEN | | | |
| | | Airgas, Inc. | | | |
| | 45 | | Expiration: January, 2011, Exercise Price: $60.00 | | $ | 12,262 | |
| | 13 | | Expiration: January, 2011, Exercise Price: $62.50 | | | 1,300 | |
| | | | Alcon, Inc. ADR | | | | |
| | 2 | | Expiration: January, 2011, Exercise Price: $160.00 | | | 740 | |
| | | | Bank of Montreal | | | | |
| | 5 | | Expiration: January, 2011, Exercise Price: $55.00 | | | 1,400 | |
| | 1 | | Expiration: February, 2011, Exercise Price: $55.00 | | | 310 | |
| | | | Casey’s General Stores, Inc | | | | |
| | 2 | | Expiration: January, 2011, Exercise Price: $40.00 | | | 560 | |
| | | | Coca-Cola Enterprises, Inc. | | | | |
| | 141 | | Expiration: January, 2011, Exercise Price: $25.00 | | | 7,755 | |
| | | | Compellent Technologies, Inc | | | | |
| | 22 | | Expiration: January, 2011, Exercise Price: $27.50 | | | 440 | |
| | | | Dollar Thrifty Automotive Group, Inc. | | | | |
| | 31 | | Expiration: January, 2011, Exercise Price: $46.00 | | | 4,960 | |
| | 7 | | Expiration: January, 2011, Exercise Price: $48.00 | | | 245 | |
| | 7 | | Expiration: January, 2011, Exercise Price: $49.00 | | | 140 | |
| | | | Emergency Medical Services Corporation | | | | |
| | 21 | | Expiration: January, 2011, Exercise Price: $60.00 | | | 10,920 | |
| | | | EXCO Resources Inc. | | | | |
| | 31 | | Expiration: January, 2011, Exercise Price: $19.00 | | | 2,170 | |
| | | | Fortune Brands, Inc | | | | |
| | 21 | | Expiration: January, 2011, Exercise Price: $60.00 | | | 2,940 | |
| | | | Genzyme Corporation | | | | |
| | 35 | | Expiration: January, 2011, Exercise Price: $70.00 | | | 8,172 | |
| | 26 | | Expiration: January, 2011, Exercise Price: $72.50 | | | 2,080 | |
| | | | J. Crew Group Inc. | | | | |
| | 39 | | Expiration: January, 2011, Exercise Price: $45.00 | | | 195 | |
| | | | J.C. Penney Company, Inc. | | | | |
| | 53 | | Expiration: January, 2011, Exercise Price: $31.00 | | | 9,382 | |
| | 56 | | Expiration: January, 2011, Exercise Price: $32.00 | | | 6,468 | |
| | | | Massey Energy Company | | | | |
| | 37 | | Expiration: January, 2011, Exercise Price: $45.00 | | | 32,560 | |
| | | | Mead Johnson Nutrition Co. | | | | |
| | 43 | | Expiration: February, 2011, Exercise Price: $60.00 | | | 18,576 | |
| | | | | | | | |
The accompanying notes are an integral part of these financial statements.
The Merger Fund VL
SCHEDULE OF OPTIONS WRITTEN (continued)
December 31, 2010
| Contracts (100 shares per contract) | | Value | |
| | | Motorola, Inc. | | | |
| | 88 | | Expiration: January, 2011, Exercise Price: $7.50 | | $ | 13,816 | |
| | 303 | | Expiration: January, 2011, Exercise Price: $9.00 | | | 8,484 | |
| | | | Nicor Inc | | | | |
| | 28 | | Expiration: February, 2011, Exercise Price: $50.00 | | | 2,520 | |
| | | | Potash Corporation of Saskatchewan | | | | |
| | 28 | | Expiration: January, 2011, Exercise Price: $130.00 | | | 70,000 | |
| | 17 | | Expiration: January, 2011, Exercise Price: $145.00 | | | 18,700 | |
| | | | Pride International, Inc. | | | | |
| | 14 | | Expiration: January, 2011, Exercise Price: $30.00 | | | 4,480 | |
| | | | Quicksilver Resources Inc. | | | | |
| | 13 | | Expiration: January, 2011, Exercise Price: $14.00 | | | 1,235 | |
| | | | Seagate Technology LLC | | | | |
| | 153 | | Expiration: January, 2011, Exercise Price: $14.00 | | | 18,437 | |
| | | | Symantec Corporation | | | | |
| | 62 | | Expiration: January, 2011, Exercise Price: $16.00 | | | 5,580 | |
| | | | Tenet Healthcare Corp. | | | | |
| | 98 | | Expiration: January, 2011, Exercise Price: $6.00 | | | 8,330 | |
| | | | Yahoo! Inc. | | | | |
| | 49 | | Expiration: January, 2011, Exercise Price: $16.00 | | | 4,312 | |
| PUT OPTIONS WRITTEN | | | | |
| | | | Novartis AG | | | | |
| | 15 | | Expiration: January, 2011, Exercise Price: $60.00 | | | 2,100 | |
| | | | TOTAL OPTIONS WRITTEN | | | | |
| | | | (Premiums received $244,754) | | $ | 281,569 | |
ADR – American Depository Receipt
The accompanying notes are an integral part of these financial statements.
The Merger Fund VL
SCHEDULE OF FORWARD CONTRACTS
December 31, 2010
| | | | | | | U.S. $ Value at | | | | | | | U.S. $ Value at | | | Unrealized | |
| Settlement | | Currency to | | December 31, | | | Currency to | | December 31, | | | Appreciation | |
| Date | | be Delivered | | 2010 | | | be Received | | 2010 | | | (Depreciation) | |
| 1/14/11 | | | 45,992 | | Australian Dollars | | $ | 46,954 | | | | 42,543 | | U.S. Dollars | | $ | 42,543 | | | $ | (4,411 | ) |
| 1/14/11 | | | 44,531 | | U.S. Dollars | | | 44,531 | | | | 45,992 | | Australian Dollars | | | 46,954 | | | | 2,423 | |
| 1/19/11 | | | 237,666 | | Australian Dollars | | | 242,468 | | | | 230,541 | | U.S. Dollars | | | 230,541 | | | | (11,927 | ) |
| 1/19/11 | | | 11,631 | | U.S. Dollars | | | 11,631 | | | | 11,955 | | Australian Dollars | | | 12,197 | | | | 566 | |
| 1/27/11 | | | 91,599 | | Australian Dollars | | | 93,345 | | | | 89,154 | | U.S. Dollars | | | 89,154 | | | | (4,191 | ) |
| 1/27/11 | | | 91,533 | | U.S. Dollars | | | 91,533 | | | | 91,599 | | Australian Dollars | | | 93,345 | | | | 1,812 | |
| 1/31/11 | | | 602,575 | | Australian Dollars | | | 613,729 | | | | 589,328 | | U.S. Dollars | | | 589,328 | | | | (24,401 | ) |
| 1/31/11 | | | 144,815 | | U.S. Dollars | | | 144,815 | | | | 146,633 | | Australian Dollars | | | 149,347 | | | | 4,532 | |
| 2/1/11 | | | 23,985 | | Australian Dollars | | | 24,426 | | | | 23,217 | | U.S. Dollars | | | 23,217 | | | | (1,209 | ) |
| 2/1/11 | | | 2,498 | | U.S. Dollars | | | 2,498 | | | | 2,525 | | Australian Dollars | | | 2,571 | | | | 73 | |
| 2/2/11 | | | 72,600 | | Australian Dollars | | | 73,927 | | | | 72,266 | | U.S. Dollars | | | 72,266 | | | | (1,661 | ) |
| 2/2/11 | | | 72,651 | | U.S. Dollars | | | 72,651 | | | | 72,600 | | Australian Dollars | | | 73,927 | | | | 1,276 | |
| 2/3/11 | | | 155,386 | | Australian Dollars | | | 158,207 | | | | 151,834 | | U.S. Dollars | | | 151,834 | | | | (6,373 | ) |
| 2/15/11 | | | 132,578 | | Australian Dollars | | | 134,795 | | | | 128,203 | | U.S. Dollars | | | 128,203 | | | | (6,592 | ) |
| 2/16/11 | | | 188,000 | | Australian Dollars | | | 191,121 | | | | 183,046 | | U.S. Dollars | | | 183,046 | | | | (8,075 | ) |
| 2/16/11 | | | 42,491 | | U.S. Dollars | | | 42,491 | | | | 44,000 | | Australian Dollars | | | 44,730 | | | | 2,239 | |
| 3/30/11 | | | 123,035 | | Australian Dollars | | | 124,437 | | | | 119,078 | | U.S. Dollars | | | 119,078 | | | | (5,359 | ) |
| 1/6/11 | | | 66,300 | | Canadian Dollars | | | 66,672 | | | | 66,279 | | U.S. Dollars | | | 66,279 | | | | (393 | ) |
| 2/25/11 | | | 382,757 | | Canadian Dollars | | | 384,510 | | | | 376,815 | | U.S. Dollars | | | 376,815 | | | | (7,695 | ) |
| 2/25/11 | | | 61,940 | | U.S. Dollars | | | 61,940 | | | | 62,370 | | Canadian Dollars | | | 62,656 | | | | 716 | |
| 1/4/11 | | | 272,250 | | Euro | | | 363,810 | | | | 378,446 | | U.S. Dollars | | | 378,446 | | | | 14,636 | |
| 1/4/11 | | | 357,592 | | U.S. Dollars | | | 357,592 | | | | 272,250 | | Euro | | | 363,810 | | | | 6,218 | |
| 2/8/11 | | | 249,975 | | Euro | | | 334,012 | | | | 327,124 | | U.S. Dollars | | | 327,124 | | | | (6,888 | ) |
| 3/29/11 | | | 88,015 | | Euro | | | 117,578 | | | | 116,379 | | U.S. Dollars | | | 116,379 | | | | (1,199 | ) |
| 1/13/11 | | | 4,433 | | British Pounds | | | 6,911 | | | | 7,028 | | U.S. Dollars | | | 7,028 | | | | 117 | |
| 1/13/11 | | | 6,857 | | U.S. Dollars | | | 6,857 | | | | 4,433 | | British Pounds | | | 6,911 | | | | 54 | |
| 1/21/11 | | | 85,600 | | British Pounds | | | 133,437 | | | | 135,924 | | U.S. Dollars | | | 135,924 | | | | 2,487 | |
| 3/3/11 | | | 263,515 | | British Pounds | | | 410,648 | | | | 418,348 | | U.S. Dollars | | | 418,348 | | | | 7,700 | |
| 3/3/11 | | | 12,910 | | U.S. Dollars | | | 12,910 | | | | 8,400 | | British Pounds | | | 13,090 | | | | 180 | |
| 1/19/11 | | | 12,088,800 | | Japanese Yen | | | 148,928 | | | | 147,824 | | U.S. Dollars | | | 147,824 | | | | (1,104 | ) |
| 1/19/11 | | | 13,398 | | U.S. Dollars | | | 13,398 | | | | 1,122,229 | | Japanese Yen | | | 13,825 | | | | 427 | |
| 1/20/11 | | | 2,997,000 | | Japanese Yen | | | 36,922 | | | | 36,433 | | U.S. Dollars | | | 36,433 | | | | (489 | ) |
| 1/20/11 | | | 23,909 | | U.S. Dollars | | | 23,909 | | | | 1,998,000 | | Japanese Yen | | | 24,615 | | | | 706 | |
| | | | | | | | $ | 4,593,593 | | | | | | | | $ | 4,547,788 | | | $ | (45,805 | ) |
The accompanying notes are an integral part of these financial statements.
The Merger Fund VL
SCHEDULE OF SWAP CONTRACTS
December 31, 2010
| | | | | | | | | | | Unrealized | | |
| Termination | | | | | | | | | | Appreciation | | |
| Date | | Security | | Shares | | | Notional | | | (Depreciation) | | Counterparty |
| 1/3/11 | | Andean Resources Ltd. | | | 1,100 | | | | 7,030 | | | | 551 | | JPMorgan Chase & Co. Inc. |
| 3/31/11 | | AXA Asia Pacific Holdings Ltd. | | | 82,300 | | | | 527,963 | | | | 46,860 | | JPMorgan Chase & Co. Inc. |
| 6/30/11 | | British Sky Broadcasting Group | | | 10,000 | | | | 113,501 | | | | 10,278 | | Merrill Lynch & Co. Inc. |
| 6/30/11 | | British Sky Broadcasting Group | | | 26,445 | | | | 303,444 | | | | 13,336 | | JPMorgan Chase & Co. Inc. |
| 2/22/11 | | Crucell NV | | | 6,400 | | | | 200,978 | | | | (6,465 | ) | JPMorgan Chase & Co. Inc. |
| 5/2/11 | | Hillgrove Resources Ltd. | | | 331,444 | | | | 96,019 | | | | (26,365 | ) | JPMorgan Chase & Co. Inc. |
| 2/28/11 | | Indophil Resources NL | | | 223,119 | | | | 234,766 | | | | 12,727 | | JPMorgan Chase & Co. Inc. |
| 12/31/11 | | Infigen Energy | | | 32,700 | | | | 18,449 | | | | (18,281 | ) | JPMorgan Chase & Co. Inc. |
| 3/31/11 | | ING Industrial Fund | | | 223,700 | | | | 120,530 | | | | 6,655 | | JPMorgan Chase & Co. Inc. |
| 12/31/11 | | Panasonic Electric Works Co. | | | 900 | | | | 11,713 | | | | (32 | ) | JPMorgan Chase & Co. Inc. |
| 8/31/11 | | Perpetual Ltd. | | | 3,600 | | | | 115,105 | | | | (15,870 | ) | JPMorgan Chase & Co. Inc. |
| 4/29/11 | | SANYO Electric Co., Ltd. | | | 94,300 | | | | 152,540 | | | | 2,119 | | JPMorgan Chase & Co. Inc. |
| 4/30/11 | | Whitehaven Coal Limited | | | 23,000 | | | | 158,771 | | | | 35,605 | | JPMorgan Chase & Co. Inc. |
| 2/15/11 | | Wellstream Holdings PLC | | | 10,700 | | | | 130,852 | | | | 3,101 | | JPMorgan Chase & Co. Inc. |
| 3/31/11 | | AMP Ltd. | | | (15,259 | ) | | | (82,839 | ) | | | (5,145 | ) | JPMorgan Chase & Co. Inc. |
| 4/29/11 | | Panasonic Corp. | | | (1,771 | ) | | | (25,024 | ) | | | (700 | ) | JPMorgan Chase & Co. Inc. |
| | | | | | | | | | | | | $ | 58,374 | | |
The accompanying notes are an integral part of these financial statements.
The Merger Fund VL
STATEMENT OF ASSETS AND LIABILITIES
December 31, 2010
| ASSETS: | | | | | | |
| Investments, at value (Cost $13,688,682) | | | | | $ | 13,775,241 | |
| Cash held in foreign currency | | | | | | 66,279 | |
| Deposits at brokers | | | | | | 2,122,761 | |
| Receivable from brokers | | | | | | 1,942,083 | |
| Receivable for investments sold | | | | | | 1,521,838 | |
| Receivable for forward currency exchange contracts | | | | | | 46,162 | |
| Receivable for swap contracts | | | | | | 58,374 | |
| Receivable from the investment adviser | | | | | | 11,124 | |
| Dividends and interest receivable | | | | | | 1,765 | |
| Swap dividends receivable | | | | | | 2,133 | |
| Prepaid expenses and other receivables | | | | | | 3,360 | |
| Total Assets | | | | | | 19,551,120 | |
| LIABILITIES: | | | | | | | |
| Securities sold short, at value (proceeds of $1,942,083) | | $ | 2,016,264 | | | | | |
| Written option contracts, at value (premiums received $244,754) | | | 281,569 | | | | | |
| Payable to custodian | | | 1,494,197 | | | | | |
| Payable for forward currency exchange contracts | | | 91,967 | | | | | |
| Payable for swap interest | | | 696 | | | | | |
| Payable for investments purchased | | | 804,908 | | | | | |
| Payable for fund shares redeemed | | | 320 | | | | | |
| Payable to independent trustees | | | 1,440 | | | | | |
| Dividends and interest payable | | | 10 | | | | | |
| Accrued expenses and other liabilities | | | 42,421 | | | | | |
| Total Liabilities | | | | | | | 4,733,792 | |
| NET ASSETS | | | | | | $ | 14,817,328 | |
| NET ASSETS CONSIST OF: | | | | | | | | |
| Accumulated undistributed net investment loss | | | | | | $ | (17,904 | ) |
| Accumulated undistributed net realized gain on investments, securities | | | | | | | | |
| sold short, written option contracts expired or closed, swap contracts, | | | | | | | | |
| foreign currency translation and forward currency exchange contracts | | | | | | | 602,715 | |
| Net unrealized appreciation (depreciation) on: | | | | | | | | |
| Investments | | | 86,559 | | | | | |
| Securities sold short | | | (74,181 | ) | | | | |
| Written option contracts | | | (36,815 | ) | | | | |
| Swap contracts | | | 58,374 | | | | | |
| Forward currency exchange contracts | | | (45,805 | ) | | | | |
| Net unrealized depreciation | | | | | | | (11,868 | ) |
| Paid-in capital | | | | | | | 14,244,385 | |
| Total Net Assets | | | | | | $ | 14,817,328 | |
| NET ASSET VALUE and offering price per share, | | | | | | | | |
| ($14,817,328 / 1,343,196 shares of beneficial interest outstanding) | | | | | | $ | 11.03 | |
The accompanying notes are an integral part of these financial statements.
The Merger Fund VL
STATEMENT OF OPERATIONS
For the Year Ended December 31, 2010
| INVESTMENT INCOME: | | | | | | |
| Interest | | | | | $ | 27,609 | |
| Dividend income on long positions (net of foreign withholding taxes of $2,473) | | | | | | 80,689 | |
| Total investment income | | | | | | 108,298 | |
| EXPENSES: | | | | | | | |
| Investment advisory fees | | $ | 138,780 | | | | | |
| Transfer agent and shareholder servicing agent fees | | | 29,237 | | | | | |
| Federal and state registration fees | | | 850 | | | | | |
| Professional fees | | | 120,020 | | | | | |
| Trustees’ fees and expenses | | | 5,663 | | | | | |
| Custody fees | | | 2,700 | | | | | |
| Administration fees | | | 38,728 | | | | | |
| Fund accounting expense | | | 44,281 | | | | | |
| Reports to shareholders | | | 7,225 | | | | | |
| Miscellaneous expenses | | | 719 | | | | | |
| Borrowing expense on securities sold short | | | 44,051 | | | | | |
| Dividends on securities sold short | | | 152,007 | | | | | |
| Total expenses before expense waiver by adviser | | | | | | | 584,261 | |
| Less: Expense reimbursed by Adviser (Note 3) | | | | | | | (232,770 | ) |
| Net expenses | | | | | | | 351,491 | |
| NET INVESTMENT LOSS | | | | | | | (243,193 | ) |
| REALIZED AND UNREALIZED GAIN (LOSS) ON INVESTMENTS: | | | | | | | | |
| Realized gain (loss) on: | | | | | | | | |
| Investments | | | 885,807 | | | | | |
| Securities sold short | | | (135,765 | ) | | | | |
| Written option contracts expired or closed | | | 174,710 | | | | | |
| Swap contracts | | | 252,960 | | | | | |
| Foreign currency translation | | | 803 | | | | | |
| Forward currency exchange contracts | | | (257,666 | ) | | | | |
| Net realized gain | | | | | | | 920,849 | |
| Change in unrealized appreciation / (depreciation) on: | | | | | | | | |
| Investments | | | (50,946 | ) | | | | |
| Securities sold short | | | 2,613 | | | | | |
| Written option contracts | | | (50,923 | ) | | | | |
| Swap contracts | | | 57,352 | | | | | |
| Foreign currency translation | | | (2,424 | ) | | | | |
| Forward currency exchange contracts | | | (53,861 | ) | | | | |
| Net unrealized depreciation | | | | | | | (98,189 | ) |
| NET REALIZED AND UNREALIZED GAIN ON INVESTMENTS | | | | | | | 822,660 | |
| NET INCREASE IN NET ASSETS RESULTING FROM OPERATIONS | | | | | | $ | 579,467 | |
| | | | | | | | | |
The accompanying notes are an integral part of these financial statements.
The Merger Fund VL
STATEMENTS OF CHANGES IN NET ASSETS
| | | Year Ended | | | Year Ended | |
| | | December 31, 2010 | | | December 31, 2009 | |
| Net investment loss | | $ | (243,193 | ) | | $ | (133,417 | ) |
| Net realized gain on investments, securities sold short, | | | | | | | | |
| written option contracts expired or closed, swap contracts, | | | | | | | | |
| foreign currency translation and forward currency | | | | | | | | |
| exchange contracts | | | 920,849 | | | | 458,764 | |
| Change in unrealized appreciation (depreciation) | | | | | | | | |
| on investments, securities sold short, written option | | | | | | | | |
| contracts, swap contracts, foreign currency translation | | | | | | | | |
| and forward currency exchange contracts | | | (98,189 | ) | | | 362,955 | |
| Net increase in net assets resulting from operations | | | 579,467 | | | | 688,302 | |
| | | | | | | | | |
| Distributions to shareholders from: | | | | | | | | |
| Net investment income | | | — | | | | (305,678 | ) |
| Net realized gains | | | (303,267 | ) | | | (7,130 | ) |
| Total dividends and distributions | | | (303,267 | ) | | | (312,808 | ) |
| Net increase in net assets from | | | | | | | | |
| capital share transactions (Note 4) | | | 4,831,452 | | | | 4,436,488 | |
| Net increase in net assets | | | 5,107,652 | | | | 4,811,982 | |
| | | | | | | | | |
| NET ASSETS: | | | | | | | | |
| Beginning of year | | | 9,709,676 | | | | 4,897,694 | |
| End of year (including accumulated undistributed | | | | | | | | |
| net investment loss of $(17,904) | | | | | | | | |
| and $(27,721), respectively) | | $ | 14,817,328 | | | $ | 9,709,676 | |
The accompanying notes are an integral part of these financial statements.
The Merger Fund VL
FINANCIAL HIGHLIGHTS
| | | Year Ended December 31, | |
| | | 2010 | | | 2009 | | | 2008 | | | 2007 | | | 2006 | |
| Per Share Data: | | | | | | | | | | | | | | | |
| Net Asset Value, beginning of year | | $ | 10.70 | | | $ | 9.88 | | | $ | 9.96 | | | $ | 11.56 | | | $ | 10.96 | |
| Income from investment operations: | | | | | | | | | | | | | | | | | | | | |
| Net investment income (loss) | | | 0.02 | (1) | | | (0.35 | )(1) | | | (0.13 | )(2) | | | 0.03 | (1) | | | (0.02 | )(1) |
| Net realized and unrealized | | | | | | | | | | | | | | | | | | | | |
| gain on investments | | | 0.54 | | | | 1.53 | | | | 0.50 | | | | 0.20 | | | | 1.83 | |
| Total from investment operations | | | 0.56 | | | | 1.18 | | | | 0.37 | | | | 0.23 | | | | 1.81 | |
| Less distributions: | | | | | | | | | | | | | | | | | | | | |
| Distributions from net investment income | | | — | | | | (0.35 | ) | | | — | | | | — | | | | — | |
| Distributions from net realized gains | | | (0.23 | ) | | | (0.01 | ) | | | (0.45 | ) | | | (1.83 | ) | | | (1.21 | ) |
| Total distributions | | | (0.23 | ) | | | (0.36 | ) | | | (0.45 | ) | | | (1.83 | ) | | | (1.21 | ) |
| Net Asset Value, end of year | | $ | 11.03 | | | $ | 10.70 | | | $ | 9.88 | | | $ | 9.96 | | | $ | 11.56 | |
| Total Return | | | 5.30 | % | | | 11.80 | % | | | 3.79 | %(3) | | | 2.11 | % | | | 16.55 | % |
| Supplemental data and ratios: | | | | | | | | | | | | | | | | | | | | |
| Net assets, end of year (000’s) | | $ | 14,817 | | | $ | 9,710 | | | $ | 4,898 | | | $ | 4,484 | | | $ | 3,794 | |
| Ratio of operating expenses to average | | | | | | | | | | | | | | | | | | | | |
| net assets including interest expense, | | | | | | | | | | | | | | | | | | | | |
| borrowing expense on securities sold short | | | | | | | | | | | | | | | | | | | | |
| and dividends on securities sold short: | | | | | | | | | | | | | | | | | | | | |
| Before expense waiver | | | 5.26 | % | | | 7.82 | % | | | 7.85 | % | | | 8.53 | % | | | 8.06 | % |
| After expense waiver | | | 3.16 | % | | | 4.28 | % | | | 2.98 | % | | | 4.27 | % | | | 3.43 | % |
| Ratio of operating expenses to average | | | | | | | | | | | | | | | | | | | | |
| net assets excluding interest expense, | | | | | | | | | | | | | | | | | | | | |
| borrowing expense on securities sold short | | | | | | | | | | | | | | | | | | | | |
| and dividends on securities sold short: | | | | | | | | | | | | | | | | | | | | |
| Before expense waiver | | | 3.50 | % | | | 4.94 | % | | | 6.27 | % | | | 5.66 | % | | | 6.03 | % |
| After expense waiver | | | 1.40 | % | | | 1.40 | % | | | 1.40 | % | | | 1.40 | % | | | 1.40 | % |
| Ratio of net investment loss | | | | | | | | | | | | | | | | | | | | |
| to average net assets | | | | | | | | | | | | | | | | | | | | |
| Before expense waiver | | | (4.29 | )% | | | (5.69 | )% | | | (6.28 | )% | | | (5.52 | )% | | | (5.99 | )% |
| After expense waiver | | | (2.19 | )% | | | (2.15 | )% | | | (1.41 | )% | | | (1.26 | )% | | | (1.36 | )% |
Portfolio turnover rate(4) | | | 187.18 | % | | | 373.07 | % | | | 743.72 | % | | | 418.22 | % | | | 555.55 | % |
| | | | | | | | | | | | | | | | | | | | | |
| (1) | Net investment income per share is calculated using ending balance after consideration of adjustments for permanent book and tax differences. |
| (2) | Net investment income (loss) per share is calculated using ending balances prior to consideration of adjustments for permanent book and tax differences. |
| (3) | The return would have been 3.06% without the expense credit from the service provider. |
| (4) | The numerator for the portfolio turnover rate includes the lesser of purchases or sales (excluding securities sold short). The denominator includes the average long positions throughout the period. |
The accompanying notes are an integral part of these financial statements.
The Merger Fund VL
NOTES TO THE FINANCIAL STATEMENTS
December 31, 2010
Note 1 — ORGANIZATION
The Merger Fund VL (the “Fund”) is a no-load, open-end, non-diversified investment company organized as a statutory trust under the laws of Delaware on November 22, 2002, and registered under the Investment Company Act of 1940, as amended (the “1940 Act”). The Fund commenced operations on May 26, 2004. The investment objective of the Fund is to seek to achieve capital growth by engaging in merger arbitrage. Merger arbitrage is a highly specialized investment approach generally designed to profit from the successful completion of proposed mergers, takeovers, tender offers, leveraged buyouts, liquidations and other types of corporate reorganizations. Shares of the Fund are not offered directly to the public. The Fund’s shares are currently offered only to separate accounts funding variable annuity and variable life insurance contracts. At December 31, 2010, 96.7% of the shares outstanding of the Fund were owned by three insurance companies.
Note 2 — SIGNIFICANT ACCOUNTING POLICIES
The following is a summary of significant accounting policies followed by the Fund in the preparation of its financial statements. These policies are in conformity with generally accepted accounting principles.
Securities listed on the NASDAQ Global Market and the NASDAQ Global Select Market are valued at the NASDAQ Official Closing Price (“NOCP”). Other listed securities are valued at the last sale price on the exchange on which such securities are primarily traded or, in the case of options, at the last sale price. Securities not listed on an exchange and securities for which there are no transactions are valued at the average of the closing bid and asked prices. When pricing options, if no sales are reported or if the last sale is outside the bid and asked parameters, the higher of the intrinsic value of the option or the mean between the last reported bid and asked prices will be used. Securities for which there are no such valuations are valued at fair value as determined in good faith by management under the supervision of the Board of Trustees. The Adviser (as defined herein) reserves the right to value securities, including options, at prices other than last-sale prices, intrinsic value prices, or the average of closing bid and asked prices, when such prices are believed unrepresentative of fair market value as determined in good faith by the Adviser. When fair-value pricing is employed, the prices of securities used by the Fund to calculate its NAV may differ from quoted or published prices for the same securities. In addition, due to the subjective and variable nature of fair-value pricing, it is possible that the value determined for a particular asset may be materially different from the value realized upon such asset’s sale. At December 31, 2010, the Fund did not have any fair valued securities. Investments in United States government securities (other than short-term securities) are valued at the average of the quoted bid and asked prices in the over-the-counter market. Short-term investments are carried at amortized cost, which approximates market value.
The Merger Fund VL
NOTES TO THE FINANCIAL STATEMENTS (continued)
December 31, 2010
Note 2 — SIGNIFICANT ACCOUNTING POLICIES (continued)
The Fund has performed an analysis of all existing investments to determine the significance and character of all inputs to their fair value determination. Various inputs are used in determining the value of the Fund’s investments. These inputs are summarized in the three broad levels listed below:
| | Level 1 — | Quoted prices in active markets for identical securities. |
| | Level 2 — | Other significant observable inputs (including quoted prices for similar securities, interest rates, prepayment speeds, credit risk, etc.). |
| | Level 3 — | Model derived valuations in which one or more significant inputs or significant value drivers are unobservable. Unobservable inputs are those inputs that reflect the Fund’s own assumptions that market participants would use to price the asset or liability based on the best available information. |
The inputs or methodology used for valuing securities are not an indication of the risk associated with investing in those securities.
The following tables provide the fair value measurements of applicable Fund assets and liabilities by level within the fair value hierarchy for the Fund as of December 31, 2010. These assets and liabilities are measured on a recurring basis.
| | | | Level 1 | | | Level 2 | | | Level 3 | | | Total | |
| | Assets | | | | | | | | | | | | |
| | Common Stocks* | | $ | 13,533,835 | | | $ | — | | | $ | — | | | $ | 13,533,835 | |
| | Warrants | | | — | | | | 3,151 | | | | — | | | | 3,151 | |
| | Corporate Bonds | | | — | | | | 222,107 | | | | — | | | | 222,107 | |
| | Purchased Options | | | 16,148 | | | | — | | | | — | | | | 16,148 | |
| | Swap Contracts** | | | — | | | | 58,374 | | | | — | | | | 58,374 | |
| | Forward Currency Exchange Contracts** | | | — | | | | 46,162 | | | | — | | | | 46,162 | |
| | Liabilities | | | | | | | | | | | | | | | | |
| | Securities Sold Short | | $ | 1,963,183 | | | $ | 53,081 | | | $ | — | | | $ | 2,016,264 | |
| | Written Options | | | 281,569 | | | | — | | | | — | | | | 281,569 | |
| | Forward Currency Exchange Contracts** | | | — | | | | 91,967 | | | | — | | | | 91,967 | |
| * | Please refer to the Schedule of Investments to view common stocks segregated by industry type. |
| ** | Swap contracts and forward currency exchange contracts are valued at the net unrealized depreciation on the instrument. |
The Merger Fund VL
NOTES TO THE FINANCIAL STATEMENTS (continued)
December 31, 2010
Note 2 — SIGNIFICANT ACCOUNTING POLICIES (continued)
Level 3 Reconciliation Disclosure
Following is a reconciliation of Level 3 assets for which significant unobservable inputs were used to determine fair value.
| | | | Investments | |
| | Description | | in Securities | |
| | Balance as of December 31, 2009 | | $ | 7,869 | |
| | Accrued discounts/premiums | | | — | |
| | Realized gain (loss) | | | 317 | |
| | Change in unrealized appreciation (depreciation) | | | — | |
| | Net purchases (sales) | | | (8,186 | ) |
| | Transfers in and/or out of Level 3 | | | — | |
| | Balance as of December 31, 2010 | | $ | — | |
The Fund did not invest in new Level 3 Securities at December 31, 2010. There were no transfers into or out of Level 1 or 2 during the period.
The Fund may sell securities or currencies short for economic hedging purposes. For financial statement purposes, an amount equal to the settlement amount is initially included in the Statement of Assets and Liabilities as an asset and an equivalent liability. The amount of the liability is subsequently marked-to-market to reflect the current value of the short position. Subsequent fluctuations in the market prices of securities or currencies sold, but not yet purchased, may require purchasing the securities or currencies at prices which may differ from the market value reflected on the Statement of Assets and Liabilities. Short sale transactions result in off balance sheet risk because the ultimate obligation may exceed the related amounts shown in the Statement of Assets and Liabilities. The Fund will incur a loss if the price of the security increases between the date of the short sale and the date on which the Fund replaces the borrowed security. The Fund’s loss on a short sale is potentially unlimited because there is no upward limit on the price a borrowed security could attain.
The Fund is liable for any dividends payable on securities while those securities are sold short. Until the security is replaced, the Fund is required to pay to the lender any income earned which is recorded as an expense by the Fund. As collateral for its securities sold short, the Fund is required under the 1940 Act to maintain assets consisting of cash, cash equivalents or liquid securities. These assets are required to be adjusted daily to reflect changes in the value of the securities or currencies sold short.
| C. | Transactions with Brokers for Securities Sold Short |
The Fund’s receivables from brokers for proceeds on securities sold short and deposit at brokers for securities sold short are with two securities dealers. The Fund does not require the brokers to maintain collateral in support of the receivable from the brokers for proceeds on securities sold short. The Fund maintains cash deposits at brokers beyond the receivable for short sales. These cash deposits are presented as deposits at brokers on the Statement of Assets and Liabilities.
The Merger Fund VL
NOTES TO THE FINANCIAL STATEMENTS (continued)
December 31, 2010
Note 2 — SIGNIFICANT ACCOUNTING POLICIES (continued)
No provision for federal income taxes has been made since the Fund has complied to date with the provisions Subchapter M of the Internal Revenue Code applicable to regulated investment companies and intends to continue to so comply in future years and to distribute investment company net taxable income and net capital gains to shareholders. Additionally, the Fund intends to make all required distributions to avoid federal excise tax.
The Fund has reviewed all open tax years and major jurisdictions and concluded that there is no impact on the Fund’s net assets and there is no tax liability resulting from unrecognized tax benefits relating to income tax positions taken or expected to be taken on a tax return. The Fund is also not aware of any tax positions for which it is reasonably possible that the total amounts of unrecognized tax benefits will significantly change in the next twelve months. As of December 31, 2010, open Federal and New York tax years include the tax years ended December 31, 2007 through 2010. The Fund has no examination in progress.
| E. | Written Option Contracts |
The Fund is subject to equity price risk in the normal course of pursuing its investment objectives. The Fund writes (sells) call options to hedge portfolio investments. Uncovered put options can also be written by the Fund as part of a merger arbitrage strategy involving a pending corporate reorganization. When the Fund writes (sells) an option, an amount equal to the premium received by the Fund is included in the Statement of Assets and Liabilities as an asset and an equivalent liability. The amount of the liability is subsequently marked-to-market to reflect the current value of the written option contracts. By writing an option, the Fund may become obligated during the term of the option to deliver or purchase the securities underlying the option at the exercise price if the option is exercised. Written option contracts are valued at the higher of the intrinsic value of the option or the last sales price reported on the date of valuation. If no sale is reported or if the last sale is outside the parameters of the closing bid and asked prices, the written option contract is valued at the higher of the intrinsic value of the option or the mean of the last reported bid and asked prices on the day of valuation. When an option expires on its stipulated expiration date or the Fund enters into a closing purchase transaction, the Fund realizes a gain or loss if the cost of the closing purchase transaction differs from the premium received when the option was sold without regard to any unrealized gain or loss on the underlying security, and the liability related to such option is eliminated. When an option is exercised, the premium originally received decreases the cost basis of the security (or increases the proceeds on a sale of the security), and the Fund realizes a gain or loss from the sale of the underlying security. With written option contracts, there is minimal counterparty credit risk to the Fund since written option contracts are exchange traded.
The Fund is subject to equity price risk in the normal course of pursuing its investment objectives. The Fund purchases put or call options to hedge portfolio investments. Premiums paid for option contracts purchased are included in the Statement of Assets and Liabilities as an asset. Option contracts are valued daily at the higher of the intrinsic value of the option or the last sales price reported
The Merger Fund VL
NOTES TO THE FINANCIAL STATEMENTS (continued)
December 31, 2010
Note 2 — SIGNIFICANT ACCOUNTING POLICIES (continued)
on the date of valuation. If no sale is reported or if the last sale is outside the parameters of the closing bid and asked prices, the option contract purchased is valued at the higher of the intrinsic value of the option or the mean between the last reported bid and asked prices on the day of valuation. When option contracts expire or are closed, realized gains or losses are recognized without regard to any unrealized gains or losses on the underlying securities. With purchased options, there is minimal counterparty credit risk to the Fund since purchased options are exchange traded.
| G. | Forward Currency Exchange Contracts |
The Fund is subject to foreign currency exchange rate risk in the normal course of pursuing its investment objectives. The Fund may use forward currency exchange contracts to hedge against changes in the value of foreign currencies. The Fund may enter into forward currency exchange contracts obligating the Fund to deliver or receive a currency at a specified future date. Forward contracts are valued daily, and unrealized appreciation or depreciation is recorded daily as the difference between the contract exchange rate and the closing forward rate applied to the face amount of the contract. A realized gain or loss is recorded at the time the forward contract expired. With forward contracts, there is minimal counterparty credit risk to the Fund since forward contracts are exchange traded.
The use of forward currency exchange contracts does not eliminate fluctuations in the underlying prices of the Fund’s investment securities; however, it does establish a rate of exchange that can be achieved in the future. The use of forward currency exchange contracts involves the risk that anticipated currency movements will not be accurately predicted. A forward currency exchange contract would limit the risk of loss due to a decline in the value of a particular currency; however it would also limit any potential gain that might result should the value of the currency increase instead of decrease. These contracts may involve market risk in excess of the amount of receivable or payable reflected on the Statement of Assets and Liabilities.
The Fund is subject to equity price risk and interest rate risk in the normal course of pursuing its investment objectives. The Fund has entered into both long and short equity swap contracts with multiple broker- dealers. A long equity swap contract entitles the Fund to receive from the counterparty any appreciation and dividends paid on an individual security, while obligating the Fund to pay the counterparty any depreciation on the security as well as interest on the notional amount of the contract at a rate equal to LIBOR plus 25 to 100 basis points. A short equity swap contract obligates the Fund to pay the counterparty any appreciation and dividends paid on an individual security, while entitling the Fund to receive from the counterparty any depreciation on the security as well as interest on the notional value of the contract at a rate equal to LIBOR less 25 to 100 basis points.
The Fund may also enter into equity swap contracts whose value is determined by the spread between a long equity position and a short equity position. This type of swap contract obligates the Fund to pay the counterparty an amount tied to any increase in the spread between the two securities over the term of the contract. The Fund is also obligated to pay the counterparty any dividends paid on the short equity holding as well as any net financing costs. This type of swap contract entitles the Fund
The Merger Fund VL
NOTES TO THE FINANCIAL STATEMENTS (continued)
December 31, 2010
Note 2 — SIGNIFICANT ACCOUNTING POLICIES (continued)
to receive from the counterparty any gains based on a decrease in the spread as well as any dividends paid on the long equity holding and any net interest income.
Fluctuations in the value of an open contract are recorded daily as a net unrealized gain or loss. The Fund will realize a gain or loss upon termination or reset of the contract. Either party, under certain conditions, may terminate the contract prior to the contract’s expiration date.
Credit risk may arise as a result of the failure of the counterparty to comply with the terms of the contract. The Fund considers the creditworthiness of each counterparty to a contract in evaluating potential credit risk quarterly. The counterparty risk to the Fund is limited to the net unrealized gain, if any, on the contract, along with dividends receivable on long equity contracts and interest receivable on short equity contracts. Additionally, risk may arise from unanticipated movements in interest rates or in the value of the underlying securities.
| I. | Distributions to Shareholders |
Dividends from net investment income and net realized capital gains, if any, are declared and paid annually. Income and capital gain distributions are determined in accordance with income tax regulations which may differ from generally accepted accounting principles. These differences are due primarily to wash sale-loss deferrals, constructive sales, straddle-loss deferrals, adjustments on swap contracts, and unrealized gains or losses on Section 1256 contracts, which were realized, for tax purposes, at December 31, 2010. Accordingly, reclassifications are made within the net asset accounts for such amounts, as well as amounts related to permanent differences in the character of certain income and expense items for income tax and financial reporting purposes. The Fund increased net investment income by $253,010, reduced realized accumulated gains by $253,010, and did not change paid-in capital.
Investing in securities of foreign companies and foreign governments involves special risks and considerations not typically associated with investing in U.S. companies and the U.S. government. These risks include revaluation of currencies and adverse political and economic developments. Moreover, securities of many foreign companies and foreign governments and their markets may be less liquid and their prices more volatile than those of securities of comparable U.S. companies and the U.S. government.
| K. | Foreign Currency Translations |
The books and records of the Fund are maintained in U.S. dollars. Foreign currency transactions are translated into U.S. dollars on the following basis: (i) market value of investment securities, assets and liabilities at the daily rates of exchange, and (ii) purchases and sales of investment securities, dividend and interest income and certain expenses at the rates of exchange prevailing on the respective dates of such transactions. For financial reporting purposes, the Fund does not isolate changes in the exchange rate of investment securities from the fluctuations arising from changes in the market prices of securities. However, for federal income tax purposes, the Fund does isolate and treat as ordinary income the effect of changes in foreign exchange rates on realized gain or loss from the sale of investment securities and payables and receivables arising from trade-date and settlement-date differences.
The Merger Fund VL
NOTES TO THE FINANCIAL STATEMENTS (continued)
December 31, 2010
Note 2 — SIGNIFICANT ACCOUNTING POLICIES (continued)
The Fund may engage in security transactions on a when-issued or delayed-delivery basis. Although the payment and interest terms of these securities are established at the time the Fund enters into the agreement, these securities may be delivered for cash proceeds at a future date. During this period, the securities are subject to market fluctuation. The Fund records sales of when-issued securities and reflects the values of such securities in determining net asset value in the same manner as other open short-sale positions. When delayed-delivery purchases are outstanding, the Fund segregates and maintains at all times cash, cash equivalents or other liquid securities in an amount at least equal to the market value.
The Fund considers highly liquid temporary cash investments purchased with an original maturity of less than three months to be cash equivalents. Cash equivalents are included in short-term investments on the Schedule of Investments as well as in investments on the Statement of Assets and Liabilities.
| N. | Guarantees and Indemnifications |
In the normal course of business, the Fund enters into contracts with service providers that contain general indemnification clauses. The Fund’s maximum exposure under these arrangements is unknown, as this would involve future claims that may be made against the Fund that have not yet occurred. However, based on experience, the Fund expects the risk of loss to be remote.
The preparation of financial statements in conformity with generally accepted accounting principles requires management to make estimates and assumptions that affect the reported amounts of assets and liabilities and disclosure of contingent assets and liabilities at the date of the financial statements and the reported amounts of revenues and expenses during the reporting period. Actual results could differ from those estimates.
Investment and shareholder transactions are recorded on the trade date. Realized gains and losses from security transactions are recorded on the identified cost basis. Dividend income and distributions to shareholders are recorded on the ex-dividend date. Interest is accounted for on the accrual basis and includes amortization of premiums and discounts on the interest method. Expenses include $44,051 of borrowing expense on securities sold short. The Fund may utilize derivative instruments including options, forward currency exchange contracts and other instruments with similar characteristics to the extent that they are consistent with the Fund’s investment objectives and limitations. The use of these instruments may involve additional investment risks, including the possibility of illiquid markets or imperfect correlation between the value of the instruments and the underlying securities.
The Merger Fund VL
NOTES TO THE FINANCIAL STATEMENTS (continued)
December 31, 2010
Note 2 — SIGNIFICANT ACCOUNTING POLICIES (continued)
The Fund helps manage counterparty credit risk by entering into agreements only with counterparties the Adviser believes have the financial resources to honor their obligations and by having the Adviser monitor the financial stability of the counterparties. Collateral pledges are monitored and subsequently adjusted if and when the valuations fluctuate, either up or down, by at least the predetermined threshold amount.
Financial assets and liabilities as well as cash collateral received and posted are offset by the counterparty, and the net amount is reported in the consolidated statement of financial condition when the Fund believes there exists a legally enforceable right to set off the recognized amounts.
The Fund has adopted authoritative standards regarding disclosure about derivatives and hedging activities and how they affect the Fund’s Statement of Assets and Liabilities and Statement of Operations. For the year ended December 31, 2010: long option contracts (1,484 contracts) were purchased and $243,412 premiums were paid, written option contracts (8,275 contracts) were opened and $1,442,104 premiums were received, equity swap contracts were opened for a notional value of $2,721,987 and closed for a notional value of $1,716,305 and an average of 18 forward currency exchange contract positions were open during the year.
Statement of Assets and Liabilities:
Fair values of derivative instruments as of December 31, 2010:
| | | Asset Derivatives | | | Liability Derivatives | |
| | | Balance | | | | | | Balance | | | | |
| Derivatives | | Sheet Location | | | Fair Value | | | Sheet Location | | | Fair Value | |
| Equity Contracts: | | | | | | | | | | | | |
| Purchased Options | | Investments | | | $ | 16,148 | | | | N/A | | | $ | — | |
| Written Option Contracts | | | N/A | | | | — | | | Written Options | | | | 281,569 | |
| Swap Contracts | | Receivables | | | | 58,374 | | | Payables | | | | — | |
| | | | | | | | | | | | | | | | | |
| Foreign exchange contracts: | | | | | | | | | | | | | | | | |
| Forward Foreign Currency | | | | | | | | | | | | | | | | |
| Exchange Contracts | | Receivables | | | | 46,162 | | | Payables | | | | 91,967 | |
| Total | | | | | | $ | 120,684 | | | | | | | $ | 373,536 | |
| | | | | | | | | | | | | | | | | |
| | | | | | | | | | | | | | | | | |
The Merger Fund VL
NOTES TO THE FINANCIAL STATEMENTS (continued)
December 31, 2010
Note 2 — SIGNIFICANT ACCOUNTING POLICIES (continued)
Statement of Operations:
The effect of derivative instruments on the statement of operations for the year ended December 31, 2010:
| Amount of Realized Gain (Loss) on Derivatives | |
| | | | | | | | | Forward | | | | | | | |
| | | Purchased | | | Written | | | Currency | | | | | | | |
| Derivatives | | Options | | | Options | | | Contracts | | | Swaps | | | Total | |
| Equity contracts | | $ | (62,745 | ) | | $ | 174,710 | | | $ | — | | | $ | 252,960 | | | $ | 364,925 | |
| Foreign exchange contracts | | | — | | | | — | | | | (257,666 | ) | | | — | | | | (257,666 | ) |
| Total | | $ | (62,745 | ) | | $ | 174,710 | | | $ | (257,666 | ) | | $ | 252,960 | | | $ | 107,259 | |
| | | | | | | | | | | | | | | | | | | | | |
| Change in Unrealized Appreciation (Depreciation) on Derivatives | |
| | | | | | | | | | | Forward | | | | | | | | | |
| | | Purchased | | | Written | | | Currency | | | | | | | | | |
| Derivatives | | Options | | | Options | | | Contracts | | | Swaps | | | Total | |
| Equity contracts | | $ | (6,731 | ) | | $ | (50,923 | ) | | $ | — | | | $ | 57,352 | | | $ | (302 | ) |
| Foreign exchange contracts | | | — | | | | — | | | | (53,861 | ) | | | — | | | | (53,861 | ) |
| Total | | $ | (6,731 | ) | | $ | (50,923 | ) | | | (53,861 | ) | | $ | 57,352 | | | $ | (54,163 | ) |
| | | | | | | | | | | | | | | | | | | | | |
Note 3 — AGREEMENTS AND INVESTMENT ADVISER TRANSACTION
Until December 31, 2010, the Fund’s investment adviser was Westchester Capital Management, Inc. (“Westchester”) pursuant to an investment advisory agreement dated July 1, 2003. Under the terms of this agreement, the Adviser was entitled to receive a fee, calculated daily and payable monthly, at the annual rate of 1.25% of the Fund’s average daily net assets. Certain officers of the Fund were also officers of Westchester. Westchester agreed to reduce its fees and reimburse the Fund to the extent total annualized expenses, excluding interest expense, borrowing expense on securities sold short and dividends on securities sold short, exceeded 1.40% of average daily net assets. The agreement permits Westchester to recover the expenses paid in excess of the cap on expenses for the three previous years, as long as the recovery does not cause the Fund’s operating expenses, excluding interest expense, borrowing expense on securities sold short and dividends on securities sold short, to exceed the cap on expenses. For the year ended December 31, 2010, Westchester reimbursed $232,770 to the Fund.
On October 12, 2010, Westchester entered into an agreement to transfer substantially all of its business and assets to Westchester Capital Management, LLC (the “Adviser” or “WCM”), a newly formed company which is controlled by two of Westchester’s portfolio managers and has a minority investor that is an affiliate of Lincoln Peak Capital Management, LLC (the “Transaction”). The closing of the Transaction occurred on December 31, 2010 (the “Closing”). Under the 1940 Act, the Closing caused the Fund’s previous investment advisory agreement with Westchester (the “Previous Advisory Agreement”) to terminate. In connection with the Transaction, the Fund’s Board of Trustees (the “Board”) considered and approved an investment advisory agreement with the Adviser (the “Advisory Agreement”) to take effect upon the Closing of the Transaction, subject to shareholder approval of the
The Merger Fund VL
NOTES TO THE FINANCIAL STATEMENTS (continued)
December 31, 2010
Note 3 — AGREEMENTS AND INVESTMENT ADVISER TRANSACTION (continued)
Advisory Agreement. The Advisory Agreement has the same advisory fee rate and otherwise is the same in all material respects as the Previous Advisory Agreement. The Advisory Agreement with the Adviser was approved by the Fund’s shareholders at a special meeting held on November 24, 2010.
The investment advisory agreement with the Adviser is dated as of January 1, 2011 and expires on June 30, 2013. Under the terms of this agreement, the Adviser is entitled to receive a fee, calculated daily and payable monthly, at the annual rate of 1.25% of the Fund’s average daily net assets. Certain officers of the Fund are also officers of the Adviser. The Adviser has agreed to reduce its fees and reimburse the Fund to the extent total annualized expenses, excluding interest expense, borrowing expense on securities sold short and dividends on securities sold short, exceed 1.40% of average daily net assets. The agreement permits the Adviser to recover the expenses paid in excess of the cap on expenses for the three previous years, as long as the recovery does not cause the Fund’s operating expenses, excluding interest expense, borrowing expense on securities sold short and dividends on securities sold short, to exceed the cap on expenses.
Reimbursed expenses subject to potential recovery by year of expiration are as follows:
| Year of Expiration | Potential Recovery |
| 12/31/11 | $227,119 |
| 12/31/12 | $220,029 |
| 12/31/13 | $232,770 |
U.S. Bancorp Fund Services, LLC, a subsidiary of U.S. Bancorp, a publicly held bank holding company, serves as transfer agent, administrator, dividend paying agent and shareholder servicing agent for the Fund. U.S. Bank, N.A. serves as custodian for the Fund.
Note 4 — SHARES OF BENEFICIAL INTEREST
The Board of Trustees has the authority to issue an unlimited amount of shares of beneficial interest without par value.
Changes in shares of beneficial interest were as follows:
| | | Year Ended | | | Year Ended | |
| | | December 31, 2010 | | | December 31, 2009 | |
| | | Shares | | | Amount | | | Shares | | | Amount | |
| Issued | | | 859,594 | | | $ | 9,564,764 | | | | 491,549 | | | $ | 5,257,980 | |
| Issued as reinvestment of dividends | | | 27,495 | | | | 303,267 | | | | 29,234 | | | | 312,808 | |
| Redeemed | | | (451,639 | ) | | | (5,036,579 | ) | | | (108,598 | ) | | | (1,134,300 | ) |
| Net Increase | | | 435,450 | | | $ | 4,831,452 | | | | 412,185 | | | $ | 4,436,488 | |
The Merger Fund VL
NOTES TO THE FINANCIAL STATEMENTS (continued)
December 31, 2010
Note 5 — INVESTMENT TRANSACTIONS
Purchases and sales of securities for the year ended December 31, 2010 (excluding short-term investments, options and securities sold short) aggregated $37,243,371 and $17,037,910, respectively. There were no purchases or sales of U.S. Government securities.
At December 31, 2010, the components of accumulated earnings (losses) on a tax basis were as follows:
| Cost of investments* | | $ | 13,715,195 | |
| Gross unrealized appreciation | | $ | 315,515 | |
| Gross unrealized depreciation | | | (255,469 | ) |
| Net unrealized appreciation | | $ | 60,046 | |
| Undistributed ordinary income | | $ | 883,133 | |
| Undistributed long-term capital gains | | | — | |
| Total distributable earnings | | $ | 883,133 | |
| Other accumulated losses | | | (370,236 | ) |
| Total accumulated gain | | $ | 572,943 | |
| * | Represents cost for federal income tax purposes and differs from the cost for financial reporting purposes due to wash sales and constructive sales. |
The tax components of dividends paid during the fiscal year ended December 31, 2010 and December 31, 2009 were as follows:
| | | | 2010 | | | 2009 | |
| | Ordinary Income | | $ | 303,267 | | | $ | 305,684 | |
| | Long-Term Capital Gains | | | — | | | | 7,124 | |
The Fund designated as long-term capital gain dividends, pursuant to Internal Revenue Code Section 852(b)(3), the amount necessary to reduce the earnings and profits for the Fund related to net capital gains to zero for the tax year ended December 31, 2010.
For the fiscal year ended December 31, 2010, certain dividends paid by the Fund may be subject to a maximum tax rate of 15%, as provided for by the Jobs and Growth Tax Relief Reconciliation Act of 2003. The percentage of dividends declared from net investment income designated as qualified dividend income for the fiscal year ended December 31, 2010 was 34.62% (unaudited) for the Fund.
For corporate shareholders, the percent of ordinary income distributions qualifying for the corporate dividends-received deduction for the fiscal year ended December 31, 2010 was 31.91% (unaudited) for the Fund.
The percentage of taxable ordinary income distributions that are designated as short-term capital gain distributions under Internal Revenue Code Section 871(k)(2)(c) for the fiscal year ended December 31, 2010 was 100.00% (unaudited) for the Fund.
The Merger Fund VL
NOTES TO THE FINANCIAL STATEMENTS (continued)
December 31, 2010
Note 6 — WRITTEN OPTION CONTRACTS
The premium amount and the number of written option contracts during the year ended December 31, 2010 were as follows:
| | | | Number of | | | Premium | |
| | | | Contracts | | | Amount | |
| | Options outstanding, beginning of year | | | 234 | | | $ | 86,286 | |
| | Options written | | | 8,275 | | | | 1,442,105 | |
| | Options closed | | | (2,982 | ) | | | (605,409 | ) |
| | Options exercised | | | (2,505 | ) | | | (533,063 | ) |
| | Options expired | | | (1,516 | ) | | | (145,165 | ) |
| | Options outstanding, end of year | | | 1,506 | | | $ | 244,754 | |
| | | | | | | | | | |
REPORT OF INDEPENDENT REGISTERED PUBLIC ACCOUNTING FIRM
To the Board of Trustees and Shareholders of
The Merger Fund VL:
In our opinion, the accompanying statement of assets and liabilities, including the schedule of investments, securities sold short, options written, forward contracts, and swap contracts, and the related statements of operations and of changes in net assets and the financial highlights present fairly, in all material respects, the financial position of The Merger Fund VL (the "Fund") at December 31, 2010, the results of its operations for the year then ended, the changes in its net assets for each of the two years in the period then ended and the financial highlights for each of the five years in the period then ended, in conformity with accounting principles generally accepted in the United States of America. These financial statements and financial highlights (hereafter referred to as "financial statements") are the responsibility of the Fund's management; our responsibility is to express an opinion on these financial statements based on our audits. We conducted our audits of these financial statements in accordance with the standards of the Public Company Accounting Oversight Board (United States). Those standards require that we plan and perform the audits to obtain reasonable assurance about whether the financial statements are free of material misstatement. An audit includes examining, on a test basis, evidence supporting the amounts and disclosures in the financial statements, assessing the accounting principles used and significant estimates made by management, and evaluating the overall financial statement presentation. We believe that our audits, which included confirmation of securities at December 31, 2010 by correspondence with the custodian and brokers, provide a reasonable basis for our opinion.

February 22, 2011
The Merger Fund VL
APPROVAL OF ADVISORY CONTRACT
(Unaudited)
On September 25, 2010, at an in-person meeting called for the purpose of considering the Advisory Agreement, the full Board, including all of the Trustees who are not parties to the Advisory Contract or “interested persons” (as defined in the 1940 Act) of the Fund, WCM or Westchester (the “Independent Trustees”), approved the Advisory Agreement. In so doing, the full Board, including the Independent Trustees, reviewed and evaluated materials and information about the Advisory Agreement, the Transaction and related matters provided by Westchester, WCM, counsel to the Independent Trustees and counsel to the Fund. The Independent Trustees conferred separately in executive session with counsel to the Independent Trustees about the Transaction.
At the meeting, the Board considered oral and written information provided by WCM regarding, among other things: WCM’s ownership structure; the portfolio managers’ experience, performance record, reputations, industry relationships and their ability to manage the Fund consistent with the Fund’s current investment objectives and policies; business and investment strategies; resources; and financial strength. Emphasis during the meeting focused on WCM’s business being the same in all material respects as Westchester’s business and WCM’s majority owners continuing to be the Fund’s portfolio managers. The Board discussed with Westchester and WCM the Transaction and its potential effect, if any, on the Fund and its shareholders.
The Board took into consideration that other than the change in ownership of Westchester’s business and assets, Frederick W. Green’s retirement and Mr. Green’s resignation from the Board, all other aspects of the operations of the Fund, including the Fund’s fundamental investment approach and risk profile, the advisory fee rate payable by the Fund and the persons principally responsible for the day-to-day investment management of the Fund, would not change. Messrs. Roy Behren and Michael T. Shannon assured the Board that there would be no reduction or other significant change in the nature, extent or quality of the investment advisory services to be provided to the Fund under the Advisory Agreement.
In their deliberations, the Trustees considered all materials that they believed reasonably necessary to evaluate in determining whether to approve the Advisory Agreement. In their deliberations, the Trustees did not identify any single piece of information that was all-important, controlling or determinative of their decision, and individual Trustees may have attributed different weights to the various factors. The material factors that formed the basis for the Trustees’ approval included the factors set forth below:
| (i) | there was not expected to be any diminution in the nature, extent and quality of the services to be provided to the Fund following the Closing as a result of the Transaction; |
| (ii) | the fundamental investment approach and risk profile of the Fund would not change after the Closing as a result of the Transaction; |
| (iii) | the qualifications of WCM to provide advisory services to the Fund, including that two of Westchester’s portfolio managers would be the majority owners of WCM and would continue to be the Fund’s portfolio managers after the Closing; |
The Merger Fund VL
APPROVAL OF ADVISORY CONTRACT (continued)
(Unaudited)
| (iv) | the advisory fee rate paid by the Fund under the Previous Advisory Agreement was the same rate proposed to be charged by WCM under the Advisory Agreement, WCM also had agreed to enter into a separate expense waiver and reimbursement agreement that was the same in all material respects as the current expense waiver and reimbursement agreement between the Fund and Westchester, and the Board planned to consider WCM’s willingness to continue this agreement when considering whether to renew the Advisory Agreement after its initial term; |
| (v) | the transition from Westchester to WCM would not have any foreseeable short-term or long-term adverse impact on the Fund or its shareholders; |
| (vi) | the compliance capabilities of WCM, including that WCM’s compliance program and the Fund’s Chief Compliance Officer, were not expected to change after the Closing as a result of the Transaction; |
| (vii) | WCM assured the Board that it would retain all of Westchester’s employees, except Mr. Green and one other retiring employee; |
| (viii) | the terms and conditions of the Advisory Agreement, including the differences between the Advisory Agreement and the Previous Advisory Agreement, which were not material; |
| (ix) | the financial strength and resources of WCM, including that WCM would have adequate cash, net worth and net working capital after the Closing to support its operations; |
| (x) | the terms and conditions of other agreements and arrangements relating to the future operations of the Fund, including WCM’s services agreements with Messrs. Behren and Shannon; |
| (xi) | Westchester, and not the Fund, would pay all of the costs of obtaining approval of the Advisory Agreement; |
| (xii) | the members of the previous Board would continue to oversee the Fund after the Closing, except that upon the Closing, Mr. Green would resign as a member of the Board and shareholders of the Fund would be asked to elect Mr. Shannon as a new member of the Board to fill the vacancy that would be created by Mr. Green’s resignation, subject to the Closing; |
| (xiii) | WCM has no affiliations that would adversely affect the Fund or its shareholders; |
| (xiv) | shareholders of the Fund would face no adverse tax consequences as a result of the Transaction; and |
| (xv) | WCM agreed to exercise reasonable best efforts to assure that, for a period of two years after the Closing, there is not imposed on the Fund any “unfair burden” (within the meaning of Section 15(f) of 1940 Act). |
In connection with the Board’s consideration of the Advisory Agreement, the Board also considered the following factors:
The Merger Fund VL
APPROVAL OF ADVISORY CONTRACT (continued)
(Unaudited)
Nature, Extent and Quality of Services to be Provided
The Trustees considered the expected nature, extent and quality of the services to be provided to the Fund by WCM and the resources to be dedicated to the Fund by WCM, including WCM’s portfolio-management services; the portfolio managers’ expertise, familiarity with the Fund, quality, competence and integrity; research capabilities; implementation and enforcement of compliance procedures and financial-reporting controls; adherence to the Fund’s investment objectives, policies and restrictions; and future plans for the Fund. The Trustees also reviewed WCM’s methodology, research and analysis that it would employ in selecting investments for the Fund. The Trustees considered the non-traditional nature of the Fund’s investment approach; the specialized expertise and experience of the Fund’s portfolio managers, who would be the majority owners of WCM; and the difficulty, were it warranted, of selecting another adviser experienced in the Fund’s investment approach.
The Trustees additionally considered, among other things, the expected impact, if any, of the Transaction on the operations of the Fund; continuity in portfolio management, support and trading functions; the ability of WCM to attract, motivate and retain highly qualified advisory investment professionals; and the quality of WCM’s investment research capabilities and the other resources that it would devote to managing the Fund. As noted above, the Trustees also considered that Messrs. Behren and Shannon would continue to serve as the portfolio managers of the Fund following the Closing of the Transaction.
The Trustees noted the professional experience and qualifications of the portfolio managers of WCM. The Trustees also considered that the compliance program and resources proposed to be provided to the Fund by WCM would be the same in all material respects as the previous compliance program and resources, including WCM’s representation that the previous Chief Compliance Officer of the Fund and Westchester would serve as the Chief Compliance Officer of the Fund and WCM following the Closing.
After reviewing these and related factors, the Trustees determined, within the context of their overall conclusions, that the expected nature, extent and quality of the services to be provided by WCM to the Fund under the Advisory Agreement supported the approval of such agreement.
Investment Advisory Fee Rate
The Trustees considered the fact that the investment advisory fee rate payable by the Fund to WCM under the Advisory Agreement is the same as the investment advisory fee rate paid by the Fund to Westchester under the Previous Advisory Agreement. The Trustees considered WCM’s willingness to enter into a separate expense waiver and reimbursement agreement that is the same in all material respects as the previous expense waiver and reimbursement agreement between the Fund and Westchester. Both agreements provide that the relevant adviser will limit the Fund’s advisory fees or other expenses so that the Fund’s annual total operating expenses do not exceed 1.40% of the Fund’s average daily net assets (excluding interest expense and dividends on securities sold short). The Trustees noted that this separate agreement, which was not subject to shareholder approval, would expire on June 30, 2013, and may be annually renewed thereafter only upon mutual agreement of the Fund and WCM.
The Merger Fund VL
APPROVAL OF ADVISORY CONTRACT (continued)
(Unaudited)
The Trustees received and considered information about the advisory fee rate that would be charged by WCM to its other clients, taking into account, among other things, differences in size and risk profile. In evaluating the Fund’s proposed advisory fee rate, the Trustees also took into account the demands, complexity and quality of the investment management of the Fund.
The Trustees also noted WCM’s covenants regarding compliance with Section 15(f) of the 1940 Act.
After reviewing these and related factors, the Trustees determined, within the context of their overall conclusions, that the proposed advisory fee rate supported the approval of the Advisory Agreement.
Investment Performance of the Fund and WCM
The Trustees also evaluated the investment performance of the Fund relative to the S&P 500 Index over the last year, three years, five years and since the Fund’s inception, and relative to the performance of alternative-investment mutual funds, including those that engage in merger arbitrage. The Trustees also focused on the Fund’s performance since January 2007, when Messrs. Behren and Shannon started co-managing the Fund’s portfolio with Mr. Green.
The Trustees noted that although WCM was a newly formed entity, the Trustees were familiar with WCM’s portfolio managers’ investment performance as portfolio managers of the Fund and the other funds advised by Westchester since January 2007.
Costs of Services to be Provided and Estimated Profitability
Additionally, the Board reviewed information on the costs of the services to be provided and the profits to be realized by WCM from its relationship with the Fund, as evidenced by WCM’s projected profitability analysis. The profitability analysis consisted of projected income and expenses by category, less expenses allocated to other funds to be managed by an affiliate of WCM, expenses to be waived or reimbursed by WCM pursuant to the separate expense waiver and reimbursement agreement, adjusted total expenses, net income (loss) and profit margin. The Board also reviewed comparisons of the rates of compensation paid to managers of funds in the Fund’s peer group, Lipper data relating to average expenses, advisory fee rates for comparable funds and the expected benefit to WCM of the Fund’s soft-dollar arrangements. Based on the information provided, the Board determined that the Fund at least initially would be unprofitable to WCM, and, hence, the Fund’s fee structure was reasonable compared to funds with similar investment goals and strategies. The Trustees noted that although the Fund would not be profitable to WCM, at least initially, WCM desired to establish a relationship with the Fund. The Trustees also considered information provided by WCM regarding its projected financial condition.
It was noted that the Fund’s advisory fee rate and net expense ratio were within the average range compared to its peer funds. The Board also considered the fact that WCM had agreed to waive a portion of its fees and/or reimburse Fund expenses until at least June 30, 2013 pursuant to the separate expense waiver and reimbursement agreement, which may be renewed by mutual agreement of the Fund and WCM. This agreement would permit WCM to recapture any waivers or subsidies it makes only if the amounts can be recaptured within three years (even if this agreement is terminated) without causing the Fund’s total annual operating expenses, excluding interest expense and dividends
The Merger Fund VL
APPROVAL OF ADVISORY CONTRACT (continued)
(Unaudited)
on securities sold short, to exceed the applicable cap. WCM would not subsidize acquired fund fees and expenses, which are fees and expenses incurred by the Fund in connection with its investment in other investment companies.
The Board considered the Fund’s total and net expense ratio, contractual investment advisory fee rate and service-provider fee ratio (in the aggregate and separately by fund administration, custodian, fund accounting and transfer agent fee ratios) compared to the industry average by quartile, within the appropriate Lipper benchmark category and Lipper category range.
WCM provided information on peer-group comparisons consisting of alternative-investment mutual funds, including those that engage in merger arbitrage. The materials compared each fund’s: investment strategies; management fee; expense ratio; total assets; whether a fund has a breakpoint, charges a sales load and is open to new investors; returns for the one year, three years and five years ended December 31, 2009; and risk as measured by beta and standard deviation. It was noted that the Fund’s management fees and net expense ratio were within the average range compared to its peer funds.
After reviewing these and related factors, the Trustees determined, within the context of their overall conclusions, that WCM’s expected expenses and profitability associated with its relationship with the Fund supported the approval of the Proposed Advisory Agreement.
Economies of Scale
The Board considered the issue of economies of scale and noted that, given the very small size of the Fund, consideration of fee breakpoints was premature.
Other Benefits to WCM
The Trustees received and considered information regarding any expected “fall-out” or ancillary benefits to be received by WCM as a result of its relationship with the Fund. The Trustees also considered the benefits of research expected to be made available to WCM by reason of brokerage commissions generated by the Fund’s securities transactions, and noted that WCM’s practices with respect to allocating portfolio brokerage for brokerage and research services would be the same as Westchester’s practices. The Trustees considered the possible conflicts of interest associated with certain fall-out or other ancillary benefits and the reporting, disclosure and other processes that would be in place to disclose and to monitor such possible conflicts of interest. The Trustees recognized that WCM’s profitability, if any, likely would be somewhat lower without these benefits.
Conclusion
Based on its evaluation, in consultation with independent counsel, of all material aspects of the Advisory Agreement, including those factors described above, and such other information believed to be reasonably necessary to evaluate the terms of the Advisory Agreement, the Board, including all of the Independent Trustees voting separately, unanimously determined that the terms of the Advisory Agreement were fair and reasonable, the compensation to be paid to WCM pursuant to the Advisory Agreement was reasonable, and approval of the Advisory Agreement by the Board and the shareholders of the Fund would be in the best interests of the Fund and its shareholders.
INFORMATION ABOUT TRUSTEES AND OFFICERS
The business and affairs of the Fund are managed under the direction of the Fund’s Board of Trustees. Information pertaining to the Fund’s Trustees and Officers is set forth below. The Statement of Additional Information includes additional information about the Fund’s Trustees and Officers and is available, without charge, upon request by calling 1-800-343-8959.
| | | Term of | | # of Portfolios | |
| | Position(s) | Office and | | in Fund Complex | Other |
| | Held with | Length of | Principal Occupation | Overseen by | Directorships |
| Name, Address and Age | the Fund | Time Served | During Past Five Years | Trustee ** | Held by Trustee |
| Roy Behren* | Co-President | One-year | Co-Portfolio Manager | N/A | N/A |
| Westchester Capital | and | term; | and Co-President of | | |
| Management, LLC | Treasurer | since 2011 | Westchester Capital | | |
| 100 Summit Lake Drive | | | Management, LLC, the | | |
| Valhalla, NY 10595 | | | Fund’s Adviser, since | | |
| Age: 50 | | | 2011. Co-Portfolio | | |
| | | | Manager of Westchester | | |
| | | | Capital Management, Inc., | | |
| | | | the Fund’s previous | | |
| | | | adviser, from 2007 to | | |
| | | | 2010. Research analyst | | |
| | | | for Westchester Capital | | |
| | | | Management, Inc. from | | |
| | | | 1994 until 2010. Chief | | |
| | | | Compliance Officer of the | | |
| | | | Fund and Westchester | | |
| | | | Capital Management, Inc. | | |
| | | | from 2004 to 2010. | | |
| | | | | | |
| Michael T. Shannon* | Co-President | One-year | Co-Portfolio Manager | 1 | None |
| Westchester Capital | and | term; | and Co-President of | | |
| Management, LLC | Trustee | since 2011 | Westchester Capital | | |
| 100 Summit Lake Drive | | | Management, LLC, the | | |
| Valhalla, NY 10595 | | | Fund’s Adviser, since | | |
| Age: 44 | | | 2011. Co-Portfolio | | |
| | | | Manager of Westchester | | |
| | | | Capital Management, Inc., | | |
| | | | the Fund’s previous | | |
| | | | adviser, from 2007 to | | |
| | | | 2010. Senior Vice | | |
| | | | President in charge of | | |
| | | | the Special Situations | | |
| | | | and Mergers Group of | | |
| | | | D.E. Shaw & Co. from | | |
| | | | April 2005 to April 2006. | | |
| | | | | | |
| James P. Logan, III | Independent | Indefinite; | Chairman of J.P. | 2 | None |
| c/o Westchester Capital | Trustee | since | Logan & Company. | | |
| Management, LLC | | inception | Chairman of | | |
| 100 Summit Lake Drive | | in 2002 | Logan-Chace, LLC, an | | |
| Valhalla, NY 10595 | | | executive search firm. | | |
| Age: 74 | | | | | |
INFORMATION ABOUT TRUSTEES AND OFFICERS (continued)
| | | Term of | | # of Portfolios | |
| | Position (s) | Office and | | in Fund Complex | Other |
| | Held with | Length of | Principal Occupation | Overseen by | Directorships |
| Name, Address and Age | the Fund | Time Served | During Past Five Years | Trustee ** | Held by Trustee |
| Michael J. Downey | Independent | Indefinite; | Private investor. | 2 | Chairman and |
| c/o Westchester Capital | Trustee | since | Consultant and | | Director of The |
| Management, LLC | | inception | independent financial | | Asia Pacific |
| 100 Summit Lake Drive | | in 2002 | adviser since July 1993. | | Fund, Inc. |
| Valhalla, NY 10595 | | | | | Director of |
| Age: 67 | | | | | AllianceBernstein |
| | | | | | core mutual fund |
| | | | | | group |
| | | | | | |
| Barry Hamerling | Independent | Indefinite; | Managing Partner of | 2 | Trustee of AXA |
| c/o Westchester Capital | Trustee | since 2007 | Premium Ice Cream of | | Premier VIP |
| Management, LLC | | | America. Managing | | Trust |
| 100 Summit Lake Drive | | | Partner of Let-US | | |
| Valhalla, NY 10595 | | | Creations. | | |
| Age: 65 | | | | | |
| | | | | | |
| Bruce Rubin | Vice | One-year | Chief Operating Officer | N/A | N/A |
| Westchester Capital | President, | term; | of Westchester Capital | | |
| Management, LLC | Chief | since 2010 | Management, LLC, the | | |
| 100 Summit Lake Drive | Compliance | | Fund’s Adviser. Chief | | |
| Valhalla, NY 10595 | Officer and | | Operating Officer of | | |
| Age: 51 | Anti-Money | | Westchester Capital | | |
| | Laundering | | Management, Inc., the | | |
| | Compliance | | Fund’s previous adviser, | | |
| | Officer | | from 2010 to 2010. | | |
| | | | Chief Operating Officer | | |
| | | | of Seneca Capital from | | |
| | | | 2005 to 2010. | | |
| | | | | | |
| Jane Perl | Secretary | One-year | Director of Operations | N/A | N/A |
| Westchester Capital | | term; | of Westchester Capital | | |
| Management, LLC | | since 2011 | Management, LLC, the | | |
| 100 Summit Lake Drive | | | Fund’s Adviser, since | | |
| Valhalla, NY 10595 | | | 2011. Director of | | |
| Age: 62 | | | Operations of | | |
| | | | Westchester Capital | | |
| | | | Management, Inc., the | | |
| | | | Fund’s previous adviser | | |
| | | | from, 1988 to 2010. | | |
| * | Denotes a trustee who is an “interested person” (as that term is defined in Section 2(a)(19) of the Investment Company Act of 1940, as amended) of the Fund or of the Adviser. Mr. Shannon is deemed to be an interested person because of his affiliation with the Fund’s investment adviser, Westchester Capital Management, LLC, and because he is an officer of the Fund. |
| ** | The fund complex consists of the Fund and The Merger Fund. |
The Merger Fund VL
AVAILABILITY OF PROXY VOTING INFORMATION
Information regarding how the Fund generally votes proxies relating to portfolio securities may be obtained without charge by calling the Fund’s Transfer Agent at 1-800-343-8959 or by visiting the SEC’s website at www.sec.gov. Information regarding how the Fund voted proxies during the most recent 12-month period ended June 30 is available on the SEC’s website or by calling the toll-free number listed above.
AVAILABILITY OF QUARTERLY PORTFOLIO SCHEDULE
The Fund files its complete schedule of portfolio holdings with the SEC for the first and third quarters of each fiscal year on Form N-Q. The Fund’s Forms N-Q are available on the SEC’s website at www.sec.gov and may be reviewed and copied at the SEC’s Public Reference Room in Washington, D.C. Information on the operation of the Public Reference Room may be obtained by calling 1-800-SEC-0330.
Investment Adviser
Westchester Capital Management, LLC
100 Summit Lake Drive
Valhalla, NY 10595
(914) 741-5600
Administrator, Transfer Agent, Dividend Paying
Agent and Shareholder Servicing Agent
U.S. Bancorp Fund Services, LLC
615 East Michigan Street
P.O. Box 701
Milwaukee, WI 53201-0701
(800) 343-8959
Custodian
U.S. Bank, N.A.
1555 North RiverCenter Drive, Suite 302
Milwaukee, WI 53212
(800) 343-8959
Trustees
Michael T. Shannon
Michael J. Downey
James P. Logan, III
Barry Hamerling
Executive Officers
Roy Behren, Co-President and Treasurer
Michael T. Shannon, Co-President
Bruce Rubin, Vice President and
Chief Compliance Officer
Jane Perl, Secretary
Counsel
Fulbright & Jaworski L.L.P.
666 Fifth Avenue
New York, NY 10103
Independent Registered Public Accounting Firm
PricewaterhouseCoopers LLP
100 East Wisconsin Avenue
Milwaukee, WI 53202
Item 2. Code of Ethics.
The registrant has adopted a code of ethics that applies to the registrant’s principal executive officer and principal financial officer. The registrant has not made any amendments to its code of ethics during the period covered by this report. The registrant has not granted any waivers from any provisions of the code of ethics during the period covered by this report. A copy of the registrant’s Code of Ethics is filed herewith.
Item 3. Audit Committee Financial Expert.
The registrant’s board of trustees has determined that there is at least one audit committee financial expert serving on its audit committee. Each of Michael J. Downey, James P. Logan, III and Barry Hamerling is an “audit committee financial expert” and is considered to be “independent” as each term is defined in Item 3 of Form N-CSR.
Item 4. Principal Accountant Fees and Services.
The registrant has engaged its principal accountant to perform audit services, audit-related services, tax services and other services during the past two fiscal years. “Audit services” refer to performing an audit of the registrant's annual financial statements or services that are normally provided by the accountant in connection with statutory and regulatory filings or engagements for those fiscal years. “Tax services” refer to professional services rendered by the principal accountant for tax compliance, tax advice, and tax planning. The following table details the aggregate fees billed or expected to be billed for each of the last two fiscal years for audit fees, audit-related fees, tax fees and other fees by the principal accountant.
| | FYE 12/31/2010 | FYE 12/31/2009 |
| Audit Fees | 40,000 | 40,000 |
| Audit-Related Fees | | |
| Tax Fees | 5,000 | 5,000 |
| All Other Fees | | |
The audit committee has adopted pre-approval policies and procedures that require the audit committee to pre-approve all audit and non-audit services of the registrant, including services provided to any entity affiliated with the registrant. The audit committee did not approve any services for which the preapproval requirement was waived. All of the principal accountant’s hours spent on auditing the registrant’s financial statements were attributed to work performed by full-time, permanent employees of the principal accountant.
There were no non-audit fees billed by the registrant's accountant for services to the registrant and to the registrant's investment adviser, and any entity controlling, controlled by, or under common control with the investment adviser that provides ongoing services to the registrant for each of the last two fiscal years of the registrant.
Item 5. Audit Committee of Listed Registrants.
Not applicable to registrants who are not listed issuers (as defined in Rule 10A-3 under the Securities Exchange Act of 1934).
Item 6. Investments.
Schedule of Investments is included as part of the report to shareholders filed under Item 1 of this Form.
Item 7. Disclosure of Proxy Voting Policies and Procedures for Closed-End Management Investment Companies.
Not applicable to open-end management investment companies.
Item 8. Portfolio Managers of Closed-End Management Investment Companies.
Not applicable to open-end management investment companies.
Item 9. Purchases of Equity Securities by Closed-End Management Investment Company and Affiliated Purchasers.
Not applicable to open-end management investment companies.
Item 10. Submission of Matters to a Vote of Security Holders.
There have been no material changes to the procedures by which shareholders may recommend nominees to the registrant’s board of trustees.
Item 11. Controls and Procedures.
| (a) | The Registrant’s Co-Presidents/Principal Executive Officers and Treasurer/Principal Financial Officer have reviewed the Registrant's disclosure controls and procedures (as defined in Rule 30a-3(c) under the Investment Company Act of 1940 (the “Act”)) as of a date within 90 days of the filing of this report, as required by Rule 30a-3(b) under the Act and Rules 13a-15(b) or 15d-15(b) under the Securities Exchange Act of 1934. Based on their review, such officers have concluded that the disclosure controls and procedures are reasonably designed to ensure that information required to be disclosed in this report is appropriately recorded, processed, summarized and reported and made known to them by others within the Registrant and by the Registrant’s service providers. |
| (b) | There were no changes in the Registrant's internal control over financial reporting (as defined in Rule 30a-3(d) under the Act) that occurred during the second fiscal quarter of the period covered by this report that has materially affected, or is reasonably likely to materially affect, the Registrant's internal control over financial reporting. |
Item 12. Exhibits.
| (a) | (1) Any code of ethics or amendment thereto, that is the subject of the disclosure required by Item 2, to the extent that the registrant intends to satisfy Item 2 requirements through filing an exhibit. Filed herewith. |
(2) A separate certification for each principal executive and principal financial officer pursuant to Section 302 of the Sarbanes-Oxley Act of 2002. Filed herewith.
(3) Any written solicitation to purchase securities under Rule 23c-1 under the Act sent or given during the period covered by the report by or on behalf of the registrant to 10 or more persons. Not applicable to open-end management investment companies.
| (b) | Certifications pursuant to Section 906 of the Sarbanes-Oxley Act of 2002. Furnished herewith. |
SIGNATURES
Pursuant to the requirements of the Securities Exchange Act of 1934 and the Investment Company Act of 1940, the registrant has duly caused this report to be signed on its behalf by the undersigned, thereunto duly authorized.
(Registrant) The Merger Fund VL
By (Signature and Title)* /s/ Michael T. Shannon
Michael T. Shannon, Co-President
Date 2/23/11
By (Signature and Title)* /s/ Roy Behren
Roy Behren, Co-President
Date 2/23/11
Pursuant to the requirements of the Securities Exchange Act of 1934 and the Investment Company Act of 1940, this report has been signed below by the following persons on behalf of the registrant and in the capacities and on the dates indicated.
By (Signature and Title)* /s/ Michael T. Shannon
Michael T. Shannon, Co-President
Date 2/23/11
By (Signature and Title)* /s/ Roy Behren
Roy Behren, Co-President and Treasurer
Date 2/23/11
* Print the name and title of each signing officer under his or her signature.