UNITED STATES
SECURITIES AND EXCHANGE COMMISSION
Washington, D.C. 20549
FORM N-CSR
CERTIFIED SHAREHOLDER REPORT OF REGISTERED MANAGEMENT INVESTMENT
COMPANIES
Investment Company Act file number 811-21279
The Merger Fund VL
(Exact name of registrant as specified in charter)
100 Summit Lake Drive
Valhalla, New York 10595
(Address of principal executive offices) (Zip code)
Roy Behren and Michael T. Shannon
100 Summit Lake Drive
Valhalla, New York 10595
(Name and address of agent for service)
1-800-343-8959
Registrant's telephone number, including area code
Date of fiscal year end: December 31
Date of reporting period: December 31, 2013
Item 1. Reports to Stockholders.
| |
| |
| THE MERGER FUND VL |
| A Westchester Capital Fund |
| |
| |
ANNUAL REPORT
December 31, 2013
Dear Shareholders:
The Merger Fund VL advanced by 1.47% during the fourth quarter, bringing its calendar-year gain to 3.88%, providing an excess return of 378 basis points versus 6-month Treasury Bills’ 0.10% performance.1 This performance is in line with our expectations given the current market environment. We are proud to mention that the Fund provided its 30th gain in the 38 quarters since its 2004 inception.
Equity markets relentlessly slogged ahead like the Walking Dead, oblivious to macroeconomic issues and fueled by the Fed’s apparent final quarter of full-scale quantitative easing.
| | | AVERAGE ANNUALIZED TOTAL RETURN AS OF 12/31/2013 | |
| | | | | | | | | | | | | | | | | | | | | Since | |
| | | 3-month | | | YTD | | | 1-year | | | 3-year | | | 5-year | | | 7-year | | | Inception* | |
| The Merger Fund VL (MERVX) | | | 1.47 | % | | | 3.88 | % | | | 3.88 | % | | | 2.42 | % | | | 4.81 | % | | | 4.27 | % | | | 5.88 | % |
| Citi 6-Month T-bills | | | 0.02 | % | | | 0.10 | % | | | 0.10 | % | | | 0.12 | % | | | 0.20 | % | | | 1.18 | % | | | 1.76 | % |
| HFRX Absolute Return Index | | | 1.72 | % | | | 3.58 | % | | | 3.58 | % | | | 0.20 | % | | | -0.63 | % | | | -1.52 | % | | | -0.10 | % |
| Barclays Aggregate Bond Index | | | -0.14 | % | | | -2.02 | % | | | -2.02 | % | | | 3.26 | % | | | 4.44 | % | | | 4.91 | % | | | 4.80 | % |
| MSCI The World Index | | | 8.11 | % | | | 27.37 | % | | | 27.37 | % | | | 12.13 | % | | | 15.68 | % | | | 4.43 | % | | | 7.80 | % |
| S&P 500 Index | | | 10.51 | % | | | 32.39 | % | | | 32.39 | % | | | 16.18 | % | | | 17.94 | % | | | 6.13 | % | | | 7.62 | % |
* Performance is calculated for the period from June 1, 2004, the first full month of the life of the Fund.
3-month performance is not annualized. Performance data quoted represents past performance; past performance does not guarantee future results. The performance results portrayed herein reflect the reinvestment of all interest, dividends and distributions. The investment return and principal value of an investment will fluctuate so that an investor’s shares, when redeemed, may be worth more or less than their original cost. Current performance of the Fund may be lower or higher than the performance quoted. Performance data included herein for periods prior to 2011 reflect that of Westchester Capital Management, Inc., the Fund’s prior investment advisor. Messrs. Behren and Shannon, the Fund’s current portfolio managers, assumed portfolio management duties of the Fund in 2007. As of the April 29, 2013 Prospectus, the Fund’s total annual operating expense ratio was 3.10%. The expense ratio may differ from the more recent expense ratio reported in the Financial Highlights. After applicable fee waivers and expense reimbursements (which may be terminated before April 30, 2014 only with approval of the Board of Trustees), total annual operating expenses were 1.96%, and after applicable fee waivers and before investment-related expenses, such as dividend and interest expense and acquired fund fees and expenses, total annual operating expenses were 1.40%. Performance data current to the most recent month-end may be obtained by contacting your financial advisor or the offering insurance company or by calling (800) 343-8959.
The S&P 500 continued to astonish the disbelievers, tacking on another 10.51% for the quarter and bringing its year-to-date gain to 32.39%. Remarkably, the S&P 500 has not been positive in all four quarters of the same calendar year in 17 years- since 1997. Equities worldwide were as happy as Honeymooners, with the MSCI World Index increasing 8.11% during the period.
Fixed income markets appear to be in Jeopardy in light of the nascent rising interest-rate environment, as the Barclays Aggregate Bond Index backtracked by 0.14%, increasing its 2013 loss to -2.02%. This is noteworthy in that it is a reflection of our Fund’s negative correlation with
__________
| 1 | 6-Month T-Bills are used as a proxy for the risk-free rate of return because it is a rough approximation of the Fund’s typical holding period for a merger arbitrage investment. |
bond prices (our three year beta to the Barclays Aggregate Bond Index is -0.29), which will be important should interest rates lift. Our hedge fund peers in the HFRX Absolute Return Index also performed well in Q4, adding 1.72%, bringing their calendar year performance up to 3.58%. However, our outperformance relative to the HFRX Absolute Return Index remained in place for the past 1, 3, 5 and 7 year periods.2
Our correlation and volatility again remained below that of our peer indices. The Fund continued to exhibit roughly one-fourth the “risk” (volatility) of the S&P and the MSCI World Index3 and the beta correlation with equity indices remained at approximately 0.19. Our beta to the HFRX Absolute Return Index is 1.05, which makes sense since we are not employing the Leverage that many of the hedge fund index components can utilize. If an investment’s returns are higher and our volatility is lower than an alternative investment option, then pursuant to “Modern Portfolio Theory,” it should be considered an attractive substitute for both the Barclays Aggregate Bond Index as well as the HFRX Absolute Return index.4 Accordingly, we believe that the Fund can be inserted into the equity “silo” of an investor’s portfolio or as a fixed income substitute.
As for our portfolio, the Fund held 112 investments during the quarter and experienced one terminated merger, consistent with our historic deal-selection success rate. Reflecting an 8:1 ratio of winners to losers, 100 of our positions were flat or positive and 12 performed negatively, roughly consistent with the prior period. We invested in 23 new situations during the quarter, through both equities and fixed income, and as of the end of December we were 85% invested across 93 positions. Particularly at the end of a calendar year, the percentage invested may vary and will be affected by deals closing towards the end of the quarter, with proceeds occasionally awaiting redeployment.
Twenty-one mergers with target market values exceeding $1.3 billion were completed during the quarter. Michael Dell’s attempt to keep his eponymous company All in the Family succeeded when he closed his hotly contested $16 billion Leveraged buy-out for the company, based just south of Dallas, in late October. NYSE Euronext’s $13 billion acquisition by Intercontinental Exchange Group, Inc. was completed in November; Berkshire Hathaway’s $10 billion dollar purchase of NV Energy Inc. went down to The Wire but closed in late December, as did biotech pioneer Elan Corporation plc’s acquisition by Perrigo Co.; dual $9 billion pharmaceutical deals to buy Warner Chilcott PLC and Onyx Pharmaceuticals by Actavis plc and Amgen, respectively drew Cheers from their investors when both deals closed on October 1. Another example of our investment process involved a portfolio manager visit to meet with executives of Shufflemaster and experience their technology in an attempt to Get Smart about the strategic rationale for its $1.5 billion merger with Bally Technologies.
__________
| 2 | See Total Return chart on page 1. |
| 3 | Three-year trailing standard deviation for The Merger Fund VL was 3.34% versus 12.11% for the S&P 500 Index and 13.71% for the MSCI World Index. |
| 4 | http://onlinelibrary.wiley.com/doi/10.1111/j.1540-6261.1952.tb01525.x/abstract |
Newly announced transactions were plentiful during the fourth quarter although many did not offer rates of return attractive enough for us to incur the deal or timing risk. We felt like Mad Men as we invested in U.S.-based advertiser Omnicom Group’s $16 billion dollar merger with French communications specialist Publicis Group. Although not a new investment, we added to our position in England’s Vodafone plc. Longtime Friends with Verizon Corp. through its Verizon Wireless joint venture, it finally agreed to sell its interest back to Verizon for $130 billion (which was so large that it skewed industry deal values for the quarter). In another large transaction, Silicon Valley’s Applied Materials was the Survivor in a $10 billion merger with Japanese semiconductor manufacturer Tokyo Electron Limited. Going the other direction was American LSI Corporation’s $6 billion acquisition by Avago Technology of Singapore. In yet another technology transaction, China-based Tsinghua University agreed to buy China-based but U.S.-traded semiconductor manufacturer RDA Microelectronics. Readers may recall that the Fund had an investment in Spreadtrum Communications, which was purchased by Tsinghua as well. RDA shareholders approved the deal shortly after the Spreadtrum transaction closed in late December and the transaction is currently awaiting Chinese Homeland antitrust approval by MOFCOM.
The Fund entered Spin City via its investments in Novartis, Starwood Property Trust, and Northstar Realty Trust, all of which are spinning off significant subsidiaries; Consul Energy announced that it was exploring options which include selling or separating its coal and gas business into two separate publicly traded entities. Oil and gas company Hess Corp. demonstrated its Dexterity by selling billions of dollars of assets as well as filing for a tax-free spinoff of its retail gas station network.
Finally, the Fund took a position, through both bonds and stock, in AMR Corporation, the parent of American Airlines. This could have turned into an American Horror Story, as AMR had filed for bankruptcy and was having difficulty reorganizing, but it fortunately was able to agree to a $4 billion merger with US Airways Group, which became effective upon AMR’s emergence from bankruptcy. The senior notes we purchased, secured by equipment (planes) and landing slot rights, were redeemed for cash. Other AMR bonds that we purchased were exchanged for shares of preferred securities which were ultimately convertible into shares of the combined company’s stock. The AMR stock that we purchased was also converted into shares of the new American Airlines plus some potential free optionality on over-reserved bankruptcy claims.
As far as attribution, no deal swung performance more than 29 basis points. The red list was topped by the one broken deal of the quarter. Archer Daniels Midland’s failed acquisition of Australian grain storage, shipping and processing firm Graincorp, cost the Fund 0.29% and was our Biggest Loser. In a Twilight Zone development, the transaction was blocked by the Australian government even after the ACCC (Australian Competition and Consumer Commission) declared that it would not oppose the transaction. National Treasurer Joe Hockey, however, ruled that Law and Order required him to block the transaction. He declared it “against the national interest” rather than anti-competitive, since ADM, a foreign corporation, would own a
“key Australian business.” The next largest loser was our market hedge, which detracted 0.14% from performance. The top ten winners on the Blacklist contributed from 0.10% to 0.06%, led by Vodafone, and followed by Celesio, American International Group, Leap Wireless, Lender Processing Services, and Lamar Advertising Company (which is in the process of converting into a REIT and is awaiting IRS approval).
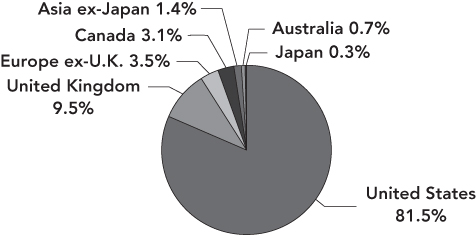
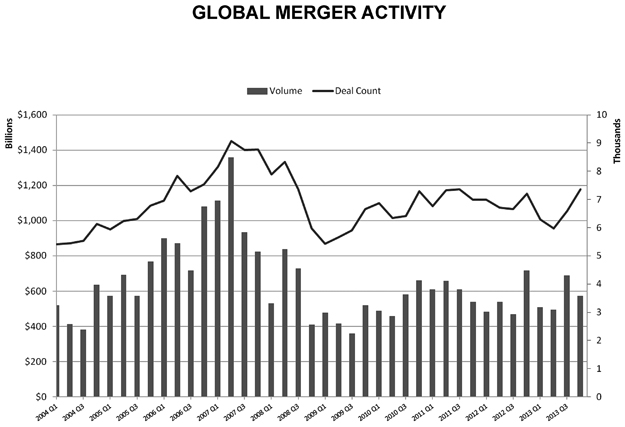
Global M & A activity (by target value) was relatively flat versus 2012; however when looked at in depth by region, the statistics shed a different light.5 U.S. volume increased by $75 billion, but without the $130 billion Verizon Wireless deal, the largest acquisition transaction in a decade, would have been down from the prior year. Aside from Canadian activity, which was down by 30%, volume in several other regions, which started from a small base, picked up significantly in Q4 to end the year on a positive note. Here are other comparables: U.K. -29%, Germany +37%, France +72% (coming out of a terrible year and ending notably with the $19 bln Omnicom/Publicis deal and Vivendi’s spin-off of SFR and $8.5 bln sale of its Activision stake), China +36% (as it continues its quest for natural resources and technology companies, China is beginning to get the hang of global capital markets), and Hong Kong +63%. Finally, despite the optimism generated by Abenomics, Japan’s transaction capabilities appear to be Breaking Badly, with 2013 volumes down by 35% versus 2012.
The types of transactions varied, but common structures included large corporations streamlining their operations in order to focus on core businesses. Whether as a result of internal or shareholder pressure, we have seen a multitude of spin-offs, split-offs and division sales. No corporation these days can be a Fugitive for long from activist shareholder demands. Yet at the same time, once the Gunsmoke from the divestiture transactions clears, many of these “stripped down” companies have been attempting to grow their core businesses through complementary acquisitions, a trend that we expect to continue. We have also seen several companies begin the process of converting to Real Estate Investment Trust structures in order to provide a more tax efficient exposure to their shareholders. The IRS, and no doubt the West Wing of the White House, is currently considering whether these tax-advantaged activities should be curtailed. We expect the IRS to receive guidance from its REIT working group shortly. Additionally, leveraged private transactions accounted for 632 deals in 2013, valued at $399 billion. We expect that low interest rates and approximately $1 trillion in uncommitted capital should drive continued private equity activity in 2014.
In an encouraging reversal of long-term trends, recent transactions have been received positively by investors. Last year, stock prices of U.S. companies announcing acquisitions greater than $1 billion rose, on average, more than 4 percent on the first day. The increase is the largest ever recorded by Dealogic, and nearly 50% higher than the previous year. In fact, each year between
__________
| 5 | All statistics in this paragraph are provided by Bloomberg Global Financial Advisory Mergers & Acquisitions Rankings, 2013 Annual report. |
1996 and 2011, acquirers’ average stock price fell within the first 24 hours of the announcement. “Investors love to see organic growth, but when they can’t get it, they are going to reward those companies that use acquisitions to grow,” a prominent merger and acquisitions lawyer observed.6
As far as developments at Westchester Capital go, we now manage a total of four SEC-registered mutual funds. Our Modern Family of funds includes The Merger Fund and The Merger Fund VL, which utilizes the same investment strategy for Variable Life and Annuity investors; the Dunham Monthly Distribution Fund (which we manage as a sub-adviser), which provides an alternative market-neutral profile to The Merger Fund® with an income-oriented slant; and as of January, our newest member, the WCM Alternatives: Event-Driven Fund (symbol: WCEIX). It is a complementary product to our other vehicles, which invests in the more aggressive event-driven space. WCEIX has a broader mandate than either The Merger Fund® or the Dunham Fund, will not provide a monthly distribution, and will be positioned for a higher level of volatility and possibly higher returns as well. As hinted at in our last letter, many of our investors have requested such a selection, and we view this as a natural extension of our business model of providing dependable, liquid, alternative investment products to investors wishing to diversify their portfolio of otherwise correlated investments. We are available at your convenience to discuss the full range of our products.
As usual, quarterly statistical summaries are provided within two weeks of the end of the quarter, approximately one month prior to the release of the quarterly letter. They are available electronically on our website, and we would be happy to arrange for an automatic email within 60 Minutes of the data becoming available. Going forward, we will generate a single letter for the Westchester Funds family that will include performance as well as commentary. We welcome your comments and suggestions.
Thanks again for your support and please feel free to contact us with any questions or comments.
 |  |
| Roy Behren | Mike Shannon |
__________
| 6 | Financial Times, January 22, 2014 “Companies buoyed by investors’ deal hunger” |
IMPORTANT DISCLOSURES
Before investing in The Merger Fund VL, carefully consider its investment objectives, risks, charges and expenses. For a prospectus or summary prospectus containing this and other information, please call (800) 343-8959 or contact your financial advisor. Please read it carefully before investing.
Diversification does not assure a profit, nor does it protect against a loss in a declining market.
Mutual fund investing involves risk. Principal loss is possible. The principal risk associated with the Fund’s merger arbitrage investment strategy is that certain of the proposed reorganizations in which the Fund invests may be renegotiated or terminated, in which case losses may be realized. Investments in foreign companies involved in pending mergers, takeovers and other corporate reorganizations may entail political, cultural, regulatory, legal, and tax risks different from those associated with comparable transactions in the United States. Merger arbitrage portfolios may have higher turnover rates than portfolios of typical long-only funds. This may increase the transaction costs to the Fund, which could impact the Fund’s performance. The purpose of the short sale is to protect against a decline in the market value of the acquiring company’s shares prior to the acquisition completion. However, should the acquisition be called off or otherwise not completed, the Fund may realize losses on both its long position in the target company’s shares and it short position in the acquirer’s shares.
References to other mutual funds do not construe an offer of those securities.
The Merger Fund VL is available through variable products offered by third-party insurance companies. The views expressed are as of February 14, 2014 and are a general guide to the views of Westchester Capital Management. The views expressed are those of the fund manager, are subject to change, are not guaranteed and should not be considered recommendations to buy or sell any security. This document does not replace portfolio and fund-specific materials.
Definitions: The S&P 500 Index is a broad based unmanaged index of 500 stocks, which is widely recognized as representative of the equity market in general; The MSCI World Index is a free float-adjusted market capitalization index designed to measure the equity market performance of developed economies; The Barclays Aggregate Bond Index is an intermediate term index comprised of investment grade bonds; Citi 6-Month T-Bills measures monthly return equivalents of yield averages that are not marked to market. The Six-Month Treasury Bill Indexes consist of the last three six-month Treasury bill issues. The indices are unmanaged and not available for direct investment. The HFRX Absolute Return Index is designed to be representative of the overall composition of the hedge fund universe. Standard Deviation is the degree by which returns vary relative to the average return. The higher the standard deviation, the greater the variability of the investment; Beta is a measure of the fund’s sensitivity to market movements. A portfolio with a beta greater than 1 is more volatile than the market and a portfolio with a beta less than 1 is less volatile than the market; A basis point (often denoted as bp) is a unit equal to 1/100 of a percentage point and can be summarized as follows: 1% change = 100 basis points and 0.01% = 1 basis point; Correlation is calculated using R-Squared; which is a measure that represents the percentage of a fund’s movements that can be explained by movements in a benchmark index. A fund with low R-squared doesn’t act much like the index; Alpha is a measure of performance on a risk-adjusted basis. Alpha takes the volatility (price risk) of a mutual fund and compares its risk-adjusted performance to a benchmark index. The excess return of the fund relative to the return of the benchmark index is a fund’s alpha; A leveraged buyout (LBO) is when a company or single asset (e.g., a real estate property) is purchased with a combination of equity plus significant amounts of borrowed money — structured in such a way that the target’s cash flows or assets are used as the collateral (or, “leverage”) to secure and repay the money borrowed to purchase the target-company/asset.
This commentary may include statements that constitute “forward-looking statements” under the U.S. Securities laws. Forward-looking statements include, among other things, projections, estimates, and information about possible or future results, market or regulatory developments. The views expressed above are not guarantees of future performance or economic results and involve certain risks, uncertainties and assumptions that could cause actual outcomes and results to differ materially from the views expressed herein. The views expressed above are subject to change at any time based upon economic, market, or other conditions and no obligation to update the views expressed herein is undertaken. Any discussions of specific securities should not be considered a recommendation to buy or sell those securities. The views expressed herein (including any forward-looking statement) may not be relied upon as investment advice or as an indication of trading intent.
| | |
| Chart 1 | Chart 2 |
| | |
| PORTFOLIO COMPOSITION | PORTFOLIO COMPOSITION |
| By Type of Deal* | By Type of Buyer* |
| | |
 |  |
| | |
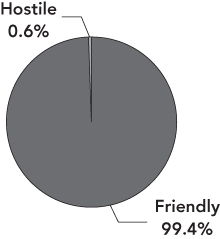
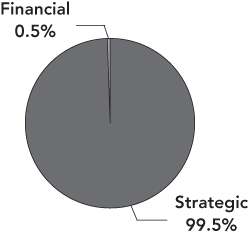
Chart 3
PORTFOLIO COMPOSITION
By Deal Terms*
| * | Data expressed as a percentage of long common stock, corporate bonds and swap contract positions as of December 31, 2013. |
| 1 | “Stub” includes assets other than cash and stock (e.g., escrow notes). |
| 2 | The compensation is undetermined because the compensation to be received (e.g., stock, cash, escrow notes, other) will be determined at a later date, potentially at the option of the Fund’s investment adviser. |
Chart 4
PORTFOLIO COMPOSITION
By Sector*
Chart 5
PORTFOLIO COMPOSITION
By Region*
| * | Data expressed as a percentage of long common stock, corporate bonds and swap contract positions as of December 31, 2013. |
The Global Industry Classification Standard (GICS®) was developed by and/or is the exclusive property of MSCI, Inc. and Standard & Poor Financial Services LLC (“S&P”). GICS is a service mark of MSCI and S&P and has been licensed for use by U.S. Bancorp Fund Services, LLC.
GLOBAL MERGER ACTIVITY
Quarterly volume of announced global mergers
and acquisitions January 2004 – December 2013
Source: Bloomberg, Global Financial Advisory Mergers & Acquisitions Rankings 2013
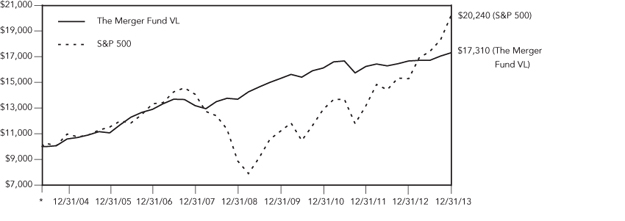
COMPARISON OF CHANGE IN VALUE OF $10,000 INVESTMENT IN THE MERGER FUND VL AND S&P 500
* Inception Date 5/26/04
| | | Average Annual Total Return | |
| | | | | | | | | | | | Since | |
| | | 1 Year | | | 3 Year | | | 5 Year | | | Inception | |
| The Merger Fund VL | | | 3.88 | % | | | 2.42 | % | | | 4.81 | % | | | 5.88 | % |
| The Standard & Poor’s 500 Index | | | 32.39 | % | | | 16.18 | % | | | 17.94 | % | | | 7.62 | % |
The Standard & Poor’s 500 Index (S&P 500) is a capitalization-weighted index, representing the aggregate market value of the common equity of 500 stocks primarily traded on the New York Stock Exchange. This chart assumes an initial gross investment of $10,000 made on May 26, 2004. Returns shown include the reinvestment of all dividends. Past performance is not predictive of future performance. The graph and table do not reflect the deduction of taxes that a shareholder would pay on fund distributions or the redemption of fund shares. Investment return and principal value will fluctuate, so that your shares, when redeemed, may be worth more or less than the original cost.
The Merger Fund VL
EXPENSE EXAMPLE
December 31, 2013
(Unaudited)
As a shareholder of the Fund, you incur two types of costs: (1) transaction costs as described below and (2) ongoing costs, including management fees, distribution and/or service fees, and other Fund expenses. This example is intended to help you understand your ongoing costs (in dollars) of investing in the Fund and to compare these costs with the ongoing costs of investing in other mutual funds. The example is based on an investment of $1,000 for the period 7/1/13 – 12/31/13.
Actual Expenses
The first line of the table below provides information about actual account values and actual expenses. You may use the information in this line, together with the amount you invested, to estimate the expenses that you paid over the period. Simply divide your account value by $1,000 (for example, an $8,600 account value divided by $1,000 = 8.6), then multiply the result by the number in the first line under the heading entitled “Expenses Paid During Period” to estimate the expenses you paid on your account during this period. The example below includes, among other fees, management fees, fund accounting, custody and transfer agent fees. However, the example below does not include portfolio trading commissions and related expenses, and extraordinary expenses as determined under generally accepted accounting principles.
Hypothetical Example for Comparison Purposes
The second line of the table below provides information about hypothetical account values and hypothetical expenses based on the Fund’s actual expense ratio and an assumed rate of return of 5% per year before expenses, which is not the Fund’s actual return. The hypothetical account values and expenses may not be used to estimate the actual ending account balance or expenses you paid for the period. You may use this information to compare the ongoing costs of investing in the Fund and other funds. To do so, compare this 5% hypothetical example with the 5% hypothetical examples that appear in the shareholder reports of the other funds. Please note that the expenses shown in the table are meant to highlight your ongoing costs only and do not reflect any transactional costs, such as redemption fees. Therefore, the second line of the table is useful in comparing ongoing costs only, and will not help you determine the relative total costs of owning different funds. In addition, if these transactional costs were included, your costs would have been higher.
EXPENSE EXAMPLE (continued)
December 31, 2013
(Unaudited)
| | | | Expenses Paid |
| | Beginning Account | Ending Account | During Period |
| | Value 7/1/13 | Value 12/31/13 | 7/1/13-12/31/13* |
Actual+(1) | $1,000.00 | $1,034.80 | $8.26 |
Hypothetical++(2) | $1,000.00 | $1,017.09 | $8.19 |
| + | Excluding dividends on securities sold short and borrowing expense on securities sold short, your actual cost of investment in the Fund would be $7.18. |
| ++ | Excluding dividends on securities sold short and borrowing expense on securities sold short, your hypothetical cost of investment in the Fund would be $7.12. |
| (1) | Ending account values and expenses paid during the period based on a 3.48% return. This actual return is net of expenses. |
| (2) | Ending account values and expenses paid during period based on a 5.00% annual return before expenses. |
| * | Expenses are equal to the Fund’s annualized expense ratio of 1.61%, multiplied by the average account value over the period, multiplied by 184/365 (to reflect the one-half year period). |
SCHEDULE OF INVESTMENTS
December 31, 2013
| Shares | | | | Value | |
| | | | |
| COMMON STOCKS — 71.08% | | | |
| | | | | | |
| | | ADVERTISING — 6.64% | | | |
| | 10,400 | | Lamar Advertising Company Class A (a)(f) | | $ | 543,400 | |
| | 9,851 | | Omnicom Group, Inc. (d)(f)(j) | | | 724,246 | |
| | | | | | | 1,267,646 | |
| | | | | | | | |
| | | | AIRLINES — 0.07% | | | | |
| | 510 | | American Airlines Group, Inc. (a) | | | 12,884 | |
| | | | | | | | |
| | | | AUTO PARTS & EQUIPMENT — 0.13% | | | | |
| | 300 | | Visteon Corporation (a) | | | 24,567 | |
| | | | | | | | |
| | | | AUTOMOBILE MANUFACTURERS — 2.42% | | | | |
| | 11,300 | | General Motors Company (a)(f) | | | 461,831 | |
| | | | | | | | |
| | | | BROADCASTING & CABLE TV — 0.50% | | | | |
| | 1,100 | | CC Media Holdings, Inc. Class A (a) | | | 7,183 | |
| | 1,042 | | Discovery Communications, Inc. Class C (a)(e) | | | 87,382 | |
| | | | | | | 94,565 | |
| | | | | | | | |
| | | | CABLE & SATELLITE TV — 3.01% | | | | |
| | 1,375 | | Comcast Corporation Special Class A (e) | | | 68,585 | |
| | 2,000 | | DISH Network Corporation Class A (a)(f) | | | 115,840 | |
| | 608 | | Liberty Global plc Series C (a)(b) | | | 51,266 | |
| | 2,500 | | Time Warner Cable, Inc. (f) | | | 338,750 | |
| | | | | | | 574,441 | |
| | | | | | | | |
| | | | COAL & CONSUMABLE FUELS — 1.04% | | | | |
| | 5,200 | | CONSOL Energy, Inc. (f) | | | 197,808 | |
| | | | | | | | |
| | | | CONSUMER FINANCE — 1.53% | | | | |
| | 11,100 | | SLM Corporation (f) | | | 291,708 | |
| | | | | | | | |
| | | | DATA PROCESSING & OUTSOURCED SERVICES — 2.62% | | | | |
| | 13,360 | | Lender Processing Services, Inc. (e) | | | 499,397 | |
| | | | | | | | |
| | | | DIVERSIFIED CHEMICALS — 4.14% | | | | |
| | 2,400 | | The Dow Chemical Company (f) | | | 106,560 | |
The accompanying notes are an integral part of these financial statements.
The Merger Fund VL
SCHEDULE OF INVESTMENTS (continued)
December 31, 2013
| Shares | | | | Value | |
| | | | | | |
| | | DIVERSIFIED CHEMICALS — 4.14% (continued) | | | |
| | 3,600 | | E.I. Du Pont de Nemours & Company (f) | | $ | 233,892 | |
| | 18,242 | | Huntsman Corporation (f) | | | 448,753 | |
| | | | | | | 789,205 | |
| | | | | | | | |
| | | | DIVERSIFIED METALS & MINING — 0.01% | | | | |
| | 1,276 | | Pilot Gold, Inc. (a)(b) | | | 1,033 | |
| | | | | | | | |
| | | | DIVERSIFIED SUPPORT SERVICES — 0.09% | | | | |
| | 597 | | Iron Mountain, Inc. | | | 18,119 | |
| | | | | | | | |
| | | | DRUG RETAIL — 0.71% | | | | |
| | 2,469 | | Shoppers Drug Mart Corporation (b)(j) | | | 135,215 | |
| | | | | | | | |
| | | | FOOD RETAIL — 0.20% | | | | |
| | 1,200 | | Safeway, Inc. | | | 39,084 | |
| | | | | | | | |
| | | | GAS UTILITIES — 0.23% | | | | |
| | 700 | | ONEOK, Inc. | | | 43,526 | |
| | | | | | | | |
| | | | HEALTH CARE FACILITIES — 0.57% | | | | |
| | 8,230 | | Health Management Associates, Inc. Class A (a)(e) | | | 107,813 | |
| | | | | | | | |
| | | | INDUSTRIAL MACHINERY — 1.86% | | | | |
| | 479 | | Allegion plc (a)(b) | | | 21,167 | |
| | 1,000 | | Dover Corporation (f) | | | 96,540 | |
| | 1,434 | | Ingersoll-Rand plc (b) | | | 88,334 | |
| | 2,700 | | The Timken Company (f) | | | 148,689 | |
| | | | | | | 354,730 | |
| | | | | | | | |
| | | | INTEGRATED OIL & GAS — 4.10% | | | | |
| | 3,100 | | BP plc — ADR (f) | | | 150,691 | |
| | 4,400 | | Hess Corporation (f) | | | 365,200 | |
| | 500 | | Murphy Oil Corporation | | | 32,440 | |
| | 125 | | Murphy USA, Inc. (a) | | | 5,195 | |
| | 2,400 | | Occidental Petroleum Corporation (f) | | | 228,240 | |
| | | | | | | 781,766 | |
| | | | | | | | |
The accompanying notes are an integral part of these financial statements.
The Merger Fund VL
SCHEDULE OF INVESTMENTS (continued)
December 31, 2013
| Shares | | | | Value | |
| | | | | | |
| | | INTEGRATED TELECOMMUNICATION SERVICES — 0.06% | | | |
| | 300 | | AT&T, Inc. | | $ | 10,548 | |
| | | | | | | | |
| | | | INTERNET SOFTWARE & SERVICES — 1.49% | | | | |
| | 100 | | Chegg, Inc. (a) | | | 851 | |
| | 1,600 | | Equinix, Inc. (a)(f) | | | 283,920 | |
| | | | | | | 284,771 | |
| | | | | | | | |
| | | | IT CONSULTING & OTHER SERVICES — 0.41% | | | | |
| | 10,943 | | Pactera Technology International, Ltd. — ADR (a)(h) | | | 78,242 | |
| | | | | | | | |
| | | | LIFE SCIENCES TOOLS & SERVICES — 3.44% | | | | |
| | 8,665 | | Life Technologies Corporation (a)(f) | | | 656,807 | |
| | | | | | | | |
| | | | MOVIES & ENTERTAINMENT — 1.31% | | | | |
| | 1,000 | | SFX Entertainment, Inc. (a) | | | 12,000 | |
| | 6,851 | | Twenty-First Century Fox, Inc. Class B (e) | | | 237,045 | |
| | | | | | | 249,045 | |
| | | | | | | | |
| | | | MULTI-LINE INSURANCE — 2.70% | | | | |
| | 10,100 | | American International Group, Inc. (f) | | | 515,605 | |
| | | | | | | | |
| | | | OIL & GAS DRILLING — 2.27% | | | | |
| | 8,400 | | Noble Corporation plc (b)(f) | | | 314,748 | |
| | 2,400 | | Transocean, Ltd. (b)(f) | | | 118,608 | |
| | | | | | | 433,356 | |
| | | | | | | | |
| | | | OIL & GAS EQUIPMENT & SERVICES — 3.93% | | | | |
| | 1,900 | | Halliburton Company (f) | | | 96,425 | |
| | 4,000 | | National Oilwell Varco, Inc. (f) | | | 318,120 | |
| | 3,300 | | Oil States International, Inc. (a)(f) | | | 335,676 | |
| | | | | | | 750,221 | |
| | | | | | | | |
| | | | OIL & GAS EXPLORATION & PRODUCTION — 3.72% | | | | |
| | 3,600 | | Anadarko Petroleum Corporation (f) | | | 285,552 | |
| | 5,579 | | LinnCo LLC (f) | | | 171,898 | |
| | 8,200 | | QEP Resources, Inc. (f) | | | 251,330 | |
| | | | | | | 708,780 | |
| | | | | | | | |
The accompanying notes are an integral part of these financial statements.
The Merger Fund VL
SCHEDULE OF INVESTMENTS (continued)
December 31, 2013
| Shares | | | | Value | |
| | | | | | |
| | | OIL & GAS REFINING & MARKETING — 0.21% | | | |
| | 800 | | Valero Energy Corporation | | $ | 40,320 | |
| | | | | | | | |
| | | | OIL & GAS STORAGE & TRANSPORTATION — 1.93% | | | | |
| | 3,863 | | PAA Natural Gas Storage, LP (j) | | | 88,994 | |
| | 2,377 | | PVR Partners, LP | | | 63,775 | |
| | 5,600 | | Williams Companies, Inc. (f) | | | 215,992 | |
| | | | | | | 368,761 | |
| | | | | | | | |
| | | | PAPER PRODUCTS — 1.08% | | | | |
| | 4,200 | | International Paper Company (f) | | | 205,926 | |
| | | | | | | | |
| | | | PERSONAL PRODUCTS — 0.70% | | | | |
| | 169,751 | | Magic Holdings International, Ltd. (b) | | | 134,412 | |
| | | | | | | | |
| | | | PHARMACEUTICALS — 2.66% | | | | |
| | 900 | | Eli Lilly & Company | | | 45,900 | |
| | 1,400 | | Endo Health Solutions, Inc. (a) | | | 94,444 | |
| | 1,700 | | Novartis AG — ADR (f) | | | 136,646 | |
| | 7,133 | | Pfizer, Inc. (f) | | | 218,484 | |
| | 259 | | ViroPharma, Inc. (a) | | | 12,911 | |
| | | | | | | 508,385 | |
| | | | | | | | |
| | | | REGIONAL BANKS — 1.16% | | | | |
| | 951 | | CapitalSource, Inc. | | | 13,666 | |
| | 6,097 | | Sterling Financial Corporation (e) | | | 207,786 | |
| | | | | | | 221,452 | |
| | | | | | | | |
| | | | REITS — 2.74% | | | | |
| | 2,560 | | Cole Real Estate Investments, Inc. | | | 35,942 | |
| | 4,236 | | CommonWealth REIT | | | 98,741 | |
| | 13,424 | | NorthStar Realty Finance Corporation | | | 180,553 | |
| | 4,646 | | Starwood Property Trust, Inc. | | | 128,694 | |
| | 2,500 | | Weyerhaeuser Company | | | 78,925 | |
| | | | | | | 522,855 | |
The accompanying notes are an integral part of these financial statements.
The Merger Fund VL
SCHEDULE OF INVESTMENTS (continued)
December 31, 2013
| Shares | | | | Value | |
| | | | | | |
| | | SECURITY & ALARM SERVICES — 0.59% | | | |
| | 3,507 | | Corrections Corporation of America | | $ | 112,469 | |
| | | | | | | | |
| | | | SEMICONDUCTOR EQUIPMENT — 0.23% | | | | |
| | 3,141 | | Tokyo Electron, Ltd. — ADR | | | 43,440 | |
| | | | | | | | |
| | | | SEMICONDUCTORS — 0.89% | | | | |
| | 13,792 | | LSI Corporation | | | 151,988 | |
| | 1,035 | | RDA Microelectronics, Inc. — ADR | | | 18,506 | |
| | | | | | | 170,494 | |
| | | | | | | | |
| | | | SPECIALTY CHEMICALS — 1.69% | | | | |
| | 2,400 | | Ashland, Inc. (f) | | | 232,896 | |
| | 3,200 | | Chemtura Corporation (a) | | | 89,344 | |
| | | | | | | 322,240 | |
| | | | | | | | |
| | | | THRIFTS & MORTGAGE FINANCE — 1.66% | | | | |
| | 33,665 | | Hudson City Bancorp, Inc. (e) | | | 317,461 | |
| | | | | | | | |
| | | | WIRELESS TELECOMMUNICATION SERVICES — 6.34% | | | | |
| | 10,931 | | Leap Wireless International, Inc. (a)(f) | | | 190,199 | |
| | 11,673 | | Sprint Corporation (a)(f) | | | 125,485 | |
| | 15,750 | | T-Mobile U.S., Inc. (a)(f) | | | 529,830 | |
| | 9,274 | | Vodafone Group plc — ADR (f) | | | 364,561 | |
| | | | | | | 1,210,075 | |
| | | | | | | | |
| | | | TOTAL COMMON STOCKS | | | | |
| | | | (Cost $12,454,799) | | | 13,561,003 | |
| | | | | |
| PREFERRED STOCKS — 0.50% | | | | |
| | 3,694 | | American Airlines Group, Inc., 6.250%, Series A (a) | | | 95,748 | |
| | | | | | | | |
| | | | TOTAL PREFERRED STOCKS | | | | |
| | | | (Cost $95,767) | | | 95,748 | |
| WARRANTS — 0.00% | | | | |
| | 668 | | Kinross Gold Corporation (a)(b) | | | 10 | |
| | | | | | | | |
| | | | TOTAL WARRANTS | | | | |
| | | | (Cost $2,560) | | | 10 | |
The accompanying notes are an integral part of these financial statements.
The Merger Fund VL
SCHEDULE OF INVESTMENTS (continued)
December 31, 2013
| Principal Amount | | | | Value | |
| | | | |
| CORPORATE BONDS — 4.48% | | | |
| | | American Airlines Group, Inc. | | | |
| $ | 210,000 | | 7.500%, 3/15/2016 (Acquired 1/25/13 | | | |
| | | | through 5/23/13, Cost $214,725) (f)(i) | | $ | 218,925 | |
| | | | Cricket Communications, Inc. | | | | |
| | 141,000 | | 7.750%, 10/15/2020 (g) | | | 161,269 | |
| | | | Health Management Associates, Inc. | | | | |
| | 106,000 | | 7.375%, 1/15/2020 | | | 119,117 | |
| | | | Lender Processing Services, Inc. | | | | |
| | 93,000 | | 5.750%, 4/15/2023 | | | 96,720 | |
| | | | MetroPCS Wireless, Inc. | | | | |
| | 30,000 | | 6.625%, 11/15/2020 | | | 31,912 | |
| | | | Oil States International, Inc. | | | | |
| | 112,000 | | 5.125%, 1/15/2023 (f) | | | 126,840 | |
| | | | Petrominerales, Ltd. | | | | |
| | 100,000 | | 3.250%, 6/12/2017 (b) | | | 99,500 | |
| | | | TOTAL CORPORATE BONDS | | | | |
| | | | (Cost $850,793) | | | 854,283 | |
| | | | | |
| MUNICIPAL BONDS — 0.89% | | | | |
| | | | Louisiana Public Facilities | | | | |
| | 170,000 | | 9.750%, 8/1/2014 | | | 170,486 | |
| | | | TOTAL MUNICIPAL BONDS | | | | |
| | | | (Cost $170,000) | | | 170,486 | |
| | | | | | | | |
| Contracts (100 shares per contract) | | | | |
| | | | | |
| PURCHASED PUT OPTIONS — 0.54% | | | | |
| | | | | | | | |
| | | | American Airlines Group, Inc. | | | | |
| | 42 | | Expiration: February 2014, Exercise Price: $30.00 | | | 22,260 | |
| | 37 | | Expiration: March 2014, Exercise Price: $30.00 | | | 21,090 | |
The accompanying notes are an integral part of these financial statements.
The Merger Fund VL
SCHEDULE OF INVESTMENTS (continued)
December 31, 2013
| Contracts (100 shares per contract) | | Value | |
| | | | | | |
| PURCHASED PUT OPTIONS — 0.54% (continued) | | | |
| | | | | | |
| | | American International Group, Inc. | | | |
| | 35 | | Expiration: January 2014, Exercise Price: $42.00 | | $ | 105 | |
| | 24 | | Expiration: January 2014, Exercise Price: $44.00 | | | 84 | |
| | 34 | | Expiration: February 2014, Exercise Price: $40.00 | | | 391 | |
| | | | Andarko Petroleum Corporation | | | | |
| | 2 | | Expiration: February 2014, Exercise Price: $70.00 | | | 134 | |
| | 15 | | Expiration: February 2014, Exercise Price: $75.00 | | | 2,490 | |
| | 19 | | Expiration: February 2014, Exercise Price: $80.00 | | | 7,030 | |
| | | | Ashland, Inc. | | | | |
| | 19 | | Expiration: January 2014, Exercise Price: $75.00 | | | 143 | |
| | 3 | | Expiration: April 2014, Exercise Price: $80.00 | | | 232 | |
| | | | AT&T, Inc. | | | | |
| | 3 | | Expiration: January 2014, Exercise Price: $31.00 | | | 9 | |
| | | | BP plc — ADR | | | | |
| | 12 | | Expiration: February 2014, Exercise Price: $41.00 | | | 72 | |
| | 9 | | Expiration: February 2014, Exercise Price: $43.00 | | | 108 | |
| | | | Chemtura Corporation | | | | |
| | 6 | | Expiration: March 2014, Exercise Price: $20.00 | | | 75 | |
| | 21 | | Expiration: March 2014, Exercise Price: $22.50 | | | 578 | |
| | | | CommonWealth REIT | | | | |
| | 34 | | Expiration: January 2014, Exercise Price: $17.50 | | | 272 | |
| | 8 | | Expiration: January 2014, Exercise Price: $20.00 | | | 60 | |
| | | | CONSOL Energy, Inc. | | | | |
| | 34 | | Expiration: January 2014, Exercise Price: $33.00 | | | 289 | |
| | 18 | | Expiration: April 2014, Exercise Price: $32.00 | | | 1,260 | |
| | | | Corrections Corporation of America | | | | |
| | 3 | | Expiration: January 2014, Exercise Price: $31.00 | | | 60 | |
| | 4 | | Expiration: March 2014, Exercise Price: $27.00 | | | 80 | |
| | 20 | | Expiration: March 2014, Exercise Price: $28.00 | | | 550 | |
The accompanying notes are an integral part of these financial statements.
The Merger Fund VL
SCHEDULE OF INVESTMENTS (continued)
December 31, 2013
| Contracts (100 shares per contract) | | Value | |
| | | | | | |
| PURCHASED PUT OPTIONS — 0.54% (continued) | | | |
| | | | | | |
| | | DISH Network Corporation Class A | | | |
| | 8 | | Expiration: January 2014, Exercise Price: $40.00 | | $ | 40 | |
| | 10 | | Expiration: March 2014, Exercise Price: $45.00 | | | 575 | |
| | | | Dover Corporation | | | | |
| | 10 | | Expiration: March 2014, Exercise Price: $80.00 | | | 440 | |
| | | | The Dow Chemical Company | | | | |
| | 22 | | Expiration: March 2014, Exercise Price: $33.00 | | | 330 | |
| | | | E.I. Du Pont de Nemours & Company | | | | |
| | 6 | | Expiration: January 2014, Exercise Price: $50.00 | | | 21 | |
| | 24 | | Expiration: January 2014, Exercise Price: $52.50 | | | 120 | |
| | 5 | | Expiration: April 2014, Exercise Price: $52.50 | | | 135 | |
| | | | Eli Lilly & Company | | | | |
| | 7 | | Expiration: January 2014, Exercise Price: $43.00 | | | 28 | |
| | 2 | | Expiration: April 2014, Exercise Price: $44.00 | | | 64 | |
| | | | Endo Health Solutions, Inc. | | | | |
| | 9 | | Expiration: April 2014, Exercise Price: $40.00 | | | 405 | |
| | 5 | | Expiration: April 2014, Exercise Price: $50.00 | | | 625 | |
| | | | Equinix, Inc. | | | | |
| | 2 | | Expiration: January 2014, Exercise Price: $140.00 | | | 54 | |
| | 6 | | Expiration: January 2014, Exercise Price: $160.00 | | | 570 | |
| | 7 | | Expiration: March 2014, Exercise Price: $145.00 | | | 1,505 | |
| | | | Financial Select Sector SPDR Fund | | | | |
| | 5 | | Expiration: February 2014, Exercise Price: $22.00 | | | 255 | |
| | | | General Motors Company | | | | |
| | 70 | | Expiration: March 2014, Exercise Price: $33.00 | | | 1,890 | |
| | 10 | | Expiration: March 2014, Exercise Price: $34.00 | | | 360 | |
| | 26 | | Expiration: March 2014, Exercise Price: $37.00 | | | 2,288 | |
| | | | Halliburton Company | | | | |
| | 17 | | Expiration: February 2014, Exercise Price: $47.00 | | | 1,088 | |
| | | | | | | | |
The accompanying notes are an integral part of these financial statements.
The Merger Fund VL
SCHEDULE OF INVESTMENTS (continued)
December 31, 2013
| Contracts (100 shares per contract) | | Value | |
| | | | |
| PURCHASED PUT OPTIONS — 0.54% (continued) | | | |
| | | | | | |
| | | Hess Corporation | | | |
| | 14 | | Expiration: January 2014, Exercise Price: $70.00 | | $ | 133 | |
| | 29 | | Expiration: February 2014, Exercise Price: $70.00 | | | 783 | |
| | | | Huntsman Corporation | | | | |
| | 72 | | Expiration: January 2014, Exercise Price: $14.00 | | | 180 | |
| | 104 | | Expiration: February 2014, Exercise Price: $18.00 | | | 520 | |
| | 71 | | Expiration: February 2014, Exercise Price: $19.00 | | | 532 | |
| | | | Ingersoll-Rand plc | | | | |
| | 12 | | Expiration: January 2014, Exercise Price: $52.50 | | | 60 | |
| | | | International Paper Company | | | | |
| | 42 | | Expiration: January 2014, Exercise Price: $40.00 | | | 189 | |
| | | | Iron Mountain, Inc. | | | | |
| | 75 | | Expiration: January 2014, Exercise Price: $17.50 | | | 187 | |
| | 35 | | Expiration: January 2014, Exercise Price: $20.00 | | | 175 | |
| | 6 | | Expiration: April 2014, Exercise Price: $20.00 | | | 105 | |
| | | | Lamar Advertising Company Class A | | | | |
| | 13 | | Expiration: January 2014, Exercise Price: $39.00 | | | 130 | |
| | 59 | | Expiration: January 2014, Exercise Price: $40.00 | | | 590 | |
| | 30 | | Expiration: April 2014, Exercise Price: $43.00 | | | 2,925 | |
| | | | LinnCo LLC | | | | |
| | 17 | | Expiration: February 2014, Exercise Price: $45.00 | | | 637 | |
| | | | Materials Select Sector SPDR Trust | | | | |
| | 3 | | Expiration: March 2014, Exercise Price: $45.00 | | | 257 | |
| | | | Murphy Oil Corporation | | | | |
| | 5 | | Expiration: January 2014, Exercise Price: $55.00 | | | 25 | |
| | | | National Oilwell Varco, Inc. | | | | |
| | 7 | | Expiration: January 2014, Exercise Price: $70.00 | | | 46 | |
| | 19 | | Expiration: February 2014, Exercise Price: $67.50 | | | 427 | |
| | 7 | | Expiration: February 2014, Exercise Price: $70.00 | | | 245 | |
| | 4 | | Expiration: May 2014, Exercise Price: $70.00 | | | 500 | |
The accompanying notes are an integral part of these financial statements.
The Merger Fund VL
SCHEDULE OF INVESTMENTS (continued)
December 31, 2013
| Contracts (100 shares per contract) | | Value | |
| | | | |
| PURCHASED PUT OPTIONS — 0.54% (continued) | | | |
| | | | | | |
| | | Noble Corporation plc | | | |
| | 4 | | Expiration: March 2014, Exercise Price: $33.00 | | $ | 228 | |
| | 50 | | Expiration: March 2014, Exercise Price: $34.00 | | | 3,800 | |
| | | | Novartis AG — ADR | | | | |
| | 17 | | Expiration: April 2014, Exercise Price: $70.00 | | | 850 | |
| | | | Occidental Petroleum Corporation | | | | |
| | 8 | | Expiration: January 2014, Exercise Price: $87.50 | | | 160 | |
| | 4 | | Expiration: February 2014, Exercise Price: $85.00 | | | 212 | |
| | 12 | | Expiration: February 2014, Exercise Price: $87.50 | | | 1,032 | |
| | | | Oil States International, Inc. | | | | |
| | 24 | | Expiration: March 2014, Exercise Price: $85.00 | | | 2,100 | |
| | 8 | | Expiration: March 2014, Exercise Price: $90.00 | | | 1,200 | |
| | | | ONEOK, Inc. | | | | |
| | 7 | | Expiration: January 2014, Exercise Price: $47.50 | | | 70 | |
| | | | Pfizer, Inc. | | | | |
| | 11 | | Expiration: March 2014, Exercise Price: $26.00 | | | 127 | |
| | 59 | | Expiration: March 2014, Exercise Price: $27.00 | | | 944 | |
| | | | QEP Resources, Inc. | | | | |
| | 85 | | Expiration: March 2014, Exercise Price: $25.00 | | | 3,188 | |
| | | | Safeway, Inc. | | | | |
| | 12 | | Expiration: January 2014, Exercise Price: $28.00 | | | 90 | |
| | | | SLM Corporation | | | | |
| | 7 | | Expiration: January 2014, Exercise Price: $18.00 | | | 7 | |
| | 78 | | Expiration: January 2014, Exercise Price: $20.00 | | | 117 | |
| | 18 | | Expiration: January 2014, Exercise Price: $21.00 | | | 36 | |
| | 15 | | Expiration: April 2014, Exercise Price: $20.00 | | | 210 | |
| | | | SPDR S&P 500 ETF Trust | | | | |
| | 15 | | Expiration: January 2014, Exercise Price: $184.00 | | | 2,115 | |
| | 28 | | Expiration: February 2014, Exercise Price: $174.00 | | | 2,352 | |
| | | | Sprint Corporation | | | | |
| | 100 | | Expiration: February 2014, Exercise Price: $5.00 | | | 250 | |
| | | | | | | | |
The accompanying notes are an integral part of these financial statements.
The Merger Fund VL
SCHEDULE OF INVESTMENTS (continued)
December 31, 2013
| Contracts (100 shares per contract) | | Value | |
| | | | |
| PURCHASED PUT OPTIONS — 0.54% (continued) | | | |
| | | | | | |
| | | Time Warner Cable, Inc. | | | |
| | 3 | | Expiration: January 2014, Exercise Price: $125.00 | | $ | 165 | |
| | 3 | | Expiration: February 2014, Exercise Price: $120.00 | | | 417 | |
| | 4 | | Expiration: April 2014, Exercise Price: $110.00 | | | 350 | |
| | 2 | | Expiration: April 2014, Exercise Price: $115.00 | | | 300 | |
| | 3 | | Expiration: April 2014, Exercise Price: $120.00 | | | 675 | |
| | | | The Timken Company | | | | |
| | 13 | | Expiration: March 2014, Exercise Price: $47.50 | | | 975 | |
| | | | T-Mobile U.S., Inc. | | | | |
| | 69 | | Expiration: January 2014, Exercise Price: $20.00 | | | 69 | |
| | 34 | | Expiration: February 2014, Exercise Price: $20.00 | | | 34 | |
| | 24 | | Expiration: February 2014, Exercise Price: $21.00 | | | 36 | |
| | 28 | | Expiration: February 2014, Exercise Price: $22.00 | | | 210 | |
| | 35 | | Expiration: February 2014, Exercise Price: $24.00 | | | 455 | |
| | | | Transocean, Ltd. | | | | |
| | 8 | | Expiration: February 2014, Exercise Price: $38.00 | | | 92 | |
| | 24 | | Expiration: February 2014, Exercise Price: $43.00 | | | 564 | |
| | | | Valero Energy Corporation | | | | |
| | 26 | | Expiration: January 2014, Exercise Price: $29.00 | | | 26 | |
| | 5 | | Expiration: March 2014, Exercise Price: $32.00 | | | 35 | |
| | | | Visteon Corporation | | | | |
| | 2 | | Expiration: March 2014, Exercise Price: $65.00 | | | 120 | |
| | | | Vivendi SA | | | | |
| | 35 | | Expiration: January 2014, Exercise Price: EUR 15.00 (j) | | | 48 | |
| | | | Vodafone Group plc — ADR | | | | |
| | 8 | | Expiration: January 2014, Exercise Price: $26.00 | | | 20 | |
| | 24 | | Expiration: January 2014, Exercise Price: $29.00 | | | 60 | |
| | 22 | | Expiration: January 2014, Exercise Price: $33.00 | | | 55 | |
| | 13 | | Expiration: April 2014, Exercise Price: $30.00 | | | 130 | |
| | 20 | | Expiration: April 2014, Exercise Price: $33.00 | | | 500 | |
The accompanying notes are an integral part of these financial statements.
The Merger Fund VL
SCHEDULE OF INVESTMENTS (continued)
December 31, 2013
| Contracts (100 shares per contract) | | Value | |
| | | | |
| PURCHASED PUT OPTIONS — 0.54% (continued) | | | |
| | | | | | |
| | | Weyerhaeuser Company | | | |
| | 25 | | Expiration: April 2014, Exercise Price: $24.00 | | $ | 375 | |
| | | | Williams Companies, Inc. | | | | |
| | 9 | | Expiration: January 2014, Exercise Price: $30.00 | | | 54 | |
| | 47 | | Expiration: February 2014, Exercise Price: $30.00 | | | 376 | |
| | | | TOTAL PURCHASED PUT OPTIONS | | | | |
| | | | (Cost $209,317) | | | 102,040 | |
| | | | | | | | |
| Principal Amount | | | | |
| | | | | |
| ESCROW NOTES — 0.70% | | | | |
| $ | 7,668 | | AMR Corporation (a)(d)(k) | | | 102,785 | |
| | 145,000 | | Dallas-Fort Worth International Airport (a)(d)(k) | | | 31,479 | |
| | | | TOTAL ESCROW NOTES | | | | |
| | | | (Cost $111,333) | | | 134,264 | |
| | | | | | | | |
| Shares | | | | | | |
| | | | | |
| SHORT-TERM INVESTMENTS — 24.98% | | | | |
| | 1,084,000 | | BlackRock Liquidity Funds TempFund | | | | |
| | | | Portfolio, Institutional Share Class, 0.05% (c) | | | 1,084,000 | |
| | 1,084,000 | | Fidelity Institutional Government | | | | |
| | | | Portfolio, Institutional Share Class, 0.03% (c)(g) | | | 1,084,000 | |
| | 426,574 | | Fidelity Institutional Money Market | | | | |
| | | | Portfolio, Institutional Share Class, 0.01% (c) | | | 426,574 | |
| | 1,084,000 | | Goldman Sachs Financial Square Money | | | | |
| | | | Market Fund, Institutional Share Class, 0.06% (c)(h) | | | 1,084,000 | |
| | 1,087,000 | | The Liquid Asset Portfolio, Institutional Share Class, 0.07% (c)(g) | | | 1,087,000 | |
| | | | TOTAL SHORT-TERM INVESTMENTS | | | | |
| | | | (Cost $4,765,574) | | | 4,765,574 | |
| | | | TOTAL INVESTMENTS | | | | |
| | | | (Cost $18,660,143) — 103.17% | | $ | 19,683,408 | |
| | | | | | | | |
The accompanying notes are an integral part of these financial statements.
The Merger Fund VL
SCHEDULE OF INVESTMENTS (continued)
December 31, 2013
ADR – American Depository Receipt
ETF – Exchange-Traded Fund
EUR – Euro
plc – Public Limited Company
REIT – Real Estate Investment Trust
| (a) | Non-income producing security. |
| (c) | The rate quoted is the annualized seven-day yield as of December 31, 2013. |
| (d) | Security fair valued by the Adviser in good faith in accordance with the policies adopted by the Board of Trustees. |
| (e) | All or a portion of the shares have been committed as collateral for open securities sold short. |
| (f) | All or a portion of the shares have been committed as collateral for written option contracts. |
| (g) | All or a portion of the shares have been committed as collateral for swap contracts. |
| (h) | All or a portion of the shares have been committed as collateral for forward currency exchange contracts. |
| (i) | Security exempt from registration under Rule 144A of the Securities Act of 1933. These securities may be resold in transactions exempt from registration normally to qualified institutional buyers. As of December 31, 2013, these securities represented 1.15% of total net assets. |
| (j) | Level 2 security. Please see Note 2 on the Notes to the Financial Statements. |
| (k) | Level 3 security. Please see Note 2 on the Notes to the Financial Statements. |
The Global Industry Classification Standard (GICS®) was developed by and/or is the exclusive property of MSCI, Inc. and Standard & Poor Financial Services LLC (“S&P”). GICS is a service mark of MSCI and S&P and has been licensed for use by U.S. Bancorp Funds Services, LLC.
The accompanying notes are an integral part of these financial statements.
The Merger Fund VL
SCHEDULE OF SECURITIES SOLD SHORT
December 31, 2013
| Shares | | | | Value | |
| | | | |
| COMMON STOCKS | | | |
| | 2,798 | | American Realty Capital Properties, Inc. | | $ | 35,982 | |
| | 2,552 | | Applied Materials, Inc. | | | 45,145 | |
| | 1,376 | | Comcast Corporation Class A | | | 71,504 | |
| | 558 | | Community Health Systems, Inc. | | | 21,913 | |
| | 1,042 | | Discovery Communications, Inc. Class A | | | 94,218 | |
| | 3,897 | | Fidelity National Financial, Inc. | | | 126,458 | |
| | 571 | | Liberty Global plc Class A (b) | | | 50,813 | |
| | 1,472 | | Loblaw Companies Ltd. (b)(c) | | | 58,755 | |
| | 2,835 | | M&T Bank Corporation | | | 330,051 | |
| | 269 | | PacWest Bancorp | | | 11,357 | |
| | 1,719 | | Plains All American Pipeline, LP | | | 88,992 | |
| | 2,434 | | Regency Energy Partners, LP | | | 63,917 | |
| | 6,851 | | Twenty-First Century Fox, Inc. Class A | | | 241,018 | |
| | 10,276 | | Umpqua Holdings Corporation | | | 196,682 | |
| | | | | | | 1,436,805 | |
| | | | | | | | |
| CONTINGENT VALUE RIGHTS | | | | |
| | 8,230 | | Health Management Associates, Inc. (a)(d) | | | 823 | |
| | | | | | | | |
| EXCHANGE-TRADED FUNDS | | | | |
| | 168 | | SPDR S&P 500 ETF Trust | | | 31,025 | |
| | | | TOTAL SECURITIES SOLD SHORT | | | | |
| | | | (Proceeds $1,296,505) | | $ | 1,468,653 | |
ETF – Exchange-Traded Fund
plc – Public Limited Company
| (a) | Security fair valued by the Adviser in good faith in accordance with the policies adopted by the Board of Trustees. |
| (c) | Level 2 security. Please see Note 2 on the Notes to the Financial Statements. |
| (d) | Level 3 security. Please see Note 2 on the Notes to the Financial Statements. |
The accompanying notes are an integral part of these financial statements.
The Merger Fund VL
SCHEDULE OF OPTIONS WRITTEN
December 31, 2013
| Contracts (100 shares per contract) | | Value | |
| | | | | | |
| CALL OPTIONS WRITTEN | | | |
| | | | | | |
| | | American Airlines Group, Inc. | | | |
| | 42 | | Expiration: February 2014, Exercise Price: $30.00 | | $ | 840 | |
| | 37 | | Expiration: March 2014, Exercise Price: $30.00 | | | 1,480 | |
| | 26 | | Expiration: April 2014, Exercise Price: $24.00 | | | 7,410 | |
| | | | American International Group, Inc. | | | | |
| | 25 | | Expiration: January 2014, Exercise Price: $46.00 | | | 12,625 | |
| | 18 | | Expiration: January 2014, Exercise Price: $47.00 | | | 7,380 | |
| | 24 | | Expiration: January 2014, Exercise Price: $50.00 | | | 3,504 | |
| | 34 | | Expiration: February 2014, Exercise Price: $47.00 | | | 15,555 | |
| | | | Andarko Petroleum Corporation | | | | |
| | 2 | | Expiration: February 2014, Exercise Price: $77.50 | | | 880 | |
| | 5 | | Expiration: February 2014, Exercise Price: $85.00 | | | 635 | |
| | 16 | | Expiration: February 2014, Exercise Price: $87.50 | | | 1,200 | |
| | 13 | | Expiration: February 2014, Exercise Price: $90.00 | | | 559 | |
| | | | Ashland, Inc. | | | | |
| | 20 | | Expiration: January 2014, Exercise Price: $85.00 | | | 24,300 | |
| | 4 | | Expiration: April 2014, Exercise Price: $90.00 | | | 3,800 | |
| | | | AT&T, Inc. | | | | |
| | 3 | | Expiration: January 2014, Exercise Price: $35.00 | | | 110 | |
| | | | BP plc — ADR | | | | |
| | 12 | | Expiration: February 2014, Exercise Price: $45.00 | | | 4,500 | |
| | 19 | | Expiration: February 2014, Exercise Price: $47.00 | | | 3,800 | |
| | | | Chemtura Corporation | | | | |
| | 33 | | Expiration: March 2014, Exercise Price: $25.00 | | | 11,550 | |
| | | | CommonWealth REIT | | | | |
| | 42 | | Expiration: January 2014, Exercise Price: $22.50 | | | 4,410 | |
| | | | CONSOL Energy, Inc. | | | | |
| | 34 | | Expiration: January 2014, Exercise Price: $36.00 | | | 7,752 | |
| | 18 | | Expiration: April 2014, Exercise Price: $36.00 | | | 6,705 | |
The accompanying notes are an integral part of these financial statements.
The Merger Fund VL
SCHEDULE OF OPTIONS WRITTEN (continued)
December 31, 2013
| Contracts (100 shares per contract) | | Value | |
| | | | | | |
| | | Corrections Corporation of America | | | |
| | 3 | | Expiration: January 2014, Exercise Price: $33.00 | | $ | 67 | |
| | 5 | | Expiration: March 2014, Exercise Price: $32.00 | | | 700 | |
| | 25 | | Expiration: March 2014, Exercise Price: $33.00 | | | 2,375 | |
| | | | DISH Network Corporation Class A | | | | |
| | 8 | | Expiration: January 2014, Exercise Price: $45.00 | | | 10,360 | |
| | 12 | | Expiration: March 2014, Exercise Price: $50.00 | | | 11,280 | |
| | | | Dover Corporation | | | | |
| | 10 | | Expiration: March 2014, Exercise Price: $90.00 | | | 8,000 | |
| | | | The Dow Chemical Company | | | | |
| | 24 | | Expiration: March 2014, Exercise Price: $37.00 | | | 18,720 | |
| | | | E.I. Du Pont de Nemours & Company | | | | |
| | 6 | | Expiration: January 2014, Exercise Price: $57.50 | | | 4,530 | |
| | 24 | | Expiration: January 2014, Exercise Price: $60.00 | | | 12,240 | |
| | 6 | | Expiration: April 2014, Exercise Price: $60.00 | | | 3,402 | |
| | | | Eli Lilly & Company | | | | |
| | 7 | | Expiration: January 2014, Exercise Price: $48.00 | | | 2,170 | |
| | 2 | | Expiration: April 2014, Exercise Price: $49.00 | | | 574 | |
| | | | Endo Health Solutions, Inc. | | | | |
| | 9 | | Expiration: April 2014, Exercise Price: $55.00 | | | 13,041 | |
| | 5 | | Expiration: April 2014, Exercise Price: $60.00 | | | 5,250 | |
| | | | Equinix, Inc. | | | | |
| | 2 | | Expiration: January 2014, Exercise Price: $160.00 | | | 3,580 | |
| | 6 | | Expiration: January 2014, Exercise Price: $180.00 | | | 1,875 | |
| | 8 | | Expiration: March 2014, Exercise Price: $165.00 | | | 14,120 | |
| | | | General Motors Company | | | | |
| | 70 | | Expiration: March 2014, Exercise Price: $37.00 | | | 32,200 | |
| | 43 | | Expiration: March 2014, Exercise Price: $40.00 | | | 11,309 | |
| | | | Halliburton Company | | | | |
| | 17 | | Expiration: February 2014, Exercise Price: $50.00 | | | 4,029 | |
| | | | Hess Corporation | | | | |
| | 14 | | Expiration: January 2014, Exercise Price: $80.00 | | | 4,935 | |
| | 30 | | Expiration: February 2014, Exercise Price: $77.50 | | | 19,725 | |
The accompanying notes are an integral part of these financial statements.
The Merger Fund VL
SCHEDULE OF OPTIONS WRITTEN (continued)
December 31, 2013
| Contracts (100 shares per contract) | | Value | |
| | | | | | |
| | | Huntsman Corporation | | | |
| | 104 | | Expiration: February 2014, Exercise Price: $21.00 | | $ | 39,520 | |
| | 71 | | Expiration: February 2014, Exercise Price: $22.00 | | | 19,880 | |
| | | | Ingersoll-Rand plc | | | | |
| | 14 | | Expiration: January 2014, Exercise Price: $60.00 | | | 22,862 | |
| | | | International Paper Company | | | | |
| | 42 | | Expiration: January 2014, Exercise Price: $44.00 | | | 21,315 | |
| | | | Iron Mountain, Inc. | | | | |
| | 6 | | Expiration: April 2014, Exercise Price: $25.00 | | | 3,660 | |
| | | | Koninklijke KPN NV | | | | |
| | 274 | | Expiration: February 2014, Exercise Price: EUR 2.20 (a) | | | 7,162 | |
| | 265 | | Expiration: February 2014, Exercise Price: EUR 2.30 (a) | | | 4,375 | |
| | | | Lamar Advertising Company Class A | | | | |
| | 45 | | Expiration: January 2014, Exercise Price: $46.00 | | | 29,250 | |
| | 32 | | Expiration: April 2014, Exercise Price: $48.00 | | | 18,880 | |
| | 27 | | Expiration: April 2014, Exercise Price: $49.00 | | | 13,500 | |
| | | | Leap Wireless International, Inc. | | | | |
| | 87 | | Expiration: January 2014, Exercise Price: $16.00 | | | 12,528 | |
| | 13 | | Expiration: January 2014, Exercise Price: $17.00 | | | 585 | |
| | 1 | | Expiration: April 2014, Exercise Price: $16.00 | | | 160 | |
| | | | LinnCo LLC | | | | |
| | 34 | | Expiration: February 2014, Exercise Price: $50.00 | | | 9,010 | |
| | | | Murphy Oil Corporation | | | | |
| | 5 | | Expiration: January 2014, Exercise Price: $65.00 | | | 5,235 | |
| | | | National Oilwell Varco, Inc. | | | | |
| | 8 | | Expiration: January 2014, Exercise Price: $77.50 | | | 2,024 | |
| | 5 | | Expiration: February 2014, Exercise Price: $77.50 | | | 1,900 | |
| | 15 | | Expiration: February 2014, Exercise Price: $80.00 | | | 3,540 | |
| | 7 | | Expiration: February 2014, Exercise Price: $82.50 | | | 938 | |
| | 5 | | Expiration: May 2014, Exercise Price: $77.50 | | | 2,625 | |
The accompanying notes are an integral part of these financial statements.
The Merger Fund VL
SCHEDULE OF OPTIONS WRITTEN (continued)
December 31, 2013
| Contracts (100 shares per contract) | | Value | |
| | | | | | |
| | | Noble Corporation plc | | | |
| | 5 | | Expiration: March 2014, Exercise Price: $35.00 | | $ | 1,625 | |
| | 28 | | Expiration: March 2014, Exercise Price: $36.00 | | | 7,336 | |
| | 29 | | Expiration: March 2014, Exercise Price: $37.00 | | | 5,916 | |
| | | | NorthStar Realty Finance Corporation | | | | |
| | 40 | | Expiration: March 2014, Exercise Price: $11.00 | | | 9,800 | |
| | 43 | | Expiration: March 2014, Exercise Price: $12.50 | | | 5,074 | |
| | | | Novartis AG — ADR | | | | |
| | 17 | | Expiration: April 2014, Exercise Price: $75.00 | | | 9,605 | |
| | | | Occidental Petroleum Corporation | | | | |
| | 8 | | Expiration: January 2014, Exercise Price: $95.00 | | | 1,464 | |
| | 4 | | Expiration: February 2014, Exercise Price: $92.50 | | | 1,860 | |
| | 12 | | Expiration: February 2014, Exercise Price: $95.00 | | | 3,900 | |
| | | | Oil States International, Inc. | | | | |
| | 4 | | Expiration: March 2014, Exercise Price: $95.00 | | | 3,760 | |
| | 25 | | Expiration: March 2014, Exercise Price: $100.00 | | | 15,000 | |
| | 4 | | Expiration: March 2014, Exercise Price: $105.00 | | | 1,520 | |
| | | | ONEOK, Inc. | | | | |
| | 7 | | Expiration: January 2014, Exercise Price: $52.50 | | | 6,776 | |
| | | | Pfizer, Inc. | | | | |
| | 12 | | Expiration: March 2014, Exercise Price: $30.00 | | | 1,404 | |
| | 59 | | Expiration: March 2014, Exercise Price: $31.00 | | | 3,747 | |
| | | | QEP Resources, Inc. | | | | |
| | 81 | | Expiration: March 2014, Exercise Price: $30.00 | | | 17,820 | |
| | | | Safeway, Inc. | | | | |
| | 12 | | Expiration: January 2014, Exercise Price: $32.00 | | | 1,320 | |
| | | | SLM Corporation | | | | |
| | 96 | | Expiration: January 2014, Exercise Price: $25.00 | | | 13,488 | |
| | 15 | | Expiration: April 2014, Exercise Price: $25.00 | | | 2,820 | |
| | | | Sprint Corporation | | | | |
| | 41 | | Expiration: February 2014, Exercise Price: $6.00 | | | 19,475 | |
| | 69 | | Expiration: February 2014, Exercise Price: $7.00 | | | 26,220 | |
The accompanying notes are an integral part of these financial statements.
The Merger Fund VL
SCHEDULE OF OPTIONS WRITTEN (continued)
December 31, 2013
| Contracts (100 shares per contract) | | Value | |
| | | | | | |
| | | Time Warner Cable, Inc. | | | |
| | 4 | | Expiration: January 2014, Exercise Price: $130.00 | | $ | 2,560 | |
| | 3 | | Expiration: February 2014, Exercise Price: $135.00 | | | 1,590 | |
| | 10 | | Expiration: April 2014, Exercise Price: $125.00 | | | 13,380 | |
| | 8 | | Expiration: April 2014, Exercise Price: $130.00 | | | 7,800 | |
| | | | The Timken Company | | | | |
| | 14 | | Expiration: March 2014, Exercise Price: $52.50 | | | 6,020 | |
| | 3 | | Expiration: March 2014, Exercise Price: $55.00 | | | 855 | |
| | | | T-Mobile U.S., Inc. | | | | |
| | 34 | | Expiration: January 2014, Exercise Price: $23.00 | | | 36,176 | |
| | 28 | | Expiration: February 2014, Exercise Price: $24.00 | | | 26,992 | |
| | 43 | | Expiration: February 2014, Exercise Price: $25.00 | | | 37,517 | |
| | 9 | | Expiration: February 2014, Exercise Price: $26.00 | | | 7,191 | |
| | 42 | | Expiration: February 2014, Exercise Price: $28.00 | | | 24,570 | |
| | | | Transocean, Ltd. | | | | |
| | 8 | | Expiration: February 2014, Exercise Price: $47.00 | | | 2,480 | |
| | 16 | | Expiration: February 2014, Exercise Price: $48.00 | | | 3,968 | |
| | | | Valero Energy Corporation | | | | |
| | 8 | | Expiration: March 2014, Exercise Price: $36.00 | | | 11,616 | |
| | | | Verizon Communications, Inc. | | | | |
| | 7 | | Expiration: April 2014, Exercise Price: $43.00 | | | 4,298 | |
| | | | Visteon Corporation | | | | |
| | 3 | | Expiration: March 2014, Exercise Price: $75.00 | | | 2,640 | |
| | | | Vivendi SA | | | | |
| | 35 | | Expiration: January 2014, Exercise Price: EUR 17.50 (a) | | | 8,185 | |
| | | | Vodafone Group plc — ADR | | | | |
| | 22 | | Expiration: January 2014, Exercise Price: $37.00 | | | 5,170 | |
| | 11 | | Expiration: April 2014, Exercise Price: $36.00 | | | 4,455 | |
| | 35 | | Expiration: April 2014, Exercise Price: $37.00 | | | 11,550 | |
| | | | Weyerhaeuser Company | | | | |
| | 25 | | Expiration: April 2014, Exercise Price: $29.00 | | | 7,625 | |
| | | | | | | | |
The accompanying notes are an integral part of these financial statements.
The Merger Fund VL
SCHEDULE OF OPTIONS WRITTEN (continued)
December 31, 2013
| Contracts (100 shares per contract) | | Value | |
| | | | | | |
| | | Williams Companies, Inc. | | | |
| | 9 | | Expiration: January 2014, Exercise Price: $34.00 | | $ | 4,203 | |
| | 47 | | Expiration: February 2014, Exercise Price: $34.00 | | | 22,795 | |
| | | | | | | 935,992 | |
| PUT OPTIONS WRITTEN | | | | |
| | | | | | | | |
| | | | American Realty Capital Properties, Inc. | | | | |
| | 6 | | Expiration: April 2014, Exercise Price: $12.50 | | | 420 | |
| | | | SPDR S&P 500 ETF Trust | | | | |
| | 10 | | Expiration: January 2014, Exercise Price: $174.00 | | | 240 | |
| | 21 | | Expiration: February 2014, Exercise Price: $169.00 | | | 1,071 | |
| | | | | | | 1,731 | |
| | | | TOTAL OPTIONS WRITTEN | | | | |
| | | | (Premiums received $679,643) | | $ | 937,723 | |
ADR – American Depository Receipt
ETF – Exchange-Traded Fund
EUR – Euro
plc – Public Limited Company
REIT – Real Estate Investment Trust
| (a) | Level 2 Security. Please see Note 2 on the Notes to the Financial Statements. |
The accompanying notes are an integral part of these financial statements.
The Merger Fund VL
SCHEDULE OF FORWARD CURRENCY EXCHANGE CONTRACTS*
December 31, 2013
| | | | | | | | | | | | | | | | | | |
| | | | | | | U.S. | | | | | | | U.S. | | | | |
| | | | | | | $ Value at | | | | | | | $ Value at | | | Unrealized | |
| Settlement | Currency to | | December 31, | | | Currency to | | December 31, | | | Appreciation | |
| Date | be Delivered | | 2013 | | | be Received | | 2013 | | | (Depreciation)** | |
| 1/15/14 | | | 200,021 | | Australian Dollars | | $ | 178,420 | | | | 178,964 | | U.S. Dollars | | $ | 178,964 | | | $ | 544 | |
| 1/15/14 | | | 71,077 | | U.S. Dollars | | | 71,077 | | | | 79,780 | | Australian Dollars | | | 71,164 | | | | 87 | |
| 3/14/14 | | | 22,596 | | Australian Dollars | | | 20,080 | | | | 20,110 | | U.S. Dollars | | | 20,110 | | | | 30 | |
| 4/9/14 | | | 257,145 | | British Pounds | | | 425,514 | | | | 402,525 | | U.S. Dollars | | | 402,525 | | | | (22,989 | ) |
| 4/9/14 | | | 419,249 | | U.S. Dollars | | | 419,249 | | | | 257,145 | | British Pounds | | | 425,514 | | | | 6,265 | |
| 5/6/14 | | | 257,145 | | British Pounds | | | 425,417 | | | | 419,146 | | U.S. Dollars | | | 419,146 | | | | (6,271 | ) |
| 1/30/14 | | | 81,942 | | Canadian Dollars | | | 77,082 | | | | 78,376 | | U.S. Dollars | | | 78,376 | | | | 1,294 | |
| 2/12/14 | | | 85,554 | | Canadian Dollars | | | 80,455 | | | | 81,788 | | U.S. Dollars | | | 81,788 | | | | 1,333 | |
| 3/13/14 | | | 900 | | Canadian Dollars | | | 846 | | | | 858 | | U.S. Dollars | | | 858 | | | | 12 | |
| 3/14/14 | | | 3,828 | | Canadian Dollars | | | 3,597 | | | | 3,607 | | U.S. Dollars | | | 3,607 | | | | 10 | |
| 1/9/14 | | | 153,176 | | Euros | | | 210,722 | | | | 207,792 | | U.S. Dollars | | | 207,792 | | | | (2,930 | ) |
| 1/15/14 | | | 268,308 | | Euros | | | 369,107 | | | | 351,067 | | U.S. Dollars | | | 351,067 | | | | (18,040 | ) |
| 1/15/14 | | | 364,419 | | U.S. Dollars | | | 364,419 | | | | 268,308 | | Euros | | | 369,107 | | | | 4,688 | |
| 2/5/14 | | | 61,250 | | Euros | | | 84,260 | | | | 82,781 | | U.S. Dollars | | | 82,781 | | | | (1,479 | ) |
| 3/19/14 | | | 79,436 | | Euros | | | 109,278 | | | | 107,601 | | U.S. Dollars | | | 107,601 | | | | (1,677 | ) |
| 3/19/14 | | | 107,445 | | U.S. Dollars | | | 107,445 | | | | 79,436 | | Euros | | | 109,278 | | | | 1,833 | |
| 5/15/14 | | | 1,077,070 | | Hong Kong Dollars | | | 138,918 | | | | 138,958 | | U.S. Dollars | | | 138,958 | | | | 40 | |
| | | | | | | | $ | 3,085,886 | | | | | | | | $ | 3,048,636 | | | $ | (37,250 | ) |
| * | JPMorgan Chase & Co. Inc. is the counterparty for all open forward currency exchange contracts held by the Fund as of December 31, 2013. |
| ** | Unrealized appreciation is a receivable and unrealized depreciation is a payable on the Statement of Assets and Liabilities. |
The accompanying notes are an integral part of these financial statements.
The Merger Fund VL
SCHEDULE OF SWAP CONTRACTS
December 31, 2013
| | | | | | | | | | | Unrealized | | |
| Termination | | | | | | | | | | Appreciation | | |
| Date | | Security | | Shares | | | Notional | | | (Depreciation)* | | Counterparty |
| |
| LONG TOTAL RETURN SWAP CONTRACTS |
| 10/10/14 | | Ainsworth Lumber Company, Ltd. | | | 44,100 | | | $ | 172,835 | | | $ | 6,121 | | Merrill Lynch & Co. Inc. |
| 5/17/14 | | GrainCorp, Ltd. | | | 14,146 | | | | 107,627 | | | | (18,591 | ) | JPMorgan Chase & Co. Inc. |
| 10/18/14 | | Hillgrove Resources, Ltd. | | | 113,277 | | | | 8,982 | | | | 444 | | JPMorgan Chase & Co. Inc. |
| 7/29/14 | | Invensys plc | | | 68,881 | | | | 578,053 | | | | 43,611 | | JPMorgan Chase & Co. Inc. |
| 8/28/14 | | Koninklijke KPN NV | | | 67,508 | | | | 218,270 | | | | 2,688 | | JPMorgan Chase & Co. Inc. |
| 11/5/14 | | Paladin Labs | | | 776 | | | | 85,914 | | | | 15,496 | | Merrill Lynch & Co. Inc. |
| 6/20/14 | | Vivendi SA | | | 3,500 | | | | 92,105 | | | | 20,324 | | JPMorgan Chase & Co. Inc. |
| | | | | | | | | | | | | | | | |
| |
| SHORT TOTAL RETURN SWAP CONTRACTS |
| 11/5/14 | | Endo Health Solutions, Inc. | | | (1,267 | ) | | | (84,813 | ) | | | (14,192 | ) | Merrill Lynch & Co. Inc. |
| 10/10/14 | | Louisiana Pacific Corporation | | | (5,025 | ) | | | (93,716 | ) | | | (5,018 | ) | Merrill Lynch & Co. Inc. |
| 10/10/14 | | Publicis Groupe (a) | | | (8,022 | ) | | | (725,902 | ) | | | (51,995 | ) | Merrill Lynch & Co. Inc. |
| 7/31/14 | | Schneider Electric SA | | | (1,786 | ) | | | (156,256 | ) | | | (8,549 | ) | JPMorgan Chase & Co. Inc. |
| | | | | | | | | | | | | $ | (9,661 | ) | |
plc – Public Limited Company
| * | Based on the net value of each counterparty, unrealized appreciation is a receivable and unrealized depreciation is a payable on the Statement of Assets and Liabilities. |
| (a) | Security fair valued by the Adviser in good faith in accordance with the policies adopted by the Board of Trustees. |
The accompanying notes are an integral part of these financial statements.
The Merger Fund VL
STATEMENT OF ASSETS AND LIABILITIES
December 31, 2013
| ASSETS: | | | | | | |
| Investments, at value (Cost $18,660,143) | | | | | $ | 19,683,408 | |
| Receivable from brokers | | | | | | 1,296,505 | |
| Deposits at brokers | | | | | | 738,392 | |
| Receivable for investments sold | | | | | | 102,441 | |
| Receivable for forward currency exchange contracts | | | | | | 16,136 | |
| Receivable for swap contracts | | | | | | 39,927 | |
| Dividends and interest receivable | | | | | | 80,570 | |
| Receivable from investment advisor | | | | | | 3,508 | |
| Prepaid expenses and other receivables | | | | | | 44 | |
| Total Assets | | | | | | 21,960,931 | |
| | | | | | | | |
| LIABILITIES: | | | | | | | |
| Securities sold short, at value (proceeds of $1,296,505) | | $ | 1,468,653 | | | | | |
| Written option contracts, at value (premiums received $679,643) | | | 937,723 | | | | | |
| Payable to custodian | | | 142 | | | | | |
| Payable for forward currency exchange contracts | | | 53,386 | | | | | |
| Payable for swap contracts | | | 49,588 | | | | | |
| Payable for investments purchased | | | 282,809 | | | | | |
| Payable for fund shares redeemed | | | 8,794 | | | | | |
| Dividends and interest payable | | | 5,803 | | | | | |
| Accrued expenses and other liabilities | | | 75,841 | | | | | |
| Total Liabilities | | | | | | | 2,882,739 | |
| NET ASSETS | | | | | | $ | 19,078,192 | |
| | | | | | | | | |
| NET ASSETS CONSISTS OF: | | | | | | | | |
| Accumulated undistributed net investment income | | | | | | $ | 340,348 | |
| Accumulated net realized loss on investments, securities sold short, | | | | | | | | |
| written option contracts expired or closed, swap contracts, foreign | | | | | | | | |
| currency translation and forward currency exchange contracts | | | | | | | (320,972 | ) |
| Net unrealized appreciation (depreciation) on: | | | | | | | | |
| Investments | | $ | 1,023,265 | | | | | |
| Securities sold short | | | (172,148 | ) | | | | |
| Written option contracts | | | (258,080 | ) | | | | |
| Swap contracts | | | (9,661 | ) | | | | |
| Forward currency exchange contracts | | | (37,250 | ) | | | | |
| Net unrealized appreciation | | | | | | | 546,126 | |
| Paid-in capital | | | | | | | 18,512,690 | |
| Total Net Assets | | | | | | $ | 19,078,192 | |
| | | | | | | | | |
| NET ASSET VALUE and offering price per share* | | | | | | | | |
| ($19,078,192 / 1,746,612 shares of beneficial interest outstanding) | | | | | | $ | 10.92 | |
*The redemption price per share may vary based on the length of time a shareholder holds Fund shares.
The accompanying notes are an integral part of these financial statements.
The Merger Fund VL
STATEMENT OF OPERATIONS
For the Year Ended December 31, 2013
| INVESTMENT INCOME: | | | | | | |
| Interest | | | | | $ | 80,029 | |
| Dividend income on long positions (net of foreign withholding taxes of $214) | | | | | | 218,611 | |
| Total investment income | | | | | | 298,640 | |
| | | | | | | | |
| EXPENSES: | | | | | | | |
| Investment advisory fees | | $ | 206,301 | | | | | |
| Professional fees | | | 88,321 | | | | | |
| Transfer agent and shareholder servicing agent fees | | | 53,730 | | | | | |
| Fund accounting expense | | | 49,173 | | | | | |
| Administration fees | | | 26,416 | | | | | |
| Reports to shareholders | | | 7,964 | | | | | |
| Trustees’ fees and expenses | | | 7,178 | | | | | |
| Custody fees | | | 5,180 | | | | | |
| Miscellaneous expenses | | | 2,576 | | | | | |
| Federal and state registration fees | | | 911 | | | | | |
| Borrowing expense on securities sold short | | | 12,776 | | | | | |
| Dividends on securities sold short | | | 28,157 | | | | | |
| Total expenses before expense waiver by adviser | | | | | | | 488,683 | |
| Less: Expense reimbursed by Adviser (Note 3) | | | | | | | (216,693 | ) |
| Net expenses | | | | | | | 271,990 | |
| NET INVESTMENT INCOME | | | | | | | 26,650 | |
| | | | | | | | | |
| REALIZED AND UNREALIZED GAIN (LOSS) ON INVESTMENTS: | | | | | | | | |
| Realized gain (loss) on: | | | | | | | | |
| Investments | | | 658,929 | | | | | |
| Securities sold short | | | (251,651 | ) | | | | |
| Written option contracts expired or closed | | | (105,358 | ) | | | | |
| Swap contracts | | | (129,314 | ) | | | | |
| Foreign currency translation | | | 2,401 | | | | | |
| Forward currency exchange contracts | | | 58,039 | | | | | |
| Net realized gain | | | | | | | 233,046 | |
| Change in unrealized appreciation (depreciation) on: | | | | | | | | |
| Investments | | | 758,403 | | | | | |
| Securities sold short | | | (45,475 | ) | | | | |
| Written option contracts | | | (270,875 | ) | | | | |
| Swap contracts | | | (17,580 | ) | | | | |
| Foreign currency translation | | | 2,043 | | | | | |
| Forward currency exchange contracts | | | (26,022 | ) | | | | |
| Net unrealized appreciation | | | | | | | 400,494 | |
| NET REALIZED AND UNREALIZED GAIN ON INVESTMENTS | | | | | | | 633,540 | |
| NET INCREASE IN NET ASSETS RESULTING FROM OPERATIONS | | | | | | $ | 660,190 | |
The accompanying notes are an integral part of these financial statements.
The Merger Fund VL
STATEMENTS OF CHANGES IN NET ASSETS
| | | Year Ended | | | Year Ended | |
| | | December 31, 2013 | | | December 31, 2012 | |
| | | | | | | |
| Net investment income (loss) | | $ | 26,650 | | | $ | (61,443 | ) |
| Net realized gain (loss) on investments, securities sold short, | | | | | | | | |
| written option contracts expired or closed, swap contracts, | | | | | | | | |
| foreign currency translation and forward currency exchange contracts | | | 233,046 | | | | (99,027 | ) |
| Change in unrealized appreciation on investments, | | | | | | | | |
| securities sold short, written option contracts, swap contracts, | | | | | | | | |
| foreign currency translation and forward currency exchange contracts | | | 400,494 | | | | 496,501 | |
| Net increase in net assets resulting from operations | | | 660,190 | | | | 336,031 | |
| | | | | | | | | |
| Distributions to shareholders from: (Note 5) | | | | | | | | |
| Net investment income | | | (49,575 | ) | | | — | |
| Net realized gains | | | — | | | | (218,179 | ) |
| Total dividends and distributions | | | (49,575 | ) | | | (218,179 | ) |
| Net increase (decrease) in net assets | | | | | | | | |
| from capital share transactions (Note 4) | | | 4,083,274 | | | | (59,922 | ) |
| Net increase in net assets | | | 4,693,889 | | | | 57,930 | |
| | | | | | | | | |
| NET ASSETS: | | | | | | | | |
| Beginning of year | | | 14,384,303 | | | | 14,326,373 | |
| End of year (including accumulated undistributed net | | | | | | | | |
| investment income of $340,348 and $52,116, respectively) | | $ | 19,078,192 | | | $ | 14,384,303 | |
The accompanying notes are an integral part of these financial statements.
The Merger Fund VL
FINANCIAL HIGHLIGHTS
Selected per share data is based on a share of beneficial interest outstanding throughout each year.
| | | | | | | | | | | | | | | | |
| | | Year Ended December 31, | |
| | | 2013 | | | 2012 | | | 2011 | | | 2010(1) | | | 2009(1) | |
| Per Share Data: | | | | | | | | | | | | | | | |
| Net Asset Value, beginning of year | | $ | 10.54 | | | $ | 10.44 | | | $ | 11.03 | | | $ | 10.70 | | | $ | 9.88 | |
| | | | | | | | | | | | | | | | | | | | | |
| Income from investment operations: | | | | | | | | | | | | | | | | | | | | |
| Net investment income (loss) | | | 0.02 | (2) | | | (0.04 | )(2) | | | (0.13 | )(2) | | | 0.02 | (3) | | | (0.35 | )(3) |
| Net realized and unrealized gain on investments | | | 0.39 | | | | 0.30 | | | | 0.23 | | | | 0.54 | | | | 1.53 | |
| Total from investment operations | | | 0.41 | | | | 0.26 | | | | 0.10 | | | | 0.56 | | | | 1.18 | |
| | | | | | | | | | | | | | | | | | | | | |
| Less distributions: | | | | | | | | | | | | | | | | | | | | |
| Distributions from net investment income | | | (0.03 | ) | | | — | | | | — | | | | — | | | | (0.35 | ) |
| Distributions from net realized gains | | | — | | | | (0.16 | ) | | | (0.69 | ) | | | (0.23 | ) | | | (0.01 | ) |
| Total dividends and distributions | | | (0.03 | ) | | | (0.16 | ) | | | (0.69 | ) | | | (0.23 | ) | | | (0.36 | ) |
| Net Asset Value, end of year | | $ | 10.92 | | | $ | 10.54 | | | $ | 10.44 | | | $ | 11.03 | | | $ | 10.70 | |
| | | | | | | | | | | | | | | | | | | | | |
| Total Return | | | 3.88 | % | | | 2.52 | % | | | 0.87 | % | | | 5.30 | % | | | 11.80 | % |
| Supplemental data and ratios: | | | | | | | | | | | | | | | | | | | | |
| Net assets, end of year (000’s) | | $ | 19,078 | | | $ | 14,384 | | | $ | 14,326 | | | $ | 14,817 | | | $ | 9,710 | |
| Ratio of gross expenses to average net assets: | | | | | | | | | | | | | | | | | | | | |
| Before expense waiver | | | 2.96 | % | | | 3.06 | % | | | 3.44 | % | | | 5.26 | % | | | 7.82 | % |
| After expense waiver | | | 1.65 | % | | | 1.92 | % | | | 2.19 | % | | | 3.16 | % | | | 4.28 | % |
| Ratio of dividends on short positions and borrowing | | | | | | | | | | | | | | | | | | | | |
| expense on securities sold short to average net assets | | | 0.25 | % | | | 0.52 | % | | | 0.79 | % | | | 1.76 | % | | | 2.88 | % |
| Ratio of operating expense to average net assets | | | | | | | | | | | | | | | | | | | | |
| excluding dividends on short positions and | | | | | | | | | | | | | | | | | | | | |
| borrowing expense on securities sold short | | | 1.40 | % | | | 1.40 | % | | | 1.40 | % | | | 1.40 | % | | | 1.40 | % |
| Ratio of net investment income (loss) to average net assets: | | | | | | | | | | | | | | | | | | | | |
| Before expense waiver | | | (1.15 | )% | | | (1.57 | )% | | | (2.44 | )% | | | (4.29 | )% | | | (5.69 | )% |
| After expense waiver | | | 0.16 | % | | | (0.43 | )% | | | (1.19 | )% | | | (2.19 | )% | | | (2.15 | )% |
Portfolio turnover rate(4) | | | 195.96 | % | | | 268.78 | % | | | 272.58 | % | | | 187.18 | % | | | 373.07 | % |
| (1) | Performance data included for periods prior to 2011 reflect that of Westchester Capital Management, Inc. the Fund’s prior investment adviser. See Note 1 for additional information. |
| (2) | Net investment income (loss) per share has been calculated based on average shares outstanding during the year. |
| (3) | Net investment income (loss) per share is calculated using ending balance after consideration of adjustments for permanent book and tax differences. |
| (4) | The numerator for the portfolio turnover rate includes the lesser of purchases or sales (excluding short positions). The denominator includes the average long positions throughout the year. |
The accompanying notes are an integral part of these financial statements.
The Merger Fund VL
NOTES TO THE FINANCIAL STATEMENTS
December 31, 2013
Note 1 — ORGANIZATION
The Merger Fund VL (the “Fund”) is a no-load, open-end, diversified investment company organized as a statutory trust under the laws of Delaware on November 22, 2002, and registered under the Investment Company Act of 1940, as amended (the “1940 Act”). The Fund commenced operations on May 26, 2004. In a transaction that closed on December 31, 2010, Westchester Capital Management, Inc. transferred substantially all of its business and assets to Westchester Capital Management, LLC (the “Adviser”), which became the Fund’s investment adviser. Therefore, the performance information included herein for periods prior to 2011 reflect the performance of Westchester Capital Management, Inc. Messrs. Behren and Shannon, the Fund’s current portfolio managers, assumed portfolio management duties for the Fund in January 2007. The investment objective of the Fund is to seek to achieve capital growth by engaging in merger arbitrage. Merger arbitrage is a highly specialized investment approach generally designed to profit from the successful completion of publicly announced mergers, takeovers, tender offers, leveraged buyouts, liquidations and other types of corporate reorganizations. The Fund’s shares are currently offered only to separate accounts funding variable annuity and variable life insurance contracts. At December 31, 2013, 99.5% of the shares outstanding of the Fund were owned by three insurance companies. Activities of these shareholders may have a significant effect on the operations of the Fund.
Note 2 — SIGNIFICANT ACCOUNTING POLICIES
The following is a summary of significant accounting policies followed by the Fund in the preparation of its financial statements. These policies are in conformity with U.S. generally accepted accounting principles (“GAAP”). In preparing these financial statements, the Fund has evaluated events and transactions for potential recognition or disclosure through the date the financial statements were available to be issued. The presentation of financial statements in conformity with GAAP requires management to make estimates and assumptions that affect the reported amount of assets and liabilities at the date of the financial statements and the reported amounts of revenues and expenses during the reporting period. Actual results could differ from those estimates and assumptions.
A.Investment Valuation
Securities listed on the NASDAQ are valued at the NASDAQ Official Closing Price (“NOCP”). Investments in registered open-end investment companies other than exchange-traded funds are valued at their reported net asset value (“NAV”). Equity securities that are traded on a national securities exchange are valued at the last sale price at the close of that exchange. The securities
The Merger Fund VL
NOTES TO THE FINANCIAL STATEMENTS (continued)
December 31, 2013
Note 2 — SIGNIFICANT ACCOUNTING POLICIES (continued)
valued using quoted prices in active markets are classified as Level 1 investments. Securities not listed on an exchange, but for which market transaction prices are reported, are valued at the last sale price as of the close of the New York Stock Exchange. Non-exchange listed securities are valued based on evaluations provided by a third party, when available, or at the mean of the closing bid and asked prices or valued based on the announced price. These securities are classified as Level 2 investments. In pricing corporate bonds and other debt securities that are not obligations of the U.S. Government or its agencies, the mean of the reported closing bid and asked prices is used. These are classified as Level 2 investments. As a secondary source, an individual broker bid may be used to value debt securities if the Adviser reasonably believes such bid is an actionable bid in that the broker would be willing to transact at that price. These securities are generally classified as Level 2 or Level 3 investments.
Exchange-traded options are valued at the higher of the intrinsic value of the option (i.e., what the Fund would pay or can receive upon exercising the option) or the last reported composite sale price. If no sales are reported or if the last sale is outside the bid and asked parameters, the higher of the intrinsic value of the option or the mean between the last reported bid and asked price is used. Non-exchange-traded options will be valued at the higher of the intrinsic value of the option or at the price supplied by the counterparty. Options for which there is an active market are classified as Level 1 investments, but options not listed on an exchange are classified as Level 2 investments. Investments in United States government securities (other than short-term securities) are valued at the mean between the 4:00 PM bid and asked prices supplied by a third party vendor. Short-term fixed-income securities having a maturity of less than 60 days are valued at amortized cost. Registered open-end investment companies other than exchange-traded funds (i.e., ETFs) are valued at their reported NAV per share.
Securities for which there are no market quotations readily available or for which such quotations are unreliable are valued at fair value as determined in accordance with procedures adopted by the Board of Trustees and under the supervision of the Board of Trustees. The factors for fair valuation the Adviser may consider include, among other things: fundamental analytical data; the nature and duration of restrictions on disposition; an evaluation of forces that influence the market in which the securities are purchased and sold; public trading in similar securities of the issuer or comparable issuers. When fair-value pricing is employed, the prices of securities used by the Fund to calculate its NAV may differ from quoted or published prices for the same securities. These securities are generally classified as Level 2 or 3 depending on the inputs as described below. At December 31, 2013, securities fair valued in good faith based on the
NOTES TO THE FINANCIAL STATEMENTS (continued)
December 31, 2013
Note 2 — SIGNIFICANT ACCOUNTING POLICIES (continued)
absolute value of long investments and securities sold short and based on the absolute value of unrealized gains or losses on swap contracts represented 4.78% of net assets.
The Fund has performed an analysis of all existing investments to determine the significance and character of all inputs to their fair value determination. Various inputs are used in determining the value of the Fund’s investments. These inputs are summarized in the three broad levels listed below:
| | Level 1 — | Quoted prices in active markets for identical securities. |
| | | |
| | Level 2 — | Other significant observable inputs (including quoted prices for similar securities, interest rates, prepayment speeds, credit risk, etc.). |
| | | |
| | Level 3 — | Model derived valuations in which one or more significant inputs or significant value drivers are unobservable. Unobservable inputs are those inputs that reflect the Fund’s own assumptions that market participants would use to price the asset or liability based on the best available information. |
The inputs or methodology used for valuing securities are not an indication of the risk associated with investing in those securities.
The Merger Fund VL
NOTES TO THE FINANCIAL STATEMENTS (continued)
December 31, 2013
Note 2 — SIGNIFICANT ACCOUNTING POLICIES (continued)
The following tables provide the fair value measurements of applicable Fund assets and liabilities by level within the fair value hierarchy for the Fund as of December 31, 2013. These assets and liabilities are measured on a recurring basis.
| | | Level 1 | | | Level 2 | | | Level 3 | | | Total | |
| Assets | | | | | | | | | | | | |
| Common Stocks* | | $ | 12,612,548 | | | $ | 948,455 | | | $ | — | | | $ | 13,561,003 | |
| Preferred Stocks | | | 95,748 | | | | — | | | | — | | | | 95,748 | |
| Warrants | | | 10 | | | | — | | | | — | | | | 10 | |
| Corporate Bonds | | | — | | | | 854,283 | | | | — | | | | 854,283 | |
| Municipal Bonds | | | — | | | | 170,486 | | | | — | | | | 170,486 | |
| Purchased Put Options | | | 101,992 | | | | 48 | | | | — | | | | 102,040 | |
| Escrow Notes | | | — | | | | — | | | | 134,264 | | | | 134,264 | |
| Short-Term Investments | | | 4,765,574 | | | | — | | | | — | | | | 4,765,574 | |
| Swap Contracts** | | | — | | | | 39,927 | | | | — | | | | 39,927 | |
| Forward Currency Exchange Contracts** | | | — | | | | 16,136 | | | | — | | | | 16,136 | |
| Liabilities | | | | | | | | | | | | | | | | |
| Common Stocks Sold Short | | $ | 1,378,050 | | | $ | 58,755 | | | $ | — | | | $ | 1,436,805 | |
| Contingent Value Rights Sold Short | | | — | | | | — | | | | 823 | | | | 823 | |
| Exchange-Traded Funds Sold Short | | | 31,025 | | | | — | | | | — | | | | 31,025 | |
| Written Option Contracts | | | 918,001 | | | | 19,722 | | | | — | | | | 937,723 | |
| Swap Contracts** | | | — | | | | 49,588 | | | | — | | | | 49,588 | |
| Forward Currency Exchange Contracts** | | | — | | | | 53,386 | | | | — | | | | 53,386 | |
| | * | Please refer to the Schedule of Investments to view common stocks segregated by industry type. |
| | ** | Swap contracts and forward currency exchange contracts are valued at the net unrealized appreciation (depreciation) on the instrument. |
The Level 2 securities are priced using inputs such as current yields, discount rates, credit quality, yields on comparable securities, trading volume, maturity date, market bid and ask prices, prices on comparable securities and other significant inputs. There were no transfers into or out of Level 1 or 2 Securities during the year. Transfers between levels are recognized at the end of the reporting period.
The Merger Fund VL
NOTES TO THE FINANCIAL STATEMENTS (continued)
December 31, 2013
Note 2 — SIGNIFICANT ACCOUNTING POLICIES (continued)
Level 3 Reconciliation Disclosure
The following is a reconciliation of Level 3 assets for which significant unobservable inputs were used to determine fair value.
| Description | | Investments | |
| Balance as of December 31, 2012 | | $ | 1,190 | |
| Realized gain | | | 1,105 | |
| Change in unrealized appreciation | | | 21,547 | |
| Net purchases | | | 111,333 | |
| Net sales | | | (1,734 | ) |
| Balance as of December 31, 2013 | | $ | 133,441 | |
Significant unobservable valuation inputs developed by the Board of Trustees for material Level 3 investments as of December 31, 2013, are as follows:
| | Fair Value at | Valuation | Unobservable | |
| Description | December 31, 2013 | Technique | Input | Range |
| Escrow Notes | $102,785 | Projected Final | Discount of | 13.25 – 13.75 |
| | | Distribution(1) | Projected Distribution | |
| Escrow Notes | $31,479 | Projected Final | Final | 0.22 |
| | | Distribution(1) | Distribution | |
| Contingent Value | $823 | Broker | No Active | |
| Rights Sold Short | | Quotes | Market | 0.09 – 0.11 |
| (1) | This Level 3 security was received through a corporate action and is being priced at an estimate of the expected final distribution. |
B.Securities Sold Short
The Fund may sell securities or currencies short for economic hedging purposes or any other investment purpose. For financial statement purposes, an amount equal to the settlement amount is initially included in the Statement of Assets and Liabilities as an asset and an equivalent liability. The amount of the liability is subsequently priced to reflect the current value of the short position. Subsequent fluctuations in the market prices of securities or currencies sold, but not yet purchased, may require purchasing the securities or currencies at prices which may differ from the market value reflected on the Statement of Assets and Liabilities. Short sale transactions result in off balance sheet risk because the ultimate obligation may exceed the related amounts shown in the Statement of Assets and Liabilities. The Fund will incur a loss if the price of the security
The Merger Fund VL
NOTES TO THE FINANCIAL STATEMENTS (continued)
December 31, 2013
Note 2 — SIGNIFICANT ACCOUNTING POLICIES (continued)
increases between the date of the short sale and the date on which the Fund purchases the security to replace the borrowed security. The Fund’s loss on a short sale is potentially unlimited because there is no upward limit on the price a borrowed security could attain.
The Fund is liable for any dividends payable on securities while those securities are sold short. Until the security is replaced, the Fund is required to pay to the lender any income earned, which is recorded as an expense by the Fund. The Fund generally segregates liquid assets in an amount equal to the market value of securities sold short. These assets are required to be adjusted daily to reflect changes in the value of the securities or currencies sold short.
C.Transactions with Brokers for Securities Sold Short
The Fund’s receivables from brokers for proceeds on securities sold short and deposits at brokers for securities sold short are with two securities dealers. The Fund does not require the brokers to maintain collateral in support of the receivable from the brokers for proceeds on securities sold short. The Fund is required by the brokers to maintain collateral at the brokers for securities sold short. The receivable from brokers on the Statement of Assets and Liabilities represents the collateral for securities sold short. The Fund maintains cash deposits at brokers beyond the receivable for short sales. These cash deposits are presented as deposits at brokers on the Statement of Assets and Liabilities. These transactions may involve market risk in excess of the amount of receivable or payable reflected on the Statement of Assets and Liabilities.
D.Federal Income Taxes
No provision for federal income taxes has been made since the Fund has complied to date with the provisions of Subchapter M of the Internal Revenue Code applicable to regulated investment companies and intends to continue to so comply in future years and to distribute investment company net taxable income and net capital gains to shareholders. Additionally, the Fund intends to make all required distributions to avoid federal excise tax.
The Fund has reviewed all open tax years in major jurisdictions and concluded that there is no impact on the Fund’s net assets and there is no tax liability resulting from unrecognized tax benefits relating to uncertain income tax positions taken or expected to be taken on a tax return. The Fund is also not aware of any tax positions for which it is reasonably possible that the total amounts of unrecognized tax benefits will significantly change in the next twelve months. As of December 31, 2013, open Federal and New York tax years include the tax years ended December 31, 2010 through 2013. The Fund has no tax examination in progress.
The Merger Fund VL
NOTES TO THE FINANCIAL STATEMENTS (continued)
December 31, 2013
Note 2 — SIGNIFICANT ACCOUNTING POLICIES (continued)
E.Written Option Contracts
The Fund is subject to equity price risk in the normal course of pursuing its investment objectives. The Fund writes (sells) call options including to hedge portfolio investments. Uncovered put options can also be written by the Fund as part of a merger arbitrage strategy involving a pending corporate reorganization. When the Fund writes (sells) an option, an amount equal to the premium received by the Fund is included in the Statement of Assets and Liabilities as an asset and an equivalent liability. The amount of the liability is subsequently priced daily to reflect the current value of the option written. By writing an option, the Fund may become obligated during the term of the option to deliver or purchase the securities underlying the option at the exercise price if the option is exercised. Exchange-traded written option contracts are valued at the higher of the intrinsic value of the option (i.e., what the Fund would pay upon the option being exercised) or the last reported composite sale price. If no sale is reported or if the last sale is outside the bid and asked parameters, the higher of the intrinsic value of the option or the mean between the last reported bid and asked prices will be used. When an option expires on its stipulated expiration date or the Fund enters into a closing purchase transaction, the Fund realizes a gain or loss if the cost of the closing purchase transaction differs from the premium received when the option was sold without regard to any unrealized gain or loss on the underlying security, and the liability related to such option is eliminated. When an option is exercised, the premium originally received decreases the cost basis of the security (or increases the proceeds on a sale of the security), and the Fund realizes a gain or loss from the sale of the underlying security. Written option contracts sold on an exchange typically involve less credit risk than over-the-counter options. These contracts may involve market risk in excess of the amount of receivable or payable reflected on the Statement of Assets and Liabilities. Refer to Note 2 R. for further derivative disclosures.
F.Purchased Option Contracts
The Fund is subject to equity price risk in the normal course of pursuing its investment objectives. The Fund purchases put or call options for hedging purposes, volatility management purposes, or otherwise to gain, or reduce, long or short exposure to one or more asset classes or issuers. Premiums paid for option contracts purchased are included in the Statement of Assets and Liabilities as an asset. Exchange-traded option contracts are valued at the higher of the intrinsic value of the option (i.e., what the Fund can receive upon exercising the option) or the last reported composite sale price. If no sale is reported or if the last sale is outside the bid and
The Merger Fund VL
NOTES TO THE FINANCIAL STATEMENTS (continued)
December 31, 2013
Note 2 — SIGNIFICANT ACCOUNTING POLICIES (continued)
asked parameters, the option contract purchased is valued at the higher of the intrinsic value of the option or the mean between the last reported bid and asked prices on the day of valuation. When option contracts expire or are closed, realized gains or losses are recognized without regard to any unrealized gains or losses on the underlying securities that may be held by the Fund. Purchased options sold on an exchange typically include less credit risk than over-the-counter options. Refer to Note 2 R. for further derivative disclosures.
G.Forward Currency Exchange Contracts
The Fund is subject to foreign currency exchange rate risk in the normal course of pursuing its investment objectives. The Fund may use forward currency exchange contracts to hedge against changes in the value of foreign currencies. The Fund may enter into forward currency exchange contracts obligating the Fund to deliver and receive a currency at a specified future date. Forward contracts are valued daily, and unrealized appreciation or depreciation is recorded daily as the difference between the contract exchange rate and the closing forward rate applied to the face amount of the contract. A realized gain or loss is recorded at the time the forward contract expires. Credit risk may arise as a result of the failure of the counterparty to comply with the terms of the contract. The Fund considers the creditworthiness of each counterparty to a contract in evaluating potential credit risk quarterly. The counterparty risk to the Fund includes the amount of any net unrealized gain on the contract.
The use of forward currency exchange contracts does not eliminate fluctuations in the underlying prices of the Fund’s investment securities. The use of forward currency exchange contracts involves the risk that anticipated currency movements will not be accurately predicted. A forward currency exchange contract would limit the risk of loss due to a decline in the value of a particular currency; however it would also limit any potential gain that might result should the value of the currency increase instead of decrease. These contracts may involve market risk in excess of the amount of receivable or payable reflected on the Statement of Assets and Liabilities. Refer to Note 2 R. for further derivative disclosures.
H.Equity Swap Contracts
The Fund is subject to equity price risk and interest rate risk in the normal course of pursuing its investment objectives. The Fund may enter into both long and short equity swap contracts with multiple broker-dealers. A long equity swap contract entitles the Fund to receive from the counterparty any appreciation and dividends paid on an individual security, while obligating the Fund to pay the counterparty any depreciation on the security as well as interest on the notional
The Merger Fund VL
NOTES TO THE FINANCIAL STATEMENTS (continued)
December 31, 2013
Note 2 — SIGNIFICANT ACCOUNTING POLICIES (continued)
amount of the contract at a rate equal to LIBOR plus an agreed upon spread (generally between 25 to 100 basis points). A short equity swap contract obligates the Fund to pay the counterparty any appreciation and dividends paid on an individual security, while entitling the Fund to receive from the counterparty any depreciation on the security, and to pay to or receive from the counterparty interest on the notional value of the contract at a rate equal to LIBOR less an agreed upon spread (generally between 25 to 100 basis points).
The Fund may also enter into equity swap contracts whose value may be determined by the spread between a long equity position and a short equity position. This type of swap contract obligates the Fund to pay the counterparty an amount tied to any increase in the spread between the two securities over the term of the contract. The Fund is also obligated to pay the counterparty any dividends paid on the short equity holding as well as any net financing costs. This type of swap contract entitles the Fund to receive from the counterparty any gains based on a decrease in the spread as well as any dividends paid on the long equity holding and any net interest income.
Fluctuations in the value of an open contract are recorded daily as a net unrealized gain or loss. The Fund will realize a gain or loss upon termination or reset of the contract. Either party, under certain conditions, may terminate the contract prior to the contract’s expiration date.
Credit risk may arise as a result of the failure of the counterparty to comply with the terms of the contract. The Fund considers the creditworthiness of each counterparty to a contract in evaluating potential credit risk quarterly. The counterparty risk to the Fund includes the risk of loss of the full amount of any net unrealized gain on the contract, along with dividends receivable on long equity contracts and interest receivable on short equity contracts. Additionally, risk may arise from unanticipated movements in interest rates or in the value of the underlying securities. These contracts may involve market risk in excess of the amount of receivable or payable reflected on the Statement of Assets and Liabilities. Refer to Note 2 R. for further derivative disclosures.
I.Distributions to Shareholders
Dividends from net investment income and net realized capital gains, if any, are declared and paid at least annually. Income and capital gain distributions are determined in accordance with income tax regulations which may differ from GAAP. These differences are due primarily to wash sale-loss deferrals, constructive sales, straddle-loss deferrals, adjustments on swap contracts, and unrealized gains or losses on Section 1256 contracts, which were realized, for tax purposes, at
The Merger Fund VL
NOTES TO THE FINANCIAL STATEMENTS (continued)
December 31, 2013
Note 2 — SIGNIFICANT ACCOUNTING POLICIES (continued)
December 31, 2013. Accordingly, reclassifications are made within the net asset accounts for such amounts, as well as amounts related to permanent differences in the character of certain income and expense items for income tax and financial reporting purposes. At December 31, 2013, the Fund increased accumulated undistributed net investment income by $311,157, reduced accumulated undistributed net gain by $311,157, and did not change paid-in capital.
J.Foreign Securities
Investing in securities of foreign companies and foreign governments involves special risks and considerations not typically associated with investing in U.S. companies and the U.S. government. These risks include revaluation of currencies and adverse political and economic developments. Moreover, securities of many foreign companies and their markets may be less liquid and their prices more volatile than those of securities of comparable U.S. companies and the U.S. government.
K.Foreign Currency Translations
The books and records of the Fund are maintained in U.S. dollars. Foreign currency transactions are translated into U.S. dollars on the following basis: (i) market value of investment securities, assets and liabilities at the daily rates of exchange, and (ii) purchases and sales of investment securities, dividend and interest income and certain expenses at the rates of exchange prevailing on the respective dates of such transactions. For financial reporting purposes, the Fund does not isolate changes in the exchange rate of investment securities from the fluctuations arising from changes in the market prices of securities. However, for federal income tax purposes, the Fund does isolate and treat as ordinary income the effect of changes in foreign exchange rates on realized gain or loss from the sale of investment securities and payables and receivables arising from trade-date and settlement-date differences.
L.Cash and Cash Equivalents
The Fund considers highly liquid temporary cash investments purchased with an original maturity of less than three months to be cash equivalents. Cash equivalents are included in short-term investments on the Schedule of Investments as well as in investments on the Statement of Assets and Liabilities. Temporary cash overdrafts are reported as payable to custodian.
M.Guarantees and Indemnifications
In the normal course of business, the Fund enters into contracts with service providers that contain general indemnification clauses. The Fund’s maximum exposure under these arrangements is unknown, as this would involve future claims that may be made against the Fund
The Merger Fund VL
NOTES TO THE FINANCIAL STATEMENTS (continued)
December 31, 2013
Note 2 — SIGNIFICANT ACCOUNTING POLICIES (continued)
that have not yet occurred. The Fund has not historically incurred material expenses in respect of those provisions.
N.Use of Estimates
The preparation of financial statements in conformity with GAAP requires the Adviser to make estimates and assumptions that affect the reported amounts of assets and liabilities and disclosure of contingent assets and liabilities at the date of the financial statements and the reported amounts of revenues and expenses during the reporting period. Actual results could differ from those estimates.
O.Other
Transactions are recorded for financial statement purposes on the trade date. Realized gains and losses from security transactions are recorded on the identified cost basis. Dividend income and distributions to shareholders are recorded on the ex-dividend date. Interest is accounted for on the accrual basis and includes amortization of premiums and discounts on the effective interest method. Expenses include $12,776 of borrowing expense on securities sold short. The Fund may utilize derivative instruments such as options, forward currency exchange contracts and other instruments with similar characteristics to the extent that they are consistent with the Fund’s investment objectives and limitations. The use of these instruments may involve additional investment risks, including the possibility of illiquid markets or imperfect correlation between the value of the instruments and the underlying securities.
P.Counterparty Risk
The Fund helps manage counterparty credit risk by entering into agreements only with counterparties the Adviser believes have the financial resources to honor their obligations and by having the Adviser monitor the financial stability of the counterparties.
Q.The Right to Offset
Financial assets and liabilities as well as cash collateral received by the counterparties and posted are offset by the counterparty, and the net amount is reported in the Statement of Assets and Liabilities when the Fund believes there exists a legally enforceable right to offset the recognized amounts.
The Merger Fund VL
NOTES TO THE FINANCIAL STATEMENTS (continued)
December 31, 2013
Note 2 — SIGNIFICANT ACCOUNTING POLICIES (continued)
R.Derivatives
The Fund has adopted authoritative standards regarding disclosure about derivatives and hedging activities and how they affect the Fund’s Statement of Assets and Liabilities and Statement of Operations. For the year ended December 31, 2013: long option contracts (8,905 contracts) were purchased and $707,986 in premiums were paid, written option contracts (12,210 contracts) were opened and $2,610,169 in premiums were received, equity swap contracts were opened with a notional value of $4,394,216 and closed with a notional value of $5,605,832 and an average of 13 forward currency exchange contract positions were open during the year.
Statement of Assets and Liabilities
Fair values of derivative instruments as of December 31, 2013:
| | | Asset Derivatives | | | Liability Derivatives | |
| | | Statement of | | | Statement of | |
| | | Assets and | | | Assets and | |
| Derivatives | | Liabilities Location | | | Fair Value | | | Liabilities Location | | | Fair Value | |
| Equity Contracts: | | | | | | | | | | | | |
| Purchased | | | | | | | | | | | | |
| Option Contracts | | Investments | | | $ | 102,040 | | | | N/A | | | $ | — | |
| | | | | | | | | | | Written | | | | | |
| | | | | | | | | | | Option | | | | | |
| Written Option Contracts | | | N/A | | | | – | | | Contracts | | | | 937,723 | |
| Swap Contracts | | Receivables | | | | 39,927 | | | Payables | | | | 49,588 | |
| Foreign Exchange Contracts: | | | | | | | | | | | | | | | | |
| Forward Currency | | | | | | | | | | | | | | | | |
| Exchange Contracts | | Receivables | | | | 16,136 | | | Payables | | | | 53,386 | |
| Total | | | | | | $ | 158,103 | | | | | | | $ | 1,040,697 | |
NOTES TO THE FINANCIAL STATEMENTS (continued)
December 31, 2013
Note 2 — SIGNIFICANT ACCOUNTING POLICIES (continued)
Statement of Operations
The effect of derivative instruments on the Statement of Operations for the year ended December 31, 2013:
Amount of Realized Gain (Loss) on Derivatives
| | | | | | | | | Forward | | | | | | | |
| | | Purchased | | | Written | | | Currency | | | | | | | |
| | | Option | | | Option | | | Exchange | | | Swap | | | | |
| Derivatives | | Contracts | | | Contracts | | | Contracts | | | Contracts | | | Total | |
| Equity Contracts | | $ | (618,908 | ) | | $ | (105,358 | ) | | $ | — | | | $ | (129,314 | ) | | $ | (853,580 | ) |
| Foreign Exchange Contracts | | | — | | | | — | | | | 58,039 | | | | — | | | | 58,039 | |
| Total | | $ | (618,908 | ) | | $ | (105,358 | ) | | $ | 58,039 | | | $ | (129,314 | ) | | $ | (795,541 | ) |
Change in Unrealized Appreciation (Depreciation) on Derivatives
| | | | | | | | | Forward | | | | | | | |
| | | Purchased | | | Written | | | Currency | | | | | | | |
| | | Option | | | Option | | | Exchange | | | Swap | | | | |
| Derivatives | | Contracts | | | Contracts | | | Contracts | | | Contracts | | | Total | |
| Equity Contracts | | $ | (77,418 | ) | | $ | (270,875 | ) | | $ | — | | | $ | (17,580 | ) | | $ | (365,873 | ) |
| Foreign Exchange Contracts | | | — | | | | — | | | | (26,022 | ) | | | — | | | | (26,022 | ) |
| Total | | $ | (77,418 | ) | | $ | (270,875 | ) | | $ | (26,022 | ) | | $ | (17,580 | ) | | $ | (391,895 | ) |
Note 3 — AGREEMENTS AND INVESTMENT ADVISER TRANSACTIONS
The Fund’s investment adviser is Westchester Capital Management, LLC (the “Adviser”) pursuant to an investment advisory agreement with the Adviser dated as of January 1, 2011 (the “Advisory Agreement”). Under the terms of the Advisory Agreement, the Adviser is entitled to receive a fee, calculated daily and payable monthly, at the annual rate of 1.25% of the Fund’s average daily net assets. Certain officers of the Fund are also officers of the Adviser. The Advisory Agreement was approved for an initial term of two years and thereafter will remain in effect from year to year provided that such continuance is specifically approved at least annually by the vote of a majority of the Fund’s Trustees who are not interested persons of the Advisor or the Fund or by a vote of a majority of the outstanding voting securities of the Fund. The Adviser has entered into an agreement with the Fund whereby the Adviser has agreed to either reduce
The Merger Fund VL
NOTES TO THE FINANCIAL STATEMENTS (continued)
December 31, 2013
Note 3 — AGREEMENTS AND INVESTMENT ADVISER TRANSACTIONS (continued)
all or a portion of its management fee and, if necessary, to bear certain other expenses (but not including brokerage commissions, short dividends, interest expense, taxes, acquired fund fees and expenses or extraordinary expenses) associated with operating the Fund so that the total Annual Fund Operating Expenses do not exceed 1.40% of the Fund’s average daily net assets until April 30, 2014. The Agreement permits the Adviser to recapture amounts that it waives or absorbs on behalf of the Fund at any time within three years of the end of the fiscal year in which the fee was reduced or waived or the expense was borne provided that doing so would not cause the Fund’s operating expenses for that year, excluding brokerage commissions, short dividends, interest expense, taxes, acquired fund fees and expenses or extraordinary expenses, to exceed 1.40%. For the year ended December 31, 2013, the Adviser waived $216,693 to the Fund.
Reimbursed expenses subject to potential recovery by year of expiration are as follows:
| Year of Expiration | Potential Recovery |
| 12/31/14 | $185,038 |
| 12/31/15 | $161,469 |
| 12/31/16 | $216,693 |
U.S. Bancorp Fund Services, LLC, a subsidiary of U.S. Bancorp, a publicly held bank holding company, serves as transfer agent, administrator, accountant, dividend paying agent and shareholder servicing agent for the Fund. U.S. Bank, N.A. serves as custodian for the Fund.
Note 4 — SHARES OF BENEFICIAL INTEREST
The Board of Trustees has the authority to issue an unlimited amount of shares of beneficial interest without par value.
Changes in shares of beneficial interest were as follows:
| | | Year Ended | | | Year Ended | |
| | | December 31, 2013 | | | December 31, 2012 | |
| | | Shares | | | Amount | | | Shares | | | Amount | |
| Issued | | | 649,173 | | | $ | 6,925,407 | | | | 319,208 | | | $ | 3,355,581 | |
| Issued as reinvestment of dividends | | | 4,544 | | | | 49,575 | | | | 20,759 | | | | 218,179 | |
| Redeemed | | | (271,890 | ) | | | (2,891,708 | ) | | | (346,808 | ) | | | (3,633,682 | ) |
| Net increase (decrease) | | | 381,827 | | | $ | 4,083,274 | | | | (6,841 | ) | | $ | (59,922 | ) |
NOTES TO THE FINANCIAL STATEMENTS (continued)
December 31, 2013
Note 5 — INVESTMENT TRANSACTIONS
Purchases and sales of securities for the year ended December 31, 2013 (excluding short-term investments, short-term options and short-term positions) aggregated $30,482,568 and $24,984,309, respectively. There were no purchases or sales of U.S. Government securities.
At December 31, 2013, the components of accumulated earnings (losses) on a tax basis were as follows:
| Cost of investments* | | $ | 18,730,781 | |
| Gross unrealized appreciation | | | 1,275,603 | |
| Gross unrealized depreciation | | | (322,976 | ) |
| Net unrealized appreciation | | $ | 952,627 | |
| Undistributed ordinary income | | $ | 412,970 | |
| Undistributed long-term capital gain | | | — | |
| Total distributable earnings | | $ | 412,970 | |
| Other accumulated losses | | | (800,095 | ) |
| Total accumulated gains | | $ | 565,502 | |
| * | Represents cost for federal income tax purposes and differs from the cost for financial reporting purposes due to wash sales and constructive sales. |
The tax components of dividends paid during the fiscal year ended December 31, 2013 and December 31, 2012 were as follows:
| | | 2013 | | | 2012 | |
| Ordinary Income | | $ | 49,575 | | | $ | 218,179 | |
| Long-Term Capital Gains | | | — | | | | — | |
| Total Distributions Paid | | $ | 49,575 | | | $ | 218,179 | |
The Fund designated as long term capital gain dividend, pursuant to Internal Revenue Case Section 852(b)(3), the amount necessary to reduce the earnings and profits of the Fund related to net capital gain to zero for the tax year ended December 31, 2013. As of December 31, 2013, the Fund did not have a post-October capital loss or a capital loss carryforward.
For the fiscal year ended December 31, 2013, certain dividends paid by the Fund may be subject to a maximum tax rate of 15%, as provided for by the Jobs and Growth Tax Relief Reconciliation Act of 2003. The percentage of dividends declared from ordinary income
The Merger Fund VL
NOTES TO THE FINANCIAL STATEMENTS (continued)
December 31, 2013
Note 5 — INVESTMENT TRANSACTIONS (continued)
designated as qualified dividend income for the fiscal year ended December 31, 2013 was 0.00% (unaudited) for the Fund.
For corporate shareholders, the percent of ordinary income distributions qualifying for the corporate dividends-received deduction for the fiscal year ended December 31, 2013 was 100% (unaudited) for the Fund.
The percentage of taxable ordinary income distributions that are designated as short-term capital gain distributions under Internal Revenue Code Section 871(k)(2)(c) for the fiscal year ended December 31, 2013 was 0.00% (unaudited) for the Fund.
Note 6 — WRITTEN OPTION CONTRACTS
The premium amount and the number of written option contracts during the year ended December 31, 2013 were as follows:
| | | Number of | | | Premium | |
| | | Contracts | | | Amount | |
| Options outstanding at December 31, 2012 | | | 2,470 | | | $ | 612,721 | |
| Options written | | | 12,210 | | | | 2,610,169 | |
| Options closed | | | (7,591 | ) | | | (1,564,087 | ) |
| Options exercised | | | (3,211 | ) | | | (864,262 | ) |
| Options expired | | | (983 | ) | | | (114,898 | ) |
| Options outstanding at December 31, 2013 | | | 2,895 | | | $ | 679,643 | |
Note 7 — OFFSETTING ASSETS AND LIABILITIES
The Fund is subject to various Master Netting Arrangements, which govern the terms of certain transactions with select counterparties. The Master Netting Arrangements allow the Fund to close out and net its total exposure to a counterparty in the event of a default with respect to all the transactions governed under a single agreement with a counterparty. The Master Netting Arrangements also specify collateral posting arrangements at pre-arranged exposure levels. Under the Master Netting Arrangements, collateral is routinely transferred if the total net exposure to certain transactions (net of existing collateral already in place) governed under the relevant Master Netting Arrangement with a counterparty in a given account exceeds a specified threshold depending on the counterparty and the type of Master Netting Arrangement.
The Merger Fund VL
NOTES TO THE FINANCIAL STATEMENTS (continued)
December 31, 2013
Note 7 — OFFSETTING ASSETS AND LIABILITIES (continued)
Assets:
| | | | | | | | | | | | Gross Amounts not offset | | | | |
| | | | | | | | | | | | in the Statement | | | | |
| | | | | | | | | | | | of Assets and Liabilities | | | | |
| | | | | | Gross Amounts | | | Net Amounts | | | | | | | | | | |
| | | Gross | | | Offset in the | | | Presented in | | | | | | | | | | |
| | | Amounts of | | | Statement | | | the Statement | | | | | | | | | | |
| | | Recognized | | | of Assets | | | of Assets | | | Financial | | | Collateral | | | Net | |
| | | Assets | | | and Liabilities | | | and Liabilities | | | Instruments | | | Received | | | Amount | |
| Description | | | | | | | | | | | | | | | | | | |
| Forward Currency | | | | | | | | | | | | | | | | | | |
| Exchange Contracts | | $ | 16,136 | | | $ | — | | | $ | 16,136 | | | $ | 16,136 | | | $ | — | | | $ | — | |
| Swap Contracts — | | | | | | | | | | | | | | | | | | | | | | | | |
| JPMorgan Chase | | | | | | | | | | | | | | | | | | | | | | | | |
| & Co. Inc. | | | 67,067 | | | | 27,140 | | | | 39,927 | | | | — | | | | — | | | | 39,927 | |
| Swap Contracts — | | | | | | | | | | | | | | | | | | | | | | | | |
| Merrill Lynch & Co. Inc. | | | 21,617 | | | | 21,617 | | | | — | | | | — | | | | — | | | | — | |
| | | $ | 104,820 | | | $ | 48,757 | | | $ | 56,063 | | | $ | 16,136 | | | $ | — | | | $ | 39,927 | |
Liabilities:
| | | | | | | | | | | | Gross Amounts not offset | | | | |
| | | | | | | | | | | | in the Statement | | | | |
| | | | | | | | | | | | of Assets and Liabilities | | | | |
| | | | | | Gross Amounts | | | Net Amounts | | | | | | | | | | |
| | | Gross | | | Offset in the | | | Presented in | | | | | | | | | | |
| | | Amounts of | | | Statement | | | the Statement | | | | | | | | | | |
| | | Recognized | | | of Assets | | | of Assets | | | Financial | | | Collateral | | | Net | |
| | | Liabilities | | | and Liabilities | | | and Liabilities | | | Instruments | | | Pledged | | | Amount | |
| Description | | | | | | | | | | | | | | | | | | |
| Forward Currency | | | | | | | | | | | | | | | | | | |
| Exchange Contracts | | $ | 53,386 | | | $ | — | | | $ | 53,386 | | | $ | 16,136 | | | $ | 37,250 | | | $ | — | |
| Swap Contracts — | | | | | | | | | | | | | | | | | | | | | | | | |
| JPMorgan Chase | | | | | | | | | | | | | | | | | | | | | | | | |
| & Co. Inc. | | | 27,140 | | | | 27,140 | | | | — | | | | — | | | | — | | | | — | |
| Swap Contracts — | | | | | | | | | | | | | | | | | | | | | | | | |
| Merrill Lynch & Co. Inc. | | | 71,205 | | | | 21,617 | | | | 49,588 | | | | — | | | | 49,588 | | | | — | |
| Written Option Contracts | | | 937,723 | | | | — | | | | 937,723 | | | | — | | | | 937,723 | | | | — | |
| | | $ | 1,089,454 | | | $ | 48,757 | | | $ | 1,040,697 | | | $ | 16,136 | | | $ | 1,024,561 | | | $ | — | |
Note 8 — SUBSEQUENT EVENTS
Roy Behren’s term as a Trustee of the Fund began on January 1, 2014.
REPORT OF INDEPENDENT REGISTERED PUBLIC ACCOUNTING FIRM
To the Board of Directors and Shareholders of
The Merger Fund VL:
In our opinion, the accompanying statement of assets and liabilities, including the schedule of investments, securities sold short, options written, forward currency exchange contracts and swap contracts, and the related statements of operations and of changes in net assets and the financial highlights present fairly, in all material respects, the financial position of The Merger Fund VL (the “Fund”) at December 31, 2013, the results of its operations for the year then ended, the changes in its net assets for each of the two years in the period then ended and the financial highlights for each of the five years in the period then ended, in conformity with accounting principles generally accepted in the United States of America. These financial statements and financial highlights (hereafter referred to as “financial statements”) are the responsibility of the Fund’s management; our responsibility is to express an opinion on these financial statements based on our audits. We conducted our audits of these financial statements in accordance with the standards of the Public Company Accounting Oversight Board (United States). Those standards require that we plan and perform the audit to obtain reasonable assurance about whether the financial statements are free of material misstatement. An audit includes examining, on a test basis, evidence supporting the amounts and disclosures in the financial statements, assessing the accounting principles used and significant estimates made by management, and evaluating the overall financial statement presentation. We believe that our audits, which included confirmation of securities at December 31, 2013 by correspondence with the custodian and brokers, provide a reasonable basis for our opinion.

Milwaukee, Wisconsin
February 28, 2014
The Merger Fund VL
BOARD APPROVAL OF INVESTMENT ADVISORY AGREEMENTS
December 31, 2013 (Unaudited)
Each year, the Board of Trustees of each of The Merger Fund and The Merger Fund VL (together, the “Board”), including a majority of the Trustees who are not interested persons of The Merger Fund and The Merger Fund VL (together, the “Independent Trustees”), is required to determine whether to continue The Merger Fund’s and The Merger Fund VL’s advisory agreements. In October 2013, the Board and the Independent Trustees approved the continuation of The Merger Fund’s and The Merger Fund VL’s (the “Funds”) advisory arrangements with Westchester Capital Management LLC (the “Adviser”) (collectively, the “Agreements”) for an additional one-year period. A summary of the material factors and conclusions that formed the basis for the approval by the Board and the Independent Trustees are discussed below.
Review Process
The Investment Company Act of 1940, as amended, requires that the Board request and evaluate, and that the Adviser furnish, such information as may reasonably be necessary to evaluate the terms of the Funds’ Agreements. The Independent Trustees began their formal review process in the Fall of 2013 by requesting from the Adviser information they believed necessary to evaluate the terms of the Funds’ Agreements (the “Information Request”).
Throughout the review process, the Independent Trustees were advised by their independent counsel. The Independent Trustees also discussed the continuation of the Agreements in a private session with their independent counsel, at which no representatives of the Adviser were present.
The Independent Trustees and Board, in approving the continuation of the Agreements, did not identify any particular information that was all-important or controlling, and each Trustee attributed different weights to the various factors. The Trustees evaluated all information available to them on a fund-by-fund basis, and their deliberations were made separately in respect of each Fund. This summary describes the most important, but not all, of the factors considered by the Board and the Independent Trustees.
Materials Reviewed
During the course of each year, the Board receives a wide variety of materials relating to the services provided by the Adviser and the Funds’ other service providers, including reports on: each Fund’s investment results; portfolio construction; portfolio composition; portfolio trading practices; shareholder services; and other information relating to the nature, extent and quality of services provided by the Adviser to the Funds. In addition, in connection with its annual consideration of the Agreements, the Board requested and reviewed supplementary information
The Merger Fund VL
BOARD APPROVAL OF INVESTMENT ADVISORY AGREEMENTS (continued)
December 31, 2013 (Unaudited)
regarding the terms of the Agreements, the Funds’ investment results, advisory fee and total expense comparisons, financial and profitability information regarding the Adviser and its affiliates, descriptions of various functions undertaken by the Adviser, such as compliance monitoring, and information about the personnel providing investment management services to the Funds. The Board also requested and evaluated performance and expense information for other investment companies that was compiled by Morningstar and the Funds’ administrator. The Board and the Independent Trustees also considered information regarding so-called “fall-out” benefits to the Adviser and its affiliates due to the Adviser’s relationships with the Funds.
Nature, Extent and Quality of Services
Nature and Extent of Services – In considering the continuation of the Agreements for the current year, the Board and the Independent Trustees evaluated the nature and extent of the services provided by the Adviser. The Board and the Independent Trustees considered information concerning the investment philosophy and investment process used by the Adviser in managing the Funds. In this context, the Board and the Independent Trustees considered the in-house research capabilities of the Advisers as well as other resources available to the Adviser, including research services available to the Adviser as a result of securities transactions effected for the Funds and other investment advisory clients of the Adviser. The Trustees considered the scope and quality of services provided by the Adviser under the Agreements, and noted that the services required to be provided had expanded over time as a result of regulatory and other developments. The Board and the Independent Trustees also considered the managerial and financial resources available to the Adviser.
Quality of Services – The Board and the Independent Trustees considered the quality of the services provided by the Adviser and the quality of the resources of the Adviser available to the Funds. The Board and the Independent Trustees considered the specialized experience, expertise and professional qualifications of the personnel of the Adviser, including that the Adviser had a uniquely long track record managing a merger arbitrage strategy within the context of a registered mutual fund. The Board and the Independent Trustees considered the complexity of managing the Funds’ strategy relative to other types of funds. The Board and the Independent Trustees also received and reviewed information regarding the quality of non-investment advisory services provided to the Funds by the Adviser, including certain compliance services. The Board and the Independent Trustees considered that the scope of the services provided to the Funds by the Adviser were consistent with the Funds’ operational requirements.
In their evaluation of the quality of the services provided by the Adviser, the Board and the Independent Trustees considered the performance of the Funds. The Board and the
The Merger Fund VL
BOARD APPROVAL OF INVESTMENT ADVISORY AGREEMENTS (continued)
December 31, 2013 (Unaudited)
Independent Trustees considered whether the Funds operated within their investment objectives and their record of compliance with their investment restrictions. The Board and the Independent Trustees reviewed information comparing the Funds’ historical performance to relevant market indices and to performance information for other investment companies with similar investment objectives over the 1-, 3-, 5- and 10-year periods (if the Funds were in existence) ended September 30, 2013. The Board and the Independent Trustees concluded, within the context of their overall conclusions regarding each of the Agreements, that the Funds’ performance records and the Adviser’s process used in managing the Funds supported the renewal of the Agreements.
The Board and the Independent Trustees concluded, within the context of their overall conclusions regarding each of the Agreements, that, overall, they were satisfied with the nature, extent and quality of the services provided by the Adviser.
Management Fees and Expenses
The Board and the Independent Trustees reviewed information, including comparative information provided by Morningstar and the Funds’ administrator, regarding the advisory fees paid to the Adviser and the total expenses borne by the Funds. They considered the Funds’ advisory fees relative to their peer groups. The Board and the Independent Trustees also considered the fees that the Adviser and its affiliates charge other clients with investment objectives similar to the Funds. The Board and the Independent Trustees considered information provided by the Adviser describing the differences in services provided to these other clients, which noted that, among other things, typically more services were provided to the Funds than those other clients. The Board and the Independent Trustees concluded, within the context of their overall conclusions regarding each of the Agreements, that the fees to be charged under the Agreements represent reasonable compensation to the Adviser in light of the services provided.
Profitability and Possible Economies of Scale
Profitability – The Board and the Independent Trustees reviewed information regarding the cost of services provided by the Adviser and the profitability (before distribution expenses and prior to taxes) of the Adviser’s relationship with the Funds. In evaluating the Adviser’s reported profitability, the Independent Trustees considered that certain of the information provided by the Adviser was necessarily estimated and that preparing the related profitability information involved certain assumptions and allocations that were imprecise. The Board and the Independent Trustees recognized that the probative value of profitability information may be limited because a wide range of comparative information often is not generally available and it
The Merger Fund VL
BOARD APPROVAL OF INVESTMENT ADVISORY AGREEMENTS (continued)
December 31, 2013 (Unaudited)
can be affected by numerous factors, including the structure of the particular adviser, the types of funds it manages, its business mix, the efficiency of an adviser’s operations, numerous assumptions about allocations and the adviser’s cost of capital. In addition, the Board and the Independent Trustees considered information regarding the direct and indirect benefits the Adviser receives as a result of its relationship with the Funds, including research purchased with soft dollar credits earned from portfolio transactions effected on behalf of the Funds (soft dollar arrangements), and reputational benefits.
Economies of Scale – The Board and the Independent Trustees reviewed the extent to which the Adviser may realize economies of scale in managing the Funds. The Board and the Independent Trustees concluded, within the context of their overall conclusions regarding each of the Agreements, that the Adviser’s level of profitability from its relationship with each Fund was reasonable and not excessive in light of, among other things, the positive relative performance of the Funds and the Adviser’s significant expertise and experience managing a merger-arbitrage related strategy. The Trustees also considered that the Adviser proposed to continue, also for an additional one-year period, to apply waivers to TMF’s advisory fee that generally had the effect of breakpoints in the Adviser’s advisory fee as well as to continue the expense limitation agreement applicable to VL. The Independent Trustees concluded that those measures were reasonably designed to result in the sharing of economies of scale realized by the Adviser, if any, with the Funds and their shareholders.
Conclusions
Based on their review, including their consideration of each of the factors referred to above, the Board and the Independent Trustees concluded that the terms of the Agreements, including the fees payable to the Adviser, are fair and reasonable to the Funds and their shareholders given the scope and quality of the services provided to the Funds and such other considerations as the Independent Trustees considered relevant in the exercise of their reasonable business judgment and that the continuation of the Agreements was in the best interests of the Funds and their shareholders. Accordingly, the Board and Independent Trustees unanimously approved the continuation of the Agreements.
INFORMATION ABOUT TRUSTEES AND OFFICERS
The business and affairs of the Fund are managed under the direction of the Fund’s Board of Trustees. Information pertaining to the Fund’s Trustees and Officers is set forth below. The Statement of Additional Information includes additional information about the Fund’s Trustees and Officers and is available, without charge, upon request by calling 1-800-343-8959.
| | | | | # of | |
| | | | | Portfolios | Other |
| | | | | in Fund | Directorships |
| | | Term of | Principal | Complex | Held by |
| Name, | Position(s) | Office and | Occupation(s) | Overseen | Trustee |
| Address | Held with | Length of | During the | by | During the |
| and Age | the Fund | Time Served | Past Five Years | Trustee** | Past Five Years |
| | | | | | |
| Roy Behren* | Co-President | One-year | Co-Portfolio Manager and | 3*** | None |
| Westchester Capital | and | terms, since | Co-President of Westchester | | |
| Management, LLC | Treasurer; | 2011; | Capital Management, LLC, the | | |
| 100 Summit Lake Drive | Trustee | Indefinite, | Fund’s Adviser, since 2011. | | |
| Valhalla, NY 10595 | | since 2014 | Co-Portfolio Manager of | | |
| Age: 53 | | | Westchester Capital | | |
| | | | Management, Inc., the Fund’s | | |
| | | | previous adviser, from 2007 to | | |
| | | | 2010. Research analyst for | | |
| | | | Westchester Capital | | |
| | | | Management, Inc. from 1994 | | |
| | | | until 2010. Chief Compliance | | |
| | | | Officer of the Fund and | | |
| | | | Westchester Capital | | |
| | | | Management, Inc. from | | |
| | | | 2004 to 2010. | | |
| | | | | | |
| Michael T. Shannon* | Co-President | Indefinite; | Co-Portfolio Manager and | 3*** | None |
| Westchester Capital | and Trustee | since 2011 | Co-President of Westchester | | |
| Management, LLC | | | Capital Management, LLC, the | | |
| 100 Summit Lake Drive | | | Fund’s Adviser, since 2011. | | |
| Valhalla, NY 10595 | | | Co-Portfolio Manager of | | |
| Age: 47 | | | Westchester Capital | | |
| | | | Management, Inc., the Fund’s | | |
| | | | previous adviser, from 2007 | | |
| | | | to 2010. | | |
| | | | | | |
| James P. Logan III | Independent | Indefinite; | Chairman of J.P. Logan & | 3 | None |
| c/o Westchester Capital | Trustee | since | Company since January 1980. | | |
| Management, LLC | | inception | Chairman of Logan-Chace, | | |
| 100 Summit Lake Drive | | in 2002 | LLC, an executive search firm. | | |
| Valhalla, NY 10595 | | | | | |
| Age: 77 | | | | | |
INFORMATION ABOUT TRUSTEES AND OFFICERS (continued)
| | | | | # of | |
| | | | | Portfolios | Other |
| | | | | in Fund | Directorships |
| | | Term of | Principal | Complex | Held by |
| Name, | Position(s) | Office and | Occupation(s) | Overseen | Trustee |
| Address | Held with | Length of | During the | by | During the |
| and Age | the Fund | Time Served | Past Five Years | Trustee** | Past Five Years |
| | | | | | |
| Barry Hamerling | Independent | Indefinite; | Managing Partner of Premium | 3 | Trustee of AXA |
| c/o Westchester Capital | Trustee | since 2007 | Ice Cream of America since | | Premier VIP |
| Management, LLC | | | 1995. Managing Partner of | | Trust; Chairman |
| 100 Summit Lake Drive | | | B&J Freeport since 1990. | | of the Ayco |
| Valhalla, NY 10595 | | | Managing Partner of Let-US | | Charitable |
| Age: 67 | | | Creations from 1999 to 2011. | | Foundation |
| | | | | | |
| Richard V. Silver | Independent | Indefinite; | Consultant with AXA Equitable | 3 | None |
| c/o Westchester Capital | Trustee | since 2013 | Life Insurance Company from | | |
| Management, LLC | | | May 2012 to April 2013. Senior | | |
| 100 Summit Lake Drive | | | Executive Vice President, Chief | | |
| Valhalla, NY 10595 | | | Legal Officer and Chief | | |
| Age: 58 | | | Administrative Officer of AXA | | |
| | | | Equitable Life Insurance | | |
| | | | Company from February 2010 | | |
| | | | to April 2012. Executive Vice | | |
| | | | President and General Counsel | | |
| | | | of AXA Equitable Life Insurance | | |
| | | | Company from September 2001 | | |
| | | | to February 2010. | | |
| | | | | | |
| Christianna Wood | Independent | Indefinite; | Chief Executive Officer and | 3 | Director of |
| c/o Westchester Capital | Trustee | since 2013 | President of Gore Creek | | H&R Block |
| Management, LLC | | | Capital, Ltd. since August 2009. | | Corporation; |
| 100 Summit Lake Drive | | | Chief Executive Officer of | | Director of |
| Valhalla, NY 10595 | | | Capital Z Asset Management | | International |
| Age: 54 | | | from March 2008 to July 2009. | | Securities |
| | | | Senior Investment Officer, | | Exchange; |
| | | | Global Equity at California | | Director of |
| | | | Public Employees’ Retirement | | Grange |
| | | | System from October 2002 to | | Insurance |
| | | | February 2008. | | |
| | | | | | |
INFORMATION ABOUT TRUSTEES AND OFFICERS (continued)
| | | | | # of | |
| | | | | Portfolios | Other |
| | | | | in Fund | Directorships |
| | | Term of | Principal | Complex | Held by |
| Name, | Position(s) | Office and | Occupation(s) | Overseen | Trustee |
| Address | Held with | Length of | During the | by | During the |
| and Age | the Fund | Time Served | Past Five Years | Trustee** | Past Five Years |
| | | | | | |
| Bruce Rubin | Vice | One-year | Chief Operating Officer of | N/A | N/A |
| Westchester Capital | President, | term; since | Westchester Capital | | |
| Management, LLC | Chief | 2010 | Management, LLC, the Fund’s | | |
| 100 Summit Lake Drive | Compliance | | Adviser. Chief Operating | | |
| Valhalla, NY 10595 | Officer and | | Officer of Westchester Capital | | |
| Age: 54 | Anti-Money | | Management, Inc., the Fund’s | | |
| | Laundering | | previous adviser, from 2010 to | | |
| | Compliance | | 2010. Chief Operating Officer | | |
| | Officer | | of Seneca Capital from 2005 | | |
| | | | to 2010. | | |
| | | | | | |
| Abraham R. Cary | Secretary | One-year | Head of Trading of Westchester | N/A | N/A |
| Westchester Capital | | term; since | Capital Management, LLC, the | | |
| Management, LLC | | 2012 | Fund’s Adviser, since 2011. | | |
| 100 Summit Lake Drive | | | Head of Trading Westchester | | |
| Valhalla, NY 10595 | | | Capital Management, Inc., the | | |
| Age: 38 | | | Fund’s previous adviser from | | |
| | | | 2002 to 2010. | | |
| * | Denotes a trustee who is an “interested person” (as that term is defined in Section 2(a)(19) of the Investment Company Act of 1940, as amended) of the Fund or of the Adviser. Mr. Behren and Mr. Shannon are deemed to be interested persons because of their affiliation with the Fund’s investment adviser, Westchester Capital Management, LLC, and because they are officers of the Fund. Mr. Behren’s term as a Trustee of the Fund began on January 1, 2014 (See Note 8). |
| ** | The fund complex consists of the Fund, The Merger Fund and WCM Alternatives: Event-Driven Fund. |
| *** | Mr. Behren’s term as a Trustee of the Fund began on January 1, 2014 and Mr. Shannon’s term as a Trustee of The Merger Fund began on January 1, 2014. |
The Merger Fund VL
AVAILABILITY OF PROXY VOTING INFORMATION
Information regarding how the Fund generally votes proxies relating to portfolio securities may be obtained without charge by calling the Fund’s Transfer Agent at 1-800-343-8959 or by visiting the SEC’s website at www.sec.gov. Information regarding how the Fund voted proxies during the most recent 12-month period ended June 30 is available on the SEC’s website or by calling the toll-free number listed above.
AVAILABILITY OF QUARTERLY PORTFOLIO SCHEDULE
The Fund files its complete schedule of portfolio holdings with the SEC for the first and third quarters of each fiscal year on Form N-Q. The Fund’s Forms N-Q are available on the SEC’s website at www.sec.gov and may be reviewed and copied at the SEC’s Public Reference Room in Washington, D.C. Information on the operation of the Public Reference Room may be obtained by calling 1-800-SEC-0330.
(This Page Intentionally Left Blank.)
Investment Adviser
Westchester Capital Management, LLC
100 Summit Lake Drive
Valhalla, NY 10595
(914) 741-5600
Administrator, Transfer Agent, Accountant, Dividend Paying Agent and Shareholder Servicing Agent
U.S. Bancorp Fund Services, LLC
615 East Michigan Street
P.O. Box 701
Milwaukee, WI 53201-0701
(800) 343-8959
Custodian
U.S. Bank, N.A.
1555 North Rivercenter Drive, Suite 302
Milwaukee, WI 53212
(800) 343-8959
Trustees
Roy Behren
Michael T. Shannon
James P. Logan, III
Barry Hamerling
Richard V. Silver
Christianna Wood
Executive Officers
Roy Behren, Co-President and Treasurer
Michael T. Shannon, Co-President
Bruce Rubin, Vice President and
Chief Compliance Officer
Abraham R. Cary, Secretary
Counsel
Ropes & Gray LLP
1211 Avenue of the Americas
New York, NY 10036
Independent Registered
Public Accounting Firm
PricewaterhouseCoopers LLP
100 East Wisconsin Avenue
Milwaukee, WI 53202
Item 2. Code of Ethics.
The registrant has adopted a code of ethics that applies to the registrant’s principal executive officer and principal financial officer. The registrant has not granted any waivers from any provisions of the code of ethics during the period covered by this report. A copy of the registrant’s revised Code of Ethics is filed herewith. You may also receive a copy of the registrant’s Code of Ethics, free of charge, upon request by calling (800) 343-8959.
Item 3. Audit Committee Financial Expert.
The registrant’s board of trustees has determined that there is at least one audit committee financial expert serving on its audit committee. Barry Hamerling and Christianna Wood are the “audit committee financial experts” and are considered to be “independent” as each term is defined in Item 3 of Form N-CSR.
Item 4. Principal Accountant Fees and Services.
The registrant has engaged its principal accountant to perform audit services, audit-related services, tax services and other services during the past two fiscal years. “Audit services” refer to performing an audit of the registrant's annual financial statements or services that are normally provided by the accountant in connection with statutory and regulatory filings or engagements for those fiscal years. “Audit-related services” refer to the assurance and related services by the principal accountant that are reasonably related to the performance of the audit. “Tax services” refer to professional services rendered by the principal accountant for tax compliance, tax advice, and tax planning. The following table details the aggregate fees billed or expected to be billed for each of the last two fiscal years for audit fees, audit-related fees, tax fees and other fees by the principal accountant.
| | FYE 12/31/2013 | FYE 12/31/2012 |
| Audit Fees | $41,200 | $40,000 |
| Audit-Related Fees | $ - | $ - |
| Tax Fees | $5,150 | $5,000 |
| All Other Fees | $ - | $ - |
The audit committee has adopted pre-approval policies and procedures that require the audit committee to pre-approve all audit and non-audit services of the registrant, including services provided to any entity affiliated with the registrant.
The percentage of fees billed by PricewaterhouseCoopers LLP applicable to non-audit services pursuant to waiver of pre-approval requirement were as follows:
| | FYE 12/31/2013 | FYE 12/31/2012 |
| Audit-Related Fees | 0% | 0% |
| Tax Fees | 0% | 0% |
| All Other Fees | 0% | 0% |
All of the principal accountant’s hours spent on auditing the registrant’s financial statements were attributed to work performed by full-time permanent employees of the principal accountant.
The following table indicates the non-audit fees billed or expected to be billed by the registrant’s accountant for services to the registrant and to the registrant’s investment adviser (and any other controlling entity, etc.—not including any sub-advisers) for the last two years. The audit committee of the board of trustees/directors has considered whether the provision of non-audit services that were rendered to the registrant's investment adviser is compatible with maintaining the principal accountant's independence and has concluded that the provision of such non-audit services by the accountant has not compromised the accountant’s independence.
| Non-Audit Related Fees | FYE 12/31/2013 | FYE 12/31/2012 |
| Registrant | - | - |
| Registrant’s Investment Adviser | - | - |
Item 5. Audit Committee of Listed Registrants.
Not applicable.
Item 6. Investments.
The registrant’s Schedule of Investments is included as part of the report to shareholders filed under Item 1 of this Form.
Item 7. Disclosure of Proxy Voting Policies and Procedures for Closed-End Management Investment Companies.
Not applicable.
Item 8. Portfolio Managers of Closed-End Management Investment Companies.
Not applicable.
Item 9. Purchases of Equity Securities by Closed-End Management Investment Company and Affiliated Purchasers.
Not applicable.
Item 10. Submission of Matters to a Vote of Security Holders.
There have been no material changes to the procedures by which shareholders may recommend nominees to the registrant’s board of trustees.
Item 11. Controls and Procedures.
| (a) | The registrant’s Co-President/Chief Executive Officers and Treasurer/Chief Financial Officer (collectively, the “Officers”) have reviewed the registrant's disclosure controls and procedures (as defined in Rule 30a-3(c) under the Investment Company Act of 1940 (the “Act”)) as of a date within 90 days of the filing of this report, as required by Rule 30a-3(b) under the Act and Rules 13a-15(b) or 15d-15(b) under the Securities Exchange Act of 1934. Based on their review, such Officers have concluded that the disclosure controls and procedures are effective in ensuring that information required to be disclosed in this report is appropriately recorded, processed, summarized and reported and made known to them by others within the registrant and by the registrant’s service provider. |
| (b) | There were no changes in the registrant's internal control over financial reporting (as defined in Rule 30a-3(d) under the Act) that occurred during the second fiscal quarter of the period covered by this report that has materially affected, or is reasonably likely to materially affect, the registrant's internal control over financial reporting. |
Item 12. Exhibits.
(a)(1) Any code of ethics or amendment thereto, that is the subject of the disclosure required by Item 2, to the extent that the registrant intends to satisfy Item 2 requirements through filing an exhibit. Filed herewith.
(a)(2) A separate certification for each principal executive and principal financial officer pursuant to Section 302 of the Sarbanes-Oxley Act of 2002. Filed herewith.
(a)(3) Any written solicitation to purchase securities under Rule 23c-1 under the Act sent or given during the period covered by the report by or on behalf of the registrant to 10 or more persons. Not applicable to open-end investment companies.
(b) Certifications pursuant to Section 906 of the Sarbanes-Oxley Act of 2002. Furnished herewith.
SIGNATURES
Pursuant to the requirements of the Securities Exchange Act of 1934 and the Investment Company Act of 1940, the registrant has duly caused this report to be signed on its behalf by the undersigned, thereunto duly authorized.
(Registrant) The Merger Fund VL
By (Signature and Title)* /s/ Michael T. Shannon
Michael T. Shannon, Co-President
Date March 10, 2014
By (Signature and Title)* /s/ Roy Behren
Roy Behren, Co-President and Treasurer
Date March 10, 2014
Pursuant to the requirements of the Securities Exchange Act of 1934 and the Investment Company Act of 1940, this report has been signed below by the following persons on behalf of the registrant and in the capacities and on the dates indicated.
By (Signature and Title)* /s/ Michael T. Shannon
Michael T. Shannon, Co-President
Date March 10, 2014
By (Signature and Title)* /s/ Roy Behren
Roy Behren, Co-President and Treasurer
Date March 10, 2014
* Print the name and title of each signing officer under his or her signature.