December 31, 2016
THE MERGER FUND VL
| | | Total Firm AUM: | $3.8 billion | |
| STANDARDIZED | | Strategy Assets: | | |
| PERFORMANCE SUMMARY | | Merger Arbitrage1 | $3.1 billion | |
| As of December 31, 2016 | | Multi-Event2 | $711.9 million | |
| | Average Annual Total Return (%) |
| Merger Arbitrage | QTD | YTD | 1 YR | 5 YR | 10 YR | Life |
| The Merger Fund | | | | | | |
| (Investor) | 1.09 | 2.61 | 2.61 | 2.07 | 2.44 | 6.18 |
| The Merger Fund | | | | | | |
| (Institutional) | 1.15 | 2.94 | 2.94 | n/a | n/a | 1.82 |
| | Annual Operating Expense Ratio (%)3 |
| | Gross | Net | Net Expenses Before | | |
| Merger Arbitrage | Expense | Expense | Investment Related | Performance | Fund |
| | Ratio | Ratio3 | Expenses4 | Inception5 | AUM |
| The Merger Fund | | | | | |
| (Investor) | 1.90% | 1.77% | 1.34% | 01/31/1989 | $1.5 b |
| The Merger Fund | | | | | |
| (Institutional) | 1.57% | 1.44% | 1.01% | 08/01/2013 | $1.4 b |
| | Average Annual Total Return (%) |
| Insurance | | | | | | |
| Dedicated Funds | QTD | YTD | 1 YR | 5 YR | 10 YR | Life |
| The Merger Fund VL | 0.81 | 2.44 | 2.44 | 1.85 | 3.27 | 4.69 |
| | Annual Operating Expense Ratio (%)3 |
| Insurance | Gross | Net | Net Expenses Before | | |
| Dedicated Funds | Expense | Expense | Investment Related | Performance | Fund |
| | Ratio | Ratio6 | Expenses4 | Inception7 | AUM |
| The Merger Fund VL | 2.60% | 1.82% | 1.40% | 05/26/2004 | $31.8 m |
| | Average Annual Total Return (%) |
| Multi-Event | QTD | YTD | 1 YR | 5 YR | 10 YR | Life |
| Event-Driven Fund | 1.38 | 2.96 | 2.96 | n/a | n/a | 1.55 |
| Annual Operating Expense Ratio (%)3 |
| | Gross | Net | Net Expenses Before | | |
| Multi-Event | Expense | Expense | Investment Related | Performance | Fund |
| | Ratio | Ratio8 | Expenses4 | Inception | AUM |
| Event-Driven Fund | 2.27% | 2.13% | 1.74% | 01/02/2014 | $112.9 m |
QTD and YTD performance is not annualized. Performance data quoted represent past performance; past performance does not guarantee future results. The performance results portrayed herein reflect the reinvestment of all interest, dividends and distributions. The investment return and principal value of an investment will fluctuate so that an investor’s shares, when redeemed, may be worth more or less than their original cost. Current performance of the Funds may be lower or higher than the performance quoted. Performance data included herein for periods prior to 2011 reflect that of Westchester Capital Management, Inc., the Funds’ prior investment advisor. Messrs. Behren and Shannon, the Funds’ current portfolio managers, have served as co-portfolio managers of the Funds since 2007. Performance data current to the most recent month-end may be obtained by calling (800) 343-8959 or by visiting www.westchestercapitalfunds.com.
1Includes USD 54 million in private funds advised by Westchester Capital Management, LLC’s affiliated investment advisor and USD 115 million in a sub-advised fund. 2Includes USD 599 million in sub- advised funds. 3Net expense ratios are as of a fund’s most recent prospectus and were applicable to investors. Prospectus dates vary among funds. For The Merger Fund®, expense ratios are as of the May 2, 2016 prospectus. The Advisor has contractually agreed to waive a portion of its management fee until April 30, 2017 if its assets exceed certain thresholds, beginning at $1.5 billion. For The Merger Fund VL, expense ratios are as of the April 22, 2016 prospectus. For the Event-Driven Fund, expense ratios are as of the May 2, 2016 prospectus. 4Investment related expenses for The Merger Fund, The Merger Fund VL and the WCM Alternatives: Event-Driven Fund include acquired fund fees and expenses of 0.03%, 0.03% and 0.04%, short interest and dividend expenses of 0.40%, 0.39% and 0.35% respectively. 5The inception date of the Merger Fund® Investor share class is January 31, 1989. 6The Merger Fund VL: The Adviser has contractually agreed to waive its investment advisory fee and to reimburse the Fund for other ordinary operating expenses to the extent necessary to limit ordinary operating expenses to an amount not to exceed 1.40%. The expense limitation is expected to apply until April 30, 2017, except that it may be terminated by the Board of Trustees at any time. 7The inception date of The Merger Fund VL is May 26, 2004. 8Event-Driven Fund: The Adviser has contractually agreed to waive its investment advisory fee and to reimburse the Fund for other ordinary operating expenses to the extent necessary to limit ordinary operating expenses of the institutional class of shares to an amount not to exceed 1.74%. The expense limitation is expected to apply until April 30, 2017, except that it may be terminated by the Board of Trustees at any time.
| MARKET INDICES | QTD | YTD | 1 YR | 3 YR | 5 YR | 10 YR |
| BofA Merrill Lynch | | | | | | |
| 3-Month U.S. | | | | | | |
| Treasury Bill Index | 0.09% | 0.33% | 0.33% | 0.14% | 0.12% | 0.80% |
| Barclays Aggregate | | | | | | |
| Bond Index | -2.98% | 2.65% | 2.65% | 3.03% | 2.23% | 4.34% |
| S&P 500 Index | 3.82% | 11.96% | 11.96% | 8.87% | 14.66% | 6.95% |
| The Wilshire | | | | | | |
| Liquid Alternative | | | | | | |
| ED Index | 0.68% | 3.46% | 3.46% | -0.57% | 1.18% | 2.36% |
| The US OE | | | | | | |
| MultiAlternative | | | | | | |
| Category | -0.11% | 0.77% | 0.77% | -0.14% | 1.25% | 0.45% |
| The US OE Market | | | | | | |
| Neutral Index | 1.60% | 1.82% | 1.82% | 0.76% | 1.09% | 0.27% |
Fellow Shareholders,
We live in an increasingly unpredictable world. Black swans, or outlier occurrences, shock us at a mounting rate, often with counterintuitive impacts to boot. The rule of thumb that “the market hates uncertainty” seemed suspended, as markets rose in the face of longshot events which clearly should have created uncertainty. Developments such as Brexit, the election of President Trump, Russian cyber-espionage, North Korean ICBM launches, world-wide terrorism and the Cubs winning the World Series obviously create uncertainty, yet equity markets continue to hit new highs. Nobody could have forecast all of these events, let alone predicted that markets would be UP on Brexit and spike ten percent on the Trump election (not to mention that heavily-shorted Tesla stock would be up 50% during the past three months- just saying). The point is, with the effects being as equally unpredictable as the events themselves, prudent investment managers are scratching their heads seeking stable, predictable and uncorrelated investments. Volatility abounded this year, as the S&P 500 Index dug itself a -10% hole before rallying to gain 9.5% on a sharp post-election bounce.
It is unclear where we go from here, but with equity markets at all-time highs (and earnings multiples extended) and interest rates expected to lift in the near future, it is safe to say that the path of least resistance for both bonds and stocks is not much higher in the near term. The good news from our corner of the investing world is that transaction outcomes are as predictable as ever, and our historic lack of correlation has continued. As we have often discussed, unlike bond investors, we view a rising interest rate environment as attractive, and helpful for arbitrage spreads. Additionally, early indications are that we are entering a uniquely pro-business and free market environment that is conducive to transaction activity.
Although the fourth quarter was challenging and volatile, our Funds gained 1.15%, 0.81% and 1.38% respectively for The Merger Fund®, The Merger Fund VL and the WCM Alternatives: Event Driven Fund, bringing our 2016 full year performance to 2.94%, 2.44% and 2.96% respectively, with the usual fraction of equity market volatility. These returns were in-line with our excess return targets over similarly volatile risk-free investments.1 Although the strong quarter coincided with equity market strength, our performance was actually due to multiple deal completions, successful deal selection and a snap-back in some overextended arbitrage spreads. This was accomplished against a backdrop of an unprecedented number of broken deals, which reinforces the importance of a proven, repeatable investment process should storm clouds gather quickly.
__________
1 | As of 12/31/2016 the three-year trailing standard deviation for The Merger Fund® was 2.96% and for The Merger Fund VL was 2.87% versus 10.74% for the S&P 500 Index. The Standard Deviation for The WCM Event Driven Fund since it’s 1/02/2014 inception was 4.05%. |
Despite the lack of economic clarity, 2016 continued the three year bull market for merger and acquisition activity. Deal flow remained strong yet deal selection was paramount– traditionally a strength of ours. Some interesting stats, for merger transactions with an equity value of >$400mm:2
| | • | Announced deal value in 2016 was $867 billion (vs. 2015’s record level of $1.326 trillion), the fifth highest annual level since 1998. |
| | | |
| | • | Average deal size in 2016 was $5.7 billion, less than the record $8.8 billion in 2015 but greater than the $4.3 billion historical average. |
| | | |
| | • | Average annualized deal spreads narrowed during the year from 6.1% in 1Q16 to 4.6% in 4Q16. |
Interest rates began to rise in the fourth quarter, although the Fed did not officially raise the federal funds rate until December. As noted above, our December commentary, “Which Boats will Rise with the Interest Rate Tide?”3 observes that rising rate environments have traditionally been positive for merger arbitrage (“M&A”) strategies. In fact, our Funds significantly outperformed the Barclays Aggregate Bond Index which fell almost 3 percent in the last quarter of the year. Additionally, we have outperformed the Barclays Index over the last five quarters.4
Forecast for 2017
We expect clear weather for deal activity in 2017 driven by less uncertainty and more confidence than 2016. Executives remain under pressure to drive growth externally if organic growth is lacking. As companies adapt to globalization and technological innovation, many look for a merger, acquisition or other corporate reorganization to stay competitive. Additionally, companies have begun to lock in historically low deal-funding costs before interest rates rise.
Since our December commentary on rates, President Trump has vowed to follow through on his free market campaign pledges. He has pledged to reduce regulatory burdens on business, invest in infrastructure and reform the corporate tax code. Of note, he has also discussed a potential “tax holiday” to encourage repatriation of overseas cash, a move which industry leaders believe would fuel M&A activity. We agree with forecasters such as David Folkerts-Landau, chief economist at Deutsche Bank who believes “[the Trump administration’s] policy mix has the potential of reigniting
__________
2 | Source: UBS US M&A Review: 4Q16 |
3 | Available upon request by email or hard copy |
4 | Since 9/30/2015 – 12/31/2016 The Merger Fund® returned 3.11% versus 1.65% for the Barclays Aggregate Bond Index. |
productivity growth and raising the US growth potential.”5 We also expect this growth will be accompanied by a normalized (read: higher) interest rate environment, with the Federal Reserve continuing its incremental rate hike policy. As a result, we would expect deal activity to ramp and arbitrage spreads to widen in 2017.
STRATEGY UPDATES
Merger Activity
Dealmakers appeared to be cautious during the first three quarters of the year. However, October was the most active month on record for announced deals in the U.S., according to Dealogic, and the fifth busiest month ever for global activity. As a result, full year M&A activity was strong, albeit not at the levels of the past two years.
There were multiple large-scale transactions in 2016, from AT&T’s $85 billion blockbuster bid for Time Warner to German drug maker Bayer’s $56 billion offer for Monsanto, the U.S. genetically modified crop giant. However, deal terminations were plentiful as well. In fact, for definitive strategic deals, the termination rate in 2016 was 5.4% (vs. 3.3% historically), a level that has not been seen since 2008. The chart on the following page, which includes deals not subject to a definitive merger agreement, is interesting:
__________
The broken deals in this chart represent almost one quarter of the $3.55 trillion in transactions announced over the past calendar year.
Deal failures were caused, among other factors, by valuation disagreements, competing bids, and issues revealed during due diligence. Notable terminations in our universe included Allergan-Pfizer, KLA-Tencor-Lam Research, Meredith-Media General, Office Depot-Staples, Hawaiian Electric-NextEra Energy, and Baker Hughes-Halliburton. Given our focus on risk-adjusted returns, we were able to avoid most of these landmines, but caught some shrapnel in the Allergan-Pfizer (discussed in our Q1 letter) and the KLA-Tencor-Lam Research (discussed in our Q3 letter) transactions.
Portfolio Performance Summary
As mentioned above, The Merger Fund® returned 1.15% and its insurance dedicated counterpart, The Merger Fund VL posted a gain of 0.81%, bringing their year-to-date gains to 2.94% and 2.44% respectively. We held 80 investments throughout the quarter and had one terminated transaction. Reflecting a 3:1 ratio of winners to losers, 59 positions posted gains versus 21 with negative marks-to-market. We invested in 20 new situations during the quarter, and as of the end of December we held 66 positions and ended the quarter approximately 94% invested.
The three top winners for the quarter were Ingram Micro, Inc., Yahoo! Inc. and St. Jude Medical, Inc., contributing approximately 20 to 40 basis points each in performance. China-based HNA Group’s $6 billion acquisition of electronics distributor Ingram Micro closed in early December. We have attached a two-page summary of this transaction as an illustrative case study of a complicated acquisition.
Additional contributors:
| | • | While it’s unclear whether Verizon will follow through on a $4.8 billion deal to buy Yahoo’s core internet business, President Donald Trump’s plans to revamp the corporate tax code could benefit Yahoo significantly regardless of the Verizon transaction. |
| | | |
| | • | Abbott Laboratories received U.S. antitrust approval to complete its proposed acquisition of St. Jude Medical in early December. The deal closed on January 4, 2017. |
Of the 21 situations that posted negative marks the three largest were:
| | • | Syngenta/ChemChina: This transaction resulted in negative marks-to-market due to a number of regulatory-related risk elements; however we are optimistic that it will eventually be cleared in the U.S., E.U. and China. Additionally, we remain alert to the protective |
| | | posture of China’s foreign exchange authority, the State Administration of Foreign Exchange (“SAFE”), regarding Yuan outflows to pay for corporate transactions. SAFE approval is required for this deal. |
| | | |
| | • | Bass Pro Shops is acquiring Cabela’s Inc. for about $4.5 billion in cash, uniting two of the biggest sellers of outdoor-sports gear and rivals. As part of the deal, Capital One Financial Corp. is acquiring Cabela’s credit card business. On the last day of the calendar year the parties received a second request from U.S. antitrust regulators. Simultaneously and perhaps more disconcerting, Capital One revealed that the Office of the Comptroller of Currency (“OCC”) was reviewing its Anti-Money Laundering (“AML”) compliance and was unlikely to grant it approval to buy Cabela’s captive credit card bank prior to the October 2017 termination date. Despite the clear strategic rationale for the transaction, we have become cautious due to the OCC issue as well as weakening fundamentals in the firearm sales business, which may become more apparent as the deal is delayed by the financing business approval. |
| | | |
| | • | Macro Hedge – equities rallied, so we lost approximately 8 basis points on our market hedges. |
Our Event Driven Fund had a similar performance profile to The Merger Fund® during this quarter due to an interim large allocation to merger arbitrage. Two of the top three winners and all of the top three detractors were in similar transactions. The largest non-M&A contributor, and the second largest driver of performance, was a position in the secured debt of a late-stage reorganization candidate called Energy Future Holdings (“EFH”). EFH, a Texas-based electric utility company, is the former TXU Energy, which itself was formerly known as Texas Utilities prior to its $45 billion leveraged buyout by Kohlberg Kravis Roberts, Texas Pacific Group, and Goldman Sachs. The company filed for Chapter 11 bankruptcy protection in mid-2014 and began the emergence from bankruptcy process in mid-2016, via an agreement where NextEra Energy will acquire 100 percent of the equity of EFH and certain of its subsidiaries.
When the price just doesn’t add up: Appraisal Actions
After not participating for many years, we have commenced two appraisal actions in Delaware Chancery Court on behalf of our Funds. The concept behind exercising appraisal rights is to allow shareholders judicial recourse when they believe they are receiving less than fair value for their shares pursuant to a merger transaction. The majority of U.S. public companies
are incorporated in Delaware, and these claims would be governed by the Delaware General Corporation Law. In circumstances where plaintiff shareholders can persuade the court that fair value was not paid for the target company’s shares, or where price paid was not determined on an arm’s length basis, dissenting shareholders can often be awarded significantly more by the Court than the consideration offered in the transaction. The plaintiffs need not prove any claimed wrongdoing, but merely that less than “fair value” was to be paid for the shares.
Based on our internal models and discounted cash flow methodology, we have concluded that Newell Brands Inc. significantly underpaid for Jarden Corp. and shareholders of Columbia Pipeline Group received less than fair value from TransCanada Corp. There are many factors and methodologies that may affect the analysis, such as growth assumptions, cost of capital, and the history of the negotiation and sale process.
Here, briefly, are some of the allegations contained in our complaints, which form the basis for our claims:
Jarden
| | • | Jarden ran a single bidder process and did not run a market check to see whether other strategic or financial buyers would pay a higher price than Newell. |
| | | |
| | • | Martin Franklin, the Company’s Executive Chairman, was the lead negotiator for Jarden. He, along with the Company’s Vice Chairman and President and the Company’s CEO, received substantial golden parachute payments estimated at hundreds of millions dollars. This included the accelerated vesting of equity awards that may never have vested, an option to acquire the Company’s Aspen office, an option to purchase Jarden’s aircraft, and a post-closing consulting agreement. |
| | | |
| | • | When the Merger Agreement was signed, Jarden had not yet realized expected synergies from some of its prior acquisitions, which appear not to have been incorporated into the deal price. |
| | | |
| | • | Based on the above, we believe that the $59.21 per share value of cash and Newell stock offered significantly less than fair value consideration. |
Columbia Pipeline
| | • | Columbia Pipeline Group was spun off from NiSource Inc. in a structure that incentivized management and insiders to sell the company and trigger lucrative change-of-control compensation awards. |
| | • | We believe that within two days of being spun-off, Columbia was marketed to be sold. Reflecting the board’s sense of company value, they rejected a $32.50 to $35.50 per share takeover bid in August 2015, asserting that a more appropriate price would be in the upper $30s. |
| | | |
| | • | The energy market plummeted thereafter, and Columbia’s management subsequently began to negotiate solely with TransCanada, ultimately agreeing to sell the company at what we believe was a “fire sale” price close to the trough of the energy market decline (March 2016). |
| | | |
| | • | Pursuant to this agreed transaction, Columbia board members received approximately $72 million, with the CEO and CFO alone receiving over $63 million. |
| | | |
| | • | Significantly, energy prices spiked during the pendency of the transaction, causing the agreed deal value on the closing date to be significantly below fair value. |
| | | |
| | • | Based on the above, we believe that the Columbia Pipeline merger price of $25.50 significantly undervalued the company. |
We intend to pursue these actions to an appropriate conclusion on behalf of our investors, which we think will deliver an attractive outcome. We view these positions as we would any other investment, carefully balancing risk and liquidity versus the potential reward. Both position sizes are moderate, and are part of our diversified portfolio of merger investments.
OUR COMPANY
WCM manages a total of five SEC-registered mutual funds. Our other vehicles span a spectrum from lower-return, lower-volatility expectations to higher volatility with potentially higher return expectations:
| Account | Vehicle | Strategy | Inception |
The Merger Fund® | | | |
| Investor Share | | | |
| Class (MERFX) | SEC ‘40-Act Fund | Merger Arbitrage | 1989 |
| Institutional Share | | | |
| Class (MERIX) | SEC ‘40-Act Fund | Merger Arbitrage | 2013 |
| The Merger | | | |
| Fund VL (MERVX) | Variable Insurance Trust | Merger Arbitrage | 2004 |
| Dunham Monthly | | | |
| Distribution Fund | Sub-advised | | |
| (DNMDX) | SEC ‘40-Act Fund | Event-Driven | 2008 |
| WCM Alternatives: | | | |
| Event-Driven | | | |
| Fund (WCEIX) | SEC ‘40-Act Fund | Event-Driven | 2014 |
| JNL/Westchester | | | |
| Capital Event | Sub-advised | | |
| Driven Fund | SEC ‘40-Act Fund | Event-Driven | 2015 |
| Westchester Merger | | | |
| Arbitrage Strategy | | | |
| of theJNL | | | |
Multi-Manager | Sub-advised | | |
| Alternative Fund | SEC ‘40-Act Fund | Merger Arbitrage | 2016 |
As usual, quarterly statistical summaries for any of our vehicles are provided within two weeks of the end of the quarter- typically one month prior to the release of the quarterly letter. They are available electronically on our website, and we would be happy to provide a scheduled email as soon as the data becomes available. For convenience, investors can arrange for e-alerts of important Fund communications. Through our website at www.westchestercapitalfunds.com, you can check direct account balances, make purchases and sales, and sign up for notification of trade confirmations, statements and shareholder communications via e-mail.
CASE STUDY: INGRAM MICRO INC.
Merger arbitrage investing is often complex. As investors have asked to better understand our process and its application to individual deals, we thought it would be helpful to provide a case study on a successful deal.
The acquisition of Ingram Micro (“Ingram”) for US $6bln in cash ($38.90/share) by Tianjin Tianhai Investment Company Ltd. (“TTI”) which closed in December, contributed almost 40 basis points (gross, not annualized) to our funds’ performance for the year. The deal is particularly interesting because of the multiple facets that needed to be investigated, analyzed and forecasted by our team, counsel and consultants. It also
showcases the importance of a thorough investment and risk management process.
The transaction was announced in February of 2016 and was completed 10 months later after many ups and downs.
The Courtship
Ingram is a distributor of IT hardware, software and logistics services to suppliers and reseller customers. TTI, a majority-owned subsidiary of HNA group (a China-based Fortune Global 500 conglomerate), provides international transportation services, among other operations. HNA is not a State-Owned Entity but many of its executives are well-connected in the Chinese government. The rationale for this strategic transaction was to expand HNA’s expertise, capabilities and geographic reach.
It was an immediate love fest— Ingram stated that it “will now be part of a larger organization that has complementary logistics capabilities and a strong presence in China that can further support the growth and profitability objectives of our vendor and customer partners.” The CEO of HNA group chimed in with “After the transaction, Ingram Micro would become the largest member enterprise of HNA Group in terms of revenue, and facilitate the internationalization process of the group. With the help of Ingram Micro, HNA Group would have access to business opportunities in emerging markets…Furthermore, the addition of Ingram Micro would help…HNA Group transform from a logistics operator to a supply chain operator, and provide one-stop services while improving efficiencies.”
But Hold Off on the Nuptials
Sounds great, right? On the surface, this was a great strategic fit for both companies. But a deeper dive revealed an apparent tough road to completion. Here are some of the litany of conditions that were required for the transaction:
| | • | SEC proxy review |
| | | |
| | • | Antitrust approvals in U.S. (Hart-Scott Rodino), Canada, Brazil, India, China, Turkey, Mexico, South Africa, Italy, Austria, Poland, and Slovakia |
| | | |
| | • | Chinese SAFE; Committee on Foreign Investment in the U.S. (“CFIUS”) |
| | | |
| | • | Shanghai Stock Exchange Clearance; Tianjin Tianhai shareholder approval |
| | | |
| | • | Ingram shareholder approval |
Uncertainty Creates Opportunity
The merger agreement was filed the day of the announcement, which disclosed the conditions, representations of the parties, termination provisions and other important details of the transaction, including a commitment by HNA to pay a USD $400mm termination fee if it were unable to close the deal. This provision signaled a high level of commitment on the part of the Chinese acquirer. However, this transaction traded at an extremely wide arbitrage spread, which reflected the level of risk stemming from the plethora of approvals, the 35% premium paid and the “X factor” of a Chinese buyer.
Our Analysis & Conclusions
We immediately went to work tracking the various approval processes, which is typical; however, overlaid on this assessment were Chinese currency and antitrust reviews as well as an assessment by CFIUS, which investigates any transaction or investment in a U.S. business or asset by a foreign person that may raise national security concerns or involve critical infrastructure. Antitrust review appeared not to be a problem since the parties did not compete with each other. The majority of our resources were spent on the most complicated and opaque approvals, which were the CFIUS and SAFE reviews.
We ultimately concluded that the transaction was attractive as an investment for the following reasons:
| | • | It had a high likelihood of being successfully completed because the merger agreement was tightly written in favor of the target company |
| | | |
| | • | The buyer had committed to a larger than typical termination fee |
| | | |
| | • | The regulatory conditions seemed surmountable, including the Chinese approvals |
| | | |
| | • | Most importantly, the stock appeared mispriced in the market, trading at a level that implied successful completion was more or less a coin toss |
Regarding CFIUS, our take, in consultation with counsel, was that Ingram was merely a reseller of generic electronic equipment, with less than 3% of its sales reaching the U.S. government as end customers, and the transaction posed no threat to national security. After initially claiming that CFIUS approval was not even needed, several months later TTI decided to make the filing. The stock promptly dropped below $33 in July, creating an arbitrage spread of $5.90/share, which implied an approximately 40% likelihood of deal success. We viewed this as mispriced and added to our positions.
As the CFIUS process played out behind closed doors, China’s currency came under extreme pressure and its government, through SAFE, began a policy of limiting the outflow of money to purchase external assets. Through consultants, we became informed enough to forecast the likelihood of SAFE approval and concluded that currency market fears were overblown as well. We concluded that the SAFE crackdown was more targeted at speculative flows and financially-driven transactions designed to spirit yuan out of the country, rather than strategic deals by Chinese buyers.
We ultimately concluded that the stock was significantly mispriced because:
| | 1. | We were comfortable that CFIUS approval was highly likely |
| | | |
| | 2. | SAFE concerns were a red herring because the deal was highly strategic; the buyer was a known, favored corporate citizen in China, and the deal was being funded by U.S. dollars, not yuan, borrowed from banks outside of China |
| | | |
| | 3. | The $400mm break fee showed that the buyer was willing to put significant skin in the game. Additionally, Ingram’s business remained strong throughout the year, consistently increasing its standalone value (giving us less downside) in the event of deal termination |
Consequently, our position size peaked in excess of 4% in late November, exposing the Funds to approximately 0.6% of value-at-risk. The companies continued to knock out the required approvals as they awaited CFIUS, and by the time they received CFIUS approval on November 1st, all approvals except SAFE had been received.
The spread remained wide and we held onto the position, optimistic that the final approval was in sight. The parties, after agreeing to extend the termination (also known as “walkaway date”) from mid-August to mid-November, agreed again to extend the date to mid-December. This was another positive data point for the good guys, so we stuck with the position. The parties received SAFE approval on December 2nd, the deal closed on December 5th, capping one of our most interesting deals to date. We would be happy to discuss this deal and our investment process in greater detail with any investor who may be interested.
 |  |
| | |
| Roy Behren | Mike Shannon |
IMPORTANT DISCLOSURES
Before investing in The Merger Fund® and/or WCM Alternatives: Event-Driven Fund, carefully consider the investment objectives, risks, charges and expenses. For a prospectus or summary prospectus containing this and other information, please call (800) 343-8959. Please read the prospectus carefully before investing. The Merger Fund VL is available through variable products offered by third-party insurance companies. For a prospectus containing information for any variable annuity or variable life product that invests in The Merger Fund VL, contact your financial advisor or the offering insurance company for a contract prospectus and prospectus for the underlying funds. To obtain a prospectus for the Dunham Monthly Distribution Fund, please visit www.dunham.com. Please read it carefully before investing. Shares of JNL/Westchester Capital Event Driven Fund are offered to separate accounts of participating life insurance companies for the purpose of funding variable annuity contracts and variable life insurance policies. Shares of the fund are not offered directly to the public. For a prospectus containing information for any variable annuity or variable life product that invests in the Fund, contact your financial advisor or the offering insurance company for a contract prospectus and prospectus for the underlying funds. Please read it carefully before investing. Variable annuities are long-term, tax-deferred investments designed for retirement, involve investment risks and may lose value. Earnings are taxable as ordinary income when distributed and may be subject to a 10% federal tax penalty if withdrawn before age 59½. Optional benefit costs are added to the ongoing fees and expenses of the variable annuity.
Variable annuities (VA650, VA660) are issued by Jackson National Life Insurance Company® (Home Office: Lansing, Michigan) and in New York (VA650NY, VA660NY) by Jackson National Life Insurance Company of New York® (Home Office: Purchase, New York). Variable annuities are distributed by Jackson National Life Distributors LLC, member FINRA. May not be available in all states and state variations may apply. These products have limitations and restrictions, including withdrawal charges, recapture charges and excess interest adjustments (interest rate adjustments in New York) where applicable. Jackson® issues other annuities with similar features, benefits, limitations and charges. Contact Jackson for more information. Jackson is the marketing name for Jackson National Life Insurance Company and Jackson National Life Insurance Company of New York.
Fund holdings and sector allocations are subject to change and should not be considered a recommendation to buy or sell any security. The Ten Largest Positions as a Percent of Net Assets for The Merger Fund® as of December 31, 2016 were: Yahoo! Inc. (4.87%), Jarden Corporation (4.36%), St. Jude Medical, Inc. (3.96%), Harman International Industries, Inc. (3.54%), American Capital Ltd. (3.25%), Syngenta AG (3.24%), NXP Semiconductors NV (3.10%), Sky PLC (3.00%), Endurance Specialty Holdings Limited (2.85%), Linear Technology Corporation (2.83%). The Ten Largest Positions as a Percent of Net Assets for The Merger Fund VL as of December 31, 2016 were: Yahoo! Inc. (4.17%), Harman International Industries, Inc. (3.47%), American Capital Ltd. (3.18%), Jarden Corporation (3.17%), Syngenta AG (3.05%), NXP Semiconductors NV (3.04%), St. Jude Medical, Inc. (3.03%), Sky PLC (2.96%), The Valspar Corporation (2.77%), Linear Technology Corporation (2.75%). The Ten Largest Positions as a Percent of Net Assets for WCM Alternatives: Event-Driven Fund as of December 31, 2016 were: Yahoo! Inc. (4.50%), Hewlett Packard Enterprise Company (3.94%), American Capital Ltd. (3.78%), Harman International Industries, Inc. (3.70%), Sky PLC (3.56%), Syngenta AG (3.54%), Jarden Corporation (3.43%), Reynolds American Inc. (3.37%), St. Jude Medical, Inc. (3.37%), NXP Semiconductors NV (3.33%).
Diversification does not assure a profit, nor does it protect against a loss in a declining market.
Mutual fund investing involves risk. Principal loss is possible. Merger‐arbitrage and event‐driven investing involves the risk that the adviser’s evaluation of the outcome of a proposed event, whether it be a merger, reorganization, regulatory issue or other event, will prove incorrect and that the Funds’ return on the investment will be
negative. Investments in foreign companies may entail political, cultural, regulatory, legal, and tax risks different from those associated with comparable transactions in the United States. The frequency of the Fund’s transactions will vary from year to year, though merger arbitrage portfolios typically have higher turnover rates than portfolios of typical long‐only funds. Increased portfolio turnover may result in higher brokerage commissions, dealer mark‐ups and other transaction costs. The higher costs associated with increased portfolio turnover may offset gains in the Fund’s performance. The Funds’ may enter into short sale transactions for, among other reasons, purposes of protecting against a decline in the market value of the acquiring company’s shares prior to the acquisition completion. If the price of a security sold short increases between the time of the short sale and the time the Fund covers its short position, the Fund will incur a loss. The amount of a potential loss on an uncovered short sale transaction is theoretically unlimited. Debt securities may fluctuate in value due to, among other things, changes in interest rates, general economic conditions, industry fundamentals, market sentiment and the financial condition of the issuer, including the issuer’s credit rating or financial performance. Derivatives may create leverage which will amplify the effect of the performance of those instruments on the Funds’ and may produce significant losses. The Funds’ hedging strategy will be subject to the Funds’ investment adviser’s ability to assess correctly the degree of correlation between the performance of the instruments used in the hedging strategy and the performance of the investments in the portfolio being hedged.
References to other mutual funds do not construe an offer of those securities. Any tax or legal information provided is merely a summary of our understanding and interpretation of some of the current income tax regulations and is not exhaustive. Investors must consult their tax advisor or legal counsel for advice and information concerning their particular situation. Neither the Funds’ nor any of their representatives may give legal or tax advice.
The views expressed are as of February 14, 2017 and are a general guide to the views of Westchester Capital Management, are subject to change, are not guaranteed and should not be considered recommendations to buy or sell any security. This document does not replace portfolio and fund-specific materials.
The Morningstar Rating™ for funds, or “star rating”, is calculated for managed products (including mutual funds, variable annuity and variable life subaccounts, exchange-traded funds, closed-end funds, and separate accounts) with at least a three-year history. Exchange-traded funds and open-ended mutual funds are considered a single population for comparative purposes. It is calculated based on a Morningstar Risk-Adjusted Return measure that accounts for variation in a managed product’s monthly excess performance, placing more emphasis on downward variations and rewarding consistent performance. The top 10% of products in each product category receive 5 stars, the next 22.5% receive 4 stars, the next 35% receive 3 stars, the next 22.5% receive 2 stars, and the bottom 10% receive 1 star. The Overall Morningstar Rating™ for a managed product is derived from a weighted average of the performance figures associated with its three-, five-, and 10-year (if applicable) Morningstar Rating™ metrics. The weights are: 100% three-year rating for 36-59 months of total returns, 60% five-year rating/40% three-year rating for 60-119 months of total returns, and 50% 10-year rating/30% five-year rating/20% three-year rating for 120 or more months of total returns. While the 10-year overall star rating formula seems to give the most weight to the 10-year period, the most recent three-year period actually has the greatest impact because it is included in all three rating periods. As of December 31, 2016, The Merger Fund® was rated against the following numbers of U.S.-domiciled Market Neutral funds over the following time periods: 118 funds in the last three years, 70 funds in the last five years, and 27 funds in the last ten years. With respect to these Market Neutral funds, The Merger Fund®- Investor received a Morningstar Rating of 3 stars, 3 stars and 4 stars for the three-, five- and ten year periods, respectively; The Merger Fund® - Institutional received a Morningstar Rating of 3 stars, 4 stars and 4 stars for the three-, five- and ten-year periods, respectively. 5 and 10 year ratings are Extended Performance Ratings computed by
Morningstar based on the MERFX share class. © 2016 Morningstar, Inc. All Rights Reserved. The information contained herein: (1) is proprietary to Morningstar; (2) may not be copied or distributed; and (3) is not warranted to be accurate, complete or timely.
Neither Morningstar nor its content providers are responsible for any damages or losses arising from any use of this information. Past performance is no guarantee of future results.
Absolute return strategies are not intended to outperform stocks and bonds during strong market rallies. An absolute return fund may not achieve its goals and may underperform during periods of strong positive market performance.
Definitions: The S&P 500 Index is a broad based unmanaged index of 500 stocks, which is widely recognized as representative of the equity market in general; The Barclays Aggregate Bond Index is an intermediate term index comprised of investment grade bonds; The Morningstar Category: US Fund Market Neutral is comprised of a universe of funds with similar investment objectives; The Morningstar Category: The US Fund MultiAlternative encompasses funds that have a majority of their assets exposed to alternative strategies and include both funds with static allocations to alternative strategies and funds tactically allocating among alternative strategies and asset classes. The BofA Merrill Lynch US 3-Month Treasury Bill Index is comprised of a single issue purchased at the beginning of the month and held for a full month. Indices are unavailable for direct investment. The Wilshire Liquid Alternative Event Driven IndexSM measures the performance of the event driven strategy component of The Wilshire Liquid Alternative IndexSM. Event driven strategies predominantly invest in companies involved in corporate transactions such as mergers, restructuring, distressed, buy backs, or other capital structure changes. The Wilshire Liquid Alternative Event Driven Index (WLIQAED) is designed to provide a broad measure of the liquid alternative event driven market. Standard Deviation is the degree by which returns vary relative to the average return. The higher the standard deviation, the greater the variability of the investment; A basis point (often denoted as bps) is a unit equal to 1/100 of a percentage point and can be summarized as follows: 1% change = 100 basis points and 0.01% = 1 basis point; Correlation is calculated using R-Squared; which is a measure that represents the percentage of a fund’s movements that can be explained by movements in a benchmark index. A fund with low R-squared doesn’t act much like the index.
The returns shown are based on net asset values calculated for shareholder transactions and may differ from the returns shown in the financial highlights of the annual report, which reflects adjustments made to the net asset values in accordance with accounting principles generally accepted in the United States of America.
Expense ratios are as of a Fund’s most recent prospectus and may differ from the more recent expense ratios reported in the financial highlights of the most recent annual or semi-annual report.
The SEC does not endorse, indemnify, approve nor disapprove of any security.
The Merger Fund® and WCM Alternatives: Event-Driven Fund is distributed by Quasar Distributors, LLC. The Merger VL is available through variable products offered by third-party insurance companies and is not affiliated with Quasar Distributors, LLC. The Dunham Monthly Distribution Fund, which is sub-advised by Westchester Capital Management, LLC, is distributed by Dunham and Associates Investment Counsel, which have no affiliation with Quasar Distributors, LLC.
DEAL COMPOSITION
The Merger Fund VL (Unaudited)
| Type of Buyer | | Deal Terms* | | |
| Strategic | 100.0% | | | Cash | 41.9% | |
| Financial | 0.0% | | | Cash & Stock | 28.2% | |
| | | | | Stock and Stub(1) | 20.9% | |
| By Deal Type | | Stock with Fixed Exchange Ratio | 5.9% | |
| Friendly | 97.1% | | | Undetermined(2) | 2.9% | |
| Hostile | 2.9% | | | Stock with Flexible | | |
| | | | | Exchange Ratio (Collar) | 0.2% | |
| * | Data expressed as a percentage of long common stock, corporate bonds and swap contract positions as of December 31, 2016. |
(1) | “Stub” includes assets other than cash and stock (e.g., escrow notes). |
(2) | The compensation is undetermined because the compensation to be received (e.g., stock, cash, escrow notes, other) will be determined at a later date, potentially at the option of the Fund’s investment adviser. |
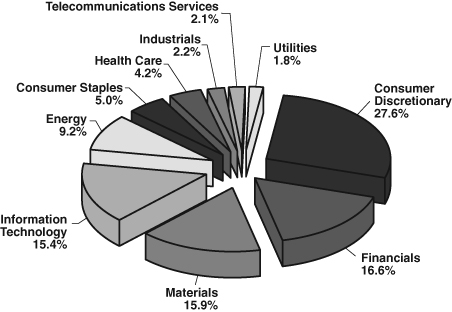
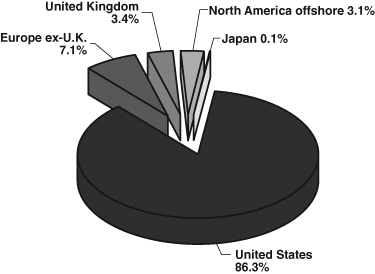
PORTFOLIO COMPOSITION*
The Merger Fund VL (Unaudited)
By Sector
By Region
| * | Data expressed as a percentage of long common stock, corporate bonds and swap contract positions as of December 31, 2016. Data expressed excludes short-term investments, short investments, written options, forward currency exchange contracts and short total return swap contracts. Please refer to the Schedule of Investments, Schedule of Options Written, Schedule of Forward Currency Exchange Contracts and Schedule of Swap Contracts for more details on the Fund’s individual holdings. |
The Global Industry Classification Standard (GICS®) was developed by and/or is the exclusive property of MSCI, Inc. and Standard & Poor’s Financial Services LLC (“S&P”). GICS is a service mark of MSCI and S&P and has been licensed for use by U.S. Bancorp Fund Services, LLC.
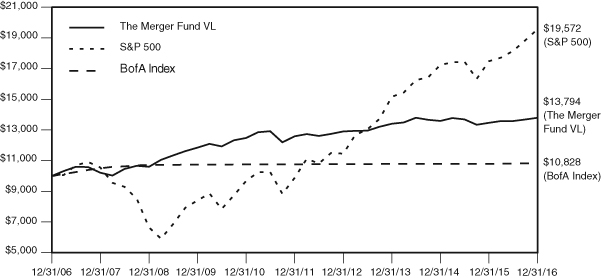
COMPARISON OF CHANGE IN VALUE OF $10,000 INVESTMENT
IN THE MERGER FUND VL, S&P 500 AND BofA MERRILL LYNCH
3-MONTH U.S. TREASURY BILL INDEX*
THE MERGER FUND VL
AVERAGE ANNUAL TOTAL RETURN
as of December 31, 2016
| | 1 Year | 3 Year | 5 Year | 10 Year |
| The Merger Fund VL | 2.44% | 0.96% | 1.85% | 3.27% |
| BofA Index | 0.33% | 0.14% | 0.12% | 0.80% |
| S&P 500 | 11.96% | 8.87% | 14.66% | 6.95% |
This chart assumes an initial gross investment of $10,000 made on December 31, 2006. Returns shown include the reinvestment of all dividends. Past performance is not predictive of future performance. The graph and table do not reflect the deduction of taxes that a shareholder would pay on fund distributions or upon redemption of fund shares. Investment return and principal value will fluctuate, so that your shares, when redeemed, may be worth more or less than the original cost. The Standard & Poor’s 500 Index (“S&P 500”) is a broad based unmanaged index of 500 stocks, which is widely recognized as representative of the equity market in general. The BofA Merrill Lynch U.S. 3-Month Treasury Bill Index (“BofA Index”) is comprised of a single issue purchased at the beginning of the month and held for a full month. At the end of the month that issue is sold and rolled into a newly selected issue. The issue selected at each month-end rebalancing is the outstanding Treasury Bill that matures closest to, but not beyond, three months from the rebalancing date. To qualify for selection, an issue must have settled on or before the month-end rebalancing date. The index is unmanaged and does not include any expenses, fees or sales charges. It is not possible to invest directly in an index.
| * | The Fund compares its performance in this annual report to the BofA Index. The Fund’s Advisor believes the BofA Index is a more appropriate index against which to compare the Fund’s performance than the Fund’s former index, the S&P 500, in light of the Fund’s investment strategies, including those that may be characterized as market neutral strategies. |
The Merger Fund VL
EXPENSE EXAMPLE
December 31, 2016 (Unaudited)
As a shareholder of the Fund, you incur two types of costs: (1) transaction costs and (2) ongoing costs, including management fees, distribution and/or service fees, and other Fund expenses. This example is intended to help you understand your ongoing costs (in dollars) of investing in the Fund and to compare these costs with the ongoing costs of investing in other mutual funds. The example is based on an investment of $1,000 invested at the beginning of the period and held for the period 7/1/16 – 12/31/16.
Actual Expenses
The first line of the table below provides information about actual account values and actual expenses. You may use the information in this line, together with the amount you invested, to estimate the expenses that you paid over the period. Simply divide your account value by $1,000 (for example, an $8,600 account value divided by $1,000 = 8.6), then multiply the result by the number in the first line under the heading entitled “Expenses Paid During Period” to estimate the expenses you paid on your account during this period. The example below includes, among other fees, management fees, fund accounting, custody and transfer agent fees. However, the example below does not include portfolio trading commissions and related expenses or extraordinary expenses. In addition, charges and expenses at the insurance company separate account level are not reflected.
Hypothetical Example for Comparison Purposes
The second line of the table below provides information about hypothetical account values and hypothetical expenses based on the Fund’s actual expense ratio and an assumed rate of return of 5% per year before expenses, which is not the Fund’s actual return. The hypothetical account values and expenses may not be used to estimate the actual ending account balance or expenses you paid for the period. You may use this information to compare the ongoing costs of investing in the Fund and other funds. To do so, compare this 5% hypothetical example with the 5% hypothetical examples that appear in the shareholder reports of the other funds. Please note that the expenses shown in the table are meant to highlight your ongoing costs only. Therefore, the second line of the table is useful in comparing ongoing costs only, and will not help you determine the relative total costs of owning different funds.
The Merger Fund VL
EXPENSE EXAMPLE (continued)
December 31, 2016 (Unaudited)
| | | | | Expenses |
| | | | | Paid |
| | Beginning | Ending | | During |
| | Account | Account | Annualized | Period |
| | Value | Value | Expense | 7/1/16 — |
| | 7/1/16 | 12/31/16 | Ratio | 12/31/16* |
Actual+(1) | $1,000.00 | $1,015.70 | 2.10% | $10.64 |
Hypothetical+(2) | $1,000.00 | $1,014.54 | 2.10% | $10.63 |
| * | Expenses are equal to the Fund’s annualized net expense ratio multiplied by the average account value over the period, multiplied by 184/366 (to reflect the one-half year period). |
| + | Excluding dividends and borrowing expense on securities sold short, your actual cost of investment in and your hypothetical cost of investment in the Fund would have been $7.09 and $7.10, respectively. |
| (1) | Ending account values and expenses paid during the period based on a 1.57% return. This actual return is net of expenses. |
| (2) | Ending account values and expenses paid during period based on a hypothetical 5.00% annual return before expenses. |
The Merger Fund VL
SCHEDULE OF INVESTMENTS
December 31, 2016
| Shares | | | | Value | |
| | |
| LONG INVESTMENTS — 110.51% | |
| | |
| COMMON STOCKS — 75.77% | |
| | | | | | |
| | | AEROSPACE & DEFENSE — 1.18% | | | |
| | 6,231 | | B/E Aerospace, Inc. (e) | | $ | 375,044 | |
| | | | | | | | |
| | | | ALTERNATIVE CARRIERS — 1.34% | | | | |
| | 7,586 | | Level 3 Communications, Inc. (a) | | | 427,547 | |
| | | | | | | | |
| | | | APPLICATION SOFTWARE — 1.93% | | | | |
| | 16,665 | | Mentor Graphics Corporation | | | 614,772 | |
| | | | | | | | |
| | | | ASSET MANAGEMENT & CUSTODY BANKS — 0.80% | | | | |
| | 17,096 | | NorthStar Asset Management Group, Inc. | | | 255,072 | |
| | | | | | | | |
| | | | AUTO PARTS & EQUIPMENT — 0.10% | | | | |
| | 520 | | Adient plc (a)(b) | | | 30,477 | |
| | | | | | | | |
| | | | BROADCASTING — 1.16% | | | | |
| | 3,700 | | CBS Corporation Class B | | | 235,394 | |
| | 1,100 | | iHeartMedia, Inc. (a) | | | 1,221 | |
| | 7,117 | | Media General, Inc. (a)(e) | | | 134,013 | |
| | | | | | | 370,628 | |
| | | | | | | | |
| | | | BUILDING PRODUCTS — 0.67% | | | | |
| | 5,200 | | Johnson Controls International plc (b) | | | 214,188 | |
| | | | | | | | |
| | | | CABLE & SATELLITE — 0.53% | | | | |
| | 4,891 | | Liberty Media Corporation-Liberty | | | | |
| | | | SiriusXM Class A (a)(e) | | | 168,837 | |
| | | | | | | | |
| | | | CASINOS & GAMING — 0.15% | | | | |
| | 1,894 | | Isle of Capri Casinos, Inc. (a) | | | 46,763 | |
| | | | | | | | |
| | | | COMMODITY CHEMICALS — 0.06% | | | | |
| | 903 | | Valvoline, Inc. | | | 19,414 | |
| | | | | | | | |
| | | | CONSUMER ELECTRONICS — 3.47% | | | | |
| | 9,947 | | Harman International Industries, Inc. (e) | | | 1,105,709 | |
| | | | | | | | |
| | | | DIVERSIFIED CHEMICALS — 2.31% | | | | |
| | 12,872 | | The Dow Chemical Company (e) | | | 736,536 | |
| | | | | | | | |
| | | | DRUG RETAIL — 0.47% | | | | |
| | 18,319 | | Rite Aid Corporation (a) | | | 150,949 | |
| | | | | | | | |
| | | | FERTILIZERS & AGRICULTURAL CHEMICALS — 3.92% | | | | |
| | 4,100 | | Monsanto Company | | | 431,361 | |
| | 10,347 | | Syngenta AG — ADR (e) | | | 817,930 | |
| | | | | | | 1,249,291 | |
The accompanying notes are an integral part of these financial statements.
The Merger Fund VL
SCHEDULE OF INVESTMENTS (continued)
December 31, 2016
| Shares | | | | Value | |
| | | | | | |
| | | FINANCIAL EXCHANGES & DATA — 0.28% | | | |
| | 2,621 | | Bats Global Markets, Inc. | | $ | 87,830 | |
| | | | | | | | |
| | | | HEALTH CARE EQUIPMENT — 3.04% | | | | |
| | 12,049 | | St. Jude Medical, Inc. (e) | | | 966,209 | |
| | | | | | | | |
| | | | HEALTHCARE SERVICES — 0.03% | | | | |
| | 136 | | Envision Healthcare Corporation (a) | | | 8,607 | |
| | | | | | | | |
| | | | HOTELS, RESORTS & CRUISE LINES — 2.41% | | | | |
| | 28,200 | | Hilton Worldwide Holdings, Inc. | | | 767,040 | |
| | | | | | | | |
| | | | HOUSEWARES & SPECIALTIES — 3.17% | | | | |
| | 16,060 | | Jarden Corporation (a)(d)(g)(j) | | | 1,008,345 | |
| | | | | | | | |
| | | | INTERNET SOFTWARE & SERVICES — 4.17% | | | | |
| | 34,357 | | Yahoo!, Inc. (a)(e) | | | 1,328,585 | |
| | | | | | | | |
| | | | MOVIES & ENTERTAINMENT — 2.65% | | | | |
| | 8,733 | | Time Warner, Inc. | | | 842,996 | |
| | | | | | | | |
| | | | MULTI-LINE INSURANCE — 2.46% | | | | |
| | 12,000 | | American International Group, Inc. | | | 783,720 | |
| | | | | | | | |
| | | | OIL & GAS & CONSUMABLE FUELS — 0.69% | | | | |
| | 6,108 | | Energy Transfer Partners LP | | | 218,727 | |
| | | | | | | | |
| | | | OIL & GAS EQUIPMENT & SERVICES — 3.94% | | | | |
| | 9,800 | | Baker Hughes, Inc. | | | 636,706 | |
| | 17,201 | | FMC Technologies, Inc. (a)(e)(f) | | | 616,639 | |
| | | | | | | 1,253,345 | |
| | | | OIL & GAS REFINING & MARKETING — 0.13% | | | | |
| | 4,559 | | Showa Shell Sekiyu K.K. (b) | | | 42,401 | |
| | | | | | | | |
| | | | OIL & GAS STORAGE & TRANSPORTATION — 2.47% | | | | |
| | 16,892 | | Columbia Pipeline Group, Inc. (a)(d)(g)(j) | | | 434,400 | |
| | 20,482 | | Columbia Pipeline Partners LP (e) | | | 351,266 | |
| | | | | | | 785,666 | |
| | | | | | | | |
| | | | PACKAGED FOODS & MEATS — 1.21% | | | | |
| | 6,427 | | Lamb Weston Holdings, Inc. (a) | | | 243,262 | |
| | 2,529 | | The WhiteWave Foods Company (a)(e) | | | 140,612 | |
| | | | | | | 383,874 | |
| | | | | | | | |
| | | | PERSONAL PRODUCTS — 0.05% | | | | |
| | 848 | | Coty, Inc. Class A | | | 15,527 | |
The accompanying notes are an integral part of these financial statements.
The Merger Fund VL
SCHEDULE OF INVESTMENTS (continued)
December 31, 2016
| Shares | | | | Value | |
| | | | | | |
| | | REGIONAL BANKS — 2.19% | | | |
| | 13,600 | | CIT Group, Inc. (e) | | $ | 580,448 | |
| | 2,157 | | PrivateBancorp, Inc. | | | 116,888 | |
| | | | | | | 697,336 | |
| | | | | | | | |
| | | | REINSURANCE — 2.64% | | | | |
| | 9,110 | | Endurance Specialty Holdings Ltd. (b)(e) | | | 841,764 | |
| | | | | | | | |
| | | | REITs — 1.00% | | | | |
| | 13,441 | | NorthStar Realty Finance Corporation | | | 203,631 | |
| | 5,172 | | Starwood Property Trust, Inc. | | | 113,526 | |
| | | | | | | 317,157 | |
| | | | | | | | |
| | | | RESTAURANTS — 1.26% | | | | |
| | 4,500 | | Yum China Holdings, Inc. (a) | | | 117,540 | |
| | 4,500 | | Yum! Brands, Inc. | | | 284,985 | |
| | | | | | | 402,525 | |
| | | | | | | | |
| | | | SEMICONDUCTORS — 6.38% | | | | |
| | 8,442 | | Intersil Corporation Class A (e) | | | 188,256 | |
| | 14,057 | | Linear Technology Corporation | | | 876,454 | |
| | 9,868 | | NXP Semiconductors NV (a)(b)(e) | | | 967,163 | |
| | | | | | | 2,031,873 | |
| | | | | | | | |
| | | | SPECIAL PURPOSE ACQUISITION COMPANY — 0.10% | | | | |
| | 3,048 | | KLR Energy Acquisition Corporation Class A (a) | | | 31,547 | |
| | | | | | | | |
| | | | SPECIALTY CHEMICALS — 7.09% | | | | |
| | 6,900 | | Ashland Global Holdings, Inc. (e) | | | 754,101 | |
| | 18,715 | | Chemtura Corporation (a)(e) | | | 621,338 | |
| | 8,517 | | The Valspar Corporation (e) | | | 882,446 | |
| | | | | | | 2,257,885 | |
| | | | | | | | |
| | | | SPECIALTY STORES — 2.58% | | | | |
| | 14,047 | | Cabela’s, Inc. (a)(e) | | | 822,452 | |
| | | | | | | | |
| | | | SYSTEMS SOFTWARE — 0.79% | | | | |
| | 4,581 | | Dell Technologies, Inc. Class V (a) | | | 251,818 | |
| | | | | | | | |
| | | | TECHNOLOGY HARDWARE, | | | | |
| | | | STORAGE & PERIPHERALS — 2.44% | | | | |
| | 33,500 | | Hewlett Packard Enterprise Company | | | 775,190 | |
| | | | | | | | |
| | | | THRIFTS & MORTGAGE FINANCE — 1.97% | | | | |
| | 32,279 | | EverBank Financial Corporation | | | 627,827 | |
The accompanying notes are an integral part of these financial statements.
The Merger Fund VL
SCHEDULE OF INVESTMENTS (continued)
December 31, 2016
| Shares | | | | Value | |
| | | | | | |
| | | TOBACCO — 2.54% | | | |
| | 14,409 | | Reynolds American, Inc. (e) | | $ | 807,480 | |
| | | | TOTAL COMMON STOCKS (Cost $23,646,105) | | | 24,122,953 | |
| | |
| CLOSED-END FUNDS — 3.18% | |
| | 56,489 | | American Capital Ltd.(a)(e) | | | 1,012,283 | |
| | | | TOTAL CLOSED-END FUNDS (Cost $942,051) | | | 1,012,283 | |
| | | | | | | | |
| | |
| CONTINGENT VALUE RIGHTS — 0.01% | |
| | 7,030 | | Casa Ley, S.A. de C.V. (a)(g) | | | 2,460 | |
| | 268 | | Leap Wireless International, Inc. (a)(g) | | | 844 | |
| | 7,030 | | Property Development Centers LLC (a)(g) | | | 352 | |
| | | | TOTAL CONTINGENT VALUE RIGHTS (Cost $0) | | | 3,656 | |
| | | | | | | | |
| | | | | | | |
Principal Amount | | | | |
| | |
| CORPORATE BONDS — 4.16% (f) | |
| | | | Aeropuertos Dominicanos Siglo XXI, S.A. | | | | |
| $ | 23,000 | | 9.250%, 11/13/2019 (b)(i) | | | 24,035 | |
| | | | Alere, Inc. | | | | |
| | 34,000 | | 6.500%, 6/15/2020 | | | 33,660 | |
| | | | Change Healthcare Holdings, Inc. | | | | |
| | 162,000 | | 11.000%, 12/31/2019 | | | 167,305 | |
| | | | Energy Future Intermediate Holding Company LLC | | | | |
| | 91,244 | | 11.000%, 10/1/2021 (h) | | | 122,267 | |
| | 266,590 | | 11.750%, 3/1/2022 (h)(i) | | | 363,896 | |
| | | | FairPoint Communications, Inc. | | | | |
| | 146,000 | | 8.750%, 8/15/2019 (i) | | | 152,570 | |
| | | | LIN Television Corporation | | | | |
| | 83,000 | | 5.875%, 11/15/2022 | | | 84,868 | |
| | | | Northern Tier Energy LLC / Northern Tier Finance Corporation | | | | |
| | 47,000 | | 7.125%, 11/15/2020 | | | 49,056 | |
| | | | Rite Aid Corporation | | | | |
| | 40,000 | | 6.125%, 4/1/2023 (i) | | | 43,150 | |
| | | | Team Health, Inc. | | | | |
| | 135,000 | | 7.250%, 12/15/2023 (i) | | | 153,900 | |
| | | | Western Refining, Inc. | | | | |
| | 124,000 | | 6.250%, 4/1/2021 | | | 128,960 | |
| | | | TOTAL CORPORATE BONDS (Cost $1,221,993) | | | 1,323,667 | |
The accompanying notes are an integral part of these financial statements.
The Merger Fund VL
SCHEDULE OF INVESTMENTS (continued)
December 31, 2016
Contracts (100 shares per contract) | | Value | |
| | | | |
| PURCHASED CALL OPTIONS — 0.00% | | | |
| | | Rockwell Collins, Inc. | | | |
| | 3 | | Expiration: January 2017, Exercise Price: $100.00 | | $ | 171 | |
| | | | SPDR S&P 500 ETF Trust | | | | |
| | 17 | | Expiration: February 2017, Exercise Price: $237.00 | | | 323 | |
| | | | | | | 494 | |
| | | | | |
| PURCHASED PUT OPTIONS — 0.12% | | | | |
| | | | American International Group, Inc. | | | | |
| | 24 | | Expiration: February 2017, Exercise Price: $57.50 | | | 960 | |
| | 96 | | Expiration: February 2017, Exercise Price: $62.50 | | | 11,136 | |
| | | | Ashland Global Holdings, Inc. | | | | |
| | 29 | | Expiration: January 2017, Exercise Price: $95.00 | | | 507 | |
| | 41 | | Expiration: January 2017, Exercise Price: $100.00 | | | 923 | |
| | | | Baker Hughes, Inc. | | | | |
| | 49 | | Expiration: January 2017, Exercise Price: $60.00 | | | 1,764 | |
| | 49 | | Expiration: February 2017, Exercise Price: $57.50 | | | 2,817 | |
| | | | CBS Corporation Class B | | | | |
| | 12 | | Expiration: January 2017, Exercise Price: $47.50 | | | 90 | |
| | 13 | | Expiration: January 2017, Exercise Price: $50.00 | | | 123 | |
| | 4 | | Expiration: January 2017, Exercise Price: $52.50 | | | 24 | |
| | 50 | | Expiration: January 2017, Exercise Price: $57.00 | | | 775 | |
| | | | CIT Group, Inc. | | | | |
| | 26 | | Expiration: January 2017, Exercise Price: $31.00 | | | 247 | |
| | 110 | | Expiration: January 2017, Exercise Price: $39.00 | | | 2,090 | |
| | | | The Dow Chemical Company | | | | |
| | 55 | | Expiration: January 2017, Exercise Price: $50.00 | | | 660 | |
| | | | General Motors Company | | | | |
| | 8 | | Expiration: January 2017, Exercise Price: $29.00 | | | 32 | |
| | | | Hewlett Packard Enterprise Company | | | | |
| | 24 | | Expiration: January 2017, Exercise Price: $18.00 | | | 60 | |
| | 172 | | Expiration: January 2017, Exercise Price: $19.00 | | | 430 | |
| | 136 | | Expiration: January 2017, Exercise Price: $21.00 | | | 1,020 | |
| | | | Hilton Worldwide Holdings, Inc. | | | | |
| | 13 | | Expiration: January 2017, Exercise Price: $19.00 | | | 65 | |
| | 31 | | Expiration: January 2017, Exercise Price: $20.00 | | | 77 | |
| | 233 | | Expiration: February 2017, Exercise Price: $22.00 | | | 2,330 | |
| | | | Johnson Controls International plc | | | | |
| | 52 | | Expiration: January 2017, Exercise Price: $40.00 | | | 260 | |
| | | | Lamb Weston Holdings, Inc. | | | | |
| | 64 | | Expiration: January 2017, Exercise Price: $30.00 | | | 960 | |
The accompanying notes are an integral part of these financial statements.
The Merger Fund VL
SCHEDULE OF INVESTMENTS (continued)
December 31, 2016
Contracts (100 shares per contract) | | Value | |
| | | SPDR S&P 500 ETF Trust | | | |
| | 17 | | Expiration: January 2017, Exercise Price: $227.00 | | $ | 7,472 | |
| | 4 | | Expiration: February 2017, Exercise Price: $226.00 | | | 2,042 | |
| | | | Yum! Brands, Inc. | | | | |
| | 9 | | Expiration: January 2017, Exercise Price: $72.50 | | | 230 | |
| | 36 | | Expiration: January 2017, Exercise Price: $80.00 | | | 720 | |
| | | | | | | 37,814 | |
| | | | TOTAL PURCHASED OPTIONS (Cost $51,732) | | | 38,308 | |
| | | | | | | | |
Principal Amount | | | | |
| | | | | |
| ESCROW NOTES — 0.03% | | | | |
| $ | 7,668 | | AMR Corporation (a)(d)(g) | | | 10,352 | |
| | | | TOTAL ESCROW NOTES (Cost $4,196) | | | 10,352 | |
| | | | | | | | |
| Shares | | | | | | |
| | | | | |
| SHORT-TERM INVESTMENTS — 27.24% | | | | |
| | 1,533,000 | | First American Government Obligations Fund, | | | | |
| | | | Institutional Share Class, 0.42% (c) | | | 1,533,000 | |
| | 1,533,000 | | First American Treasury Obligations Fund, | | | | |
| | | | Institutional Share Class, 0.40% (c) | | | 1,533,000 | |
| | 1,533,000 | | Invesco Government & Agency Portfolio, | | | | |
| | | | Institutional Share Class, 0.43% (c) | | | 1,533,000 | |
| | 1,533,000 | | Morgan Stanley Institutional Liquidity Funds — | | | | |
| | | | Government Portfolio, Institutional Share Class, 0.44% (c) | | | 1,533,000 | |
| | 1,007,034 | | Morgan Stanley Institutional Liquidity Funds — | | | | |
| | | | Treasury Portfolio, Institutional Share Class, 0.38% (c) | | | 1,007,034 | |
| | 1,533,000 | | Invesco Treasury Portfolio, Institutional Share Class, 0.37% (c) | | | 1,533,000 | |
| | | | TOTAL SHORT-TERM INVESTMENTS (Cost $8,672,034) | | | 8,672,034 | |
| | | | TOTAL LONG INVESTMENTS | | | | |
| | | | (Cost $34,538,111) — 110.51% | | | 35,183,253 | |
| | | | | | | | |
| | | | | |
| SHORT INVESTMENTS — (14.01)% | | | | |
| | | | | |
| COMMON STOCKS — (12.60)% | | | | |
| | | | | | | | |
| | | | AEROSPACE & DEFENSE — (0.38)% | | | | |
| | (1,309 | ) | Rockwell Collins, Inc. | | | (121,423 | ) |
| | | | | | | | |
| | | | AIRLINES — (0.06)% | | | | |
| | (402 | ) | American Airlines Group, Inc. | | | (18,769 | ) |
| | | | | | | | |
| | | | BROADCASTING — (0.18)% | | | | |
| | (888 | ) | Nexstar Broadcasting Group, Inc. Class A | | | (56,210 | ) |
The accompanying notes are an integral part of these financial statements.
The Merger Fund VL
SCHEDULE OF INVESTMENTS (continued)
December 31, 2016
| Shares | | | | Value | |
| | | | | | |
| | | CABLE & SATELLITE — (0.64)% | | | |
| | (45,811 | ) | Sirius XM Holdings, Inc. | | $ | (203,859 | ) |
| | | | | | | | |
| | | | CASINOS & GAMING — (0.07)% | | | | |
| | (1,304 | ) | Eldorado Resorts, Inc. | | | (22,103 | ) |
| | | | | | | | |
| | | | CONSTRUCTION MACHINERY & HEAVY TRUCKS — (0.16)% | | | | |
| | (1,841 | ) | Joy Global, Inc. | | | (51,548 | ) |
| | | | | | | | |
| | | | DIVERSIFIED BANKS — (0.20)% | | | | |
| | (790 | ) | Canadian Imperial Bank of Commerce (b) | | | (64,464 | ) |
| | | | | | | | |
| | | | DIVERSIFIED CHEMICALS — (1.33)% | | | | |
| | (5,752 | ) | E. I. Du Pont de Nemours and Company | | | (422,197 | ) |
| | | | | | | | |
| | | | FINANCIAL EXCHANGES & DATA — (0.19)% | | | | |
| | (840 | ) | CBOE Holdings, Inc. | | | (62,068 | ) |
| | | | | | | | |
| | | | HEALTH CARE EQUIPMENT — (1.26)% | | | | |
| | (10,471 | ) | Abbott Laboratories | | | (402,191 | ) |
| | | | | | | | |
| | | | HEALTHCARE SERVICES — (0.03)% | | | | |
| | (136 | ) | Envision Healthcare Corporation | | | (8,607 | ) |
| | | | | | | | |
| | | | INTEGRATED TELECOMMUNICATION SERVICES — (0.44)% | | | | |
| | (487 | ) | AT&T, Inc. | | | (20,712 | ) |
| | (4,956 | ) | CenturyLink, Inc. | | | (117,854 | ) |
| | | | | | | (138,566 | ) |
| | | | | | | | |
| | | | INTERNET SOFTWARE & SERVICES — (3.33)% | | | | |
| | (12,081 | ) | Alibaba Group Holding Ltd. — ADR | | | (1,060,833 | ) |
| | | | | | | | |
| | | | OIL & GAS & CONSUMABLE FUELS — (0.69)% | | | | |
| | (9,162 | ) | Sunoco Logistics Partners LP | | | (220,071 | ) |
| | | | | | | | |
| | | | OIL & GAS REFINING & MARKETING — (0.20)% | | | | |
| | (2,352 | ) | Idemitsu Kosan Company, Ltd. (b) | | | (62,485 | ) |
| | | | REITs — (1.39)% | | | | |
| | (21,807 | ) | Colony Capital, Inc. Class A | | | (441,592 | ) |
| | | | | | | | |
| | | | SEMICONDUCTORS — (0.74)% | | | | |
| | (3,263 | ) | Analog Devices, Inc. | | | (236,959 | ) |
| | | | | | | | |
| | | | SOFTWARE — (1.04)% | | | | |
| | (4,215 | ) | VMware, Inc. Class A | | | (331,847 | ) |
| | | | | | | | |
| | | | TOBACCO — (0.27)% | | | | |
| | (756 | ) | British American Tobacco PLC — ADR | | | (85,178 | ) |
| | | | TOTAL COMMON STOCKS (Proceeds $3,767,788) | | | (4,010,970 | ) |
The accompanying notes are an integral part of these financial statements.
The Merger Fund VL
SCHEDULE OF INVESTMENTS
December 31, 2016 (continued)
| Shares | | | | Value | |
| | | | |
| CLOSED-END FUNDS — (1.41)% | | | |
| | (27,284 | ) | Ares Capital Corporation | | $ | (449,913 | ) |
| | | | TOTAL CLOSED-END FUNDS | | | | |
| | | | (Proceeds $415,380) | | | (449,913 | ) |
| | | | TOTAL SHORT INVESTMENTS | | | | |
| | | | (Proceeds $4,183,168) — (14.01)% | | | (4,460,883 | ) |
| | | | TOTAL NET INVESTMENTS | | | | |
| | | | (Cost $30,354,943) — 96.50% | | | 30,722,370 | |
| | | | OTHER ASSETS IN EXCESS OF LIABILITIES — 3.50% | | | 1,113,110 | |
| | | | TOTAL NET ASSETS — 100.00% | | $ | 31,835,480 | |
ADR – American Depository Receipt
ETF – Exchange-Traded Fund
plc – Public Limited Company
REITs – Real Estate Investment Trusts
| (a) | Non-income producing security. |
| (b) | Foreign security. |
| (c) | The rate quoted is the annualized seven-day yield as of December 31, 2016. |
| (d) | Security fair valued by the Valuation Group in good faith in accordance with the policies adopted by the Board of Trustees. |
| (e) | All or a portion of the shares have been committed as collateral for open securities sold short, written option contracts, swap contacts, and forward currency exchange contracts. |
| (f) | Level 2 Security. Please see Note 2 in the Notes to the Financial Statements for more information. |
| (g) | Level 3 Security. Please see Note 2 in the Notes to the Financial Statements for more information. |
| (h) | Default or other conditions exist and the security is not presently accruing income. |
| (i) | Security exempt from registration under Rule 144A of the Securities Act of 1933. These securities may be resold in transactions exempt from registration normally to qualified institutional buyers. As of December 31, 2016, these securities represent 2.32% of total net assets. |
| (j) | Restricted security. Please see Note 2 in the Notes to the Financial Statements for more information. As of December 31, 2016, these securities represent 4.53% of total net assets. |
| | |
The accompanying notes are an integral part of these financial statements.
The Merger Fund VL
SCHEDULE OF OPTIONS WRITTEN
December 31, 2016
| Contracts (100 shares per contract) | | Value | |
| | | | |
| CALL OPTIONS WRITTEN | | | |
| | | American International Group, Inc. | | | |
| | 24 | | Expiration: February 2017, Exercise Price: $62.50 | | $ | 9,660 | |
| | 96 | | Expiration: February 2017, Exercise Price: $65.00 | | | 21,792 | |
| | | | Ashland Global Holdings, Inc. | | | | |
| | 29 | | Expiration: January 2017, Exercise Price: $105.00 | | | 14,645 | |
| | 12 | | Expiration: January 2017, Exercise Price: $110.00 | | | 1,980 | |
| | 28 | | Expiration: January 2017, Exercise Price: $115.00 | | | 1,008 | |
| | | | AT&T, Inc. | | | | |
| | 18 | | Expiration: February 2017, Exercise Price: $37.00 | | | 9,954 | |
| | | | Baker Hughes, Inc. | | | | |
| | 49 | | Expiration: January 2017, Exercise Price: $63.00 | | | 14,430 | |
| | 49 | | Expiration: February 2017, Exercise Price: $62.50 | | | 19,968 | |
| | | | CBS Corporation Class B | | | | |
| | 17 | | Expiration: January 2017, Exercise Price: $57.50 | | | 10,948 | |
| | 50 | | Expiration: January 2017, Exercise Price: $61.50 | | | 14,775 | |
| | | | CenturyLink, Inc. | | | | |
| | 27 | | Expiration: April 2017, Exercise Price: $22.00 | | | 6,345 | |
| | 36 | | Expiration: April 2017, Exercise Price: $23.00 | | | 5,976 | |
| | | | CIT Group, Inc. | | | | |
| | 26 | | Expiration: January 2017, Exercise Price: $35.00 | | | 20,150 | |
| | 110 | | Expiration: January 2017, Exercise Price: $42.00 | | | 15,620 | |
| | | | The Dow Chemical Company | | | | |
| | 55 | | Expiration: January 2017, Exercise Price: $56.00 | | | 10,423 | |
| | | | General Motors Company | | | | |
| | 8 | | Expiration: January 2017, Exercise Price: $32.00 | | | 2,440 | |
| | | | Hewlett Packard Enterprise Company | | | | |
| | 98 | | Expiration: January 2017, Exercise Price: $21.00 | | | 20,972 | |
| | 101 | | Expiration: January 2017, Exercise Price: $22.00 | | | 14,039 | |
| | 136 | | Expiration: January 2017, Exercise Price: $22.50 | | | 12,580 | |
| | | | Hilton Worldwide Holdings, Inc. | | | | |
| | 13 | | Expiration: January 2017, Exercise Price: $22.00 | | | 6,760 | |
| | 36 | | Expiration: January 2017, Exercise Price: $23.00 | | | 15,120 | |
| | 233 | | Expiration: February 2017, Exercise Price: $25.00 | | | 59,648 | |
| | | | Johnson Controls International plc | | | | |
| | 26 | | Expiration: January 2017, Exercise Price: $44.00 | | | 9,048 | |
| | 24 | | Expiration: January 2017, Exercise Price: $45.00 | | | 6,000 | |
| | 2 | | Expiration: January 2017, Exercise Price: $47.00 | | | 241 | |
| | | | Lamb Weston Holdings, Inc. | | | | |
| | 65 | | Expiration: January 2017, Exercise Price: $35.00 | | | 22,100 | |
| | | | Monsanto Company | | | | |
| | 41 | | Expiration: January 2017, Exercise Price: $105.00 | | | 5,494 | |
| | | | | | | | |
The accompanying notes are an integral part of these financial statements.
The Merger Fund VL
SCHEDULE OF OPTIONS WRITTEN (continued)
December 31, 2016
Contracts (100 shares per contract) | | Value | |
| | | NXP Semiconductors NV | | | |
| | 4 | | Expiration: January 2017, Exercise Price: $97.00 | | $ | 600 | |
| | 3 | | Expiration: January 2017, Exercise Price: $100.00 | | | 30 | |
| | | | Reynolds American, Inc. | | | | |
| | 14 | | Expiration: January 2017, Exercise Price: $52.50 | | | 5,740 | |
| | 20 | | Expiration: February 2017, Exercise Price: $55.00 | | | 4,500 | |
| | 6 | | Expiration: February 2017, Exercise Price: $57.50 | | | 570 | |
| | | | Rockwell Collins, Inc. | | | | |
| | 2 | | Expiration: January 2017, Exercise Price: $90.00 | | | 892 | |
| | | | SPDR S&P 500 ETF Trust | | | | |
| | 17 | | Expiration: February 2017, Exercise Price: $229.00 | | | 2,482 | |
| | | | Time Warner, Inc. | | | | |
| | 14 | | Expiration: January 2017, Exercise Price: $85.00 | | | 16,310 | |
| | 9 | | Expiration: January 2017, Exercise Price: $90.00 | | | 5,931 | |
| | 10 | | Expiration: January 2017, Exercise Price: $94.00 | | | 2,705 | |
| | 34 | | Expiration: April 2017, Exercise Price: $90.00 | | | 25,755 | |
| | | | The Valspar Corporation | | | | |
| | 9 | | Expiration: April 2017, Exercise Price: $105.00 | | | 1,800 | |
| | | | Yum! Brands, Inc. | | | | |
| | 9 | | Expiration: January 2017, Exercise Price: $82.50 | | | 6,390 | |
| | 36 | | Expiration: January 2017, Exercise Price: $87.50 | | | 9,900 | |
| | | | | | | 435,721 | |
| | | | | |
| PUT OPTIONS WRITTEN | | | | |
| | | | Alibaba Group Holding Ltd. | | | | |
| | 4 | | Expiration: February 2017, Exercise Price: $90.00 | | | 2,120 | |
| | | | SPDR S&P 500 ETF Trust | | | | |
| | 17 | | Expiration: January 2017, Exercise Price: $213.00 | | | 799 | |
| | 4 | | Expiration: February 2017, Exercise Price: $213.00 | | | 604 | |
| | | | | | | 3,523 | |
| | | | TOTAL OPTIONS WRITTEN (Premiums received $413,231) | | $ | 439,244 | |
ETF – Exchange-Traded Fund
plc – Public Limited Company
The accompanying notes are an integral part of these financial statements.
The Merger Fund VL
SCHEDULE OF FORWARD CURRENCY EXCHANGE CONTRACTS*
December 31, 2016
| | | | | | | USD Value at | | | | | | | USD Value at | | | Unrealized | |
| Settlement | | Currency to | | December 31, | | | Currency to | | December 31, | | | Appreciation | |
| Date | | be Delivered | | 2016 | | | be Received | | 2016 | | | (Depreciation)** | |
| 1/4/17 | | | 39,791 | | AUD | | $ | 28,711 | | | | 30,585 | | USD | | $ | 30,585 | | | $ | 1,874 | |
| 1/4/17 | | | 29,250 | | USD | | | 29,250 | | | | 39,791 | | AUD | | | 28,711 | | | | (539 | ) |
| 12/20/17 | | | 828,802 | | GBP | | | 1,031,413 | | | | 1,038,482 | | USD | | | 1,038,482 | | | | 7,069 | |
| | | | | | | | $ | 1,089,374 | | | | | | | | $ | 1,097,778 | | | $ | 8,404 | |
AUD – Australian Dollar
GBP – British Pound
USD – U.S. Dollar
| * | JPMorgan Chase & Co., Inc. is the counterparty for all open forward currency exchange contracts held by the Fund as of December 31, 2016. |
| ** | Net unrealized appreciation (depreciation) is a receivable (payable). |
The accompanying notes are an integral part of these financial statements.
The Merger Fund VL
SCHEDULE OF SWAP CONTRACTS
December 31, 2016
| | | | | | | | | | Unrealized | | |
| Termination | | | | | | Notional | | | Appreciation | | Counter- |
Date | Security | | Shares | | | Amount | | | (Depreciation)* | | party |
| LONG TOTAL RETURN SWAP CONTRACTS |
| 12/20/17 | Allied World Assurance | | | | | | | | | | |
| | Company Holdings AG | | | 133 | | | $ | 6,951 | | | $ | 189 | | BAML |
| 10/3/17 | CBS Corporation Class B | | | 3,000 | | | | 164,790 | | | | 25,641 | | BAML |
| 8/5/17 | FMC Technologies, Inc. | | | 1,038 | | | | 26,872 | | | | 10,270 | | BAML |
| 9/29/17 | General Motors Company | | | 800 | | | | 25,184 | | | | 2,623 | | BAML |
| 12/12/17 | Sky plc | | | 77,098 | | | | 943,035 | | | | (1,755 | ) | JPM |
| 2/11/17 | Syngenta AG | | | 389 | | | | 156,904 | | | | (3,558 | ) | BAML |
| | | | | | | | | | | | | | | |
| SHORT TOTAL RETURN SWAP CONTRACTS |
| 11/23/17 | British American | | | | | | | | | | | | | |
| | Tobacco plc | | | (3,592 | ) | | | (193,424 | ) | | | (8,836 | ) | BAML |
| 12/20/17 | Fairfax Financial | | | | | | | | | | | | | |
| | Holdings Ltd. | | | (4 | ) | | | (1,881 | ) | | | (66 | ) | BAML |
| 8/5/17 | Technip SA | | | (9,120 | ) | | | (550,558 | ) | | | (99,911 | ) | BAML |
| | | | | | | | | | | | $ | (75,403 | ) | |
BAML – Bank of America Merrill Lynch & Co., Inc.
JPM – JPMorgan Chase & Co., Inc.
plc – Public Limited Company
| * | Based on the net swap value held at each counterparty, unrealized appreciation is a receivable and unrealized depreciation is a payable. |
The accompanying notes are an integral part of these financial statements.
The Merger Fund VL
STATEMENT OF ASSETS AND LIABILITIES
December 31, 2016
| ASSETS: | | | | | | |
| Investments, at value (Cost $34,538,111) | | | | | $ | 35,183,253 | |
| Cash held in foreign currency (Cost $238) | | | | | | 233 | |
| Receivable from brokers | | | | | | 4,183,168 | |
| Deposits at brokers | | | | | | 450,943 | |
| Receivable for forward currency exchange contracts | | | | | | 8,404 | |
| Receivable for investments sold | | | | | | 424,310 | |
| Dividends and interest receivable | | | | | | 48,112 | |
| Receivable for fund shares issued | | | | | | 36,385 | |
| Prepaid expenses and other receivables | | | | | | 629 | |
| Total Assets | | | | | | 40,335,437 | |
| LIABILITIES: | | | | | | | |
| Securities sold short, at value (Proceeds of $4,183,168) | | $ | 4,460,883 | | | | | |
| Written option contracts, at value | | | | | | | | |
| (Premiums received $413,231) | | | 439,244 | | | | | |
| Payable for swap contracts | | | 75,403 | | | | | |
| Payable for investments purchased | | | 3,374,379 | | | | | |
| Accrued expenses and other liabilities | | | 66,782 | | | | | |
| Payable for fund shares redeemed | | | 48,796 | | | | | |
| Dividends and interest payable | | | 21,760 | | | | | |
| Payable to the investment adviser | | | 12,710 | | | | | |
| Total Liabilities | | | | | | | 8,499,957 | |
| NET ASSETS | | | | | | $ | 31,835,480 | |
| NET ASSETS CONSISTS OF: | | | | | | | | |
| Accumulated undistributed net investment income | | | | | | $ | 38,432 | |
| Accumulated net realized loss on investments, | | | | | | | | |
| securities sold short, written option contracts | | | | | | | | |
| expired or closed, forward currency exchange contracts, | | | | | | | | |
| swap contracts, and foreign currency translation | | | | | | | (998,287 | ) |
| Net unrealized appreciation (depreciation) on: | | | | | | | | |
| Investments | | $ | 645,142 | | | | | |
| Securities sold short | | | (277,715 | ) | | | | |
| Written option contracts | | | (26,013 | ) | | | | |
| Forward currency exchange contracts | | | 8,404 | | | | | |
| Swap contracts | | | (75,403 | ) | | | | |
| Foreign currency transaction | | | (5 | ) | | | | |
| Net unrealized appreciation | | | | | | | 274,410 | |
| Paid-in capital | | | | | | | 32,520,925 | |
| Total Net Assets | | | | | | $ | 31,835,480 | |
| NET ASSET VALUE and offering price per share* | | | | | | | | |
| ($31,835,480 / 3,022,641 shares of | | | | | | | | |
| beneficial interest outstanding) | | | | | | $ | 10.53 | |
| * | The redemption price per share may vary based on the length of time a shareholder holds Fund shares. |
The accompanying notes are an integral part of these financial statements.
The Merger Fund VL
STATEMENT OF OPERATIONS
For the Year Ended December 31, 2016
| INVESTMENT INCOME: | | | | | | |
| Interest | | | | | $ | 71,398 | |
| Dividend income on long positions | | | | | | | |
| (net of foreign withholding taxes of $2,160) | | | | | | 339,281 | |
| Total investment income | | | | | | 410,679 | |
| EXPENSES: | | | | | | | |
| Investment advisory fees | | $ | 385,698 | | | | | |
| Professional fees | | | 99,277 | | | | | |
| Transfer agent and shareholder servicing agent fees | | | 76,553 | | | | | |
| Fund accounting expenses | | | 40,881 | | | | | |
| Administration fees | | | 27,614 | | | | | |
| Reports to shareholders | | | 9,778 | | | | | |
| Custody fees | | | 9,483 | | | | | |
| Miscellaneous expenses | | | 8,899 | | | | | |
| Trustees’ fees and expenses | | | 6,189 | | | | | |
| Compliance fees | | | 1,417 | | | | | |
| Federal and state registration fees | | | 888 | | | | | |
| Borrowing expenses on securities sold short | | | 43,745 | | | | | |
| Dividends on securities sold short | | | 137,980 | | | | | |
| Total expenses before expense reimbursement by adviser | | | | | | | 848,402 | |
| Less: Expense reimbursed by adviser (Note 3) | | | | | | | (234,695 | ) |
| Net expenses | | | | | | | 613,707 | |
| NET INVESTMENT LOSS | | | | | | | (203,028 | ) |
| REALIZED AND CHANGE IN UNREALIZED | | | | | | | | |
| GAIN (LOSS) ON INVESTMENTS: | | | | | | | | |
| Realized gain (loss) on: | | | | | | | | |
| Investments | | | (222,360 | ) | | | | |
| Securities sold short | | | (750,076 | ) | | | | |
| Written option contracts expired or closed | | | 654,464 | | | | | |
| Forward currency exchange contracts | | | 293,002 | | | | | |
| Swap contracts | | | 229,699 | | | | | |
| Foreign currency transaction | | | (1,592 | ) | | | | |
| Net realized gain | | | | | | | 203,137 | |
| Change in unrealized appreciation (depreciation) on: | | | | | | | | |
| Investments | | | 1,359,103 | | | | | |
| Securities sold short | | | (153,593 | ) | | | | |
| Written option contracts | | | (191,062 | ) | | | | |
| Forward currency exchange contracts | | | (13,136 | ) | | | | |
| Swap contracts | | (276,007 | ) | | | | |
| Foreign currency transaction | | | (2 | ) | | | | |
| Net change in unrealized appreciation | | | | | | | 725,303 | |
| NET REALIZED AND CHANGE IN UNREALIZED | | | | | | | | |
| GAIN ON INVESTMENTS | | | | | | | 928,440 | |
| NET INCREASE IN NET ASSETS | | | | | | | | |
| RESULTING FROM OPERATIONS | | | | | | $ | 725,412 | |
The accompanying notes are an integral part of these financial statements.
The Merger Fund VL
STATEMENTS OF CHANGES IN NET ASSETS
| | | Year Ended | | | Year Ended | |
| | | December 31, 2016 | | | December 31, 2015 | |
| | | | | | | |
| Net investment loss | | $ | (203,028 | ) | | $ | (150,238 | ) |
| Net realized gain on investments, | | | | | | | | |
| securities sold short, written option | | | | | | | | |
| contracts expired or closed, forward currency | | | | | | | | |
| exchange contracts, swap contracts, and | | | | | | | | |
| foreign currency transaction | | | 203,137 | | | | 140,111 | |
| Net change in unrealized appreciation (depreciation) | | | | | | | | |
| on investments, securities sold short, written | | | | | | | | |
| option contracts, forward currency exchange | | | | | | | | |
| contracts, swap contracts, and foreign | | | | | | | | |
| currency transaction | | | 725,303 | | | | (388,979 | ) |
| Net increase (decrease) in net assets | | | | | | | | |
| resulting from operations | | | 725,412 | | | | (399,106 | ) |
| | | | | | | | | |
| Distributions to shareholders from: (Note 5) | | | | | | | | |
| Net investment income | | | (228,542 | ) | | | (709,107 | ) |
| Net realized gains | | | (353,285 | ) | | | (219,497 | ) |
| Total dividends and distributions | | | (581,827 | ) | | | (928,604 | ) |
| Net increase (decrease) in net assets from | | | | | | | | |
| capital share transactions (Note 4) | | | (1,460,822 | ) | | | 11,626,736 | |
| Net increase (decrease) in net assets | | | (1,317,237 | ) | | | 10,299,026 | |
| | | | | | | | | |
| NET ASSETS: | | | | | | | | |
| Beginning of year | | | 33,152,717 | | | | 22,853,691 | |
| End of year (including accumulated | | | | | | | | |
| undistributed net investment income of | | | | | | | | |
| $38,432 and $11,643, respectively) | | $ | 31,835,480 | | | $ | 33,152,717 | |
The accompanying notes are an integral part of these financial statements.
The Merger Fund VL
FINANCIAL HIGHLIGHTS
Selected per share data is based on a share of beneficial interest outstanding throughout each year.
| | | Year Ended December 31, | |
| | | 2016 | | | 2015 | | | 2014 | | | 2013 | | | 2012 | |
| Per Share Data: | | | | | | | | | | | | | | | |
| Net asset value, beginning of year | | $ | 10.47 | | | $ | 10.87 | | | $ | 10.92 | | | $ | 10.54 | | | $ | 10.44 | |
| Income from investment operations: | | | | | | | | | | | | | | | | | | | | |
Net investment income (loss)(1) | | | (0.07 | ) | | | (0.05 | ) | | | 0.26 | | | | 0.02 | | | | (0.04 | ) |
| Net realized and unrealized | | | | | | | | | | | | | | | | | | | | |
| gain (loss) on investments | | | 0.33 | | | | (0.05 | ) | | | (0.11 | ) | | | 0.39 | | | | 0.30 | |
| Total from investment operations | | | 0.26 | | | | (0.10 | ) | | | 0.15 | | | | 0.41 | | | | 0.26 | |
| Less distributions: | | | | | | | | | | | | | | | | | | | | |
| From net investment income | | | (0.08 | ) | | | (0.23 | ) | | | (0.14 | ) | | | (0.03 | ) | | | — | |
| From net realized gains | | | (0.12 | ) | | | (0.07 | ) | | | (0.06 | ) | | | — | | | | (0.16 | ) |
| Total dividends and distributions | | | (0.20 | ) | | | (0.30 | ) | | | (0.20 | ) | | | (0.03 | ) | | | (0.16 | ) |
| Net Asset Value, end of year | | $ | 10.53 | | | $ | 10.47 | | | $ | 10.87 | | | $ | 10.92 | | | $ | 10.54 | |
| Total Return | | | 2.44 | % | | | (0.90 | )% | | | 1.37 | % | | | 3.88 | % | | | 2.52 | % |
| Supplemental data and ratios: | | | | | | | | | | | | | | | | | | | | |
| Net assets, end of year (000’s) | | $ | 31,835 | | | $ | 33,153 | | | $ | 22,854 | | | $ | 19,078 | | | $ | 14,384 | |
| Ratio of gross expenses | | | | | | | | | | | | | | | | | | | | |
| to average net assets: | | | | | | | | | | | | | | | | | | | | |
| Before expense reimbursement | | | 2.75 | % | | | 2.57 | % | | | 2.80 | % | | | 2.96 | % | | | 3.06 | % |
| After expense reimbursement | | | 1.99 | % | | | 1.79 | % | | | 1.74 | % | | | 1.65 | % | | | 1.92 | % |
| Ratio of dividends on short | | | | | | | | | | | | | | | | | | | | |
| positions and borrowing expense | | | | | | | | | | | | | | | | | | | | |
| on securities sold short to | | | | | | | | | | | | | | | | | | | | |
| average net asset | | | 0.59 | % | | | 0.39 | % | | | 0.34 | % | | | 0.25 | % | | | 0.52 | % |
| Ratio of expenses to average | | | | | | | | | | | | | | | | | | | | |
| net assets excluding dividends on | | | | | | | | | | | | | | | | | | | | |
| short positions and borrowing | | | | | | | | | | | | | | | | | | | | |
| expense on securities sold short | | | | | | | | | | | | | | | | | | | | |
| (after expense reimbursement) | | | 1.40 | % | | | 1.40 | % | | | 1.40 | % | | | 1.40 | % | | | 1.40 | % |
| Ratio of net investment income | | | | | | | | | | | | | | | | | | | | |
| (loss) to average net assets | | | | | | | | | | | | | | | | | | | | |
| Before expense reimbursement | | | (1.42 | )% | | | (1.27 | )% | | | 1.33 | % | | | (1.15 | )% | | | (1.57 | )% |
| After expense reimbursement | | | (0.66 | )% | | | (0.49 | )% | | | 2.39 | % | | | 0.16 | % | | | (0.43 | )% |
Portfolio turnover rate(2) | | | 202 | % | | | 167 | % | | | 154 | % | | | 196 | % | | | 269 | % |
| (1) | Net investment income (loss) per share has been calculated based on average shares outstanding during the year. |
| (2) | The numerator for the portfolio turnover rate includes the lesser of purchases or sales (excluding short- term investments, short-term options, forward currency contracts, swap contracts and short positions). The denominator includes the average long positions throughout the year. |
The accompanying notes are an integral part of these financial statements.
The Merger Fund VL
NOTES TO THE FINANCIAL STATEMENTS
December 31, 2016
Note 1 — ORGANIZATION
The Merger Fund VL (the “Fund”) is a no-load, open-end, diversified investment company organized as a statutory trust under the laws of Delaware on November 22, 2002, and registered under the Investment Company Act of 1940, as amended (the “1940 Act”). The Fund commenced operations on May 26, 2004. In a transaction that closed on December 31, 2010, Westchester Capital Management, Inc. transferred substantially all of its business and assets to Westchester Capital Management, LLC (the “Adviser”), which became the Fund’s investment adviser. Therefore, the performance information included herein for periods prior to 2011 reflects the performance of Westchester Capital Management, Inc. Roy Behren and Michael Shannon, the Fund’s current portfolio managers, assumed portfolio management duties for the Fund in January 2007. The investment objective of the Fund is to seek to achieve capital growth by engaging in merger arbitrage. Merger arbitrage is a highly specialized investment approach generally designed to profit from the successful completion of publicly announced mergers, takeovers, tender offers, leveraged buyouts, spin-offs, liquidations and other corporate reorganizations. The Fund’s shares are currently offered only to separate accounts funding variable annuity and variable life insurance contracts. At December 31, 2016, 99.0% of the shares outstanding of the Fund were owned by five insurance companies. Activities of these shareholders may have a significant effect on the operations of the Fund.
Note 2 — SIGNIFICANT ACCOUNTING POLICIES
The following is a summary of significant accounting policies followed by the Fund in the preparation of its financial statements. These policies are in conformity with U.S. generally accepted accounting principles (“GAAP”). The Fund is an investment company and, accordingly, follows the investment company accounting and reporting guidance of the Financial Accounting Standards Board Accounting Standards Codification Topic 946 – Investment Companies. The presentation of financial statements in conformity with GAAP requires management to make estimates and assumptions that affect the reported amount of assets and liabilities at the date of the financial statements and the reported amounts of revenues and expenses during the reporting period. Actual results could differ from those estimates and assumptions.
The following is a summary of the Fund’s pricing procedures. It is intended to be a general discussion and may not necessarily reflect all pricing procedures followed by the Fund.
The Merger Fund VL
NOTES TO THE FINANCIAL STATEMENTS (continued)
December 31, 2016
Note 2 — SIGNIFICANT ACCOUNTING POLICIES (continued)
Equity securities that trade on an exchange will typically be valued based on the last reported sale price. Securities listed on NASDAQ are typically valued using the NASDAQ Official Closing Price. The securities valued using quoted prices in active markets are classified as Level 1 investments. If, on a particular day, an exchange-listed security does not trade, then the mean between the closing bid and asked prices will typically be used to value the security. These securities are classified as Level 2 investments. Fixed income securities having a maturity of greater than 60 days are typically valued based on evaluations provided by a pricing vendor approved by the Board of Trustees of the Fund (the “Board” or “Trustees”). These are classified as Level 2 investments.
Exchange-traded options are typically valued at the higher of the intrinsic value of the option (i.e., what the Fund would pay or can receive upon the option being exercised) or the last reported composite sale price when such sale falls between the bid and asked prices. When the last sale of an exchange-traded option is outside the bid and asked prices, the Fund will typically value the option at the higher of the intrinsic value of the option or the mean between the highest end of day option bid price and the lowest end of day option ask price. Options for which there is an active market are classified as Level 1 investments, but options not listed on an exchange are classified as Level 2 investments. Investments in United States government securities (other than short-term securities) are valued at the mean between the 4:00 PM New York time bid and asked prices supplied by a third party vendor. Investments in registered open-end investment companies, including money market funds, are typically valued at their reported NAV per share. Short-term fixed-income securities having a maturity of less than 60 days are valued at market quotations or based on valuations supplied by a third party pricing service. If a reliable price from a third party pricing service is unavailable, amortized cost may be used if it is determined that the instrument’s amortized cost value represents approximately the fair value of the security. Forward currency contracts are valued daily at the prevailing forward exchange rate. These securities are generally classified as Level 2. Total return swap prices are determined using the same methods as would be used to price the underlying security. These securities are generally classified as Level 2.
The Fund typically fair values securities and assets for which (a) market quotations are not readily available or (b) market quotations are believed to be unrepresentative of market value. For example, a Fund may fair value a security that primarily trades on an exchange that closes before the NYSE if a significant event occurs after the close of the exchange on
The Merger Fund VL
NOTES TO THE FINANCIAL STATEMENTS (continued)
December 31, 2016
Note 2 — SIGNIFICANT ACCOUNTING POLICIES (continued)
which the security primarily trades but before the NYSE closes. Fair valuations are determined in good faith by the Valuation Group (the “Valuation Group”), a committee comprised of persons who are officers of the Fund or representatives of the Adviser, acting pursuant to procedures adopted by the Board. When fair-value pricing is employed, the prices of securities used by the Fund to calculate its NAV may differ from quoted or published prices for the same securities. In addition, due to the subjective nature of fair-value pricing, it is possible that the value determined for a particular asset may be materially different from the value realized upon such asset’s sales. These securities are generally classified as Level 2 or 3 depending on the inputs as described below.
The Fund has performed an analysis of all existing investments to determine the significance and character of all inputs to their fair value determination. Various inputs are used in determining the value of the Fund’s investments. These inputs are summarized in the three broad levels listed below:
| | Level 1 — | Quoted prices in active markets for identical securities. |
| | | |
| | Level 2 — | Other significant observable inputs (including quoted prices for similar securities, interest rates, prepayment speeds, credit risk, etc.). |
| | | |
| | Level 3 — | Significant unobservable inputs are those inputs that reflect the Fund’s own assumptions that market participants would use to price the asset or liability based on the best available information. |
The inputs or methodology used for valuing securities are not an indication of the risk associated with investing in those securities.
The following tables provide the fair value measurements of applicable Fund assets and liabilities by level within the fair value hierarchy for the Fund as of December 31, 2016. These assets and liabilities are measured on a recurring basis.
The Merger Fund VL
NOTES TO THE FINANCIAL STATEMENTS (continued)
December 31, 2016
Note 2 — SIGNIFICANT ACCOUNTING POLICIES (continued)
Investments at Fair Value | | Level 1 | | | Level 2 | | | Level 3 | | | Total | |
| Assets | | | | | | | | | | | | |
| Common Stocks* | | $ | 22,063,569 | | | $ | 616,639 | | | $ | 1,442,745 | | | $ | 24,122,953 | |
| Closed-End Funds | | | 1,012,283 | | | | — | | | | — | | | | 1,012,283 | |
| Contingent Value Rights | | | — | | | | — | | | | 3,656 | | | | 3,656 | |
| Corporate Bonds | | | — | | | | 1,323,667 | | | | — | | | | 1,323,667 | |
| Purchased Option Contracts | | | 38,308 | | | | — | | | | — | | | | 38,308 | |
| Escrow Notes | | | — | | | | — | | | | 10,352 | | | | 10,352 | |
| Short-Term Investments | | | 8,672,034 | | | | — | | | | — | | | | 8,672,034 | |
| Forward Currency | | | | | | | | | | | | | | | | |
| Exchange Contracts** | | | — | | | | 8,404 | | | | — | | | | 8,404 | |
| Total | | $ | 31,786,194 | | | $ | 1,948,710 | | | $ | 1,456,753 | | | $ | 35,191,657 | |
| Liabilities | | | | | | | | | | | | | | | | |
| Short Common Stock* | | $ | 4,010,970 | | | $ | — | | | $ | — | | | $ | 4,010,970 | |
| Short Closed-End Funds | | | 449,913 | | | | — | | | | — | | | | 449,913 | |
| Written Option Contracts | | | 439,244 | | | | — | | | | — | | | | 439,244 | |
| Swap Contracts** | | | — | | | | 75,403 | | | | — | | | | 75,403 | |
| Total | | $ | 4,900,127 | | | $ | 75,403 | | | $ | — | | | $ | 4,975,530 | |
| * | | Please refer to the Schedules of Investments to view long/short common stocks segregated by industry type. |
| ** | | Swap contracts and forward currency exchange contracts are valued at the net unrealized appreciation (depreciation) on the instrument by counterparty. |
The Level 2 securities are priced using inputs such as current yields, discount rates, credit quality, yields on comparable securities, trading volume, maturity date, market bid and asked prices, prices on comparable securities and other significant inputs. Level 3 securities are valued by brokers using broker quotes or such other pricing sources or data as are permitted by the Fund’s pricing procedures. At December 31, 2016, the value of these securities was $1,456,753. The inputs for these securities are not readily available or cannot be reasonably estimated and are generally those inputs as described in Note 2 A. The appropriateness of fair values for these securities is monitored by the Valuation Group on an ongoing basis.
For the year ended December 31, 2016, $1,442,745 were transferred from Level 1 to Level 3 due to Management pursuing appraisal rights resulting from corporate mergers. There were no transfers into or out of Level 2 during the year. Transfers are recorded at the end of the reporting period.
The Merger Fund VL
NOTES TO THE FINANCIAL STATEMENTS (continued)
December 31, 2016
Note 2 — SIGNIFICANT ACCOUNTING POLICIES (continued)
Level 3 Reconciliation Disclosure
The following is a reconciliation of Level 3 assets for which significant unobservable inputs were used to determine fair value.
| | | Common | | | Contingent | | | Escrow | | | Total | |
Description | | Stocks | | | Value Rights | | | Notes | | | Investment | |
| Balance as of December 31, 2015 | | $ | — | | | $ | 4,507 | | | $ | 9,968 | | | $ | 14,475 | |
| Purchases on Investments | | | — | | | | — | | | | — | | | | — | |
| (Sales) of Investments | | | — | | | | — | | | | — | | | | — | |
| Transfers Into Level 3 | | | 1,442,745 | | | | — | | | | — | | | | 1,442,745 | |
| (Transfers Out) of Level 3 | | | — | | | | — | | | | — | | | | — | |
| Change in Unrealized | | | | | | | | | | | | | | | | |
| Appreciation (Depreciation) | | | — | | | | (851 | ) | | | 384 | | | | (467 | ) |
| Balance as of December 31, 2016 | | $ | 1,442,745 | | | $ | 3,656 | | | $ | 10,352 | | | $ | 1,456,753 | |
The realized and unrealized gains and losses from Level 3 transactions are included with the net realized gain (loss) on investments and net change in unrealized appreciation (depreciation) on investments on the Statement of Operations, respectively. The net change in unrealized appreciation (depreciation) on investments related to Level 3 securities held by the Fund at December 31, 2016 totals $(467).
Significant unobservable valuation inputs monitored by the Valuation Group under the supervision of the Board of Trustees for material Level 3 investments as of December 31, 2016 are as follows:
| | Fair Value at | | |
| | December 31, | Valuation | Unobservable |
Description | 2016 | Technique | Input |
| Common Stock | $434,400 | Discounted Cash | Discount Rates |
| | | Flow Model | Terminal Value |
| | | | Cash Flow Projections |
| Common Stock | $1,008,345 | Discounted Cash | Discount Rates |
| | | Flow Model | Terminal Value |
| | | | Cash Flow Projections |
The table above does not include certain Level 3 investments that are valued by brokers and pricing services. At December 31, 2016, the value of these investments was $14,008. The inputs for these investments are not readily available or cannot be reasonably estimated and are generally those inputs described in Note 2.
No provision for federal income taxes has been made since the Fund has complied to date with the provisions of Subchapter M of the Internal Revenue Code applicable to regulated investment companies and intends to continue to so comply in future years and to distribute investment company net taxable income and net capital gains to shareholders. Additionally, the Fund intends to make all required distributions to avoid federal excise tax.
The Merger Fund VL
NOTES TO THE FINANCIAL STATEMENTS (continued)
December 31, 2016
Note 2 — SIGNIFICANT ACCOUNTING POLICIES (continued)
The Fund has reviewed all open tax years in major jurisdictions and concluded that there is no impact on the Fund’s net assets and there is no tax liability resulting from unrecognized tax benefits relating to uncertain income tax positions taken or expected to be taken on a tax return. The Fund is also not aware of any tax positions for which it is reasonably possible that the total amounts of unrecognized tax benefits will significantly change in the next twelve months. As of December 31, 2016, open Federal and New York tax years include the tax years ended December 31, 2013 through December 31, 2016. The Fund has no tax examination in progress.
| C. | Transactions with Brokers |
The Fund’s receivables from brokers for proceeds on securities sold short and deposits at brokers for securities sold short are with two securities dealers. The Fund does not require the brokers to maintain collateral in support of the receivables from the brokers for proceeds on securities sold short. The Fund is required by the brokers to maintain collateral for securities sold short. The receivable from brokers on the Statement of Assets and Liabilities represents the proceeds from securities sold short that is maintained at the broker. The Fund may maintain cash deposits at brokers beyond the receivables for short sales. The Fund may be required by the brokers with which it executes short sales to maintain an additional amount of collateral in a special tri-party custody arrangement for the benefit of the broker.
The Fund’s equity swap contracts’ and forward currency exchange contracts’ cash deposits are monitored daily by the Adviser and counterparty. Cash deposits by the Fund are presented as deposits at brokers on the Statement of Assets and Liabilities. These transactions may involve market risk in excess of amounts receivable or payable reflected on the Statement of Assets and Liabilities.
The Fund sells securities or currencies short for economic hedging purposes or any other investment purpose. For financial statement purposes, an amount equal to the settlement amount is initially included in the Statement of Assets and Liabilities as an asset and an equivalent liability. The amount of the liability is subsequently priced to reflect the current value of the short position. Subsequent fluctuations in the market prices of securities or currencies sold, but not yet purchased, may require purchasing the securities or currencies at prices which may differ from the market value reflected on the Statement of Assets and Liabilities. Short sale transactions result in off balance sheet risk because the ultimate
The Merger Fund VL
NOTES TO THE FINANCIAL STATEMENTS (continued)
December 31, 2016
Note 2 — SIGNIFICANT ACCOUNTING POLICIES (continued)
obligation may exceed the related amounts shown in the Statement of Assets and Liabilities. The Fund will incur a loss if the price of the security increases between the date of the short sale and the date on which the Fund purchases the security to replace the borrowed security. The Fund’s loss on a short sale is potentially unlimited because there is no upward limit on the price a borrowed security could attain.
The Fund is liable for any dividends payable on securities while those securities are sold short. Until the security is replaced, the Fund is required to pay to the lender any income earned, which is recorded as an expense by the Fund. The Fund segregates liquid assets in an amount equal to the market value of securities sold short, which is reflected in the Schedule of Investments. These assets are required to be adjusted daily to reflect changes in the value of the securities or currencies sold short.
| E. | Written Option Contracts |
The Fund is subject to equity price risk in the normal course of pursuing its investment objectives. The Fund writes (sells) put or call options for hedging purposes, volatility management purposes, or otherwise to gain, or reduce, long or short exposure to one or more asset classes or issuers. When the Fund writes (sells) an option, an amount equal to the premium received by the Fund is included in the Statement of Assets and Liabilities as an asset and an equivalent liability. The amount of the liability is subsequently priced daily to reflect the current value of the option written. Refer to Note 2 A. for a pricing description. By writing an option, the Fund may become obligated during the term of the option to deliver or purchase the securities underlying the option at the exercise price if the option is exercised. These contracts may involve market risk in excess of amounts receivable or payable reflected on the Statement of Assets and Liabilities. Refer to Note 2 Q. for further derivative disclosures, and Note 2 O. for further counterparty risk disclosure.
When an option expires on its stipulated expiration date or the Fund enters into a closing purchase transaction, the Fund realizes a gain or loss if the cost of the closing purchase transaction differs from the premium received when the option was sold without regard to any unrealized appreciation or depreciation on the underlying security, and the liability related to such option is eliminated. When a written call option is exercised, the premium originally received decreases the cost basis of the security and the Fund realizes gains or losses from the sale of the underlying security. When a written put option is exercised, the cost of the security acquired is decreased by the premium received for the put.
The Merger Fund VL
NOTES TO THE FINANCIAL STATEMENTS (continued)
December 31, 2016
Note 2 — SIGNIFICANT ACCOUNTING POLICIES (continued)
| F. | Purchased Option Contracts |
The Fund is subject to equity price risk in the normal course of pursuing its investment objectives. The Fund purchases put or call options for hedging purposes, volatility management purposes, or otherwise to gain, or reduce, long or short exposure to one or more asset classes or issuers. When the Fund purchases an option contract, an amount equal to the premium paid is included in the Statement of Assets and Liabilities as an investment, and is subsequently priced daily to reflect the value of the purchased option. Refer to Note 2 A. for a pricing description. Refer to Note 2 Q. for further derivative disclosures, and Note 2 O. for further counterparty risk disclosure.
When option contracts expire or are closed, realized gains or losses are recognized without regard to any unrealized appreciation or depreciation on the underlying securities that may be held by the Fund. If the Fund exercises a call option, the cost of the security acquired is increased by the premium paid for the call. If the Fund exercises a put option, the premium paid for the put option increases the cost of the underlying security and a gain or loss is realized from the sale of the underlying security.
| G. | Forward Currency Exchange Contracts |
The Fund is subject to foreign currency exchange rate risk in the normal course of pursuing its investment objectives. During the year ended December 31, 2016, the Fund used forward currency exchange contracts to hedge against changes in the value of foreign currencies. The Fund may enter into forward currency exchange contracts obligating the Fund to deliver and receive a currency at a specified future date. Forward contracts are valued daily, and unrealized appreciation or depreciation is recorded daily as the difference between the contract exchange rate and the closing forward rate applied to the face amount of the contract. Refer to Note 2 A. for a pricing description. A realized gain or loss is recorded at the time the forward contract expires. Credit risk may arise as a result of the failure of the counterparty to comply with the terms of the contract. Refer to Note 2 O. for further counterparty risk disclosure.
The use of forward currency exchange contracts does not eliminate fluctuations in the underlying prices of the Fund’s investment securities. The use of forward currency exchange contracts involves the risk that anticipated currency movements will not be accurately predicted. A forward currency exchange contract would limit the risk of loss due to a decline in the value of a particular currency; however, it would also limit any potential gain that might result should the value of the currency increase instead of decrease. These contracts may involve market risk in excess of the amounts receivable or payable reflected on the Statement of Assets and Liabilities. Refer to Note 2 Q. for further derivative disclosures.
The Merger Fund VL
NOTES TO THE FINANCIAL STATEMENTS (continued)
December 31, 2016
Note 2 — SIGNIFICANT ACCOUNTING POLICIES (continued)
The Fund is subject to equity price risk and interest rate risk in the normal course of pursuing its investment objectives. During the year ended December 31, 2016, the Fund entered into both long and short equity swap contracts with multiple broker-dealers. A long equity swap contract entitles the Fund to receive from the counterparty any appreciation and dividends paid on an individual security, while obligating the Fund to pay the counterparty any depreciation on the security as well as interest on the notional amount of the contract at a rate equal to LIBOR plus an agreed upon spread (generally between 25 to 100 basis points). A short equity swap contract obligates the Fund to pay the counterparty any appreciation and dividends paid on an individual security, while entitling the Fund to receive from the counterparty any depreciation on the security, and to pay to or receive from the counterparty interest on the notional value of the contract at a rate equal to LIBOR less an agreed upon spread (generally between 25 to 100 basis points). Refer to Note 2 A. for a pricing description.
The Fund may also enter into equity swap contracts whose value may be determined by the spread between a long equity position and a short equity position. This type of swap contract obligates the Fund to pay the counterparty an amount tied to any increase in the spread between the two securities over the term of the contract. The Fund is also obligated to pay the counterparty any dividends paid on the short equity holding as well as any net financing costs. This type of swap contract entitles the Fund to receive from the counterparty any gains based on a decrease in the spread as well as any dividends paid on the long equity holding and any net interest income.
Fluctuations in the value of an open contract are recorded daily as net unrealized appreciation or depreciation. The Fund will realize a gain or loss upon termination or reset of the contract. Either party, under certain conditions, may terminate the contract prior to the contract’s expiration date. Equity swap contracts are typically valued based on market quotations or pricing service evaluations for the underlying reference asset. The Valuation Group monitors the credit quality of the Fund’s counterparties and may adjust the valuation of a swap in the Valuation Group’s discretion due to, among other things, changes in a counterparty’s credit quality.
Credit risk may arise as a result of the failure of the counterparty to comply with the terms of the contract. Refer to Note 2 O. for further counterparty risk disclosure. Additionally, risk may arise from unanticipated movements in interest rates or in the value of the
The Merger Fund VL
NOTES TO THE FINANCIAL STATEMENTS (continued)
December 31, 2016
Note 2 — SIGNIFICANT ACCOUNTING POLICIES (continued)
underlying securities. These contracts may involve market risk in excess of amounts receivable or payable reflected on the Statement of Assets and Liabilities. Refer to Note 2 Q. for further derivative disclosures.
| I. | Distributions to Shareholders |
Dividends from net investment income and net realized capital gains, if any, are declared and paid at least annually. Income and capital gain distributions are determined in accordance with income tax regulations which may differ from GAAP. These differences are due primarily to wash sale-loss deferrals, constructive sales, straddle-loss deferrals, adjustments on swap contracts, and unrealized gains or losses on Section 1256 contracts, which were realized, for tax purposes, at the end of the Fund’s fiscal year.
Investing in securities of foreign companies and foreign governments involves special risks and considerations not typically associated with investing in U.S. companies and the U.S. government. These risks include fluctuations in currency exchange rates and adverse political, cultural, regulatory, legal, tax, and economic developments as well as different custody and/or settlement practices or delayed settlements in some foreign markets. Moreover, securities of many foreign companies and their markets may be less liquid and their prices more volatile than those of securities of comparable U.S. companies and the U.S. government.
| K. | Foreign Currency Translations |
The books and records of the Fund are maintained in U.S. dollars. Foreign currency transactions are translated into U.S. dollars on the following basis: (i) market value of investment securities, assets and liabilities at the daily rates of exchange, and (ii) purchases and sales of investment securities, dividend and interest income and certain expenses at the rates of exchange prevailing on the respective dates of such transactions. For financial reporting purposes, the Fund does not isolate changes in the exchange rate of investment securities from the fluctuations arising from changes in the market prices of securities. However, for federal income tax purposes, the Fund does isolate and treat as ordinary income the effect of changes in foreign exchange rates on realized gain or loss from the sale of investment securities and payables and receivables arising from trade-date and settlement-date differences. Foreign currency held as cash by the Fund’s custodian is reported separately on the Statement of Assets and Liabilities and on the Statement of Operations.
| L. | Cash and Cash Equivalents |
The Fund considers highly liquid short-term fixed income investments purchased with an original maturity of less than three months to be cash
The Merger Fund VL
NOTES TO THE FINANCIAL STATEMENTS (continued)
December 31, 2016
Note 2 — SIGNIFICANT ACCOUNTING POLICIES (continued)
equivalents. Cash equivalents are included in short-term investments on the Schedule of Investments as well as in investments on the Statement of Assets and Liabilities. Temporary cash overdrafts are reported as payable to custodian.
| M. | Guarantees and Indemnifications |
In the normal course of business, the Fund enters into contracts with service providers that contain general indemnification clauses. The Fund’s maximum exposure under these arrangements is unknown, as this would involve future claims that may be made against the Fund that have not yet occurred. The Fund has not historically incurred material expenses in respect of those provisions.
| N. | Security Transactions, Investment Income and Expenses |
Transactions are recorded for financial statement purposes on the trade date. Realized gains and losses from security transactions are recorded on the identified cost basis. Distributions to shareholders are recorded on the ex-dividend date. Dividend income is recorded on the ex-dividend date, except for certain dividends on foreign securities, which are recorded as soon as the Fund is informed after the ex-dividend date. Interest is accounted for on the accrual basis and includes amortization of premiums and discounts on the effective interest method. At December 31, 2016, expenses include $43,745 of borrowing expenses on securities sold short.
The Fund helps manage counterparty credit risk by entering into agreements only with counterparties the Adviser believes have the financial resources to honor their obligations. The Adviser considers the creditworthiness of each counterparty to a contract in evaluating potential credit risk. The counterparty risk for forward currency exchange contracts to the Fund includes the amount of any net unrealized appreciation on the contract. The counterparty risk for equity swap contracts to the Fund includes the risk of loss of the full amount of any net unrealized appreciation on the contract, along with dividends receivable on long equity contracts and interest receivable on short equity contracts. Written and purchased options sold on an exchange expose the Fund to counterparty risk; however, they are exchange traded and the exchange’s clearinghouse guarantees the options against default. Over-the-counter options counterparty risk includes the risk of loss of the full amount of any net unrealized appreciation.
Financial assets and liabilities, as well as cash collateral received by the Fund’s counterparties and posted are offset by the respective counterparty, and the net amount is reported in the Statement of Assets
The Merger Fund VL
NOTES TO THE FINANCIAL STATEMENTS (continued)
December 31, 2016
Note 2 — SIGNIFICANT ACCOUNTING POLICIES (continued)
and Liabilities when the Fund believes there exists a legally enforceable right to offset the recognized amounts.
The Fund may utilize derivative instruments such as options, swaps, futures, forward contracts and other instruments with similar characteristics to the extent that they are consistent with the Fund’s investment objectives and limitations. The use of these instruments may involve additional investment risks, including the possibility of illiquid markets or imperfect correlation between the value of the instruments and the underlying securities. Derivatives also may create leverage which will amplify the effect of their performance on the Fund and may produce significant losses.
The Fund has adopted authoritative standards regarding disclosure about derivatives and hedging activities and how they affect the Fund’s Statement of Assets and Liabilities and Statement of Operations. For the year ended December 31, 2016, the Fund’s monthly average quantities and notional values are described below:
| | | Monthly Average | | | Monthly Average | |
| | | Quantity | | | Premiums/Notional Value* | |
| Purchased Option Contracts | | | 1,445 | | | $ | 221,637 | |
| Written Option Contracts | | | 1,656 | | | $ | 390,536 | |
| Forward Currency Exchange Contracts | | | 5 | | | $ | 1,659,127 | |
| Long Total Return Swap Contracts | | | 105,063 | | | $ | 2,359,723 | |
| Short Total Return Swap Contracts | | | 11,237 | | | $ | 324,186 | |
| * | Purchased and written options present monthly average premiums and forward currency exchange contracts and total return swaps present monthly average notional value. |
Statement of Assets and Liabilities
Fair values of derivative instruments as of December 31, 2016:
| | Asset Derivatives | |
| | Statement of Assets | | |
Derivatives | and Liabilities Location | Fair Value | |
| Equity Contracts: | | | |
| Purchased Option Contracts | Investments | | $ | 38,308 | |
| Foreign Exchange Contracts: | | | | | |
| Forward Currency Exchange Contracts | Receivables | | | 8,404 | |
| Total | | | $ | 46,712 | |
| | Liability Derivatives | |
| Statement of Assets | | | | |
Derivatives | and Liabilities Location | Fair Value | |
| Equity Contracts: | | | | | |
| Written Option Contracts | Written Option Contracts | | $ | 439,244 | |
| Swap Contracts | Payables | | | 75,403 | |
| Total | | | | | |
The Merger Fund VL
NOTES TO THE FINANCIAL STATEMENTS (continued)
December 31, 2016
Note 2 — SIGNIFICANT ACCOUNTING POLICIES (continued)
Statement of Operations
The effect of derivative instruments on the Statement of Operations for the year ended December 31, 2016:
| Amount of Realized Gain (Loss) on Derivatives | |
| | | | | | | | | | | | | | |
| | | | | | | | | Forward | | | | | | | |
| | | Purchased | | | Written | | | Currency | | | | | | | |
| | | Option | | | Option | | | Exchange | | | Swap | | | | |
Derivatives | | Contracts* | | | Contracts | | | Contracts | | | Contracts | | | Total | |
| Equity Contracts | | $ | (424,807 | ) | | $ | 654,464 | | | $ | — | | | $ | 229,699 | | | $ | 459,356 | |
| Foreign Exchange | | | | | | | | | | | | | | | | | | | | |
| Contracts | | | — | | | | — | | | | 293,002 | | | | — | | | | 293,002 | |
| Total | | $ | (424,807 | ) | | $ | 654,464 | | | $ | 293,002 | | | $ | 229,699 | | | $ | 752,358 | |
| * | The amounts disclosed are included in the realized gain (loss) on investments. |
| Change in Unrealized Appreciation (Depreciation) on Derivatives | |
| | |
| | | | | | | | | Forward | | | | | | | |
| | | Purchased | | | Written | | | Currency | | | | | | | |
| | | Option | | | Option | | | Exchange | | | Swap | | | | |
Derivatives | | Contracts* | | | Contracts | | | Contracts | | | Contracts | | | Total | |
| Equity Contracts | | $ | 68,886 | | | $ | (191,062 | ) | | $ | — | | | $ | (276,007 | ) | | $ | (398,183 | ) |
| Foreign Exchange | | | | | | | | | | | | | | | | | | | | |
| Contracts | | | — | | | | — | | | | (13,136 | ) | | | — | | | | (13,136 | ) |
| Total | | $ | 68,886 | | | $ | (191,062 | ) | | $ | (13,136 | ) | | $ | (276,007 | ) | | $ | (411,319 | ) |
| * | The amounts disclosed are included in the change in unrealized appreciation (depreciation) on investments. |
Note 3 — AGREEMENTS
The Fund’s investment adviser is Westchester Capital Management, LLC pursuant to an investment advisory agreement with the Adviser dated as of January 1, 2011 (the “Advisory Agreement”). Under the terms of the Advisory Agreement, the Adviser is entitled to receive a fee, calculated daily and payable monthly, at the annual rate of 1.25% of the Fund’s average daily net assets. Certain officers of the Fund are also officers of the Adviser. The Advisory Agreement was approved for an initial term of two years and thereafter will remain in effect from year to year provided that such continuance is specifically approved at least annually by the vote of a majority of the Fund’s Trustees who are not interested persons of the Adviser or the Fund or by a vote of a majority of the outstanding voting securities of the Fund. The Adviser has entered into an agreement with the Fund whereby the Adviser has agreed to either reduce all or a portion of its management fee and, if necessary, to bear certain other expenses (to the extent permitted by the Internal Revenue Code of 1986, as amended, but not including brokerage commissions, short dividends, interest expense, taxes, acquired fund fees and expenses or extraordinary expenses)
The Merger Fund VL
NOTES TO THE FINANCIAL STATEMENTS (continued)
December 31, 2016
Note 3 — AGREEMENTS (continued)
associated with operating the Fund so that the total Annual Fund Operating Expenses do not exceed 1.40% of the Fund’s average daily net assets until December 31, 2017 (the “Expense Waiver and Reimbursement Agreement”). The Expense Waiver and Reimbursement Agreement permits the Adviser to recapture amounts that it waives or absorbs on behalf of the Fund at any time within three years of the end of the fiscal year in which the fee was reduced or waived or the expense was borne provided that doing so would not cause the Fund’s operating expenses for that year, excluding brokerage commissions, short dividends, interest expense, taxes, acquired fund fees and expenses or extraordinary expenses, to exceed 1.40%. The Expense Waiver and Reimbursement Agreement may be terminated at anytime by the Board. For the year ended December 31, 2016, the Adviser reimbursed $234,695 of advisory fees to the Fund.
Reimbursed expenses subject to potential recovery by year of expiration are as follows:
| | Year of Expiration | Potential Recovery | |
| | 12/31/17 | $229,465 | |
| | 12/31/18 | $240,484 | |
| | 12/31/19 | $234,695 | |
U.S. Bancorp Fund Services, LLC, a subsidiary of U.S. Bancorp, a publicly held bank holding company, serves as transfer agent, administrator, accountant, dividend paying agent and shareholder servicing agent for the Fund. U.S. Bank, N.A. serves as custodian for the Fund.
Note 4 — SHARES OF BENEFICIAL INTEREST
The Board of Trustees has the authority to issue an unlimited amount of shares of beneficial interest without par value.
Changes in shares of beneficial interest were as follows:
| | | Year Ended | | | Year Ended | |
| | | December 31, 2016 | | | December 31, 2015 | |
| | | Shares | | | Amount | | | Shares | | | Amount | |
| Issued | | | 677,793 | | | $ | 7,142,483 | | | | 1,593,362 | | | $ | 17,459,809 | |
| Issued as reinvestment | | | | | | | | | | | | | | | | |
| of dividends | | | 55,149 | | | | 581,827 | | | | 88,777 | | | | 928,604 | |
| Redeemed | | | (875,820 | ) | | | (9,185,132 | ) | | | (618,536 | ) | | | (6,761,677 | ) |
| Net Increase (Decrease) | | | (142,878 | ) | | $ | (1,460,822 | ) | | | 1,063,603 | | | $ | 11,626,736 | |
Note 5 — INVESTMENT TRANSACTIONS AND INCOME TAX INFORMATION
Purchases and sales of securities for the year ended December 31, 2016 (excluding short-term investments, short-term options, forward currency contracts, swap contracts and short positions) aggregated $53,276,873 and $45,868,558, respectively. There were no purchases or sales of U.S. Government securities.
The Merger Fund VL
NOTES TO THE FINANCIAL STATEMENTS (continued)
December 31, 2016
Note 5 — INVESTMENT TRANSACTIONS AND INCOME TAX INFORMATION (continued)
At December 31, 2016, the components of accumulated earnings (losses) on a tax basis were as follows:
| Cost of investments* | | $ | 34,716,340 | |
| Gross unrealized appreciation | | | 1,117,122 | |
| Gross unrealized depreciation | | | (650,209 | ) |
| Net unrealized appreciation | | $ | 466,913 | |
| Undistributed ordinary income | | $ | — | |
| Undistributed long-term capital gain | | | — | |
| Total distributable earnings | | $ | — | |
| Other accumulated losses | | | (1,152,358 | ) |
| Total accumulated losses | | $ | (685,445 | ) |
| * | Represents cost for federal income tax purposes and differs from the cost for financial reporting purposes due to wash sales and constructive sales. |
GAAP requires that certain components of net assets relating to permanent differences be reclassified between financial and tax reporting. Permanent differences are primarily related to foreign currency transactions and swap treatment. These reclassifications have no effect on net assets or net asset value per share. For the year ended December 31, 2016, the following table shows the reclassifications made:
| | Accumulated Net Realized Loss on | |
| Accumulated | Investment, Securities Sold Short, Written | |
| Undistributed | Option Contracts Expired or Closed, | |
| Net Investment | Swap Contracts, Foreign Currency Translation | |
Income | and Forward Currency Exchange Contracts | Paid-in Capital |
| $458,359 | $(352,668) | $(105,691) |
The tax components of dividends paid during the year ended December 31, 2016 and December 31, 2015 were as follows:
| | | 2016 | | | 2015 | |
| Ordinary Income | | $ | 509,841 | | | $ | 778,441 | |
| Long-Term Capital Gains | | | 71,986 | | | | 150,163 | |
| Total Distributions Paid | | $ | 581,827 | | | $ | 928,604 | |
The Fund designated as long term capital gain dividend, pursuant to Internal Revenue Case Section 852(b)(3), the amount necessary to reduce the earnings and profits of the Fund related to net capital gain to zero for the tax year ended December 31, 2016. As of December 31, 2016, the Fund had post-October losses deferred, on a tax basis of $28,567. As of December 31, 2016, the Fund had no short term capital loss carryover and $784,804 of long term capital loss carryover.
The Merger Fund VL
NOTES TO THE FINANCIAL STATEMENTS (continued)
December 31, 2016
Note 6 — WRITTEN OPTION CONTRACTS
The premium amount and the number of written option contracts during the year ended December 31, 2016 were as follows:
| | | Number of | | | Premium | |
| | | Contracts | | | Amount | |
| Options outstanding at December 31, 2015 | | | 2,906 | | | $ | 636,492 | |
| Options written | | | 9,835 | | | | 2,178,247 | |
| Options closed | | | (6,682 | ) | | | (1,516,703 | ) |
| Options exercised | | | (2,573 | ) | | | (603,346 | ) |
| Options expired | | | (1,865 | ) | | | (281,459 | ) |
| Options outstanding at December 31, 2016 | | | 1,621 | | | $ | 413,231 | |
Note 7 — OFFSETTING ASSETS AND LIABILITIES
The Fund is subject to various Master Netting Arrangements, which govern the terms of certain transactions with select counterparties. The Master Netting Arrangements allow the Fund to close out and net its total exposure to a counterparty in the event of a default with respect to all the transactions governed under a single agreement with a counterparty. The Master Netting Arrangements also specify collateral posting arrangements at pre-arranged exposure levels. Under the Master Netting Arrangements, collateral is routinely transferred if the total net exposure to certain transactions (net of existing collateral already in place) governed under the relevant Master Netting Arrangement with a counterparty in a given account exceeds a specified threshold depending on the counterparty and the type of Master Netting Arrangement.
The Merger Fund VL
NOTES TO THE FINANCIAL STATEMENTS (continued)
December 31, 2016
Note 7 — OFFSETTING ASSETS AND LIABILITIES (continued)
| | | | | | Gross | | | Net | | | | | | | | | | |
| | | | | | Amounts | | | Amounts | | | | | | | | | | |
| | | | | | Offset | | | Presented | | | Gross Amounts not | | | | |
| | | Gross | | | in the | | | in the | | | offset in the Statement | | | | |
| | | Amounts of | | | Statement | | | Statement | | | of Assets and Liabilities | | | | |
| | | Recognized | | | of Assets | | | of Assets | | | | | | Collateral | | | | |
| | | Assets/ | | | and | | | and | | | Financial | | | Received/ | | | Net | |
| | | Liabilities | | | Liabilities | | | Liabilities | | | Instruments | | | Pledged* | | | Amount | |
| Assets: | | | | | | | | | | | | | | | | | | |
| Description | | | | | | | | | | | | | | | | | | |
| Forward Currency | | | | | | | | | | | | | | | | | | |
| Exchange | | | | | | | | | | | | | | | | | | |
| Contracts** | | $ | 8,943 | | | $ | 539 | | | $ | 8,404 | | | $ | — | | | $ | — | | | $ | 8,404 | |
| Swap Contracts — | | | | | | | | | | | | | | | | | | | | | | | | |
| Bank of America | | | | | | | | | | | | | | | | | | | | | | | | |
| Merrill Lynch | | | | | | | | | | | | | | | | | | | | | | | | |
| & Co., Inc. | | | 38,723 | | | | 38,723 | | | | — | | | | — | | | | — | | | | — | |
| | | $ | 47,666 | | | $ | 39,262 | | | $ | 8,404 | | | $ | — | | | $ | — | | | $ | 8,404 | |
| Liabilities: | | | | | | | | | | | | | | | | | | | | | | | | |
| Description | | | | | | | | | | | | | | | | | | | | | | | | |
| Written Option | | | | | | | | | | | | | | | | | | | | | | | | |
| Contracts** | | $ | 439,244 | | | $ | — | | | $ | 439,244 | | | $ | — | | | $ | 439,244 | | | $ | — | |
| Forward Currency | | | | | | | | | | | | | | | | | | | | | | | | |
| Exchange | | | | | | | | | | | | | | | | | | | | | | | | |
| Contracts** | | | 539 | | | | 539 | | | | — | | | | — | | | | — | | | | — | |
| Swap Contracts — | | | | | | | | | | | | | | | | | | | | | | | | |
| Bank of America | | | | | | | | | | | | | | | | | | | | | | | | |
| Merrill Lynch | | | | | | | | | | | | | | | | | | | | | | | | |
| & Co., Inc. | | | 112,371 | | | | 38,723 | | | | 73,648 | | | | — | | | | 73,648 | | | | — | |
| Swap Contracts — | | | | | | | | | | | | | | | | | | | | | | | | |
| JPMorgan Chase | | | | | | | | | | | | | | | | | | | | | | | | |
| & Co., Inc. | | | 1,755 | | | | — | | | | 1,755 | | | | — | | | | 1,755 | | | | — | |
| | | $ | 553,909 | | | $ | 39,262 | | | $ | 514,647 | | | $ | — | | | $ | 514,647 | | | $ | — | |
| * | | In some instances, the actual collateral received/pledged may be more than amount shown. |
| ** | | JPMorgan Chase & Co., Inc. is the counterparty for all open forward currency exchange contracts and prime broker for all written option contracts held by the Fund as of December 31, 2016. |
Note 8 — SUBSEQUENT EVENTS
Management has evaluated events and transactions occurring after December 31, 2016 through the date that the financial statements were issued, and has determined that no additional disclosure in the financial statements is required.
REPORT OF INDEPENDENT REGISTERED PUBLIC ACCOUNTING FIRM
To the Board of Trustees and Shareholders of
The Merger Fund VL:
In our opinion, the accompanying statement of assets and liabilities, including the schedules of investments, of options written, of forward currency exchange contracts, and of swap contracts and the related statements of operations and of changes in net assets and the financial highlights present fairly, in all material respects, the financial position of The Merger Fund VL (the “Fund”) as of December 31, 2016, the results of its operations for the year then ended, the changes in its net assets for each of the two years in the period then ended and the financial highlights for each of the five years in the period then ended, in conformity with accounting principles generally accepted in the United States of America. These financial statements and financial highlights (hereafter referred to as “financial statements”) are the responsibility of the Fund’s management. Our responsibility is to express an opinion on these financial statements based on our audits. We conducted our audits of these financial statements in accordance with the standards of the Public Company Accounting Oversight Board (United States). Those standards require that we plan and perform the audit to obtain reasonable assurance about whether the financial statements are free of material misstatement. An audit includes examining, on a test basis, evidence supporting the amounts and disclosures in the financial statements, assessing the accounting principles used and significant estimates made by management, and evaluating the overall financial statement presentation. We believe that our audits, which included confirmation of securities as of December 31, 2016 by correspondence with the custodian and brokers, provide a reasonable basis for our opinion.

New York, New York
February 24, 2017
BOARD APPROVAL OF INVESTMENT ADVISORY AGREEMENTS
(Unaudited)
Each year, the Board of Trustees of each of The Merger Fund, The Merger Fund VL, and WCM Alternatives: Event-Driven Fund (together, the “Board”), including a majority of the Trustees who are not interested persons of The Merger Fund, The Merger Fund VL, and WCM Alternatives: Event-Driven Fund (together, the “Independent Trustees”), is required to determine whether to continue the advisory agreements for each of The Merger Fund, The Merger Fund VL, and WCM Alternatives: Event-Driven Fund, respectively. In October 2016, the Board and the Independent Trustees approved the continuation of The Merger Fund’s, The Merger Fund VL’s, and WCM Alternatives: Event-Driven Fund’s (each, a “Fund” and, together, the “Funds”) advisory arrangements with Westchester Capital Management LLC (the “Adviser”) (collectively, the “Agreements”) for an additional one-year period. A summary of the material factors and conclusions that formed the basis for the approval by the Board and the Independent Trustees are discussed below.
Review Process
The Investment Company Act of 1940, as amended, requires that the Board request and evaluate, and that the Adviser furnish, such information as may reasonably be necessary to evaluate the terms of the Agreements. The Independent Trustees began their formal review process in the summer of 2016 by compiling a request for information that sought a wide range of information the Independent Trustees believed might be necessary to evaluate the terms of the Funds’ Agreements. The Independent Trustees were assisted in compiling that information request by counsel to the Independent Trustees.
Following receipt of the Adviser’s response to the information request, the Independent Trustees evaluated all of the information available to them on a Fund-by-Fund basis, and their deliberations were made separately in respect of each Fund. Throughout the review process, the Independent Trustees were advised by their counsel. The Independent Trustees also discussed their obligations with respect to the continuation of the Agreements in a private session with their counsel. The Independent Trustees and Board, in determining to approve the continuation of the Agreements did not identify any particular information that was all-important or controlling, and each Trustee attributed different weights to the various factors. The following summary describes the most important, but not all, of the factors considered by the Board and the Independent Trustees.
BOARD APPROVAL OF INVESTMENT ADVISORY AGREEMENTS
(continued) (Unaudited)
Materials Reviewed
During the course of each year, the Board receives a wide variety of materials relating to the services provided by the Adviser and the Funds’ other service providers, including reports on: each Fund’s investment results; portfolio construction; portfolio composition; portfolio trading practices; and other information relating to the nature, extent and quality of services provided by the Adviser to the Funds. In addition, in connection with its annual consideration of the Agreements, the Board requested and reviewed supplementary information regarding the terms of the Agreements, the Funds’ investment results, advisory fee and total expense comparisons, financial and profitability information regarding the Adviser and its affiliates, descriptions of various functions undertaken by the Adviser, such as compliance monitoring, information about the personnel providing investment management services to the Funds, and information regarding the terms of the Adviser’s other advisory relationships.
The Board also requested and evaluated performance and expense information for other investment companies that were compiled and presented by Morningstar. During the review process, the Board held a telephonic meeting with representatives of Morningstar in which the Board received information regarding the methodology used in compiling Morningstar’s report and the process for how each Fund’s peer group was determined. The Board and the Independent Trustees also considered information regarding so-called “fall-out” benefits to the Adviser and its affiliates due to the Adviser’s relationships with the Funds. After consideration of all of the information presented to them, the Board concluded that they had received all of the information they believed was reasonably necessary to assess the terms of each Agreement and determine whether to renew each Agreement.
Nature, Extent and Quality of Services
Nature and Extent of Services – In considering whether to continue the Agreements for an additional year, the Board and the Independent Trustees evaluated the nature and extent of the services provided by the Adviser. The Board and the Independent Trustees considered information concerning the investment philosophy and investment process used by the Adviser in managing the Funds. In this context, the Board and the Independent Trustees considered the in-house research capabilities of the Adviser as well as other resources available to the Adviser, including research services available to the Adviser as a result of securities transactions effected for the Funds and other investment advisory clients of the Adviser. The Trustees considered the scope and quality of services provided by the Adviser under the Agreements, and noted that the scope
BOARD APPROVAL OF INVESTMENT ADVISORY AGREEMENTS
(continued) (Unaudited)
of work required of the Adviser to perform the contracted-for services had expanded over time as a result of regulatory and other developments. In this respect, the Board also considered the oversight functions performed by officers of the Funds who were supplied by and employees of the Adviser and compensated by the Adviser. The Board and the Independent Trustees also considered the managerial and financial resources available to the Adviser.
Quality of Services – The Board and the Independent Trustees considered the quality of the services provided by the Adviser and the quality of the resources of the Adviser available to the Funds. The Board and the Independent Trustees considered the specialized experience, expertise and professional qualifications of the personnel of the Adviser, including that the Adviser was among a limited number of investment advisers with a long track record managing merger arbitrage and event-driven strategies within the context of a registered mutual fund. The Board and the Independent Trustees considered the complexity of managing the Funds’ strategies relative to other types of funds. The Board and the Independent Trustees also received and reviewed information regarding the non-portfolio management services provided to the Funds by the Adviser in support of the Funds’ operations. The Trustees also considered the personnel that had been retained by the Adviser over recent years to maintain and potentially improve the level of services provided to the Funds.
In their evaluation of the quality of the services provided by the Adviser, the Board and the Independent Trustees considered the performance of the Funds. The Board and the Independent Trustees considered whether the Funds operated within their investment objectives and their record of compliance with their investment restrictions. The Board and the Independent Trustees reviewed information comparing the Funds’ historical performance to relevant market indices and to performance information for other investment companies with similar investment strategies over the one-, three-, five- and ten-year periods (where applicable) ended June 30, 2016. The Board considered that The Merger Fund VL ranked in the second or first quartile among its limited number of peers for the three-, five-, and ten-year periods ended June 30, 2016, while performing in the third quartile of its limited peer group for the one-year period ended June 30, 2016. The Board also considered that while The Merger Fund ranked in the third or fourth quartile of its peer group in Morningstar’s report for each of the one-, three-, and ten-year periods ended June 30, 2016, it ranked in the second quartile for the five-year period ended June 30, 2016, and the Adviser had provided information evidencing that Fund’s outperformance
BOARD APPROVAL OF INVESTMENT ADVISORY AGREEMENTS
(continued) (Unaudited)
of the S&P Merger Arbitrage Index over the one-, three, five, and ten-year periods ending August 31, 2016. The Board also considered that WCM Alternatives: Event-Driven Fund ranked in the second quartile of its Morningstar peer group for the one-year period ended June 30, 2016 and at the median of its peers. In all of their evaluations of relative performance, the Trustees noted that Morningstar’s report included a relatively small number of peer funds for comparison, especially over longer-term periods, due to the limited number of registered mutual funds pursuing merger-arbitrage and/or event-driven investment strategies. At the request of the Independent Trustees, Morningstar also provided for the Board’s October 2016 meeting, updated performance information for the Funds through September 30, 2016, which the Trustees also reviewed and considered. In their evaluation of each Fund’s performance, including each Fund’s relatively lower levels of absolute performance over recent periods, the Trustees also considered, among other things, information the Adviser had provided regarding the market conditions affecting merger-arbitrage strategies generally; the prevailing low interest rate environment generally and the Funds’ historical relationship to interest rates; and that the Adviser had continued to deliver low volatility returns, with relatively low levels of correlation to the equity markets. The Board and the Independent Trustees concluded, within the context of their overall conclusions regarding each of the Agreements, that they were satisfied with the nature, extent and quality of the services provided by the Adviser and that each Fund’s performance record supported the renewal of the Agreements.
Management Fees and Expenses
The Board and the Independent Trustees reviewed information, including comparative information provided by Morningstar, regarding the advisory fees paid to the Adviser and the total expenses borne by the Funds. They considered the Funds’ advisory fees relative to their peer groups. In this regard, the Independent Trustees noted that each Fund’s net advisory fees and net operating expenses, after taking into account any expense limitation arrangements or advisory fee waivers, remained competitive with its peers. The Independent Trustees noted The Merger Fund’s net advisory fees and net operating expenses (Investor Class) were below the median of its peer group, that The Merger Fund VL’s and WCM Alternatives: Event-Driven Fund’s net advisory fees were at or near their respective peer group medians and that The Merger Fund VL’s net operating expenses were below its peer group median. The Trustees noted that WCM Alternatives: Event-Driven Fund’s net operating expenses were above the median of its peer group, though in line with a number of its peers.
BOARD APPROVAL OF INVESTMENT ADVISORY AGREEMENTS
(continued) (Unaudited)
The Board and the Independent Trustees also considered the fees that the Adviser and its affiliates charge other clients with investment strategies similar to the Funds, including where an account is subject to a performance-based fee. The Board and the Independent Trustees considered information provided by the Adviser describing the differences in services provided to these other clients. In this regard, the Adviser noted that the services provided to these other clients typically consist nearly exclusively or primarily of portfolio management services. The Adviser described the additional level of services provided to the Funds under the terms of the Funds’ advisory arrangements or otherwise, such as supplying Fund management, general coordination of the Funds’ other service providers, the provision of middle and back office support functions, provision of certain compliance and regulatory functions, and quarterly preparation and attendance of meetings with the Board, as well as the greater financial obligations and entrepreneurial risks the Adviser undertakes in respect of sponsoring a registered investment company. The Board and the Independent Trustees concluded, within the context of their overall conclusions regarding each of the Agreements, that the fees charged under the Agreements represent reasonable compensation to the Adviser in light of the services provided.
Profitability and Possible Economies of Scale
Profitability – The Board and the Independent Trustees reviewed information regarding the cost of services provided by the Adviser and the profitability (before distribution expenses and taxes) of the Adviser’s relationship with each Fund. The Board noted that, in reporting on its profitability, the Adviser had included an estimated expense for compensation of the Funds’ portfolio managers because the Funds’ portfolio managers are principal owners of the Adviser and do not receive a salary or bonus. The Board noted that the Adviser would have incurred significant compensation expense if it instead had to hire equivalently qualified portfolio managers to perform the services performed by the owners, which costs would significantly reduce the Adviser’s profitability. In evaluating the Adviser’s reported profitability, the Independent Trustees considered that certain of the information provided by the Adviser was necessarily estimated and that preparing the related profitability information involved certain assumptions and allocations that were imprecise. The Board and the Independent Trustees recognized that the probative value of profitability information may be limited because a wide range of comparative information for peer advisers often is not generally available and it can be affected by numerous factors, including the structure of the particular adviser, the types of funds it manages, its
BOARD APPROVAL OF INVESTMENT ADVISORY AGREEMENTS
(continued) (Unaudited)
business mix, the efficiency of an adviser’s operations, numerous assumptions about allocations and the adviser’s cost of capital. The Independent Trustees concluded that the Adviser’s profitability with respect to The Merger Fund may be relatively high in comparison to other mutual funds, but they noted that the Adviser was among a limited number of investment advisers with an extensive history of providing competitive merger-arbitrage portfolio management services within a registered investment company vehicle and that the Fund’s net advisory fees and net operating expenses remained below its limited number of close peers.
In addition, the Board and the Independent Trustees considered information regarding the direct and indirect benefits the Adviser receives as a result of its relationship with the Funds, including research purchased with soft dollar credits earned from portfolio transactions effected on behalf of the Funds (soft dollar arrangements) and reputational benefits.
Economies of Scale – The Board and the Independent Trustees reviewed the extent to which the Adviser may realize economies of scale in managing the Funds. The Board and the Independent Trustees concluded within the context of their overall conclusions regarding each of the Agreements that the Adviser’s level of profitability from its relationship with each Fund was not excessive in light of, among other things, the Funds’ competitive advisory fees and expense ratios. The Trustees also considered that the Adviser proposed to continue to apply waivers to The Merger Fund’s advisory fee that generally had the effect of breakpoints in the Adviser’s advisory fee and to continue the expense limitation agreements applicable to The Merger Fund VL and WCM Alternatives: Event-Driven Fund, in each case for an additional one-year period. The Independent Trustees concluded that those measures were reasonably designed to result in the sharing of economies of scale realized by the Adviser, if any, with the Funds and their shareholders.
Conclusions
Based on their review, including their consideration of each of the factors referred to above, the Board and the Independent Trustees concluded that the terms of the Agreements, including the fees payable to the Adviser, are fair and reasonable to the Funds and their shareholders given the scope and quality of the services provided to the Funds and such other considerations as the Independent Trustees considered relevant in the exercise of their reasonable business judgment and that the continuation of the Agreements was in the best interests of the Funds and their shareholders. Accordingly, the Board and Independent Trustees unanimously approved the continuation of the Agreements.
INFORMATION ABOUT TRUSTEES AND OFFICERS
The business and affairs of the Fund are managed under the direction of the Fund’s Board of Trustees. Information pertaining to the Fund’s Trustees and Officers is set forth below. The Statement of Additional Information includes additional information about the Fund’s Trustees and Officers and is available, without charge, upon request by calling 1-800-343-8959.
| | | | | # of | Other |
| | | Term of | | Portfolios | Directorships |
| | | Office | | in Fund | Held by |
| | | and | Principal | Complex | Trustee |
| Name, | Position(s) | Length | Occupation(s) | Overseen | During |
| Address and | Held with | of Time | During the | by | the Past |
Year of Birth | the Fund | Served | Past Five Years | Trustee** | Five Years |
| | | | | | |
| Roy Behren* | Co-President | Indefinite; | Co-Portfolio Manager | 3 | None |
| Westchester Capital | and | since | and Co-President of | | |
| Management, LLC | Treasurer; | 2011; | Westchester Capital | | |
| 100 Summit Lake Drive | Trustee | Indefinite; | Management, LLC, the | | |
| Valhalla, NY 10595 | | since | Fund’s Adviser, since | | |
| Year of Birth: 1960 | | 2014 | 2011. | | |
| | | | | | |
| Michael T. Shannon* | Co-President | Indefinite; | Co-Portfolio Manager | 3 | None |
| Westchester Capital | and | since | and Co-President of | | |
| Management, LLC | Trustee | 2011 | Westchester Capital | | |
| 100 Summit Lake Drive | | | Management, LLC, the | | |
| Valhalla, NY 10595 | | | Fund’s Adviser, since | | |
| Year of Birth: 1966 | | | 2011. | | |
| | | | | | |
| Barry Hamerling | Independent | Indefinite; | Managing Partner of | 3 | Trustee of |
| c/o Westchester | Trustee | since | Premium Ice Cream of | | AXA Premier |
| Capital | | 2007 | America since 1995. | | VIP Trust |
| Management, LLC | | | Managing Partner of | | |
| 100 Summit Lake Drive | | | B&J Freeport since | | |
| Valhalla, NY 10595 | | | 1990. Managing Partner | | |
| Year of Birth: 1946 | | | of Let-US Creations | | |
| | | | from 1999 to 2011. | | |
| | | | | | |
| Richard V. Silver | Independent | Indefinite; | Consultant with AXA | 3 | None |
| c/o Westchester | Trustee | since | Equitable Life | | |
| Capital | | 2013 | Insurance Company | | |
| Management, LLC | | | from May 2012 to April | | |
| 100 Summit Lake Drive | | | 2013. Senior Executive | | |
| Valhalla, NY 10595 | | | Vice President, Chief | | |
| Year of Birth: 1955 | | | Legal Officer and Chief | | |
| | | | Administrative Officer | | |
| | | | of AXA Equitable Life | | |
| | | | Insurance Company | | |
| | | | from February 2010 to | | |
| | | | April 2012. | | |
INFORMATION ABOUT TRUSTEES AND OFFICERS (continued)
| | | | | # of | Other |
| | | Term of | | Portfolios | Directorships |
| | | Office | | in Fund | Held by |
| | | and | Principal | Complex | Trustee |
| Name, | Position(s) | Length | Occupation(s) | Overseen | During |
| Address and | Held with | of Time | During the | by | the Past |
Year of Birth | the Fund | Served | Past Five Years | Trustee** | Five Years |
| | | | | | |
| Christianna Wood | Independent | Indefinite; | Chief Executive Officer | 3 | Director of |
| c/o Westchester | Trustee | since | and President of Gore | | H&R Block |
| Capital | | 2013 | Creek Capital, Ltd. | | Corporation; |
| Management, LLC | | | since August 2009. | | Director of |
| 100 Summit Lake Drive | | | | | International |
| Valhalla, NY 10595 | | | | | Securities |
| Year of Birth: 1959 | | | | | Exchange; |
| | | | | | Director of |
| | | | | | Grange |
| | | | | | Insurance |
| | | | | | |
| Bruce Rubin | Vice | One-year | Chief Operating | N/A | N/A |
| Westchester Capital | President, | terms; | Officer of Westchester | | |
| Management, LLC | Chief | since | Capital Management, | | |
| 100 Summit Lake Drive | Compliance | 2010 | LLC, the Fund’s Adviser. | | |
| Valhalla, NY 10595 | Officer and | | | | |
| Year of Birth: 1959 | Anti-Money | | | | |
| | Laundering | | | | |
| | Compliance | | | | |
| | Officer | | | | |
| | | | | | |
| Abraham R. Cary | Secretary | One-year | Head of Trading of | N/A | N/A |
| Westchester Capital | | terms; | Westchester Capital | | |
| Management, LLC | | since | Management, LLC, the | | |
| 100 Summit Lake Drive | | 2012 | Fund’s Adviser, since | | |
| Valhalla, NY 10595 | | | 2011. | | |
| Year of Birth: 1975 | | | | | |
| * | Denotes a trustee who is an “interested person” (as that term is defined in Section 2(a)(19) of the Investment Company Act of 1940, as amended) of the Fund or of the Adviser. Mr. Behren and Mr. Shannon are deemed to be interested persons because of their affiliation with the Fund’s investment adviser, Westchester Capital Management, LLC, and because they are officers of the Fund. |
| ** | The fund complex consists of the Fund, The Merger Fund and WCM Alternatives: Event-Driven Fund. |
The Merger Fund VL
ADDITIONAL INFORMATION (Unaudited)
For the fiscal year ended December 31, 2016, certain dividends paid by the Fund may be subject to a maximum tax rate of 15%, as provided for by the Jobs and Growth Tax Relief Reconciliation Act of 2003. The percentage of dividends declared from ordinary income designated as qualified dividend income for the fiscal year ended December 31, 2016 was 0.00% for the Fund.
For corporate shareholders, the percent of ordinary income distributions qualifying for the corporate dividends received deduction for the fiscal year ended December 31, 2016 was 56.71% for the Fund.
The percentage of taxable ordinary income distributions that are designated as short-term capital gain distributions under Internal Revenue Code Section 871(k)(2)(c) for the fiscal year ended December 31, 2016 was 55.17% for the Fund.
AVAILABILITY OF PROXY VOTING INFORMATION
Information regarding how the Fund generally votes proxies relating to portfolio securities may be obtained without charge by calling the Fund’s Transfer Agent at 1-800-343-8959 or by visiting the SEC’s website at www.sec.gov. Information regarding how the Fund voted proxies during the most recent 12-month period ended June 30 is available on the SEC’s website or by calling the toll-free number listed above.
AVAILABILITY OF QUARTERLY PORTFOLIO SCHEDULE
The Fund files its complete schedule of portfolio holdings with the SEC for the first and third quarters of each fiscal year on Form N-Q. The Fund’s Forms N-Q are available on the SEC’s website at www.sec.gov and may be reviewed and copied at the SEC’s Public Reference Room in Washington, DC. Information on the operation of the Public Reference Room may be obtained by calling 1-800-SEC-0330.
(This Page Intentionally Left Blank.)
Investment Adviser
Westchester Capital Management, LLC
100 Summit Lake Drive
Valhalla, NY 10595
(914) 741-5600
www.westchestercapitalfunds.com
Administrator, Transfer Agent, Accountant,
Dividend Paying Agent and Shareholder Servicing Agent
U.S. Bancorp Fund Services, LLC
615 East Michigan Street
P.O. Box 701
Milwaukee, WI 53201-0701
(800) 343-8959
Custodian
U.S. Bank, N.A.
1555 North Rivercenter Drive, Suite 302
Milwaukee, WI 53212
(800) 343-8959
Trustees
Roy Behren
Michael T. Shannon
Barry Hamerling
Richard V. Silver
Christianna Wood
Executive Officers
Roy Behren, Co-President and Treasurer
Michael T. Shannon, Co-President
Bruce Rubin, Vice President and
Chief Compliance Officer
Abraham R. Cary, Secretary
Counsel
Ropes & Gray LLP
1211 Avenue of the Americas
New York, NY 10036
Independent Registered
Public Accounting Firm
PricewaterhouseCoopers LLP
300 Madison Avenue
New York, NY 10017
Item 2. Code of Ethics.
The registrant has adopted a code of ethics that applies to the registrant’s principal executive officer and principal financial officer. The registrant has not granted any waivers from any provisions of the code of ethics during the period covered by this report. A copy of the registrant’s Code of Ethics is filed herewith. You may also receive a copy of the registrant’s Code of Ethics, free of charge, upon request by calling (800) 343-8959.
Item 3. Audit Committee Financial Expert.
The registrant’s board of trustees has determined that there is at least one audit committee financial expert serving on its audit committee. Barry Hamerling and Christianna Wood are the “audit committee financial experts” and are considered to be “independent” as each term is defined in Item 3 of Form N-CSR.
Item 4. Principal Accountant Fees and Services.
The registrant has engaged its principal accountant, PricewaterhouseCoopers LLP, to perform audit services, audit-related services, tax services and other services during the past two fiscal years. “Audit services” refer to performing an audit of the registrant's annual financial statements or services that are normally provided by the accountant in connection with statutory and regulatory filings or engagements for those fiscal years. “Audit-related services” refer to the assurance and related services by the principal accountant that are reasonably related to the performance of the audit. “Tax services” refer to professional services rendered by the principal accountant for tax compliance, tax advice, and tax planning. The following table details the aggregate fees billed or expected to be billed for each of the last two fiscal years for audit fees, audit-related fees, tax fees and other fees by the principal accountant.
| | FYE 12/31/2016 | FYE 12/31/2015 |
| Audit Fees | $44,075 | $44,075 |
| Audit-Related Fees | $ - | $ - |
| Tax Fees | $6,100 | $6,100 |
| All Other Fees | $ - | $ - |
The audit committee has adopted pre-approval policies and procedures that require the audit committee to pre‑approve all audit and non‑audit services of the registrant, including services provided to any entity affiliated with the registrant.
The percentage of fees billed by PricewaterhouseCoopers LLP applicable to non-audit services pursuant to waiver of pre-approval requirement were as follows:
| | FYE 12/31/2016 | FYE 12/31/2015 |
| Audit-Related Fees | 0% | 0% |
| Tax Fees | 0% | 0% |
| All Other Fees | 0% | 0% |
All of the principal accountant’s hours spent on auditing the registrant’s financial statements were attributed to work performed by full‑time permanent employees of the principal accountant.
The following table indicates the non-audit fees billed or expected to be billed by the registrant’s accountant for services to the registrant and to the registrant’s investment adviser (and any other controlling entity, etc.—not including any sub-advisers) for the last two years. The audit committee of the board of trustees has considered whether the provision of non-audit services that were rendered to the registrant's investment adviser is compatible with maintaining the principal accountant's independence and has concluded that the provision of such non-audit services by the accountant has not compromised the accountant’s independence.
| Non-Audit Related Fees | FYE 12/31/2016 | FYE 12/31/2015 |
| Registrant | - | - |
| Registrant’s Investment Adviser | - | - |
Item 5. Audit Committee of Listed Registrants.
Item 6. Investments.
The registrant’s Schedule of Investments is included as part of the report to shareholders filed under Item 1 of this Form.
Item 7. Disclosure of Proxy Voting Policies and Procedures for Closed-End Management Investment Companies.
Not applicable to open-end investment companies.
Item 8. Portfolio Managers of Closed-End Management Investment Companies.
Not applicable to open-end investment companies.
Item 9. Purchases of Equity Securities by Closed‑End Management Investment Company and Affiliated Purchasers.
Not applicable to open-end investment companies.
Item 10. Submission of Matters to a Vote of Security Holders.
There have been no material changes to the procedures by which shareholders may recommend nominees to the registrant’s board of trustees.
Item 11. Controls and Procedures.
| (a) | The registrant’s Co-Presidents/Chief Executive Officers and Treasurer/Chief Financial Officer have reviewed the registrant's disclosure controls and procedures (as defined in Rule 30a-3(c) under the Investment Company Act of 1940 (the “Act”)) as of a date within 90 days of the filing of this report, as required by Rule 30a-3(b) under the Act and Rules 13a-15(b) or 15d‑15(b) under the Securities Exchange Act of 1934. Based on their review, such officers have concluded that the disclosure controls and procedures are effective in ensuring that information required to be disclosed in this report is appropriately recorded, processed, summarized and reported and made known to them by others within the registrant and by the registrant’s service provider. |
| (b) | There were no changes in the registrant's internal control over financial reporting (as defined in Rule 30a-3(d) under the Act) that occurred during the second fiscal quarter of the period covered by this report that has materially affected, or is reasonably likely to materially affect, the registrant's internal control over financial reporting. |
Item 12. Exhibits.
| (a) | (1) Any code of ethics or amendment thereto, that is the subject of the disclosure required by Item 2, to the extent that the registrant intends to satisfy Item 2 requirements through filing an exhibit. Filed herewith. |
(2) A separate certification for each principal executive officer and principal financial officer pursuant to Section 302 of the Sarbanes-Oxley Act of 2002. Filed herewith.
(3) Any written solicitation to purchase securities under Rule 23c‑1 under the Act sent or given during the period covered by the report by or on behalf of the registrant to 10 or more persons. Not applicable to open-end investment companies.
| (b) | Certifications pursuant to Section 906 of the Sarbanes‑Oxley Act of 2002. Furnished herewith. |
SIGNATURES
Pursuant to the requirements of the Securities Exchange Act of 1934 and the Investment Company Act of 1940, the registrant has duly caused this report to be signed on its behalf by the undersigned, thereunto duly authorized.
(Registrant) The Merger Fund VL
By (Signature and Title)* /s/ Michael T. Shannon
Michael T. Shannon, Co-President
Date March 3, 2017
By (Signature and Title)*/s/ Roy Behren
Roy Behren, Co-President and Treasurer
Date March 3, 2017
Pursuant to the requirements of the Securities Exchange Act of 1934 and the Investment Company Act of 1940, this report has been signed below by the following persons on behalf of the registrant and in the capacities and on the dates indicated.
By (Signature and Title)* /s/ Michael T. Shannon
Michael T. Shannon, Co-President
Date March 3, 2017
By (Signature and Title)*/s/ Roy Behren
Roy Behren, Co-President and Treasurer
Date March 3, 2017
* Print the name and title of each signing officer under his or her signature.