UNITED STATES
SECURITIES AND EXCHANGE COMMISSION
Washington, D.C. 20549
FORM N-CSR
CERTIFIED SHAREHOLDER REPORT OF REGISTERED
MANAGEMENT INVESTMENT COMPANIES
Investment Company Act file number 811-21279
The Merger Fund VL
(Exact name of registrant as specified in charter)
100 Summit Lake Drive
Valhalla, New York 10595
(Address of principal executive offices) (Zip code)
Roy Behren and Michael T. Shannon
100 Summit Lake Drive
Valhalla, New York 10595
(Name and address of agent for service)
1-800-343-8959
Registrant's telephone number, including area code
Date of fiscal year end: December 31, 2018
Date of reporting period: December 31, 2018
Item 1. Reports to Stockholders.
December 31, 2018
Annual Report
THE MERGER FUND VL
Beginning on January 1, 2021, as permitted by regulations adopted by the U.S. Securities and Exchange Commission, at the election of your insurance company, paper copies of the Fund’s shareholder reports may no longer be sent by mail, unless you specifically request paper copies of the reports from your insurance company. Instead, the reports will be made available free of charge on a website, and if you have not previously elected electronic delivery of your shareholder reports, you will be notified by mail each time a report is posted and provided with a website link to access the report. If you already elected to receive shareholder reports electronically, you will not be affected by this change and you need not take any action. You may elect to receive shareholder reports and other communications from your insurance company electronically by contacting your insurance company. You may elect to receive all future reports in paper free of charge. You can inform your insurance company that you wish to continue receiving paper copies of your shareholder reports by contacting your insurance company. Your election to receive reports in paper will apply to all funds held in your account with your insurance company.
| STANDARDIZED | Mutual Fund Assets: | |
| PERFORMANCE SUMMARY | Merger Arbitrage1 | $3.0 billion |
| As of December 31, 2018 | Opportunistic Credit | $3.8 million |
| | Multi-Event2 | $381.3 million |
| | |
| | Average Annual Total Return (%) |
| Merger Arbitrage | QTD | YTD | 1 YR | 5 YR | 10 YR | Life |
| The Merger Fund | | | | | | |
| (Institutional) | 1.98 | 7.98 | 7.98 | 2.91 | n/a | 3.10 |
| The Merger Fund | | | | | | |
| (Investor) | 1.92 | 7.68 | 7.68 | 2.62 | 3.38 | 6.10 |
| Insurance | | | | | | |
Dedicated Funds5 | | | | | | |
| The Merger Fund VL | 1.73 | 7.09 | 7.09 | 2.48 | 3.64 | 4.70 |
Opportunistic Credit5 | | | | | | |
| Credit Event Fund | | | | | | |
| (Institutional) | -3.12 | -2.93 | -2.93 | n/a | n/a | -2.92 |
| Credit Event Fund | | | | | | |
| (Investor) | -3.23 | -3.23 | -3.23 | n/a | n/a | -3.22 |
Multi Event5 | | | | | | |
| Event-Driven Fund | | | | | | |
| (Institutional) | -0.41 | 5.27 | 5.27 | n/a | n/a | 2.89 |
| Event-Driven Fund | | | | | | |
| (Investor) | -0.44 | 4.95 | 4.95 | n/a | n/a | 4.92 |
| | Annual Operating Expense Ratio (%)3 |
| | | | Net Expenses | | |
| | Gross | Net | excluding | | |
| | Expense | Expense | Investment- | Performance | |
| Merger Arbitrage | Ratio | Ratio3 | Related Expenses4,5 | Inception | Ticker |
| The Merger Fund | | | | | |
| (Institutional) | 1.60% | 1.59% | 1.17% | 08/01/2013 | MERIX |
| The Merger Fund | | | | | |
| (Investor) | 1.92% | 1.91% | 1.49% | 01/31/1989 | MERFX |
| Insurance | | | | | |
Dedicated Funds5 | | | | | |
| The Merger Fund VL | 2.57% | 1.84% | 1.40% | 05/26/2004 | MERVX |
Opportunistic Credit5 | | | | | |
| Credit Event Fund | | | | | |
| (Institutional) | 2.30% | 1.88% | 1.64% | 12/29/2017 | WCFIX |
| Credit Event Fund | | | | | |
| (Investor) | 2.55% | 2.13% | 1.89% | 12/29/2017 | WCFRX |
Multi Event5 | | | | | |
| Event-Driven Fund | | | | | |
| (Institutional) | 2.32% | 2.32% | 1.74% | 01/02/2014 | WCEIX |
| Event-Driven Fund | | | | | |
| (Investor) | 2.57% | 2.57% | 1.99% | 03/22/2017 | WCERX |
QTD and YTD performance is not annualized. Performance data quoted represent past performance; past performance does not guarantee future results. The performance results portrayed herein reflect the reinvestment of all interest, dividends and distributions. The investment return and principal value of an investment will fluctuate so that an investor’s shares, when redeemed, may be worth more or less than their original cost. Current performance of the Funds may be lower or higher than the performance quoted. Performance data included herein for periods prior to 2011 reflect that of Westchester Capital Management, Inc., the Funds’ prior investment advisor. Messrs. Behren and Shannon, the Funds’ current portfolio managers, have served as co-portfolio managers of the Funds since 2007. Performance data current to the most recent month-end may be obtained by calling (800) 343-8959 or by visiting www.westchestercapitalfunds.com.
1Includes USD 147 million in a sub-advised fund. 2Includes USD 237 million in sub-advised funds. 3Net expense ratios are as of a fund’s most recent prospectus and were applicable to investors. 4Investment related expenses include expenses related to short sales and interest on any borrowing and acquired fund fees and expenses. 5The Adviser has contractually agreed to waive a portion of its investment advisory fee through April 30, 2019 for The Merger Fund® and WCM Alternatives: Event-Driven Fund, and through December 31, 2019 for The Merger Fund VL. The Adviser has contractually agreed to waive a portion of its investment advisory fee and to reimburse other ordinary operating expenses through April 30, 2019 for the WCM Alternatives: Credit Event Fund.
Trailing Returns
As of Date: 12/31/2018
| | QTD | YTD | 1 Year | 5 Years | 10 Years |
| US Fund Market Neutral | -0.45% | -0.63% | -0.63% | 0.82% | 0.33% |
| US Fund Multialternative | -4.51% | -4.61% | -4.61% | 0.08% | 2.40% |
| US Fund Long-Short Credit | -2.74% | -2.16% | -2.16% | 0.86% | 5.13% |
| Wilshire Liq Alt Event Driven | -1.65% | 0.27% | 0.27% | 0.26% | 2.73% |
| S&P 500 | -13.52% | -4.39% | -4.39% | 8.50% | 13.12% |
| BBgBarc US Agg Bond | 1.64% | 0.01% | 0.01% | 2.52% | 3.48% |
| BofAML US 3M Trsy Bill | 0.56% | 1.88% | 1.88% | 0.63% | 0.38% |
Fellow Shareholders,
The Merger Fund® advanced by 1.98% (MERIX) and 1.92% (MERFX) during the 4th quarter, posting a 7.98% and 7.68% YTD return, respectively. The Merger Fund VL, our insurance dedicated vehicle, was up 1.73% for the quarter and 7.09% year-to-date. The WCM Alternatives: Event-Driven Fund (WCEIX) Institutional and (WCERX) Investor share classes, ended the year on a positive note as well, up 5.27% and 4.95%, respectively. 2018 performance was at the high end of our targeted returns and we significantly outperformed most comparable vehicles.
2018: Few Places to Hide
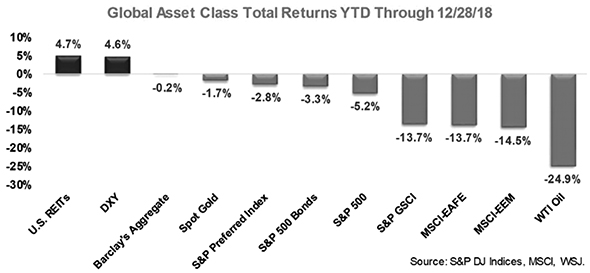
The fourth quarter’s market swoon pulled down a variety of strategies’ performance, including some of those thought to be market-neutral. A confluence of events boosted volatility and dragged down major markets, to finish their worst year since 2008. For the year, the Dow Jones Industrial Average was down 5.6%, the S&P 500 off 4.4% and the NASDAQ down 3.9%. Our relative and absolute performance in this environment illustrates the use case for uncorrelated and volatility-dampening products such as those that we manage.1
As William Watts wrote in Marketwatch in January, almost every asset class suffered declines for the year leaving investors “nowhere to hide.” Quoting a note from Sam Stovall, Chief Investment Strategist at CFRA, Watts added: “No matter the investment, investors likely experienced declines in annual returns. Indeed, even though U.S. REITs and the dollar recorded total returns in excess of 4.5%, declines were seen in bonds, gold, oil, preferred stocks and U.S. equities, along with developed international and emerging market indices.”2
__________
1 | U.S. Indexes Close with worst yearly losses since 2008, The Wall Street Journal, 1/1/19 |
2 | Here’s how ugly 2018 was for stocks and other assets, Marketwatch, 1/1/19 |
Of note, bond funds struggled, influenced by rising rates and credit quality concerns. The Bloomberg Barclays Aggregate Bond Index finished in negative territory and the average intermediate-term bond fund, a popular retail product, also lost 0.5 percent. According to the Seattle Times, funds that focus on corporate debt fared even worse as worries rose that a possible recession could lead to defaults and downgrades. The average corporate bond fund lost 2.5 percent, and the average high-yield bond fund dropped 2.6 percent in 2018.
Merger Arbitrage
The year 2018 was exceptional for mergers and acquisitions, characterized by large successful transactions in many industrial sectors, as companies aimed to create both cost-savings and earnings growth through transactions. Seeking to expand the top line, bottom line and also product lines, the buy vs. build decision was decided in favor of corporate acquisitions. This pursuit of scale drove a surge in deal activity – mostly via strategic transactions within the same industries, including telecommunications, energy, consumer goods and services, and healthcare. Transactions larger than USD10 billion rose by 120% to reach the second highest figure in the last 15 years, while the number of deals above USD5 billion were at decade-long highs.
As noted, The Merger Fund® advanced by 1.92% (MERFX) and 1.98% (MERIX) during the 4th quarter, its 94th gain in the 120 quarters since its inception 30 years ago, posting 7.68% and 7.98% YTD returns, respectively. The Merger Fund VL, our insurance dedicated vehicle, was up 1.73% for the quarter and 7.09% year-to-date. As is typical, the volatility of our returns was a fraction of that of the broad market, with the S&P 500’s 3-year standard deviation at 15.65% versus The Merger Fund’s roughly 2.90%. Speaking of 3 year track records, we are pleased to point out that The Merger Fund® Institutional share class (MERIX) was awarded a five-star Morningstar rating as of January 2019 for its most recent 3 year performance.
The biggest contributor to performance, Twenty-First Century Fox/Walt Disney Co., added 0.46% to the portfolio. We expect this deal to close by the end of next month. Our biggest detractor, DowDuPont Inc., which is in the process of splitting into 3 separately traded public entities, cost the fund 0.15% after the company lowered its earnings guidance in concert with weakness in the materials sector. The transaction appears to provide an attractive risk/reward profile, and we will keep you posted as the situation plays out further. Winners outnumbered the losers by more than 2 to 1 during the period, and no single position contributed to performance by more than 50 basis points. We added 32 new positions, ending with 89 positions in a broad variety of industries, and were 75%
invested as a number of deals closed at or near year end. Despite the relatively large temporary cash position, The Merger Fund® is off to a good start to 2019, ahead by 0.67% and 0.74% for the Investor and Institutional share class, respectively, through the end of January.
| NOTABLE WINNERS | NOTABLE LOSERS |
| Deal | Attribution | Deal | Attribution |
| Twenty-First Century | 0.46% | DowDupont Inc. | -0.15% |
| Fox/Walt Disney | | | |
| Dell Technologies | 0.35% | Newfield Exploration | -0.08% |
| Inc./VMware Inc. | | Co./Encana Corp. | |
| Macro Portfolio Hedge | 0.33% | Huntsman Corporation | -0.08% |
| Shire PLC/Takeda | 0.26% | Time Warner Inc./ | -0.08% |
| Pharmaceutical | | AT&T Inc. | |
| Aetna Inc./CVS | 0.25% | NXP Semiconductors | -0.07% |
| Health Corporation | | NV | |
| Rockwell Collins/ | 0.18% | Altaba Inc./Alibaba | -0.05% |
| United Technologies | | Group Holding Ltd. | |
Event-Driven
| Strategy | Allocations | | Strategy allocations result from our bottom-up process; our investment decisions are based on each opportunity’s unique characteristics. Every investment is based on public information rather than speculation, has a defined timeline and calculable expected return. The strategy is designed to “go where the events are.” We do not weight the portfolio according to pre-determined allocations to macro-factors such as strategy, sector or geography. |
| Arbitrage | 61.48% | |
| Special Situations | 10.48% | |
| Credit-Catalyst | 12.87% | |
| Corporate Restructuring | 15.17% | |
| Total | 100.00% | |
| | | |
The WCM Alternatives: Event-Driven Fund lost 0.41% and 0.44% in the Institutional (WCEIX) and Investor (WCERX) share classes respectively, during the quarter, reaching 5.27% and 4.95% returns for the year. Although lower than The Merger Fund®, it’s performance still comfortably beat most of its peers, as the event-driven space tends to have a larger market correlation than pure merger arbitrage vehicles. In fact, our event-driven fund has a sufficient long-term track record for Morningstar to include it in its overall category rankings, and we are proud to say that we have just been awarded the maximum 5 stars overall as of January 2019! During the quarter, we were invested in 135 events; 69 positions posted gains versus 66 with negative marks-to-market and 16 events were completed. Additionally, we entered 22 new positions and the fund was fully invested at quarter-end due to its broad investment mandate.
Many of the top performers and detractors for WCEIX included transactions invested in by The Merger Fund due to several attractive merger arbitrage opportunities; however, there were 28 non-merger arbitrage investments which added value during the quarter.
The largest contributor was Dell Technologies tracking stock, which gained as a result of Michael Dell increasing his offer to buy in the shares in order to merge them and their embedded holdings of VMware stock with the “parent company” (+0.49%). The largest detractor was Tenneco Inc. (-0.46%), which completed the acquisition of Federal-Mogul for a total consideration of $5.4 billion in October, and intends to separate the combined businesses into two independent, publicly traded companies through a tax-free spin-off to shareholders sometime in late 2019. Although we had some company-specific option hedges in place, we retained a partial delta to the underlying stock, and the position declined along with market and auto sector weakness.
SPACs (Special Purpose Acquisition Company) continue to provide attractive opportunities to deploy our cash balances in relatively low return but extremely low risk investments, which also offer potential upside optionality from the rights or warrants that accompany the purchase of IPO units.
Credit Event
The WCM Alternatives: Credit Event Fund was fully invested at quarter-end. The Institutional and Investor share classes lost 3.12% and 3.23% during the quarter, ending the year down 2.93% and 3.23% respectively. Seasonal factors and distortions stemming from the significant stock market correction and Federal Reserve policy confusion were the primary causes of the fund’s draw down. The good news is that we deployed a significant amount of capital in December and the fund bounced strongly in January, gaining 3.56%, recouping more than the negative marks-to-market from the fourth quarter.
There was no single biggest contributor to performance. SPAC investments generated a 30 basis points positive contribution. The largest single name detractor of performance was Colony Capital preferred stock that cost the fund 38 bps.
Thematically speaking, the biggest Q4 detractor was the group of closed end fund3 investments which as a whole lost 143 bps. We acquired a diversified basket of closed end funds that invest in leveraged loans. The investment thesis was that a) such corporate borrowings would perform well in a rising-rate environment due to the floating rate nature of the instruments; and b) what made them more attractive was that we could buy these loans at a discount of 7-12% through certain closed end funds. The discounts at which we purchased the closed end funds were abnormally wide by several standard deviations, exacerbated by year-end tax-related selling.
Unfortunately, throughout the second half of 2018, and especially in late November and December, the closed end funds declined in price because: a) discounts to net asset value (NAV) widened even more, to the mid-to-high teens, and b) the price of the loans themselves declined. The leveraged loan index as whole declined around 5 points as the fixed income market “dislocated” towards the end of the year.
Thus far, our belief that the dislocation was temporary has been partly vindicated. In January, the leveraged loan index recovered by several points. Additionally, closed end fund discounts to NAV have also narrowed back to the low teens and we have continued receiving dividend payments while awaiting such reversion. Overall, we remain constructive on our credit portfolio, and we believe we are positioned to generate an attractive risk-adjusted return by maintaining a short duration and low credit risk while retaining upside to certain opportunistic events and price reversions.
Outlook
We have yet to see signs of a downturn in transaction activity, and opportunities remain plentiful in the event space. We are monitoring many types of events such as product litigation, GSE (government sponsored entities such as Fannie Mae [FNMA] and Freddie Mac [FHLMC]) reform, and corporate restructurings such as spin-offs, subsidiary buy-ins, significant asset sales and late-stage bankruptcy emergences. Although there may be reason to be directionally nervous, due to political and regulatory uncertainty and possible early indicators of an economic
__________
3 | A closed end fund is a fund that is raises “permanent capital” within a fund structure (by managers such as Pimco, Nuveen, etc.) to invest using a particular strategy. Investors in a closed end fund, unlike in an open end fund, do not purchase or redeem shares directly from the fund. Instead, once a fixed amount of money has been raised, the shares trade in public markets similar to that of a normal individual stock. The end-of-day net asset value (NAV) of a typical mutual fund, called an “open end fund” will be the price that an investor transacts at. A key difference with a closed end fund, is that the price per share of a closed end fund may, and often does, trade at a discount or a premium to the NAV. Closed end funds have different investment strategies and may employ equities, preferred securities, leveraged loans or other fixed income securities, or a combination of the above. |
downturn, we try to insulate our investments from directional exposure and market or interest rate correlation. Our investments, both in merger arbitrage as well as the broader equity and credit event space, are primarily predicated opportunistically on the successful completion of announced catalysts rather than speculative valuation movements. Nonetheless, we believe the key drivers of many deals in 2018 –record access to investment capital, strong cash-rich and under-levered corporate balance, and persistently low borrowing costs along with ready access to financing – continue to provide significant support for transaction activity in the year ahead.
OUR COMPANY
WCM manages a total of six SEC-registered mutual funds. Our other vehicles span the spectrum from lower-return, lower-volatility expectations to additional volatility with potentially higher return expectations:
| Account | Vehicle | Strategy | Inception |
The Merger Fund® | SEC ‘40-Act Fund | Merger Arbitrage | 1989 |
| Investor Share | | | |
| Class (MERFX) | | | 1989 |
| Institutional Share | | | |
| Class (MERIX) | | | 2013 |
| The Merger | | | |
| Fund VL (MERVX) | Variable Insurance Trust | Merger Arbitrage | 2004 |
| WCM Alternatives: | | | |
| Credit Event | | | |
Fund New | SEC ‘40-Act Fund | Opportunistic Credit | 2017 |
| Investor Share | | | |
| Class (WCFRX) | | | 2017 |
| Institutional Share | | | |
| Class (WCFIX) | | | 2017 |
| WCM Alternatives: | | | |
| Event-Driven Fund | SEC ‘40-Act Fund | Event-Driven | 2014 |
| Investor Share | | | |
| Class (WCERX) | | | 2017 |
| Institutional Share | | | |
| Class (WCEIX) | | | 2014 |
| JNL/Westchester | | | |
| Capital Event | Sub-advised | | |
| Driven Fund | SEC ‘40-Act Fund | Event-Driven | 2015 |
| Westchester Merger | | | |
| Arbitrage Strategy | | | |
| of the JNL | | | |
| Multi-Manager | Sub-advised | | |
| Alternative Fund | SEC ‘40-Act Fund | Merger Arbitrage | 2016 |
As usual, quarterly statistical summaries for all of our vehicles are provided within two weeks of the end of the quarter- typically one month prior to the release of the quarterly letter. They are available electronically on our website, and we would be happy to provide a scheduled email as soon as the data becomes available. For convenience, investors can arrange for e-alerts of important Fund communications. Through our website at www.westchestercapitalfunds.com, you can check direct account balances, make purchases and sales, and sign up for notification of trade confirmations, statements, and shareholder communications via e-mail.
Please contact us with any questions or comments. We are always available and we enjoy speaking with our investors.
 |  |
| Roy Behren | Mike Shannon |
IMPORTANT DISCLOSURES
Before investing in The Merger Fund®, WCM Alternatives: Event-Driven Fund, and/or WCM Alternatives: Credit Event Fund, carefully consider the investment objectives, risks, charges, and expenses. For a prospectus or summary prospectus containing this and other information, please call (800) 343-8959. Please read the prospectus carefully before investing. The Merger Fund VL is available through variable products offered by third-party insurance companies. For a prospectus containing information for any variable annuity or variable life product that invests in The Merger Fund VL, contact your financial advisor or the offering insurance company for a contract prospectus and prospectus for the underlying funds. Please read it carefully before investing. Shares of JNL/Westchester Capital Event Driven Fund are offered to separate accounts of participating life insurance companies for the purpose of funding variable annuity contracts and variable life insurance policies. Shares of the fund are not offered directly to the public. For a prospectus containing information for any variable annuity or variable life product that invests in the Fund, contact your financial advisor or the offering insurance company for a contract prospectus and prospectus for the underlying funds. Please read it carefully before investing. Variable annuities are long-term, tax-deferred investments designed for retirement, involve investment risks and may lose value. Earnings are taxable as ordinary income when distributed and may be subject to a 10% federal tax penalty if withdrawn before age 59½. Optional benefit costs are added to the ongoing fees and expenses of the variable annuity.
Variable annuities (VA650, VA660) are issued by Jackson National Life Insurance Company® (Home Office: Lansing, Michigan) and in New York (VA650NY, VA660NY) by Jackson National Life Insurance Company of New York® (Home Office: Purchase, New York). Variable annuities are distributed by Jackson National Life Distributors LLC, member FINRA. May not be available in all states and state variations may apply. These products have limitations and restrictions, including withdrawal charges, recapture charges and excess interest adjustments (interest rate adjustments in New York) where applicable. Jackson® issues other annuities with similar features, benefits, limitations, and charges. Contact Jackson for more information. Jackson is the marketing name for Jackson National Life Insurance Company and Jackson National Life Insurance Company of New York.
Fund holdings and sector allocations are subject to change and should not be considered a recommendation to buy or sell any security. The Ten Largest Positions as a Percent of Net Assets for The Merger Fund® as of December 31, 2018 were: Altaba Inc. (10.39%), Twenty-First Century Fox, Inc. Cl. B (7.14%), Red Hat, Inc. (5.74%), Shire PLC (4.38%), ARRIS International plc (2.85%), Aspen Insurance Holdings Limited (2.56%), Dominion Energy Midstream Partners, LP (2.53%), Columbia Pipeline Group, Inc. (2.16%), Valero Energy Partners LP (1.99%), Esterline Technologies Corporation (1.98%). The Ten Largest Positions as a Percent of Net Assets for The Merger Fund VL as of December 31, 2018 were: Altaba Inc. (9.13%), Twenty-First Century Fox, Inc. Cl. B (6.91%), Red Hat, Inc. (5.42%), Randgold Resources Limited (4.14%), Shire PLC (3.92%), ARRIS International plc (2.64%), Aspen Insurance Holdings Limited (2.41%), Dominion Energy Midstream Partners, LP (2.38%), Valero Energy Partners LP (1.85%), Esterline Technologies Corporation (1.85%). The Ten Largest Positions as a Percent of Net Assets for WCM Alternatives: Event-Driven Fund as of December 31, 2018 were: Altaba Inc. (9.92%), Twenty-First Century Fox, Inc. Cl. B (8.66%), Red Hat, Inc. (5.93%), Shire PLC (5.10%), ARRIS International plc (3.14%), Aspen Insurance Holdings Limited (2.90%), Dominion Energy Midstream Partners, LP (2.81%), Nielsen Finance LLC (2.66%), Esterline Technologies Corporation (2.49%), United Technologies Corporation (2.15%). The Ten Largest Positions as a Percent of Net Assets for WCM Alternatives: Credit Event Fund as of December 31, 2018 were: CM Seven Star Acquisition Corp. (6.30%), Univar USA Inc. (6.08%), Spectrum Brands Holdings, Inc. (5.98%), Ardagh Packaging Finance PLC (5.96%), Momentive Performance (5.23%), Alberton Acquisition Corporation (5.18%), EIG INVESTORS CORP (5.17%), Nielsen Finance LLC (5.15%), DJO FIN LLC/DJO FIN CORP (4.97%), Tribune Media (4.96%).
Diversification does not assure a profit, nor does it protect against a loss in a declining market.
Mutual fund investing involves risk. Principal loss is possible. Merger-arbitrage and event-driven investing involve the risk that the adviser’s evaluation of the outcome of a proposed event, whether it be a merger, reorganization, regulatory issue or other events, will prove incorrect and that the Funds’ return on the investment will be negative. Investments in foreign companies may entail political, cultural, regulatory, legal, and tax risks different from those associated with comparable transactions in the United States. The frequency of the Fund’s transactions will vary from year to year, though merger arbitrage portfolios typically have higher turnover rates than portfolios of typical long-only funds. Increased portfolio turnover may result in higher brokerage commissions, dealer mark‐ups, and other transaction costs. The higher costs associated with increased portfolio turnover may offset gains in the Fund’s performance. The Funds’ may enter into short sale transactions for, among other reasons, purposes of protecting against a decline in the market value of the acquiring company’s shares prior to the acquisition completion. If the price of a security sold short increases between the time of the short sale and the time the Fund covers its short position, the Fund will incur a loss. The amount of a potential loss on an uncovered short sale transaction is theoretically unlimited. Debt securities may fluctuate in value due to, among other things, changes in interest rates, general economic conditions, industry fundamentals, market sentiment and the financial condition of the issuer, including the issuer’s credit rating or financial performance. Derivatives may create leverage which will amplify the effect of the performance of those instruments on the Funds’ and may produce significant losses. The Funds’ hedging strategy will be subject to the Funds’ investment adviser’s ability to assess correctly the degree of correlation between the performance of the instruments used in the hedging strategy and the performance of the investments in the portfolio being hedged. Investments in lower rated and non-rated securities present a great risk of loss to principal and interest than higher-rated securities. The WCM Alternatives: Credit Event Fund is non-diversified and therefore has a greater potential to realize losses upon the occurrence of adverse events affecting an issuer in its portfolio.
Any tax or legal information provided is merely a summary of our understanding and interpretation of some of the current income tax regulations and is not exhaustive. Investors must consult their tax advisor or legal counsel for advice and information concerning their particular situation. Neither the Funds’ nor any of their representatives may give legal or tax advice.
The views expressed are as of January 31, 2019 and are a general guide to the views of Westchester Capital Management, are subject to change, are not guaranteed and should not be considered recommendations to buy or sell any security. Distributions are not guaranteed. This document does not replace portfolio and fund-specific materials.
The Morningstar Rating™ for funds, or “star rating”, is calculated for managed products (including mutual funds, variable annuity, and variable life subaccounts, exchange-traded funds, closed-end funds, and separate accounts) with at least a three-year history. Exchange-traded funds and open-ended mutual funds are considered a single population for comparative purposes. It is calculated based on a Morningstar Risk-Adjusted Return measure that accounts for variation in a managed product’s monthly excess performance, placing more emphasis on downward variations and rewarding consistent performance. The top 10% of products in each product category receive 5 stars, the next 22.5% receive 4 stars, and the next 35% receive 3 stars, the next 22.5% receive 2 stars, and the bottom 10% receives 1 star. The Overall Morningstar Rating™ for a managed product is derived from a weighted average of the performance figures associated with its three-, five-, and 10-year (if applicable) Morningstar Rating™ metrics.
The weights are 100% three-year rating for 36-59 months of total returns, 60% five-year rating/40% three-year rating for 60-119 months of total returns and 50% 10-year rating/30%
five-year rating/20% three-year rating for 120 or more months of total returns. While the 10-year overall star rating formula seems to give the most weight to the 10-year period, the most recent three-year period actually has the greatest impact because it is included in all three rating periods. As of December 31, 2018, The Merger Fund® was rated against the following numbers of U.S.-domiciled Market Neutral funds over the following time periods: 122 funds in the last three years, 98 funds in the last five years, and 31 funds in the last ten years. With respect to these Market Neutral funds, The Merger Fund® – Investor share class (MERFX) received a Morningstar Rating of 4 stars, 4 stars and 4 stars for the three-, five- and ten-year periods, respectively. The Merger Fund® – Institutional share class (MERIX) received a Morningstar rating of 5 stars, 4 stars and 4 stars for the three-, five- and ten-year periods, respectively. Ten-year ratings are Extended Performance Ratings computed by Morningstar using historical adjusted returns prior to the 8/1/2013 inception date of MERIX and reflect the historical performance of MERFX, (inception date 1/31/1989), adjusted to reflect the fees and expenses of the Institutional shares. As of December 31, 2018, WCM Alternatives: Event-Driven Fund was rated against the following numbers of U.S.-domiciled Multi Alternative funds over the following time periods: 290 funds in the last three years. With respect to these Multi Alternative funds, WCM Alternatives: Event-Driven Fund – Institutional share class (WCEIX) received a Morningstar Rating of 4 stars for the three-year period. WCM Alternatives: Event-Driven Fund – Investor share class (WCERX) received a Morningstar Rating of 4 stars for the three-year period. As of January 31, 2019, WCM Alternatives: Event-Driven Fund was rated against the following numbers of U.S.-domiciled Multi Alternative funds over the following time periods: 278 funds in the last three years and 177 funds in the last five years. With respect to these Multi Alternative funds, WCM Alternatives: Event-Driven Fund – Institutional share class (WCEIX) received a Morningstar Rating of 4 stars for the three-year period and 5 stars for the five-year period. 3-year and 5-year ratings are Extended Performance Ratings computed by Morningstar using historical adjusted returns prior to the 3/22/2017 inception date of WCERX and reflect the historical performance of WCEIX, (inception date 1/2/2014), adjusted to reflect the fees and expenses of the Investor shares. © 2018 Morningstar, Inc. All Rights Reserved. The information contained herein: (1) is proprietary to Morningstar; (2) may not be copied or distributed; and (3) is not warranted to be accurate, complete or timely. Neither Morningstar nor its content providers are responsible for any damages or losses arising from any use of this information. Past performance is no guarantee of future results.
Absolute return strategies are not intended to outperform stocks and bonds during strong market rallies. An absolute return fund may not achieve its goals and may underperform during periods of strong positive market performance.
Definitions: The S&P 500 Index is a broad based unmanaged index of 500 stocks, which is widely recognized as representative of the equity market in general; The Bloomberg Barclays Aggregate Bond Index is an intermediate-term index comprised of investment grade bonds. The Bloomberg Barclays US Corporate High Yield Bond Index measures the USD-denominated, high yield, fixed-rate corporate bond market. Securities are classified as high yield if the middle rating of Moody’s, Fitch and S&P are Ba1/BB+/BB+ or below. The Morningstar Category: US Fund Market Neutral is comprised of a universe of funds with similar investment objectives. The Morningstar Category: The US Fund MultiAlternative encompasses funds that have a majority of their assets exposed to alternative strategies and include both funds with static allocations to alternative strategies and funds tactically allocating among alternative strategies and asset classes. The ICE BofA Merrill Lynch US 3-Month Treasury Bill Index is comprised of a single issue purchased at the beginning of the month and held for a full month. Indices are unavailable for direct investment. The Dow Jones Industrial Average, or simply the Dow, is a stock market index that shows how 30 large, publicly owned companies based in the United States have traded during a standard trading session in the stock market. Nasdaq is a global electronic marketplace for buying and selling securities, as well as the benchmark index for U.S. technology stocks. Indices are unavailable for direct investment. The Wilshire Liquid Alternative Event Driven IndexSM measures the performance of the event-driven strategy component of The Wilshire
Liquid Alternative IndexSM. Event-driven strategies predominantly invest in companies involved in corporate transactions such as mergers, restructuring, distressed, buy-backs, or other capital structure changes. The Wilshire Liquid Alternative Event Driven Index (WLIQAED) is designed to provide a broad measure of the liquid alternative event-driven market. HFRX Event Driven Index is comprised of investment Managers who maintain positions in companies currently or prospectively involved in corporate transactions of a wide variety including but not limited to mergers, restructurings, financial distress, tender offers, shareholder buybacks, debt exchanges, security issuance or other capital structure adjustments. DOJ or The United States Department of Justice Antitrust Division is a law enforcement agency responsible for enforcing the antitrust laws of the United States. Standard Deviation is the degree to which returns vary relative to the average return: The higher the standard deviation, the greater the variability of the investment. Beta is a measure of the fund’s sensitivity to market movements. A portfolio with a beta greater than 1 is more volatile than the market and a portfolio with a beta less than 1 is less volatile than the market; Correlation is calculated using R-Squared; which is a measure that represents the percentage of a fund’s movements that can be explained by movements in a benchmark index. A fund with low R-squared doesn’t act much like the index; A special purpose acquisition company (SPAC) is a corporation formed by private individuals to facilitate investment through an initial public offering (IPO). The proceeds are used to buy one or more existing companies. A put option is an option contract giving the owner the right, but not the obligation, to sell a specified amount of an underlying security at a specified price within a specified time frame. This is the opposite of a call option, which gives the holder the right to buy an underlying security at a specified price before the option expires. The returns shown are based on net asset values calculated for shareholder transactions and may differ from the returns shown in the financial highlights of the annual report, which reflects adjustments made to the net asset values in accordance with accounting principles generally accepted in the United States of America.
The Merger Fund®, WCM Alternatives: Event-Driven Fund and WCM Alternatives: Credit Event Fund are distributed by Compass Distributors, LLC. The Merger VL is available through variable products offered by third-party insurance companies and is not affiliated with Compass Distributors, LLC.
DEAL COMPOSITION
The Merger Fund VL (Unaudited)
| Type of Buyer | | | | Deal Terms* | | |
| Strategic | 95.7% | | | Cash | 52.5% | |
| Financial | 4.3% | | | Stock and Stub(1) | 23.6% | |
| | | | | Stock with Fixed Exchange Ratio | 14.8% | |
| By Deal Type | | | | Cash & Stock | 9.1% | |
| Friendly | 100.0% | | | Stock with Flexible | | |
| Hostile | —% | | | Exchange Ratio (Collar) | —% | ** |
| | | | | Undetermined(2) | —% | |
| * | | Data expressed as a percentage of long common stock, corporate bonds and swap contract positions as of December 31, 2018. |
| ** | | Less than 0.05%. |
(1) | | “Stub” includes assets other than cash and stock (e.g., escrow notes). |
(2) | | The compensation is undetermined because the compensation to be received (e.g., stock, cash, escrow notes, other) will be determined at a later date, potentially at the option of the Fund’s investment adviser. |
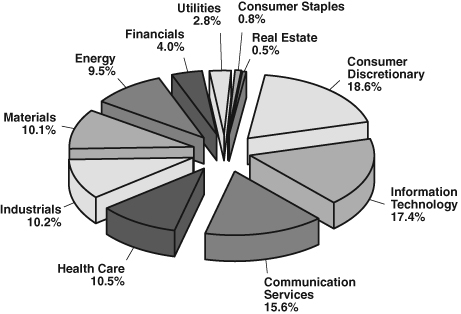
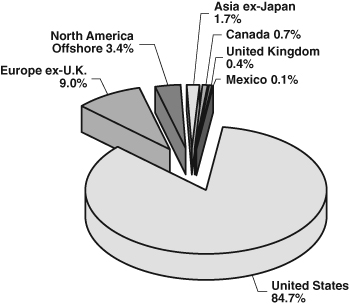
PORTFOLIO COMPOSITION*
The Merger Fund VL (Unaudited)
By Sector
By Region
| * | Data expressed as a percentage of long common stock, closed-end funds, preferred stocks, contingent value rights, rights, warrants, bank loans, corporate bonds and swap contract positions as of December 31, 2018. Data expressed excludes special purpose acquisition companies, short-term investments, short investments, written options, forward currency exchange contracts and short total return swap contracts. Please refer to the Schedule of Investments for more details on the Fund’s individual holdings. |
The Global Industry Classification Standard (GICS®) was developed by and/or is the exclusive property of MSCI, Inc. and Standard & Poor’s Financial Services LLC (“S&P”). GICS is a service mark of MSCI and S&P and has been licensed for use by U.S. Bancorp Fund Services, LLC, doing business as U.S. Bank Global Fund Services (”Fund Services”).
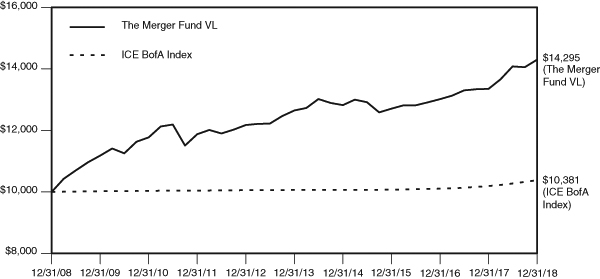
COMPARISON OF CHANGE IN VALUE OF $10,000 INVESTMENT
IN THE MERGER FUND VL AND THE ICE BofA MERRILL LYNCH
3-MONTH U.S. TREASURY BILL INDEX (Unaudited)
THE MERGER FUND VL
AVERAGE ANNUAL TOTAL RETURN
as of December 31, 2018
| | 1 Year | 3 Year | 5 Year | 10 Year |
| The Merger Fund VL | 7.09% | 4.01% | 2.48% | 3.64% |
| ICE BofA Index | 1.87% | 1.02% | 0.63% | 0.37% |
This chart assumes an initial gross investment of $10,000 made on December 31, 2008. Returns shown include the reinvestment of all dividends. Past performance is not predictive of future performance. The graph and table do not reflect the deduction of taxes that a shareholder would pay on fund distributions or upon redemption of fund shares. Investment return and principal value will fluctuate, so that your shares, when redeemed, may be worth more or less than the original cost.
The ICE BofA Merrill Lynch 3-Month U.S. Treasury Bill Index (“ICE BofA Index”) is comprised of a single issue purchased at the beginning of the month and held for a full month. At the end of the month that issue is sold and rolled into a newly selected issue. The issue selected at each month-end rebalancing is the outstanding U.S. Treasury Bill that matures closest to, but not beyond, three months from the rebalancing date. To qualify for selection, an issue must have settled on or before the month-end rebalancing date. The index is unmanaged and does not include any expenses, fees or sales charges. It is not possible to invest directly in an index.
The Merger Fund VL
EXPENSE EXAMPLE
December 31, 2018 (Unaudited)
As a shareholder of The Merger Fund VL (the “Fund”), you incur two types of costs: (1) transaction costs and (2) ongoing costs, including management fees, and other Fund specific expenses. The expense example is intended to help a shareholder understand ongoing costs (in dollars) of investing in the Fund and to compare these costs with the ongoing costs of investing in other mutual funds. The example is based on an investment of $1,000 invested at the beginning of the period and held for the most recent six-month period.
The Actual Expenses comparison provides information about actual account values and actual expenses. A shareholder may use the information in this line, together with the amount invested, to estimate the expenses paid over the period. A shareholder may divide his/her account value by $1,000 (e.g., an $8,600 account value divided by $1,000 = 8.6), then multiply the result by the number in the first line under the heading entitled “Expenses Paid During Period” to estimate the expenses paid on his/her account during this period. The example below includes, among other fees, management fees, fund accounting, custody and transfer agent fees. However, the example does not include portfolio trading commissions and related expenses or extraordinary expenses. In addition, charges and expenses at the insurance company separate account level are not reflected.
The Hypothetical Example for Comparison Purposes provides information about hypothetical account values and hypothetical expenses based on the Fund’s actual expense ratio and an assumed rate of return of 5% per year before expenses, which is not the Fund’s actual return. The hypothetical account values and expenses may not be used to estimate the actual ending account balance or expenses paid for the period. A shareholder may use this information to compare the ongoing costs of investing in the Fund and other funds. To do so, a shareholder would compare this 5% hypothetical example with the 5% hypothetical examples that appear in the shareholder reports of other funds.
The expenses shown in the table are meant to highlight your ongoing costs only and do not reflect any transactional costs, such as sales charges (loads), redemptions fees, or exchange fees. Therefore, the Hypothetical Example for Comparison Purposes is useful in comparing ongoing costs only, and will not help to determine the relevant total costs of owning different funds. In addition, if these transactional costs were included, shareholder costs would have been higher.
The Merger Fund VL
EXPENSE EXAMPLE (continued)
December 31, 2018 (Unaudited)
| | Annualized | Beginning | Ending | Expenses Paid |
| | Net Expense | Account | Account | During Period |
| | Ratio | Value | Value | 7/1/18 — |
| | 12/31/18 | 7/1/18 | 12/31/18 | 12/31/18(1) |
Actual Expenses(2)(3) | 1.79% | $1,000.00 | $1,015.50 | $9.09 |
| Hypothetical Example | | | | |
| for Comparison Purposes | | | | |
| (5% return before | | | | |
expenses)(3) | 1.79% | $1,000.00 | $1,016.18 | $9.10 |
| (1) | Expenses are equal to the Fund’s annualized net expense ratio, multiplied by the average account value over the period, multiplied by 184/365 to reflect the one-half year period. |
| (2) | Based on the actual returns of 1.55% for the six-month period ended December 31, 2018. |
| (3) | Excluding dividends on short positions and borrowing expenses on securities sold short, your actual cost of investment in and your hypothetical cost of investment in the Fund would have been $7.11 and $7.12, respectively. |
The Merger Fund VL
SCHEDULE OF INVESTMENTS
December 31, 2018
| | | Shares | | | Value | |
| LONG INVESTMENTS — 98.32% | | | | | | |
| COMMON STOCKS — 42.64% | | | | | | |
| AEROSPACE & DEFENSE — 2.72% | | | | | | |
| Esterline Technologies Corporation (a) | | | 6,338 | | | $ | 769,750 | |
| L3 Technologies, Inc. | | | 2,098 | | | | 364,339 | |
| | | | | | | | 1,134,089 | |
| APPLICATION SOFTWARE — 0.10% | | | | | | | | |
| SendGrid, Inc. (a) | | | 980 | | | | 42,307 | |
| BIOTECHNOLOGY — 0.77% | | | | | | | | |
| Shire plc — ADR | | | 1,848 | | | | 321,626 | |
| BROADCASTING — 0.16% | | | | | | | | |
| Discovery Communications, Inc. Class C (a) | | | 2,937 | | | | 67,786 | |
| BUILDING PRODUCTS — 1.38% | | | | | | | | |
| USG Corporation | | | 13,461 | | | | 574,246 | |
| COMMUNICATIONS EQUIPMENT — 2.64% | | | | | | | | |
| ARRIS International plc (a)(b) | | | 35,976 | | | | 1,099,786 | |
| COPPER — 0.16% | | | | | | | | |
| Nevsun Resources Ltd. (b)(f) | | | 15,344 | | | | 67,324 | |
| DATA PROCESSING & | | | | | | | | |
| OUTSOURCED SERVICES — 0.15% | | | | | | | | |
| Travelport Worldwide Ltd. (b) | | | 3,988 | | | | 62,293 | |
| DIVERSIFIED CHEMICALS — 1.00% | | | | | | | | |
| DowDuPont, Inc. (e)(k) | | | 7,800 | | | | 417,144 | |
| ELECTRONIC EQUIPMENT | | | | | | | | |
| & INSTRUMENTS — 1.06% | | | | | | | | |
| Orbotech Ltd. (a)(b) | | | 7,796 | | | | 440,786 | |
| GOLD — 4.14% | | | | | | | | |
| Randgold Resources Ltd. — ADR (f) | | | 20,136 | | | | 1,724,510 | |
| HEALTH CARE EQUIPMENT | | | | | | | | |
| & SUPPLIES — 1.70% | | | | | | | | |
| NxStage Medical, Inc. (a) | | | 24,717 | | | | 707,401 | |
| HEALTH CARE TECHNOLOGY — 0.48% | | | | | | | | |
| athenahealth, Inc. (a) | | | 1,528 | | | | 201,589 | |
| INTEGRATED TELECOMMUNICATION | | | | | | | | |
| SERVICES — 0.48% | | | | | | | | |
| AT&T, Inc. (e)(k) | | | 7,062 | | | | 201,549 | |
The accompanying notes are an integral part of these financial statements.
The Merger Fund VL
SCHEDULE OF INVESTMENTS (continued)
December 31, 2018
| | | Shares | | | Value | |
| LIFE & HEALTH INSURANCE — 0.05% | | | | | | |
| Genworth Financial, Inc. Class A (a) | | | 4,159 | | | $ | 19,381 | |
| MOVIES & ENTERTAINMENT — 8.35% | | | | | | | | |
| Pandora Media, Inc. (a) | | | 68,946 | | | | 557,773 | |
| Twenty-First Century Fox, Inc. Class A | | | 902 | | | | 43,404 | |
| Twenty-First Century Fox, Inc. Class B (e) | | | 60,237 | | | | 2,878,124 | |
| | | | | | | | 3,479,301 | |
| MULTI-UTILITIES — 1.20% | | | | | | | | |
| SCANA Corporation | | | 10,415 | | | | 497,629 | |
| OIL & GAS EXPLORATION | | | | | | | | |
| & PRODUCTION — 0.69% | | | | | | | | |
| Encana Corporation (b) | | | 23,327 | | | | 134,830 | |
| Newfield Exploration Company (a) | | | 10,318 | | | | 151,262 | |
| | | | | | | | 286,092 | |
| OIL & GAS REFINING & MARKETING — 0.03% | | | | | | | | |
| EnLink Midstream Partners LP | | | 987 | | | | 10,867 | |
| OIL & GAS STORAGE | | | | | | | | |
| & TRANSPORTATION — 5.30% | | | | | | | | |
| Columbia Pipeline Group, Inc. (a)(d)(g)(i) | | | 16,892 | | | | 443,558 | |
| Dominion Energy Midstream Partners LP | | | 54,930 | | | | 990,937 | |
| Valero Energy Partners LP | | | 18,301 | | | | 771,753 | |
| | | | | | | | 2,206,248 | |
| PROPERTY & CASUALTY INSURANCE — 2.41% | | | | | | | | |
| Aspen Insurance Holdings Ltd. (b) | | | 23,923 | | | | 1,004,527 | |
| REITs — 0.33% | | | | | | | | |
| Brookfield Property REIT, Inc. Class A | | | 8,413 | | | | 135,449 | |
| RESEARCH & CONSULTING SERVICES — 1.21% | | | | | | | | |
| The Dun & Bradstreet Corporation | | | 3,525 | | | | 503,158 | |
| SYSTEMS SOFTWARE — 5.42% | | | | | | | | |
| Red Hat, Inc. (a)(e) | | | 12,855 | | | | 2,257,852 | |
| TECHNOLOGY HARDWARE, | | | | | | | | |
| STORAGE & PERIPHERALS — 0.71% | | | | | | | | |
| Dell Technologies, Inc. Class C (a) | | | 6,019 | | | | 294,134 | |
| TOTAL COMMON STOCKS (Cost $17,710,560) | | | | | | | 17,757,074 | |
The accompanying notes are an integral part of these financial statements.
The Merger Fund VL
SCHEDULE OF INVESTMENTS (continued)
December 31, 2018
| | | Shares | | | Value | |
| SPECIAL PURPOSE | | | | | | |
| ACQUISITION COMPANIES — 7.44% (a) | | | | | | |
| Black Ridge Acquisition Corporation | | | 3,305 | | | $ | 33,182 | |
| CF Finance Acquisition Corporation | | | 5,187 | | | | 51,870 | |
| ChaSerg Technology Acquisition Corporation | | | 5,904 | | | | 58,981 | |
| Collier Creek Holdings Class A (b)(f) | | | 11,400 | | | | 114,456 | |
| Constellation Alpha Capital Corporation (b) | | | 34,369 | | | | 350,907 | |
| Federal Street Acquisition Corporation Class A | | | 5,016 | | | | 51,314 | |
| Forum Merger II Corporation Class A | | | 3,446 | | | | 33,254 | |
| Gordon Pointe Acquisition Corporation (f) | | | 17,028 | | | | 170,706 | |
| Graf Industrial Corporation (f) | | | 51,254 | | | | 513,053 | |
| Legacy Acquisition Corporation Class A | | | 949 | | | | 9,319 | |
| Leisure Acquisition Corporation | | | 6,820 | | | | 66,972 | |
| Megalith Financial Acquisition | | | | | | | | |
| Corporation Class A | | | 3,536 | | | | 34,299 | |
| Modern Media Acquisition Corporation | | | 18,790 | | | | 191,658 | |
| Mudrick Capital Acquisition | | | | | | | | |
| Corporation Class A (f) | | | 5,919 | | | | 58,480 | |
| Opes Acquisition Corporation | | | 4,080 | | | | 40,514 | |
| Pensare Acquisition Corporation | | | 11,440 | | | | 115,887 | |
| Pure Acquisition Corporation | | | 9,128 | | | | 89,820 | |
| Thunder Bridge Acquisition Ltd. (b)(f) | | | 10,600 | | | | 107,908 | |
| Thunder Bridge Acquisition Ltd. Class A (b) | | | 45,274 | | | | 448,213 | |
| Tiberius Acquisition Corporation | | | 4,193 | | | | 41,091 | |
| TKK Symphony Acquisition Corporation (b) | | | 5,669 | | | | 54,706 | |
| Trident Acquisitions Corporation | | | 13,674 | | | | 136,330 | |
| Trinity Merger Corporation Class A | | | 3,140 | | | | 31,369 | |
| Twelve Seas Investment Company (b) | | | 7,333 | | | | 72,010 | |
| VectoIQ Acquisition Corporation | | | 22,805 | | | | 221,208 | |
| TOTAL SPECIAL PURPOSE | | | | | | | | |
| ACQUISITION COMPANIES (Cost $3,046,201) | | | | | | | 3,097,507 | |
| | | | | | | | | |
| CLOSED-END FUNDS — 9.13% (a)(e) | | | | | | | | |
| Altaba, Inc. | | | 65,636 | | | | 3,802,950 | |
| TOTAL CLOSED-END FUNDS (Cost $4,235,383) | | | | | | | 3,802,950 | |
| | | | | | | | | |
| PREFERRED STOCKS — 0.17% | | | | | | | | |
| Colony Capital, Inc., 8.750%, Series E | | | 284 | | | | 6,572 | |
| NuStar Logistics LP, 9.170% | | | | | | | | |
| (3 Month LIBOR + 6.734%), 1/15/2043 (e)(j) | | | 2,732 | | | | 65,131 | |
| TOTAL PREFERRED STOCKS (Cost $76,013) | | | | | | | 71,703 | |
The accompanying notes are an integral part of these financial statements.
The Merger Fund VL
SCHEDULE OF INVESTMENTS (continued)
December 31, 2018
| | | Shares | | | Value | |
| CONTINGENT VALUE RIGHTS — 0.00% (a)(e)(g) | | | | | | |
| Media General, Inc. | | | 8,397 | | | $ | 252 | |
| TOTAL CONTINGENT VALUE RIGHTS (Cost $0) | | | | | | | 252 | |
| | | | | | | | | |
| RIGHTS — 0.01% (a) | | | | | | | | |
| Black Ridge Acquisition Corporation | | | 3,305 | | | | 991 | |
| Modern Media Acquisition Corporation | | | 5,284 | | | | 1,321 | |
| Pensare Acquisition Corporation | | | 7,938 | | | | 2,302 | |
| TOTAL RIGHTS (Cost $6,600) | | | | | | | 4,614 | |
| | | | | | | | | |
| WARRANTS — 0.03% (a) | | | | | | | | |
| Black Ridge Acquisition Corporation | | | 3,305 | | | | 1,058 | |
| ConvergeOne Holdings, Inc. (f) | | | 1,547 | | | | 1,524 | |
| Federal Street Acquisition | | | | | | | | |
| Corporation Class A (f) | | | 724 | | | | 543 | |
| Modern Media Acquisition Corporation | | | 2,642 | | | | 711 | |
| Mudrick Capital Acquisition | | | | | | | | |
| Corporation Class A | | | 5,919 | | | | 2,663 | |
| Pensare Acquisition Corporation | | | 3,969 | | | | 794 | |
| Pure Acquisition Corporation | | | 4,543 | | | | 5,179 | |
| Tiberius Acquisition Corporation | | | 4,193 | | | | 1,635 | |
| TOTAL WARRANTS (Cost $17,096) | | | | | | | 14,107 | |
| | | | | | | | | |
| | | Principal | | | | | |
| | | Amount | | | | | |
| BANK LOANS — 1.67% (f)(j) | | | | | | | | |
| Tribune Media Company | | | | | | | | |
| 5.520% (1 Month | | | | | | | | |
| LIBOR + 3.000%), 1/27/2024 | | $ | 393,000 | | | | 388,087 | |
| Zayo Group LLC | | | | | | | | |
| 4.477% (1 Month | | | | | | | | |
| LIBOR + 2.000%), 1/19/2021 | | | 313,721 | | | | 305,878 | |
| TOTAL BANK LOANS (Cost $703,659) | | | | | | | 693,965 | |
| | | | | | | | | |
| CORPORATE BONDS — 6.88% (f) | | | | | | | | |
| Ardagh Packaging Finance plc / | | | | | | | | |
| Ardagh Holdings USA, Inc. | | | | | | | | |
| 7.250%, 5/15/2024 (b)(h) | | | 338,000 | | | | 338,422 | |
| DJO Finance LLC / DJO Finance Corporation | | | | | | | | |
| 8.125%, 6/15/2021 (h) | | | 290,000 | | | | 299,425 | |
The accompanying notes are an integral part of these financial statements.
The Merger Fund VL
SCHEDULE OF INVESTMENTS (continued)
December 31, 2018
| | | Principal | | | | | | |
| | | Amount | | | | | Value | |
| Vistra Energy Corporation | | | | | | | | |
| 5.875%, 6/1/2023 | | $ | 198,000 | | | | | $ | 198,990 | |
| EIG Investors Corporation | | | | | | | | | | |
| 10.875%, 2/1/2024 | | | 225,000 | | | | | | 241,875 | |
| Momentive Performance Materials, Inc. | | | | | | | | | | |
| 3.880%, 10/24/2021 | | | 189,000 | | | | | | 201,049 | |
| Nationstar Mortgage LLC / | | | | | | | | | | |
| Nationstar Capital Corporation | | | | | | | | | | |
| 6.500%, 7/1/2021 | | | 40,000 | | | | | | 39,100 | |
| 6.500%, 6/1/2022 | | | 27,000 | | | | | | 26,511 | |
| Nielsen Finance LLC / | | | | | | | | | | |
| Nielsen Finance Company | | | | | | | | | | |
| 5.000%, 4/15/2022 (h) | | | 163,000 | | | | | | 156,480 | |
| Rent-A-Center, Inc. | | | | | | | | | | |
| 6.625%, 11/15/2020 | | | 119,000 | | | | | | 116,025 | |
| 4.750%, 5/1/2021 (e) | | | 200,000 | | | | | | 192,000 | |
| Spectrum Brands Holdings, Inc. | | | | | | | | | | |
| 7.750%, 1/15/2022 | | | 228,000 | | | | | | 231,420 | |
| T-Mobile USA, Inc. | | | | | | | | | | |
| 6.500%, 1/15/2024 | | | 145,000 | | | | | | 149,376 | |
| Unitymedia GmbH | | | | | | | | | | |
| 6.125%, 1/15/2025 (b)(h) | | | 231,000 | | | | | | 233,287 | |
| Unitymedia Hessen GmbH & Company | | | | | | | | | | |
| KG / Unitymedia NRW GmbH | | | | | | | | | | |
| 5.000%, 1/15/2025 (b)(h) | | | 113,000 | | | | | | 110,966 | |
| Univar USA, Inc. | | | | | | | | | | |
| 6.750%, 7/15/2023 (h) | | | 333,000 | | | | | | 330,086 | |
| TOTAL CORPORATE BONDS (Cost $2,928,460) | | | | | | | | | 2,865,012 | |
| | | | | | | | | | | |
| | | Contracts | | | | | | | |
| | | (100 shares | | | Notional | | | | |
| | | per contract) | | | Amount | | | | |
| PURCHASED PUT OPTIONS — 0.42% (a) | | | | | | | | | | |
| DowDuPont, Inc. | | | | | | | | | | |
| Expiration: January 2019, | | | | | | | | | | |
| Exercise Price: $55.00 | | | 4 | | $ | 21,392 | | | 972 | |
| Expiration: February 2019, | | | | | | | | | | |
| Exercise Price: $45.00 | | | 74 | | | 395,752 | | | 3,589 | |
| First Trust Natural Gas ETF Trust | | | | | | | | | | |
| Expiration: March 2019, | | | | | | | | | | |
| Exercise Price: $22.00 | | | 54 | | | 79,380 | | | 39,960 | |
The accompanying notes are an integral part of these financial statements.
The Merger Fund VL
SCHEDULE OF INVESTMENTS (continued)
December 31, 2018
| | | Contracts | | | | | | | |
| | | (100 shares | | | Notional | | | | |
| | | per contract) | | | Amount | | | Value | |
| SPDR S&P 500 ETF Trust | | | | | | | | | |
| Expiration: January 2019, | | | | | | | | | |
| Exercise Price: $247.00 | | | 31 | | | $ | 774,752 | | | $ | 12,400 | |
| Expiration: January 2019, | | | | | | | | | | | | |
| Exercise Price: $255.00 | | | 12 | | | | 299,904 | | | | 9,156 | |
| SPDR S&P Oil & Gas Exploration | | | | | | | | | | | | |
| & Production ETF Trust | | | | | | | | | | | | |
| Expiration: February 2019, | | | | | | | | | | | | |
| Exercise Price: $32.00 | | | 83 | | | | 220,199 | | | | 46,480 | |
| Technology Select Sector SPDR Fund | | | | | | | | | | | | |
| Expiration: January 2019, | | | | | | | | | | | | |
| Exercise Price: $70.00 | | | 45 | | | | 278,910 | | | | 36,090 | |
| Expiration: January 2019, | | | | | | | | | | | | |
| Exercise Price: $71.00 | | | 29 | | | | 179,742 | | | | 26,158 | |
| The Walt Disney Company | | | | | | | | | | | | |
| Expiration: January 2019, | | | | | | | | | | | | |
| Exercise Price: $95.00 | | | 83 | | | | 910,095 | | | | 1,328 | |
| TOTAL PURCHASED OPTIONS (Cost $151,974) | | | | | | | | | | | 176,133 | |
| | | | | | | | | | | | | |
| | | Principal | | | | | | | | | |
| | | Amount | | | | | | | | | |
| ESCROW NOTES — 0.03% (a)(d)(g) | | | | | | | | | | | | |
| AMR Corporation | | $ | 7,668 | | | | | | | | 11,885 | |
| T-Mobile USA, Inc. | | | 108,000 | | | | | | | | — | |
| TOTAL ESCROW NOTES (Cost $4,196) | | | | | | | | | | | 11,885 | |
| | | | | | | | | | | | | |
| | | Shares | | | | | | | | | |
| SHORT-TERM INVESTMENTS — 29.90% | | | | | | | | | | | | |
| MONEY MARKET FUNDS — 29.04% (c) | | | | | | | | | | | | |
| First American Government Obligations Fund, | | | | | | | | | | | | |
| Institutional Share Class, 2.32% | | | 1,931,000 | | | | | | | | 1,931,000 | |
| Goldman Sachs Financial Square | | | | | | | | | | | | |
| Funds — Government Fund, | | | | | | | | | | | | |
| Institutional Share Class, 2.34% | | | 1,931,000 | | | | | | | | 1,931,000 | |
| The Government & Agency Portfolio, | | | | | | | | | | | | |
| Institutional Share Class, 2.30% | | | 1,931,000 | | | | | | | | 1,931,000 | |
| JPMorgan Prime Money Market Fund, | | | | | | | | | | | | |
| Institutional Share Class, 2.53% (e) | | | 507,672 | | | | | | | | 507,720 | |
| JPMorgan U.S. Government Money Market | | | | | | | | | | | | |
| Fund, Institutional Share Class, 2.33% (e) | | | 1,931,000 | | | | | | | | 1,931,000 | |
The accompanying notes are an integral part of these financial statements.
The Merger Fund VL
SCHEDULE OF INVESTMENTS (continued)
December 31, 2018
| | | Shares | | | Value | |
| Morgan Stanley Institutional Liquidity | | | | | | |
| Fund — Government Portfolio, | | | | | | |
| Institutional Share Class, 2.32% | | | 1,931,000 | | | $ | 1,931,000 | |
| Morgan Stanley Institutional Liquidity | | | | | | | | |
| Fund — Treasury Portfolio, | | | | | | | | |
| Institutional Share Class, 2.33% | | | 1,931,000 | | | | 1,931,000 | |
| | | | | | | | 12,093,720 | |
| | | | | | | | | |
| | | Principal | | | | | |
| | | Amount | | | | | |
| U.S. TREASURY BILLS — 0.86% (e)(f) | | | | | | | | |
| United States Treasury Bills | | | | | | | | |
| 2.19%, 2/28/2019 | | $ | 58,000 | | | | 57,778 | |
| 2.38%, 4/25/2019 | | | 305,000 | | | | 302,651 | |
| | | | | | | | 360,429 | |
| TOTAL SHORT-TERM INVESTMENTS | | | | | | | | |
| (Cost $12,454,243) | | | | | | | 12,454,149 | |
| TOTAL LONG INVESTMENTS | | | | | | | | |
| (Cost $41,334,385) — 98.32% | | | | | | | 40,949,351 | |
| | | | | | | | | |
| | | Shares | | | | | |
| SHORT INVESTMENTS — (19.65)% | | | | | | | | |
| COMMON STOCKS — (18.95)% | | | | | | | | |
| AEROSPACE & DEFENSE — (0.88)% | | | | | | | | |
| Harris Corporation | | | (2,728 | ) | | | (367,325 | ) |
| AIRLINES — (0.03)% | | | | | | | | |
| American Airlines Group, Inc. | | | (402 | ) | | | (12,908 | ) |
| BROADCASTING — (0.17)% | | | | | | | | |
| Discovery Communications, Inc. Class A | | | (2,937 | ) | | | (72,661 | ) |
| CABLE & SATELLITE — (1.36)% | | | | | | | | |
| Sirius XM Holdings, Inc. | | | (98,861 | ) | | | (564,496 | ) |
| GOLD — (4.01)% | | | | | | | | |
| Barrick Gold Corporation (b) | | | (123,393 | ) | | | (1,670,741 | ) |
| INTERNET & DIRECT | | | | | | | | |
| MARKETING RETAIL — (7.56)% | | | | | | | | |
| Alibaba Group Holding Ltd. — ADR | | | (22,975 | ) | | | (3,149,183 | ) |
The accompanying notes are an integral part of these financial statements.
The Merger Fund VL
SCHEDULE OF INVESTMENTS (continued)
December 31, 2018
| | | Shares | | | Value | |
| INTERNET SERVICES | | | | | | |
| & INFRASTRUCTURE — (0.10)% | | | | | | |
| Twilio, Inc. Class A | | | (478 | ) | | $ | (42,686 | ) |
| MANAGED HEALTH CARE — (0.00)% | | | | | | | | |
| Cigna Corporation | | | (1 | ) | | | (190 | ) |
| MOVIES & ENTERTAINMENT — (0.35)% | | | | | | | | |
| The Walt Disney Company | | | (1,324 | ) | | | (145,177 | ) |
| MULTI-UTILITIES — (3.54)% | | | | | | | | |
| Dominion Energy, Inc. | | | (20,656 | ) | | | (1,476,078 | ) |
| OIL & GAS STORAGE | | | | | | | | |
| & TRANSPORTATION — (0.05)% | | | | | | | | |
| Enbridge, Inc. (b) | | | (278 | ) | | | (8,640 | ) |
| EnLink Midstream LLC | | | (1,135 | ) | | | (10,771 | ) |
| | | | | | | | (19,411 | ) |
| PHARMACEUTICALS — (0.21)% | | | | | | | | |
| Takeda Pharmaceutical Company Ltd. (b)(f) | | | (325 | ) | | | (10,933 | ) |
| Takeda Pharmaceutical Company Ltd. — ADR | | | (4,544 | ) | | | (76,430 | ) |
| | | | | | | | (87,363 | ) |
| REITs — (0.27)% | | | | | | | | |
| Brookfield Property Partners LP (b) | | | (6,863 | ) | | | (110,632 | ) |
| SEMICONDUCTORS — (0.42)% | | | | | | | | |
| KLA-Tenor Corporation | | | (1,949 | ) | | | (174,416 | ) |
| TOTAL COMMON STOCKS | | | | | | | | |
| (Proceeds $7,934,684) | | | | | | | (7,893,267 | ) |
| | | | | | | | | |
| PRIVATE PLACEMENTS — (0.70)% (f) | | | | | | | | |
| Twenty-First Century Fox, Inc. Class A | | | (9,072 | ) | | | (290,871 | ) |
| TOTAL PRIVATE PLACEMENTS | | | | | | | | |
| (Proceeds $302,355) | | | | | | | (290,871 | ) |
| TOTAL SHORT INVESTMENTS | | | | | | | | |
| (Proceeds $8,237,039) — (19.65)% | | | | | | | (8,184,138 | ) |
| TOTAL NET INVESTMENTS | | | | | | | | |
| (Cost $33,097,346) — 78.67% | | | | | | | 32,765,213 | |
| OTHER ASSETS IN EXCESS | | | | | | | | |
| OF LIABILITIES — 21.33% | | | | | | | 8,882,947 | |
| TOTAL NET ASSETS — 100.00% | | | | | | $ | 41,648,160 | |
The accompanying notes are an integral part of these financial statements.
The Merger Fund VL
SCHEDULE OF INVESTMENTS (continued)
December 31, 2018
ADR – American Depository Receipt
ETF – Exchange-Traded Fund
LIBOR – London Interbank Offered Rate
plc – Public Limited Company
REITs – Real Estate Investment Trusts
| (a) | Non-income producing security. |
| (b) | Foreign security. |
| (c) | The rate quoted is the annualized seven-day yield as of December 31, 2018. |
| (d) | Security fair valued by the Valuation Group in good faith in accordance with the policies adopted by the Board of Trustees. |
| (e) | All or a portion of the shares have been committed as collateral for open securities sold short, written option contracts, swap contracts, and forward currency exchange contracts. |
| (f) | Level 2 Security. Please see Note 2 in the Notes to the Financial Statements for more information. |
| (g) | Level 3 Security. Please see Note 2 in the Notes to the Financial Statements for more information. |
| (h) | Security exempt from registration under Rule 144A of the Securities Act of 1933. These securities may be resold in transactions exempt from registration normally to qualified institutional buyers. As of December 31, 2018, these securities represent 3.53% of total net assets. |
| (i) | Restricted security. The Fund may own investment securities that have other legal or contractual limitations, and thus are restricted as to resale. These securities are valued by the Valuation Group under the supervision of the Board of Trustees. As of December 31, 2018, this common stock had a cost of $428,231 and its market value represented 1.07% of total net assets. The Fund’s adviser perfected its appraisal rights over this security as of 6/20/2016. Please see Note 2 in the Notes to the Financial Statements for more information. |
| (j) | The coupon rate shown on variable rate securities represents the rate as of December 31, 2018. |
| (k) | This security is held in connection with a written option contract. |
The Global Industry Classification Standard (GICS®) was developed by and/or is the exclusive property of MSCI, Inc. and Standard & Poor’s Financial Services LLC (“S&P”). GICS is a service mark of MSCI and S&P and has been licensed for use by Fund Services.
The accompanying notes are an integral part of these financial statements.
The Merger Fund VL
SCHEDULE OF INVESTMENTS (continued)
Open Written Options
December 31, 2018
| | | Contracts | | | | | | | |
| | | (100 shares | | | Notional | | | | |
| | | per contract) | | | Amount | | | Value | |
| WRITTEN CALL OPTIONS | | | | | | | | | |
| AT&T, Inc. | | | | | | | | | |
| Expiration: January 2019, | | | | | | | | | |
| Exercise Price: $31.00 | | | (14 | ) | | $ | (39,956 | ) | | $ | (56 | ) |
| Expiration: January 2019, | | | | | | | | | | | | |
| Exercise Price: $32.00 | | | (14 | ) | | | (39,956 | ) | | | (42 | ) |
| DowDuPont, Inc. | | | | | | | | | | | | |
| Expiration: January 2019, | | | | | | | | | | | | |
| Exercise Price: $60.00 | | | (4 | ) | | | (21,392 | ) | | | (24 | ) |
| Expiration: February 2019, | | | | | | | | | | | | |
| Exercise Price: $50.00 | | | (74 | ) | | | (395,752 | ) | | | (36,630 | ) |
| SPDR S&P 500 ETF Trust | | | | | | | | | | | | |
| Expiration: January 2019, | | | | | | | | | | | | |
| Exercise Price: $260.00 | | | (18 | ) | | | (449,856 | ) | | | (2,430 | ) |
| The Walt Disney Company | | | | | | | | | | | | |
| Expiration: January 2019, | | | | | | | | | | | | |
| Exercise Price: $115.00 | | | (77 | ) | | | (844,305 | ) | | | (4,389 | ) |
| | | | | | | | | | | | (43,571 | ) |
| WRITTEN PUT OPTIONS | | | | | | | | | | | | |
| SPDR S&P 500 ETF Trust | | | | | | | | | | | | |
| Expiration: January 2019, | | | | | | | | | | | | |
| Exercise Price: $230.00 | | | (17 | ) | | | (424,864 | ) | | | (1,513 | ) |
| Expiration: January 2019, | | | | | | | | | | | | |
| Exercise Price: $240.00 | | | (6 | ) | | | (149,952 | ) | | | (1,302 | ) |
| | | | | | | | | | | | (2,815 | ) |
| TOTAL WRITTEN OPTIONS | | | | | | | | | | | | |
| (Premiums received $69,854) | | | | | | | | | | $ | (46,386 | ) |
ETF – Exchange-Traded Fund
The accompanying notes are an integral part of these financial statements.
The Merger Fund VL
SCHEDULE OF INVESTMENTS (continued)
Forward Currency Exchange Contracts
December 31, 2018
| | | | | | | | | USD Value at | | | | | | | USD Value at | | | Unrealized | |
| Settlement | | | | Currency to | | December 31, | | | Currency to | | December 31, | | | Appreciation | |
| Date | | Counterparty | | be Delivered | | 2018 | | | be Received | | 2018 | | | (Depreciation)* | |
| 1/16/19 | | JPM | | | 85,099 | | CAD | | $ | 62,362 | | | | 65,718 | | USD | | $ | 65,718 | | | $ | 3,356 | |
| 1/3/19 | | JPM | | | 499,652 | | EUR | | | 572,616 | | | | 577,163 | | USD | | | 577,163 | | | | 4,547 | |
| 1/3/19 | | JPM | | | 33,711 | | USD | | | 33,711 | | | | 29,274 | | EUR | | | 33,549 | | | | (162 | ) |
| 2/20/19 | | JPM | | | 63,745 | | EUR | | | 73,351 | | | | 73,244 | | USD | | | 73,244 | | | | (107 | ) |
| 3/21/19 | | JPM | | | 268,899 | | EUR | | | 310,191 | | | | 319,524 | | USD | | | 319,524 | | | | 9,333 | |
| 3/21/19 | | JPM | | | 256,303 | | USD | | | 256,303 | | | | 217,435 | | EUR | | | 250,824 | | | | (5,479 | ) |
| | | | | | | | | | $ | 1,308,534 | | | | | | | | $ | 1,320,022 | | | $ | 11,488 | |
CAD – Canadian Dollar
EUR – Euro
JPM – JPMorgan Chase & Co., Inc.
USD – U.S. Dollar
| * | Net unrealized appreciation (depreciation) is a receivable (payable). |
The accompanying notes are an integral part of these financial statements.
The Merger Fund VL
SCHEDULE OF INVESTMENTS (continued)
Open Swap Contracts
December 31, 2018
| | | | | | | Pay/Receive | | | | | | | | | | | | | |
| | | | | | | on | | | | | | | | | | | | Unrealized | |
| Counter- | | | | Termination | | Financing | | | | Payment | | | | | Notional | | | Appreciation | |
| party | | Security | | Date | | Rate | | Financing Rate | | Frequency | | Shares | | | Amount | | | (Depreciation)* | |
| LONG TOTAL RETURN SWAP CONTRACTS | | | | | | | | | | | | | | | |
| JPM | | Ci:z Holdings Company Ltd. | | 12/28/19 | | Pay | | 0.400% +3 Month LIBOR | | Quarterly | | 10 | | | $ | 527 | | | $ | 10 | |
| BAML | | Gemalto NV | | 5/31/19 | | Pay | | 0.350% +1 Month LIBOR | | Monthly | | 9,220 | | | | 538,171 | | | | (3,520 | ) |
| JPM | | Innogy SE | | 7/18/19 | | Pay | | 0.400% +3 Month LIBOR | | Quarterly | | 1,350 | | | | 57,650 | | | | 5,274 | |
| JPM | | Man SE | | 11/8/19 | | Pay | | 0.400% +3 Month LIBOR | | Quarterly | | 706 | | | | 72,589 | | | | 237 | |
| BAML | | Shire plc | | 6/29/19 | | Pay | | 0.800% +1 Month LIBOR | | Monthly | | 14,448 | | | | 832,433 | | | | 4,218 | |
| JPM | | Shire plc | | 9/28/19 | | Pay | | 0.300% +3 Month LIBOR | | Quarterly | | 286 | | | | 17,410 | | | | (858 | ) |
| GS | | Shire plc | | 12/7/19 | | Pay | | 0.500% +1 Month LIBOR | | Monthly | | 7,904 | | | | 457,683 | | | | (351 | ) |
| | | | | | | | | | | | | | | | | | | | | | |
| SHORT TOTAL RETURN SWAP CONTRACTS | | | | | | | | | | | | | | | | | |
| BAML | | Brookfield Property | | | | | | | | | | | | | | | | | | | |
| | | Partners LP | | 3/28/19 | | Pay | | (4.500)% +1 Month LIBOR | | Monthly | | (1,550 | ) | | | (28,935 | ) | | | 3,934 | |
| JPM | | Takeda Pharmaceutical | | | | | | | | | | | | | | | | | | | |
| | | Company Ltd. | | 8/17/19 | | Pay | | (5.250)% +3 Month LIBOR | | Quarterly | | (1,815 | ) | | | (75,869 | ) | | | 14,747 | |
| BAML | | Takeda Pharmaceutical | | | | | | | | | | | | | | | | | | | |
| | | Company Ltd. | | 12/7/19 | | Pay | | (4.500)% +1 Month LIBOR | | Monthly | | (12,924 | ) | | | (540,001 | ) | | | 104,850 | |
| GS | | Takeda Pharmaceutical | | | | | | | | | | | | | | | | | | | |
| | | Company Ltd. | | 12/7/19 | | Pay | | (5.000)% +1 Month LIBOR | | Monthly | | (6,308 | ) | | | (213,573 | ) | | | 747 | |
| | | | | | | | | | | | | | | | | | | | $ | 129,288 | |
BAML – Bank of America Merrill Lynch & Co., Inc.
GS – Goldman, Sachs & Co.
JPM – JPMorgan Chase & Co., Inc.
LIBOR – London Interbank Offered Rate
plc – Public Limited Company
| * | Based on the net swap value held at each counterparty, unrealized appreciation (depreciation) is a receivable (payable). |
The accompanying notes are an integral part of these financial statements.
The Merger Fund VL
STATEMENT OF ASSETS AND LIABILITIES
December 31, 2018
| ASSETS: | | | | | | |
| Investments, at value (Cost $41,334,385) | | | | | $ | 40,949,351 | |
| Deposits at brokers for securities sold short | | | | | | 8,237,039 | |
| Deposits at brokers for other investments | | | | | | 1,121,112 | |
| Receivable for forward currency exchange contracts | | | | | | 11,488 | |
| Receivable for swap contracts | | | | | | 129,288 | |
| Receivable for investments sold | | | | | | 696,557 | |
| Dividends and interest receivable | | | | | | 96,492 | |
| Receivable for fund shares issued | | | | | | 73,675 | |
| Prepaid expenses and other receivables | | | | | | 258 | |
| Total Assets | | | | | | 51,315,260 | |
| LIABILITIES: | | | | | | | |
| Securities sold short, at value (Proceeds of $8,237,039) | | $ | 8,184,138 | | | | | |
| Written option contracts, at value | | | | | | | | |
| (Premiums received $69,854) | | | 46,386 | | | | | |
| Payable for investments purchased | | | 1,353,974 | | | | | |
| Payable to the investment adviser | | | 17,268 | | | | | |
| Payable for fund shares redeemed | | | 1,767 | | | | | |
| Dividends payable | | | 1,609 | | | | | |
| Accrued expenses and other liabilities | | | 61,958 | | | | | |
| Total Liabilities | | | | | | | 9,667,100 | |
| NET ASSETS | | | | | | $ | 41,648,160 | |
| NET ASSETS CONSISTS OF: | | | | | | | | |
| Paid-in capital | | | | | | $ | 39,835,684 | |
| Distributable earnings | | | | | | | 1,812,476 | |
| Total Net Assets | | | | | | $ | 41,648,160 | |
| | | | | | | | | |
| NET ASSET VALUE and offering price per share* | | | | | | | | |
| ($41,648,160 / 3,666,774 shares of | | | | | | | | |
| beneficial interest outstanding) | | | | | | $ | 11.36 | |
| * | The redemption price per share may vary based on the length of time a shareholder holds Fund shares. |
The accompanying notes are an integral part of these financial statements.
The Merger Fund VL
STATEMENT OF OPERATIONS
For the Year Ended December 31, 2018
| INVESTMENT INCOME: | | | | | | |
| Interest | | | | | $ | 377,799 | |
| Dividend income on long positions | | | | | | | |
| (net of foreign withholding taxes of $483) | | | | | | 680,499 | |
| Total investment income | | | | | | 1,058,298 | |
| EXPENSES: | | | | | | | |
| Investment advisory fees | | $ | 434,792 | | | | | |
| Transfer agent and shareholder servicing agent fees | | | 91,221 | | | | | |
| Professional fees | | | 90,900 | | | | | |
| Fund accounting expenses | | | 43,381 | | | | | |
| Administration fees | | | 38,918 | | | | | |
| Reports to shareholders | | | 13,255 | | | | | |
| Trustees’ fees and expenses | | | 13,157 | | | | | |
| Custody fees | | | 10,823 | | | | | |
| Compliance fees | | | 2,607 | | | | | |
| Miscellaneous expenses | | | 2,589 | | | | | |
| Federal and state registration fees | | | 802 | | | | | |
| Borrowing expenses on securities sold short | | | 58,895 | | | | | |
| Dividends on securities sold short | | | 93,789 | | | | | |
| Total expenses before expense reimbursement by adviser | | | | | | | 895,129 | |
| Expense reimbursed by adviser (Note 3) | | | | | | | (255,478 | ) |
| Net expenses | | | | | | | 639,651 | |
| NET INVESTMENT INCOME | | | | | | | 418,647 | |
| REALIZED AND CHANGE IN UNREALIZED | | | | | | | | |
| GAIN (LOSS) ON INVESTMENTS: | | | | | | | | |
| Realized gain (loss) on: | | | | | | | | |
| Investments | | | 786,770 | | | | | |
| Securities sold short | | | (13,422 | ) | | | | |
| Written option contracts expired or closed | | | 117,637 | | | | | |
| Forward currency exchange contracts | | | 115,718 | | | | | |
| Swap contracts | | | 1,159,697 | | | | | |
| Foreign currency transactions | | | (6,289 | ) | | | | |
| Net realized gain | | | | | | | 2,160,111 | |
| Change in unrealized appreciation (depreciation) on: | | | | | | | | |
| Investments | | | (1,508,617 | ) | | | | |
| Securities sold short | | | 1,353,334 | | | | | |
| Written option contracts | | | 89,729 | | | | | |
| Forward currency exchange contracts | | | 59,670 | | | | | |
| Swap contracts | | | (123,866 | ) | | | | |
| Foreign currency translation | | | (2 | ) | | | | |
| Net change in unrealized depreciation | | | | | | | (129,752 | ) |
| NET REALIZED AND CHANGE IN UNREALIZED | | | | | | | | |
| GAIN ON INVESTMENTS | | | | | | | 2,030,359 | |
| NET INCREASE IN NET ASSETS | | | | | | | | |
| RESULTING FROM OPERATIONS | | | | | | $ | 2,449,006 | |
The accompanying notes are an integral part of these financial statements.
The Merger Fund VL
STATEMENTS OF CHANGES IN NET ASSETS
| | | Year Ended | | | Year Ended | |
| | | December 31, 2018 | | | December 31, 2017 | |
| | | | | | | |
| Net investment income | | $ | 418,647 | | | $ | 105,517 | |
| Net realized gain on investments, | | | | | | | | |
| securities sold short, written option | | | | | | | | |
| contracts expired or closed, forward currency | | | | | | | | |
| exchange contracts, swap contracts, and | | | | | | | | |
| foreign currency transactions | | | 2,160,111 | | | | 988,085 | |
| Net change in unrealized depreciation | | | | | | | | |
| on investments, securities sold short, | | | | | | | | |
| written option contracts, forward currency | | | | | | | | |
| exchange contracts, swap contracts, | | | | | | | | |
| and foreign currency translation | | | (129,752 | ) | | | (312,547 | ) |
| Net increase in net assets | | | | | | | | |
| resulting from operations | | | 2,449,006 | | | | 781,055 | |
| | | | | | | | | |
| Distributions to shareholders from: (Note 5) | | | | | | | | |
| Total dividends and | | | | | | | | |
| distributions to shareholders | | | (715,400 | ) | | | — | |
| | | | | | | | | |
| Net increase (decrease) in net assets from | | | | | | | | |
| capital share transactions (Note 4) | | | 7,924,592 | | | | (626,573 | ) |
| Net increase in net assets | | | 9,658,198 | | | | 154,482 | |
| | | | | | | | | |
| NET ASSETS: | | | | | | | | |
| Beginning of year | | | 31,989,962 | | | | 31,835,480 | |
| End of year | | $ | 41,648,160 | | | $ | 31,989,962 | * |
* Includes accumulated undistributed net investment income of $10,433.
The accompanying notes are an integral part of these financial statements.
The Merger Fund VL
FINANCIAL HIGHLIGHTS
Selected per share data is based on a share of beneficial interest outstanding throughout each year.
| | | Year Ended December 31, | |
| | | 2018 | | | 2017 | | | 2016 | | | 2015 | | | 2014 | |
| Per Share Data: | | | | | | | | | | | | | | | |
| Net asset value, beginning of year | | $ | 10.80 | | | $ | 10.53 | | | $ | 10.47 | | | $ | 10.87 | | | $ | 10.92 | |
| Income from investment operations: | | | | | | | | | | | | | | | | | | | | |
Net investment income (loss)(1) | | | 0.14 | | | | 0.04 | | | | (0.07 | ) | | | (0.05 | ) | | | 0.26 | |
| Net realized and unrealized | | | | | | | | | | | | | | | | | | | | |
| gain (loss) on investments | | | 0.63 | | | | 0.23 | | | | 0.33 | | | | (0.05 | ) | | | (0.11 | ) |
| Total from investment operations | | | 0.77 | | | | 0.27 | | | | 0.26 | | | | (0.10 | ) | | | 0.15 | |
| Less distributions: | | | | | | | | | | | | | | | | | | | | |
| From net investment income | | | (0.08 | ) | | | — | | | | (0.08 | ) | | | (0.23 | ) | | | (0.14 | ) |
| From net realized gains | | | (0.13 | ) | | | — | | | | (0.12 | ) | | | (0.07 | ) | | | (0.06 | ) |
| Total dividends and distributions | | | (0.21 | ) | | | — | | | | (0.20 | ) | | | (0.30 | ) | | | (0.20 | ) |
| Net Asset Value, end of year | | $ | 11.36 | | | $ | 10.80 | | | $ | 10.53 | | | $ | 10.47 | | | $ | 10.87 | |
| Total Return | | | 7.09 | % | | | 2.56 | % | | | 2.44 | % | | | (0.90 | )% | | | 1.37 | % |
| Supplemental data and ratios: | | | | | | | | | | | | | | | | | | | | |
| Net assets, end of year (000’s) | | $ | 41,648 | | | $ | 31,990 | | | $ | 31,835 | | | $ | 33,153 | | | $ | 22,854 | |
| Ratio of gross expenses | | | | | | | | | | | | | | | | | | | | |
| to average net assets: | | | | | | | | | | | | | | | | | | | | |
| Before expense reimbursement | | | 2.57 | % | | | 2.51 | % | | | 2.75 | % | | | 2.57 | % | | | 2.80 | % |
| After expense reimbursement | | | 1.84 | % | | | 1.78 | % | | | 1.99 | % | | | 1.79 | % | | | 1.74 | % |
| Ratio of dividends and interest on | | | | | | | | | | | | | | | | | | | | |
| short positions and borrowing | | | | | | | | | | | | | | | | | | | | |
| expense on securities sold short | | | | | | | | | | | | | | | | | | | | |
| to average net assets | | | 0.44 | % | | | 0.38 | % | | | 0.59 | % | | | 0.39 | % | | | 0.34 | % |
| Ratio of operating expenses to | | | | | | | | | | | | | | | | | | | | |
| average net assets excluding | | | | | | | | | | | | | | | | | | | | |
| dividends and interest on short | | | | | | | | | | | | | | | | | | | | |
| positions and borrowing expense | | | | | | | | | | | | | | | | | | | | |
| on securities sold short (after | | | | | | | | | | | | | | | | | | | | |
| expense reimbursement) | | | 1.40 | % | | | 1.40 | % | | | 1.40 | % | | | 1.40 | % | | | 1.40 | % |
| Ratio of net investment income (loss) | | | | | | | | | | | | | | | | | | | | |
| to average net assets | | | 1.20 | % | | | 0.34 | % | | | (0.66 | )% | | | (0.49 | )% | | | 2.39 | % |
Portfolio turnover rate(2) | | | 154 | % | | | 184 | % | | | 202 | % | | | 167 | % | | | 154 | % |
| (1) | Net investment income (loss) per share has been calculated based on average shares outstanding during the year. |
| (2) | The numerator for the portfolio turnover rate includes the lesser of purchases or sales (excluding short-term investments, short-term options, forward currency contracts, swap contracts and short positions). The denominator includes the average long positions throughout the year. |
The accompanying notes are an integral part of these financial statements.
The Merger Fund VL
NOTES TO THE FINANCIAL STATEMENTS
December 31, 2018
Note 1 — ORGANIZATION
The Merger Fund VL (the “Fund”) is a no-load, open-end, diversified investment company organized as a statutory trust under the laws of Delaware on November 22, 2002, and registered under the Investment Company Act of 1940, as amended (the “1940 Act”). The Fund commenced operations on May 26, 2004. In a transaction that closed on December 31, 2010, Westchester Capital Management, Inc. transferred substantially all of its business and assets to Westchester Capital Management, LLC (the “Adviser”), which became the Fund’s investment adviser. Therefore, the performance information included for periods prior to 2011 reflects the performance of Westchester Capital Management, Inc. Roy Behren and Michael Shannon, the Fund’s current portfolio managers, assumed portfolio management duties for the Fund in January 2007. The investment objective of the Fund is to seek to achieve capital growth by engaging in merger arbitrage. Merger arbitrage is a highly specialized investment approach generally designed to profit from the successful completion of publicly announced mergers, takeovers, tender offers, leveraged buyouts, spin-offs, liquidations and other corporate reorganizations. The Fund’s shares are currently offered only to separate accounts funding variable annuity and variable life insurance contracts. At December 31, 2018, 97.4% of the shares outstanding of the Fund were owned by five insurance companies. Activities of these shareholders may have a significant effect on the operations of the Fund.
Note 2 — SIGNIFICANT ACCOUNTING POLICIES
The following is a summary of significant accounting policies followed by the Fund in the preparation of its financial statements. These policies are in conformity with U.S. generally accepted accounting principles (“GAAP”). The Fund is an investment company and, accordingly, follows the investment company accounting and reporting guidance of the Financial Accounting Standards Board Accounting Standards Codification Topic 946 – Investment Companies. The presentation of financial statements in conformity with GAAP requires management to make estimates and assumptions that affect the reported amount of assets and liabilities at the date of the financial statements and the reported amounts of revenues and expenses during the reporting period. Actual results could differ from those estimates and assumptions.
A. Investment Valuation
The following is a summary of the Fund’s pricing procedures. It is intended to be a general discussion and may not necessarily reflect all pricing procedures followed by the Fund.
The Merger Fund VL
NOTES TO THE FINANCIAL STATEMENTS (continued)
December 31, 2018
Note 2 — SIGNIFICANT ACCOUNTING POLICIES (continued)
Equity securities, including common and preferred stocks, closed-end funds and ETFs, that trade on an exchange will typically be valued based on the last reported sale price. Securities listed on NASDAQ are typically valued using the NASDAQ Official Closing Price. The securities valued using quoted prices in active markets are classified as Level 1 investments. If, on a particular day, an exchange-listed security does not trade, then the mean between the closing bid and asked prices will typically be used to value the security. These securities are classified as Level 2 investments. Fixed income securities having a maturity of greater than 60 days are typically valued based on evaluations provided by an independent pricing vendor. Investments in United States government securities (other than short-term securities) are valued at the mean between the 4:00 p.m. New York time bid and asked prices supplied by a third party vendor. Short-term fixed-income securities having a maturity of less than 60 days are valued at market quotations or based on valuations supplied by a third party pricing service. If a reliable price from a third party pricing service is unavailable, amortized cost may be used if it is determined that the instrument’s amortized cost value represents approximately the fair value of the security. These securities are classified as Level 2 investments.
Investments in Special Purpose Acquisition Companies, including their related units, shares, rights and warrants (each a “SPAC interest”), will typically be valued by reference to the last reported transaction for the composite exchange. These securities are classified as Level 1 investments. If, on a particular day, no reliable market transaction is readily available and reported for the composite exchange, then the mean between the closing bid and asked prices on the composite exchange will be used to value the SPAC interest, or the SPAC interest will be fair valued in accordance with the Fund’s pricing procedures. These securities are classified as Level 2 investments.
Exchange-traded options are typically valued at the higher of the intrinsic value of the option (i.e., what the Fund would pay or can receive upon the option being exercised) or the last reported composite sale price when such sale falls between the bid and asked prices. When the last sale of an exchange-traded option is outside the bid and asked prices, the Fund will typically value the option at the higher of the intrinsic value of the option or the mean between the highest end of day option bid price and the lowest end of day option ask price. Options for which there is an active market are classified as Level 1 investments, but options not listed on an exchange and/or are fair valued in accordance with the Fund’s pricing procedures are classified as Level 2 investments.
Investments in registered open-end investment companies, including Money Market Funds, are typically valued at their reported net asset value (“NAV”) per share. These securities are generally classified as Level 1 investments.
The Merger Fund VL
NOTES TO THE FINANCIAL STATEMENTS (continued)
December 31, 2018
Note 2 — SIGNIFICANT ACCOUNTING POLICIES (continued)
Forward currency contracts are valued daily at the prevailing forward exchange rate. These securities are generally classified as Level 2.
In general, swap prices are determined using the same methods as would be used to price the underlying security. When the underlying security is the subject of a completed corporate reorganization for which the final deal terms are known, the swap is priced at the value of the consideration to be received by the Fund. The credit quality of counterparties and collateral is monitored and the valuation of a swap may be adjusted if it is believed that the credit quality of the counterparty or collateral affects the market value of the swap position. These securities are generally classified as Level 2 investments.
The Fund typically fair values securities and assets for which (a) market quotations are not readily available or (b) market quotations are believed to be unrepresentative of market value. For example, the Fund may fair value a security that primarily trades on an exchange that closes before the New York Stock Exchange (“NYSE”) if a significant event occurs after the close of the exchange on which the security primarily trades but before the NYSE closes. Fair valuations are determined in good faith by the Valuation Group (the “Valuation Group”), a committee comprised of persons who are officers of the Trust or representatives of the Adviser, acting pursuant to procedures adopted by the Board. When fair value pricing is employed, the prices of securities used by the Fund to calculate its NAV may differ from quoted or published prices for the same securities. In addition, due to the subjective nature of fair value pricing, it is possible that the value determined for a particular asset may be materially different from the value realized upon such asset’s sale. These securities are generally classified as Level 2 or 3 depending on the inputs as described below.
The Fund has performed an analysis of all existing investments to determine the significance and character of all inputs to their fair value determination. Various inputs are used in determining the value of the Fund’s investments. These inputs are summarized in the three broad levels listed below:
| | Level 1 — | Quoted prices in active markets for identical securities. |
| | Level 2 — | Other significant observable inputs (including quoted prices for similar securities, interest rates, prepayment speeds, credit risk, etc.). |
| | Level 3 — | Significant unobservable inputs are those inputs that reflect the Fund’s own assumptions that market participants would use to price the asset or liability based on the best available information. |
The inputs or methodology used for valuing securities are not an indication of the risk associated with investing in those securities.
The Merger Fund VL
NOTES TO THE FINANCIAL STATEMENTS (continued)
December 31, 2018
Note 2 — SIGNIFICANT ACCOUNTING POLICIES (continued)
The following tables provide the fair value measurements of applicable Fund assets and liabilities by level within the fair value hierarchy for the Fund as of December 31, 2018. These assets and liabilities are measured on a recurring basis.
Investments at Fair Value | | Level 1 | | | Level 2 | | | Level 3 | | | Total | |
| Assets | | | | | | | | | | | | |
| Common Stocks* | | $ | 15,521,682 | | | $ | 1,791,834 | | | $ | 443,558 | | | $ | 17,757,074 | |
| Special Purpose Acquisition | | | | | | | | | | | | | | | | |
| Companies | | | 2,132,904 | | | | 964,603 | | | | — | | | | 3,097,507 | |
| Closed-End Funds | | | 3,802,950 | | | | — | | | | — | | | | 3,802,950 | |
| Preferred Stocks | | | 71,703 | | | | — | | | | — | | | | 71,703 | |
| Contingent Value Rights | | | — | | | | — | | | | 252 | | | | 252 | |
| Rights | | | 4,614 | | | | — | | | | — | | | | 4,614 | |
| Warrants | | | 12,040 | | | | 2,067 | | | | — | | | | 14,107 | |
| Bank Loans | | | — | | | | 693,965 | | | | — | | | | 693,965 | |
| Corporate Bonds | | | — | | | | 2,865,012 | | | | — | | | | 2,865,012 | |
| Purchased Option Contracts | | | 176,133 | | | | — | | | | — | | | | 176,133 | |
| Escrow Notes | | | — | | | | — | | | | 11,885 | | | | 11,885 | |
| Short-Term Investments | | | 12,093,720 | | | | 360,429 | | | | — | | | | 12,454,149 | |
| Forward Currency | | | | | | | | | | | | | | | | |
| Exchange Contracts** | | | — | | | | 11,488 | | | | — | | | | 11,488 | |
| Swap Contracts** | | | — | | | | 129,288 | | | | — | | | | 129,288 | |
| Total | | $ | 33,815,746 | | | $ | 6,818,686 | | | $ | 455,695 | | | $ | 41,090,127 | |
| Liabilities | | | | | | | | | | | | | | | | |
| Short Common Stocks* | | $ | (7,882,334 | ) | | $ | (10,933 | ) | | $ | — | | | $ | (7,893,267 | ) |
| Private Placements | | | — | | | | (290,871 | ) | | | — | | | | (290,871 | ) |
| Written Option Contracts | | | (46,386 | ) | | | — | | | | — | | | | (46,386 | ) |
| Total | | $ | (7,928,720 | ) | | $ | (301,804 | ) | | $ | — | | | $ | (8,230,524 | ) |
| * | | Please refer to the Schedules of Investments to view long/short common stocks segregated by industry type. |
| ** | | Swap contracts and forward currency exchange contracts are valued at the net unrealized appreciation (depreciation) on the instrument by counterparty. |
The Level 2 securities are priced using inputs such as current yields, discount rates, credit quality, yields on comparable securities, trading volume, maturity date, market bid and asked prices, prices on comparable securities and other significant inputs. Level 3 securities are valued by using broker quotes or such other pricing sources or data as are permitted by the Fund’s pricing procedures. At December 31, 2018, the value of these securities were $455,695. The inputs for these securities are not readily available or cannot be reasonably estimated and are generally those inputs as described in Note 2 A. The appropriateness of fair values for these securities is monitored by the Valuation Group on an ongoing basis.
The Merger Fund VL
NOTES TO THE FINANCIAL STATEMENTS (continued)
December 31, 2018
Note 2 — SIGNIFICANT ACCOUNTING POLICIES (continued)
There were no transfers into or out of Level 3 for the year ended December 31, 2018.
Level 3 Reconciliation Disclosure
The following is a reconciliation of Level 3 assets for which significant unobservable inputs were used to determine fair value.
| | | Common | | | Contingent | | | Escrow | | | Total | |
Description | | Stocks | | | Value Rights | | | Notes | | | Investment | |
| Balance as of December 31, 2017 | | $ | 437,688 | | | $ | 4,328 | | | $ | 12,269 | | | $ | 454,285 | |
| Purchases on Investments* | | | — | | | | — | | | | — | ** | | | — | ** |
| (Sales) of Investments | | | — | | | | — | ** | | | — | | | | — | ** |
| Realized (Gain) Loss | | | — | | | | (6,585 | ) | | | — | | | | (6,585 | ) |
| Transfers Into Level 3 | | | — | | | | — | | | | — | | | | — | |
| (Transfer Out) of Level 3 | | | — | | | | — | | | | — | | | | — | |
| Change in Unrealized | | | | | | | | | | | | | | | | |
| Appreciation (Depreciation) | | | 5,870 | | | | 2,509 | | | | (384 | ) | | | 7,995 | |
| Balance as of December 31, 2018 | | $ | 443,558 | | | $ | 252 | | | $ | 11,885 | | | $ | 455,695 | |
| Change in unrealized appreciation | | | | | | | | | | | | | | | | |
| (depreciation) during the year | | | | | | | | | | | | | | | | |
| for Level 3 investments | | | | | | | | | | | | | | | | |
| held at December 31, 2018. | | $ | 5,870 | | | $ | 3,884 | | | $ | (384 | ) | | $ | 9,370 | |
| * | | Includes receipts from corporate actions. |
| ** | | Amount less than $0.50. |
The realized and unrealized gains and losses from Level 3 transactions are included with the net realized gain (loss) on investments and net change in unrealized appreciation (depreciation) on investments on the Statement of Operations, respectively. The net change in unrealized appreciation on investments related to Level 3 securities held by the Fund at December 31, 2018 totals $7,995.
Significant unobservable valuation inputs monitored by the Valuation Group under the supervision of the Board of Trustees for restricted securities or material Level 3 investments as of December 31, 2018 are as follows:
| | | Fair Value at | | Valuation | | Unobservable |
| Description | | December 31, 2018 | | Technique | | Input |
| Common Stock | | $ | 443,558 | | Discounted Cash | | Discount Rates/Terminal Value/ |
| | | | | | Flow Model | | Cash Flow Projections |
| Escrow Note | | $ | — | * | Projected Final | | Discount of |
| | | | | | Distribution** | | Projected Distribution |
| * | | Amount less than $0.50. |
| ** | | This Level 3 security was received through a corporate action. The security is being kept open due to the potential of an additional distribution. Based on the evaluation of the likelihood of an additional distribution, the security is being priced at zero. |
The Merger Fund VL
NOTES TO THE FINANCIAL STATEMENTS (continued)
December 31, 2018
Note 2 — SIGNIFICANT ACCOUNTING POLICIES (continued)
The table above does not include certain Level 3 investments that are valued by brokers. At December 31, 2018, the value of these securities were $12,137. The inputs for these investments are not readily available or cannot be reasonably estimated and are generally those inputs described in Note 2 A.
B. Federal Income Taxes
No provision for federal income taxes has been made since the Fund has complied to date with the provisions of Subchapter M of the Internal Revenue Code applicable to regulated investment companies and intends to continue to comply in future years and to distribute investment company net taxable income and net capital gains to shareholders. Additionally, the Fund intends to make all required distributions to avoid federal excise tax.
The Fund has reviewed all open tax years in major jurisdictions and concluded that there is no impact on the Fund’s net assets and there is no tax liability resulting from unrecognized tax benefits relating to uncertain income tax positions taken or expected to be taken on a tax return. The Fund is also not aware of any tax positions for which it is reasonably possible that the total amounts of unrecognized tax benefits will significantly change in the next twelve months. As of December 31, 2018, open Federal and New York tax years include the tax years ended December 31, 2015 through December 31, 2018. The Fund has no tax examination in progress.
C. Transactions with Brokers
The Fund’s deposits at brokers for securities sold short and deposits at brokers for other investments are with two securities dealers. The Fund is required by the brokers to maintain collateral for securities sold short. The receivable from brokers for securities sold short on the Statement of Assets and Liabilities represents the proceeds from securities sold short that is maintained at the broker. The Fund does not require the brokers to maintain collateral in support of the receivables from the brokers for proceeds on securities sold short. The Fund may maintain cash deposits at brokers beyond the receivables for short sales. On the Statement of Assets and Liabilities, these are classified as deposits at brokers for other investments. The Fund may be required by the brokers with which it executes short sales to maintain an additional amount of collateral in a special tri-party custody arrangement for the benefit of the broker.
The Fund’s equity swap contracts’ and forward currency exchange contracts’ cash deposits are monitored daily by the Adviser and counterparty. These transactions may involve market risk in excess of amounts receivable or payable reflected on the Statement of Assets and Liabilities.
The Merger Fund VL
NOTES TO THE FINANCIAL STATEMENTS (continued)
December 31, 2018
Note 2 — SIGNIFICANT ACCOUNTING POLICIES (continued)
D. Securities Sold Short
The Fund sells securities or currencies short for economic hedging purposes or any other investment purpose. For financial statement purposes, an amount equal to the settlement amount is initially included in the Statement of Assets and Liabilities as an asset and an equivalent liability. The amount of the liability is subsequently priced to reflect the current value of the short position. Subsequent fluctuations in the market prices of securities or currencies sold, but not yet purchased, may require purchasing the securities or currencies at prices which may differ from the market value reflected on the Statement of Assets and Liabilities. Short sale transactions result in off balance sheet risk because the ultimate obligation may exceed the related amounts shown in the Statement of Assets and Liabilities. The Fund will incur a loss if the price of the security increases between the date of the short sale and the date on which the Fund purchases the security to replace the borrowed security. The Fund’s loss on a short sale is potentially unlimited because there is no upward limit on the price a borrowed security could attain.
The Fund is liable for any dividends payable on securities while those securities are sold short. Until the security is replaced, the Fund is required to pay to the lender any income earned, which is recorded as an expense by the Fund. The Fund segregates liquid assets in an amount equal to the market value of securities sold short, which is reflected in the Schedule of Investments. These assets are required to be adjusted daily to reflect changes in the value of the securities or currencies sold short.
E. Written Option Contracts
The Fund is subject to equity price risk in the normal course of pursuing its investment objectives. The Fund writes (sells) put or call options for hedging purposes, volatility management purposes, or otherwise to gain, or reduce, long or short exposure to one or more asset classes or issuers. When the Fund writes (sells) an option, an amount equal to the premium received by the Fund is included in the Statement of Assets and Liabilities as an asset and an equivalent liability. The amount of the liability is subsequently priced daily to reflect the current value of the option written. Refer to Note 2 A. for a pricing description. By writing an option, the Fund may become obligated during the term of the option to deliver or purchase the securities underlying the option at the exercise price if the option is exercised. These contracts may involve market risk in excess of amounts receivable or payable reflected on the Statement of Assets and Liabilities. Refer to Note 2 Q. for further derivative disclosures, and Note 2 O. for further counterparty risk disclosure.
The Merger Fund VL
NOTES TO THE FINANCIAL STATEMENTS (continued)
December 31, 2018
Note 2 — SIGNIFICANT ACCOUNTING POLICIES (continued)
When an option expires on its stipulated expiration date or the Fund enters into a closing purchase transaction, the Fund realizes a gain or loss if the cost of the closing purchase transaction differs from the premium received when the option was sold without regard to any unrealized appreciation or depreciation on the underlying security, and the liability related to such option is eliminated. When a written call option is exercised, the premium originally received decreases the cost basis of the security and the Fund realizes gains or losses from the sale of the underlying security. When a written put option is exercised, the cost of the security acquired is decreased by the premium received for the put.
F. Purchased Option Contracts
The Fund is subject to equity price risk in the normal course of pursuing its investment objectives. The Fund purchases put or call options for hedging purposes, volatility management purposes, or otherwise to gain, or reduce, long or short exposure to one or more asset classes or issuers. When the Fund purchases an option contract, an amount equal to the premium paid is included in the Statement of Assets and Liabilities as an investment, and is subsequently priced daily to reflect the value of the purchased option. Refer to Note 2 A. for a pricing description. Refer to Note 2 Q. for further derivative disclosures, and Note 2 O. for further counterparty risk disclosure.
When option contracts expire or are closed, realized gains or losses are recognized without regard to any unrealized appreciation or depreciation on the underlying securities that may be held by the Fund. If the Fund exercises a call option, the cost of the security acquired is increased by the premium paid for the call. If the Fund exercises a put option, the premium paid for the put option increases the cost of the underlying security and a gain or loss is realized from the sale of the underlying security.
G. Forward Currency Exchange Contracts
The Fund is subject to foreign currency exchange rate risk in the normal course of pursuing its investment objectives. The Fund used forward currency exchange contracts to hedge against changes in the value of foreign currencies. The Fund may enter into forward currency exchange contracts obligating the Fund to deliver and receive a currency at a specified future date. Forward contracts are valued daily, and unrealized appreciation or depreciation is recorded daily as the difference between the contract exchange rate and the closing forward rate applied to the face amount of the contract. Refer to Note 2 A. for a pricing description. A realized gain or loss is recorded at the time the forward contract expires. Credit risk may arise as a result of the failure of the counterparty to comply with the terms of the contract. Refer to Note 2 O. for further counterparty risk disclosure.
The Merger Fund VL
NOTES TO THE FINANCIAL STATEMENTS (continued)
December 31, 2018
Note 2 — SIGNIFICANT ACCOUNTING POLICIES (continued)
The use of forward currency exchange contracts does not eliminate fluctuations in the underlying prices of the Fund’s investment securities. The use of forward currency exchange contracts involves the risk that anticipated currency movements will not be accurately predicted. A forward currency exchange contract would limit the risk of loss due to a decline in the value of a particular currency; however, it would also limit any potential gain that might result should the value of the currency increase instead of decrease. These contracts may involve market risk in excess of the amounts receivable or payable reflected on the Statement of Assets and Liabilities. Refer to Note 2 Q. for further derivative disclosures.
H. Equity Swap Contracts
The Fund is subject to equity price risk and interest rate risk in the normal course of pursuing its investment objectives. The Fund entered into both long and short equity swap contracts with multiple broker-dealers. A long equity swap contract entitles the Fund to receive from the counterparty any appreciation and dividends paid on an individual security, while obligating the Fund to pay the counterparty any depreciation on the security as well as interest on the notional amount of the contract at a rate equal to LIBOR plus an agreed upon spread (refer to the Schedule of Investments for further disclosure of the contracts’ financing rates). A short equity swap contract obligates the Fund to pay the counterparty any appreciation and dividends paid on an individual security, while entitling the Fund to receive from the counterparty any depreciation on the security, and to pay to or receive from the counterparty interest on the notional value of the contract at a rate equal to LIBOR less an agreed upon spread (refer to the Schedule of Investments for further disclosure of the contracts’ financing rates). Refer to Note 2 A. for a pricing description.
The Fund may also enter into equity swap contracts whose value may be determined by the spread between a long equity position and a short equity position. This type of swap contract obligates the Fund to pay the counterparty an amount tied to any increase in the spread between the two securities over the term of the contract. The Fund is also obligated to pay the counterparty any dividends paid on the short equity holding as well as any net financing costs. This type of swap contract entitles the Fund to receive from the counterparty any gains based on a decrease in the spread as well as any dividends paid on the long equity holding and any net interest income.
Fluctuations in the value of an open contract are recorded daily as net unrealized appreciation or depreciation. The Fund will realize a gain or loss
The Merger Fund VL
NOTES TO THE FINANCIAL STATEMENTS (continued)
December 31, 2018
Note 2 — SIGNIFICANT ACCOUNTING POLICIES (continued)
upon termination or reset of the contract. The Fund or the Fund’s counterparty, under certain conditions, may terminate the contract prior to the contract’s expiration date.
Credit risk may arise as a result of the failure of the counterparty to comply with the terms of the contract. Refer to Note 2 O. for further counterparty risk disclosure. Additionally, risk may arise from unanticipated movements in interest rates or in the value of the underlying securities. Equity Swap contracts may involve market risk in excess of amounts receivable or payable reflected on the Statement of Assets and Liabilities. Refer to Note 2 Q. for further derivative disclosures.
I. Distributions to Shareholders
Dividends from net investment income and net realized capital gains, if any, are declared and paid at least annually. Income and capital gain distributions are determined in accordance with income tax regulations which may differ from GAAP. These differences are due primarily to wash sale-loss deferrals, constructive sales, straddle-loss deferrals, adjustments on swap contracts, and unrealized gains or losses on Section 1256 contracts, which were realized, for tax purposes, at the end of the Fund’s fiscal year.
J. Foreign Securities
Investing in securities of foreign companies and foreign governments involves special risks and considerations not typically associated with investing in U.S. companies and the U.S. government. These risks include fluctuations in currency exchange rates and adverse political, cultural, regulatory, legal, tax, and economic developments as well as different custody and/or settlement practices or delayed settlements in some foreign markets. Moreover, securities of many foreign companies and their markets may be less liquid and their prices more volatile than those of securities of comparable U.S. companies and the U.S. government.
K. Foreign Currency Transactions
The books and records of the Fund are maintained in U.S. dollars. Foreign currency transactions are translated into U.S. dollars on the following basis: (i) market value of investment securities, assets and liabilities at the daily rates of exchange, and (ii) purchases and sales of investment securities, dividend and interest income and certain expenses at the rates of exchange prevailing on the respective dates of such transactions. For financial reporting purposes, the Fund does not isolate changes in the exchange rate of investment securities from the fluctuations arising from changes in the market prices of securities. However, for federal income tax purposes, the Fund does isolate and treat as ordinary
The Merger Fund VL
NOTES TO THE FINANCIAL STATEMENTS (continued)
December 31, 2018
Note 2 — SIGNIFICANT ACCOUNTING POLICIES (continued)
income the effect of changes in foreign exchange rates on realized gain or loss from the sale of investment securities and payables and receivables arising from trade-date and settlement-date differences. Foreign currency, if any, held as cash by the Fund’s custodian is reported separately on the Statement of Assets and Liabilities.
L. Cash and Cash Equivalents
The Fund considers highly liquid short-term fixed income investments purchased with an original maturity of less than three months to be cash equivalents. Cash equivalents are included in short-term investments on the Schedule of Investments as well as in investments on the Statement of Assets and Liabilities. Temporary cash overdrafts are reported as payable to custodian.
M. Guarantees and Indemnifications
In the normal course of business, the Fund enters into contracts with service providers that contain general indemnification clauses. The Fund’s maximum exposure under these arrangements is unknown, as this would involve future claims that may be made against the Fund that have not yet occurred. The Fund has not historically incurred material expenses in respect of those provisions.
N. Security Transactions, Investment Income and Expenses
Transactions are recorded for financial statement purposes on the trade date. Realized gains and losses from security transactions are recorded on the identified cost basis. Distributions to shareholders are recorded on the ex-dividend date. Dividend income is recorded on the ex-dividend date, except for certain dividends on foreign securities, which are recorded as soon as the Fund is informed after the ex-dividend date. Interest is accounted for on the accrual basis and includes amortization of premiums and discounts on the effective interest method. At December 31, 2018, expenses include $58,895 of borrowing expenses on securities sold short.
O. Counterparty Risk
The Fund helps manage counterparty credit risk by entering into agreements only with counterparties the Adviser believes have the financial resources to honor their obligations. The Adviser considers the creditworthiness of each counterparty to a contract in evaluating potential credit risk. The counterparty risk for forward currency exchange contracts to the Fund includes the amount of any net unrealized appreciation on the contract. The counterparty risk for equity swap contracts to the Fund includes the risk of loss of the full amount of any net unrealized appreciation on the contract, along with dividends receivable on long equity contracts
The Merger Fund VL
NOTES TO THE FINANCIAL STATEMENTS (continued)
December 31, 2018
Note 2 — SIGNIFICANT ACCOUNTING POLICIES (continued)
and interest receivable on short equity contracts. Written and purchased options sold on an exchange expose the Fund to counterparty risk; however, the exchange’s clearinghouse guarantees the options against default. Over-the-counter options counterparty risk includes the risk of loss of the full amount of any net unrealized appreciation.
P. The Right to Offset
Financial assets and liabilities, as well as cash collateral received by the Fund’s counterparties and posted are offset by the respective counterparty, and the net amount is reported in the Statement of Assets and Liabilities when the Fund believes there exists a legally enforceable right to offset the recognized amounts.
Q. Derivatives
The Fund may utilize derivative instruments such as options, swaps, futures, forward contracts and other instruments with similar characteristics to the extent that they are consistent with the Fund’s investment objectives and limitations. The use of these instruments may involve additional investment risks, including the possibility of illiquid markets or imperfect correlation between the value of the instruments and the underlying securities. Derivatives also may create leverage which will amplify the effect of their performance on the Fund and may produce significant losses.
The Fund has adopted authoritative standards regarding disclosure about derivatives and hedging activities and how they affect the Fund’s Statement of Assets and Liabilities and Statement of Operations. For the year ended December 31, 2018, the Fund’s monthly average quantities and notional values are described below:
| | | Monthly Average | | | Monthly Average | |
| | | Quantity | | | Notional Value | |
| Purchased Option Contracts | | | 514 | | | $ | 4,813,919 | |
| Written Option Contracts | | | 572 | | | $ | 4,851,551 | |
| Forward Currency Exchange Contracts | | | 9 | | | $ | 2,819,803 | |
| Long Total Return Swap Contracts | | | 192,352 | | | $ | 3,513,925 | |
| Short Total Return Swap Contracts | | | 63,846 | | | $ | 936,788 | |
The Merger Fund VL
NOTES TO THE FINANCIAL STATEMENTS (continued)
December 31, 2018
Note 2 — SIGNIFICANT ACCOUNTING POLICIES (continued)
Statement of Assets and Liabilities
Fair values of derivative instruments as of December 31, 2018 as described below:
| | | | Asset Derivatives | |
| | | | Statement of Assets | | | |
Derivatives | | and Liabilities Location | | Fair Value | |
| Equity Contracts: | | | | | |
| Purchased Option Contracts | | Investments | | $ | 176,133 | |
| Swap Contracts | | Receivables | | | 129,288 | |
| Foreign Exchange Contracts: | | | | | | |
| Forward Currency Exchange Contracts | | Receivables | | | 11,488 | |
| Total | | | | $ | 316,909 | |
| | | | | | | | |
| | | | Liability Derivatives | |
| | | | Statement of Assets | | | | |
Derivatives | | and Liabilities Location | | Fair Value | |
| Equity Contracts: | | | | | | |
| Written Option Contracts | | Written Option Contracts | | $ | 46,386 | |
| Total | | | | $ | 46,386 | |
Statement of Operations
The effect of derivative instruments on the Statement of Operations for the year ended December 31, 2018 as described below:
Amount of Realized Gain (Loss) on Derivatives
| | | | | | | | | Forward | | | | | | | |
| | | Purchased | | | Written | | | Currency | | | | | | | |
| | | Option | | | Option | | | Exchange | | | Swap | | | | |
Derivatives | | Contracts* | | | Contracts | | | Contracts | | | Contracts | | | Total | |
| Equity Contracts | | $ | 49,017 | | | $ | 117,637 | | | $ | — | | | $ | 1,159,697 | | | $ | 1,326,351 | |
| Foreign Exchange | | | | | | | | | | | | | | | | | | | | |
| Contracts | | | — | | | | — | | | | 115,718 | | | | — | | | | 115,718 | |
| Total | | $ | 49,017 | | | $ | 117,637 | | | $ | 115,718 | | | $ | 1,159,697 | | | $ | 1,442,069 | |
| * | The amounts disclosed are included in the realized gain (loss) on investments. |
Change in Unrealized Appreciation (Depreciation) on Derivatives
| | | | | | | | | Forward | | | | | | | |
| | | Purchased | | | Written | | | Currency | | | | | | | |
| | | Option | | | Option | | | Exchange | | | Swap | | | | |
Derivatives | | Contracts* | | | Contracts | | | Contracts | | | Contracts | | | Total | |
| Equity Contracts | | $ | 45,074 | | | $ | 89,729 | | | $ | — | | | $ | (123,866 | ) | | $ | 10,937 | |
| Foreign Exchange | | | | | | | | | | | | | | | | | | | | |
| Contracts | | | — | | | | — | | | | 59,670 | | | | — | | | | 59,670 | |
| Total | | $ | 45,074 | | | $ | 89,729 | | | $ | 59,670 | | | $ | (123,866 | ) | | $ | 70,607 | |
| * | The amounts disclosed are included in the change in unrealized appreciation (depreciation) on investments. |
The Merger Fund VL
NOTES TO THE FINANCIAL STATEMENTS (continued)
December 31, 2018
Note 3 — AGREEMENTS
The Fund’s investment adviser is Westchester Capital Management, LLC pursuant to an investment advisory agreement with the Adviser dated as of January 1, 2011 (the “Advisory Agreement”). Under the terms of the Advisory Agreement, the Adviser is entitled to receive a fee, calculated daily and payable monthly, at the annual rate of 1.25% of the Fund’s average daily net assets. Certain officers of the Fund are also officers of the Adviser. The Advisory Agreement was approved for an initial term of two years and thereafter will remain in effect from year to year provided that such continuance is specifically approved at least annually by the vote of a majority of the Fund’s Trustees who are not interested persons of the Adviser or the Fund or by a vote of a majority of the outstanding voting securities of the Fund. The Adviser has entered into an agreement with the Fund whereby the Adviser has agreed to reduce all or a portion of its management fee and, if necessary, to bear certain other expenses (to the extent permitted by the Internal Revenue Code of 1986, as amended, but not including brokerage commissions, dividends on securities sold short, borrow expenses on securities sold short, interest expense, taxes, acquired fund fees and expenses or extraordinary expenses) associated with operating the Fund to the extent necessary to limit the annualized expenses of the Fund to 1.40% of the Fund’s average daily net assets until December 31, 2019 (the “Expense Waiver and Reimbursement Agreement”). The Expense Waiver and Reimbursement Agreement permits the Adviser to recapture amounts that it waives or absorbs on behalf of the Fund at any time within three years of the end of the fiscal year in which the fee was reduced or waived or the expense was borne provided that doing so would not cause the Fund’s operating expenses for that year, excluding brokerage commissions, dividends on securities sold short, borrow expenses on securities sold short, interest expense, taxes, acquired fund fees and expenses or extraordinary expenses, to exceed 1.40%. The Expense Waiver and Reimbursement Agreement may be terminated at anytime by the Board. For the year ended December 31, 2018, the Adviser reimbursed $255,478 of advisory fees to the Fund.
Reimbursed expenses subject to potential recovery by year of expiration are as follows:
Year of Expiration | Potential Recovery |
| 12/31/19 | $234,695 |
| 12/31/20 | $233,117 |
| 12/31/21 | $255,478 |
The Merger Fund VL
NOTES TO THE FINANCIAL STATEMENTS (continued)
December 31, 2018
Note 3 — AGREEMENTS (continued)
U.S. Bancorp Fund Services, LLC, doing business as U.S. Bank Global Fund Services (“Fund Services”) and a subsidiary of U.S. Bancorp, a publicly held bank holding company, serves as transfer agent, administrator, accountant, dividend paying agent and shareholder servicing agent for the Fund. U.S. Bank, N.A. serves as custodian for the Fund.
Note 4 — SHARES OF BENEFICIAL INTEREST
The Board of Trustees has the authority to issue an unlimited amount of shares of beneficial interest without par value.
Changes in shares of beneficial interest were as follows:
| | | Year Ended | | | Year Ended | |
| | | December 31, 2018 | | | December 31, 2017 | |
| | | Shares | | | Amount | | | Shares | | | Amount | |
| Issued | | | 1,435,637 | | | $ | 16,130,753 | | | | 429,106 | | | $ | 4,598,945 | |
| Issued as reinvestment | | | | | | | | | | | | | | | | |
| of dividends | | | 63,142 | | | | 715,400 | | | | — | | | | — | |
| Redeemed | | | (794,969 | ) | | | (8,921,561 | ) | | | (488,783 | ) | | | (5,225,518 | ) |
| Net Increase (Decrease) | | | 703,810 | | | $ | 7,924,592 | | | | (59,677 | ) | | $ | (626,573 | ) |
Note 5 — INVESTMENT TRANSACTIONS AND INCOME TAX INFORMATION
Purchases and sales of securities for the year ended December 31, 2018 (excluding short-term investments, short-term options, forward currency contracts, swap contracts and short positions) aggregated $55,885,411 and $43,119,516, respectively. There were no purchases or sales of long-term U.S. Government securities.
At December 31, 2018, the components of accumulated earnings gains (losses) on a tax basis were as follows:
| Cost of investments* | | $ | 33,596,390 | |
| Gross unrealized appreciation | | | 1,965,845 | |
| Gross unrealized depreciation | | | (2,702,632 | ) |
| Net unrealized depreciation | | $ | (736,787 | ) |
| Undistributed ordinary income | | $ | 1,832,824 | |
| Undistributed long-term capital gain | | | 788,866 | |
| Total distributable earnings | | $ | 2,621,690 | |
| Other accumulated losses | | | (72,427 | ) |
| Total accumulated gains | | $ | 1,812,476 | |
| * | Represents cost (including derivative contracts) for federal income tax purposes and differs from the cost for financial reporting purposes due to wash sales, PFIC mark to market, and unsettled short losses. |
The Merger Fund VL
NOTES TO THE FINANCIAL STATEMENTS (continued)
December 31, 2018
Note 5 — INVESTMENT TRANSACTIONS AND INCOME TAX INFORMATION (continued)
GAAP requires that certain components of net assets relating to permanent differences be reclassified between financial and tax reporting. Permanent differences are primarily related to foreign currency transactions and swap treatment. These reclassifications have no effect on net assets or net asset value per share. For the year ended December 31, 2018, the following table shows the reclassifications made:
Distributable Earnings | Paid-in Capital |
$507 | $(507) |
The tax components of dividends paid during the year ended December 31, 2018 and December 31, 2017 were as follows:
| | | 2018 | | | 2017 | |
| Ordinary Income | | $ | 715,400 | | | $ | — | |
| Long-Term Capital Gains | | | — | | | | — | |
| Total Distributions Paid | | $ | 715,400 | | | $ | — | |
The Fund designated as long-term capital gain dividend, pursuant to Internal Revenue Case Section 852(b)(3), the amount necessary to reduce the earnings and profits of the Fund related to net capital gain to zero for the tax year ended December 31, 2018. As of December 31, 2018, the Fund had no post-October losses deferred. As of December 31, 2018, the Fund had no short-term capital loss carryover or long-term capital loss carryover.
Note 6 — OFFSETTING ASSETS AND LIABILITIES
The Fund is subject to various Master Netting Arrangements, which govern the terms of certain transactions with select counterparties. The Master Netting Arrangements allow the Fund to close out and net its total exposure to a counterparty in the event of a default with respect to all the transactions governed under a single agreement with a counterparty. The Master Netting Arrangements also specify collateral posting arrangements at pre-arranged exposure levels. Under the Master Netting Arrangements, collateral is routinely transferred if the total net exposure to certain transactions (net of existing collateral already in place) governed under the relevant Master Netting Arrangement with a counterparty in a given account exceeds a specified threshold depending on the counterparty and the type of Master Netting Arrangement.
The Merger Fund VL
NOTES TO THE FINANCIAL STATEMENTS (continued)
December 31, 2018
Note 6 — OFFSETTING ASSETS AND LIABILITIES (continued)
| | | | | | | | Gross | | | Net | | | | | | | | | | |
| | | | | | | | Amounts | | | Amounts | | | | | | | | | | |
| | | | | | | | Offset | | | Presented | | | Gross Amounts not | | | | |
| | | | | Gross | | | in the | | | in the | | | offset in the Statement | | | | |
| | | | | Amounts of | | | Statement | | | Statement | | | of Assets and Liabilities | | | | |
| | | | | Recognized | | | of Assets | | | of Assets | | | | | | Collateral | | | | |
| | | | | Assets/ | | | and | | | and | | | Financial | | | Received/ | | | Net | |
| | | | | Liabilities | | | Liabilities | | | Liabilities | | | Instruments | | | Pledged* | | | Amount | |
| Assets: | | | | | | | | | | | | | | | | | | | |
| Description | | | | | | | | | | | | | | | | | | | |
| Forward Currency | | | | | | | | | | | | | | | | | | | |
| Exchange | | | | | | | | | | | | | | | | | | | |
| Contracts** | | | $ | 17,236 | | | $ | 5,748 | | | $ | 11,488 | | | $ | — | | | $ | — | | | $ | 11,488 | |
| Swap Contracts — | | | | | | | | | | | | | | | | | | | | | | | | | |
| Bank of America | | | | | | | | | | | | | | | | | | | | | | | | | |
| Merrill Lynch | | | | | | | | | | | | | | | | | | | | | | | | | |
| & Co., Inc. | | | | 113,002 | | | | 3,520 | | | | 109,482 | | | | — | | | | — | | | | 109,482 | |
| Swap Contracts — | | | | | | | | | | | | | | | | | | | | | | | | | |
| JPMorgan Chase | | | | | | | | | | | | | | | | | | | | | | | | | |
| & Co., Inc. | | | | 20,268 | | | | 858 | | | | 19,410 | | | | — | | | | — | | | | 19,410 | |
| Swap Contracts — | | | | | | | | | | | | | | | | | | | | | | | | | |
| Goldman, | | | | | | | | | | | | | | | | | | | | | | | | | |
| Sachs & Co. | | | | 747 | | | | 351 | | | | 396 | | | | — | | | | — | | | | 396 | |
| | | | | $ | 151,253 | | | $ | 10,477 | | | $ | 140,776 | | | $ | — | | | $ | — | | | $ | 140,776 | |
| | | | | | | | | | | | | | | | | | | | | | | | | | | |
| Liabilities: | | | | | | | | | | | | | | | | | | | | | | | | | |
| Description | | | | | | | | | | | | | | | | | | | | | | | | | |
| Written Option | | | | | | | | | | | | | | | | | | | | | | | | | |
| Contracts** | | | $ | 46,386 | | | $ | — | | | $ | 46,386 | | | $ | — | | | $ | 46,386 | | | $ | — | |
| Forward Currency | | | | | | | | | | | | | | | | | | | | | | | | | |
| Exchange | | | | | | | | | | | | | | | | | | | | | | | | | |
| Contracts** | | | | 5,748 | | | | 5,748 | | | | — | | | | — | | | | — | | | | — | |
| Swap Contracts — | | | | | | | | | | | | | | | | | | | | | | | | | |
| Bank of America | | | | | | | | | | | | | | | | | | | | | | | | | |
| Merrill Lynch | | | | | | | | | | | | | | | | | | | | | | | | | |
| & Co., Inc. | | | | 3,520 | | | | 3,520 | | | | — | | | | — | | | | — | | | | — | |
| Swap Contracts — | | | | | | | | | | | | | | | | | | | | | | | | | |
| JPMorgan Chase | | | | | | | | | | | | | | | | | | | | | | | | | |
| & Co., Inc. | | | | 858 | | | | 858 | | | | — | | | | — | | | | — | | | | — | |
| Swap Contracts — | | | | | | | | | | | | | | | | | | | | | | | | | |
| Goldman, | | | | | | | | | | | | | | | | | | | | | | | | | |
| Sachs & Co. | | | | 351 | | | | 351 | | | | — | | | | — | | | | — | | | | — | |
| | | | | $ | 56,863 | | | $ | 10,477 | | | $ | 46,386 | | | $ | — | | | $ | 46,386 | | | $ | — | |
| * | | In some instances, the actual collateral received/pledged may be more than amount shown. |
| ** | | JPMorgan Chase & Co., Inc. is the counterparty for all open forward currency exchange contracts and prime broker for all written option contracts held by the Fund as of December 31, 2018. |
The Merger Fund VL
NOTES TO THE FINANCIAL STATEMENTS (continued)
December 31, 2018
Note 7 — ACCOUNTING PRONOUNCEMENTS
In March 2017, the Financial Accounting Standards Board (the “FASB”) issued Accounting Standards Update No. 2017-08, Receivables — Nonrefundable Fees and Other Costs (Subtopic 310-20): Premium Amortization on Purchased Callable Debt Securities (the “ASU No. 2017-08”). The amendments in the ASU shorten the amortization period for certain callable debt securities, held at a premium, to be amortized to the earliest call date. The ASU No. 2017-08 does not require an accounting change for securities held at a discount; which continues to be amortized to maturity. The ASU No. 2017-08 is effective for fiscal years and interim periods within those fiscal years beginning after December 15, 2018. Management is currently evaluating the impact these changes will have on the Fund’s financial statements and disclosures.
In August 2018, the FASB issued ASU 2018-13, Fair Value Measurement (Topic 820): Disclosure Framework—Changes to the Disclosure Requirements for Fair Value Measurement (the “ASU 2018-13”). The primary focus of the ASU 2018-13 is to improve the effectiveness of the disclosure requirements for fair value measurements. The changes affect all companies that are required to include fair value measurement disclosures. In general, the amendments in the ASU 2018-13 are effective for all entities for fiscal years and interim periods within those fiscal years, beginning after December 15, 2019. An entity is permitted to early adopt the removed or modified disclosures upon the issuance of ASU 2018-13 and may delay adoption of the additional disclosures, which are required for public companies only, until their effective date. Management has evaluated the impact of these changes and has incorporated these changes, as applicable, to the Fund’s financial statements and disclosures here and within.
Note 8 — SUBSEQUENT EVENTS
Management has evaluated events and transactions occurring after December 31, 2018 through the date that the financial statements were issued, and has determined that no additional disclosure in the financial statements is required.
REPORT OF INDEPENDENT REGISTERED PUBLIC ACCOUNTING FIRM
To the Board of Trustees and Shareholders of The Merger Fund VL:
Opinion on the Financial Statements
We have audited the accompanying statement of assets and liabilities, including the schedule of investments of The Merger Fund VL (the "Fund") as of December 31, 2018, the related statement of operations for the year ended December 31, 2018, the statements of changes in net assets for each of the two years in the period ended December 31, 2018, including the related notes, and the financial highlights for each of the five years in the period ended December 31, 2018 (collectively referred to as the “financial statements”). In our opinion, the financial statements present fairly, in all material respects, the financial position of the Fund as of December 31, 2018, the results of its operations for the year then ended, the changes in its net assets for each of the two years in the period ended December 31, 2018 and the financial highlights for each of the five years in the period ended December 31, 2018 in conformity with accounting principles generally accepted in the United States of America.
Basis for Opinion
These financial statements are the responsibility of the Fund’s management. Our responsibility is to express an opinion on the Fund’s financial statements based on our audits. We are a public accounting firm registered with the Public Company Accounting Oversight Board (United States) (PCAOB) and are required to be independent with respect to the Fund in accordance with the U.S. federal securities laws and the applicable rules and regulations of the Securities and Exchange Commission and the PCAOB.
We conducted our audits of these financial statements in accordance with the standards of the PCAOB. Those standards require that we plan and perform the audit to obtain reasonable assurance about whether the financial statements are free of material misstatement, whether due to error or fraud.
Our audits included performing procedures to assess the risks of material misstatement of the financial statements, whether due to error or fraud, and performing procedures that respond to those risks. Such procedures included examining, on a test basis, evidence regarding the amounts and disclosures in the financial statements. Our audits also included evaluating the accounting principles used and significant estimates made by management, as well as evaluating the overall presentation of the financial statements. Our procedures included confirmation of securities owned as of December 31, 2018 by correspondence with the custodian, agent banks, and brokers; when replies were not received from brokers, we performed other auditing procedures. We believe that our audits provide a reasonable basis for our opinion.
New York, New York
February 27, 2019
We have served as the auditor of one or more investment companies in Westchester Capital Management (or its predecessor) since 1995.
BOARD APPROVAL OF INVESTMENT ADVISORY AGREEMENTS
(Unaudited)
Each year, the Board of Trustees of each of The Merger Fund, The Merger Fund VL, and Westchester Capital Funds (together, the “Board”), including a majority of the Trustees who are not interested persons of The Merger Fund, The Merger Fund VL, and Westchester Capital Funds (together, the “Independent Trustees”), is required to determine whether to continue the advisory agreements for each of The Merger Fund, The Merger Fund VL, WCM Alternatives: Event-Driven Fund, and WCM Alternatives: Credit Event Fund, respectively. In November 2018, the Board and the Independent Trustees approved the continuation of The Merger Fund’s, The Merger Fund VL’s, WCM Alternatives: Event-Driven Fund’s, and WCM Alternatives: Credit Event Fund’s (each, a “Fund” and, together, the “Funds”) advisory arrangements with Westchester Capital Management, LLC (the “Adviser”) (collectively, the “Agreements”) for an additional one-year period. A summary of the material factors and conclusions that formed the basis for the approval by the Board and the Independent Trustees are discussed below.
Review Process
The Investment Company Act of 1940, as amended, requires that the Board request and evaluate, and that the Adviser furnish, such information as may reasonably be necessary to evaluate the terms of the Agreements. The Independent Trustees began their formal review process in the summer of 2018 by compiling a request for information that sought a wide range of information the Independent Trustees believed might be necessary to evaluate the terms of the Funds’ Agreements. The Independent Trustees were assisted in compiling that information request by counsel to the Independent Trustees.
Following receipt of the Adviser’s response to their information request, the Independent Trustees evaluated all of the information available to them on a Fund-by-Fund basis, and their deliberations were made separately in respect of each Fund. Throughout the review process, the Independent Trustees were advised by their counsel and they also discussed their obligations with respect to the continuation of the Agreements in private sessions with their counsel. The Independent Trustees and the Board, in determining to approve the continuation of the Agreements, did not identify any particular information that was all-important or controlling, and each Trustee attributed different weights to the various factors. The following summary describes some, but not all, of the factors considered by the Board and the Independent Trustees.
Materials Reviewed
During the course of each year, the Board receives a wide variety of materials relating to the services provided by the Adviser and the Funds’
BOARD APPROVAL OF INVESTMENT ADVISORY AGREEMENTS
(continued) (Unaudited)
other service providers, including reports on: each Fund’s investment results; portfolio construction; portfolio composition; portfolio trading practices; and other information relating to the nature, extent and quality of services provided by the Adviser to the Funds. In addition, in connection with its annual consideration of the Agreements, the Board requested and reviewed supplementary information regarding the terms of the Agreements, the Funds’ investment results, advisory fee and total expense comparisons, financial and profitability information regarding the Adviser and its affiliates, descriptions of various functions undertaken by the Adviser, such as compliance monitoring, information about the personnel providing investment management services to the Funds, and information regarding the terms of the Adviser’s other advisory relationships.
The Board also requested and evaluated performance and expense information for other investment companies that was compiled and presented by Broadridge Financial Solutions, Inc. (“Broadridge”). During the review process, the Board received information regarding the methodology used in compiling Broadridge’s report and the process for how each Fund’s peer group was determined. The Board and the Independent Trustees also considered information regarding so-called “fall-out” benefits to the Adviser and its affiliates due to the Adviser’s relationships with the Funds. After consideration of all of the information presented to it, the Board concluded that it had received all of the information it believed was reasonably necessary to assess the terms of each Agreement and determine whether to renew each Agreement.
Nature, Extent and Quality of Services
Nature and Extent of Services – In considering whether to continue the Agreements for an additional year, the Board and the Independent Trustees evaluated the nature and extent of the services provided by the Adviser. The Board and the Independent Trustees considered information concerning the investment philosophy and investment process used by the Adviser in managing the Funds. In this context, the Board and the Independent Trustees considered the in-house research capabilities of the Adviser as well as other resources available to the Adviser, including research services available to the Adviser as a result of securities transactions effected for the Funds and other investment advisory clients of the Adviser. The Trustees considered the scope and quality of services provided by the Adviser under the Agreements, and noted that the scope of work required of the Adviser to perform the contracted-for and other necessary related services had expanded over time as a result of regulatory and other developments. In this respect, the Board also considered the oversight functions performed by officers of the Funds
BOARD APPROVAL OF INVESTMENT ADVISORY AGREEMENTS
(continued) (Unaudited)
who were supplied by and employees of the Adviser and compensated by the Adviser. The Board and the Independent Trustees also considered the managerial and financial resources available to the Adviser.
Quality of Services – The Board and the Independent Trustees considered the quality of the services provided by the Adviser and the quality of the resources of the Adviser available to the Funds. The Board and the Independent Trustees considered the specialized experience, expertise and professional qualifications of the personnel of the Adviser, including that the Adviser was among a limited number of investment advisers with a long track record managing merger arbitrage and event-driven strategies within the context of a registered mutual fund. The Board and the Independent Trustees considered the complexity of managing the Funds’ strategies relative to other types of funds. The Board and the Independent Trustees also received and reviewed information regarding the non-portfolio management services provided to the Funds by the Adviser in support of the Funds’ operations. The Trustees also considered the personnel who had been retained by the Adviser over recent years to maintain and potentially enhance the level of services provided to the Funds. The Board and the Independent Trustees also considered whether the Funds operated within their investment objectives and their record of compliance with their investment restrictions.
In their evaluation of the quality of the services provided by the Adviser, the Board and the Independent Trustees considered the performance of the Funds. The Board and the Independent Trustees reviewed information comparing the Funds’ historical performance to relevant market indices and to performance information for other investment companies with similar investment strategies over the one-, three-, five- and ten-year periods (where applicable) ended August 31, 2018. The Board considered that The Merger Fund ranked in the first or second quartile for each of the one-, three-, and five-year periods ended August 31, 2018, and it outperformed the only other fund shown in its peer group over the ten-year period ended August 31, 2018. The Board also considered that The Merger Fund outperformed its benchmark index, the BofA Merrill Lynch 3-Month U.S. Treasury Bill Index, over the one-, three-, five-, and ten-year periods ended August 31, 2018. The Board considered that The Merger Fund VL ranked in the first or second quartile of its peer group over the one-, three-, and five- periods ended August 31, 2018 and it outperformed its only other close peer shown over the ten-year period ended August 31, 2018. The Board also considered that The Merger Fund VL outperformed its benchmark, the BofA Merrill Lynch 3-Month U.S. Treasury Bill Index, over the one-, three-, five-, and ten-year
BOARD APPROVAL OF INVESTMENT ADVISORY AGREEMENTS
(continued) (Unaudited)
periods ended August 31, 2018. The Board also considered that WCM Alternatives: Event-Driven Fund ranked in the second quartile of its peer group for the one- and three-year periods ended August 31, 2018. The Board also considered that WCM Alternatives: Credit Event Fund had been in operation for less than 1 year and had underperformed the ICE BofA Merrill Lynch 3-Month U.S. Treasury Bill Index for the 6-month and year-to-date periods ended September 30, 2018. The Trustees noted that they had considered the Adviser’s explanation in respect of the performance of WCM Alternatives: Credit Event Fund and had considered that the Fund had a limited operating history.
In all of their evaluations of relative performance, the Trustees noted that the report provided by Broadridge included a relatively small number of peer funds for The Merger Fund, The Merger Fund VL and WCM Alternatives: Event-Driven Fund (the Broadridge report did not include any comparative performance information for WCM Alternatives: Credit Event Fund), especially over longer-term periods, due to the limited number of registered mutual funds pursuing merger-arbitrage and/or event-driven investment strategies. In their evaluation of each Fund’s performance, including each Fund’s level of absolute performance over recent periods, the Trustees also considered, among other things, information the Adviser had provided regarding the market conditions affecting merger-arbitrage and event-driven strategies generally, the prevailing low interest rate environment generally, and the Funds’ historical relationship to interest rates, and that the Adviser had continued to deliver low volatility returns, with relatively low levels of correlation to the equity markets. The Board and the Independent Trustees concluded, within the context of their overall conclusions regarding each of the Agreements, that they were satisfied with the nature, extent and quality of the services provided by the Adviser and that each Fund’s performance record either supported the renewal of the Agreements or was over too short of a period to cause the Trustees to conclude not to renew the Agreement.
Management Fees and Expenses
The Board and the Independent Trustees reviewed information, including comparative information provided by Broadridge, regarding the advisory fees paid to the Adviser and the total expenses borne by the Funds. They considered the Funds’ advisory fees relative to their peer groups. In this regard, the Independent Trustees noted that each Fund’s net advisory fees and net operating expenses, after taking into account any expense limitation arrangements or advisory fee waivers, remained competitive with its peers. The Independent Trustees noted The Merger
BOARD APPROVAL OF INVESTMENT ADVISORY AGREEMENTS
(continued) (Unaudited)
Fund’s net advisory fees and net operating expenses (Investor Class) were at or below the median of its peer group. The Independent Trustees also noted The Merger Fund VL’s net advisory fees and net operating expenses were at or below the median of its peer group. The Independent Trustees noted that WCM Alternatives: Event-Driven Fund’s net advisory fees were above the median of its peer group, though in line with a number of its peers, and that although the Fund’s net operating expenses (Investor Class) were also above median, that was driven primarily by the Fund’s non-advisory fee expenses and the varying level of subsidies offered by the sponsors of the other funds in the peer group. The Independent Trustees also noted that WCM Alternatives: Credit Event Fund’s net advisory fees and net operating expenses (Institutional Class) were above at its peer group median, though each were in line with a number of its peers.
The Board and the Independent Trustees also considered the fees that the Adviser and its affiliates charge other clients with investment strategies similar to the Funds, including where an account is subject to a performance-based fee. The Board and the Independent Trustees considered information provided by the Adviser describing the differences in services provided to these other clients. In this regard, the Adviser noted that the services provided to these other clients typically consist nearly exclusively or primarily of portfolio management services. The Adviser described the additional level of services provided to the Funds under the terms of the Funds’ advisory arrangements or otherwise, such as supplying Fund management, general coordination of the Funds’ other service providers, the provision of middle and back office support functions, provision of certain compliance and regulatory functions, and quarterly preparation and attendance of meetings with the Board, as well as the greater financial obligations and entrepreneurial risks the Adviser undertakes in respect of sponsoring a registered mutual fund. The Board and the Independent Trustees concluded, within the context of their overall conclusions regarding each of the Agreements, that the fees charged under the Agreements represent reasonable compensation to the Adviser in light of the services provided.
Profitability and Possible Economies of Scale
Profitability – The Board and the Independent Trustees reviewed information regarding the cost of services provided by the Adviser and the profitability (before distribution expenses and taxes) of the Adviser’s relationship with each Fund. The Board noted that, in reporting on its profitability, the Adviser had included an estimated expense for compensation of the Funds’ portfolio managers because the Funds’ portfolio managers are principal owners of the Adviser and do not receive
BOARD APPROVAL OF INVESTMENT ADVISORY AGREEMENTS
(continued) (Unaudited)
a salary or bonus. The Board noted that the Adviser would have incurred significant compensation expense if it instead had to hire equivalently qualified portfolio managers to perform the services performed by the owners, which costs would significantly reduce the Adviser’s profitability. In evaluating the Adviser’s reported profitability, the Independent Trustees considered that certain of the information provided by the Adviser was necessarily estimated and that preparing the related profitability information involved certain assumptions and allocations that were imprecise. The Board and the Independent Trustees recognized that the probative value of profitability information may be limited because a wide range of comparative information for peer advisers often is not generally available and it can be affected by numerous factors, including the structure of the particular adviser, the types of funds it manages, its business mix, the efficiency of an adviser’s operations, numerous assumptions about allocations and the adviser’s cost of capital. The Independent Trustees concluded that the Adviser’s profitability with respect to The Merger Fund may be relatively high in comparison to other mutual funds, but they noted that the Adviser was among a limited number of investment advisers with an extensive history of providing competitive merger-arbitrage portfolio management services within a registered mutual fund vehicle and that the Fund’s net advisory fees and net operating expenses remained in line with or below its close peers.
In addition, the Board and the Independent Trustees considered information regarding the direct and indirect benefits the Adviser receives as a result of its relationship with the Funds, including research purchased with soft dollar credits earned from portfolio transactions effected on behalf of the Funds (soft dollar arrangements) and reputational benefits.
Economies of Scale – The Board and the Independent Trustees reviewed the extent to which the Adviser may realize economies of scale in managing the Funds. The Board and the Independent Trustees concluded within the context of their overall conclusions regarding each of the Agreements that the Adviser’s level of profitability from its relationship with each Fund was not excessive in light of, among other things, the Funds’ competitive advisory fees and expense ratios. The Trustees also considered that the Adviser proposed to continue the expense limitation agreements applicable to each Fund (other than The Merger Fund) and the advisory fee waiver in respect of The Merger Fund for another one-year period. The Independent Trustees concluded that those measures were reasonably designed to result in the sharing of economies of scale realized by the Adviser, if any, with the Funds and their shareholders.
BOARD APPROVAL OF INVESTMENT ADVISORY AGREEMENTS
(continued) (Unaudited)
Conclusions
Based on their review, including their consideration of each of the factors referred to above, the Board and the Independent Trustees concluded that the terms of the Agreements, including the fees payable to the Adviser, are fair and reasonable to the Funds and their shareholders given the scope and quality of the services provided to the Funds and such other considerations as the Independent Trustees considered relevant in the exercise of their reasonable business judgment and that the continuation of the Agreements was in the best interests of the Funds and their shareholders. Accordingly, the Board and Independent Trustees unanimously approved the continuation of the Agreements.
INFORMATION ABOUT TRUSTEES AND OFFICERS
The business and affairs of the Fund are managed under the direction of the Fund’s Board of Trustees. Information pertaining to the Fund’s Trustees and Officers is set forth below. The Statement of Additional Information includes additional information about the Fund’s Trustees and Officers and is available, without charge, upon request by calling 1-800-343-8959.
| | | | | # of | Other |
| | | Term of | | Portfolios | Directorships |
| | | Office | | in Fund | Held by |
| | | and | Principal | Complex | Trustee |
| Name, | Position(s) | Length | Occupation(s) | Overseen | During |
| Address and | Held with | of Time | During the | by | the Past |
Year of Birth | the Fund | Served | Past Five Years | Trustee** | Five Years |
| Interested Trustees | | | | | |
| | | | | | |
| Roy Behren* | Co-President | Indefinite, | Co-Portfolio Manager | 4 | None |
| Westchester Capital | and | since | and Co-President of | | |
| Management, LLC | Treasurer; | 2011 | Westchester Capital | | |
| 100 Summit Lake Drive | Trustee | | Management, LLC, the | | |
| Valhalla, NY 10595 | | | Fund’s Adviser, since | | |
| Year of Birth: 1960 | | | 2011. | | |
| | | | | | |
| Michael T. Shannon* | Co-President | Indefinite, | Co-Portfolio Manager | 4 | None |
| Westchester Capital | and | since | and Co-President of | | |
| Management, LLC | Trustee | 2011 | Westchester Capital | | |
| 100 Summit Lake Drive | | | Management, LLC, the | | |
| Valhalla, NY 10595 | | | Fund’s Adviser, since | | |
| Year of Birth: 1966 | | | 2011. | | |
| | | | | | |
| Non-Interested Trustees | | | | | |
| | | | | | |
| Barry Hamerling | Independent | Indefinite, | Managing Partner of | 4 | Former |
| c/o Westchester | Trustee | since | Premium Ice Cream of | | Trustee of |
| Capital | | 2007 | America since 1995. | | AXA Premier |
| Management, LLC | | | Managing Partner of | | VIP Trust |
| 100 Summit Lake Drive | | | B&J Freeport since | | |
| Valhalla, NY 10595 | | | 1990. | | |
| Year of Birth: 1946 | | | | | |
| | | | | | |
| Richard V. Silver | Independent | Indefinite, | Consultant with AXA | 4 | None |
| c/o Westchester | Trustee | since | Equitable Life | | |
| Capital | | 2013 | Insurance Company | | |
| Management, LLC | | | from May 2012 to | | |
| 100 Summit Lake Drive | | | April 2013. | | |
| Valhalla, NY 10595 | | | | | |
| Year of Birth: 1955 | | | | | |
| | | | | | |
| Christianna Wood | Independent | Indefinite, | Chief Executive Officer | 4 | Director of |
| c/o Westchester | Trustee | since | and President of Gore | | H&R Block |
| Capital | | 2013 | Creek Capital, Ltd. | | Corporation; |
| Management, LLC | | | since August 2009. | | Director of |
| 100 Summit Lake Drive | | | | | Grange |
| Valhalla, NY 10595 | | | | | Insurance; |
| Year of Birth: 1959 | | | | | Trustee of |
| | | | | | the Delaware |
| | | | | | Funds |
INFORMATION ABOUT TRUSTEES AND OFFICERS (continued)
| | | | | # of | Other |
| | | Term of | | Portfolios | Directorships |
| | | Office | | in Fund | Held by |
| | | and | Principal | Complex | Trustee |
| Name, | Position(s) | Length | Occupation(s) | Overseen | During |
| Address and | Held with | of Time | During the | by | the Past |
Year of Birth | the Fund | Served | Past Five Years | Trustee** | Five Years |
| Officers | | | | | |
| | | | | | |
| Bruce Rubin | Vice | One-year | Chief Operating | N/A | N/A |
| Westchester Capital | President, | terms, | Officer of Westchester | | |
| Management, LLC | Chief | since | Capital Management, | | |
| 100 Summit Lake Drive | Compliance | 2010 | LLC, the Fund’s Adviser, | | |
| Valhalla, NY 10595 | Officer and | | since 2010. | | |
| Year of Birth: 1959 | Anti-Money | | | | |
| | Laundering | | | | |
| | Compliance | | | | |
| | Officer | | | | |
| | | | | | |
| Abraham R. Cary | Secretary | One-year | Head of Trading of | N/A | N/A |
| Westchester Capital | | terms, | Westchester Capital | | |
| Management, LLC | | since | Management, LLC, the | | |
| 100 Summit Lake Drive | | 2012 | Fund’s Adviser, since | | |
| Valhalla, NY 10595 | | | 2011. | | |
| Year of Birth: 1975 | | | | | |
| * | | Denotes a trustee who is an “interested person” (as that term is defined in Section 2(a)(19) of the Investment Company Act of 1940, as amended) of the Fund or of the Adviser. Messrs. Behren and Shannon are deemed to be interested persons because of their affiliation with the Fund’s investment adviser, Westchester Capital Management, LLC, and because they are officers of the Fund. |
| ** | | The fund complex consists of the Fund, The Merger Fund, WCM Alternatives: Event-Driven Fund and WCM Alternatives: Credit Event Fund. |
The Merger Fund VL
ADDITIONAL INFORMATION (Unaudited)
For the fiscal year ended December 31, 2018, certain dividends paid by the Fund may be subject to a maximum tax rate of 15%, as provided for by the Jobs and Growth Tax Relief Reconciliation Act of 2003. The percentage of dividends declared from ordinary income designated as qualified dividend income for the fiscal year ended December 31, 2018 was 0.00% for the Fund.
For corporate shareholders, the percent of ordinary income distributions qualifying for the corporate dividends received deduction for the fiscal year ended December 31, 2018 was 0.00% for the Fund.
The percentage of taxable ordinary income distributions that are designated as short-term capital gain distributions under Internal Revenue Code Section 871(k)(2)(c) for the fiscal year ended December 31, 2018 was 61.57% for the Fund.
AVAILABILITY OF PROXY VOTING INFORMATION
Information regarding how the Fund generally votes proxies relating to portfolio securities may be obtained without charge by calling the Fund’s Transfer Agent at 1-800-343-8959 or by visiting the SEC’s website at www.sec.gov. Information regarding how the Fund voted proxies during the most recent 12-month period ended June 30 is available on the SEC’s website or by calling the toll-free number listed above.
AVAILABILITY OF QUARTERLY PORTFOLIO SCHEDULE
The Fund files its complete schedule of portfolio holdings with the SEC for the first and third quarters of each fiscal year on Form N-Q or Part F of Form N-PORT (beginning with filings after March 31, 2019). The Fund’s Forms N-Q or Part F of Form N-PORT are available on the SEC’s website at www.sec.gov. Once filed, the most recent Form N-Q (or Form N-PORT) will also be available without charge, upon request, by calling 1-800-343-8959.
(This Page Intentionally Left Blank.)
Investment Adviser
Westchester Capital Management, LLC
100 Summit Lake Drive
Valhalla, NY 10595
(914) 741-5600
www.westchestercapitalfunds.com
Administrator, Transfer Agent, Accountant,
Dividend Paying Agent and Shareholder Servicing Agent
U.S. Bancorp Fund Services, LLC
615 East Michigan Street
P.O. Box 701
Milwaukee, WI 53201-0701
(800) 343-8959
Custodian
U.S. Bank, N.A.
1555 North Rivercenter Drive, Suite 302
Milwaukee, WI 53212
(800) 343-8959
Trustees
Roy Behren
Michael T. Shannon
Barry Hamerling
Richard V. Silver
Christianna Wood
Executive Officers
Roy Behren, Co-President and Treasurer
Michael T. Shannon, Co-President
Bruce Rubin, Vice President and
Chief Compliance Officer
Abraham R. Cary, Secretary
Counsel
Ropes & Gray LLP
1211 Avenue of the Americas
New York, NY 10036
Independent Registered
Public Accounting Firm
PricewaterhouseCoopers LLP
300 Madison Avenue
New York, NY 10017
Item 2. Code of Ethics.
The registrant has adopted a code of ethics that applies to the registrant’s principal executive officer and principal financial officer. The registrant has not granted any waivers from any provisions of the code of ethics during the period covered by this report. A copy of the registrant’s Code of Ethics is filed herewith. You may also receive a copy of the registrant’s Code of Ethics, free of charge, upon request by calling (800) 343-8959.
Item 3. Audit Committee Financial Expert.
The registrant’s board of trustees has determined that there is at least one audit committee financial expert serving on its audit committee. Barry Hamerling and Christianna Wood are the “audit committee financial experts” and are considered to be “independent” as each term is defined in Item 3 of Form N-CSR.
Item 4. Principal Accountant Fees and Services.
The registrant has engaged its principal accountant, PricewaterhouseCoopers LLP, to perform audit services, audit-related services, tax services and other services during the past two fiscal years. “Audit services” refer to performing an audit of the registrant's annual financial statements or services that are normally provided by the accountant in connection with statutory and regulatory filings or engagements for those fiscal years. “Audit-related services” refer to the assurance and related services by the principal accountant that are reasonably related to the performance of the audit. “Tax services” refer to professional services rendered by the principal accountant for tax compliance, tax advice, and tax planning. The following table details the aggregate fees billed or expected to be billed for each of the last two fiscal years for audit fees, audit-related fees, tax fees and other fees by the principal accountant.
| | FYE 12/31/2018 | FYE 12/31/2017 |
| Audit Fees | $45,575 | $45,575 |
| Audit-Related Fees | $ - | $ - |
| Tax Fees | $6,290 | $6,290 |
| All Other Fees | $ - | $ - |
The audit committee has adopted pre-approval policies and procedures that require the audit committee to pre‑approve all audit and non‑audit services of the registrant, including services provided to any entity affiliated with the registrant.
The percentage of fees billed by PricewaterhouseCoopers LLP applicable to non-audit services pursuant to waiver of pre-approval requirement were as follows:
| | FYE 12/31/2018 | FYE 12/31/2017 |
| Audit-Related Fees | 0% | 0% |
| Tax Fees | 0% | 0% |
| All Other Fees | 0% | 0% |
All of the principal accountant’s hours spent on auditing the registrant’s financial statements were attributed to work performed by full‑time permanent employees of the principal accountant.
The following table indicates the non-audit fees billed or expected to be billed by the registrant’s accountant for services to the registrant and to the registrant’s investment adviser (and any other controlling entity, etc.—not including any sub-advisers) for the last two years. The audit committee of the board of trustees has considered whether the provision of non-audit services that were rendered to the registrant's investment adviser is compatible with maintaining the principal accountant's independence and has concluded that the provision of such non-audit services by the accountant has not compromised the accountant’s independence.
| Non-Audit Related Fees | FYE 12/31/2018 | FYE 12/31/2017 |
| Registrant | - | - |
| Registrant’s Investment Adviser | - | - |
Item 5. Audit Committee of Listed Registrants.
Not applicable.
Item 6. Investments.
The registrant’s Schedule of Investments is included as part of the report to shareholders filed under Item 1 of this Form.
Item 7. Disclosure of Proxy Voting Policies and Procedures for Closed-End Management Investment Companies.
Not applicable to open-end investment companies.
Item 8. Portfolio Managers of Closed-End Management Investment Companies.
Not applicable to open-end investment companies.
Item 9. Purchases of Equity Securities by Closed‑End Management Investment Company and Affiliated Purchasers.
Not applicable to open-end investment companies.
Item 10. Submission of Matters to a Vote of Security Holders.
There have been no material changes to the procedures by which shareholders may recommend nominees to the registrant’s board of trustees.
Item 11. Controls and Procedures.
| (a) | The registrant’s Co-Presidents/Chief Executive Officers and Treasurer/Chief Financial Officer have reviewed the registrant's disclosure controls and procedures (as defined in Rule 30a-3(c) under the Investment Company Act of 1940 (the “Act”)) as of a date within 90 days of the filing of this report, as required by Rule 30a-3(b) under the Act and Rules 13a-15(b) or 15d‑15(b) under the Securities Exchange Act of 1934. Based on their review, such officers have concluded that the disclosure controls and procedures are effective in ensuring that information required to be disclosed in this report is appropriately recorded, processed, summarized and reported and made known to them by others within the registrant and by the registrant’s service provider. |
| (b) | There were no changes in the registrant's internal control over financial reporting (as defined in Rule 30a-3(d) under the Act) that occurred during the second fiscal quarter of the period covered by this report that has materially affected, or is reasonably likely to materially affect, the registrant's internal control over financial reporting. |
Item 12. Disclosure of Securities Lending Activities for Closed-End Management Investment Companies.
Not applicable to open-end investment companies.
Item 13. Exhibits.
| (a) | (1) Any code of ethics or amendment thereto, that is the subject of the disclosure required by Item 2, to the extent that the registrant intends to satisfy Item 2 requirements through filing an exhibit. Filed herewith. |
(2) A separate certification for each principal executive officer and principal financial officer pursuant to Section 302 of the Sarbanes-Oxley Act of 2002. Filed herewith.
(3) Any written solicitation to purchase securities under Rule 23c‑1 under the Act sent or given during the period covered by the report by or on behalf of the registrant to 10 or more persons. Not applicable to open-end investment companies.
(4) Change in the registrant’s independent public accountant. Provide the information called for by Item 4 of Form 8-K under the Exchange Act (17 CFR 249.308). Unless otherwise specified by Item 4, or related to and necessary for a complete understanding of information not previously disclosed, the information should relate to events occurring during the reporting period. Not Applicable.
| (b) | Certifications pursuant to Section 906 of the Sarbanes‑Oxley Act of 2002. Furnished herewith. |
SIGNATURES
Pursuant to the requirements of the Securities Exchange Act of 1934 and the Investment Company Act of 1940, the registrant has duly caused this report to be signed on its behalf by the undersigned, thereunto duly authorized.
(Registrant) The Merger Fund VL
By (Signature and Title)* /s/ Michael T. Shannon
Michael T. Shannon, Co-President
Date 3/8/2019
By (Signature and Title)* /s/ Roy Behren
Roy Behren, Co-President and Treasurer
Date 3/8/2019
Pursuant to the requirements of the Securities Exchange Act of 1934 and the Investment Company Act of 1940, this report has been signed below by the following persons on behalf of the registrant and in the capacities and on the dates indicated.
By (Signature and Title)* /s/ Michael T. Shannon
Michael T. Shannon, Co-President
Date 3/8/2019
By (Signature and Title)* /s/ Roy Behren
Roy Behren, Co-President and Treasurer
Date 3/8/2019
* Print the name and title of each signing officer under his or her signature.