UNITED STATES
SECURITIES AND EXCHANGE COMMISSION
Washington, D.C. 20549
FORM N-CSR
CERTIFIED SHAREHOLDER REPORT OF REGISTERED
MANAGEMENT INVESTMENT COMPANIES
Investment Company Act file number 811-21279
The Merger Fund VL
(Exact name of registrant as specified in charter)
101 Munson Street
Greenfield, MA 01301-9683
(Address of principal executive offices) (Zip code)
Jennifer Fromm, Esq.
Vice President, Chief Legal Officer, Counsel and Secretary for Registrant
One Financial Plaza
Hartford, CT 06103-2608
(Name and address of agent for service)
Registrant’s telephone number, including area code: (800) 367-5877
Date of fiscal year end: December 31
Date of reporting period: December 31, 2021
Form N-CSR is to be used by management investment companies to file reports with the Commission not later than 10 days after the transmission to stockholders of any report that is required to be transmitted to stockholders under Rule 30e-1 under the Investment Company Act of 1940 (17 CFR 270.30e-1). The Commission may use the information provided on Form N-CSR in its regulatory, disclosure review, inspection, and policymaking roles.
A registrant is required to disclose the information specified by Form N-CSR, and the Commission will make this information public. A registrant is not required to respond to the collection of information contained in Form N-CSR unless the Form displays a currently valid Office of Management and Budget (“OMB”) control number. Please direct comments concerning the accuracy of the information collection burden estimate and any suggestions for reducing the burden to Secretary, Securities and Exchange Commission, 450 Fifth Street, NW, Washington, DC 20549-0609. The OMB has reviewed this collection of information under the clearance requirements of 44 U.S.C. § 3507.
Item 1. Reports to Stockholders.
(a) The Report to Shareholders is attached herewith.
| | |
ANNUAL REPORT THE MERGER FUND® VL | |  |
December 31, 2021
As permitted by regulations adopted by the Securities and Exchange Commission, you may no longer receive paper copies of The Merger Fund® VL’s shareholder reports from your insurance company unless you specifically request paper copies from the insurance company. If your insurance company elects to use this method of delivery, the shareholder reports will be made available on a website, and the insurance company will notify you by mail each time a report is posted and provide you with a website link to access the report. Instructions for requesting paper copies will be provided by your insurance company.
If you already elected to receive shareholder reports electronically, you will not be affected by this change and you need not take any action. You may elect to receive shareholder reports and other communications from the insurance company electronically by following the instructions provided by the insurance company.
You may elect to receive paper copies of all future shareholder reports free of charge from the insurance company. You can do so by contacting the insurance company. Your election to receive reports in paper likely will apply to all of the funds available in your insurance product, but you should ask your insurance company whether this is the case.
Not FDIC Insured • No Bank Guarantee • May Lose Value
Table of Contents
Proxy Voting Procedures and Voting Record (Form N-PX)
The subadviser votes proxies relating to portfolio securities in accordance with procedures that have been approved by the Board of Trustees of the Fund (“Trustees,” the “Board”). You may obtain a description of these procedures, along with information regarding how the Fund voted proxies during the most recent 12-month period ended June 30, free of charge, by calling toll-free 1-800-367-5877. This information is also available through the Securities and Exchange Commission’s (the “SEC”) website at http://www.sec.gov.
PORTFOLIO HOLDINGS INFORMATION
The Fund files a complete schedule of portfolio holdings with the SEC for the first and third quarters of each fiscal year as an exhibit to its reports on Form N-PORT-P. Form N-PORT-P is available on the SEC’s website at https://www.sec.gov.
This report is not authorized for distribution to prospective investors in the The Merger Fund VL unless preceded or accompanied by an effective prospectus which includes information concerning the sales charge, the Fund’s record and other pertinent information.
MESSAGE TO SHAREHOLDERS
To Shareholders of The Merger Fund® VL:

On October 1, 2021, Westchester Capital Management became an affiliated manager of Virtus Investment Partners and The Merger Fund® VL became part of the Virtus Funds, a family of distinctive investment options designed to help you preserve and grow your assets to meet your personal financial needs. I am pleased to welcome you to Virtus.
The relationship with Virtus Funds may be new, but the portfolio management team and process remain the same under the direction of Roy Behren and Michael Shannon, Co-Presidents and Co-Chief Investment Officers at Westchester Capital. We are excited that Roy, Mike and their team will continue to manage your Fund with the same dedication to seeking to deliver consistent, absolute returns through the disciplined execution of event-driven alternative investment strategies. Roy and Mike’s review of the markets and other factors that affected the performance of your Fund for the 12 months ended December 31, 2021 follows.
The Virtus team shares Westchester Capital’s unwavering commitment to exceptional client service and will be glad to address any questions you may have about The Merger Fund® VL at 800-367-5877.
Our entire team looks forward to serving you and your investment needs.
Sincerely,

George R. Aylward
President, The Merger Fund® VL
February 2022
Refer to the Fund Summary section for your Fund’s performance. Performance data quoted represents past results. Past performance is no guarantee of future results, and current performance may be higher or lower than the performance shown above. Investing involves risk, including the risk of loss of principal invested.
1
The Merger Fund® VL
DISCLOSURE OF FUND EXPENSES (Unaudited)
FOR THE SIX-MONTH PERIOD OF JULY 1, 2021 TO DECEMBER 31, 2021
We believe it is important for you to understand the impact of costs on your investment. All mutual funds have operating expenses. As an investor in The Merger Fund VL (“the Fund”), you may incur certain types of costs including investment advisory fees, and other expenses. For further information regarding applicable sales charges, see Note 1 in the Notes to Financial Statements. These examples are intended to help you understand your ongoing costs (in dollars) of investing in the Fund and to compare these costs with the ongoing costs of investing in other mutual funds. These examples are based on an investment of $1,000 invested at the beginning of the period and held for the entire six-month period. The Annualized Expense Ratios may be different from the expense ratios in the Financial Highlights which are for the fiscal year ended December 31, 2021.
Please note that the expenses shown in the accompanying tables are meant to highlight your ongoing costs only and do not reflect additional fees and expenses associated with the annuity or life insurance policy through which you invest. Therefore, the accompanying tables are useful in comparing ongoing costs only, and will not help you determine the relative total costs of owning different funds. In addition, if the annuity or life insurance policy costs were included, your costs would have been higher. The calculations assume no shares were bought or sold during the period. Your actual costs may have been higher or lower, depending on the amount of your investment and the timing of any purchases or redemptions.
Actual Expenses
The table below provides information about actual account values and actual expenses. You may use the information below, together with the amount you invested, to estimate the expenses that you paid over the period. Simply divide your account value by $1,000 (for example, an $8,600 account value divided by $1,000 = 8.6), then multiply the result by the number in the table under the heading entitled “Expenses Paid During Period” to estimate the expenses you paid on your account during this period.
| | | | | | | | | | | | | | | | |
| | | Annualized Net
Expense Ratio
12/31/21 | | | Beginning
Account Value
7/1/21 | | | Ending
Account Value
12/31/21 | | | Expenses Paid
During Period
7/1/2021-
12/31/21(1) | |
Actual Expenses(2)(3) | | | 1.56 | % | | $ | 1,000.00 | | | $ | 983.44 | | | $ | 7.80 | |
| (1) | Expenses are equal to the Fund’s annualized net expense ratio, multiplied by the average account value over the period, multiplied by 184/365 to reflect the one-half year period. |
| (2) | Based on the actual returns of (1.66)% for the six-month period ended December 31, 2021. |
| (3) | Excluding dividends and interest, borrowing expenses on securities sold short and professional fees related to tax reclaims processing, your actual cost of investment in the Fund would have been $7.00. |
You can find more information about the Fund’s expenses in the Financial Statements section that follows. For additional information on operating expenses and other shareholder costs, refer to the Fund’s prospectus.
Hypothetical Example for Comparison Purposes
The table below provides information about hypothetical account values and hypothetical expenses based on the Fund’s actual expense ratio and an assumed rate of return of 5% per year before expenses, which is not the Fund’s actual return. The hypothetical account values and expenses may not be used to estimate the actual ending account balance or expenses you paid for the period. You may use this information to compare the ongoing costs of investing in the Fund and other funds. To do so, compare these 5% hypothetical examples with the 5% hypothetical examples that appear in the shareholder reports of other mutual funds.
| | | | | | | | | | | | | | | | |
| | | Annualized Net
Expense Ratio
12/31/21 | | | Beginning
Account Value
7/1/21 | | | Ending
Account Value
12/31/21 | | | Expenses Paid
During Period
7/1/2021-
12/31/21(1) | |
Hypothetical Example for Comparison Purposes (5% return before expenses)(2) | | | 1.56 | % | | $ | 1,000.00 | | | $ | 1,017.34 | | | $ | 7.93 | |
| (1) | Expenses are equal to the Fund’s annualized net expense ratio, multiplied by the average account value over the period, multiplied by 184/365 to reflect the one-half year period. |
| (2) | Excluding dividends and interest, borrowing expenses on securities sold short and professional fees related to tax reclaims processing, your actual cost of investment in the Fund would have been $7.12. |
You can find more information about the Fund’s expenses in the Financial Statements section that follows. For additional information on operating expenses and other shareholder costs, refer to the Fund’s prospectus.
2
THE MERGER FUND® VL
KEY INVESTMENT TERMS (Unaudited)
DECEMBER 31, 2021
American Depositary Receipt (“ADR”)
Represents shares of foreign companies traded in U.S. dollars on U.S. exchanges that are held by a U.S. bank or a trust. Foreign companies use ADRs in order to make it easier for Americans to buy their shares.
Beta
Beta is a measure of the volatility – or systematic risk – of a security or portfolio compared to the market as a whole.
Bloomberg U.S. Aggregate Bond Index
The Bloomberg U.S. Aggregate Bond Index measures the U.S. investment-grade fixed-rate bond market. The index is calculated on a total return basis. The index is unmanaged, its returns do not reflect any fees, expenses, or sales charges, and it is not available for direct investment.
Exchange-Traded Fund (“ETF”)
An open-end fund that is traded on a stock exchange. Most ETFs have a portfolio of stocks or bonds that track a specific market index.
Federal Reserve (the “Fed”)
The Central Bank of the U.S., responsible for controlling the money supply, interest rates, and credit with the goal of keeping the U.S. economy and currency stable. Governed by a seven-member board, the system includes 12 regional Federal Reserve Banks, 25 branches, and all national and state banks that are part of the system.
The Global Industry Classification Standard (GICS)
The Global Industry Classification Standard is a method for assigning companies to a specific economic sector and industry group that best defines its business operations. It is one of two rival systems that are used by investors, analysts, and economists to compare competing companies.
ICE BofA 3-month U.S. Treasury Bill Index
The ICE BofA 3-month U.S. Treasury Bill Index measures performance of the three-month Treasury bill, based on monthly average auction rates. The index is calculated on a total return basis. The index is unmanaged, its returns do not reflect any fees, expenses, or sales charges, and is not available for direct investment.
Leveraged Loans
Leveraged loans (also known as bank, senior or floating-rate loans) consists of below investment-grade credit quality loans that are arranged by banks and other financial institutions to help companies finance acquisitions, recapitalizations, or other highly leveraged transactions. Such loans may be especially vulnerable to adverse changes in economic or market conditions, although they are senior in the capital structure which typically provides investors/lenders a degree of potential credit risk protection.
London Interbank Offered Rate (“LIBOR”)
A benchmark rate that some of the world’s leading banks charge each other for short-term loans and that serves as the first step to calculating interest rates on various loans throughout the world.
Morningstar U.S. Insurance Fund Event Driven Category Average
The Morningstar U.S. Insurance Fund Event Driven Category Average contains strategies that attempt to profit when security prices change in response to certain corporate actions, such as bankruptcies, mergers and acquisitions, emergence from bankruptcy, shifts in corporate strategy, and other atypical events. Activist shareholder and distressed investment strategies also fall into this category. These portfolios typically focus on equity securities but can invest across the capital structure. The category average is calculated on a total return basis with dividends reinvested. The category average is unmanaged and is not available for direct investment.
Prime Rate
The federal funds rate commercial banks charge their most creditworthy corporate customers.
Real Estate Investment Trust (“REIT”)
A publicly traded company that owns, develops and operates income-producing real estate such as apartments, office buildings, hotels, shopping centers and other commercial properties.
Secured Overnight Financing Rate (“SOFR”)
A broad measure of the cost of borrowing cash overnight collateralized by U.S. Treasury securities
Special Purpose Acquisition Company (SPAC)
A special purpose acquisition company (SPAC) is a company that has no commercial operations and is formed strictly to raise capital through an initial public offering for the purpose of acquiring or merging with an existing company.
Standard Deviation
The standard deviation is a statistic that measures the dispersion of a dataset relative to its mean and is calculated as the square root of the variance. The standard deviation is calculated as the square root of variance by determining each data point’s deviation relative to the mean.
S&P 500® Index
The S&P 500® Index is a free-float market capitalization-weighted index of 500 of the largest U.S. companies. The index is calculated on a total return basis with dividends reinvested. The index is unmanaged, its returns do not reflect any fees, expenses, or sales charges, and it is not available for direct investment.
Wilshire Liquid Alternative Event Driven Index
The Wilshire Liquid Alternative Event Driven Index measures the performance of the event-driven strategy component of the Wilshire Liquid Alternative Index. Event-driven strategies predominantly invest in companies involved in corporate transactions such as mergers, restructuring, distressed, buy backs, or other capital structure changes. The index is unmanaged, its returns do not reflect any fees, expenses, or sales charges, and is not available for direct investment.
3
| | |
The Merger Fund® VL Fund Summary (Unaudited) | | |
How did the markets perform during the Fund’s fiscal year ended December 31, 2021?
| ⬛ | | The Fund is diversified and has an investment objective of seeking to achieve capital growth by engaging in merger arbritage. Merger arbitrage is a highly specialized investment approach generally designed to profit from the successful completion of publicly announced mergers, takeovers, tender offers, leveraged buyouts, spin-offs, liquidations and other corporate reorganizations. There is no guarantee that the Fund will meet its objectives. |
| ⬛ | | For the fiscal year ended December 31, 2021, the Fund’s Class I shares at NAV returned 1.08%.For the same period, the ICE BofA U.S. Treasury Bill 3-Month Index returned 0.05%, the Wilshire Liquid Alternative Event Driven Index returned 2.05%, and the Morningstar U.S. Insurance Fund Event Driven Category Average returned 6.18%. |
For the 12 months ended December 31, 2021, global merger and acquisition (M&A) deal value topped $5 trillion for the first time. This surpassed the previous record high set in 2007 by about 30%, with activity up roughly 65% year-over-year, according to Dealogic. In fact, each quarter in 2021 recorded more than $1 trillion in M&A volume for the first time in history. Fueled by pent-up demand coming out of the pandemic, low interest rates, and an aggressively growing economy, companies struck deals to boost growth, acquire new capabilities, realize operational efficiencies, or some combination of the three.
Largely undaunted by concerns around inflation and geopolitical factors, the increase in merger activity reflected a growing understanding among business leaders that creating value requires more than cost-cutting. During 2021, company leaders proved willing to purchase assets that created revenue synergies, accelerated long-term growth, and increased scale. Moreover, accommodative monetary policies from the U.S. Federal Reserve (the Fed) gave company executives access to cheap financing, which facilitated transaction activity. In 2021, there were 58 mega-deals – transactions with equity value in excess of $10 billion – the highest annual deal count ever, accounting for one-fifth of total M&A volumes, according to Citigroup. The number of deals worth $1 billion or more were also at their highest levels, up 90% year-over-year and 40% higher than the prior record in 2007.
Private equity-related M&A was a driver of deal flow as well, with spending on acquisitions accounting for a record 36% of global transaction volume this year, the highest share ever. No matter their size, most private equity firms were under pressure to deploy their investors’ funds, with more than $2.3 trillion of uninvested committed capital in their coffers, which can create multiples of that amount of potential transaction activity.
Despite a slowdown in the second half of 2021, the creation of new special purpose acquisition companies (SPACs) accounted for about 10% of the global M&A volumes. Additionally, there was approximately $140 billion of cash in trust inside existing SPACs searching for targets, which was estimated to amount to as much as a half-trillion U.S. dollars in combined cash and leverage specifically reserved for future M&A.
But this year’s burst of M&A was not without some headwinds. Because there is some risk of any M&A transaction being delayed or terminated, the target company will typically trade at a discount to the offer price. This discount, called the deal spread, measures potential returns for this strategy. During the fiscal year, deal spreads increased as a result of increased scrutiny from regulators around the globe, particularly the U.S. and China, which caused mark-to-market volatility, or unrealized losses, on existing deals awaiting regulatory approval. Rising inflation, rising interest rates, and the resurgence of COVID created additional execution uncertainty. However, our view on approvals remained consistent as of year end. Regardless of market movements and volatility, should deal spreads tighten to zero for those transactions that proceed to closure, the negative marks-to-market on those particular positions would be reversed. Unfortunately, this does not always happen on a calendar year basis.
What factors affected the Fund’s performance during its fiscal year?
The Fund has an absolute return focus and is not managed to a benchmark. However, because merger arbitrage has a historically low correlation to stocks and bonds, with volatility that has historically been similar to that of a short-to-medium-term bond, the Fund is often compared to the Bloomberg U.S. Aggregate Bond Index in addition to the U.S. 3-month Treasury bill. For the fiscal year ended
December 31, 2021, the Bloomberg U.S. Aggregate Bond Index was down 1.54% and the ICE BofA US Treasury Bill 3 Month Index return was 0.05%.
The Fund’s performance for the fiscal year ended December 31, 2021, was well below our targeted rate of return. While the Fund experienced its second down year in the 17 years since its inception in 2004, the Fund demonstrated lower volatility. At the end of the 12-month period, the Fund’s three-year standard deviation was approximately 3.66, and its beta, or volatility compared with the market, was 0.12 to the S&P 500® Index and 0.04 to the Bloomberg U.S. Aggregate Bond Index.
The second half of 2021 introduced a number of challenges, beginning with the deal break between Aon and Willis Towers Watson. The M&A space saw increased volatility in deal spreads in general, as investors began to question the impact of an increase in worldwide concerns relating to international and national security issues and consumer protections. Lack of transparency at China’s oversight agency, the State Administration for Market Regulation (SAMR), particularly regarding technology sector transactions, exacerbated China-U.S. tensions, causing wild fluctuations among deals that required Chinese approval.
As with any investment program, losses are inevitable from time to time. The Fund continues to manage concentration risk to minimize the impact of these periodic unpredictable events. The majority of the drawdowns in the Fund were unrealized losses, and we are confident that many of these positions will recover.
The biggest contributors to performance for the 12-month period were Coherent Inc./II-VI Inc., Athene Holding Ltd./Apollo Global Mgmt., and the FTAC Olympus Acquisition.
The Fund’s biggest detractors for the fiscal year were Willis Towers Watson PLC/Aon PLC., Xilinx Inc. /Advanced Micro Devices Inc., and the Macro Portfolio Hedge.
The preceding information is the opinion of portfolio management only through the end of the period stated on the cover. Any such opinions are subject to change at any time based upon market or other conditions and should not be relied upon as investment advice. Past performance is no guarantee of future
4
| | |
The Merger Fund® VL (Continued) Fund Summary (Unaudited) | | |
results, and there is no guarantee that market forecasts will be realized.
Fundamental Risk of Investing: There can be no assurance that the portfolio will achieve its investment objectives. An investment in the portfolio is subject to the risk of loss of principal; shares may decrease in value.
Merger-arbitrage & Event-driven Investing: Merger-arbitrage and event-driven investing involve the risk that the adviser’s evaluation of the outcome of a proposed event, whether it be a merger, reorganization, regulatory issue, or other event, will prove incorrect and that the Fund’s return on the investment may be negative.
Short Sales: The portfolio may engage in short sales, and may incur a loss if the price of a borrowed security increases before the date on which the portfolio replaces the security.
Foreign Investing: Investing in foreign securities subjects the portfolio to additional risks such as increased volatility, currency fluctuations, less liquidity, and political, regulatory, economic, and market risk.
Portfolio Turnover: The portfolio’s principal investment strategies may result in a consistently high portfolio turnover rate. A higher portfolio turnover rate may indicate higher transaction costs and may result in higher taxes when the portfolio is held in a taxable account.
Credit & Interest: Debt instruments are subject to various risks, including credit and interest rate risk. The issuer of a debt security may fail to make interest and/or principal payments. Values of debt instruments may rise or fall in response to changes in interest rates, and this risk may be enhanced with longer-term maturities.
Derivatives: Investments in derivatives such as futures, options, forwards, and swaps may increase volatility or cause a loss greater than the principal investment.
Hedging: The portfolio’s hedging strategy will be subject to the portfolio’s investment adviser’s ability to correctly assess the degree of correlation between the performance of the instruments used in the hedging strategy and the performance of the investments in the portfolio being hedged.
Sector Focused Investing: Events negatively affecting a particular industry or market sector in which the portfolio focuses its investments may cause the value of the portfolio to decrease.
Technology Concentration: Because the portfolio is presently heavily weighted in the technology sector, it will be impacted by that sector’s performance more than a portfolio with broader sector diversification.
Market Volatility: Local, regional, or global events such as war, acts of terrorism, the spread of infectious illness or other public health issues, recessions, or other events could have a significant impact on the portfolio and its investments, including hampering the ability of the portfolio manager(s) to invest the portfolio’s assets as intended.
Prospectus: For additional information on risks, please see the Fund’s prospectus.
5
The Merger Fund VL
| | | | | | | | | | | | |
| |
Average Annual Total Returns1 for the period ended 12/31/21 | | | | |
| | | |
| | | 1 Yr | | | 5 Yr | | | 10 Yr | |
| | | | |
| The Merger Fund Class I | | | 1.08 | % | | | 4.83 | % | | | 3.33 | % |
| | | | |
| ICE BofA U.S. Treasury Bill 3 Month Index | | | 0.05 | | | | 1.14 | | | | 0.63 | |
| | | | |
| Wilshire Liquid Alternative Event Driven Index | | | 2.05 | | | | 3.21 | | | | — | |
| | | | |
| Morningstar U.S. Insurance Fund Event Driven Category Average | | | 6.18 | | | | 4.46 | | | | 4.11 | |
Fund Expense Ratio2: Class I shares: Gross 1.65%, Net 1.50%
All returns represent past performance which is no guarantee of future results. Current performance may be higher or lower than the performance shown. The investment return and principal value of an investment will fluctuate so that an investor’s shares, when redeemed, may be worth more or less than their original cost. The above table and graph below do not reflect the deduction of taxes that a shareholder would pay on fund distributions or the redemption of shares. Please visit Virtus.com for performance data current to the most recent month-end.
Growth of $10,000 for periods ended 12/31
This chart assumes an initial gross investment of $10,000 made on December 31, 2011. Returns shown include the reinvestment of all dividends. Past performance is not predictive of future performance. The graph and table do not reflect the deduction of taxes that a shareholder would pay on fund distributions or upon redemption of fund shares. Investment return and principal value will fluctuate, so that your shares, when redeemed, may be worth more or less than the original cost.
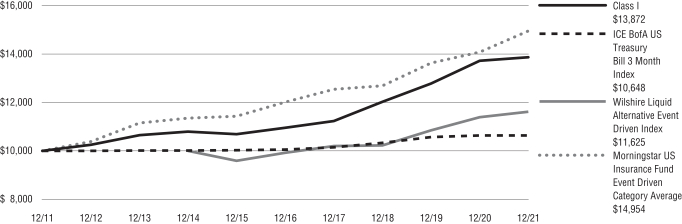
| (*) | Prior to October 1, 2021, the Fund’s shares did not have a class designation; effective October 1, 2021, the Fund’s shares are referred to as Class I shares. The fees and expenses of Class I shares are the same as the fees and expenses of the shares prior to the change in designation. |
| 1 | Total returns are historical and include changes in share price and the reinvestment of both dividends and capital gain distributions. |
| 2 | The expense ratios of the Fund are set forth according to the prospectus for the Fund effective October 1, 2021, as supplemented and revised, and may differ from the expense ratios disclosed in the Financial Highlights tables in this report. See the Financial Highlights for more current expense ratios. Net Expense: Expenses reduced by a contractual expense limitation in effect through September 30, 2023. Gross Expense: Does not reflect the effect of the expense limitation. Expense ratios include fees and expenses associated with any underlying funds. |
The indexes are unmanaged and not available for direct investment; therefore, their performance does not reflect the expenses associated with active management of an actual portfolio.
For information regarding the indexes and certain investment terms, see the Key Investment Terms starting on page 3.
6
DEAL COMPOSITION
The Merger Fund® VL (Unaudited)
| | | | | | | | | | | | |
| | | | | |
| Type of Buyer | | | | | | | Deal Terms* | | | |
| | | | | |
| Strategic | | | 95.7 | % | | | | Cash | | | 59.1 | % |
| | | | | |
| Financial | | | 4.3 | % | | | | Stock with Fixed Exchange Ratio | | | 27.5 | % |
| | | | |
| | | | | | | | Cash & Stock | | | 9.9 | % |
| | | | | |
| By Deal Type | | | | | | | | Stock and Stub(1) | | | 2.7 | % |
| | | | | |
| Friendly | | | 99.8 | % | | | | Risk Reversal | | | 0.7 | % |
| | | | | |
| Hostile | | | 0.2 | % | | | | Undetermined | | | 0.1 | % |
| * | Data expressed as a percentage of long common stock, corporate bonds and swap contract positions as of December 31, 2021. |
| (1) | “Stub” includes assets other than cash and stock (e.g., escrow notes). |
7
PORTFOLIO COMPOSITION*
The Merger Fund® VL (Unaudited)
By Sector

By Region
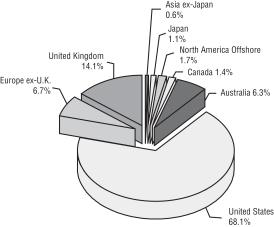
| * | Data expressed as a percentage of long common stocks, private investments in public equity, preferred stocks, contingent value rights, rights, warrants, bank loans, convertible bonds, corporate bonds and long total return swap contract positions as of December 31, 2021. Data expressed excludes special purpose acquisition companies, escrow notes, short- term investments, securities sold short, written and purchased options, forward currency exchange contracts and short total return swap contracts. Please refer to the Schedule of Investments for more details on the Fund’s individual holdings. |
The Global Industry Classification Standard (GICS®) was developed by and/or is the exclusive property of MSCI, Inc. and Standard & Poor’s Financial Services LLC (“S&P”). GICS is a service mark of MSCI and S&P and has been licensed for use by U.S. Bancorp Fund Services, LLC, doing business as U.S. Bank Global Fund Services (“Fund Services”).
8
THE MERGER FUND® VL
SCHEDULE OF INVESTMENTS
DECEMBER 31, 2021
| | | | | | | | | | | | |
| | | Shares | | | | | | Value | |
| | | | | | | | | | | | |
| LONG INVESTMENTS — 98.03% | | | | | | | | | | | | |
| COMMON STOCKS — 51.04% | | | | | | | | | |
| AEROSPACE & DEFENSE — 1.48% | | | | | | | | | |
Aerojet Rocketdyne Holdings, Inc. | | | 17,195 | | | | | | | $ | 804,038 | |
| | | | | | | | | | | | |
| | | |
| AIRLINES — 0.00% | | | | | | | | | |
American Airlines Group, Inc. (a) | | | 78 | | | | | | | | 1,394 | |
| | | | | | | | | | | | |
| | | |
| AUTO COMPONENTS — 0.36% | | | | | | | | | |
Veoneer, Inc. (a) | | | 5,511 | | | | | | | | 195,530 | |
| | | | | | | | | | | | |
| | | |
| BANKS — 0.39% | | | | | | | | | |
People’s United Financial, Inc. | | | 11,944 | | | | | | | | 212,842 | |
| | | | | | | | | | | | |
| | | |
| BIOTECHNOLOGY — 0.42% | | | | | | | | | |
Arena Pharmaceuticals, Inc. (a)(j) | | | 2,406 | | | | | | | | 223,614 | |
Molecular Partners AG — ADR (a) | | | 150 | | | | | | | | 2,893 | |
| | | | | | | | | | | | |
| | | | | | | | | | | 226,507 | |
| | | | | | | | | | | | |
| | | |
| CHEMICALS — 1.43% | | | | | | | | | |
Atotech Ltd. (a) | | | 17,854 | | | | | | | | 455,634 | |
Ferro Corporation (a) | | | 14,539 | | | | | | | | 317,386 | |
| | | | | | | | | | | | |
| | | | | | | | | | | 773,020 | |
| | | | | | | | | | | | |
| | | |
| COMMERCIAL SERVICES & SUPPLIES — 0.16% | | | | | | | | | |
RR Donnelley & Sons Company (a) | | | 7,581 | | | | | | | | 85,362 | |
| | | | | | | | | | | | |
| | | |
| COMMERICAL BANKS — 0.13% | | | | | | | | | |
Flagstar Bancorp, Inc. | | | 1,466 | | | | | | | | 70,280 | |
| | | | | | | | | | | | |
| | | |
| COMPUTERS SERVICES — 0.09% | | | | | | | | | |
PAE, Inc. (a) | | | 4,711 | | | | | | | | 46,780 | |
| | | | | | | | | | | | |
| | | |
| CONSTRUCTION MATERIALS — 0.50% | | | | | | | | | |
Forterra, Inc. (a) | | | 11,406 | | | | | | | | 271,235 | |
| | | | | | | | | | | | |
| | | |
| ELECTRIC UTILITIES — 0.36% | | | | | | | | | |
PNM Resources, Inc. | | | 4,312 | | | | | | | | 196,670 | |
| | | | | | | | | | | | |
| | | |
| ELECTRONIC EQUIPMENT & INSTRUMENTS — 5.06% | | | | | | | | | |
Coherent, Inc. (a) | | | 10,269 | | | | | | | | 2,737,099 | |
| | | | | | | | | | | | |
| | | |
| ELECTRONIC EQUIPMENT, INSTRUMENTS & COMPONENTS — 1.14% | | | | | | | | | |
Rogers Corporation (a) | | | 2,260 | | | | | | | | 616,980 | |
| | | | | | | | | | | | |
| | | |
| ENTERTAINMENT — 0.56% | | | | | | | | | |
MGM Holdings, Inc. (a)(f) | | | 1,792 | | | | | | | | 240,128 | |
Sciplay Corporation (a) | | | 4,474 | | | | | | | | 61,652 | |
| | | | | | | | | | | | |
| | | | | | | | | | | 301,780 | |
| | | | | | | | | | | | |
| | | |
| FOOD PRODUCTS — 0.25% | | | | | | | | | |
Sanderson Farms, Inc. | | | 702 | | | | | | | | 134,138 | |
| | | | | | | | | | | | |
| | | |
| HEALTH CARE EQUIPMENT & SUPPLIES — 0.34% | | | | | | | | | |
Intersect ENT, Inc. (a) | | | 6,783 | | | | | | | | 185,244 | |
| | | | | | | | | | | | |
| | | |
| HEALTH CARE PROVIDERS & SERVICES — 0.03% | | | | | | | | | |
ATI Physical Therapy, Inc. (a) | | | 4,111 | | | | | | | | 13,936 | |
| | | | | | | | | | | | |
See Notes to Financial Statements.
9
THE MERGER FUND® VL
SCHEDULE OF INVESTMENTS (Continued)
DECEMBER 31, 2021
| | | | | | | | | | | | |
| | | Shares | | | | | | Value | |
| HEALTH CARE TECHNOLOGY — 1.94% | | | | | | | | | |
Cerner Corporation (j) | | | 11,306 | | | | | | | $ | 1,049,988 | |
Convey Health Solutions Holdings, Inc. (a) | | | 200 | | | | | | | | 1,672 | |
| | | | | | | | | | | | |
| | | | | | | | | | | 1,051,660 | |
| | | | | | | | | | | | |
| | | |
| IT SERVICES — 0.45% | | | | | | | | | |
Afterpay Ltd. — ADR (a) | | | 4,117 | | | | | | | | 246,608 | |
| | | | | | | | | | | | |
| | | |
| LIFE & HEALTH INSURANCE — 3.69% | | | | | | | | | |
American National Group, Inc. | | | 1,598 | | | | | | | | 301,766 | |
Athene Holding Ltd. — ADR (a)(e) | | | 20,341 | | | | | | | | 1,695,016 | |
| | | | | | | | | | | | |
| | | | | | | | | | | 1,996,782 | |
| | | | | | | | | | | | |
| | | |
| MACHINERY — 0.91% | | | | | | | | | |
Welbilt, Inc. (a) | | | 20,750 | | | | | | | | 493,228 | |
| | | | | | | | | | | | |
| | | |
| MEDIA — 0.97% | | | | | | | | | |
Shaw Communications, Inc. (b) | | | 17,292 | | | | | | | | 524,639 | |
| | | | | | | | | | | | |
| | | |
| METALS & MINING — 4.04% | | | | | | | | | |
BHP Group plc — ADR (e) | | | 36,570 | | | | | | | | 2,185,789 | |
| | | | | | | | | | | | |
| | | |
| MULTI-LINE INSURANCE — 0.62% | | | | | | | | | |
The Hartford Financial Services Group, Inc. (j) | | | 4,881 | | | | | | | | 336,984 | |
| | | | | | | | | | | | |
| | | |
| OIL, GAS & CONSUMABLE FUELS — 0.76% | | | | | | | | | |
Teekay LNG Partners LP (b) | | | 24,197 | | | | | | | | 409,655 | |
| | | | | | | | | | | | |
| | | |
| PHARMACEUTICALS — 0.05% | | | | | | | | | |
TPCO Holding Corporation — ADR (a) | | | 20,481 | | | | | | | | 28,059 | |
| | | | | | | | | | | | |
| | | |
| PROFESSIONAL SERVICES — 0.15% | | | | | | | | | |
51job, Inc. — ADR (a) | | | 1,703 | | | | | | | | 83,328 | |
| | | | | | | | | | | | |
| | | |
| REITs — 3.18% | | | | | | | | | |
Bluerock Residential Growth REIT, Inc. | | | 4,796 | | | | | | | | 126,567 | |
CyrusOne, Inc. | | | 17,774 | | | | | | | | 1,594,683 | |
| | | | | | | | | | | | |
| | | | | | | | | | | 1,721,250 | |
| | | | | | | | | | | | |
| | | |
| RESEARCH & CONSULTING SERVICES — 6.84% | | | | | | | | | |
IHS Markit Ltd. (e) | | | 27,868 | | | | | | | | 3,704,215 | |
| | | | | | | | | | | | |
| | | |
| ROAD & RAIL — 0.01% | | | | | | | | | |
Hertz Global Holdings, Inc. (a) | | | 215 | | | | | | | | 5,373 | |
| | | | | | | | | | | | |
| | | |
| SEMICONDUCTORS — 6.42% | | | | | | | | | |
Magnachip Semiconductor Corporation (a) | | | 938 | | | | | | | | 19,670 | |
Xilinx, Inc. (e) | | | 16,289 | | | | | | | | 3,453,757 | |
| | | | | | | | | | | | |
| | | | | | | | | | | 3,473,427 | |
| | | | | | | | | | | | |
| | | |
| SEMICONDUCTORS & SEMICONDUCTOR EQUIPMENT — 0.26% | | | | | | | | | |
NeoPhotonics Corporation (a) | | | 9,144 | | | | | | | | 140,543 | |
| | | | | | | | | | | | |
| | | |
| SOFTWARE — 7.68% | | | | | | | | | |
Five9, Inc. (a)(j) | | | 1,500 | | | | | | | | 205,980 | |
Nuance Communications, Inc. (a)(e) | | | 50,112 | | | | | | | | 2,772,196 | |
UserTesting, Inc. (a) | | | 100 | | | | | | | | 842 | |
Vonage Holdings Corporation (a)(j) | | | 56,648 | | | | | | | | 1,177,712 | |
| | | | | | | | | | | | |
| | | | | | | | | | | 4,156,730 | |
| | | | | | | | | | | | |
See Notes to Financial Statements.
10
THE MERGER FUND® VL
SCHEDULE OF INVESTMENTS (Continued)
DECEMBER 31, 2021
| | | | | | | | | | | | |
| | | Shares | | | | | | Value | |
| SPECIALTY RETAIL — 0.37% | | | | | | | | | |
Sportsman’s Warehouse Holdings, Inc. (a)(j) | | | 16,862 | | | | | | | $ | 198,972 | |
| | | | | | | | | | | | |
| TOTAL COMMON STOCKS (Cost $24,648,081) | | | | | | | | 27,630,077 | |
| | | | | | | | | | | | |
| | | |
| | | Shares/Units | | | | | | | |
| | | |
| SPECIAL PURPOSE ACQUISITION COMPANIES — 18.22% (a) | | | | | | | | | |
26 Capital Acquisition Corporation | | | 1,800 | | | | | | | | 18,234 | |
Accelerate Acquisition Corporation Class A | | | 9,000 | | | | | | | | 87,480 | |
ACE Convergence Acquisition Corporation Class A — ADR | | | 17,419 | | | | | | | | 173,493 | |
AfterNext HealthTech Acquisition Corporation Class A — ADR | | | 6,731 | | | | | | | | 65,627 | |
Alpha Partners Technology Merger Corporation Class A — ADR | | | 5,646 | | | | | | | | 54,540 | |
AltEnergy Acquisition Corporation | | | 1,600 | | | | | | | | 16,144 | |
Altimar Acquisition Corporation III — ADR | | | 2,313 | | | | | | | | 22,737 | |
Altimeter Growth Corporation 2 Class A — ADR | | | 4,105 | | | | | | | | 40,475 | |
Anzu Special Acquisition Corporation I | | | 200 | | | | | | | | 1,992 | |
Anzu Special Acquisition Corporation I Class A | | | 5,592 | | | | | | | | 54,522 | |
Apollo Strategic Growth Capital Class A — ADR | | | 8,013 | | | | | | | | 79,088 | |
Archimedes Tech SPAC Partners Company | | | 187 | | | | | | | | 1,877 | |
ArcLight Clean Transition Corporation II Class A — ADR | | | 5,030 | | | | | | | | 50,199 | |
Ares Acquisition Corporation — ADR | | | 1,950 | | | | | | | | 19,364 | |
Arrowroot Acquisition Corporation Class A | | | 7,864 | | | | | | | | 76,281 | |
Artisan Acquisition Corporation Class A — ADR | | | 1,407 | | | | | | | | 13,943 | |
Astrea Acquisition Corporation Class A | | | 4,267 | | | | | | | | 42,158 | |
Athena Consumer Acquisition Corporation | | | 1,071 | | | | | | | | 10,892 | |
Atlas Crest Investment Corporation II | | | 1,450 | | | | | | | | 14,398 | |
Atlas Crest Investment Corporation II Class A | | | 3,919 | | | | | | | | 38,132 | |
Aurora Acquisition Corporation Class A (b) | | | 2,413 | | | | | | | | 23,889 | |
Austerlitz Acquisition Corporation I Class A — ADR | | | 11,528 | | | | | | | | 111,937 | |
Austerlitz Acquisition Corporation II — ADR | | | 900 | | | | | | | | 9,009 | |
Austerlitz Acquisition Corporation II Class A — ADR | | | 4,453 | | | | | | | | 43,283 | |
Authentic Equity Acquisition Corporation — ADR | | | 400 | | | | | | | | 4,000 | |
Avanti Acquisition Corporation Class A (b) | | | 8,716 | | | | | | | | 85,591 | |
Bilander Acquisition Corporation Class A | | | 5,641 | | | | | | | | 54,548 | |
Biotech Acquisition Company Class A — ADR | | | 5,539 | | | | | | | | 54,504 | |
BlueRiver Acquisition Corporation — ADR | | | 150 | | | | | | | | 1,481 | |
BOA Acquisition Corporation Class A | | | 1,148 | | | | | | | | 11,285 | |
Brigade-M3 European Acquisition Corporation (b) | | | 3,199 | | | | | | | | 31,350 | |
Build Acquisition Corporation | | | 1,053 | | | | | | | | 10,372 | |
Burgundy Technology Acquisition Corporation — ADR | | | 857 | | | | | | | | 8,793 | |
Burgundy Technology Acquisition Corporation Class A — ADR | | | 14,707 | | | | | | | | 147,217 | |
Capstar Special Purpose Acquisition Corporation Class A | | | 5,895 | | | | | | | | 58,714 | |
Catalyst Partners Acquisition Corporation Class A — ADR | | | 5,630 | | | | | | | | 54,836 | |
CC Neuberger Principal Holdings II Class A — ADR | | | 9,734 | | | | | | | | 96,367 | |
CC Neuberger Principal Holdings III — ADR | | | 1,500 | | | | | | | | 15,000 | |
CF Acquisition Corporation VI Class A | | | 470 | | | | | | | | 5,090 | |
CF Acquisition Corporation VIII | | | 3,028 | | | | | | | | 30,583 | |
CHP Merger Corporation Class A | | | 3,916 | | | | | | | | 39,630 | |
Churchill Capital Corporation V Class A | | | 1,825 | | | | | | | | 17,958 | |
Churchill Capital Corporation VII Class A | | | 11,792 | | | | | | | | 115,915 | |
CIIG Capital Partners II, Inc. | | | 4,645 | | | | | | | | 47,890 | |
Class Acceleration Corporation | | | 150 | | | | | | | | 1,485 | |
Climate Real Impact Solutions Acquisition Corporation II | | | 68 | | | | | | | | 678 | |
Climate Real Impact Solutions Acquisition Corporation II Class A | | | 6,007 | | | | | | | | 58,628 | |
Cohn Robbins Holdings Corporation Class A — ADR | | | 15,588 | | | | | | | | 153,230 | |
Colicity, Inc. Class A | | | 5,272 | | | | | | | | 52,404 | |
Colonnade Acquisition Corporation II — ADR | | | 1,000 | | | | | | | | 9,880 | |
Compute Health Acquisition Corporation | | | 5,691 | | | | | | | | 56,569 | |
Concord Acquisition Corporation II Class A | | | 5,651 | | | | | | | | 55,097 | |
Conx Corporation Class A (e) | | | 8,816 | | | | | | | | 86,573 | |
Conyers Park Acquisition Corporation III Class A | | | 5,588 | | | | | | | | 54,483 | |
Corazon Capital V838 Monoceros Corporation Class A — ADR | | | 2,795 | | | | | | | | 27,028 | |
Corner Growth Acquisition Corporation — ADR | | | 2,686 | | | | | | | | 26,726 | |
See Notes to Financial Statements.
11
THE MERGER FUND® VL
SCHEDULE OF INVESTMENTS (Continued)
DECEMBER 31, 2021
| | | | | | | | | | | | |
| | | Shares/Units | | | | | | Value | |
| | | |
| SPECIAL PURPOSE ACQUISITION COMPANIES — continued | | | | | | | | | |
COVA Acquisition Corporation — ADR | | | 2,301 | | | | | | | $ | 23,010 | |
Crown PropTech Acquisitions Class A — ADR | | | 5,549 | | | | | | | | 54,935 | |
D & Z Media Acquisition Corporation | | | 2,350 | | | | | | | | 23,288 | |
Decarbonization Plus Acquisition Corporation II | | | 2 | | | | | | | | 21 | |
Decarbonization Plus Acquisition Corporation II Class A | | | 498 | | | | | | | | 4,965 | |
Decarbonization Plus Acquisition Corporation IV Class A — ADR | | | 5,194 | | | | | | | | 51,213 | |
Deep Lake Capital Acquisition Corporation Class A — ADR | | | 4,760 | | | | | | | | 46,553 | |
Dragoneer Growth Opportunities Corporation III Class A — ADR | | | 5,561 | | | | | | | | 54,331 | |
E.Merge Technology Acquisition Corporation Class A | | | 16,998 | | | | | | | | 167,260 | |
ECP Environmental Growth Opportunities Corporation Class A | | | 10,151 | | | | | | | | 100,089 | |
EdtechX Holdings Acquisition Corporation II Class A | | | 1,074 | | | | | | | | 10,761 | |
Elliott Opportunity Corporation II — ADR | | | 1,118 | | | | | | | | 11,191 | |
Elliott Opportunity Corporation II Class A — ADR | | | 5,998 | | | | | | | | 58,600 | |
Enterprise 4.0 Technology Acquisition Corporation — ADR | | | 1,694 | | | | | | | | 17,059 | |
Environmental Impact Acquisition Corporation Class A | | | 3,175 | | | | | | | | 31,496 | |
Equity Distribution Acquisition Corporation Class A | | | 24,951 | | | | | | | | 245,019 | |
ESGEN Acquisition Corporation — ADR | | | 1,873 | | | | | | | | 18,992 | |
ESM Acquisition Corporation (b) | | | 933 | | | | | | | | 9,265 | |
Eucrates Biomedical Acquisition Corporation — ADR | | | 13 | | | | | | | | 127 | |
Eve Mobility Acquisition Corporation — ADR | | | 589 | | | | | | | | 5,896 | |
ExcelFin Acquisition Corporation | | | 1,606 | | | | | | | | 16,140 | |
Fifth Wall Acquisition Corporation III Class A — ADR | | | 5,552 | | | | | | | | 55,242 | |
FinServ Acquisition Corporation II | | | 1,229 | | | | | | | | 12,118 | |
FinServ Acquisition Corporation II Class A | | | 1,651 | | | | | | | | 15,998 | |
FinTech Acquisition Corporation VI | | | 2,838 | | | | | | | | 28,238 | |
FinTech Acquisition Corporation VI Class A | | | 2,782 | | | | | | | | 27,264 | |
Fintech Evolution Acquisition Group — ADR | | | 5,096 | | | | | | | | 50,196 | |
FirstMark Horizon Acquisition Corporation | | | 4,182 | | | | | | | | 42,656 | |
FirstMark Horizon Acquisition Corporation Class A | | | 2,775 | | | | | | | | 27,445 | |
Fortistar Sustainable Solutions Corporation Class A | | | 5,601 | | | | | | | | 54,386 | |
Fortress Capital Acquisition Corporation Class A — ADR | | | 4,915 | | | | | | | | 47,970 | |
Fortress Value Acquisition Corporation III | | | 1,065 | | | | | | | | 10,554 | |
Fortress Value Acquisition Corporation III Class A | | | 3,709 | | | | | | | | 36,237 | |
Fortress Value Acquisition Corporation IV Class A | | | 5,570 | | | | | | | | 54,308 | |
Frazier Lifesciences Acquisition Corporation — ADR | | | 1,900 | | | | | | | | 18,810 | |
FTAC Athena Acquisition Corporation Class A — ADR | | | 8,473 | | | | | | | | 84,052 | |
FTAC Emerald Acquisition Corporation | | | 5,297 | | | | | | | | 52,811 | |
FTAC Hera Acquisition Corporation — ADR | | | 2,134 | | | | | | | | 21,255 | |
FTAC Parnassus Acquisition Corporation Class A | | | 3,086 | | | | | | | | 30,089 | |
FTAC Zeus Acquisition Corporation | | | 1,059 | | | | | | | | 10,590 | |
Fusion Acquisition Corporation II | | | 3,000 | | | | | | | | 29,685 | |
G Squared Ascend I, Inc. — ADR | | | 4,210 | | | | | | | | 42,374 | |
G Squared Ascend I, Inc. Class A — ADR | | | 5,942 | | | | | | | | 58,707 | |
G Squared Ascend II, Inc. — ADR | | | 2,391 | | | | | | | | 23,886 | |
Gesher I Acquisition Corporation — ADR | | | 1,707 | | | | | | | | 17,138 | |
Goal Acquisitions Corporation | | | 8,597 | | | | | | | | 83,391 | |
Golden Falcon Acquisition Corporation Class A | | | 4,958 | | | | | | | | 48,489 | |
Gores Holdings VIII, Inc. Class A | | | 75 | | | | | | | | 765 | |
Gores Technology Partners, Inc. Class A | | | 1,961 | | | | | | | | 19,434 | |
Gores Technology Partners II, Inc. Class A | | | 678 | | | | | | | | 6,712 | |
Graf Acquisition Corporation IV | | | 3,041 | | | | | | | | 30,106 | |
Haymaker Acquisition Corporation III | | | 4,762 | | | | | | | | 47,096 | |
Healthcare Assurance Acquisition Corporation Class A | | | 5,883 | | | | | | | | 57,477 | |
Healthcare Services Acquisition Corporation Class A | | | 6,430 | | | | | | | | 62,757 | |
Hennessy Capital Investment Corporation V | | | 100 | | | | | | | | 997 | |
Highland Transcend Partners Corporation I Class A — ADR | | | 50,169 | | | | | | | | 497,676 | |
Horizon Acquisition Corporation II Class A — ADR | | | 5,983 | | | | | | | | 58,813 | |
Hudson Executive Investment Corporation II | | | 200 | | | | | | | | 1,978 | |
Independence Holdings Corporation (b) | | | 1,500 | | | | | | | | 14,925 | |
Independence Holdings Corporation Class A (b) | | | 3,919 | | | | | | | | 38,093 | |
Infinite Acquisition Corporation — ADR | | | 1,324 | | | | | | | | 13,333 | |
INSU Acquisition Corporation III Class A | | | 5,558 | | | | | | | | 54,468 | |
See Notes to Financial Statements.
12
THE MERGER FUND® VL
SCHEDULE OF INVESTMENTS (Continued)
DECEMBER 31, 2021
| | | | | | | | | | | | |
| | | Shares/Units | | | | | | Value | |
| | | |
| SPECIAL PURPOSE ACQUISITION COMPANIES — continued | | | | | | | | | |
InterPrivate II Acquisition Corporation | | | 897 | | | | | | | $ | 8,871 | |
InterPrivate III Financial Partners, Inc. Class A | | | 895 | | | | | | | | 8,869 | |
InterPrivate IV InfraTech Partners, Inc. | | | 231 | | | | | | | | 2,275 | |
ION Acquisition Corporation 3 Ltd. Class A — ADR | | | 6,032 | | | | | | | | 58,993 | |
Isleworth Healthcare Acquisition Corporation | | | 2,244 | | | | | | | | 22,081 | |
Jack Creek Investment Corporation (b) | | | 1,500 | | | | | | | | 15,000 | |
Jaws Hurricane Acquisition Corporation Class A | | | 5,394 | | | | | | | | 52,160 | |
Jaws Juggernaut Acquisition Corporation — ADR | | | 4,066 | | | | | | | | 40,579 | |
Jaws Juggernaut Acquisition Corporation Class A — ADR | | | 1,472 | | | | | | | | 14,470 | |
Jaws Mustang Acquisition Corporation — ADR | | | 600 | | | | | | | | 6,018 | |
Jaws Mustang Acquisition Corporation Class A — ADR | | | 5,976 | | | | | | | | 58,266 | |
Khosla Ventures Acquisition Company | | | 1,672 | | | | | | | | 16,218 | |
Khosla Ventures Acquisition Company III Class A | | | 5,273 | | | | | | | | 51,464 | |
Kismet Acquisition Three Corporation — ADR | | | 1 | | | | | | | | 10 | |
Kismet Acquisition Three Corporation Class A — ADR | | | 6,044 | | | | | | | | 58,566 | |
KKR Acquisition Holdings Corporation I | | | 5,844 | | | | | | | | 58,557 | |
KL Acquisition Corporation Class A | | | 12,891 | | | | | | | | 125,945 | |
KludeIn I Acquisition Corporation | | | 3,000 | | | | | | | | 30,120 | |
L. Catterton Asia Acquisition Corporation Class A — ADR | | | 6,050 | | | | | | | | 58,685 | |
Landcadia Holdings IV, Inc. Class A | | | 5,988 | | | | | | | | 58,084 | |
LDH Growth Corporation I Class A — ADR | | | 1,414 | | | | | | | | 13,885 | |
Lerer Hippeau Acquisition Corporation Class A | | | 2,989 | | | | | | | | 29,412 | |
Lionheart Acquisition Corporation II Class A | | | 5,904 | | | | | | | | 58,804 | |
Live Oak Crestview Climate Acquisition Corporation Class A | | | 5,937 | | | | | | | | 60,557 | |
Live Oak Mobility Acquisition Corporation Class A | | | 2,647 | | | | | | | | 25,861 | |
Longview Acquisition Corporation II Class A | | | 6,305 | | | | | | | | 62,041 | |
M3-Brigade Acquisition Corporation II Class A | | | 5,922 | | | | | | | | 58,687 | |
Macondray Capital Acquisition Corporation I — ADR | | | 2,600 | | | | | | | | 25,922 | |
Magnum Opus Acquisition Ltd. Class A — ADR | | | 5,909 | | | | | | | | 58,617 | |
Marlin Technology Corporation Class A — ADR | | | 9,417 | | | | | | | | 91,910 | |
Mason Industrial Technology, Inc. | | | 2,774 | | | | | | | | 27,518 | |
MedTech Acquisition Corporation Class A | | | 5,513 | | | | | | | | 54,468 | |
Motive Capital Corporation Class A — ADR | | | 13,200 | | | | | | | | 129,888 | |
Motive Capital Corporation II — ADR | | | 3,201 | | | | | | | | 31,914 | |
The Music Acquisition Corporation | | | 2,750 | | | | | | | | 26,125 | |
New Vista Acquisition Corporation Class A — ADR | | | 1,051 | | | | | | | | 10,226 | |
Newbury Street Acquisition Corporation | | | 838 | | | | | | | | 8,296 | |
Noble Rock Acquisition Corporation — ADR | | | 300 | | | | | | | | 2,940 | |
North Atlantic Acquisition Corporation Class A — ADR | | | 5,564 | | | | | | | | 54,527 | |
North Mountain Merger Corporation Class A | | | 2,783 | | | | | | | | 27,440 | |
Northern Genesis Acquisition Corporation III Class A | | | 6,025 | | | | | | | | 58,573 | |
Novus Capital Corporation II | | | 400 | | | | | | | | 4,116 | |
Pathfinder Acquisition Corporation Class A — ADR | | | 5,310 | | | | | | | | 51,507 | |
Peridot Acquisition Corporation II — ADR | | | 2,500 | | | | | | | | 24,825 | |
Peridot Acquisition Corporation II Class A — ADR | | | 6,038 | | | | | | | | 58,750 | |
Pershing Square Tontine Holdings Ltd. Class A | | | 7,392 | | | | | | | | 145,770 | |
Phoenix Biotech Acquisition Corporation | | | 1,719 | | | | | | | | 17,345 | |
Pioneer Merger Corporation Class A — ADR | | | 10,362 | | | | | | | | 102,273 | |
Pivotal Investment Corporation III | | | 852 | | | | | | | | 8,435 | |
Poema Global Holdings Corporation Class A — ADR | | | 3,177 | | | | | | | | 31,389 | |
Pontem Corporation Class A — ADR | | | 6,744 | | | | | | | | 66,091 | |
Post Holdings Partnering Corporation Class A | | | 8,951 | | | | | | | | 87,720 | |
Prime Impact Acquisition I — ADR | | | 57 | | | | | | | | 570 | |
Prime Impact Acquisition I Class A — ADR | | | 6,492 | | | | | | | | 63,881 | |
Progress Acquisition Corporation | | | 65 | | | | | | | | 649 | |
PROOF Acquisition Corporation I | | | 4,240 | | | | | | | | 42,442 | |
Property Solutions Acquisition Corporation II | | | 1,847 | | | | | | | | 18,267 | |
Prospector Capital Corporation Class A — ADR | | | 6,639 | | | | | | | | 64,664 | |
Pyrophyte Acquisition Corporation — ADR | | | 2,132 | | | | | | | | 21,533 | |
Queen’s Gambit Growth Capital Class A — ADR | | | 7,231 | | | | | | | | 71,587 | |
RedBall Acquisition Corporation Class A — ADR | | | 10,937 | | | | | | | | 108,495 | |
Revolution Healthcare Acquisition Corporation Class A | | | 11,543 | | | | | | | | 112,083 | |
See Notes to Financial Statements.
13
THE MERGER FUND® VL
SCHEDULE OF INVESTMENTS (Continued)
DECEMBER 31, 2021
| | | | | | | | | | | | |
| | | Shares/Units | | | | | | Value | |
| | | |
| SPECIAL PURPOSE ACQUISITION COMPANIES — continued | | | | | | | | | |
RMG Acquisition Corporation III Class A | | | 11,557 | | | | | | | $ | 112,681 | |
Rocket Internet Growth Opportunities Corporation — ADR | | | 5,017 | | | | | | | | 49,668 | |
Ross Acquisition Corporation II — ADR | | | 153 | | | | | | | | 1,533 | |
Ross Acquisition Corporation II Class A — ADR | | | 5,518 | | | | | | | | 53,856 | |
ScION Tech Growth II (b) | | | 1,250 | | | | | | | | 12,388 | |
Semper Paratus Acquisition Corporation — ADR | | | 2,138 | | | | | | | | 21,530 | |
Senior Connect Acquisition Corporation I Class A | | | 4,566 | | | | | | | | 44,473 | |
Shelter Acquisition Corporation I | | | 5,172 | | | | | | | | 51,410 | |
Shelter Acquisition Corporation I — Sponsor (d)(g) | | | 718 | | | | | | | | — | |
Simon Property Group Acquisition Holdings, Inc. | | | 5,267 | | | | | | | | 52,117 | |
Simon Property Group Acquisition Holdings, Inc. Class A | | | 8,911 | | | | | | | | 86,793 | |
Slam Corporation — ADR | | | 5,203 | | | | | | | | 51,406 | |
Slam Corporation Class A — ADR | | | 401 | | | | | | | | 3,910 | |
Soar Technology Acquisition Corporation — ADR | | | 1,164 | | | | | | | | 11,291 | |
Social Capital Hedosophia Holdings Corporation VI Class A (b)(j) | | | 4,249 | | | | | | | | 43,297 | |
Spartan Acquisition Corporation III Class A | | | 12,473 | | | | | | | | 123,109 | |
Sports Entertainment Acquisition Corporation Class A | | | 3,802 | | | | | | | | 37,716 | |
Supernova Partners Acquisition Company III Ltd. Class A — ADR | | | 13,459 | | | | | | | | 130,687 | |
Sustainable Development Acquisition Corporation I | | | 300 | | | | | | | | 2,997 | |
SVF Investment Corporation Class A — ADR | | | 4,793 | | | | | | | | 48,122 | |
SVF Investment Corporation 2 Class A — ADR | | | 185 | | | | | | | | 1,839 | |
SVF Investment Corporation 3 Class A — ADR | | | 11 | | | | | | | | 110 | |
Tailwind Acquisition Corporation Class A | | | 15,365 | | | | | | | | 151,192 | |
Target Global Acquisition Corporation I — ADR | | | 4,801 | | | | | | | | 47,818 | |
Thunder Bridge Capital Partners III, Inc. Class A | | | 5,475 | | | | | | | | 53,491 | |
Tishman Speyer Innovation Corporation II Class A | | | 5,140 | | | | | | | | 50,115 | |
TortoiseEcofin Acquisition Corporation III Class A — ADR | | | 5,633 | | | | | | | | 54,584 | |
Tribe Capital Growth Corporation I | | | 3,142 | | | | | | | | 31,043 | |
Tribe Capital Growth Corporation I Class A | | | 2,236 | | | | | | | | 21,868 | |
Twelve Seas Investment Company II | | | 587 | | | | | | | | 5,829 | |
USHG Acquisition Corporation Class A | | | 5,301 | | | | | | | | 54,971 | |
VectoIQ Acquisition Corporation II Class A | | | 6,710 | | | | | | | | 65,355 | |
Virgin Group Acquisition Corporation II Class A — ADR | | | 11,130 | | | | | | | | 109,853 | |
Vy Global Growth Class A — ADR | | | 8,099 | | | | | | | | 79,451 | |
Warbug Pincus Capital Corporation I Class A — ADR | | | 3,004 | | | | | | | | 29,439 | |
Z-Work Acquisition Corporation Class A | | | 1,798 | | | | | | | | 17,495 | |
| | | | | | | | | | | | |
| TOTAL SPECIAL PURPOSE ACQUISITION COMPANIES (Cost $9,905,088) | | | | | | | | 9,861,000 | |
| | | | | | | | | | | | |
| | | |
| | | Shares | | | | | | | |
| | | |
| PRIVATE INVESTMENTS IN PUBLIC EQUITY — 0.10% (a) | | | | | | | | | |
MarketWise, Inc. | | | 565 | | | | | | | | 4,260 | |
Microvast Holdings, Inc. (d)(g)(l) | | | 9,000 | | | | | | | | 48,393 | |
| | | | | | | | | | | | |
| TOTAL PRIVATE INVESTMENTS IN PUBLIC EQUITY (Cost $95,650) | | | | | | | | 52,653 | |
| | | | | | | | | | | | |
| | | |
| PREFERRED STOCKS — 0.08% | | | | | | | | | |
Babcock & Wilcox Enterprises, Inc.,
6.500%, 12/31/2026 | | | 1,856 | | | | | | | | 46,029 | |
| | | | | | | | | | | | |
| TOTAL PREFERRED STOCKS (Cost $46,400) | | | | | | | | 46,029 | |
| | | | | | | | | | | | |
| | | |
| CONTINGENT VALUE RIGHTS — 0.11% (a) | | | | | | | | | |
Alder Biopharmaceuticals, Inc. (f) | | | 31,310 | | | | | | | | 56,358 | |
Ligand Pharmaceuticals (g) | | | 7,028 | | | | | | | | 879 | |
Media General, Inc. (d)(e)(g) | | | 8,397 | | | | | | | | — | |
| | | | | | | | | | | | |
| TOTAL CONTINGENT VALUE RIGHTS (Cost $0) | | | | | | | | 57,237 | |
| | | | | | | | | | | | |
| | | |
| RIGHTS — 0.01% (a)(g) | | | | | | | | | |
Bristol-Myers Squibb Company | | | 6,945 | | | | | | | | 7,813 | |
| | | | | | | | | | | | |
| TOTAL RIGHTS (Cost $0) | | | | | | | | 7,813 | |
| | | | | | | | | | | | |
See Notes to Financial Statements.
14
THE MERGER FUND® VL
SCHEDULE OF INVESTMENTS (Continued)
DECEMBER 31, 2021
| | | | | | | | | | | | |
| | | Shares | | | | | | Value | |
| WARRANTS — 0.30% (a) | | | | | | | | | |
Accelerate Acquisition Corporation Class A
Expiration: December 2027,
Exercise Price: $11.50 | | | 3,000 | | | | | | | $ | 2,490 | |
ACE Convergence Acquisition Corporation Class A
Expiration: September 2027,
Exercise Price: $11.50 (b) | | | 9,310 | | | | | | | | 6,145 | |
Akazoo S.A.
Expiration: December 2024,
Exercise Price: $11.50 (b)(d)(g) | | | 2,642 | | | | | | | | — | |
Apollo Strategic Growth Capital Class A
Expiration: October 2027,
Exercise Price: $11.50 (b) | | | 4,782 | | | | | | | | 6,121 | |
Ardagh Metal Packaging S.A.
Expiration: August 2026,
Exercise Price: $11.50 (b) | | | 542 | | | | | | | | 1,079 | |
Arrowroot Acquisition Corporation Class A
Expiration: March 2022,
Exercise Price: $11.50 | | | 6,162 | | | | | | | | 3,204 | |
Austerlitz Acquisition Corporation I
Expiration: February 2026,
Exercise Price: $11.50 (b) | | | 189 | | | | | | | | 198 | |
Avanti Acquisition Corporation Class A
Expiration: December 2025,
Exercise Price: $11.50 (b) | | | 1,800 | | | | | | | | 1,066 | |
Berkshire Grey, Inc.
Expiration: December 2026,
Exercise Price: $11.50 | | | 1,255 | | | | | | | | 1,129 | |
BigBear A.I. Holdings, Inc.
Expiration: December 2028,
Exercise Price: $11.50 | | | 619 | | | | | | | | 501 | |
BuzzFeed, Inc.
Expiration: December 2026,
Exercise Price: $11.50 | | | 1,666 | | | | | | | | 833 | |
Cazoo Group Ltd.
Expiration: August 2026,
Exercise Price: $11.50 (b) | | | 5,415 | | | | | | | | 4,873 | |
CEC Brands LLC
Expiration: December 2025,
Exercise Price: $21.88 (g) | | | 2,163 | | | | | | | | 6,489 | |
CF Acquisition Corporation VI
Expiration: February 2028,
Exercise Price: $11.50 | | | 225 | | | | | | | | 571 | |
CHP Merger Corporation Class A
Expiration: November 2024,
Exercise Price: $11.50 | | | 1,459 | | | | | | | | 700 | |
Cohn Robbins Holdings Corporation Class A
Expiration: August 2025,
Exercise Price: $11.50 (b) | | | 3,302 | | | | | | | | 2,642 | |
Conx Corporation Class A
Expiration: October 2027,
Exercise Price: $11.50 | | | 2,204 | | | | | | | | 1,895 | |
Decarbonization Plus Acquisition Corporation II Class A
Expiration: October 2025,
Exercise Price: $11.50 | | | 166 | | | | | | | | 261 | |
Deep Lake Capital Acquisition Corporation Class A
Expiration: December 2027,
Exercise Price: $11.50 (b) | | | 2,380 | | | | | | | | 1,475 | |
E.Merge Technology Acquisition Corporation Class A
Expiration: July 2025,
Exercise Price: $11.50 | | | 5,666 | | | | | | | | 3,173 | |
Embark Technology, Inc.
Expiration: December 2027,
Exercise Price: $11.50 | | | 66 | | | | | | | | 129 | |
See Notes to Financial Statements.
15
THE MERGER FUND® VL
SCHEDULE OF INVESTMENTS (Continued)
DECEMBER 31, 2021
| | | | | | | | | | | | |
| | | Shares | | | | | | Value | |
| WARRANTS — continued | | | | | | | | | |
Enjoy Technology, Inc.
Expiration: December 2025,
Exercise Price: $11.50 | | | 193 | | | | | | | $ | 85 | |
Equity Distribution Acquisition Corporation Class A
Expiration: September 2025,
Exercise Price: $11.50 | | | 8,317 | | | | | | | | 6,155 | |
Fortress Capital Acquisition Corporation Class A
Expiration: December 2027,
Exercise Price: $11.50 (b) | | | 983 | | | | | | | | 767 | |
FTAC Athena Acquisition Corporation Class A
Expiration: March 2026,
Exercise Price: $11.50 (b) | | | 916 | | | | | | | | 1,017 | |
GCM Grosvenor, Inc. Class A
Expiration: November 2025,
Exercise Price: $11.50 | | | 2,381 | | | | | | | | 3,571 | |
Ginkgo Bioworks Holdings, Inc.
Expiration: August 2026,
Exercise Price: $11.50 | | | 40 | | | | | | | | 90 | |
Goal Acquisitions Corporation
Expiration: January 2022,
Exercise Price: $11.50 | | | 8,032 | | | | | | | | 4,388 | |
Golden Falcon Acquisition Corporation Class A
Expiration: November 2026,
Exercise Price: $11.50 | | | 2,479 | | | | | | | | 1,562 | |
Healthcare Services Acquisition Corporation Class A
Expiration: December 2027,
Exercise Price: $11.50 | | | 3,215 | | | | | | | | 1,672 | |
Highland Transcend Partners Corporation I Class A
Expiration: December 2027,
Exercise Price: $11.50 (b) | | | 16,723 | | | | | | | | 26,757 | |
InterPrivate III Financial Partners, Inc.
Expiration: December 2027,
Exercise Price: $11.50 | | | 179 | | | | | | | | 251 | |
KL Acquisition Corporation Class A
Expiration: January 2028,
Exercise Price: $11.50 | | | 4,297 | | | | | | | | 2,277 | |
Longview Acquisition Corporation II Class A
Expiration: May 2026,
Exercise Price: $11.50 | | | 1,261 | | | | | | | | 1,072 | |
Marlin Technology Corporation Class A
Expiration: March 2026,
Exercise Price: $11.50 (b) | | | 3,139 | | | | | | | | 2,166 | |
Moneylion, Inc.
Expiration: September 2026,
Exercise Price: $11.50 | | | 11,485 | | | | | | | | 7,121 | |
Motive Capital Corporation Class A
Expiration: December 2025,
Exercise Price: $11.50 (b) | | | 3,398 | | | | | | | | 3,466 | |
Origin Materials, Inc.
Expiration: July 2026,
Exercise Price: $11.50 | | | 7,146 | | | | | | | | 10,647 | |
Pathfinder Acquisition Corporation Class A
Expiration: December 2027,
Exercise Price: $11.50 (b) | | | 1,062 | | | | | | | | 603 | |
Pear Therapeutics, Inc.
Expiration: December 2026,
Exercise Price: $11.50 | | | 100 | | | | | | | | 60 | |
Pioneer Merger Corporation Class A
Expiration: December 2027,
Exercise Price: $11.50 (b) | | | 3,454 | | | | | | | | 2,245 | |
Pontem Corporation Class A
Expiration: December 2027,
Exercise Price: $11.50 (b) | | | 2,248 | | | | | | | | 2,000 | |
See Notes to Financial Statements.
16
THE MERGER FUND® VL
SCHEDULE OF INVESTMENTS (Continued)
DECEMBER 31, 2021
| | | | | | | | | | | | |
| | | Shares | | | | | | Value | |
| WARRANTS — continued | | | | | | | | | |
Prospector Capital Corporation Class A
Expiration: January 2025,
Exercise Price: $11.50 (b) | | | 2,213 | | | | | | | $ | 1,372 | |
Quantum-SI, Inc.
Expiration: September 2027,
Exercise Price: $11.50 | | | 7,060 | | | | | | | | 12,355 | |
RMG Acquisition Corporation III Class A
Expiration: December 2027,
Exercise Price: $11.50 (b) | | | 1,196 | | | | | | | | 1,051 | |
Senior Connect Acquisition Corporation I Class A
Expiration: December 2027,
Exercise Price: $11.50 | | | 2,283 | | | | | | | | 1,199 | |
Spartan Acquisition Corporation III Class A
Expiration: February 2026,
Exercise Price: $11.50 | | | 2,306 | | | | | | | | 3,321 | |
Supernova Partners Acquisition Company III Ltd. Class A
Expiration: March 2027,
Exercise Price: $11.50 (b) | | | 1,493 | | | | | | | | 1,344 | |
Talkspace, Inc.
Expiration: June 2025,
Exercise Price: $11.50 | | | 17,327 | | | | | | | | 4,022 | |
Thunder Bridge Capital Partners III, Inc. Class A
Expiration: February 2028,
Exercise Price: $11.50 | | | 1,095 | | | | | | | | 909 | |
Tishman Speyer Innovation Corporation II Class A
Expiration: December 2027,
Exercise Price: $11.50 | | | 1,028 | | | | | | | | 793 | |
VectoIQ Acquisition Corporation II Class A
Expiration: December 2027,
Exercise Price: $11.50 | | | 1,342 | | | | | | | | 1,167 | |
Virgin Group Acquisition Corporation II Class A
Expiration: March 2026,
Exercise Price: $11.50 (b) | | | 1,063 | | | | | | | | 893 | |
Wejo Group Ltd.
Expiration: November 2026,
Exercise Price: $11.50 (b) | | | 3,597 | | | | | | | | 3,957 | |
Whole Earth Brands, Inc.
Expiration: June 2025,
Exercise Price: $11.50 | | | 7,310 | | | | | | | | 8,553 | |
| | | | | | | | | | | | |
| TOTAL WARRANTS (Cost $325,639) | | | | | | | | | | | 163,882 | |
| | | | | | | | | | | | |
| | | Principal
Amount | | | | | | | |
| BANK LOANS — 1.87% | | | | | | | | | | | | |
Mallinckrodt International Finance S.A.
4.250% (3 Month U.S. LIBOR + 2.750%), 2/28/2022 (f)(i)(k) | | $ | 175,000 | | | | | | | | 170,844 | |
RentPath LLC
8.000% (3 Month U.S. LIBOR + 4.750%), 12/17/2021 (g)(i)(k) | | | 17,879 | | | | | | | | 179 | |
Syniverse Holdings, Inc.
6.000% (3 Month U.S. LIBOR + 5.000%), 3/9/2023 (f)(i) | | | 583,000 | | | | | | | | 578,872 | |
Watts Guerra LLP
8.000%, 12/31/2022 (g) | | | 262,329 | | | | | | | | 261,673 | |
| | | | | | | | | | | | |
| TOTAL BANK LOANS (Cost $1,033,991) | | | | | | | | | | | 1,011,568 | |
| | | | | | | | | | | | |
| | | |
| CONVERTIBLE BONDS — 0.12% (f) | | | | | | | | | |
Nuance Communications, Inc.
1.000%, 12/15/2035 | | | 28,000 | | | | | | | | 63,980 | |
| | | | | | | | | | | | |
| TOTAL CONVERTIBLE BONDS (Cost $59,927) | | | | | | | | | | | 63,980 | |
| | | | | | | | | | | | |
See Notes to Financial Statements.
17
THE MERGER FUND® VL
SCHEDULE OF INVESTMENTS (Continued)
DECEMBER 31, 2021
| | | | | | | | | | | | |
| | | Principal
Amount | | | | | | Value | |
| | | |
| CORPORATE BONDS — 1.62% (f) | | | | | | | | | |
Devon Energy Corporation
5.875%, 6/15/2028 | | $ | 135,000 | | | | | | | $ | 146,216 | |
Forterra Finance LLC/FRTA Finance Corporation
6.500%, 7/15/2025 (h) | | | 250,000 | | | | | | | | 265,325 | |
GrubHub Holdings, Inc.
5.500%, 7/1/2027 (h) | | | 132,000 | | | | | | | | 131,076 | |
Teekay Corporation
9.250%, 11/15/2022 (b)(h) | | | 127,000 | | | | | | | | 130,175 | |
TreeHouse Foods, Inc.
4.000%, 9/1/2028 | | | 114,000 | | | | | | | | 109,440 | |
WeWork Companies, Inc.
7.875%, 5/1/2025 (h) | | | 91,000 | | | | | | | | 86,986 | |
WeWork Companies, Inc./WW Co-Obligor, Inc.
5.000%, 7/10/2025 (h) | | | 8,000 | | | | | | | | 6,945 | |
| | | | | | | | | | | | |
| TOTAL CORPORATE BONDS (Cost $860,842) | | | | | | | | | | | 876,163 | |
| | | | | | | | | | | | |
| | | |
| | | Contracts
(100 shares
per contract) | | | Notional
Amount | | | | |
PURCHASED OPTIONS — 0.03% (a) | | | | | | | | | | | | |
| PURCHASED PUT OPTIONS — 0.03% | | | | | | | | | |
The Hartford Financial Services Group, Inc.
Expiration: March 2022,
Exercise Price: $55.00 | | | 48 | | | $ | 331,392 | | | | 1,680 | |
SPDR S&P 500 ETF Trust | | | | | | | | | | | | |
Expiration: January 2022,
Exercise Price: $465.00 | | | 17 | | | | 807,432 | | | | 4,726 | |
Expiration: January 2022,
Exercise Price: $470.00 | | | 12 | | | | 569,952 | | | | 4,518 | |
Expiration: January 2022,
Exercise Price: $470.00 | | | 7 | | | | 332,472 | | | | 3,507 | |
| | | | | | | | | | | | |
| TOTAL PURCHASED OPTIONS (Cost $30,797) | | | | | | | | | | | 14,431 | |
| | | | | | | | | | | | |
| | | |
| | | Shares | | | | | | | |
| ESCROW NOTES — 2.39% (a) | | | | | | | | | | | | |
Altaba, Inc. (f) | | | 216,901 | | | | | | | | 1,291,646 | |
AMR Corporation (g) | | | 7,668 | | | | | | | | 153 | |
| | | | | | | | | | | | |
| TOTAL ESCROW NOTES (Cost $891,197) | | | | | | | | | | | 1,291,799 | |
| | | | | | | | | | | | |
| | | |
| SHORT-TERM INVESTMENTS — 22.14% | | | | | | | | | | | | |
| MONEY MARKET FUNDS — 22.14% (c)(m) | | | | | | | | | | | | |
Fidelity Institutional Government Portfolio, Institutional Share Class, 0.01% | | | 2,651,000 | | | | | | | | 2,651,000 | |
First American Government Obligations Fund, Institutional Share Class, 0.03% | | | 1,380,998 | | | | | | | | 1,380,998 | |
Goldman Sachs Financial Square Government Fund, Institutional Share Class, 0.03% | | | 2,651,000 | | | | | | | | 2,651,000 | |
The Government & Agency Portfolio, Institutional Share Class, 0.03% | | | 2,651,000 | | | | | | | | 2,651,000 | |
JPMorgan U.S. Government Money Market Fund, Institutional Share Class, 0.03% | | | 2,651,000 | | | | | | | | 2,651,000 | |
| | | | | | | | | | | | |
TOTAL SHORT-TERM INVESTMENTS
(Cost $11,984,998) | | | | | | | | | | | 11,984,998 | |
| | | | | | | | | | | | |
TOTAL LONG INVESTMENTS
(Cost $49,882,610) — 98.03% | | | | | | | | | | | 53,061,630 | |
| | | | | | | | | | | | |
| | | |
| SHORT INVESTMENTS — (9.38)% | | | | | | | | | |
| COMMON STOCKS — (9.21)% | | | | | | | | | | | | |
| COMMERCIAL BANKS & THRIFTS — (0.13)% | | | | | | | | | | | | |
New York Community Bancorp, Inc. | | | (5,885 | ) | | | | | | | (71,856 | ) |
| | | | | | | | | | | | |
| | Shares of this fund are publicly offered, and its prospectus and annual report are publicly available. |
See Notes to Financial Statements.
18
THE MERGER FUND® VL
SCHEDULE OF INVESTMENTS (Continued)
DECEMBER 31, 2021
| | | | | | | | | | | | |
| | | |
| | | Shares | | | | | | Value | |
| ASSET MANAGEMENT & CUSTODY BANKS — (3.13)% | | | | | | | | | | | | |
Apollo Global Management, Inc. | | | (23,408 | ) | | | | | | $ | (1,695,441 | ) |
| | | | | | | | | | | | |
| BANKS — (0.40)% | | | | | | | | | | | | |
M&T Bank Corporation | | | (1,409 | ) | | | | | | | (216,394 | ) |
| | | | | | | | | | | | |
| HOTELS, RESTAURANTS & LEISURE — (0.14)% | | | | | | | | | | | | |
Scientific Games Corporation | | | (1,118 | ) | | | | | | | (74,716 | ) |
| | | | | | | | | | | | |
| INSURANCE — (0.92)% | | | | | | | | | | | | |
Aon plc | | | (1,658 | ) | | | | | | | (498,328 | ) |
| | | | | | | | | | | | |
| INTEGRATED OIL & GAS — (0.07)% | | | | | | | | | | | | |
BP plc — ADR | | | (1,473 | ) | | | | | | | (39,226 | ) |
| | | | | | | | | | | | |
| IT SERVICES — (0.04)% | | | | | | | | | | | | |
Block, Inc. | | | (132 | ) | | | | | | | (21,319 | ) |
| | | | | | | | | | | | |
| METALS & MINING — (1.72)% | | | | | | | | | | | | |
BHP Group Ltd. — ADR | | | (15,413 | ) | | | | | | | (930,175 | ) |
| | | | | | | | | | | | |
| OIL REFINING & MARKETING — (0.55)% | | | | | | | | | | | | |
Phillips 66 | | | (4,060 | ) | | | | | | | (294,188 | ) |
| | | | | | | | | | | | |
| SEMICONDUCTORS & SEMICONDUCTOR EQUIPMENT — (1.84)% | | | | | | | | | | | | |
Advanced Micro Devices, Inc. | | | (5,752 | ) | | | | | | | (827,713 | ) |
MKS Instruments, Inc. | | | (975 | ) | | | | | | | (169,816 | ) |
| | | | | | | | | | | | |
| | | | | | | | | | | (997,529 | ) |
| | | | | | | | | | | | |
| SOFTWARE — (0.27)% | | | | | | | | | | | | |
NortonLifeLock, Inc. | | | (5,546 | ) | | | | | | | (144,085 | ) |
| | | | | | | | | | | | |
TOTAL COMMON STOCKS
(Proceeds $4,912,143) | | | | | | | | | | | (4,983,257 | ) |
| | | | | | | | | | | | |
| | | Principal
Amount | | | | | | | |
| CORPORATE BONDS — (0.17)% (f) | | | | | | | | | | | | |
Devon Energy Corporation
5.850%, 12/15/2025 | | $ | (81,000 | ) | | | | | | | (92,614 | ) |
| | | | | | | | | | | | |
TOTAL CORPORATE BONDS
(Proceeds $88,747) | | | | | | | | | | | (92,614 | ) |
| | | | | | | | | | | | |
TOTAL SHORT INVESTMENTS
(Proceeds $5,000,890) — (9.38)% | | | | | | | | | | | (5,075,871 | ) |
| | | | | | | | | | | | |
| | | |
| TOTAL NET INVESTMENTS | | | | | | | | | |
(Cost $44,881,720) — 88.65% | | | | | | | | | | | 47,985,759 | |
| OTHER ASSETS IN EXCESS OF LIABILITIES — 11.35% | | | | | | | | | | | 6,143,480 | |
| | | | | | | | | | | | |
| TOTAL NET ASSETS — 100.00% | | | | | | | | | | $ | 54,129,239 | |
| | | | | | | | | | | | |
ADR – American Depository Receipt
ETF – Exchange-Traded Fund
LIBOR – London Interbank Offered Rate
plc – Public Limited Company
REIT – Real Estate Investment Trust
| (a) | Non-income producing security. |
| (c) | The rate quoted is the annualized seven-day yield as of December 31, 2021. |
| (d) | Security fair valued by the Valuation Committee in good faith in accordance with the policies adopted by the Board of Trustees. |
| (e) | All or a portion of the shares have been committed as collateral for open securities sold short, written option contracts, swap contracts, and forward currency exchange contracts. |
| (f) | Level 2 Security. Please see Note 2 in the Notes to the Financial Statements for more information. |
| (g) | Level 3 Security. Please see Note 2 in the Notes to the Financial Statements for more information. |
| (h) | Security exempt from registration under Rule 144A of the Securities Act of 1933. These securities may be resold in transactions exempt from registration normally to qualified institutional buyers. As of December 31, 2021, these securities represent 1.15% of total net assets. |
See Notes to Financial Statements.
19
THE MERGER FUND® VL
SCHEDULE OF INVESTMENTS (Continued)
DECEMBER 31, 2021
| (i) | The coupon rate shown on variable rate securities represents the rate as of December 31, 2021. |
| (j) | This security is held in connection with a written option contract. |
| (k) | Default or other conditions exist and the security is not presently accruing income. |
| (l) | Restricted security. The Fund may own investment securities that have other legal or contractual limitations, and thus are restricted as to resale. These securities are valued in accordance with the Fund’s pricing procedures (please see Note 2 in the Notes to the Financial Statements for more information). As of December 31, 2021, these common stocks had a cost of $90,000 and their market value represented 0.09% of total net assets. |
| (m) | Shares of this fund are publicly offered, and its prospectus and annual report are publicly available. |
The Global Industry Classification Standard (GICS®) was developed by and/or is the exclusive property of MSCI, Inc. and Standard & Poor’s Financial Services LLC (“S&P”). GICS is a service mark of MSCI and S&P and has been licensed for use by U.S. Bancorp Fund Services, LLC, doing business as U.S Bank Global Fund Services.
For information regarding the abbreviations, see the Key Investment Terms starting on page 3.
See Notes to Financial Statements.
20
THE MERGER FUND® VL
SCHEDULE OF INVESTMENTS (Continued)
OPEN WRITTEN OPTIONS
DECEMBER 31, 2021
| | | | | | | | | | | | |
| | | Contracts
(100 shares
per contract) | | | Notional
Amount | | | Value | |
| | | |
| WRITTEN CALL OPTIONS | | | | | | | | | |
Arena Pharmaceuticals, Inc.
Expiration: March 2022,
Exercise Price: $95.00 | | | (12 | ) | | $ | (111,528 | ) | | $ | (3,000 | ) |
Cerner Corporation
Expiration: January 2022,
Exercise Price: $95.00 | | | (13 | ) | | | (120,731 | ) | | | (325 | ) |
Expiration: February 2022,
Exercise Price: $95.00 | | | (34 | ) | | | (315,758 | ) | | | (1,020 | ) |
Five9, Inc.
Expiration: January 2022,
Exercise Price: $140.00 | | | (5 | ) | | | (68,660 | ) | | | (2,450 | ) |
The Hartford Financial Services Group, Inc.
Expiration: March 2022,
Exercise Price: $65.00 | | | (48 | ) | | | (331,392 | ) | | | (26,832 | ) |
NortonLifeLock, Inc.
Expiration: January 2022,
Exercise Price: $32.00 | | | (29 | ) | | | (75,342 | ) | | | (145 | ) |
Social Capital Hedosophia Holdings Corporation VI Class A
Expiration: January 2022,
Exercise Price: $10.00 | | | (43 | ) | | | (43,817 | ) | | | (1,032 | ) |
SPDR S&P 500 ETF Trust
Expiration: January 2022,
Exercise Price: $480.00 | | | (11 | ) | | | (522,456 | ) | | | (3,317 | ) |
Sportsman’s Warehouse Holdings, Inc.
Expiration: January 2022,
Exercise Price: $20.00 | | | (13 | ) | | | (15,340 | ) | | | (65 | ) |
Vonage Holdings Corporation
Expiration: January 2022,
Exercise Price: $21.00 | | | (7 | ) | | | (14,553 | ) | | | (35 | ) |
| | | | | | | | | | | | |
| | | | | | | | | | | (38,221 | ) |
| | | | | | | | | | | | |
| | | |
| WRITTEN PUT OPTIONS | | | | | | | | | |
SPDR S&P 500 ETF Trust
Expiration: January 2022,
Exercise Price: $450.00 | | | (18 | ) | | | (854,928 | ) | | | (2,241 | ) |
Expiration: January 2022,
Exercise Price: $455.00 | | | (8 | ) | | | (379,968 | ) | | | (1,912 | ) |
| | | | | | | | | | | | |
| | | | | | | | | | | (4,153 | ) |
| | | | | | | | | | | | |
| | | |
TOTAL WRITTEN OPTIONS
(Premiums received $51,315) | | | | | | | | $ (42,374) | |
| | | | | | | | | | | | |
ETF – Exchange-Traded Fund
See Notes to Financial Statements.
21
THE MERGER FUND® VL
SCHEDULE OF INVESTMENTS (Continued)
FORWARD CURRENCY EXCHANGE CONTRACTS
DECEMBER 31, 2021
| | | | | | | | | | | | | | | | | | | | | | | | | | | | | | |
Settlement
Date | | Counterparty | | Currency to
be Delivered | | | USD Value at
December 31, 2021 | | | Currency to
be Received | | | USD Value at
December 31, 2021 | | | Unrealized
Appreciation
(Depreciation)* | |
1/5/2022 | | JPM | | | 811,407 | | | | AUD | | | | $ 590,346 | | | | 610,205 | | | | USD | | | | $ 610,205 | | | | $19,859 | |
1/5/2022 | | JPM | | | 578,685 | | | | USD | | | | 578,685 | | | | 811,407 | | | | AUD | | | | 590,347 | | | | 11,662 | |
4/8/2022 | | GS | | | 331,169 | | | | AUD | | | | 241,010 | | | | 236,589 | | | | USD | | | | 236,589 | | | | (4,421 | ) |
4/11/2022 | | GS | | | 160,274 | | | | AUD | | | | 116,641 | | | | 114,741 | | | | USD | | | | 114,741 | | | | (1,900 | ) |
4/11/2022 | | JPM | | | 298,424 | | | | AUD | | | | 217,182 | | | | 219,270 | | | | USD | | | | 219,270 | | | | 2,088 | |
1/12/2022 | | JPM | | | 226,459 | | | | CAD | | | | 179,024 | | | | 177,212 | | | | USD | | | | 177,212 | | | | (1,812 | ) |
5/20/2022 | | JPM | | | 700,246 | | | | CAD | | | | 553,245 | | | | 553,560 | | | | USD | | | | 553,560 | | | | 315 | |
1/13/2022 | | JPM | | | 281,065 | | | | EUR | | | | 320,076 | | | | 326,557 | | | | USD | | | | 326,557 | | | | 6,481 | |
1/14/2022 | | GS | | | 38,648 | | | | EUR | | | | 44,013 | | | | 43,807 | | | | USD | | | | 43,807 | | | | (206 | ) |
1/14/2022 | | JPM | | | 658,859 | | | | EUR | | | | 750,323 | | | | 748,167 | | | | USD | | | | 748,167 | | | | (2,156 | ) |
2/11/2022 | | GS | | | 790,107 | | | | EUR | | | | 900,297 | | | | 891,849 | | | | USD | | | | 891,849 | | | | (8,448 | ) |
4/29/2022 | | GS | | | 7,052 | | | | EUR | | | | 8,050 | | | | 8,000 | | | | USD | | | | 8,000 | | | | (50 | ) |
6/24/2022 | | GS | | | 10,148 | | | | EUR | | | | 11,604 | | | | 11,636 | | | | USD | | | | 11,636 | | | | 32 | |
2/10/2022 | | JPM | | | 49,004 | | | | GBP | | | | 66,320 | | | | 65,634 | | | | USD | | | | 65,634 | | | | (686 | ) |
3/11/2022 | | JPM | | | 10,724 | | | | GBP | | | | 14,511 | | | | 14,855 | | | | USD | | | | 14,855 | | | | 344 | |
4/20/2022 | | GS | | | 853,900 | | | | GBP | | | | 1,155,128 | | | | 1,171,497 | | | | USD | | | | 1,171,497 | | | | 16,369 | |
4/20/2022 | | GS | | | 46,615 | | | | USD | | | | 46,615 | | | | 34,708 | | | | GBP | | | | 46,951 | | | | 336 | |
1/13/2022 | | JPM | | | 207,559 | | | | HKD | | | | 26,620 | | | | 26,615 | | | | USD | | | | 26,615 | | | | (5 | ) |
1/13/2022 | | JPM | | | 9,085 | | | | USD | | | | 9,085 | | | | 70,842 | | | | HKD | | | | 9,085 | | | | — | |
1/12/2022 | | JPM | | | 51,881,628 | | | | JPY | | | | 451,067 | | | | 471,112 | | | | USD | | | | 471,112 | | | | 20,045 | |
3/25/2022 | | JPM | | | 10,377,400 | | | | JPY | | | | 90,283 | | | | 91,047 | | | | USD | | | | 91,047 | | | | 764 | |
2/16/2022 | | JPM | | | 1,414,465 | | | | SEK | | | | 156,590 | | | | 154,680 | | | | USD | | | | 154,680 | | | | (1,910 | ) |
| | | | | | | | | | | | | | | | | | | | | | | | | | | | | | |
| | | | | | | | | | | | | $6,526,715 | | | | | | | | | | | | $6,583,416 | | | | $56,701 | |
| | | | | | | | | | | | | | | | | | | | | | | | | | | | | | |
AUD – Australian Dollar
CAD – Canadian Dollar
EUR – Euro
GBP – British Pound
GS – Goldman, Sachs & Co.
HKD – Hong Kong Dollar
JPM – JPMorgan Chase & Co., Inc.
JPY – Japanese Yen
SEK – Swedish Krona
USD – U.S. Dollar
| * | Net unrealized appreciation (depreciation) is a receivable (payable). |
See Notes to Financial Statements.
22
THE MERGER FUND® VL
SCHEDULE OF INVESTMENTS (Continued)
OPEN SWAP CONTRACTS*
DECEMBER 31, 2021
| | | | | | | | | | | | | | | | | | | | | | |
Counterparty | | Security | | Termination
Date | | Pay/Receive
on Financing
Rate | | Financing Rate | | Payment
Frequency | | Shares | | | Notional
Amount | | | Unrealized
Appreciation
(Depreciation)** | |
| LONG TOTAL RETURN SWAP CONTRACTS | | | | | | | | | | | | | | |
| GS | | Afterpay Ltd. | | 9/3/2022 | | Pay | | 0.660% (0.610% + SOFR) | | Monthly | | | 1,153 | | | $ | 109,671 | | | $ | (40,053 | ) |
| JPM | | Ausnet Services | | 12/2/2022 | | Pay | | 0.620% (0.550% + Overnight
Banking Rate) | | Quarterly | | | 112,613 | | | | 213,269 | | | | (2,768 | ) |
| GS | | Ausnet Services | | 1/9/2023 | | Pay | | 0.660% (0.610% + SOFR) | | Monthly | | | 60,481 | | | | 109,222 | | | | 3,841 | |
| GS | | Avast plc | | 9/11/2022 | | Pay | | 0.660% (0.610% + SOFR) | | Monthly | | | 183,465 | | | | 1,476,352 | | | | 31,160 | |
| JPM | | Blue Prism Group plc | | 11/27/2022 | | Pay | | 0.520% (0.450% + Overnight
Banking Rate) | | Quarterly | | | 4,356 | | | | 65,238 | | | | 9,213 | |
| GS | | BP Midstream Partners LP | | 1/21/2023 | | Pay | | 1.060% (1.010% + SOFR) | | Monthly | | | 2,561 | | | | 38,737 | | | | 436 | |
| BAML | | Bristol-Myers Squibb Company (2) | | 3/2/2022 | | Pay | | 0.000%(1) | | Monthly | | | 5,135 | | | | — | (1) | | | 5,777 | |
| BAML | | Brookfield Property REIT, Inc., 6.25%, Series A | | 12/8/2022 | | Pay | | 0.820% (0.750% + Overnight
Banking Rate) | | Monthly | | | 701 | | | | 17,595 | | | | 713 | |
| BAML | | Cazoo Group Ltd. | | 12/24/2022 | | Receive | | (12.930)% ((13.000)% + Overnight
Banking Rate) | | Monthly | | | 2,759 | | | | 24,141 | | | | (7,479 | ) |
| GS | | Cazoo Group Ltd. | | 12/26/2022 | | Receive | | (12.840)% ((12.890)% + SOFR) | | Monthly | | | 7,434 | | | | 60,893 | | | | (15,816 | ) |
| BAML | | CNP Assurances | | 12/8/2022 | | Pay | | 0.570% (0.500% + Overnight
Banking Rate) | | Monthly | | | 12,834 | | | | 320,307 | | | | (2,538 | ) |
| BAML | | Cominar Real Estate Investment Trust | | 12/29/2022 | | Pay | | 1.104% (1.000% + 1 Month
U.S. LIBOR) | | Monthly | | | 19,301 | | | | 174,374 | | | | 3,936 | |
| JPM | | Deutsche Industrie REIT AG | | 12/2/2022 | | Pay | | 0.620% (0.550% + Overnight
Banking Rate) | | Quarterly | | | 2,333 | | | | 61,421 | | | | (1,411 | ) |
| JPM | | Hitachi Metals Ltd. | | 6/24/2022 | | Pay | | 0.620% (0.550% + Overnight
Banking Rate) | | Quarterly | | | 23,788 | | | | 460,158 | | | | (19,606 | ) |
| JPM | | Lundin Energy AB | | 1/27/2023 | | Pay | | 0.620% (0.550% + Overnight
Banking Rate) | | Quarterly | | | 1,186 | | | | 42,560 | | | | 29 | |
| GS | | Meggit plc | | 9/10/2022 | | Pay | | 0.860% (0.810% + SOFR) | | Monthly | | | 102,399 | | | | 1,079,862 | | | | (57,255 | ) |
| GS | | Neles OY | | 1/1/2023 | | Pay | | 0.660% (0.610% + SOFR) | | Monthly | | | 4,149 | | | | 63,209 | | | | 1,450 | |
| GS | | Phillips 66 Partners LP | | 1/22/2023 | | Pay | | 0.660% (0.610% + SOFR) | | Monthly | | | 8,121 | | | | 292,969 | | | | (80 | ) |
| GS | | Siltronic AG (tender line) | | 4/2/2022 | | Pay | | 0.660% (0.610% + SOFR) | | Monthly | | | 5,111 | | | | 860,905 | | | | (42,947 | ) |
| GS | | Siltronic AG | | 5/7/2022 | | Pay | | 0.660% (0.610% + SOFR) | | Monthly | | | 393 | | | | 65,120 | | | | (1,844 | ) |
| JPM | | Soho China Ltd. | | 7/22/2022 | | Pay | | 0.620% (0.550% + Overnight
Banking Rate) | | Quarterly | | | 44,891 | | | | 26,001 | | | | (16,108 | ) |
| JPM | | Suez | | 1/18/2022 | | Pay | | 0.620% (0.550% + Overnight
Banking Rate) | | Quarterly | | | 34,343 | | | | 768,576 | | | | 5,758 | |
| GS | | Suez | | 12/17/2022 | | Pay | | 0.660% (0.610% + SOFR) | | Monthly | | | 1,947 | | | | 43,406 | | | | 496 | |
| GS | | Swedish Orphan Biovitrum A.B. | | 1/3/2023 | | Pay | | 0.660% (0.610% + SOFR) | | Monthly | | | 6,019 | | | | 163,800 | | | | (40,540 | ) |
| GS | | Sydney Airport | | 12/29/2022 | | Pay | | 0.660% (0.610% + SOFR) | | Monthly | | | 37,848 | | | | 228,494 | | | | 10,472 | |
| JPM | | Toshiba Corporation | | 5/16/2022 | | Pay | | 0.620% (0.550% + Overnight
Banking Rate) | | Quarterly | | | 1,958 | | | | 84,326 | | | | (3,839 | ) |
| JPM | | Ultra Electronics Holdings plc | | 9/16/2022 | | Pay | | 0.520% (0.450% + Overnight
Banking Rate) | | Quarterly | | | 305 | | | | 14,144 | | | | (1,019 | ) |
| GS | | Uniper S.E. | | 12/12/2022 | | Pay | | 0.660% (0.610% + SOFR) | | Monthly | | | 237 | | | | 10,264 | | | | 1,012 | |
| GS | | Vifore Pharma AG | | 1/15/2023 | | Pay | | 0.660% (0.610% + SOFR) | | Monthly | | | 1,365 | | | | 233,879 | | | | 9,124 | |
| GS | | Willis Towers Watson plc | | 10/27/2022 | | Pay | | 0.660% (0.610% + SOFR) | | Monthly | | | 2,070 | | | | 479,371 | | | | 12,126 | |
| BAML | | Xilinx, Inc. | | 12/8/2022 | | Pay | | 0.820% (0.750% + Overnight
Banking Rate) | | Monthly | | | 174 | | | | 34,541 | | | | 2,348 | |
See Notes to Financial Statements.
23
THE MERGER FUND® VL
SCHEDULE OF INVESTMENTS (Continued)
OPEN SWAP CONTRACTS*
DECEMBER 31, 2021
| | | | | | | | | | | | | | | | | | | | | | | | | | | | |
Counterparty | | Security | | Termination
Date | | | Pay/Receive
on Financing
Rate | | | Financing Rate | | Payment
Frequency | | | Shares | | | Notional
Amount | | | Unrealized
Appreciation
(Depreciation)** | |
| SHORT TOTAL RETURN SWAP CONTRACTS | | | | | | | | | | | | | | | | | | | |
| GS | | Advanced Micro Devices, Inc. | | | 1/10/2023 | | | | Pay | | | (0.300)% ((0.350)% + SOFR) | | | Monthly | | | | (22,615 | ) | | $ | (3,133,308 | ) | | $ | (121,318 | ) |
| JPM | | Aker BP ASA | | | 1/27/2023 | | | | Pay | | | (0.430)% ((0.500)% + Overnight Banking Rate) | | | Quarterly | | | | (1,127 | ) | | | (34,942 | ) | | | 185 | |
| JPM | | American Airlines Group, Inc. | | | 9/19/2022 | | | | Pay | | | (0.530)% ((0.600)% + Overnight Banking Rate) | | | Quarterly | | | | (70 | ) | | | (1,311 | ) | | | 54 | |
| GS | | BHP Group Ltd. | | | 10/3/2022 | | | | Pay | | | (0.700)% ((0.750)% + SOFR) | | | Monthly | | | | (14,481 | ) | | | (438,694 | ) | | | 1,366 | |
| JPM | | BHP Group Ltd. | | | 10/3/2022 | | | | Pay | | | (0.580)% ((0.650)% + Overnight Banking Rate) | | | Quarterly | | | | (9,814 | ) | | | (302,381 | ) | | | 5,981 | |
| GS | | BHP Group Ltd. — ADR | | | 9/18/2022 | | | | Pay | | | (0.902)% ((0.952)% + SOFR) | | | Monthly | | | | (9,010 | ) | | | (590,585 | ) | | | 46,670 | |
| JPM | | CTP N.V. | | | 12/2/2022 | | | | Pay | | | (0.330)% ((0.400)% + Overnight Banking Rate) | | | Quarterly | | | | (2,920 | ) | | | (62,778 | ) | | | 602 | |
| GS | | II-VI, Inc. | | | 5/12/2022 | | | | Pay | | | (0.300)% ((0.350)% + SOFR) | | | Monthly | | | | (9,335 | ) | | | (700,754 | ) | | | 62,830 | |
| BAML | | S&P Global, Inc. | | | 1/10/2023 | | | | Pay | | | (0.330)% ((0.400)% + Overnight Banking Rate) | | | Monthly | | | | (7,908 | ) | | | (3,750,384 | ) | | | 18,155 | |
| GS | | Square, Inc. | | | 11/28/2022 | | | | Pay | | | (0.300)% ((0.350)% + SOFR) | | | Monthly | | | | (1,845 | ) | | | (482,154 | ) | | | 184,139 | |
| GS | | Valmet Corporation | | | 1/1/2023 | | | | Pay | | | (0.220)% ((0.270)% + SOFR) | | | Monthly | | | | (1,360 | ) | | | (57,053 | ) | | | (1,353 | ) |
| | | | | | | | | | | | | | | | | | | | | | | | | | | | |
| | | | | | | | | | | | | | | | | | | | | | | | | | $ | 41,899 | |
| | | | | | | | | | | | | | | | | | | | | | | | | | | | |
|
BAML– Bank of America Merrill Lynch & Co., Inc. |
GS– Goldman, Sachs & Co. |
JPM– JPMorgan Chase & Co., Inc. |
LIBOR– London Interbank Offered Rate |
OvernightBanking Rate – Overnight Banking Funding Rate |
plc– Public Limited Company |
REIT– Real Estate Investment Trust |
SOFR– Secured Overnight Financing Rate |
| * | There were no upfront premiums paid or received for the open swap contracts held. |
| ** | Based on the net swap value held at each counterparty, unrealized appreciation (depreciation) is a receivable (payable). |
| (1) | Security held is the direct result of a corporate action. There is no associated financing rate and the security is held with a zero cost basis. |
| (2) | Level 3 Security. Please see Note 2 in the Notes to the Financial Statements for more information. |
See Notes to Financial Statements.
24
THE MERGER FUND® VL
STATEMENT OF ASSETS AND LIABILITIES
DECEMBER 31, 2021
| | | | | | | | |
| ASSETS: | | | | | | | | |
Investments, at value (Cost $49,882,610) | | | | | | $ | 53,061,630 | |
Cash | | | | | | | 1,254 | |
Cash held in foreign currency (Cost $331) | | | | | | | 333 | |
Deposits at brokers for securities sold short | | | | | | | 5,122,962 | |
Deposits at brokers for other investments | | | | | | | 1,660,176 | |
Receivable for forward currency exchange contracts | | | | | | | 56,701 | |
Receivable for swap contracts | | | | | | | 64,828 | |
Receivable for investments sold | | | | | | | 281,454 | |
Dividends and interest receivable | | | | | | | 36,437 | |
Receivable for fund shares issued | | | | | | | 223 | |
Prepaid expenses and other receivables | | | | | | | 235 | |
| | | | | | | | |
| | |
Total Assets | | | | | | | 60,286,233 | |
| | | | | | | | |
| LIABILITIES: | | | | | | | | |
Securities sold short, at value (Proceeds of $5,000,890) | | | 5,075,871 | | | | | |
Written option contracts, at value
(Premiums received $51,315) | | | 42,374 | | | | | |
Payable for swap contracts | | | 22,929 | | | | | |
Payable for investments purchased | | | 878,681 | | | | | |
Payable to the investment adviser | | | 51,791 | | | | | |
Payable for fund shares redeemed | | | 5,742 | | | | | |
Dividends and interest payable | | | 226 | | | | | |
Accrued expenses and other liabilities | | | 79,380 | | | | | |
| | | | | | | | |
| | |
Total Liabilities | | | | | | | 6,156,994 | |
| | | | | | | | |
| NET ASSETS | | | | | | $ | 54,129,239 | |
| | | | | | | | |
| NET ASSETS CONSISTS OF: | | | | | | | | |
Paid-in capital | | | | | | $ | 50,975,550 | |
Distributable earnings | | | | | | | 3,153,689 | |
| | | | | | | | |
| | |
Total Net Assets | | | | | | $ | 54,129,239 | |
| | | | | | | | |
| | |
NET ASSET VALUE and offering price per share*
($54,129,239 / 4,598,946 shares of beneficial interest outstanding) | | | | | | $ | 11.77 | |
| | | | | | | | |
| * | The redemption price per share may vary based on the length of time a shareholder holds Fund shares. |
See Notes to Financial Statements.
25
THE MERGER FUND® VL
STATEMENT OF OPERATIONS
FOR THE YEAR ENDED DECEMBER 31, 2021
| | | | | | | | |
| INVESTMENT INCOME: | | | | | | | | |
Dividend income on long positions (net of foreign withholding taxes of $266) | | | | | | $ | 423,322 | |
Interest | | | | | | | 106,233 | |
| | | | | | | | |
| | |
Total investment income | | | | | | | 529,555 | |
| | | | | | | | |
| EXPENSES: | | | | | | | | |
Investment advisory fees (Note 4) | | | 698,849 | | | | | |
Professional fees | | | 85,923 | | | | | |
Transfer agent and shareholder servicing agent fees (Note 4) | | | 70,795 | | | | | |
Administration fees (Note 4) | | | 43,030 | | | | | |
Custody fees | | | 40,355 | | | | | |
Reports to shareholders | | | 25,195 | | | | | |
Fund accounting expenses (Note 4) | | | 20,164 | | | | | |
Trustees’ fees and expenses | | | 13,898 | | | | | |
Miscellaneous expenses | | | 4,250 | | | | | |
Compliance fees | | | 2,298 | | | | | |
Federal registration fees | | | 1,514 | | | | | |
Dividends and interest on securities sold short | | | 35,789 | | | | | |
Borrowing expenses on securities sold short | | | 27,372 | | | | | |
| | | | | | | | |
| | |
Total expenses before expense reimbursement by adviser | | | | | | | 1,069,432 | |
Expense reimbursed by adviser (Note 4) | | | | | | | (223,540 | ) |
| | | | | | | | |
| | |
Net expenses | | | | | | | 845,892 | |
| | | | | | | | |
NET INVESTMENT LOSS | | | | | | | (316,337 | ) |
| | | | | | | | |
| REALIZED AND CHANGE IN UNREALIZED GAIN (LOSS) ON INVESTMENTS: | | | | | | | | |
Realized gain (loss) on: | | | | | | | | |
| | |
Investments | | | 6,079,497 | | | | | |
| | |
Securities sold short | | | (264,402 | ) | | | | |
| | |
Written option contracts expired or closed | | | 177,662 | | | | | |
| | |
Forward currency exchange contracts | | | 90,759 | | | | | |
| | |
Swap contracts | | | (6,219,820 | ) | | | | |
| | |
Foreign currency transactions | | | (8,681 | ) | | | | |
| | | | | | | | |
| | |
Net realized loss | | | | | | | (144,985 | ) |
Change in unrealized appreciation (depreciation) on: | | | | | | | | |
| | |
Investments | | | (135,365 | ) | | | | |
| | |
Securities sold short | | | (129 | ) | | | | |
| | |
Written option contracts | | | 8,052 | | | | | |
| | |
Forward currency exchange contracts | | | 195,619 | | | | | |
| | |
Swap contracts | | | 850,991 | | | | | |
| | |
Foreign currency translation | | | 2 | | | | | |
| | | | | | | | |
Net change in unrealized appreciation | | | | | | | 919,170 | |
| | | | | | | | |
NET REALIZED AND CHANGE IN UNREALIZED GAIN ON INVESTMENTS | | | | | | | 774,185 | |
| | | | | | | | |
NET INCREASE IN NET ASSETS RESULTING FROM OPERATIONS | | | | | | $ | 457,848 | |
| | | | | | | | |
See Notes to Financial Statements.
26
THE MERGER FUND® VL
STATEMENT OF CHANGES IN NET ASSETS
| | | | | | | | |
| | | Year Ended
December 31, 2021 | | | Year Ended
December 31, 2020 | |
Net investment loss | | $ | (316,337 | ) | | $ | (92,340 | ) |
Net realized gain (loss) on investments, securities sold short, written option contracts expired or closed, forward currency exchange contracts, swap contracts and foreign currency transactions | | | (144,985 | ) | | | 2,984,862 | |
Net change in unrealized appreciation on investments, securities sold short, written option contracts, forward currency exchange contracts, swap contracts and foreign currency translation | | | 919,170 | | | | 564,100 | |
| | | | | | | | |
Net increase in net assets resulting from operations | | | 457,848 | | | | 3,456,622 | |
| | | | | | | | |
| | |
Distributions to shareholders from: (Note 11) | | | | | | | | |
Total dividends and distributions to shareholders | | | (2,516,139 | ) | | | (132,148 | ) |
| | | | | | | | |
| | |
Net increase in net assets from capital share transactions (Note 6) | | | 4,434,080 | | | | 466,359 | |
| | | | | | | | |
Net increase in net assets | | | 2,375,789 | | | | 3,790,833 | |
| | |
NET ASSETS: | | | | | | | | |
Beginning of year | | | 51,753,450 | | | | 47,962,617 | |
| | | | | | | | |
End of year | | $ | 54,129,239 | | | $ | 51,753,450 | |
| | | | | | | | |
See Notes to Financial Statements.
27
THE MERGER FUND® VL
FINANCIAL HIGHLIGHTS
Selected per share data is based on a share of beneficial interest outstanding throughout each year.(1)
| | | | | | | | | | | | | | | | | | | | |
| |
| | | Year Ended December 31, | |
| | | | | |
| | | 2021 | | | 2020 | | | 2019 | | | 2018 | | | 2017 | |
| | | | | |
| Per Share Data: | | | | | | | | | | | | | | | | | | | | |
| Net asset value, beginning of year | | $ | 12.21 | | | $ | 11.40 | | | $ | 11.36 | | | $ | 10.80 | | | $ | 10.53 | |
| | | | | | | | | | | | | | | | | | | | |
| Income from investment operations: | | | | | | | | | | | | | | | | | | | | |
Net investment income (loss)(2) | | | (0.07 | ) | | | (0.02 | ) | | | 0.06 | | | | 0.14 | | | | 0.04 | |
Net realized and unrealized gain on investments | | | 0.20 | | | | 0.86 | | | | 0.64 | | | | 0.63 | | | | 0.23 | |
| | | | | | | | | | | | | | | | | | | | |
Total from investment operations | | | 0.13 | | | | 0.84 | | | | 0.70 | | | | 0.77 | | | | 0.27 | |
| | | | | | | | | | | | | | | | | | | | |
| Less distributions: | | | | | | | | | | | | | | | | | | | | |
From net investment income | | | — | | | | — | | | | (0.12 | ) | | | (0.08 | ) | | | — | |
From net realized gains | | | (0.57 | ) | | | (0.03 | ) | | | (0.54 | ) | | | (0.13 | ) | | | — | |
| | | | | | | | | | | | | | | | | | | | |
Total dividends and distributions | | | (0.57 | ) | | | (0.03 | ) | | | (0.66 | ) | | | (0.21 | ) | | | — | |
| | | | | | | | | | | | | | | | | | | | |
| Net Asset Value, end of year | | $ | 11.77 | | | $ | 12.21 | | | $ | 11.40 | | | $ | 11.36 | | | $ | 10.80 | |
| | | | | | | | | | | | | | | | | | | | |
| Total Return | | | 1.08 | % | | | 7.38 | % | | | 6.17 | % | | | 7.09 | % | | | 2.56 | % |
| | | | | |
| Supplemental data and ratios: | | | | | | | | | | | | | | | | | | | | |
| Net assets, end of year (000’s) | | $ | 54,129 | | | $ | 51,753 | | | $ | 47,963 | | | $ | 41,648 | | | $ | 31,990 | |
| Ratio of gross expenses to average net assets: | | | | | | | | | | | | | | | | | |
Before expense reimbursement | | | 1.91 | % | | | 1.91 | % | | | 2.43 | %(4) | | | 2.57 | % | | | 2.51 | % |
After expense reimbursement | | | 1.51 | % | | | 1.46 | % | | | 1.91 | %(4) | | | 1.84 | % | | | 1.78 | % |
| Ratio of dividends and interest on short positions and borrowing expense on securities sold short to average net assets | | | 0.11 | % | | | 0.06 | % | | | 0.51 | %(4) | | | 0.44 | % | | | 0.38 | % |
| Ratio of operating expenses to average net assets excluding dividends and interest on short positions and borrowing expense on securities sold short (after expense reimbursement) | | | 1.40 | % | | | 1.40 | % | | | 1.40 | %(5) | | | 1.40 | % | | | 1.40 | % |
| Ratio of net investment income (loss) to average net assets | | | (0.57 | )% | | | (0.19 | )% | | | 0.48 | % | | | 1.20 | % | | | 0.34 | % |
| Portfolio turnover rate(3) | | | 164 | % | | | 189 | % | | | 172 | % | | | 154 | % | | | 184 | % |
| (1) | The figures presented do not reflect any fees or charges imposed by participating life insurance companies under their variable annuity and variable life insurance contracts. If the fees and charges imposed by participating life insurance companies under their variable annuity and variable life insurance contracts were included, the fees and expenses of the Fund would be higher than those shown in the table. |
| (2) | Net investment income (loss) per share has been calculated based on average shares outstanding during the year. |
| (3) | The numerator for the portfolio turnover rate includes the lesser of purchases or sales (excluding short-term investments, short-term options, forward currency contracts, swap contracts and short positions). The denominator includes the average long positions throughout the year. |
| (4) | The amount for the year ended December 31, 2019 includes 0.05% of legal expenses related to the settlement of an appraisal right. |
| (5) | The amount for the year ended December 31, 2019 excludes 0.05% of legal expenses related to the settlement of an appraisal right. |
See Notes to Financial Statements.
28
The Merger Fund® VL
NOTES TO THE FINANCIAL STATEMENTS
December 31, 2021
Note 1. ORGANIZATION
The Merger Fund VL (the “Fund”) is a no-load, open-end, diversified investment company organized as a statutory trust under the laws of Delaware on November 22, 2002, and registered under the Investment Company Act of 1940, as amended (the “1940 Act”). The Fund commenced operations on May 26, 2004.
The Fund’s investment objective is outlined in its Fund Summary page. There is no guarantee that the Fund will achieve its objective(s).
The Fund’s shares are currently offered only to separate accounts funding variable annuity and variable life insurance contracts.
The Fund offers Class I shares.
Note 2. SIGNIFICANT ACCOUNTING POLICIES
The Fund is an investment company that follows the accounting and reporting guidance of Financial Accounting Standards Board (“FASB”) Accounting Standards Codification Topic 946 Financial Services – Investment Companies. The following is a summary of significant accounting policies consistently followed by the Fund in the preparation of its financial statements. The preparation of financial statements in conformity with U.S. generally accepted accounting principles (“U.S. GAAP”) requires management to make estimates and assumptions that affect the reported amounts of assets and liabilities, disclosure of contingent assets and liabilities at the date of the financial statements, and the reported amounts of increases and decreases in net assets from operations during the reporting period. Actual results could differ from those estimates and those differences could be significant.
Starting October 1, 2021, concurrent with the change in adviser to Virtus Investment Advisers, Inc. (the “Adviser”) (as detailed in Note 4A), the Fund adopted valuation policies and procedures used by the other Virtus-sponsored registered funds.
The Fund utilizes a fair value hierarchy which prioritizes the inputs to valuation techniques used to measure fair value into three broad levels. The Fund’s policy is to recognize transfers into or out of Level 3 at the end of the reporting period.
| | • Level 1 – | quoted prices in active markets for identical securities (security types generally include listed equities). |
| | • Level 2 – | prices determined using other significant observable inputs (including quoted prices for similar securities, interest rates, prepayment speeds, credit risk, etc.). |
| | • Level 3 – | prices determined using significant unobservable inputs (including the Valuation Committee’s own assumptions in determining the fair value of investments). |
A description of the valuation techniques applied to the Fund’s major categories of assets and liabilities measured at fair value on a recurring basis is as follows:
Equity securities are valued at the official closing price (typically last sale) on the exchange on which the securities are primarily traded or, if no closing price is available, at the last bid price and are categorized as Level 1 in the hierarchy. Restricted equity securities and private placements that are illiquid, or are internally fair valued by the Valuation Committee, are generally categorized as Level 3 in the hierarchy.
Certain non-U.S. securities may be fair valued in cases where closing prices are not readily available or are deemed not reflective of readily available market prices. For example, significant events (such as movement in the U.S. securities market, or other regional and local developments) may occur between the time that non-U.S. markets close (where the security is principally traded) and the time that the Fund calculates its net asset value (“NAV”) at the close of regular trading on the New York Stock Exchange (“NYSE”) (generally 4 p.m. Eastern time) that may impact the value of securities traded in these non-U.S. markets. In such cases, the Fund fair value non-U.S. securities using an independent pricing service which considers the correlation of the trading patterns of the non-U.S. security to the intraday trading in the U.S. markets for investments such as ADRs, financial futures, ETFs, and certain indexes, as well as prices for similar securities. Such fair valuations are categorized as Level 2 in the hierarchy. Because the frequency of significant events is not predictable, fair valuation of certain non-U.S. common stocks may occur on a frequent basis.
Listed derivatives, such as options and futures, that are actively traded are valued at the last posted settlement price from the exchange where they are principally traded and are categorized as Level 1 in the hierarchy. Over-the-counter (“OTC”) derivative contracts, which include forward currency contracts, swaps, swaptions, options and equity linked instruments, are valued based on model prices provided by independent pricing services or from dealer quotes. Depending on the derivative type and the specific terms of the transaction, these models vary and include observable inputs in actively quoted markets including but not limited to: underlying reference entity details, indices, spreads, interest rates, yield curves, dividend and exchange rates. These instruments are generally categorized as Level 2 in the hierarchy. Centrally cleared swaps listed or traded on a bilateral or trade facility platform, such as a registered exchange, are valued at the last posted settlement price determined by the respective exchange. These securities are generally categorized as Level 2 within the hierarchy.
Debt securities, including convertible bonds, and restricted securities, are valued based on evaluated quotations received from independent pricing services or from dealers who make markets in such securities. For most bond types, the pricing service utilizes matrix pricing that considers one or more of the following factors: yield or price of bonds of comparable quality, coupon, maturity, current cash flows, type, activity of the underlying equities, and current day trade information, as well as dealer supplied prices. These valuations are generally categorized as Level 2 in the hierarchy. Structured debt instruments, such as mortgage-backed and asset-backed securities may also incorporate collateral analysis and utilize cash flow models for valuation and are generally categorized as Level 2 in the hierarchy. Pricing services do not provide pricing for all securities and therefore indicative bids from dealers are utilized which are based on pricing models used by market makers in the security and are generally categorized as Level 2 in the hierarchy. Debt securities that are internally fair valued by the Valuation Committee are generally categorized as Level 3 in the hierarchy.
29
The Merger Fund® VL
NOTES TO THE FINANCIAL STATEMENTS (Continued)
December 31, 2021
Investments in open-end mutual funds are valued at NAV. Investments in closed-end funds and ETFs are valued as of the close of regular trading on the NYSE each business day. Each is categorized as Level 1 in the hierarchy.
The following table summarizes the market value of the Fund’s investments as of December 31, 2021, based on the inputs used to value them:
| | | | | | | | | | | | | | | | |
Investments at Fair Value | | Level 1 | | | Level 2 | | | Level 3 | | | Total | |
| Assets | | | | | | | | | | | | | | | | |
Common Stocks* | | $ | 27,389,949 | | | $ | 240,128 | | | $ | — | | | $ | 27,630,077 | |
Special Purpose Acquisition Companies | | | 9,861,000 | | | | — | | | | — | *** | | | 9,861,000 | |
Private Investments in Public Equity | | | 4,260 | | | | — | | | | 48,393 | | | | 52,653 | |
Preferred Stocks | | | 46,029 | | | | — | | | | — | | | | 46,029 | |
Contingent Value Rights | | | — | | | | 56,358 | | | | 879 | | | | 57,237 | |
Rights | | | — | | | | — | | | | 7,813 | | | | 7,813 | |
Warrants | | | 157,393 | | | | — | | | | 6,489 | | | | 163,882 | |
Bank Loans | | | — | | | | 749,716 | | | | 261,852 | | | | 1,011,568 | |
Convertible Bonds | | | — | | | | 63,980 | | | | — | | | | 63,980 | |
Corporate Bonds | | | — | | | | 876,163 | | | | — | | | | 876,163 | |
Purchased Option Contracts | | | 14,431 | | | | — | | | | — | | | | 14,431 | |
Escrow Notes | | | — | | | | 1,291,646 | | | | 153 | | | | 1,291,799 | |
Short-Term Investments | | | 11,984,998 | | | | — | | | | — | | | | 11,984,998 | |
| Other Investments | | | | | | | | | | | | | | | | |
Forward Currency Exchange Contracts** | | | — | | | | 56,701 | | | | — | | | | 56,701 | |
Swap Contracts** | | | — | | | | 59,051 | | | | 5,777 | | | | 64,828 | |
| | | | | | | | | | | | | | | | |
Total | | $ | 49,458,060 | | | $ | 3,393,743 | | | $ | 331,356 | | | $ | 53,183,159 | |
| | | | | | | | | | | | | | | | |
| Liabilities | | | | | | | | | | | | | | | | |
Short Common Stocks* | | $ | (4,983,257 | ) | | $ | — | | | $ | — | | | $ | (4,983,257 | ) |
Short Corporate Bonds | | | — | | | | (92,614 | ) | | | — | | | | (92,614 | ) |
| Other Investments | | | | | | | | | | | | | | | | |
Written Option Contracts | | | (42,374 | ) | | | — | | | | — | | | | (42,374 | ) |
Swap Contracts** | | | — | | | | (22,929 | ) | | | — | | | | (22,929 | ) |
| | | | | | | | | | | | | | | | |
Total | | $ | (5,025,631 | ) | | $ | (115,543 | ) | | $ | — | | | $ | (5,141,174 | ) |
| | | | | | | | | | | | | | | | |
| * | Please refer to the Schedules of Investments to view long/short common stocks segregated by industry type. |
| ** | Swap contracts and forward currency exchange contracts are valued at the net unrealized appreciation (depreciation) on the instrument by level and counterparty. |
| *** | Amount less than $0.50. |
| | | | | | | | | | | | | | | | | | | | | | | | | | | | | | | | | | | | | | | | |
Description | | Common
Stocks | | | Special
Purpose
Acquisition
Companies | | | Private
Investments
in Public
Equity | | | Contingent
Value Rights | | | Rights | | | Warrants | | | Bank
Loans | | | Escrow
Notes | | | Swaps | | | Total
Investments | |
Balance as of December 31, 2020 | | $ | 497,000 | | | $ | — | | | $ | 684,045 | | | $ | — | | | $ | — | | | $ | 2,100 | ** | | $ | 264,000 | | | $ | — | | | $ | — | | | $ | 1,447,145 | |
Purchases on Investments | | | — | | | | — | * | | | 90,000 | | | | — | | | | — | | | | — | | | | 15,778 | | | | — | | | | — | | | | 105,778 | |
(Sales) of Investments | | | (536,651 | ) | | | — | | | | (511,625 | ) | | | — | | | | — | | | | — | | | | — | | | | — | | | | — | | | | (1,048,276 | ) |
Realized (Gain) Loss | | | 49,360 | | | | — | | | | 421,625 | | | | — | | | | — | | | | — | | | | — | | | | — | | | | — | | | | 470,985 | |
Paydown | | | — | | | | — | | | | — | | | | — | | | | — | | | | — | | | | (1,671 | ) | | | — | | | | — | | | | (1,671 | ) |
Transfers Into Level 3 | | | — | | | | — | | | | — | | | | 879 | | | | 7,813 | | | | — | | | | — | | | | 153 | | | | — | * | | | 8,845 | |
Change in Unrealized Appreciation (Depreciation) | | | (9,709 | ) | | | — | * | | | (635,652 | ) | | | — | | | | — | | | | 4,389 | | | | (16,255 | ) | | | — | | | | 5,777 | | | | (651,450 | ) |
| | | | | | | | | | | | | | | | | | | | | | | | | | | | | | | | | | | | | | | | |
Balance as of December 31, 2021 | | $ | — | | | $ | — | * | | $ | 48,393 | | | $ | 879 | | | $ | 7,813 | | | $ | 6,489 | | | $ | 261,852 | | | $ | 153 | | | $ | 5,777 | | | $ | 331,356 | |
| | | | | | | | | | | | | | | | | | | | | | | | | | | | | | | | | | | | | | | | |
Change in unrealized appreciation (depreciation) during the year for Level 3 investments held at December 31, 2021 | | $ | — | | | $ | — | * | | $ | (41,607 | ) | | $ | (7,364 | ) | | $ | 27,472 | | | $ | 4,403 | | | $ | (16,255 | ) | | $ | (498 | ) | | $ | 11,377 | | | $ | (22,472 | ) |
| | | | | | | | | | | | | | | | | | | | | | | | | | | | | | | | | | | | | | | | |
| ** | CEC Brands LLC warrant received as a result of a corporate action. |
Some of the Fund’s investments that were categorized as Level 3 were valued utilizing third party pricing information without adjustment. Such valuations are based on unobservable inputs. A significant change in third party information could result in a significantly lower or higher value of Level 3 investments.
30
The Merger Fund® VL
NOTES TO THE FINANCIAL STATEMENTS (Continued)
December 31, 2021
Some of the Fund’s investments that were categorized as Level 3 were valued utilizing third party pricing information without adjustment. Such valuations are based on unobservable inputs. A significant change in third party information could result in a significantly lower or higher value of Level 3 investments.
Significant unobservable valuation inputs monitored by the Valuation Committee under the supervision of the Board of Trustees for restricted securities or material Level 3 investments as of December 31, 2021 for the Fund are as follows:
| | | | | | | | | | | | | | | | |
Description | | Fair Value at
December 31, 2021 | | | Valuation
Technique | | | Unobservable
Input | | | Input Values
(Ranges) | |
Private Investment in Public Equity | | $ | 48,393 | | | | Market Price less Discount | | | | Liquidity Discount | | | | 0.0 - 5.0 | % |
| | B. | Security Transactions and Investment Income |
Security transactions are recorded on the trade date. Realized gains and losses from the sale of securities are determined on the identified cost basis. Dividend income is recognized on the ex-dividend date or, in the case of certain foreign securities, as soon as the Fund is notified. Interest income is recorded on the accrual basis. The Fund amortizes premiums and accretes discounts using the effective interest method. Premiums on callable debt securities are amortized to interest income to the earliest call date using the effective interest method. Conversion premium is not amortized. Any distributions from underlying funds are recorded in accordance with the character of the distributions as designated by the underlying funds.
Dividend income from REITs is recorded using management’s estimate of the percentage of income included in distributions received from such investments based on historical information and other industry sources. The return of capital portion of the estimate is a reduction to investment income and a reduction in the cost basis of each investment which increases net realized gain (loss) and net change in unrealized appreciation (depreciation). If the return of capital distributions exceed their cost basis, the distributions are treated as realized gains. The actual amounts of income, return of capital, and capital gains are only determined by each REIT after its fiscal year-end, and may differ from the estimated amounts.
It is the intention of the Fund to comply with the requirements of Subchapter M of the Internal Revenue Code of 1986, as amended (the “Code”) and to distribute substantially all of its taxable income to its shareholders. Therefore, no provision for federal income taxes or excise taxes has been made.
The Fund may be subject to foreign taxes on income, gains on investments or currency repatriation, a portion of which may be recoverable. The Fund will accrue such taxes and recoveries as applicable based upon current interpretations of the tax rules and regulations that exist in the markets in which it invests.
Management of the Fund has concluded that there are no significant uncertain tax positions that would require recognition in the financial statements. The Fund’s U.S. federal income tax return is generally subject to examination by the Internal Revenue Service for a period of three years after it is filed. State, local and/or non-U.S. tax returns and/or other filings may be subject to examination for different periods, depending upon the tax rules of each applicable jurisdiction.
| | D. | Distributions to Shareholders |
Distributions are recorded by the Fund on the ex-dividend date. Income and capital gain distributions are determined in accordance with income tax regulations which may differ from U.S. GAAP.
Expenses incurred together by the Fund and other affiliated mutual funds are allocated in proportion to the net assets of each such fund, except where allocation of direct expenses to the Fund or an alternative allocation method can be more appropriately used.
In addition to the net annual operating expenses that the Fund bears directly, the shareholders of the Fund indirectly bear the pro-rata expenses of any underlying mutual funds in which the Fund invests.
| | F. | Foreign Currency Transactions |
Non-U.S. investment securities and other assets and liabilities denominated in foreign currencies are translated into U.S. dollar amounts at the foreign currency exchange rate effective at the end of the reporting period. Cost of investments is translated at the currency exchange rate effective at the trade date. The gain or loss resulting from a change in currency exchange rates between the trade and settlement date of a portfolio transaction is treated as a gain or loss on foreign currency. Likewise, the gain or loss resulting from a change in currency exchange rates between the date income is accrued and the date it is paid is treated as a gain or loss on foreign currency. The Fund does not isolate that portion of the results of operations arising from changes in foreign exchange rates on investments from the fluctuations arising from changes in the market prices of securities held. Such fluctuations are included with the net realized and unrealized gain or loss on investments.
The Fund may sell securities short. A short sale is a transaction in which the Fund sells a security it does not own in anticipation of a decline in market price. To sell a security short, the Fund must borrow the security. The Fund’s obligation to replace the security borrowed and sold short will be fully collateralized at all times by the proceeds from the short sale retained by the broker and by cash and securities deposited in a segregated account with the Fund’s custodian. If the price of the security sold short increases between the time of the short sale and the time the Fund replaces the borrowed security, the Fund will realize a loss, and if the price declines during the period, the Fund will realize a gain. Any realized gain will be decreased, and any realized loss increased, by the amount of transaction costs. On ex-dividend date, dividends on short sales are recorded as an expense to the Fund.
31
The Merger Fund® VL
NOTES TO THE FINANCIAL STATEMENTS (Continued)
December 31, 2021
In addition, in accordance with the terms of its prime brokerage agreement, the Fund may receive rebate income or be charged a fee on borrowed securities. Such income or fee is calculated on a daily basis based upon the market value of each borrowed security and a variable rate that is dependent upon the availability of such security. The dividends on short sales and rebate income/fees are recorded under “Dividend expense and interest expense on securities sold short” on the Statement of Operations.
The Fund may invest a portion of their assets in convertible securities. Although convertible securities derive part of their value from that of the securities into which they are convertible, they are not considered derivative financial instruments. However, certain of the Fund’s investments in convertible securities include features which render them sensitive to price changes in their underlying securities. The value of structured/synthetic convertible securities can be affected by interest rate changes and credit risks of the issuer. Such securities may be structured in ways that limit their potential for capital appreciation, and the entire value of the security may be at risk of loss depending on the performance of the underlying equity security. Consequently, the Fund is exposed to greater downside risk than traditional convertible securities, but typically still less than that of the underlying stock.
| | I. | Private Investment in a Public Equity (PIPE) with Special Purpose Acquisition Companies (SPAC) |
The Fund may acquire equity securities of an issuer through a private investment in a public equity (PIPE) transaction with SPACs, including through commitments to purchase securities on a when-issued basis. A PIPE transaction typically involves the purchase of securities directly from a publicly traded company in a private placement transaction. Securities purchased through PIPE transactions will generally be restricted from trading and considered illiquid until a resale registration statement for the shares is filed and declared effective.
At period end, the Fund had commitments to purchase when-issued securities through PIPE transactions with SPACs.
The Fund may invest in direct debt instruments which are interests in amounts owed by a corporate, governmental, or other borrower to lenders or lending syndicates. Leveraged loans are generally non-investment grade and often involve borrowers that are highly leveraged. The Fund may invest in obligations of borrowers who are in bankruptcy proceedings. Leveraged loans are typically senior in the corporate capital structure of the borrower. A loan is often administered by a bank or other financial institution (the “lender”) that acts as agent for all holders. The agent administers the terms of the loan, as specified in the leveraged loan. The Fund’s investments in loans may be in the form of participations in loans or assignments of all or a portion of loans from third parties. When investing in loan participations, the Fund has the right to receive payments of principal, interest and any fees to which it is entitled only from the lender selling the loan participation and only upon receipt by the lender of payments from the borrower. The Fund generally has no right to enforce compliance with the terms of the leveraged loan with the borrower. As a result, the Fund may be subject to the credit risk of both the borrower and the lender that is selling the leveraged loan. When the Fund purchases assignments from lenders it acquires direct rights against the borrower on the loan.
The Fund may invest in multiple series or tranches of a loan, which may have varying terms and carry different associated risks. Leveraged loans may involve foreign borrowers and investments may be denominated in foreign currencies. Direct indebtedness of emerging countries involves a risk that the government entities responsible for the repayment of the debt may be unable, or unwilling, to pay the principal and interest when due.
The leveraged loans have floating rate loan interests which generally pay interest at rates that are periodically determined by reference to a base lending rate plus a premium. The base lending rates are generally LIBOR, SOFR, the prime rate offered by one or more U.S. banks or the certificate of deposit rate. When a leveraged loan is purchased the Fund may pay an assignment fee. On an ongoing basis, the Fund may receive a commitment fee based on the undrawn portion of the underlying line of credit portion of a leveraged loan. Prepayment penalty fees are received upon the prepayment of a leveraged loan by a borrower. Prepayment penalty, facility, commitment, consent and amendment fees are recorded to income as earned or paid earned or paid.
Note 3. Derivative Financial Instruments and Transactions
Disclosures about derivative instruments and hedging activities are intended to enable investors to understand how and why the Fund uses derivatives, how derivatives are accounted for, and how derivative instruments affect the Fund’s results of operations and financial position. Summarized below are such disclosures and accounting policies for each specific type of derivative instrument used by the Fund.
A futures contract is an agreement between two parties to purchase (long) or sell (short) a security at a set price for delivery on a future date. Upon entering into a futures contract, the Fund is required to pledge to the broker an amount of cash and/or securities equal to the “initial margin” requirements of the futures exchange on which the contract is traded. Pursuant to the contract, the Fund agrees to receive from or pay to the broker an amount of cash equal to the daily fluctuation in value of the contract. Such receipts or payments are known as variation margin and are recorded by the Fund for financial statement purposes on a daily basis as unrealized appreciation or depreciation. When the contract expires or is closed, gain or loss equal to the difference between the value of the contract at the time it was opened and the value at the time it was closed is realized. This is presented in the Statement of Operations as net realized gain (loss) from future contracts.
During the year ended December 31, 2021, the Fund utilized futures to optimize performance by gaining exposure to broad markets or to hedge the risk of securities within the portfolios. The potential risks of doing so are that 1) the use of futures may result in larger losses or smaller gains than the use of more traditional investments, 2) the prices of futures and the price movements of the securities that the future is intended to simulate may not correlate well, 3) the Fund’s success in using futures will be dependent upon the subadviser’s ability to correctly predict such price movements, 4) liquidity of futures can be adversely affected by market factors, and the prices of such securities may move in unexpected ways, and 5) if the Fund cannot close out a futures position, it may be compelled to continue to make daily cash payments to the broker to meet margin requirements, thus increasing transaction costs. Futures contracts outstanding at period end, if any, are listed after the Fund’s Schedule of Investments.
32
The Merger Fund® VL
NOTES TO THE FINANCIAL STATEMENTS (Continued)
December 31, 2021
| | B. | Forward Foreign Currency Exchange Contracts |
A forward foreign currency exchange contract is an agreement between two parties to buy and sell a currency at a set exchange rate on a future date. Forward foreign currency exchange contracts, when used by the Fund, help to manage the overall exposure to the currencies in which some of the investments held by the Fund are denominated. The contract is marked-to-market daily and the change in market value is recorded by the Fund as an unrealized appreciation or depreciation. When the contract is closed, the Fund records a realized gain or loss equal to the difference between the value at the time it was opened and the value at the time it was closed. The use of forward foreign currency exchange contracts involves the risk that the value of the contract changes unfavorably due to movements in the value of the referenced foreign currencies. Non-deliverable forward foreign currency exchange contracts are settled with the counterparty in U.S. dollars without the delivery of foreign currency.
During the year ended December 31, 2021, the Fund entered into forward foreign currency exchange contracts as an economic hedge against either specific transactions or portfolio instruments or to obtain exposure to, or hedge exposure away from, foreign currencies (foreign currency exchange rate risk). Forward foreign currency contracts outstanding at period end, if any, are listed after the Fund’s Schedule of Investments.
An options contract provides the purchaser with the right, but not the obligation, to buy (call option) or sell (put option) a financial instrument at an agreed upon price. The Fund may purchase or write both put and call options on portfolio securities. When doing so, the Fund is subject to equity price risk and/or foreign currency risk in the normal course of pursuing its investment objectives.
When the Fund purchases an option, it pays a premium and an amount equal to that premium is recorded as an asset. When the Fund writes an option, it receives a premium and an amount equal to that premium is recorded as a liability. The asset or liability is adjusted daily to reflect the current market value of the option. Holdings of the Fund designated to cover outstanding written options are noted in the Schedule of Investments. Purchased options are reported as an asset within “Investment in securities at value” in the Statements of Assets and Liabilities. Written options are reported as a liability within “Written options at value.” Changes in value of the purchased option are included in “Net change in unrealized appreciation (depreciation) from investments” in the Statements of Operations. Changes in value of written options are included in “Net change in unrealized appreciation (depreciation) from written options” in the Statements of Operations.
If an option expires unexercised, the Fund realizes a gain or loss to the extent of the premium received or paid. If an option is exercised, the premium received or paid is recorded as an adjustment to the proceeds from the sale or the cost basis of the purchase. The difference between the premium and the amount received or paid on effecting a closing purchase or sale transaction is also treated as a realized gain or loss. Gain or loss on purchased options is included in “Net realized gain (loss) on investments” in the Statements of Operations. Gain or loss on written options is presented separately as “Net realized gain (loss) from written options” in the Statements of Operations.
The risk in writing call options is that the Fund gives up the opportunity for profit if the market price/foreign currency rate of the referenced security/currency increases and the option is exercised. The risk in writing put options is that the Fund may incur a loss if the market price/foreign currency rate of the referenced security/currency decreases and the option is exercised. The risk in buying options is that the Fund pays a premium whether or not the option is exercised. The use of such instruments may involve certain additional risks as a result of unanticipated movements in the market. Writers (sellers) of options are subject to unlimited risk of loss, as the seller will be obligated to deliver or take delivery of the security at a predetermined price which may, upon exercise of the option, be significantly different from the then-market value.
During the year ended December 31, 2021, the Fund invested in writing put/call options and buying put/call options for various purposes, including for investment purposes and as a means to hedge other investments.
The Fund may enter into swap agreements, in which the Fund and a counterparty agree either to make periodic net payments on a specified notional amount or a net payment upon termination. Swap agreements are negotiated in the over-the-counter (“OTC”) market and may be entered into as a bilateral contract (“OTC swaps”) or centrally cleared (“centrally cleared swaps”). The value of the swap is reflected on the Statements of Assets and Liabilities as “Receivable and/or Payable for swap contracts”. Swaps are marked-to-market daily and changes in value are recorded as “Net change in unrealized appreciation (depreciation) on swap contracts” in the Statements of Operations.
Any upfront premiums paid are recorded as assets and any upfront fees received are recorded as liabilities and are shown under “Swaps at value” in the Statements of Assets and Liabilities and are amortized over the term of the swap. During the year ended December 31, 2021, there were no upfront premiums paid or received for the open swap contracts held. When a swap is terminated, the Fund records a realized gain or loss equal to the difference between the proceeds from (or cost of) the closing transaction and the Fund’s basis in the contract, if any. Generally, the basis of the contracts is the unamortized premium received or paid. Cash settlements between the Fund and the counterparty are recognized as “Net realized gain (loss) on swap contracts” in the Statements of Operations. Swap contracts outstanding at period end, if any, are listed after the Fund’s Schedule of Investments.
In a centrally cleared swap, immediately following execution of the swap agreement, the swap agreement is submitted to a central counterparty (the “CCP”) and the Fund’s counterparty on the swap agreement becomes the CCP. The Fund is required to interface with the CCP through a clearing broker. Upon entering into a centrally cleared swap, the Fund is required to deposit initial margin with the clearing broker in the form of cash or securities in an amount that varies depending on the size and risk profile of the particular swap.
Securities deposited as margin are designated on the Schedule of Investments and cash deposited is recorded on the Statements of Assets and Liabilities as “Deposits at brokers for other investments”.
Swap transactions involve, to varying degrees, elements of interest rate, credit and market risk in excess of the amounts recognized in the Statements of Assets and Liabilities. Such risks involve the possibility that there will be no liquid market for these agreements, that the counterparty to the agreements may default on its obligation to perform or disagree as to the meaning of the contractual terms in the agreements, and that there may be unfavorable changes in interest rates and/or market values associated with these transactions.
33
The Merger Fund® VL
NOTES TO THE FINANCIAL STATEMENTS (Continued)
December 31, 2021
Total return swaps – Total return swaps are agreements in which there is an exchange of cash flows whereby one party commits to make payments based on the total return (coupons plus capital gains/losses) of an underlying instrument in exchange for fixed or floating rate interest payments. To the extent the total return of the instrument or index underlying the transaction exceeds or falls short of the offsetting interest rate obligation, the Fund will receive a payment from or make a payment to the counterparty. The Fund may enter into total return swaps to obtain exposure to a security or market without owning such security or investing directly in that market or to transfer the risk/return of one market (e.g., fixed income) to another market (e.g., equity) (equity risk and/or interest rate risk).
The Fund may enter into equity basket swaps to obtain exposure to a portfolio of long and short securities. Under the terms of the agreement, the swap is designed to function as a portfolio of direct investments in long and short equity or fixed income positions.
This means that the Fund has the ability to trade in and out of long and short positions within the swap and will receive all of the economic benefits and risks equivalent to direct investments in these positions such as: capital appreciation (depreciation), corporate actions, and dividends and interest received and paid, all of which are reflected in the swap value. The swap value also includes interest charges and credits related to the notional values of the long and short positions and cash balances within the swap. These interest charges and credits are based on defined market rates plus or minus a specified spread and are referred to herein as “financing costs”. Positions within the swap are reset periodically, and financing costs are reset monthly.
During a reset, any unrealized gains (losses) on positions and accrued financing costs become available for cash settlement between the Fund and the swap counterparty. Cash settlement in and out of the swap may occur at a reset date or any other date, at the discretion of the Fund and the counterparty, over the life of the agreement, and is generally determined based on limits and thresholds established as part of the ISDA Master Agreement (defined below in “Derivative Risks”) between the Fund and the counterparty.
The value of the swap is derived from a combination of (i) the net value of the underlying positions, which are valued daily using the last sale or closing prices on the principal exchange on which the securities are traded; (ii) financing costs; (iii) the value of dividends or accrued interest; (iv) cash balances within the swap; and (v) other factors, as applicable. The swap involves additional risks than if the Fund has invested in the underlying positions directly, including: the risk that changes in the swap may not correlate perfectly with the underlying long and short securities; credit risk related to the counterparty’s failure to perform under contract terms; and liquidity risk related to the lack of a liquid market for the swap contract, which may limit the ability of the Fund to close out its position(s).
During the year ended December 31, 2021, the Fund utilized total return swaps to gain exposure to broad markets or to hedge the risk of individual securities within the portfolios, obtain long or short exposure to the underlying reference instrument, obtain leverage and gain exposure to restricted markets in order to avoid the operational burden of ownership filing requirements. At December 31, 2021, the Fund did not hold swap baskets.
The following is a summary of derivative instruments categorized by primary risk exposure, presented in the financial statements as of December 31, 2021:
Statement of Assets and Liabilities
| | | | | | | | |
| | | Asset Derivatives | |
Derivatives | | Statements of Assets
and Liabilities Location | | | Fair
Value | |
| | |
| Equity Contracts: | | | | | | | | |
Purchased Option Contacts | | | Investments | | | $ | 14,431 | |
Swap Contracts | | | Receivables | | | | 64,828 | |
| Foreign Exchange Contracts: | | | | | | | | |
Forward Currency Exchange Contracts | | | Receivables | | | | 56,701 | |
| | | | | | | | |
| Total | | | | | | $ | 135,960 | |
| | | | | | | | |
| |
| | | Liability Derivatives | |
Derivatives | | Statements of Assets
and Liabilities Location | | | Fair
Value | |
| | |
| Equity Contracts: | | | | | | | | |
Written Option Contacts | | | Written Option Contracts | | | $ | 42,374 | |
Swap Contracts | | | Payables | | | | 22,929 | |
| | | | | | | | |
| Total | | | | | | $ | 65,303 | |
| | | | | | | | |
The effect of derivatives on the Statements of Operations for the year ended December 31, 2021:
Statement of Operations
| | | | | | | | | | | | | | | | | | | | |
| | | Amount of Realized Gain (Loss) on Derivatives | |
| | | | | |
Derivatives | | Purchased
Option
Contracts* | | | Written
Option
Contracts | | | Forward
Currency
Exchange
Contracts | | | Swap
Contracts | | | Total | |
Equity Contracts | | $ | (478,159 | ) | | $ | 177,662 | | | $ | — | | | $ | (6,219,820 | ) | | $ | (6,520,317 | ) |
Foreign Exchange Contracts | | | — | | | | — | | | | 90,759 | | | | — | | | | 90,759 | |
| | | | | | | | | | | | | | | | | | | | |
Total | | $ | (478,159 | ) | | $ | 177,662 | | | $ | 90,759 | | | $ | (6,219,820 | ) | | $ | (6,429,558 | ) |
| | | | | | | | | | | | | | | | | | | | |
| * | The amounts disclosed are included in the realized gain (loss) on investments. |
34
The Merger Fund® VL
NOTES TO THE FINANCIAL STATEMENTS (Continued)
December 31, 2021
| | | | | | | | | | | | | | | | | | | | |
| | | Change in Unrealized Appreciation (Depreciation) on Derivatives | |
| | | | | |
Derivatives | | Purchased
Option
Contracts** | | | Written
Option
Contracts | | | Forward
Currency
Exchange
Contracts | | | Swap
Contracts | | | Total | |
Equity Contracts | | $ | 58,356 | | | $ | 8,052 | | | $ | — | | | $ | 850,991 | | | $ | 917,399 | |
Foreign Exchange Contracts | | | — | | | | — | | | | 195,619 | | | | — | | | | 195,619 | |
| | | | | | | | | | | | | | | | | | | | |
Total | | $ | 58,356 | | | $ | 8,052 | | | $ | 195,619 | | | $ | 850,991 | | | $ | 1,113,018 | |
| | | | | | | | | | | | | | | | | | | | |
| ** | The amounts disclosed are included in net change in unrealized appreciation (depreciation) on investments. |
The quarterly average values (unless otherwise specified) of the derivatives held by the Fund in the table shown below indicate the volume of derivative activity for each applicable Fund for the year ended December 31, 2021.
| | | | | | | | |
| | | Monthly Average
Quantity | | | Monthly Average
Notional Value | |
Purchased Option Contracts | | | 200 | | | $ | 3,060,805 | |
Written Option Contracts | | | 344 | | | $ | 4,041,818 | |
Forward Currency Exchange Contracts | | | 15 | | | $ | 5,911,332 | |
Long Total Return Swap Contracts | | | 885,678 | | | $ | 6,741,818 | |
Short Total Return Swap Contracts | | | 124,366 | | | $ | 12,324,634 | |
A derivative contract may suffer a mark-to-market loss if the value of the contract decreases due to an unfavorable change in the market rates or values of the underlying instrument. Losses can also occur if the counterparty does not perform under the contract.
The Fund’s risk of loss from counterparty credit risk on derivatives bought or sold over the counter (“OTC”), rather than traded on a securities exchange, is generally limited to the aggregate unrealized gain netted against any collateral held by such Fund. For OTC purchased options, the Fund bears the risk of loss of the amount of the premiums paid plus the positive change in market values net of any collateral held by such Fund should the counterparty fail to perform under the contracts. Options written by the Fund do not typically give rise to counterparty credit risk, as options written generally obligate the Fund, and not the counterparty to perform.
With exchange traded purchased options and futures and centrally cleared swaps generally speaking, there is less counterparty credit risk to the Fund since the exchange or clearinghouse, as counterparty to such instruments, guarantees against a possible default. The clearinghouse stands between the buyer and the seller of the contract; therefore, credit risk is limited to failure of the clearinghouse. While offset rights may exist under applicable law, the Fund does not have a contractual right of offset against a clearing broker or clearinghouse in the event of a default (including the bankruptcy or insolvency) of the clearing broker or clearinghouse. Additionally, credit risk exists in exchange traded futures and centrally cleared swaps with respect to initial and variation margin that is held in a clearing broker’s customer accounts. While clearing brokers are required to segregate customer margin from their own assets, in the event that a clearing broker becomes insolvent or goes into bankruptcy and at that time there is a shortfall in the aggregate amount of margin held by the clearing broker for all its clients, typically the shortfall would be allocated on a pro rata basis across all the clearing broker’s customers, potentially resulting in losses to the Fund.
In order to better define its contractual rights and to secure rights that will help the Fund mitigate its counterparty risk, the Fund may enter into an International Swaps and Derivatives Association, Inc. Master Agreement (“ISDA Master Agreement”) or similar agreement with its derivative contract counterparties. An ISDA Master Agreement is a bilateral agreement between the Fund and a counterparty that governs certain OTC derivatives and typically contains, among other things, collateral posting terms and netting provisions in the event of a default and/or termination event. Under an ISDA Master Agreement, the Fund may, under certain circumstances, offset with the counterparty certain derivative financial instruments’ payables and/or receivables with collateral held and/or posted and create one single net payment. The provisions of the ISDA Master Agreement typically permit a single net payment in the event of default including the bankruptcy or insolvency of the counterparty. However, bankruptcy or insolvency laws of a particular jurisdiction may impose restrictions on or prohibitions against the right of offset in bankruptcy, insolvency or other events. In addition, certain ISDA Master Agreements allow counterparties to OTC derivatives to terminate derivative contracts prior to maturity in the event the Fund’s net assets decline by a stated percentage or the Fund fails to meet the terms of its ISDA Master Agreements, which would cause the Fund to accelerate payment of any net liability owed to the counterparty.
| | F. | Collateral Requirements and Master Netting Agreements (“MNA”) |
For derivatives traded under an ISDA Master Agreement, the collateral requirements are typically calculated by netting the mark-to-market amount for each transaction under such agreement and comparing that amount to the value of any collateral currently pledged by the Fund and the counterparty.
Cash collateral that has been pledged to cover obligations of the Fund and cash collateral received from the counterparty, if any, is reported separately on the Statements of Assets and Liabilities as cash pledged as collateral and cash received as collateral, respectively. Non-cash collateral pledged by the Fund, if any, is noted in the Schedules of Investments. Typically, the Fund and counterparties are not permitted to sell, re-pledge or use the collateral they receive. To the extent amounts due to the Fund from its counterparties are not fully collateralized, contractually or otherwise, the Fund bears the risk of loss from counterparty non-performance. The Fund attempts to mitigate counterparty risk by only entering into agreements with counterparties that they believe have the financial resources to honor their obligations and by monitoring the financial stability of those counterparties.
35
The Merger Fund® VL
NOTES TO THE FINANCIAL STATEMENTS (Continued)
December 31, 2021
For financial reporting purposes, the Fund does not offset derivative assets and derivative liabilities that are subject to netting arrangements in the Statements of Assets and Liabilities.
The following tables present the Fund’s derivative assets and liabilities by counterparty net of amounts available for offset under a MNA and net of the related collateral received/pledged by the Fund as of December 31, 2021:
| | | | | | | | | | | | | | | | | | | | | | | | |
| | | | | |
| Assets: | | Gross
Amounts of
Recognized
Assets/
Liabilities | | | Gross
Amounts
Offset
in the
Statement
of Assets
and
Liabilities | | | Net Amounts
Presented
in the
Statement
of Assets
and Liabilities | | | Gross Amounts
not offset in the Statement
of Assets and Liabilities | | | Net
Amount | |
| | Financial
Instruments | | | Collateral
Received/
Pledged* | |
| Description | | | | | | | | | | | | | | | | | | | | | | | | |
Forward Currency Exchange Contracts —
JP Morgan Chase & Co., Inc. | | $ | 61,558 | | | $ | 6,569 | | | $ | 54,989 | | | $ | — | | | $ | — | | | $ | 54,989 | |
Goldman, Sachs & Co. | | | 16,737 | | | | 15,025 | | | | 1,712 | | | | — | | | | — | | | | 1,712 | |
Swap Contracts —
Bank of America Merrill Lynch & Co., Inc. | | | 30,929 | | | | 10,017 | | | | 20,912 | | | | — | | | | — | | | | 20,912 | |
JPMorgan Chase & Co., Inc. | | | 21,822 | | | | 21,822 | | | | — | | | | — | | | | — | | | | — | |
Goldman, Sachs & Co. | | | 365,122 | | | | 321,206 | | | | 43,916 | | | | — | | | | — | | | | 43,916 | |
| | | | | | | | | | | | | | | | | | | | | | | | |
| | | | | | |
| | $ | 496,168 | | | $ | 374,639 | | | $ | 121,529 | | | $ | — | | | $ | — | | | $ | 121,529 | |
| | | | | | | | | | | | | | | | | | | | | | | | |
| Liabilities: | | | | | | | | | | | | | | | | | | | | | | | | |
| Description | | | | | | | | | | | | | | | | | | | | | | | | |
Written Option Contracts** | | $ | 42,374 | | | $ | — | | | $ | 42,374 | | | $ | — | | | $ | 42,374 | | | $ | — | |
Forward Currency Exchange Contracts —
JP Morgan Chase & Co., Inc. | | | 6,569 | | | | 6,569 | | | | — | | | | — | | | | — | | | | — | |
Goldman, Sachs & Co. | | | 15,025 | | | | 15,025 | | | | — | | | | — | | | | — | | | | — | |
Swap Contracts —
Bank of America Merrill Lynch & Co., Inc. | | | 10,017 | | | | 10,017 | | | | — | | | | — | | | | — | | | | — | |
JPMorgan Chase & Co., Inc. | | | 44,751 | | | | 21,822 | | | | 22,929 | | | | — | | | | 22,929 | | | | — | |
Goldman, Sachs & Co. | | | 321,206 | | | | 321,206 | | | | — | | | | — | | | | — | | | | — | |
| | | | | | | | | | | | | | | | | | | | | | | | |
| | | | | | |
| | $ | 439,942 | | | $ | 374,639 | | | $ | 65,303 | | | $ | — | | | $ | 65,303 | | | $ | — | |
| | | | | | | | | | | | | | | | | | | | | | | | |
| * | In some instances, the actual collateral pledged/received may be more than the amount shown. |
| ** | JPMorgan Chase & Co., Inc. is the prime broker for all written option contracts held by the Fund as of December 31, 2021. |
Note 4. Investment Advisory Fees and Related Party Transactions
Effective October 1, 2021, the Adviser, an indirect, wholly-owned subsidiary of Virtus Investment Partners, Inc. (“Virtus”), is the investment adviser to the Fund. The Adviser manages the Fund’s investment programs and general operations of the Fund, including oversight of the Fund’s subadviser. Prior to October 1, 2021, Westchester Capital Management, LLC (“WCM”) served as the investment adviser to the Fund.
As compensation for its services to the Fund, the Adviser is entitled to a fee, which is calculated daily and paid monthly based upon the following annual rates as a percentage of the average daily net assets of the Fund:
| | | | |
Fund | | Advisory Fee | |
The Merger Fund VL | | | 1.25 | % |
Prior to October 1, 2021, the Fund paid monthly advisory fees to WCM, in its former capacity as investment adviser to the Fund, at the same annual rate.
WCM manages the investments of the Fund for which it is paid a fee by the Adviser.
Effective October 1, 2021, the Adviser has contractually agreed to limit the Fund’s annual total operating expenses, subject to the exceptions listed below, so that such expenses do not exceed, on an annualized basis, the following respective percentages of average daily net assets through
36
The Merger Fund® VL
NOTES TO THE FINANCIAL STATEMENTS (Continued)
December 31, 2021
September 30, 2023. Following the contractual period, the Adviser may discontinue these expense limitation arrangements at any time. The waivers and reimbursements are accrued daily and received monthly.
| | | | |
Fund | | Class I | |
| |
The Merger Fund VL | | | 1.40 | % |
The exclusions include brokerage commissions, short dividends, interest expense, taxes, acquired fund fees and expenses or extraordinary expenses, if any.
Prior to October 1, 2021, the Fund was contractually limited to the Fund’s annual total operating expenses of 1.40%.
Under certain conditions, the Adviser may recapture operating expenses reimbursed or fees waived under these arrangements within three years after the date on which such amounts were incurred or waived. The Fund must pay its ordinary operating expenses before the Adviser is entitled to any reimbursement and must remain in compliance with any applicable expense limitations or, if none, the expense limitation in effect at the time of the waiver or reimbursement. All or a portion of the following Adviser reimbursed expenses may be recaptured by the fiscal year ending December 31:
| | | | | | | | | | | | | | | | |
| | | Expiration | | | | |
Fund | | 2022 | | | 2023 | | | 2024 | | | Total | |
| | | | |
The Merger Fund VL | | $ | 223,736 | | | $ | 218,124 | | | $ | 223,540 | | | $ | 665,400 | |
During the year ended December 31, 2021, the Adviser did not recapture any expenses previously waived.
Effective October 1, 2021, VP Distributors, LLC (“VP Distributors”), an indirect, wholly-owned subsidiary of Virtus, serves as the distributor of the Fund’s shares.
Effective October 1, 2021, Virtus Fund Services, LLC, an indirect, wholly-owned subsidiary of Virtus, serves as the administrator to the Fund. Prior to October 1, 2021, U.S. Bancorp Fund Services, LLC, doing business as U.S. Bank Global Fund Services (“Fund Services”) and a subsidiary of U.S. Bancorp, a publicly held bank holding company, provided administrative services to the Fund.
For the year ended December 31, 2021, the Fund incurred administration fees and fund accounting expenses totaling $43,030 and $20,164, respectively, which are included in the Statements of Operations within the line items “Administration fees” and “Fund accounting expenses.” The fees are calculated daily and paid monthly.
The Fund provides a deferred compensation plan for its Trustees who receive compensation from the Fund. Under the deferred compensation plan, Trustees may elect to defer all or a portion of their compensation. Amounts deferred are retained by the Fund, and then, to the extent permitted by the 1940 Act, in turn, may be invested in the shares of affiliated or unaffiliated mutual funds selected by the participating Trustees.
Note 5. Purchases and Sales of Securities
Purchases and sales of securities (excluding U.S. Government and agency securities, forward currency contracts, written options, and short-term securities) during the year ended December 31, 2021, were as follows:
| | | | | | | | |
Fund | | Purchases | | | Sales | |
| | |
The Merger Fund VL | | $ | 76,931,415 | | | $ | 79,365,067 | |
During the year ended December 31, 2021, the Fund did not purchase or sell long-term U.S. Government and agency securities.
Note 6. Capital Share Transactions
Transactions in shares of capital stock, during the periods ended as indicated below, were as follows:
| | | | | | | | | | | | | | | | |
| The Merger Fund VL | | Year Ended
December 31, 2021 | | | Year Ended
December 31, 2020 | |
| Class I | | Shares | | | Amount | | | Shares | | | Amount | |
Issued | | | 1,088,438 | | | $ | 13,623,227 | | | | 2,039,391 | | | $ | 23,496,166 | |
Issued as reinvestment of dividends | | | 213,958 | | | | 2,516,139 | | | | 10,788 | | | | 132,148 | |
Redeemed | | | (943,227 | ) | | | (11,705,286 | ) | | | (2,016,169 | ) | | | (23,161,955 | ) |
| | | | | | | | | | | | | | | | |
Net Increase | | | 359,169 | | | $ | 4,434,080 | | | | 34,010 | | | $ | 466,359 | |
| | | | | | | | | | | | | | | | |
37
The Merger Fund® VL
NOTES TO THE FINANCIAL STATEMENTS (Continued)
December 31, 2021
Note 7. 10% Shareholders
As of December 31, 2021, the Fund had individual shareholder account(s) and/or omnibus shareholder account(s) (comprised of a group of individual shareholders), which individually amounted to more than 10% of the total shares outstanding of such Fund as detailed below:
| | | | | | | | |
Fund | | % of Shares
Outstanding | | | Number of
Accounts | |
| | |
The Merger Fund VL | | | 82.27 | % | | | 2 | |
Note 8. Credit and Market Risk and Asset Concentration
Local, regional or global events such as war, acts of terrorism, the spread of infectious illness or other public health issue, recessions, or other events could have a significant impact on the Fund and its investments, including hampering the ability of the Fund’s portfolio managers to invest the Fund’s assets as intended.
In July 2017, the head of the United Kingdom Financial Conduct Authority announced the intention to phase out the use of LIBOR by the end of 2021. However, after subsequent announcements by the FCA, the LIBOR administrator and other regulators, certain of the most widely used LIBORs are expected to continue until mid-2023. The Fund may be exposed to financial instruments tied to LIBOR to determine payment obligations, financing terms, hedging strategies or investment value. The expected discontinuation of LIBOR could have a significant impact on the financial markets and may present a material risk for certain market participants, including the Fund. Abandonment of or modifications to LIBOR could lead to significant short- and long-term uncertainty and market instability. The risks associated with this discontinuation and transition may be exacerbated if the work necessary to effect an orderly transition to an alternative reference rate is not completed in a timely manner. It remains uncertain the effects such changes will have on the Fund, issuers of instruments in which the Fund invests, and the financial markets generally.
In countries with limited or developing markets, investments may present greater risks than in more developed markets and the prices of such investments may be volatile. The consequences of political, social or economic changes in these markets may have disruptive effects on the market prices of these investments and the income they generate, as well as the Fund’s ability to repatriate such amounts.
High-yield/high-risk securities typically entail greater price volatility and/or principal and interest rate risk. There is a greater chance that an issuer will not be able to make principal and interest payments on time. Analysis of the creditworthiness of issuers of high-yield/high-risk securities may be complex, and as a result, it may be more difficult for the Adviser and/or subadviser to accurately predict risk.
Many municipalities insure repayment for their obligations. Although bond insurance reduces the risk of loss due to default by an issuer, such bonds remain subject to the risk that the market may fluctuate for other reasons, and there is no assurance that the insurance company will meet its obligations. Insured securities have been identified in the Schedule of Investments. A real or perceived decline in creditworthiness of a bond insurer can have an adverse impact on the value of insured bonds held in the Fund. The Fund may invest a high percentage of their assets in specific sectors of the market in the pursuit of their investment objectives. Fluctuations in these sectors of concentration may have a greater impact on the Fund, positive or negative, than if the Fund did not concentrate its investments in such sectors.
At December 31, 2021, the Fund held securities issued by various companies in specific sectors as detailed below:
| | | | | | | | |
Fund | | Sector | | | Percentage* | |
| | |
| The Merger Fund VL | | | Information Technology | | | | 34.8 | % |
| | * | Data expressed as a percentage of long common stocks, private investments in public equity, preferred stocks, contingent value rights, rights, warrants, bank loans, convertible bonds, corporate bonds and long total return swap contract positions as of December 31, 2021. Data expressed excludes special purpose acquisition companies, escrow notes, short-term investments, securities sold short, written and purchased options, forward currency exchange contracts and short total return swap contracts. Please refer to the Schedule of Investments for more details on the Fund’s individual holdings. |
Note 9. Indemnifications
Under the Fund’s organizational documents and in separate agreements between each Trustee and the Fund, its Trustees and officers are indemnified against certain liabilities arising out of the performance of their duties to the Fund. In addition, in the normal course of business, the Fund enters into contracts that provide a variety of indemnifications to other parties. The Fund’s maximum exposure under these arrangements is unknown, as this would involve future claims that may be made against the Fund and that have not occurred. However, the Fund has not had prior claims or losses pursuant to these arrangements, and it expects the risk of loss to be remote.
Note 10. Restricted Securities
Restricted securities are not registered under the Securities Act of 1933, as amended (the “1933 Act”). Generally, 144A securities are excluded from this category. The Fund will bear any costs, including those involved in registration under the 1933 Act, in connection with the disposition of such securities.
The Fund held the following securities that were considered to be restricted at December 31, 2021:
| | | | | | | | | | | | | | | | | | |
Fund | | Investment | | Date of
Acquisition | | | Cost | | | Value | | | Percentage of
Net Assets | |
| | | | | |
The Merger Fund VL | | Microvast Holdings, Inc. | | | 7/26/2021 | | | $ | 90,000 | | | $ | 48,393 | | | | 0.09 | % |
38
The Merger Fund® VL
NOTES TO THE FINANCIAL STATEMENTS (Continued)
December 31, 2021
Note 11. Investment Transactions and Income Tax Information
At December 31, 2021, the components of accumulated earnings gains (losses) on a tax basis were as follows:
| | | | |
| | | The Merger Fund VL | |
Costs of Investments* | | $ | 45,118,004 | |
| | | | |
Gross unrealized appreciation | | | 4,395,526 | |
Gross unrealized depreciation | | | (1,471,543 | ) |
| | | | |
Net unrealized appreciation | | $ | 2,923,983 | |
| | | | |
Undistributed ordinary income | | $ | 795,578 | |
Undistributed long-term capital gain | | | — | |
| | | | |
Total distributable earnings | | $ | 795,578 | |
| | | | |
Other accumulated losses | | | (565,872 | ) |
| | | | |
Total accumulated gains | | $ | 3,153,689 | |
| | | | |
| | * | Represents cost (including derivative contracts) for federal income tax purposes and differs from the cost for financial reporting purposes due to wash sales, passive foreign investment company mark to market, and unsettled short losses. |
U.S. GAAP requires that certain components of net assets relating to permanent differences be reclassified between financial and tax reporting. Permanent differences are primarily related to foreign currency transactions and swap treatment. These reclassifications have no effect on net assets or net asset value per share. For the year ended December 31, 2021, the Fund did not have any reclassifications between distributable earnings and paid-in capital.
The tax components of dividends paid during the years ended December 31, 2021 and December 31, 2020 were as follows:
| | | | | | | | |
| Class I | | The Merger Fund VL | |
| | | 2021 | | | 2020 | |
Ordinary Income | | $ | 1,948,191 | | | $ | — | |
Long-Term Capital Gains | | | 567,948 | | | | 132,148 | |
| | | | | | | | |
Total Distributions Paid | | $ | 2,516,139 | | | $ | 132,148 | |
| | | | | | | | |
The Fund designated as long-term capital gain dividend, pursuant to Internal Revenue Case Section 852(b)(3), the amount necessary to reduce the earnings and profits of the Fund related to net capital gain to zero for the tax year ended December 31, 2021. As of December 31, 2021, the Fund had no post-October losses deferred. As of December 31, 2021, the Fund had $550,188 in short-term capital loss carryover and no long term capital loss carryover.
Note 12. Regulatory Matters and Litigation
From time to time, the Fund, the Adviser and/or the subadvisers and/or their affiliates may be involved in litigation and arbitration as well as examinations and investigations by various regulatory bodies, including the SEC, involving compliance with, among other things, securities laws, client investment guidelines, laws governing the activities of broker-dealers and other laws and regulations affecting their activities. At this time, the Adviser believes that the outcomes of such matters are not likely, either individually or in aggregate, to be material to these financial statements.
Note 13. Recent Accounting Pronouncement
In March 2020, the FASB issued Accounting Standards Update No. 2020-04 (“ASU 2020-04”), Reference Rate Reform (Topic 848) – Facilitation of the Effects of Reference Rate Reform on Financial Reporting. The amendments in ASU 2020-04 provides optional temporary financial reporting relief from the effect of certain types of contract modifications due to the planned discontinuation of the LIBOR and other interbank-offered reference rates as of the end of 2021. ASU 2020-04 is effective for certain reference rate-related contract modifications that occur during the period March 12, 2020 through December 31, 2022. Management is currently evaluating the impact, if any, of applying ASU 2020-04.
Note 14. Subsequent Events
Management has evaluated the impact of all subsequent events on the Fund through the date the financial statements were available for issuance, and has determined that there are no subsequent events requiring recognition or disclosure in these financial statements.
39
REPORT OF INDEPENDENT REGISTERED PUBLIC ACCOUNTING FIRM
To the Board of Trustees and Shareholders of The Merger Fund VL
Opinion on the Financial Statements
We have audited the accompanying statement of assets and liabilities, including the schedule of investments, of The Merger Fund VL (the “Fund”) as of December 31, 2021, the related statement of operations for the year ended December 31, 2021, the statement of changes in net assets for each of the two years in the period ended December 31, 2021, including the related notes, and the financial highlights for each of the five years in the period ended December 31, 2021 (collectively referred to as the “financial statements”). In our opinion, the financial statements present fairly, in all material respects, the financial position of the Fund as of December 31, 2021, the results of its operations for the year then ended, the changes in its net assets for each of the two years in the period ended December 31, 2021 and the financial highlights for each of the five years in the period ended December 31, 2021 in conformity with accounting principles generally accepted in the United States of America.
Basis for Opinion
These financial statements are the responsibility of the Fund’s management. Our responsibility is to express an opinion on the Fund’s financial statements based on our audit. We are a public accounting firm registered with the Public Company Accounting Oversight Board (United States) (PCAOB) and are required to be independent with respect to the Fund in accordance with the U.S. federal securities laws and the applicable rules and regulations of the Securities and Exchange Commission and the PCAOB.
We conducted our audit of these financial statements in accordance with the standards of the PCAOB. Those standards require that we plan and perform the audit to obtain reasonable assurance about whether the financial statements are free of material misstatement, whether due to error or fraud.
Our audit included performing procedures to assess the risks of material misstatement of the financial statements, whether due to error or fraud, and performing procedures that respond to those risks. Such procedures included examining, on a test basis, evidence regarding the amounts and disclosures in the financial statements. Our audit also included evaluating the accounting principles used and significant estimates made by management, as well as evaluating the overall presentation of the financial statements. Our procedures included confirmation of securities owned as of December 31, 2021 by correspondence with the custodian, transfer agents, agent banks, and brokers; when replies were not received from agent banks and brokers, we performed other auditing procedures. We believe that our audit provides a reasonable basis for our opinion.
/s/ PricewaterhouseCoopers LLP
Philadelphia, Pennsylvania
February 25, 2022
We have served as the Virtus Mutual Funds’ auditor since at least 1977. We have not been able to determine the specific year we began serving as auditor.
40
RESULTS OF SHAREHOLDER MEETING
THE MERGER FUND® VL
JULY 9, 2021
At a special meeting of shareholders of The Merger Fund® VL (the “Fund”), held on July 9, 2021, shareholders voted on the following proposals:
| | | | | | | | |
| | | Votes For | | | Votes Withheld | |
| Proposal 1: | | | | | | | | |
| | |
To elect Trustees | | | | | | | | |
Donald C. Burke | | | 57,164,880.71 | | | | 184,248.85 | |
Sarah E. Cogan | | | 56,325,526.57 | | | | 1,023,602.99 | |
Deborah A. DeCotis | | | 56,325,526.57 | | | | 1,023,602.99 | |
F. Ford Drummond | | | 56,325,526.57 | | | | 1,023,602.99 | |
Sidney E. Harris | | | 56,325,526.57 | | | | 1,023,602.99 | |
John R. Mallin | | | 57,164,880.71 | | | | 184,248.85 | |
Connie D. McDaniel | | | 57,164,880.71 | | | | 184,248.85 | |
Philip R. McLoughlin | | | 56,325,526.57 | | | | 1,023,602.99 | |
Geraldine M. McNamara | | | 57,164,880.71 | | | | 184,248.85 | |
R. Keith Walton | | | 57,150,773.53 | | | | 198,356.02 | |
Brian T. Zino | | | 57,164,880.71 | | | | 184,248.85 | |
George R. Aylward | | | 57,146,238.21 | | | | 202,891.34 | |
Shareholders of the Fund voted to elect each of the individuals listed above as Trustees of the Fund.
| | | | | | | | | | | | |
| | | Votes For | | | Votes Against | | | Votes Abstaining | |
| Proposal 2: | | | | | | | | | | | | |
| | | |
To approve a new Investment Advisory Agreement with Virtus Investment Advisers, Inc. | |
| 54,313,805.20 94.461% of Total
Votes Outstanding |
| |
| 52,104.43 0.090% of Total
Votes Outstanding |
| |
| 2,983,219.93 5.188% of Total
Votes Outstanding |
|
| Proposal 3: | | | | | | | | | | | | |
| | | |
To approve a new Subadvisory Agreement with Westchester Capital Management, LLC | |
| 53,980,530.45 93.881% of Total
Votes Outstanding |
| |
| 362,043.01 0.630% of Total
Votes Outstanding |
| |
| 3,006,556.10 5.228% of Total
Votes Outstanding |
|
| Proposal 4: | | | | | | | | | | | | |
| | | |
To approve a proposal to permit Virtus Investment Advisers, Inc., as the investment adviser to the Fund, to hire, terminate and replace affiliated (both wholly-owned and partially-owned) and unaffiliated subadvisers for the Fund or to materially modify subadvisory agreements for the Fund without shareholder approval, and to permit the Fund to disclose advisory and subadvisory fee information in an aggregated manner. | |
| 54,007,854.18 93.929% of Total
Votes Outstanding |
| |
| 517,704.46 0.900% of Total
Votes Outstanding |
| |
| 2,823,570.92 4.910% of Total
Votes Outstanding |
|
Shareholders of the Fund voted to approve each the above proposals.
41
FUND MANAGEMENT TABLES
Information pertaining to the Trustees and officers of The Merger Fund® VL as of the date of issuance of this report, is set forth below. The statement of additional information (SAI) includes additional information about the Trustees and is available without charge, upon request, by calling (800) 243-4361.
The address of each individual, unless otherwise noted, is c/o The Merger Fund® VL, One Financial Plaza, Hartford, CT 06103. There is no stated term of office for Trustees or officers of the Trust.
Independent Trustees
| | | | |
| | | |
Name, Year of Birth, Length of Time Served and
Number of Portfolios in Fund
Complex Overseen by Trustee | | Principal Occupation(s) During Past 5 Years | | Other Directorships Held by Trustee During Past 5 Years |
Burke, Donald C. YOB: 1960 Served Since: 2021 98 Portfolios | | Private investor (since 2009). Formerly, President and Chief Executive Officer, BlackRock U.S. Funds (2007 to 2009); Managing Director, BlackRock, Inc. (2006 to 2009); and Managing Director, Merrill Lynch Investment Managers (1990 to 2006). | | Trustee (since 2021), The Merger Fund®, The Merger Fund® VL, Virtus Event Opportunities Trust (2 portfolios), Virtus Investment Trust (13 portfolios) and Virtus Strategy Trust (11 portfolios); Director (2020 to 2021), Duff & Phelps Select MLP and Midstream Energy Fund Inc.; Director (since 2020), Virtus Total Return Fund Inc.; Trustee (since 2020), Virtus Global Multi-Sector Income Fund; Trustee (since 2016), Virtus Mutual Fund Family (55 portfolios), Virtus Variable Insurance Trust (8 portfolios) and Virtus Alternative Solutions Trust (2 portfolios); Director (since 2014), closed-end funds managed by Duff & Phelps Investment Management Co. (3 funds); Director, Avista Corp. (energy company) (since 2011); Trustee, Goldman Sachs Fund Complex (2010 to 2014); and Director, BlackRock Luxembourg and Cayman Funds (2006 to 2010). |
Cogan, Sarah E. YOB: 1956 Served Since: 2021 102 Portfolios | | Retired Partner, Simpson Thacher & Bartlett LLP (“STB”) (law firm) (since 2019); Director, Girl Scouts of Greater New York (since 2016); Trustee, Natural Resources Defense Council, Inc. (since 2013); and formerly, Partner, STB (1989 to 2018). | | Trustee (since 2021), The Merger Fund®, The Merger Fund® VL, and Virtus Event Opportunities Trust (2 portfolios); Advisory Board Member (since 2021), Virtus Alternative Solutions Trust (2 portfolios), Virtus Mutual Fund Family (55 portfolios), and Virtus Variable Insurance Trust (8 portfolios); Advisory Board Member (February 2021 to June 2021), Duff & Phelps Select MLP and Midstream Energy Fund Inc.; Trustee (since 2021), Virtus Global Multi-Sector Income Fund and Virtus Total Return Fund Inc.; Trustee (since 2019), Virtus Investment Trust (13 portfolios) and Virtus Strategy Trust (11 portfolios); Trustee (since 2019), Virtus AllianzGI Closed-End Funds (7 portfolios); Trustee (since 2019), PIMCO California Municipal Income Fund, PIMCO California Municipal Income Fund II, PIMCO California Municipal Income Fund III, PIMCO Municipal Income Fund, PIMCO Municipal Income Fund II, PIMCO Municipal Income Fund III, PIMCO New York Municipal Income Fund, PIMCO New York Municipal Income Fund II, PIMCO New York Municipal Income Fund III, PIMCO Energy and Tactical Credit Opportunities Fund, PCM Fund, Inc, PIMCO Corporate & Income Strategy Fund, PIMCO Corporate & Income Opportunity Fund, PIMCO Dynamic Credit and Mortgage Income Fund, PIMCO Dynamic Income Fund, PIMCO Global StocksPLUS® & Income Fund, PIMCO High Income Fund, PIMCO Income Opportunity Fund, PIMCO Income Strategy Fund, PIMCO Income Strategy Fund II, PIMCO Strategic Income Fund, Inc., PIMCO Flexible Credit Income Fund and PIMCO Flexible Municipal Income Fund; and Trustee (since 2019), PIMCO Managed Accounts Trust (5 portfolios). |
42
FUND MANAGEMENT TABLES (Continued)
| | | | |
| | | |
Name, Year of Birth, Length of Time Served and
Number of Portfolios in Fund
Complex Overseen by Trustee | | Principal Occupation(s) During Past 5 Years | | Other Directorships Held by Trustee During Past 5 Years |
DeCotis, Deborah A. YOB: 1952 Served Since: 2021 102 Portfolios | | Advisory Director, Morgan Stanley & Co., Inc. (since 1996); Member, Circle Financial Group (since 2009); Member, Council on Foreign Relations (since 2013); and Trustee, Smith College (since 2017). Formerly, Director, Watford Re (2017 to 2021); Co-Chair Special Projects Committee, Memorial Sloan Kettering (2005 to 2015); and Trustee, Stanford University (2010 to 2015). | | Trustee (since 2021), The Merger Fund®, The Merger Fund® VL, and Virtus Event Opportunities Trust (2 portfolios); Advisory Board Member (since 2021), Virtus Alternative Solutions Trust (2 portfolios), Virtus Mutual Fund Family (55 portfolios), and Virtus Variable Insurance Trust (8 portfolios); Advisory Board Member (February 2021 to June 2021), Duff & Phelps Select MLP and Midstream Energy Fund Inc.; Trustee (since 2021), Virtus Global Multi-Sector Income Fund and Virtus Total Return Fund Inc.; Trustee (since 2020), PIMCO Dynamic Income Opportunities Fund; Trustee (since 2019), PIMCO Energy and Tactical Credit Opportunities Fund and Virtus AllianzGI Artificial Intelligence & Technology Opportunities Fund; Trustee (since 2018), PIMCO Flexible Municipal Income Fund Trustee (since 2017), PIMCO Flexible Credit Income Fund and Virtus AllianzGI Convertible & Income 2024 Target Term Fund; Trustee (since 2015), Virtus AllianzGI Diversified Income & Convertible Fund; Trustee (since 2014), Virtus Investment Trust (13 portfolios); Trustee (since 2013), PIMCO Dynamic Credit and Mortgage Income Fund; Trustee (since 2012), PIMCO Dynamic Income Fund; Trustee (since 2011), Virtus Strategy Trust (11 portfolios); Trustee (since 2011), PIMCO California Municipal Income Fund II, PIMCO California Municipal Income Fund III, PIMCO Municipal Income Fund, PIMCO Municipal Income Fund II, PIMCO Municipal Income Fund III, PIMCO New York Municipal Income Fund, PIMCO New York Municipal Income Fund II, PIMCO New York Municipal Income Fund III, PCM Fund, Inc., PIMCO Corporate & Income Strategy Fund, PIMCO Corporate & Income Opportunity Fund, PIMCO Global StocksPLUS® & Income Fund, PIMCO High Income Fund, PIMCO Income Opportunity Fund, PIMCO Income Strategy Fund, PIMCO Income Strategy Fund II, PIMCO Strategic Income Fund, Inc., PIMCO Managed Accounts Trust (5 portfolios); and Trustee (since 2011), Virtus AllianzGI Convertible & Income Fund, Virtus AllianzGI Convertible & Income Fund II, Virtus AllianzGI Equity & Convertible Income Fund, and Virtus Dividend, Interest & Premium Strategy Fund. |
Drummond, F. Ford YOB: 1962 Served Since: 2021 102 Portfolios | | Owner/Operator (since 1998), Drummond Ranch; and Director (since 2015), Texas and Southwestern Cattle Raisers Association. Formerly Chairman, Oklahoma Nature Conservancy (2019 to 2020); Board Member (2006 to 2020) and Chairman (2016 to 2018), Oklahoma Water Resources Board; Director (1998 to 2008), The Cleveland Bank; and General Counsel (1998 to 2008), BMIHealth Plans (benefits administration). | | Trustee (since 2021), The Merger Fund®, The Merger Fund® VL, and Virtus Event Opportunities Trust (2 portfolios); Advisory Board Member (since 2021), Virtus Alternative Solutions Trust (2 portfolios), Virtus Mutual Fund Family (55 portfolios), and Virtus Variable Insurance Trust (8 portfolios); Advisory Board Member (February 2021 to June 2021), Duff & Phelps Select MLP and Midstream Energy Fund Inc.; Trustee (since 2021), Virtus Global Multi-Sector Income Fund and Virtus Total Return Fund Inc.; Trustee (since 2019), Virtus AllianzGI Artificial Intelligence & Technology Opportunities Fund; Trustee (since 2017), Virtus AllianzGI Convertible & Income 2024 Target Term Fund; Trustee (since 2015), Virtus AllianzGI Convertible & Income Fund, Virtus AllianzGI Convertible & Income Fund II, Virtus AllianzGI Diversified Income & Convertible Fund, Virtus Dividend, Interest & Premium Strategy Fund and Virtus AllianzGI Equity & Convertible Income Fund; Trustee (since 2014), Virtus Strategy Trust (11 portfolios); Director (since 2011), Bancfirst Corporation; and Trustee (since 2006), Virtus Investment Trust (13 portfolios). |
Harris, Sidney E. YOB: 1949 Served Since: 2021 95 Portfolios | | Private Investor (since 2021); Dean Emeritus (since 2015), Professor (2015 to 2021 and 1997 to 2014), Dean (1997 to 2004), J. Mack Robinson College of Business, Georgia State University. | | Trustee (since 2021), The Merger Fund®, The Merger Fund® VL, Virtus Event Opportunities Trust (2 portfolios), Virtus Investment Trust (13 portfolios) and Virtus Strategy Trust (11 portfolios); Director (2020 to 2021), Duff & Phelps Select MLP and Midstream Energy Fund Inc.; and Director (since 2020), Virtus Total Return Fund Inc.; Trustee (since 2020), Virtus Global Multi-Sector Income Fund; Trustee (since 2019), Mutual Fund Directors Forum; Trustee (since 2017), Virtus Mutual Fund Family (55 portfolios), Virtus Variable Insurance Trust (8 portfolios) and Virtus Alternative Solutions Trust (2 portfolios); Trustee (2013 to 2020) and Honorary Trustee (since 2020), KIPP Metro Atlanta; Director (1999 to 2019), Total System Services, Inc.; Trustee (2004 to 2017), RidgeWorth Funds; Chairman (2012 to 2017), International University of the Grand Bassam Foundation; Trustee (since 2012), International University of the Grand Bassam Foundation; and Trustee (2011 to 2015), Genspring Family Offices, LLC. |
Mallin, John R. YOB: 1950 Served Since: 2021 95 Portfolios | | Partner/Attorney (since 2003), McCarter & English LLP (law firm) Real Property Practice Group; and Member (since 2014), Counselors of Real Estate. | | Trustee (since 2021), The Merger Fund®, The Merger Fund® VL, Virtus Event Opportunities Trust (2 portfolios), Virtus Investment Trust (13 portfolios) and Virtus Strategy Trust (11 portfolios); Director (2020 to 2021), Duff & Phelps Select MLP and Midstream Energy Fund Inc.; and Director (since 2020), Virtus Total Return Fund Inc.; Trustee (since 2020), Virtus Global Multi-Sector Income Fund; Trustee (since 2016), Virtus Mutual Fund Family (55 portfolios) and Virtus Alternative Solutions Trust (2 portfolios); Director (since 2019), 1892 Club, Inc. (non-profit); Director (2013 to 2020), Horizons, Inc. (non-profit); and Trustee (since 1999), Virtus Variable Insurance Trust (8 portfolios). |
43
FUND MANAGEMENT TABLES (Continued)
| | | | |
| | | |
Name, Year of Birth, Length of Time Served and
Number of Portfolios in Fund
Complex Overseen by Trustee | | Principal Occupation(s) During Past 5 Years | | Other Directorships Held by Trustee During Past 5 Years |
McDaniel, Connie D. YOB: 1958 Served Since: 2021 95 Portfolios | | Retired (since 2013). Vice President, Chief of Internal Audit, Corporate Audit Department (2009 to 2013); Vice President, Global Finance Transformation (2007 to 2009); Vice President and Controller (1999 to 2007), The Coca-Cola Company. | | Trustee (since 2021), The Merger Fund®, The Merger Fund® VL, Virtus Event Opportunities Trust (2 portfolios), Virtus Investment Trust (13 portfolios) and Virtus Strategy Trust (11 portfolios); Director (2020 to 2021), Duff & Phelps Select MLP and Midstream Energy Fund Inc.; and Director (since 2020), Virtus Total Return Fund Inc.; Trustee (since 2020), Virtus Global Multi-Sector Income Fund; Director (since 2019), Global Payments Inc.; Chairperson (since 2019), Governance & Nominating Committee, Global Payments Inc; Trustee (since 2017), Virtus Mutual Fund Family (55 portfolios), Virtus Variable Insurance Trust (8 portfolios), and Virtus Alternative Solutions Trust (2 portfolios); Director (since 2021), North Florida Land Trust; Director (2014 to 2019), Total System Services, Inc.; Member (since 2011) and Chair (2014 to 2016), Georgia State University, Robinson College of Business Board of Advisors; and Trustee (2005 to 2017), RidgeWorth Funds. |
McLoughlin, Philip YOB: 1946 Served Since: 2021 105 Portfolios | | Private investor since 2010. | | Trustee (since 2021), The Merger Fund®, The Merger Fund® VL, Virtus Event Opportunities Trust (2 portfolios), Virtus Investment Trust (13 portfolios) and Virtus Strategy Trust (11 portfolios); Trustee (since 2021), Virtus AllianzGI Artificial Intelligence & Technology Opportunities Fund, Virtus AllianzGI Convertible & Income Fund II, Virtus AllianzGI Diversified Income & Convertible Fund, Virtus AllianzGI Equity & Convertible Income Fund and Virtus Dividend, Interest & Premium Strategy Fund; Trustee (since 2022) and Advisory Board Member (2021), Virtus AllianzGI Convertible & Income 2024 Target Term Fund and Virtus AllianzGI Convertible & Income Fund; Director and Chairman (since 2016), Virtus Total Return Fund Inc.; Director and Chairman (2016 to 2019), the former Virtus Total Return Fund Inc.; Director and Chairman (2014 to 2021), Duff & Phelps Select MLP and Midstream Energy Fund Inc.; Trustee and Chairman (since 2013), Virtus Alternative Solutions Trust (2 portfolios); Trustee and Chairman (since 2011), Virtus Global Multi-Sector Income Fund; Chairman and Trustee (since 2003), Virtus Variable Insurance Trust (8 portfolios); Director (since 1995), closed-end funds managed by Duff & Phelps Investment Management Co. (3 funds); Director (1991 to 2019) and Chairman (2010 to 2019), Lazard World Trust Fund (closed-end investment firm in Luxembourg); and Trustee (since 1989) and Chairman (since 2002), Virtus Mutual Fund Family (55 portfolios). |
McNamara, Geraldine M. YOB: 1951 Served Since: 2021 98 Portfolios | | Private investor (since 2006); and Managing Director, U.S. Trust Company of New York (1982 to 2006). | | Trustee (since 2021), The Merger Fund®, The Merger Fund® VL, Virtus Event Opportunities Trust (2 portfolios), Virtus Investment Trust (13 portfolios) and Virtus Strategy Trust (11 portfolios); Director (2020 to 2021), Duff & Phelps Select MLP and Midstream Energy Fund Inc. and Virtus Total Return Fund Inc.; Trustee (since 2020), Virtus Global Multi-Sector Income Fund; Trustee (since 2016), Virtus Alternative Solutions Trust (2 portfolios); Trustee (since 2015), Virtus Variable Insurance Trust (8 portfolios); Director (since 2003), closed-end funds managed by Duff & Phelps Investment Management Co. (3 funds); and Trustee (since 2001), Virtus Mutual Fund Family (55 portfolios). |
Walton, R. Keith YOB: 1964 Served Since: 2021 102 Portfolios | | Venture and Operating Partner (since 2020), Plexo Capital, LLC; Venture Partner (since 2019) and Senior Adviser (2018 to 2019), Plexo, LLC; Formerly, Managing Director (2020 to 2021), Lafayette Square Holding Company LLC; Senior Adviser (2018 to 2019), Vatic Labs, LLC; Executive Vice President, Strategy (2017 to 2019), Zero Mass Water, LLC; Vice President, Strategy (2013 to 2017), Arizona State University; and Partner (since 2006), Global Infrastructure Partners. | | Trustee (since 2022), Virtus AllianzGI Diversified Income & Convertible Fund; Advisory Board Member (since 2022), Virtus AllianzGI Artificial Intelligence & Technology Opportunities Fund, Virtus AllianzGI Convertible & Income 2024 Target Term Fund, Virtus AllianzGI Convertible & Income Fund, Virtus AllianzGI Convertible & Income Fund II, Virtus AllianzGI Equity & Convertible Income Fund and Virtus Dividend, Interest & Premium Strategy Fund; Trustee (since 2021), The Merger Fund®, The Merger Fund® VL, Virtus Event Opportunities Trust (2 portfolios), Virtus Investment Trust (13 portfolios) and Virtus Strategy Trust (11 portfolios); Trustee (since 2020) Virtus Alternative Solutions Trust (2 portfolios), Virtus Variable Insurance Trust (8 portfolios) and Virtus Mutual Fund Family (55 portfolios); Director (since 2017), certain funds advised by Bessemer Investment Management LLC; Director (2016 to 2021), Duff & Phelps Select MLP and Midstream Energy Fund Inc.; Trustee (since 2016), Virtus Global Multi-Sector Income Fund; Director (2006 to 2019), Systematica Investments Limited Funds; Director (2006 to 2017), BlueCrest Capital Management Funds; Trustee (2014 to 2017), AZ Service; Director (since 2004), Virtus Total Return Fund Inc.; and Director (2004 to 2019), the former Virtus Total Return Fund Inc. |
44
FUND MANAGEMENT TABLES (Continued)
| | | | |
| | | |
Name, Year of Birth, Length of Time Served and
Number of Portfolios in Fund
Complex Overseen by Trustee | | Principal Occupation(s) During Past 5 Years | | Other Directorships Held by Trustee During Past 5 Years |
Zino, Brian T. YOB: 1952 Served Since: 2021 102 Portfolios | | Retired. Various roles (1982 to 2009), J. & W. Seligman & Co. Incorporated, including President (1994 to 2009). | | Trustee (since 2021), The Merger Fund®, The Merger Fund® VL, Virtus Event Opportunities Trust (2 portfolios), Virtus Investment Trust (13 portfolios) and Virtus Strategy Trust (11 portfolios); Trustee (since 2022) and Advisory Board Member (2021), Virtus AllianzGI Closed-End Funds (7 portfolios); Trustee (since 2020), Virtus Alternative Solutions Trust (2 portfolios), Virtus Variable Insurance Trust (8 portfolios) and Virtus Mutual Fund Family (55 portfolios); Director (2016 to 2021), Duff & Phelps Select MLP and Midstream Energy Fund Inc.; Trustee (since 2016), Virtus Global Multi-Sector Income Fund; Director (since 2014), Virtus Total Return Fund Inc.; Director (2014 to 2019), the former Virtus Total Return Fund Inc.; Trustee (since 2011), Bentley University; Director (1986 to 2009) and President (1994 to 2009), J&W Seligman Co. Inc.; Director (1998 to 2009), Chairman (2002 to 2004) and Vice Chairman (2000 to 2002), ICI Mutual Insurance Company; Member, Board of Governors of ICI (1998 to 2008). |
Interested Trustee
| | | | |
| | | |
Name, Year of Birth, Length of Time Served and
Number of Funds Overseen | | Principal Occupation(s) During Past 5 Years | | Principal Occupation(s) During Past 5 Years and
Other Directorships Held by Trustee |
Aylward, George R.* Trustee and President YOB: 1964 Served Since: 2021 107 Portfolios | | Director, President and Chief Executive Officer (since 2008), Virtus Investment Partners, Inc. and/or certain of its subsidiaries, and various senior officer positions with Virtus affiliates (since 2005). | | Member, Board of Governors of the Investment Company Institute (since 2021); Trustee and President (since 2021), The Merger Fund®, The Merger Fund® VL, Virtus Event Opportunities Trust (2 portfolios), Virtus Investment Trust (13 portfolios) and Virtus Strategy Trust (11 portfolios); Trustee, President and Chief Executive Officer (since 2021), Virtus AllianzGI Closed-End Funds (7 portfolios); Chairman and Trustee (since 2015), Virtus ETF Trust II (5 portfolios); Director, President and Chief Executive Officer (2014 to 2021), Duff & Phelps Select MLP and Midstream Energy Fund Inc.; Trustee and President (since 2013), Virtus Alternative Solutions Trust (2 portfolios); Director (since 2013), Virtus Global Funds, PLC (5 portfolios); Trustee (since 2012) and President (since 2010), Virtus Variable Insurance Trust (8 portfolios); Trustee, President and Chief Executive Officer (since 2011), Virtus Global Multi-Sector Income Fund; Trustee and President (since 2006) and Executive Vice President (2004 to 2006), Virtus Mutual Fund Family (55 portfolios); Director, President and Chief Executive Officer (since 2006), Virtus Total Return Fund Inc.; and Director, President and Chief Executive Officer (2006 to 2019), the former Virtus Total Return Fund Inc. |
* Mr. Aylward is an “interested person,” as defined in the 1940 Act, by reason of his position as President and Chief Executive Officer of Virtus Investment Partners, Inc. (“Virtus”), the ultimate parent company of the Adviser, and various positions with its affiliates, including the Adviser.
Advisory Board Member
| | | | |
| | | |
Name, Year of Birth, Length of Time Served, and
Number of Portfolios in Fund
Complex Overseen | | Principal Occupation(s) During Past 5 Years | | Other Directorships Held by Trustee During Past 5 Years |
Moyer, William R. YOB: 1944 Served Since: 2021 95 Portfolios | | Private investor (since 2004); and Financial and Operations Principal (2006 to 2017), Newcastle Distributors LLC (broker dealer). | | Advisory Board Member (since 2021), The Merger Fund®, The Merger Fund® VL, Virtus Event Opportunities Trust (2 portfolios), Virtus Investment Trust (13 portfolios) and Virtus Strategy Trust (11 portfolios); Advisory Board Member (since 2020), Virtus Variable Insurance Trust (8 portfolios) and Virtus Mutual Fund Family (55 portfolios); Advisory Board Member (since 2020) and Director (2016 to 2019), Virtus Total Return Fund Inc.; Director (2016 to 2019), the former Virtus Total Return Fund Inc.; Advisory Board Member (2020 to 2021) and Director (2014 to 2019), Duff & Phelps Select MLP and Midstream Energy Fund Inc.; Advisory Board Member (since 2020) and Trustee (2011 to 2019), Virtus Global Multi-Sector Income Fund; Advisory Board Member (since 2020) and Trustee (2013 to 2016), Virtus Alternative Solutions Trust (2 portfolios). |
45
FUND MANAGEMENT TABLES (Continued)
Officers of the Trust Who Are Not Trustees
| | | | |
| | | |
Name, Address and Year of Birth | | Position(s) Held with Trust and Length of Time Served | | Principal Occupation(s) During Past 5 Years |
Batchelar, Peter J. YOB: 1970 | | Senior Vice President (since 2021). | | Senior Vice President, Product Development (since 2017), Vice President, Product Development (2008 to 2016), and various officer positions (since 2008), Virtus Investment Partners, Inc. and/or certain of its subsidiaries; Senior Vice President (since 2021), The Merger Fund®, The Merger Fund® VL, Virtus Event Opportunities Trust, Virtus Investment Trust, Virtus Strategy Trust and Virtus AllianzGI Closed-End Funds; Senior Vice President (since 2017) and Vice President (2008 to 2016), Virtus Mutual Fund Family; Senior Vice President (since 2017) and Vice President (2010 to 2016), Virtus Variable Insurance Trust; Senior Vice President (since 2017) and Vice President (2013 to 2016), Virtus Alternative Solutions Trust; Senior Vice President (2017 to 2021) and Vice President (2016 to 2017), Duff & Phelps Select MLP and Midstream Energy Fund Inc.; Senior Vice President (since 2017) and Vice President (2016 to 2017), Virtus Total Return Fund Inc. and Virtus Global Multi-Sector Income Fund; and Senior Vice President (2017 to 2019) and Vice President (2016 to 2017), the former Virtus Total Return Fund Inc. |
Bradley, W. Patrick YOB: 1972 | | Executive Vice President, Chief Financial Officer and Treasurer (since 2021). | | Executive Vice President, Fund Services (since 2016), Senior Vice President, Fund Services (2010 to 2016), and various officer positions (since 2006), Virtus Investment Partners, Inc. and/or certain of its subsidiaries; Executive Vice President, Chief Financial Officer and Treasurer (since 2021), The Merger Fund®, The Merger Fund® VL, Virtus Event Opportunities Trust, Virtus Investment Trust, Virtus Strategy Trust and Virtus AllianzGI Closed-End Funds; Director (since 2019), Virtus Global Funds ICAV; Executive Vice President (since 2016), Senior Vice President (2013 to 2016), Vice President (2011 to 2013), Chief Financial Officer and Treasurer (since 2004), Virtus Variable Insurance Trust; Executive Vice President (since 2016), Senior Vice President (2013 to 2016), Vice President (2011 to 2013), Chief Financial Officer and Treasurer (since 2006), Virtus Mutual Fund Family; Executive Vice President (since 2016), Senior Vice President (2013 to 2016), Vice President (2012 to 2013) and Chief Financial Officer and Treasurer (since 2010), Virtus Total Return Fund Inc.; Executive Vice President (2016 to 2019), Senior Vice President (2013 to 2016), Vice President (2012 to 2013), Chief Financial Officer and Treasurer (since 2010), the former Virtus Total Return Fund Inc.; Executive Vice President (since 2016), Senior Vice President (2013 to 2016), Vice President (2011 to 2013), Chief Financial Officer and Treasurer (since 2011), Virtus Global Multi-Sector Income Fund; Executive Vice President ( 2016 to 2021), Senior Vice President (2014 to 2016), Chief Financial Officer and Treasurer (2014 to 2021), Duff & Phelps Select MLP and Midstream Energy Fund Inc.; Executive Vice President (since 2016), Senior Vice President (2013 to 2016), and Chief Financial Officer and Treasurer (since 2013), Virtus Alternative Solutions Trust; Director (since 2013), Virtus Global Funds, PLC; and Vice President and Assistant Treasurer (since 2011), Duff & Phelps Utility and Infrastructure Fund Inc. |
Carr Kevin J. YOB: 1954 | | Senior Vice President and Assistant Secretary (since 2021). | | Vice President and Senior Counsel (2017 to Present), Senior Vice President (2009 to 2017), Vice President, Counsel and Secretary (2008 to 2009), and various officer positions (since 2005), Virtus Investment Partners, Inc. and/or certain of its subsidiaries; Senior Vice President and Assistant Secretary (since 2021), The Merger Fund®, The Merger Fund® VL, Virtus Event Opportunities Trust, Virtus Investment Trust and Virtus Strategy Trust; Assistant Secretary, (since 2021), Virtus AllianzGI Closed-End Funds; Senior Vice President (since 2013), Vice President (2005 to 2013), Chief Legal Officer, Counsel and Secretary (since 2005), Virtus Mutual Fund Family; Senior Vice President (2013 to 2014), Vice President (2012 to 2013), Secretary and Chief Legal Officer (2005 to 2013), and Assistant Secretary (2013 to 2014 and since 2017), Virtus Total Return Fund Inc.; Senior Vice President (2013 to 2014), Vice President (2012 to 2013), Secretary and Chief Legal Officer (2005 to 2013) and Assistant Secretary (2013 to 2014 and 2017 to 2019), the former Virtus Total Return Fund Inc.; Senior Vice President (since 2017), Assistant Secretary (since 2013), Vice President, Chief Legal Officer, Counsel and Secretary (2010 to 2013), Virtus Variable Insurance Trust; Senior Vice President (2013 to 2014), Vice President (2011 to 2013), and Assistant Secretary (since 2011), Virtus Global Multi-Sector Income Fund; Assistant Secretary (2015 to 2021), Duff & Phelps Select MLP and Midstream Energy Fund Inc.; Senior Vice President (since 2017) and Assistant Secretary (since 2013), Virtus Alternative Solutions Trust; Secretary (since 2015), ETFis Series Trust I; and Secretary (since 2015), Virtus ETF Trust II. |
46
FUND MANAGEMENT TABLES (Continued)
| | | | |
| | | |
Name, Address and Year of Birth | | Position(s) Held with Trust and Length of Time Served | | Principal Occupation(s) During Past 5 Years |
Engberg, Nancy J. YOB: 1956 | | Senior Vice President and Chief Compliance Officer (since 2021). | | Senior Vice President (since 2017), Vice President (2008 to 2017) and Chief Compliance Officer (2008 to 2011 and since 2016), and various officer positions (since 2003), Virtus Investment Partners, Inc. and/or certain of its subsidiaries; Senior Vice President and Chief Compliance Officer (since 2021), The Merger Fund®, The Merger Fund® VL, Virtus Event Opportunities Trust, Virtus Investment Trust, Virtus Strategy Trust and Virtus AllianzGI Closed-End Funds; Senior Vice President (since 2017), Vice President (2011 to 2017) and Chief Compliance Officer (since 2011), Virtus Mutual Fund Family; Senior Vice President (since 2017), Vice President (2010 to 2017) and Chief Compliance Officer (since 2011), Virtus Variable Insurance Trust; Senior Vice President (since 2017), Vice President (2011 to 2017) and Chief Compliance Officer (since 2011), Virtus Global Multi-Sector Income Fund; Senior Vice President (since 2017), Vice President (2012 to 2017) and Chief Compliance Officer (since 2012), Virtus Total Return Fund Inc.; Senior Vice President (2017 to 2019), Vice President (2012 to 2017) and Chief Compliance Officer (2012 to 2019), the former Virtus Total Return Fund Inc.; Senior Vice President (since 2017), Vice President (2013 to 2016) and Chief Compliance Officer (since 2013), Virtus Alternative Solutions Trust; Senior Vice President (2017 to 2021), Vice President (2014 to 2017) and Chief Compliance Officer (2014 to 2021), Duff & Phelps Select MLP and Midstream Energy Fund Inc.; Chief Compliance Officer (since 2015), ETFis Series Trust I; and Chief Compliance Officer (since 2015), Virtus ETF Trust II. |
Fromm Jennifer YOB: 1973 | | Vice President, Chief Legal Officer, Counsel and Secretary (since 2021). | | Vice President (since 2016) and Senior Counsel (since 2007), Virtus Investment Partners, Inc. and/or certain of its subsidiaries; Vice President, Chief Legal Officer, Counsel and Secretary (since 2021), The Merger Fund®, The Merger Fund® VL, Virtus Event Opportunities Trust, Virtus Investment Trust and Virtus Strategy Trust; Vice President and Assistant Secretary (since 2021), Virtus AllianzGI Closed-End Funds; Vice President and Secretary (since 2020), DNP Select Income Fund Inc., Duff & Phelps Utility and Infrastructure Fund Inc., and DTF Tax-Free Income Inc.; Assistant Secretary (since 2020), Duff & Phelps Utility and Corporate Bond Trust Inc.; Vice President, Chief Legal Officer and Secretary (since 2019), Duff & Phelps Select MLP and Midstream Energy Fund Inc., Virtus Total Return Fund Inc. and Virtus Global Multi-Sector Income Fund; Vice President (since 2017) and Assistant Secretary (since 2008), Virtus Mutual Funds Family; Vice President, Chief Legal Officer, Counsel and Secretary (since 2013), Virtus Variable Insurance Trust; and Vice President, Chief Legal Officer, and Secretary (since 2013), Virtus Alternative Solutions Trust. |
Short, Julia R. YOB: 1972 | | Senior Vice President (since 2021). | | Senior Vice President, Product Development (since 2017), Virtus Investment Partners, Inc. and/or certain of its subsidiaries; Senior Vice President (since 2021), The Merger Fund®, The Merger Fund® VL, Virtus Event Opportunities Trust, Virtus Investment Trust, Virtus Strategy Trust and Virtus AllianzGI Closed-End Funds; Senior Vice President (2018 to 2021), Duff & Phelps Select MLP and Midstream Energy Fund Inc.; and Senior Vice President (since 2018), Virtus Global Multi-Sector Income Fund and Virtus Total Return Fund Inc.; Senior Vice President (2018 to 2019), the former Virtus Total Return Fund Inc.; Senior Vice President (since 2017), Virtus Mutual Fund Family; President and Chief Executive Officer, RidgeWorth Funds (2007 to 2017); and Managing Director, Product Manager, RidgeWorth Investments (2004 to 2017). |
Smirl, Richard W. YOB: 1967 | | Executive Vice President (since 2021). | | Executive Vice President, Product Management (since 2021), and Executive Vice President and Chief Operating Officer (since 2021), Virtus Investment Partners, Inc. and/or certain of its subsidiaries; Executive Vice President (since 2021), The Merger Fund®, The Merger Fund® VL, Virtus Event Opportunities Trust, Virtus Mutual Fund Family, Virtus Investment Trust, Virtus Strategy Trust, Virtus AllianzGI Closed-End Funds, Virtus Global Multi-Sector Income Fund, Virtus Global Multi-Sector Income Fund, and Virtus Total Return Fund Inc.; Executive Vice President (May to June 2021), Duff & Phelps Select MLP and Midstream Energy Fund Inc.; Chief Operating Officer (2018 to 2021), Russell Investments; Executive Director (Jan. to July 2018), State of Wisconsin Investment Board; and Partner and Chief Operating Officer (2004 to 2018), William Blair Investment Management. |
47
The Merger Fund VL
ADDITIONAL INFORMATION (Unaudited)
For the fiscal year ended December 31, 2021, certain dividends paid by the Fund may be reported as qualified dividend income (QDI) and may be eligible for taxation at capital gains rate. The percentage of dividends declared from ordinary income designated as qualified dividend income for the fiscal year ended December 31, 2021 was 0.00% for the Fund.
For corporate shareholders, the percent of ordinary income distributions qualifying for the corporate dividends received deduction for the fiscal year ended December 31, 2021 was 0.00% for the Fund.
The percentage of taxable ordinary income distributions that are designated as short-term capital gain distributions under Internal Revenue Code Section 871(k)(2)(c) for the fiscal year ended December 31, 2021 was 100.00% for the Fund.
48
PRIVACY POLICY (Unaudited)
| | |
 | | 02/2021 |
| | | | |
| |
FACTS | | WHAT DO VP DISTRIBUTORS, LLC; VIRTUS FUND SERVICES, LLC; AND VIRTUS MUTUAL FUNDS (VIRTUS) DO WITH YOUR PERSONAL INFORMATION? |
| | |
| | |
Why? | | Financial companies choose how they share your personal information. Federal law gives consumers the right to limit some but not all sharing. Federal law also requires us to tell you how we collect, share, and protect your personal information. Please read this notice carefully to understand what we do. |
| | |
| | |
What? | | The types of personal information we collect and share depend on the product or service you have with us. This information can include: > Social Security Number and Account Balances > Transaction History and Checking Account Information > Account Transactions and Wire Transfer Instructions When you are no longer our customer, we continue to share your information as described in this notice. |
| | |
| | |
How? | | All financial companies need to share customers’ personal information to run their everyday business. In the section below, we list the reasons financial companies can share their customers’ personal information; the reasons Virtus chooses to share; and whether you can limit this sharing. |
| | | | |
| | | |
| Reasons we can share your personal information | | Does Virtus share? | | Can you limit this sharing? |
| | | |
For our everyday business purposes —
such as to process your transactions, maintain your account(s), respond to court orders and legal investigations, or report to credit bureaus | | Yes | | No |
| | | |
For our marketing purposes —
to offer our products and services to you | | Yes | | No |
| | | |
For joint marketing with other financial companies | | No | | We don’t share |
| | | |
For our affiliates’ everyday business purposes —
information about your transactions and experiences | | No | | We don’t share |
| | | |
For our affiliates’ everyday business purposes —
information about your creditworthiness | | No | | We don’t share |
| | | |
For our affiliates to market to you | | No | | We don’t share |
| | | |
For nonaffiliates to market to you | | No | | We don’t share |
| | | | |
| | |
Questions? | | Call 800-243-1574 or go to www.Virtus.com |
49
| | |
| | |
Who we are | | |
| | |
Who is providing this notice? | | VP Distributors, LLC; Virtus Fund Services, LLC; and Virtus Mutual Funds (Virtus) |
| | |
What we do | | |
| | |
How does Virtus
protect my personal information? | | To protect your personal information from unauthorized access and use, we use security measures that comply with federal law. These measures include computer safeguards and secured files and buildings. |
| | |
How does Virtus
collect my personal information? | | We collect your personal information, for example, when you > open an account or give us your contact information > pay us by check or make a wire transfer > buy securities from us We also collect your personal information from others, such as credit bureaus, affiliates, or other companies |
| | |
Why can’t I limit all sharing? | | Federal law gives you the right to limit only > sharing for affiliates’ everyday business purposes — information about your creditworthiness > affiliates from using your information to market to you > sharing for nonaffiliates to market to you State laws and individual companies may give you additional rights to limit sharing. |
| | |
Definitions | | |
| | |
Affiliates | | Companies related by common ownership or control. They can be financial and nonfinancial companies. > Virtus does not share with our affiliates. |
| | |
Nonaffiliates | | Companies not related by common ownership or control. They can be financial and nonfinancial companies. > Virtus does not share with our nonaffiliates so they can market to you. |
| | |
Joint marketing | | A formal agreement between nonaffiliated financial companies that together market financial products or services to you. > Virtus doesn’t jointly market. |
50
THE MERGER FUND® VL
101 Munson Street
Greenfield, MA 01301
Trustees
George R. Aylward
Donald C. Burke
Sarah E. Cogan
Deborah A. DeCotis
F. Ford Drummond
Sidney E. Harris
John R. Mallin
Connie D. McDaniel
Philip R. McLoughlin, Chairman
Geraldine M. McNamara
R. Keith Walton
Brian T. Zino
Advisory Board Member
William R. Moyer
Officers
George R. Aylward, President
Peter Batchelar, Senior Vice President
W. Patrick Bradley, Executive Vice President, Chief Financial Officer and Treasurer
Kevin J. Carr, Senior Vice President and Assistant Secretary
Nancy J. Engberg, Senior Vice President and Chief Compliance Officer
Jennifer Fromm, Vice President, Chief Legal Officer, Counsel and Secretary
Julia R. Short, Senior Vice President
Richard W. Smirl, Executive Vice President
Investment Adviser
Virtus Investment Advisers, Inc.
One Financial Plaza
Hartford, CT 06103-2608
Principal Underwriter
VP Distributors, LLC
One Financial Plaza
Hartford, CT 06103-2608
Administrator
Virtus Fund Services, LLC
One Financial Plaza
Hartford, CT 06103-2608
Custodian
The Bank of New York Mellon
240 Greenwich Street
New York, NY 10286-1048
Independent Registered Public Accounting Firm
PricewaterhouseCoopers LLP
2001 Market Street
Philadelphia, PA 19103-7042
How to Contact Us
| | |
Mutual Fund Services | | 1-800-367-5877 |
Website | | Virtus.com |
Important Notice to Shareholders
The Securities and Exchange Commission has modified mailing regulations for semiannual and annual shareholder fund reports to allow mutual fund companies to send a single copy of these reports to shareholders who share the same mailing address. If you would like additional copies, please call Mutual Fund Services at 1-800-367-5877.
| | |
| | |
PO Box 9874 Providence RI 02940-8074 | | |
For more information about The Merger Fund® VL,
please contact us
at 1-800-367-5877, or visit Virtus.com.
(b) Not applicable.
Item 2. Code of Ethics.
| | (a) | The registrant, as of the end of the period covered by this report, has adopted a code of ethics that applies to the registrant’s principal executive officer, principal financial officer, principal accounting officer or controller, or persons performing similar functions, regardless of whether these individuals are employed by the registrant or a third party. |
| | (c) | Effective October 1, 2021, the code of ethics that applies to the registrant’s principal executive officer, principal financial officer, principal accounting officer or controller, or persons performing similar functions was amended. A copy of the currently applicable code is included as an exhibit. |
| | (d) | The registrant has not granted any waivers, including an implicit waiver, from a provision of the code of ethics that applies to the registrant’s principal executive officer, principal financial officer, principal accounting officer or controller, or persons performing similar functions, regardless of whether these individuals are employed by the registrant or a third party, that relates to one or more of the items set forth in paragraph (b) of this item’s instructions. |
Item 3. Audit Committee Financial Expert.
| | (a)(1) | The Registrant’s Board of Trustees has determined that the Registrant has an “audit committee financial expert” serving on its Audit Committee. |
| | (a)(2) | As of the end of the period covered by the report, the Registrant’s Board of Trustees had determined that each of Connie D. McDaniel, Donald C. Burke and Brian T. Zino possesses the technical attributes identified in Instruction 2(b) of Item 3 to Form N-CSR to qualify as an “audit committee financial expert.” Each such individual is an “independent” trustee pursuant to paragraph (a)(2) of Item 3 to Form N-CSR. |
Item 4. Principal Accountant Fees and Services.
Audit Fees
| | (a) | The aggregate fees billed for each of the last two fiscal years for professional services rendered by the principal accountant for the audit of the registrant’s annual financial statements or services that are normally provided by the accountant in connection with statutory and regulatory filings or engagements for those fiscal years are $45,575 for 2021 and $47,575 for 2020. |
Audit-Related Fees
| | (b) | The aggregate fees billed in each of the last two fiscal years for assurance and related services by the principal accountant that are reasonably related to the performance of the audit of the registrant’s financial statements and are not reported under paragraph (a) of this Item are $0 for 2021 and $0 for 2020. Such audit-related fees include out of pocket expenses. |
Tax Fees
| | (c) | The aggregate fees billed in each of the last two fiscal years for professional services rendered by the principal accountant for tax compliance, tax advice, and tax planning are $0 for 2021 and $6,540 for 2020. |
“Tax Fees” are those primarily associated with review of the Trust’s tax provision and qualification as a regulated investment company (RIC) in connection with audits of the Trust’s financial statement, review of year-end distributions by the Fund to avoid excise tax for the Trust, periodic discussion with management on tax issues affecting the Trust, and reviewing and signing the Fund’s federal income tax returns.
All Other Fees
| | (d) | The aggregate fees billed in each of the last two fiscal years for products and services provided by the principal accountant, other than the services reported in paragraphs (a) through (c) of this Item are $0 for 2021 and $0 for 2020. |
| | (e)(1) | Disclose the audit committee’s pre-approval policies and procedures described in paragraph (c)(7) of Rule 2-01 of Regulation S-X. |
The Merger Fund VL (the “Fund”) Board has adopted policies and procedures with regard to the pre-approval of services provided by PwC. Audit, audit-related and tax compliance services provided to the Fund on an annual basis require specific pre-approval by the Audit Committee. The Audit Committee must also approve other non-audit services provided to the Fund and those non-audit services provided to the Fund’s Affiliate Service Providers that related directly to the operations and financial reporting of the Fund. Certain of these non-audit services that the Audit Committee believes are a) consistent with the SEC’s auditor independence rules and b) routine and recurring services that will not impair the independence of the independent auditors may be approved by the Audit Committee without consideration on a specific case-by-case basis (“general pre-approval”).
The Audit Committee has determined that the Chair of the Audit Committee may provide pre-approval for such services that meet the above requirements but are not included in the general pre-approval in the event such approval is sought between regularly scheduled meetings. In any event, the Audit Committee is informed of, and ratifies, each service approved at the next regularly scheduled in-person Audit Committee meeting.
| | (e)(2) | The percentage of services described in each of paragraphs (b) through (d) of this Item that were approved by the audit committee pursuant to paragraph (c)(7)(i)(C) of Rule 2-01 of Regulation S-X are as follows: |
(b) 0%
(c) 0%
(d) N/A
| | (f) | The percentage of hours expended on the principal accountant’s engagement to audit the registrant’s financial statements for the most recent fiscal year that were attributed to work performed by persons other than the principal accountant’s full-time, permanent employees was less than fifty percent. |
| | (g) | The aggregate non-audit fees billed by the registrant’s accountant for services rendered to the registrant, and rendered to the registrant’s investment adviser (not including any sub-adviser whose role is primarily portfolio management and is subcontracted with or overseen by another investment adviser), and any entity controlling, controlled by, or under common control with the adviser that provides ongoing services to the registrant for each of the last two fiscal years of the registrant was $0 for 2021 and $54,115 for 2020. |
| | (h) | The registrant’s audit committee of the board of directors has considered whether the provision of non-audit services that were rendered to the registrant’s investment adviser (not including any sub-adviser whose role is primarily portfolio management and is subcontracted with or overseen by another investment adviser), and any entity controlling, controlled by, or under common control with the investment adviser that provides ongoing services to the registrant that were not pre-approved pursuant to paragraph (c)(7)(ii) of Rule 2-01 of Regulation S-X is compatible with maintaining the principal accountant’s independence. |
Item 5. Audit Committee of Listed Registrants.
Item 6. Investments.
| | (a) | Schedule of Investments in securities of unaffiliated issuers as of the close of the reporting period is included as part of the report to shareholders filed under Item 1(a) of this form. |
Item 7. Disclosure of Proxy Voting Policies and Procedures for Closed-End Management Investment Companies.
Not applicable.
Item 8. Portfolio Managers of Closed-End Management Investment Companies.
Not applicable.
Item 9. Purchases of Equity Securities by Closed-End Management Investment Company and Affiliated Purchasers.
Not Applicable.
Item 10. Submission of Matters to a Vote of Security Holders.
Effective February 1, 2021, the Board has adopted a new policy for consideration of Trustee nominees recommended by shareholders. With regards to such policy, an individual shareholder or shareholder group submitting a nomination must hold either individually or in the aggregate for at least one full year as of the date of nomination 5% of the shares of a series of the Fund, among other qualifications and restrictions. Shareholders or shareholder groups submitting nominees must comply with all requirements set forth in the Fund’s policy for consideration of Trustee nominees recommended by shareholders and any such submission must be in writing, directed to the attention of the Board’s Governance and Nominating Committee in care of the Fund’s Secretary, and should include biographical information, including business experience for the past ten years and a description of the qualifications of the proposed nominee, along with a statement from the proposed nominee that he or she is willing to serve and meets the requirements to be an Independent Trustee, if applicable. Shareholder nominees for Trustee will be given the same consideration as any candidate provided the nominee meets certain minimum requirements.
Item 11. Controls and Procedures.
| | (a) | The registrant’s principal executive and principal financial officers, or persons performing similar functions, have concluded that the registrant’s disclosure controls and procedures (as defined in Rule 30a-3(c) under the Investment Company Act of 1940, as amended (the “1940 Act”) (17 CFR 270.30a-3(c))) are effective, as of a date within 90 days of the filing date of the report that includes the disclosure required by this paragraph, based on their evaluation of these controls and procedures required by Rule 30a-3(b) under the 1940 Act (17 CFR 270.30a-3(b)) and Rules 13a-15(b) or 15d-15(b) under the Securities Exchange Act of 1934, as amended (17 CFR 240.13a-15(b) or 240.15d-15(b)). |
| | (b) | There were no changes in the registrant’s internal control over financial reporting (as defined in Rule 30a-3(d) under the 1940 Act (17 CFR 270.30a-3(d))) that occurred during the period covered by this report that has materially affected, or is reasonably likely to materially affect, the registrant’s internal control over financial reporting. |
Item 12. Disclosure of Securities Lending Activities for Closed-End Management Investment Companies.
Not applicable.
SIGNATURES
Pursuant to the requirements of the Securities Exchange Act of 1934 and the Investment Company Act of 1940, the registrant has duly caused this report to be signed on its behalf by the undersigned, thereunto duly authorized.
| | | | |
| (Registrant) | | The Merger Fund VL | | |
| | |
| By (Signature and Title)* | | /s/ George R. Aylward George R. | | |
| | Aylward, President (principal executive officer) | | |
| |
| Date 3/7/22 | | |
Pursuant to the requirements of the Securities Exchange Act of 1934 and the Investment Company Act of 1940, this report has been signed below by the following persons on behalf of the registrant and in the capacities and on the dates indicated.
| | | | |
| By (Signature and Title)* | | /s/ George R. Aylward | | |
| | George R. Aylward, President | | |
| | (principal executive officer) | | |
| |
| Date 3/7/22 | | |
| | |
| By (Signature and Title)* | | /s/ W. Patrick Bradley | | |
| Chief Financial Officer, and Treasurer | | W. Patrick Bradley, Executive Vice President, (principal financial officer) | | |
| |
| Date 3/7/22 | | |
| * | Print the name and title of each signing officer under his or her signature. |