UNITED STATES
SECURITIES AND EXCHANGE COMMISSION
Washington, D.C. 20549
FORM N-CSR
CERTIFIED SHAREHOLDER REPORT OF REGISTERED
MANAGEMENT INVESTMENT COMPANIES
Investment Company Act file number 811-21279
The Merger Fund VL
(Exact name of registrant as specified in charter)
100 Summit Lake Drive
Valhalla, New York 10595
(Address of principal executive offices) (Zip code)
Roy Behren and Michael T. Shannon
100 Summit Lake Drive
Valhalla, New York 10595
(Name and address of agent for service)
1-800-343-8959
Registrant's telephone number, including area code
Date of fiscal year end: December 31
Date of reporting period: December 31, 2014
Item 1. Reports to Stockholders.
December 31, 2014
THE MERGER FUND VL
| | Total Firm AUM: | $5.8 billion |
| STANDARDIZED | Strategy Assets: | |
| PERFORMANCE SUMMARY | Merger Arbitrage1 | $5.5 billion |
| As of December 31, 2014 | Multi-Event2 | $296.7 million |
| | | Average Annual Total Return (%) |
| Merger Arbitrage | QTD | YTD | 1 YR | 3 YR | 5 YR | 10 YR | Life |
| The Merger Fund | | | | | | | |
| (Investor) | -0.56 | 1.43 | 1.43 | 2.88 | 2.74 | 3.41 | 6.60 |
| The Merger Fund | | | | | | | |
| (Institutional) | -0.43 | 1.63 | 1.63 | n/a | n/a | n/a | 2.71 |
| | Annual Operating Expense Ratio (%)3 |
| | Gross | Net | Expenses Before | | |
| Merger Arbitrage | Expense | Expense | Investment Related | Performance | Fund |
| | Ratio | Ratio3 | Expenses4 | Inception | AUM |
| The Merger Fund | | | | | |
| (Investor) | 1.65% | 1.52% | 1.26% | 01/31/1989 | $4.1 b |
| The Merger Fund | | | | | |
| (Institutional) | 1.48% | 1.35% | 1.09% | 08/01/2013 | $1.3 b |
| | Average Annual Total Return (%) |
| Insurance | | | | | | | |
| Dedicated Funds | QTD | YTD | 1 YR | 3 YR | 5 YR | 10 YR | Life |
| The Merger Fund VL | -0.54 | 1.37 | 1.37 | 2.58 | 2.78 | 5.17 | 5.50* |
| | Annual Operating Expense Ratio (%)3 |
| | | | Total Annual | | |
| Insurance | Gross | Net | Operating Expenses | Performance | Fund |
| Dedicated Funds | Expense | Expense | After Expense | Inception | AUM |
| | Ratio | Ratio | Reimbursement5 | | |
| The Merger Fund VL | 3.00 | 1.69 | 1.40 | 05/24/2004 | $23 m |
| | Average Annual Total Return (%) |
| Multi-Event | QTD | YTD | 1 YR | 3 YR | 5 YR | 10 YR | Life |
| Event Driven Fund | 0.16 | 3.87 | 3.87 | n/a | n/a | n/a | 3.87 |
| | Annual Operating Expense Ratio (%)3 |
| | | | Total Annual | | |
| | Gross | Net | Operating Expenses | Performance | Fund |
| Multi-Event | Expense | Expense | After Expense | Inception | AUM |
| | Ratio | Ratio | Reimbursement6 | | |
| Event Driven Fund | 2.51 | 1.98 | 1.74 | 01/02/2014 | $13 m |
| * | Performance is calculated for the period from June 1, 2004, the first full month of the life of the Fund. |
| YTD performance is not annualized. Performance data quoted represent past performance; past performance does not guarantee future results. The performance results portrayed herein reflect the reinvestment of all interest, dividends and distributions. The investment return and principal |
value of an investment will fluctuate so that an investor’s shares, when redeemed, may be worth more or less than their original cost. Current performance of the Fund may be lower or higher than the performance quoted. Performance data included herein for periods prior to 2011 reflect that of Westchester Capital Management, Inc., the Fund’s prior investment advisor. Messrs. Behren and Shannon, the Fund’s current portfolio managers, have served as co-portfolio managers of the Fund since 2007. Performance data current to the most recent month-end may be obtained by calling (800) 343-8959 or by visiting www.westchestercapitalfunds.com. Short term performance, in particular, is not a good indication of WCEIX’s future performance, and an investment should not be made based solely on returns.
1Includes USD 81.7 million in private funds advised by Westchester Capital Management, LLC’s affiliated invested advisor; 2includes USD 285 million in sub-advised funds. 3Expense ratios are as of a fund’s most recent prospectus. Prospectus dates vary among funds. For The Merger Fund, expense ratios are as of the April 30, 2014. The Advisor has agreed to reduce its management fee until December 31, 2015. For The Merger Fund VL, expense ratios are as of the April 28, 2014 prospectus. For the Event-Driven Fund, expense ratios are as of the December 11, 2013 prospectus. 4Investment related expenses include acquired fund fees and expenses, interest expense, and borrowing expense and dividend expense on securities sold short. 5The Merger Fund VL: The Adviser has contractually agreed to waive its investment advisory fee and to reimburse the Fund for other ordinary operating expenses to the extent necessary to limit ordinary operating expenses to an amount not to exceed 1.40%. The expense limitation is expected to apply until December 31, 2015 except that it may be terminated by the Board of Trustees at any time. 6Event-Driven Fund: The Adviser has contractually agreed to waive its investment advisory fee and to reimburse the Fund for other ordinary operating expenses to the extent necessary to limit ordinary operating expenses to an amount not to exceed 1.74%. The expense limitation is expected to apply until April 30, 2016, except that it may be terminated by the Board of Trustees at any time.
| MARKET INDICES | QTD | YTD | 1 YR | 3 YR | 5 YR | 10 YR |
| Morningstar | | | | | | |
| Category Average: | | | | | | |
| Market Neutral | -0.43% | 0.76% | 0.76% | 1.44% | 1.25% | 1.89% |
| Barclays Aggregate | | | | | | |
| Bond Index | 1.78% | 5.94% | 5.94% | 2.66% | 4.46% | 4.71% |
| MSCI World Index | 1.12% | 5.50% | 5.50% | 16.13% | 10.81% | 6.61% |
| S&P 500 Index | 4.93% | 13.69% | 13.69% | 20.41% | 15.45% | 7.67% |
| HFRX Merger | | | | | | |
| Arbitrage Index | 1.43% | 2.19% | 2.19% | 2.38% | 2.12% | 4.14% |
| HFRX Event | | | | | | |
| Driven Index | -5.45% | -4.06% | -4.06% | 5.00% | 2.34% | 1.95% |
Fellow Shareholders,
The final quarter of 2014 was unusual in many respects. U.S. equities were again the best performing asset class for the quarter but realized volatility spiked significantly.1 During the 4th quarter, the S&P 500 dropped almost 10% at one point, but managed to rally back to finish the quarter ahead by 4.93%. With the S&P 500 tacking on 32% in 2013 and having nearly tripled since the market bottom in March 2009, many expected muted or even negative returns in 2014. Confounding the experts once again, Morningstar calculated that the S&P 500 Index outperformed 80% of active managers in 2014, rising 13.69% and capping three years of consecutive double-digit returns for the Index—the first time since 1995-1999.
Investors similarly expected a rough time for U.S. Treasuries and other rate-sensitive instruments as the Fed began tapering its bond-buying program. Many had predicted that U.S. interest rates had bottomed and there was only one direction left to go—higher. However, somebody switched the script and rates sunk even lower during 2014, with the 10-year ending the year at 2.17%, down from 3.0% a year earlier (note: rates have dropped further as of the date of this letter, astoundingly bringing the 10-year yield to sub-1.8%). As we know, bonds gain value when rates sink, so the Barclays Aggregate Bond Index was a beneficiary, returning 1.78% for the quarter and 5.94% for the year.
Hedge fund strategies, on the other hand, diverged from equity and fixed income performance. The HFRX Merger Arbitrage Index and HFRX Event-Driven Index significantly underperformed major equity benchmarks, causing some pundits to question the value proposition for alternative investments. The spurious comparison between equity market and alternative investments is easy to make but it is important to keep things in perspective. Alternative investments often use short positions and portfolio hedges to try to minimize volatility and maximize risk-adjusted returns. Investors should not be looking for alternative strategies to beat the S&P, but instead to diversify their traditional equity and bond exposure with a complementary risk/return profile. They should be viewed as a tool to help hedge the volatility that may accompany directional investing. We like to think of it as deflating the ball a little—it might not travel as far, but it will be easier to catch.
__________
1 The VIX hit a low of 10.33 on July 3 and tripled to a high of 31.05 on October 15.
In any event, with increased equity volatility and global macroeconomic developments including energy volatility, Middle East unrest, and European economic sluggishness all potentially adding risk, 2015 could be a critical period for liquid alternatives to demonstrate their value. We have successfully navigated these types of periods before and hope to be considered as a manager who is positioned to weather the anticipated capital market turbulence.
STRATEGY UPDATES
Merger Activity
2014 was a busy year for strategic corporate events as a surge in boardroom confidence, continued low interest rates, and a rising stock market resulted in the highest level of deal-making since 2007. As discussed in our prior letter, this trend began in late 2013, as companies began to explore various types of transactions in addition to run-of-the-mill (referred to in the hedge fund community as “plain vanilla”) mergers. Activist investors (at both the buyer and the target company) acted as kerosene on the fire. Investors rewarded companies that opportunistically deployed capital in mergers or even split themselves into independent entities. A metric called deal value creation (which tracks stock price movements before and after deal announcements to measure shareholder value that has been created) recently hit an all-time high with over 80% of acquiring company stock prices reacting positively after announcement.2
Merger activity picked up in 2014 and the size of transactions followed suit, with the big getting bigger as some of the world’s giant corporations rolled up large competitors, from Comcast Corp.’s $68 billion deal for Time Warner Cable Inc. in the first quarter to last month, when Halliburton Co. and Actavis Plc announced a combined $100 billion in takeovers on the same day. In fact, megadeals dominated the scene with approximately 94 deals worth more than $5 billion each, an 81% increase over 2013.3 Mel Brooks would certainly appreciate the current environment.
__________
| 2 | MKM Partners, Event-Driven Research: Weekly Report, December 5, 2014 |
| 3 | Allen & Overy, M&A Index | 2014 |
Among public deals with an equity value of $400 million or greater (our typical universe of deals) the average size was $7.1 billion, well ahead of the previous record of $5.2 billion in 1998.4 The re-emergence of megamergers has been accompanied by increased volatility, which have widened deal spreads. Average transaction spreads increased throughout the year from approximately 3% in Q1 to over 7% in Q4, reflecting not just increased risk but increased risk aversion by investors. Many large deals encountered challenges from antitrust scrutiny, to oil price concerns, to the government’s battle against tax inversion transactions (re-domiciling offshore)—sometimes resulting in terminated or delayed transactions. The most glaring example is AbbVie Inc.’s decision to walk away from its $55 billion purchase of Shire Plc in October after the U.S. Treasury proposed rules limiting the attractiveness of inversions. Ironically, we and most other arbitrage/event managers thought that the Shire deal was highly likely to successfully complete. The merger agreement was tight and AbbVie management went out of their way to emphasize that the transaction was highly strategic and not merely driven by the tax benefits of moving offshore. Unfortunately the Treasury department’s bluster and proposed rulemaking made management nervous about possible additional shoes to drop. Many event-driven funds were caught in the carnage, some of which ended the year with negative performance even as equities surged.
According to a recent Reuters article, “Following the Shire deal collapse, merger arbitrage spreads, or the difference between a company’s share price and the price at which it may be bought, …. widened by 2.5 percent on average as a number of hedge funds liquidated positions, presenting an investment opportunity for others.”5 Additionally, equity investors were caught in two mini-corrections, dropping the S&P 500 Index by almost 8% in October and 5% in December. As discussed in our Q3 letter, we were able to utilize the increased volatility by adding to our highest-conviction investments, benefiting from our diversification discipline and measured approach. Our conservative nature caused us to be smaller than most of our peers in the Shire transaction, but by living to fight
__________
| 4 | U.S. M&A Review: 2014 and 4Q 2014, UBS |
| 5 | Reuters, Scuttled deals worth $580 billion put hedge funds on back foot, November 13, 2014 |
another day, we were able to avoid a year-destroying drawdown and deploy capital set aside for market and arbitrage dislocations.
We are optimistic that merger and acquisition (“M&A”) activity will continue to rebound, as it appears that the deal pipeline is as full as the world’s current oil pipeline.
Portfolio Performance Summary
The Merger Fund® ended the year ahead by 1.43%, after losing money for only the 21st time in 104 quarters. The Merger Fund VL, its insurance-dedicated fund counterpart, gave back 0.54% finishing the year up 1.37%.
The Fund ended the year 95% invested and held positions in approximately 106 deals, with one broken deal during the quarter—the collapse of UK drugmaker Shire’s acquisition of U.S. peer AbbVie, discussed above. We added 14 new positions in Q4, including deals in Canada (Brookfield Residential Properties Inc. being bought by majority-owner Brookfield Asset Management Inc.), France (Lafarge SA acquisition by Holcim Ltd.) and Germany (E.ON SE’s public spin-off of its Power Generation, Global Energy Trading, and Exploration assets). Deal market capitalizations varied from the $650 mm purchase of QEP Midstream Partners, LP to the $28 bln acquisition of oil service company Baker Hughes Inc. by Halliburton Co. Seven deals were in excess of $5 bln, including E.ON ($34 bln USD), Baker Hughes ($28 bln), Lafarge ($19.8 bln USD), CareFusion Corp/Becton Dickinson and Co. ($11.5 bln), Cubist Pharmaceuticals, Inc./Merck &CO., Inc. ($7.7 bln), and Covance Inc./Laboratory Corp. of America ($5.7 bln). Additionally, a legacy position for our funds and the largest deal by far was Actavis Plc’s $67 bln purchase of Allergan Inc., announced in November in a successful defensive maneuver by Allergan against a hostile bid from the Valeant Pharmaceuticals/Pershing Square group.
The Fund benefited from its wide diversification. Although 32 positions produced negative marks, winners outnumbered losers by a 2:1 ratio. Aside from the Fund’s 98 basis point loss in Shire, the remainder of the top ten detractors from performance ranged from 27 basis points to 8 basis points. The top 10 winners for the quarter contributed anywhere from 7 bps to 34 bps, with Allergan being the biggest winner as the bidding war finally came to an end. The majority of the transactions in the portfolio were strategic in nature with very few highly-levered private equity deals.
More than $100 bln worth of transactions were completed during the quarter, led by the gigantic $52 bln (enterprise value) buy-in of Kinder Morgan Energy Partners LP by Kinder Morgan, Inc., with a Secretariat-like
lead over the $14.5 bln buyout of Canadian Tim Hortons, Inc. by Burger King Worldwide. Additional closed deals included TW Telecom/Inc./Level 3 Communications ($7.5 bln); URS Corporation/ADCOM Technology ($5.6 bln); gaming device manufacturer Bally Technologies Inc/Scientific Games Corp. on which we had the pleasure of engaging in some on-site research ($5.1 bln); Kodiak Oil & Gas Corp./Whiting Petroleum which was governed by an extremely tight merger agreement and closed despite a 50% drop in energy prices ($4 bln); Banco Santander Brasil SA/Banco Santander SA ($3.2 bln USD) and several others.
| SECTOR EXPOSURE | REGIONAL EXPOSURE |
| | |
 | 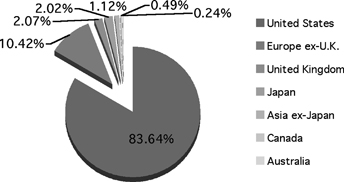 |
| Type of Buyer | | | | | Deal Terms* | | |
| Strategic | 99.76% | | | | Cash | 31.01% | |
| Financial | 0.24% | | | | Stock and Stub(1) | 20.99% | |
| | | | | | Cash & Stock | 19.94% | |
| By Deal Type | | | | | Stock with Fixed Exchange Ratio | 11.96% | |
| Friendly | 92.60% | | | | Undetermined(2) | 10.20% | |
| Hostile | 7.40% | | | | Stock with Flexible | | |
| | | | | | Exchange Ratio (Collar) | 5.90% | |
| * | Data expressed as a percentage of long common stock, convertible, corporate and municipal bonds and swap contract positions as of December 31, 2014. |
| (1) | “Stub” includes assets other than cash and stock (e.g., escrow notes). |
| (2) | The compensation is undetermined because the compensation to be received (e.g., stock, cash, escrow notes, other) will be determined at later date, potentially at the option of the Fund’s investment adviser. |
Event-Driven
In addition to an upturn in megadeals, 2014 also continued the spin-off trend. Successful spinoffs have generated outsized shareholder returns, reinforcing the value of such “corporate optimization” and encouraging further spin-off activity. A recent New York Times article opined, “the studies repeatedly show that spinoffs and divestitures create value in both the short and long term. Some studies show that companies that are involved in a spinoff outperform the market by 15 to 30 percent over three years. Even the announcement of a spinoff seems to push stock prices higher. According to the Boston Consulting Group, `55% of all divestitures created value, as measured by the average cumulative abnormal return’ over seven days.”6
The value of spinoffs has risen dramatically since 2010 where the total market value of spun off assets was approximately $130 billion. Fast forward to 2014 where it is estimated that $664 billion worth of businesses and assets were divested—more than a fivefold increase.7 In 2014, the industries that were most active in breakups have been the utility and energy sectors. Oil prices declined precipitously, causing energy stocks to decline across the board.8 Because there was so much spin-off and restructuring activity in the sector, we had as much as 8-9 percent of our assets in the energy space and experienced some mark-to-market declines on those positions. However, because our positions are structured with option hedges such that the delta to the sector and the market in general is significantly reduced, we were able to avoid significant damage and in fact preserved positive performance for the year with a fraction of the market and indices’ volatility.
We intend to continue using various parts of the capital structure for hedging purposes. As mentioned in prior letters, we anticipate that by managing the event-driven strategy consistent with our firm-wide investment discipline, we will be positioned towards the conservative end of the spectrum, from both a risk and return perspective. Accordingly, our focus will remain on risk-adjusted, rather than notional returns in all market environments. However, even from a rate of return perspective, the Fund’s positive (albeit modest) absolute return for the quarter and year outpaced the relevant indices, many of which were negative (WCEIX returned 0.16% QTD and 3.87% YTD vs the HFRX Event Driven Index return of -5.45% and
__________
6 New York Times, The Mergers and Acquisition Cycle: Buy. Divide. Conquer, December 10, 2014
7 New York Times, Corporate Spinoffs Expected To Grow Next Yr. Study Finds, December 11, 2014
8 For example, the XLE Energy Select Sector ETF declined by 12.5% during the quarter.
-4.06% respectively). Whether equities resume their upward trajectory or not, we believe the success of our investments essentially continues to be dependent upon the completion of the transactions in which we have invested. Our three year beta, which includes market downturns, continues to be sub 0.20 for our merger arbitrage vehicles and approximately 0.25 for the event-driven funds that we manage.
Portfolio Performance Summary
| Strategy | Allocations | |
| Arbitrage | 61.53% | |
| Special Situations | 20.46% | |
| Extraordinary Events | 12.92% | |
| Non-directional Credit | 5.09% | |
| Total | 100.00% | |
Strategy allocations are the direct result of our bottom-up research; our investment decisions are based on the unique characteristics of each opportunity. Every investment must be public and have a defined timeline and expected return. Outside of these factors, the strategy is designed to “go where the events are.” We are, therefore, more reactive than proactive when it comes to making specific allocations to macro-factors like strategy, sector and even country.
WCEIX turned in a positive performance for the quarter, inching ahead by 0.16% and finishing the year with a 3.87% gain, well ahead of its peers and relevant indices. As of December 31st, the Fund was 114% invested and held 94 individual investments across all several categories of events. Gains were driven by our investments in (restructuring/extraordinary (event), General Motors (special situation), Starwood Property Trust (extraordinary Allergan (merger arbitrage), Covidien (merger arbitrage), Lamar Advertising (REIT conversion), Vivendi SA (event) and Tim Hortons, Inc. (merger arb).
Aside from the terminated Shire transaction, which cost the Fund 100 bps this quarter, a majority of the top ten performance detractors were event-driven investments in the energy sector. These included QEP Resources Inc., Anadarko Petroleum Corp., Hess Corp., Occidental Petroleum Corp., Williams Companies, Inc. and Noble Corporation plc, which combined cost the Fund approximately 110 bps. Another losing position was the Time Warner Cable Inc./Comcast Corp., a pending merger which is awaiting regulatory approval and cost the Fund 10 bps. Fortunately, our conservative positioning of these transactions allowed us to mitigate some of the downside experienced by the sector.
Consistent with that mindset, we will continue to seek idiosyncratic catalyst-driven investments in a variety of industries. The criteria for these investments include low correlation with markets or macro environments as well as the potential for attractive risk-adjusted returns.
OUR COMPANY
Westchester Capital manages a total of four SEC-registered mutual funds. On the conservative end of the spectrum, we have The Merger Fund® and its insurance-dedicated counterpart, The Merger Fund VL (for Variable Life and Annuity investors); moving up the ladder modestly in terms of both historic volatility and return is the Dunham Monthly Distribution Fund (which we manage as a sub-adviser), which provides an alternative market-neutral profile to The Merger Fund® with an income-oriented slant; and now passing its one-year anniversary, we also offer an institutional class of the WCM Alternatives: Event-Driven Fund (symbol: WCEIX). It is a complementary product which invests in the more dynamic event-driven space. As mentioned previously, WCEIX’s mandate is broader and more aggressively defined than either The Merger Fund® or the Dunham Fund. It will not provide a monthly distribution, and will be positioned to potentially provide higher returns along with a possible higher standard deviation.
As usual, quarterly statistical summaries for any of our vehicles are provided within two weeks of the end of the quarter, typically one month prior to the release of the quarterly letter. They are available electronically on our website, and we would be happy to arrange for a scheduled email as soon as the data becomes available. For convenience, investors can arrange for e-alerts of important Fund communications. Through our website at www.westchestercapitalfunds.com, you can check direct account balances, make purchases and sales, and sign up for notification of trade confirmations, statements and shareholder communications via e-mail.
Stay warm. Daylight hours are starting to get longer already!
 |  |
| Roy Behren | Mike Shannon |
IMPORTANT DISCLOSURES
Before investing in The Merger Fund® and/or WCM Alternatives: Event-Driven Fund, carefully consider the investment objectives, risks, charges and expenses. For a prospectus or summary prospectus containing this and other information, please call (800) 343-8959. Please read the prospectus carefully before investing. The Merger Fund VL is available through variable products offered by third-party insurance companies. For a prospectus containing information for any variable annuity or variable life product that invests in The
Merger Fund VL, contact your financial advisor or the offering insurance company for a contract prospectus and prospectus for the underlying funds. To obtain a prospectus for the Dunham Monthly Distribution Fund, please visit www.dunham.com. Please read it carefully before investing.
Fund holdings and sector allocations are subject to change and should not be considered a recommendation to buy or sell any security. The Ten Largest Positions as a Percent of Net Assets for The Merger Fund as of December 31, 2014 were: Time Warner Cable Inc. (5.11%), DIRECTV (5.07%), Covidien PLC (4.81%), Allergan, Inc. (4.69%), TRW Automotive Holdings Corp. (4.66%), American International Group, Inc. (3.13%), Vivendi SA (3.12%), CareFusion Corporation (2.99%), Lamar Advertising Company (2.69%), Dresser-Rand Group (2.60%). The Ten Largest Positions as a Percent of Net Assets for The Merger Fund VL as of December 31, 2014 were: Time Warner Cable Inc. (4.62%), DIRECTV (4.57%), TRW Automotive Holdings Corp. (4.33%), Allergan, Inc. (4.33%), Covidien PLC (4.31%), Dresser-Rand Group (2.98%), CareFusion Corporation (2.86%), Vivendi SA (2.80%), American International Group, Inc. (2.62%), Lamar Advertising Company (2.37%). The Ten Largest Positions as a Percent of Net Assets for WCM Alternatives Event-Driven Fund as of December 31, 2014 were: DIRECTV (4.69%), Time Warner Cable Inc. (4.64%), Allergan, Inc. (4.54%), Lamar Advertising Company (4.31%), Covidien PLC (4.31%), Hudson City Bancorp, Inc. (3.60%).TRW Automotive Holdings Corp. (3.35%), American International Group, Inc. (3.35%), General Motors Co. (3.33%) Huntsman Corporation (3.14%).
Diversification does not assure a profit, nor does it protect against a loss in a declining market.
Mutual fund investing involves risk. Principal loss is possible. Merger‐arbitrage and event‐driven investing involves the risk that the adviser’s evaluation of the outcome of a proposed event, whether it be a merger, reorganization, regulatory issue or other event, will prove incorrect and that the Fund’s return on the investment will be negative. Investments in foreign companies may entail political, cultural, regulatory, legal, and tax risks different from those associated with comparable transactions in the United States. The frequency of the Fund’s transactions will vary from year to year, though merger arbitrage portfolios typically have higher turnover rates than portfolios of typical long‐only funds. Increased portfolio turnover may result in higher brokerage commissions, dealer mark‐ups and other transaction costs. The higher costs associated with increased portfolio turnover may offset gains in the Fund’s performance. The Fund may enter into short sale transactions for, among other reasons, purposes of protecting against a decline in the market value of the acquiring company’s shares prior to the acquisition completion. If the price of a security sold short increases between the time of the short sale and the time the Fund covers its short position, the Fund will incur a loss. The amount of a potential loss on an uncovered short sale transaction is theoretically unlimited. Debt securities may fluctuate in value due to, among other things, changes in interest rates, general economic conditions, industry fundamentals, market sentiment and the financial condition of the issuer, including the issuer’s credit rating or financial performance. Derivatives may create leverage which will amplify the effect of the performance of those instruments on the Fund and may produce significant losses. The Fund’s hedging strategy will be subject to the Fund’s investment adviser’s ability to assess correctly the degree of correlation between the performance of the instruments used in the hedging strategy and the performance of the investments in the portfolio being hedged.
References to other mutual funds do not construe an offer of those securities. Any tax or legal information provided is merely a summary of our understanding and interpretation of some of the current income tax regulations and is not exhaustive. Investors must consult their tax advisor or legal counsel for advice and information concerning their particular situation. Neither the Fund nor any of its representatives may give legal or tax advice.
The views expressed are as of February 10, 2015 and are a general guide to the views of Westchester Capital Management, are subject to change, are not guaranteed and should
not be considered recommendations to buy or sell any security. This document does not replace portfolio and fund-specific materials.
For each fund with at least a three-year history, Morningstar calculates a Morningstar Rating™ based on a Morningstar Risk-Adjusted Return measure that accounts for variation in a fund’s monthly performance (including the effects of sales charges, loads, and redemption fees), placing more emphasis on downward variations and rewarding consistent performance. The top 10% of funds in each category receive 5 stars, the next 22.5% receive 4 stars, the next 35% receive 3 stars, the next 22.5% receive 2 stars and the bottom 10% receive 1 star. (Each share class is counted as a fraction of one fund within this scale and rated separately, which may cause slight variations in the distribution percentages.) As of December 31, 2014, The Merger Fund® was rated against the following numbers of U.S.-domiciled Market Neutral funds over the following time periods: 110 funds in the last three years, 64 funds in the last five years, and 27 funds in the last ten years. With respect to these Market Neutral funds, The Merger Fund® received a Morningstar Rating of 4 stars, 4 stars and 4 stars for the three-, five- and ten-year periods, respectively. © 2014 Morningstar, Inc. All Rights Reserved. The information contained herein: (1) is proprietary to Morningstar; (2) may not be copied or distributed; and (3) is not warranted to be accurate, complete or timely. Neither Morningstar nor its content providers are responsible for any damages or losses arising from any use of this information. Past performance is no guarantee of future results.
Definitions: The S&P 500 Index is a broad based unmanaged index of 500 stocks, which is widely recognized as representative of the equity market in general; The MSCI World Index is a free float-adjusted market capitalization index designed to measure the equity market performance of developed economies; The Barclays Aggregate Bond Index is an intermediate term index comprised of investment grade bonds; The Morningstar Category: Market Neutral is an index comprised of a universe of funds with similar investment objectives. Indices are unavailable for direct investment. The HFRX Merger Arbitrage Index is comprised of strategies which employ an investment process primarily focused on opportunities in equity and equity related instruments of companies which are currently engaged in a corporate transaction. Standard Deviation is the degree by which returns vary relative to the average return. The higher the standard deviation, the greater the variability of the investment; Beta is a measure of the fund’s sensitivity to market movements. A portfolio with a beta greater than 1 is more volatile than the market and a portfolio with a beta less than 1 is less volatile than the market; A basis point (often denoted as bp) is a unit equal to 1/100 of a percentage point and can be summarized as follows: 1% change = 100 basis points and 0.01% = 1 basis point; Correlation is calculated using R-Squared; which is a measure that represents the percentage of a fund’s movements that can be explained by movements in a benchmark index. A fund with low R-squared doesn’t act much like the index. The VIX or CBOE Volatility Index is often referred to as “the fear gauge,” reflects expected 30-day volatility of the S&P 500. The VIX typically is inversely related to equity markets, as declining markets are viewed as more risky (or volatile) than rising markets. Delta is the ratio of the change in price of an option to the change in price of the underlying asset. Also called the hedge ratio. Applies to derivative products. For a call option on a stock, a delta of 0.50 means that for every $1.00 that the stock goes up, the option price rises by $0.50. As options near expiration, in-the-money call option contracts approach a delta of 1.0, while in-the-money put options approach a delta of -1.
The SEC does not endorse, indemnify, approve nor disapprove of any security.
The Merger Fund® and WCM Alternatives: Event-Driven Fund is distributed by Quasar Distributors, LLC. The Merger VL is available through variable products offered by third-party insurance companies and is not affiliated with Quasar Distributors, LLC. The Dunham Monthly Distribution Fund, which is sub-advised by Westchester Capital Management, LLC, is distributed by Dunham and Associates Investment Counsel, which have no affiliation with Quasar Distributors, LLC.
COMPARISON OF CHANGE IN VALUE OF $10,000 INVESTMENT
IN THE MERGER FUND VL AND S&P 500
| | | Average Annual Total Return |
| | 1 Year | 3 Year | 5 Year | 10 Year |
| The Merger Fund VL | 1.37% | 2.59% | 2.78% | 5.17% |
| The Standard & | | | | |
| Poor’s 500 Index | 13.69% | 20.41% | 15.45% | 7.67% |
The Standard & Poor’s 500 Index (“S&P 500”) is a capitalization-weighted index, representing the aggregate market value of the common equity of 500 stocks primarily traded on the New York Stock Exchange. This chart assumes an initial gross investment of $10,000 made on December 31, 2004. Returns shown include the reinvestment of all dividends. Past performance is not predictive of future performance. The graph and table do not reflect the deduction of taxes that a shareholder would pay on fund distributions or the redemption of fund shares. Investment return and principal value will fluctuate, so that your shares, when redeemed, may be worth more or less than the original cost.
The Merger Fund VL
EXPENSE EXAMPLE
December 31, 2014 (Unaudited)
As a shareholder of the Fund, you incur two types of costs: (1) transaction costs as described below and (2) ongoing costs, including management fees, distribution and/or service fees, and other Fund expenses. This example is intended to help you understand your ongoing costs (in dollars) of investing in the Fund and to compare these costs with the ongoing costs of investing in other mutual funds. The example is based on an investment of $1,000 for the period 7/1/14 – 12/31/14.
Actual Expenses
The first line of the table below provides information about actual account values and actual expenses. You may use the information in this line, together with the amount you invested, to estimate the expenses that you paid over the period. Simply divide your account value by $1,000 (for example, an $8,600 account value divided by $1,000 = 8.6), then multiply the result by the number in the first line under the heading entitled “Expenses Paid During Period” to estimate the expenses you paid on your account during this period. The example below includes, among other fees, management fees, fund accounting, custody and transfer agent fees. However, the example below does not include portfolio trading commissions and related expenses, and extraordinary expenses as determined under generally accepted accounting principles.
Hypothetical Example for Comparison Purposes
The second line of the table below provides information about hypothetical account values and hypothetical expenses based on the Fund’s actual expense ratio and an assumed rate of return of 5% per year before expenses, which is not the Fund’s actual return. The hypothetical account values and expenses may not be used to estimate the actual ending account balance or expenses you paid for the period. You may use this information to compare the ongoing costs of investing in the Fund and other funds. To do so, compare this 5% hypothetical example with the 5% hypothetical examples that appear in the shareholder reports of the other funds. Please note that the expenses shown in the table are meant to highlight your ongoing costs only and do not reflect any transactional costs, such as redemption fees. Therefore, the second line of the table is useful in comparing ongoing costs only, and will not help you determine the relative total costs of owning different funds. In addition, if these transactional costs were included, your costs would have been higher.
The Merger Fund VL
EXPENSE EXAMPLE
December 31, 2014 (Unaudited)
| | | | | Expenses |
| | | | | Paid |
| | Beginning | Ending | | During |
| | Account | Account | Annualized | Period |
| | Value | Value | Expense | 7/1/14 — |
| | 7/1/14 | 12/31/14 | Ratio | 12/31/14* |
Actual+(1) | $1,000.00 | $ 984.90 | 1.86% | $9.31 |
Hypothetical+(2) | $1,000.00 | $1,015.83 | 1.86% | $9.45 |
| * | Expenses are equal to the Fund’s annualized expense ratio multiplied by the average account value over the period, multiplied by 184/365 (to reflect the one-half year period). |
| + | Excluding dividends and borrowing expense on securities sold short, your actual cost of investment in and your hypothetical cost of investment in the Fund would have been $7.00 and $7.12, respectively. |
| (1) | Ending account values and expenses paid during the period based on a -1.51% return. This actual return is net of expenses. |
| (2) | Ending account values and expenses paid during period based on a 5.00% annual return before expenses. |
The Merger Fund VL
SCHEDULE OF INVESTMENTS
December 31, 2014
| Shares | | | | Value | |
| | |
| COMMON STOCKS — 70.77% | |
| | | ADVERTISING — 2.37% | | | |
| | 10,100 | | Lamar Advertising Company Class A (f) | | $ | 541,764 | |
| | | | | | | | |
| | | | AEROSPACE & DEFENSE — 2.05% | | | | |
| | 5,958 | | B/E Aerospace, Inc. (a)(f) | | | 345,683 | |
| | 2,979 | | KLX, Inc. (a) | | | 122,884 | |
| | | | | | | 468,567 | |
| | | | ALTERNATIVE CARRIERS — 0.02% | | | | |
| | 81 | | Level 3 Communications, Inc. (a) | | | 4,000 | |
| | | | | | | | |
| | | | AUTO PARTS & EQUIPMENT — 0.07% | | | | |
| | 155 | | TRW Automotive Holdings Corporation (a) | | | 15,942 | |
| | | | | | | | |
| | | | BIOTECHNOLOGY — 1.10% | | | | |
| | 2,488 | | Cubist Pharmaceuticals, Inc. (a) | | | 250,417 | |
| | | | | | | | |
| | | | BROADCASTING & CABLE TV — 0.04% | | | | |
| | 1,100 | | iHeartMedia, Inc. (a) | | | 8,085 | |
| | | | | | | | |
| | | | CABLE & SATELLITE TV — 11.35% | | | | |
| | 7,942 | | DIRECTV (a)(e) | | | 688,571 | |
| | 4,400 | | DISH Network Corporation Class A (a)(f) | | | 320,716 | |
| | 2,137 | | Liberty Global plc Series C (a)(b) | | | 103,238 | |
| | 121,859 | | Sirius XM Holdings, Inc. (a)(f) | | | 426,507 | |
| | 6,932 | | Time Warner Cable, Inc. (e) | | | 1,054,080 | |
| | | | | | | 2,593,112 | |
| | | | CASINOS & GAMING — 1.02% | | | | |
| | 13,541 | | International Game Technology (f) | | | 233,582 | |
| | | | | | | | |
| | | | COMMUNICATIONS EQUIPMENT — 0.10% | | | | |
| | 1,134 | | Riverbed Technology, Inc. (a) | | | 23,145 | |
| | | | | | | | |
| | | | DIVERSIFIED CHEMICALS — 4.65% | | | | |
| | 7,300 | | The Dow Chemical Company (f) | | | 332,953 | |
| | 3,500 | | E.I. Du Pont de Nemours & Company | | | 258,790 | |
| | 20,718 | | Huntsman Corporation (f) | | | 471,956 | |
| | | | | | | 1,063,699 | |
| | | | FOOD RETAIL — 1.03% | | | | |
| | 6,706 | | Safeway, Inc. (f) | | | 235,515 | |
| | | | | | | | |
| | | | GENERAL MERCHANDISE STORES — 2.35% | | | | |
| | 6,788 | | Family Dollar Stores, Inc. (f) | | | 537,677 | |
| | | | | | | | |
| | | | GOLD — 0.41% | | | | |
| | 4,985 | | Newmont Mining Corporation (f) | | | 94,216 | |
The accompanying notes are an integral part of these financial statements.
The Merger Fund VL
SCHEDULE OF INVESTMENTS (continued)
December 31, 2014
| Shares | | | | Value | |
| | | | | | |
| | | HEALTH CARE EQUIPMENT — 4.30% | | | |
| | 9,609 | | Covidien plc (b)(e) | | $ | 982,809 | |
| | | | | | | | |
| | | | HOME BUILDING — 0.32% | | | | |
| | 2,987 | | Brookfield Residential Properties, Inc. (a)(b) | | | 71,867 | |
| | | | | | | | |
| | | | INDUSTRIAL MACHINERY — 0.19% | | | | |
| | 1,000 | | The Timken Company | | | 42,680 | |
| | | | | | | | |
| | | | INTEGRATED OIL & GAS — 3.76% | | | | |
| | 3,900 | | BP plc — ADR (f) | | | 148,668 | |
| | 5,700 | | Hess Corporation (f) | | | 420,774 | |
| | 3,607 | | Occidental Petroleum Corporation (f) | | | 290,760 | |
| | | | | | | 860,202 | |
| | | | INTERNET SOFTWARE & SERVICES — 0.69% | | | | |
| | 1,600 | | eBay, Inc. (a)(f) | | | 89,792 | |
| | 300 | | Equinix, Inc. (f) | | | 68,019 | |
| | | | | | | 157,811 | |
| | | | IT CONSULTING & OTHER SERVICES — 0.44% | | | | |
| | 4,013 | | Sapient Corporation (a)(g) | | | 99,843 | |
| | | | | | | | |
| | | | LEISURE FACILITIES — 0.10% | | | | |
| | 400 | | LIFE TIME FITNESS, Inc. (a)(f) | | | 22,648 | |
| | | | | | | | |
| | | | LIFE & HEALTH INSURANCE — 0.83% | | | | |
| | 2,707 | | Protective Life Corporation | | | 188,543 | |
| | | | | | | | |
| | | | LIFE SCIENCES TOOLS & SERVICES — 0.67% | | | | |
| | 1,484 | | Covance, Inc. (a) | | | 154,099 | |
| | | | | | | | |
| | | | MOVIES & ENTERTAINMENT — 0.02% | | | | |
| | 1,000 | | SFX Entertainment, Inc. (a) | | | 4,530 | |
| | | | | | | | |
| | | | MULTI-LINE INSURANCE — 2.61% | | | | |
| | 10,664 | | American International Group, Inc. (f) | | | 597,291 | |
| | | | | | | | |
| | | | OIL & GAS DRILLING — 0.32% | | | | |
| | 4,376 | | Noble Corporation plc (b)(f) | | | 72,510 | |
| | | | | | | | |
| | | | OIL & GAS EQUIPMENT & SERVICES — 3.66% | | | | |
| | 2,402 | | Amec Foster Wheeler plc — ADR | | | 31,082 | |
| | 4,230 | | Baker Hughes, Inc. (f) | | | 237,176 | |
| | 6,950 | | Dresser-Rand Group, Inc. (a)(e) | | | 568,510 | |
| | | | | | | 836,768 | |
| | | | OIL & GAS EXPLORATION & PRODUCTION — 1.64% | | | | |
| | 4,400 | | Anadarko Petroleum Corporation (f) | | | 363,000 | |
| | 842 | | California Resources Corporation (a) | | | 4,639 | |
The accompanying notes are an integral part of these financial statements.
The Merger Fund VL
SCHEDULE OF INVESTMENTS (continued)
December 31, 2014
| Shares | | | | Value | |
| | | | | | |
| | | OIL & GAS EXPLORATION | | | |
| | | & PRODUCTION — 1.64% (continued) | | | |
| | 339 | | QEP Resources, Inc. (h) | | $ | 6,855 | |
| | | | | | | 374,494 | |
| | | | OIL & GAS STORAGE & TRANSPORTATION — 2.09% | | | | |
| | 4,272 | | Kinder Morgan, Inc. (f) | | | 180,768 | |
| | 6,600 | | The Williams Companies, Inc. | | | 296,604 | |
| | | | | | | 477,372 | |
| | | | PAPER PACKAGING — 1.44% | | | | |
| | 3,300 | | MeadWestvaco Corporation (f) | | | 146,487 | |
| | 3,000 | | Rock-Tenn Company Class A | | | 182,940 | |
| | | | | | | 329,427 | |
| | | | PAPER PRODUCTS — 1.71% | | | | |
| | 7,300 | | International Paper Company (f) | | | 391,134 | |
| | | | | | | | |
| | | | PHARMACEUTICALS — 5.38% | | | | |
| | 4,643 | | Allergan, Inc. (f) | | | 987,055 | |
| | 105 | | Auxilium Pharmaceuticals, Inc. (a)(h) | | | 3,611 | |
| | 7,633 | | Pfizer, Inc. (f) | | | 237,768 | |
| | | | | | | 1,228,434 | |
| | | | REGIONAL BANKS — 0.12% | | | | |
| | 2,532 | | Investors Bancorp, Inc. | | | 28,422 | |
| | | | | | | | |
| | | | REITS — 1.99% | | | | |
| | 11,151 | | Equity Commonwealth (f) | | | 286,246 | |
| | 5,980 | | Starwood Property Trust, Inc. | | | 138,975 | |
| | 1,090 | | Starwood Waypoint Residential Trust | | | 28,744 | |
| | | | | | | 453,965 | |
| | | | RESTAURANTS — 0.15% | | | | |
| | 900 | | Restaurant Brands International, Inc. (a)(b) | | | 35,136 | |
| | | | | | | | |
| | | | SEMICONDUCTOR EQUIPMENT — 1.93% | | | | |
| | 23,140 | | Tokyo Electron Ltd. — ADR (e) | | | 441,511 | |
| | | | | | | | |
| | | | SEMICONDUCTORS — 2.22% | | | | |
| | 6,401 | | International Rectifier Corporation (a) | | | 255,400 | |
| | 9,114 | | TriQuint Semiconductor, Inc. (a) | | | 251,091 | |
| | | | | | | 506,491 | |
| | | | SPECIALTY CHEMICALS — 1.99% | | | | |
| | 3,311 | | Sigma-Aldrich Corporation (e) | | | 454,501 | |
The accompanying notes are an integral part of these financial statements.
The Merger Fund VL
SCHEDULE OF INVESTMENTS (continued)
December 31, 2014
| | Shares | | | | Value | |
| | | | | | | |
| | | | THRIFTS & MORTGAGE FINANCE — 1.98% | | | |
| | | 9,109 | | Beneficial Mutual Bancorp, Inc. (a) | | $ | 111,767 | |
| | | 33,665 | | Hudson City Bancorp, Inc. (f) | | | 340,690 | |
| | | | | | | | 452,457 | |
| | | | | TRADING COMPANIES & DISTRIBUTORS — 0.01% | | | | |
| | | 59 | | Veritiv Corporation (a) | | | 3,060 | |
| | | | | | | | | |
| | | | | TRUCKING — 1.34% | | | | |
| | | 12,312 | | Hertz Global Holdings, Inc. (a)(f) | | | 307,061 | |
| | | | | | | | | |
| | | | | WIRELESS TELECOMMUNICATION SERVICES — 2.31% | | | | |
| | | 15,651 | | T-Mobile U.S., Inc. (a) | | | 421,638 | |
| | | 3,101 | | Vodafone Group plc — ADR | | | 105,961 | |
| | | | | | | | 527,599 | |
| | | | | TOTAL COMMON STOCKS (Cost $15,727,475) | | | 16,172,386 | |
| | | | | | | | | |
| PREFERRED STOCKS — 1.05% | | | | |
| | | 9,490 | | State Street Corporation, 6.000% | | | 239,528 | |
| | | | | TOTAL PREFERRED STOCKS (Cost $236,775) | | | 239,528 | |
| | | | | | | | | |
| CONTINGENT VALUE RIGHTS — 0.00% | | | | |
| | | 268 | | Leap Wireless International, Inc. (a)(d)(l) | | | 837 | |
| | | | | TOTAL CONTINGENT VALUE RIGHTS (Cost $0) | | | 837 | |
| | | | | | | | | |
| Principal Amount | | | | | | |
| | | | | |
| CONVERTIBLE BONDS — 0.07% | | | | |
| | | | | Cubist Pharmaceuticals, Inc. | | | | |
| | $ | 12,000 | | 1.875%, 9/1/2020 | | | 16,350 | |
| | | | | TOTAL CONVERTIBLE BONDS (Cost $15,900) | | | 16,350 | |
| | | | | | | | | |
| CORPORATE BONDS — 3.91% | | | | |
| | | | | Dresser-Rand Group, Inc. | | | | |
| | | 100,000 | | 6.500%, 5/1/2021 | | | 108,000 | |
| | | | | Drill Rigs Holdings, Inc. | | | | |
| | | 74,000 | | 6.500%, 10/1/2017 (Acquired 5/27/14 | | | | |
| | | | | through 5/28/14, cost $76,633) (b)(i) | | | 61,790 | |
| | | | | Energy Future Intermediate Holding Company LLC | | | | |
| | | 59,000 | | 11.750%, 3/1/2022 (Acquired 10/7/14, cost $69,620) (i)(j) | | | 70,210 | |
The accompanying notes are an integral part of these financial statements.
The Merger Fund VL
SCHEDULE OF INVESTMENTS (continued)
December 31, 2014
| Principal Amount | | | | Value | |
| | | | Gentiva Health Services, Inc. | | | |
| | $ | 171,000 | | 11.500%, 9/1/2018 | | $ | 182,158 | |
| | | | | KCG Holdings, Inc. | | | | |
| | | 240,000 | | 8.250%, 6/15/2018 (Acquired 12/2/14, cost $248,545) (i) | | | 247,200 | |
| | | | | Kodiak Oil & Gas Corporation | | | | |
| | | 28,000 | | 5.500%, 1/15/2021 (b) | | | 28,210 | |
| | | 195,000 | | 5.500%, 2/1/2022 (b) | | | 196,462 | |
| | | | | TOTAL CORPORATE BONDS (Cost $908,728) | | | 894,030 | |
| | | | | | | | | |
| MUNICIPAL BONDS — 0.74% | | | | |
| | | | | Louisiana Public Facilities | | | | |
| | | 170,000 | | 9.750%, 8/1/2015 | | | 169,985 | |
| | | | | TOTAL MUNICIPAL BONDS (Cost $170,000) | | | 169,985 | |
| | | | | | | | | |
| Contracts (100 shares per contract) | | | | |
| | | | | |
| PURCHASED PUT OPTIONS — 0.61% | | | | |
| | | | | American International Group, Inc. | | | | |
| | | 60 | | Expiration: February 2015, Exercise Price: $50.00 | | | 1,620 | |
| | | 5 | | Expiration: March 2015, Exercise Price: $52.50 | | | 420 | |
| | | | | Anadarko Petroleum Corporation | | | | |
| | | 34 | | Expiration: January 2015, Exercise Price: $85.00 | | | 14,195 | |
| | | | | B/E Aerospace, Inc. | | | | |
| | | 50 | | Expiration: January 2015, Exercise Price: $70.00 | | | 1,150 | |
| | | | | Baker Hughes, Inc. | | | | |
| | | 7 | | Expiration: January 2015, Exercise Price: $55.00 | | | 756 | |
| | | 14 | | Expiration: January 2015, Exercise Price: $57.50 | | | 3,241 | |
| | | | | Bayer AG | | | | |
| | | 6 | | Expiration: January 2015, Exercise Price: EUR 100.00 (k) | | | 189 | |
| | | 3 | | Expiration: February 2015, Exercise Price: EUR 96.00 (k) | | | 221 | |
| | | 6 | | Expiration: February 2015, Exercise Price: EUR 105.00 (k) | | | 1,198 | |
| | | | | BP plc — ADR | | | | |
| | | 31 | | Expiration: April 2015, Exercise Price: $32.00 | | | 1,488 | |
| | | | | CBS Corporation Class B | | | | |
| | | 30 | | Expiration: March 2015, Exercise Price: $50.00 | | | 3,150 | |
| | | | | DISH Network Corporation Class A | | | | |
| | | 28 | | Expiration: January 2015, Exercise Price: $52.50 | | | 140 | |
| | | 7 | | Expiration: January 2015, Exercise Price: $55.00 | | | 87 | |
| | | 36 | | Expiration: March 2015, Exercise Price: $62.50 | | | 5,220 | |
| | | | | The Dow Chemical Company | | | | |
| | | 55 | | Expiration: March 2015, Exercise Price: $40.00 | | | 3,657 | |
The accompanying notes are an integral part of these financial statements.
The Merger Fund VL
SCHEDULE OF INVESTMENTS (continued)
December 31, 2014
| Contracts (100 shares per contract) | | Value | |
| | | E.I. Du Pont de Nemours & Company | | | |
| | 18 | | Expiration: January 2015, Exercise Price: $60.00 | | $ | 45 | |
| | 9 | | Expiration: January 2015, Exercise Price: $62.50 | | | 27 | |
| | 17 | | Expiration: February 2015, Exercise Price: $67.50 | | | 909 | |
| | | | eBay, Inc. | | | | |
| | 15 | | Expiration: February 2015, Exercise Price: $50.00 | | | 652 | |
| | | | Equinix, Inc. | | | | |
| | 1 | | Expiration: January 2015, Exercise Price: $180.00 | | | 37 | |
| | | | General Motors Company | | | | |
| | 6 | | Expiration: January 2015, Exercise Price: $27.00 | | | 12 | |
| | 10 | | Expiration: January 2015, Exercise Price: $28.00 | | | 30 | |
| | 15 | | Expiration: January 2015, Exercise Price: $29.00 | | | 30 | |
| | 3 | | Expiration: January 2015, Exercise Price: $30.00 | | | 15 | |
| | 6 | | Expiration: March 2015, Exercise Price: $30.00 | | | 216 | |
| | | | Hertz Global Holdings, Inc. | | | | |
| | 26 | | Expiration: January 2015, Exercise Price: $18.00 | | | 65 | |
| | 55 | | Expiration: January 2015, Exercise Price: $20.00 | | | 275 | |
| | 6 | | Expiration: January 2015, Exercise Price: $21.00 | | | 54 | |
| | 26 | | Expiration: March 2015, Exercise Price: $20.00 | | | 1,170 | |
| | | | Hess Corporation | | | | |
| | 46 | | Expiration: February 2015, Exercise Price: $67.50 | | | 7,406 | |
| | | | Huntsman Corporation | | | | |
| | 4 | | Expiration: January 2015, Exercise Price: $22.00 | | | 100 | |
| | 7 | | Expiration: February 2015, Exercise Price: $22.00 | | | 595 | |
| | 54 | | Expiration: February 2015, Exercise Price: $23.00 | | | 7,155 | |
| | 86 | | Expiration: February 2015, Exercise Price: $24.00 | | | 16,340 | |
| | | | International Paper Company | | | | |
| | 57 | | Expiration: January 2015, Exercise Price: $45.00 | | | 827 | |
| | | | Kinder Morgan, Inc. | | | | |
| | 30 | | Expiration: January 2015, Exercise Price: $50.00 | | | 23,100 | |
| | 13 | | Expiration: January 2015, Exercise Price: $55.00 | | | 16,510 | |
| | | | Lamar Advertising Company Class A | | | | |
| | 8 | | Expiration: January 2015, Exercise Price: $45.00 | | | 60 | |
| | 2 | | Expiration: January 2015, Exercise Price: $47.00 | | | 10 | |
| | 9 | | Expiration: January 2015, Exercise Price: $48.00 | | | 68 | |
| | | | LIFE TIME FITNESS, Inc. | | | | |
| | 3 | | Expiration: February 2015, Exercise Price: $45.00 | | | 90 | |
| | | | MeadWestvaco Corporation | | | | |
| | 26 | | Expiration: March 2015, Exercise Price: $37.50 | | | 715 | |
| | | | Noble Corporation plc | | | | |
| | 9 | | Expiration: January 2015, Exercise Price: $19.00 | | | 2,264 | |
The accompanying notes are an integral part of these financial statements.
The Merger Fund VL
SCHEDULE OF INVESTMENTS (continued)
December 31, 2014
| Contracts (100 shares per contract) | | Value | |
| | | Occidental Petroleum Corporation | | | |
| | 4 | | Expiration: January 2015, Exercise Price: $77.50 | | $ | 250 | |
| | 13 | | Expiration: January 2015, Exercise Price: $82.50 | | | 2,529 | |
| | 12 | | Expiration: February 2015, Exercise Price: $72.50 | | | 1,188 | |
| | | | Pfizer, Inc. | | | | |
| | 11 | | Expiration: January 2015, Exercise Price: $27.00 | | | 28 | |
| | | | Restaurant Brands International, Inc. | | | | |
| | 9 | | Expiration: January 2015, Exercise Price: $40.00 | | | 1,620 | |
| | | | Rock-Tenn Company Class A | | | | |
| | 9 | | Expiration: January 2015, Exercise Price: $40.00 | | | 90 | |
| | 16 | | Expiration: January 2015, Exercise Price: $45.00 | | | 160 | |
| | | | SPDR S&P 500 ETF Trust | | | | |
| | 8 | | Expiration: January 2015, Exercise Price: $200.00 | | | 976 | |
| | 43 | | Expiration: January 2015, Exercise Price: $201.00 | | | 5,805 | |
| | 10 | | Expiration: February 2015, Exercise Price: $201.00 | | | 3,190 | |
| | | | The Timken Company | | | | |
| | 8 | | Expiration: March 2015, Exercise Price: $40.00 | | | 900 | |
| | | | T-Mobile U.S., Inc. | | | | |
| | 7 | | Expiration: January 2015, Exercise Price: $24.00 | | | 98 | |
| | 125 | | Expiration: January 2015, Exercise Price: $25.00 | | | 3,375 | |
| | | | Vodafone Group plc — ADR | | | | |
| | 8 | | Expiration: January 2015, Exercise Price: $32.00 | | | 160 | |
| | | | The Williams Companies, Inc. | | | | |
| | 41 | | Expiration: February 2015, Exercise Price: $40.00 | | | 3,526 | |
| | 11 | | Expiration: February 2015, Exercise Price: $41.00 | | | 1,133 | |
| | | | TOTAL PURCHASED PUT OPTIONS (Cost $221,354) | | | 140,537 | |
| | | | | | | | |
| Principal Amount | | | | |
| | | | | | | | |
| ESCROW NOTES — 0.07% | | | | |
| | $7,668 | | AMR Corporation (a)(d)(l) | | | | |
| | | | TOTAL ESCROW NOTES (Cost $4,196) | | | 15,911 | |
| | | | | | | 15,911 | |
The accompanying notes are an integral part of these financial statements.
The Merger Fund VL
SCHEDULE OF INVESTMENTS (continued)
December 31, 2014
| Shares | | | | Value | |
| | | | |
| SHORT-TERM INVESTMENTS — 17.85% | | | |
| | 1,378,000 | | Fidelity Institutional Government Portfolio, | | | |
| | | | Institutional Share Class, 0.01% (c) | | $ | 1,378,000 | |
| | 1,322,366 | | Goldman Sachs Financial Square Money Market Fund, | | | | |
| | | | Institutional Share Class, 0.07% (c) | | | 1,322,366 | |
| | 1,378,000 | | The Liquid Asset Portfolio, | | | | |
| | | | Institutional Share Class, 0.07% (c) | | | 1,378,000 | |
| | | | TOTAL SHORT-TERM INVESTMENTS (Cost $4,078,366) | | | 4,078,366 | |
| | | | TOTAL INVESTMENTS — 95.07% | | | | |
| | | | (Cost $21,362,794) | | $ | 21,727,930 | |
ADR – American Depository Receipt
ETF – Exchange-Traded Fund
EUR – Euro
plc – Public Limited Company
REIT – Real Estate Investment Trust
| (a) | Non-income producing security. |
| (b) | Foreign security. |
| (c) | The rate quoted is the annualized seven-day yield as of December 31, 2014. |
| (d) | Security fair valued by the Adviser in good faith in accordance with the policies adopted by the Board of Trustees. |
| (e) | All or a portion of the shares have been committed as collateral for open securities sold short. |
| (f) | All or a portion of the shares have been committed as collateral for written option contracts. |
| (g) | All or a portion of the shares have been committed as collateral for swap contracts. |
| (h) | All or a portion of the shares have been committed as collateral for forward currency exchange contracts. |
| (i) | Security exempt from registration under Rule 144A of the Securities Act of 1933. These securities may be resold in transactions exempt from registration normally to qualified institutional buyers. As of December 31, 2014, these securities represented 1.66% of total net assets. |
| (j) | Default or other conditions exist and the security is not presently accruing income. |
| (k) | Level 2 Security. Please see Note 2 on the Notes to the Financial Statements. |
| (l) | Level 3 Security. Please see Note 2 on the Notes to the Financial Statements. |
The Global Industry Classification Standard (GICS®) was developed by and/or is the exclusive property of MSCI, Inc. and Standard & Poor Financial Services LLC (“S&P”). GICS is a service mark of MSCI and S&P and has been licensed for use by U.S. Bancorp Fund Services, LLC.
The accompanying notes are an integral part of these financial statements.
The Merger Fund VL
SCHEDULE OF SECURITIES SOLD SHORT
December 31, 2014
| Shares | | | | Value | |
| | | | |
| COMMON STOCKS | | | |
| | 1,524 | | Actavis plc (a) | | $ | 392,293 | |
| | 402 | | American Airlines Group, Inc. | | | 21,559 | |
| | 18,801 | | Applied Materials, Inc. | | | 468,521 | |
| | 15,382 | | AT&T, Inc. | | | 516,681 | |
| | 16,123 | | Comcast Corporation Class A | | | 935,295 | |
| | 3,241 | | Comcast Corporation Special Class A | | | 186,568 | |
| | 405 | | Dollar Tree, Inc. | | | 28,504 | |
| | 32 | | Endo International plc (a) | | | 2,308 | |
| | 900 | | General Motors Company | | | 31,419 | |
| | 2,050 | | Halliburton Company | | | 80,627 | |
| | 399 | | Laboratory Corporation of America Holdings | | | 43,052 | |
| | 2,038 | | Liberty Global plc Class A (a) | | | 102,318 | |
| | 2,835 | | M&T Bank Corporation | | | 356,133 | |
| | 2 | | Media General, Inc. | | | 33 | |
| | 9,142 | | Medtronic plc | | | 660,052 | |
| | 15,266 | | RF Micro Devices, Inc. | | | 253,263 | |
| | | | TOTAL SECURITIES SOLD SHORT (Proceeds $3,628,366) | | $ | 4,078,626 | |
| plc – | Public Limited Company |
| (a) | Foreign security. |
The accompanying notes are an integral part of these financial statements.
The Merger Fund VL
SCHEDULE OF OPTIONS WRITTEN
December 31, 2014
| Contracts (100 shares per contract) | | Value | |
| | | | |
| CALL OPTIONS WRITTEN | | | |
| | | Allergan, Inc. | | | |
| | 5 | | Expiration: January 2015, Exercise Price: $210.00 | | $ | 2,850 | |
| | | | American International Group, Inc. | | | | |
| | 16 | | Expiration: February 2015, Exercise Price: $52.50 | | | 6,640 | |
| | 81 | | Expiration: February 2015, Exercise Price: $55.00 | | | 18,589 | |
| | 9 | | Expiration: March 2015, Exercise Price: $57.50 | | | 1,215 | |
| | | | Anadarko Petroleum Corporation | | | | |
| | 11 | | Expiration: January 2015, Exercise Price: $92.50 | | | 418 | |
| | 33 | | Expiration: January 2015, Exercise Price: $95.00 | | | 759 | |
| | | | B/E Aerospace, Inc. | | | | |
| | 14 | | Expiration: January 2015, Exercise Price: $75.00 | | | 6,230 | |
| | 46 | | Expiration: January 2015, Exercise Price: $80.00 | | | 5,750 | |
| | | | Baker Hughes, Inc. | | | | |
| | 7 | | Expiration: January 2015, Exercise Price: $60.00 | | | 140 | |
| | 17 | | Expiration: January 2015, Exercise Price: $62.50 | | | 170 | |
| | | | Bayer AG | | | | |
| | 8 | | Expiration: January 2015, Exercise Price: EUR 110.00 (a) | | | 4,201 | |
| | 3 | | Expiration: February 2015, Exercise Price: EUR 105.00 (a) | | | 3,510 | |
| | 6 | | Expiration: February 2015, Exercise Price: EUR 115.00 (a) | | | 2,360 | |
| | | | BP plc — ADR | | | | |
| | 39 | | Expiration: April 2015, Exercise Price: $37.00 | | | 9,477 | |
| | | | CBS Corporation Class B | | | | |
| | 4 | | Expiration: February 2015, Exercise Price: $52.50 | | | 1,680 | |
| | 29 | | Expiration: February 2015, Exercise Price: $55.00 | | | 7,627 | |
| | 27 | | Expiration: March 2015, Exercise Price: $57.50 | | | 5,467 | |
| | | | DISH Network Corporation Class A | | | | |
| | 44 | | Expiration: March 2015, Exercise Price: $67.50 | | | 37,180 | |
| | | | The Dow Chemical Company | | | | |
| | 29 | | Expiration: March 2015, Exercise Price: $45.00 | | | 7,946 | |
| | 10 | | Expiration: March 2015, Exercise Price: $46.00 | | | 2,210 | |
| | 34 | | Expiration: March 2015, Exercise Price: $47.00 | | | 5,984 | |
| | | | E.I. Du Pont de Nemours & Company | | | | |
| | 12 | | Expiration: January 2015, Exercise Price: $70.00 | | | 5,010 | |
| | 23 | | Expiration: February 2015, Exercise Price: $72.50 | | | 6,612 | |
| | | | eBay, Inc. | | | | |
| | 16 | | Expiration: February 2015, Exercise Price: $55.00 | | | 4,480 | |
| | | | Equinix, Inc. | | | | |
| | 1 | | Expiration: January 2015, Exercise Price: $200.00 | | | 3,525 | |
| | | | Equity Commonwealth | | | | |
| | 13 | | Expiration: January 2015, Exercise Price: $27.50 | | | 65 | |
The accompanying notes are an integral part of these financial statements.
The Merger Fund VL
SCHEDULE OF OPTIONS WRITTEN (continued)
December 31, 2014
| Contracts (100 shares per contract) | | Value | |
| | | Family Dollar Stores, Inc. | | | |
| | 6 | | Expiration: January 2015, Exercise Price: $80.00 | | $ | 480 | |
| | | | General Motors Company | | | | |
| | 22 | | Expiration: January 2015, Exercise Price: $32.00 | | | 6,633 | |
| | 63 | | Expiration: January 2015, Exercise Price: $33.00 | | | 13,230 | |
| | 14 | | Expiration: January 2015, Exercise Price: $34.00 | | | 1,792 | |
| | 12 | | Expiration: March 2015, Exercise Price: $34.00 | | | 2,616 | |
| | | | Hertz Global Holdings, Inc. | | | | |
| | 36 | | Expiration: January 2015, Exercise Price: $22.00 | | | 11,340 | |
| | 7 | | Expiration: January 2015, Exercise Price: $23.00 | | | 1,592 | |
| | 80 | | Expiration: March 2015, Exercise Price: $23.00 | | | 25,600 | |
| | | | Hess Corporation | | | | |
| | 57 | | Expiration: February 2015, Exercise Price: $72.50 | | | 25,793 | |
| | | | Huntsman Corporation | | | | |
| | 7 | | Expiration: January 2015, Exercise Price: $25.00 | | | 70 | |
| | 9 | | Expiration: February 2015, Exercise Price: $25.00 | | | 405 | |
| | 72 | | Expiration: February 2015, Exercise Price: $26.00 | | | 2,520 | |
| | 115 | | Expiration: February 2015, Exercise Price: $27.00 | | | 2,300 | |
| | | | International Game Technology | | | | |
| | 39 | | Expiration: January 2015, Exercise Price: $17.00 | | | 975 | |
| | | | International Paper Company | | | | |
| | 73 | | Expiration: January 2015, Exercise Price: $49.00 | | | 35,223 | |
| | | | Kinder Morgan, Inc. | | | | |
| | 30 | | Expiration: January 2015, Exercise Price: $50.00 | | | 30 | |
| | 13 | | Expiration: January 2015, Exercise Price: $55.00 | | | 26 | |
| | | | Koninklijke (Royal) KPN NV | | | | |
| | 69 | | Expiration: January 2015, Exercise Price: EUR 2.60 (a) | | | 585 | |
| | 282 | | Expiration: February 2015, Exercise Price: EUR 2.60 (a) | | | 4,095 | |
| | 20 | | Expiration: February 2015, Exercise Price: EUR 2.70 (a) | | | 169 | |
| | 66 | | Expiration: March 2015, Exercise Price: EUR 2.60 (a) | | | 1,198 | |
| | | | Lamar Advertising Company Class A | | | | |
| | 98 | | Expiration: January 2015, Exercise Price: $52.50 | | | 16,170 | |
| | | | LIFE TIME FITNESS, Inc. | | | | |
| | 4 | | Expiration: February 2015, Exercise Price: $50.00 | | | 2,980 | |
| | | | MeadWestvaco Corporation | | | | |
| | 33 | | Expiration: March 2015, Exercise Price: $42.50 | | | 10,230 | |
| | | | Newmont Mining Corporation | | | | |
| | 9 | | Expiration: March 2015, Exercise Price: $19.00 | | | 1,296 | |
| | 4 | | Expiration: March 2015, Exercise Price: $20.00 | | | 400 | |
| | | | Noble Corporation plc | | | | |
| | 11 | | Expiration: January 2015, Exercise Price: $22.00 | | | 11 | |
The accompanying notes are an integral part of these financial statements.
The Merger Fund VL
SCHEDULE OF OPTIONS WRITTEN (continued)
December 31, 2014
| Contracts (100 shares per contract) | | Value | |
| | | Occidental Petroleum Corporation | | | |
| | 5 | | Expiration: January 2015, Exercise Price: $82.50 | | $ | 1,088 | |
| | 16 | | Expiration: January 2015, Exercise Price: $87.50 | | | 64 | |
| | 15 | | Expiration: February 2015, Exercise Price: $80.00 | | | 5,715 | |
| | | | Pfizer, Inc. | | | | |
| | 20 | | Expiration: January 2015, Exercise Price: $31.00 | | | 1,140 | |
| | 4 | | Expiration: February 2015, Exercise Price: $31.00 | | | 358 | |
| | 44 | | Expiration: March 2015, Exercise Price: $30.00 | | | 7,414 | |
| | | | Restaurant Brands International, Inc. | | | | |
| | 9 | | Expiration: January 2015, Exercise Price: $40.00 | | | 495 | |
| | | | Rock-Tenn Company Class A | | | | |
| | 12 | | Expiration: January 2015, Exercise Price: $47.50 | | | 16,680 | |
| | 18 | | Expiration: January 2015, Exercise Price: $50.00 | | | 20,250 | |
| | | | Sirius XM Holdings, Inc. | | | | |
| | 159 | | Expiration: January 2015, Exercise Price: $3.50 | | | 795 | |
| | 26 | | Expiration: February 2015, Exercise Price: $3.50 | | | 312 | |
| | 89 | | Expiration: March 2015, Exercise Price: $3.50 | | | 1,246 | |
| | | | The Timken Company | | | | |
| | 10 | | Expiration: March 2015, Exercise Price: $42.50 | | | 2,025 | |
| | | | T-Mobile U.S., Inc. | | | | |
| | 9 | | Expiration: January 2015, Exercise Price: $26.00 | | | 1,296 | |
| | 51 | | Expiration: February 2015, Exercise Price: $29.00 | | | 4,284 | |
| | 53 | | Expiration: February 2015, Exercise Price: $30.00 | | | 3,021 | |
| | | | TRW Automotive Holdings Corporation | | | | |
| | 8 | | Expiration: January 2015, Exercise Price: $105.00 | | | 20 | |
| | | | Vivendi SA | | | | |
| | 68 | | Expiration: January 2015, Exercise Price: EUR 20.00 (a) | | | 6,582 | |
| | 131 | | Expiration: January 2015, Exercise Price: EUR 19.50 (a) | | | 18,705 | |
| | 14 | | Expiration: February 2015, Exercise Price: EUR 19.50 (a) | | | 2,338 | |
| | 26 | | Expiration: February 2015, Exercise Price: EUR 20.00 (a) | | | 3,146 | |
| | 15 | | Expiration: March 2015, Exercise Price: EUR 19.00 (a) | | | 3,467 | |
| | | | Vodafone Group plc — ADR | | | | |
| | 23 | | Expiration: January 2015, Exercise Price: $34.00 | | | 2,013 | |
| | 3 | | Expiration: January 2015, Exercise Price: $35.00 | | | 129 | |
| | | | The Williams Companies, Inc. | | | | |
| | 26 | | Expiration: February 2015, Exercise Price: $44.00 | | | 7,748 | |
| | 14 | | Expiration: February 2015, Exercise Price: $45.00 | | | 3,381 | |
| | 26 | | Expiration: February 2015, Exercise Price: $46.00 | | | 4,992 | |
| | | | | | | 436,558 | |
The accompanying notes are an integral part of these financial statements.
The Merger Fund VL
SCHEDULE OF OPTIONS WRITTEN (continued)
December 31, 2014
| Contracts (100 shares per contract) | | Value | |
| | | | |
| PUT OPTIONS WRITTEN | | | |
| | | SPDR S&P 500 ETF Trust | | | |
| | 21 | | Expiration: January 2015, Exercise Price: $194.00 | | $ | 1,302 | |
| | 12 | | Expiration: January 2015, Exercise Price: $195.00 | | | 822 | |
| | 10 | | Expiration: February 2015, Exercise Price: $195.00 | | | 2,050 | |
| | | | | | | 4,174 | |
| | | | TOTAL OPTIONS WRITTEN (Premiums received $394,329) | | $ | 440,732 | |
ADR – American Depository Receipt
ETF – Exchange-Traded Fund
EUR – Euro
| plc – | Public Limited Company |
| (a) | Level 2 Security. Please see Note 2 on the Notes to the Financial Statements. |
The accompanying notes are an integral part of these financial statements.
The Merger Fund VL
SCHEDULE OF FORWARD CURRENCY EXCHANGE CONTRACTS*
December 31, 2014
| | | | U.S. | | | U.S. | |
| | | | $ Value at | | | $ Value at | Unrealized |
| Settlement | Currency to | December 31, | Currency to | December 31, | Appreciation |
| Date | be Delivered | 2014 | be Received | 2014 | (Depreciation)** |
| 3/26/15 | 122,904 | AUD | $ 99,714 | 112,703 | USD | $ 112,703 | $12,989 |
| 3/26/15 | 49,384 | USD | 49,384 | 56,938 | AUD | 46,195 | (3,189) |
| 3/27/15 | 65,519 | AUD | 53,152 | 57,410 | USD | 57,410 | 4,258 |
| 3/27/15 | 55,541 | USD | 55,541 | 64,810 | AUD | 52,577 | (2,964) |
| 5/22/15 | 22,596 | AUD | 18,262 | 18,209 | USD | 18,209 | (53) |
| 1/21/15 | 525,834 | CAD | 452,398 | 473,107 | USD | 473,107 | 20,709 |
| 1/21/15 | 3,474 | USD | 3,474 | 4,051 | CAD | 3,485 | 11 |
| 1/21/15 | 126,574 | EUR | 153,196 | 160,104 | USD | 160,104 | 6,908 |
| 1/21/15 | 16,119 | USD | 16,119 | 12,679 | EUR | 15,346 | (773) |
| 2/11/15 | 499,508 | EUR | 604,683 | 615,742 | USD | 615,742 | 11,059 |
| 2/18/15 | 188,500 | EUR | 228,202 | 235,314 | USD | 235,314 | 7,112 |
| 3/17/15 | 125,840 | EUR | 152,379 | 158,004 | USD | 158,004 | 5,625 |
| 3/25/15 | 18,368 | EUR | 22,243 | 22,985 | USD | 22,985 | 742 |
| 3/19/15 | 61,978 | GBP | 96,537 | 105,291 | USD | 105,291 | 8,754 |
| 3/19/15 | 99,768 | USD | 99,768 | 61,978 | GBP | 96,537 | (3,231) |
| 6/15/15 | 64,674 | GBP | 100,665 | 103,075 | USD | 103,075 | 2,410 |
| 6/25/15 | 248,444 | SGD | 187,130 | 188,035 | USD | 188,035 | 905 |
| | | | $2,392,847 | | | $ 2,464,119 | $71,272 |
AUD – Australian Dollar
CAD – Canadian Dollar
EUR – Euro
GBP – British Pound
SGD – Singapore Dollar
USD – U.S. Dollar
| * | JPMorgan Chase & Co. Inc. is the counterparty for all open forward currency exchange contracts held by the Fund as of December 31, 2014. |
| ** | Unrealized appreciation is a receivable and unrealized depreciation is a payable on the Statement of Assets and Liabilities. |
The accompanying notes are an integral part of these financial statements.
The Merger Fund VL
SCHEDULE OF SWAP CONTRACTS
December 31, 2014
| | | | | | | | | | Unrealized | | |
| Termination | | | | | | | | | Appreciation | | Counter- |
| Date | Security | | Shares | | | Notional | | | (Depreciation)* | | party |
| | | | | | | | | | | |
| LONG TOTAL RETURN SWAP CONTRACTS | | | | | | | | | | |
| 9/19/15 | Bayer AG | | | 1,700 | | | $ | 232,451 | | | $ | (5,121 | ) | JPM |
| 10/6/15 | CareFusion Corporation | | | 6,770 | | | | 401,732 | | | | 16,624 | | JPM |
| 10/6/15 | CareFusion Corporation | | | 4,246 | | | | 251,958 | | | | 10,209 | | BAML |
| 10/1/15 | CBS Corporation Class B | | | 6,053 | | | | 334,973 | | | | 13,376 | | BAML |
| 10/16/15 | CSR plc | | | 7,186 | | | | 95,873 | | | | (529 | ) | JPM |
| 10/7/15 | DIRECTV | | | 4,075 | | | | 353,302 | | | | (3,947 | ) | JPM |
| 10/16/15 | Dresser-Rand Group, Inc. | | | 49 | | | | 4,008 | | | | 132 | | JPM |
| 12/16/15 | E.ON SE | | | 1,148 | | | | 19,719 | | | | 407 | | JPM |
| 9/29/15 | General Motors Company | | | 12,000 | | | | 418,920 | | | | 23,445 | | BAML |
| 1/5/15 | GrainCorp, Ltd. Class A | | | 83 | | | | 559 | | | | (110 | ) | JPM |
| 9/29/15 | Hillgrove Resources, Ltd. | | | 14,160 | | | | 5,202 | | | | (3,469 | ) | JPM |
| 10/16/15 | Jazztel plc | | | 9,680 | | | | 147,002 | | | | (5,325 | ) | JPM |
| 3/3/15 | Koninklijke (Royal) KPN NV | | | 43,729 | | | | 139,059 | | | | (17,750 | ) | JPM |
| 12/11/15 | Lafarge SA (a) | | | 1,707 | | | | 119,968 | | | | 1,485 | | JPM |
| 10/16/15 | Protective Life Corporation | | | 71 | | | | 4,945 | | | | 39 | | JPM |
| 6/3/15 | SAI Global, Ltd. | | | 14,659 | | | | 47,870 | | | | (21,685 | ) | JPM |
| 10/2/15 | TRW Automotive | | | | | | | | | | | | | |
| | Holdings Corporation | | | 9,449 | | | | 971,830 | | | | 12,843 | | JPM |
| 12/9/15 | United Envirotech, Ltd. | | | 150,572 | | | | 183,008 | | | | 233 | | BAML |
| 1/21/15 | Vivendi SA | | | 25,482 | | | | 637,967 | | | | (23,333 | ) | JPM |
| | | | | | | | | | | | | | |
| SHORT TOTAL RETURN SWAP CONTRACTS | | | | | | | | | | | | | |
| 11/14/15 | Amec Foster Wheeler plc | | | (2,402 | ) | | | (31,934 | ) | | | 12,200 | | JPM |
| 10/6/15 | Becton, Dickinson | | | | | | | | | | | | | |
| | and Company | | | (528 | ) | | | (73,476 | ) | | | (7,901 | ) | JPM |
| 10/6/15 | Becton, Dickinson | | | | | | | | | | | | | |
| | and Company | | | (330 | ) | | | (45,923 | ) | | | (4,966 | ) | BAML |
| 7/17/15 | GTECH Holdings S.p.A. | | | (659 | ) | | | (14,744 | ) | | | 1,398 | | BAML |
| 12/11/15 | GTECH Holdings S.p.A. | | | (112 | ) | | | (2,506 | ) | | | (12 | ) | JPM |
| 12/17/15 | GTECH Holdings | | | | | | | | | | | | | |
| | S.p.A. Rights (a) | | | (428 | ) | | | — | | | | — | | BAML |
| 12/11/15 | Holcim, Ltd. (a) | | | (1,707 | ) | | | (122,505 | ) | | | (1,270 | ) | JPM |
| | | | | | | | | | | | $ | (3,027 | ) | |
BAML – Bank of America Merrill Lynch & Co., Inc.
JPM – JPMorgan Chase & Co., Inc.
plc – Public Limited Company
| * | Based on the net swap contract value held at each counterparty, unrealized appreciation is a receivable and unrealized depreciation is a payable on the Statement of Assets and Liabilities. |
| (a) | Security fair valued by the Adviser in good faith in accordance with the policies adopted by the Board of Trustees. |
The accompanying notes are an integral part of these financial statements.
(This Page Intentionally Left Blank.)
The Merger Fund VL
STATEMENT OF ASSETS AND LIABILITIES
December 31, 2014
| ASSETS: | | | | | | |
| Investments, at value (Cost $21,362,794) | | | | | $ | 21,727,930 | |
| Cash held in foreign currency (Cost $447,806) | | | | | | 449,174 | |
| Receivable from brokers | | | | | | 3,628,366 | |
| Deposits at brokers | | | | | | 1,364,480 | |
| Receivable for forward currency exchange contracts | | | | | | 81,482 | |
| Receivable for swap contracts | | | | | | 43,695 | |
| Receivable for investments sold | | | | | | 173,071 | |
| Dividends and interest receivable | | | | | | 39,587 | |
| Receivable for fund shares issued | | | | | | 37,674 | |
| Swap dividends receivable | | | | | | 17,141 | |
| Prepaid expenses and other receivables | | | | | | 704 | |
| Total Assets | | | | | | 27,563,304 | |
| | | | | | | | |
| LIABILITIES: | | | | | | | |
| Securities sold short, at value (proceeds of $3,628,366) | | $ | 4,078,626 | | | | | |
| Written option contracts, at value | | | | | | | | |
| (premiums received $394,329) | | | 440,732 | | | | | |
| Payable for forward currency exchange contracts | | | 10,210 | | | | | |
| Payable for swap contracts | | | 46,722 | | | | | |
| Accrued expenses and other liabilities | | | 76,875 | | | | | |
| Payable for investments purchased | | | 41,636 | | | | | |
| Dividends and interest payable | | | 5,992 | | | | | |
| Payable to the investment adviser | | | 5,851 | | | | | |
| Payable for closed swap contracts | | | 1,720 | | | | | |
| Swap dividends payable | | | 1,114 | | | | | |
| Payable for fund shares redeemed | | | 135 | | | | | |
| Total Liabilities | | | | | | | 4,709,613 | |
| NET ASSETS | | | | | | $ | 22,853,691 | |
The accompanying notes are an integral part of these financial statements.
The Merger Fund VL
STATEMENT OF ASSETS AND LIABILITIES (continued)
December 31, 2014
| NET ASSETS CONSISTS OF: | | | | | | |
| Accumulated undistributed net investment income | | | | | $ | 666,851 | |
| Accumulated net realized loss on investments, securities | | | | | | | |
| sold short, written option contracts expired or closed, | | | | | | | |
| swap contracts, foreign currency translation | | | | | | | |
| and forward currency exchange contracts | | | | | | (212,577 | ) |
| Net unrealized appreciation (depreciation) on: | | | | | | | |
| Investments | | $ | 365,136 | | | | | |
| Securities sold short | | | (450,260 | ) | | | | |
| Written option contracts | | | (46,403 | ) | | | | |
| Swap contracts | | | (3,027 | ) | | | | |
| Foreign currency translation | | | 1,368 | | | | | |
| Forward currency exchange contracts | | | 71,272 | | | | | |
| Net unrealized depreciation | | | | | | | (61,914 | ) |
| Paid-in capital | | | | | | | 22,461,331 | |
| Total Net Assets | | | | | | $ | 22,853,691 | |
| NET ASSET VALUE and offering price per share* | | | | | | | | |
| ($22,853,691 / 2,101,916 shares of | | | | | | | | |
| beneficial interest outstanding) | | | | | | $ | 10.87 | |
| * | The redemption price per share may vary based on the length of time a shareholder holds Fund shares. |
The accompanying notes are an integral part of these financial statements.
The Merger Fund VL
STATEMENT OF OPERATIONS
For the Year Ended December 31, 2014
| INVESTMENT INCOME: | | | | | | |
| Interest | | | | | $ | 66,684 | |
| Dividend income on long positions | | | | | | | |
| (net of foreign withholding taxes of $943) | | | | | | 830,574 | |
| Total investment income | | | | | | 897,258 | |
| EXPENSES: | | | | | | | |
| Investment advisory fees | | $ | 271,266 | | | | | |
| Professional fees | | | 79,318 | | | | | |
| Transfer agent and shareholder servicing agent fees | | | 67,878 | | | | | |
| Fund accounting expense | | | 52,325 | | | | | |
| Administration fees | | | 28,053 | | | | | |
| Reports to shareholders | | | 11,465 | | | | | |
| Miscellaneous expenses | | | 7,623 | | | | | |
| Custody fees | | | 7,238 | | | | | |
| Trustees’ fees and expenses | | | 7,122 | | | | | |
| Federal and state registration fees | | | 995 | | | | | |
| Borrowing expense on securities sold short | | | 26,630 | | | | | |
| Dividends on securities sold short | | | 47,914 | | | | | |
| Total expenses before expense waiver by adviser | | | | | | | 607,827 | |
| Less: Expense reimbursed by Adviser (Note 3) | | | | | | | (229,465 | ) |
| Net expenses | | | | | | | 378,362 | |
| NET INVESTMENT INCOME | | | | | | | 518,896 | |
| REALIZED AND UNREALIZED GAIN (LOSS) ON INVESTMENTS: | | | | | | | | |
| Realized gain (loss) on: | | | | | | | | |
| Investments | | | (98,812 | ) | | | | |
| Securities sold short | | | (130,722 | ) | | | | |
| Written option contracts expired or closed | | | 426,538 | | | | | |
| Swap contracts | | | 52,977 | | | | | |
| Foreign currency translation | | | (146 | ) | | | | |
| Forward currency exchange contracts | | | 78,042 | | | | | |
| Net realized gain | | | | | | | 327,877 | |
| Change in unrealized appreciation (depreciation) on: | | | | | | | | |
| Investments | | | (658,129 | ) | | | | |
| Securities sold short | | | (278,112 | ) | | | | |
| Written option contracts | | | 211,677 | | | | | |
| Swap contracts | | | 6,634 | | | | | |
| Foreign currency translation | | | 1,368 | | | | | |
| Forward currency exchange contracts | | | 108,522 | | | | | |
| Net unrealized depreciation | | | | | | | (608,040 | ) |
| NET REALIZED AND UNREALIZED LOSS ON INVESTMENTS | | | | | | | (280,163 | ) |
| NET INCREASE IN NET ASSETS | | | | | | | | |
| RESULTING FROM OPERATIONS | | | | | | $ | 238,733 | |
The accompanying notes are an integral part of these financial statements.
The Merger Fund VL
STATEMENTS OF CHANGES IN NET ASSETS
| | | Year Ended | | | Year Ended | |
| | | December 31, 2014 | | | December 31, 2013 | |
| | | | | | | |
| Net investment income | | $ | 518,896 | | | $ | 26,650 | |
| Net realized gain on investments, | | | | | | | | |
| securities sold short, written option contracts | | | | | | | | |
| expired or closed, swap contracts, foreign | | | | | | | | |
| currency translation and forward | | | | | | | | |
| currency exchange contracts | | | 327,877 | | | | 233,046 | |
| Change in unrealized appreciation | | | | | | | | |
| (depreciation) on investments, securities | | | | | | | | |
| sold short, written option contracts, swap | | | | | | | | |
| contracts, foreign currency translation and | | | | | | | | |
| forward currency exchange contracts | | | (608,040 | ) | | | 400,494 | |
| Net increase in net assets | | | | | | | | |
| resulting from operations | | | 238,733 | | | | 660,190 | |
| | | | | | | | | |
| Distributions to shareholders from: (Note 5) | | | | | | | | |
| Net investment income | | | (293,878 | ) | | | (49,575 | ) |
| Net realized gains | | | (117,999 | ) | | | — | |
| Total dividends and distributions | | | (411,877 | ) | | | (49,575 | ) |
| Net increase in net assets from | | | | | | | | |
| capital share transactions (Note 4) | | | 3,948,643 | | | | 4,083,274 | |
| Net increase in net assets | | | 3,775,499 | | | | 4,693,889 | |
| | | | | | | | | |
| NET ASSETS: | | | | | | | | |
| Beginning of year | | | 19,078,192 | | | | 14,384,303 | |
| End of year (including accumulated | | | | | | | | |
| undistributed net investment income of | | | | | | | | |
| $666,851 and $340,348, respectively) | | $ | 22,853,691 | | | $ | 19,078,192 | |
The accompanying notes are an integral part of these financial statements.
The Merger Fund VL
FINANCIAL HIGHLIGHTS
Selected per share data is based on a share of beneficial interest outstanding throughout each year.
| | | Year Ended December 31, | |
| | | 2014 | | | 2013 | | | 2012 | | | 2011 | | | 2010(1) | |
| Per Share Data: | | | | | | | | | | | | | | | |
| Net Asset Value, beginning of year | | $ | 10.92 | | | $ | 10.54 | | | $ | 10.44 | | | $ | 11.03 | | | $ | 10.70 | |
| Income from investment operations: | | | | | | | | | | | | | | | | | | | | |
| Net investment income (loss) | | | 0.26 | (2) | | | 0.02 | (2) | | | (0.04 | )(2) | | | (0.13 | )(2) | | | 0.02 | (3) |
| Net realized and unrealized | | | | | | | | | | | | | | | | | | | | |
| gain (loss) on investments | | | (0.11 | ) | | | 0.39 | | | | 0.30 | | | | 0.23 | | | | 0.54 | |
| Total from investment operations | | | 0.15 | | | | 0.41 | | | | 0.26 | | | | 0.10 | | | | 0.56 | |
| Less distributions: | | | | | | | | | | | | | | | | | | | | |
| From net investment income | | | (0.14 | ) | | | (0.03 | ) | | | — | | | | — | | | | — | |
| From net realized gains | | | (0.06 | ) | | | — | | | | (0.16 | ) | | | (0.69 | ) | | | (0.23 | ) |
| Total dividends and distributions | | | (0.20 | ) | | | (0.03 | ) | | | (0.16 | ) | | | (0.69 | ) | | | (0.23 | ) |
| Net Asset Value, end of year | | $ | 10.87 | | | $ | 10.92 | | | $ | 10.54 | | | $ | 10.44 | | | $ | 11.03 | |
| Total Return | | | 1.37 | % | | | 3.88 | % | | | 2.52 | % | | | 0.87 | % | | | 5.30 | % |
| Supplemental data and ratios: | | | | | | | | | | | | | | | | | | | | |
| Net assets, end of year (000’s) | | $ | 22,854 | | | $ | 19,078 | | | $ | 14,384 | | | $ | 14,326 | | | $ | 14,817 | |
| Ratio of gross expenses | | | | | | | | | | | | | | | | | | | | |
| to average net assets: | | | | | | | | | | | | | | | | | | | | |
| Before expense waiver | | | 2.80 | % | | | 2.96 | % | | | 3.06 | % | | | 3.44 | % | | | 5.26 | % |
| After expense waiver | | | 1.74 | % | | | 1.65 | % | | | 1.92 | % | | | 2.19 | % | | | 3.16 | % |
| Ratio of dividends and borrowing | | | | | | | | | | | | | | | | | | | | |
| expense on securities sold short | | | | | | | | | | | | | | | | | | | | |
| to average net assets | | | 0.34 | % | | | 0.25 | % | | | 0.52 | % | | | 0.79 | % | | | 1.76 | % |
| Ratio of operating expenses to | | | | | | | | | | | | | | | | | | | | |
| average net assets excluding | | | | | | | | | | | | | | | | | | | | |
| dividends and borrowing | | | | | | | | | | | | | | | | | | | | |
| expense on securities sold short | | | 1.40 | % | | | 1.40 | % | | | 1.40 | % | | | 1.40 | % | | | 1.40 | % |
| Ratio of net investment | | | | | | | | | | | | | | | | | | | | |
| income (loss) to average net assets: | | | | | | | | | | | | | | | | | | | | |
| Before expense waiver | | | 1.33 | % | | | (1.15 | )% | | | (1.57 | )% | | | (2.44 | )% | | | (4.29 | )% |
| After expense waiver | | | 2.39 | % | | | 0.16 | % | | | (0.43 | )% | | | (1.19 | )% | | | (2.19 | )% |
Portfolio turnover rate(4) | | | 154 | % | | | 196 | % | | | 269 | % | | | 273 | % | | | 187 | % |
| (1) | Performance data included for periods prior to 2011 reflect that of Westchester Capital Management, Inc. the Fund’s prior investment adviser. See Note 1 for additional information. |
| (2) | Net investment income (loss) per share has been calculated based on average shares outstanding during the year. |
| (3) | Net investment income per share is calculated using ending balance after consideration of adjustments for permanent book and tax differences. |
| (4) | The numerator for the portfolio turnover rate includes the lesser of purchases or sales (excluding short positions). The denominator includes the average long positions throughout the year. |
The accompanying notes are an integral part of these financial statements.
The Merger Fund VL
NOTES TO THE FINANCIAL STATEMENTS
December 31, 2014
Note 1 — ORGANIZATION
The Merger Fund VL (the “Fund”) is a no-load, open-end, diversified investment company organized as a statutory trust under the laws of Delaware on November 22, 2002, and registered under the Investment Company Act of 1940, as amended (the “1940 Act”). The Fund commenced operations on May 26, 2004. In a transaction that closed on December 31, 2010, Westchester Capital Management, Inc. transferred substantially all of its business and assets to Westchester Capital Management, LLC (the “Adviser”), which became the Fund’s investment adviser. Therefore, the performance information included herein for periods prior to 2011 reflect the performance of Westchester Capital Management, Inc. Roy Behren and Michael Shannon, the Fund’s current portfolio managers, assumed portfolio management duties for the Fund in January 2007. The investment objective of the Fund is to seek to achieve capital growth by engaging in merger arbitrage. Merger arbitrage is a highly specialized investment approach generally designed to profit from the successful completion of publicly announced mergers, takeovers, tender offers, leveraged buyouts, liquidations and other corporate reorganizations. The Fund’s shares are currently offered only to separate accounts funding variable annuity and variable life insurance contracts. At December 31, 2014, 93.3% of the shares outstanding of the Fund were owned by three insurance companies. Activities of these shareholders may have a significant effect on the operations of the Fund.
Note 2 — SIGNIFICANT ACCOUNTING POLICIES
The following is a summary of significant accounting policies followed by the Fund in the preparation of its financial statements. These policies are in conformity with U.S. generally accepted accounting principles (“GAAP”). In preparing these financial statements, the Fund has evaluated events and transactions for potential recognition or disclosure through the date the financial statements were available to be issued. The presentation of financial statements in conformity with GAAP requires management to make estimates and assumptions that affect the reported amount of assets and liabilities at the date of the financial statements and the reported amounts of revenues and expenses during the reporting period. Actual results could differ from those estimates and assumptions.
A.Investment Valuation
The following is a summary of the Fund’s pricing procedures. It is intended to be a general discussion and may not necessarily reflect all pricing procedures followed by the Fund.
The Merger Fund VL
NOTES TO THE FINANCIAL STATEMENTS (continued)
December 31, 2014
Note 2 — SIGNIFICANT ACCOUNTING POLICIES (continued)
Securities listed on the NASDAQ are valued at the NASDAQ Official Closing Price (“NOCP”). Investments in registered open-end investment companies other than exchange-traded funds are valued at their reported net asset value (“NAV”). Equity securities that are traded on a national securities exchange are valued at the last sale price at the close of that exchange. The securities valued using quoted prices in active markets are classified as Level 1 investments. Equity securities not listed on an exchange, but for which market transaction prices are reported, are valued at the last sale price as of the close of the New York Stock Exchange. If such a security does not trade on a particular day, then the mean between the closing bid and asked prices will be used. These securities are classified as Level 2 investments. In pricing corporate bonds and other debt securities that are not obligations of the U.S. Government or its agencies, the mean of the bid and asked prices provided by a third party is used. These are classified as Level 2 investments. As a secondary source, an individual broker bid may be used to value debt securities if the Adviser reasonably believes such bid is an actionable bid in that the broker would be willing to transact at that price. These securities are generally classified as Level 2 or Level 3 investments.
Exchange-traded options are valued at the higher of the intrinsic value of the option (i.e., what the Fund would pay or can receive upon the option being exercised) or the last reported composite sale price. If no sales are reported or if the last sale is outside the bid and asked parameters, the higher of the intrinsic value of the option or the mean between the last reported bid and asked prices is used. Non-exchange-traded options will be valued at the higher of the intrinsic value of the option or at the price supplied by the counterparty. Options for which there is an active market are classified as Level 1 investments, but options not listed on an exchange are classified as Level 2 investments. Investments in United States government securities (other than short-term securities) are valued at the mean between the 4:00 PM bid and asked prices supplied by a third party vendor. Short-term fixed-income securities having a maturity of less than 60 days are valued at market quotations or based on valuations supplied by a third party pricing service. If a reliable price from a third party pricing service is unavailable, amortized cost may be used if it is determined that the instrument’s amortized cost value represents approximately the fair value of the security.
The Merger Fund VL
NOTES TO THE FINANCIAL STATEMENTS (continued)
December 31, 2014
Note 2 — SIGNIFICANT ACCOUNTING POLICIES (continued)
Securities for which there are no market quotations readily available or for which such quotations are unreliable are valued at fair value as determined in accordance with procedures adopted by the Board of Trustees of the Fund (“the Board of Trustees” or “Trustees”) and under the supervision of the Board of Trustees. The factors for fair valuation the Valuation Group may consider include, among other things: fundamental analytical data; the nature and duration of restrictions on disposition; an evaluation of forces that influence the market in which the securities are purchased and sold; and public trading in similar securities of the issuer or comparable issuers. When fair-value pricing is employed, the prices of securities used by the Fund to calculate its NAV may differ from quoted or published prices for the same securities. These securities are generally classified as Level 2 or 3 depending on the inputs as described below. At December 31, 2014, securities fair valued in good faith based on the absolute value of long investments and on the absolute value of unrealized gains or losses on swap contracts represented 0.09% of net assets.
The Fund has performed an analysis of all existing investments to determine the significance and character of all inputs to their fair value determination. Various inputs are used in determining the value of the Fund’s investments. These inputs are summarized in the three broad levels listed below:
| | Level 1 — | Quoted prices in active markets for identical securities. |
| | Level 2 — | Other significant observable inputs (including quoted prices for similar securities, interest rates, prepayment speeds, credit risk, etc.). |
| | Level 3 — | Significant unobservable inputs are those inputs that reflect the Fund’s own assumptions that market participants would use to price the asset or liability based on the best available information. |
The inputs or methodology used for valuing securities are not an indication of the risk associated with investing in those securities.
The Merger Fund VL
NOTES TO THE FINANCIAL STATEMENTS (continued)
December 31, 2014
Note 2 — SIGNIFICANT ACCOUNTING POLICIES (continued)
The following tables provide the fair value measurements of applicable Fund assets and liabilities by level within the fair value hierarchy for the Fund as of December 31, 2014. These assets and liabilities are measured on a recurring basis.
| | | Level 1 | | | Level 2 | | | Level 3 | | | Total | |
| Assets | | | | | | | | | | | | |
| Common Stocks* | | $ | 16,172,386 | | | $ | — | | | $ | — | | | $ | 16,172,386 | |
| Preferred Stocks | | | 239,528 | | | | — | | | | — | | | | 239,528 | |
| Contingent Value Rights | | | — | | | | — | | | | 837 | | | | 837 | |
| Convertible Bonds | | | — | | | | 16,350 | | | | — | | | | 16,350 | |
| Corporate Bonds | | | — | | | | 894,030 | | | | — | | | | 894,030 | |
| Municipal Bonds | | | — | | | | 169,985 | | | | — | | | | 169,985 | |
| Purchased Put Option Contracts | | | 138,929 | | | | 1,608 | | | | — | | | | 140,537 | |
| Escrow Notes | | | — | | | | — | | | | 15,911 | | | | 15,911 | |
| Short-Term Investments | | | 4,078,366 | | | | — | | | | — | | | | 4,078,366 | |
| Forward Currency | | | | | | | | | | | | | | | | |
| Exchange Contracts** | | | — | | | | 81,482 | | | | — | | | | 81,482 | |
| Swap Contracts** | | | — | | | | 43,695 | | | | — | (1) | | | 43,695 | |
| | | | | | | | | | | | | | | | | |
| Liabilities | | | | | | | | | | | | | | | | |
| Common Stocks Sold Short | | $ | 4,078,626 | | | $ | — | | | $ | — | | | $ | 4,078,626 | |
| Written Call Option Contracts | | | 390,376 | | | | 50,356 | | | | — | | | | 440,732 | |
| Forward Currency | | | | | | | | | | | | | | | | |
| Exchange Contracts** | | | — | | | | 10,210 | | | | — | | | | 10,210 | |
| Swap Contracts** | | | — | | | | 46,722 | | | | — | | | | 46,722 | |
| * | | Please refer to the Schedule of Investments to view common stocks segregated by industry type. |
| ** | | Swap contracts and forward currency exchange contracts are valued at the net unrealized appreciation (depreciation) on the instrument. |
The Level 2 securities are priced using inputs such as current yields, discount rates, credit quality, yields on comparable securities, trading volume, maturity date, market bid and ask prices, prices on comparable securities and other significant inputs. There were no transfers into or out of Level 1, 2 or 3 securities during the year. Transfers are recorded at the end of the reporting period.
Level 3 Reconciliation Disclosure
The following is a reconciliation of Level 3 assets for which significant unobservable inputs were used to determine fair value.
| Description | | Investments | |
| Balance as of December 31, 2013 | | $ | 133,441 | |
| Realized loss | | | (31,605 | ) |
| Change in unrealized depreciation | | | (10,184 | ) |
| Net purchases | | | — | (1) |
| Net sales | | | (74,904 | ) |
| Balance as of December 31, 2014 | | $ | 16,748 | |
(1) Amount is less than $0.50. | |
The Merger Fund VL
NOTES TO THE FINANCIAL STATEMENTS (continued)
December 31, 2014
Note 2 — SIGNIFICANT ACCOUNTING POLICIES (continued)
The realized and unrealized gains and losses from Level 3 transactions are included with the net realized gain (loss) on investments and net change in unrealized appreciation (depreciation) on investments on the Statement of Operations, respectively. The net change in unrealized appreciation (depreciation) on investments related to Level 3 securities held by the Fund at December 31, 2014 totals $(10,504).
Significant unobservable valuation inputs developed by the Board of Trustees for material Level 3 investments as of December 31, 2014, are as follows:
| | Fair Value at | Valuation | Unobservable | |
| Description | December 31, 2014 | Technique | Input | Range |
| Escrow Notes | $15,911 | Broker Quote | No Active Market | 2.05 – 2.10 |
| Contingent | | | | |
| Value Rights | $ 837 | Broker Quote | No Active Market | 3.00 – 3.25 |
| Swap Contracts | $ —(1) | Broker Quote | No Active Market | 0.00 – 0.00 |
(1) Amount is less than $0.50. | | | | |
B.Securities Sold Short
The Fund may sell securities or currencies short for economic hedging purposes or any other investment purpose. For financial statement purposes, an amount equal to the settlement amount is initially included in the Statement of Assets and Liabilities as an asset and an equivalent liability. The amount of the liability is subsequently priced to reflect the current value of the short position. Subsequent fluctuations in the market prices of securities or currencies sold, but not yet purchased, may require purchasing the securities or currencies at prices which may differ from the market value reflected on the Statement of Assets and Liabilities. Short sale transactions result in off balance sheet risk because the ultimate obligation may exceed the related amounts shown in the Statement of Assets and Liabilities. The Fund will incur a loss if the price of the security increases between the date of the short sale and the date on which the Fund purchases the security to replace the borrowed security. The Fund’s loss on a short sale is potentially unlimited because there is no upward limit on the price a borrowed security could attain.
The Fund is liable for any dividends payable on securities while those securities are sold short. Until the security is replaced, the Fund is required to pay to the lender any income earned, which is recorded as an expense by the Fund. The Fund segregates liquid assets in an amount equal to the market value of securities sold short, which is reflected in the Schedule of Investments. These assets are required to be adjusted daily to reflect changes in the value of the securities or currencies sold short.
The Merger Fund VL
NOTES TO THE FINANCIAL STATEMENTS (continued)
December 31, 2014
Note 2 — SIGNIFICANT ACCOUNTING POLICIES (continued)
C.Transactions with Brokers
The Fund’s receivables from brokers for proceeds on securities sold short and deposits at brokers for securities sold short are with two securities dealers. The Fund does not require the brokers to maintain collateral in support of the receivable from the brokers for proceeds on securities sold short. The Fund is required by the brokers to maintain collateral at the brokers for securities sold short. The receivable from brokers on the Statement of Assets and Liabilities represents the collateral for securities sold short. The Fund maintains cash deposits at brokers beyond the receivable for short sales.
The Fund’s equity swap contracts’ and forward currency exchange contracts’ cash deposits are monitored daily by the Adviser and counterparty. Cash deposits by the Fund are presented as deposits at brokers on the Statement of Assets and Liabilities. These transactions may involve market risk in excess of the amount of receivable or payable reflected on the Statement of Assets and Liabilities.
D.Federal Income Taxes
No provision for federal income taxes has been made since the Fund has complied to date with the provisions of Subchapter M of the Internal Revenue Code applicable to regulated investment companies and intends to continue to so comply in future years and to distribute investment company net taxable income and net capital gains to shareholders. Additionally, the Fund intends to make all required distributions to avoid federal excise tax.
The Fund has reviewed all open tax years in major jurisdictions and concluded that there is no impact on the Fund’s net assets and there is no tax liability resulting from unrecognized tax benefits relating to uncertain income tax positions taken or expected to be taken on a tax return. The Fund is also not aware of any tax positions for which it is reasonably possible that the total amounts of unrecognized tax benefits will significantly change in the next twelve months. As of December 31, 2014, open Federal and New York tax years include the tax years ended December 31, 2011 through December 31, 2014. The Fund has no tax examination in progress.
E.Written Option Contracts\
The Fund is subject to equity price risk in the normal course of pursuing its investment objectives. The Fund writes (sells) call options including to hedge portfolio investments. Uncovered put options can also be written by the Fund as part of a merger arbitrage strategy involving a pending corporate reorganization. When the Fund writes (sells) an option,
The Merger Fund VL
NOTES TO THE FINANCIAL STATEMENTS (continued)
December 31, 2014
Note 2 — SIGNIFICANT ACCOUNTING POLICIES (continued)
an amount equal to the premium received by the Fund is included in the Statement of Assets and Liabilities as an asset and an equivalent liability. The amount of the liability is subsequently priced daily to reflect the current value of the option written. Refer to Note 2 A. for a pricing description. By writing an option, the Fund may become obligated during the term of the option to deliver or purchase the securities underlying the option at the exercise price if the option is exercised. When an option expires on its stipulated expiration date or the Fund enters into a closing purchase transaction, the Fund realizes a gain or loss if the cost of the closing purchase transaction differs from the premium received when the option was sold without regard to any unrealized gain or loss on the underlying security, and the liability related to such option is eliminated.
When an option is exercised, the premium originally received decreases the cost basis of the security (or increases the proceeds on a sale of the security), and the Fund realizes a gain or loss from the sale of the underlying security. Written option contracts sold on an exchange typically involve less credit risk than over-the-counter options. These contracts may involve market risk in excess of the amount of receivable or payable reflected on the Statement of Assets and Liabilities. Refer to Note 2 Q. for further derivative disclosures.
F.Purchased Option Contracts
The Fund is subject to equity price risk in the normal course of pursuing its investment objectives. The Fund purchases put or call options for hedging purposes, volatility management purposes, or otherwise to gain, or reduce, long or short exposure to one or more asset classes or issuers. When the Fund purchases an option contract, an amount equal to the premium paid is included in the Statement of Assets and Liabilities as an investment, and is subsequently priced daily to reflect the value of the purchased option. Refer to Note 2 A. for a pricing description. When option contracts expire or are closed, realized gains or losses are recognized without regard to any unrealized gains or losses on the underlying securities that may be held by the Fund. Purchased options sold on an exchange typically include less credit risk than over-the-counter options. Refer to Note 2 Q. for further derivative disclosures.
G.Forward Currency Exchange Contracts
The Fund is subject to foreign currency exchange rate risk in the normal course of pursuing its investment objectives. The Fund may use forward currency exchange contracts to hedge against changes in the value of foreign currencies. The Fund may enter into forward currency
The Merger Fund VL
NOTES TO THE FINANCIAL STATEMENTS (continued)
December 31, 2014
Note 2 — SIGNIFICANT ACCOUNTING POLICIES (continued)
exchange contracts obligating the Fund to deliver and receive a currency at a specified future date. Forward contracts are valued daily, and unrealized appreciation or depreciation is recorded daily as the difference between the contract exchange rate and the closing forward rate applied to the face amount of the contract. A realized gain or loss is recorded at the time the forward contract expires. Credit risk may arise as a result of the failure of the counterparty to comply with the terms of the contract. Refer to Note 2 O. for further counterparty risk disclosure.
The use of forward currency exchange contracts does not eliminate fluctuations in the underlying prices of the Fund’s investment securities. The use of forward currency exchange contracts involves the risk that anticipated currency movements will not be accurately predicted. A forward currency exchange contract would limit the risk of loss due to a decline in the value of a particular currency; however it would also limit any potential gain that might result should the value of the currency increase instead of decrease. These contracts may involve market risk in excess of the amount of receivable or payable reflected on the Statement of Assets and Liabilities. Refer to Note 2 Q. for further derivative disclosures.
H.Equity Swap Contracts
The Fund is subject to equity price risk and interest rate risk in the normal course of pursuing its investment objectives. The Fund may enter into both long and short equity swap contracts with multiple broker-dealers. A long equity swap contract entitles the Fund to receive from the counterparty any appreciation and dividends paid on an individual security, while obligating the Fund to pay the counterparty any depreciation on the security as well as interest on the notional amount of the contract at a rate equal to LIBOR plus an agreed upon spread (generally between 25 to 100 basis points). A short equity swap contract obligates the Fund to pay the counterparty any appreciation and dividends paid on an individual security, while entitling the Fund to receive from the counterparty any depreciation on the security, and to pay to or receive from the counterparty interest on the notional value of the contract at a rate equal to LIBOR less an agreed upon spread (generally between 25 to 100 basis points).
The Fund may also enter into equity swap contracts whose value may be determined by the spread between a long equity position and a short equity position. This type of swap contract obligates the Fund to pay the counterparty an amount tied to any increase in the spread between the two securities over the term of the contract. The Fund is also obligated to pay the counterparty any dividends paid on the short equity holding as
The Merger Fund VL
NOTES TO THE FINANCIAL STATEMENTS (continued)
December 31, 2014
Note 2 — SIGNIFICANT ACCOUNTING POLICIES (continued)
well as any net financing costs. This type of swap contract entitles the Fund to receive from the counterparty any gains based on a decrease in the spread as well as any dividends paid on the long equity holding and any net interest income.
Fluctuations in the value of an open contract are recorded daily as a net unrealized gain or loss. The Fund will realize a gain or loss upon termination or reset of the contract. Either party, under certain conditions, may terminate the contract prior to the contract’s expiration date. Equity swap contracts are typically valued based on market quotations or pricing service evaluations for the underlying reference asset. The Valuation Group monitors the credit quality of the Fund’s counterparties and may adjust the valuation of a swap in the Valuation Group’s discretion due to, among other things, changes in a counterparty’s credit quality.
Credit risk may arise as a result of the failure of the counterparty to comply with the terms of the contract. Refer to Note 2 O. for further countryparty risk disclosure. Additionally, risk may arise from unanticipated movements in interest rates or in the value of the underlying securities. These contracts may involve market risk in excess of the amount of receivable or payable reflected on the Statement of Assets and Liabilities. Refer to Note 2 Q. for further derivative disclosures.
I.Distributions to Shareholders
Dividends from net investment income and net realized capital gains, if any, are declared and paid at least annually. Income and capital gain distributions are determined in accordance with income tax regulations which may differ from GAAP. These differences are due primarily to wash sale-loss deferrals, constructive sales, straddle-loss deferrals, adjustments on swap contracts, and unrealized gains or losses on Section 1256 contracts, which were realized, for tax purposes, at December 31, 2014. Accordingly, reclassifications are made within the net asset account for such amounts, as well as amounts related to permanent differences in the character of certain income and expense items for income tax and financial reporting purposes. At December 31, 2014, the Fund increased accumulated undistributed net investment income by $101,485, reduced accumulated undistributed net gain by $101,483, and decreased paid-in-capital by $2.
J.Foreign Securities
Investing in securities of foreign companies and foreign governments involves special risks and considerations not typically associated with investing in U.S. companies and the U.S. government. These risks include
The Merger Fund VL
NOTES TO THE FINANCIAL STATEMENTS (continued)
December 31, 2014
Note 2 — SIGNIFICANT ACCOUNTING POLICIES (continued)
revaluation of currencies and adverse political and economic developments. Moreover, securities of many foreign companies and their markets may be less liquid and their prices more volatile than those of securities of comparable U.S. companies and the U.S. government.
K.Foreign Currency Translations
The books and records of the Fund are maintained in U.S. dollars. Foreign currency transactions are translated into U.S. dollars on the following basis: (i) market value of investment securities, assets and liabilities at the daily rates of exchange, and (ii) purchases and sales of investment securities, dividend and interest income and certain expenses at the rates of exchange prevailing on the respective dates of such transactions. For financial reporting purposes, the Fund does not isolate changes in the exchange rate of investment securities from the fluctuations arising from changes in the market prices of securities. However, for federal income tax purposes, the Fund does isolate and treat as ordinary income the effect of changes in foreign exchange rates on realized gain or loss from the sale of investment securities and payables and receivables arising from trade-date and settlement-date differences. Foreign currency held as cash by the Fund’s custodian is reported separately on the Statement of Assets and Liabilities and on the Statement of Operations.
L.Cash and Cash Equivalents
The Fund considers highly liquid temporary cash investments purchased with an original maturity of less than three months to be cash equivalents. Cash equivalents are included in short-term investments on the Schedule of Investments as well as in investments on the Statement of Assets and Liabilities. Temporary cash overdrafts are reported as payable to custodian.
M.Guarantees and Indemnifications
In the normal course of business, the Fund enters into contracts with service providers that contain general indemnification clauses. The Fund’s maximum exposure under these arrangements is unknown, as this would involve future claims that may be made against the Fund that have not yet occurred. The Fund has not historically incurred material expenses in respect of those provisions.
N.Other
Transactions are recorded for financial statement purposes on the trade date. Realized gains and losses from security transactions are recorded on the identified cost basis. Dividend income and distributions to shareholders are recorded on the ex-dividend date. Interest is
The Merger Fund VL
NOTES TO THE FINANCIAL STATEMENTS (continued)
December 31, 2014
Note 2 — SIGNIFICANT ACCOUNTING POLICIES (continued)
accounted for on the accrual basis and includes amortization of premiums and discounts on the effective interest method. Expenses include $26,630 of borrowing expense on securities sold short.
O.Counterparty Risk
The Fund helps manage counterparty credit risk by entering into agreements only with counterparties the Adviser believes have the financial resources to honor their obligations. The Adviser considers the creditworthiness of each counterparty to a contract in evaluating potential credit risk. The counterparty risk for forward currency exchange contracts to the Fund includes the amount of any net unrealized gain on the contract. The counterparty risk for equity swap contracts to the Fund includes the risk of loss of the full amount of any net unrealized gain on the contract, along with dividends receivable on long equity contracts and interest receivable on short equity contracts.
P.The Right to Offset
Financial assets and liabilities as well as cash collateral received by the counterparties and posted are offset by the counterparty, and the net amount is reported in the Statement of Assets and Liabilities when the Fund believes there exists a legally enforceable right to offset the recognized amounts.
Q.Derivatives
The Fund may utilize derivative instruments such as options, swaps, futures, forward contracts and other instruments with similar characteristics to the extent that they are consistent with the Fund’s investment objectives and limitations. The use of these instruments may involve additional investment risks, including the possibility of illiquid markets or imperfect correlation between the value of the instruments and the underlying securities.
The Fund has adopted authoritative standards regarding disclosure about derivatives and hedging activities and how they affect the Fund’s Statement of Assets and Liabilities and Statement of Operations. For the year ended December 31, 2014: long option contracts (9,849 contracts) were purchased and $1,374,402 in premiums were paid, written option contracts (17,962 contracts) were opened and $3,649,353 in premiums were received, equity swap contracts were opened with a notional value of $7,767,502 and closed with a notional value of $3,930,892 and an average of 13 forward currency exchange contract positions were open during the year.
The Merger Fund VL
NOTES TO THE FINANCIAL STATEMENTS (continued)
December 31, 2014
Note 2 — SIGNIFICANT ACCOUNTING POLICIES (continued)
Statement of Assets and Liabilities
Fair values of derivative instruments as of December 31, 2014:
| | Asset Derivatives |
| | Statement of Assets | | |
| Derivatives | and Liabilities Location | | Fair Value |
| Equity Contracts: | | | |
| Purchased Put Option Contracts | Investments | | $140,537 |
| Swap Contracts | Receivables | | 43,695 |
| Foreign Exchange Contracts: | | | |
| Forward Currency Exchange Contracts | Receivables | | 81,482 |
| Total | | | $ 65,714 |
| | Liability Derivatives |
| | Statement of Assets | | |
| Derivatives | and Liabilities Location | | Fair Value |
| Equity Contracts: | | | |
| Written Call Option Contracts | Written Option Contracts | | $440,732 |
| Swap Contracts | Payables | | 46,722 |
| Foreign Exchange Contracts: | | | |
| Forward Currency Exchange Contracts | Payables | | 10,210 |
| Total | | | $497,664 |
Statement of Operations
The effect of derivative instruments on the Statement of Operations for the year ended December 31, 2014:
| Amount of Realized Gain (Loss) on Derivatives | |
| | | | | | | | | Forward | | | | | | | |
| | | Purchased | | | Written | | | Currency | | | | | | | |
| | | Option | | | Option | | | Exchange | | | Swap | | | | |
| Derivatives | | Contracts | | | Contracts | | | Contracts | | | Contracts | | | Total | |
| Equity Contracts | | $ | (635,006 | ) | | $ | 426,538 | | | $ | — | | | $ | 52,977 | | | $ | (155,491 | ) |
| Foreign Exchange | | | | | | | | | | | | | | | | | | | | |
| Contracts | | | — | | | | — | | | | 78,042 | | | | — | | | | 78,042 | |
| Total | | $ | (635,006 | ) | | $ | 426,538 | | | $ | 78,042 | | | $ | 52,977 | | | $ | (77,449 | ) |
| | | | | | | | | | | | | | | | | | | | | |
| Change in Unrealized Appreciation on Derivatives | |
| | | | | | | | | | | Forward | | | | | | | | | |
| | | Purchased | | | Written | | | Currency | | | | | | | | | |
| | | Option | | | Option | | | Exchange | | | Swap | | | | | |
| Derivatives | | Contracts | | | Contracts | | | Contracts | | | Contracts | | | Total | |
| Equity Contracts | | $ | 26,460 | | | $ | 211,677 | | | $ | — | | | $ | 6,634 | | | $ | 244,771 | |
| Foreign Exchange | | | | | | | | | | | | | | | | | | | | |
| Contracts | | | — | | | | — | | | | 108,522 | | | | — | | | | 108,522 | |
| Total | | $ | 26,460 | | | $ | 211,677 | | | $ | 108,522 | | | $ | 6,634 | | | $ | 353,293 | |
The Merger Fund VL
NOTES TO THE FINANCIAL STATEMENTS (continued)
December 31, 2014
Note 3 — AGREEMENTS AND INVESTMENT ADVISER TRANSACTIONS
The Fund’s investment adviser is Westchester Capital Management, LLC pursuant to an investment advisory agreement with the Adviser dated as of January 1, 2011 (the “Advisory Agreement”). Under the terms of the Advisory Agreement, the Adviser is entitled to receive a fee, calculated daily and payable monthly, at the annual rate of 1.25% of the Fund’s average daily net assets. Certain officers of the Fund are also officers of the Adviser. The Advisory Agreement was approved for an initial term of two years and thereafter will remain in effect from year to year provided that such continuance is specifically approved at least annually by the vote of a majority of the Fund’s Trustees who are not interested persons of the Adviser or the Fund or by a vote of a majority of the outstanding voting securities of the Fund. The Adviser has entered into an agreement with the Fund whereby the Adviser has agreed to either reduce all or a portion of its management fee and, if necessary, to bear certain other expenses (to the extent permitted by the Internal Revenue Code of 1986, as amended, but not including brokerage commissions, short dividends, interest expense, taxes, acquired fund fees and expenses or extraordinary expenses) associated with operating the Fund so that the total Annual Fund Operating Expenses do not exceed 1.40% of the Fund’s average daily net assets until December 31, 2015 (the “Expense Waiver and Reimbursement Agreement”). The Expense Waiver and Reimbursement Agreement permits the Adviser to recapture amounts that it waives or absorbs on behalf of the Fund at any time within three years of the end of the fiscal year in which the fee was reduced or waived or the expense was borne provided that doing so would not cause the Fund’s operating expenses for that year, excluding brokerage commissions, short dividends, interest expense, taxes, acquired fund fees and expenses or extraordinary expenses, to exceed 1.40%. The Expense Waiver and Reimbursement Agreement may be terminated at anytime by the Board. For the year ended December 31, 2014, the Adviser waived $229,465 of advisory fees to the Fund.
Reimbursed expenses subject to potential recovery by year of expiration are as follows:
| Year of Expiration | Potential Recovery |
| 12/31/15 | $161,469 |
| 12/31/16 | $216,693 |
| 12/31/17 | $229,465 |
U.S. Bancorp Fund Services, LLC, a subsidiary of U.S. Bancorp, a publicly held bank holding company, serves as transfer agent, administrator, accountant, dividend paying agent and shareholder servicing agent for the Fund. U.S. Bank, N.A. serves as custodian for the Fund.
The Merger Fund VL
NOTES TO THE FINANCIAL STATEMENTS (continued)
December 31, 2014
Note 4 — SHARES OF BENEFICIAL INTEREST
The Board of Trustees has the authority to issue an unlimited amount of shares of beneficial interest without par value.
Changes in shares of beneficial interest were as follows:
| | | Year Ended | | | Year Ended | |
| | | December 31, 2014 | | | December 31, 2013 | |
| | | Shares | | | Amount | | | Shares | | | Amount | |
| Issued | | | 676,452 | | | $ | 7,503,331 | | | | 649,173 | | | $ | 6,925,407 | |
| Issued as reinvestment | | | | | | | | | | | | | | | | |
| of dividends | | | 37,856 | | | | 411,877 | | | | 4,544 | | | | 49,575 | |
| Redeemed | | | (359,004 | ) | | | (3,966,565 | ) | | | (271,890 | ) | | | (2,891,708 | ) |
| Net increase | | | 355,304 | | | $ | 3,948,643 | | | | 381,827 | | | $ | 4,083,274 | |
Note 5 — INVESTMENT TRANSACTIONS
Purchases and sales of securities for the year ended December 31, 2014 (excluding short-term investments, short-term options and short-term positions) aggregated $33,841,990 and $28,858,273, respectively. There were no purchases or sales of U.S. Government securities.
At December 31, 2014, the components of accumulated earnings (losses) on a tax basis were as follows:
| Cost of investments* | | $ | 21,394,132 | |
| Gross unrealized appreciation | | | 1,758,543 | |
| Gross unrealized depreciation | | | (1,424,745 | ) |
| Net unrealized appreciation | | $ | 333,798 | |
| Undistributed ordinary income | | $ | 811,342 | |
| Undistributed long-term capital gain | | | 149,280 | |
| Total distributable earnings | | $ | 960,622 | |
| Other accumulated losses | | | (902,060 | ) |
| Total accumulated gains | | $ | 392,360 | |
| * | Represents cost for federal income tax purposes and differs from the cost for financial reporting purposes due to wash sales and constructive sales. |
The tax components of dividends paid during the fiscal years ended December 31, 2014 and December 31, 2013 were as follows:
| | | 2014 | | | 2013 | |
| Ordinary Income | | $ | 411,877 | | | $ | 49,575 | |
| Long-Term Capital Gains | | | — | | | | — | |
| Total Distributions Paid | | $ | 411,877 | | | $ | 49,575 | |
The Fund designated as long term capital gain dividend, pursuant to Internal Revenue Case Section 852(b)(3), the amount necessary to reduce the earnings and profits of the Fund related to net capital gain to zero for
The Merger Fund VL
NOTES TO THE FINANCIAL STATEMENTS (continued)
December 31, 2014
Note 5 — INVESTMENT TRANSACTIONS (continued)
the tax year ended December 31, 2014. As of December 31, 2014, the Fund did not have a post-October capital loss or a capital loss carryforward.
Note 6 — WRITTEN OPTION CONTRACTS
The premium amount and the number of written option contracts during the year ended December 31, 2014 were as follows:
| | | Number of | | | Premium | |
| | | Contracts | | | Amount | |
| Options outstanding at December 31, 2013 | | | 2,895 | | | $ | 679,643 | |
| Options written | | | 17,962 | | | | 3,649,353 | |
| Options closed | | | (13,097 | ) | | | (2,870,623 | ) |
| Options exercised | | | (2,168 | ) | | | (743,334 | ) |
| Options expired | | | (2,867 | ) | | | (320,710 | ) |
| Options outstanding at December 31, 2014 | | | 2,725 | | | $ | 394,329 | |
Note 7 — OFFSETTING ASSETS AND LIABILITIES
The Fund is subject to various Master Netting Arrangements, which govern the terms of certain transactions with select counterparties. The Master Netting Arrangements allow the Fund to close out and net its total exposure to a counterparty in the event of a default with respect to all the transactions governed under a single agreement with a counterparty. The Master Netting Arrangements also specify collateral posting arrangements at pre-arranged exposure levels. Under the Master Netting Arrangements, collateral is routinely transferred if the total net exposure to certain transactions (net of existing collateral already in place) governed under the relevant Master Netting Arrangement with a counterparty in a given account exceeds a specified threshold depending on the counterparty and the type of Master Netting Arrangement.
The Merger Fund VL
NOTES TO THE FINANCIAL STATEMENTS (continued)
December 31, 2014
Note 7 — OFFSETTING ASSETS AND LIABILITIES (continued)
| | | | | | | | | | | | Gross Amounts not offset | |
| | | | | | | | | | | | in the Statement | |
| | | | | | | | | | | | of Assets and Liabilities | |
| | | | | | Gross | | | Net | | | | | | | | | | |
| | | | | | Amounts | | | Amounts | | | | | | | | | | |
| | | | | | Offset | | | Presented | | | | | | | | | | |
| | | Gross | | | in the | | | in the | | | | | | | | | | |
| | | Amounts of | | | Statement | | | Statement | | | | | | | | | | |
| | | Recognized | | | of Assets | | | of Assets | | | | | | Collateral | | | | |
| | | Assets/ | | | and | | | and | | | Financial | | | Received/ | | | Net | |
| | | Liabilities | | | Liabilities | | | Liabilities | | | Instruments | | | Pledged | | | Amount | |
| Assets: | | | | | | | | | | | | | | | | | | |
| Description | | | | | | | | | | | | | | | | | | |
| Forward | | | | | | | | | | | | | | | | | | |
| Currency | | | | | | | | | | | | | | | | | | |
| Exchange | | | | | | | | | | | | | | | | | | |
| Contracts | | $ | 81,482 | | | $ | — | | | $ | 81,482 | | | $ | 10,210 | | | $ | — | | | $ | 71,272 | |
| Swap Contracts — | | | | | | | | | | | | | | | | | | | | | | | | |
| JPMorgan | | | | | | | | | | | | | | | | | | | | | | | | |
| Chase & Co. Inc. | | | 43,730 | | | | 43,730 | | | | — | | | | — | | | | — | | | | — | |
| Swap Contracts — | | | | | | | | | | | | | | | | | | | | | | | | |
| Bank of America | | | | | | | | | | | | | | | | | | | | | | | | |
| Merrill Lynch | | | 48,661 | | | | 4,966 | | | | 43,695 | | | | — | | | | — | | | | 43,695 | |
| | | $ | 173,873 | | | $ | 48,696 | | | $ | 125,177 | | | $ | 10,210 | | | $ | — | | | $ | 114,967 | |
| Liabilities: | | | | | | | | | | | | | | | | | | | | | | | | |
| Description | | | | | | | | | | | | | | | | | | | | | | | | |
| Forward | | | | | | | | | | | | | | | | | | | | | | | | |
| Currency | | | | | | | | | | | | | | | | | | | | | | | | |
| Exchange | | | | | | | | | | | | | | | | | | | | | | | | |
| Contracts | | $ | 10,210 | | | $ | — | | | $ | 10,210 | | | $ | 10,210 | | | $ | — | | | $ | — | |
| Swap Contracts — | | | | | | | | | | | | | | | | | | | | | | | | |
| JPMorgan | | | | | | | | | | | | | | | | | | | | | | | | |
| Chase & Co. Inc. | | | 90,452 | | | | 43,730 | | | | 46,722 | | | | — | | | | 46,722 | | | | — | |
| Swap Contracts — | | | | | | | | | | | | | | | | | | | | | | | | |
| Bank of America | | | | | | | | | | | | | | | | | | | | | | | | |
| Merrill Lynch | | | 4,966 | | | | 4,966 | | | | — | | | | — | | | | — | | | | — | |
| Written Option | | | | | | | | | | | | | | | | | | | | | | | | |
| Contracts | | | 440,732 | | | | — | | | | 440,732 | | | | — | | | | 440,732 | | | | — | |
| | | $ | 546,360 | | | $ | 48,696 | | | $ | 497,664 | | | $ | 10,210 | | | $ | 487,454 | | | $ | — | |
REPORT OF INDEPENDENT REGISTERED PUBLIC ACCOUNTING FIRM
To the Board of Trustees and Shareholders of
The Merger Fund VL:
In our opinion, the accompanying statements of assets and liabilities, including the schedule of investments, schedule of securities sold short, schedule of options written, schedule of forward currency exchange contracts, schedule of swap contracts, and the related statements of operations and of changes in net assets and the financial highlights present fairly, in all material respects, the financial position of The Merger Fund VL (hereafter referred to as the “Fund”) at December 31, 2014, its operations for the year then ended, the changes in its net assets for each of the two years in the period then ended and the financial highlights for each of the periods presented, in conformity with accounting principles generally accepted in the United States of America. These financial statements and financial highlights (hereafter referred to as “financial statements”) are the responsibility of the Fund’s management; our responsibility is to express an opinion on these financial statements based on our audit. We conducted our audit of these financial statements in accordance with the standards of the Public Company Accounting Oversight Board (United States). Those standards require that we plan and perform the audit to obtain reasonable assurance about whether the financial statements are free of material misstatement. An audit includes examining, on a test basis, evidence supporting the amounts and disclosures in the financial statements, assessing the accounting principles used and significant estimates made by management, and evaluating the overall financial statement presentation. We believe that our audit, which included confirmation of securities at December 31, 2014 by correspondence with the custodian and brokers, provide a reasonable basis for our opinion.

Milwaukee, Wisconsin
February 27, 2015
The Merger Fund VL
BOARD APPROVAL OF INVESTMENT ADVISORY AGREEMENTS
Each year, the Board of Trustees of each of The Merger Fund and The Merger Fund VL (together, the “Board”), including a majority of the Trustees who are not interested persons of The Merger Fund and The Merger Fund VL (together, the “Independent Trustees”), is required to determine whether to continue The Merger Fund’s and The Merger Fund VL’s advisory agreements. In October 2014, the Board and the Independent Trustees approved the continuation of The Merger Fund’s and The Merger Fund VL’s (the “Funds”) advisory arrangements with Westchester Capital Management LLC (the “Adviser”) (collectively, the “Agreements”) for an additional one-year period. A summary of the material factors and conclusions that formed the basis for the approval by the Board and the Independent Trustees are discussed below.
Review Process
The Investment Company Act of 1940, as amended, requires that the Board request and evaluate, and that the Adviser furnish, such information as may reasonably be necessary to evaluate the terms of the Funds’ Agreements. The Independent Trustees began their formal review process in the fall of 2014 by requesting from the Adviser a wide range of information they believed necessary to evaluate the terms of the Funds’ Agreements. Later in their review process and based on the Adviser’s initial response, the Independent Trustees made a supplemental request for additional information they believed would be helpful to them in evaluating whether to approve the renewal the Agreements.
Throughout the review process, the Independent Trustees were advised by their independent counsel. The Independent Trustees also discussed the continuation of the Agreements in a private session with their independent counsel.
The Independent Trustees and Board, in approving the continuation of the Agreements, did not identify any particular information that was all-important or controlling, and each Trustee attributed different weights to the various factors. The Trustees evaluated all information available to them on a fund-by-fund basis, and their deliberations were made separately in respect of each Fund. This summary describes the most important, but not all, of the factors considered by the Board and the Independent Trustees.
Materials Reviewed
During the course of each year, the Board receives a wide variety of materials relating to the services provided by the Adviser and the Funds’ other service providers, including reports on: each Fund’s investment results; portfolio construction; portfolio composition; portfolio trading
The Merger Fund VL
BOARD APPROVAL OF INVESTMENT ADVISORY AGREEMENTS
(continued)
practices; shareholder services; and other information relating to the nature, extent and quality of services provided by the Adviser to the Funds. In addition, in connection with its annual consideration of the Agreements, the Board requested and reviewed supplementary information regarding the terms of the Agreements, the Funds’ investment results, advisory fee and total expense comparisons, financial and profitability information regarding the Adviser and its affiliates, descriptions of various functions undertaken by the Adviser, such as compliance monitoring, and information about the personnel providing investment management services to the Funds. The Board also requested and evaluated performance and expense information for other investment companies that was compiled by Morningstar. The Board and the Independent Trustees also considered information regarding so-called “fall-out” benefits to the Adviser and its affiliates due to the Adviser’s relationships with the Funds.
Nature, Extent and Quality of Services
Nature and Extent of Services – In considering the continuation of the Agreements for an additional year, the Board and the Independent Trustees evaluated the nature and extent of the services provided by the Adviser. The Board and the Independent Trustees considered information concerning the investment philosophy and investment process used by the Adviser in managing the Funds. In this context, the Board and the Independent Trustees considered the in-house research capabilities of the Adviser as well as other resources available to the Adviser, including research services available to the Adviser as a result of securities transactions effected for the Funds and other investment advisory clients of the Adviser. The Trustees considered the scope and quality of services provided by the Adviser under the Agreements, and noted that the services required to be provided had expanded over time as a result of regulatory and other developments. The Board and the Independent Trustees also considered the managerial and financial resources available to the Adviser.
Quality of Services – The Board and the Independent Trustees considered the quality of the services provided by the Adviser and the quality of the resources of the Adviser available to the Funds. The Board and the Independent Trustees considered the specialized experience, expertise and professional qualifications of the personnel of the Adviser, including that the Adviser had a uniquely long track record managing a merger arbitrage strategy within the context of a registered mutual fund. The Board and the Independent Trustees considered the complexity of
The Merger Fund VL
BOARD APPROVAL OF INVESTMENT ADVISORY AGREEMENTS
(continued)
managing the Funds’ strategy relative to other types of funds. The Board and the Independent Trustees also received and reviewed information regarding the quality of non-investment advisory services provided to the Funds by the Adviser, including certain compliance services. The Board and the Independent Trustees considered that the scope of the services provided to the Funds by the Adviser were consistent with the Funds’ operational requirements.
In their evaluation of the quality of the services provided by the Adviser, the Board and the Independent Trustees considered the performance of the Funds. The Board and the Independent Trustees considered whether the Funds operated within their investment objectives and their record of compliance with their investment restrictions. The Board and the Independent Trustees reviewed information comparing the Funds’ historical performance to relevant market indices and to performance information for other investment companies with similar investment objectives over the 1-, 3-, 5- and 10-year periods (if the Funds were in existence) ended June 30, 2014. At the request of the Independent Trustees, Morningstar also provided for the Board’s October 2014 meeting, updated performance information for the Funds as of September 30, 2014. The Board and the Independent Trustees concluded, within the context of their overall conclusions regarding each of the Agreements, that the Funds’ performance records and the Adviser’s process used in managing the Funds supported the renewal of the Agreements.
The Board and the Independent Trustees concluded, within the context of their overall conclusions regarding each of the Agreements, that they were satisfied with the nature, extent and quality of the services provided by the Adviser.
Management Fees and Expenses
The Board and the Independent Trustees reviewed information, including comparative information provided by Morningstar, regarding the advisory fees paid to the Adviser and the total expenses borne by the Funds. They considered the Funds’ advisory fees relative to their peer groups. The Board and the Independent Trustees also considered the fees that the Adviser and its affiliates charge other clients with investment objectives similar to the Funds. The Board and the Independent Trustees considered information provided by the Adviser describing the differences in services provided to these other clients, which noted that, among other things, typically more services were provided to the Funds than those other clients. The Board and the Independent Trustees concluded, within
The Merger Fund VL
BOARD APPROVAL OF INVESTMENT ADVISORY AGREEMENTS
(continued)
the context of their overall conclusions regarding each of the Agreements, that the fees to be charged under the Agreements represent reasonable compensation to the Adviser in light of the services provided.
Profitability and Possible Economies of Scale
Profitability – The Board and the Independent Trustees reviewed information regarding the cost of services provided by the Adviser and the profitability (before distribution expenses and prior to taxes) of the Adviser’s relationship with the Funds. In evaluating the Adviser’s reported profitability, the Independent Trustees considered that certain of the information provided by the Adviser was necessarily estimated and that preparing the related profitability information involved certain assumptions and allocations that were imprecise. The Board and the Independent Trustees recognized that the probative value of profitability information may be limited because a wide range of comparative information often is not generally available and it can be affected by numerous factors, including the structure of the particular adviser, the types of funds it manages, its business mix, the efficiency of an adviser’s operations, numerous assumptions about allocations and the adviser’s cost of capital. In addition, the Board and the Independent Trustees considered information regarding the direct and indirect benefits the Adviser receives as a result of its relationship with the Funds, including research purchased with soft dollar credits earned from portfolio transactions effected on behalf of the Funds (soft dollar arrangements), and reputational benefits.
Economies of Scale – The Board and the Independent Trustees reviewed the extent to which the Adviser may realize economies of scale in managing the Funds. The Board and the Independent Trustees concluded, within the context of their overall conclusions regarding each of the Agreements, that the Adviser’s level of profitability from its relationship with each Fund was reasonable and not excessive in light of, among other things, the positive relative performance of the Funds and the Adviser’s significant expertise and experience managing a merger-arbitrage related strategy. The Trustees also considered that the Adviser proposed to continue, also for an additional one-year period, to apply waivers to TMF’s advisory fee that generally had the effect of breakpoints in the Adviser’s advisory fee as well as to continue the expense limitation agreement applicable to VL. The Independent Trustees concluded that those measures were reasonably designed to result in the sharing of economies of scale realized by the Adviser, if any, with the Funds and their shareholders.
The Merger Fund VL
BOARD APPROVAL OF INVESTMENT ADVISORY AGREEMENTS
(continued)
Conclusions
Based on their review, including their consideration of each of the factors referred to above, the Board and the Independent Trustees concluded that the terms of the Agreements, including the fees payable to the Adviser, are fair and reasonable to the Funds and their shareholders given the scope and quality of the services provided to the Funds and such other considerations as the Independent Trustees considered relevant in the exercise of their reasonable business judgment and that the continuation of the Agreements was in the best interests of the Funds and their shareholders. Accordingly, the Board and Independent Trustees unanimously approved the continuation of the Agreements.
INFORMATION ABOUT TRUSTEES AND OFFICERS
The business and affairs of the Fund are managed under the direction of the Fund’s Board of Trustees. Information pertaining to the Fund’s Trustees and Officers is set forth below. The Statement of Additional Information includes additional information about the Fund’s Trustees and Officers and is available, without charge, upon request by calling 1-800-343-8959.
| | | | | # of | Other |
| | | Term of | | Portfolios | Directorships |
| | | Office | | in Fund | Held by |
| | | and | Principal | Complex | Trustee |
| Name, | Position(s) | Length | Occupation(s) | Overseen | During |
| Address | Held with | of Time | During the | by | the Past |
| and Age | the Fund | Served | Past Five Years | Trustee** | Five Years |
| | | | | | |
| Roy Behren* | Co-President | Indefinite; | Co-Portfolio Manager | 3 | None |
| Westchester Capital | and | since | and Co-President of | | |
| Management, LLC | Treasurer; | 2011; | Westchester Capital | | |
| 100 Summit Lake Drive | Trustee | Indefinite; | Management, LLC, the | | |
| Valhalla, NY 10595 | | since | Fund’s Adviser, since | | |
| Age: 54 | | 2014 | 2011. Co-Portfolio | | |
| | | | Manager of | | |
| | | | Westchester Capital | | |
| | | | Management, Inc., the | | |
| | | | Fund’s previous adviser, | | |
| | | | from 2007 to 2010. | | |
| | | | Research analyst for | | |
| | | | Westchester Capital | | |
| | | | Management, Inc. | | |
| | | | from 1994 until 2010. | | |
| | | | Chief Compliance | | |
| | | | Officer of the Fund and | | |
| | | | Westchester Capital | | |
| | | | Management, Inc. | | |
| | | | from 2004 to 2010. | | |
| | | | | | |
| Michael T. Shannon* | Co-President | Indefinite; | Co-Portfolio Manager | 3 | None |
| Westchester Capital | and | since | and Co-President of | | |
| Management, LLC | Trustee | 2011 | Westchester Capital | | |
| 100 Summit Lake Drive | | | Management, LLC, the | | |
| Valhalla, NY 10595 | | | Fund’s Adviser, since | | |
| Age: 48 | | | 2011. Co-Portfolio | | |
| | | | Manager of | | |
| | | | Westchester Capital | | |
| | | | Management, Inc., the | | |
| | | | Fund’s previous adviser, | | |
| | | | from 2007 to 2010. | | |
| | | | | | |
| Barry Hamerling | Independent | Indefinite; | Managing Partner of | 3 | Trustee of |
| c/o Westchester | Trustee | since | Premium Ice Cream of | | AXA Premier |
| Capital | | 2007 | America since 1995. | | VIP Trust |
| Management, LLC | | | Managing Partner of | | |
| 100 Summit Lake Drive | | | B&J Freeport since | | |
| Valhalla, NY 10595 | | | 1990. Managing Partner | | |
| Age: 68 | | | of Let-US Creations | | |
| | | | from 1999 to 2011. | | |
INFORMATION ABOUT TRUSTEES AND OFFICERS (continued)
| | | | | # of | Other |
| | | Term of | | Portfolios | Directorships |
| | | Office | | in Fund | Held by |
| | | and | Principal | Complex | Trustee |
| Name, | Position(s) | Length | Occupation(s) | Overseen | During |
| Address | Held with | of Time | During the | by | the Past |
| and Age | the Fund | Served | Past Five Years | Trustee** | Five Years |
| | | | | | |
| Richard V. Silver | Independent | Indefinite; | Consultant with AXA | 3 | None |
| c/o Westchester | Trustee | since | Equitable Life | | |
| Capital | | 2013 | Insurance Company | | |
| Management, LLC | | | from May 2012 to April | | |
| 100 Summit Lake Drive | | | 2013. Senior Executive | | |
| Valhalla, NY 10595 | | | Vice President, Chief | | |
| Age: 59 | | | Legal Officer and Chief | | |
| | | | Administrative Officer | | |
| | | | of AXA Equitable Life | | |
| | | | Insurance Company | | |
| | | | from February 2010 to | | |
| | | | April 2012. Executive | | |
| | | | Vice President and | | |
| | | | General Counsel of | | |
| | | | AXA Equitable Life | | |
| | | | Insurance Company | | |
| | | | from September 2001 | | |
| | | | to February 2010. | | |
| | | | | | |
| Christianna Wood | Independent | Indefinite; | Chief Executive Officer | 3 | Director of |
| c/o Westchester | Trustee | since | and President of Gore | | H&R Block |
| Capital | | 2013 | Creek Capital, Ltd. | | Corporation; |
| Management, LLC | | | since August 2009. | | Director of |
| 100 Summit Lake Drive | | | Chief Executive | | International |
| Valhalla, NY 10595 | | | Officer of Capital Z | | Securities |
| Age: 55 | | | Asset Management | | Exchange; |
| | | | from March 2008 to | | Director of |
| | | | July 2009. | | Grange |
| | | | | | Insurance |
| | | | | | |
| Bruce Rubin | Vice | One-year | Chief Operating | N/A | N/A |
| Westchester Capital | President, | terms; | Officer of Westchester | | |
| Management, LLC | Chief | since | Capital Management, | | |
| 100 Summit Lake Drive | Compliance | 2010 | LLC, the Fund’s Adviser. | | |
| Valhalla, NY 10595 | Officer and | | Chief Operating Officer | | |
| Age: 55 | Anti-Money | | of Westchester Capital | | |
| | Laundering | | Management, Inc., the | | |
| | Compliance | | Fund’s previous adviser, | | |
| | Officer | | from March 2010 to | | |
| | | | December 2010. Chief | | |
| | | | Operating Officer of | | |
| | | | Seneca Capital from | | |
| | | | 2005 to 2010. | | |
INFORMATION ABOUT TRUSTEES AND OFFICERS (continued)
| | | | | # of | Other |
| | | Term of | | Portfolios | Directorships |
| | | Office | | in Fund | Held by |
| | | and | Principal | Complex | Trustee |
| Name, | Position(s) | Length | Occupation(s) | Overseen | During |
| Address | Held with | of Time | During the | by | the Past |
| and Age | the Fund | Served | Past Five Years | Trustee** | Five Years |
| | | | | | |
| Abraham R. Cary | Secretary | One-year | Head of Trading of | N/A | N/A |
| Westchester Capital | | terms; | Westchester Capital | | |
| Management, LLC | | since | Management, LLC, the | | |
| 100 Summit Lake Drive | | 2012 | Fund’s Adviser, since | | |
| Valhalla, NY 10595 | | | 2011. Head of Trading | | |
| Age: 39 | | | Westchester Capital | | |
| | | | Management, Inc., the | | |
| | | | Fund’s previous adviser | | |
| | | | from 2002 to 2010. | | |
| * | | Denotes a trustee who is an “interested person” (as that term is defined in Section 2(a)(19) of the Investment Company Act of 1940, as amended) of the Fund or of the Adviser. Mr. Behren and Mr. Shannon are deemed to be interested persons because of their affiliation with the Fund’s investment adviser, Westchester Capital Management, LLC, and because they are officers of the Fund. |
| ** | | The fund complex consists of the Fund, The Merger Fund and WCM Alternatives: Event-Driven Fund. |
ADDITIONAL INFORMATION (Unaudited)
For the fiscal year ended December 31, 2014, certain dividends paid by the Fund may be subject to a maximum tax rate of 15%, as provided for by the Jobs and Growth Tax Relief Reconciliation Act of 2003. The percentage of dividends declared from ordinary income designated as qualified dividend income for the fiscal year ended December 31, 2014 was 0.00% for the Fund.
For corporate shareholders, the percent of ordinary income distributions qualifying for the corporate dividends received deduction for the fiscal year ended December 31, 2014 was 45.53% for the Fund.
The percentage of taxable ordinary income distributions that are designated as short-term capital gain distributions under Internal Revenue Code Section 871(k)(2)(c) for the fiscal year ended December 31, 2014 was 28.65% for the Fund.
The Merger Fund VL
AVAILABILITY OF PROXY VOTING INFORMATION
Information regarding how the Fund generally votes proxies relating to portfolio securities may be obtained without charge by calling the Fund’s Transfer Agent at 1-800-343-8959 or by visiting the SEC’s website at www.sec.gov. Information regarding how the Fund voted proxies during the most recent 12-month period ended June 30 is available on the SEC’s website or by calling the toll-free number listed above.
AVAILABILITY OF QUARTERLY PORTFOLIO SCHEDULE
The Fund files its complete schedule of portfolio holdings with the SEC for the first and third quarters of each fiscal year on Form N-Q. The Fund’s Forms N-Q are available on the SEC’s website at www.sec.gov and may be reviewed and copied at the SEC’s Public Reference Room in Washington, DC. Information on the operation of the Public Reference Room may be obtained by calling 1-800-SEC-0330.
(This Page Intentionally Left Blank.)
Investment Adviser
Westchester Capital Management, LLC
100 Summit Lake Drive
Valhalla, NY 10595
(914) 741-5600
www.westchestercapitalfunds.com
Administrator, Transfer Agent, Accountant,
Dividend Paying Agent and Shareholder Servicing Agent
U.S. Bancorp Fund Services, LLC
615 East Michigan Street
P.O. Box 701
Milwaukee, WI 53201-0701
(800) 343-8959
Custodian
U.S. Bank, N.A.
1555 North Rivercenter Drive, Suite 302
Milwaukee, WI 53212
(800) 343-8959
Trustees
Roy Behren
Michael T. Shannon
Barry Hamerling
Richard V. Silver
Christianna Wood
Executive Officers
Roy Behren, Co-President and Treasurer
Michael T. Shannon, Co-President
Bruce Rubin, Vice President and
Chief Compliance Officer
Abraham R. Cary, Secretary
Counsel
Ropes & Gray LLP
1211 Avenue of the Americas
New York, NY 10036
Independent Registered
Public Accounting Firm
PricewaterhouseCoopers LLP
100 East Wisconsin Avenue
Milwaukee, WI 53202
Item 2. Code of Ethics.
The registrant has adopted a code of ethics that applies to the registrant’s principal executive officer and principal financial officer. The registrant has not granted any waivers from any provisions of the code of ethics during the period covered by this report. A copy of the registrant’s Code of Ethics is filed herewith. You may also receive a copy of the registrant’s Code of Ethics, free of charge, upon request by calling (800) 343-8959.
Item 3. Audit Committee Financial Expert.
The registrant’s board of trustees has determined that there is at least one audit committee financial expert serving on its audit committee. Barry Hamerling and Christianna Wood are the “audit committee financial experts” and are considered to be “independent” as each term is defined in Item 3 of Form N-CSR.
Item 4. Principal Accountant Fees and Services.
The registrant has engaged its principal accountant to perform audit services, audit-related services, tax services and other services during the past two fiscal years. “Audit services” refer to performing an audit of the registrant's annual financial statements or services that are normally provided by the accountant in connection with statutory and regulatory filings or engagements for those fiscal years. “Audit-related services” refer to the assurance and related services by the principal accountant that are reasonably related to the performance of the audit. “Tax services” refer to professional services rendered by the principal accountant for tax compliance, tax advice, and tax planning. The following table details the aggregate fees billed or expected to be billed for each of the last two fiscal years for audit fees, audit-related fees, tax fees and other fees by the principal accountant.
| | FYE 12/31/2014 | FYE 12/31/2013 |
| Audit Fees | $ 42,800 | $ 41,200 |
| Audit-Related Fees | $ - | $ - |
| Tax Fees | $ 5,920 | $ 5,150 |
| All Other Fees | $ - | $ - |
The audit committee has adopted pre-approval policies and procedures that require the audit committee to pre-approve all audit and non-audit services of the registrant, including services provided to any entity affiliated with the registrant.
The percentage of fees billed by PricewaterhouseCoopers LLP applicable to non-audit services pursuant to waiver of pre-approval requirement were as follows:
| | FYE 12/31/2014 | FYE 12/31/2013 |
| Audit-Related Fees | 0% | 0% |
| Tax Fees | 0% | 0% |
| All Other Fees | 0% | 0% |
All of the principal accountant’s hours spent on auditing the registrant’s financial statements were attributed to work performed by full-time permanent employees of the principal accountant.
The following table indicates the non-audit fees billed or expected to be billed by the registrant’s accountant for services to the registrant and to the registrant’s investment adviser (and any other controlling entity, etc.—not including any sub-advisers) for the last two years. The audit committee of the board of trustees has considered whether the provision of non-audit services that were rendered to the registrant's investment adviser is compatible with maintaining the principal accountant's independence and has concluded that the provision of such non-audit services by the accountant has not compromised the accountant’s independence.
| Non-Audit Related Fees | FYE 12/31/2014 | FYE 12/31/2013 |
| Registrant | - | - |
| Registrant’s Investment Adviser | - | - |
Item 5. Audit Committee of Listed Registrants.
Not applicable.
Item 6. Investments.
The registrant’s Schedule of Investments is included as part of the report to shareholders filed under Item 1 of this Form.
Item 7. Disclosure of Proxy Voting Policies and Procedures for Closed-End Management Investment Companies.
Not applicable.
Item 8. Portfolio Managers of Closed-End Management Investment Companies.
Not applicable.
Item 9. Purchases of Equity Securities by Closed-End Management Investment Company and Affiliated Purchasers.
Not applicable.
Item 10. Submission of Matters to a Vote of Security Holders.
There have been no material changes to the procedures by which shareholders may recommend nominees to the registrant’s board of trustees.
Item 11. Controls and Procedures.
| (a) | The registrant’s Co-Presidents/Chief Executive Officers and Treasurer/Chief Financial Officer have reviewed the registrant's disclosure controls and procedures (as defined in Rule 30a-3(c) under the Investment Company Act of 1940, as amended (the “Act”)) as of a date within 90 days of the filing of this report, as required by Rule 30a-3(b) under the Act and Rules 13a-15(b) or 15d-15(b) under the Securities Exchange Act of 1934. Based on their review, such officers have concluded that the disclosure controls and procedures are effective in ensuring that information required to be disclosed in this report is appropriately recorded, processed, summarized and reported and made known to them by others within the registrant and by the registrant’s service provider. |
| (b) | There were no changes in the registrant's internal control over financial reporting (as defined in Rule 30a-3(d) under the Act) that occurred during the second fiscal quarter of the period covered by this report that has materially affected, or is reasonably likely to materially affect, the registrant's internal control over financial reporting. |
Item 12. Exhibits.
(a)(1) Any code of ethics or amendment thereto, that is the subject of the disclosure required by Item 2, to the extent that the registrant intends to satisfy Item 2 requirements through filing an exhibit. Filed herewith.
(a)(2) A separate certification for each principal executive and principal financial officer pursuant to Section 302 of the Sarbanes-Oxley Act of 2002. Filed herewith.
(a)(3) Any written solicitation to purchase securities under Rule 23c-1 under the Act sent or given during the period covered by the report by or on behalf of the registrant to 10 or more persons. Not applicable to open-end investment companies.
(b) Certifications pursuant to Section 906 of the Sarbanes-Oxley Act of 2002. Furnished herewith.
SIGNATURES
Pursuant to the requirements of the Securities Exchange Act of 1934 and the Investment Company Act of 1940, the registrant has duly caused this report to be signed on its behalf by the undersigned, thereunto duly authorized.
(Registrant) The Merger Fund VL
By (Signature and Title)* /s/Michael T. Shannon
Michael T. Shannon, Co-President
Date March 6, 2015
By (Signature and Title)* /s/Roy Behren
Roy Behren, Co-President and Treasurer
Pursuant to the requirements of the Securities Exchange Act of 1934 and the Investment Company Act of 1940, this report has been signed below by the following persons on behalf of the registrant and in the capacities and on the dates indicated.
By (Signature and Title) * /s/Michael T. Shannon
Michael T. Shannon, Co-President
By (Signature and Title)* /s/Roy Behren
Roy Behren, Co-President and Treasurer
* Print the name and title of each signing officer under his or her signature.
