SECURITIES AND EXCHANGE COMMISSION
WASHINGTON, DC 20549
FORM 20-F
(Mark One)
| x | | REGISTRATION STATEMENT PURSUANT TO SECTION 12(b) OR (g) OF THE SECURITIES EXCHANGE ACT OF 1934 |
OR
¨ | | ANNUAL REPORT PURSUANT TO SECTION 13 OR 15(d) OF THE SECURITIES EXCHANGE ACT OF 1934 |
FOR THE FISCAL YEAR ENDED DECEMBER 31, 2001
OR
¨ | | TRANSITION REPORT PURSUANT TO SECTION 13 OR 15(d) OF THE SECURITIES EXCHANGE ACT OF 1934 |
Commission file number: [ ]
WMC RESOURCES LTD
Australian Business Number 76 004 184 598
(Exact name of Registrant as specified in its charter)
COMMONWEALTH OF AUSTRALIA
(Jurisdiction of incorporation or organization)
Level 16,
IBM Centre,
60 City Road,
Southbank,
Victoria 3006, Australia
(Address of principal executive offices)
Securities registered or to be registered pursuant to Section 12(b) of the Act.
Title of each Class
| | Name of each exchange on which registered
|
| Ordinary Shares (1) | | New York Stock Exchange |
| American Depositary Shares (2) | | New York Stock Exchange |
Securities registered or to be registered pursuant to Section 12(g) of the Act.
None
Securities for which there is a reporting obligation pursuant to Section 15(d) of the Act.
None
Indicate the number of outstanding shares of each of the issuer’s classes of capital or common stock as of the close of the period covered by the registration statement.
Shares outstanding :
| | |
| Fully Paid Ordinary Shares: | | 1,136,615,216(3) |
Indicate by check mark whether the registrant (1) has filed all reports required to be filed by Section 13 or 15(d) of the Securities Exchange Act of 1934 during the preceding 12 months (or for such shorter period that the registrant was required to file such reports), and (2) has been subject to such filing requirements for the past 90 days. Yes ¨ No x
Indicate by check mark which financial statement item the registrant has elected to follow. Item 17 ¨ Item 18 x
| (1) | | Not for trading but only in connection with the listing of the American Depositary Shares. |
| (2) | | Evidenced by American Depositary Receipts, each American Depositary Share representing four fully paid Ordinary Shares. |
| (3) | | Number of Ordinary Shares outstanding on a fully diluted basis assuming conversion of options in the demerger. |
| | | Page
|
|
| | 1 |
|
| | 1 |
|
| | 2 |
|
| | 5 |
|
| ITEM 1. | | | | 6 |
|
| ITEM 2. | | | | 8 |
|
| ITEM 3. | | | | 9 |
|
| ITEM 4. | | | | 18 |
|
| ITEM 5. | | | | 64 |
|
| ITEM 6. | | | | 94 |
|
| ITEM 7. | | | | 111 |
|
| ITEM 8. | | | | 116 |
|
| ITEM 9. | | | | 120 |
|
| ITEM 10. | | | | 123 |
|
| ITEM 11. | | | | 141 |
|
| ITEM 12. | | | | 154 |
|
| ITEM 13. | | | | 160 |
|
| ITEM 14. | | | | 160 |
|
| ITEM 15. | | | | 160 |
|
| ITEM 16. | | | | 160 |
|
| ITEM 17. | | | | 161 |
|
| ITEM 18. | | | | 161 |
|
| ITEM 19. | | | | 162 |
|
| EXHIBIT 1 – CONSTITUTION OF WMC RESOURCES | | 164 |
|
| EXHIBIT 4 – MATERIAL CONTRACTS | | 165 |
|
| EXHIBIT 8 – SIGNIFICANT SUBSIDIARIES | | 166 |
|
| EXHIBIT 10 – OTHER EXHIBITS | | 167 |

On November 21, 2001, WMC Limited announced a proposal to demerge its interest in the Alcoa World Alumina and Chemicals venture from its copper/uranium, nickel and fertilizer businesses and exploration and development interests. The demerger has been effected through an Australian court-approved scheme of arrangement and associated capital reduction and dividend distribution. As a result of the demerger, WMC Limited continues to hold its interest in AWAC, but has changed its name to Alumina Limited, and WMC Resources holds the nickel, copper/uranium and fertilizer businesses and exploration and development interests previously held within the WMC Limited group.
This registration statement on Form 20-F relates to the registration of WMC Resources shares under Section 12(b) of the Securities Exchange Act of 1934. WMC Resources has been admitted to the official list of the Australian Stock Exchange and its shares have been quoted on the stock market conducted by the Australian Stock Exchange. WMC Resources shares have also been approved for listing on the New York Stock Exchange in the form of American Depositary Receipts.
FORWARD LOOKING STATEMENTS
This registration statement contains forward-looking statements, including statements regarding (i) estimated reserves, (ii) certain plans, strategies and objectives of management, (iii) scheduled closure of certain operations or facilities, (iv) anticipated production or construction commencement dates, (v) expected costs or production output, (vi) the anticipated productive lives of projects and mines, (vii) the anticipated prices and market dynamics of commodities produced and (viii) the expected impact of the demerger of WMC Limited’s interests in the Alcoa World Alumina and Chemicals businesses from its other operating businesses, which are owned by WMC Resources following the demerger. Such forward-looking statements are not guarantees of future performance and involve known and unknown risks, uncertainties and other factors, many of which are beyond the control of WMC Resources, which may cause actual results to differ materially from those expressed in the statements contained in this registration statement.
For example, future revenues from operations, projects or mines described in this registration statement will be based in part on the market price of the minerals or metals produced, which may vary significantly from current levels. Such variations, if materially adverse, may impact the timing or feasibility of the development of a particular project or the expansion of certain facilities or mines. Other factors that may affect the actual construction or production commencement dates, costs or production output and anticipated lives of operations, mines or facilities include:
| | • | | the ability to profitably produce and transport the minerals or metals extracted to applicable markets; |
| | • | | the impact of foreign currency exchange rates on the market prices of the minerals or metals produced; |
| | • | | activities of governmental authorities in certain countries where such projects, facilities or mines are being explored or developed, including increases in taxes, changes in environmental and other regulations, and political uncertainty; and |
| | • | | the ability of WMC Resources to operate as an independent company following the demerger. |
WMC Resources can give no assurances that the estimated reserve figures, the scheduled closure of such operations or facilities, actual production or commencement dates, cost or production output, or anticipated lives of the projects, mines and facilities and its expected operating and financial performance following the demerger discussed herein will not differ materially from the statements contained in this registration statement.
The historical financial information may not be indicative of WMC Resources’ future performance and does not reflect what WMC Resources’ financial position and results of operations would have been had it operated as a separate, stand-alone entity during the periods presented.
-1-
“ADR” means an American Depositary Receipt evidencing one or more ADSs.
“ADS” means an American Depositary Share.
“ASX” means the Australian Stock Exchange.
“AWAC” means Alcoa World Alumina and Chemicals.
“Cash Flow Hedge” means a contract which hedges an exposure to changes in cash flows from an expected future transaction related to a forecast purchase or sale or an existing asset or liability.
“Commissioned” means the bringing into operation of plant and/or equipment at a rate approximating its design capacity.
“Combined” means the 100% combination of entities controlled by WMC Resources. Unincorporated joint ventures are consolidated on a proportionate basis.
“Counterparty Credit Risk” means the risk of financial loss arising out of holding a particular contract or portfolio of contracts as a result of one or more parties to the relevant contract(s) failing to fulfil its financial obligations under the contract.
“Cross-Currency Swap” means the exchange of cash flows in one currency for those in another, often requiring an exchange of principal.
“Currency Forward” means an agreement to exchange a specified amount of one currency for another at a future date at a certain rate.
“Decline” means a downwards sloping tunnel providing road access from the surface to underground mine operations.
“Demerger” means the demerger of WMC Limited’s interest in AWAC from its other operating businesses pursuant to an Australian scheme of arrangement and associated capital reduction and dividend distribution.
“Depositary” means The Bank of New York Company, Inc., 101 Barclay Street New York NY 10286.
“Derivative” means an instrument or product whose value changes with changes in one or more underlying market variables, such as equity or commodity prices, interest rates or foreign exchange rates. Basic derivatives include, forwards, futures, swaps, options, warrants and convertible bonds.
“Dilution” means the incorporation of waste rock with the ore during the mining process resulting in lower grade.
“Fair Value” means the current market value (mark-to-market) of financial positions.
“Fair Value Hedge” means a contract which hedges an exposure to the change in fair value of a recognized asset, liability or an unrecognized firm commitment (or a part thereof) attributable to a particular risk.
“Foreign Currency Hedge” means a contract which hedges the foreign exchange exposure of:
| | • | | an unrecognized firm commitment (fair value hedge); |
| | • | | an available for sale security (fair value hedge); |
-2-
| | • | | a forecast transaction (cash flow hedge); or |
| | • | | a net investment in a foreign operation |
“Grass Roots Exploration” is exploration undertaken at new sites not related to existing operations (also known as “green fields” exploration).
“Hedge” means to reduce risk by making transactions that reduce exposure to market fluctuations. A hedge is also the term for the transactions made to effect this reduction.
“Hedge Accounting” means the practice of deferring accounting recognition of gains and losses on financial market hedges until the corresponding gain or loss of the underlying exposure is recognized.
“HSRA” means the Australian/US dollar Hedge Settlement Rate quoted on Reuters Screen HSRA.
“Indenture” means the agreement between the Government of South Australia and WMC (Olympic Dam Corporation) Pty Ltd, a form of which is filed herewith as Exhibit 4.A.
“Interest Rate Swap” means an agreement to exchange net future cash flows. Interest rate swaps most commonly change the basis on which liabilities are paid on a specified principal. They are also used to transform the interest basis of assets. In its commonest form, the fixed-floating swap, one counterparty pays a fixed rate and the other pays a floating rate based on a reference rate, such as Libor. There is no exchange of principal – the interest rate payments are made on a notional amount.
“LME” means the London Metal Exchange.
“Marking-to-Market” means to calculate the value of a financial instrument (or portfolio of such instruments) based on the current market rates or prices of the underlying.
“Mineral” is a naturally occurring element or chemical compound.
“Mineralization” is a concentration of a valuable mineral or minerals.
“Nickel Matte” is the output of a nickel smelter, being predominantly nickel sulphides plus some impurities. This is typically fed to a refinery for nickel metal production. Matte can be sold as a commercial product in its own right.
“NYSE” means the New York Stock Exchange.
“Open-cut” or “Open-pit” means a mine at the earth’s surface as distinct from an underground mine.
“Option” means a contract that gives the purchaser the right, but not the obligation, to buy or sell an underlying security or instrument at a certain price (the exercise, or strike price) on or before an agreed date (the exercise period). For this right, the purchaser pays a premium to the seller. The seller (writer) of an option has a duty to buy or sell at the strike price, should the purchaser exercise his right.
“Ore” means a naturally occurring solid resource (often rock) from which a mineral or minerals can be economically extracted.
“Ore Reserve” means that part of a mineral deposit which could be economically mined and legally extracted or produced at the time of the reserve determination. Ore reserve estimates in this registration statement include adjustments for dilution and mine recovery loss during the mining process but do not include adjustments for
-3-
metallurgical recovery. These ore reserves comply with those prescribed by the United States Securities and Exchange Commission’s Industry Guide 7.
“Proven Ore Reserves” means reserves for which (a) the quantity is computed from dimensions revealed in outcrops, trenches, workings or drill holes; the grade and/or quality are computed from the results of detailed sampling and (b) the sites for inspection, sampling and measurement are spaced so closely and the geologic character is so well defined that size, shape, depth and mineral content of reserves are well-established.
“Probable Ore Reserves” means reserves for which quantity and grade and/or quality are computed from information similar to that used for proven ore reserves, but the sites for inspection, sampling and measurement are farther apart or are otherwise less adequately spaced. The degree of assurance, although lower than that for proven ore reserves, is high enough to assume continuity between points of observation.
“SCH” means a transfer of securities on the Clearing House Electronic Subregister System operated by ASX Settlement and Transfer Corporation Pty Ltd.
“Stoping” means the extraction of ore in an underground mine, leaving behind a void.
“Sulphides” means a compound of metal elements and sulphur.
“Tailings” are the residue remaining after extraction of the valuable components from ore.
“WA Mining Act 1978” refers to legislation passed by the Government of the State of Western Australia with which all mining operations in that State must comply.
“WMC Resources” means WMC Resources Ltd, the registrant. Unless indicated otherwise, references to WMC Resources prior to the effective date of the demerger are to the assets and businesses of WMC Limited that WMC Resources owned immediately upon effectiveness of the demerger.
-4-
| 1 troy ounce | | = | | 31.103 grams |
|
| 1 kilogram | | = | | 32.15 troy ounces |
|
| 1 kilogram | | = | | 2.205 pounds |
|
| 1 tonne | | = | | 1,000 kilograms |
|
| 1 tonne | | = | | 2,205 pounds |
|
| 1 gram per tonne | | = | | 0.0292 troy ounces per (short) ton |
|
| 1 kilometer | | = | | 0.6214 miles |
Gold recovered is reported in troy ounces (expressed as “ounces” in this registration statement), the customary market unit, whereas ore production and grades are quoted in metric units, that is tonnes and grams per tonne.
-5-
| | IDENTITY OF DIRECTORS, SENIOR MANAGEMENT AND ADVISERS |
ITEM 1. IDENTITY OF DIRECTORS, SENIOR MANAGEMENT AND ADVISERS
A. Directors | | and Senior Management |
Directors
Name
| | Position
|
| Hugh M. Morgan | | Chief Executive Officer and Executive Director |
|
| Andrew G. Michelmore | | Chief Executive Officer Elect and Executive Director |
|
| Ian G.R. Burgess | | Non-Executive Chairman |
|
| Tommie C.-E. Bergman | | Non-Executive Director |
|
| Adrienne E. Clarke | | Non-Executive Director |
|
| Peter J. Knight | | Non-Executive Director |
|
| David E. Meiklejohn | | Non-Executive Director |
|
| Roger A. G. Vines | | Non-Executive Director |
|
| Ian E. Webber | | Non-Executive Director |
Senior Management
Name
| | Position
|
| Bruce R. Brook | | Executive General Manager – Finance and Chief Financial Officer |
|
| Alan K. Dundas | | Executive General Manager – Operations |
|
| Andrew G. Michelmore | | Executive General Manager – Business Strategy &
Development (and Chief Executive Officer Elect) |
|
| Greg J. Travers | | Executive General Manager – Group Services |
|
All Directors and senior management have a business address of:
WMC Resources Ltd,
Level 16,
60 City Road,
Southbank, Victoria 3006
AUSTRALIA
-6-
| | IDENTITY OF DIRECTORS, SENIOR MANAGEMENT AND ADVISERS |
B. Advisers
Financial Advisers | | U.S. Legal Advisers | | Australian Legal Advisers |
|
Deutsche Bank AG Level 23 333 Collins Street Melbourne, Victoria 3000 AUSTRALIA | | Sullivan & Cromwell Level 32, 101 Collins Street Melbourne, Victoria 3000 AUSTRALIA | | Arthur Robinson & Hedderwicks Level 27, 530 Collins Street Melbourne, Victoria 3000 AUSTRALIA |
C. Auditors
PricewaterhouseCoopers
Level 14,
333 Collins Street
Melbourne, Victoria 3000
AUSTRALIA
The auditors are subject to the requirements of the Institute of Chartered Accountants in Australia.
-7-
| | OFFER STATISTICS AND EXPECTED TIMETABLE |
ITEM 2. OFFER STATISTICS AND EXPECTED TIMETABLE
A. Offer Statistics
Not applicable.
B. Method and Expected Timetable
Not applicable.
-8-
A. Selected Financial Data
The selected financial data appearing below as at December 31, 2001 and 2000 and for the fiscal years ended December 31, 2001, 2000 and 1999 are set forth in Australian dollars (except as otherwise indicated), and are extracted, in relevant part, from the audited Combined Financial Statements of WMC Resources which appear elsewhere herein. The selected financial data appearing below as at June 30, 2002 and for the six month periods ended June 30, 2002 and 2001 are set forth in Australian dollars (except as otherwise indicated), and are extracted, in relevant part from the unaudited Interim Combined Financial Statements of WMC Resources which appear elsewhere herein. As discussed in Note 1 in the Combined Financial Statements and the unaudited Interim Combined Financial Statements, the financial statements herein reflect the statements of income and comprehensive income and balance sheets of WMC Resources as if it were a separate entity for all periods presented. The historical financial information may not be indicative of WMC Resources’ future performance and does not reflect what WMC Resources’ financial position and results of operations would have been had it operated as a separate, stand-alone entity during the periods presented. These Combined Financial Statements and unaudited Interim Combined Financial Statements have been prepared in accordance with accounting principles generally accepted in Australia (“Australian GAAP”), which differ in certain respects from accounting principles generally accepted in the United States of America (“US GAAP”). Note 44 to the Combined Financial Statements and Note 32 to the unaudited Interim Combined Financial Statements provides an explanation of these differences as they affect WMC Resources and reconciliations from Australian GAAP to US GAAP of net income, comprehensive income, certain balance sheet items, shareholders’ equity and cashflows. The selected financial data appearing below as at December 31, 1999, 1998, and 1997 and for the fiscal years ended December 31, 1998 and 1997 are derived from WMC Resources’ unaudited combined financial data that is not included herein.
WMC Resources’ net income under Australian GAAP was A$46.3 million for the six months ended June 30, 2002 (A$126.0 million for the year ended December 31, 2001) . Under US GAAP, WMC Resources would have reported net income of A$142.5 million for the six months ended June 30, 2002 (A$37.7 million for the year ended December 31, 2001). Comprehensive income under US GAAP for the six months ended June 30, 2002 was a profit of A$366.4 million (for the year ended December 31, 2001 a loss of A$804.7 million was reported) . WMC Resources’ unaudited Interim Combined Financial Statements and the Combined Financial Statements are prepared in accordance with Australian GAAP. The principal differences between Australian GAAP and US GAAP that affect WMC Resources’ net income and comprehensive income, as well as its shareholders’ equity, relate to the treatment of the following items:
| | (i) | | research and development costs; |
| | (ii) | | revenue from insurance proceeds; |
| | (iv) | | exploration expenditure; |
| | (vi) | | recognition of profit on real estate disposal; |
| | (vii) | | deferral of cost of option payments; and |
| | (viii) | | fair value of accounting for derivatives; |
Differences that affect the Combined Statement of Cashflows are that under US GAAP, bank overdrafts are not considered to be part of net cash equivalents, and payments for exploration and research and development would be classified as part of cashflows from operating activities, rather than investing activities.
-9-
The following selected financial data should be read in conjunction with, and is qualified in its entirety by reference to the unaudited Interim Combined Financial Statements and the Combined Financial Statements, including the Notes thereto, and comments following below.
WMC Resources’ financial year end changed from June 30 to December 31 commencing from January 1, 1999. Pursuant to the Australian Corporations Act 2001, WMC Resources had an 18-month transitional accounting period from July 1, 1997 to December 31, 1998. As a result, certain financial information presented in this registration statement reflects this 18-month transitional accounting period.
The following selected financial data should be read in conjunction with, and is qualified in its entirety by reference to those statements, including the notes thereto, and comments following below.
SELECTED FINANCIAL DATA UNDER AUSTRALIAN GAAP
| | | Six Months Ended June 30, 2002
| | Six Months Ended June 30, 2001
| | Year Ended December 31, 2001
| | | Year Ended December 31, 2000
| | Year Ended December 31, 1999
| | | Year Ended December 31, 1998
| | | Six Months Ended December 31, 1997
| | | Year Ended June 30, 1997
| |
| | | (A$ million, except where indicated) | |
| Net Sales Revenue (from Continuing Operations) | | 1,196.3 | | 1,339.1 | | 2,364.1 | | | 2,666.0 | | 1,672.7 | | | 1,315.1 | | | 758.0 | | | 1,688.0 | |
|
| Income / (Loss) from Continuing Operations: | | 12.1 | | 41.5 | | (157.5 | ) | | 327.2 | | (5.7 | ) | | (215.9 | ) | | (35.8 | ) | | (80.7 | ) |
|
| Net Income / (Loss) | | 46.3 | | 116.1 | | 126.0 | | | 399.9 | | 84.1 | | | (48.5 | ) | | 3.7 | | | 110.8 | |
| Comprehensive Income/ (Loss) | | 84.0 | | 91.5 | | 111.9 | | | 380.7 | | 79.8 | | | (86.9 | ) | | 62.9 | | | 134.8 | |
|
Pro forma Net Income / (Loss) from Continuing Operations per Ordinary Share (A$/share) (1) | | 0.01 | | 0.04 | | (0.14 | ) | | 0.29 | | (0.01 | ) | | (0.19 | ) | | (0.03 | ) | | (0.07 | ) |
|
Pro forma Diluted Net Income / (Loss) from Continuing Operations per Ordinary Share (A$/share) (2) | | 0.01 | | 0.04 | | (0.14 | ) | | 0.29 | | (0.01 | ) | | (0.19 | ) | | (0.03 | ) | | (0.06 | ) |
| | | At June 30, 2002
| | At December 31, 2001
| | At December 31, 2000
| | At December 31, 1999
| | At December 31, 1998
| | At December 31, 1997
| | At June 30, 1997
|
| | | (A$ million, except where indicated) |
| Total assets | | 7,461.8 | | 8,242.9 | | 8,597.0 | | 7,275.8 | | 7,374.3 | | 6,008.7 | | 5,257.5 |
| Long-term obligations | | 3,087.8 | | 3,476.3 | | 4,304.2 | | 3,053.1 | | 3,592.6 | | 2,275.6 | | 2,095.4 |
| Net assets | | 3,358.6 | | 3,220.3 | | 3,123.8 | | 3,214.3 | | 3,010.8 | | 2,542.8 | | 2,563.3 |
| | |
| |
| |
| |
| |
| |
| |
|
| Shareholders’ equity | | 3,358.6 | | 3,220.3 | | 3,123.8 | | 3,214.3 | | 3,010.8 | | 2,542.8 | | 2,563.3 |
| | |
| |
| |
| |
| |
| |
| |
|
| | | Millions of shares |
| Number of shares | | 1,112.4 | | 1,108.8 | | 1,098.0 | | 1,149.9 | | 1,143.0 | | 1,139.0 | | 1,132.7 |
| | |
| |
| |
| |
| |
| |
| |
|
(1) | | The number of WMC Resources’ shares used in the pro forma basic net income per share calculation was determined on the basis of the weighted average number of outstanding WMC Limited shares for the periods indicated as in the demerger each WMC Limited shareholder received one share in WMC Resources for each share in WMC Limited it held. Refer also to Note 6 to the unaudited Interim Combined Financial Statements and Notes 1(m) and 6 to the Combined Financial Statements. |
(2) | | The number of WMC Resources’ shares used in the pro forma diluted net income per share calculation was determined on the basis of the weighted average of the number of outstanding WMC Limited shares for the periods indicated, including potential shares from the conversion of partly paid shares and options into shares of WMC Limited. Refer also to Note 6 to the unaudited Interim Combined Financial Statements and Notes 1(m) and 6 to the Combined Financial Statements. |
-10-
SELECTED FINANCIAL DATA UNDER US GAAP
| | | Six Months Ended June 30, 2002
| | Six Months Ended June 30, 2001
| | | Year Ended December 31, 2001
| | | Year Ended December 31, 2000
| | Year Ended December 31, 1999
| | | Year Ended December 31, 1998
| | | Six Months Ended December 31, 1997
| | | Year Ended June 30, 1997
| |
| | | (A$ million, except where indicated) | |
| Net Sales Revenue | | 1,196.3 | | 1,339.1 | | | 2,364.1 | | | 2,666.0 | | 1,672.7 | | | 1,315.1 | | | 758.0 | | | 1,688.0 | |
| Income / (Loss) from Continuing Operations: | | 99.3 | | (75.4 | ) | | (231.5 | ) | | 241.6 | | (22.2 | ) | | (220.8 | ) | | (42.7 | ) | | (99.5 | ) |
| Net Income / (Loss) | | 142.5 | | (0.8 | ) | | 37.7 | | | 307.6 | | 52.1 | | | (60.1 | ) | | (7.3 | ) | | 91.9 | |
| Comprehensive Income/ (Loss) | | 366.4 | | (899.1 | ) | | (804.7 | ) | | 288.4 | | 2.1 | | | (98.5 | ) | | 51.9 | | | 115.9 | |
Pro forma Net Income / (Loss) from Continuing Operations per Ordinary Share (A$/share) ) (1)(2) | | 0.09 | | (0.07 | ) | | (0.21 | ) | | 0.21 | | (0.02 | ) | | (0.19 | ) | | (0.04 | ) | | (0.09 | ) |
Pro forma Diluted Net Income / (Loss) from Continuing Operations per Ordinary Share (A$/share) (3) | | 0.09 | | (0.07 | ) | | (0.21 | ) | | 0.21 | | (0.02 | ) | | (0.19 | ) | | (0.04 | ) | | (0.09 | ) |
| | | At June 30, 2002
| | At December 31, 2001
| | At December 31, 2000
| | At December 31, 1999
| | At December 31, 1998
| | At December 31, 1997
| | At June 30, 1997
|
| | | (A$ million, except where indicated) |
| Total assets | | 6,438.3 | | 6,691.4 | | 8,368.2 | | 7,146.7 | | 7,296.6 | | 5,936.5 | | 5,189.1 |
| Long-term obligations | | 3,087.8 | | 3,476.3 | | 4,304.2 | | 3,053.1 | | 3,592.6 | | 2,275.6 | | 2,095.4 |
| Net assets | | 2,489.1 | | 2,068.8 | | 2,888.9 | | 3,071.7 | | 2,893.7 | | 2,437.4 | | 2,469.1 |
| | |
| |
| |
| |
| |
| |
| |
|
| Shareholders’ equity | | 2,489.1 | | 2,068.8 | | 2,888.9 | | 3,071.7 | | 2,893.7 | | 2,437.4 | | 2,469.1 |
| | |
| |
| |
| |
| |
| |
| |
|
| | | Millions of shares |
| Number of Shares | | 1,112.4 | | 1,108.8 | | 1,098.0 | | 1,149.9 | | 1,143.0 | | 1,139.0 | | 1,132.7 |
| | |
| |
| |
| |
| |
| |
| |
|
(1) | | The number of WMC Resources’ shares used in the pro forma basic net income per share calculation was determined on the basis of the weighted average number of outstanding WMC Limited shares for the periods indicated as in the demerger each WMC Limited shareholder received one share in WMC Resources for each share in WMC Limited it held. Refer also to Note 6 to the unaudited Interim Combined Financial Statements and Notes 1(m) and 6 to the Combined Financial Statements. |
(2) | | In 1999, net loss per share was A$0.04 before the cumulative effect of an accounting change in policy for start-up costs. Refer to Note 44(e) to the Combined Financial Statements. |
(3) | | The number of WMC Resources’ shares used in the pro forma diluted net income per share calculation was determined on the basis of the weighted average number of outstanding WMC Limited shares for the periods indicated, including potential shares from the conversion of partly paid shares and options into shares of WMC Limited. Refer also to Note 6 to the unaudited Interim Combined Financial Statements and Notes 1(m) and 6 to the Combined Financial Statements. |
Exchange Rates
WMC Resources’ has published its combined financial statements in Australian dollars (“A$” or “$”). In this registration statement, references to “US$” are to United States dollars.
-11-
The following table sets forth, for the periods and dates indicated, certain information concerning the rates of exchange of A$1.00 into US$ based on the noon buying rate in New York City for cable transfers in Australian dollars as certified for customs purposes by the Federal Reserve Bank of New York (the “Noon Buying Rate”).
Period
| | At Period End
| | Average Rate(1)
| | High
| | Low
|
| | | (all figures in US$ per A$1.00) |
| Year Ended December 31, 1997 | | 0.6515 | | 0.7385 | | 0.7978 | | 0.6490 |
| Year Ended December 31, 1998 | | 0.6123 | | 0.6300 | | 0.6868 | | 0.5586 |
| Year Ended December 31, 1999 | | 0.6539 | | 0.6444 | | 0.6719 | | 0.6123 |
| Year Ended December 31, 2000 | | 0.5560 | | 0.5757 | | 0.6687 | | 0.5112 |
| Year Ended December 31, 2001 | | 0.5117 | | 0.5129 | | 0.5714 | | 0.4812 |
| Six Months Ended June 30, 2002 | | 0.5628 | | 0.5372 | | 0.5748 | | 0.5060 |
|
| May 2002 | | | | | | 0.5660 | | 0.5365 |
| June 2002 | | | | | | 0.5748 | | 0.5583 |
| July 2002 | | | | | | 0.5688 | | 0.5445 |
| August 2002 | | | | | | 0.5396 | | 0.5280 |
| September 2002 | | | | | | 0.5518 | | 0.5419 |
| October 2002 | | | | | | 0.5585 | | 0.5422 |
(1) | | The average of the exchange rates on the last day of each month during the financial period. |
On November 27, 2002, the Noon Buying Rate was A$1.00 = US$0.5563
-12-
B. Capitalization and Indebtedness
The following tables set out the capitalization of WMC Resources at June 30, 2002, in accordance with US GAAP and Australian GAAP. These capitalization tables show the pro forma effect of the demerger which includes the internal reorganization and court-approved scheme of arrangement through a capital reduction and dividend distribution as if the demerger had occurred on June 30, 2002. As part of the scheme of arrangement, WMC Resources acquired from WMC Limited the shares it holds in the legal entities controlling Queensland Fertilizer Operation and the Olympic Dam mining operations in return for the issue of WMC Resources Ltd shares. Under Australian GAAP, the transfers were accounted for at fair value. Under US GAAP, the transfers will be accounted for at book value. The pro forma adjustments are based upon currently available information and estimates and assumptions. Actual adjustments may differ from the pro forma adjustments shown.
| | | At June 30, 2002
| | At June 30, 2002
| | | At June 30, 2002
|
| | | Actual
| | Adjustment
| | | Pro forma
|
| | | (in A$ millions unaudited) |
Amounts in Accordance with Australian GAAP | | | | | | | |
|
| Short-term debt | | 467.6 | | (267.6 | ) | | 200.0 |
|
| Long-term debt (unsecured) | | 1,633.4 | | (134.2 | ) | | 1,499.2 |
|
Shareholders’ funds(1) | | 3,358.6 | | 165.0 | | | 3,523.6 |
| | |
| |
|
| |
|
|
Total Capitalization (2) | | 5,459.6 | | (236.8 | ) | | 5,222.8 |
| | |
| |
|
| |
|
| | | At June 30, 2002
| | At June 30, 2002
| | | At June 30, 2002
|
| | | Actual
| | Adjustment
| | | Pro forma
|
| | | (in A$ millions unaudited) |
Amounts in Accordance with US GAAP | | | | | | | |
|
| Short-term debt | | 467.6 | | (267.6 | ) | | 200.0 |
|
| Long-term debt (unsecured) | | 1,633.4 | | (134.2 | ) | | 1,499.2 |
|
Shareholders’ equity(1) | | 2,492.0 | | 254.8 | | | 2,746.8 |
| | |
| |
|
| |
|
|
Total Capitalization (2) | | 4,593.0 | | (147.0 | ) | | 4,446.0 |
| | |
| |
|
| |
|
(1) | | Upon demerger this balance will be credited to the share capital account. |
(2) | | Does not include ascertainable, unsecured contingent liabilities of A$51.1 million represented by guarantees, insurance bonds and other liabilities including performance bonds for minimum work commitments in exploration blocks. |
For a discussion of the principal differences between Australian GAAP and US GAAP, and reconciliation to US GAAP net income and shareholders’ equity, see Note 44 to the “Combined Financial Statements of WMC Resources for
-13-
the Fiscal Years Ended December 31, 2001, 2000, and 1999” and Note 32 in the “Combined Financial Statements of WMC Resources for the six month periods ended June 30, 2002 and 2001” included in this registration statement.
C. Reasons for the Offer and Use of Proceeds
Not applicable.
D. Risk Factors
This section describes some of the risks that could affect WMC Resources’ businesses. The factors below should be considered in connection with any forward-looking statements in this registration statement and the cautionary statements on page 1. The risks below are not the only ones WMC Resources faces – some risks may not be known to WMC Resources, and some that are not currently believed to be material could later turn out to be material. One or more or a combination of these risks could materially impact WMC Resources’ businesses, its revenues, operating income, net income, net assets, liquidity and capital resources.
Risks relating to the demerger of WMC Resources from WMC Limited
WMC Resources’ share price performance cannot be predicted and may be more volatile than WMC Limited’s before the demerger.
No public market existed for WMC Resources shares prior to the demerger, and therefore there can be no assurance as to the performance of shares in WMC Resources or that a liquid market will develop for its shares following the demerger. The share prices of WMC Resources will be influenced by a number of factors, some of which may have a negative impact on the share prices. It is possible that the combined market values of WMC Limited and WMC Resources after the demerger will be lower than the market value of WMC Limited prior to the demerger. The market prices of shares in WMC Resources may be volatile following its listing on the ASX.
WMC Resources will have less earnings diversification than WMC Limited had prior to the demerger.
Before the demerger, the earnings of WMC Limited were diversified across the different markets in which it operated. Following the demerger, WMC Resources as a separate company will be exposed only to its respective markets, without the diversification provided by exposure to the markets of the remainder of WMC Limited. The reduced diversification of earnings of WMC Resources means that its earnings volatility, as a stand alone company following the demerger, may be greater than that of WMC Limited before the demerger.
WMC Resources will have less ability to pay and frank dividends than WMC Limited had prior to the demerger.
Prior to the demerger, a high percentage of WMC Limited’s dividends were funded by cashflows from AWAC. Following the demerger, WMC Resources will not have the benefit of those AWAC cashflows which is expected to have a negative impact on its ability to pay dividends to its shareholders. As a consequence, dividend distributions declared by the WMC Resources Board may for some time be relatively modest.
In addition, WMC Resources is not expected to generate sufficient franking credits in the short to medium term to pay fully franked dividends to its shareholders, as it is anticipated that the profits of WMC Resources will largely be sheltered by existing carried-forward tax losses. Franked dividends are those paid out of profits which have borne Australian corporate tax (i.e. to which franking credits have been allocated) while unfranked dividends are paid out of untaxed profits. Generally, franking credits are generated by income tax paid, or franked dividends received, by the company. Shareholders who receive franked dividends are generally entitled to some form of relief from Australian tax in respect of those dividends. Broadly, dividends paid to non Australian resident shareholders will be exempt from Australian dividend withholding tax to the extent the dividends are franked and dividends paid to Australian resident shareholders would entitle those shareholders to an Australian tax offset (and therefore affect the degree to which the dividends are subject to Australian tax) to the extent the dividends are franked. For further information regarding franking credits and
-14-
franked dividends, see Item 10.E “Additional Information – Taxation – Commonwealth of Australia Taxation” at pages 133 to 134.
WMC Resources’ credit rating and access to debt markets are affected by it no longer having access to cash flows from AWAC following the demerger.
WMC Limited currently has a Standard & Poor’s long term credit rating of A (negative watch) and a short term credit rating of A-1. Moody’s Investors Service’s has a long term credit rating for WMC Limited of A3 (negative watch) and its short term credit rating of P-2. The credit ratings used by Standard and Poor’s and Moody’s in Australia are based on the same scale as used in the U.S.
WMC Limited’s cash flows from its interest in AWAC has been taken into account by ratings agencies in assessing WMC Limited’s creditworthiness. It has also been a factor considered by financiers in agreeing to lend funds to WMC Limited for its non-AWAC related projects, which historically have principally been debt funded.
After considering the impact of the demerger on the financial profile of WMC Resources, Standard & Poor’s has indicated that it is likely that WMC Resources will be assigned a long-term credit rating of BBB (stable) and a short-term credit rating of A2 post the demerger. Moody’s has stated that it is likely that WMC Resources will be assigned a long-term credit rating of Baa2 and a short term credit rating of P-2 following the demerger. Both agencies have indicated they expect to assign a credit rating to WMC Resources lower than WMC Limited’s credit rating because WMC Resources will no longer have the benefit of income provided by the AWAC assets or the same diversity of income streams that WMC Limited had.
WMC Resources could be exposed to the risk of reduced access to debt and capital markets if its credit rating were downgraded in the future, to a level below investment grade, or if the debt markets became more restrictive in the terms and conditions available to BBB rated borrowers. In addition, following the demerger, WMC Resources will be reliant on its own cash flows and financing capabilities based on its stand-alone financial position to fund new projects and any such financing may not be on terms WMC Resources considers favourable.
Risks relating to WMC Resources’ business
A reduction in commodity prices could materially reduce WMC Resources’ revenues and profits.
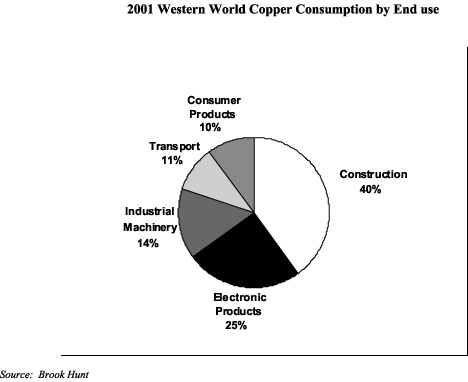
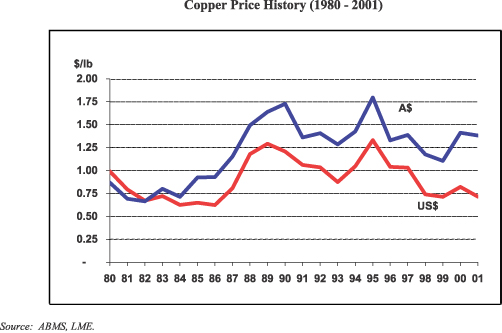
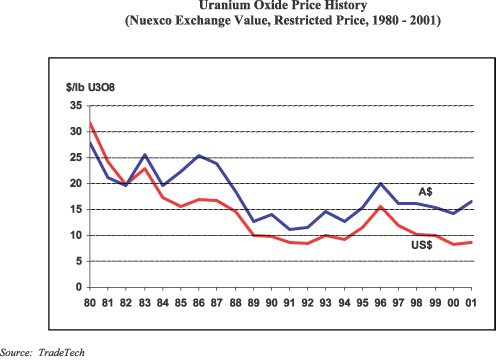
WMC Resources’ revenue is derived from sales of nickel, copper, uranium, gold and fertilizers. The prices obtained for WMC Resources’ products are determined by, or linked to, prices in the world markets which have historically been subject to substantial fluctuations arising from changes in supply and demand and the speculative activities of various market participants. This will have a consequent effect on the prices and revenues received by WMC Resources for its products, including under supply contracts the pricing terms of which track market prices, and its profitability. The general trend in commodity prices has been characterized by an increase from 1999 through the end of 2000, followed by a decline over the course of 2001 into 2002. For further information about historical commodity price movements in the commodities WMC Resources produces, refer to pages 46 (nickel), 52 (copper), 53 (uranium oxide) and 58 (DAP). WMC Resources expects that commodity prices may not rise until economic activity in the markets it serves starts to increase significantly. The general volatility in commodity prices makes it difficult for WMC Resources to predict the extent and duration of any decline or increase in the cyclical commodity prices relating to its products. WMC Resources expects that volatility in prices and in demand for most of its products will continue for the foreseeable future. WMC Resources may enter into hedging transactions with respect to nickel, gold, copper and fertilizer with a view to reducing the potentially adverse effects of commodity price fluctuations. Since 2000, any new hedging activity has been limited to securing acceptable rates of return for new projects. For a statement of current hedging, and movements in the selling price of nickel, gold, fertilizer and copper over the last five years, see Item 11 “Quantitative and Qualitative Disclosure about Market Risk”.
-15-
Fluctuations in foreign exchange could adversely affect WMC Resources’ revenues and profits.
Products exported from Australia by WMC Resources are predominantly sold in US$. In the year ended December 31, 2001, 90% of WMC Resources’ sales revenue was denominated in or linked to US$. However, WMC Resources’ dividend payments and the majority of WMC Resources’ operating costs are denominated in A$. Therefore, in the absence of other changes, if the A$ strengthens in value relative to the value of the US$, WMC Resources’ financial results will be adversely affected. Conversely, a weakening of the A$ relative to the US$ will tend to have a favorable effect on WMC Resources’ financial results. In addition, some of WMC Resources’ liabilities and assets are denominated in US$, particularly much of its borrowings and the majority of the receivables. As at June 30, 2002, WMC Resources had US$818.6 million of debt denominated in US$ and US$ receivables of US$103.5 million. Thus movements in the A$/US$ exchange rate will also affect WMC Resources’ net asset value.
Fluctuations in the A$/US$ exchange rate will also affect the US$ equivalent of the A$ price of WMC Resources’ ordinary shares on the ASX and, as a result, are likely to affect the market price of WMC Resources’ ADSs in the United States. Such fluctuations would also affect the US$ amounts received by holders of ADSs on conversion of cash dividends paid in A$ on the ordinary shares underlying the ADSs. WMC Resources has from time to time sought to hedge its foreign currency exchange position. See Item 11 “Quantitative and Qualitative Disclosure about Market Risk”.
WMC Resources may have fewer ore reserves than our estimates indicate.
WMC Resources’ reserves estimations may change substantially if new information subsequently becomes available. Fluctuations in the price of commodities, variation in production costs or different recovery rates may ultimately result in WMC Resources’ estimated reserves being revised. If such a revision were to indicate a substantial reduction in proven or probable reserves at one or more of its major projects, it could negatively affect WMC Resources’ financial condition and prospects.
An increase in production costs could reduce WMC Resources’ profitability.
Changes in WMC Resources’ costs have a major impact on its profitability. WMC Resources’ main costs are: salaries and wages, energy, transport, materials and amortization and depreciation of property, plant and equipment. In addition, industrial disruptions, work stoppages, refurbishments, installation of new plants, accidents or bad weather at WMC Resources’ operations can result in production losses and delays in delivery of products, which may adversely affect profitability. Some costs are also affected by government imposts and regulations. WMC Resources’ costs depend upon the efficient design and construction of mining and processing facilities and competent operation of those facilities. Changes in costs of mining and processing operations can occur as a result of unforeseen events or changes in reserve estimates.
WMC Resources’ ability to sustain or increase its current level of production in the medium to long term is partly dependent on the development of new projects and expansion of existing operations
WMC Resources’ ability to sustain or increase its current level of production, and therefore its potential revenues and profits, in the medium to long term is partly dependent on the development of new projects and on the expansion of existing operations. Planned development or expansion projects may not result in the entire planned additional production. The economics of any project is based upon, among other factors, estimates of non-reserve mineralization and reserves, recovery rates, production rates, capital and operating costs of these development projects and future commodity prices. The uncertainty and volatility of some or all of these factors contributes to the risks associated with project development and expansion activities. See Item 4 “Information about the Company - Capitalization Expenditure” at page 34.
WMC Resources is exposed to regulatory, legislative and judicial action.
WMC Resources’ operations in each of the jurisdictions in which WMC Resources conducts operations could be affected by government actions, such as controls on imports, exports and prices, variations in taxation laws (including royalties), government directions, guidelines and regulations, particularly in relation to the environment and mine operations, legislation, indigenous people’s rights and court decisions, particularly those that impact on land access and
-16-
freedom to conduct mining operations. Any such government action or court decisions may require increased capital or operating expenditures or both, or could prevent or delay the development of certain operations by WMC Resources. A number of WMC Resources’ exploration and potential projects and activities are in developing countries where these political risk factors may be more acute than in developed countries.
Of particular relevance to the operations of WMC Resources in Australia is the impact of pending judicial decisions and potential legislative action concerning the effect of native title in land held under mining or other leases or waters used in WMC Resources’ operations. This is discussed in detail in Item 8A “Legal Proceedings” at page 116 to 117. WMC Resources is also subject to the requirements of Australian mining law and the conditions of leases granted to it by state or territorial governments. See “Information on the Company – Australian Mining Law and Leases” at pages 60 to 63. Finally, WMC Resources must comply with extensive environmental regulation in Australia and the other countries where it has operations, see Item 4 “Information on the Company – Environmental Matters” at page 60.
Service of process, enforcement of judgments and bringing of original actions in the United States may be more difficult
Since WMC Resources and its officers and directors reside outside the United States and a substantial portion of their assets is located outside the United States, there is a risk that service of process, enforcement of judgments and bringing of original actions will be more difficult.
-17-
| | INFORMATION ON THE COMPANY |
ITEM 4. INFORMATION ON THE COMPANY
A. History and Development of WMC Resources
Background
WMC Resources was incorporated under the laws of the Commonwealth of Australia on March 2, 1933. From 1978 until the demerger, WMC Resources had been operating as a wholly owned subsidiary of WMC Limited, holding principally the group’s nickel assets. Through the transactions to effect the demerger of WMC Limited’s interest in the Alcoa World Alumina and Chemicals (“AWAC”) joint venture with Alcoa, from WMC Limited’s other businesses in conjunction with the demerger approved by WMC Limited’s shareholders on November 29, 2002 and the Australian court on December 2, 2002, WMC Resources will be an independent diversified resources company. WMC Resources’ main businesses consist of the discovery, development, production, processing and marketing of minerals and metals. WMC Resources produces nickel, copper, phosphate fertilizers, uranium oxide, gold and a range of other intermediate products. As at June 30, 2002, WMC Resources had total combined assets of A$7.5 billion. WMC Resources generated net sales revenue from operations of A$1.2 billion in the six months ended June 30, 2002.
WMC Resources has its registered office and principal executive offices at Level 16, 60 City Road, Southbank, Victoria, 3006, Australia. Its telephone number is +61 3 9685 6000 and its facsimile number is +61 3 9685 3569.
The demerger
On November 21, 2001, WMC Limited announced a proposal to demerge its interests in AWAC from its other mineral businesses. The demerger has been effected through an Australian court-approved scheme of arrangement and associated capital reduction and dividend distribution. As a result of the demerger, WMC Limited has continued to hold its interest in AWAC (but changed its name to Alumina Limited) and WMC Resources holds the nickel, copper/uranium and fertilizer businesses and exploration and development interests previously held within the WMC Limited group.
Immediately prior to effecting the demerger, through a series of share sale transactions internal to the WMC Limited group, WMC Resources acquired those of WMC Limited’s subsidiaries which held its copper/uranium and fertilizer businesses and exploration and development interests (other than those relating to AWAC), together with those subsidiaries which provide administrative or financial support to, or otherwise relate to activities conducted by, the WMC Resources group. The subsidiaries shares were transferred to WMC Resources in return for newly issued shares in WMC Resources and, for accounting purposes, at their fair value which was determined by using discounted cash flows in accordance with Australian GAAP. (Under Australian GAAP, fair value is defined as the amount for which an asset could be exchanged, or a liability settled, between knowledgeable, willing parties in an arm’s length transaction. However, in circumstances such as these where the transaction does not take place in an active market, fair value can be determined using alternative estimation techniques such as discounted cash flows.)
The demerger was effected in two simultaneous stages. First, WMC Limited reduced its share capital by a notional cash amount of A$2.78 per share and declared a notional cash dividend of A$0.73 per share. Second, under the scheme of arrangement effected by an order of the Court and binding on all WMC Limited shareholders and WMC Limited, WMC Limited shareholders agreed to purchase all of the shares in WMC Resources utilizing as consideration their capital reduction and dividend entitlements from WMC Limited. WMC Limited shareholders received WMC Resources shares on a pro-rata basis.
The amount of the capital reduction and dividend together represents what WMC Limited’s carrying value in WMC Resources would have been had the internal transfers and other pre-demerger capital transactions occurred on June 30, 2002. This pro forma carrying value amounted to A$3,908 million.
-18-
| | INFORMATION ON THE COMPANY |
To be effected, the demerger required the approval of a majority in number of WMC Limited shareholders present and voting, and holding at least 75% of the total number of WMC Limited shares voted, at the shareholders’ meeting held to consider the demerger. The implementation of the demerger was subject to the approval of the Australian court considering the scheme of arrangement. The approval of the ASX was also required in order to admit WMC Resources to the official list of the ASX.
Following the demerger, WMC Limited has continued to be an operating company with its primary assets comprising the interests in the AWAC joint venture with Alcoa, Inc. that it previously owned. AWAC has interests in bauxite mining, alumina refining, alumina chemicals and two operating aluminium smelters. Coincident with the demerger, WMC Limited changed its name to “Alumina Limited” and has continued its listings on the ASX and the NYSE. As a result, following the demerger, Alumina Limited has continued to be a reporting company under the Securities Exchange Act of 1934.
Rationale for the demerger
Over the two years leading up to October 2001, there was an unprecedented level of consolidation within the global metals and mining industry. In the context of that consolidation, a number of parties made approaches to WMC Limited seeking to discuss the possibility of a merger with WMC Limited or alternative transactions regarding WMC Limited and its businesses. In considering options for WMC Limited’s future, the WMC Limited Board has always been concerned to ensure that WMC Limited Shareholders derive full value from WMC Limited’s assets. In this regard, the WMC Limited Board formed the view that the stock market had not fully valued WMC Limited’s asset portfolio, and that this under-valuation had been partly attributable to the lack of recognition of WMC Limited’s 40% interest in AWAC. Accordingly, one initiative considered by the WMC Limited Board was to separate its interest in AWAC from its other operating businesses. WMC Limited received legal, taxation, accounting and financial advice regarding such a separation over a period commencing prior to October 2001.
In October 2001, Alcoa made a confidential approach to the WMC Limited Board with a conditional proposal to acquire all the outstanding ordinary shares in WMC Limited at a price of A$10.20 per share. A key condition of the proposal was that it be recommended by the WMC Limited Board to the WMC Limited shareholders at that price. The WMC Limited Board carefully evaluated this proposal and obtained independent valuation reports from Grant Samuel & Associates and JP Morgan. Grant Samuel’s report concluded that the value of WMC Limited to a potential acquirer lay in the range of A$11.18 to A$12.91 per share (based on the assumptions made at that time).
At that time, having regard to these valuations and to the considerable interest in the assets of WMC Limited expressed by other major mining companies, the WMC Limited Board determined that, if an offer of A$10.20 per WMC Limited share was to have been made, it would not have been fair and reasonable, particularly since it was substantially below the range determined by its independent experts. For these reasons, the WMC Limited Board could not recommend Alcoa’s proposal. Alcoa remained free to make an offer directly to WMC Shareholders, but chose not to.
The WMC Limited Board was particularly mindful that Alcoa’s primary interest in WMC Limited was WMC Limited’s 40% interest in AWAC. It was anticipated that, if Alcoa acquired WMC Limited, it would most probably seek to on-sell the assets other than WMC Limited’s interest in AWAC, and accordingly any offer it made for WMC Limited as a whole would likely be at less than full value, in order to compensate for any risks associated with holding and divesting these assets. Furthermore, uncertainties existed under the terms of the agreements governing the AWAC joint venture as to whether an acquiror of WMC Limited would be required to contribute its own alumina assets to the AWAC joint venture. These agreements also contain pre-emptive rights with respect to a proposed sale of a party’s interest in AWAC. As a result of these uncertainties, the WMC Limited Board was concerned that there would be insufficient competition from other potentially interested parties if Alcoa were to bid for WMC Limited, potentially resulting in WMC Limited shareholders receiving a price less than full value.
-19-
| | INFORMATION ON THE COMPANY |
The WMC Limited Board was also aware that following Alcoa’s merger with Reynolds Metals Company, international competition authorities had required the sale of Reynolds’ alumina assets and Alcoa’s controlling interest in the AWAC entities had been taken into account by the European competition authority in reaching its decision. The WMC Limited Board believed that these decisions:
| | • | | were likely to have the effect of restricting Alcoa’s ability to acquire any further substantial alumina assets other than WMC Limited’s 40% interest in AWAC; and |
| | • | | were instrumental in Alcoa making its proposal to WMC Limited. |
Therefore, without a significant change in the relevant competition authorities’ view on Alcoa’s ability to acquire third party owned alumina assets, the WMC Limited Board believed that Alcoa would remain interested in acquiring WMC Limited’s 40% share of AWAC.
As a result, the WMC Limited Board recognized that, for WMC Limited to pursue its non-AWAC related activities (including pursuing business opportunities requiring an issue of equity, such as acquisitions or expansions), without concern for what Alcoa may do, it had to separate its interest in AWAC from its non-AWAC businesses and interests.
While the WMC Limited Board considered a number of alternatives to the demerger, the WMC Limited Board determined that, of all the available alternatives, the demerger would be in the best interests of WMC Limited’s shareholders. The WMC Limited Board actively considered other forms of restructuring before announcing the demerger proposal in November 2001. The alternatives the WMC Limited Board considered included:
| | • | | selling WMC Limited’s interest in AWAC to Alcoa or another party; |
| | • | | selling WMC Limited’s nickel, copper-uranium and fertilizer operations as a group or separately; |
| | • | | merging with or being acquired by another party; and |
| | • | | continuing to operate WMC Limited in its current form. |
In order to assess the prospects of each of these alternatives, in October 2001 WMC Limited invited selected major resource companies to undertake due diligence with a view to providing an indication of their interest in WMC Limited’s operations. Following this due diligence process, which was subject to appropriate confidentiality arrangements, and subsequent discussions between WMC Limited and the parties involved, the WMC Limited Board concluded that implementing the demerger proposal was the best way to maximise value for WMC Limited’s shareholders in the medium to long-term.
In reaching its decision to put the demerger proposal to WMC Limited’ shareholders, the WMC Limited Board considered the following material factors in relation to each alternative:
Selling WMC Limited’s interest in AWAC
The assets of the AWAC joint venture are world class and WMC Limited’s share of AWAC has attracted substantial interest from other parties. However, the AWAC agreements provide that each party has a pre-emptive right in the event the other were to sell its interest in AWAC and, although there is no pre-emptive right triggered by a change of control of WMC Limited, or by the demerger proposal, the AWAC Agreements require the AWAC enterprise to be the
-20-
| | INFORMATION ON THE COMPANY |
exclusive vehicle for the bauxite, alumina and industrial chemicals businesses of both WMC Limited and Alcoa. This latter provision may also have affected an acquirer of either WMC Limited or Alcoa.
Although these provisions of the AWAC Agreements are subject to conflicting interpretations, the provisions, and the resulting anti-trust issues that could arise, represented impediments to the sale of WMC Limited’s interest in AWAC to any interested parties which then held significant alumina assets. In these circumstances, the WMC Limited Board believed it would be difficult to conduct a competitive sale process for WMC Limited’s interest in AWAC or achieve a fair price through a sale to Alcoa.
Further, there would be difficulties in distributing the cash proceeds of the sale to WMC Limited’s shareholders in an efficient and timely manner, and the sale of WMC Limited’s share of AWAC to Alcoa or another party could potentially be subject to adverse income tax and stamp duty consequences. Accordingly, the WMC Limited Board believed that this alternative would be unlikely to maximise value for WMC Limited shareholders.
Selling WMC Limited’s nickel, copper-uranium and fertilizer operations
There was strong interest from third parties in WMC Limited’s nickel, copper-uranium and fertilizer operations which has been evidenced by indications of interest made to WMC Limited since the announcement of the demerger proposal on November 21, 2001. The WMC Limited Board believed that the sale of these operations (together or separately) by means of a formal tender process represented a viable alternative to the demerger proposal. However, there was no certainty that this strategy would maximise shareholder value in a medium to long-term context because:
| | • | | selling all of the individual assets may have taken some considerable time and there was a risk that an acceptable price may not be achieved for one or other of the assets; |
| | • | | as part of the WMC Limited ownership structure, WMC Limited in selling the assets could only contemplate cash consideration, not scrip consideration, and this would limit the universe of viable buyers; and |
| | • | | the significant transaction costs which could be incurred in the sales of the individual assets could reduce any value derived from an overall asset sale. |
Further, there would be difficulties in distributing the cash proceeds of the sale to WMC Limited’s shareholders in an efficient and timely manner, and the sale of WMC Limited’s non-AWAC businesses (together or separately) could potentially be subject to adverse income tax and stamp duty consequences.
WMC Limited merging with or being acquired by another party
While there has been a high level of interest in all of WMC Limited’s operations, as discussed above, the structure of WMC Limited was a significant impediment to the ability and motivation of interested parties to make an offer to merge with or acquire the company. In particular, the uncertainties which existed under the terms of the AWAC Agreements as to whether an acquirer of WMC Limited would be required to contribute its own alumina assets to the AWAC joint venture, could act as a deterrent to potential acquirers, as could the pre-emptive rights in the AWAC Agreements. The WMC Limited Board believed it was likely that, for these and other reasons set out above in relation to the sale of WMC Limited’s interest in AWAC, the only party likely to make such an offer for WMC Limited in its current form is Alcoa and that, accordingly, if such an offer were to be made by Alcoa, there would probably not be sufficient competition to maximise value for WMC Limited shareholders.
-21-
| | INFORMATION ON THE COMPANY |
| |
|
Continuing to operate WMC Limited in its then-current form
WMC Limited has had a long and distinguished history as one of Australia’s premier resource companies, and, in different circumstances, the WMC Limited Board would have chosen to continue to operate the company in accordance with its established long-term strategy of growth by exploration, brownfield expansion and acquisition.
However, for the reasons discussed above, the WMC Limited Board concluded that the best interests of WMC Limited shareholders would not be served by continuing to operate WMC Limited in its then-current form.
Summaries of the Valuation Reports and Independent Expert’s Reports
Grant Samuel & Associates Pty Limited
Grant Samuel & Associates Pty Limited was retained by WMC Limited to provide independent valuation advice to the board of Directors of WMC Limited following the approach from Alcoa in October 2001. Grant Samuel was asked to provide an estimate of the full underlying value of WMC Limited at that time. The WMC Limited board subsequently requested Grant Samuel to prepare an independent expert’s report stating whether the demerger is in the best interests of WMC Limited’s shareholders and optionholders and the reasons for that opinion. Grant Samuel received compensation of approximately A$1,040,000 for the valuation report engagement and approximately A$300,000 for the independent expert’s reports on the fairness of the demerger.
Grant Samuel is an Australian-based corporate advisory firm providing services in relation to mergers and acquisitions, capital raisings, corporate restructuring, property and financial matters generally. One of Grant Samuel’s activities is the preparation of corporate and business valuations and the provision of independent advice and expert’s reports in connection with takeovers and capital reconstructions. Grant Samuel has acted as an independent expert in relation to a number of significant transactions in the Australian market. WMC Limited selected Grant Samuel primarily due to its strong reputation and high level of recognition as an independent expert in the Australian investment community.
Fairness of the Demerger
The following is a summary of Grant Samuel’s report regarding the fairness of the demerger to WMC Limited’s shareholders. The summary is qualified by the report itself, dated October 28, 2002, a copy of which is included as Exhibit 10A to this registration statement. Grant Samuel concluded in its report that the demerger is in the best interests of shareholders because, on balance, it believes that the shareholders are likely to be better off if the demerger proceeds than if it does not. Its conclusion is based upon an assessment of the benefits and detriments of the demerger to WMC Limited’s shareholders.
WMC Limited engaged Grant Samuel to provide its independent expert’s opinion to assist its shareholders and optionholders in considering the demerger proposal and to meet the requirements under the Australian law to provide an independent expert’s report that the transaction is “in the best interests” of shareholders. Under Australian requirements, the determination of whether a particular transaction is “in the best interests” of shareholders involves a judgment on the part of the expert as to the overall commercial effect of the transaction, the circumstances that have led to the proposal and the alternatives available. The expert must weigh up the advantages and disadvantages of the proposal and form an overall view as to whether the shareholders are likely to be better off if the proposal is implemented than if it is not.
In determining whether the demerger is in the best interests of WMC Limited’s shareholders, Grant Samuel considered a ranges of factors, including:
| | • | | The impact on business operations if the demerger proceeded |
-22-
| | INFORMATION ON THE COMPANY |
| |
|
| | • | | The effect on earnings and dividends attributable to existing shareholders |
| | • | | The financial position of Alumina Ltd and WMC Resources |
| | • | | The impact on the markets for Alumina Ltd and WMC Resources shares |
| | • | | The effect on competition for WMC Limited’s assets in the event of a takeover, and |
| | • | | The costs, disadvantages and risks of the demerger. |
In performing its work, Grant Samuel reviewed, (a) the Scheme Booklet for the demerger, (b) WMC Limited’s annual and interim financial statements, (c) industry data and reports, (d) press articles and broker reports, (e) other information on industries and listed companies in Australia comparable to Alumina Ltd and WMC Resources, (f) board papers, (g) five year forecasts for each of Alumina Ltd and WMC Resources, (h) other documentation, including taxation advice, legal advice and work papers and (i) discussions with senior management of WMC Limited and their financial and taxation advisors. Grant Samuel notes that the information provided to it has been evaluated through analysis, enquiry and review for purposes of forming an opinion as to whether the demerger is in the best interests of WMC Limited’s shareholders and optionholders. Grant Samuel does not warrant that its enquiries have identified or verified all of the matters that an audit, extensive examination or due diligence investigation might disclose. Except as set out in its report, Grant Samuel has not attempted to independently verify the completeness, accuracy or fair presentation of any of the information provided to it by WMC Limited and notes that an opinion as to whether a transaction is in the best interests of shareholders is more in the nature of an overall review than a detailed audit or investigation.
In its report, Grant Samuel concluded as a preliminary matter that the demerger will have no direct impact on the asset portfolio in which WMC Limited shareholders have an economic interest since WMC Limited shareholders will continue to hold interests in the same set of assets, albeit through different corporate structures. Accordingly, its analysis of the benefits of the demerger focused upon whether it was likely to promote more efficient utilization of the assets, enhance share market perceptions of the value of the assets, as reflected in share prices, or increase the price that could be realized for the assets in the context of a takeover or similar transaction. These potential benefits were then weighed against the costs of the demerger, which primarily comprised the tax consequences of the transaction for WMC Limited’s shareholders and WMC Limited.
In Grant Samuel’s opinion, the demerger will result in the creation of two more focused companies, with expected benefits in terms of investor flexibility, transparency and the alignment of management incentives with corporate performance. According to Grant Samuel, these factors suggest that the demerger should result in more efficient utilization of assets of WMC Resources and should increase investor interest in both Alumina Ltd and WMC Resources. On the other hand, Grant Samuel notes that the demerger will result in some inefficiencies, including the duplication of some corporate costs, a sub-optimal capital structure for Alumina Ltd, higher proportion of debt relative to total assets in WMC Resources and, potentially, an increase in the cost of capital for Alumina Ltd and WMC Resources by comparison with the cost of capital of WMC Limited in its form prior to the demerger.
Grant Samuel also noted in its opinion that WMC Limited’s structure prior to the demerger severely limited the number of parties that could realistically be considered potential acquirers of WMC Limited. In Grant Samuel’s view, the demerger will significantly increase the competitive tension between potential buyers of WMC Limited or its assets, and materially enhance the prospect that any change of control by way of takeover or otherwise will occur at prices reflecting full underlying value. Grant Samuel noted that in recent years there has been a substantial degree of rationalization in the resources sector. In this context, Grant Samuel believes that the demerger’s promotion of a more competitive market for control of WMC Limited represents a compelling advantage of the demerger and that market expectations of corporate activity are likely to provide material support for the share prices of Alumina Ltd and WMC Resources following the demerger.
-23-
| | INFORMATION ON THE COMPANY |
| |
|
In forming its opinion, Grant Samuel considered background issues, the impact on the underlying business, the impact on the capital structure, equity market issues, the impact on corporate control, taxation and other issues.
Background. Grant Samuel reviewed the performance of other entities before and after demerger or spin-out transactions. Grant Samuel noted that most of the demergers that have occurred in Australia in recent years involved spin-outs of subsidiaries exposed to unrelated industries or distinctly different markets, but also that there is an absence of reliable benchmarks to measure performance of the two entities after a demerger. Grant Samuel observed that in both the demerger of PaperlinX Limited from Amcor Limited and the demerger of Origin Energy Limited from Boral Limited, the share price performance of the resulting entities suggested that the demergers may have enhanced shareholder value. Grant Samuel, however, also noted the existence of some recent studies that have found that demergers may negatively impact value and that conglomerates have outperformed the market over some periods.
Impact on Underlying Business. In considering the key impacts that the demerger would have on the underlying businesses of WMC Limited, Grant Samuel focused on management and board focus, duplication of corporate costs, loss of synergies and loss of diversification.
Grant Samuel noted that the demerger will result in the creation of two companies with separate boards and management teams, creating the potential for greater board and management focus and consequent improvement in the returns from, in particular, WMC Resources. Grant Samuel also noted that to the extent that remuneration is linked to share price performance, the demerger will ensure that management remuneration is more directly related to performance over which management has exclusive control. Grant Samuel concluded, however, that the benefits that arise from greater board and management focus are hard to quantify and are only likely to emerge over the longer term.
Grant Samuel believes that the demerger will result in the duplication of some corporate costs, such as listed company costs, annual reports, shareholder communications, legal and regulatory compliance costs, central administration costs, accounting, information technology and taxation and other general services. Grant Samuel noted, however, that WMC Limited estimated these costs to be approximately A$4.6 million per year and concluded that in the context of the earnings, assets and likely market values of each of the demerged companies, the additional expense would not be substantial.
Grant Samuel observed that the demerger will result in the loss of any synergies that may have been derived from holding WMC Limited’s interest in AWAC together with its non-alumina businesses, although it noted that WMC Limited’s scope to extract operational synergies from its investment in AWAC is limited by Alcoa’s operational management of AWAC. Grant Samuel also noted that WMC Resources is expected to produce strong cash flows and that the funding requirements for its assets in the short-to-medium term are not expected to be significant, which further limits the availability of synergistic benefits of combining WMC Limited’s interest in AWAC with its non-alumina businesses.
Grant Samuel also considered the impact on diversification that the demerger would have on the two companies, noting that Alumina Ltd’s income would derive solely from the alumina, aluminium and alumina-based chemicals businesses of AWAC and that while WMC Resources would retain some diversification in its portfolio, its earnings would likely be more volatile than WMC Limited’s earnings prior to the demerger. Grant Samuel noted, however, that there should be no overall increase in investment volatility for WMC Limited’s shareholders as they will retain their existing economic and risk exposures following the demerger, albeit in two separate companies rather than a single company.
Impact on Capital Structure. Grant Samuel reviewed the proposed capital of Alumina Ltd, noting that it would hold A$600 million of WMC Limited’s debt prior to the demerger, which it believed was conservative relative to other aluminium/alumina producers. Grant Samuel believes that this debt creates a sub-optimal capital structure for Alumina Ltd insofar as it will not be able to fully utilize the tax deductibility of interest payments because Alumina Ltd’s primary source of income will be after tax dividends from AWAC. Grant Samuel believes, however, that any unutilized tax benefits are unlikely to be material in the context of the earnings and market value of Alumina Ltd.
-24-
| | INFORMATION ON THE COMPANY |
| |
|
Grant Samuel also reviewed the capital structure of WMC Resources, noting that WMC Resources will assume the balance of WMC Limited’s debt and all its hedging obligations prior to the demerger. Grant Samuel noted that WMC Resources’ level of debt relative to its asset base is generally more conservative than that of other major resource companies. Grant Samuel also noted though that WMC Resources will not have the benefit of relatively stable cashflows from AWAC and that it will be more vulnerable than WMC Limited to any significant decline in operating cash flows or rise in interest rates, which could reduce its financial flexibility and potentially increase its cost of debt. However, Grant Samuel also observed that WMC Resources has competitive, low-cost operations and that it is expected to produce strong free cash flows that will allow a significant reduction in debt levels, even after considering its capital expenditures requirements. Accordingly, Grant Samuel considered that the impact of any reduction in WMC Resources financial flexibility should not be material.
Equity Market Issues. Grant Samuel considered certain key equity market issues that the demerger would raise, and concluded that the demerger should enhance the investment appeal of the demerged companies. Grant Samuel believes that the demerger will provide investors with greater flexibility to make their own choices regarding their respective exposures to the asset portfolios of Alumina Ltd and WMC Resources, suggesting that share markets generally do not reward corporate diversification unless there are substantial synergies available to a corporate holder of a diversified portfolio of businesses.
Grant Samuel further observed that Alumina Ltd will be one of very few pure upstream aluminium/alumina companies and that the AWAC assets are low cost, highly profitable and achieve good returns on capital, which are features likely to be attractive to investors.
Grant Samuel also believes that the demerger will result in more transparent valuations for each of Alumina Ltd and WMC Resources as investors will be forced to look more closely at the attributes and underlying financial performance of each company separately and in the context of their respective peer groups.
While Grant Samuel noted that the demerged companies will be smaller than WMC Limited, which could potentially reduce liquidity of the stock of each company, it also observed that both companies will be among Australia’s largest listed companies and included in leading domestic and international indicies, such as the ASX/S&P200. Grant Samuel concluded that the impact of the demerger on the liquidity of shares in the demerged companies is difficult to predict and that although it is likely that potentially lower liquidity would have a negative impact on investor interest in the demerged companies, any such negative effect should not be significant.
Grant Samuel believes that market expectations of corporate activity involving Alumina Ltd and WMC Resources should significantly boost the equity market appeal of the demerged companies, at least in the short-to-medium term. It noted, however, that in the longer term, if no corporate activity eventuates, this support may dissipate.
Impact on Corporate Control. Grant Samuel observed that in the context of a continuing rationalization of the resources sector, WMC Limited’s assets should be highly attractive to a number of potential acquirers. In particular, Grant Samuel noted that the AWAC interest provides exposure to a high quality portfolio of alumina and aluminium assets, which would be attractive to Alcoa and other industry players seeking to gain exposure to this sector. Grant Samuel noted that Alcoa may be impeded in other corporate activity it can pursue due to anti-competition issues. Grant Samuel also noted the attractiveness of WMC Limited’s other high quality copper/uranium, nickel and fertilizer assets.
Grant Samuel observed that impediments existed in WMC Limited’s structure before the demerger that acted as disincentives to potential acquirers of WMC Limited. These included WMC Limited’s size, which would limit the number of companies that could fund an acquisition of the entire company, and the exclusivity provisions of the AWAC agreements, which potentially could require an acquiror of WMC Limited with alumina assets to contribute those assets to AWAC after completion of an acquisition of WMC Limited.
-25-
| | INFORMATION ON THE COMPANY |
| |
|
Grant Samuel believes that the demerger will remove these structural impediments and would allow for the achievement of full underlying value for WMC Limited’s assets in any change of control of WMC Limited’s assets following the demerger. Grant Samuel also noted that the recent takeover activity in the Australian resources sector demonstrates that competitive transaction processes can deliver significantly enhanced value to shareholders. Grant Samuel believes that the demerger’s promotion of a competitive market for control of WMC Limited’s assets is a compelling benefit of the demerger.
Taxation Issues. Grant Samuel examined the key impacts that the demerger would have from a taxation perspective and concluded that the demerger will not result in any capital gains tax or other tax-related liability for WMC Limited or the demerged companies, and that WMC Limited’s prior tax losses would be expected to be preserved. Grant Samuel also concluded that the demerger will have no adverse tax consequences for most WMC Limited shareholders.
Valuation Report
The following is a summary of Grant Samuel’s valuation report regarding WMC Limited, dated November 21, 2001. The full text of the written report prepared by Grant Samuel may be obtained free of charge, upon written request to WMC Resources or may be viewed on WMC Limited’s web site (www.wmc.com). It is important to note that this valuation report was prepared to assist the WMC Limited board in assessing the offer from Alcoa and it was not prepared for purposes of the demerger.
In providing its opinion on the value of WMC Limited, Grant Samuel relied upon the prevailing business and economic conditions of the first two weeks of November 2001 and its report is qualified to the extent these conditions have changed materially since that time. In addition, the report is based upon financial and other information provided by WMC Limited to Grant Samuel, which Grant Samuel evaluated through analysis, enquiry and review, although this evaluation did not constitute an extensive examination akin to a due diligence investigation or audit. Grant Samuel appointed the technical specialists Australian Mining Consultants Pty Limited (“AMC”) to undertake a technical review of the assets of WMC Limited to assist Grant Samuel in preparing its report.
The information provided to Grant Samuel included (a) WMC Limited’s financial statements and annual reports, (b) management accounts, (c) management forecasts, budgets and business plans, (d) operating models for WMC Limited’s major businesses prepared by WMC Limited management, (e) WMC Limited’s strategy documents, (f) publicly available information on WMC Limited, including press articles and brokers’ analysis reports, (g) site visits, and (h) discussions with senior management and their financial advisors.
Grant Samuel’s final estimate of WMC Limited’s value was in the range of A$11.18 to A$12.91 per share (diluted for options). This valuation was calculated by aggregating the estimated fair market value of each of WMC Limited’s business and other assets, adjusting for the mark-to-market value of WMC Limited’s hedge portfolio and deducting net borrowings (based on WMC Limited’s unaudited balance sheet as at June 30, 2001). The valuation of each of the major businesses of WMC Limited, namely AWAC, Olympic Dam, the nickel operations and the fertilizer operations, were estimated on the basis of fair market value as a going concern, defined as the maximum price that could be realized in an open market over a reasonable period of time assuming potential buyers have full information. Other assets were valued on the basis of estimated net realizable value.
In Grant Samuel’s opinion, the final valuation range contemplated for the acquisition of WMC Limited as a whole and accordingly incorporated a control premium, a value which generally exceeds that implied by the price at which the shares trade on the stock exchange in the absence of a takeover offer. The two principal factors which influenced the valuation range were the high quality of the assets held in WMC Limited’s portfolio and the range of growth opportunities available to WMC Limited.
Grant Samuel calculated valuation ranges for the key assets and businesses of WMC Limited as follows:
-26-
| | INFORMATION ON THE COMPANY |
| |
|
| | • | | AWAC - US$3.7 to US$4.1 billion |
| | • | | Olympic Dam - US$2.3 to US$2.5 billion |
| | • | | The nickel business - US$1.4 to US$1.6 billion |
| | • | | The fertilizer business - US$475 to US$550 million |
Of the four primary methodologies commonly used for valuing businesses and assets, Grant Samuel selected discounted cash flow analysis as the methodology for valuing WMC. Discounted cash flow analysis estimates the value of a business though the calculation of net present values by discounting expected cash flows at a rate that reflects the risk associated with those cash flows. Grant Samuel selected this method because it has a strong theoretical basis and is the primary method of valuation in the mining and resources industries given their depleting ore reserves and varying production levels and capital requirements.
On the basis of operating and financial models prepared by WMC Limited for each of the key assets, Grant Samuel developed a number of different scenarios for the future development of each asset. Using WMC Limited’s balance sheet at June 30, 2001 as a starting point, net present values for each asset, were calculated on an ungeared (i.e. assuming that the entities conducting the businesses hold no debt) after-tax basis from July 1, 2001 onwards. It should be noted that cash flows for AWAC, Olympic Dam, the nickel assets and the fertilizer business were projected in US dollar terms at an exchange rate of A$1.00=US$0.51 and the nominal discount rates used to discount projected ungeared cash flows to a present value were: 9-10% for AWAC, Olympic Dam and the nickel assets and 8-9% for the fertilizer business. Net present values for each were calculated across a range of commodity prices and discount rates.
WMC Limited prepared operating and financial models for each of its key assets on the basis of its business plans for each business. Based on these models, Grant Samuel developed a number of scenarios for the future development of each of the key assets.
Alumina. Grant Samuel valued WMC Limited’s interest in AWAC in the range of US$3.7 billion to US$4.1 billion, having regard to both the aggregate value of individual assets and to the total valuation of AWAC as one business unit. Values were attributed to AWAC’s bauxite, alumina and aluminium assets based on discounted cash flow analysis and a variety of other considerations. Indicative cash flow models were prepared by Grant Samuel based on historical information, forecast information for 2001 and 2002 and discussions with AWAC and WMC Limited. The models project cash flows in US$ terms for twenty years commencing July 2001 and operations were generally assumed to continue for a period of a further thirty years. The value of production over this thirty year period was incorporated in a terminal value, calculated at the end of 2020. The terminal value assumed production remains constant at 2020 levels, but that cash profitability declines by an average of 15% to reflect contracting margins. A range of aluminium prices, alumina prices and exchange rates were considered. Discount rates applied to the projected cash flows equate to nominal rates in the range of 9.0 to 10.0% and represent an estimate of AWAC’s weighted average cost of capital.
Grant Samuel reviewed recent acquisitions of aluminium companies and the relationship between the equity purchase price and earnings before interest, taxes, depreciation and amortization (“EBITDA”) and earnings before interest, taxes and amortization (“EBITA”) of the acquired business. These acquisitions included Indian Aluminium by Hindalco Industries, Eastern Aluminium by Alcoa, Comalco by Rio Tinto, Reynolds Metals by Aloca, Algroup by Alcan, Pechiney by Alcan and Alumax by Alcoa. The historical EBITDA multiples in these transactions ranged from 8.1x to 11.0x and the historical EBITA multiples in these transactions ranged from 10.6x to 16.4x, with the average historical EBITDA multiple being 8.8x and the average historical EBITA multiple being 13.6x. The forecast EBITDA multiples in these transactions ranged from 5.5x to 11.6x and the forecast EBITA multiples in these transactions ranged from 6.3x to 22.4x, with the average forecast EBITDA multiple being 7.4x and the average forecast EBITA multiple being 13.3x. Based on the valuation range for AWAC determined by Grant Samuel, these multiples compared to AWAC’s 2000 historical EBITDA
-27-
| | INFORMATION ON THE COMPANY |
| |
|
multiples of 8.5x to 9.4x and EBITA multiples of 10.1x to 11.1x and forecast EBITDA multiples of 9.4x to 10.4x for 2001 and 10.3x to 11.5x for 2002 and forecast EBITA multiples of 11.1x to 12.2x for 2001 and 12.4x to 13.7x for 2002. Grant Samuel’s valuation of AWAC implies marginally higher EBITDA multiples than the recent transaction evidence, although on a EBITA basis the multiples are consistent with the recent transaction evidence. In Grant Samuel’s opinion, this is appropriate having regard to AWAC being the world’s largest alumina producer, the high quality of AWAC’s assets, the recent transactions not being directly comparable to AWAC due to the nature of the operations acquired and the short-term economic outlook having deteriorated significantly since the recent transactions were announced.
Grant Samuel also noted that the multiples implied by the Grant Samuel valuation also represented a modest premium to the trading multiples of the share market prices of comparable companies, which do include any premium for control. For these comparable companies, the 2000 weighted average EBITDA multiple was 8.3x, ranging from 2.6x to 13.6x and the 2000 weighted average EBITA multiple was 11.1x, ranging from 3.6x to 20.2x. The multiples implied by Grant Samuel’s valuation were marginally higher than Alcoa’s trading multiple for 2001, but at a modest premium to its trading multiple for 2002. Grant Samuel noted that Alcoa traded at a significant premium to the next largest aluminium producer, Alcan. Grant Samuel also noted that AWAC accounted for 9% of Alcoa’s revenues and 24% of Alcoa’s after-tax earnings in 2000, but that this contribution was expected by market analysts to decline over 2002. In addition, Grant Samuel noted that the alumina price tends to lag the aluminium price and hence earnings from Alcoa’s other businesses are expected to recover from the current economic downturn before AWAC’s earnings recover. In this context, Grant Samuel concluded that a modest premium to Alcoa’s 2002 trading multiples was appropriate.
Nickel. Grant Samuel valued WMC Limited’s nickel assets in the range of US$1.4 billion to US$1.6 billion. In deriving this valuation, Grant Samuel developed cash flow models for two cases for the long-term development of the nickel business. The first scenario, referred to as Scenario A, was based on the then-existing operations of the nickel business and the then-current business plan, which incorporates an expansion at Mt. Keith from 11 million tonnes of ore to 13.5 million tonnes of ore per year and the development of the Yakabindie nickel deposit at 10 million tonnes of ore per year. The second scenario, referred to as Scenario B, contemplates additional production from the Kambalda operations, significant exploration success at Leinster and Mt. Keith expanding production to 16 million tonnes of ore per year with gravity concentration.
Grant Samuel calculated net present values for each of the scenarios for a range of nickel prices and discount rates summarized as follows:
Scenario
| | Discount Rate
| | Low Case
| | Middle Case
| | High Case
|
| A | | 9.0% | | US$1,191 M | | US$1,581 M | | US$1,966 M |
| | | 9.5% | | US$1,146 M | | US$1,523 M | | US$1,895 M |
| | | 10.0% | | US$1,105 M | | US$1,468 M | | US$1,828 M |
| B | | 9.0% | | US$1,313 M | | US$1,764 M | | US$2,211 M |
| | | 9.5% | | US$1,248 M | | US$1,680 M | | US$2,107 M |
| | | 10.0% | | US$1,188 M | | US$1,601 M | | US$2,011 M |
-28-
| | INFORMATION ON THE COMPANY |
| |
|
Grant Samuel’s valuation range reflects the results of this net present value analysis and takes into account:
| | • | | A judgment that Scenario A reflects a more reasonable case for valuation purposes and that Scenario B is more optimistic, but nevertheless achievable. Grant Samuel therefore placed more weight on Scenario A. |
| | • | | The impact of acid sales stemming from annual sulphuric acid production of approximately 550,000 tonnes, which is sold to users in Western Australia. Without these customers, the net present values would be reduced by approximately 7%. |
| | • | | The potential to purchase additional concentrate to operate the nickel smelter at full capacity, which based on current concentrate purchases, would increase the net present values by approximately 4%. Grant Samuel notes, however, that WMC Limited has not purchased concentrates at this level in the past and no free supply of this amount of concentrates currently exists. |
| | • | | The impact of campaign lengths at the nickel smelter and refinery. The forecast campaign life for the nickel smelter is 10 years and the refinery is subject to three yearly shut downs. The sensitivity of calculated net present values to shorter smelter campaign lengths of eight years and longer refinery campaigns of four years is less than 1%. |
| | • | | The possibility of the smelter and the refinery continuing to operate after completion of mining at Mt. Keith and Yakabindie through purchase of concentrate from third parties, which could increase the net present value of the nickel operations by approximately US$150 million. |
| | • | | Regional exploration, which has been valued at US$6.9 million to US$21.5 million. |
The cash flow model for the nickel business projects cash flows in US dollars. The following table demonstrates the sensitivity of the analysis to different A$/US$ exchange rate assumptions. The table sets out calculated net present values assuming a long run nickel price of US$3.00/lb, a discount rate of 9.5% and a range of long run exchange rates:
Scenario
| | US$/A$ = 0.51
| | US$/A$ = 0.55
| | US$/A$ = 0.60
| | US$/A$ = 0.65
|
| A | | US$1,523 M | | US$1,288 M | | US$ 995 M | | US$706 M |
| B | | US$1,680 M | | US$1,406 M | | US$1,064 M | | US$723 M |
Copper. Grant Samuel valued WMC Limited’s copper assets in the range of US$2.3 billion to US$2.5 billion. In deriving this valuation, Grant Samuel developed cash flow models for two cases. The first scenario, referred to as Scenario A, was based on long-term production at a rate of 250,000 tonnes per year of copper, which was WMC Limited’s then-current strategic plan for Olympic Dam. The second scenario, referred to as Scenario B, contemplates a significant increase in production at Olympic Dam to 350,000 tonnes of copper per year. The discounted cash flow analysis was based on twenty year models for each of the scenarios. Terminal values were calculated for each scenario to reflect the value that would be realized for a further thirty years of operation after the twenty year forecast period. The cash flow models project nominal ungeared cash flows from July 1, 2001 and incorporate the benefit of Olympic Dam tax losses totaling A$665 million. Grant Samuel calculated net present values for each of the scenarios for low case, medium case and high case copper price as follows:
-29-
| | INFORMATION ON THE COMPANY |
| |
|
Scenario
| | Discount Rate
| | Low Case
| | Middle Case
| | High Case
|
| A | | 9.0% | | US$2,228 M | | US$2,464 M | | US$2,699 M |
| | | 9.5% | | US$2,134 M | | US$2,357 M | | US$2,580 M |
| | | 10.0% | | US$2,046 M | | US$2,259 M | | US$2,470 M |
| B | | 9.0% | | US$2,696 M | | US$2,990 M | | US$3,284 M |
| | | 9.5% | | US$2,558 M | | US$2,836 M | | US$3,112 M |
| | | 10.0% | | US$2,431 M | | US$2,694 M | | US$2,956 M |
Grant Samuel’s valuation range reflects the results of this net present value analysis and takes into account:
| | • | | That Scenario A is broadly consistent with the current operations at Olympic Dam. Scenario B was developed to assess the potential additional value that could be realized through a significant expansion of Olympic Dam. |
| | • | | The risks and uncertainties associated with a substantial expansion of Olympic Dam. |
| | • | | The importance of the uranium production to the economics of Olympic Dam, which contributes approximately 22% to the Olympic Dam revenue stream. |
| | • | | The option value inherent in the Olympic Dam project, which is accentuated by its long project life. Significant positive and negative movements in the copper price would have asymmetric impacts on the value of Olympic Dam. The long project life also means that in the future Olympic Dam may be able to take advantage of technological improvements or other developments to mine and treat mineralization that is not currently economic. |
The US$ costs in the cash flow model were estimated by projecting A$ costs and converting at forward rates equal to the spot rate. The following table demonstrates the sensitivity of the analysis to different A$/US$ exchange rate assumptions. The table sets out calculated net present values assuming the medium case copper price, a discount rate of 9.5% and a range of long run exchange rates:
Scenario
| | US$/A$ = 0.51
| | US$/A$ = 0.55
| | US$/A$ = 0.60
| | US$/A$ = 0.65
|
| A | | US$2,357 M | | US$2,131 M | | US$1,861 M | | US$1,558 M |
| B | | US$2,836 M | | US$2,549 M | | US$2,205 M | | US$1,856 M |
Fertilizer. Grant Samuel valued WMC Limited’s fertilizer assets in the range of US$475 million to US$550 million. The discounted cash flow analysis was based on a twenty year model. The cash flow model projects nominal ungeared cash flows from July 1, 2001. The major assumptions used in the discounted cash flow analysis for the fertilizer business were:
-30-
| | INFORMATION ON THE COMPANY |
| |
|
| | • | | The DAP price, fob Tampa, Florida, will increase to US$180 per tonne by 2004 and then decline in real terms at 1% per year thereafter. |
| | • | | The MAP price will be the same as the DAP price. |
| | • | | Mining and production costs are based on WMC Limited’s expected operating costs once operations stabilize. Grant Samuel noted that historical operating costs have been substantially higher than forecast costs. |
| | • | | Planned capital expenditures for the first five years of the plan are made, including the planned magnetic separation project and a number of debottlenecking projects. |
| | • | | Closure and rehabilitation costs of A$50 million |
| | • | | The fertilizer business had revenue losses for tax purposes of A$329 million at October 31, 2000. |
Grant Samuel calculated net present values for each of the scenarios for low case, medium case and high case DAP price as follows:
Discount Rate
| | Low Case
| | Middle Case
| | High Case
|
| 8.0% | | US$462 M | | US$556 M | | US$649 M |
| 8.5% | | US$443 M | | US$534 M | | US$623 M |
| 9.0% | | US$425 M | | US$513 M | | US$598 M |
Grant Samuel’s valuation range reflects the results of this net present value analysis and takes into account:
| | • | | WMC Limited has been studying an expansion project to bring production to 1.25 million tonnes per annum, at an estimated capital cost of A$50 million, although based on work done to the date of the Grant Samuel report it was not possible to quantify the potential upside with confidence. |
| | • | | The plant has not yet operated consistently at nameplate capacity and that forecasts costs were significantly lower than those that have been achieved historically. |
| | • | | The valuation assumed a recovery of DAP and MAP prices to around US$180 per tonne. |
| | • | | The business plan was based on selling large volumes of MAP into Western Australia, where WMC Limited did not yet have a market presence. |
| | • | | The depressed state of the world fertilizer market and the idle production capacity of some major participants would likely reduce the value that WMC Limited could realize for its fertilizer assets in the then-current environment. |
The following table demonstrates the sensitivity of the analysis to different A$/US$ exchange rate assumptions. The table sets out calculated net present values assuming a long run DAP price of US$180 per tonne, fob Tampa, Florida, a discount rate of 8.5% and a range of long run exchange rates:
-31-
| | INFORMATION ON THE COMPANY |
| |
|
US$/A$ = 0.51
| | US$/A$ = 0.55
| | US$/A$ = 0.60
| | US$/A$ = 0.65
|
| US$534 M | | US$397 M | | US$238 M | | US$84 M |
JPMorgan Australia Limited
JPMorgan was retained by the board of Directors WMC Limited following the approach from Alcoa Inc. in October 2001, to act as Financial Adviser for the purposes of estimating the trading range of WMC Limited on the Australian Stock Exchange in then current market conditions on the basis that its only asset would be its current interest in AWAC. It is important to note that this valuation report was prepared to assist the WMC Limited board in assessing the offer from Alcoa and it was not prepared for purposes of the demerger.
JPMorgan is a wholly owned subsidiary of JPMorgan Chase & Co., a United States based investment and commercial bank and provider of investment banking, asset management, private equity, consumer banking, private banking, e-finance, and custody and processing services. JPMorgan has provided financial advice in relation to a number of recent significant mergers and acquisitions in Australia. JPMorgan was selected primarily due to its strong reputation as corporate advisor internationally and for its knowledge of the U.S. market, in particular with respect to AWAC and Alcoa Inc. It received compensation of approximately A$1,113,000 for this engagement.
In preparing its report, JPMorgan reviewed and relied upon information provided to it by WMC Limited and public sources, including (a) AWAC’s governing agreements, (b) AWAC’s strategic plans and presentations and audited financial statements, (c) Alcoa of Australia monthly reports, (d) WMC Limited’s and Alcoa’s annual reports, (e) AMC’s report on the Western Australian bauxite mines, (f) other publicly available information and (g) discussions with management of WMC Limited.
In connection with its report, JPMorgan did not assume any responsibility for independent verification of any of the above-noted information and relied upon it being complete and accurate in all material respects. With respect to financial forecasts, projections, strategic plans and economic forecasts, JPMorgan assumed they had been reasonably prepared on bases reflecting the best currently available estimates and judgments of WMC Limited’s management. JPMorgan did not make an independent evaluation or appraisal of the assets and liabilities of AWAC or any of the other operations referred to in the report, nor was JPMorgan furnished with any such evaluations.
The full text of the written valuation report prepared by JPMorgan dated November 2001 may be obtained free of charge, upon written request to WMC Resources or may be viewed on WMC Limited’s website (www.wmc.com).
JPMorgan concluded that the estimated trading value of WMC Limited, if it held only WMC Limited’s AWAC interest, was in the range of US$3.7 billion to US$4.0 billion. This range was based on the different ranges of values calculated using the following valuation methods: (i) intrinsic value, which determines the estimated value that a third party with access to 100% of the cash flows of the underlying business would be likely to attribute to the assets of AWAC, (ii) transaction multiples, as a reasonableness check on the intrinsic value valuation, a comparison on the intrinsic value calculated and the prices paid in selected acquisitions and divestments in the alumina and aluminum sectors, (iii) dividend value, which determines the value that a third party, other than a party capable of accessing 100% of the cash flows of the AWAC enterprise, will theoretically be prepared to pay for the assets and (iv) market trading multiples, which derives a notional trading market value for how an entity comprised only of WMC Limited’s AWAC interest might trade on the Australian Stock Exchange in then-current market conditions. The material portions of these analyses are summarized below.
-32-
| | INFORMATION ON THE COMPANY |
| |
|
Intrinsic Value Method. Using the intrinsic value method, JPMorgan arrived at a valuation range of US$3.930 billion to US$4.175 billion. The intrinsic value was calculated by aggregating the estimated value of WMC Limited’s interest in each of AWAC’s operations together with any surplus assets and deducting its borrowings (including capitalized finance leases) and non operating liabilities. The value of WMC Limited’s interest in each of AWAC’s operations was based on projections of discounted after tax net incremental cash flows generated by each of the assets. The discount rates used were based on the weighted average cost of capital of the different assets, which ranged from 7.9% for the United States and Europe, to 15.8% for Suriname. The valuation figures calculated did not include either a strategic or a control premium, which JPMorgan believed would already be incorporated in the calculation of intrinsic value. The range of intrinsic values determined by JPMorgan in this analysis was US$3,363 million to US$3,538 million for the aluminium refining assets, US$595 million to US$628 million for the aluminium smelting assets and US$191 million to US$228 million for chemicals and other operations. Adjusting for corporate overheads and debt generated an equity value range of US$3,930 million to US$4,175 million.
Transaction Multiples. As a reasonableness check of the intrinsic value, JPMorgan compared the results to an analysis of the prices paid in selected acquisitions and divestments in the alumina and aluminum sectors in recent years. This comparison of transaction multiples produced a range of US$3,825 million to US$4,100 million. JPMorgan’s analysis of intrinsic value implied that the alumina assets were valued at approximately US$758 per tonne of annual productive capacity and that the aluminium assets were valued at approximately US$4,245 per tonne of annual productive capacity. Recent alumina transactions examined by JPMorgan included Comalco’s acquisition of Queensland Alumina Refinery with an implied multiple of US$624 per tonne; Alcan’s acquisition of Gove Aluminium Ltd with an implied multiple of US$728 per tonne; and Billiton Plc’s acquisition of Woresly with an implied multiple of US$783 per tonne. Recent aluminium transactions examined by JPMorgan included Pechiney SA’s acquisition of AMP Tomago Aluminium, VAW Aluminium’s acquisition of Capral Aluminium, Alcoa of Australia’s acquisition of Eastern Aluminium and CITIC/Marubeni Aluminium’s acquisition of Aluvic. The transactions generated multiples ranging from US$1,965 per tonne to US$3,333 per tonne, with a median of US$3,226 per tonne. JPMorgan noted that the higher multiple for AWAC’s aluminium assets related to the historically low discounts reflecting the low interest rate environment in the U.S., the benefit realized in the Australian operations from a weak A$/US$ exchange rate and the differing nature of the operations included in the comparatives.
Dividend Value. JPMorgan calculated a range of US$3,540 million to US$3,750 million for dividend value, which provides an estimate of the value a third party would be prepared to pay for the assets. JPMorgan estimated the dividend value by calculating the present value of estimated future dividend flows accruing to WMC Limited from its interest in AWAC discounted at the cost of equity capital for each operation, which ranged from 8.7% for Australia, the United States and Europe to 19.9% for Suriname. To determine the dividend stream, JPMorgan assumed that AWAC would continue to distribute 100% of net profit to its shareholders, although it stated that this fact was not critical to its analysis. Based on this analysis, JPMorgan determined the dividend value ranges to be from US$3,275 million to US$3,419 million for Alcoa of Australia, US$145 million to US$183 million for Alcoa World Alumina LLC and US$145 million to US$171 million for the remainder of AWAC’s businesses. Adjusting for WMC Limited’s corporate overheads of approximately US$22 million, generates JPMorgan’s estimated dividend value range of US$3,543 million to US$3,751 million. JPMorgan noted in the report that the dividend value differed from the intrinsic value primarily as a result of tax leakages from the dividend flows, principally associated with withholding taxes, and the sub-optimal capital structure of AWAC, which includes minimal debt.
Market Trading Multiples. On the basis of market trading multiples analysis, JPMorgan calculated a range of US$3,505 million to US$3,750 million. This analysis involved determining an estimate of the entity’s attributable EBITDA from AWAC for the year ending December 31, 2002 and capitalizing this amount by multiples which have been determined by a review of the prevailing trading characteristics of comparable listed companies. JPMorgan focused upon selected aluminum companies and selected primarily single commodity, base metal companies, including Alcoa, Alcan, Pechiney, Kaiser Aluminium, Century Aluminium, Noranda, Grupo Mexico, Phelps Dodge, Freeport, Inco and Falconbridge. The range of estimated 2002 EBITDA multiples for these companies was 4.9x to 8.5x, with a mean of 6.6x. This compares to an estimated 2002 EBITDA multiple for WMC Limited of 7.3x, which implies the trading range of US$3,505 million to US$3,750 million for WMC Limited.
-33-
| | INFORMATION ON THE COMPANY |
| |
|
Capitalization Expenditure
Since January 1, 1999 WMC Resources has made the following principal capital expenditures and divestures:
| | • | | WMC Resources’ divestment of its Kambalda mines is part of WMC Resources’ nickel strategy to divest mature nickel mines and seek to participate in the benefits that a small focused operator can yield from the remaining resource. Since early 2000, WMC Resources has been selling various of the mines within its Kambalda nickel operations. To the date of this registration statement, proceeds from these sales have totalled A$51.8 million in aggregate. |
| | • | | In February 2001 WMC Resources purchased the Yakabindie nickel project. The Yakabindie project, situated near Mt Keith, involved an investment of A$40 million, A$25 million of which was paid at the time of acquisition with the remaining A$15 million due upon gaining approval to mine the property. While the approval process has been commenced, final approvals to mine are not expected for some years. |
| | • | | In 1999, WMC Resources completed construction of the Queensland Fertilizer Operations and the commissioning of the Olympic Dam Expansion project bringing the total project investment in that year to A$780 million. A$180 million was incurred on the Olympic Dam Expansion project in 1999 bringing the total investment in the expansion project to approximately A$1.94 billion. The Olympic Dam project raised the copper production capacity of the plant from 85,000 tonnes of refined copper per year to approximately 200,000 tonnes per year. |
WMC Resources currently has the following capital expenditure and divestiture activities in progress:
| | • | | The Long Victor mine in Kambalda was sold in September 2002 for A$15 million. It is anticipated that the remaining WMC Resources mine in the Kambalda region will be sold in 2003. |
| | • | | WMC Resources is currently undertaking an optimisation project in relation to its Olympic Dam operations in South Australia. The project is intended to increase the refinery capacity and improve efficiency in the milling and hydro-metallurgy areas, with the anticipated result that production capacity of the operations will increase to up to 235,000 tonnes of refined copper per year by 2003. The expected capital cost is approximately A$85 million, all of which will be capitalized. |
| | • | | Olympic Dam experienced a fire in both the copper and uranium solvent extraction circuits in 2001. The expected cost of the rebuild is approximately A$250 million for which up to A$55 million of property damage insurance is currently under negotiation with insurers. |
B. Business Overview
General
WMC Resources’ main business is the discovery, development, production, processing, and marketing of minerals and metals. WMC Resources produces nickel, copper, gold, phosphate fertilizers and uranium oxide. WMC Resources’ other activities include producing and distributing fertilizers.
During 2001 WMC Resources explored in Australia, Brazil, Canada, Chile, China, Peru and the USA. During 2001 WMC Resources continued a feasibility study on the Corridor Sands titanium feedstock project in southern
-34-
| | INFORMATION ON THE COMPANY |
| |
|
Mozambique. The pre-feasibility optimization study at the 56 % owned Meliadine West Joint Venture in Northern Canada was completed in 2001.
During 2001 WMC Resources purchased Yakabindie nickel project and commissioned the new fertilizer operations at Phosphate Hill, Mount Isa and Townsville, in the State of Queensland.
-35-
| | INFORMATION ON THE COMPANY |
| |
|
The following map shows the location of WMC Resources’ operations and interests in Australia.
CORPORATE OFFICES | | FERTILIZER |
Melbourne, VIC Perth, WA | | Mt Isa, QLD Phosphate Hill, QLD Townsville, QLD |
|
COPPER-URANIUM | | EXPLORATION |
| Olympic Dam, SA | | Perth, WA 13 West Musgrave, WA |
|
NICKEL | | |
Kalgoorlie, WA Kambalda, WA Kwinana, WA Leinster, WA Mount Keith, WA Yakabindie, WA | | |
AUSTRALIA
-36-
| | INFORMATION ON THE COMPANY |
Segment Information
WMC Resources categorizes its on-going operations as follows: Nickel; Copper Uranium (principally the Olympic Dam Operations which produces copper, uranium oxide, gold and silver); Fertilizers; Exploration and New Business; and Other. Geographic and financial information relating to the segments of continuing operations are included under Note 7 to the unaudited Interim Combined Financial Statements and Note 7 to the Combined Financial Statements. The following table sets forth financial information in A$ by operating segments for the six month period ended June 30, 2002 and for each of the last three years.
FINANCIAL INFORMATION BY SEGMENT (CONTINUING OPERATIONS)
| | | Six Months Ended June 30, 2002
| | | Year Ended December 31, 2001
| | | Year Ended December 31, 2000
| | | Year Ended December 31, 1999
| |
| | | (A$ million) | | | (A$ million) | | | (A$ million) | | | (A$ million) | |
Sales Revenue by Operating Segments(1) | | | | | | | | | | | | |
| Nickel | | 598.5 | | | 1,200.9 | | | 1,645.4 | | | 989.2 | |
| Copper | | 318.9 | | | 810.3 | | | 798.0 | | | 491.6 | |
| Fertilizers | | 269.7 | | | 352.9 | | | 222.6 | | | 191.9 | |
| Other | | 9.2 | | | — | | | — | | | — | |
| | |
|
| |
|
| |
|
| |
|
|
| | | 1,196.3 | | | 2,364.1 | | | 2,666.0 | | | 1,672.7 | |
| | |
|
| |
|
| |
|
| |
|
|
Combined Income by Operating Segments before Income Tax | | | | | | | | | | | | |
| Nickel | | 80.1 | | | 146.9 | | | 626.7 | | | 123.7 | |
| Copper | | 14.8 | | | 47.9 | | | 165.7 | | | 16.4 | |
| Fertilizers | | (16.3 | ) | | (89.4 | ) | | (59.7 | ) | | (9.5 | ) |
| Other | | 5.4 | | | (1.0 | ) | | (1.2 | ) | | 4.9 | |
| | |
|
| |
|
| |
|
| |
|
|
| Product Operating Income | | 84.0 | | | 104.4 | | | 731.5 | | | 135.5 | |
| New Business | | (17.7 | ) | | (35.3 | ) | | (6.2 | ) | | (49.3 | ) |
| Regional Exploration | | (9.7 | ) | | (63.9 | ) | | (53.8 | ) | | (48.1 | ) |
| Financing/Corporate | | (31.4 | ) | | (228.5 | ) | | (189.3 | ) | | (114.7 | ) |
| | |
|
| |
|
| |
|
| |
|
|
| | | 25.2 | | | (223.3 | ) | | 482.2 | | | (76.6 | ) |
| | |
|
| |
|
| |
|
| |
|
|
(1) | | Sales revenue includes intermediate-product sales, commodity and related currency hedging. Inter-segment sales are on a commercial basis and are not significant. All revenues are considered to be generated in Australia – see Note 7 of the unaudited Interim Combined Financial Statements and Note 7 of the Combined Financial Statements. |
The operations and assets of WMC Resources’ business segments are further described in Item 4D “Property, Plant and Equipment”.
-37-
| | INFORMATION ON THE COMPANY |
C. Organizational Structure
The “WMC Resources Group” consists of the ultimate parent company, WMC Resources Ltd and its subsidiaries. WMC Resources’ business is split into business units based on major production commodities and activities:
| | • | | Exploration and New Business; and |
The principal companies within the WMC Resources Group are:
| | • | | WMC Resources Ltd – Is both the parent holding company as well as an operating entity that owns the nickel mining, processing and marketing operations. |
| | • | | WMC (Olympic Dam Corporation) Pty Ltd – Incorporated in Australia, this company owns the Olympic Dam Operations which produces high quality refined copper and uranium oxide, gold and silver as co-products. It is wholly owned by WMC Resources. |
| | • | | WMC Fertilizers Pty Ltd – Incorporated in Australia, this company owns the Queensland Fertilizer Operations and fertilizer distribution arm, Hi-Fert Pty Ltd. It is wholly owned by WMC Resources. |
| | • | | WMC Finance Ltd – Incorporated in Australia, this company’s principal activities are the borrowing and lending of money and other financing activities, including commodity and currency hedging and the selling of gold and silver purchased from related entities. It is wholly owned by WMC Resources. |
| | • | | WMC Finance (USA) Ltd – Incorporated in Australia, the principal activity of this company is to hold debt issues raised in the United States markets. It is wholly owned by WMC Resources. |
D. Property, Plant and Equipment
All assets are 100% owned, either directly or through subsidiary companies, unless otherwise stated.
Under current life of mine plans, all reported reserves will be mined out within the period of existing leases or concessions or within the time period of assured renewal periods. All reported reserves are at established mining operations which have all required permits and government approvals.
-38-
| | INFORMATION ON THE COMPANY |
1. NICKEL
WMC Resources’ nickel business unit is a fully integrated nickel business comprising mines, concentrators, a smelter and a refinery. WMC Resources produced 50,452 tonnes of contained nickel-in-concentrate extracted from 7.7 million tonnes of ore processed in the six months ended June 30, 2002. This compares with production of 104,591 tonnes of contained nickel-in-concentrate in the year ended December 31, 2001 from 13.8 million tonnes of ore processed. Purchased feed from third parties was 7,690 tonnes of recovered nickel for the six months ended June 30, 2002, compared to 19,717 tonnes for the year ended December 31, 2001.
WMC Resources’ strategy for its nickel business unit is:
| | • | | To optimize the performance of existing assets by focusing on improving margins; |
| | • | | Use process improvement technology and gains in production efficiency to increase output at minimum capital cost and reduce unit production costs; |
| | • | | Maintain the business as a low cost major producer; |
| | • | | Grow the business where commercially viable via projects such as Yakabindie and through exploration; and |
| | • | | Restructure the business when appropriate. |
Production of nickel-in-concentrate by WMC Resources commenced in 1967, following the discovery of significant nickel ore reserves at Kambalda. WMC Resources currently mines nickel ore from both open-cut and underground mines at WMC Resources’ wholly owned mines at Leinster and Mount Keith. WMC Resources ceased mining at Kambalda in the first half of 2002. The mill and concentrator at Kambalda are now fed with third party ore. Nickel ore is concentrated at Kambalda, Leinster and Mount Keith and then the majority of this nickel concentrate is transported to the Kalgoorlie Nickel Smelter to be smelted into nickel matte. Some of the Mount Keith production is sold directly as concentrate. In the six months ended June 30, 2002, 36% of nickel-in-matte produced was sold to overseas customers (36% in 2001 fiscal year) and the balance was refined at the Kwinana Nickel Refinery to produce high purity nickel briquettes, nickel powder and various other intermediate products such as ammonium sulphate.
Pursuant to an agreement with Southern Cross Energy which expires in 2013, power at the Kambalda, Mount Keith and Leinster nickel operations and at the Kalgoorlie Nickel Smelter is primarily derived from on site third party gas fired turbines with power at the Kwinana Refinery being wheeled from the goldfields through Western Power. Under the agreement with Southern Cross Energy, WMC Resources has a take or pay obligation to purchase energy. In the Goldfields region, until 2006, gas is purchased under long term contract and is sourced from North West gas fields and transported by the Goldfields Gas Pipeline. Under its gas transmission agreement, WMC Resources has an 80% take or pay obligation. Since December 31, 2001 the transmission tariff has increased by approximately 30% and WMC Resources is currently disputing this increase in accordance with the dispute resolution procedures under the transmission agreement. The Western Australian Independent Gas Pipeline Regulator has made a draft decision regarding tariffs payable by third parties for access to the pipeline suggesting that a lower access tariff to that currently proposed by the pipeline owners should apply. The pipeline owners have commenced proceedings in the Supreme Court of Western Australia seeking a declaration that the Regulators’ draft decision does not apply. Until 2003 gas for the Kwinana Refinery will be sourced from the North West of Western Australia and is transported by the Dampier to Bunbury natural gas pipeline, with WMC Resources having a 70% take or pay obligation. WMC Resources is currently negotiating the renewal of this agreement beyond 2003.
-39-
| | INFORMATION ON THE COMPANY |
| |
|
A summary of the production of nickel-in-concentrate from WMC Resources’ mines and third parties, matte from its smelter and metal from its refinery for the last five years is set out below.
NICKEL PRODUCTION SUMMARY
| | | Six Months Ended June 30, 2002
| | Year Ended December 31, 2001
| | Year Ended December 31, 2000
| | Year Ended December 31, 1999(1)
| | Year Ended December 31, 1998
| | Six Months Ended December 31, 1997
| | Year Ended June 30, 1997
|
| | | (tonnes) |
| | | Nickel-in-concentrate Produced |
| Kambalda | | 9,708 | | 18,653 | | 19,202 | | 11,114 | | 33,381 | | 15,440 | | 30,368 |
| Leinster | | 19,174 | | 38,008 | | 40,724 | | 35,953 | | 44,313 | | 20,406 | | 37,599 |
| Mount Keith | | 21,570 | | 47,930 | | 47,532 | | 41,208 | | 42,037 | | 19,878 | | 36,700 |
| | |
| |
| |
| |
| |
| |
| |
|
| Total | | 50,452 | | 104,591 | | 107,458 | | 88,275 | | 119,731 | | 55,724 | | 104,667 |
| | |
| |
| |
| |
| |
| |
| |
|
|
| | | Kalgoorlie Smelter Production |
| Concentrate treated | | 300,208 | | 704,330 | | 737,244 | | 575,219 | | 722,362 | | 368,280 | | 562,496 |
| Matte produced | | 62,069 | | 140,432 | | 148,051 | | 116,299 | | 145,741 | | 77,163 | | 108,640 |
| Nickel-in-matte produced | | 41,704 | | 96,650 | | 103,019 | | 79,668 | | 100,071 | | 52,699 | | 72,939 |
|
| | | Kwinana Refinery Production |
| Matte treated | | 49,039 | | 94,208 | | 93,975 | | 79,792 | | 84,072 | | 42,975 | | 72,064 |
| Refined nickel produced | | 30,904 | | 61,324 | | 60,532 | | 53,009 | | 53,695 | | 26,989 | | 47,577 |
(1) | | In 1999 the Kalgoorlie Nickel Smelter was shut down for 63 days for a major furnace rebuild following a furnace leak. |
-40-
| | INFORMATION ON THE COMPANY |
| |
|
The table below shows WMC Resources’ proven and probable nickel ore reserves. The reserves include adjustments for dilution and mine recovery loss during the mining process but do not include adjustments for metallurgical recovery. The commodity price used to estimate the 2001 nickel ore reserves was A$5.00/lb. At the 2001 average exchange rate this equates to US$2.56/lb.
NICKEL ORE RESERVES
As at December 31, 2001
| | | Type of Reserve(1)
| | Average Metallurgical Recovery Expected (%)
| | Proven Ore(4)
| | Probable Ore(5)
| | Total Ore
|
| | | | | Quantity (millions of tonnes)
| | Grade %
| | Quantity (millions of tonnes)
| | Grade %
| | Quantity (millions of tonnes)
| | Grade %
|
Kambalda(6) | | u/g | | 90 | | 0.5 | | 3.6 | | 0.6 | | 3.6 | | 1.1 | | 3.6 |
| Leinster | | u/g | | 80 | | 13.9 | | 1.6 | | 8.6 | | 1.8 | | 22.5 | | 1.7 |
| | | o/c | | 75 | | — | | — | | 4.4 | | 1.8 | | 4.4 | | 1.8 |
| | | s/p | | 45 | | 0.3 | | 1.5 | | — | | — | | 0.3 | | 1.5 |
| Mount Keith | | o/c | | 70 | | 201.0 | | 0.6 | | 128.0 | | 0.5 | | 329.0 | | 0.6 |
| | | s/p | | 62 | | 21.4 | | 0.5 | | — | | — | | 21.4 | | 0.5 |
(1) | | u/g = underground, o/c = open-cut, s/p = stockpile |
(2) | | Ore reserves reflect tonnages recoverable from mining as they include adjustments for dilution and mine recovery loss during the mining process, although they do not include adjustments for metallurgical recovery. |
(3) | | All sites are 100% owned. |
(4) | | For proven reserves the following indicative drill spacings have been used; |
| | • | | Kambalda (Long Shaft) - £20m x 20m and development, |
| | • | | Leinster (Perseverance Shoot) - £25m x 25m and |
| | • | | Mount Keith - £40m x 40m. |
(5) | | For probable reserves the following indicative drill spacings have been used. |
| | • | | Kambalda (Long Shaft) - £30m x 30m, |
| | • | | Leinster (Perseverance Shoot) - £50m x 50m and |
| | • | | Mount Keith - £80m x 80m. |
(6) | | Kambalda reserves as at 31 December 2001 comprised the Long Victor mine (0.9Mt @ 3.8%Ni) and the Lanfranchi mine complex (0.2Mt @ 3.0%Ni). The Long Victor mine was sold in September 2002. It is anticipated that the Lanfranchi mine complex will be sold during 2003. |
In May 2000, WMC Resources announced the encouraging results of early exploration work at its West Musgrave nickel-copper project in Western Australia. West Musgrave is located within the Musgrave Ranges north-east of Laverton near the South Australian border. The tenements lie entirely within Aboriginal Reserve No. A17614, administered by the Ngaanyatjarra Land Council.
-41-
| | INFORMATION ON THE COMPANY |
| |
|
Nickel Operations
Kambalda Nickel Operations
The operations are sited 56 kilometers south of Kalgoorlie in Western Australia and comprise high-grade nickel sulphide mines and a concentrator. Since early 2000, WMC Resources has been selling various of the mines at Kambalda and entering into long term nickel purchase agreements with the purchasers for the processing of ore and the purchase of subsequent concentrate. The divestment of the mines is part of WMC Resources’ nickel strategy to divest mature mines where proven and probable reserves are nearly depleted and reduce the capital intensity of the operation. As at December 31, 2001 nickel ore was being extracted from only one mine owned by WMC Resources and the ore was milled and concentrated at Kambalda. During the first half of 2002, WMC Resources ceased mining ore at Kambalda and now relies entirely on third party ore for feed through the concentrator. The Kambalda concentrator has a capacity of 1.5 million tonnes of ore per year. The current utilization of the Kambalda concentrator is approximately 50%. The nickel concentrate, containing approximately 12% to 14% nickel, is dried at Kambalda and transported by rail to the Kalgoorlie Nickel Smelter for conversion to nickel matte.
Purchases from third parties amounted to 7,690 tonnes of recovered nickel for the six months ended June 30, 2002, and 19,717 tonnes for the year ended 2001. The lease containing the Miitel mine, previously on care-and-maintenance, was disposed of in November 2000. During 2001 the Wannaway mine and North Widgiemooltha Block were sold to external parties. Land containing the Otter, Juan and Coronet North mines was leased to third parties under a long term arrangement. The Long Victor mine was sold during September 2002. The Lanfranchi mine complex is the only mine at Kambalda still owned by WMC Resources. Mining ceased at Lanfranchi at the end of March 2002. It is anticipated that this remaining mine will be sold during 2003. Long-term nickel purchase agreements have been entered with the purchasers, securing the future of these mines, and potentially for other ore bodies on the leases.
Nickel production was 9,708 tonnes of nickel-in-concentrate for the six months ended June 30, 2002 and 18,653 tonnes of nickel-in-concentrate for the 12 months ended December 31, 2001.
The net written down value of property and associated plant and equipment at Kambalda Nickel Operations at June 30, 2002 was A$111.3 million.
Leinster Nickel Operations
Leinster is approximately 375 kilometers north of Kalgoorlie in Western Australia. WMC purchased the Leinster Nickel Operations in 1988 from Mount Isa Mines and Western Selcast. Between 1988 and 1989 the Leinster nickel operations were re-established after WMC acquired 100% of the Agnew nickel mine from Western Selcast and Mount Isa Mines. In January 1989 WMC commissioned rehabilitation of the Leinster nickel concentrator and the Perseverance mine, and commenced mining at Perseverance. WMC diamond drilling extended the known reserve at Rocky’s Reward mine to the north and ore treatment recommenced in May 1989.
The site comprises underground and open pit mines, a concentrator and is supported by the nearby township of Leinster. Leinster production was sourced from the Perseverance underground mine and the Harmony open cut mine during 2001. The Harmony ore body commenced production in the last quarter of 2000. The Leinster mill operating capacity is rated 2.8 million tonnes of ore per year. The utilization of the Leinster concentrator is currently approximately 90%. The concentrate is dried at Leinster before being delivered to WMC Resources’ Kalgoorlie Nickel Smelter for further processing.
Production was 19,174 tonnes of nickel-in-concentrate for the six months ended June 30, 2002 compared to 38,008 tonnes of nickel-in-concentrate for the year ended December 31, 2001.
-42-
| | INFORMATION ON THE COMPANY |
| |
|
The net written down value of property and associated plant and equipment at Leinster Nickel Operations at June 30, 2002 was A$292.9 million. Reserves are equivalent to approximately eleven years life at current production rates.
Mount Keith Operations
Mount Keith is located in Western Australia, approximately 450 kilometers north of Kalgoorlie and 80 kilometers north of Leinster. The Mount Keith deposit is a low-grade disseminated sulphide ore body averaging some 0.6% nickel that is mined by open-cut method. The operation includes a concentrator and ancillary facilities. Development of the deposit began in March 1993 and was officially commissioned in January 1995.
WMC Resources has an agreement to sell half of the annual production of nickel-in-concentrate from Mount Keith, up to a maximum of 14,000 tonnes of nickel-in-concentrate per year to OMG Harjavalta Nickel Oy. The contract term will expire when 140,000 tonnes in total have been delivered, which is expected to occur in the first quarter of 2005. Mount Keith concentrates not contracted for sale are transported by road to Leinster or Kambalda for drying and blending with other concentrates and then delivered to the Kalgoorlie Nickel Smelter for smelting.
Production of nickel-in-concentrate was 21,570 tonnes for the six months ended June 30, 2002 compared to 47,930 tonnes for the year ended December 31, 2001. The nominal capacity of the Mount Keith concentrator is 11.2 million tones of ore per annum. It currently has a utilization rate of approximately 95%. Average nickel recoveries of over 70% were achieved in 2001. A pre-feasibility study has recently been completed which indicates that the milling capacity at Mount Keith could be increased by up to 30%.
The net written down value of property and associated plant and equipment at Mount Keith Operations at June 30, 2002 was A$369.7 million. Reserves included in the current mine plan will be depleted in approximately 16 years at current production rates.
Kalgoorlie Nickel Smelter
The Kalgoorlie Nickel Smelter was constructed by WMC Resources and commenced operation in 1972 to supply nickel matte under sales contracts to overseas nickel refiners and also to supply WMC Resources’ nickel refinery at Kwinana. The smelter receives supplies of concentrate from the Kambalda, Leinster and Mount Keith treatment plants. A flash smelting process is used to produce matte containing 67% to 74% nickel and 2% to 3% copper.
The Kalgoorlie Nickel Smelter also produces sulphuric acid. Most of the sulphuric acid is sold to nickel laterite operations in the Kalgoorlie area, with some acid being used at the Mount Keith and the Kwinana Nickel Refinery. In the six months ended June 30, 2002, 233,227 tonnes of sulphuric acid were produced compared to 532,103 tonnes in the previous 12 months.
The Kalgoorlie Nickel Smelter processed 300,208 tonnes of concentrate for the six months ended June 30, 2002 to produce 41,704 tonnes of nickel-in-matte, compared to 704,300 tonnes of concentrate in the year ended December 31, 2001 to produce 96,650 tonnes of nickel-in-matte.
In the six months ended June 30, 2002 approximately 74% of the nickel-in-matte produced, and in the year ended December 31, 2001 approximately 64% of the nickel-in-matte produced, was sent by rail to WMC Resources’ refinery at Kwinana where it was refined to nickel metal. The remainder was exported.
The net written down value of property and associated plant and equipment at the Kalgoorlie Nickel Smelter at June 30, 2002 was A$241.4 million
-43-
| | INFORMATION ON THE COMPANY |
| |
|
Kwinana Nickel Refinery
The Kwinana Nickel Refinery is 30 kilometers south of Perth in Western Australia. The refinery, constructed by WMC Resources, commenced operation in 1970 and uses the Sherritt-Gordon ammonia leach process to convert nickel matte from the Kalgoorlie Nickel Smelter into LME grade nickel briquettes and nickel powder. A small amount of higher grade nickel concentrate from Mount Keith has on occasion been used to supplement matte as feedstock. The refinery also produces a number of intermediate products, including a copper sulphide, cobalt-nickel sulphide and ammonium sulphate. The cobalt-nickel sulphide is treated by a third-party processor that separates the nickel and cobalt into metal. WMC Resources receives a credit for the nickel and has the cobalt metal returned for subsequent sale.
The refinery treated 49,039 tonnes of matte to produce 30,904 tonnes of refined nickel for the six months ended June 30, 2002 compared to treating 94,208 tonnes of matte to produce 61,324 tonnes of refined nickel for the year ended December 31, 2001. Work on expanding the refining capacity to 67,000 tonnes of nickel metal per year, was completed during 2001.
The net written down value of property and associated plant and equipment at the Kwinana Nickel Refinery at June 30, 2002 was A$308.2 million
See Item 4D “Environmental Matters” for a discussion of an outstanding environmental issue at the Kwinana Nickel Refinery.
-44-
| | INFORMATION ON THE COMPANY |
| |
|
Markets and Competition
Nickel is used primarily in alloys to impart strength, toughness and corrosion resistance. It is principally used in the production of stainless steel, low alloy steels, nickel based alloys and for electroplating. Stainless steel accounted for approximately 63% of western world primary nickel demand in 2001 and this percentage is expected to increase as stainless steel is expected to grow faster than other nickel applications.
In the Western World, growth in demand for stainless steel has consistently outstripped growth in industrial production, as shown in the chart below.
Source: Brook Hunt
-45-
| | INFORMATION ON THE COMPANY |
| |
|
The London Metal Exchange is the central price setting market for most nickel. Nickel prices in 2001 ranged from US$2.00/lb to US$3.42/lb (average daily cash settlement). Nickel price weakness in 2001 was largely attributable to slowing world economic activity and increased scrap recycling and mine production. Management believes that the medium to long term outlook is positive, with limited new supply coming on-stream in the near term and expected continued growth in consumption through growth in stainless steel production. The chart below sets forth historical prices for nickel.
Source: CRU Ni Market Service October 2001
WMC Resources sells nickel metal, nickel matte, nickel concentrate and various intermediate-products. Most of WMC Resources’ nickel metal sales are made under short to medium term contractual arrangements. Nickel metal sales are made to a large number of customers in Europe, North America and Asia. WMC Resources also maintains websites for the sale of uncontracted nickel and cobalt metal.
Approximately 75% of nickel-in-matte sales for the six months ended June 30, 2002 and 77 % for the year ended December 31, 2001 were made to Sumitomo Metal and Mining Company Limited of Japan (“Sumitomo”). WMC Resources has 10-year contracts with Sumitomo for a total of 26,000 tonnes of nickel-in-matte per year. These contracts expire progressively between 2002 and 2005. This contractual arrangement is an extension of WMC Resources’ long-standing relationship with Sumitomo. WMC Resources has been providing Sumitomo with nickel matte on a consistent basis since the late 1960s. WMC Resources will seek to renew these agreements prior to their expiry consistent with its past course of dealing with Sumitomo. If, for any reason, one or more of these contracts are not renewed or replaced with new contracts with Sumitomo, WMC Resources will pursue other avenues for the disposition of its nickel matte products and believes ample potential purchasers are available to pick up any lost sales to Sumitomo.
-46-
| | INFORMATION ON THE COMPANY |
| |
|
2. COPPER/URANIUM
WMC Resources’ Olympic Dam Operations in South Australia are a significant Australian producer of both copper and uranium oxide. WMC Resources’ Olympic Dam subsidiary assumed 100% ownership of the Olympic Dam Operations on March 31, 1993 after previously holding 51% in the joint venture that established operations at Olympic Dam.
WMC Resources treated 4.5 million tonnes of ore to produce 87,826 tonnes of copper and 1,192 tonnes of uranium oxide for the six months ended June 30, 2002. Production for the 12 months ended December 31, 2002 was 200,523 tonnes of copper and 4,379 tonnes of uranium oxide. In the six months ended June 30, 2002 Olympic Dam produced 37,605 ounces of gold and 321,283 ounces of silver, compared to the annual 2001 production of 113,412 ounces of gold and 912,859 ounces of silver. Olympic Dam is currently undertaking an optimization project to increase production capacity to 235,000 tonnes per annum of refined copper.
A summary of WMC Resources’ Olympic Dam copper, uranium oxide and gold and silver production is set out below
OLYMPIC DAM PRODUCTION SUMMARY |
|
| | | | | Six Months Ended June 30, 2002
| | Year Ended December 31, 2001
| | Year Ended December 31, 2000
| | Year Ended December 31, 1999
| | Year Ended December 31, 1998
| | Six Months Ended December 31, 1997
| | Year Ended June 30, 1997
|
| | | | | Olympic Dam
|
| Ore treated | | ‘000s tonnes | | 4,466 | | 9,336 | | 8,901 | | 6,743 | | 3,405 | | 1,631 | | 3,004 |
| Grade of Ore: | | | | | | | | | | | | | | | | |
| Copper | | % | | 2.53 | | 2.47 | | 2.53 | | 2.69 | | 2.72 | | 2.90 | | 3.00 |
| Uranium oxide concentrate | | kilograms/tonne | | 0.65 | | 0.72 | | 0.73 | | 0.78 | | 0.80 | | 0.76 | | 0.86 |
| Gold | | grams/tonne | | 0.54 | | 0.59 | | 0.53 | | 0.65 | | 0.56 | | 0.60 | | 0.50 |
| Metal Produced: | | | | | | | | | | | | | | | | |
| Refined copper | | tonnes | | 87,826 | | 200,523 | | 200,423 | | 138,272 | | 73,645 | | 41,120 | | 75,444 |
| Uranium oxide concentrate | | tonnes | | 1,192 | | 4,379 | | 4,539 | | 3,221 | | 1,740 | | 805 | | 1,758 |
| Gold | | ounces | | 37,605 | | 113,412 | | 69,967 | | 30,510 | | 31,590 | | 15,521 | | 28,410 |
| Silver | | ounces | | 321,283 | | 912,859 | | 625,143 | | 245,078 | | 306,679 | | 175,266 | | 346,842 |
In July 2002, WMC announced a review of the smelting operations had identified that deterioration in excess of expectations in the furnace roof and sidewall refractory, and in adjacent taphole cooling jackets, will require increased maintenance and consequential down time that will impact production.
The review found that it would be prudent from an operating risk perspective to advance plans to reline the Olympic Dam furnace which was previously scheduled for a smelter shutdown in the first half of 2004. The reline will be brought forward to the second half of 2003. Relining the furnace will take approximately 40 days impacting copper and uranium oxide production, cash generation and costs. The cash cost of relining the direct-to-blister furnace, including cooling jacket replacement and improvements, are estimated to be A$50 million. Associated refurbishment and repairs to the smelter, anode furnaces, slag furnace and sulphuric acid plant, normally scheduled to coincide with each smelter reline, are estimated to cost an additional A$40 million. Modifications to improve the capability of the gas handling system and acid plant will also be undertaken at the same time at an estimated cost of A$30 million.
-47-
| | INFORMATION ON THE COMPANY |
| |
|
Production of refined copper is estimated to be approximately 196,000 tonnes in 2003 due to the shutdown in the second half of 2003. The plant is scheduled to operate at a capacity of 235,000 tonnes per annum of refined copper by the end of 2003. The table below shows WMC Resources’ proven and probable copper, uranium oxide and gold ore reserves.
The reserves include adjustments for dilution and mine recovery loss during the mining process but do not include adjustments for metallurgical recovery. The commodity prices used to estimate the 2001 ore reserves were: A$1.42/lb for copper, A$23.33/lb for uranium and A$475/oz for gold. At the 2001 average exchange rate this equates to US$0.73/lb for copper, US$11.96/lb for uranium and US$244/oz for gold. The uranium price reflects a premium over the spot price based on long-term contracts.
OLYMPIC DAM ORE RESERVES |
|
As at December 31, 2001 |
| | | | | Average Metallurgical Recovery Expected
| | Type of Reserve
| | Proven Ore(4)
| | Probable Ore(5)
| | Total Ore
|
| | | | �� | %
| | | Quantity (millions of tonnes)
| | Grade
| | Quantity (millions of tonnes)
| | Grade
| | Quantity (millions of tonnes)
| | Grade
|
| Copper | | % | | 93 | | u/g | | 123 | | 2.4 | | 594 | | 1.5 | | 717 | | 1.7 |
| Uranium | | kg/tonne | | 73 | | u/g | | 123 | | 0.6 | | 594 | | 0.5 | | 717 | | 0.5 |
| Gold | | gram/tonne | | 60 | | u/g | | 123 | | 0.6 | | 594 | | 0.6 | | 717 | | 0.6 |
(1) | | Reserves at Olympic Dam contain copper, uranium, gold and silver. Quoted copper, uranium and gold grades are for the same reserve tonnage. |
(2) | | Ore reserves reflect tonnages recoverable from mining as they include adjustments for dilution and mine recovery loss during the mining process, although they do not include adjustments for metallurgical recovery. |
(3) | | Olympic Dam is 100% owned. |
(4) | | For proven reserves an indicative drill spacing of £40m x 40m has been used. |
(5) | | For probable reserves an indicative drill spacing of £80m x 80m has been used. |
Olympic Dam’s current strategic approach can be summarized as follows:
| | • | | In the short term, complete the current optimization project and achieve 235,000 tonnes per annum of copper production; |
| | • | | Complete cost reduction programs to achieve unit cost of sales of below A$0.85/lb; |
| | • | | Maintain the business as a low-cost producer; |
| | • | | Continue productivity improvements; and |
| | • | | Review further expansion options. |
-48-
| | INFORMATION ON THE COMPANY |
| |
|
Due to the size of the Olympic Dam ore body, there is potential to increase the size of the operation further. Work to examine a number of options is underway. However, any further expansion of Olympic Dam beyond the current optimization project will first require various regulatory and governmental approvals covering a range of operational issues.
Olympic Dam Operations
The Olympic Dam copper, uranium, gold and silver deposit was discovered by WMC Resources in 1975, 560 kilometers north-west of Adelaide in South Australia. It comprises a large number of discrete ore zones throughout an area of several square kilometers ranging in depth from 350 meters to approximately one kilometer. The Olympic Dam underground mining operation is highly mechanized, with automated rail transportation and underground crushing. The primary method of ore extraction is long hole open stoping with cemented aggregate fill. This method allows for large equipment to achieve high productivity and maximum ore recovery.
Ore is hoisted to the surface where it is fed to one of two grinding circuits. After grinding, the resultant slurry passes to a flotation circuit where a series of flotation stages and a further regrinding activity produce a copper concentrate. The concentrate then passes through a leaching circuit which is principally designed to extract uranium from the copper minerals. Uranium is extracted in a solvent extraction plant, producing yellow-cake, which is subsequently calcined to produce uranium oxide concentrate and then packaged in drums for export sales.
After drying, copper concentrate is fed to an Outokumpu flash furnace smelter, which produces blister copper and flash furnace slag. In 2001, the annual through-put of the smelter was 407,000 tonnes of concentrate. At the completion of the current optimization project the smelter’s capacity is expected to increase to 515,000 tonnes per year of concentrate.
Blister copper is transferred to anode furnaces for fire refining. Anode copper is transported to the refinery where the ISA electrorefining process is used to produce copper cathodes. The slimes from this process are treated separately to recover gold and silver.
Power for the Olympic Dam operations is supplied via a 275kV power line from Port Augusta, with power supplied currently under contract until July 2002 by NRG Flinders and transmitted by Electranet in accordance with the National Electricity Code and the Electricity Act 1996 (SA) (as amended). Subject to final approval by WMC Resources, a letter of intent has been given to TXU Electricity Limited for WMC Resources to enter into a four year contract for the supply of electricity to Olympic Dam from July 1, 2002.
Water supply for Olympic Dam is accessed from bore fields which draw from the Great Artesian Basin in South Australia. The operation has licenses from the relevant authorities to allow a drawdown (aquifer pressure) estimated to be the equivalent of 42 megalitres per day of which 33 megalitres per day is currently used.
The Olympic Dam Operation produces both LME accredited electrolytic refined copper cathode and electro-won copper which is not LME accredited. Production at Olympic Dam commenced in 1988 at a rate of 45,000 tonnes per year of refined copper. Between 1989 and 1995, the production rate was increased, ultimately raising the ore mining capacity to approximately 3 million tonnes per year to supply a copper production capacity of approximately 85,000 tonnes per year. In 1999 a major expansion of operations at Olympic Dam was completed with production capacity increasing to approximately 200,000 tonnes of refined copper, 4,300 tonnes of uranium oxide, 75,000 ounces of refined gold and 850,000 ounces of refined silver per year.
The Olympic Dam Operation experienced a fire in the Copper Solvent Extraction Circuit in 1999 which resulted in a loss of approximately 7,150 tonnes of copper production. A further fire in both the copper and uranium solvent extraction area was also experienced in 2001. The cost of the rebuild is expected to be approximately A$250 million with the uranium circuit scheduled to be completed in the last quarter of 2002 and the copper circuit in April 2003. The rebuild cost
-49-
| | INFORMATION ON THE COMPANY |
| |
|
and costs of lost production will be partially offset by insurance proceeds which will include insurance proceeds for business interruption and material damage.
WMC Resources is currently increasing annual capacity to 235,000 tonnes of refined copper a year for a capital cost of approximately A$85 million. The optimization project will result in increased refinery capacity and improve efficiency in the milling and hydro-metallurgy areas. Environmental approvals from the Federal and State Australian Governments exist to permit production of up to 350,000 tonnes of refined copper per year.
The net written down value of property and associated plant and equipment at Olympic Dam at June 30, 2002 was A$2.7 billion. Reserves included in the current mine plan will be depleted in approximately 20 years at current production rates.
The Indenture Agreement
On June 21, 1982, the Government of South Australia, by an Act of the Parliament of that State, the Roxby Downs (Indenture Ratification) Act of 1982, ratified an agreement between the State of South Australia and the then-current Olympic Dam Operation joint venturers. This Act:
| | • | | levies an ad valorem royalty of 3.5% on the value of the products dispatched from the mine. A second tier of additional royalty is also levied when the after-tax rate of return from the operation is greater than a threshold rate of 1.2 times the 10-year Australian government bond rate. After December 31, 2005, the royalty reverts to the royalty under the State Mining Act which, at present, is 2.5%; |
| | • | | confers continuing mining rights (via a Special Mining Lease) at Olympic Dam Operation until the deposit is economically mined out; |
| | • | | confers the right to draw water supplies; |
| | • | | provides Government infrastructure and services; and |
| | • | | permits production of up to 350,000 tonnes of copper per year. |
The Special Mining Lease relating to WMC Resources’ Olympic Dam Operation is granted for a period of fifty years with rights of extension for further periods of fifty years.
For information on native land claims refer to Item 8A “Legal Proceedings”.
-50-
| | INFORMATION ON THE COMPANY |
| |
|
Markets and Competition
Copper
Industrial usage of copper derives from its electrical and thermal conducive properties, its durability and strength. Copper has many end uses, as illustrated below.
Source: Brook Hunt
The principal copper producing countries of the world are Chile, USA, Indonesia, Canada and Australia. The five largest individual copper producers (and WMC Resources) are detailed below.
Leading Copper Producers in 2001
Rank
| | Company
| | Mine Production ‘000tonnes
| | % of World Production
|
| 1 | | Codelco | | 1,701 | | 12.4 |
| 2 | | Phelps Dodge | | 1,068 | | 7.8 |
| 3 | | BHP Billiton | | 973 | | 7.1 |
| 4 | | Rio Tinto | | 834 | | 6.1 |
| 5 | | Grupo Mexico | | 712 | | 5.2 |
| | | |
| |
|
| 15 | | WMC Resources | | 201 | | 1.5 |
Source : Brook Hunt
-51-
| | INFORMATION ON THE COMPANY |
Copper is an internationally traded commodity, traded on the LME in London and the COMEX division of the New York Mercantile Exchange in New York. The chart below depicts historical copper prices.
Source: ABMS, LME.
The average copper price in 2001 was US$0.72/lb (US$1578/tonne). Prices in 2001 were weak due to the world economic slow down and new mine production coming on line. In response to the decline in prices, key copper producers have announced mine production cuts of 540,000 tonnes for the coming year. US producers have also been impacted by the strength of the US$ and in some cases by higher energy prices.
Olympic Dam’s copper production is sold to customers in Europe, Australia and Asia under contracts which are negotiated annually. Contract prices are based on the LME cash settlement price.
Uranium Oxide – as a co-product to copper at Olympic Dam
The only significant commercial end use of uranium is as fuel for nuclear power electricity generating plants. Nuclear power currently accounts for approximately 16% of the world’s electricity requirements. Depending upon overall growth of electricity production from other sources, nuclear power’s share is expected to decline over the decade to comprise approximately 13 to 14% of total electricity production by 2010. Production is spread among a number of countries with Canada and Australia being the largest producers. The industry is dominated by a small number of large producers. Worldwide annual mine production amounts to approximately 46,000 tonnes of uranium oxide.
-52-
| | INFORMATION ON THE COMPANY |
| |
|
The rapid growth of uranium consumption in the 1970’s and 1980’s slowed in the 1990’s with reduced construction of new power reactors. However demand has continued to strongly outstrip mine supply requiring continued draw-down of diminishing secondary stockpiles. Former Russian military uranium has been entering the commercial market in increasing quantities since 1995. The recent and expected future rate of such market entry is 24 million lbs Uranium Oxide per year.
In the near term, Russian uranium will probably keep the uranium spot price lower than it would otherwise be, but in the longer term this material is expected to be needed to meet commercial demand and therefore is not expected to materially affect price. However, depending on the level of future commercial uranium prices, the presence of former Russian military uranium may result in the deferral of one or more new mine projects the development of which price sensitive. For various reasons, it is unlikely that former US military uranium will become available to the commercial market during the next 10-year period.
Uranium oxide is not traded on an official exchange and the spot market is highly illiquid as most uranium oxide is sold under long term contract (three to ten years). In spite of this, the spot market is important as pricing under a significant portion of long term contracts is linked to the spot market. Spot prices in 2001 averaged US$8.61/lb uranium oxide. The chart below depicts historical spot prices.
Source: TradeTech
WMC Resources’ objective is to match sales of uranium to production, with the bulk of production committed under long-term sales contracts with well established and reputable electricity generating utilities. Sales of uranium oxide in 2001 were made to the United Kingdom, Finland, Sweden, Belgium, France, Japan, Canada and the United States.
Uranium is exported in accordance with Australian government regulations and the requirements of bilateral safeguards agreements between the Australian government and the recipient’s national government.
-53-
| | INFORMATION ON THE COMPANY |
3. FERTILIZER
WMC Resources holds mining leases over two phosphate deposits in north-west Queensland. Its major phosphate resource is located at Phosphate Hill, 140 kilometers southeast of Mount Isa. The principal activities at Phosphate Hill are conducted on Mining Lease 5543 which expires on October 31, 2035. Currently, mining is from three open pits using excavators and trucks. Ore is treated through a beneficiation plant which has a four stage process of crushing, washing and de-sliming, grinding, thickening and slurry storage. The construction of the Queensland Fertilizer Operation was completed at the end of 1999, and commissioning of the integrated plant was carried out during 2000.
Sulphuric acid is sourced from a WMC Resources owned acid plant located adjacent to MIM Holdings Limited’s Mt Isa smelter and from the Korea Zinc plant at Townsville. The acid plant has a production capacity of approximately 1.2 million tonnes of sulphuric acid per year. The agreement with MIM to convert the smelter off-gases to sulphuric acid obligates both parties on a “reasonable endeavors” basis. If for some reason sulphur dioxide gas is unavailable, the acid plant burns sulphur to produce sulphur dioxide. Sulphuric acid is transported to Phosphate Hill in specially designed rail tanker wagons.
Sulphuric acid is combined with filter cake from the beneficiation plant in a phosphoric acid plant to produce phosphoric acid and gypsum. The phosphoric acid plant at the Queensland Fertilizer Operations is a hemihydrate plant with a production capacity of 1,500 tonnes per day.
In the ammonia plant, ammonia is produced by combining hydrogen from natural gas and nitrogen from air. In the granulation plant, the phosphoric acid is reacted with ammonia to form ammonium phosphate slurry which is pumped into the granulator where it forms granules of fertilizer, either Di-ammonium phosphate (“DAP”) or Mono-ammonium phosphate (“MAP”). Final product is then transported by rail to handling and storage facilities in Townsville under the terms of a 20 year take or pay rail transport contract with Queensland Rail to a maximum annual tonnage of approximately one million tonnes. The Townsville storage facilities have a capacity of 90,000 tonnes.
Gypsum is stored onsite at Phosphate Hill in large lined dams. Gypsum storage and disposal is a significant cost for the operation as the production process produces large quantities of gypsum. WMC Resources is currently exploring longer term low cost alternatives for the storage and or use of the gypsum produced.
Power at Phosphate Hill is sourced from on-site third party gas fired turbines. Natural gas for power and ammonia production is purchased under a long term contract with Santos Ltd (and others). This gas is sourced from the Cooper Basin gas fields in south-west Queensland via the AGL Carpentaria gas pipeline.
-54-
| | INFORMATION ON THE COMPANY |
Water is sourced from a series of bores into nearby aquifers within the mining lease area. These should be adequate to meet requirements for at least 10 to 15 years. Access to other identified sources is currently being pursued.
The current principal strategic objectives for the Queensland Fertilizer Operations are:
| | • | | Consolidate operating performance at or above design capacity; |
| | • | | Optimize and improve production efficiency to reduce operating costs and obtain additional low-cost production; |
| | • | | Develop domestic and export markets; |
| | • | | Increase production of MAP based products; and |
| | • | | Review further expansion options. |
Following a period of poor returns the domestic and international fertilizer markets are undergoing consolidation. Queensland Fertilizer Operations will consider all its strategic options to participate in this process.
Investigations are currently underway into increasing the percentage of MAP produced and into the possible introduction of sulphur fortified MAP for which there may be increased market demand.
The table below details principal components and location of the Queensland Fertilizer Operations:
-55-
| | INFORMATION ON THE COMPANY |
In 2001, the first full year of Queensland Fertilizer Operations, a number of significant milestones were achieved. A statutory pressure vessel shutdown of the ammonia plant was completed in August, during which time the opportunity was taken to undertake maintenance activities in the rest of the plant. Following the shutdown production subsequently increased. In November 2001, the operations produced the first 58,000 tonnes of MAP (mono-ammonium phosphate). Total fertilizer production for the six months ended June 30, 2002 was 398,177 tonnes. For the year ended December 31, 2001, total fertilizer production was 709,445 tonnes.
A production efficiency study is underway to investigate ways to increase annual production of phosphate fertilizer to 1.06 million tonnes. A companion study is underway to evaluate options for upgrading ore, either through flotation or ore sorting, to further increase annual capacity to 1.3 million tonnes of phosphate fertilizer, but as yet no definitive economic option has been proposed.
PHOSPHATE HILL PRODUCTION SUMMARY |
|
| | | Six Months Ended June 30, 2002
| | Year Ended December 31, 2001
| | Year Ended December 31, 2000
| | Year Ended December 31, 1999
| | Year Ended December 31, 1998(2)
|
| | | (tonnes) |
| Di-ammonium phosphate (DAP) | | 339,069 | | 651,498 | | 326,262 | | 5,143 | | — |
| Mono-ammonium phosphate (MAP) | | 59,108 | | 57,947 | | — | | — | | — |
The table below shows WMC Resources’ proven and probable phosphate ore reserves. The reserves include adjustments for dilution and mine recovery loss during the mining process but do not include adjustments for metallurgical recovery. The commodity price used to estimate the 2001 ore reserves was A$300/t (for DAP). At the 2001 average exchange rate this equated to US$154/t (for DAP).
PHOSPHATE HILL ORE RESERVES |
As at December 31, 2001 |
Type of Reserve(1)
| | Proven Ore (4)(6)
| | Probable Ore (5)(6)
| | Total Ore
|
| | Quantity (millions of tonnes)
| | Grade (% P205)
| | Quantity (millions of tonnes)
| | Grade (% P205)
| | Quantity (millions of tonnes)
| | Grade (% P205)
|
| o/c | | 25.3 | | 24.2 | | 65.5 | | 24.1 | | 90.8 | | 24.2 |
| s/p | | 0.2 | | 25.7 | | — | | — | | 0.2 | | 25.7 |
(1) | | o/c = open cut, s/p = stockpile |
(2) | | Ore reserves reflect tonnages recoverable from mining as they include adjustments for dilution and mine recovery loss during the mining process, although they do not include adjustments for metallurgical recovery. |
(3) | | Phosphate Hill is 100% owned. |
(4) | | For proven reserves an indicative drill spacing of £40m x 40m has been used. |
(5) | | For probable reserves an indicative drill spacing of £120m x £120m has been used. |
-56-
| | INFORMATION ON THE COMPANY |
(6) | | The metallurgical recovery assumption used in the above table of P205 recovery (combined Beneficiation Plant and Phosphoric Acid Plant P205 recoveries) is 82% for 2002 to 2004, and 77% from 2005 onwards. |
The net written down value of property and associated plant and equipment at the Queensland Fertilizer Operations at June 30, 2002 was A$860 million. Under the demerger, Queensland Fertilizer Operations, along with other assets and liabilities, were transferred from WMC Limited to WMC Resources at a “fair value”. In the case of Queensland Fertilizer Operations the fair value adjustment resulted in a writedown of the carrying value by A$318 million to A$542 million. Reserves included in the current mine plan will be depleted in approximately 18 years at current production rate.
Markets and Competition
WMC Resources’ wholly owned subsidiary, Hi-Fert Pty Ltd, is a distributor of fertilizers in Australia. During 2001 WMC Resources pursued a market development strategy, supporting the continued growth in production from its fertilizer operations. The focus for fertilizer products is the Australian market, which yields good margins for these operations. Marketing arrangements are in place for the total fertilizer production (at 2002 volumes). Supply contracts are in place with major Australian fertilizer distributors for the delivery of between 440,000 and 590,000 tonnes of DAP per year, depending on customer requirements. Contracts covering domestic MAP sales of between 120,000 and 200,000 tonnes per year will become effective once commercial production volumes are commenced. WMC Resources has contracted to sell to Cargill Fertilizers Incorporated 350,000 tonnes per year of high analysis fertilizer for sale into Asia. The arrangement with Cargill provides for up to 500,000 tonnes per year to be sold through Cargill if required by WMC Resources.
High analysis fertilizers based on phosphoric acid are increasing their market share due to their high nutrient content and savings in storage, handling, transportation and application costs. About half of the high analysis fertilizer produced is traded internationally because production is concentrated in a small number of countries. International trade is based on the supply from the two major production regions, the U.S. Gulf of Mexico and North Africa. The North African producers generally export to Western Europe, the North American producers to Asia, South America, Australia and New Zealand.
Most high analysis fertilizer pricing is based on U.S. Gulf of Mexico prices. DAP prices have been depressed in recent years due to weak demand and over-supply. DAP prices in 2001 averaged US$147/tonne (fob U.S. Gulf of Mexico). Due to price weakness and increasing costs, there have been recent significant production cutbacks in North America and both this and industry consolidation is expected to continue.
-57-
| | INFORMATION ON THE COMPANY |
The chart below depicts historical U.S. Gulf of Mexico DAP prices.
Source: Fertecon
4. EXPLORATION AND NEW BUSINESS
Minerals Exploration
Exploration is a core component of WMC Resources’ growth management strategy. WMC Resources’ global minerals exploration program seeks to deliver mineral discoveries that provide significant growth opportunity in locales where it can effectively manage the business and technical risks. During 2001, exploration was conducted in Australia, Brazil, Canada, Chile, China, Peru and the U.S.A.
WMC Resources spent A$9.0 million on minerals exploration for continuing operations for the six months ended June 30, 2002. Expenditure for the year ended December 31, 2001 was A$62.9 million. The annualised decrease was due to a significant recent restructuring of the exploration function. Exploration continued to focus on greenfields, targeting and testing for deposits of nickel, copper and gold. In 2001, significant nickel, copper and platinum group element mineralization was detected through an extensive drilling program at the West Musgrave project, Western Australia.
-58-
| | INFORMATION ON THE COMPANY |
West Musgrave, Western Australia
During 2000 and 2001 WMC Resources received results from the West Musgrave area of Western Australia. Two prospects, 4 kilometers apart, were tested by diamond drilling targeted on separate geophysical anomalies, with both intersecting nickel and copper sulphide mineralization.
In 2001, WMC Resources announced encouraging drill results from the Nebo and Babel prospects in the West Musgrave area of central Western Australia. Drilling continued during 2001 on those prospects. Results have been variable, although significant nickel, copper sulphide and platinum group metal mineralization has been drilled over a strike extent of five kilometers. The assessment and interpretation of these results is continuing.
Exploration in this area is currently focused on identifying thicker zones of massive mineralization at both Nebo and Babel while broader, regional exploration continues. WMC Resources currently manages more than 7,600 square kilometers of granted exploration tenure in the region. A regional electromagnetic survey covering approximately 3,200 square kilometers of prospective tenure in the region has recently been completed. The results of this survey are still being interpreted in preparation for ground follow-up of prospective anomalies. WMC Resources have recently begun negotiations with the Ngaanyatjarra Land Council for a land access agreement to fly an airborne electromagnetic survey that would allow exploration access over an even broader area in the region.
New Business
Mozambique
Corridor Sands Project
The Corridor Sands heavy minerals project contemplates the exploitation of large, currently undeveloped mineral sands deposits situated in southern Mozambique.
In November 2000, after an earlier due diligence investigation, WMC Limited paid Southern Mining Corporation Limited US$15 million for an exclusive option to study and acquire a controlling interest in the project. A bankable feasibility study was completed in 2002.
The project envisages a world-scale integrated mining, concentration and smelting operation to produce titanium dioxide slag, used to produce pigments for brightness and opacity in the manufacture of paint, paper and plastics.
WMC has entered into discussions with Southern Mining Corporation with a view to purchasing their interest in the project. If successful, part of the consideration would be by way of issue of WMC Limited Shares in an amount between 1 and 1.5 percent of issued share capital.
-59-
| | INFORMATION ON THE COMPANY |
Environmental Matters
WMC Resources’ environmental policy is to achieve compatibility between economic development and the maintenance of the environment and to comply with all applicable environmental laws. Primary responsibility for environmental matters rests with local management. A corporate environment group provides technical and professional support to the line organization in its execution of the environment policy and undertakes independent environmental audits of operations. Environmental compliance is reported quarterly by each operation. Initiatives for the improved use of water and energy and other resources have been introduced, as have initiatives for the reduction of certain emissions to the atmosphere. An environmental management system, consistent with the requirements of ISO14001 is operational at all of WMC Resources’ operations. WMC Resources published its sixth annual Environment Progress Report in 2001 (now known as the Sustainability Report).
WMC Resources has mineral-producing operations and conducts exploration in many countries. Its activities are subject to various laws governing the protection of the environment in areas such as air and water quality, emissions, waste disposal, environmental impact assessments, mine rehabilitation and access to, and use of, ground water. Failure to comply with the laws in relation to the above issues may result in sanctions such as fines or orders requiring that additional environmental control equipment be installed or that operations be curtailed.
WMC Resources continues to invest in plant and equipment to improve the operational and environmental performance of its operations and to ensure compliance with regulatory requirements. Operating expenditures continue to be incurred for the recovery of the groundwater at the Baldivis tailings storage facility and Kwinana Nickel Refinery. To December 31, 2001, WMC Resources has spent A$50.4 million on groundwater remediation at its Kwinana and Baldivis facilities. It is anticipated that the work will continue until approximately 2008, at a further cost of A$33.4 million.
Other than the Baldivis and Kwinana groundwater issue, as at December 31, 2001 WMC Resources had 20 outstanding ‘non-compliance’ issues as identified in its public Sustainability Report 2001. None of these issues is considered material in terms of its potential financial impact on WMC Resources nor is any legal action expected to arise from these instances of non-compliance.
WMC Resources has accrued and continues to accrue financial provisions for meeting environmental obligations such as mine closure and rehabilitation together with other long-term liabilities. As at June 30, 2002, WMC Resources had set aside A$91.9 million for such provisions.
WMC Resources cannot reasonably estimate the cost of future compliance or remedial work or further investment necessitated through the introduction of further environmental regulation or by any causes of contamination, including those occurring prior to the introduction of such regulation or before or after the property in question was owned or occupied by WMC Resources. Among other things, the level of such costs will be dependent upon the nature and extent of the current and future environmental regulation, the time and nature of required remedial work, the extent of any contamination, the technology available to meet the required standards, the determination of WMC Resources’ liabilities in proportion to those of other parties and the extent to which costs are recoverable from insurance and third parties.
Australian Mining Law and Leases
In Australia, with few exceptions, all onshore mineral rights are reserved to the Government of the relevant State or Territory. Exploration for minerals is regulated by the general mining legislation of the relevant State or Territory and controlled by the relevant State or Territory government department. Where native title has not been extinguished, native title legislation may apply to the grant of tenure and some subsequent administrative processes (see Item 8A “Legal Proceedings – Native Title in Australia”).
-60-
| | INFORMATION ON THE COMPANY |
Where large-scale mining projects are involved, mining leases can also be granted pursuant to specific legislation of the State or Territory. Such mining leases involve complex agreements with State Governments on matters such as water rights, the size of the mining tenements, protection of the environment, the provision of infrastructure and the payment of royalties. In South Australia, the Olympic Dam Operations special mining lease is an example of this type of agreement (see Item 4D “Property, Plant and Equipment – Copper – Indenture Agreement”).
In addition, a number of mining leases pertaining to the Kambalda Nickel Operations and Leinster Nickel Operations were issued pursuant to the Nickel Refinery (Western Mining Corporation Limited) Agreement Act 1968 (WA) and the Nickel (Agnew) Agreement Act 1974 (WA) respectively.
WMC Resources’ nickel operating properties are located in the State of Western Australia. Upon application to the Western Australian Department of Mineral and Petroleum Resources, the Warden may grant a prospecting license. The Warden is also responsible for providing recommendations in relation to exploration licenses to the Minister who, in turn, may grant an exploration license. Exploration or prospecting licenses generally grant exclusive rights to explore for minerals in an area for a set period, as long as the holder complies with the provisions of the relevant Mining Act relating to conditions of tenure and minimum annual expenditure.
In most Australian States, if the holder of an exploration license establishes indications of an economic mineral deposit and expends a minimum level of investment, it may apply for a mining lease. In Western Australia the maximum area of a mining lease is 10 square kilometers and the maximum initial term is 21 years. A general purpose lease may also be granted for one or more of a number of permitted purposes. These purposes include erecting, placing and operating machinery in connection with mining operations, depositing or treating minerals or tailings and using the land for any other specified purpose directly connected with mining operations.
In Western Australia, the holder of an exploration license can obtain a mining lease without establishing an economic deposit. This gives the holder exclusive mining rights on the property. The Minister for Mines of the State of Western Australia may grant or refuse a mining lease at his discretion, regardless of the Warden’s recommendations. If the applicant is the holder of an exploration license and the holder has complied with the conditions attaching to the exploration license, an application, generally, will be granted. However, a 1994 decision of the Full Court of the Supreme Court of Western Australia held that the “automatic grant” was subject to the Minister’s discretion to refuse the mining lease application on reasonable grounds in the public interest, such as major environmental issues.
Upon expiration of the initial term of a Western Australian mining lease, the holder has the right to renew the lease for a further period of 21 years. Subsequent renewals are subject to the Minister’s discretion.
Holders of mining leases must pay royalties on minerals won from the mining area. The amount of the royalty payable is specified in the relevant legislation. The royalty on sales of nickel in Western Australia is 2.5% of the free on Board contained metal value of nickel sold.
See Item 4D “Property, Plant and Equipment – Copper – Indenture Agreement” for the royalties payable for the Olympic Dam Operations.
In addition to the aforementioned leases, WMC Resources owns freehold property including mineral rights at Kambalda in Western Australia on which nickel mines are operating and the tenure underlying the Olympic Dam Operations. No royalty is payable to the State of Western Australia for nickel production from these mines although a royalty is payable to a prior holder of the freehold property.
A summary of WMC Resources’ significant leases and freehold property for Western Australian, South Australian and Queensland operations follows.
-61-
| | INFORMATION ON THE COMPANY |
| |
|
Operation
| | Relevant Act(s)
| | Term
| | | | Expiration Date of Lease (1)
| | Life of Approved Mine Plan
|
Kambalda Nickel Operations | | Mining Act 1978 (WA) | | Leases are currently within their initial 21 year lease period. A further 21 years is available as of a right renewal. Further renewals are at Minister’s discretion | | ) ) )
| | 2005-2006 2010-2011 2015, 2019 | | 3 |
|
| | | Nickel Refinery (Western Mining Corporation Limited) | | All leases have completed their initial term of 21 years. | | ) ) | | 2007-2008 2014 | | |
| | | Agreement Act 1968 (WA) | | All leases had an option to be renewed for a further period of 21 years. This option has been exercised against all leases. A second renewed term is available for a further period of 21 years. However, grant of this renewal is at the Minister’s discretion. These tenements can also be replaced by WA Mining Act 1978 mining leases in which case they would become subject to the provisions of that Act. | | ) | | 2017-2018 | | |
|
| | | Transfer of Land Act (WA). Mining on Private Property Act 1898 (WA) | | In perpetuity | | | | | | |
|
Leinster Nickel Operations | | Nickel (Agnew) Agreement Act 1974 (WA) | | Lease has completed its initial term of 21 years. Option for a renewed term of a further period of 21 years has been exercised. Lease has unlimited rights for renewal for further periods of 21 years. This lease can also be replaced by WA Mining Act 1978 mining leases in which case they would become subject to the provisions of that Act. | | ) | | 2019 | | 11 |
|
| | | Mining Act 1978 (WA) | | Leases are currently within their initial 21 year lease period. A further 21 years is available as of a right renewal. Further renewals are at Minister’s discretion. | | ) ) ) ) | | 2004 2008-2010 2012-2013 2015 | | |
-62-
| | INFORMATION ON THE COMPANY |
| |
|
Operation
| | Relevant Act(s)
| | Term
| | | | Expiration Date of Lease (1)
| | Life of Approved Mine Plan
|
Mount Keith Operations | | Mining Act 1978 (WA) | | Leases are currently within their initial 21 year lease period. A further 21 years is available as of a right renewal. Further renewals are at Minister’s discretion. | | ) | | 2008 2011-2016 | | 16 |
|
Olympic Dam | | Roxby Downs (Indenture Ratification) Act 1982 (SA) | | 50 years plus right to renew for further periods of up to 50 years | | ) | | 2036 | | 20 |
|
| | | Real Property Act 1886 (SA) | | In perpetuity | | | | | | |
|
Phosphate Hill | | Mineral Resources Act 1989 (Qld) | | 40 years plus renewal periods as negotiated with Queensland Government | | ) | | 2035 | | 18 |
(1) | | There may be a number of lease agreements applicable for each operation |
-63-
| | OPERATING AND FINANCIAL REVIEW AND PROSPECTS |
ITEM 5. OPERATING AND FINANCIAL REVIEW AND PROSPECTS
A. Operating Results
The following discussion of WMC Resources’ operating performance and financial condition uses financial data prepared using Australian GAAP. The differences between US GAAP and Australian GAAP are discussed in Item 3A and outlined in Note 32 to the unaudited Interim Combined Financial Statements and Note 44 to the Combined Financial Statements.
Demerger
WMC Resources was formed as a result of the demerger of WMC Limited into two entities, one holding an interest in the AWAC joint venture and the other constituting the nickel, copper/uranium and fertilizer operations. Pursuant to the demerger, WMC Resources, which already held WMC Limited’s nickel business, acquired WMC Limited’s copper/uranium and fertilizer businesses, two finance vehicles, WMC Finance Ltd and WMC Finance (USA) Ltd, as well as exploration and development interests (other than those relating to AWAC). The interest in AWAC, costs associated with AWAC and exploration and development related to AWAC remained in WMC Limited, now renamed Alumina Limited.
The following discussion of the operating and financial review of WMC Resources has been prepared, like the historical financial statements on which the discussion is based, as though WMC Resources existed as a stand-alone economic entity, consisting of the businesses and assets listed above, for each of the periods presented. This presentation includes the results of operations which have been discontinued, such as gold and talc, the proceeds from the sale of these same discontinued businesses and the associated hedging losses incurred by them. As a result, the financial presentation does not entirely reflect the businesses and assets of WMC Resources on an on-going-forward basis, the latter being focused upon the nickel, copper/uranium and fertilizer businesses.
In addition, although the financial statements include all costs and revenues incurred by WMC Resources for the reported periods, they do not necessarily reflect what the costs and revenues would have been had WMC Resources existed as a separate, stand-alone economic entity during the periods presented. In particular, in order to achieve improved financial outcomes, management might have made different decisions regarding exploration, project evaluation and corporate expenditure activities as well as its capital structure. Some of the uncertainties surrounding WMC Resources operating and financial prospects are described in the section entitled “Risk Factors” on pages 15 and 16 above.
-64-
| | OPERATING AND FINANCIAL REVIEW AND PROSPECTS |
The transactions that occurred in conjunction with the demerger and the manner in which the demerger has been implemented, will also have an affect on WMC Resources’ results of operations and financial position in future years relative to its historical results of operations and financial position discussed in this section. In particular, as part of the demerger, WMC Resources acquired WMC Limited’s copper/uranium and fertilizer businesses and WMC Limited’s international exploration assets and businesses (other than those relating to AWAC) at their fair value as required under Australian GAAP. These internal acquisitions resulted in an increase in WMC Resources’ consolidated property, plant and equipment and will result in correspondingly higher depreciation and amortization expense in future years compared to historical periods. In addition, in connection with the demerger, WMC Resources replaced WMC Limited’s debt facilities and borrowings with new debt facilities and borrowings. As a result, following implementation the demerger, WMC Resources’ level of debt reduced by approximately A$400 million. This lower level of debt will also result in a lower level of annual interest expense associated with borrowings in future years compared to historical periods. Finally, the transfers of WMC Finance Ltd and WMC Finance (USA) Ltd in connection with the demerger resulted in the accounting for the derivative and financial instruments held in these entities at fair value on the date of transfer as required under Australian GAAP. As a result, WMC Resources future earnings will only be impacted, in respect of these instruments, by the movement in commodity prices and exchange rates between the date of transfer and the maturity date, whereas future cash flows will be impacted, in respect of these instruments, by the movement in commodity prices and exchange rates between when the dates when the contracts were originally entered into and the maturity date. For more information regarding the effect of the demerger on WMC Resources’ results of operations and financial position, you should refer to the unaudited pro forma Combined Financial Statements.
Significant Accounting Policies
WMC Resources’ significant accounting policies are more fully described in Note 1 to its Combined Financial Statements, in respect of Australian GAAP, with differences in accounting policies for US GAAP more fully described in note 44 to the Combined Financial Statements. Some of WMC Resources’ accounting policies require the application of significant judgment by management in selecting the appropriate assumptions for calculating financial estimates. By their nature, these judgments are subject to an inherent degree of uncertainty and are based on WMC Resources’ historical experience, terms of existing contracts, management’s view on trends in the mining industry and information from outside sources.
Management believes the following critical accounting policies, among others, affect its more significant judgments and estimates used in the preparation of WMC Resources’ combined financial statements and could potentially impact WMC Resources’ financial results and future financial performance.
WMC Resources’ critical accounting policies include those discussed below.
Amortization of mine properties and mine development assets
Amortization of mine properties is calculated on a straight line basis over the estimated remaining life of those mines or the life of the specific asset, whichever is shorter. Estimates of remaining mine lives are determined as the period of time over which proven and probable reserves determined in accordance with the SEC’s Industry Guide 7 are expected to be extracted.
Amortization of WMC Resources capital cost of mine development is calculated on a units-of-production basis over the proven and probable reserves determined in accordance with the SEC’s Industry Guide 7 included in the current mine plan. In order to calculate the amortization, the total costs of development, including net costs incurred to date and estimated future development costs are totalled and divided by the total proven and probable reserves included in the current mine plan. Annual depletion is calculated based on the units of production during the period multiplied by the per-unit cost.
The estimate of the total expected future lives and production of WMC Resources’ mines could be materially different from the actual production in the future and the actual lives of the mines due to changes in the factors used in determining WMC Resources’ ore reserves, such as the commodity prices and foreign currency exchange rates. Any change in management’s estimate of the total expected future lives of WMC Resources’ mines may impact the amortization charges recorded in WMC Resources’ combined financial statements in relation to mine properties and mine development. In addition, actual future costs of mine development could differ from those estimated for the purpose of determining the rate of amortization.
-65-
| | OPERATING AND FINANCIAL REVIEW AND PROSPECTS |
Where ore has been mined and subsequently stockpiled for future processing, it is included in the determination of proven and probable reserves. However, this stockpiled ore is not included in the total reserves used in the amortization calculation for mine development, as this calculation only references proven and probable reserves included in the current mine plan.
For US GAAP purposes, WMC Resources intends to revise its methodology for the determination of amortization of mine development to exclude future costs from the amortization base. This policy will be reflected in the Company’s annual report on Form 20-F for the 12 months to December 31, 2002, and will be adopted as a cumulative effect adjustment in accordance with APB 20 from January 1, 2002.
Post-production waste removal
All costs of post-production waste removal (stripping) from open pit mines are accumulated, and deferred on the balance sheet as part of the total of mine properties and mine development. These costs include the costs of drilling, blasting, loading and haulage of waste rock from the open pit to the waste pile. Consistent with the methodology described above for amortization of mine development costs, these costs are combined with expected future costs of waste removal and amortized on a units of production basis over proven and probable reserves determined in accordance with the SEC’s Industry Guide 7 included in the current mine plan.
Variations exist in the accounting methods adopted by companies in the mining industry to account for post-production waste removal costs, and certain companies expense these costs as incurred. If the company had not adopted a policy of deferring and amortizing these costs, it would have experienced greater volatility in period to period results.
For US GAAP purposes deferred waste removal costs are considered deferred production costs and classified as other non-current assets in the balance sheet, and operating cash flows in the cash flow statement. Similar to the policy for amortization of mine development costs discussed above, for US GAAP purposes, WMC Resources intends to revise its methodology for the determination of amortization of post-production waste removal costs to exclude future costs from the amortization base. This policy will be reflected in the Company’s annual report on Form 20-F for the 12 months to December 31, 2002, and will be adopted as a cumulative effect adjustment in accordance with APB 20 from January 1, 2002.
Recoverable value of long-lived assets
WMC Resources’ long-lived mining assets are carried at depreciated historical cost. Management annually reviews these carrying values for impairment. Where necessary, the carrying amounts of non-current assets are revalued downwards to their recoverable amount. These reviews are based on undiscounted projections of anticipated future cash flows to be generated by utilizing the long-lived assets.
For US GAAP, long lived mining assets are reviewed for impairment annually and when events or changes in circumstances indicate that the carrying amount of an asset may not be recoverable. If deemed impaired, an impairment loss is measured and recorded based on the fair value of the asset, which generally will be computed using discounted expected future cash flows.
While management believes that these estimates of future cash flows are reasonable, different assumptions regarding projected commodity prices, production costs and foreign currency exchange rates could materially affect the anticipated cash flows to be generated by the long-lived assets, thereby affecting the evaluations of the carrying values of the long-lived assets.
-66-
| | OPERATING AND FINANCIAL REVIEW AND PROSPECTS |
Deferred taxation
When determining deferred taxation, management makes estimates as to the future recoverability of deferred tax assets. If management determines that a deferred tax asset will not be realized, a charge would be recorded for that portion of the deferred tax assets which is not considered recoverable. These determinations are based on the projected realization of tax allowances and tax losses. In the event that these tax assets are not realized, an adjustment would be required to income in the period that the determination was made. Likewise, should management determine that WMC Resources would be able to realize tax assets in the future in excess of the recorded amount, an adjustment to increase the deferred tax asset would be recorded as a credit to income in the period that the determination is made.
Under Australian GAAP, the threshold test that must be met to recognize a deferred tax asset is that recoverability must be virtually certain for tax losses and beyond reasonable doubt for timing differences. Under US GAAP, recoverability of the deferred tax asset must be considered to be more likely than not.
Environmental rehabilitation costs
WMC Resources makes provision for environmental rehabilitation costs and related liabilities based on management’s interpretations of current environmental and regulatory requirements. In addition, final environmental rehabilitation obligations are estimated based on these interpretations, with provisions made over the expected lives of WMC Resources’ operations. While management believes that the environmental rehabilitation provisions made are adequate and that the interpretations applied are appropriate, the amounts estimated for the future liabilities may differ materially from the costs that will actually be incurred. The estimated cost of rehabilitation is re-assessed on a regular basis. If management determines that an insufficient rehabilitation provision has been created, earnings will be adjusted prospectively. Rehabilitation provisions as at June 30, 2002 were A$91.9 million, compared to estimated total future costs of A$358.9 million.
Accounting for derivative instruments and hedging activities
WMC Resources defers certain unrealized gains and losses on derivatives contracts that are used to hedge changes in cash flows from forecasted transactions, and brings these amounts to account when the hedged transaction is recognized in income. Refer to item 11 “Qualitative and Quantitative Disclosures about Market Risks”, as well as note 1(e) to the Combined Financial Statements for an expanded discussion of the Company’s accounting policy under Australian GAAP, and note 44 (j) for discussion under US GAAP. The hedged forecasted transactions are based on detailed production forecasts, which are based on the mine plans, and amounts hedged are based on a portion of the Company’s reserves determined in accordance with the SEC’s Industry Guide 7, and as determined in accordance with the Company’s treasury risk management guidelines. On this basis, the forecasted transactions are considered to be probable of occurring, however changes in ore reserves due to changes in commodity prices or exchange rates could result in these transactions failing to occur, in which case, any unrecognized gains or losses on derivative contracts would be brought to account immediately.
Introduction
WMC Resources’ operations during the three-year period to December 31, 2001 were characterized by a focus upon its core businesses of nickel, copper/uranium (Olympic Dam) and fertilizers (Phosphate Hill). This strategy, begun in the 1990s when the WMC Resources operations were part of WMC Limited, included major investment and restructuring to enhance the competitiveness and quality of its assets, with an emphasis on developing fully integrated production facilities to achieve efficiency and a competitive cost base, exploring expansion opportunities at existing businesses and focusing on sites with long-life reserves. In addition, non-core businesses, such as oil and gas, talc and gold were divested. These initiatives produced generally positive results in fiscal 2000. Performance in fiscal 2001, however, was impacted by a fire in the solvent extraction plant at its Olympic Dam operations in October 2001, production difficulties associated with the setting up of the Queensland Fertilizer operations, as well as falling commodity prices.
- 67-
| | OPERATING AND FINANCIAL REVIEW AND PROSPECTS |
WMC Resources performance in the six-month period ended June 30, 2002 continued to be negatively influenced by the production constraints related to downtime for repairs and disruptions to production. Copper and nickel experienced higher per unit costs of sales, although commodity prices began to recover during the period.
As a major diversified resources company, WMC Resources’ financial and operational performance and prospects are influenced by a number of factors. The following is a discussion of the key factors which affect WMC Resources’ business and financial performance.
Commodity prices
WMC Resources sells products which are commodities and its financial performance is significantly influenced by the prices it obtains for these products. The price of a commodity is generally determined, or linked to, the price for the product in question in the world markets. World commodity prices are subject to changes in supply and demand, and characterized by significant fluctuations. The volatility of commodity prices means that the sales revenues (and absent mitigating factors, profit) generated by sales of WMC Resources products can vary considerably from period to period, even where production levels and costs remain constant. For information about commodity price movements for nickel, copper, gold and fertilizer, see the “Average Quarterly Prices” table at page 144 of this registration statement.
Fluctuations in the A$/US$ Exchange Rate
The world commodity prices for the products WMC Resources sells are denominated in, or linked to, the US$. By contrast, most of WMC Resources’ costs are denominated in Australian dollars and its accounts are prepared in A$. As a consequence, fluctuations in the rate of exchange between the US$ and A$ may have an effect on the financial results of WMC Resources. Absent mitigating factors such as foreign currency hedging, an appreciation of the US$ relative to the A$ increases the value of sales revenues as compared to costs and has a positive impact on profit. A depreciation in the US$ as compared to the A$ decreases the value of sales revenue to costs and exerts negative pressure on profit. For information about movements in the US dollar/Australia dollar exchange rate, see the “Exchange Rates” table at page 12 of this registration statement.
Capital Expenditures
Mining is a capital intensive business, where much investment in infrastructure and plant is required. Recent major capital expenditures include: expansion and optimisation projects at Olympic Dam and development of the Phosphate Hill fertilizer operations. These are discussed in more detail below.
Nickel Operations
The nickel operations have undergone cost reduction and production efficiency programs which were reflected in the fiscal 2000 profit. In 2001, however, lower commodity prices and higher production costs put significant negative pressure on profit. Although some recovery in nickel prices occurred in the first six months of 2002, profit, sales and revenues remained low as compared to the first six months of 2001. Nickel matte production was curtailed in the first half of 2002 following a shutdown of the acid plant at the Kalgoorlie smelter for repairs. WMC Resources is also pursuing a strategy of focusing upon longer-life and higher quality operations and thus is selling off its mines at Kambalda where proven and probable reserves are nearly depleted and reducing its capital intensity. Approximately 75% of nickel metal sales are made under short to medium term contractual arrangements.
Olympic Dam Operations
The copper/uranium operations benefited from a major expansion of production capacity at the Olympic Dam facility and significant cost reductions and production efficiencies were achieved in 2000. An optimisation project commenced in 2001 to take the annual capacity from approximately 200,000 tonnes of refined copper to 235,000 tonnes. A fire at the Olympic Dam solvent extraction plant in October 2001 resulted in a A$71.8 million charge for the write off of assets and reduced production in the 2001 year and a further A$56.9 million charge due to reduced production in the first
-68-
| | OPERATING AND FINANCIAL REVIEW AND PROSPECTS |
half of 2002. The rebuild of the uranium solvent extraction plant is expected to be commissioned in the final quarter of 2002 and the copper solvent extraction plant during March 2003. A recent review of the smelting operations identified a deterioration in excess of expectations of some parts of the direct-to-blister furnace at the site, requiring increased maintenance and repairs and consequent downtime. The review determined that a relining of the furnace (which requires a 40 day shutdown of production), originally scheduled for 2004, should be brought forward to 2003. The cash cost of relining the direct-to-blister furnace, including cooling jacket replacement and improvements, are estimated to be A$50 million. Associated refurbishment and repairs to the smelter, anode furnaces, slag furnace and sulphuric acid plant, normally scheduled to coincide with each smelter reline, are estimated to cost an additional A$40 million. Modifications to improve the capability of the gas handling system and acid plant will also be undertaken at some time at an estimated cost of A$30 million. A consequence of these repairs and refurbishment activities is that refined copper production for 2002 and 2003 is forecast to be approximately 178,000 tonnes and 196,000 tonnes respectively. Upon completion of the optimisation project, the new copper solvent extraction plant and furnace relines and other repairs, the Olympic Dam facility is expected to operate at the 235,000 tonnes per annum rate. Approximately 90% of copper production was sold under contracts which are negotiated annually. More than 90% of the uranium oxide production is committed under long-term sales contracts.
Queensland Fertilizer Operations
The Queensland Fertilizer Operations have experienced significant hand-over delays and inconsistent production from the initial start up phase in the last quarter of 1999 until October 2000. Since then, the production rate has been increasing but has not yet achieved sustained full capacity. A decrease in prices has also affected the operations, which are not yet profitable. The Phosphate Hill site has the potential for future development but such opportunities are still in the early stages of study. Almost 100% of fertilizer production is sold under contract.
Regulatory Environment
WMC Resources is subject to extensive regulation in Australia and abroad. Of particular importance in Australia is the impact of native title claims on mining and other leases. See Item 8A “Legal Proceedings – Native Title in Australia”. Furthermore, mining leases are subject to certain conditions. WMC is also subject to regulation on environmental matters, with special regulations applying in the context of the export and handling of uranium.
Competitive Environment
WMC Resources’ competitive position is based on its core longer life assets which are complemented by fully integrated production facilities, all of which are being optimized to lower costs and increase production. WMC Resources also continues to engage in exploration to identify new ore bodies and development opportunities. WMC Resources’ competitive position is further enhanced by the fact that its operations are in politically stable, low-risk jurisdictions and that it has striven to achieve a high level of environmental and health and safety compliance.
2002 Half Year Compared to 2001 Half Year
Introduction
Although the financial statements include all costs and revenues incurred by WMC Resources for the reported periods, they do not necessarily reflect what the costs and revenues would have been had WMC Resources existed as a separate, stand-alone economic entity during the periods presented. In particular, in order to achieve improved financial outcomes, management might have made different decisions regarding exploration, project evaluation and corporate expenditure activities as well as its capital structure.
Overview
WMC Resources’ combined net profit after tax from continuing operations was A$12.1 million for the six months ended June 30, 2002 compared with a profit of A$41.5 million for the six months ended June 30, 2001. Net sales revenue from continuing operations amounted to A$1,196.3 million for the six months ended June 30, 2002 compared with A$1,339.1 million for the
-69-
| | OPERATING AND FINANCIAL REVIEW AND PROSPECTS |
comparable previous half year, a decrease of 10.7%. Reduced production and associated sales volumes, lower copper prices, a weaker US dollar relative to the Australian dollar, offset by reduced net borrowing costs in the first half of 2002, contributed to the decrease in net income.
The fire which destroyed extensive parts of Olympic Dam’s solvent extraction plant in October 2001 reduced production and the subsequent sales of copper and uranium oxide in the six months ended June 30, 2002, although the financial impact of the reduced sales were in part offset by the recognition of preliminary business interruption insurance claims totalling A$62 million.
Nickel production was curtailed in the first half of 2002 following a shutdown of the acid plant at the Kalgoorlie smelter for repairs to the mist precipitators.
Revenues
WMC Resources’ sales revenue from continuing operations for the six months ended June 30, 2002 decreased to A$1,196.3 million, down from A$1,339.1 million in the six months ended June 30, 2001. The decrease was driven by lower copper prices down from an average of US$0.78 per pound in the first half of 2001 to US$0.72 per pound in 2002, a weaker US dollar relative to the Australian dollar and reduced production and sales as detailed in the following table. Net foreign exchange and commodity price hedging losses of A$67.2 million in the first half of 2002 were however down from a loss of A$124.6 million in the comparable period of 2001 due to the weaker US dollar relative to the Australian dollar and reduced quantum of hedge positions in the first half of 2002.
SALES VOLUME SUMMARY
| | First Half 2002
| | First Half 2001
|
|
Nickel (‘000 tonnes) | | | | |
|
| - Nickel in concentrate | | 7.0 | | 7.1 |
|
| - Nickel in matte | | 9.5 | | 17.8 |
|
| - Nickel metal | | 31.0 | | 28.2 |
|
Refined copper (‘000 tonnes) | | 89.3 | | 105.7 |
|
Uranium oxide (tonnes) | | 1,246 | | 1,649 |
|
Fertilizer (‘000 tonnes) | | | | |
|
| - Queensland Fertilizer Operations external sales | | 291.7 | | 312.4 |
|
| - Hi Fert sales | | 492.5 | | 410.4 |
Costs
WMC Resources total costs from continuing operations of A$1,272.3 million for the six months ended June 30, 2002 were lower than the comparable period in 2001 of A$1,385.1 million. A reduction in net borrowings costs of A$98.1 million and lower exploration costs of A$20.2 million as a result of less exploration activity were offset by fertilizers costs A$18.1 million higher due to increased production and some third party purchases and copper costs higher by A$16.4 million due to the accelerated write-down of inactive assets.
Depreciation and amortization charged to profit for continuing operations increased to A$261.4 million in the six months ended 30 June 2002, compared with A$229.5 million for the six months ended 30 June 2001 principally due to the accelerated write-down of inactive assets at Olympic Dam.
-70-
| | OPERATING AND FINANCIAL REVIEW AND PROSPECTUS |
| |
|
The recognition in the first half of 2002 of a A$75.9 million profit on the close out of interest rate swaps and reduced level of borrowings of approximately A$700 million converted a net borrowing cost of A$81.8 million in the first half of 2001 to a positive A$16.3 million in the first half of 2002.
Profit
WMC Resources’ combined net profit after tax from continuing operations was A$12.1 million for the six months ended June 30, 2002 compared with a profit of A$41.5 million for the six months ended June 30, 2001. The reduction in net profit was primarily attributable to reduced sales revenues and slightly higher costs offset by reduced borrowing costs as set out above.
Cash flow
Net cash inflow from operating activities for the six months ended June 30, 2002 was A$63.4 million, compared to A$407.8 million for the six months ended June 30, 2001. Key factors impacting the reduced net cash flow from operating activities were:
| | • | | receipts from customers decreased by 30.3% to A$1,136.0 million, principally due to lower copper prices, a weaker US dollar relative to the Australian dollar and reduced sales volumes reflecting the lower production volumes for the period; |
| | • | | payments to suppliers and employees decreased to A$1,097.4 million from A$1,138.2 million in the six months ended June 30, 2001; and |
| | • | | proceeds from the close out of an interest rate swap amounting to A$71.2 million were received in the first half of 2002 ( nil in first half of 2001 ). |
Net cash outflow from investing activities for the six months ended June 30, 2002 was A$133.9 million, compared to an outflow of A$54.8 million in the six months ended June 30, 2001. The key factors contributing to the outflow from investing activities were:
| | • | | proceeds from the disposal of property, plant and equipment of A$3.3 million, compared to proceeds of A$42.3 million in the first half of 2001; |
| | • | | proceeds from the sale of Central Norseman Gold Corporation Ltd (a discontinued operation) of A$25.7 million in the first half of 2002. In the first half of 2001 A$122.2 million was received from the sale of equity interests in Mondo Minerals (a discontinued operation); |
| | • | | payments for property, plant and equipment was A$137.6 million, compared to A$199.1 million in the first half of 2001 which included A$53.0 million for discontinued operations; |
| | • | | payment of A$24.7 million in first half of 2002 for closed out gold hedge contracts following the sale of the gold business in 2001; and |
| | • | | payment of A$25.2 million for the purchase of Yakabindie Nickel Project in February 2001. |
Net cash inflow from financing activities was A$17.7 million, compared to an outflow of A$154.2 million for the six months ended June 30, 2001, principally due to a net repayment of borrowings of A$36.6 million in the first half of 2002 against a net repayment of A$337.0 million in the first half of 2001, and a net increase in contributed equity of A$54.3 million in the first half of 2002 (A$182.8 million in first half of 2001) reflecting the equity cashflows retained by WMC Resources but incurred by WMC Limited prior to the demerger.
-71-
| | OPERATING AND FINANCIAL REVIEW AND PROSPECTUS |
| |
|
Balance sheet
Net assets increased to A$3,358.6 million from A$3,220.3 million at December 31, 2001, despite a decrease in total assets to A$7,461.8 million from A$8,242.9 million. The increase in net assets reflects the reduction in interest bearing liabilities from A$2,321.8 million at December 31, 2001 to A$2,101.0 million at June 30, 2002 due to the impact of the increasing value of the Australian dollar on US dollar denominated debt. The A$781.1 million decrease in total assets was principally due to the decrease in deferred hedging losses of A$547.6 million due to the higher A$/US$ exchange rate, and a decrease in the value of property, plant and equipment by A$144.9 million reflecting the impact of depreciation and amortization charges exceeding capital expenditures.
Segment Results
Nickel
Profit before interest, hedging and tax decreased to A$112.7 million in the first half of 2002, compared with a profit of A$228.9 million in the comparable period of 2001. The lower profit in 2002 was due to lower sales volumes (A$22 million), and lower realized Australian dollar prices due to the weaker US dollar relative to the Australian dollar (A$30 million) and higher cost of sales (A$64 million). A fire in the mist precipitator at the Kalgoorlie nickel smelter and plant in February 2002, resulted in reduced production of nickel matte. The smelter operated at 95 percent of normal throughput rates in the second quarter of 2002. Two new mist precipitators are scheduled for installation and commissioning in the fourth quarter of 2002. The average unit cost of nickel metal sales (net of by-product credits) for the first half of 2002 was A$4.14/lb, compared to A$3.52/lb in the first half of 2001, as a result of lower production from the acid plant outage and increased purchases of third party concentrate feed to replace concentrate feed previously produced internally from the Kambalda mines which have now been sold.
NICKEL PERFORMANCE SUMMARY
| | First Half 2002 unaudited
| | | First Half 2001 unaudited
| |
|
Financial | | A$ millions | |
Profit before hedging, interest and tax (1) | | 112.7 | | | 228.9 | |
| Commodity/currency hedging | | (32.6 | ) | | (63.2 | ) |
Profit before interest and tax | | 80.1 | | | 165.7 | |
| Sales revenue | | 598.5 | | | 668.7 | |
| Capital expenditure | | 73.0 | | | 124.2 | |
| Total assets | | 1,742.3 | | | 1,787.3 | |
|
Production | | ‘000 tonnes | |
| Nickel-in-concentrate | | 50.5 | | | 51.2 | |
| Nickel-in-matte | | 41.7 | | | 47.0 | |
| Nickel metal | | 30.9 | | | 28.1 | |
|
Sales | | ‘000 tonnes | |
| Nickel-in-concentrate | | 7.0 | | | 7.1 | |
| Nickel-in-matte | | 9.5 | | | 17.8 | |
| Nickel metal | | 31.0 | | | 28.2 | |
(1) | | WMC Resources has included information concerning profit before hedging, interest and tax in its segment results as it believes that such data is commonly used by certain investors to evaluate the core results of the Company’s segments. Profit before hedging, interest and tax is not a measure of financial performance under GAAP and should not be considered an alternative to, or more meaningful than, income before interest and income tax or net income/(loss) attributable to holding company shareholders. WMC Resource’s combined results as discussed herein include the results of hedging, interest and tax. |
Sales revenue decreased in line with lower production and associated sales volumes and lower realized Australian dollar prices due to the weaker US dollar relative to the Australian dollar. Hedging losses at A$32.6 million, were 48%
-72-
| | OPERATING AND FINANCIAL REVIEW AND PROSPECTUS |
| |
|
lower in the first half of 2002 when compared to the A$63.2 million in the comparable period of 2001 reflecting the weaker US dollar during the first half of 2002. Nickel metal prices in Australian dollars averaged A$5.28 per pound for the six months ended June 30, 2002, down on the average price in the six months ended June 30, 2001 of A$6.18 per pound again reflecting the weaker US dollar during the first half of 2002.
Copper/Uranium
Profit before interest, hedging and tax decreased to A$40.9 million in the first half of 2002, compared with a profit of A$128.1 million in the comparable period of 2001. The lower profit in 2002 was due to lower sales volumes from reduced production (A$21 million), lower copper prices (A$45 million) and the accelerated writedown of inactive assets.
Production was impacted by the fire in the solvent extraction plant in October 2001. Downtime to repair a cooling jacket in the furnace also resulted in approximately 7,000 tonnes of lost copper production in the first half of 2002. As a result, refined copper production decreased by 15.5 % to 87,800 tonnes and uranium oxide production decreased by 48.0 % to 1,192 tonnes in the first half of 2002.
COPPER/URANIUM PERFORMANCE SUMMARY
| | First Half 2002 unaudited
| | | First Half 2001 unaudited
| |
Financial | | A$ millions | |
Profit before hedging, interest and tax (1) | | 40.9 | | | 128.1 | |
| Commodity/currency hedging | | (26.1 | ) | | (42.8 | ) |
|
Profit before interest and tax | | 14.8 | | | 85.3 | |
| Sales revenue | | 318.9 | | | 430.7 | |
| Capital expenditure | | 51.1 | | | 21.5 | |
| Total assets | | 2,776.6 | | | 2,926.5 | |
|
Production | | | | | | |
| Refined copper (‘000 tonnes) | | 87.8 | | | 103.9 | |
| Uranium oxide (tonnes) | | 1,192 | | | 2,292 | |
|
Sales | | | |
| Refined copper (‘000 tonnes) | | 89.3 | | | 105.7 | |
| Uranium oxide (tonnes) | | 1,246 | | | 1,649 | |
(1) | | WMC Resources has included information concerning profit before hedging, interest and tax in its segment results as it believes that such data is commonly used by certain investors to evaluate the core results of the Company’s segments. Profit before hedging, interest and tax is not a measure of financial performance under GAAP and should not be considered an alternative to, or more meaningful than, income before interest and income tax or net income/(loss) attributable to holding company shareholders. WMC Resource’s combined results as discussed herein include the results of hedging, interest and tax. |
Sales revenue decreased to A$380.9 million in the six months ended June 30, 2002, compared to A$431.3 million in the comparable period of 2001, in line with lower sales reflecting reduced production and lower Australian dollar prices received for WMC Resources’ product due to both lower copper prices and the weaker US dollar relative to the Australian dollar in the first half of 2002 compared to the first half of 2001. Preliminary insurance claims associated with the solvent extraction plant fire totalling A$62 million were recognized during the first half of 2002.
The sales revenue includes hedging losses of A$26.1 million, in the first half of 2002, 39.0% lower when compared to the A$42.8 million of hedging losses in the comparable period of 2001.
The rebuild of the solvent extraction plant continued during the first half of 2002 with the uranium circuit scheduled to be completed in the last quarter of 2002 and the copper circuit in March 2003. The optimisation project to increase capacity to 235,000 tonnes of copper cathode remains on schedule and on budget. Production of refined copper is
-73-
| | OPERATING AND FINANCIAL REVIEW AND PROSPECTUS |
| |
|
estimated to be approximately 196,000 tonnes in 2003 due to the major shutdown for the furnace rebuild in the second half of 2003. The plant is scheduled to operate at the rate of 235,000 tonnes per annum of refined copper by the end of 2003.
Copper prices averaged US$0.72 per pound for the six months ended June 30, 2002, down on the average price in the six months ended June 30, 2001 of US$0.78 per pound. Australian dollar prices averaged A$1.32 per pound for the six months ended June 30, 2002, down on the average price in the six months ended June 30, 2001 of A$1.55 per pound, due to the weaker US dollar relative to the Australian dollar in the six months ended June 30, 2002.
Fertilizer Operations
A loss before interest, hedging and tax of A$7.7 million in the first half of 2002, compares with a profit of A$1.5 million in the comparable period of 2001. The loss in the first half of 2002 was as a result of lower realized Australian dollar prices due to the weaker US dollar relative to the Australian dollar offset in part by increased production.
FERTILIZER PERFORMANCE SUMMARY(1)
| | First Half 2002 unaudited
| | | First Half 2001 unaudited
| |
Financial | | A$ millions | |
Profit/(Loss) before hedging, interest and tax (2) | | (7.7 | ) | | 1.5 | |
| Commodity/currency hedging | | (8.6 | ) | | (18.6 | ) |
Profit/(Loss) before interest and tax | | (16.3 | ) | | (17.1 | ) |
|
| Sales revenue | | 269.7 | | | 239.7 | |
| Capital expenditure | | 8.8 | | | 18.5 | |
| Total assets | | 1,050.8 | | | 1,081.1 | |
|
Production | | ‘000 tonnes | |
| Phosphate fertilizer | | 398.2 | | | 363.6 | |
|
Sales | | ‘000 tonnes | |
| Queensland Fertilizer Operations external sales | | 291.7 | | | 312.4 | |
| Hi Fert sales | | 492.5 | | | 410.4 | |
(1) | | Includes performance of wholly owned subsidiary Hi Fert Pty. Ltd. |
(2) | | WMC Resources has included information concerning profit before hedging, interest and tax in its segment results as it believes that such data is commonly used by certain investors to evaluate the core results of the Company’s segments. Profit before hedging, interest and tax is not a measure of financial performance under GAAP and should not be considered an alternative to, or more meaningful than, income before interest and income tax or net income/(loss) attributable to holding company shareholders. WMC Resource’s combined results as discussed herein include the results of hedging, interest and tax. |
-74-
| | OPERATING AND FINANCIAL REVIEW AND PROSPECTUS |
| |
|
Production in the first half of 2002 was 398,177 tonnes of ammonium phosphate fertilizer, an increase of 9.5% from the 363,620 tonnes produced in the first half of 2001 as the plant continued to ramp up to design capacity. The plant operated at design capacity in December 2001 and January 2002, however a shortage of sulphuric acid and a three week statutory maintenance shutdown of the acid plant undertaken in late June 2002 limited production in the first half of 2002.
The price of DAP averaged US$154 per tonne compared to US$153 per tonne in the first half of 2001. The US$/A$ exchange rate increased from an average of 0.5228 in the first half of 2001 to 0.5345 in the first half of 2002.
2001 Compared to 2000
Introduction
Although the financial statements include all costs and revenues incurred by WMC Resources for the reported periods, they do not necessarily reflect what the costs and revenues would have been had WMC Resources existed as a separate, stand-alone economic entity during the periods presented. In particular, in order to achieve improved financial outcomes, management might have made different decisions regarding exploration, project evaluation and corporate expenditure activities as well as its capital structure.
Overview
WMC Resources’ combined net loss after tax from continuing operations was A$157.5 million for the year ended December 31, 2001 compared with a profit of A$327.2 million for the year ended December 31, 2000. Net sales revenue from continuing operations amounted to A$2,364.1 million for the year ended December 31, 2001, compared with A$2,666.0 million for the previous year, a decrease of 11.3%. Lower commodity prices, particularly for nickel, combined with lower nickel production and higher costs at Olympic Dam due to the impact of the fire in the solvent extraction plant, and at Queensland Fertilizer Operations due to the first full year of depreciation and amortization charges following the completion of the commissioning in August 2000 were largely responsible for the A$484.7 million reduction in profit after tax.
A fire in Olympic Dam’s solvent extraction plant in October 2001 resulted in a A$71.8 million charge for the write off of assets and reduced production of copper and uranium oxide.
The nickel business profit before interest, hedging and tax in the 12 months to December 31, 2001 was 65% lower than the previous year, reflecting the weakness in the nickel price and reduced sales volumes. Profit before interest, hedging and tax in 2001 for the copper/uranium business was 42.5% lower than the previous year, due to lower copper and uranium prices and the impact of the fire in the solvent extraction plant. The fertilizer business reported an operating loss before interest, hedging and tax of A$59.9 million in 2001, compared to a loss of A$52.7 million in 2000. The increased loss reflected lower average di-ammonium phosphate prices, which decreased 4% from US$154/tonne in 2001, and plant performance issues since the plant was still in the process of ramping up in fiscal 2000 and 2001. The fiscal 2000 profit included only five months of depreciation and amortization charges as the costs were capitalized up to completion of commissioning in August 2000.
In December 1999, WMC Resources revised its Price Risk Management Policy to substantially reduce future hedging activity, with the exception of carry forward hedge positions, principally for the currency exchange rate and the gold price. This policy is described in greater detail in Item 11 “Quantitative and Qualitative Disclosures About Market Risk – Quantitative Information About Market Risk – Price Risk Management Policy” at page 141 of this registration statement. Following the change in policy, the Company’s revenue has been subject to movements in spot prices for commodities and the Australian dollar/US dollar exchange rate, although these have largely been offset in net revenue terms and the Company’s liquidity position has improved, with significant debt reduction occurring over the fiscal year 2001.
-75-
| | OPERATING AND FINANCIAL REVIEW AND PROSPECTUS |
| |
|
Revenues
WMC Resources’ sales revenues from continuing operations for 2001 decreased to A$2,364.1 million, down from A$2,666.0 million in 2000. The decrease in revenue was driven by lower prices for all commodities as detailed in the following table. Revenues were also impacted by net foreign exchange and commodity price-hedging losses of A$273.9 million (A$320.6 million in 2000) due to reduced hedging cover in place in 2001 compared to 2000.
PRICES SUMMARY
| | 2001
| | 2000
|
| Nickel (US$/lb) | | 2.70 | | 3.92 |
| Copper (US$/lb) | | 0.72 | | 0.82 |
| Fertilizer (US$/tonne) | | 147 | | 154 |
Costs
WMC Resources’ cost of goods sold from continuing operations for 2001 increased to A$1,878.7 million, up from A$1,672.0 million in 2000. The higher costs were predominantly due to the impact of the fire in the solvent extraction plant at Olympic Dam of A$71.8 million, increased nickel concentrate purchased from third parties reflecting the sale of the Kambalda mines of A$6.9 million and higher operating costs of A$127.2 million at the Queensland Fertilizer plant associated with the ramp up of production. Fiscal year 2000 included only five months of depreciation and amortization charges at the Queensland Fertilizer plant as the costs were capitalized up to completion of commissioning August 2000.
Depreciation and amortization charged to profit for continuing operations increased to A$481.2 million in 2001, compared to A$428.8 million in 2000. The charge in 2001 reflects the first full year of depreciation for the Queensland Fertilizer Operations, compared to five months of charges in 2000.
Profit
WMC Resources’ loss after tax from continuing operations was A$157.5 million, down from a profit of A$327.2 million in 2000. The loss was primarily attributable to substantially lower prices for WMC Resources’ products and the A$71.8 million charge following the fire at Olympic Dam’s solvent extraction plant in October 2001 and the increased costs referred to above.
Net interest expense was A$140.9 million, compared to A$148.1 million in 2000, reflecting the benefits of lower interest rates and debt reduction. In 2000 interest of A$24.9 million was capitalized in relation to the construction of the Queensland Fertilizer Operations.
Cash flow
Net cash inflow from operating activities for 2001 was A$577.7 million, compared to A$898.1 million in 2000. The key factor impacting the net cash flow from operating activities was an increase in payments to suppliers and employees to A$2,212.7 million from A$1,904.9 million in 2000 due mainly to higher operating costs. This was attributable to a full year of operations at Queensland Fertilizer Operations and increased nickel concentrate purchases from third parties.
Net cash inflow from investing activities for 2001 was A$279.1 million, compared to an outflow of A$419.3 million in 2000. The key factors contributing to the inflow from investing activities were:
| | • | | proceeds from the disposal of non-current assets of A$699.3 million of which A$610.2 million related to discontinued operations. This compared to proceeds of A$38 million in 2000; and |
-76-
| | OPERATING AND FINANCIAL REVIEW AND PROSPECTUS |
| |
|
| | • | | payments for property, plant and equipment was A$426.8 million, compared to A$436.0 million in 2000. |
Net cash outflow from financing activities was A$793.7 million, compared to an outflow of A$508.9 million in 2000. Key drivers were:
| | • | | a net repayment of borrowings of A$778.3 million in 2001 against a net repayment of A$37.7 million in 2000; and |
| | • | | the absence of contributed equity relating to payments for the buyback of ordinary shares during 2001, compared to an outflow of A$417.4 million in 2000. |
Balance sheet
Net assets increased to A$3,220.3 million from A$3,123.8 million in 2000. Total borrowings decreased to A$2,321.8 million in 2001 due to net repayments of A$778.3 million, offset by the impact of a weaker Australian dollar on US dollar denominated debt. Property, plant and equipment reduced by A$417.7 million due to the disposal of discontinued operations and depreciation and amortization charges exceeding capital expenditure.
Total assets of A$8,242.9 million at December 31, 2001 decreased from A$8,597.0 at December 31, 2000 principally due to:
| | • | | higher deferred tax asset balances of A$303.7 million, compared to A$181.8 million in 2000, due to an increase in tax losses brought to account; |
| | • | | a decrease in the value of property, plant and equipment of A$417.7 million, reflecting the impact of depreciation and amortization charges exceeding capital expenditure of A$139.3 million and the disposal of discontinued operations of A$201.4 million; and |
| | • | | offset by an increase in deferred hedging losses of A$309.4 million due to the lower A$/US$ exchange rate. |
WMC Resources’ liabilities for 2001 decreased to A$5,013.6 million, down from A$5,459.7 million in 2000. The decrease was attributable to the reduction of borrowings as discussed above, offset by an increase in hedging creditors as a result of commodity and currency price movements of A$327.1 million.
Shareholders’ equity in 2001 increased to A$3,220.3 million, up from A$3,123.8 million in 2000. The increase was attributable to a net income of A$126.0 million offset by net foreign currency adjustments to comprehensive income of A$14.1 million and A$15.4 million of equity cashflows incurred by WMC Limited prior to the demerger and retained by WMC Resources.
Segment Results
Nickel
WMC Resources’ nickel business faced difficult conditions for the nickel industry during 2001. Profit before interest, hedging and tax decreased to A$288.4 million in 2001, compared with profit of A$823.2 million in 2000. The lower profit in 2001 was due to lower sales volumes at lower prices and higher unit cost of sales. The average unit cost of metal sales (net of by-product credits) for 2001 increased 17.2% to A$3.74 per pound, reflecting planned increased concentrate purchased from third parties following the sale of Kambalda mines, lower smelter throughput and increased energy costs in Western Australia. Overall amortization increased in 2001 due to the commencement of mining at the new Harmony mine at Leinster. Total nickel-in-concentrate production decreased by 2.7% to 104,591 tonnes in line with weaker market conditions and planned major maintenance shutdowns at the Kalgoorlie smelter and Kwinana refinery.
-77-
| | OPERATING AND FINANCIAL REVIEW AND PROSPECTS |
|
NICKEL PERFORMANCE SUMMARY
| | 2001
| | | 2000
| |
| | | A$ millions | |
Financial | | | | | | |
Profit before hedging, interest and tax(1) | | 288.4 | | | 823.2 | |
| Commodity/currency hedging | | (141.5 | ) | | (216.7 | ) |
Profit before interest and tax | | 146.9 | | | 606.5 | |
| Significant items | | — | | | 20.2 | (2) |
Total profit before interest and tax | | 146.9 | | | 626.7 | |
| | |
|
| |
|
|
| Sales revenue | | 1,200.9 | | | 1,645.4 | |
| Capital expenditure | | 227.1 | | | 155.5 | |
| Total assets | | 1,691.1 | | | 1,801.0 | |
|
| | | ’000 tonnes | |
Production | | | | | | |
| Nickel-in-concentrate | | 104.6 | | | 107.5 | |
| Nickel-in-matte | | 96.6 | | | 103.0 | |
| Nickel metal | | 61.3 | | | 60.5 | |
Sales |
| Nickel-in-concentrate | | 13.8 | | | 18.1 | |
| Nickel-in-matte | | 34.6 | | | 40.7 | |
| Nickel metal | | 61.1 | | | 61.6 | |
(1) | | WMC Resources has included information concerning profit before hedging, interest and tax in its segment results as it believes that such data is commonly used by certain investors to evaluate the core results of the Company’s segments. Profit before hedging, interest and tax is not a measure of financial performance under GAAP and should not be considered an alternative to, or more meaningful than, income before interest and income tax or net income/(loss) attributable to holding company shareholders. WMC Resource’s combined results as discussed herein include the results of hedging, interest and tax. |
(2) | | Under US GAAP, profit from the sale of tenements at Kambalda was only recognized in 2001. Refer to Note 43(f) to the Combined Financial Statements. |
Sales revenue decreased in line with lower production and reduced prices received for WMC Resources’ product. Hedging losses reduced due to reduced hedging cover in place in 2001 compared to 2000.
WMC Resources continued to optimize its nickel refinery at Kwinana. The plant has been progressively upgraded and operating costs have been kept low by increasing process intensity, improving process control and targeted de-bottlenecking. In 2001, the expansion of the plant by a further 10% to a capacity of 67,000 tonnes of nickel metal a year was completed on time and on budget.
WMC Resources continued to dispose of Kambalda nickel mines during 2001. The Wannaway mine and North Widgiemooltha Block were sold to external parties. Land containing Otter Juan and Coronet North mines was leased under a long-term arrangement. Under the terms of these divestments WMC entered into long-term agreements with the acquirers to buy the concentrates they produce. The sales of these mines provided a reduction in Kambalda’s capital intensity. The Lanfranchi mine complex is the only mine at Kambalda still owned by WMC Resources. Mining ceased at Lanfranchi at the end of March 2002. It is anticipated that this mine will be sold during 2003.
In February 2001, the Yakabindie Nickel Company was purchased. It is expected to have long-term potential to complement existing assets in the Mount Keith area.
Copper/Uranium
Total profit before interest, hedging and tax was 42.5% lower at A$150.8 million due to the A$71.8 million impact of the write off of the damaged solvent extraction plant and associated reduced production in 2001 coupled with the inclusion of A$61.4 million of insurance proceeds in 2000. The unit cost of sales for copper (net of uranium and by-product credits) was A$1.06 per pound for 2001, up A$0.20 per pound on 2000. The increase in the unit cost of sales was primarily attributable to the impact of the fire in the solvent extraction plant in October 2001.
-78-
| | OPERATING AND FINANCIAL REVIEW AND PROSPECTS |
|
COPPER/URANIUM PERFORMANCE SUMMARY
| | 2001
| | | 2000
| |
| | | A$ millions | |
Financial | | | | | | |
Profit before hedging, interest and tax(1) | | 150.8 | | | 262.5 | |
| Commodity/currency hedging | | (102.9 | ) | | (96.8 | ) |
Profit before interest and tax | | 47.9 | | | 165.7 | |
Sales revenue | | 810.3 | | | 798.0 | |
| Capital expenditure | | 75.3 | | | 79.9 | |
| Total assets | | 2,811.1 | | | 3,098.0 | |
Production | | | |
| Refined copper (‘000 tonnes) | | 200.5 | | | 200.4 | |
Uranium oxide (tonnes) | | 4,379 | | | 4,539 | |
Sales | | | | | | |
| Refined copper (‘000 tonnes) | | 200.8 | | | 203.2 | |
| Uranium oxide (tonnes) | | 4,534 | | | 4,352 | |
(1) | | WMC Resources has included information concerning profit before hedging, interest and tax in its segment results as it believes that such data is commonly used by certain investors to evaluate the core results of the Company’s segments. Profit before hedging, interest and tax is not a measure of financial performance under GAAP and should not be considered an alternative to, or more meaningful than, income before interest and income tax or net income/(loss) attributable to holding company shareholders. WMC Resource’s combined results as discussed herein include the results of hedging, interest and tax. |
The fire in late October 2001 caused considerable damage to the copper and uranium solvent extraction circuits. The cost of the rebuild is expected to be approximately A$250 million with the uranium circuit scheduled to be completed in the last quarter of 2002 and the copper circuit in April 2003. The rebuild costs and costs of lost production will be partially offset by insurance proceeds which will include insurance proceeds for business interruption and property damage. The expected cost of the rebuild is approximately A$250 million of which up to A$55 million of property damage insurance is currently under negotiation with insurers.
Despite the production difficulties arising from the fire in the solvent extraction plant, refined copper production for the 2001 year was at design capacity at 200,523 tonnes, with uranium production of 4,379 tonnes. A record 9.3 million tonnes of ore was treated in 2001. Olympic Dam also produced a record 113,412 ounces of gold and 912,859 ounces of silver.
The average copper price during 2001 was lower at US$0.72 per pound compared to US$0.82 per pound in 2000, however this was offset by the stronger US dollar relative to the Australian dollar during 2001 (US$0.5129) compared to 2000 (US$0.5757).
Prices on the uranium spot market recovered in 2001 to in excess of US$9.00 per pound, compared to the spot price of US$7.10 in late December 2000. WMC Resources’ uranium is sold under long-term contracts with leading world power utilities. These contracts provide a premium over spot or benchmark prices. All uranium exports are subject to bilateral safeguards agreements and must be approved by the Australian government.
The optimization project to increase capacity to 235,000 tonnes of copper cathode remains on schedule and on budget. This project is due to be completed and fully commissioned by the fourth quarter of 2002. The full benefit of this optimization project will not however be reflected in production until the completion of the rebuild of the copper solvent extraction circuit in March 2003 and the reline of the smelter furnace in the last quarter of 2003.
Fertilizer Operations
The Queensland Fertilizer Operations (QFO) is a fully integrated operation, with phosphate rock, phosphoric acid and ammonia production at Phosphate Hill and sulphuric acid production in Mount Isa. The full year operating loss before
-79-
| | OPERATING AND FINANCIAL REVIEW AND PROSPECTS |
|
interest, hedging and tax in 2001 was A$59.9 million. The loss was due to below design capacity production rates as the plant continued to ramp up to full capacity and maintain reliable and constant production and historically low di-ammonium phosphate (DAP) prices which decreased 4% from US$154/tonne in 2000 to US$147/tonne in 2001. The low production rates were attributable to plant performance issues that delayed reaching design capacity until December 2001. The operating loss before interest, hedging and tax in 2000 of A$52.6 million included only five months of depreciation amortization charge (A$24.4 million) following the completion of the commissioning in August 2000, compared to A$66.0 million for a full year of depreciation and amortization charge in 2001. Production was 326,300 tonnes of phosphate fertilizer in 2000 compared to 709,400 in 2001.
FERTILIZER PERFORMANCE(1) SUMMARY
| | 2001
| | | 2000
| |
| | | A$ millions | |
Financial | | | |
Loss before hedging, interest and tax(2) | | (59.9 | ) | | (52.6 | ) |
| Commodity/currency hedging | | (29.5 | ) | | (7.1 | ) |
Loss before interest and tax | | (89.4 | ) | | (59.7 | ) |
| Sales revenue | | 352.9 | | | 222.6 | |
| Capital expenditure | | 42.3 | | | 96.2 | |
| Total assets | | 1,137.3 | | | 1,162.0 | |
| | |
|
| |
|
|
|
| | | ’000 tonnes | |
Production | | | | | | |
| Phosphate fertilizer | | 709.4 | | | 326.3 | |
| | |
|
| |
|
|
|
| | | ’000 tonnes | |
Sales | | | | | | |
| Queensland Fertilizer Operations external sales | | 536.6 | | | 157.6 | |
| Hi Fert sales | | 591.1 | | | 558.6 | |
| | |
|
| |
|
|
(1) | | Includes performance of wholly owned subsidiary Hi Fert Pty. Ltd. |
(2) | | WMC Resources has included information concerning profit before hedging, interest and tax in its segment results as it believes that such data is commonly used by certain investors to evaluate the core results of the Company’s segments. Profit before hedging, interest and tax is not a measure of financial performance under GAAP and should not be considered an alternative to, or more meaningful than, income before interest and income tax or net income/(loss) attributable to holding company shareholders. WMC Resource’s combined results as discussed herein include the results of hedging, interest and tax. |
Continuing equipment reliability issues in the first half of the 2001 year were rectified during the statutory inspection shutdown in August, 2001. Production subsequently increased. Production in 2001 included 57,947 tonnes of high quality mono-ammonium phosphate (MAP).
Hi Fert, a wholly owned fertilizer distribution subsidiary, has made significant operating changes in 2001. Costs have been reduced through workforce reduction, re-structure and relocation. It has repositioned itself for further growth into the South Eastern Australian market. This has mainly involved the acquisition of high volume and high margin agents from WMC Resources’ major competitors, which has increased total sales volume.
The price of DAP at the start of the year was US$154 per tonne fob Tampa and increased to a high of US$168 in March before falling to a low of US$133 in June. Between June and October the price ranged between US$136 and US$142 per tonne, with a rise from October taking the price to US$152 per tonne at December 31, 2001.
2000 Compared to 1999
Introduction
Although the financial statements include all costs and revenues incurred by WMC Resources for the reported periods, they do not necessarily reflect what the costs and revenues would have been had WMC Resources existed as a separate, stand-alone economic entity during the periods presented. In particular, in order to achieve improved financial
-80-
| | OPERATING AND FINANCIAL REVIEW AND PROSPECTS |
|
outcomes, management might have made different decisions regarding exploration, project evaluation and corporate expenditure activities as well as its capital structure.
Overview
WMC Resources’ combined net income after tax from continuing operations was A$327.2 million for the year ended December 31, 2000 compared with a loss of A$5.7 million for the year ended December 31, 1999. Net sales revenue from continuing operations amounted to A$2,666.0 million for the year ended December 31, 2000 compared with A$1,672.7 million for the previous year, an increase of 59.4%. Increased nickel, copper and uranium production, higher nickel and copper prices together with lower production costs for nickel and copper were the primary reasons for the A$332.9 million improvement in net income after tax.
Nickel production and associated sales volumes in the 12 month period to December 31, 2000 increased compared to the previous year, with margins increased due to higher nickel prices and reduced costs. Copper and uranium oxide production at Olympic Dam increased substantially in 2000 and unit costs decreased as the expanded Olympic Dam Operation achieved full production during the year.
Construction of the Queensland Fertilizer Operations at Phosphate Hill, Mt Isa and Townsville was completed during the fourth quarter of 1999, but plant hand-over delays and mechanical problems during commissioning limited production. Consistent production of di-ammonium phosphate fertilizer was not possible until the ammonia plant was handed over to WMC Resources in October 2000.
Revenues
WMC Resources’ sales revenues from continuing operations for 2000 increased to A$2,666.0 million, up from A$1,672.7 million in 1999. The revenue increase was driven by increases in sales volumes of all commodities as detailed in the following table.
SALES VOLUME SUMMARY
| | 2000
| | 1999
| |
| Nickel (‘000 tonnes) | | | | | |
| – Nickel in concentrate | | 18.1 | | 16.2 | |
| – Nickel in matte | | 40.7 | | 27.5 | |
| – Nickel metal | | 61.6 | | 53.6 | |
| Refined copper (‘000 tonnes) | | 203.2 | | 141.8 | |
| Uranium oxide (tonnes) | | 4,353 | | 2,756 | |
| Fertilizer (‘000 tonnes) | | | | | |
| – Queensland Fertilizer Operations external sales | | 157.6 | | N/A | * |
| – Hi Fert sales | | 558.6 | | 582.6 | |
|
| * 2000 was the first year of sales | | | | | |
Prices received for many of WMC Resources’ products improved as detailed in the following table, magnified by the strength of the US dollar relative to the Australian dollar, however the benefit of the stronger US dollar was mitigated by net foreign exchange and commodity price-hedging losses of A$320.6 million, compared to the losses of A$51.8 million in 1999 due to the stronger US dollar.
PRICES SUMMARY
| | 2000
| | 1999
|
| Nickel (US$/lb) | | 3.92 | | 2.73 |
| Copper (US$/lb) | | 0.82 | | 0.71 |
| Fertilizer (US$/tonne) | | 154 | | 179 |
-81-
| | OPERATING AND FINANCIAL REVIEW AND PROSPECTS |
|
Costs
WMC Resources’ cost of sales for 2000 increased to A$1,672.0 million, up from A$1,213.5 million in 1999. The cost increase was driven by increased production in all areas, particularly at Olympic Dam and a full year of fertilizer production. However, production increased relatively more than costs, resulting in improved profits. Details of production volumes are outlined in the table below.
PRODUCTION VOLUME SUMMARY
| | 2000
| | 1999
|
| Nickel (‘000 tonnes) | | | | |
| – Nickel-in-concentrate | | 107.5 | | 88.3 |
| – Nickel-in-matte | | 103.0 | | 79.7 |
| – Nickel metal | | 60.5 | | 53.0 |
Refined copper (‘000 tonnes) | | 200.4 | | 138.3 |
Uranium oxide (tonnes) | | 4,539 | | 3,221 |
Fertilizer (‘000 tonnes) | | 326.3 | | 5.1 |
Depreciation and amortization from continuing operations charged to profit was A$428.8 million compared to A$318.3 million in 1999 reflecting a full year of charges for Olympic Dam, rather than just nine months in 1999 due to the capitalization of costs during the expansion project which was completed in March 1999, and charges beginning from August 1, 2000 for the Queensland Fertilizer Operations (none in 1999) which ceased commissioning in August 2000.
Profit
WMC Resources’ profit after tax from continuing operations for 2000 was A$327.2 million, up from a loss of A$5.7 million in 1999. The profit increase was driven by increased production and sales of all commodities at improved prices as discussed above and improved cost performance and production in the nickel operations and at Olympic Dam following the expansion.
Interest of A$24.9 million was capitalized until August 1, 2000, associated with the construction projects, compared to A$61.9 million in 1999. Interest relating to the expansion of Olympic Dam ceased to be capitalized in 1999, and interest relating to the Queensland Fertilizer Operations was expensed from August 1, 2000.
Net interest expense was A$148.1 million, compared to A$78.6 million in 1999, in line with a higher level of debt and lower capitalized interest.
Disposal of Kambalda mine tenements resulted in an exceptional gain of A$23.8 million after tax. Under US GAAP this gain was not recognized until 2001. For more information refer to Note 44 of the Combined Financial Statements. The 1999 exceptional gain was A$7.9 million after tax, which included an adjustment for changes in the corporate tax rate.
Cash flow
Net cash inflow from operating activities for 2000 was A$898.1 million compared to A$164.9 million in 1999. Key drivers were receipts from customers increasing by 54.2% to A$3,030.2 million, principally due to the higher average nickel price, increased copper sales and a stronger US dollar.
Payments to suppliers and employees increased to A$1,904.0 million from A$1,606.2 million due to increased production, and the Queensland Fertilizer project startup.
-82-
| | OPERATING AND FINANCIAL REVIEW AND PROSPECTS |
|
Cash outflow relating to investing activities was A$419.3 million, down from A$624.7 million in 1999 due to:
| | • | | payments for property, plant and equipment falling by A$478.8 million to A$436.0 million. Expenditure during 2000 was on minor projects in all divisions, whereas 1999 included both the end of the Olympic Dam expansion and construction of the Queensland Fertilizer Operations; and |
| | • | | proceeds from the disposal of non-current assets were A$32.5 million compared with A$260.3 million in 1999. The latter included A$190.4 million from the 1998 sale of power generating and transmission assets. |
Cash flow movements relating to financing activities changed to an outflow of A$508.9 million from an inflow of A$485.1 million in 1999. Key drivers were:
| | • | | contributed equity related to payments for the buyback of ordinary shares of A$417.4 million compared to A$4.0 million in 1999; and |
| | • | | net repayment of borrowings of A$37.7 million against a net draw-down of A$361.4 million in 1999. |
Balance sheet
Net assets decreased to A$3,123.8 million from A$3,214.3 million in 1999 reflecting the buyback of ordinary shares of A$417.4 million in 2000.
Key factors in the increase in total assets of A$1,321.2 million were deferred hedging losses associated with the stronger US dollar relative to the Australian dollar, increasing by A$889.0 million and debtors increasing by A$430.9 million mainly due to increased hedging. However, the value of property, plant and equipment fell A$102.6 million, reflecting increased depreciation and amortization charges exceeding capital expenditure as construction of major projects were completed and came into production.
WMC Resources’ liabilities for 2000 increased to A$5,459.7 million, up from A$4,056.9 million in 1999. The increase was driven by an increase in borrowings of A$331.7 million, the provision for deferred income tax increased by A$219.6 million as a result of increased income and timing differences, hedging creditors increased as a result of commodity and currency price movements, and creditors and other provisions increased as a result of increased production.
Shareholders’ equity in 2000 reduced to A$3,123.8 million, from A$3,214.3 million in 1999. The reduction was driven by an increase from net income of A$399.9 million, offset by net foreign currency adjustments to comprehensive income of A$19.2 million, and a A$471.2 reduction in deemed contributed capital, principally the buyback of ordinary shares by WMC Limited of A$417.4 million.
Segment Results
Nickel
Cost cutting in 1999 combined with higher prices generated a significant profit improvement in 2000. Profit before interest, hedging, tax and exceptional items increased 390% from 1999 to a record A$823.2 million. WMC Resources’ average unit cost of nickel metal sales (net of by-product credits) for 2000 decreased 15% to A$3.19 per pound. Total contained nickel production increased 22% to 107,458 tonnes while labor productivity within the division increased 16% to a record 51 tonnes of nickel per full-time equivalent employee in 2000.
Sales revenue increased in line with increased production and sales volumes, as discussed above, and an increase in the A$ nickel price, excluding hedging, from A$4.24/lb in 1999 to A$7.09/lb in 2000. Production increased due to operating efficiencies and reducing stocks. Hedging losses increased with the strength of the US dollar relative to the Australian dollar.
-83-
| | OPERATING AND FINANCIAL REVIEW AND PROSPECTS |
|
WMC Resources commenced the sales of its Kambalda nickel mines in 2000. The largest group of mines, containing the Miitel, Mariners and Redross deposits, was sold to a joint venture led by Mincor Resources NL. WMC Resources entered into a long-term agreement to buy the concentrates the acquirers will produce.
84
| | OPERATING AND FINANCIAL REVIEW AND PROSPECTS |
Nickel prices moved to a high of US$4.84 per pound in March 2000, fell to US$3.19 in October 2000 and stabilized at that level, averaging US$3.92 for the year, up 43% on 1999.
NICKEL PERFORMANCE SUMMARY
| | 2000
| | | 1999
| |
Financial | | A$ millions |
Profit before hedging, interest and tax(1) | | 823.2 | | | 168.2 | |
| Commodity/currency hedging | | (216.7 | ) | | (44.5 | ) |
Profit before interest and tax | | 606.5 | | | 123.7 | |
| Significant items | | 20.2 | (2) | | — | |
Total profit before interest and tax | | 626.7 | | | 123.7 | |
| | |
|
| |
|
|
| Sales revenue | | 1,645.4 | | | 989.2 | |
| Capital expenditure | | 155.5 | | | 133.1 | |
| Total assets | | 1,801.0 | | | 1,916.7 | |
| | |
|
| |
|
|
Production | | `000 tonnes |
| Nickel-in-concentrate | | 107.5 | | | 88.3 | |
| Nickel-in-matte | | 103.0 | | | 79.7 | |
| Nickel metal | | 60.5 | | | 53.0 | |
| | |
|
| |
|
|
Sales | | `000 tonnes |
| Nickel-in-concentrate | | 18.1 | | | 16.2 | |
| Nickel-in-matte | | 40.7 | | | 27.5 | |
| Nickel metal | | 61.6 | | | 53.6 | |
| | |
|
| |
|
|
(1) | | WMC Resources has included information concerning profit before hedging, interest and tax in its segment results as it believes that such data is commonly used by certain investors to evaluate the core results of the Company’s segments. Profit before hedging, interest and tax is not a measure of financial performance under GAAP and should not be considered an alternative to, or more meaningful than, income before interest and income tax or net income/(loss) attributable to holding company shareholders. WMC Resource’s combined results as discussed herein include the results of hedging, interest and tax. |
(2) | | Under US GAAP profit from the sale of tenements at Kambalda was only recognized in 2001. Refer to Note 44(f) to the Combined Financial Statements. |
Copper/Uranium
Total profit before interest, hedging and tax increased to A$262.5 million, due to a number of factors. There were record sales of copper and uranium in 2000 of 203,234 tonnes and 4,353 tonnes respectively compared to 141,754 tonnes of copper and 2,756 tonnes of uranium in 1999. Australian dollar copper prices increased from A$1.11/lb in 1999 to A$1.46/lb in 2000 and unit cost of sales (net of uranium and by-product credits) were reduced by 13% to A$0.86 per pound of copper. Labor productivity increased 55% to 138 tonnes of copper per full-time-equivalent employee.
Increased production related to 2000 being the first year the expanded plant had been at full capacity after taking the plant’s capacity from 85,000 to 200,000 tonnes of refined copper a year. Record volumes of ore were treated, up 32% from 1999 to 8.9 million tonnes in 2000. Record production was achieved for all four metals – copper, uranium, gold and silver. Profit increased in line with the improved production, lower unit production costs and improved prices in A$ terms.
Following a fire in late December 1999, production during the first half year was disrupted by repairs to the copper solvent extraction plant, limiting copper production to 94,500 tonnes for the half. In spite of this, the mine and processing plant delivered over its new design capacity to meet production targets for the full year. The gold plant became fully operational during the year, producing nearly 70,000 ounces.
The average copper price increased from US$0.71 per pound in 1999 to US$0.82 per pound in 2000. LME copper stocks declined substantially from a record 843,000 tonnes in March 2000, to 357,000 tonnes in December. Copper consumption for the year increased by around 7%, largely due to increased demand for information technology infrastructure, and in consumer and industrial
-85-
| | OPERATING AND FINANCIAL REVIEW AND PROSPECTS |
applications. After reaching US$0.91 per pound in September 2000 the price declined amid concerns about high world oil prices and weakening growth.
During 2000, oversupply in the uranium market, due to utilities reducing their inventories and sales from commercial and ex-military stockpiles, depressed prices. Prices on the uranium spot market fell from US$9.60 per pound in early January 2000 to US$7.10 in late December 2000. WMC Resources’ uranium is sold under long-term contracts with leading world power utilities. These contracts provide a premium over spot or benchmark prices. All uranium exports are subject to bilateral safeguards agreements and must be approved by the Australian government.
COPPER/URANIUM PERFORMANCE SUMMARY
| | 2000
| | | 1999
| |
Financial | | A$ millions |
Profit before hedging, interest and tax(1) | | 262.5 | | | 23.6 | |
| Commodity/currency hedging | | (96.8 | ) | | (7.2 | ) |
Profit before interest and tax | | 165.7 | | | 16.4 | |
| Sales revenue | | 798.0 | | | 491.6 | |
| Capital expenditure | | 79.9 | | | 312.2 | |
| Total assets | | 3,098.0 | | | 3,171.3 | |
| | |
|
| |
|
|
Production | | | | | | |
| Refined copper (‘000 tonnes) | | 200.4 | | | 138.3 | |
| Uranium oxide (tonnes) | | 4,539 | | | 3,221 | |
| | |
|
| |
|
|
Sales | | | | | | |
| Refined copper (‘000 tonnes) | | 203.2 | | | 141.8 | |
| Uranium oxide (tonnes) | | 4,353 | | | 2,756 | |
| | |
|
| |
|
|
(1) | | WMC Resources has included information concerning profit before hedging, interest and tax in its segment results as it believes that such data is commonly used by certain investors to evaluate the core results of the Company’s segments. Profit before hedging, interest and tax is not a measure of financial performance under GAAP and should not be considered an alternative to, or more meaningful than, income before interest and income tax or net income/(loss) attributable to holding company shareholders. WMC Resource’s combined results as discussed herein include the results of hedging, interest and tax. |
Fertilizer Operations
Plant commissioning continued during the first half of 2000. Costs of this final phase of the construction project, A$52.4 million up to July 31, 2000, were capitalized. Included in this were start-up costs which under US GAAP must be expensed as incurred. Refer to Note 44 to the Combined Financial Statements. For the remainder of the year delays, low production levels and weak prices resulted in a poor performance by WMC Resources’ fertilizer business. Running costs were high due to low production rates and start-up-related costs, with extra labor required to prepare the plant for operation.
326,000 tonnes of fertilizer were produced in 2000. The ammonia plant was shut down for extended periods and was finally handed over from the lump-sum turn-key contractor in October 2000, nearly 12 months late, after the contractors made the changes required to meet agreed plant performance criteria. With the ammonia plant on line, the Phosphate Hill facility operated satisfactorily at production rates over 50,000 tonnes per month, equivalent to an annualized production rate of 615,000 tonnes for the last quarter of 2000.
While most bulk high-analysis ammonium phosphate fertilizer is sold on long-term contracts, reference prices started 2000 at US$150 per tonne, dipped to a low of US$143 in May 2000, recovered to US$170 in August 2000 and closed the year at US$156. These prices were below many producers’ cash costs, which resulted in production cutbacks, mostly in the US, and so provided a price floor. Rising input costs, such as for ammonia which increased in line with oil and gas prices, lifted production costs for most manufacturers by between 10% and 20%, providing further price support. Market drivers, such as grain prices, were weak due to global oversupply.
-86-
| | OPERATING AND FINANCIAL REVIEW AND PROSPECTS |
FERTILIZER PERFORMANCE(1)
SUMMARY
| | 2000
| | | 1999
| |
Financial | | A$ millions | |
Loss before hedging, interest and tax(2) | | (52.6 | ) | | (9.5 | ) |
| Commodity/currency hedging | | (7.1 | ) | | — | |
Loss before interest and tax | | (59.7 | ) | | (9.5 | ) |
| Sales revenue | | 222.6 | | | 191.9 | |
| Capital expenditure | | 96.2 | | | 418.4 | |
| Total assets | | 1,162.0 | | | 1,030.6 | |
Production | | ’000 tonnes |
| Phosphate fertilizer | | 326.3 | | | 5.1 | |
Sales | | ’000 tonnes |
Queensland Fertilizer Operations external sales (3) | | 157.6 | | | — | |
| Hi Fert sales | | 558.6 | | | 582.6 | |
(1) | | Includes performance of wholly owned subsidiary Hi Fert Pty. Ltd. |
(2) | | WMC Resources has included information concerning profit before hedging, interest and tax in its segment results as it believes that such data is commonly used by certain investors to evaluate the core results of the Company’s segments. Profit before hedging, interest and tax is not a measure of financial performance under GAAP and should not be considered an alternative to, or more meaningful than, income before interest and income tax or net income/(loss) attributable to holding company shareholders. WMC Resource’s combined results as discussed herein include the results of hedging, interest and tax. |
(3) | | Sales commenced in 2000. |
New Accounting Pronouncements
Australian Accounting Standards Board
The Australian Accounting Standards Board (“AASB”) has issued or revised certain Accounting Standards which are not effective for the fiscal periods reported upon in the combined financial statements.
AASB 1020, “Income Taxes” was issued in December 1999. It will be effective for WMC Resources in 2004. WMC Resources is currently assessing the impact of adopting this standard on its financial report.
AASB 1028 “Employee Benefits” was revised in June 2001. It will be effective for WMC Resources in 2003. Adoption of this standard is not expected to have a significant impact on WMC Resources’ financial position or results.
The Company early adopted the following standard for the year ended December 31, 2001. There was no material impact on the financial statements as a result of adoption.
AASB 1042, “Discontinuing Operations” was issued in August 2000. This standard relates to disclosure of discontinued operations.
The Company adopted the following standards on January 1, 2002. There was no material impact on the financial statements as a result of adoption.
AASB 1005 “Segment Reporting” was revised in August 2000. It was effective for WMC Resources in 2002. This standard relates to disclosure requirements.
AASB 1027 “Earnings per Share” was revised in October 2000 and further amended in June 2001. It was effective for WMC Resources in 2002.
-87-
| | OPERATING AND FINANCIAL REVIEW AND PROSPECTS |
|
AASB 1012 “Foreign Currency Translation” was revised in November 2000. It was effective for WMC Resources in 2002.
Financial Accounting Standards Board
The Financial Accounting Standards Board has issued certain Statements of Financial Accounting Standards which are not effective with respect to the fiscal years presented in the combined financial statements.
SFAS No. 143 “Accounting for Asset Retirement Obligations” was issued in 2001. It will be effective for WMC Resources in 2003. The statement requires an asset retirement obligation and a matching asset to be brought to account (calculated at a discounted present value) at the initial point the liability is incurred, generally when the mine is first commenced. The cost of the obligation is to be amortized over the life of a long-lived asset. Increases in the obligation as a result of the reduction of time are to be treated as interest. WMC Resources is currently assessing the impact of adopting this standard.
In April 2002, the FASB issued SFAS No. 145, “Rescission of FASB Statements No. 4, 44, and 64, Amendment of FASB Statement No. 13, and Technical Corrections”. The standard rescinds FASB Statements No. 4 and 64 that deal with issues relating to the extinguishment of debt. The standard also rescinds FASB Statement No. 44 that deals with intangible assets of motor carriers. The standard modifies SFAS No. 13, “Accounting for Leases,” so that certain capital lease modifications must be accounted for by lessees as sale-leaseback transactions. Additionally, the standard identifies amendments that should have been made to previously existing pronouncements and formally amends the appropriate pronouncements. SFAS No. 145 is effective for fiscal years beginning after May 15, 2002 with earlier adoption encouraged. WMC Resources is currently assessing the impact of adopting this standard which it intends on adopting for the 2003 fiscal year.
In July 2002, the FASB issued SFAS No. 146, “Accounting for Costs Associated with Exit or Disposal Activities”. The statement requires that costs associated with exit or disposal activities must be recognized when they are incurred rather than at the date of a commitment to an exit or disposal plan. Such costs include lease termination costs and certain employee severance costs associated with a restructuring, discontinued operations or other exit or disposal activity. WMC Resources is currently reviewing the impact of SFAS No. 146, which is effective for exit or disposal activities initiated after December 31, 2002.
The Company adopted the following standards on January 1, 2002. There was no material impact on the financial statements as a result of adoption.
SFAS No. 141 “Business Combinations” which addresses financial accounting and reporting for business combinations and supersedes APB Opinion No. 16, “Business Combinations”, was issued in June 2001 and is effective for business combinations initiated after 30 June 2001. It bans pooling-of-interest mergers and requires the use of the purchase method. Australian GAAP already requires the use of the purchase method in business acquisitions, so adoption of this standard did not have a significant impact on WMC Resources’ financial position or results.
SFAS No. 142 “Goodwill and Other Intangible Assets” which supersedes APB Opinion No. 17 was also issued in June 2001 and is effective for WMC Resources in 2002. It addresses how goodwill and other intangible assets should be accounted for after they have been initially recognized in the financial statements. Amortization of goodwill and indefinite-lived intangible assets ceases and is replaced by impairment tests. As WMC Resources does not have any goodwill or indefinite-lived intangible assets, adoption of this standard did not have a significant impact on WMC Resources’ financial position or results of operations.
In August 2001, the FASB issued SFAS No. 144, “Accounting for the Impairment or Disposal of Long-Lived Assets.” This statement supersedes SFAS No. 121 and the accounting and reporting provisions of APB Opinion No. 30. This statement will require one accounting model be used for long-lived assets to be held and used or disposed of by sale, whether previously held and used or newly acquired, and will broaden the presentation of discontinued operations to
-88-
| | OPERATING AND FINANCIAL REVIEW AND PROSPECTS |
|
include more disposal transactions. WMC Resources adopted SFAS 144 on January 1, 2002 and it did not have a material impact on WMC Resources’ financial position or results of operations.
B. Liquidity and Capital Resources
The ability of WMC Resources and its subsidiaries to generate cash internally is influenced by the following major factors:
| | (i) | | the level of world commodity prices and exchange rates to which WMC Resources’ revenue is substantially exposed; |
| | (ii) | | the level of expenditure required to explore and develop new ore reserves and to maintain existing production facilities; |
| | (iii) | | the level of capital expenditure required to develop new projects; |
| | (iv) | | the level of operating expenditure required for wages, salaries and consumables; and |
| | (v) | | the level of interest rates on borrowings. |
These factors will continue to influence WMC Resources’ liquidity and capital resources in future years.
WMC Resources ability to pay dividends and meet other obligations is dependent in large part on, and may be limited by, the amount of cash generated by its nickel operations and the level of dividends it receives from its subsidiaries. WMC Resources received cash of A$110.0 million in 2001 (2000: A$285.0 million) from WMC Resources’ nickel operations and significant dividends were received in 2001 from Olympic Dam Corporation of A$210 million (2000:A$269.8 million). No dividends were received from Queensland Fertilizer Operations in this period.
Funds generated from operations were A$63.4 million for the six months ended June 30, 2002, compared with funds generated from operations of A$407.8 million for the six months ended June 30, 2001. The decrease was due to a A$492.7 million reduction in receipts from customers from marginally lower commodity prices, a weaker US dollar relative to the Australian dollar and reduced sales volumes associated with the reduced production. This was in part offset by A$71.2 million from the closeout of interest rate swaps.
Expected capital expenditure in 2002 of A$448.4 million includes A$114.0 million on the rebuild of the copper and uranium SX circuits at Olympic Dam. The expected cost of this project across 2002 and 2003 is approximately A$250.0 million and the cost of this will be funded through operating cash flows. A further A$37.0 million is forecast to be spent in 2002 on the Optimization 3 project at Olympic Dam. In 2003, capital expenditure is expected to rise to A$571.5 million. The increase is due to the reline of the furnace at Olympic Dam, a de-bottlenecking at Mount Keith and the rebuild of the copper SX circuit at Olympic Dam.
Working capital was positive A$266.6 million as at June 30, 2002, compared to negative working capital of A$243.8 million as at 31 December 2001. The change in working capital was due to a decrease in hedging creditors as a result of commodity and currency related price movements and a reduction in current borrowings. Hedging creditors included in working capital represent the market values of hedge contracts which are expected to be settled within 12 months from the balance date. In accordance with WMC Resources, hedging strategy, the combination of proceeds from the sale of hedged production at spot prices, and any cash paid or received from the financial settlement of derivative contracts, is expected to exceed the cash cost of production, and therefore generate positive cash flows while extinguishing hedging debtors or creditors.
Total borrowings were A$2,101.0 million at June 30, 2002 down from A$2,321.8 million at December 31, 2001. During the six month period ended June 30, 2002 net repayment of borrowings amounted to A$37.0 million, compared with net repayments of A$778.3 million for the year ended December 31, 2001. During the first half of 2002 borrowings denominated in, or swapped to, US$ decreased by A$184.0 million due to the revaluation of the debt. As discussed in Item 3D “Risk Factors” such fluctuation in the A$ exchange rate will decrease US$ denominated revenues in terms of A$ to the extent that they are not hedged, but will also decrease funds required for repayment of US$ denominated borrowings
-89-
| | OPERATING AND FINANCIAL REVIEW AND PROSPECTS |
|
and other liabilities. For a description of WMC Resources’ loan facilities, refer to Item 11 “Quantitative and Qualitative Disclosures About Market Risk – Interest Rate Hedging” at page 145.
The maturity of debt is outlined in Note 24 in the unaudited Interim Combined Financial Statements and Note 27 in the Combined Financial Statements. The maturity of cross currency swaps is outlined in Note 29B(a) to the unaudited Interim Combined Financial Statements and Note 35B(a) to the Combined Financial Statements. The key funding principles inherent in WMC Resources’ Treasury policies are:
| | • | | BBB credit rating should be WMC Resources’ target minimum rating, although this is not an absolute constraint. Prior to the demerger, WMC Limited had a Standard & Poor’s long term credit rating of A (negative watch) and a short term credit rating of A-1. Moody’s Investors Service’s had a long term credit rating for WMC Limited of A3 (negative watch) and a short term credit rating of P-2; |
| | • | | Standard & Poor’s has indicated that it is likely that WMC Resources will be assigned a rating of BBB post the demerger. Whilst lower than WMC Limited’s rating prior to the demerger, this is nonetheless an investment grade rating which will allow access to domestic and international bank and debt capital markets |
| | • | | Conservative levels of debt should be maintained over the longer term to ensure that WMC Resources’ activities and growth are not debt constrained. A gearing (debt/debt + equity) level of 25 - 35% is WMC Resources’ long-term target. Prior to the demerger, at June 30, 2002 WMC Resources had a net debt/net debt + equity ratio of 31.91% on a pro forma basis; |
| | • | | Interest cover of 6.0 times and cashflow to debt of 40% are long-term targets. Prior to the demerger, at June 30, 2002 WMC Resources had interest cover of 2.2 times and cash flow to debt of 22.5% (annualized) on a pro forma basis; |
| | • | | Debt should be sourced from the most competitively priced source, although this needs to be balanced against having a diversity of sources and a managed maturity portfolio; |
| | • | | Debt tenor and currency should reflect asset life and currency exposure. A core amount of long-term debt should be retained (around 50% of total debt) with the balance in short-term and medium-term debt due to its lower cost and repayment flexibility; |
| | • | | WMC Resources’ Risk Management Committee is responsible for managing the fixed/floating interest rate mix and the currency of debt. It has accepted recommendations that a significant portion of longer-term debt should remain fixed; |
| | • | | Project finance should be utilized where warranted by risk management considerations (country or project specific); |
| | • | | Where foreign currency assets are acquired, the raising of debt in that currency should be examined to achieve a balance sheet hedge and reduce foreign exchange translation exposures; and |
| | • | | Asset based financing should be considered only once the acquisition decision has been assessed positively on an all equity (i.e. ungeared) basis. The decision thereafter of buy versus lease or mode of financing is then one of financing cost or risk management/transference. |
Cash and current investments net of bank overdrafts was A$62.4 million at June 30, 2002 and A$124.1 million at December 31, 2001. Net debt was A$2,038.6 million at June 30, 2002 and A$2,197.9 million at December 31, 2001. The decrease in net debt was principally due to a A$176.0 million reduction in the Australian value of the US dollar denominated borrowings as a result of the weaker US dollar relative to the Australian dollar on June 30, 2002 compared to December 31, 2001.
-90-
| | OPERATING AND FINANCIAL REVIEW AND PROSPECTS |
|
Available sources of liquidity were represented by unused bank facilities at June 30, 2002 of A$738.4 million, as compared to A$718.2 million at December 31, 2001. The bank loan balances have been designated as credit standby facilities in respect of the US$ and A$ commercial paper program and therefore their use and availability has been determined in line with the outstandings under this program.
Capital expenditure (including exploration) was A$139.8 million for the six months ended June 30, 2002, A$354.5 million for the year ended December 31, 2001, A$349.0 million for the year ended December 31, 2000 and A$877.5 million for the year ended December 31, 1999 The capital expenditure was allocated as follows:
| | | Six Months Ended June 30, 2002
| | Year Ended December 31, 2001
| | Year Ended December 31, 2000
| | Year Ended December 31, 1999
|
| | | (A$ million) |
| Exploration | | 3.3 | | 30.1 | | 8.5 | | 8.2 |
| Mine development | | 63.5 | | 221.6 | | 212.8 | | 174.9 |
| New plant and equipment at existing operations | | 62.6 | | 184.5 | | 224.9 | | 697.2 |
| Acquisition of properties | | 9.5 | | 19.8 | | 22.0 | | 84.9 |
| Government facilities | | 1.8 | | 0.8 | | 0.6 | | 19.7 |
An analysis of WMC Resources’ contractual and commercial commitments is set out in the table below.
| | | Amount of Commitment – June 30, 2002
|
Contractual Obligations | | Total
| | Less than 1 year
| | 1-3 years
| | 4-5 years
| | More than 5 years
|
| | | (A$ million) |
| Short term debt | | 467.6 | | 467.6 | | — | | | | — |
| Non current payables | | 914.2 | | — | | 540.6 | | 27.1 | | 346.5 |
| Long term debt | | 1,633.4 | | | | 662.4 | | 353.1 | | 617.9 |
| | |
| |
| |
| |
| |
|
| Total on-balance sheet contractual obligations | | 3,015.2 | | 467.6 | | 1,203.0 | | 380.2 | | 964.4 |
| | |
| |
| |
| |
| |
|
| Capital expenditure | | 69.4 | | 69.4 | | | | | | |
| Exploration and mining titles | | 216.8 | | 16.6 | | 29.4 | | 39.8 | | 131.0 |
| | |
| |
| |
| |
| |
|
| Total off-balance sheet obligations | | 286.2 | | 86.0 | | 29.4 | | 39.8 | | 131.0 |
-91-
| | OPERATING AND FINANCIAL REVIEW AND PROSPECTS |
|
| | | Amount of Commitment—June 30, 2002
|
Other commercial commitments | | Total
| | Less than 1 year
| | 1-3 years
| | 4-5 years
| | More than 5 years
|
| | | (A$ million) |
| Business undertaking commitments | | 82.4 | | 8.1 | | 19.3 | | 10.5 | | 44.5 |
| Operating lease commitments | | 166.1 | | 23.2 | | 36.8 | | 35.6 | | 70.5 |
| Other commitments | | 851.7 | | 59.4 | | 118.5 | | 116.5 | | 557.3 |
| | |
| |
| |
| |
| |
|
| Total other commercial commitments | | 1,100.2 | | 90.7 | | 174.6 | | 162.6 | | 672.3 |
| | |
| |
| |
| |
| |
|
Capital commitments on contracts for the purchase of assets comprising mine properties and development, property, plant and equipment were A$69.4 million at June 30, 2002 and A$35.4 million at December 31, 2001. These commitments for capital expenditure are in addition to the normal capital expenditure involved in mine development and maintenance at WMC Resources’ existing mines.
Commitments for expenditure for exploration, evaluation and mining activities during the life of current WMC Resources exploration and mining tenements and earning rights under farm-in and option entitlements was estimated as A$216.8 million at June 30, 2002 and A$375.1 million at December 31, 2001. These amounts are the maximum potential expenditure commitments for work expected to be beneficial to WMC Resources and include payments to vendors in which WMC Resources has earning rights. Australian mining laws generally require that certain levels of expenditure be incurred to maintain tenements in good standing. The commitments may be reduced by seeking exemption from individual commitments or by relinquishment of tenure.
Operating lease commitments relate to the Queensland Fertilizer Operations and comprise: the GATX sulphuric asset rail wagons, certain Townsville storage and conveying assets, the Phosphate Hill camp and the Mt Isa power generation turbine, all of which WMC Resources has leased from Commonwealth Bank of Australia for a period of 10 years. WMC Resources also has a lease with Caterpillar Finance relating to the Solar Turbines used for power generation at Phosphate Hill and leases various office facilities both in Australia and overseas.
Other commitments consist of commitments for payments to suppliers of gas, gas conversion, shiploading, rail transport and sulphuric acid under long-term contracts existing at reporting date but not recognized as payable.
WMC Resources does not have other material off-balance sheet financing arrangements.
For a discussion of WMC Resources’ ability to satisfy its commitments and contractual obligations as they become payable, refer to pages 90 and 91.
C. Research and Development, Patents and Licenses, etc
WMC Resources has continued to consolidate and prioritize its research and development activities through a combination of internal development, external research, alliances, joint ventures and targeted venture capital activities. Company-wide effort is coordinated through a lead team of technical managers. During 2001 a thorough review of technology was undertaken both by the technical managers and external consultants.
Project expenditures qualifying for Australian R & D tax concessions were:
| | | |
| 1999 | | A$7.3 million |
| 2000 | | A$22.4 million |
| 2001 | | A$12.6 million(1) |
| 2002 | | A$21.0 million |
(1) | | The 2001 and 2002 figures are the accounting provisions, since tax concession amounts are not finalized until later in the year. |
-92-
| | OPERATING AND FINANCIAL REVIEW AND PROSPECTS |
|
These figures only apply to those expenditures on which WMC Resources has applied for tax concessions. Additional research and development expenditure is incurred on our site operating costs due to the continuous improvement philosophy of our business, and through venture capital arrangements.
D. Trend Information
Relevant industry and market trends are discussed for WMC Resources as a whole and for each business segment in Item 5A “Operating Results”.
-93-
| | OPERATING AND FINANCIAL REVIEW AND PROSPECTS |
|
ITEM 6. DIRECTORS, SENIOR MANAGEMENT AND EMPLOYEES
A. Directors and Senior Management
The business of WMC Resources is managed by a Board of Directors which, in accordance with WMC Resources’ constitution, may have not fewer than three nor more than 12 members.
Directors of WMC Resources are classified as either executive or non-executive Directors, with the former being those Directors engaged in full-time employment by WMC Resources. The members of the audit committee are: Adrienne E. Clarke, Peter J. Knight and David E. Meiklejohn. The members of the compensation committee are: Ian G.R. Burgess, Tommie C.-E. Bergman, Roger A.G. Vines and Ian E. Webber.
As at September 3, 2002, the Directors of WMC Resources were:
Name
| | Position
| | Summary
| | Initially Elected or Appointed a Director
| | Age
| | Expiry of Current Term
|
Executive Directors | | | | | | | | | | |
|
| Hugh M. Morgan (4) | | Chief Executive Officer | | Member of the board of the Reserve Bank of Australia and director of Alcoa of Australia Ltd and Alcoa Alumina & Chemicals LLC. A member and past president of the Minerals Council of Australia, a member of the Board of the Business Council of Australia, President of the Australia Japan Business Co-operation Committee, and immediate past Chairman of the International Council on Metals and the Environment. | | December 1976 | | 61 | | (4) |
|
| Andrew G Michelmore | | Chief Executive Officer elect | | Operational experience with ICI Australia, CRA and Nabalco in senior project and general management roles, before joining WMC Limited in 1993. From January 2001, Executive General Manager – Business Strategy and Development for WMC Limited. | | August 2002 | | 49 | | (4) |
|
Non-Executive Directors | | | | | | |
|
| Ian G. R. Burgess (1) (3) | | Chairman | | Extensive business experience; former Trustee of the Walter and Eliza Hall Trust and a former Chairman of CSR Limited and AMP Limited. | | July 1993 | | 70 | | 2005(3) |
|
| Tommie C.-E. Bergman(1) (5) | | Deputy Chairman | | Former Chairman and Managing Director Australasia of Asea Brown Boveri Pty Ltd, a director of, Amcor Limited and Smorgon Steel Group Limited. Non-Executive Deputy Chairman of Cochlear Ltd and a former Director of Atlas Copco Australia Pty Ltd. | | January 2001 | | 57 | | 2004 |
-94-
| | DIRECTORS, SENIOR MANAGEMENT AND EMPLOYEES |
| |
|
Name
| | Position
| | Summary
| | Initially Elected or Apporinted a Director
| | Age
| | Expiry of Current Term
|
|
Adrienne E. Clarke (2) | | Director | | Director of Fisher and Paykel, Healthcare Corporation Limited, Woolworths Limited, Amrad Corporation Limited and Hexima Limited. Chair of CSIRO from 1991 to 1996, a past Lieutenant-Governor of Victoria, Victoria’s Ambassador for Biotechnology, President of the International Society for Plant Molecular Biology and member of the US National Academy of Sciences. | | July 1996 | | 64 | | 2003 |
|
Peter J. Knight (2) | | Director | | Former Chairman of Central Norseman Gold Corporation Limited and a non-executive director and former managing director of Clough Limited. | | August 1997 | | 63 | | 2004 |
|
David E. Meiklejohn (2) | | Director | | Chairman of PaperlinX Limited and SPC Ardmona Limited, Deputy Chairman of GasNet Australia Limited, Director of One Steel Limited, former Chairman of Kimberley-Clark Australia Limited and former Director of Amcor Limited, Colonial Limited, Spicers Paper Limited, Treasurer Corporation of Victoria, Mayne Nickless Limited and New Zealand Forest Products Limited. | | April 2002 | | 60 | | 2005 |
|
| M. John Phillips | | Former Director | | Former Deputy Governor and Deputy Chairman of the Reserve Bank of Australia. He is Chancellor of the University of Western Sydney and Chairman of IBJ Australia Bank Limited, the Foreign Investment Review Board and The Australian Gas Light Company. A former Director of QBE Insurance Group Limited and Woolworths Limited. | | July 1996 | | 72 | | Retired -18 June 2002 |
|
Roger A. G. Vines (1) | | Director | | Director of Woodside Petroleum Limited and former director of Central Norseman Gold Corporation Limited. Former chairman and managing director of Alcoa of Australia Limited. | | February 1999 | | 65 | | 2005 |
|
Ian E. Webber (1) | | Director | | Director of Santos Limited. A member of General Motors Australian Advisory Council. Former chairman of Mayne Nickless Limited and former Director of Pacific Dunlop Limited. | | June 1997 | | 67 | | 2003 |
(1) | | Member of Compensation Committee. |
(2) | | Member of Audit Committee. |
(3) | | Ian G. R. Burgess was appointed Chairman on April 15, 1999 and will retire as Chairman at the 2003 Annual General Meeting. |
(4) | | Hugh M. Morgan will retire as Chief Executive Officer and as a Director in January 2003. On August 13, 2002, the Board appointed Andrew G. Michelmore, currently EGM – Business Strategy & Development, to succeed Mr. Morgan as Chief Executive Officer. |
(5) | | Tommie C.-E. Bergman was appointed Deputy Chairman on March 13, 2002. |
(6) | | David E. Meiklejohn was appointed a director on April 19, 2002. |
-95-
| | DIRECTORS, SENIOR MANAGEMENT AND EMPLOYEES |
| |
|
In addition to the Chief Executive Officer, the former WMC Limited executive officers appointed by and reporting to the Chief Executive Officer are responsible for the day to day running of the business. As at September 3, 2002, the executive officers of WMC Resources were:
Name
| | Position in 2002 (1)
| | Appointed as Executive Officer
|
| Bruce R. Brook | | Executive General Manager – Finance and Chief Financial Officer | | March 2002 |
| Alan K. Dundas | | Executive General Manager – Operations | | January 2001 |
Andrew G. Michelmore (1) | | Executive General Manager – Business Strategy & Development | | January 1993 |
| Greg J. Travers | | Executive General Manager – Group Services | | June 1996 |
(1) | | On August 13, 2002, Andrew G. Michelmore was appointed to the Board of Directors. He was also appointed the successor to Chief Executive Officer, Hugh M. Morgan, who will retire in January 2003. |
-96-
| | DIRECTORS, SENIOR MANAGEMENT AND EMPLOYEES |
| |
|
The experience of WMC Resources’ continuing management team, who, with the Chief Executive Officer have responsibility for all operational and administrative functions of the business, is outlined below:
Executive Officer
| | Summary of Experience
|
|
| Bruce R. Brook | | Appointed as Executive General Manager – Finance of WMC Limited in March 2002 and Chief Financial Officer in June 2002. Mr Brook was Deputy Chief Financial Officer at the ANZ Bank and has had substantial experience in the resources and finance sectors, having worked for Price Waterhouse; Gold Fields of South Africa, Pasminco Limited, CRA and Pacific Dunlop. |
|
| Alan K. Dundas | | Senior operational and management roles with various companies in Australia and Canada including Nabalco, Curragh Qld Mining and Quintette Coal. Joined WMC Limited in 1994 and held roles of General Manager – Kwinana Nickel Refinery and General Manager – Nickel Operations. From January 2001, Executive General Manager – Nickel and until the demerger, Executive General Manager – Operations. |
|
| Andrew G. Michelmore | | Operational experience with ICI Australia, CRA and Nabalco in senior project and general management roles, before joining WMC Limited in 1993. From January 2001, Executive General Manager – Business Strategy and Development for WMC Limited. |
|
| Greg J. Travers | | Executive General Manager – Group Services for WMC Limited prior to the demerger. Experience in both operations and functional service areas, and has worked with Pratt Industries, Mount Newman Mining Company and BHP. He joined WMC Limited in 1994 as Group Manager – Training and Organisational Development. Mr Travers is a director of Australian Mines and Metals Association and was a director of the Institute of Public Affairs until November 2001. |
B. Compensation
For the year ended December 31, 2001, the aggregate amount of compensation paid and accrued to the WMC Limited Directors and executive general managers of WMC Limited was A$11,382,538 (compared to A$9,751,658 in 2000 and A$7,496,785 in 1999). This amount includes retirement allowances of A$181,619 paid to either Non-Executive or Executive Directors who retired from office during the period January 1, 2001 to December 31, 2001. This amount also includes A$582,116 in pension benefits in the Company’s superannuation scheme for Directors and members of administrative, supervisory or management bodies. There are no other contingent or deferred compensation arrangements accrued for executives or directors. The terms and conditions applicable to the Directors and executive general managers of WMC Limited apply to their positions with WMC Resources. The remuneration of individual directors and executive general managers is presented in the tables below.
Non-executive director remuneration January to December 2001 Non-executive directors
| | Director’s fee (1)
| | Other (2)
| | Total
|
| Tommie C-E Bergman | | 66,000 | | 5,374 | | 71,374 |
| Ian G. R. Burgess | | 190,000 | | 15,294 | | 205,294 |
| Adrienne E. Clarke | | 72,000 | | 5,854 | | 77,854 |
| Peter J. Knight | | 72,000 | | 5,854 | | 77,854 |
| M John Phillips | | 78,000 | | 9,141 | | 87,141 |
| Roger A. G. Vines | | 72,000 | | 5,854 | | 77,854 |
| Ian E. Webber | | 78,000 | | 6,334 | | 84,334 |
| Roy Woodall | | 18,595 | | 183,946 | | 202,541 |
(1) | | Includes board and committee fees. |
(2) | | Includes superannuation, executive indemnity insurance and retirement payments. |
-97-
| | DIRECTORS, SENIOR MANAGEMENT AND EMPLOYEES |
| |
|
| | | | | | | |
Executive director remuneration and senior executive remuneration January to December 2001
| | Fixed remuneration
| | Other compensation
| | Total remuneration
|
| | | A$ (1) | | A$ | | A$ |
Executive director | | | | | | |
| Hugh M. Morgan, Chief Executive Officer | | 1,562,416 | | 507,544 | | 2,069,960 |
| Donald M Morley | | 802,900 | | 607,544 | | 1,410,444 |
|
Executive general managers | | | | | | |
| Alan K. Dundas – Operations | | 487,500 | | 268,044 | | 755,544 |
| Peter Johnston | | 595,833 | | 1,046,694 | | 1,642,527 |
| Andrew G. Michelmore – Business Strategy and Development | | 650,000 | | 401,344 | | 1,051,344 |
| Anthony O’Neill | | 334,082 | | 1,101,122 | | 1,435,204 |
| John Parry | | 911,037 | | 416,088 | | 1,327,125 |
| Greg J. Travers – Group Services | | 459,100 | | 347,044 | | 806,144 |
(1) | | This includes amounts accrued for annual leave and long service leave. |
Non-executive directors with more than five years service are entitled to retirement benefits equaling the total fees paid in the three years before retirement. Directors with three to five years service receive pro rata benefits. Non-executive directors under the age of 75 receive a superannuation guarantee contribution which effective July 1, 2002 increased from 8% to 9% of their fees.
All full time Australian based employees and expatriate employees of WMC Resources (including Executive Directors and Officers) and its subsidiaries are members of the WMC Superannuation Plan (formerly WMC Superannuation Fund). The WMC Superannuation Plan has three categories of membership:
| | • | | the defined benefit category provides lump sum benefits based on period of service, age and final average salary, |
| | • | | the accumulation category offers a minimum company contribution from 11.5% to 20% of basic annual salary to each member’s account in the Plan; and |
| | • | | The Superannuation Guarantee Category is a compulsory accumulation category for all employees under hourly paid awards. Under legislation WMC Resources is required to make minimum contributions. Effective July 1, 2002, the contribution rate increased from 8% to 9% of ordinary time earnings. |
For further details of the WMC Superannuation Plan, refer to Note 39 of the Combined Financial Statements.
C. Board Practices
The Board, working with senior management, is responsible to shareholders for overall business performance. It approves company goals and directions, strategic plans and performance targets. The Board ensures that appropriate policies, procedures and systems are in place to manage risk, optimize business performance and maintain high standards of ethical behavior and legal compliance.
WMC Resources’ Board comprises a non-executive chairman, six other non-executive directors and two executive directors. Relevant experience, diverse perspectives and complementary skills are sought when appointing new directors. A balance between independent business experience and relevant industry knowledge is sought.
-98-
| | DIRECTORS, SENIOR MANAGEMENT AND EMPLOYEES |
Full-day Board meetings are held each month except January. In addition, to increase business knowledge, two meetings are usually held at operational sites each year, and further meetings are held as are deemed necessary.
The Directors (other than a Managing Director) are subject to retirement by rotation, one-third retiring each year by order of seniority of election (or the number nearest to one-third if the number of Directors is not a multiple of three), and may not continue to hold office without re-election after the third Annual General Meeting following their last election by the shareholders. Eligible retiring Directors may offer themselves for re-election by the shareholders. Non-executive directors retire, by agreement, at the Annual General Meeting following them reaching 72 years of age. Executive Directors retire at 65 years of age. After once being elected by the shareholders, a Director who is appointed a Managing Director by the Board is not required to retire by rotation. The Directors may appoint a Director either to fill a casual vacancy or as an addition to their numbers. Such Directors hold office until the next Annual General Meeting and may be elected by the shareholders at such meeting but are not taken into account in determining the number of Directors who are to retire by rotation at that meeting.
Each Director has the power to appoint any person approved by a majority of his co-Directors to act as an Alternate Director in his place, whether for a stated period or periods or until the happening of a specified event or from time to time, whenever by absence or illness or otherwise he shall be unable to attend to his duties as a Director.
The Directors may from time to time appoint one or more of their body to be a Managing Director or Managing Directors either for an unlimited period but not for life, a fixed term not exceeding five years, or a period terminable upon the happening of such specific events as the Directors may stipulate. The Directors may confer upon any Managing Director such of the powers exercisable under WMC Resources’ Constitution by the Directors as they may elect, without derogating from the exercise of those powers by the Directors. Mr Hugh M Morgan is currently the sole Managing Director and Chief Executive Officer of WMC Resources. Mr Hugh M Morgan will retire as Managing Director and Chief Executive Officer in January 2003. WMC Resources’ Constitution provides that the Directors may elect a Chairman of their meetings and determine the period for which he is to hold office. Where there is an equality of votes on a question voted on at a meeting, the Chairman has a second or casting vote (subject to the ASX Listing Rules). Mr Ian G R Burgess is currently the Non-Executive Chairman of WMC Resources.
WMC Resources’ most senior employee, the chief executive officer, is selected by the Board and is subject to annual performance reviews by the non-executive Directors. The chief executive officer recommends policy and strategic direction for Board approval and is responsible for managing day-to-day operations.
Specific Board committees assist the full Board. Charters set out the roles and terms of reference for the audit and compensation committees. The Audit Committee, consisting of three non-executive Directors, meets at least four times a year, assists the Board in overseeing company accounts and external financial reporting, ensuring that such documents are prepared in accordance with the appropriate standards and statutory requirements. Annually, the committee reviews audit programs conducted by independent external auditors, and the internal audit function to ensure that its non-reserve mineralizations are adequate, used effectively and coordinated with the external auditors. It meets regularly with management, and internal and external auditors, to ensure that adequate controls and practices are in place. The members of the audit committee are: Adrienne E. Clarke, Peter J. Knight and David E. Meiklejohn
The Compensation Committee consisting of three non-executive Directors meets at least three times a year. Its role is to oversee WMC Resources’ remuneration and compensation plans, policies and practices, including remuneration of the non-executive Directors, the chief executive officer and senior executives, and succession planning. The members of the compensation committee are: Ian G.R. Burgess, Roger A.G. Vines and Ian E. Webber. On behalf of the Board the committee considers the remuneration strategy with regard to community and industry standards and, where possible, verifies its appropriateness using external information and advice to ensure that:
| | • | | employee interests are aligned to corporate objectives; |
-99-
| | DIRECTORS, SENIOR MANAGEMENT AND EMPLOYEES |
| | • | | WMC Resources can attract, develop and retain superior talent; and |
| | • | | the integrity of WMC Resources’ reward program is maintained. |
Board committee meetings are occasionally convened to address predetermined issues, when it is not practical to organize a full Board meeting. A Board committee comprises two or more Directors.
D. Employees
At June 30, 2002, WMC Resources employed 2,869 people directly and hired 1,541 as contractors.
WMC Resources is decentralized into divisional business or functional units where Executive General Managers and General Managers exercise widely delegated authority and discretion within broad guidelines. Responsibility for employee relations resides with the operations with support and advice from the Human Resources Department.
Individual contracts of employment have been implemented across WMC Resources’ operations. This move to individual contracts was effectively concluded during 1997, with the majority of employees now employed under the same form of contract.
Membership of Trade Unions is optional under Australian law. Industrial disputation over the past year has been minimal and confined to contractor organizations. No WMC Resources employees participated in any industrial disputation. WMC Resources operates continuous shift work across many of its operations in Western Australia, South Australia and Queensland.
Local law and custom is observed as a minimum standard in determining wage and working conditions at WMC Resources’ overseas operations. WMC Resources has in place a Code of Conduct, the objective of which is to ensure fair and ethical practices within WMC Resources, which must be observed by all Directors, employees and contractors at all of WMC Resources’ operations.
-100-
| | DIRECTORS, SENIOR MANAGEMENT AND EMPLOYEES |
The distribution of WMC Resources’ employees between business segments and geographically is outlined below:
| | | Six Months End June 30, 2002
| | Year end December 31, 2001
| | Year end December 31, 2000
| | Year end December 31, 1999
|
| | | Permanent Staff
| | Contractors
| | Permanent Staff
| | Contractors
| | Permanent Staff
| | Contractors
| | Permanent Staff
| | Contractors
|
| Copper | | 973 | | 325 | | 988 | | 314 | | 1,057 | | 377 | | 1,011 | | 381 |
| Nickel | | 971 | | 794 | | 1,009 | | 755 | | 1,044 | | 820 | | 1,077 | | 635 |
| Gold | | — | | — | | 104 | | 86 | | 330 | | 302 | | 346 | | 336 |
| Industrial Minerals and Fertilizers | | 364 | | 172 | | 364 | | 233 | | 439 | | 310 | | 374 | | 185 |
| Projects | | 31 | | — | | 38 | | 19 | | 35 | | 1 | | 60 | | 37 |
| Ex-Div | | 48 | | — | | 68 | | 5 | | 182 | | 17 | | 207 | | 42 |
| Corporate | | 482 | | 250 | | 476 | | 175 | | 396 | | 50 | | 339 | | 113 |
| | |
| |
| |
| |
| |
| |
| |
| |
|
TOTAL | | 2,869 | | 1,541 | | 3,047 | | 1,587 | | 3,483 | | 1,877 | | 3,414 | | 1,729 |
| | |
| |
| |
| |
| |
| |
| |
| |
|
| Australia | | 2,853 | | 1,541 | | 2,978 | | 1,582 | | 3,341 | | 1,863 | | 3,214 | | 1,656 |
| North America | | 9 | | — | | 46 | | 3 | | 76 | | 6 | | 65 | | 17 |
| South America | | 2 | | — | | 16 | | 2 | | 53 | | 8 | | 88 | | — |
| Asia | | 5 | | — | | — | | — | | 10 | | — | | 44 | | 56 |
| Europe | | — | | — | | 2 | | — | | 3 | | — | | 3 | | — |
| South Africa | | — | | — | | 5 | | — | | — | | — | | — | | — |
E. Share Ownership
WMC Limited Employee Share Scheme
In 1987, WMC Limited shareholders approved the establishment by WMC of the WMC Employee Share Scheme (WMC ESS). The WMC ESS provided a framework for the offer by the WMC Limited Board of WMC ordinary shares, or rights to or in respect of such shares (such as options), to employees of the WMC Limited Group companies from time to time. From 1987 until the demerger and pursuant to the WMC ESS, WMC Limited issued to WMC Group employees, partly paid ordinary shares in WMC Limited, WMC Limited options, ‘stock appreciation plan’ rights and WMC ordinary shares.
WMC Limited senior officers share plans
The WMC Limited Board established a WMC Senior Officers Share Plan (SOSP) in each of 1987 and 1988. Under each SOSP, certain full time senior executive employees (including executive directors) of WMC Group companies were offered partly paid ordinary shares in WMC Limited. Executives were required to pay an initial application amount of A$0.05 per partly paid share, with the balance of the issue price being payable on a final call able to be made by WMC Limited – either on its own initiative or upon the request of the relevant executive – in certain circumstances (and in any event no later than 15 years after the date of issue of the relevant share).
In connection with the demerger, the WMC Limited Board decided that the most equitable and appropriate manner of dealing with the partly paid shares was to make a call upon the holders for payment of the amounts owing; and to offer the holders an interest-free loan to fund the payment of the call.
-101-
| | DIRECTORS, SENIOR MANAGEMENT AND EMPLOYEES | | |
Accordingly, on April 10, 2002, WMC Limited formally made a call for payment of the balance payable on each partly paid share (other than those held by Mr. Hugh Morgan and Mr. Don Morley). The amount payable under the call was required to be paid by April 17, 2002. At the same time, WMC Limited offered the holders of those partly paid shares interest-free loans equal to the amount payable under the call, and which are repayable on the last date upon which the call on their Partly Paid shares would otherwise have been made. On the date of the call, there were:
| | • | | 333,000 partly paid shares on issue under the 1987 SOSP, held by 18 holders, and |
| | • | | 244,000 partly paid shares on issue under the 1988 SOSP, held by 16 holders. |
Of the total of 23 participants, seven were former WMC Limited Group employees.
All of the amounts owing on the partly paid shares issued pursuant to each SOSP were paid, and WMC Limited advanced interest-free loans to holders of those partly paid shares. For the partly paid shares issued under 1987 SOSP WMC Limited advanced A$963,590, repayable on or before December 21, 2002; and for the partly paid shares issue under the 1988 SOSP, WMC Limited advanced A$389,470, repayable on or before November 25, 2003.
On April 16, 2002, Messrs Morgan and Morley voluntarily paid all amounts outstanding in respect of the partly paid shares issued to them under the 1987 SOSP and the 1988 SOSP. Mr. Morgan held 100,000 partly paid shares issued under the 1987 SOSP and 120,000 partly paid shares issued under the 1988 SOSP. Mr. Morley held 66,000 partly paid shares issued under the 1987 SOSP and 45,000 partly paid shares issued under the 1988 SOSP. Unlike other participants, Messrs Morgan and Morley did not receive interest-free loans from WMC Limited to fund these payments.
As a result of the matters described above, all of the partly paid shares became WMC Limited shares. Prior to the demerger, WMC Limited had no partly paid shares outstanding.
-102-
| | DIRECTORS, SENIOR MANAGEMENT AND EMPLOYEES |
WMC Limited employee option plans
Starting in 1987, WMC Limited established WMC Limited Option Plans pursuant to which WMC Limited options were issued to WMC Limited Group employees. The details of the options issued under those plans are set out in the table below.
OPTIONS TO ACQUIRE FULLY PAID ORDINARY SHARES
| | | Number Issued
| | Number Quoted
| | Exercise Price
| | Expiry Date
|
| Balance at June 30, 2002 | | | | | | | | |
| | | 375,000 | | Nil | | $5.40 | | December 22, 2002 |
| | | 612,100 | | Nil | | $4.91 | | December 22, 2002 |
| | | 375,000 | | Nil | | $5.37 | | December 21, 2003 |
| | | 1,122,270 | | Nil | | $4.88 | | December 21, 2003 |
| | | 4,044,053 | | Nil | | $8.42 | | December 17, 2004 |
| | | 6,470,450 | | Nil | | $7.52 | | December 18, 2005 |
| | | 11,196,700 | | Nil | | $9.35 | | November 30, 2006 |
| | |
| | | | | | |
| | | 24,195,573 | | | | | | |
| | |
| | | | | | |
|
| Issued during the current period | | 600,000 | | Nil | | $9.35 | | November 30, 2006 |
|
| Exercised during the current period | | 2,968,990 | | | | | | |
|
| Expired/lapsed during the current period | | 17,400 | | Nil | | $7.52 | | December 18, 2005 |
| | | 483,400 | | Nil | | $9.35 | | November 30, 2006 |
| | |
| | | | | | |
| | | 500,800 | | | | | | |
| | |
| | | | | | |
The terms of each WMC Limited Option Plan were in substance the same, except for the May 2002 WMC Limited Option Plan described more fully below. Each WMC Limited option gave the holder the right to subscribe for one WMC Limited Share (subject to adjustment in accordance with the terms of the WMC Limited Option Plan to reflect new issues by WMC Limited and capital reconstructions). Upon exercise of the WMC Limited option, the holder was obliged to pay the relevant exercise price, which was determined by reference to the weighted average sale price of WMC Limited shares on the ASX on the trading day that the invitation to apply for the relevant WMC Limited options was made to employees. In the case of WMC Limited options issued to WMC Limited’s executive directors under the 1997 WMC Limited Option Plan and the 1998 WMC Limited Option Plan (375,000 shares in each case, at an exercise price of A$5.40 for the 1997 Plan and A$5.37 for 1998 Plan) a 10% premium was applied to that weighted average sale price. WMC Limited options could not be exercised for a period of 12 months after their date of allotment (subject to limited exceptions). WMC Limited options lapsed if not exercised after five years from their date of issue.
WMC Limited options issued under the May 2002 WMC Limited Option Plan were issued to the senior executives (other than Hugh Morgan and Don Morley) who were excluded from participating in the 2001 WMC Limited Option Plan because of market speculation concerning WMC Limited at the time the 2001 options were issued. WMC Limited options issued under the May 2002 WMC Limited Option Plan were issued so as to be on equivalent terms to WMC Limited options issued under the 2001 WMC Limited Option Plan (i.e. they had the same exercise price (A$9.35), the prohibition on exercise expired on November 30, 2002 and they had the same lapse date, November 30, 2006). With regard to Messrs Morgan and Morley, they were issued WMC Limited stock appreciation rights on terms equivalent to the WMC Limited Options issued in May 2002 instead of receiving options. See “WMC Limited Stock Appreciation Plans” below.
-103-
| | DIRECTORS, SENIOR MANAGEMENT AND EMPLOYEES | | |
On August 13, 2002, WMC Limited announced a suspension of future allotments of WMC Limited options to senior executives under the WMC Limited Option Plans. However, senior managers who already held WMC Limited options had the right and entitlement to participate in the Option Scheme (described in the section “The Option Scheme approved by shareholders in connection with the demerger” below) and to be granted WMC Resources options, on the same terms as all other WMC Limited optionholders. The grant of WMC Resources options to these senior managers resulted from their existing holding of WMC Limited options and was not be a new allotment under the WMC Limited Option Plans.
As at June 30, 2002 the aggregate number of WMC Limited options held by Executive Directors of WMC Limited and those officers referred to in Item 6A was 2,582,000. All WMC Limited directors and executive general managers own shares or options in WMC Limited, but none own more than one percent of any category.
WMC Limited Stock Appreciation Plans
In various years since approval of the WMC Employee Share Scheme in 1987, WMC Limited established Stock Appreciation Plans (SAPs) for the benefit of WMC Limited Group employees in countries outside Australia. The purpose of the SAPs was to provide such employees, who due to securities law constraints were not eligible to participate in the allotments of options, with benefits similar to those conferred by the options.
The terms of each SAP were in substance the same as the option plans. Under each SAP, eligible employees were invited to apply for the grant by WMC Limited of ‘SAP Rights’. Although employees were not required to pay any amount for the grant of the SAP Rights, each has a notional allotment price, equal to the weighted average sale price of WMC Limited shares on the ASX on the trading day that the invitation to apply for the relevant SAP Right was made to an employee. Upon redemption of a SAP Right before its expiry by the holder, the holder was entitled to a payment equal to the difference between the closing price of WMC Limited shares on the ASX on the trading day immediately before redemption, and the allotment price (provided the former amount is higher).
As noted in the section “WMC Limited Option Plans” above, Hugh Morgan and Don Morley were issued WMC Limited SAP Rights on terms equivalent to the WMC Limited Options issued to WMC Limited senior executives under the May 2002 WMC Limited Option Plan. The SAP Rights issued to Messrs. Morgan and Morley have an equivalent allotment price to the options (A$9.35), the prohibition on redemption expires on the same date (November 30, 2002) and they lapse on the same date (November 30, 2006).
As at June 30, 2002, there were:
| | • | | 69,900 SAP Rights issued under the 1997 SAP, with an allotment price of $4.91 and an expiry date of December 22, 2002; |
| | • | | 91,088 SAP Rights issued under the 1998 SAP, with an allotment price of $4.88 and an expiry date of December 21, 2003; |
| | • | | 296,600 SAP Rights issued under the 1999 SAP, with an allotment price of $8.42 and an expiry date of December 20, 2004; |
| | • | | 540,700 SAP Rights issued under the 2000 SAP, with an allotment price of $7.52 and an expiry date of December 18, 2005; and |
| | • | | 513,700 SAP Rights issued under the 2001 SAP, with an allotment price of $9.35 and an expiry date of November 30, 2006. |
-104-
| | DIRECTOR, SENIOR MANAGEMENT AND EMPLOYEES | | |
WMC Limited Share Purchase Plan
In 1988 the WMC Limited Board established a WMC Employee Share Purchase Plan (WMC ESPP).
Under the WMC ESPP, certain full time employees of WMC Limited Group companies were offered the opportunity to subscribe for WMC Limited shares. WMC Limited shares were allotted at an issue price of A$5.17, with the employees required to pay A$0.10 per WMC Limited Share of the issue price and the balance funded by way of a limited-recourse, interest-free loan from WMC Limited to the participating employee.
The loan from WMC Limited was repayable out of dividends paid on WMC Limited shares and the sale of any renounceable rights and bonus shares which accrued in respect of the WMC Limited shares issued under the WMC ESPP while the loan remained outstanding. The loan was also able to be repaid voluntarily by the employee.
In 1994, the WMC Limited Board made loans to certain full time employees of WMC Limited Group companies to enable them to exercise their rights to subscribe for WMC Limited shares pursuant to a renounceable rights issue conducted by WMC Limited. WMC Limited shares were allotted to those employees (and all other participants in the rights issue) at an issue price of A$5.80, with the issue price for those employees funded by way of a limited-recourse, interest-free loan from WMC Limited to the participating employee.
The loan from WMC Limited was repayable out of dividends paid on WMC Limited shares and the sale of any renounceable rights and bonus shares which accrued in respect of the WMC Limited shares issued under the rights issue while the loan remained outstanding. The loan was also able to be repaid voluntarily by the employee.
As at May 31, 2002, there were:
| | • | | 38,100 WMC Limited shares issued under the WMC ESPP; and |
| | • | | 1,628 WMC Limited shares issued under the 1994 rights issue. |
In the context of the demerger, the WMC Limited Board decided that the most equitable and appropriate manner of dealing with these loans was to forgive the outstanding balance of each employee’s loan. Accordingly, the outstanding balance of each participant’s loan was forgiven on May 31, 2002 (in the amount of A$46,832 in respect of WMC Limited shares issued under the WMC ESPP, and A$7,198 in respect of WMC Limited shares issued under the 1994 rights issue).
The Option Scheme and Stock Appreciation Plan Proposal
The Option Scheme
As part of the demerger, WMC Limited proposed to its optionholders and shareholders an Option Scheme to deal with the WMC Limited options. In essence, the Option Scheme was designed to have the effect that the economic entitlements of WMC Limited optionholders prior to the demerger would be, to the extent possible, preserved after the demerger was implemented.
Following the approval of the Option Scheme, the following occurred:
| | • | | WMC Limited optionholders continued to hold their WMC Limited options, each of which became an ‘Alumina option’ entitling the holder to subscribe for one Alumina share. |
-105-
| | DIRECTORS, SENIOR MANAGEMENT AND EMPLOYEES |
| | • | | The exercise price and other terms of the Alumina options were amended. |
| | • | | WMC Limited optionholders were granted one WMC Resources option for each WMC Limited option they held prior to the demerger, each WMC Resources option entitling them to subscribe for one WMC Resources share. |
| | • | | The aggregate exercise prices of the Alumina option and the WMC Resources option equaled to the exercise price of the WMC Limited option prior to the demerger. |
| | • | | The Alumina option and the WMC Resources option each have the same lapse date as the WMC Limited option would have had if the demerger had not proceeded – being the earlier of five years after the option was issued (as a WMC Limited option) and 30 days (or two years, as applicable) after the WMC Limited optionholder ceases to be employed by the WMC Limited Group, the WMC Resources Group or the Alumina Group. |
So that WMC Limited options became ‘Alumina options’ with the correct exercise price and period, the Option Scheme made various amendments to the terms and conditions of the WMC Limited Option Plans to modify the exercise price of the Alumina options and to prevent them from lapsing early.
Under the Option Scheme, WMC Resources granted each WMC Limited optionholder one WMC Resources option for each WMC Limited option they held at the Option Scheme Record Date. Each WMC Resources option entitles the holder to subscribe for one WMC Resources Share. To the extent practicable, the terms and conditions attaching to the WMC Resources options mirror the terms and conditions of the WMC Limited Option Plans, but incorporate such amendments as were necessary to reflect the varying exercise periods and exercise prices of the WMC Resources options.
The exercise price of a WMC Resources option was determined by reference to the pre-demerger exercise price of the WMC Limited option (which became an Alumina option) in respect of which the WMC Resources option was granted and the VWAP of WMC Resources shares and Alumina Limited shares sold on the ASX over the first five days of trading on the ASX commencing on the Listing Date, in accordance with the following formula:
WMC
Resources
option exercise
price | | = | | Pre-demerger WMC Limited option exercise price | | x | | Alumina VWAP
|
| | | | | (Alumina VWAP + WMC Resources VWAP) |
The period during which a WMC Resources option can be exercised is the same as the remaining exercise period of the WMC Limited option (now an Alumina option) in respect of which the WMC Resources option was granted.
The Stock Appreciation Plan Proposal
Following the approval of the Option Scheme, the Stock Appreciation Plan (SAP) proposal was implemented by WMC Limited and WMC Resources. The proposal was designed to have the effect that the economic entitlements of holders of WMC Limited SAP Rights prior to the demerger were, to the extent possible, preserved after the demerger was implemented. It was also designed to treat WMC Limited SAP Right holders in an equivalent manner to WMC Limited optionholders.
The adoption of the SAP Right proposal had the following effects on WMC Limited SAP Right holders:
| | • | | WMC Limited SAP Right holders continue to hold their WMC Limited SAP Rights. |
-106-
| | DIRECTORS, SENIOR MANAGEMENT AND EMPLOYEES |
| | • | | Each WMC Limited SAP Right became an ‘Alumina Limited SAP Right’, the value of which will be based on the market price of Alumina Limited shares at the time of redemption. |
| | • | | The allotment price and other terms of the Alumina Limited SAP Right were amended. |
| | • | | WMC Limited SAP Right holders were granted one WMC Resources SAP Right for each WMC Limited SAP Right they held prior to the demerger. |
| | • | | The aggregate allotment prices of the Alumina Limited SAP Right and the WMC Resources SAP Right equaled the allotment price of the WMC Limited SAP Right prior to the demerger. |
| | • | | The Alumina Limited SAP Right and the WMC Resources SAP Right will lapse at the same time as the WMC Limited SAP Right would have lapsed if the demerger had not proceeded – being the earlier of five years after that WMC Limited SAP Right was issued and 30 days (or two years, as applicable) after the WMC Limited SAP Right holder ceases to be employed by the WMC Limited Group, the WMC Resources Group or the Alumina Group. |
In order to ensure that WMC Limited SAP Rights became ‘Alumina Limited SAP Rights’ with the correct allotment price and redemption period, various amendments were made to the terms and conditions of the WMC Limited Stock Appreciation Plans.
Pursuant to the SAP Right proposal, WMC Resources granted each holder of WMC Limited SAP Rights one WMC Resources SAP Right for each WMC Limited SAP Right they held at the Option Scheme Record Date.
Each WMC Resources SAP Right will entitle the holder on redemption to receive a cash payment equal to the difference between the allotment price of the WMC Resources SAP Right and the closing price of WMC Resources shares on the trading day immediately prior to the date of redemption.
To the extent practicable, the terms and conditions attaching to the WMC Resources SAPs will mirror the terms and conditions of the WMC Stock Appreciation Plans, but will incorporate such amendments as are necessary to reflect the varying redemption periods and allotment prices of the WMC Resources SAPs.
The two primary variants in the terms of the WMC Resources SAPs will be their allotment price and the period during which the WMC Resources SAPs may be redeemed. The allotment price of a WMC Resources SAP will be determined by reference to the pre-Demerger allotment price of the WMC SAP (which becomes an Alumina Limited SAP) in respect of which the WMC Resources SAP was granted and the VWAP of WMC Resources shares and Alumina Limited shares sold on the ASX over the first five days of trading on the ASX commencing on the Listing Date, in accordance with the following formula:
WMC Resources
SAP Right
allotment price | | = | | WMC Limited SAP Right Pre-
demerger allotment price | | x | | WMC Resources VWAP
|
| | | | | (Alumina Limited VWAP + WMC Resources VWAP) |
The period during which a WMC Resources SAP Right will be able to be redeemed will be the same as the remaining redemption period of the WMC Limited SAP Right (which becomes an Alumina Limited SAP Right) in respect of which the WMC Resources SAP Right is granted.
-107-
| | DIRECTORS, SENIOR MANAGEMENT AND EMPLOYEES |
WMC Resources Employee Share Scheme
WMC Resources Employee Share Scheme
WMC Resources intends to establish the WMC Resources Employee Share Scheme (WMC Resources ESS). The WMC Resources ESS will provide a framework for the offer by the WMC Resources Board of WMC Resources shares, or rights to or in respect of WMC Resources shares (such as options), to employees of the WMC Resources Group from time to time. WMC Resources expects to operate the WMC Resources ESS in substantially the same manner as the WMC ESS historically operated by WMC Limited, as described below.
WMC Resources expects to offer:
| | • | | to certain employees in Australia – WMC Resources Options, the terms and conditions of which will be promulgated by the WMC Resources Board at the time of the relevant offers (WMC Resources Option Plans); and |
| | • | | to certain employees outside Australia – WMC Resources SAPs, the terms and conditions of which will be promulgated by the WMC Resources Board at the time of the relevant offers (WMC Resources Stock Appreciation Plans). |
The WMC Resources Option Plans and WMC Resources Stock Appreciation Plans (the WMC Resources Plans) will be designed to align the interests of employees of the WMC Resources Group with the shareholders of WMC Resources and are regarded as an integral component of WMC Resources’ employee benefit and motivation strategies.
The total number of WMC Resources shares, together with the total number of unexercised options over WMC Resources shares, which may be issued pursuant to all WMC Resources Plans will not exceed 5% of the total number of WMC Resources shares on issue from time to time.
Subject to the Listing Rules of the ASX, the directors of WMC Resources will by resolution be able to revoke, add to, or vary all or any of the provisions of the WMC Resources Plans, or all or any of the rights or obligations of the participants or any of them, provided that the interests of the participants are not, in the opinion of the directors of WMC Resources, materially prejudiced.
WMC Resources Option Plans
On August 13, 2002, WMC announced its decision to suspend future option allotments to its senior management under the WMC ESS. This suspension has continued since the demerger.
WMC Resources will review this decision when a more universally agreed methodology for valuation expensing and taxation issues is resolved. A share purchase plan for senior staff is expected to replace option allotments in the future for this group. The proposed share purchase plan is described in more detail in “WMC Resources Senior Staff Share Purchase Plan” below.
It is proposed that WMC Resources will operate WMC Resources Option Plans for employees other than its senior management. The first allotment of WMC Resources Options will be made in a manner consistent with the past WMC Limited Option allotments. The WMC Resources Option Plans will operate on substantially the same terms as the WMC Limited Option Plans (subject to any changes to applicable regulatory requirements), namely:
| | • | | Eligible employees will be invited to apply for the grant by WMC Resources of WMC Resources Options, to be granted at an issue price of A$0.01 per WMC Resources Option. |
-108-
| | DIRECTORS, SENIOR MANAGEMENT AND EMPLOYEES |
| | • | | Each WMC Resources Option will give the holder the right to subscribe for one WMC Resources Share (subject to adjustment in accordance with the terms of the applicable WMC Resources Option Plan to reflect new issues by WMC Resources and capital reconstructions). |
| | • | | Subject to certain exceptions, the WMC Resources Options will not be able to be exercised until after a period of 12 months from the date of allotment and will lapse the fifth anniversary of the date of allotment. |
| | • | | Upon exercise of a WMC Resources Option, the holder will be obliged to pay the relevant exercise price, which will be determined by reference to the weighted average sale price of WMC Resources shares on the ASX on the trading day that the invitation to apply for the WMC Resources Options is made to employees. |
WMC Resources Stock Appreciation Plan
WMC Resources will operate its Stock Appreciation Plans on substantially the same terms as the WMC Limited Stock Appreciation Plans (subject to any changes to applicable regulatory requirements), namely:
| | • | | Eligible employees will be invited to apply for the grant by WMC Resources of WMC Resources SAPs. |
| | • | | The employees will not be required to pay any amount for the grant of the WMC Resources SAPs, but each WMC Resources SAP will have a notional allotment exercise price, equal to the weighted average sale price of WMC Resources shares on the ASX on the trading day that the invitation to apply for the WMC Resources SAPs is made to the employee. |
| | • | | Subject to certain exceptions, the WMC Resources SAPs will not be able to be redeemed until after a period of 12 months from the date of allotment and will lapse on the fifth anniversary of the date of allotment. |
| | • | | Upon redemption of a WMC Resources SAP before its expiry by the holder, the holder will be entitled to a payment equal to the difference between the closing price of WMC Resources shares on the ASX on the trading day immediately before redemption, and the notional allotment price (assuming the former amount is higher). |
The first allotment of WMC Resources SAPs will be made in a manner consistent with the past WMC Limited SAP allotments.
WMC Resources Senior Staff Share Purchase Plan
Consistent with WMC Limited’s announcement on August 13, 2002 to suspend future option allotments to its senior management under the WMC ESS, WMC Resources intends to implement a share purchase plan for senior staff, which will replace option allotments in the future for this group.
The share purchase plan will provide a level of reward for senior staff based on WMC Resources’ performance against a peer index of resources companies (anticipated to be sixteen). Actual rewards will vary in accordance with the performance of the individual executive and the performance of WMC Resources on a total shareholder return basis against the index.
All rewards for senior staff through this scheme will be provided to participants in the form of WMC Resources shares which will be purchased on-market on behalf of the participants (at no cost to the participants). Participants will not be able to dispose of the WMC Resources shares acquired under the plan unless both prior to and after such a disposal, the participant holds WMC Resources shares whose value reflects a multiple of their salary. For the Chief Executive Officer the multiple will be 1.5 times salary, for Executive General Managers the multiple will be 1 times salary and for General
-109-
| | DIRECTORS, SENIOR MANAGEMENT AND EMPLOYEES |
Managers the multiple will be 0.5 times salary. WMC Resource shares may only be disposed of once this multiple has been exceeded and only to the extent that the minimum multiple is maintained at all times (subject to certain other disposal restrictions).
Under the plan, the full value of any reward gained by senior management will be expensed and the value to the executive disclosed in accordance with WMC Resources’ reporting obligations and practice on remuneration of executive staff.
WMC Resources expects to make the first offers under this plan as soon as practicable. Subject to individual and company performance, the level of reward for General Managers and Executive General Managers will be 0 to 70% of salary, and 0 to 100% of salary for the Chief Executive Officer.
-110-
| | MAJOR SHAREHOLDERS AND RELATED PARTY TRANSACTIONS |
ITEM 7. MAJOR SHAREHOLDERS AND RELATED PARTY TRANSACTIONS
A. Major Shareholders
The issued capital of WMC Resources is currently constituted by one class of registrable voting securities being ordinary shares.
As at June 30, 2002, WMC Limited had on issue 1,112,419,643 fully paid ordinary shares, and 24,195,573 options over its ordinary shares. The Share Options were issued pursuant to the WMC Employee Share Scheme and carry no voting rights.
The following table sets forth, as at June 30, 2002, information in respect of:
| | (i) | | any person who is known to WMC Limited to be the registered owner of more than 5% of any class of WMC Limited’s voting securities; and |
| | (ii) | | the total amount of any class of its voting securities owned by the Directors and Executive General Managers of WMC Limited as a group. |
The table is presented for indicative purposes because WMC Resources had the same shareholders immediately upon effectiveness of the demerger, holding the same number of ordinary shares or ADSs, as the case may be, as WMC Limited had immediately prior to the effectiveness of the demerger.
Title of class
| | Identity of person or group
| | Amount owned
| | % of class
|
|
| Fully paid ordinary shares in WMC Limited | | J P Morgan Nominees Australia Ltd | | 219,532,851 | | 19.73 |
|
| | | National Nominees Ltd | | 192,610,470 | | 17.31 |
|
| | | Westpac Custodian Nominees Ltd | | 117,394,005 | | 10.55 |
| | | | |
| |
|
|
Fully paid ordinary shares(1) | | Directors and Executive General Managers of WMC Limited as a group | | 696,029 | | 0.06 |
| | | | |
| |
|
(1) | | Includes WMC Limited’s ADSs. |
-111-
| | MAJOR SHAREHOLDERS AND RELATED PARTY TRANSACTIONS |
The nominee companies listed in the previous table hold these fully paid ordinary shares on behalf of numerous beneficial owners. The only beneficial owners known to have owned more than 5% of the issued and outstanding fully-paid ordinary shares of WMC Limited over the past 3 years are the Capital Group International Inc. and Templeton Investment Management. Their history of significant changes over the three years to June 30, 2002 is outlined below:
Beneficial Owner
| | Date
| | Number of Shares
| | % Shareholding
|
Capital Group | | 09/13/2001 | | 114,731,532 | | 10.39% |
| | | 09/05/2001 | | 102,267,776 | | 9.31% |
| | | 08/31/2001 | | 99,490,853 | | 9.06% |
| | | 04/12/2001 | | 91,144,990 | | 8.29% |
| | | 02/09/2001 | | 61,096,440 | | 5.60% |
| | | 02/05/2001 | | 79,572,042 | | 7.24% |
| | | 11/21/2000 | | 68,037,630 | | 6.19% |
| | | 10/31/2000 | | 57,433,313 | | 5.18% |
| | | 02/10/2000 | | 17,392,660 | | 1.50% |
| | | 10/20/1999 | | 64,954,075 | | 5.67% |
| | | 09/28/1999 | | 77,007,395 | | 6.72% |
| | | 09/09/1999 | | 88,734,202 | | 7.74% |
| | | 08/26/1999 | | 100,812,121 | | 8.82% |
| | | 06/30/1999 | | 111,149,791 | | 9.84% |
| | | | | | | |
Templeton Investment | | 04/29/1999 | | Ceased to be a substantial shareholder |
| | | 02/09/1999 | | 68,935,280 | | 6.02% |
All fully paid shareholders have the same voting rights.
There are no arrangements, known to WMC Resources, the operation of which may at a subsequent date result in a change in control of WMC Resources.
As at October 31, 2002, 438,361 fully paid ordinary shares in WMC Limited were registered in the name of 308 residents of the United States and represented approximately 0.039% of the total number of WMC Limited fully paid ordinary shares issued and outstanding. As at October 31, 2002, 1,641,754 WMC Limited ADSs were outstanding (representing 6,567,016 WMC Limited fully paid ordinary shares) and were registered in the name of 399 residents of the United States and represented approximately 0.59% of the total number of fully paid ordinary shares in WMC Limited issued and outstanding. The number of WMC Resources ADSs issued and outstanding immediately upon effectiveness of the demerger is the same number, and are held by the same holders, as the ADSs of WMC Limited immediately prior to the effectiveness of the demerger.
-112-
| | MAJOR SHAREHOLDERS AND RELATED PARTY TRANSACTIONS |
| |
|
B. Related Party Transactions
Loans to directors
On January 1, 1999, directors of controlled entities of WMC Resources had outstanding secured loan balances of A$10,000 under the Employee Share Purchase Plan and the Senior Staff Share Issue. During the 1999 fiscal year, there were no additional loans made to directors and an amount of A$3,300 was repaid, resulting in a final outstanding balance of A$6,700.
During the 2000 fiscal year, there were no additional loans made to directors and an amount of A$800 was repaid, resulting in a final outstanding balance of A$5,900.
During the 2001 fiscal year, there were no additional loans made to directors and an amount of A$1,000 was repaid, resulting in a final outstanding balance of A$4,900.
During the six month period ended June 30, 2002, a loan of A$93,050 was advanced to Jens Balkau, a director of a controlled entity, an amount of A$325 was repaid and an amount of A$951 owed by a director who resigned and thus ceased to be a related party, resulting in a final outstanding balance of A$96,674.
All of the loans to directors referred to above were made in connection with the Employee Share Purchase Plan and the Senior Staff Share Issue to enable them to acquire shares of WMC Limited. The outstanding share plan loans are secured by shares allocated by WMC Limited under the 1987 and 1988 allotment of the Employee Share Purchase Plan. The loans are interest free with repayments due in December 2002 and November 2003.
Shareholding transactions of directors
Where a director of WMC Limited was a shareholder in WMC Limited, their transactions include:
| | • | | the purchase and/or sale of shares; and/or |
| | • | | the receipt of dividends. |
All these transactions were conducted on a normal commercial basis, on conditions no more favorable than those available to other shareholders.
-113-
| | MAJOR SHAREHOLDERS AND RELATED PARTY TRANSACTIONS |
| |
|
Some directors of WMC Limited, who were also employees of the WMC Limited Group, were eligible to participate in the WMC Employee Share Scheme, and were issued with options, priced at market value. These transactions were conducted on a commercial basis on conditions no more beneficial than those available to other eligible employees.
| | | Six months ended June 30, 2002
| | 2001
| | 2000
| | 1999
|
| | | Number of shares |
|
| The aggregate number of shares acquired by directors of the parent entity or their director related entities through purchase was: | | 336,000 | | 10,000 | | 130,000 | | 49,932 |
|
| The aggregate number of options acquired by directors of the parent entity or their director related entities through participation in the WMC Employee Share Scheme was: | | 0 | | 0 | | 320,000 | | 400,000 |
|
| The aggregate number of shares disposed of by directors of the parent entity or their director related entities was: | | | | | | | | |
|
| - fully paid shares | | 0 | | 11,000 | | 0 | | 22,724 |
| - partly paid shares | | 331,000 | | 0 | | 100,000 | | 90,000 |
| - options (lapsed) | | 0 | | 0 | | 300,000 | | 0 |
| - options (shares exercised and sold) | | 0 | | 300,000 | | 0 | | 0 |
|
| Details of shares and share options held by directors of the parent entity or their director related entities at period end are as follows: | | | | | | | | |
| - WMC Limited, full paid shares | | 658,440 | | 434,459 | | 435,459 | | 466,953 |
| - WMC Limited, ordinary shares partly paid to five cents | | 0 | | 331,000 | | 331,000 | | 431,000 |
| - WMC Limited, options for ordinary shares | | 1,470,000 | | 1,470,000 | | 1,770,000 | | 1,750,000 |
| - Central Norseman Gold Corporation Limited, fully paid shares | | N/A | | 2,000 | | 2,000 | | 12,000 |
All other transactions relating to shares and options of WMC Limited, including the payment and receipt of dividends, were on the same basis as similar transactions with other shareholders.
Other transactions of directors and director related entities
A number of directors of WMC Limited are also directors of other public companies which may have transactions with the WMC Group. The relevant directors do not believe that they have the capacity to control or significantly influence the financial or operating policies of either of those companies or the WMC Group in their dealings with one another. Those companies are therefore not considered to be director related entities.
During the six month period ended June 30, 2002, Hugh M. Morgan received a payment of US$504,787 from a related party, Alcoa Inc. relating to his participation in the Alcoa Inc. Directors’ Deferred Fee Plan. The benefit became payable following his retirement as a director of that entity.
-114-
| | MAJOR SHAREHOLDERS AND RELATED PARTY TRANSACTIONS |
| |
|
Legal/Financial service fees
A number of directors of WMC Limited controlled entities are associated with legal and financial service firms which have provided services to WMC Limited group companies during the financial year, on an arm’s length basis. The total of those services amounts to A$418,813 for the six months ended June 30, 2002. For the three years ended December 31, 2001, 2000 and 1999, the amounts were: A$916,259, A$684,733, A$595,028, respectively. The legal and financial services firms referred to above which provided services to WMC Resources in the fiscal year ended December 31, 2001 were: Sycip Salazar Hernandez & Gatmaitan, Sampson & West, Trident Trust Company, Welborn Sullivan Meck & Tooley P.C., Cox Padmore Skoloik & Shakarchy, Westminer Insurance / Sedgwick Management Services, Stikeman Elliott (Toronto), Larrain Y Associates, Citco, Joseilito Bacani and Brian Weihs.
Other transactions
Hughmore Securities Pty Ltd, an entity associated with Hugh M Morgan purchased fertilizer totaling A$7,760 for the six month period ended June 30, 2002. For the three years ended December 31, 2001, 2000 and 1999, the amounts were: A$14,325, A$16,898, A$17,631, respectively. All purchases were made on an arm’s length basis from a WMC Limited controlled entity.
In 1999, a family member of Terry S. Potts, a director of a WMC Limited controlled entity was sub-contracted to provide human resource services totaling A$11,774 to a WMC Limited controlled entity on an arm’s length basis.
C. Interests of Experts and Counsel
Not applicable.
-115-
ITEM 8. FINANCIAL INFORMATION
A. Financial Statements
WMC Resources’ combined financial statements are included as Item 18.
Legal Proceedings
At the date of this registration statement, WMC Resources is a party to no pending legal proceedings nor is it aware of any reasonably likely to be commenced against it, other than:
| | • | | those mentioned below; or |
| | • | | ordinary routine litigation or other legal proceedings incidental to the business, particularly arising out of contract mining and construction activities to which WMC Resources or any of its subsidiaries is a party or of which any of their property is subject. |
Native Title in Australia
“Native title” describes the rights and interests of Aboriginal and Torres Strait Islander people in land and waters according to their traditional laws and customs as recognized by the common law of Australia.
Native title law has evolved through judicial decisions and the enactment of legislation. The first significant High Court decision on the subject of native title was Mabo v Queensland (No 2) (1992) 175 CLR 1 (“the Mabo decision”) in 1992, in which the Court recognized the concept of native title and said that Aboriginal and Torres Strait Islander people who have maintained their connection with their land according to their laws and customs may hold native title. Proving connection usually involves showing that traditional laws and customs have been passed down through generations of Aboriginal or Torres Strait Islander people to the present day. The native title of a particular group will depend on the traditional laws and customs of those people. Recent decisions have indicated that native title may change over time.
The Mabo decision also recognized that native title could be extinguished prior to the enactment of the Racial Discrimination Act 1975 (October 31, 1975) by government legislation or inconsistent executive action. In response to the Mabo decision, the Commonwealth Government enacted the Native Title Act, 1993 (“NTA”) which validated acts done and granted by it prior to January 1, 1994 (“past acts”) and allowed the States and Territories to enact their own validation legislation. Subsequent amendments also validated grants (“intermediate period acts”) made by the Commonwealth (and allowed the States and Territories to enact similar legislation) relating to certain freehold grants up to December 23, 1996. The NTA also created the National Native Title Tribunal, responsible for mediation of native title claims and the administration the various procedures under the NTA governing native title claims. Finally, the NTA specifies the conditions to be satisfied and the procedures to be followed in order for acts done after January 1, 1994 (“future acts”) to be valid with respect to native title.
WMC Resources’ land tenure that is a past act or qualifying intermediate period act has been validated with respect to native title. The current operations of the Olympic Dam operations are on freehold title which the High Court held in Fejo v Northern Territory (1998) 195 CLR 96 (‘Fejo’) permanently extinguishes native title, although expansions of this operation may attract the future act requirements of the NTA if it extends to areas outside the freehold tenure.
Native title may exist in areas where it has not been extinguished (removed). Although a determination of native title does not invalidate anyone else’s rights, the High Court decision in the Wik Peoples v Queensland (1996) 187 CLR 1 (‘Wik’) case, made it clear that native title may co-exist with other forms of tenure where that tenure is not exclusive, provided the native title rights are not incompatible with the exercise of the other rights. WMC Resources holds two nickel exploration licences in Western Australia that may not be valid and it is possible that a claim for certain native title rights might be recognized on these grant. WMC Resources does not believe that if native title rights were determined to be held
-116-
over land the subject of this licence they would materially affect WMC Resources’ interests or its existing nickel operations. Where native title rights are inconsistent with the terms of a pastoral lease the native title rights must yield to rights of the pastoral lessee. The Wik decision also provided some clarity about the impact of native title on Queensland pastoral leases which are relevant to the WMC Resources Queensland Fertilizer Operations. While the current leases on which the Queensland Fertilizer Operations Operations are conducted are secure, any future expansions onto adjacent non-freehold may attract the future act processes of the NTA.
In August 2002, the High Court handed down its decision in State of Western Australia v Ward. It held, among other things, that there could be partial extinguishment of native title rights and that WA mining and petroleum legislation extinguishes all native title rights that may have existed over minerals and petroleum. The High Court also held that a mining lease under the relevant Western Australian legislation extinguished any native title right to control access to land, or to be asked permission to use, or have access to, land but does not necessarily extinguish all native title rights. Particularly it does not extinguish those native title rights that are consistent with the rights granted to a pastoral or mining leaseholder. This decision, which provides some clarity about the impact of native title on pastoral leases and mining leases in Western Australia and the Northern Territory, is significant to WMC Resources because its nickel operations are in Western Australia. However the decision also leaves many issues to be decided on a case by case basis. As a result, it is difficult at this stage for WMC Resources to make any assessment of the impact of the Ward decision either specifically on its nickel operations or more generally on the current claimant applications for native title over WMC Resources’ operations (referred to below) throughout Australia.
There are current claimant applications for native title determination in the Federal Court over areas that include the majority of WMC Resources’ operations. The majority of WMC Resources’ operations fall within one or more of these applications. These operations include the Olympic Dam copper/uranium businesses in South Australia, the Phosphate Hill fertilizer operation in Queensland and the Western Australian nickel operations.
The High Court decisions and the NTA described above may have provided some conceptual guidance on the issue of native title and WMC Resources believes that under these decisions and legislation its economic interests in existing mining leases and tenements will generally be upheld if challenged. However, WMC Resources’ existing assets and operations would be affected by a native title claim that is ultimately determined in a manner that is contrary to WMC Resources’ interests.
Other Financial Information
Export Sales
A significant proportion of WMC Resources sales are to markets outside of Australia as shown in the revenue analysis below:
Australia – 28%
Europe – 31%
Japan – 9%
North America – 9%
Taiwan – 4%
Other – 19%.
Dividends
WMC Resources’ payment of dividends or implementation of other capital management initiatives will be determined by the WMC Resources Board after taking into consideration a number of factors, including WMC Resources’ financial results, ongoing capital expenditure requirements, future cash requirements, general business conditions, taxation considerations (including the level of franking credits available), and any contractual, legal or regulatory restrictions on the
-117-
ability to pay dividends, and any other factors the WMC Resources Board may consider relevant. Dividends of WMC Resources, if any, will be paid in Australian dollars.
There will be no dividend paid by WMC Resources in respect of the year ending 31 December 2002. For the year ending 31 December 2003, the WMC Resources Board expects that, if a dividend distribution is to be made by WMC Resources, it will be modest. Dividend distributions by WMC Resources for 2003 and beyond will be determined by the WMC Resources Board after taking into account various factors, including those outlined above.
WMC Resources will not be in a position to pay franked dividends (which are dividends effectively paid out of profits which have borne Australian corporate tax) until its eligible carried–forward tax losses are utilized and WMC Resources pays Australian tax on its profits. The Australian Federal Government’s proposed tax consolidation regime, amongst other things, is expected to affect the rate at which WMC Resources’ carried-forward tax losses may be utilized, as described below. Under the consolidation regime, WMC Resources may elect to consolidate its corporate group at any date following the demerger. WMC Resources expects that all of WMC Resources’ wholly owned subsidiaries will elect to form a consolidated group with effect from January 1, 2004 resulting in WMC Resources and its wholly owned subsidiaries being treated as one single income tax entity from that date.
WMC Resources expects that, during the period following the demerger and up to the consolidation of the WMC Resources Group, WMC Resources will not pay Australian income tax and, therefore, will not have sufficient franking credits available to pay fully franked dividends to its shareholders.
The proposed consolidation rules are likely to reduce the rate at which carried forward tax losses incurred prior to the date of consolidation may be utilized after consolidation. Despite this, the profits of the WMC Resources Group earned after consolidating the group may remain sheltered to some extent by the utilization of tax losses from pre-consolidation years when combined with any current year tax incurred by the WMC Resources Group.
The extent to which the WMC Resources Group’s profits will be sheltered by tax losses and, therefore, the extent to which WMC Resources will be able to pay franked dividends, will ultimately depend on the profitability of the WMC Resources Group. Based on the historical results of WMC Resources, it is currently believed that WMC Resources may not pay income tax in the short term. Accordingly, it is anticipated that over this period WMC Resources may not have sufficient franking credits available to pay fully franked dividends to its shareholders.
-118-
Financing and Corporate Items
Net financing and corporate expenses for the six months ended June 30, 2002 totalled A$31.4 million compared to A$230.8 million for the year ended December 31, 2001. The principal components were:
| | | Six Months Ended June 30, 2002
| | | Year Ended December 31, 2001
| | | Year Ended December 31, 2000
| | | Year Ended December 31, 1999
| |
| | | A$ million | | | A$ million | | | A$ million | | | A$ million | |
| Loss/(Gain) on revaluation of foreign currency assets & liabilities | | 10.6 | | | 20.7 | | | (2.5 | ) | | 2.9 | |
| Interest (received) / (receivable) | | (95.0 | ) | | (154.3 | ) | | (152.3 | ) | | (84.8 | ) |
| Interest paid / payable | | 78.7 | | | 295.2 | | | 300.4 | | | 163.4 | |
| Corporate expenditure | | 37.1 | | | 69.2 | | | 43.4 | | | 32.7 | |
Net interest credited to profit was A$16.3 million for the six months ended June 30, 2002 compared to a charge of A$140.9 million for the year ended December 31, 2001, reflecting the decrease in borrowings, and the recognition of the gain on the close out of interest rate swaps. Corporate expenditure included A$11.5 million of redundancy costs associated with the restructuring of the WMC Resources Group service functions in the year ended December 31, 2001.
B. Significant Changes
The following are the significant changes that have occurred since the date of the unaudited Interim Combined Financial Statements.
The Long Victor mine in Kambalda was sold in September 2002 and accordingly this transaction will be brought to account in the second half of 2002.
-119-
ITEM 9. THE OFFER AND LISTING
A. Offer and Listing Details
No established market exists for WMC Resources’ shares prior to the demerger. WMC Resources cannot guarantee that a trading market will develop in Australia or elsewhere for WMC Resources’ shares, nor give any assurance that the price of WMC Resources’ shares will follow any past trading patterns of WMC Limited shares. Many things that WMC Resources can neither predict nor control could affect the market price of its shares, including the following:
| | • | | any of the risk factors referred to elsewhere in this registration statement; |
| | • | | operating revenues, net income or dividends declared or paid by WMC Resources that fall short of securities analysts’ and investors’ expectations; and |
| | • | | changes in securities analysts’ and investors’ estimates of our financial performance, the financial performance of WMC Resources’ competitors or the financial performance of any of the industries, generally, in which WMC Resources competes. |
WMC Resources had never publicly issued its shares before the implementation of the demerger, so there is no historical price range for its shares. See the cautionary statements under “Forward-Looking Statements” and under “Risk Factors” above.
Application has been made to list ADSs, each representing four WMC Resources ordinary shares, on the NYSE following the demerger and the effectiveness of this registration statement. On October 31, 2002, 1,641,754 ADSs representing 6,567,016 WMC Limited shares were outstanding and were held by 399 registered holders. Also, on October 31, 2002, there were 308 shareholders with declared addresses in the United States holding 438,361 WMC Limited shares. In addition, there are a number of United States shareholders who hold beneficial ownership through nominee companies located outside the United States. The number of WMC Resources ADSs issued and outstanding immediately upon effectiveness of the demerger is the same number, and are held by the same holders, as the ADSs of WMC Limited immediately prior to the effectiveness of the demerger.
The WMC Resources share price performance is dependent on a number of complex and interrelated factors, any of which could have a material adverse effect on WMC Resources’ results of operations. Key risks that may affect the WMC Resources share price include:
| | • | | fluctuations in world prices for the minerals and metals WMC Resources produces and sell; |
| | • | | increased competition, including competitors with greater financial resources and lower cost producers; |
| | • | | movements in exchange rates; |
| | • | | variations in interest rates; |
| | • | | unforeseen or significant expenditure required to allow WMC Resources to be in compliance with environmental and other laws; |
| | • | | increased requirements for capital expenditure; |
| | • | | actions by government authorities; and |
| | • | | other factors referred to under Item 3D “Risk Factors”. |
-120-
Resale restrictions
Australia
The WMC Resources shares received in respect of WMC Limited shares under the demerger are freely transferable in Australia, subject only to compliance with WMC Resources’ constitution and to standard restrictions applicable in Australia.
New Zealand
The WMC Resources shares received in respect of WMC Limited shares under the demerger are freely transferable in New Zealand, subject only to compliance with WMC Resources’ constitution and to standard restrictions applicable in New Zealand.
United States
The WMC Resources shares received in respect of WMC Limited shares under the demerger are freely transferable in the United States under U.S. federal securities law, except for WMC Resources shares held by persons who were affiliates of either WMC Resources or WMC Limited prior to the demerger or who are affiliates of WMC Resources subsequent to the demerger.
As defined in Rule 144 under the Securities Act of 1933, an “affiliate” of an issuer is a person that directly, or indirectly through one or more intermediaries, controls, or is controlled by, or is under common control with, such issuer.
Persons who may be deemed to be affiliates of WMC Resources or WMC Limited include individuals or entities (if any) directly or indirectly controlling or controlled by WMC Resources or WMC Limited or any individuals or entities under direct or indirect common control with WMC Resources or WMC Limited, and may include certain officers and directors of WMC Resources or WMC Limited as well as principal shareholders of WMC Resources or WMC Limited.
Persons who were not affiliates of WMC Limited or WMC Resources before the demerger, and who were not affiliates of WMC Resources after the demerger may freely transfer any WMC Resources shares received pursuant to the demerger, subject only to compliance with WMC Resources’ constitution and to standard restrictions applicable in the United States.
Persons who were affiliates of WMC Limited or WMC Resources before the transaction, but were not affiliates of WMC Resources after the demerger may transfer any WMC Resources shares received pursuant to the plan of arrangement in the following manner:
| | • | | At any time more than 90 days following the effective date of this registration statement, so long as WMC Resources has filed all reports required to be filed by it by Section 12 of the Securities Exchange Act (the “Exchange Act”) of 1934 and Section 15(d) of the Securities Act of 1933 (the “Securities Act”); and |
| | • | | The amount of the shares to be transferred, together with all other shares by that person within the preceding three months, shall not exceed the greater of 1% of WMC Resources’ shares, or the average weekly trading volume of WMC Resources’ shares calculated according to Rule 144 (e)(1) under the Securities Act; and |
| | • | | The shares are sold either in “brokers’ transactions” as defined in Section 4(4) of the Securities Act and as modified by Rule 144(g) under the Securities Act or in transactions directly with a “market maker”, as defined in Section 3(a)(38) of the Exchange Act; |
-121-
| | • | | At any time after the person has held the shares for at least one year, so long as WMC Resources has filed all reports required to be filed by it by Section 12 of the Exchange Act and Section 15(d) of the Securities Act during the 12 months preceding the sale; or |
| | • | | Any time more than two years following the date on which the shares were received. |
although, in computing the holding period of any WMC Resources shares received, for purposes of Rule 145(d)(2) or (d)(3), WMC Resources believes that persons may not “tack” the holding period of the WMC Limited shares.
Persons who were affiliates of WMC Limited or WMC Resources before the transaction and were affiliates of WMC Resources after the demerger may resell any WMC Resources shares received pursuant to the arrangement:
| | • | | At any time more than 90 days following the effective date of this registration statement, so long as WMC Resources has filed all reports required to be filed by it by Section 12 of the Exchange Act and Section 15(d) of the Securities Act, and: |
| | • | | The amount of the shares to be transferred, together with all other shares by that person within the preceding three months, shall not exceed the greater of 1% of WMC Resources’ shares, or the average weekly trading volume of WMC Resources’ shares calculated according to Rule 144 (e)(1) under the Securities Act; and |
| | • | | The shares are sold either in “brokers’ transactions” as defined in Section 4(4) of the Securities Act and as modified by Rule 144(g) under the Securities Act or in transactions directly with a “market maker”, as defined in Section 3(a)(38) of the Exchange Act. |
B. Plan of Distribution
Not applicable.
C. Markets
WMC Resources has applied to the ASX for admission to the official list and for quotation of WMC Resources’ shares on the ASX, which WMC Resources expects to be its primary trading market. An application has also been made to the NYSE for listing and trading of its ADSs for which The Bank of New York will be the Depositary. However, none of the ASX or NYSE accepts any responsibility for any of the contents or statements in this registration statement. Each WMC Resources ADS will represent four WMC Resources ordinary shares.
D. Selling Shareholders
Not applicable.
E. Dilution
Not applicable.
F. Expenses of the Issue
Not applicable.
-122-
ITEM 10. ADDITIONAL INFORMATION
A. Share Capital
Not applicable
B. Constitution
WMC Resources’ corporate organization and conduct is governed by its constitution (the “Constitution”). Set forth below is a summary of the provisions of the principal terms of the Constitution.
Company Objects & Purposes
WMC Resources is taken to be registered as a public company limited by shares under the Corporations Act 2001 of the Commonwealth of Australia (the “Corporations Act”) and is registered with Australian Business Number 76 004 184 598.
The Constitution was adopted on October 17, 2002. The Constitution does not specify WMC Resources’ objects and purposes. Rather, under section 124 of the Corporations Act, WMC Resources has the legal capacity and powers of an individual person.
Directors’ Powers & Qualifications
| (a) | | No director is permitted to vote or be counted in the quorum as a director in respect of any contract or arrangement in which the director has a personal material interest. Subject to the Corporations Act, this prohibition can be relaxed or suspended by an ordinary resolution passed in general meeting (rule 85(b)). |
| (b) | | Directors remuneration is to be determined by them from time to time and in such proportions and manner as they determine, provided that the aggregate remuneration paid to directors in any year must not exceed the amount approved in general meeting (rule 82). |
| (c) | | In addition, every director is entitled to be paid all reasonable traveling, hotel and other expenses incurred in attending meetings of WMC Resources and if any director is called upon to perform extra services or provide special professional skill for any purpose of WMC Resources, the director may be paid traveling outlays and such additional sum by way of remuneration fixed by the directors (rule 83). |
| (d) | | Directors may, from time to time, at their discretion raise or borrow any sum or sums of money for the purposes of WMC Resources with or without security (rule 47). |
| (e) | | The Constitution does not contain any age limit requirement on the retirement of directors. The Corporations Act (section 201C) prescribes age limit requirements, which require directors to retire at the next Annual General Meeting after reaching the age of 72. |
| (f) | | A director does not need to own shares in WMC Resources as a qualification for office (rule 80). |
| (g) | | At each Annual General Meeting one third of the directors (or the nearest number to one third) retire from the office and are subject to re-election. For any event, a director, other than the managing director, shall retire from office at the conclusion of the third Annual General Meeting after the general meeting at which he or she was elected or re-elected. |
-123-
Rights & Restrictions Attaching to Each Class of Shares
| (a) | | WMC Resources has only one class of shares, the ordinary class. The rights attached to ordinary shares include the right to dividends in the event that the directors declare them. Directors may determine that a dividend is payable, fix the amount, the date at which the entitlement accrues, date for payment and the method of payment. |
| (b) | | Dividends, which have not been claimed for one year after having been declared, may be invested or otherwise made use of by the directors for the benefit of WMC Resources until claimed or disposed of according to law (rule 125). |
| (c) | | The voting right attached to ordinary shares is the right to vote in person, by representative, attorney or proxy in general meeting. |
| (d) | | On a show of hands each shareholder (regardless of the number of shares held) has one vote. On a poll each shareholder may exercise one vote for each fully paid ordinary share held. In respect of partly paid shares, the shareholder has a vote equivalent to the proportion which the amount paid up bears to the total issue price of the share at the date the poll is taken. |
| (e) | | For the purposes of determining voting entitlements at a general meeting, shares will be taken to be held by those persons recorded in the register of members at the time and date determined by the directors under Corporations Regulations 7.11.37 and 7.11.38. |
| (f) | | Dividends are only payable out of the profits (rule 114). |
| (g) | | In the event of a winding up, ordinary shares rank equally in the division of any surplus. |
| (h) | | Shareholders cannot redeem ordinary shares. |
| (i) | | The holders of fully paid ordinary shares have no further liability to WMC Resources in respect of those shares. The holders of partly paid shares are liable to WMC Resources once a call is made for the payment of the unpaid amount. |
| (j) | | There is no provision in the Constitution which discriminates against an existing or prospective shareholder as a result of that shareholder owning a substantial number of shares unless such ownership leads to a partial takeover offer (see heading “Partial Takeover Approval” below). |
| (k) | | To vary or cancel the rights attached to ordinary shares, a special resolution approving the variation or cancellation must be passed at a special meeting of the holders of ordinary shares, or by consent in writing signed by the holders of a least three-fourths of the issued ordinary shares within two calendar months from the date of such special meeting (rule 11). |
General Meetings of WMC Resources
The Board may convene general meetings of WMC Resources to be held at such times and places and in the manner determined by the Board (rule 52). No shareholder or director may convene a general meeting unless entitled to do so under the Corporations Act.
Subject to the Corporations Act and the ASX Listing Rules, notices of a general meetings convened by the Board may be given in the form and in the manner determined by the Board (rule 54).
At least 28 days notice must be given of a general meeting (section 249HA of the Corporations Act).
-124-
All shareholders may attend general meetings in person, or be represented by the attendance of a representative, attorney or by proxy (who need not be shareholders of WMC Resources in their own right).
The quorum for a general meeting is three members present in person, by proxy or attorney or by representative (rule 57). If within 15 minutes of the time appointed for holding the meeting a quorum is not present, the meeting, if convened by requisition, is dissolved, but in all other cases stands adjourned to the same day in the next week at the same time and place (rule 58). If at the adjourned meeting a quorum is not present within 15 minutes from the time appointed for holding the meeting, the meeting is dissolved.
Limitations on the Right to Own Securities
WMC Resources’ Constitution does not impose limitations on the right to own securities except those provisions relating to minimum holdings (known as an Unmarketable Parcel, as described below).
Unmarketable Parcel Rationalization Scheme
The Constitution contains a scheme whereby WMC Resources can sell the shares of members who hold a parcel of shares in WMC Resources of less that A$500 value (an “Unmarketable Parcel”). The scheme sets out notice requirements that WMC Resources must comply with prior to selling any shares and also includes the right of members (who hold an Unmarketable Parcel) to exempt their holdings from the scheme. The scheme can only be invoked once in any 12-month period with respect to any particular member.
Other Takeover Limitations
The rights of non-resident or foreign shareholders to hold or exercise voting rights on WMC Resources’ securities are subject to the Foreign Acquisitions and Takeovers Act 1975 (Cth). The Treasurer of the Australian Federal Government has the power to prohibit the acquisition of a controlling interest in any Australian company by a foreign person or foreign persons, if the Treasurer is of the opinion that the acquisition would be contrary to the national interest. For this purpose, a shareholding of 15% or more held by a single foreign person or 40% or more held by two or more foreign persons is deemed to constitute a controlling interest.
Section 50 of the Trade Practices Act 1974 (Cth) prohibits an acquisition of shares that would have the effect, or be likely to have the effect, of substantially lessening competition in a substantial market for goods or services, unless the acquisition is authorized by the Australian Competition and Consumer Commission.
Partial Takeover Approval
In the event that there is an offer made under a “proportional takeover bid” (within the meaning given to that expression by Chapter 6 of the Corporations Act) to acquire shares in WMC Resources, the registration of a transfer giving effect to a contract resulting from the acceptance of the bid, is prohibited unless and until a resolution to approve the proportional takeover bid is passed in accordance with rule 139 of WMC Resources’ Constitution. This resolution is to be voted on at a meeting convened and conducted by WMC Resources, of the persons entitled to vote on the resolution. The resolution is taken to have been passed if the proportion that the number of votes in favor of the resolution bears to the total number of votes on the resolution is greater than one-half. The provisions with respect to Partial Takeover Approval (rule 139) cease to have effect on the third anniversary of the date of their adoption or last renewal.
Disclosure of Share Ownership
The Constitution does not prescribe an ownership threshold above which shareholders must disclose their holding to WMC Resources. However, Part 6C.1 of the Corporations Act imposes disclosure requirements on persons who acquire or cease to hold a substantial holding (see section 9 of the Corporations Act) in WMC Resources. The disclosure must be given to WMC Resources and the ASX within the prescribed time.
-125-
Changes in Share Capital
WMC Resources by resolution passed in general meeting may from time to time alter its share capital in one or more of the ways provided for, and in the manner prescribed by, the Corporations Act (rule 44).
Subject to the Constitution, WMC Resources may reduce its share capital (rule 46) or buy back shares (rule 141) in accordance with the Corporations Act.
C. Material Contracts
Indenture (Roxby Downs (Indenture Ratification) Act of 1982)
For a description of the Indenture, see page 50.
Demerger Deed
In connection with the demerger, WMC Resources and Alumina Limited entered into the Demerger Deed. The Demerger Deed deals with transitional and miscellaneous commercial and legal issues arising in connection with the legal and economic separation of WMC Resources from Alumina Limited.
| | (i) | | Fundamental demerger principle |
The fundamental principle of the separation of WMC Resources from Alumina Limited is that, following the Demerger, WMC Resources has the entire economic benefit, risk and liabilities of all the WMC Resources businesses, companies and assets as if WMC Resources had owned and operated those businesses, companies and assets at all times. Alumina Limited continues to have the entire economic benefit, risk and liabilities of its companies and assets following the demerger.
Consistent with the fundamental demerger principle outlined above, Alumina Limited and WMC Resources acknowledged in the Deed that once the demerger was complete, WMC Resources would not have any rights against Alumina Limited, and Alumina Limited would not have any rights against WMC Resources, except in specified circumstances. Neither Alumina Limited nor WMC Resources has any right to make a claim for loss or damage arising directly or indirectly in relation to the demerger, internal restructure of the WMC Resources group and the operation of the WMC Resources group’s businesses prior to the demerger, unless expressly permitted by the Demerger Deed or any other document or agreement between the parties (such as the Transitional Services Agreement or other ongoing commercial arrangements).
| | (iii) | | Business restructure |
-126-
WMC Limited’s non-AWAC business and companies have been substantially restructured pursuant to a series of separate restructure agreements prior to the demerger so that an identifiable corporate group has come into existence comprising the companies that own the WMC Resources assets and constitute the WMC Resources’ businesses. The Demerger Deed makes provision for:
| | • | | the approach to be adopted by the parties to the restructure of WMC’s non-AWAC businesses and companies prior to the demerger; |
| | • | | the practical, economic and legal effect of the separation of WMC Resources from Alumina Limited; |
| | • | | the mechanism under which Alumina Limited and WMC Resources can transfer to the other group any asset or contract which a group member owns or holds after the demerger date but which at the demerger date was most directly used in the other group’s business, or was incorrectly transferred as part of the restructure of WMC Limited’s non-AWAC businesses; and |
| | • | | if any asset or share transfers required to establish the WMC Resources group have not been completed prior to the date of execution of the Demerger Deed, the principles in accordance with which the parties are to conduct their arrangements pending each transfer, so as to ensure that, to the extent possible, each transferee gets the benefit and all risks of the asset or company being transferred as from the accounting effective date; |
| | (iv) | | Accounting separation |
The Demerger Deed confirms that, for accounting purposes, Alumina Limited and WMC Resources will be treated as being demerged as from 30 November 2002, or on such other date as may be agreed between Alumina Limited and WMC Resources, with the intention that it be the date of the closest month end preceding the effective date of the demerger;
Records held by each of Alumina Limited and WMC Resources at the effective date of the demerger that relate to the other are to be maintained. Each of Alumina Limited and WMC Resources must allow the other to access those records and must notify the other prior to any destruction of those records so that they can be copied or retrieved;
| | (vi) | | Financial and tax assistance |
Alumina Limited and WMC Resources will assist each other in relation to future and past financial and tax matters and each will allow the other access to financial and other records in connection with the preparation of tax returns or tax audits by the Australian Taxation Office of either Alumina Limited or WMC Resources;
| | (vii) | | Employees and superannuation |
The Demerger Deed addresses matters relating to the transfer of certain employees of WMC Resources to Alumina Limited. Alumina Limited is obliged to indemnify WMC Resources against all costs and expenses (including claims) relating to the transfer. WMC Resources and Alumina Limited are each obliged to indemnify the other against all costs and expenses (including claims) relating to any redundancy, retrenchment or termination of a former Alumina Limited employee or WMC Resources employee (as applicable);
In accordance with the fundamental demerger principle, WMC Resources is required to meet all costs relating to the provision of retirement savings or retirement income benefits and other related benefits for its employees. The
-127-
Demerger Deed also requires Alumina Limited to assume responsibility for the superannuation arrangements of those employees transferring to it from WMC Resources;
| | (viii) | | Use of intellectual property |
The Demerger Deed sets out the general principles that determine ownership of intellectual property by Alumina Limited and WMC Resources (other than trademarks and business names). The Demerger Deed also sets out the restrictions on the use of jointly-owned intellectual property;
Under the Demerger Deed, Alumina Limited is required as soon as practicable, and in any event within one month, after the demerger date to cease the use of the “WMC” name (and derivatives) and the “WMC” logo and to arrange for the change of Alumina Limited group company names including the “WMC” name (or derivatives);
| | (ix) | | Litigation management |
Alumina Limited and WMC Resources will assist each other in relation to the management of current and new litigation matters involving WMC Resources (other than in respect of litigation between Alumina Limited and WMC Resources). Each of Alumina Limited and WMC Resources indemnifies the other in respect of liability or loss suffered in connection with a claim where that liability relates to the business of the other; and
WMC Resources is to provide its own group business insurance and insurance for the WMC Resources directors and officers from the effective date of the demerger. However, WMC Resources and the WMC Resources directors and officers will have access to the existing directors’ and officers’ insurance policy maintained by Alumina Limited for the remaining life of that policy in respect of matters which occurred on or before the effective date of the demerger.
-128-
Transitional Services Agreement
In connection with the demerger, WMC Resources and Alumina Ltd entered into the Transitional Services Agreement. Under the agreement, WMC Resources will provide, or will procure the provision of, certain services to the Alumina Ltd group for a period of up to 6 months after the demerger date.
WMC Resources will provide the following services to Alumina Ltd and to members of the Alumina Ltd group:
| | • | | General corporate services |
| | • | | Legal and company secretariat |
WMC Resources will charge Alumina Ltd a set monthly fee for providing, or procuring the provision of, the services described above.
| | (d) | | Protection of information |
The agreement imposes obligations on each of WMC Resources and Alumina Ltd to protect all information, records, reports and other data and other agreements or documents relating to or used in connection with the agreement.
WMC Resources must indemnify Alumina Ltd against all claims and losses (as defined in the agreement) which may be made or brought against Alumina Ltd or incurred or suffered by Alumina Ltd as a result of the wilful misconduct (as defined in the Agreement) of WMC Resources or its directors, employees, officers, agents or contractors.
WMC Resources Loan Facility
Prior to the demerger, WMC Limited put in place the WMC Resources Loan Facility (the “Loan Facility”) through its wholly owned subsidiary, WMC Finance, for the purposes of effecting certain debt refinancing associated with the demerger. The facility is a US$1.1 billion loan note facility arranged and underwritten by Commonwealth Bank of Australia, Deutsche Bank, JP Morgan and Westpac Banking Corporation as joint lead arrangers.
A draw-down of the Loan Facility has been made to repay the US debt securities repurchased under a tender offer for all and any outstanding U.S. debt securities issued by WMC Finance (USA) Limited, which became a wholly owned subsidiary of WMC Resources following the restructure prior to the demerger. The Loan Facility has also been drawn upon to fund the repayment of commercial paper and bank debt.
-129-
The WMC Resources Loan Facility has two components:
| | • | | a US$500 million 364 day term facility which is intended to be refinanced by a medium to long-term debt capital markets issuance; and |
| | • | | a US$600 million syndicated revolving facility with a 364 day term (which may be extended at the discretion of the lenders) and a three year tranche. |
The periods above terminate on the relevant anniversary of the date of execution of the Loan Facility, which is October 29 for the term facility and November 14 for the syndicated facility.
The Loan Facility was initially guaranteed by WMC Resources and the entities that became its principal subsidiaries upon demerger, together representing no less than 85% (by EBITDA and tangible assets) of the WMC Resources Group, and by WMC Limited. Following the implementation of the demerger, WMC Limited (Alumina Limited, as it has been renamed) ceased to be a guarantor of the Loan Facility.
The pricing of the Loan Facility is generally consistent with that which a BBB rated entity might obtain for a facility of this size and nature.
The Loan Facility contains undertakings by WMC Resources and its subsidiaries that are customary for a facility of this nature, including negative pledges and guarantees by WMC Resources and the guaranteeing subsidiaries.
The Loan Facility contains events of default and review events that are customary for a facility of this nature.
D. Exchange Controls
| (a) | | The Australian Banking (Foreign Exchange) Regulations and other Australian legislation and regulations control the import and export of capital and remittance of payments involving non-residents of Australia. WMC Resources is not restricted from receiving funds into or transferring funds from Australia to the credit of non-residents of Australia but in certain cases is required to: |
| | (i) | | withhold Australian taxes; |
| | (ii) | | obtain the Reserve Bank’s authority - |
| | | | to place any sum in Australia to the credit of, or make any payment in Australia to, by order of or on behalf of: |
| | • | | the Government of Iraq, its agencies or nationals; |
| | • | | the authorities in the Federal Republic of Yugoslavia (Serbia and Montenegro), or their agencies (in limited circumstances) and 81 named individuals associated with the Milosevic regime; |
-130-
| | • | | the Government of Libya, a public company of Libya, or a Libyan undertaking; |
-131-
| | • | | the Taliban or any undertaking owned or controlled, directly or indirectly, by the Taliban or specific associated individuals, entities, agencies associated with the Taliban, Osama bin Laden, al-Quaeda or other terrorists or their sponsors; or |
| | • | | the National Union for the Total Independence of Angola (UNITA), senior officials of UNITA or adult members of the immediate families of the senior officials of UNITA |
to sell or purchase foreign currency or take or send from Australia any Australian currency where that transaction relates
to:
| | • | | property, securities or funds in Australia belonging either directly or indirectly to, or other payments to, the Government of Iraq, its agencies or nationals; |
| | • | | property, securities or funds belonging either directly or indirectly to the authorities in the Federal Republic of Yugoslavia (Serbia and Montenegro), or their agencies (in limited circumstances) and 81 named individuals associated with the Milosevic regime; |
| | • | | property, securities or funds in Australia owned or controlled, directly or indirectly, by or otherwise relating to payments to the Government of Libya, a public authority of Libya or a Libyan undertaking; |
| | • | | property, securities or funds owned or controlled directly or indirectly by, or otherwise relating to payments to, or for the benefit of, the Taliban, or any undertaking owned or controlled, directly or indirectly, by the Taliban or specific associated individuals, entities, agencies associated with the Taliban, Osama bin Laden, al-Quaeda or other terrorists or their sponsors; or |
| | • | | property, securities or funds owned or controlled by, or otherwise relating to payments directly or indirectly to or for the benefit of, the National Union for the Total Independence of Angola (UNITA), senior officials of UNITA or adult members of the immediate families of the senior officials of UNITA; and |
(iii) lodge a report of the transaction details.
(b) There are no limitations, under the laws of Australia, on the right of non-residents to acquire, hold or vote ordinary shares in the Company, except for the Foreign Acquisitions and Takeovers Act 1975 (Cth) (the “Act”) and section 606 of the Corporations Act 2001 (Cth) (the “Corporations Act”). The Act controls the rights of non-residents to hold 15% or more of the total voting powers as outanding shares of an Australian company, but it does not affect the rights attaching to shares that are held or acquired in accordance with its provisions.
Under the Act, any acquisition or issue of shares (including the acquisition of an option to acquire shares) which would increase or alter beyond 15% in the case of any single foreign interest, or 40% in the case of more than one foreign interest, the level of foreign ownership in a corporation that carries on an Australian business is subject to review and approval by the Treasurer of the Commonwealth of Australia.
The Act permits the Treasurer to deny or refuse proposals where such proposals would be contrary to the Australian national interest.
Section 606 of the Corporations Act provides that, subject to certain exceptions, a person must not acquire a relevant interest in shares in a company if as a result someone’s voting power in the company increases to more than 20%, or increases from a starting point that is above 20% and below 90%. Section 606 also prohibits a person acquiring a legal or equitable interest in shares if, because of the acquisition, another person acquires a relevant interest in shares and someone’s voting power increases to more than 20%, or increases from a starting point that is above 20% and below 90%. Section 608 of the Corporations Act provides that a person has a “relevant interest” in shares if that person holds the shares, or has power or control over the voting rights attaching to them or their disposal, whether directly or indirectly.
-132-
The foregoing summary does not purport to be complete and is qualified in its entirety by reference to the applicable legislation and to the Constitution. A copy of the Constitution is filed as Exhibit 1 to this registration statement on Form 20-F.
E. Taxation
The following is a summary of the principal Australian and United States federal income tax consequences to United States holders (as defined below) of the acquisition, ownership and disposition of ADSs or ordinary shares and is based on the laws in force as at the date of this registration statement. Holders are advised to consult their own tax advisers concerning the overall tax consequences of the acquisition, ownership and disposition of ADSs or ordinary shares in their particular circumstances. This discussion relies in part on representations by the Depositary in the Deposit Agreement and related documents.
Commonwealth of Australia Taxation
With effect from July 1, 2002, Australia introduced a new dividend imputation system relating to company tax. Although the main legislative changes to effect the new dividend imputation system were enacted on June 29, 2002, these changes are only the first instalment of the proposed changes. The full impact of the new dividend imputation system can only be determined after all instalments of the proposed changes are enacted.
Broadly, the new dividend imputation system simplifies the old dividend system and it is intended to produce the same tax outcomes as the old system. The dividend imputation system of company tax relieves double taxation on dividends paid by Australian resident corporations. Under this system, companies are required to identify dividends paid as either franked or unfranked dividends. Franked dividends are those paid out of profits which have borne Australian corporate tax (ie. to which franking credits have been allocated) while unfranked dividends are paid out of untaxed profits. The Australian corporate tax rate is 30%. Franked dividends paid to non-residents are exempt from withholding tax but unfranked (or partly franked) dividends are subject to withholding tax, generally at 15% on the unfranked amount. Notices are provided to shareholders which specify the amount (if any) of dividend withholding tax deducted.
The current Australian tax rules require taxpayers to hold shares “at risk” for certain periods before obtaining the benefit of the dividend imputation system. The minimum period for holding ordinary shares “at risk” is currently 45 days, but the Australian Government is considering a proposal to reduce the minimum period. Failure to satisfy these requirements may result in the deduction of Australian withholding tax from dividends paid to non-residents of Australia. There is an exemption from these rules for defined “small” transactions.
The tax rules classify interests which satisfy a financial arrangements test as either debt or equity. An interest that is classified as equity will be frankable, whereas an interest that is classified as debt will not be frankable. ADSs and ordinary shares are likely to be classified as equity on the basis that the return is contingent on WMC Resources’ performance or at the discretion of WMC Resources. These rules apply July 1, 2001.
Under the provisions of the current Convention between the Government of the United States of America and the Government of Australia for the Avoidance of Double Taxation and the Prevention of Fiscal Evasion with Respect to Taxes on Income (the “Treaty”), the Australian tax withheld on unfranked dividends paid by WMC Resources to which a resident of the United States is beneficially entitled is limited to 15%. However, where the recipient’s shareholding is effectively connected with a permanent establishment in Australia or a fixed base in Australia from which independent personal services are carried out, the recipient will generally be subject to ordinary income tax for dividends received under the Australian tax rules. Australia and the United States have recently agreed to reduce the withholding tax rate to 5% for holders of more than 10% of the shares in a company and 0% for holders of 80% or more of the shares in a company. In all other cases the 15% rate limit will continue to apply. These changes will not take effect until July 1, 2003 (at the earliest) pending enactment of the changes.
-133-
A United States citizen who is resident in Australia, or a United States corporation that is resident in Australia (by reason of carrying on business in Australia and being managed or controlled in Australia or having its voting power controlled by shareholders who are residents of Australia) holding ADSs or ordinary shares as capital assets, may be liable for Australian capital gains tax (“CGT”) on the disposal of WMC Resources ADSs or ordinary shares. In calculating the amount of a capital gain that may be subject to Australian CGT, special rules apply to individuals, trusts and certain superannuation funds. For ADSs or ordinary shares acquired after September 21, 1999 and held for at least 12 months, these taxpayers will pay tax on half of the gain (calculated in nominal terms or two-thirds of the gain for certain superannuation funds) after allowing for any offsetting capital losses which are applied against the whole nominal gain. For ADSs or ordinary shares acquired before that time and held for at least 12 months, these taxpayers may choose between paying CGT on half of the gain (or two-thirds of the gain for certain superannuation funds), or paying CGT on all of the gain with the gain being calculated on the basis of the cost of the ADSs or shares being indexed for inflation up to September 30, 1999. For all types of taxpayers, the legislation freezes the indexation (for inflation) of the cost of ADSs and ordinary shares as at September 30, 1999, and abolishes such indexation for ADSs and ordinary shares acquired after September 21, 1999.
Under current Australian law, no income or other tax is payable on any profit on disposal of the ADSs or ordinary shares held by persons who are residents of the United States within the meaning of the Treaty except:
| | (a) | | if the person (together with associates, if any) owns or owned ADSs and/or ordinary shares at any time during the period of five years preceding the disposal, representing 10% or more of the issued share capital of WMC Resources (excluding share capital carrying no right to participate beyond a specified amount in distribution of profits or capital). However, in these circumstances there may be relief from Australian tax for residents of the United States under the Treaty; or |
| | (b) | | if the ADSs or ordinary shares have been used by the person in carrying on a trade or business wholly or partly at or through a permanent establishment in Australia. |
Different rules will apply to persons and corporations which are not residents of the United States.
Australia does not impose gift, estate or inheritance taxes in relation to gifts of shares or upon the death of a shareholder.
Neither the issue or transfer of an ADS or WMC Resources’ ordinary shares or the payment of a dividend will give rise to a liability to goods and services tax in Australia.
Australian Stamp Duty
No Australian stamp duty will be payable on the issue or transfer of an ADS or the transfer of WMC Resources’ ordinary shares.
United States Federal Income Tax Consequences
The following discussion is a summary of the material United States federal income tax consequences of owning Ordinary Shares or ADSs. The discussion below, except where specifically noted, does not address the effects of any state, local or non-United States tax laws. In addition, it applies to you only if you hold your Ordinary Shares or ADSs as a capital asset, and does not address the tax consequences that may be relevant to you in light of your particular circumstances. Moreover, it does not apply to you if you are not a U.S. person, as defined below, or if you are subject to special treatment under the United States federal income tax laws, including if you are:
| | • | | a dealer in securities or currencies; |
| | • | | a trader in securities if you elect to use a mark-to-market method of accounting for your securities holdings; |
-134-
| | • | | a financial institution; |
| | • | | a tax-exempt organization; |
| | • | | a person liable for alternative minimum tax; |
| | • | | a person that holds Ordinary Shares or ADSs as part of a straddle or a hedging or conversion transaction; |
| | • | | a person owning 10% or more of the voting stock of WMC Resources; or |
| | • | | a person whose “functional currency” is not the United States dollar. |
This discussion is based on the Internal Revenue Code of 1986, as amended (the “Code”), existing and proposed regulations, published rulings and court decisions, all as currently in effect, as well as the Convention Between the Government of the United States of America and the Government of Australia for the Avoidance of Double Taxation and the Prevention of Fiscal Evasion with Respect to Taxes on Income (the “Treaty”). These laws are subject to change, possibly on a retroactive basis.
You are a United States person if you are:
| | • | | a citizen or resident of the United States; |
| | • | | a domestic corporation; |
| | • | | an estate, the income of which is subject to United States federal income taxation regardless of its source; or |
| | • | | a trust if a United States court can exercise primary supervision over the trust’s administration and one or more United States persons are authorized to control all substantial decisions of the trust. |
For purposes of this discussion an “eligible U.S. holder” is a U.S. person that:
| | • | | is a resident of the United States for purposes of the Treaty; |
| | • | | does not maintain, for purposes of the Treaty, a permanent establishment or fixed base in Australia to which Ordinary Shares or ADSs are attributable and through which the U.S. person carries on or has carried on business (or, in the case of an individual, performs or has performed independent personal services); and |
| | • | | is otherwise eligible for benefits under the Treaty with respect to income or gain from Ordinary Shares or ADSs. |
The tax consequences to you of the purchase, ownership or disposition of Ordinary Shares or ADSs will depend upon the facts of your particular situation. We encourage you to consult your own tax advisors with regard to the application of the federal income tax laws, as well as to the applicability and effect of any state, local or foreign tax laws to which you may be subject.
In general, and taking into account the earlier assumptions, for United States federal income tax purposes, if you hold ADRs evidencing ADSs, you will be treated as the owner of the Ordinary Shares represented by those ADSs. Exchanges of Ordinary Shares for ADSs, and ADSs for Ordinary Shares, generally will not be subject to United States federal income tax.
-135-
Distributions
Subject to the passive foreign investment company rules discussed below, distributions made to you on or with respect to Ordinary Shares or ADSs will be treated as dividends and will be taxable as ordinary income to the extent that those distributions are made out of WMC Resources’ current or accumulated earnings and profits as determined for United States federal income tax purposes. You must include the gross amount of the dividend payment (including, in the case of unfranked or partially unfranked dividends, any Australian tax withheld) as income at the time you receive it, actually or constructively. Subject to the passive foreign investment company rules discussed below, to the extent that the amount of any distribution exceeds WMC Resources’ current or accumulated earnings and profits for a taxable year, the excess will be treated as a tax-free return of capital which reduces your tax basis in the Ordinary Shares or ADSs to the extent of the tax basis, and any remaining amount will be treated as capital gain from the sale or exchange of property. If you are a corporation you generally will not be entitled to claim a dividends received deduction with respect to distributions paid with respect to your Ordinary Shares or ADSs.
The amount of the dividend distribution that you must include in your income will be the US dollar value of the Australian dollar payments made, determined at the spot Australian dollar/US dollar rate on the date the dividend distribution is includible in your income, regardless of whether the payment is in fact converted into US dollars. Generally, any gain or loss resulting from currency exchange fluctuations during the period from the date you include the dividend payment in income to the date you convert the payment into US dollars will be treated as ordinary income or loss. The gain or loss generally will be income or loss from sources within the United States for foreign tax credit limitation purposes.
Dividends paid to eligible U.S. holders with respect to WMC Resources’ stock and that are unfranked or partially unfranked are subject to Australian withholding tax at a maximum rate of 15% with respect to the unfranked portion of the dividend payment. Subject to certain limitations, the Australian tax withheld in accordance with the Treaty and paid over to Australia generally will be creditable against your United States federal income tax liability.
Dividends will be income from sources outside the United States, but generally will be “passive income” or “financial services income” which is treated separately from other types of income for purposes of computing the foreign tax credit allowable to you.
Disposition
Subject to the passive foreign investment company rules discussed below, any gain or loss you realize on the sale, exchange or other taxable disposition of Ordinary Shares or ADSs will be subject to United States federal income taxation as a capital gain or loss in an amount equal to the difference between the US dollar value of the amount that you realize on that sale, exchange or other disposition and your adjusted tax basis, determined in US dollars, in the Ordinary Shares or ADSs surrendered. The gain or loss will be long term capital gain or loss if your holding period for the Ordinary Shares or ADSs is more than one year. A noncorporate U.S. person is generally taxed at a maximum rate of 20% on long term capital gain. Any capital gain or loss so realized will generally be United States source gain or loss. Your ability to deduct capital losses is subject to limitations.
-136-
Passive Foreign Investment Company Rules
WMC Resources believes that it is more likely than not that Ordinary Shares or ADSs will not be treated as stock of a passive foreign investment company, or “PFIC,” for United States federal income tax purposes, but this conclusion is a factual determination that is made annually and thus may be subject to change. Moreover, the application of the PFIC rules to a corporation such as WMC Resources that is primarily engaged in the active business of mining and processing metals is not entirely clear.
In general, if you are a U.S. holder, WMC Resources will be a PFIC with respect to you if for any taxable year in which you held our ADSs or Ordinary Shares:
| | • | | at least 75% of our gross income for the taxable year is passive income or |
| | • | | at least 50% of the value, determined on the basis of a quarterly average, of our assets is attributable to assets that produce or are held for the production of passive income. |
Passive income generally includes dividends, interest, royalties, rents (other than certain rents and royalties derived in the active conduct of a trade or business), annuities and gains from assets that produce passive income. If a foreign corporation owns at least 25% by value of the stock of another corporation, the foreign corporation is treated for purposes of the PFIC tests as owning its proportionate share of the assets of the other corporation, and as receiving directly its proportionate share of the other corporation’s income.
If we are treated as a PFIC, and you are a U.S. holder that did not make a mark-to-market election, as described below, you will be subject to special rules with respect to:
| | • | | any gain you realize on the sale or other disposition of your Ordinary Shares or ADSs and |
| | • | | any excess distribution that we make to you (generally, any distributions to you during a single taxable year that are greater than 125% of the average annual distributions received by you in respect of the Ordinary Shares or ADSs during the three preceding taxable years or, if shorter, your holding period for the Ordinary Shares or ADSs). |
Under these rules:
| | • | | the gain or excess distribution will be allocated ratably over your holding period for the Ordinary Shares or ADSs, |
| | • | | the amount allocated to the taxable year in which you realized the gain or excess distribution will be taxed as ordinary income, |
| | • | | the amount allocated to each prior year, with certain exceptions, will be taxed at the highest tax rate in effect for that year, and |
| | • | | the interest charge generally applicable to underpayments of tax will be imposed in respect of the tax attributable to each such year. |
Special rules apply for calculating the amount of the foreign tax credit with respect to excess distributions by a PFIC.
If you own Ordinary Shares or ADSs in a PFIC that are treated as marketable stock, you may also make a mark-to-market election. If you make this election, you will not be subject to the PFIC rules described above. Instead, in general, you will include as ordinary income each year the excess, if any, of the fair market value of your Ordinary Shares or ADSs at the end of the taxable year over your adjusted basis in your Ordinary Shares or ADSs. You will also be allowed
-137-
to take an ordinary loss in respect of the excess, if any, of the adjusted basis of your Ordinary Shares or ADSs over their fair market value at the end of the taxable year (but only to the extent of the net amount of previously included income as a result of the mark-to-market election). Your basis in the Ordinary Shares or ADSs will be adjusted to reflect any such income or loss amounts.
If you own Ordinary Shares or ADSs during any year that WMC Resources is a PFIC, you must file Internal Revenue Service Form 8621.
F. Dividends and Paying Agents
Not applicable.
G. Statement by Experts
Not applicable.
H. Documents on Display
It is possible to read and copy documents referred to in the registration statement on Form 20-F that have been filed with the Securities and Exchange Commission (“SEC”) at the SEC’s public reference room located at 450 Fifth Street, NW, Washington DC 20549. Please telephone the SEC at 1-800-SEC-0330 or access the SEC website (www.sec.gov) for further information.
I. Subsidiary Information
All controlled entities are wholly owned, unless otherwise indicated. WMC Resources’ significant subsidiaries are described in Item 4C – “Key Information – Organizational Structure”. The following is a list of all entities controlled by WMC Resources of June 30, 2002:
Controlled Entities
| | Place of Incorporation
| | Notes
|
| 141 Union Company | | Delaware USA | | B,a |
| A&BP Co. Pty Ltd | | WA | | C |
| Adwest Limited Partnership | | | | c |
| Agnew Mining Company Pty Ltd | | WA | | C |
| Albion Downs Pty Ltd | | WA | | C,f |
| Carson Hill Gold Mining Corporation | | Delaware USA | | B,a |
| Central Norseman Gold Corporation Ltd (owned 50.48%) | | VIC | | |
| Great Boulder Mines Pty Ltd | | VIC | | C |
| Hi-Fert Distributors Pty Ltd | | SA | | C |
| Hi-Fert Pty Ltd | | SA | | |
| Hillcrest Inc (owned ~ 100%) | | Philippines | | A,i |
| Liberia Western Mining Corporation Limited (owned 97.4%) | | Liberia | | B,g |
| Minera WMC Chile Exploration Ltda | | Chile | | B |
| Mineração Alfenas Limitada (owned ~ 100%) | | Brazil | | B,g |
| Mineração Ituverava Limitada (owned ~ 100%) | | Brazil | | B,g |
| Mineração Jenipapo S.A. (owned ~ 100%) | | Brazil | | B |
| Mineração Wesminas Limitada (owned ~ 100%) | | Brazil | | B |
| Olympic Dam Marketing Pty Ltd | | SA | | C |
| P&DP Co. Pty Ltd | | WA | | C |
| PT Solok Mas Minerals (owned 80%) | | Indonesia | | d,g |
| PT WMC Services | | Indonesia | | d |
| Q.S. Mineração Ltda (owned ~ 100%) | | Brazil | | |
| Ringwood Station Partnership | | | | |
| Three Springs Talc Pty Limited | | Australia | | |
| WPF Pty Ltd | | QLD | | C |
-138-
Controlled Entities
| | Place of Incorporation
| | Notes
|
| Wesminco Oil Pty Ltd | | VIC | | |
| Western Exploration Pty Ltd | | VIC | | C |
| Western Hog Ranch Company | | Nevada USA | | B,a |
| Western Mining Corporation Pty Ltd | | VIC | | C |
| Western Venture Inc. | | Delaware USA | | B,a |
| Westmin Talc (UK) | | UK | | |
| Westmin Talc Pty Ltd | | VIC | | |
| Westminer Insurance Pte Ltd | | Singapore | | a |
| WMC (Argentina) Inc. | | Delaware USA | | B |
| WMC (China) Pty Limited | | VIC | | C |
| WMC (Kunming) Pty Limited | | VIC | | C |
| WMC (Liberia) Limited | | Hong Kong | | |
| WMC (Olympic Dam Corporation) Pty Ltd | | SA | | |
| WMC (Olympic Dam Operations) Pty Ltd | | VIC | | |
| WMC (Overseas) Pty Limited | | VIC | | C |
| WMC (Peru) Inc. | | Delaware USA | | d |
| WMC (Philippines) Inc. | | Philippines | | A,i |
| WMC Superannuation Fund Pty Ltd (owned 50%) | | Australia | | |
| WMC (Uzbekistan) Ltd | | Jersey | | |
| WMC Xinjiang Mineral Industry Services Company | | China | | |
| WMC (Yunnan) Pty Limited | | VIC | | C |
| WMC (Zarmitan) Ltd | | Jersey | | |
| WMC Automation Pty Ltd | | WA | | C |
| WMC Chile S.A. | | Chile | | d |
| WMC Corporate Services Inc. | | Delaware USA | | B,d |
| WMC Exploration Corporation | | Philippines | | e |
| WMC Exploration Inc. | | Delaware USA | | |
| WMC Fertilizers Pty Ltd | | VIC | | |
| WMC Finance (USA) Limited | | VIC | | |
| WMC Finance Limited | | ACT | | |
| WMC Holdings Pty Ltd | | SA | | C |
| WMC Innovation Pty Ltd | | VIC | | C |
| WMC International Holdings Ltd | | Canada | | B,d |
| WMC International Limited | | Canada | | B,a |
| WMC Kazakstan Ltd | | Jersey | | |
| WMC Liberia Management Limited | | Liberia | | B,g |
| WMC Mineração Limitada (owned ~ 100%) | | Brazil | | B,d |
| WMC (Mineral Sands) Limited | | Jersey | | |
| WMC Nickel Sales Corporation Limited | | UK | | B |
| WMC Participaçoes Limitada | | Brazil | | B,h |
| WMC Petroleum (Malaysia) Snd Bhd (in liquidation) | | Malaysia | | A |
| WMC Resources International Pty Ltd | | VIC | | |
| WMC Securities Pty Ltd | | WA | | |
| WMC Services Pty Limited | | ACT | | C |
| Yakabindie Nickel Limited | | NSW | | |
| Yeelirrie Development Company Pty Ltd | | WA | | C |
| Yeelirrie Management Services Pty Ltd | | WA | | C |
| Yeelirrie Pastoral Station Partnership | | | | |
Notes to Subsidiaries:
These controlled entities:
A) have not been required to prepare audited accounts as they are in voluntary liquidation.
-139-
B) have not prepared audited accounts either as they are non-operating or audited accounts are not required in their country of
incorporation;
C) as small proprietary corporations, not required to prepare financial reports.
a) Been translated as a self-sustaining entity.
b) The remaining shares are held in trust for the Company by the vendors, pending compliance with conditions precedent
in the sales agreement.
c) Although not a company, included as a controlled entity in compliance with AASB 1024.
d) Has been translated as an integrated entity.
e) This company is in the process of being liquidated.
f) This company is owned 100% by Newmont Mt Keith ACM Pty Ltd (with a call option in favor of, and a put option
against, WMC Resources, both exercisable before June 16, 2012).
g) These companies are in the process of dissolution.
h) It is intended to dissolve this company.
i) WMC Resources International is currently in the process of selling to third parties.
J. Enforcement of Civil Liabilities
WMC Resources is a corporation organized under the laws of the Commonwealth of Australia. All the directors and officers of WMC Resources, and some of the experts named in this document, reside outside the United States, principally in Australia. A substantial portion of the assets of WMC Resources, and the assets of WMC Resources’ directors, officers and experts, are located outside the United States. Therefore, you may not be able to effect service of process within the United States upon WMC Resources or these persons so that you may enforce judgments of United States courts against them based on the civil liability provisions of the United States federal securities laws. In addition, you may have difficulty bringing an original action in an Australian court to enforce liabilities against WMC Resources or any of these persons based on U.S. federal securities laws.
-140-
| | QUANTITATIVE AND QUALITATIVE DISCLOSURES ABOUT MARKET RISK |
ITEM 11. QUANTITATIVE AND QUALITATIVE DISCLOSURES ABOUT MARKET RISK
Quantitative Information about Market Risk
Price Risk Management Policy
WMC Resources’ Price Risk Management policy provides the framework for the management of price exposures and is established by the Board. The policy details the approach of WMC Resources to managing price exposures and delineates hedging limits and delegated management authorities. Management of exposures is delegated to the Risk Management Committee within parameters set by the Board, and is chaired by the Chief Executive Officer and comprises the Chief Financial Officer and several senior executives. The Risk Management Committee is responsible for strategic hedging decisions and ensuring that these are implemented.
WMC Resources’ Treasury acts under the authorization of the Risk Management Committee in implementing strategic hedging decisions. In addition, WMC Resources’ Treasury is authorized to manage hedges held against underlying financial or commodity exposures arising from WMC Resources’ business operations. The Risk Management Committee members receive a weekly hedge position report as well as a detailed risk management report prior to the Committee’s monthly meetings.
Due to changes to the scale, diversity and competitiveness of WMC Resources’ operations, WMC Resources revised its Risk Management Policy during 1999 to limit hedging activity to securing acceptable rates of return for new projects. Previously existing hedging contracts will remain in place, but will not be replaced or renewed.
Hedging gains or losses, together with the cost of contracts, are brought to account when the designated sale occurs. Price Risk Management transactions are entered into with domestic and international banks and financial institutions, which the Board of Directors has approved.
Commodity Hedging Policy
Commodity price risk relates to WMC Resources’ exposure to changes in the commodity prices. WMC Resources’ revenue streams are significantly derived from the sale of its commodity production and the amount of revenue will fluctuate with the moving commodity prices. Consistent with the Price Risk Management policy, WMC Resources may seek to reduce its exposure to commodity price movements by entering into commodity hedging contracts for a proportion of WMC Resources’ production. When looked at in isolation, hedging transactions could result in costs to WMC Resources if:
(a) the commodity price at the date of maturity of the hedge contract is greater than the hedged price (either due to the requirement to expend cash to financially settle hedge contracts, or via the receipt of a hedge contract price lower than the prevailing spot price at contract maturity); or
(b) a counterparty were to default and the commodity price at the date of default is less than the hedged price.
In the case of a), the hedging loss will be offset by a higher revenue stream from the higher commodity price relative to the prevailing prices at the date of conception of the hedge, although the net revenue WMC Resources would receive would be less than it would otherwise have received had the hedge transaction not been in place.
-141-
| | QUANTITATIVE AND QUALITATIVE DISCLOSURES ABOUT MARKET RISK |
A table showing the movement in the selling price of nickel, gold, fertilizer and copper over the last five years is set out below.
AVERAGE QUARTERLY PRICES
Financial Year Ended
| | Nickel London Metal Exchange US$/lb
| | Gold London Gold Market US$/oz
| | Fertilizer US Gulf Price US$/tonne
| | Copper London Metal Exchange US$/lb
|
|
| June 30, 1997 | | | | | | | | |
| First Quarter | | 3.26 | | 385 | | 208 | | 0.90 |
| Second Quarter | | 3.12 | | 376 | | 210 | | 0.97 |
| Third Quarter | | 3.42 | | 353 | | 202 | | 1.10 |
| Fourth Quarter | | 3.30 | | 343 | | 200 | | 1.14 |
|
| December 31, 1997 | | | | | | | | |
| First Quarter | | 3.05 | | 324 | | 199 | | 1.03 |
| Second Quarter | | 2.80 | | 307 | | 200 | | 0.87 |
|
| December 31, 1998 | | | | | | | | |
| First Quarter | | 2.46 | | 294 | | 194 | | 0.77 |
| Second Quarter | | 2.24 | | 300 | | 205 | | 0.78 |
| Third Quarter | | 1.81 | | 257 | | 209 | | 0.73 |
| Fourth Quarter | | 1.80 | | 294 | | 205 | | 0.70 |
|
| December 31, 1999 | | | | | | | | |
| First Quarter | | 2.11 | | 287 | | 199 | | 0.64 |
| Second Quarter | | 2.37 | | 274 | | 190 | | 0.66 |
| Third Quarter | | 2.89 | | 259 | | 174 | | 0.76 |
| Fourth Quarter | | 3.53 | | 296 | | 153 | | 0.79 |
|
| December 31, 2000 | | | | | | | | |
| First Quarter | | 4.29 | | 291 | | 148 | | 0.81 |
| Second Quarter | | 4.26 | | 280 | | 145 | | 0.79 |
| Third Quarter | | 3.75 | | 277 | | 164 | | 0.85 |
| Fourth Quarter | | 3.38 | | 269 | | 158 | | 0.84 |
|
| December 31, 2001 | | | | | | | | |
| First Quarter | | 2.97 | | 259 | | 162 | | 0.79 |
| Second Quarter | | 3.04 | | 268 | | 142 | | 0.75 |
| Third Quarter | | 2.51 | | 276 | | 138 | | 0.67 |
| Fourth Quarter | | 2.29 | | 279 | | 147 | | 0.64 |
|
| December 31, 2002 | | | | | | | | |
| First Quarter | | 2.80 | | 291 | | 152 | | 0.70 |
| Second Quarter | | 3.15 | | 313 | | 157 | | 0.73 |
-142-
| | QUANTITATIVE AND QUALITATIVE DISCLOSURES ABOUT MARKET RISK |
Currency Hedging Policy
Foreign currency risk relates to WMC Resources’ exposure to changes in exchange rates. WMC Resources’ “revenue streams are significantly derived from the sale of its commodity production in US dollars and the amount of Australian dollar revenue it will receive fluctuates with the moving AUD/USD exchange rate. Consistent with approved Board policy, WMC Resources may seek to reduce its exposure to exchange rate movements by entering into foreign exchange hedging contracts for a proportion of its outstanding receivables with a view to reducing the effects of adverse currency rate fluctuations. When looked at in isolation, hedging transactions relating to the conversion of US dollar receivables to Australian dollars, they could result in losses if:
(a) the AUD weakens against the USD between contract inception and maturity; or
(b) a counterparty were to default and the AUD has strengthened against the USD between contract inception and maturity.
In the case of a), the hedging loss will be offset by a higher Australian dollar revenue stream from the lower AUD/USD exchange rate, although the net revenue WMC Resources would receive would be less than it would otherwise had received had the hedge transaction not been in place.
Summary Hedging Results
Hedging results for the six months ended June 30, 2002 and years ended December 31, 2001, 2000 and 1999 were:
A$ million profit / (loss)
Hedging Results
| | 2002
| | | 2001
| | | 2000
| | | 1999
| |
| Currency - AUD/USD | | (65.2 | ) | | (328.1 | ) | | (253.0 | ) | | (19.8 | ) |
| Gold | | (3.4 | ) | | 64.1 | | | 91.9 | | | 103.2 | |
| Copper | | — | | | — | | | (10.3 | ) | | (4.4 | ) |
| Nickel | | — | | | 2.0 | | | (96.5 | ) | | (36.0 | ) |
| | |
|
| |
|
| |
|
| |
|
|
Total | | (68.6 | ) | | (262.0 | ) | | (267.9 | ) | | 43.0 | |
| | |
|
| |
|
| |
|
| |
|
|
These gains and losses have been allocated to the revenue and profits of individual business units.
The following information is provided in compliance with Financial Reporting Release No. 48. WMC Resources has elected to disclose information in the “Tabular Presentation” set down in s305(a)(I)(i).
Commodity Hedging
(A) Trading Purposes
Nil.
(B) Non-trading (Hedging Purposes)
As at June 30, 2002:
(1) Gold
-143-
| | QUANTITATIVE AND QUALITATIVE DISCLOSURES ABOUT MARKET RISK |
658,400 ounces of gold relating to production from Olympic Dam (December 2001: 720,000) had been hedged at an average gold price of A$615 per ounce (December 2001: A$586 per ounce) with maturities extending to 2010 as follows:
Maturity
| | Forward sale of Gold
|
| | | Amount of ounces
| | | | Rate A$/ounce
| | | | Fair Value A$m
|
2002 | | 48,200 | | | | 522 | | | | (2.2) |
2003 | | 80,000 | | | | 548 | | | | (3.2) |
2004 | | 80,000 | | | | 559 | | | | (4.0) |
2005 | | 80,000 | | | | 579 | | | | (4.1) |
2006 | | 78,300 | | | | 618 | | | | (3.2) |
| | |
| | | |
| | | |
|
2007-2010 | | 291,900 | | | | 672 | | | | (14.9) |
| | |
| | | |
| | | |
|
For comparison, the following gold hedge positions were in place at December 31, 2001:
Maturity
| | Forward sale of Gold
|
| | | Amount of ounces
| | | | Rate A$/ounce
| | | | Fair Value A$m
|
2002 | | 83,000 | | | | 500 | | | | (4.1) |
2003 | | 80,000 | | | | 509 | | | | (4.3) |
2004 | | 80,000 | | | | 521 | | | | (4.6) |
2005 | | 80,000 | | | | 497 | | | | (7.4) |
2006 | | 78,300 | | | | 618 | | | | (0.8) |
| | |
| | | |
| | | |
|
2007-2010 | | 318,700 | | | | 659 | | | | (5.7) |
| | |
| | | |
| | | |
|
The above gold contracts provide the Company with the option to either physically or financially settle. They have no floating interest rate or gold lease rate exposure.
As these contracts are entered into for the purpose of hedging future production, any unrealized gains and losses on the contracts, together with the cost of the contracts, are deferred until the underlying production occurs.
The fair value is based on the mark to market of the maturing forward contracts. This is the difference between the future expected market price as at June 30, 2002 and the original contract rate. The future expected market price is based on the forward price calculated on the spot rate and the gold contango (difference between US interest rates and the gold lease rate discounted using a zero coupon interest rate curve).
Currency Hedging
(A) Trading Purposes
Nil
(B) Non-trading (Hedging Purposes)
As at June 30, 2002, US$1,791.1 million (December 2001: US$2,104.3 million) has been hedged at an average rate of A$/US$0.6642 (December 2001: 0.6570) at maturities extending to 2008 using a combination of forward contracts and options as detailed in the table below:
-144-
| | QUANTITATIVE AND QUALITATIVE DISCLOSURES ABOUT MARKET RISK |
Maturity
| | Forward sale of US$
| | Bought Put Options
| | Written Call Options
|
| | | Amount US$m
| | Rate A$/US$
| | Fair Value A$m
| | Amount US$m
| | Strike rate A$/US$
| | Fair Value A$m
| | Amount US$m
| | Strike rate A$/US$
| | Fair Value A$m
|
2002 | | 119.3 | | 0.6796 | | (36.6) | | 31.3 | | 0.6489 | | 0.1 | | 31.3 | | 0.6489 | | (7.1) |
2003 | | 195.6 | | 0.6821 | | (66.4) | | 62.5 | | 0.6489 | | 0.8 | | 62.5 | | 0.6489 | | (15.6) |
2004 | | 228.4 | | 0.6753 | | (76.5) | | 72.5 | | 0.6413 | | 1.7 | | 72.5 | | 0.6413 | | (19.1) |
2005 | | 228.3 | | 0.6887 | | (81.9) | | 77.5 | | 0.6438 | | 2.4 | | 77.5 | | 0.6438 | | (20.8) |
2006 | | 155.6 | | 0.6828 | | (53.3) | | 72.5 | | 0.6413 | | 2.8 | | 72.5 | | 0.6413 | | (19.4) |
2007-2008 | | 353.1 | | 0.6643 | | (105.8) | | 194.5 | | 0.6123 | | 13.4 | | 194.5 | | 0.6123 | | (43.4) |
For comparison, the following foreign currency hedge positions were in place at December 31, 2001:
Maturity
| | Forward sale of US$
| | Bought Put Options
| | Written Call Options
|
| | | Amount US$m
| | Rate A$/US$
| | Fair value A$m
| | Amount US$m
| | Strike rate A$/US$
| | Fair value A$m
| | Amount US$m
| | Strike rate A$/US$
| | Fair value A$m
|
2002 | | 211.5 | | 0.6854 | | (128.0) | | 252.3 | | 0.5875 | | 1.7 | | 82.5 | | 0.6571 | | (36.6) |
2003 | | 175.6 | | 0.6855 | | (106.7) | | 82.5 | | 0.6571 | | 0.4 | | 82.5 | | 0.6571 | | (37.0) |
2004 | | 208.4 | | 0.6817 | | (117.4) | | 92.5 | | 0.6500 | | 1.1 | | 92.5 | | 0.6500 | | (38.9) |
2005 | | 213.3 | | 0.6870 | | (125.6) | | 92.5 | | 0.6500 | | 1.6 | | 92.5 | | 0.6500 | | (37.1) |
2006 | | 135.6 | | 0.6809 | | (79.9) | | 92.5 | | 0.6500 | | 2.1 | | 92.5 | | 0.6500 | | (35.2) |
2007-2010 | | 338.1 | | 0.6595 | | (164.6) | | 209.5 | | 0.6173 | | 8.5 | | 209.5 | | 0.6173 | | (64.8) |
The fair value is based on the differential US and Australian interest rate curves discounted using the zero coupon interest rate curve.
Interest Rate Hedging
Interest rate risk refers to WMC Resources’ exposure to movements in interest rates. WMC Resources is primarily exposed to interest rate risk on its outstanding interest bearing liabilities. As interest rates fluctuate, the amount of interest payable on debt balances where the interest rate is not fixed will also fluctuate. Interest rate swaps and cross currency swaps allow the group to manage its interest rate risk.
In October and November 2002 WMC Resources put in place, through its wholly owned subsidiary, WMC Finance Ltd, loan facilities totaling US$1.1 billion to repay the WMC Group debt guaranteed by WMC Limited and to provide ongoing liquidity post demerger. The loan facilities, which are guaranteed by WMC Resources and its major subsidiaries, are underwritten by JP Morgan, Deutsche Bank, Westpac Banking Corporation and Commonwealth Bank of Australia.
The loan facilities have two components:
| | • | | a US$500 million 364 day term facility (which may be extended at the discretion of the lenders) which is intended to be refinanced by a medium to long term debt capital markets issuance after the demerger is implemented; and |
| | • | | a US$600 million syndicated facility with 364 day and 3 year tranches. |
The periods above terminate on the relevant anniversary of the date of the loan facility which are October 29 for the term facility and November 14 for the syndicated facility.
-145-
| | QUANTITATIVE AND QUALITATIVE DISCLOSURES ABOUT MARKET RISK |
Interest rate risk
As at June 30, 2002 the group had the following debt:
| | | | | Maturing in:
|
| | | | | 2002
| | 2003
| | 2004
| | 2005
| | 2006
| | 2007 onwards
|
A$m debt (floating) | | | | | | | | | | | | |
|
| Promissory Notes | | – face value | | 552.5 | | | | | | | | | | |
| | | – fair value | | 552.5 | | | | | | | | | | |
|
| Bank loans | | – face value – fair value | | 132.0 136.1 | | | | | | | | | | |
|
A$m equivalent of US$ debt (fixed) | | | | | | | | | | | | | | |
|
| Yankee Bonds | | – face value – fair value | | | | 441.4 462.2 | | | | | | 353.1 373.7 | | 617.9 628.8 |
| | | | |
| |
| | | | | |
| |
|
|
| Total | | – face value – fair value | | 684.5 688.6 | | 441.4 462.2 | | | | | | 353.1 373.7 | | 617.9 628.8 |
Included in the debt noted above is the following A$ debt which has been swapped to US$. The terms of the cross currency swaps are provided on page 135.
| | | Maturing in:
|
| | | 2002
| | 2003
| | 2004
| | 2005
| | 2006
| | 2007 onwards
|
| Bank loans A$60m | | US$ 36.3m | | | | | | | | | | |
-146-
| | QUANTITATIVE AND QUALITATIVE DISCLOSURES ABOUT MARKET RISK |
As at December 31, 2001
| | | | | Maturing in:
|
| | | | | 2002
| | 2003
| | 2004
| | 2005
| | 2006
| | 2007 onwards
|
A$m debt (floating) | | | | | | | | | | | | |
|
| Promissory Notes | | – face value | | 240 | | | | | | | | | | |
| | | – fair value | | 240 | | | | | | | | | | |
|
| Medium Term Bilaterals | | – face value | | 250 | | | | | | | | | | |
| | | – fair value | | 250 | | | | | | | | | | |
|
| Bank loans | | – face value | | 117.3 | | | | | | | | | | 50 |
| | | – fair value | | 201.9 | | | | | | | | | | 65.5 |
A$m equivalent of US$m debt (fixed) | | | | | | | | | | | | |
|
| Yankee Bonds | | – face value | | | | 488.9 | | | | | | 391.1 | | 684.4 |
| | | – fair value | | | | 507.1 | | | | | | 402.7 | | 672.6 |
| | | | |
| |
| | | | | |
| |
|
|
| Total | | – face value | | 607.3 | | 488.9 | | | | | | 391.1 | | 734.4 |
| | | – fair value | | 691.9 | | 507.1 | | | | | | 402.7 | | 738.1 |
Included in the debt noted above is the following A$ debt which has been swapped to US$. The terms of the cross currency swaps are provided on page 150.
| | | Maturing in:
|
| | | 2002
| | 2003
| | 2004
| | 2005
| | 2006
| | 2007 onwards
|
| Medium Term Bilaterals A$330m | | US$ 212.0m | | | | | | | | | | |
|
| Bank loans A$50m | | | | | | | | | | | | US$33.5m |
The group is exposed to interest rate risk on its outstanding interest bearing liabilities and investments. Interest rate swaps and cross currency swaps allow the group to manage its interest rate risk.
-147-
| | QUANTITATIVE AND QUALITATIVE DISCLOSURES ABOUT MARKET RISK |
Interest rate and cross currency swaps
As at June 30, 2002, WMC Resources had not entered into any interest rate hedging contracts in relation to its debt. During the six month period the company closed out all previous interest rate swaps recording a gain of A$75.9 million. Consequently there were no interest rate swaps open at June 30, 2002.
For comparison, the group had entered into the following interest rate hedging contracts at December 31, 2001:
Notional AUD principal Millions A$
| | Interest swapped
| | Interest rate
| | Maturity
| | Fair value A$m
| |
| | | Fixed
| | Float(1)
| | |
| 100.0 | | Fixed for floating | | 6.00 | | 4.90 | | 27/5/2002 | | 0.5 | |
100.0
| | Fixed for floating | | 6.00 | | 4.90 | | 27/5/2002 | | 0.5 | |
| 200.0 | | | | | | | | | | | |
|
Notional US principal Millions A$
| | Interest swapped
| | Interest rate
| | Maturity
| | Fair value A$m
| |
| | | Fixed
| | Float
| | |
| 25.0 | | Floating for fixed | | 7.02 | | 2.01 | | 15/11/2003 | | (3.9 | ) |
25.0
| | Floating for fixed | | 7.10 | | 2.01 | | 15/11/2013 | | (6.0 | ) |
| 50.0 | | | | | | | | | | | |
| 25.0 | | Fixed for floating | | 6.50 | | 1.36 | | 15/11/2003 | | 3.6 | |
| 50.0 | | Fixed for floating | | 6.50 | | 0.93 | | 15/11/2003 | | 8.2 | |
| 25.0 | | Fixed for floating | | 6.75 | | 1.93 | | 1/12/2006 | | 4.4 | |
| 25.0 | | Fixed for floating | | 6.75 | | 1.91 | | 1/12/2006 | | 4.3 | |
| 25.0 | | Fixed for floating | | 6.75 | | 1.84 | | 1/12/2006 | | 4.3 | |
| 25.0 | | Fixed for floating | | 6.75 | | 1.83 | | 1/12/2006 | | 4.3 | |
| 25.0 | | Fixed for floating | | 7.55 | | 1.97 | | 15/11/2013 | | 8.2 | |
| 50.0 | | Fixed for floating | | 7.25 | | 1.94 | | 15/11/2013 | | 13.8 | |
| 40.0 | | Fixed for floating | | 7.25 | | 1.80 | | 15/11/2013 | | 12.5 | |
| 50.0 | | Fixed for floating | | 7.35 | | 2.77 | | 1/12/2026 | | 7.5 | |
| 25.0 | | Fixed for floating | | 7.35 | | 2.76 | | 1/12/2026 | | 3.7 | |
| 25.0 | | Fixed for floating | | 7.35 | | 2.80 | | 1/12/2026 | | 3.6 | |
50.0
| | Fixed for floating | | 7.35 | | 3.15 | | 2/12/2026 | | 2.5 | |
| 440.0 | | | | | | | | | | | |
(1) | | This is the floating rate applicable to the swap at balance date and is set using the 3 months US$ LIBOR floating base rate plus a margin. |
As at June 30, 2002, the group had entered into a cross currency swap, swapping A$60 million into US$ denominated debt of US$36.3 million as follows:
A$m Debt
| | US$m equivalent
| | Interest Rate 2002
| | Maturity
| | Fair Value A$m
|
| | | A$ Debt
| | US$ Debt
| | |
| 50.0 | | 30.0 | | 4.74 | | 2.11 | | 30/8/2002 | | (3.0) |
| 10.0 | | 6.3 | | 4.95 | | 2.37 | | 8/5/2009 | | (1.11) |
| 60.0 | | 36.3 | | | | | | | | (4.11) |
Fair value is based on the spot rate as at June 30, 2002. Given the short period to maturity this is not expected to be materially different to market value.
-148-
| | QUANTITATIVE AND QUALITATIVE DISCLOSURES ABOUT MARKET RISK |
For comparison, the group had entered into the following cross currency swaps at December 31, 2001:
A$m debt
| | US$m equivalent
| | Interest Rate
| | Maturity
| | Fair value A$m
|
| | | A$ Debt
| | US$ Debt
| | |
| 50.0 | | 30.0 | | 5.30 | | 4.10 | | 2/4/2002 | | (8.7) |
| 20.0 | | 12.6 | | 4.81 | | 2.92 | | 7/4/2002 | | (4.6) |
| 50.0 | | 31.4 | | 4.81 | | 2.91 | | 7/4/2002 | | (11.5) |
| 10.0 | | 6.3 | | 4.81 | | 5.12 | | 8/4/2002 | | (2.3) |
| 200.0 | | 131.7 | | 4.85 | | 2.62 | | 8/5/2005 | | (57.5) |
| 50.0 | | 33.5 | | 5.35 | | 3.06 | | 8/5/2009 | | (15.5) |
| 380.0 | | 245.5 | | | | | | | | |
As at June 30, 2002, the group had entered into US$230 million of interest caps at 6.28% (December 2001: US$430 million at 7.14%) with maturity dates varying from August 1, 2003 to September 1, 2003. Their fair value is immaterial.
Adoption of FAS 133
WMC Resources adopted Statement of Financial Accounting Standards No. 133, “Accounting for Derivative Instruments and Hedging Activities” as amended by Statement of Financial Accounting Standards No. 137, “Accounting for Derivative Instruments and Hedging Activities – Deferral of the Effective Date of FASB Statement No. 133”, an amendment of FASB Statement No. 133, and Statement of Financial Accounting Standards No. 138, “Accounting for Certain Derivative Instruments and Certain Hedging Activities”, an amendment of FASB Statement No. 133 (referred to hereafter as “FAS 133”), on January 1, 2001. In accordance with the transition provisions of FAS 133, WMC Resources recorded the following net-of-tax cumulative effect adjustments in earnings as of January 1, 2001:
| | | Millions (A$)
| |
| Related to previously designated fair value hedging relationships: | | | |
| Fair value of hedging instruments | | 36.0 | |
| Offsetting changes in fair value of hedged items | | (36.0 | ) |
| | |
|
|
| Total adjustment net of tax | | – | |
| | |
|
|
In addition, WMC Resources recorded the following net-of-tax cumulative-effect adjustments in other comprehensive income as of January 1, 2001.
| | | Millions (A$)
| |
| Related to previously designated fair value hedging relationships: | | | |
| Fair value of hedging instruments | | 29.2 | |
| Previously deferred hedging gains and losses | | (647.9 | ) |
| | |
|
|
| Total adjustment net of tax | | (618.7 | ) |
| | |
|
|
Accounting for Derivatives and Hedging Activities
WMC Resources formally documents all relationships between hedging instruments and hedged items, as well as its risk-management objective and strategy for undertaking various hedge transactions. This process includes linking all derivatives that are designated as fair-value, cash flow, or foreign-currency hedges to (1) specific assets and liabilities on the balance sheet or (2) specific firm commitments or forecasted transactions. WMC Resources also formally assesses (both at the hedge’s inception and on an ongoing basis) whether the derivatives that are used in hedging transactions have been highly effective in offsetting changes in the fair value or cash flows of hedged items and whether those derivatives may be expected to remain highly effective in future periods. When it is determined that a derivative is not (or has ceased to be) highly effective as a hedge, WMC Resources discontinues hedge accounting prospectively, as discussed below.
-149-
| | QUANTITATIVE AND QUALITATIVE DISCLOSURES ABOUT MARKET RISK |
WMC Resources discontinues hedge accounting prospectively when (1) it determines that the derivative is no longer effective in offsetting changes in the fair value or cash flows of a hedged item (including hedged items such as firm commitments or forecasted transactions); (2) it is probable that the forecasted transaction will not occur; (3) a hedged firm commitment no longer meets the definition of a firm commitment; or (4) management determines that designating the derivative as a hedging instrument is no longer appropriate.
Fair-Value Hedges
WMC Resources uses interest rate swaps to convert a portion of its non prepayable fixed-rate debt into variable-rate debt. Under the interest rate swap contracts, WMC Resources agrees with other parties to exchange, at specified intervals, the difference between fixed-rate and floating-rate interest amounts, which is calculated based on an agreed-upon notional amount.
For the year ended December 31, 2001, WMC Resources recognized a net gain of A$Nil, which represented the ineffective portion of all of WMC Resources’ fair-value hedges. All components of each derivative’s gain or loss were included in the assessment of hedge effectiveness.
Cash Flow Hedges
WMC Resources’ sales are denominated in United States dollars. WMC Resources enters into foreign-exchange options and forward-exchange contracts as hedges of anticipated sales denominated in foreign currencies. WMC Resources enters into these contracts to protect itself against the risk that the eventual dollar-net-cash inflows resulting from direct-foreign-export sales will be adversely affected by changes in exchange rates.
As at December 31, 2001 WMC Resources recognized a net loss of A$4.6 million, representing the change in time value on certain of its forward contracts that had been excluded from the assessment of hedge effectiveness. A further net loss of A$6.6 million was recorded for the ineffective portion of certain options designated as cash flow hedges. In addition, WMC Resources has elected to mark to market certain foreign currency purchased call options, resulting in a net loss of A$5.6 million.
The revaluation of foreign currency debt which is not treated as a hedge for accounting purposes under US GAAP resulted in a net loss after tax of A$88.3 million
As of June 30, 2002, A$50.3 million of deferred net losses on derivative instruments accumulated in other comprehensive income are expected to be reclassified as earnings during the next twelve months.
The maximum term over which WMC Resources is hedging exposures to the variability of cash flows using derivative instruments for all forecasted transactions is nine years.
Subsequent gains and losses on cash flow hedges are taken to other comprehensive income and are reclassified to profit and loss in the same period the hedged transaction is recognized. Gains and losses on fair value hedges continue to be taken to profit and loss in subsequent periods, as offsetting gains and losses on hedged liabilities. In both cases, these gains and losses are not recognized under Australian GAAP until the hedged transaction is recognized.
FAS 133 requires that any component of the gain or loss which is deemed to be ineffective be taken to the Income Statement immediately. For Australian GAAP any ineffectiveness is recognized over the term of the derivative.
Hedges of Net Investments in Foreign Operations
WMC Resources has numerous investments in foreign subsidiaries. The net assets of these subsidiaries are exposed to volatility in currency exchange rates. WMC Resources uses foreign denominated debt to naturally hedge its exposure and measures ineffectiveness of such hedges based upon the change in spot foreign exchange rates. The treatment
-150-
| | QUANTITATIVE AND QUALITATIVE DISCLOSURES ABOUT MARKET RISK |
of this debt as a net investment hedge is consistent under both Australian GAAP and US GAAP. An amount of A$48.7 million has been credited to the foreign currency translation reserve, representing the decrease in fair value of this debt for the period.
Carrying amounts and estimated fair values of financial instruments
The carrying amounts and estimated fair values of the group’s financial instruments are as follows:
| | | A$ million
| |
| | | Carrying amount June 2002
| | | Fair value June 2002
| | | Carrying amount Dec 2001
| | | Fair value Dec 2001
| |
Recognized in the Balance Sheet | | | | | | | | | | | | |
Financial Assets | | | | | | | | | | | | |
| Cash assets | | 62.4 | | | 62.4 | | | 124.1 | | | 124.1 | |
| Current other financial assets | | 17.0 | | | 17.0 | | | 20.1 | | | 20.1 | |
| Current receivables | | 538.3 | | | 535.7 | | | 496.0 | | | 582.3 | |
| Non-current receivables | | 358.6 | | | 333.9 | | | 481.4 | | | 398.4 | |
| Non-current other financial assets | | 18.0 | | | 19.6 | | | 18.2 | | | 19.2 | |
Financial Liabilities | | | | | | | | | | | | |
| Current payables | | 452.2 | | | 471.1 | | | 855.2 | | | 855.6 | |
| Bank overdrafts | | — | | | — | | | 0.2 | | | 0.2 | |
| Short term interest bearing liabilities | | 467.6 | | | 467.6 | | | 584.1 | | | 584.1 | |
| Other current liabilities | | 20.3 | | | 20.3 | | | 15.1 | | | 15.1 | |
| Non-current payables | | 914.2 | | | 960.3 | | | 1,197.7 | | | 1,109.1 | |
| Long term interest bearing liabilities | | 1,633.4 | | | 1,685.7 | | | 1,737.7 | | | 1,755.8 | |
| Other non-current liabilities | | 2.8 | | | 2.8 | | | 9.3 | | | 9.3 | |
|
Financial Instruments | | | | | | | | | | | | |
| Hedging contracts: | | | | | | | | | | | | |
| – forward/swaps | | (476.1 | ) | | (567.1 | ) | | (816.5 | ) | | (729.2 | ) |
| – options | | (143.9 | ) | | (143.9 | ) | | (234.7 | ) | | (221.0 | ) |
| | |
|
| |
|
| |
|
| |
|
|
| | | (620.0 | ) | | (711.0 | ) | | (1,051.2 | ) | | (950.2 | ) |
The following methods and assumptions were used to estimate the fair value of each class of financial instruments for which it is practicable to estimate a value.
Cash assets and current other financial assets
The carrying amount approximates fair value because of the short maturity of these instruments.
Non-current other financial assets
The other investments are carried at cost. Shares quoted on a prescribed stock exchange are valued at the quoted market value at balance date.
Debtors and creditors
The fair value of debtors and creditors relating to hedging contracts have been calculated on a mark-to-market basis using forward prices. Other current debtors and creditors mainly represent financial obligations incurred in exchange for goods and services provided and received by the group in the normal course of its operations, net of provisions for doubtful debts. Due to the short term nature of these financial obligations, their carrying values are estimated to equal their fair values.
-151-
| | QUANTITATIVE AND QUALITATIVE DISCLOSURES ABOUT MARKET RISK |
Short and long term debt
The carrying value of short term debt and bank overdrafts is considered to approximate the fair value due to the short maturity of the debt. Long term debt comprises the Yankee bond issues. The fair value of the Yankee bond issues was determined on a mark-to-market basis. At June 30, 2002 the 1993 Yankee Bond market value was US$422.2 million or A$745.3 million (December 2001: US$412.9 million; A$807.5 million) and the 1996 Yankee Bond market value was US$407.5 million or A$719.4 million (December 2001: US$396.3 million; A$774.9 million).
Foreign currency and commodity hedging contracts
Carrying amounts for commodity and foreign currency hedging contracts are based on the revaluation of open contracts at June 30, 2002 against spot rates at that date. The fair value disclosed represents the same contracts on a mark-to-market basis using forward rates and prices.
Other Disclosures
Further disclosures relating to financial instruments are included in Notes 29 and 35 to the Combined Financial Statements.
Contribution of Hedging to results for six months ended 30 June 2002
Commodity hedging contributed a loss of A$3.4 million to the operating results. The total currency loss for the six months ended June 30, 2002 was A$65.2 million. The currency losses were attributable to forward contracts, implemented in prior periods and maturing in the six months ended 30 June 2002, at an average rate above the HSRA rate for the period.
Contribution of Hedging to results for 2001 year
Commodity hedging contributed a gain of A$66.1 million to the operating results. The total currency loss for the 12 months ended December 31, 2001 was A$328.1 million. The currency losses were attributable to forward contracts, implemented in prior periods and maturing in 2001, at an average rate above the HSRA rate for the period.
Contribution of Hedging to results for 2000 year
Commodity hedging contributed a loss of A$14.9 million to the operating results. The total currency loss for the 12 months was A$253.0 million. This was due to forward contracts implemented in prior periods and maturing in 2000 at an average rate above the HSRA rate for the period.
Contribution of Hedging to results for 1999 year
Commodity hedging contributed a gain of A$62.8 million to the operating results. The total currency loss for the 12 months was A$19.8 million. This was due to forward contracts implemented in prior periods and maturing in 1999 at an average rate above the HSRA rate for the period.
Contribution of Hedging to results for 1998 year
Commodity hedging contributed a gain of A$78.2 million to the operating results. The total currency loss for the 12 months was A$165.5 million. This was due to forward contracts implemented in prior periods and maturing in 1998 at an average rate above the HSRA rate for the period.
-152-
| | QUANTITATIVE AND QUALITATIVE DISCLOSURES ABOUT MARKET RISK |
Contribution of Hedging to results for six months ended December 31, 1997
Commodity hedging contributed a gain of A$38.9 million to the operating results. The total currency loss for the six months was A$17.4 million. This was due to forward contracts implemented in prior periods and maturing in the second half of 1997 at an average rate above the average HSRA rate for the six months ended December 31, 1997.
Contribution of Hedging to 1996-97 Results
Commodity hedging contributed a gain of A$35.2 million to the operating results. The total currency hedging gain for the year was A$82.0 million. This was due to forward contracts implemented in prior years and maturing in 1996-97 at an average rate below the average HSRA rate for 1996-97.
In management’s opinion, WMC Resources did not engage in any Price Risk Management transactions of a speculative nature during 2001, 2000, 1999, July 1, 1997 to December 31, 1998 and 1996-97.
Qualitative Information About Market Risk
Qualitative information on price risk management, and commodity and currency hedging, is included in the discussion above in Item 11 “Quantitative Information on Price Risk Management”. Qualitative information on treasury management and exchange rate and interest rate risk is discussed in Item 5B “Operating and Financial Review and Prospects – Liquidity and Capital Resources”.
-153-
| | DESCRIPTION OF SECURITIES OTHER THAN EQUITY SECURITIES |
| |
|
ITEM 12. DESCRIPTION OF SECURITIES OTHER THAN EQUITY SECURITIES
Description of WMC Resources American Depositary Receipts
ADRs are American Depositary Receipts. Each ADR is a certificate evidencing a specific number of ADSs. Each ADS will represent ownership interests in four ordinary WMC Resources shares (or the right to receive four ordinary WMC Resources shares) which will be deposited among the following three custodians, named below. Each ADS will also represent any other securities, cash or other property which may be held by The Bank of New York (the “Depositary”) under the deposit agreement. The Depositary’s office is located at 101 Barclay Street, New York, N.Y. 10286. The names and addresses of the custodians are:
National Australia Bank 271 Collins Street, Melbourne, VIC 3000 Australia | | Australia and New Zealand Banking Group Level 25, 530 Collins Street, Melbourne, Vic 3001 Australia | | Commonwealth Bank of Australia Level 6 48 Martin Place GPO Box 4122 Sydney, NSW 1030 Australia |
You may hold ADSs either directly (by having an ADR registered in your name) or indirectly through your broker or other financial institution. If you hold ADSs directly, you are an ADR holder. This description assumes you hold your ADSs directly. If you hold the ADSs indirectly, you must rely on the procedures of your broker or other financial institution to assert the rights of ADR holders described in this section. You should consult with your broker or financial institution to find out what those procedures are.
As an ADR holder, you will not be treated as a WMC Resources shareholder and you will not have shareholder rights, which are governed by Australian law. The Depositary will be the holder of the shares underlying your ADSs. You will have ADR holder rights. Those rights and the obligations of the Depositary are set out in a deposit agreement among WMC Resources, the Bank of New York and you, as an ADR holder. The deposit agreement and the ADRs are governed by New York law.
The following describes the material terms of the agreement. For more complete information, you should read the entire deposit agreement and the form of ADR. Copies of the deposit agreement are available at the office of the Depositary, at the address set out above.
Share Dividends and Other Distributions
How will you receive dividends and other distributions on the shares?
The Depositary has agreed to pay to you the cash dividends or other distributions it or the custodian receives on shares or other deposited securities, after deducting its fees and expenses. You will receive these distributions in proportion to the number of shares your ADSs represent.
Cash. The Depositary will convert any cash dividend or other cash distribution WMC Resources pays on the shares into U.S. dollars, if it can do so on a reasonable basis and can transfer the U.S. dollars to the United States. If that is not possible or if any approval from the Australian government is needed and can not be obtained, the agreement allows the Depositary to distribute the Australian dollars only to those ADR holders to whom it is possible to do so. It will hold the Australian dollars it cannot convert for
-154-
| | DESCRIPTION OF SECURITIES OTHER THAN EQUITY SECURITIES |
| |
|
the account of the ADR holders who have not been paid. It will not invest the Australian dollars and it will not be liable for any interest.
Before making a distribution the Depositary will deduct any withholding taxes that must be paid under Australian law. See “Additional Information – Taxation” on pages 135 to 140. It will distribute only whole U.S. dollars and cents and will round fractional cents to the nearest whole cent.
Shares. The Depositary may distribute additional ADSs representing any shares WMC Resources distributes as a dividend or free distribution, if WMC Resources furnishes it promptly with satisfactory evidence that it is legal to do so. The Depositary will only distribute whole ADSs. It will sell shares which would require it to issue a fractional ADS and distribute the net proceeds in the same way as it does with cash. If the Depositary does not distribute additional ADRs, each ADS will also represent the new shares.
Rights to purchase additional shares. If WMC Resources offers holders of WMC Resources securities any rights to subscribe for additional shares or any other rights, the Depositary may make these rights available to you. WMC Resources must first instruct the Depositary to do so and furnish it with satisfactory evidence that it is legal to do so. If WMC Resources does not furnish this evidence and give these instructions, and the Depositary decides it is practical to sell the rights, the Depositary will sell the rights and distribute the proceeds in the same way as it does with cash. The Depositary may allow rights that are not distributed or sold to lapse. In that case, you will receive no value for them.
If the Depositary makes rights available to you, it will exercise the rights and purchase the shares on your behalf. The Depositary will then deposit the shares and deliver ADSs to you. It will only exercise rights if you pay it the exercise price and any other charges the rights require you to pay.
U.S. securities laws may restrict transfers and cancellation of the ADSs represented by shares purchased upon exercise of rights. For example, you may not be able to trade these ADSs freely in the United States. In this case, the Depositary may deliver the ADSs under a separate restricted deposit agreement which will contain the same provisions as the deposit agreement, except for changes needed to put the necessary restrictions in place.
Other Distributions. The Depositary will send to you anything else WMC Resources distributes on deposited securities by any means it thinks is legal, fair and practical. If it cannot make the distribution in that way, the Depositary has a choice. It may decide to sell what WMC Resources distributed and distribute the net proceeds, in the same way as it does with cash. Or, it may decide to hold what WMC Resources distributed, in which case ADSs will also represent the newly distributed property.
The Depositary is not responsible if it decides that it is unlawful or impractical to make a distribution available to any ADR holders. WMC Resources has no obligation to register ADSs, shares, rights or other securities under the Securities Act. WMC Resources has no obligation to take any other action to permit the distribution of ADRs, shares, rights or anything else to ADR holders. This means that you may not receive the distributions WMC Resources makes on its shares or any value for them if it is illegal or impractical for WMC Resources to make them available to you.
Deposit, Withdrawal and Cancellation
How are ADSs issued?
The Depositary will deliver ADSs if you or your broker deposits shares or evidence of rights to receive shares with the custodian. Upon payment of its fees and expenses and of any taxes or charges, such as stamp taxes or stock transfer taxes or fees, the Depositary will register the appropriate number of ADSs in the names you request and will deliver the ADRs at its office to the persons you request.
-155-
| | DESCRIPTION OF SECURITIES OTHER THAN EQUITY SECURITIES |
| |
|
How do ADS holders cancel an ADR and obtain shares?
You may turn in your ADRs at the Depositary’s office. Upon payment of its fees and expenses and of any taxes or charges, such as stamp taxes or stock transfer taxes or fees, the Depositary will deliver (1) certificates representing the underlying shares and (2) any other deposited securities underlying the ADR at the office of the custodian. Or, at your request, risk and expense, the Depositary will deliver the Deposited Securities at its office.
Voting Rights
How do you vote?
When the Depositary receives a notice from WMC Resources fixing a record date for the determination of WMC Resources’ shareholders entitled to vote at a meeting, the Depositary will notify you of the upcoming vote and arrange to deliver the WMC Resources voting materials to you. The materials will (1) describe the matters to be voted on and (2) explain how you may instruct the Depositary to vote the shares or other deposited securities underlying your ADSs as you direct. For instructions to be valid, the Depositary must receive them on or before the date specified. The Depositary will try, as far as practical, subject to Australian law and the provisions of WMC Resources’ Constitution, to vote or to have its agents vote the shares or other deposited securities as you instruct. The Depositary will only vote or attempt to vote as you instruct.
WMC Resources cannot assure you that you will receive the voting materials in time to ensure that you can instruct the Depositary to vote your shares. In addition, the Depositary and its agents are not responsible for failing to carry out voting instructions or for the manner of carrying out voting instructions. This means that you may not be able to exercise your right to vote and there may be nothing you can do if your shares are not voted as you requested.
-156-
| | DESCRIPTION OF SECURITIES OTHER THAN EQUITY SECURITIES |
| |
|
Fees and Expenses
ADR holders must pay: | | For: |
|
| $5.00 (or less) per 100 ADSs | | Ÿ | | Each issuance of an ADR, including as a result of a distribution of shares or rights or other property |
|
| | | Ÿ | | Each cancellation of an ADR for the purpose of withdrawal, including if the deposit agreement terminates |
|
| A fee equivalent to the fee that would be payable upon deposit of Shares for issuance of ADSs | | Ÿ | | Distribution of the proceeds of a sale of rights distributed to holders of deposited securities pursuant to the deposit agreement which are distributed by the Depositary to ADR holders |
|
| Registration of transfer fees | | Ÿ | | Transfer and registration of shares on the share register of WMC Resources or foreign registrar from your name to the name of the Depositary or its agent when you deposit or withdraw shares |
|
| Expenses of the Depositary | | Ÿ | | Conversion of Australian dollars to U.S. Dollars |
|
| Expenses of the Depositary | | Ÿ | | Cable, telex and facsimile transmission expenses (as expressly provided in the deposit agreement) |
|
| Taxes and other governmental Charges the Depositary have to pay on any ADR or share underlying an ADR, for example, stock transfer taxes, stamp duty or withholding taxes | | Ÿ | | As necessary |
Payment of Taxes
The Depositary may deduct the amount of any taxes owed from any payments to you. It may also sell deposited securities, by public or private sale, to pay any taxes owed. You will remain liable if the proceeds of the sale are not enough to pay the taxes. If the Depositary sells deposited securities, it will, if appropriate, reduce the number of ADRs to reflect the sale and pay to you any proceeds, or send to you any property, remaining after it has paid the taxes.
Reclassifications, Recapitalizations and Mergers
If WMC Resources:
| | Ÿ | | reclassifies, splits up or consolidates any of the deposited securities; or |
| | Ÿ | | recapitalizes, reorganizes, merges, liquidates, sells all or substantially all of its assets, or takes any similar action, |
| | Ÿ | | the cash, shares or other securities received by the Depositary will in the Depositary’s discretion, with WMC Resources’s approval, become deposited securities. Each ADR will automatically represent its equal share of the new deposited securities; and |
| | Ÿ | | the Depositary may issue new ADRs or ask you to surrender your outstanding ADRs in exchange for new ADRs identifying the new deposited securities. |
-157-
| | DESCRIPTION OF SECURITIES OTHER THAN EQUITY SECURITIES |
| |
|
Amendment and Termination
How may the deposit agreement be amended?
WMC Resources may agree with the Depositary to amend the Deposit Agreement and the ADRs without your consent for any reason. If the deposit amendment adds or increases fees or charges, except for taxes and other governmental charges or certain expenses of the Depositary, or prejudices a substantial right of ADR holders, it will only become effective three months after the Depositary notifies you of the amendment. At the time an amendment becomes effective, you are considered, by continuing to hold your ADR, to agree to the amendment and to be bound by the ADRs and the deposit agreement as amended.
How may the Deposit Agreement be terminated?
The Depositary will terminate the deposit agreement if WMC Resources asks it to do so. The Depositary may also terminate the deposit agreement if the Depositary has told WMC Resources that it would like to resign and WMC Resources has not appointed a new depositary bank within 60 days. In both cases, the Depositary must notify you at least 30 days before termination.
After termination, the Depositary and its agents will do the following under the deposit agreement but nothing else: (1) advise you that the agreement is terminated, (2) collect distributions on the deposited securities, and (3) deliver shares and other deposited securities upon cancellation of ADRs. One year after termination, the Depositary may sell any remaining deposited securities by public or private sale. After that, the Depositary will hold the money it received on the sale, as well as any other cash it is holding under the agreement for the pro rata benefit of the ADR holders that have not surrendered their ADRs. It will not invest the money and has no liability for interest. The Depositary’s only obligations will be to account for the money and other cash. After termination WMC Resources’s only obligations will be to indemnify the Depositary for certain losses and to pay certain amounts to the Depositary.
Limitations On Obligations and Liability
The deposit agreement expressly limits WMC Resources’s obligations and the obligations of the Depositary. It also limits WMC Resources’s liability and the liability of the Depositary. WMC Resources and the Depositary
| | • | | are only obligated to take the actions specifically set forth in the deposit agreement without negligence or bad faith; |
| | • | | are not liable if either of them is prevented or delayed by law or circumstances beyond their control from performing their obligations under the deposit agreement; |
| | • | | are not liable if either of them exercises discretion permitted under the deposit agreement; |
| | • | | have no obligation to become involved in a lawsuit or other proceeding related to the ADRs or the deposit agreement on your behalf or on behalf of any other party unless they are indemnified against any expense or liability in terms satisfactory to them; |
| | • | | may rely upon any documents they believe in good faith to be genuine and to have been signed or presented by the proper party. |
In the deposit agreement, WMC Resources and the Depositary agree to indemnify each other under certain circumstances.
-158-
| | DESCRIPTION OF SECURITIES OTHER THAN EQUITY SECURITIES |
| |
|
Requirements for Depositary Actions
Before the Depositary will deliver or register a transfer of an ADR, make a distribution on an ADR, or permit withdrawal of shares, the Depositary may require:
| | • | | payment of stock transfer or other taxes or other governmental charges and transfer or registration fees charged by third parties for the transfer of any shares or other deposited securities; |
| | • | | satisfactory proof of the identity and genuineness of any signature or other information it deems necessary; and |
| | • | | compliance with regulations it may establish, from time to time, consistent with the agreement, including presentation of transfer documents. |
The Depositary may refuse to deliver ADRs or register transfers of ADRs generally when the transfer books of the Depositary, or WMC Resources are closed or at any time if the Depositary or WMC Resources thinks it advisable to do so.
Your Right to Receive the Shares Underlying your ADRs
You have the right to cancel your ADRs and withdraw the underlying shares at any time except:
| | • | | When temporary delays arise because: (i) the Depositary or WMC Resources has closed its transfer books; (ii) the transfer of shares is blocked to permit voting at a shareholders’ meeting; or (iii) WMC Resources is paying a dividend on the shares. |
| | • | | When you or other ADR holders seeking to withdraw shares owe money to pay fees, taxes and similar charges. |
| | • | | When it is necessary to prohibit withdrawals in order to comply with any laws or governmental regulations that apply to ADRs or to the withdrawal of shares or other deposited securities. |
The right of withdrawal may not be limited by any other provision of the deposit agreement.
Pre-Release Of ADRs
In certain circumstances, the Depositary may deliver ADRs before deposit of the underlying shares. This is called a pre-release of the ADR. the Depositary may also deliver shares upon cancellation of pre-released ADRs (even if the ADRs are canceled before the pre-release transaction has been closed out). A pre-release is closed out as soon as the underlying shares are delivered to the Depositary. the Depositary may receive ADRs instead of shares to close out a pre-release. the Depositary may pre-release ADRs only under the following conditions: (1) before or at the time of the pre-release, the person to whom the pre-release is being made must represent to the Depositary in writing that it or its customer owns the shares or ADRs to be deposited; (2) the pre-release must be fully collateralized with cash or other collateral that the Depositary considers appropriate; (3) the Depositary must be able to close out the pre-release on not more than five (5) business days’ notice; and (4) be subject to further indemnities and credit regulations as the Depositary deems appropriate. In addition, the Depositary will limit the number of ADSs that may be outstanding at any time as a result of pre-release, although the Depositary may disregard the limit from time to time, if it thinks it is appropriate to do so.
-159-
| | DESCRIPTION OF SECURITIES OTHER THAN EQUITY SECURITIES |
| |
|
PART II
ITEM 13. DEFAULTS, DIVIDEND ARREARAGES AND DELINQUENCIES
Not applicable.
ITEM 14. MATERIAL MODIFICATIONS TO THE RIGHTS OF SECURITY HOLDERS AND USE OF PROCEEDS
Not applicable.
Reserved for future use by the SEC.
Reserved for future use by the SEC.
-160-
PART III
ITEM 17. FINANCIAL STATEMENTS
Not applicable, as Item 18 complied with.
ITEM 18. FINANCIAL STATEMENTS
Financial Statements and Financial Statement Schedules
Combined Financial Statements as of and for the year ended December 31, 2001.
The attached financial statements and financial statement schedules, pages F-1-F-77, with a full index on page F-3, together with the Reports of Independent Accountants thereon, are filed as part of this registration statement.
| Report of Independent Accountants | | F-2 |
| Combined Balance Sheets | | F-5 |
| Combined Statements of Income, Comprehensive Income & Members’ Equity | | F-4 |
| Combined Statements of Cash Flows | | F-6 |
| Notes to Combined Financial Statements | | F-9 |
Unaudited Combined Financial statements as of and for the six months ended June 20, 2002.
The attached financial statements and financial statement schedules, pages F-1-F-38, with a full index on page F-2, together with the Reports of Independent Accountants thereon, are filed as part of this registration statement.
| Combined Balance Sheets | | F-4 |
| Combined Statements of Income, Comprehensive income and Members’ Equity | | F-3 |
| Combined Statements of Cash Flows | | F-5 |
| Notes to Combined Financial Statements | | F-7 |
Unaudited ProForma Combined Financial Statements
The attached proforma combined financial statements and statement schedules pages P1-P12, with a full index on page P2, are filed as part of this registration statement.
-161-
WMC RESOURCES LTD
(Australian Business Number 76 004 184 598)
AND CONTROLLED ENTITIES
U.S. FINANCIAL REPORT
AS OF AND FOR THE YEAR ENDED
31 DECEMBER 2001
Prepared in accordance
with Australian generally accepted
accounting principles (Australian GAAP)
except where noted
Amounts are stated in Australian dollars (A$) except where noted
F-1
REPORT OF INDEPENDENT ACCOUNTANTS
To the Board of Directors of
WMC Resources Ltd
We have audited the accompanying combined balance sheets of WMC Resources Ltd and its controlled entities, a carved-out business of WMC Limited (as described in Note 1 to the combined financial statements), as of 31 December 2001 and 2000, and the related combined statements of income and comprehensive income, combined statements of cash flows and combined statements of changes in shareholders’ equity for the years ended 31 December 2001, 2000 and 1999. These combined financial statements are the responsibility of the Company’s management. Our responsibility is to express an opinion on these financial statements based on our audits. We conducted our audits in accordance with generally accepted auditing standards in Australia and the United States of America. Those standards require that we plan and perform the audits to obtain reasonable assurance about whether the financial statements are free of material misstatement. An audit includes examining, on a test basis, evidence supporting the amounts and disclosures in the financial statements. An audit also includes assessing the accounting principles used and significant estimates made by management, as well as evaluating the overall financial statement presentation. We believe that our audits provide a reasonable basis for our opinion.
In our opinion, the combined financial statements referred to above present fairly, in all material respects, the financial position of WMC Resources Ltd and its controlled entities at 31 December 2001 and 2000 and the results of their operations and cash flows for the years ended 31 December 2001, 2000 and 1999, in conformity with accounting principles generally accepted in Australia.
Accounting principles generally accepted in Australia vary in certain significant respects from accounting principles generally accepted in the United States of America. The application of accounting principles generally accepted in the United States of America would have affected the determination of combined shareholders’ equity and financial position as of 31 December 2001 and 2000 and the determination of combined results of operations for the years ended 31 December 2001, 2000 and 1999, to the extent summarised in Note 44 to the combined financial statements.
PricewaterhouseCoopers Chartered Accountants | | Melbourne, Australia December 2, 2002 |
F-2
WMC RESOURCES LTD AND CONTROLLED ENTITIES
Combined Financial Statements as of and for the year ended 31 December 2001
CONTENTS PAGE
|
|
| | 4 |
|
| | 5 |
|
| | 6 |
|
| | 8 |
|
1. | | | | 9 |
|
2. | | | | 19 |
|
3. | | | | 20 |
|
4. | | | | 22 |
|
4. | | | | 23 |
|
5. | | | | 23 |
|
6. | | | | 27 |
|
7. | | | | 29 |
|
8. | | | | 33 |
|
9. | | | | 33 |
|
10. | | | | 33 |
|
11. | | | | 33 |
|
12. | | | | 34 |
|
13. | | | | 34 |
|
14. | | | | 35 |
|
15. | | | | 35 |
|
16. | | | | 35 |
|
17. | | | | 35 |
|
18. | | | | 36 |
|
19. | | | | 38 |
|
20. | | | | 39 |
|
21. | | | | 39 |
|
22. | | | | 40 |
|
23. | | | | 41 |
|
24. | | | | 41 |
|
25. | | | | 41 |
|
26. | | | | 41 |
|
27. | | | | 42 |
|
28. | | | | 43 |
|
29. | | | | 43 |
|
30. | | | | 43 |
|
31. | | | | 43 |
|
32. | | | | 44 |
|
33. | | | | 44 |
|
34. | | | | 45 |
|
35. | | | | 46 |
|
36. | | | | 54 |
|
37. | | | | 57 |
|
38. | | | | 58 |
|
39. | | | | 60 |
|
40. | | | | 62 |
|
41. | | | | 64 |
|
42. | | | | 65 |
|
43. | | | | 66 |
|
44. | | | | 67 |
|
45. | | | | 75 |
|
46. | | | | 76 |
|
| | 77 |
F-3
WMC RESOURCES LTD AND CONTROLLED ENTITIES
COMBINED STATEMENTS OF INCOME AND COMPREHENSIVE INCOME (Millions of dollars except per share amounts)
| | | Notes
| | | Year to 31 Dec 2001 A$
| | | Year to 31 Dec 2000 A$
| | | Year to 31 Dec 1999 A$
| |
Continuing Operations: | | | | | | | | | | | | |
Net sales revenue | | 2 | | | 2,364.1 | | | 2,666.0 | | | 1,672.7 | |
| Cost of goods sold | | | | | (1,878.7 | ) | | (1,672.0 | ) | | (1,213.5 | ) |
| Selling and distribution | | | | | (163.4 | ) | | (147.4 | ) | | (97.2 | ) |
| General and administrative | | | | | (224.1 | ) | | (192.3 | ) | | (278.4 | ) |
| General and administrative - exceptional items | | 4 | | | (92.5 | ) | | (17.8 | ) | | (39.2 | ) |
| Exploration and evaluation | | | | | (71.9 | ) | | (60.8 | ) | | (57.2 | ) |
| Other expenses | | | | | (64.2 | ) | | (71.9 | ) | | (19.7 | ) |
| Other income | | 2 | | | 202.6 | | | 240.7 | | | 101.3 | |
| Other income - exceptional items | | 4 | | | — | | | 38.0 | | | 18.0 | |
| | | | | |
|
| |
|
| |
|
|
Profit before interest and income tax | | | | | 71.9 | | | 782.5 | | | 86.8 | |
| Interest expense | | 3 | (b) | | (295.2 | ) | | (300.4 | ) | | (163.4 | ) |
| | | | | |
|
| |
|
| |
|
|
| (Loss)/profit before income taxes | | | | | (223.3 | ) | | 482.1 | | | (76.6 | ) |
| Income tax credit/(expense) | | 5 | (a) | | 65.8 | | | (154.9 | ) | | 70.9 | |
| | | | | |
|
| |
|
| |
|
|
Net (Loss)/Profit from continuing operations | | | | | (157.5 | ) | | 327.2 | | | (5.7 | ) |
| | | | | |
|
| |
|
| |
|
|
Discontinued Operations: | | | | | | | | | | | | |
Net sales revenue | | 2 | | | 452.9 | | | 426.0 | | | 422.1 | |
| Net expenses | | | | | (395.3 | ) | | (339.5 | ) | | (321.8 | ) |
| Income tax (expense) | | 5 | (a) | | (15.2 | ) | | (13.8 | ) | | (10.5 | ) |
Profit on disposal of gold operations (net of income tax benefit of $34.4 million in December 2001) | | 4 | | | 170.0 | | | — | | | — | |
Profit on disposal of Three Springs Talc operation (net of income tax benefit of $1.4 million at December 2001) | | 4 | | | 20.0 | | | — | | | — | |
Profit on disposal of equity interest in Mondo Minerals (net of income tax expense of $10.1 million in December 2001) | | 4 | | | 51.1 | | | — | | | — | |
| | | | | |
|
| |
|
| |
|
|
| Net profit from discontinued operations | | | | | 283.5 | | | 72.7 | | | 89.8 | |
| | | | | |
|
| |
|
| |
|
|
Combined Operations: | | | | | | | | | | | | |
Net sales revenue | | 2 | | | 2,817.0 | | | 3,092.0 | | | 2,094.8 | |
| Cost of goods sold | | | | | (2,232.4 | ) | | (1,953.5 | ) | | (1,484.5 | ) |
| Selling and distribution | | | | | (165.8 | ) | | (149.9 | ) | | (97.3 | ) |
| General and administrative | | | | | (252.7 | ) | | (217.8 | ) | | (302.3 | ) |
| General and administrative - exceptional items | | | | | (513.1 | ) | | (17.8 | ) | | (39.2 | ) |
| Exploration and evaluation | | | | | (95.1 | ) | | (79.8 | ) | | (72.1 | ) |
| Other expenses | | | | | (52.2 | ) | | (83.9 | ) | | (33.6 | ) |
| Other income | | 2 | | | 204.0 | | | 241.7 | | | 103.3 | |
| Other income - exceptional items | | | | | 635.2 | | | 38.0 | | | 18.0 | |
| | | | | |
|
| |
|
| |
|
|
Profit before interest and income tax | | | | | 344.9 | | | 869.0 | | | 187.1 | |
| Interest expense | | 3 | (b) | | (295.2 | ) | | (300.4 | ) | | (163.4 | ) |
| | | | | |
|
| |
|
| |
|
|
| (Loss)/profit before income taxes | | | | | 49.7 | | | 568.6 | | | 23.7 | |
| Income tax credit/(expense) | | 5 | (a) | | 76.3 | | | (168.7 | ) | | 60.4 | |
| | | | | |
|
| |
|
| |
|
|
Net profit attributable to holding company shareholders | | | | | 126.0 | | | 399.9 | | | 84.1 | |
| Foreign currency adjustments | | | | | (14.1 | ) | | (19.2 | ) | | (4.3 | ) |
| | | | | |
|
| |
|
| |
|
|
Total changes in equity other than those resulting from transactions with owners as owners | | | | | 111.9 | | | 380.7 | | | 79.8 | |
| | | | | |
|
| |
|
| |
|
|
| Net earnings per share attributable to holding company shareholders | | 6 | | | | | | | | | | |
| - Australian GAAP (basic) | | | | | 0.11 | | | 0.35 | | | 0.07 | |
| - Australian GAAP (diluted) | | | | | 0.12 | | | 0.35 | | | 0.08 | |
| | | | | | | | | | | | | |
The accompanying notes form part of these combined financial statements.
F-4
WMC RESOURCES LTD AND CONTROLLED ENTITIES
(Millions of dollars) | | | | | | |
| | | | | As at 31 December
|
| | | | | 2001
| | 2000
|
| | | Notes
| | A$
| | A$
|
CURRENT ASSETS | | | | | | |
| Cash assets | | 8 | | 124.1 | | 62.3 |
| Receivables | | 9 | | 496.0 | | 690.9 |
| Other financial assets | | 10 | | 20.1 | | 11.9 |
| Inventories | | 11 | | 410.2 | | 456.2 |
| Other | | 12 | | 230.5 | | 224.9 |
| | | | |
| |
|
Total current assets | | | | 1,280.9 | | 1,446.2 |
| | | | |
| |
|
|
NON-CURRENT ASSETS | | | | | | |
| Receivables | | 13 | | 481.4 | | 601.0 |
| Investments in associates/jointly controlled entities | | 14 | | — | | 60.5 |
| Other financial assets | | 15 | | 18.2 | | 26.9 |
| Inventories | | 16 | | 82.4 | | 85.1 |
| Exploration and evaluation | | 17 | | 64.5 | | 33.7 |
| Property, plant and equipment | | 18 | | 4,775.3 | | 5,193.0 |
| Deferred tax assets | | 19 | | 303.7 | | 181.8 |
| Other | | 20 | | 1,236.5 | | 968.8 |
| | | | |
| |
|
Total non-current assets | | | | 6,962.0 | | 7,150.8 |
| | | | |
| |
|
TOTAL ASSETS | | | | 8,242.9 | | 8,597.0 |
| | | | |
| |
|
|
CURRENT LIABILITIES | | | | | | |
| Payables | | 21 | | 855.2 | | 658.1 |
| Interest bearing liabilities | | 22 | | 584.3 | | 364.1 |
| Current tax liabilities | | 23 | | 8.0 | | 4.7 |
| Provisions | | 24 | | 74.7 | | 61.7 |
| Other | | 25 | | 15.1 | | 66.9 |
| | | | |
| |
|
Total current liabilities | | | | 1,537.3 | | 1,155.5 |
| | | | |
| |
|
|
NON-CURRENT LIABILITIES | | | | | | |
| Payables | | 26 | | 1,197.7 | | 1,126.5 |
| Interest bearing liabilities | | 27 | | 1,737.7 | | 2,580.2 |
| Deferred tax liabilities | | 28 | | 434.6 | | 412.5 |
| Provisions | | 29 | | 97.0 | | 107.0 |
| Other | | 30 | | 9.3 | | 78.0 |
| | | | |
| |
|
Total non-current liabilities | | | | 3,476.3 | | 4,304.2 |
| | | | |
| |
|
TOTAL LIABILITIES | | | | 5,013.6 | | 5,459.7 |
| | | | |
| |
|
| Minority shareholders’ interest in subsidiaries | | 32 | | 9.0 | | 13.5 |
| | | | |
| |
|
NET ASSETS | | | | 3,220.3 | | 3,123.8 |
| | | | |
| |
|
|
EQUITY | | 31 | | 3,220.3 | | 3,123.8 |
| | | | |
| |
|
|
Commitments | | 38 | | | | |
Contingent liabilities and gains | | 37 | | | | |
The accompanying notes form part of these combined financial statements.
F-5
WMC RESOURCES LTD AND CONTROLLED ENTITIES
COMBINED STATEMENTS OF CASH FLOWS (Millions of dollars)
| | | Notes
| | Year to 31 Dec 2001 A$
| | | Year to 31 Dec 2000 A$
| | | Year to 31 Dec 1999 A$
| |
CASH FLOWS FROM OPERATING ACTIVITIES | | | | | | | | | | | |
| Receipts from customers | | | | 2,981.0 | | | 3,030.2 | | | 1,965.6 | |
| Payments to suppliers and employees | | | | (2,212.7 | ) | | (1,904.9 | ) | | (1,606.2 | ) |
| Receipts from early close out of gold hedging book in 1998 | | | | — | | | 7.9 | | | 10.4 | |
| Interest and other items of a similar nature received | | | | 51.5 | | | 88.0 | | | 46.9 | |
| Borrowing costs | | | | (204.9 | ) | | (246.2 | ) | | (179.4 | ) |
| Proceeds from interest rate swap close out | | | | 11.7 | | | — | | | — | |
| Income taxes paid | | | | (6.7 | ) | | (5.9 | ) | | 0.4 | |
| Proceeds from insurance claims | | | | 34.3 | | | 1.3 | | | — | |
| Payments for: | | | | | | | | | | | |
| -exploration (grassroots) | | | | (57.2 | ) | | (51.2 | ) | | (48.2 | ) |
| -exploration (additional, supporting existing operations) | | | | (19.3 | ) | | (21.1 | ) | | (24.6 | ) |
| | | | |
|
| |
|
| |
|
|
Net cash provided by operating activities | | 33(a) | | 577.7 | | | 898.1 | | | 164.9 | |
| | | | |
|
| |
|
| |
|
|
|
CASH FLOWS FROM INVESTING ACTIVITIES | | | | | | | | | | | |
| Payments for property, plant and equipment | | | | (426.8 | ) | | (436.0 | ) | | (914.8 | ) |
| Government contributions towards infrastructure assets | | | | — | | | — | | | 18.0 | |
| Proceeds from return of capital in associates | | | | — | | | — | | | 19.8 | |
| Proceeds from sale of St Ives and Agnew gold operations | | | | 432.0 | | | — | | | — | |
| Proceeds from sale of Three Springs Talc operation | | | | 56.0 | | | — | | | — | |
| Proceeds from sale of equity interest in Mondo Minerals | | | | 122.2 | | | — | | | — | |
| Proceeds from sale of investments | | | | 24.9 | | | 5.5 | | | 1.0 | |
| Proceeds from sale of non-current assets | | | | 64.2 | | | 32.5 | | | 260.3 | |
| Proceeds from insurance claims | | | | 23.6 | | | 17.1 | | | — | |
| Proceeds from gold hedge close out | | | | 21.7 | | | — | | | — | |
| Payments for short term investments | | | | (8.6 | ) | | (1.0 | ) | | (0.4 | ) |
| Payments for research and development | | | | — | | | (0.3 | ) | | (0.4 | ) |
| Payments for evaluation expenditure | | | | (4.9 | ) | | (8.5 | ) | | (8.2 | ) |
| Payment for purchase of Yakabindie Nickel Ltd | | | | (25.2 | ) | | — | | | — | |
| Payment for option to conduct feasibility study | | | | — | | | (28.6 | ) | | — | |
| | | | |
|
| |
|
| |
|
|
Net cash provided by/(used in) investing activities | | | | 279.1 | | | (419.3 | ) | | (624.7 | ) |
| | | | |
|
| |
|
| |
|
|
F-6
WMC RESOURCES LTD AND CONTROLLED ENTITIES
COMBINED STATEMENTS OF CASH FLOWS (Continued)
(Millions of dollars)
| | | Notes
| | Year to 31 Dec 2001 A$
| | | Year to 31 Dec 2000 A$
| | | Year to 31 Dec 1999 A$
| |
CASH FLOWS FROM FINANCING ACTIVITIES | | | | | | | | | | | |
| Deemed equity (distribution)/contribution | | 1(a) | | (15.4 | ) | | (471.2 | ) | | 123.7 | |
| Proceeds from borrowings | | | | 277.2 | | | 745.0 | | | 714.4 | |
| Repayments of borrowings | | | | (1,055.5 | ) | | (782.7 | ) | | (353.0 | ) |
| | | | |
|
| |
|
| |
|
|
Net cash (used in)/ provided by financing activities | | | | (793.7 | ) | | (508.9 | ) | | 485.1 | |
| | | | |
|
| |
|
| |
|
|
Net increase/(decrease) in cash held | | | | 63.1 | | | (30.1 | ) | | 25.3 | |
| Cash at the beginning of the financial year | | | | 58.4 | | | 75.8 | | | 51.6 | |
| Effects of exchange rate changes on foreign currency cash balances | | | | 2.4 | | | 12.7 | | | (1.1 | ) |
| | | | |
|
| |
|
| |
|
|
Cash at the end of the financial year | | (a) | | 123.9 | | | 58.4 | | | 75.8 | |
| | | | |
|
| |
|
| |
|
|
|
The accompanying notes form part of these combined financial statements | | | | | | | | | |
|
(a) Reconciliation of Cash | | | | | | | | | | | |
For the purposes of the combined statements of cash flows, cash represents cash on hand, at the bank and on short-term deposit (maturity of 3 months or less) less bank overdrafts: | | | | | | | | | | | |
|
Cash assets - US GAAP cash and cash equivalents | | 8 | | 124.1 | | | 62.3 | | | 76.6 | |
| | | | |
|
| |
|
| |
|
|
| Bank overdrafts | | 22 | | (0.2 | ) | | (3.9 | ) | | (0.8 | ) |
| | | | |
|
| |
|
| |
|
|
Australian GAAP cash and cash equivalents | | | | 123.9 | | | 58.4 | | | 75.8 | |
| | | | |
|
| |
|
| |
|
|
|
| The above statements differ from US GAAP in that under US GAAP bank overdrafts are not considered to be part of the net cash equivalents and so changes in bank overdrafts (net) would be included in cash flows from financing activities. In addition, payments for research and development would be included in cash flows from operating activities instead of investing activities. Refer to Note 44. |
F-7
WMC RESOURCES LTD AND CONTROLLED ENTITIES
COMBINED STATEMENTS OF CHANGES IN EQUITY (Millions of dollars)
| | | Year to 31 Dec 2001 A$
| | | Year to 31 Dec 2000 A$
| | | Year to 31 Dec 1999 A$
| |
| Equity at the beginning of the financial year | | 3,123.8 | | | 3,214.3 | | | 3,010.8 | |
| Net income | | 126.0 | | | 399.9 | | | 84.1 | |
| Other comprehensive income | | (14.1 | ) | | (19.2 | ) | | (4.3 | ) |
| Deemed equity contribution/(distribution) | | (15.4 | ) | | (471.2 | ) | | 123.7 | |
| | |
|
| |
|
| |
|
|
Equity at the end of the financial year | | 3,220.3 | | | 3,123.8 | | | 3,214.3 | |
| | |
|
| |
|
| |
|
|
The accompanying notes form part of these combined financial statements.
F-8
WMC RESOURCES LTD AND CONTROLLED ENTITIES
Notes to the Combined Financial Statements
1. SUMMARY OF SIGNIFICANT ACCOUNTING POLICIES
(a) BACKGROUND AND BASIS OF ACCOUNTING
BACKGROUND
WMC Resources Ltd and its controlled entities (“WMC Resources”) is principally engaged in the discovery, development, production, processing, and marketing of minerals and metals. WMC Resources produces nickel, copper, phosphate fertilizers, uranium oxide, gold and other minor by-products.
On 21 November 2001 WMC Limited, the parent entity of WMC Resources, announced a proposal to demerge WMC’s interest in Alcoa’s World Alumina and Chemicals business (AWAC) from its other mineral businesses and to combine as a separate entity all of its other businesses and operations that now comprise WMC Resources (the “demerger”). WMC Limited also announced its intention to distribute to its shareholders, all of its interest in WMC Resources through a scheme of arrangement and capital reduction and dividend.
Prior to effecting the demerger, through a series of transactions internal to the WMC Limited Group, WMC Resources acquired WMC Limited’s shares in the legal entities which held the copper/uranium and fertilizer businesses, WMC Finance Ltd, WMC Finance (USA) Ltd as well as WMC Limited’s exploration and development interests other than those relating to AWAC. Under Australian GAAP, all of these acquisitions were made at fair value in return for shares in WMC Resources. Under US GAAP, the internal transactions are accounted for at book value. To consummate the demerger, WMC Limited effected a capital reduction and dividend to its shareholders in an amount equivalent to the value of WMC Resources after the internal transfers were completed. The entitlement of WMC Limited’s shareholders to the capital reduction and dividend was ultimately satisfied in the demerger through the distribution to WMC Limited’s shareholders of shares in WMC Resources on a one-for-one basis.
BASIS OF ACCOUNTING
The accompanying combined financial statements have been prepared in accordance with Australian Accounting Standards and other mandatory professional reporting requirements. These standards and reporting requirements form part of generally accepted accounting principles in Australia (Australian GAAP). Where these principles differ from those generally accepted in the United States of America (US GAAP), reference is made by footnote. A reconciliation of the major differences between these principles and those applicable under US GAAP is included as Note 44.
The financial report is prepared in accordance with the historical cost convention. Unless otherwise stated, the accounting policies adopted are consistent with those of the previous year.
The combined financial statements are presented on a carve-out basis and include the statements of income and comprehensive income, balance sheets, changes in equity and cash flows of WMC Resources’ existing nickel businesses as at 31 December, 2001 and the copper/uranium and fertilizer businesses that were transferred to WMC Resources from WMC Limited in the demerger (“WMC Resources and controlled entities”). However, these historical combined financial statements do not reflect the acquisition of the above referred businesses (refer to Note 46). Also reported are the discontinued gold and talc operations of WMC sold during 2001 and 2002. These combined financial statements have been prepared from historical accounting records of the WMC Limited Group and present substantially all of the operations of the businesses that will be owned and operated by WMC Resources as if WMC Resources had been a separate economic entity inclusive of all of these businesses for all periods presented.
Changes to equity in the periods presented arise from net income or loss, other comprehensive income and other deemed contributions/distributions with WMC Limited. Deemed equity contributions/distributions represent the dividends received from AWAC, dividends paid and other capital transactions of WMC Limited net of cash retained by WMC Limited.
F-9
WMC RESOURCES LTD AND CONTROLLED ENTITIES
Notes to the Combined Financial Statements
1. SUMMARY OF ACCOUNTING POLICIES (Continued)
(a) BACKGROUND AND BASIS OF ACCOUNTING
WMC Limited uses a centralised approach to cash management and the financing of its operations through WMC Finance. As determined in the demerger proposal, WMC Resources acquired WMC Finance. Therefore the balance sheet includes all of the debt and the income statement includes the interest expense previously reported by the WMC Limited Group, as the debt was used exclusively to fund WMC Resources’ projects.
WMC Resources participated in WMC Limited’s centralised risk management function. As part of this activity, derivative financial instruments were utilized to manage risks generally associated with commodity, currency and interest rate market volatility. WMC Limited did not hold or issue derivative financial instruments for trading purposes. The historical balance sheets of WMC Resources reflect the associated asset and liability positions resulting from this activity because WMC Resources assumes WMC Limited’s derivative financial instruments through its acquisition of WMC Finance. The derivative financial instruments referred to were used exclusively to manage WMC Resources’ risks in the periods presented. The historical statements of operations and statements of cash flows reflect the related gains and losses arising from these instruments.
General corporate overhead related to corporate headquarters and common support divisions has been included in these results based on amounts incurred by WMC Limited less an amount that was solely applicable to the remaining businesses of WMC Limited. Management believes these assumptions are reasonable. Subsequent to the demerger, WMC Resources has performed these functions using its own resources or purchased services and is responsible for the costs and expenses associated with the management of a public corporation.
WMC Resources’ financial statements include the costs experienced by the WMC Limited pension and post-retirement benefit plans for those employees and retirees for whom WMC Resources will assume responsibility.
The preparation of financial statements in conformity with generally accepted accounting principles (“GAAP”) requires management to make estimates and assumptions that affect the reported amounts of assets and liabilities and disclosure of contingent assets and liabilities at the dates of the financial statements and the reported amounts of revenues and expenses during the reporting periods.
(b) CHANGES IN ACCOUNTING POLICY
Revaluation of Non-Current Assets
WMC Resources has applied revised AASB 1041 ‘Revaluation of Non-Current Assets’ for the first time from 1 January 2001 and, in accordance with the standard, has elected to apply the cost basis for non-current assets. This election has no financial effect in the current or prior periods.
(c) PRINCIPLES OF COMBINATION
The combined financial report is prepared for the economic entity, being WMC Resources Ltd (parent entity) and the entities it controls following the transfer of certain entities to WMC Resources as a result of the demerger (controlled entities). Australian GAAP defines entity widely including any legal, administrative or fiduciary arrangement. All material entities in the group are companies. In preparing the financial statements, the effects of all transactions between entities within the group are eliminated in full.
Where control of an entity is obtained during a financial year, its results are included in the combined statements of income from the date on which control commences. Where control of an entity ceases during a financial year, its results are included for that part of the year during which control existed.
Equity accounting is applied in respect of the group’s interest in the earnings and reserves of bodies corporate, including incorporated partnerships, which the group does not control, but in which it has an equity interest of generally between 20 and 50 per cent and significant influence or joint control.
WMC Resources does not use the cost method to account for any entities for which there is a greater than 20% ownership.
F-10
WMC RESOURCES LTD AND CONTROLLED ENTITIES
Notes to the Combined Financial Statements
1. SUMMARY OF ACCOUNTING POLICIES (Continued)
(d) FOREIGN CURRENCY TRANSLATION
Transactions
Foreign currency transactions are initially translated into Australian currency at the rate of exchange at the date of the transaction. The subsequent payment or receipt of funds relating to that transaction is translated at the rate applicable on the date of payment or receipt. Any such amounts outstanding at balance date are translated at the rate of exchange prevailing on the balance date.
Controlled foreign entities
Self-sustaining controlled entities which account in foreign currencies are translated into Australian currency using rates of exchange current at balance date for assets and liabilities, and actual or an average of rates ruling during the reporting period for revenues and expenses. All exchange gains and losses arising on these translations are taken to the foreign currency translation reserve as part of other comprehensive income.
The exchange gains and losses arising on those foreign currency borrowings (net of gains and losses on any related specific hedge contracts) which are designated as hedges of investments in self-sustaining controlled foreign entities are offset in the foreign currency translation reserve against the exchange gains and losses arising on the translation of the net assets of those entities. These circumstances represent an effective natural hedge.
For integrated foreign controlled entities, monetary assets and liabilities are translated into Australian currency at rates of exchange current at balance date, while non-monetary items and revenue and expense items are translated at exchange rates current when the transactions occurred. Exchange differences arising on translation are brought to account in the income statement.
(e) DERIVATIVE FINANCIAL INSTRUMENTS
WMC Resources uses derivative financial instruments to hedge natural exposures to commodity prices, exchange rates and interest rates. The instruments used include spot, forward, swap and option contracts. The following accounting policies are applied to both currency and commodity based derivatives.
Hedge contracts are accounted for in the same manner as the underlying transactions. For currency contracts hedging firmly committed sales, operating purchases or capital purchases, premiums on option contracts and discounts or premiums on entering into forward currency hedging contracts are deferred in other assets or other liabilities until the underlying transaction takes place. Unrealized or realized gains and losses on the hedging contracts are deferred in other assets or other liabilities until the underlying transaction takes place. When the underlying transaction takes place, gains, losses, premiums and discounts for the hedge contract are included in the cost of the applicable asset, or taken to profit and loss as part of sales revenue or costs.
For contracts hedging exposure to commodity prices, unrealized or realized gains and losses and premiums are deferred in other assets or other liabilities until the underlying transaction takes place. When the underlying transaction takes place, gains, losses and premiums for the hedge contact are taken to profit and loss as part of sales revenue.
For contracts hedging the interest rate component of debt instruments, gains and losses are recognised as adjustments to interest expense.
In the statement of cash flows, cash flows resulting from hedging contracts are included in the same category as the underlying transaction.
All contracts are designated as hedges of underlying transactions in the economic entity’s deal-recording systems. They are reviewed regularly to ensure that they are still effective as hedges. If a contract ceases to qualify as an effective hedge of an underlying transaction then all premiums, discounts, gains and losses relating to the hedge contract are immediately recognized in profit and loss. Any subsequent gains and losses which might occur due to market movements between the time the contract ceases to be an effective hedge and the time that it is closed out would be recognized in profit and loss as they occur. If a contract which is designated as a hedge of an underlying transaction is closed out, but the underlying transaction still exists, then recognition of any gains and losses on the contract is deferred until the underlying transaction occurs.
F-11
WMC RESOURCES LTD AND CONTROLLED ENTITIES
Notes to the Combined Financial Statements
1. SUMMARY OF ACCOUNTING POLICIES (Continued)
(f) FIXED AND DEFERRED ASSETS
Recoverable amount of non-current assets
Recoverable amounts of non-current assets are assessed based on undiscounted future net cash flows expected to be generated from the assets. Where net cash inflows are derived from a group of assets working together, recoverable amount is determined on the basis of the relevant group of assets. The values of assets are reviewed on an ongoing basis, and where the carrying amount exceeds recoverable amount, the carrying amounts of non-current assets are revalued downwards to the lower of their recoverable amount or market value.
Exploration and evaluation expenditure
Exploration and evaluation expenditure is written off as incurred, except when such costs are expected to be recouped through successful development and exploitation, or sale, of an area of interest. In addition exploration assets recognised on acquisition of an entity are carried forward provided that exploration and/or evaluation activities in the area have not yet reached a stage which permits a reasonable assessment of the existence or otherwise of economically recoverable reserves, and active and significant operations in relation to the area are continuing.
The expenditure carried forward when recovery is expected represents an accumulation of direct net exploration and evaluation costs incurred by or on behalf of WMC Resources and applicable indirect, in relation to separate areas of interest for which rights of tenure are current.
If it is established subsequently that economically recoverable reserves exist in a particular area of interest, resulting in the decision to develop a commercial mining operation, then in that year, the accumulated expenditure attributable to that area, to the extent that it does not exceed the recoverable amount for the area concerned, will be transferred to mine development. As such it will be subsequently amortised against production from that area. Any excess of accumulated expenditure over recoverable amounts will be written off to the income statement.
The carry forward of exploration expenditure prior to development is not consistent with US GAAP. Refer to Note 44(c) for the effect of any such expenditure.
Government facilities
These assets represent contributions towards the cost of power, water, road, railway and town service facilities owned by government or local authorities which are necessary to gain access to mineral reserves. Under US GAAP, these assets may be more appropriately described as ‘deferred costs’. These assets are amortised over the life of the related mining projects or the facility, whichever is less.
Mine properties and mine development
These assets represent the capital cost incurred on areas of interest for which it has been established, to the satisfaction of the directors subsequent to completion of a final feasibility study, that economically recoverable reserves exist.
Costs accumulated in respect of each area of interest represent direct and applicable indirect expenditure incurred by or on behalf of the relevant entity. Indirect expenditure principally consists of charges for depreciation of equipment used in development activities. The costs of successful exploration and evaluation and access and capital development are classified as mine development. Capital development for open pit mines includes both the initial pre-production removal of overburden and ongoing post-production waste removal. See below for further detail on post production waste removal. Capital development on underground mines includes expenditure on shaft sinking, declines, development and access drives and ventilation shafts. Utilities and facilities such as water, power and rail transport (where the Company is required to contribute to the capital cost but does not have title to the asset), pre-production administration and other costs for mineral properties are classified as mine properties. Amortization of these costs is provided separately for each mineral reserve or mine from the commencement of commercial production as follows:
| | (i) | | mine properties is calculated on a straight line basis over the estimated remaining life of those mines or the life of the specific asset, whichever is shorter; and |
| | (ii) | | mine development is calculated on a units-of-production basis over the proven and probable reserves included in the current mine plan. In order to calculate the amortization, the total costs of development, including net costs incurred to date and estimated future waste removal costs are totalled and divided by the total proven and probable reserves included in the current mine plan. Annual depletion is calculated based on the units of production during the period multiplied by the per-unit cost. |
F-12
WMC RESOURCES LTD AND CONTROLLED ENTITIES
Notes to the Combined Financial Statements
1. SUMMARY OF ACCOUNTING POLICIES (Continued)
(f) FIXED AND DEFERRED ASSETS (Continued)
Mine properties and mine development (Continued)
Mine lives are based on the period of time over which the reserves are planned to be extracted, generally between five years and a maximum of thirty years.
The costs of developing or constructing new property and plant include start-up and organisation costs that under US GAAP must be expensed as incurred. For the effect of this refer to Note 44(e).
Post-production waste removal
All costs of post-production waste removal (stripping) from open pit mines are accumulated, and deferred on the balance sheet as part of the total of Mine properties and mine development. These costs include the costs of drilling, blasting, loading and haulage of waste rock from the open pit to the waste pile. The costs are predominantly in the nature of payments to mining, blasting and other contracting companies or costs of internal labor and materials used in the process. These costs are amortized on a units-of-production basis, in accordance with the amortization policy set out for mine development at (ii) above. Based on the current mine plans, the deferred stripping asset would be expected to be extinguished during 2018 for Mount Keith and 2013 for the Harmony Mine at Leinster.
Amortization of post production waste removal costs is included in cost of goods sold in the income statement. Cash spent on waste removal is included in cash flow from investing activities for Australian GAAP in the cash flow statement, as compared to cash flow from operations for US GAAP.
As waste removal activities are an integral part of the mining operation, the deferred stripping asset is grouped with the other assets at the mine site or other level which represents the lowest level of separately identifiable cash flows in order to assess recoverable amount (see “recoverable amount of non-current assets”).
Under US GAAP, these costs are classified as part of Other non-current assets. For further details refer to Note 44 (l).
Property, plant and equipment
The cost of each item of property, plant and equipment is written off over its expected useful life to WMC Resources, in the establishment of which due regard is given to the life of the related area of interest. None of the lives exceed thirty years. Freehold land is not depreciated.
Assets which are depreciated or amortised on a basis other than over the life of the related area of interest typically have the following economic lives:
| Plant and machinery | | 5 - 30 years* |
| Motor vehicles and heavy mobile equipment - underground | | 4 years |
| - surface | | 5 years |
| Office furniture | | 8 years |
| Computers and other office equipment | | 5 years |
* Dependent on the life of related operation.
Certain major items of plant have significant components which suffer substantial wear and tear. These components are depreciated at an accelerated rate as they are overhauled and replaced on a cycle which exceeds one year but is significantly shorter than the life of the remainder of the plant of which they form a part. On overhaul, any remaining cost of the component is written off and the replacement is capitalised and depreciated over the effective life of the replacement.
Repairs and maintenance expenditures are charged to operations. Major improvements and replacements which increase productivity capacity or extend the useful life of an asset are capitalized in the respective asset class.
F-13
WMC RESOURCES LTD AND CONTROLLED ENTITIES
Notes to the Combined Financial Statements
1. SUMMARY OF ACCOUNTING POLICIES (Continued)
(f) FIXED AND DEFERRED ASSETS (Continued)
Research and development expenditure
Research and development expenditure is charged to income as incurred, except that when a regular evaluation of projects concludes that an individual project is expected beyond any reasonable doubt to recover its costs from subsequent use or disposal, the costs of the project for that and subsequent reporting periods are capitalized. Such deferred capital is amortized over the reporting periods which are expected to benefit from the project. In establishing this economic life due regard is given to the economic life of the related area of interest or, if this is not relevant, a maximum life of five years is applied.
The above policy is contrary to US GAAP, and the effect of this is shown in Note 44(a).
Acquisition of assets
On acquisition of some or all of the shares in another entity which consequently becomes a controlled entity, the identifiable net assets acquired are measured at their fair values.
Capitalisation of interest expense
For qualifying assets under construction, which are normally major projects and where development or construction necessarily requires a substantial period of time, interest expense directly attributable to the funds invested in the project are included as a capital cost during the period until substantially all the activities necessary to prepare the qualifying asset for its intended use or sale are complete. To the extent that additional funds have been borrowed for the purpose of, and are associated with the project, the interest rate used is that applicable to those funds. The interest rate for any funds utilized in excess of specific borrowings is the weighted average rate for all other borrowings. Capitalized interest expense costs are amortized (from the commencement of commercial production) over a period not exceeding the economic life of the projects, which are subject to a maximum of thirty years.
Capitalisation of internal use software
WMC Resources capitalizes the cost of external consultants and the business software acquired or developed for internal use (purchase of third party software e.g. SAP) where the project success is regarded as probable. The costs are amortized over the estimated useful life of the software. Capitalized software is assessed for impairment in accordance with the accounting policy noted in Note 1(f) “recoverable amount of non-current assets”.
(g) INVENTORIES
Stores
Stores represent consumable supplies and maintenance spares and are valued at weighted average cost. Provision is made for obsolescence.
Trading stocks and work in progress
Trading stocks represent all products which are in the form in which they are expected to be sold by the relevant business.
Work in progress, including ore stocks, consists of stocks on which further processing is required by, or on behalf of, the relevant business to convert them to trading stocks.
Work in progress, classified as non-current, relates to costs associated with ore on heap leach pads, or in broken ore stockpiles not expected to be processed into final product and realized through sale within twelve months from the balance sheet date.
Broken ore which is above a predetermined cut-off grade is stockpiled for future processing. The processing of this ore is contemplated within each current mine plan and is dependent on commodity prices and the life of the mine. Broken ore below the cut-off grade is also stockpiled, however the costs associated with this ore are expensed as incurred, as its future processing is uncertain. Costs associated with ongoing waste removal are treated in accordance with the accounting policy relating to mine properties and mine development.
Trading stocks and work in progress are valued at the lower of cost and net realizable value. Cost approximates weighted average cost and includes direct costs and an appropriate portion of fixed and variable direct overhead expenditure, including depreciation and amortization. Net realizable value is the amount estimated to be obtained from sale of the item of inventory in the normal course of business, less any anticipated costs to be incurred prior to its sale.
F-14
WMC RESOURCES LTD AND CONTROLLED ENTITIES
Notes to the Combined Financial Statements
1. SUMMARY OF ACCOUNTING POLICIES (Continued)
(h) PROVISIONS
Income tax
The provision for income taxes in WMC Resources’ combined financial statements has been determined on a separate-return basis. The liability method of tax-effect accounting is used, whereby the income tax expense for the year is matched with the accounting profit after allowance for permanent differences. The income tax effect of significant permanent differences on the tax expense for the year is set out in Note 5. Income tax set aside on cumulative timing differences is brought to account as either a provision for deferred income tax or an asset described as future income tax benefits at the rate of income tax applicable to the period in which the liability will become payable or the benefit will be received.
The future income tax benefit relating to tax losses is not carried forward as an asset unless the benefit can be regarded as being virtually certain of realization. The future income tax benefit relating to timing differences is not carried forward as an asset unless its realization is assured beyond any reasonable doubt.
Accounting for income taxes in Australia is substantially the same as prescribed under FAS109 ‘Accounting for Income Taxes’. US GAAP requires that all future income tax benefits are brought to account, but that a valuation allowance is raised against benefits unlikely to be recouped. These benefits and valuation allowances are disclosed in Note 5. Australian GAAP only allows future income tax benefits to be recognised where realization of the benefit is assured beyond any reasonable doubt. Furthermore, where these benefits comprise tax losses, the realization of these losses must be virtually certain for the benefit to be recognised (see Note (5b)). The effects on net income are similar.
Employee entitlements
(i) Wages and salaries, annual leave and sick leave
Liabilities for wages and salaries and annual leave are recognized, and are measured as the amount unpaid at the reporting date at current pay rates in respect of employee’s services up to that date.
(ii) Long service leave
Long service leave is an additional form of compensated leave to which Australian employees become entitled after a qualifying period of generally ten years of continuous service. It accrues to them at the rate of 1.3 weeks leave per year of service.
A liability for long service leave is recognized, and is measured as the present value of expected future payments to be made in respect of services provided by employees up to the reporting date. Consideration is given to expected future wages and salary levels, experience of employee departures and periods of service. Expected future payments are discounted using interest rates on national government securities with terms to maturity that match, as closely as possible, the estimated future cash outflows.
(iii) Superannuation
Prior to 27 July 2001, WMC Resources participated in the WMC Superannuation Fund. From 27 July 2001, all assets and liabilities of the WMC Superannuation Fund, future employer contributions and ongoing management of employees’ superannuation entitlements were transferred to the WMC Superannuation Plan, an independently managed sub-plan of the Plum Superannuation Fund.
WMC Resources does not account for excesses or shortfalls of the superannuation fund or plan assets over accrued membership benefits. Employer contributions to these funds are recognized as an operating cost. Further details and disclosure in accordance with US GAAP are provided in Note 39.
F-15
WMC RESOURCES LTD AND CONTROLLED ENTITIES
Notes to the Combined Financial Statements
1. SUMMARY OF ACCOUNTING POLICIES (Continued)
(h) PROVISIONS (continued)
Rehabilitation
Where practicable, rehabilitation is performed progressively and charged to costs as a part of normal activity. In addition, an assessment is made at each operation of the undiscounted cost at balance date of any future rehabilitation work which will be incurred as a result of currently existing circumstances and a provision is accumulated for this expenditure charged on a proportionate basis to production over the life of the operation or activity concerned, or where the applicable life concerned exceeds twenty years, on a proportionate basis to production on a twenty year basis (Olympic Dam - thirty year basis). The estimated cost of rehabilitation is re-assessed on a regular basis. Rehabilitation costs include reclamation costs, dismantling and removal costs, removal of foundations and roads, the clean up of polluted materials, and re-vegetation of areas affected by operations, and monitoring of sites. Any changes in estimates are dealt with on a prospective basis. The time when it will be appropriate to commence significant rehabilitation work varies at different operations from the next financial year to dates well in excess of twenty years time. Over that time there is a strong possibility that the obligations for, methods of performing, and costs of performing, the rehabilitation work might alter. The estimates therefore are subject to change.
(i) REVENUE RECOGNITION
Sales revenue is measured at the fair value of the consideration received, and is recognized when each of the following conditions are met:
| | (i) | | persuasive evidence of an arrangement exists, which is usually in the form of a contractual arrangement. |
| | (ii) | | title in the product has transferred to the buyer, which in most cases occurs when the product passes ships rail, at the port of loading. |
| | (iii) | | the seller’s price to the buyer is fixed or determinable. In the case of certain products sold by the company, including nickel concentrate, nickel matte and copper cathode, revenue is recognized on a provisional basis at the time of title transfer, based on prevailing market prices and contained metal, and is subject to final adjustment at the end of periods ranging from 30 to 90 days in most cases, for movements in market prices to the end of those periods. Revenue initially recognized is equal to the contained quantity of metal, measured at the forward price. At each subsequent period end date prior to final settlement, revenue is remeasured based on the prevailing forward price. Refer to note 2 for details of amounts of revenue recognized subject to final settlement. Revenue is considered determinable at the recognition point, due to the existence of an actively traded and widely quoted market on the London Metals Exchange for the relevant metals. Market prices are the only aspect of recognized revenue subject to material change at the time of recognition. Final sales prices are determined based on contained metal and the market price at the relevant quotation point stipulated in each contract, which is generally on or around the end of the settlement period. |
| | (iv) | | collectability is reasonably assured. |
(j) SHIPPING AND HANDLING COSTS
Operating costs include costs incurred for shipping and handling.
(k) PENSIONS
There are currently no Australian accounting standards concerned with the accounting for pension plans by employers other than an accounting standard relating to employee entitlements which requires the disclosure of certain information regarding defined benefit plans. The relevant disclosures required under this standard are made in Note 39.
Accounting and disclosure rules in the United States are embodied in FAS 87, “Employers’ Accounting for Pensions”, revised by FAS 132 “Employers Disclosures about Pensions and Other Post retirement Benefits”. An actuarial calculation of the status of the Australian defined benefit plan has been made as if WMC Resources complied with FAS 87 for US GAAP purposes from July 1, 1987. The effects of adopting FAS 87 and FAS 132 for US GAAP reconciliation purposes are disclosed in Notes 39 and 44.
F-16
WMC RESOURCES LTD AND CONTROLLED ENTITIES
Notes to the Combined Financial Statements
1. SUMMARY OF ACCOUNTING POLICIES (Continued)
(l) CURRENT ASSETS AND CURRENT LIABILITIES
For the purposes of balance sheet classification, assets and liabilities are categorised as “current” if they are expected to be realized in cash, sold or consumed, or liquidated, as the case may be, within WMC Resources’ normal operating cycle, which does not exceed one year for any activity.
(m) EARNINGS PER SHARE
To consummate the demerger, WMC Limited effected a capital reduction and dividend to its shareholders in an amount equivalent to the value of WMC Resources after the internal transfers were completed. The entitlement of WMC Limited’s shareholders to the capital reduction and dividend was ultimately satisfied in the demerger through the distribution to WMC Limited’s shareholders of shares in WMC Resources on a pro rata basis such that existing WMC Limited shareholders received one share in WMC Resources for every WMC Limited share owned. Therefore, the unaudited pro forma basic net earnings per share for the years ended 31 December, 2001, 2000, and 1999 has been computed by dividing net earnings for the periods then ended by the weighted average number of WMC Limited shares outstanding for the years then ended. The unaudited pro forma diluted earnings per share for the years ended 31 December 2001, 2000, and 1999 takes into effect the potential ordinary shares from the conversion of partly paid shares and options as disclosed in Note 6.
(n) INTEREST- BEARING LIABILITIES
Loans are carried at their principal amounts which represent the present value of future cash flows associated with servicing the debt. Interest is accrued over the period it becomes due and is recorded as part of other creditors.
(o) ROUNDING OF AMOUNTS
The company is of a kind referred to in Class Order 98/0100, issued by the Australian Securities & Investments Commission, relating to the ‘rounding off’ of amounts in the financial report. Amounts in the financial report have been rounded off in accordance with Class Order to the nearest million dollars.
(p) DISCONTINUED OPERATIONS
An operation is treated as a discontinued operation if the operation is a component of the group whose activities represent a separate major line of the business and the measurement date of a disposal is prior to the end of the reporting period. The measurement date of a disposal is the date on which the management having authority to approve the action commits itself to a formal plan to dispose of a segment of the business, whether by sale or abandonment.
During the year the following operations were disposed of:
Gold business unit
In the first quarter of 2001, the company decided to focus on its core portfolio of large low cost business in nickel, alumina, copper/uranium and fertilizer businesses. As a result, the company began a strategic evaluation of its options for the gold business. The plan was finalized on 19 September 2001 when a final decision was made to sell the gold business unit in its entirety, including Central Norseman Gold Corporation Limited, St Ives and Agnew Gold operations and the 56% interest in the Meliadine West Joint Venture (“Meliadine”).
The Group disposed of its gold operations except for its 50.48% controlling interest in Central Norseman Gold Corporation Limited (‘CNGC’) and its interest in Meliadine. A sale of the interest in Meliadine is expected during 2002. The sale of its controlling interest in CNGC was completed in January 2002 (refer to Note 46). CNGC and Meliadine were included as discontinued operations at 31 December 2001 because management had approved a formal plan to dispose of the sale prior to year end. CNGC had a carrying value of A$17.9 million at 31 December 2001 and its result for the year ended 31 December 2001 was a profit of A$6.6 million. Meliadine had a carrying value of A$33.2 million at 31 December 2001 and its result for year ended 31 December 2001 was a loss of A$5.8 million.
F-17
WMC RESOURCES LTD AND CONTROLLED ENTITIES
Notes to the Combined Financial Statements
1. SUMMARY OF ACCOUNTING POLICIES (Continued)
(p) DISCONTINUED OPERATIONS (Continued)
The company’s right to a royalty from the sale of the St Ives and Agnew Gold operations, was sold in June 2002 for a profit of $15.4 million.
The only remaining assets and liabilities relating to discontinued operations of Gold at the end of the year were :-
| | | $ million
|
| Current Assets | | 99.1 |
| Non-Current Assets | | 25.8 |
| | |
|
| Total Assets | | 124.9 |
| | |
|
| Current Liabilities | | 48.3 |
| Non-Current Liabilities | | 10.0 |
| | |
|
| Total Liabilities | | 58.3 |
| | |
|
| Net Assets | | 66.6 |
| | |
|
Upon completion of the sale of the interest in Meliadine, WMC Resources will have fully exited the gold mining business.
Talc (formed part of Other in the segment note)
Following a decision by the directors to exit the talc business and the receipt of an offer for the 50% equity interest in the Mondo Minerals Talc joint venture, the directors approved a resolution on 14 November 2000 to dispose of both the Mondo Minerals and Three Springs Talc businesses.
On 24 January 2001, WMC sold its equity interest in Mondo Minerals Talc joint venture for a profit of $51.1 million after tax. The sale received all the necessary regulatory approvals and the transaction was settled on 8 May 2001.
On 1 August 2001, WMC sold its Three Springs Talc operation for a profit of $20.0 million after tax. The sale received all the necessary regulatory approvals and the transaction was settled on 30 September 2001.
F-18
WMC RESOURCES LTD AND CONTROLLED ENTITIES
Notes to the Combined Financial Statements
| | | | | Notes
| | Year to 31 Dec 2001 A$
| | | Year to 31 Dec 2000 A$
| | | Year to 31 Dec 1999 A$
| |
2. | | | | | | | | | | | | | |
|
| | | Sales revenue from core operating activities: | | | | | | | | | | | |
| | | Sale of goods from continuing operations(1) | | | | 2,364.1 | | | 2,666.0 | | | 1,672.7 | |
| | | Sale of goods from discontinued operations | | | | 452.9 | | | 426.0 | | | 422.1 | |
| | | | | | |
|
| |
|
| |
|
|
| | | Net sales revenue | | 2(a) | | 2,817.0 | | | 3,092.0 | | | 2,094.8 | |
| | | | | | |
|
| |
|
| |
|
|
|
| | | Other income: | | | | | | | | | | | |
| | | Interest received/receivable | | 3(b) | | 153.5 | | | 152.1 | | | 84.4 | |
| | | Profit on disposal of non-current assets | | | | 10.6 | | | — | | | 1.1 | |
| | | Insurance proceeds | | | | 23.1 | | | 65.5 | | | 3.1 | |
| | | Other income | | | | 15.4 | | | 23.1 | | | 12.7 | |
| | | | | | |
|
| |
|
| |
|
|
| | | Other income from continuing operations | | | | 202.6 | | | 240.7 | | | 101.3 | |
| | | Other income from discontinued operations | | | | 1.4 | | | 1.0 | | | 0.6 | |
| | | Profit on sale of non-current assets-discontinued operations | | | | 319.3 | | | — | | | 1.4 | |
| | | | | | |
|
| |
|
| |
|
|
| | | Total other income | | | | 523.3 | | | 241.7 | | | 103.3 | |
| | | | | | |
|
| |
|
| |
|
|
|
| | | SUBTOTAL NET REVENUES | | | | 3,340.3 | | | 3,333.7 | | | 2,198.1 | |
|
| | | Proceeds from sale of non-current assets | | | | 685.9 | | | 70.1 | | | 30.1 | |
| | | Government contributions shown as exceptional item | | | | — | | | — | | | 18.0 | |
| | | Less profit on disposal of non-current assets | | | | (329.9 | ) | | — | | | (2.5 | ) |
| | | | | | |
|
| |
|
| |
|
|
| | | OPERATING REVENUE - AUS. GAAP | | | | 3,696.3 | | | 3,403.8 | | | 2,243.7 | |
| | | | | | |
|
| |
|
| |
|
|
|
| | | (a) Net sales revenue includes: | | | | | | | | | | | |
| | | Currency hedging losses | | | | (328.1 | ) | | (253.0 | ) | | (19.8 | ) |
| | | Commodity hedging gains/(losses) | | | | 66.1 | | | (14.9 | ) | | 62.8 | |
| | | | | | |
|
| |
|
| |
|
|
| | | | | | | (262.0 | ) | | (267.9 | ) | | 43.0 | |
| | | | | | |
|
| |
|
| |
|
|
Amounts included in revenue which were based on provisional pricing as described in accounting policy Note 1(i) were as follows:
Year
| | Amount
|
| 2001 | | A$60.5 million |
| 2000 | | A$138.6 million |
| 1999 | | A$82.7 million |
F-19
WMC RESOURCES LTD AND CONTROLLED ENTITIES
Notes to the Combined Financial Statements
Australian GAAP requires specific disclosure of certain items included in the calculation of income. This note does not include all costs. | | Notes
| | Year to 31 Dec 2001 A$
| | Year to 31 Dec 2000 A$
| | | Year to 31 Dec 1999 A$
| |
3. | | DISCLOSURES ABOUT ITEMS INCLUDED IN OPERATING INCOME/(LOSS) BEFORE INCOME TAX | | | | | | | | | | |
| | | | | | | | | | | |
|
| | | Operating Income/(Loss) before income tax includes the | | | | | | | | | | |
| | | following specific expenses: | | | | | | | | | | |
| | | Amortization and depreciation | | 3(a) | | 596.2 | | 510.8 | | | 406.0 | |
| | | Borrowing costs | | 3(b) | | 295.2 | | 300.4 | | | 163.4 | |
| | | Other charges against assets: | | | | | | | | | | |
| | | - bad debts written off/provided for | | | | — | | 3.4 | | | 2.8 | |
| | | - write down of inventories to net realizable value | | | | 7.7 | | 6.2 | | | 8.0 | |
| | | Stock written off | | | | 20.5 | | 17.4 | | | — | |
| | | Exploration expenditure written off: | | | | | | | | | | |
| | | - grassroots | | | | 57.2 | | 51.1 | | | 48.2 | |
| | | - supporting existing operations | | | | 19.3 | | 21.1 | | | 23.9 | |
| | | - evaluation | | | | 18.6 | | 7.6 | | | — | |
| | | Government royalties on sales or production | | | | 72.6 | | 83.2 | | | 43.2 | |
| | | Provision for: | | | | | | | | | | |
| | | - employee entitlements | | | | 22.2 | | 9.3 | | | 9.3 | |
| | | - rehabilitation | | | | 14.8 | | 12.7 | | | 8.9 | |
| | | - diminution in value of investments | | | | 0.2 | | 1.2 | | | (0.1 | ) |
| | | - obsolescence of stores | | | | 4.0 | | 3.8 | | | 1.0 | |
| | | Research and development written off | | | | 0.4 | | 1.4 | | | 3.1 | |
| | | Foreign exchange loss/(gain) | | | | 0.6 | | (2.5 | ) | | 2.9 | |
| | | Operating lease rentals | | | | 12.6 | | 16.3 | | | 15.3 | |
| | | | | | |
| |
|
| |
|
|
|
| (a) | | Amortization and depreciation | | | | | | | | | | |
| | | Amortization: | | | | | | | | | | |
| | | - government facilities | | | | 1.7 | | 1.3 | | | 0.9 | |
| | | - mine properties and mine development | | | | 248.3 | | 191.7 | | | 184.1 | |
| | | - goodwill/intangibles | | | | 16.1 | | 14.6 | | | 13.5 | |
| | | - research and development | | | | 1.7 | | (0.9 | ) | | 0.8 | |
| | | Depreciation: | | | | | | | | | | |
| | | - plant and equipment | | | | 301.2 | | 273.8 | | | 187.0 | |
| | | - land and buildings | | | | 27.2 | | 30.3 | | | 19.7 | |
| | | | | | |
| |
|
| |
|
|
| | | Total amortization and depreciation charged to profit | | | | 596.2 | | 510.8 | | | 406.0 | |
| | | | | | |
| |
|
| |
|
|
F-20
WMC RESOURCES LTD AND CONTROLLED ENTITIES
Notes to the Combined Financial Statements
| | | | | Notes
| | Year to 31 Dec 2001 A$
| | | Year to 31 Dec 2000 A$
| | | Year to 31 Dec 1999 A$
| |
3. | | DISCLOSURES ABOUT ITEMS INCLUDED IN OPERATING INCOME/(LOSS) BEFORE INCOME TAX (continued) | | | | | | | | | | | |
|
| (b) | | Borrowing costs | | | | | | | | | | | |
| | | Interest and finance charges paid/payable | | | | 295.2 | | | 325.3 | | | 225.3 | |
| | | Deferred to qualifying assets | | | | — | | | (24.9 | ) | | (61.9 | ) |
| | | | | | |
|
| |
|
| |
|
|
| | | Interest charged to income | | | | 295.2 | | | 300.4 | | | 163.4 | |
| | | | | | |
|
| |
|
| |
|
|
|
| | | Interest received/receivable | | | | | | | | | | | |
| | | - continuing operation | | 2 | | (153.5 | ) | | (152.1 | ) | | (84.4 | ) |
| | | - discontinued operations | | | | (0.8 | ) | | (0.2 | ) | | (0.4 | ) |
| | | | | | |
|
| |
|
| |
|
|
| | | Interest credited to income | | | | (154.3 | ) | | (152.3 | ) | | (84.8 | ) |
| | | | | | |
|
| |
|
| |
|
|
| | | Net charge to income | | | | 140.9 | | | 148.1 | | | 78.6 | |
| | | | | | |
|
| |
|
| |
|
|
|
| (c) | | Restructuring provisions | | | | | | | | | | | |
|
| During 2001, termination benefits in the amount of A$16.7 million net of tax were accrued and charged to expense. As at 31 December 2001, A$4.9 million remained as a provision yet to be paid. These costs were in relation to the restructuring of group services and the exploration functions. The costs have been classified as exceptional items in the income statement. |
|
| The number of employees terminated with the group services and exploration functions were 78 and 45 respectively. |
F-21
WMC RESOURCES LTD AND CONTROLLED ENTITIES
Notes to the Combined Financial Statements
| | | Notes
| | Year to 31 Dec 2001 A$
| | | Year to 31 Dec 2000 A$
| | | Year to 31 Dec 1999 A$
| |
| | | | | | | | | | | |
(a) Gains/(Charges) | | | | | | | | | | | |
|
Continuing Operations: | | | | | | | | | | | |
| Write off of assets and costs associated with the fire at Olympic Dam solvent extraction plant | | | | (71.8 | )(1) | | — | | | — | |
| Cost of redundancies and closure costs associated with the restructuring of the service and exploration functions | | | | (20.7 | ) | | — | | | — | |
| Profit on sale of tenements at Kambalda | | | | — | | | 20.2 | (3) | | — | |
| Government contribution to Fertilizer project | | | | — | | | — | | | 18.0 | |
| Write off of feasibility studies and other assets on initial acquisition of Queensland Fertilizer Project | | | | — | | | — | | | (25.4 | )(4) |
| Write-down of Yeelirrie carrying value reflecting conservatism about recoverability of future development | | | | — | | | — | | | (13.8 | )(5) |
| | | | |
|
| |
|
| |
|
|
| | | | | (92.5 | ) | | 20.2 | | | (21.2 | ) |
Discontinued Operations: | | | | | | | | | | | |
| Profit on disposal of St Ives and Agnew gold operations | | | | 238.8 | (2) | | — | | | — | |
| Cost of redundancies and closure costs associated with the restructuring of the service and exploration functions | | | | (0.8 | ) | | — | | | — | |
| Net loss on early termination of commodity and currency hedging associated with the gold business | | | | (103.2 | ) | | — | | | — | |
| Profit on disposal of Three Springs Talc Operation | | | | 18.6 | | | — | | | — | |
| Profit on disposal of equity interest in Mondo Minerals | | | | 61.2 | | | — | | | — | |
| | | | |
|
| |
|
| |
|
|
Exceptional items before income tax | | | | 122.1 | | | 20.2 | | | (21.2 | ) |
| | | | |
|
| |
|
| |
|
|
Income tax credits on: | | | | | | | | | | | |
| Write off of assets and costs associated with the fire at Olympic Dam solvent extraction plant | | | | 21.5 | (1) | | — | | | — | |
| Cost of redundancies and closure costs associated with the restructuring of the WMC service and exploration functions | | | | 4.8 | | | — | | | — | |
| Gain on disposal of St Ives and Agnew gold operations | | | | 3.4 | | | — | | | — | |
| Net loss on the early termination of commodity and currency hedging associated with the gold business | | | | 31.0 | | | — | | | — | |
| Gain on disposal of Three Springs Talc Operation | | | | 1.4 | | | — | | | — | |
| Gain on disposal of equity interest in Mondo Minerals | | | | (10.1 | ) | | — | | | — | |
| Profit on sale of tenements at Kambalda | | | | — | | | 3.6 | (3) | | — | |
| Write off of feasabilty studies and other assets on initial acquisition of Queensland Fertilizer Project | | | | — | | | — | | | 6.7 | (4) |
| Write-down of Yeelirrie carrying value | | | | — | | | — | | | 5.0 | (5) |
| | | | |
|
| |
|
| |
|
|
Income tax credit on above exceptional items: | | | | | | | | | | | |
-continuing operations | | | | 26.3 | | | 3.6 | | | 11.7 | |
-discontinued operations | | | | 25.7 | | | — | | | — | |
| | | | |
|
| |
|
| |
|
|
Gain/(Loss) on exceptional items after tax | | | | 174.1 | | | 23.8 | | | (9.5 | ) |
| | | | |
|
| |
|
| |
|
|
(b) Abnormal income tax items | | | | | | | | | | | |
| Reduction in net deferred tax liability due to change in rate for future years from 36% to 34% for 2000 and to 30% for subsequent years | | 5 | | — | | | — | | | 17.4 | |
| | | | |
|
| |
|
| |
|
|
(1) In late October 2001 the Copper/uranium business unit suffered a fire at the Olympic Dam facility which caused considerable damage to the copper and uranium solvent extraction circuits in the processing plant. The damaged plant required rebuilding and the carrying value of the impaired assets ($52.3 million) was written off as a part of exceptional items. The balance of the exceptional item for Olympic Dam was a further charge of $19.5 million incurred in relation to costs associated with lower production of copper and uranium.
F-22
WMC RESOURCES LTD AND CONTROLLED ENTITIES
Notes to the Combined Financial Statements
4. EXCEPTIONAL ITEMS (continued)
(2)An amount of $25 million is included in the profit on disposal relating to right to future royalties that did not comply with all the criteria under US GAAP for recognition in profit in 2001. Refer to Note 44.
(3)This transaction did not comply with all criteria under US GAAP for the full accrual of profit in 2000. Refer to Note 44.
(4)Queensland Phosphate Limited was acquired in 1980 as part of WMC Limited’s purchase of the BH South group of companies. The majority of the assets acquired was mine properties and related infrastructure. In 1999, before the commencement of production from the newly completed fertilizer plant at Phosphate Hill, a review of all the assets of the fertilizer business unit was undertaken to assess their recoverability. The review concluded that those assets relating to the original acquisition of QPL did not relate to the project as developed, and should be written-off.
(5)The Yeelirrie lease was written down to nil in 1999 as a result of economic review concluding the project was unviable at the current uranium prices.
| | | Notes
| | Year to 31 Dec 2001 A$
| | | Year to 31 Dec 2000 A$
| | | Year to 31 Dec 1999 A$
| |
| | | | | | | | | | | |
(a) Pre-tax operating income/(loss) (Loss)/income from continuing operations | | | | (223.3 | ) | | 482.1 | | | (76.6 | ) |
| Income from discontinued operations | | | | 57.6 | | | 86.5 | | | 100.3 | |
| Gain on disposal of discontinued operations | | | | 215.4 | | | — | | | — | |
| | | | |
|
| |
|
| |
|
|
| Pre-tax operating income | | | | 49.7 | | | 568.6 | | | 23.7 | |
| | | | |
|
| |
|
| |
|
|
Prima facie tax expense for the period at the rate of 30% | | | | | | | | | | | |
(2000: 34% and 1999: 36%) | | | | (14.9 | ) | | (193.3 | ) | | (8.5 | ) |
The following tax effect on these items caused the total charge for income tax to vary from the above: | | | | | | | | | | | |
| Investment and development allowances | | | | — | | | 0.3 | | | 48.0 | |
| Research and development | | | | 0.9 | | | 0.5 | | | 0.4 | |
| Exchange gains from return of capital | | | | 2.3 | | | — | | | — | |
| Non-taxable capital gains | | | | 12.4 | | | 7.3 | | | — | |
| Depreciation and amortization | | | | 0.4 | | | (1.9 | ) | | (1.8 | ) |
| Non-deductible expenses | | | | (2.2 | ) | | (4.0 | ) | | (1.2 | ) |
| Non-deductible goodwill | | | | — | | | — | | | (2.4 | ) |
| Future income tax benefits movements | | | | 69.5 | | | 5.8 | | | 0.4 | |
| Variance between Australian and foreign tax rates | | | | 0.8 | | | (1.8 | ) | | (5.8 | ) |
| Withholding tax | | | | — | | | (2.2 | ) | | (1.5 | ) |
| Reduction in net deferred tax liability due to change in tax rate | | | | — | | | — | | | 17.4 | |
| Exempt income | | | | 1.6 | | | 1.2 | | | 0.9 | |
| | | | |
|
| |
|
| |
|
|
| Income tax credit/(expense) for the period | | | | 70.8 | | | (188.4 | ) | | 45.9 | |
| Adjustment for over provision in prior years | | | | 5.5 | | | 19.4 | | | 14.5 | |
| | | | |
|
| |
|
| |
|
|
Total income tax credit/(expense) | | | | 76.3 | | | (168.7 | ) | | 60.4 | |
| | | | |
|
| |
|
| |
|
|
| Income tax credit/(expense) comprises: | | | | | | | | | | | |
Continuing Operations: | | | | | | | | | | | |
| – Normal | | | | 39.5 | | | (158.5 | ) | | 41.8 | |
| – Exceptional-gains and losses | | 4 | | 26.3 | | | 3.6 | | | 11.7 | |
| – Exceptional-change in tax rate | | 4 | | — | | | — | | | 17.4 | |
| | | | |
|
| |
|
| |
|
|
| | | | | 65.8 | | | (154.9 | ) | | 70.9 | |
| | | | |
|
| |
|
| |
|
|
Discontinued Operations: | | | | | | | | | | | |
| – Normal | | | | (15.2 | ) | | (13.8 | ) | | (10.5 | ) |
| – Exceptional-gains and losses | | 4 | | 25.7 | | | — | | | — | |
| | | | |
|
| |
|
| |
|
|
| | | | | 10.5 | | | (13.8 | ) | | (10.5 | ) |
| | | | |
|
| |
|
| |
|
|
| | | 5(c) | | 76.3 | | | (168.7 | ) | | 60.4 | |
| | | | |
|
| |
|
| |
|
|
F-23
WMC RESOURCES LTD AND CONTROLLED ENTITIES
Notes to the Combined Financial Statements
5. INCOME TAX (Continued)
(b) Future income tax benefits
The income tax provision is calculated under a policy of tax-effect accounting. Under this policy, the future benefits of tax losses and timing differences are brought to account where:
| (i) | | virtual certainty exists as to the ability of group companies to recoup such losses; or |
| (ii) | | a provision for deferred income tax exists in the group company to which the tax losses relate but only to the extent that deferred income tax has already been provided in respect of timing differences which will reverse within the period during which the tax losses will remain available as a deduction from assessable income; or |
| (iii) | | the reversal of all other timing differences comprising the balance of the account is assured beyond any reasonable doubt. |
Australian GAAP differs from US GAAP in that future benefits will only be brought to account when the foregoing criteria are met whereas under US GAAP all future benefits are recognized but are subject to a valuation allowance, unless realisation is more likely than not. The net impact on both income and net balance sheet amounts is identical under both methods.
| | | As at 31 Dec 2001 A$
| | | As at 31 Dec 2000 A$
| | | As at 31 Dec 1999 A$
| |
At balance date the following future tax benefits not recognised under Australian GAAP would be recognised and subject to valuation allowances under US GAAP: | | | | | | | | | |
|
| Future tax benefits are attributable to: | | | | | | | | | |
| - income tax losses | | 88.4 | | | 57.7 | | | 82.6 | |
| - income tax timing differences | | 49.1 | | | 60.5 | | | 2.2 | |
| - capital timing differences | | (149.5 | ) | | (140.3 | ) | | (99.1 | ) |
| - capital losses | | 63.9 | | | 63.9 | | | 64.7 | |
| | |
|
| |
|
| |
|
|
| | | 51.9 | | | 41.8 | | | 50.4 | |
| | |
|
| |
|
| |
|
|
Realization of future benefits attributable to tax losses and timing differences will only arise in the event that;
| • | | the company, or where applicable another WMC Resources company, derives future assessable income within the prescribed time limit of a nature and of an amount sufficient to enable the benefit from the deductions from the losses to be realized; |
| • | | companies controlled by WMC Resources continue to comply with the conditions for deductibility imposed by the law; and |
| • | | no changes in tax legislation adversely affect WMC Resources or its controlled entities in realizing the benefit from the deductions for the losses. |
F-24
WMC RESOURCES LTD AND CONTROLLED ENTITIES
Notes to the Combined Financial Statements
| | | | | | Year to | | | Year to | | | Year to | |
| | | | | | 31 Dec | | | 31 Dec | | | 31 Dec | |
| | | | | | 2001 | | | 2000 | | | 1999 | |
| | | Notes
| | | A$
| | | A$
| | | A$
| |
5. INCOME TAX (Continued) | | | | | | | | | | | | |
(c) Income tax credit (expense) is comprised of: | | | | | | | | | | | | |
| Current: | | | | | | | | | | | | |
| Australian | | | | | (3.2 | ) | | (3.8 | ) | | (4.5 | ) |
| United States Federal | | | | | — | | | (0.1 | ) | | 0.1 | |
| Other | | | | | (0.1 | ) | | (2.1 | ) | | (1.5 | ) |
| | | | | |
|
| |
|
| |
|
|
| | | | | | (3.3 | ) | | (6.0 | ) | | (5.9 | ) |
| | | | | |
|
| |
|
| |
|
|
| | | | | | | | | | | | | |
| Deferred income tax: | | | | | | | | | | | | |
| Australian | | | | | (101.9 | ) | | (334.1 | ) | | (60.8 | ) |
| United States Federal | | | | | — | | | (0.1 | ) | | (0.2 | ) |
| | | | | |
|
| |
|
| |
|
|
| | | 5 | (d) | | (101.9 | ) | | (334.2 | ) | | (61.0 | ) |
| | | | | |
|
| |
|
| |
|
|
| Future income tax benefit: | | | | | | | | | | | | |
| Australian | | | | | 123.0 | | | 148.1 | | | 84.3 | |
| United States Federal | | | | | — | | | — | | | — | |
| Other | | | | | — | | | — | | | (0.4 | ) |
| | | | | |
|
| |
|
| |
|
|
| | | | | | 123.0 | | | 148.1 | | | 83.9 | |
| | | | | |
|
| |
|
| |
|
|
| Tax credit/(expense) attributable to operating profit/(loss) | | | | | 17.8 | | | (192.1 | ) | | 17.0 | |
| | | | | | | | | | | | | |
| Prior period adjustment | | | | | 6.5 | | | 19.8 | | | 14.3 | |
| Exceptional change in tax rate | | 4 | | | — | | | — | | | 17.4 | |
| Income tax credit on exceptional items | | 4 | | | 52.0 | | | 3.6 | | | 11.7 | |
| | | | | |
|
| |
|
| |
|
|
| Total income tax credit/(expense) | | 5 | (a) | | 76.3 | | | (168.7 | ) | | 60.4 | |
| | | | | |
|
| |
|
| |
|
|
F-25
WMC RESOURCES LTD AND CONTROLLED ENTITIES
Notes to the Combined Financial Statements
| | | | | | Year to 31 Dec 2001 A$
| | | Year to 31 Dec 2000 A$
| | | Year to 31 Dec 1999 A$
| |
5. | | | INCOME TAX (Continued) | | | | | | | | | |
|
| (d | ) | | The significant timing differences included in deferred income tax were: | | | | | | | | | |
| | | | Accelerated depreciation | | (45.2 | ) | | (90.2 | ) | | (0.2 | ) |
| | | | Stores | | 1.1 | | | (1.0 | ) | | — | |
| | | | Stock adjustment to market value | | (101.1 | ) | | — | | | — | |
| | | | Amounts set aside to provision accounts | | 9.1 | | | (1.7 | ) | | (1.6 | ) |
| | | | Tax losses | | 52.9 | | | (193.8 | ) | | (14.0 | ) |
| | | | Prepayments | | (0.4 | ) | | (0.6 | ) | | (1.3 | ) |
| | | | Financial instruments accruals | | (18.5 | ) | | (32.4 | ) | | (43.8 | ) |
| | | | Foreign exchange | | 1.3 | | | (6.9 | ) | | — | |
| | | | Other | | (1.1 | ) | | (7.6 | ) | | (0.1 | ) |
| | | | | |
|
| |
|
| |
|
|
| | | | | | (101.9 | ) | | (334.2 | ) | | (61.0 | ) |
| | | | | |
|
| |
|
| |
|
|
|
| (e | ) | | At 31 December 2001, for income tax purposes, tax losses carried forward were A$1,860.9 million. |
|
| | | | These operating tax losses carried forward, expire as summarised below: |
| | | | | | | Year of Expiry
| | A$
|
|
| | | | | Australia | | Indefinitely | | 1,571.0 |
| | | | | | | | |
|
|
| | | | | United States | | 2007 | | 2.7 |
| | | | | | | 2008 | | 13.7 |
| | | | | | | 2009 | | 14.2 |
| | | | | | | 2010 | | 18.2 |
| | | | | | | 2012 | | 19.2 |
| | | | | | | 2019 | | 2.0 |
| | | | | | | 2020 | | 0.2 |
| | | | | | | 2021 | | 2.3 |
| | | | | | | | |
|
| | | | | | | | | 72.5 |
| | | | | | | | |
|
|
| | | | | | | Year of Expiry
| | A$
|
|
| | | | | Other countries | | 2002 | | 3.5 |
| | | | | | | 2003 | | 2.9 |
| | | | | | | 2004 | | 5.2 |
| | | | | | | 2005 | | 4.3 |
| | | | | | | 2006 | | 2.2 |
| | | | | | | Indefinitely | | 199.3 |
| | | | | | | | |
|
| | | | | | | | | 217.4 |
| | | | | | | | |
|
| | | | | Total operating income tax losses | | | | 1,860.9 |
| | | | | | | | |
|
|
| | | | | Capital losses and timing differences relate mainly to losses which have not yet been realized or where they are realized and can be carried forward indefinitely. |
F-26
WMC RESOURCES LTD AND CONTROLLED ENTITIES
Notes to the Combined Financial Statements
| | | Year to 31 Dec 2001 A$
| | Year to 31 Dec 2000 A$
| | Year to 31 Dec 1999 A$
| |
| | | | | | | |
| | | Cents per share | |
Unaudited pro forma basic earnings per share calculated on Group equity accounted profit after income tax and minority interests.(1) | | 11.4 | | 35.5 | | 7.3 | |
| | |
| |
| |
|
|
| Unaudited pro forma diluted earnings per share calculated on Group equity accounted profit after income tax and minority interests | | 11.9 | | 35.5 | | 7.7 | |
| | |
| |
| |
|
|
Unaudited pro forma basic earnings per share calculated on net income in accordance with US GAAP(2) (note 44) | | | | | | | |
| -before prior years’ cumulative effect of accounting change | | 3.4 | | 27.3 | | 5.6 | |
| -accounting change | | — | | — | | (1.1 | ) |
| | |
| |
| |
|
|
| Unaudited pro forma basic earnings per share | | 3.4 | | 27.3 | | 4.5 | |
| | |
| |
| |
|
|
| | | Weighted average number of ordinary shares outstanding during the year used in the calculation of basic earnings per share | | Potential ordinary shares from the conversion of partly paid shares and options | | Weighted average number of ordinary shares outstanding during the year including potential ordinary shares used in the calculation of diluted earnings per share |
| | |
| |
| |
|
| Year to 31 Dec, 2001 | | 1,103,323,901 | | 17,474,000 | | 1,120,797,901 |
| Year to 31 Dec, 2000 | | 1,127,115,419 | | 10,262,392 | | 1,137,377,811 |
| Year to 31 Dec, 1999 | | 1,146,071,704 | | 15,862,435 | | 1,161,934,139 |
| | | Year to 31 Dec 2001 A$
| | | Year to 31 Dec 2000 A$
| | Year to 31 Dec 1999 A$
| |
| | | Cents per share | |
Australian GAAP | | | | | | | | |
| (1) Earnings per share from continuing operations | | (14.3 | ) | | 29.0 | | (0.5 | ) |
| Earnings per share from discontinued operations | | 25.7 | | | 6.5 | | 7.8 | |
| | |
|
| |
| |
|
|
| | | 11.4 | | | 35.5 | | 7.3 | |
| | |
|
| |
| |
|
|
US GAAP | | | | | | | | |
| (2) Earnings per share from continuing operations | | (21.0 | ) | | 21.4 | | (1.9 | ) |
| Earnings per share from discontinued operations | | 24.4 | | | 5.9 | | 6.4 | |
| | |
|
| |
| |
|
|
| | | 3.4 | | | 27.3 | | 4.5 | |
| | |
|
| |
| |
|
|
F-27
WMC RESOURCES LTD AND CONTROLLED ENTITIES
Notes to the Combined Financial Statements
6. | | | | EARNINGS PER SHARE (Continued) | |
|
| | | (a) | | Information concerning classification of securities | |
|
| | | | | As disclosed in Note 1(m), as a result of the demerger, existing WMC Limited shareholders received one WMC Resources share for every WMC Limited share owned. The unaudited pro forma disclosures in these carve-out financial statements are based on the number of shares and options of WMC Limited outstanding for the periods concerned. | |
|
| | | | | The partly paid shares carry the right to participate in dividends in proportion to the amount paid relative to the total issue price (for partly paid shares issued in 1987, relative to the nominal value), and to that extent they have been recognised as equivalents of ordinary shares in the determination of basic earnings per share. At balance date there were 629,000 (December 2000: 771,500; December 1999: 1,083,500) partly paid shares, callable at the option of the holders and which at balance date were considered dilutive for the purpose of the calculation of diluted earnings per share. At balance date there were 27,065,363 (December 2000: 27,716,190; December 1999: 26,530,000) options which were considered potentially dilutive and therefore, were used in the calculation of diluted earnings per share. | |
|
| | | (b) | | Comparative information | |
|
| | | | | The basic earnings per share as presented and diluted earnings per share for the current and previous periods have been adjusted for the conversion of partly paid shares. The adjustment is in accordance with the Australian Accounting Standard AASB 1027, “Earnings Per Share”. | |
|
| | | (c) | | Conversion, call, subscription or issue after 31 December 2001 | |
|
| | | | | There have been no material conversions to, calls of, or subscriptions for ordinary shares or issues of potential ordinary shares since the reporting date and before completion of these financial statements except those consequent to the demerger. | |
|
| | | | | | | (Millions of $) | |
|
| | | | | | | Year to 31 Dec 2001 A$
| | Year to 31 Dec 2000 A$
| | Year to 31 Dec 1999 A$
| |
| | | (d) | | Reconciliation of earnings used in the calculation of earnings per share | | | | | | | |
|
| | | | | Net Income | | 126.0 | | 399.9 | | 84.1 | |
|
| | | | | Nominal interest from the conversion of partly paid shares and options | | 7.5 | | 3.4 | | 5.3 | |
| | | | | | |
| |
| |
|
|
| | | | | Potential diluted earnings | | 133.5 | | 403.3 | | 89.4 | |
| | | | | | |
| |
| |
|
|
| | | | | US GAAP earnings before cumulative effect of accounting change (Note 44) | | 37.7 | | 307.6 | | 65.1 | |
| | | | | Prior years cumulative effect of change in accounting for start-up activities | | — | | — | | (13.0 | ) |
| | | | | | |
| |
| |
|
|
| | | | | Net US GAAP earnings | | 37.7 | | 307.6 | | 52.1 | |
| | | | | | |
| |
| |
|
|
F-28
WMC RESOURCES LTD AND CONTROLLED ENTITIES
Notes to the Combined Financial Statements
7. FINANCIAL REPORTING BY SEGMENT
| | (A) | | Information for the year ended |
| | | | | Capital Expenditure A$
| | Total Assets A$
| | | Depreciation and Amortization A$
| | Sales Revenue(i) A$
| | | Profit Before Income Tax A$
| |
| | | Business Segments | | | | | | | | | | | | | |
| | | Copper/uranium | | 75.3 | | 2,811.1 | | | 181.9 | | 810.3 | | | 47.9 | |
| | | Nickel | | 227.1 | | 1,691.1 | | | 222.5 | | 1,200.9 | (v) | | 146.9 | |
| | | Fertilizer | | 42.3 | | 1,137.3 | | | 66.0 | | 352.9 | | | (89.4 | ) |
| | | Other | | 0.7 | | 68.8 | | | 4.1 | | — | | | (1.0 | ) |
| | | Corporate and unallocated | | | | | | | | | | | | | |
| | | New business | | 0.4 | | — | | | — | | — | | | (35.3 | ) |
| | | Regional exploration | | — | | — | | | — | | — | | | (63.9 | ) |
| | | Corporate | | 8.7 | | 1,063.8 | | | 6.4 | | — | | | (69.2 | ) |
| | | Finance and other costs | | — | | — | | | — | | — | | | (17.6 | ) |
| | | Net interest | | — | | — | | | — | | — | | | (141.7 | ) |
| | | | |
| |
|
| |
| |
|
| |
|
|
| | | Continuing operations | | 354.5 | | 6,772.1 | | | 480.9 | | 2,364.1 | | | (223.3 | ) |
| | | Discontinuing operations-Gold | | 99.9 | | 124.9 | | | 113.1 | | 433.3 | | | 192.4 | |
| | | Discontinuing operations-Talc | | 2.5 | | — | | | 2.2 | | 19.6 | | | 80.6 | |
| | | | |
| |
|
| |
| |
|
| |
|
|
| | | Economic entity | | 456.9 | | 6,897.0 | (iv) | | 596.2 | | 2,817.0 | | | 49.7 | |
| | | | |
| |
|
| |
| |
|
| |
|
|
| | | Geographical Segments | | | | | | | | | | | | | |
| | | Australia | | 345.0 | | 5,530.0 | | | 473.3 | | 2,364.1 | (ii) | | 100.1 | |
| | | North America | | 0.2 | | 151.7 | | | 0.5 | | — | | | 5.5 | |
| | | Other | | 0.2 | | 26.6 | | | 0.7 | | — | | | (1.2 | ) |
| | | Corporate and unallocated | | | | | | | | | | | | | |
| | | New business | | 0.4 | | — | | | — | | — | | | (35.3 | ) |
| | | Regional exploration | | — | | — | | | — | | — | | | (63.9 | ) |
| | | Corporate | | 8.7 | | 1,063.8 | | | 6.4 | | — | | | (69.2 | ) |
| | | Finance and other costs | | — | | — | | | — | | — | | | (17.6 | ) |
| | | Net interest | | — | | — | | | — | | — | | | (141.7 | ) |
| | | | |
| |
|
| |
| |
|
| |
|
|
| | | Continuing operations | | 354.5 | | 6,772.1 | | | 480.9 | | 2,364.1 | | | (223.3 | ) |
| | | Discontinuing operations-Gold | | 99.9 | | 124.9 | | | 113.1 | | 433.3 | | | 192.4 | |
| | | Discontinuing operations-Talc | | 2.5 | | — | | | 2.2 | | 19.6 | | | 80.6 | |
| | | | |
| |
|
| |
| |
|
| |
|
|
| | | Economic entity | | 456.9 | | 6,897.0 | (iv) | | 596.2 | | 2,817.0 | (iii) | | 49.7 | |
| | | | |
| |
|
| |
| |
|
| |
|
|
| (i) | | Sales revenue includes by-product sales, commodity and related currency hedging. Intra segment sales are on a commercial basis and are not significant. |
| (ii) | | Includes all nickel sales. |
| (iii) | | Total sales are sold to the following countries / regions: Australia 29%, Europe 28%, Japan 13%, North America 13%, Taiwan 4% and Other 13%. |
| (iv) | | Excludes deferred losses on hedging contracts of $1,345.9 million. Refer to Note 12. |
| (v) | | Includes US$137 million/A$267.1 million from a significant customer. |
F-29
WMC RESOURCES LTD AND CONTROLLED ENTITIES
Notes to the Combined Financial Statements
7. FINANCIAL REPORTING BY SEGMENT (Continued)
| | (B) | | Information for the year ended |
| | | | | Capital Expenditure A$
| | | Total Assets A$
| | | Depreciation and Amortization A$
| | Sales Revenue (i) A$
| | | Profit Before Income Tax A$
| |
| | | Business Segments | | | | | | | | | | | | | | |
| | | Copper/uranium | | 79.9 | | | 3,098.0 | | | 190.3 | | 798.0 | | | 165.7 | |
| | | Nickel | | 155.5 | | | 1,801.0 | | | 203.8 | | 1,645.4 | (vi) | | 626.7 | |
| | | Fertilizer | | 96.2 | (ii) | | 1,162.0 | | | 26.8 | | 222.6 | | | (59.7 | ) |
| | | Other | | 1.4 | | | 98.3 | | | 3.1 | | — | | | (1.2 | ) |
| | | Corporate and unallocated | | | | | | | | | | | | | | |
| | | New business | | 0.5 | | | — | | | — | | — | | | (6.2 | ) |
| | | Regional exploration | | — | | | — | | | — | | — | | | (53.8 | ) |
| | | Corporate | | 7.0 | | | 962.2 | | | 4.8 | | — | | | (43.4 | ) |
| | | Finance and other costs | | — | | | — | | | — | | — | | | 2.4 | |
| | | Net interest | | — | | | — | | | — | | — | | | (148.3 | ) |
| | | | |
|
| |
|
| |
| |
|
| |
|
|
| | | Continuing operations. | | 340.5 | | | 7,121.5 | | | 428.8 | | 2,666.0 | | | 482.2 | |
| | | Discontinuing operations-Gold(iii) | | 119.9 | | | 333.7 | | | 79.2 | | 402.6 | | | 80.1 | |
| | | Discontinuing operations-Talc | | 8.2 | | | 105.3 | | | 2.8 | | 23.4 | | | 6.4 | |
| | | | |
|
| |
|
| |
| |
|
| |
|
|
| | | Economic entity | | 468.6 | | | 7,560.5 | (v) | | 510.8 | | 3,092.0 | | | 568.7 | |
| | | | |
|
| |
|
| |
| |
|
| |
|
|
| | | Geographical Segments | | | | | | | | | | | | | | |
| | | Australia | | 332.0 | | | 5,870.2 | | | 422.5 | | 2,666.0 | (iii) | | 719.7 | |
| | | North America | | 0.7 | | | 260.4 | | | 1.0 | | — | | | 11.6 | |
| | | Other | | 0.3 | | | 28.7 | | | 0.5 | | — | | | 0.2 | |
| | | Corporate and unallocated | | | | | | | | | | | | | | |
| | | New business | | 0.5 | | | — | | | — | | — | | | (6.2 | ) |
| | | Regional exploration | | — | | | — | | | — | | — | | | (53.8 | ) |
| | | Corporate | | 7.0 | | | 962.2 | | | 4.8 | | — | | | (43.4 | ) |
| | | Finance and other costs | | — | | | — | | | — | | — | | | 2.4 | |
| | | Net interest | | — | | | — | | | — | | — | | | (148.3 | ) |
| | | | |
|
| |
|
| |
| |
|
| |
|
|
| | | Continuing operations | | 340.5 | | | 7,121.5 | | | 428.8 | | 2,666.0 | | | 482.2 | |
| | | Discontinuing operations-Gold | | 119.9 | | | 333.7 | | | 79.2 | | 402.6 | | | 80.1 | |
| | | Discontinuing operations-Talc | | 8.2 | | | 105.3 | | | 2.8 | | 23.4 | | | 6.4 | |
| | | | |
|
| |
|
| |
| |
|
| |
|
|
| | | Economic entity | | 468.6 | | | 7,560.5 | (v) | | 510.8 | | 3,092.0 | (v) | | 568.7 | |
| | | | |
|
| |
|
| |
| |
|
| |
|
|
| (i) | | Sales revenue includes by-product sales, commodity and related currency hedging. Intra segment sales are on a commercial basis and are not significant. |
| (ii) | | Includes capitalised interest and commissioning costs of $77.3 million. The capitalisation of start-up costs included in this is contrary to US GAAP. Refer to Note 44. |
| (iii) | | Includes all nickel sales. |
| (iv) | | Total sales are sold to the following countries / regions: Australia 26%, Europe 26%, Japan 16%, North America 13%, Taiwan 10% and Other 9%. |
| (v) | | Excludes deferred losses on hedging contracts of $1,036.5 million. Refer to Note 12. |
| (vi) | | Includes US$203 million/A$352.6 million from a significant customer. |
F-30
WMC RESOURCES LTD AND CONTROLLED ENTITIES
Notes to the Combined Financial Statements
7. FINANCIAL REPORTING BY SEGMENT (Continued)
| | (C) | | Information for the year ended |
| | | Capital Expenditure A$
| | Total Assets A$
| | | Depreciation And Amortization A$
| | Sales Revenue (i) A$
| | | Profit Before Income Tax A$
| |
Business Segment | | | | | | | | | | | | | |
| Copper/uranium | | 312.2 | | 3,171.3 | | | 132.4 | | 491.6 | | | 16.4 | |
| Nickel | | 133.1 | | 1,916.7 | | | 172.2 | | 989.2 | (vii) | | 123.7 | |
| Fertilizer | | 418.4 | | 1,030.6 | | | 6.1 | | 191.9 | | | (9.5 | )(ii) |
| Other | | 2.6 | | 42.6 | | | 3.1 | | — | | | 4.9 | |
Corporate and unallocated | | | | | | | | | | | | | |
| New business | | — | | — | | | — | | — | | | (49.3 | )(v) |
| Regional exploration | | 0.2 | | — | | | — | | — | | | (48.1 | ) |
| Corporate | | 2.8 | | 582.6 | | | 4.5 | | — | | | (32.7 | ) |
| Finance and other costs | | — | | — | | | — | | — | | | (3.0 | ) |
| Net interest | | — | | — | | | — | | — | | | (79.0 | ) |
| | |
| |
|
| |
| |
|
| |
|
|
Continuing operations | | 869.3 | | 6,743.8 | | | 318.3 | | 1,672.7 | | | (76.6 | ) |
Discontinuing operations-Gold(iii) | | 106.5 | | 293.7 | | | 87.4 | | 399.4 | | | 106.2 | |
Discontinuing operations-Talc | | 9.1 | | 89.8 | | | 0.3 | | 22.7 | | | (5.0 | ) |
| | |
| |
|
| |
| |
|
| |
|
|
Economic Entity | | 984.9 | | 7,127.3 | (vi) | | 406.0 | | 2,094.8 | | | 24.6 | |
| | |
| |
|
| |
| |
|
| |
|
|
Geographical Segments | | | | | | | | | | | | | |
| Australia | | 865.4 | | 5,792.8 | | | 312.4 | | 1,672.7 | (iii) | | 119.4 | |
| North America | | 0.4 | | 325.2 | | | 1.1 | | — | | | 7.1 | |
| Other | | 0.5 | | 43.2 | | | 0.3 | | — | | | 9.0 | |
Corporate and unallocated | | | | | | | | | | | | | |
| New business | | — | | — | | | — | | — | | | (49.3 | ) |
| Regional exploration | | 0.2 | | — | | | — | | — | | | (48.1 | ) |
| Corporate | | 2.8 | | 582.6 | | | 4.5 | | — | | | (32.7 | ) |
| Finance and other costs | | — | | — | | | — | | — | | | (3.0 | ) |
| Net interest | | — | | — | | | — | | — | | | (79.0 | ) |
| | |
| |
|
| |
| |
|
| |
|
|
Continuing operations | | 869.3 | | 6,743.8 | | | 318.3 | | 1,672.7 | | | (76.6 | ) |
Discontinuing operations-Gold | | 106.5 | | 293.7 | | | 87.4 | | 399.4 | | | 106.2 | |
Discontinuing operations-Talc | | 9.1 | | 89.8 | | | 0.3 | | 22.7 | | | (5.0 | ) |
| | |
| |
|
| |
| |
|
| |
|
|
Economic Entity | | 984.9 | | 7,127.3 | (vi) | | 406.0 | | 2,094.8 | (iv) | | 24.6 | |
| | |
| |
|
| |
| |
|
| |
|
|
| (i) | | Sales revenue includes by-product sales, commodity and related currency hedging. Intra segment sales are on a commercial basis and are not significant. |
| (ii) | | Includes a net exceptional charge of $7.4 million. Loss before exceptional items of $2.1 million. |
| (iii) | | Includes all nickel sales. |
| (iv) | | Total sales are sold to the following countries / regions: Australia 46%, Europe 23%, Japan 11%, North America 8%, Taiwan 8% and Other 4%. |
| (v) | | Includes an exceptional charge of $13.8 million for the write-down of all previously deferred expenditure on the Yeelirrie project. |
| (vi) | | Excludes deferred losses on hedging contracts of $147.5 million. |
| (vii) | | Includes US$131 million/A$203.3 million from a significant customer. |
F-31
WMC RESOURCES LTD AND CONTROLLED ENTITIES
Notes to the Combined Financial Statements
7. FINANCIAL REPORTING BY SEGMENT (Continued)
The segmental analysis has been prepared on the following basis:
(a) Operating segments – WMC Resources’ activities have been segmented based on management reporting to the Chief Executive Officer as follows:
| | - | | Copper/uranium. The multi-metal operations based on the Olympic Dam ore body, principally copper and uranium, but also gold and silver. |
| | - | | Other. This category includes other minor products. |
Included with the major divisional business units above are any applicable hedging gains and losses and the revenues and costs of associated by-products. Other activities not identifiable with these segments are grouped under the heading “Corporate”. This category includes unallocated corporate overhead and disposals of corporate non-current assets. The New business segment includes identification, evaluation and implementation of new opportunities.
(b) Discontinued operations – Gold business unit and the Talc business unit (formed part of Other in the segment note)
Gold business unit
During the year, the Group disposed of its gold operations except for its controlling interest in Central Norseman Gold Corporation Limited (‘CNGC’) and its interest in the West Meliadine Joint Venture. The sale of its controlling interest in CNGC was completed in January 2002 (refer to Note 46) and a sale of the interest in Meliadine is expected during 2002. However, CNGC and Meliadine were included as discontinued operations because management had approved a formal plan to dispose of these investments prior to year end.
The company’s right to a royalty from the sale of the St Ives and Agnew Gold operations, was sold in June 2002 for a profit of $15.4 million.
Talc (formed part of Other in the segment note)
On 24 January 2001, WMC sold its equity interest in Mondo Minerals Talc joint venture for a profit of $51.1 million after tax.
On 30 September 2001, WMC sold its Three Springs Talc operation for a profit of $20.0 million after tax.
(c) Geographical – the activities of WMC Resources are conducted predominantly in Australia and North America. The other geographic segment encompasses operations in South America, Africa, Europe and Asia.
(d) Segment results have been calculated after taking into account inter-segment sales and other eliminations. These sales are immaterial and are made on a commercial basis.
(e) Income and total assets for each segment have been calculated after taking account of combination and inter-segment eliminations, as appropriate.
WMC Resources allocates its expenditure on the search for and evaluation of new or additional mineral reserves over three headings - additional exploration, regional exploration and project exploration. Additional exploration is expenditure which, if successful, will define new reserves at existing operations. These reserves will usually require new facilities for extraction, although they will probably utilise existing management and infrastructure. Exploration charges for additional exploration expenditure are allocated to the appropriate business segment although such exploration is not necessarily directly related to segment production. Regional, project and evaluation exploration which cover expenditures in new areas up to the point where a decision is made either to develop to the production stage or to abandon exploration in the area, are the responsibility of other management and are disclosed in those segments. Expenditure which extends reserves at existing operations, which would probably be extracted with existing facilities, continues to be included with mine development expenditure.
F-32
WMC RESOURCES LTD AND CONTROLLED ENTITIES
Notes to the Combined Financial Statements
| | | | | | | | As at 31 December
| |
| | | | | | | | 2001 | | | 2000 | |
| | | | | Notes
| | | A$
| | | A$
| |
8. | | CURRENT ASSETS - CASH ASSETS | | | | | | | | | |
| | | | | | | | | | | | |
| | | Cash at bank and on hand | | | | | 106.2 | | | 43.3 | |
| | | Short term deposits (maturity of three months or less) | | | | | 17.9 | | | 19.0 | |
| | | | | | | |
|
| |
|
|
| | | | | | | | 124.1 | | | 62.3 | |
| | | | | | | |
|
| |
|
|
9. | | CURRENT ASSETS - RECEIVABLES | | | | | | | | | |
| | | | | | | | | | | | |
| | | Trade debtors | | | | | 214.3 | | | 378.3 | |
| | | Provision for doubtful debts | | | | | (6.7 | ) | | (6.5 | ) |
| | | | | | | |
|
| |
|
|
| | | | | | | | 207.6 | | | 371.8 | |
| | | | | | | |
|
| |
|
|
| | | Other debtors | | | | | 107.1 | | | 159.0 | |
| | | Provision for doubtful debts | | | | | — | | | (0.3 | ) |
| | | | | | | |
|
| |
|
|
| | | | | | | | 107.1 | | | 158.7 | |
| | | | | | | |
|
| |
|
|
| | | Debtors relating to hedging contracts | | | | | 181.3 | | | 160.4 | |
| | | | | | | |
|
| |
|
|
| | | | | | | | 496.0 | | | 690.9 | |
| | | | | | | |
|
| |
|
|
| | | | | | | | | | | | |
10. | | CURRENT ASSETS - OTHER FINANCIAL ASSETS | | | | | | | | | |
| | | | | | | | | | | | |
| | | Short term deposits (maturity of over three months, and up to twelve months) | | | | | 20.1 | | | 11.9 | |
| | | | | | | |
|
| |
|
|
| | | Foreign currency and deposits are in the following currency: | | | | | | | | | |
| | | US dollars | | | | | — | | | 0.4 | |
| | | | | | | |
|
| |
|
|
| | | Deposits in A$ equivalent of above currency | | | | | — | | | 0.7 | |
| | | Australian dollars | | | | | 20.1 | | | 11.2 | |
| | | | | | | |
|
| |
|
|
| | | | | | | | 20.1 | | | 11.9 | |
| | | | | | | |
|
| |
|
|
11. | | CURRENT ASSETS - INVENTORIES | | | | | | | | | |
| | | | | | | | | | | | |
| | | Stores at cost | | | | | 71.9 | | | 79.6 | |
| | | Provision for obsolescence | | | | | (0.8 | ) | | (0.8 | ) |
| | | | | | | |
|
| |
|
|
| | | | | | | | 71.1 | | | 78.8 | |
| | | | | | | |
|
| |
|
|
| | | Trading stocks at cost | | | | | 156.8 | | | 195.8 | |
| | | Trading stocks at net realizable value | | | | | 34.5 | | | 15.4 | |
| | | Work in progress at cost | | | | | 142.1 | | | 161.8 | |
| | | Work in progress at net realizable value | | | | | 5.7 | | | 4.4 | |
| | | | | | | |
|
| |
|
|
| | | | | | | | 339.1 | | | 377.4 | |
| | | | | | | |
|
| |
|
|
| | | Total current inventories | | 11 | (a) | | 410.2 | | | 456.2 | |
| | | | | | | |
|
| |
|
|
| (a) | | Current inventories | | | | | 410.2 | | | 456.2 | |
| | | Non-current inventories | | 16 | | | 82.4 | | | 85.1 | |
| | | | | | | |
|
| |
|
|
| | | Aggregate inventories | | | | | 492.6 | | | 541.3 | |
| | | | | | | |
|
| |
|
|
F-33
WMC RESOURCES LTD AND CONTROLLED ENTITIES
Notes to the Combined Financial Statements
| | | | | Notes
| | As at 31 December
| | | | | |
| | | | 2001 | | | 2000 | | | | | |
| | | | A$
| | | A$
| | | | | |
| 12. | | | | | | | | | | | | | | |
| | | Prepayments | | | | 58.4 | | | 63.7 | | | | | |
| | | Deferred losses-hedging contracts | | 12(a) | | 157.7 | | | 159.8 | | | | | |
| | | Other | | | | 14.4 | | | 1.4 | | | | | |
| | | | | | |
|
| |
|
| | | | |
| | | | | | | 230.5 | | | 224.9 | | | | | |
| | | | | | |
|
| |
|
| | | | |
| | | (a) Deferred gains and losses consist of realized and unrealized gains and losses arising from commodity hedging contracts and related currency hedging contracts that are in place, but which relate to commodities to be produced and sold in future years. The deferred gains and losses will be brought to account in the year that the related production is sold. Whether the unrealized deferred balances will be realized and at what amount depends upon commodity and currency price movements until the end of the hedge contracts concerned. In accordance with Australian accounting standards, the balance sheet position has been calculated using current spot prices at balance date. The amounts deferred in the balance sheet are set out below. |
|
| | | Deferred losses: | | | | | | | | | | | | |
|
| | | - Current | | 12 | | (157.7 | ) | | (159.8 | ) | | | | |
| | | - Non-current | | 20 | | (1,188.2 | ) | | (876.7 | ) | | | | |
| | | | | | |
|
| |
|
| | | | |
| | | Net Position | | 35D | | (1,345.9 | ) | | (1,036.5 | ) | | | | |
| | | | | | |
|
| |
|
| | | | |
| | | The net amount that has been received/(paid) or is receivable/(payable) in the following currency: | | | | | | | | | | | | |
|
| | | - US dollars | | | | 21.8 | | | 125.2 | | | | | |
| | | | | | |
|
| |
|
| | | | |
|
| | | A$ equivalent of above currency | | | | 42.7 | | | 225.6 | | | | | |
| | | A$ equivalent of other items | | | | 0.4 | | | 0.5 | | | | | |
| | | In Australian dollars | | | | (1,389.0 | ) | | (1,262.6 | ) | | | | |
| | | | | | |
|
| |
|
| | | | |
| | | | | | | (1,345.9 | ) | | (1,036.5 | ) | | | | |
| | | | | | |
|
| |
|
| | | | |
|
| Deferral of hedging gains and losses on the balance sheet is not in accordance with US GAAP, which requires hedging gains and losses to be included as part of other comprehensive income. Refer to Note 44(j). |
|
| 13. | | NON-CURRENT ASSETS - RECEIVABLES | | | | | | | | | | | | |
|
| | | Loans and debtors | | | | 4.6 | | | 31.3 | | | | | |
| | | Provision for doubtful debts | | | | (0.7 | ) | | (1.9 | ) | | | | |
| | | | | | |
|
| |
|
| | | | |
| | | | | | | 3.9 | | | 29.4 | | | | | |
| | | Debtors relating to hedging contracts | | | | 477.5 | | | 571.6 | | | | | |
| | | | | | |
|
| |
|
| | | | |
| | | | | | | 481.4 | | | 601.0 | | | | | |
| | | | | | |
|
| |
|
| | | | |
F-34
WMC RESOURCES LTD AND CONTROLLED ENTITIES
Notes to the Combined Financial Statements
| | | As at 31 December
|
| | | 2001 A$
| | | 2000 A$
|
14. INVESTMENTS IN ASSOCIATES/JOINTLY CONTROLLED ENTITIES | | | | | |
|
Securities in entities which are not traded on any prescribed stock exchange | | | | | |
|
Mondo Minerals Oy: | | | | | |
|
Securities at cost: | | | | | |
| – balance brought forward | | 46.5 | | | 42.8 |
| – foreign currency revaluation | | 0.5 | | | 3.7 |
| | |
|
| |
|
| | | 47.0 | | | 46.5 |
| Equity in retained profits | | 14.0 | | | 14.0 |
| Sale of equity interest in Mondo Minerals* | | (61.0 | ) | | — |
| | |
|
| |
|
Equity accounted carrying value of Mondo Minerals Oy | | — | | | 60.5 |
| | |
|
| |
|
| | * | | On 24 January 2001, WMC sold its 50 per cent equity interest in the Mondo Minerals Talc joint venture, effective 1 January 2001. |
15. NON-CURRENT ASSETS – OTHER FINANCIAL ASSETS
Securities listed on prescribed stock exchanges
| Cost | | 0.1 | | 0.2 | |
| Provision for diminution in value of investments | | — | | (0.1 | ) |
| | |
| |
|
|
Total investments in quoted companies | | 0.1 | | 0.1 | |
| | |
| |
|
|
Quoted market value | | 1.1 | | 1.1 | |
| | |
| |
|
|
| Other investments at cost | | 18.1 | | 26.8 | |
| | |
| |
|
|
| Total investments in unquoted entities | | 18.1 | | 26.8 | |
| | |
| |
|
|
| Total investments in other entities | | 18.2 | | 26.9 | |
| | |
| |
|
|
16. NON-CURRENT ASSETS – INVENTORIES
Stores | | 44.9 | | | 34.9 | |
| Provision for obsolescence | | (12.9 | ) | | (11.2 | ) |
| | |
|
| |
|
|
| | | 32.0 | | | 23.7 | |
| | |
|
| |
|
|
|
Stocks | | | | | | |
| Work-in-progress at cost | | 27.9 | | | 37.4 | |
| Work-in-progress at net realisable value | | 22.5 | | | 24.0 | |
| | |
|
| |
|
|
| | | 50.4 | | | 61.4 | |
| | |
|
| |
|
|
| | | 82.4 | | | 85.1 | |
| | |
|
| |
|
|
17. NON-CURRENT ASSETS – EXPLORATION AND EVALUATION
Cost brought forward | | 33.7 | | | 27.0 | |
| – grassroots expenditure | | 57.2 | | | 51.2 | |
| – expenditure for additional reserves supporting existing operations | | 19.3 | | | 21.1 | |
| – evaluation expenditure | | 18.6 | | | 11.4 | |
| – write-offs | | (92.2 | ) | | (80.1 | ) |
| – acquisitions | | 27.1 | | | — | |
| – reclassification | | — | | | (0.8 | ) |
| – foreign currency translation | | 0.8 | | | 3.9 | |
| | |
|
| |
|
|
Cost carried forward | | 64.5 | | | 33.7 | |
| | |
|
| |
|
|
F-35
WMC RESOURCES LTD AND CONTROLLED ENTITIES
Notes to the Combined Financial Statements
17. | | NON-CURRENT ASSETS—EXPLORATION AND EVALUATION (Continued) | | | | | | | | | |
|
| | | The Yakabindie Nickel Limited company was acquired in 2001 for A$25 million (plus stamp duty and other minor costs of A$2.1 million). The balance sheet at acquisition consisted primarily of an exploration and evaluation asset, being the costs incurred by the company (whilst under the ownership of other mining groups) to determine the reserves of Yakabindie. In the event that mining approvals are obtained for Yakabindie, an additional A$15 million will be payable in cash to the vendor. At the date of this financial report, receipt of all mining approvals, including approval under aboriginal heritage legislation had not been obtained and accordingly this price variation has not been included in the cost of acquisition. Should this consideration become payable it will be included in the total acquisition cost at that time. |
|
| | | | | | | | As at 31 December
| |
| | | | | Notes
| | | 2001 A$
| | | 2000 A$
| |
18. | | NON-CURRENT ASSETS—PROPERTY, PLANT AND EQUIPMENT | | | | | | | | | |
|
| | | Government facilities | | 18(a) | | | 32.0 | | | 32.9 | |
| | | Mine properties and mine development | | 18(b) | | | 850.0 | | | 999.4 | |
| | | Property, land and buildings | | 18(c) | | | 385.9 | | | 405.3 | |
| | | Plant and equipment | | 18(d) | | | 3,507.4 | | | 3,755.4 | |
| | | | | | | |
|
| |
|
|
| | | | | | | | 4,775.3 | | | 5,193.0 | |
| | | | | | | |
|
| |
|
|
(a) | | Government facilities: | | | | | | | | | |
| | | Cost | | | | | 47.9 | | | 47.1 | |
| | | Provisions for amortization and write-off | | | | | (15.9 | ) | | (14.2 | ) |
| | | | | | | |
|
| |
|
|
| | | | | | | | 32.0 | | | 32.9 | |
| | | | | | | |
|
| |
|
|
(b) | | Mine properties and mine development: | | | | | | | | | |
|
| | | Areas in which production has commenced: | | | | | | | | | |
| | | Cost | | | | | 1,878.8 | | | 2,274.5 | |
| | | Provisions for amortization and write-off | | | | | (1,029.3 | ) | | (1,289.1 | ) |
| | | | | | | |
|
| |
|
|
| | | | | | | | 849.5 | | | 985.4 | |
| | | | | | | |
|
| |
|
|
| | | Areas in which production has not yet commenced: | | | | | | | | | |
| | | Cost | | | | | 14.3 | | | 27.8 | |
| | | Provisions for amortization and write-off | | | | | (13.8 | ) | | (13.8 | ) |
| | | | | | | |
|
| |
|
|
| | | | | | | | 0.5 | | | 14.0 | |
| | | | | | | |
|
| |
|
|
| | | | | | | | 850.0 | | | 999.4 | |
| | | | | | | |
|
| |
|
|
|
| | | The ratio used to amortize mine development at the Mount Keith open cut mine was 2.89 tonnes of waste per tonne of ore for the periods presented. The amount amortized for 2001 was $52.9 million (2000: $59.4 million; 1999: $59.5 million). |
|
| | | Included in the total of mine properties and mine development are post-production waste removal costs as follows: |
|
| | | | | 2001 $A
| | | 2000 $A
| | | 1999 $A
| |
| | | Opening balance | | 72 | | | 53 | | | 46 | |
| | | Costs capitalised | | 103 | | | 73 | | | 59 | |
| | | Amortisation charge | | (76 | ) | | (54 | ) | | (52 | ) |
| | | | |
|
| |
|
| |
|
|
| | | Closing balance | | 99 | | | 72 | | | 53 | |
| | | | |
|
| |
|
| |
|
|
F-36
WMC RESOURCES LTD AND CONTROLLED ENTITIES
Notes to the Combined Financial Statement
| | | As at 31 December
| |
| | | | | 2001 A$
| | | 2000 A$
| |
18. | | NON-CURRENT ASSETS - PROPERTY, PLANT AND EQUIPMENT (Continued) | | | | | | |
|
(c) | | Property, land and buildings: | | | | | | |
| | | Cost (including some property on mining leases) | | 554.1 | | | 564.7 | |
| | | Provisions for depreciation and write-off | | (168.2 | ) | | (159.4 | ) |
| | | | |
|
| |
|
|
| | | | | 385.9 | | | 405.3 | |
| | | | |
|
| |
|
|
| Directors are required to disclose a current value (within the last three years) of interests in land and buildings, excluding mining tenements and leases and buildings thereon, held by entities within the Company. The value of such interests on the basis of market value for existing use was estimated by the Directors to be $176.4 million as at 30 June 1999 compared with a net book value of $122.6 million. This valuation has not been recognised in the financial statements. It should be noted that the market value of many of these properties is dependant upon the long term continuation of relevant mining operations and WMC Resources’ present employment policies. |
| | | | | As at 31 December
| |
| | | | | 2001 | | | 2000 | |
| | | | | A$
| | | A$
| |
(d) | | Plant and equipment: | | | | | | |
| | | Cost | | 4,837.4 | | | 4,966.7 | |
| | | Provisions for depreciation and write-off | | (1,440.9 | ) | | (1,286.1 | ) |
| | | | |
|
| |
|
|
| | | | | 3,396.5 | | | 3,680.6 | |
| | | Construction in progress - cost | | 110.9 | | | 74.8 | |
| | | | |
|
| |
|
|
| | | | | 3,507.4 | | | 3,755.4 | |
| | | | |
|
| |
|
|
|
(e) | | Reconciliations | | | | | | |
|
| | | Reconciliations of the carrying amounts of each class of property, plant and equipment at the beginning and end of the current financial year are set out below. |
| | | | | | Millions of Dollars (A$)
| | | | | | | |
| | | Government facilities
| | | Mine properties and mine development
| | | Property, land and buildings
| | | Plant and equipment
| | | Total
| |
| Carrying amount at 1 January 2001 | | 32.9 | | | 999.4 | | | 405.3 | | | 3,755.4 | | | 5,193.0 | |
| Additions | | 0.8 | | | 221.6 | | | 19.9 | | | 184.5 | | | 426.8 | |
| Disposals | | — | | | (131.7 | ) | | (9.5 | ) | | (65.0 | ) | | (206.2 | ) |
| Depreciation/amortization expense | | (1.7 | ) | | (248.3 | ) | | (27.2 | ) | | (301.2 | ) | | (578.4 | ) |
| Assets written off | | — | | | (4.7 | ) | | (1.8 | ) | | (54.1 | ) | | (60.6 | ) |
| Capitalised depreciation | | — | | | — | | | — | | | 0.7 | | | 0.7 | |
| Reclassifications | | — | | | 13.7 | | | (0.8 | ) | | (12.9 | ) | | — | |
| | |
|
| |
|
| |
|
| |
|
| |
|
|
| Carrying amount at December 31, 2001 | | 32.0 | | | 850.0 | | | 385.9 | | | 3,507.4 | | | 4,775.3 | |
| | |
|
| |
|
| |
|
| |
|
| |
|
|
|
(f) | | Long lived asset held for sale | | | | |
|
| | | During 2001, WMC Resources reviewed its asset strategy and decided to focus on building a portfolio of long life, low cost assets. As a result, the company proposed divestment of the Kambalda nickel mines as well as the gold and talc businesses. Not all designated assets have been divested and accordingly the following long lived asset is held for sale: |
|
| | | Long/Victor | | | | |
|
| | | The Long/Victor mine formed part of the Kambalda nickel mines. A sale of WMC Resources’ interest is expected during 2002. This asset is now held in the “Nickel” business segment. At 31 December 2001, Long/Victor has a carrying value of A$1.6 million. The result for the year ended 31 December 2001 was immaterial. |
F-37
WMC RESOURCES LTD AND CONTROLLED ENTITIES
Notes to the Combined Financial Statements
| | | As at 31 December
| |
| | | 2001 | | | 2000 | |
| | | A$
| | | A$
| |
19. NON-CURRENT ASSETS - DEFERRED TAX ASSETS | | | | | | |
| Future income tax benefit | | 303.7 | | | 181.8 | |
| | |
|
| |
|
|
Future income tax benefit - US GAAP | | | | | | |
| Future income tax benefit before valuation allowance: | | | | | | |
| - Income tax losses | | 378.1 | | | 214.6 | |
| - Income tax timing differences | | 63.1 | | | 85.4 | |
| - Capital losses | | 63.9 | | | 63.9 | |
| - Capital timing differences | | (149.5 | ) | | (140.3 | ) |
| | |
|
| |
|
|
| | | 355.6 | | | 223.6 | |
| | |
|
| |
|
|
Valuation allowance: | | | | | | |
| (Australian GAAP, Income tax benefits not brought to account) | | | | | | |
| - Income tax losses | | (88.4 | ) | | (57.7 | ) |
| - Income tax timing differences | | (49.1 | ) | | (60.5 | ) |
| - Capital losses | | (63.9 | ) | | (63.9 | ) |
| - Capital timing differences | | 149.5 | | | 140.3 | |
| | |
|
| |
|
|
| | | (51.9 | ) | | (41.8 | ) |
| | |
|
| |
|
|
Future income tax benefit after valuation allowance: | | | | | | |
| (Australian GAAP, future income tax benefits) | | | | | | |
| - Income tax losses | | 289.7 | | | 156.9 | |
| - Income tax timing differences | | 14.0 | | | 24.9 | |
| | |
|
| |
|
|
| | | 303.7 | | | 181.8 | |
| | |
|
| |
|
|
| The timing differences represented by the net future income tax benefits are: | | | | | | |
| Amortization and depreciation | | (64.2 | ) | | (41.7 | ) |
| Prepayments | | (0.3 | ) | | (1.2 | ) |
| Provisions | | 3.0 | | | 2.9 | |
| Stores | | (3.2 | ) | | (4.2 | ) |
| Foreign exchange | | 78.9 | | | 67.6 | |
| Financial instruments | | 0.1 | | | (0.2 | ) |
| Tax losses | | 289.7 | | | 156.9 | |
| Other | | (0.3 | ) | | 1.7 | |
| | |
|
| |
|
|
| | | 303.7 | | | 181.8 | |
| | |
|
| |
|
|
F-38
WMC RESOURCES LTD AND CONTROLLED ENTITIES
Notes to the Combined Financial Statements
| | | | | Notes
| | | As at 31 December
| |
| | | | | | 2001 | | | 2000 | |
| | | | | | A$
| | | A$
| |
20. | | NON-CURRENT ASSETS - OTHER ASSETS | | | | | | | | | |
| | | Research and development | | 20 | (a) | | 0.5 | | | 2.4 | |
| | | Capitalised systems upgrade | | 20 | (b) | | 20.5 | | | 35.8 | |
| | | Deferred losses-hedging contracts | | 12 | (a) | | 1,188.2 | | | 876.7 | |
| | | Deferred borrowing costs and premiums | | 20 | (c) | | 7.8 | | | 14.9 | |
| | | Other | | | | | 19.5 | | | 39.0 | |
| | | | | | | |
|
| |
|
|
| | | | | | | | 1,236.5 | | | 968.8 | |
| | | | | | | |
|
| |
|
|
| (a) | | Research and development | | | | | | | | | |
(i) | | Cost brought forward | | | | | 7.4 | | | 9.8 | |
| | | - expenditure | | | �� | | — | | | 0.3 | |
| | | - write-offs | | | | | (0.4 | ) | | (1.4 | ) |
| | | - transferred or sold | | | | | 0.2 | | | (1.3 | ) |
| | | | | | | |
|
| |
|
|
| | | Cost carried forward | | | | | 7.2 | | | 7.4 | |
| | | | | | | |
|
| |
|
|
(ii) | | Provision brought forward | | | | | (5.0 | ) | | (4.9 | ) |
| | | - charged to profit and loss | | | | | (1.7 | ) | | (2.7 | ) |
| | | - reversed on sale, transfer or reclassification | | | | | — | | | 3.6 | |
| | | - transfers from other accounts | | | | | — | | | (1.0 | ) |
| | | | | | | |
|
| |
|
|
| | | Provision carried forward | | | | | (6.7 | ) | | (5.0 | ) |
| | | | | | | |
|
| |
|
|
| | | | | | | | 0.5 | | | 2.4 | |
| | | | | | | |
|
| |
|
|
| (b) | | Capitalised systems upgrade | | | | | | | | | |
| | | Cost of commercial systems software | | | | | 70.7 | | | 70.7 | |
| | | Provision for amortization | | | | | (50.2 | ) | | (34.9 | ) |
| | | | | | | |
|
| |
|
|
| | | | | | | | 20.5 | | | 35.8 | |
| | | | | | | |
|
| |
|
|
| (c) | | Deferred borrowing costs and premiums | | | | | | | | | |
| | | Cost | | | | | 45.0 | | | 45.0 | |
| | | Provision for amortization | | | | | (37.2 | ) | | (30.1 | ) |
| | | | | | | |
|
| |
|
|
| | | | | | | | 7.8 | | | 14.9 | |
| | | | | | | |
|
| |
|
|
21. CURRENT LIABILITIES - PAYABLES |
| | | | | | | | | |
| | | Trade creditors | | | | 159.1 | | 181.6 |
| | | Creditors relating to hedging contracts | | | | 555.7 | | 310.0 |
| | | Other creditors | | | | 140.4 | | 166.5 |
| | | | | | |
| |
|
| | | | | | | 855.2 | | 658.1 |
| | | | | | |
| |
|
F-39
WMC RESOURCES LTD AND CONTROLLED ENTITIES
Notes to the Combined Financial Statements
| | | | | As at 31 December
|
| | | | 2001 | | 2000 |
| | | Notes
| | A$
| | A$
|
22. CURRENT LIABILITIES - INTEREST BEARING LIABILITIES | | | | | | |
|
| Bank overdrafts | | | | 0.2 | | 3.9 |
| Borrowings | | 27(a) | | 584.1 | | 360.2 |
| | | | |
| |
|
| | | | | 584.3 | | 364.1 |
| | | | |
| |
|
| | | | | | | |
(a) Current Liabilities - borrowings and overdrafts
Category of aggregate short term borrowings
| | Balance at end of year
| | Weighted average interest rate on balance date borrowings
| | Maximum amount outstanding during period(i)
| | Average amount outstanding during period(ii)
| | Weighted average interest rate during period(iii)
|
| | | A$
| | %
| | A$
| | A$
| | %
|
Year ended 31 December 2001. | | | | | | | | | | |
| Bank overdrafts | | 0.2 | | 8.00 | | 0.5 | | 0.2 | | 8.67 |
| Other loans | | 584.1 | | 3.20 | | 1,119.5 | | 752.9 | | 5.28 |
| | |
| | | | | | | | |
| | | 584.3 | | | | | | | | |
| | |
| | | | | | | | |
|
Year ended 31 December 2000. | | | | | | | | | | |
| Bank overdrafts | | 3.9 | | 9.70 | | 50.9 | | 2.5 | | 8.95 |
| Other loans | | 360.2 | | 7.36 | | 400.1 | | 295.3 | | 6.59 |
| | |
| | | | | | | | |
| | | 364.1 | | | | | | | | |
| | |
| | | | | | | | |
(i) Based on bank statement balances. (ii) Based on average monthly balance. (iii) Based on weighted average monthly interest rates. (iv) There are no significant unused committed lines of credit for short-term financing. |
F-40
WMC RESOURCES LTD AND CONTROLLED ENTITIES
Notes to the Combined Financial Statements
| | | Notes
| | | As at 31 December
|
| | | | 2001 | | 2000 |
| | | | A$
| | A$
|
23. CURRENT LIABILITIES – CURRENT TAX | | | | | | | |
|
| Current income tax | | | | | 8.0 | | 4.7 |
| | | | | |
| |
|
|
24. CURRENT LIABILITIES – PROVISIONS | | | | | | | |
| Employee entitlements | | 29 | (a) | | 46.8 | | 39.3 |
| Rehabilitation | | | | | 5.8 | | 5.3 |
| Other | | | | | 22.1 | | 17.1 |
| | | | | |
| |
|
| | | | | | 74.7 | | 61.7 |
| | | | | |
| |
|
|
25. CURRENT LIABILITIES – OTHER | | | | | | | |
|
| Deferred realized profits-gold hedge close out | | | | | — | | 49.8 |
| Prepaid revenue | | | | | 8.0 | | 8.9 |
| Other | | | | | 7.1 | | 8.2 |
| | | | | |
| |
|
| | | | | | 15.1 | | 66.9 |
| | | | | |
| |
|
|
26. NON-CURRENT LIABILITIES – PAYABLES | | | | | | | |
|
| Creditors relating to hedging contracts | | | | | 1,142.3 | | 1,060.9 |
| Other creditors | | | | | 55.4 | | 65.6 |
| | | | | |
| |
|
| | | | | | 1,197.7 | | 1,126.5 |
| | | | | |
| |
|
F-41
WMC RESOURCES LTD AND CONTROLLED ENTITIES
Notes to the Combined Financial Statements
| | | | | | | | As at 31 December
| |
| | | | | | | | 2001 | | | 2000 | |
| | | | | Notes
| | | A$
| | | A$
| |
27. | | NON-CURRENT LIABILITIES - INTEREST BEARING LIABILITIES | | | | | | | | | |
| | | Borrowings | | 27 | (a) | | 1,737.7 | | | 2,580.2 | |
| | | | | | | |
|
| |
|
|
|
| (a) | | Total borrowings | | | | | | | | | |
| | | Disclosed as: | | | | | | | | | |
| | | - current liabilities (due in 12 months or less) | | 22 | | | 584.1 | | | 360.2 | |
| | | - non-current liabilities (due in more than 12 months) | | | | | 1,737.7 | | | 2,580.2 | |
| | | | | | | |
|
| |
|
|
| | | | | | | | 2,321.8 | | | 2,940.4 | |
| | | | | | | |
|
| |
|
|
|
| (b) | | Description | | | | | | | | | |
| | | Unsecured: | | | | | | | | | |
| | | US$200 million Notes at 7.35% due 1 December 2026 | | | | | 391.1 | | | 360.5 | |
| | | US$150 million Debentures at 7.25% due 15 November 2013 | | | | | 293.3 | | | 270.4 | |
| | | A$50 million Note at floating interest rates applicable | | | | | 50.0 | * | | 50.0 | * |
| | | in Australia due 18 May 2009 | | | | | | | | | |
| | | US$200 million Notes at 6.75% due 1 December 2006 | | | | | 391.1 | | | 360.5 | |
| | | US$250 million Notes at 6.5% due 15 November 2003 | | | | | 488.9 | | | 450.6 | |
| | | A$200 million Notes at 6.0% due 25 May 2002 | | | | | 200.0 | * | | 200.0 | * |
| | | Promissory notes (Weighted average rate of 4.38%-2000:-6.38%) | | | | | 240.0 | | | 545.0 | |
| | | Bank loans at floating interest rates applicable in Australia | | | | | 230.1 | * | | 657.3 | * |
| | | (Weighted average rate of 3.14%-2000 :-7.05%) | | | | | | | | | |
| | | Bank loans at floating interest rates applicable in Australia | | | | | 37.3 | | | 46.1 | |
| | | (Weighted average rate of 1.8%-2000 :-7.05%) | | | | | | | | | |
| | | | | | | |
|
| |
|
|
| | | | | | | | 2,321.8 | | | 2,940.4 | |
| | | | | | | |
|
| |
|
|
| | | *These amounts have been swapped to US dollars (refer to Note 35B) | | | | | | | | | |
|
| (c) | | Currencies | | | | | | | | | |
| | | US dollars | | | | | 1,064.5 | | | 1,329.0 | |
| | | GB pounds | | | | | 0.1 | | | — | |
| | | | | | | |
|
| |
|
|
| | | A$ equivalent of above currencies | | | | | 2,081.8 | | | 2,395.4 | |
| | | Australian dollars | | | | | 240.0 | | | 545.0 | |
| | | | | | | |
|
| |
|
|
| | | Australian dollars | | | | | 2,321.8 | | | 2,940.4 | |
| | | | | | | |
|
| |
|
|
|
| (d) | | Exchange Rates | | | | | | | | | |
| | | Exchange rates as at balance date used in translations: | | | | | | | | | |
| | | A$1 = US$ | | | | | 0.5114 | | | 0.5548 | |
| | | A$1 = GBP | | | | | 0.3527 | | | — | |
| (e) | | Analysis of repayments | | | | | | | | | |
| | | Current liabilities: | | | | | | | | | |
| | | In one year or less | | 22 | | | 584.1 | | | 360.2 | |
| | | | | | | |
|
| |
|
|
| | | Non-current liabilities: | | | | | | | | | |
| | | Between one and two years | | | | | 107.8 | | | 810.0 | |
| | | Between two and three years | | | | | 488.9 | | | 267.7 | |
| | | Between three and four years | | | | | — | | | 450.9 | |
| | | Between four and five years | | | | | 391.1 | | | — | |
| | | Later than five years | | | | | 749.9 | | | 1,051.6 | |
| | | | | | | |
|
| |
|
|
| | | | | | | | 1,737.7 | | | 2,580.2 | |
| | | | | | | |
|
| |
|
|
| | | | | | | | 2,321.8 | | | 2,940.4 | |
| | | | | | | |
|
| |
|
|
F-42
WMC RESOURCES LTD AND CONTROLLED ENTITIES
Notes to the Combined Financial Statements
| | | | | | | | As at 31 December
| |
| | | | | | | | 2001 | | | 2000 | |
| | | | | Notes
| | | A$
| | | A$
| |
28. | | NON-CURRENT LIABILITIES - DEFERRED TAX LIABILITIES | | | | | | | | | |
|
| | | Deferred income tax | | 28 | (a) | | 434.6 | | | 412.5 | |
| | | | | | | |
|
| |
|
|
| | | (a) The timing differences represented by the | | | | | | | | | |
| | | provision for deferred income tax are: | | | | | | | | | |
| | | Amortization and depreciation | | | | | 596.2 | | | 577.3 | |
| | | Prepayments | | | | | 1.2 | | | 27.1 | |
| | | Employee provisions | | | | | (16.4 | ) | | (15.3 | ) |
| | | Other provisions | | | | | (6.8 | ) | | (11.1 | ) |
| | | Stores | | | | | 18.4 | | | 19.7 | |
| | | Stock | | | | | (9.0 | ) | | (9.1 | ) |
| | | Foreign exchange | | | | | (1.7 | ) | | 6.1 | |
| | | Financial instruments | | | | | 11.3 | | | 4.9 | |
| | | Other | | | | | 19.0 | | | 12.4 | |
| | | Tax losses | | | | | (177.6 | ) | | (199.5 | ) |
| | | | | | | |
|
| |
|
|
| | | | | | | | 434.6 | | | 412.5 | |
| | | | | | | |
|
| |
|
|
|
29. | | NON-CURRENT LIABILITIES - PROVISIONS | | | | | | | | | |
|
| | | Employee entitlements | | | | | 12.6 | | | 15.0 | |
| | | Rehabilitation | | | | | 83.9 | | | 87.3 | |
| | | Other | | | | | 0.5 | | | 4.7 | |
| | | | | | | |
|
| |
|
|
| | | | | | | | 97.0 | | | 107.0 | |
| | | | | | | |
|
| |
|
|
| | | (a) The aggregate of provisions for employee entitlements as shown in Notes 24 and 29 is $59.4 million (2000: $54.3 million). |
|
30. | | NON-CURRENT LIABILITIES - OTHER | | | | | | | | | |
|
| | | Deferred realized profits-gold hedge close out | | | | | — | | | 61.2 | |
| | | Prepaid rent | | | | | 6.6 | | | 6.6 | |
| | | Deferred interest | | | | | — | | | 5.4 | |
| | | Other | | | | | 2.7 | | | 4.8 | |
| | | | | | | |
|
| |
|
|
| | | | | | | | 9.3 | | | 78.0 | |
| | | | | | | |
|
| |
|
|
|
31. | | | | | | | | | | | |
|
| | | Shareholders’ equity | | | | | 3,220.3 | | | 3,123.8 | |
| | | | | | | |
|
| |
|
|
|
| | | The above represents the deemed contribution of shareholders’ equity from the demerger of WMC Limited. Consequent on the demerger, shareholders in WMC Limited have become shareholders in WMC Resources Ltd on a pro-rata basis. Set out below for information is the number of shares issued by WMC Limited for the periods concerned. |
| | | | | | | | | | | | |
| | | | | | | | Number
| | | Number
| |
| | | Authorized | | | | | 2,000,000,000 | | | 2,000,000,000 | |
| | | Issued and fully paid | | | | | 1,108,821,653 | | | 1,097,898,726 | |
| | | Issued and partly paid to A$0.05 | | | | | 629,000 | | | 771,500 | |
F-43
WMC RESOURCES LTD AND CONTROLLED ENTITIES
Notes to the Combined Financial Statements
| | | | | | | | Year to 31 Dec 2001 | | | Year to 31 Dec 2000 | | | Year to 31 Dec 1999 | |
| | | | | Notes
| | | A$
| | | A$
| | | A$
| |
32. | | | | | | | | | | | | | | |
| | | Outside equity interest in controlled entities comprises: | | | | | | | | | | | | |
| | | Share capital | | | | | 2.6 | | | 2.6 | | | 2.6 | |
| | | Increase in value of assets | | | | | — | | | 6.7 | | | — | |
| | | Reserves | | | | | 0.7 | | | 0.7 | | | 0.7 | |
| | | Retained profits | | 32 | (a) | | 5.7 | | | 3.5 | | | 1.3 | |
| | | | | | | |
|
| |
|
| |
|
|
| | | | | | | | 9.0 | | | 13.5 | | | 4.6 | |
| | | | | | | |
|
| |
|
| |
|
|
|
(a) | | Retained profits reconciliation | | | | | | | | | | | | |
| | | Outside equity interests in operating profit after income tax | | | | | 2.2 | | | 3.2 | | | 4.1 | |
| | | Retained profits brought forward | | | | | 3.5 | | | 1.3 | | | 0.2 | |
| | | | | | | |
|
| |
|
| |
|
|
| | | Total available for appropriation | | | | | 5.7 | | | 4.5 | | | 4.3 | |
| | | Dividends provided for or paid | | | | | — | | | (1.0 | ) | | (3.0 | ) |
| | | | | | | |
|
| |
|
| |
|
|
| | | Retained profits at the end of the financial year | | | | | 5.7 | | | 3.5 | | | 1.3 | |
| | | | | | | |
|
| |
|
| |
|
|
|
33. | | NOTES TO THE STATEMENTS OF CASH FLOWS | | | | | | | | | | | | |
|
| | | (a) Reconciliation of operating profit after income tax to net cash provided by operating activities | | | | | | |
| | | Net Income before minority interests | | | | | 128.2 | | | 403.1 | | | 88.2 | |
| | | Government contributions for infrastructure assets | | | | | — | | | — | | | (18.0 | ) |
| | | Depreciation and amortization | | 3 | | | 596.2 | | | 510.8 | | | 406.0 | |
| | | Borrowing costs amortization | | | | | (5.4 | ) | | 6.1 | | | 10.8 | |
| | | Research and development written off | | | | | 0.4 | | | 1.4 | | | 3.1 | |
| | | (Profit)/loss on disposal of non-current assets | | | | | (275.1 | ) | | 6.9 | | | (2.5 | ) |
| | | Provision for diminution in investments and loans | | | | | 0.2 | | | 1.2 | | | (0.1 | ) |
| | | Unrealized exchange losses/(gains) | | | | | 0.6 | | | (1.9 | ) | | (1.5 | ) |
| | | Write down in value of inventory | | 3 | | | 7.7 | | | 6.2 | | | 8.0 | |
| | | Change in assets and liabilities adjusted for | | | | | | | | | | | | |
| | | (Increase)/Decrease in: | | | | | | | | | | | | |
| | | - inventories | | | | | (20.8 | ) | | (20.4 | ) | | (94.3 | ) |
| | | - receivables | | | | | 278.3 | | | (430.9 | ) | | 84.5 | |
| | | - future income tax benefits | | | | | (121.9 | ) | | (79.7 | ) | | 2.2 | |
| | | - other assets | | | | | (194.5 | ) | | (592.8 | ) | | 287.3 | |
| | | (Decrease)/Increase in: | | | | | | | | | | | | |
| | | - accounts payable | | | | | 154.7 | | | 858.6 | | | (523.1 | ) |
| | | - provision for income tax payable | | | | | 3.3 | | | (1.6 | ) | | (7.1 | ) |
| | | - provision for deferred income tax | | | | | 22.7 | | | 219.6 | | | (48.0 | ) |
| | | - other operating provisions | | | | | 14.5 | | | 9.4 | | | 3.6 | |
| | | - other liabilities | | | | | (11.4 | ) | | 2.1 | | | (34.2 | ) |
| | | | | | | |
|
| |
|
| |
|
|
| | | Net cash provided by operating activities | | | | | 577.7 | | | 898.1 | | | 164.9 | |
| | | | | | | |
|
| |
|
| |
|
|
|
| | | (b) Acquisition and Disposal of Controlled Entities | | | | | | | | | | | | |
| | | During the financial year the Company did not acquire or dispose of any material controlled entities. | | | |
|
| | | (c) Non-cash financing and investing activities | | | | | | | | | | | | |
| | | Proceeds of $25 million from the sale of the St Ives and Agnew gold operations were not received as at 31 December 2001. |
|
| | | (d) Financing facilities |
| | | Refer to Note 34. |
F-44
WMC RESOURCES LTD AND CONTROLLED ENTITIES
Notes to the Combined Financial Statements
34. | | | | Notes
| | | As at 31 December
|
| | | | 2001 A$
| | 2000 A$
|
| | | | |
|
| | | The total facilities available at balance date were as | | | | | | | |
| | | follows: | | | | | | | |
| | | Bank overdrafts | | | | | 0.2 | | 3.9 |
| | | Bank loan facilities | | 34 | (b) | | 958.2 | | 955.3 |
| | | Short term loan facilities | | | | | 451.9 | | 360.1 |
| | | Medium term loan facilities | | | | | 488.9 | | 532.0 |
| | | Long term loan facilities | | | | | 1,141.0 | | 1,502.4 |
| | | | | | | |
| |
|
| | | | | | | | 3,040.2 | | 3,353.7 |
| | | | | | | |
| |
|
| | | Used at balance date: | | | | | | | |
| | | Bank overdrafts | | | | | 0.2 | | 3.9 |
| | | Bank loan facilities | | 34 | (b) | | 240.0 | | 545.0 |
| | | Short term loan facilities | | | | | 451.9 | | 360.1 |
| | | Medium term loan facilities | | | | | 488.9 | | 532.0 |
| | | Long term loan facilities | | | | | 1,141.0 | | 1,502.4 |
| | | | | | | |
| |
|
| | | | | | | | 2,322.0 | | 2,943.4 |
| | | | | | | |
| |
|
| | | Available at balance date: | | | | | | | |
| | | Bank loan facilities | | 34 | (b) | | 718.2 | | 410.3 |
| | | | | | | |
| |
|
| | | | | | | | 718.2 | | 410.3 |
| | | | | | | |
| |
|
|
| (a) | | All facilities are in the name of WMC Finance Limited and WMC Finance (USA) Limited. The loan facilities are denominated in currencies as follows:- |
|
| | | Bank loans facilities | | | | | | | |
| | | United States dollars | | | | | 490.0 | | 530.0 |
| | | | | | | | | | (committed) |
| | | In some cases, these facilities may be drawn in another currency | | | | | | | |
| | | to the equivalent value of the denominated currency. | | | | | | | |
|
| | | Short term facilities | | | | | | | |
| | | Australian dollars | | | | | 414.7 | | 360.0 |
| | | United States dollars | | | | | 19.0 | | — |
|
| | | Medium term facilities | | | | | | | |
| | | Australian dollars | | | | | — | | 1,032.0 |
| | | United States dollars | | | | | 250.0 | | 25.0 |
|
| | | Long term facilities | | | | | | | |
| | | Australian dollars | | | | | 65.5 | | 60.0 |
| | | United States dollars | | | | | 550.0 | | 800.0 |
|
| (b) | | The bank loan facilities are available for general corporate purposes. $240.0 million (2000: $545.0 million) was utilised at balance date. The balances have been designated as credit standby facilities in respect of the US$ Commercial Paper programme, and therefore their use and availability has been determined in line with the outstandings under this programme. |
F-45
WMC RESOURCES LTD AND CONTROLLED ENTITIES
Notes to the Combined Financial Statements
35. FINANCIAL INSTRUMENTS
A. Hedging position
WMC Resources’ revenues will vary significantly with movements in commodity prices and the A$/US$ exchange rate. In the past these risks were managed through a hedging programme which provided management with increased assurance of revenue outcomes when planning future activities. The improved cost performance of the operations and the added diversity of revenue sources following the expansion of the Olympic Dam and the start up of the Queensland Fertilizer Operation have significantly improved expected cash flows throughout the business cycle. As a result, since December 1999, the Price Risk Management Policy has been revised to substantially reduce future hedging activity. Hedging is limited to gold revenue denominated in Australian dollars and revenue from specific projects where targeted returns can be secured.
As at 31 December 2001, WMC Resources had entered into a number of foreign exchange and commodity hedging contracts. These are explained below:
(i) Currency hedging
As at 31 December 2001, WMC Resources had the following hedge position against its currency exposures:
(a) WMC Resources subsidiary entities excluding Central Norseman Gold Corporation (CNGC)
As at 31 December 2001, US$2,104.3 million (2000: US$3,687.4 million) had been hedged at an average rate of A$/US$0.6570 (2000: 0.6516) at maturities extending to 2008 using a combination of forward contracts and options as detailed in the table below:
Maturity
| | Forward sale of US$
| | Bought US$ Put Options
| | Written US$ Call Options
|
| | | Amount US$m
| | Rate A$/US$
| | Amount US$m
| | Strike rate A$/US$
| | Amount US$m
| | Strike rate A$/US$
|
2002 | | 211.5 | | 0.6854 | | 252.3 | | 0.5875 | | 82.5 | | 0.6571 |
2003 | | 175.6 | | 0.6855 | | 82.5 | | 0.6571 | | 82.5 | | 0.6571 |
2004 | | 208.4 | | 0.6817 | | 92.5 | | 0.6500 | | 92.5 | | 0.6500 |
2005 | | 213.3 | | 0.6870 | | 92.5 | | 0.6500 | | 92.5 | | 0.6500 |
2006 | | 135.6 | | 0.6809 | | 92.5 | | 0.6500 | | 92.5 | | 0.6500 |
2007-2008 | | 338.1 | | 0.6595 | | 209.5 | | 0.6173 | | 209.5 | | 0.6173 |
For comparison, the following foreign currency hedge positions were in place at 31 December 2000:
Maturity
| | Forward sale of US$
| | Bought US$ Put Options
| | Written US$ Call Options
|
| | | Amount US$m
| | Rate A$/US$
| | Amount US$m
| | Strike rate A$/US$
| | Amount US$m
| | Strike rate A$/US$
|
2001 | | 427.1 | | 0.6846 | | 707.2 | | 0.6212 | | 202.0 | | 0.6523 |
2002 | | 312.8 | | 0.6682 | | 82.5 | | 0.6571 | | 82.5 | | 0.6571 |
2003 | | 256.3 | | 0.6709 | | 82.5 | | 0.6571 | | 82.5 | | 0.6571 |
2004 | | 272.2 | | 0.6694 | | 92.5 | | 0.6500 | | 92.5 | | 0.6500 |
2005 | | 294.3 | | 0.6734 | | 92.5 | | 0.6500 | | 92.5 | | 0.6500 |
2006-2008 | | 765.5 | | 0.6422 | | 302.0 | | 0.6273 | | 302.0 | | 0.6273 |
(b) CNGC
As at 31 December 2001, US$47.6 million (2000: US$74.9 million) had been hedged at an average rate of A$/US$0.6293 (2000: 0.6292) at maturities extending to 2003 using a combination of forward contracts and options as detailed in the table below:
Maturity
| | Forward sale of US$
| | Bought US$ Put Options
| | Written US$ Call Options
|
| | | Amount US$m
| | Rate A$/US$
| | Amount US$m
| | Strike rate A$/US$
| | Amount US$m
| | Strike rate A$/US$
|
2002 | | 23.5 | | 0.6289 | | 0.9 | | 0.6865 | | 0.9 | | 0.6865 |
2003 | | 23.2 | | 0.6275 | | — | | — | | — | | — |
F-46
WMC RESOURCES LTD AND CONTROLLED ENTITIES
Notes to the Combined Financial Statements
35. FINANCIAL INSTRUMENTS (Continued)
A. Hedging position (continued)
For comparison, the following foreign currency hedge positions were in place at 31 December 2000:
Maturity
| | Forward sale of US$
| | Bought US$ Put Options
| | Written US$ Call Options
|
| | | Amount US$m
| | Rate A$/US$
| | Amount US$m
| | Strike rate A$/US$
| | Amount US$m
| | Strike rate A$/US$
|
2001 | | 26.4 | | 0.6273 | | 9.9 | | 0.6311 | | 0.9 | | 0.6865 |
2002 | | 23.5 | | 0.6289 | | 0.9 | | 0.6865 | | 0.9 | �� | 0.6865 |
2003 | | 23.2 | | 0.6275 | | — | | — | | — | | — |
(ii) Commodity hedging
As at 31 December 2001, WMC Resources had the following hedge positions against its commodity exposures:
(a) WMC Resources subsidiary entities excluding CNGC
Gold
720,000 ounces of gold (2000: 1,852,665 ounces) had been hedged at an average gold price of A$586 per ounce (2000: US$306 per ounce) with maturities extending to 2010, as follows:
Maturity
| | Forward sale of Gold
|
| | | Amount Ounces
| | Rate A$/ounce
|
2002 | | 83,000 | | 500 |
2003 | | 80,000 | | 509 |
2004 | | 80,000 | | 521 |
2005 | | 80,000 | | 497 |
2006-2010 | | 397,000 | | 651 |
For comparison, the following gold hedge positions were in place at 31 December 2000:
Maturity
| | Forward sale of Gold
| | Bought Put Options
| | Written Call Options
|
| | | Amount Ounces
| | Rate US$/ounce
| | Amount ounces
| | Strike rate US$/ounce
| | Amount ounces
| | Strike rate US$/ounce
|
2001 | | 131,865 | | 299 | | 334,400 | | 290 | | 48,400 | | 293 |
2002 | | 142,300 | | 308 | | 100,250 | | 324 | | 100,250 | | 372 |
2003 | | 158,950 | | 338 | | 60,750 | | 314 | | 60,750 | | 345 |
2004 | | 111,150 | | 351 | | 74,800 | | 321 | | 74,800 | | 363 |
2005 | | 119,550 | | 354 | | 79,250 | | 324 | | 79,250 | | 373 |
2006-2010 | | 523,950 | | 370 | | 15,450 | | 293 | | 15,450 | | 293 |
As these contracts are entered into for the purpose of hedging future production, any unrealized gains and losses on the contracts, together with the cost of the contracts, are deferred until the underlying production occurs.
F-47
WMC RESOURCES LTD AND CONTROLLED ENTITIES
Notes to the Consolidated Financial Statements
35. FINANCIAL INSTRUMENTS (continued)
A. Hedging position (continued)
(ii) Commodity hedging (continued)
(b) CNGC-Gold
112,800 ounces of gold (2000: 248,000 ounces) had been hedged at US$307 per ounce (2000: US$301 per ounce) with maturities extending to 2003 using a combination of forward contracts and options as follows:
Maturity
| | Forward sale of Gold
| | Bought Put Options
| | Written Call Options
|
| | | Amount Ounces
| | Rate US$/ounce
| | Amount ounces
| | Strike rate US$/ounce
| | Amount ounces
| | Strike rate US$/ounce
|
2002 | | 36,000 | | 307 | | 22,500 | | 310 | | 22,500 | | 347 |
2003 | | 31,800 | | 307 | | 22,500 | | 310 | | 22,500 | | 347 |
45,000 ounces of gold (2000: Nil) has been hedged at A$440 per ounce with maturities extending to 2003, as follows:
Maturity
| | Forward sale of Gold
|
| | | Amount ounces
| | Rate A$/ounce
|
2002 | | 22,500 | | 440 |
2003 | | 22,500 | | 440 |
For comparison, the following gold hedge positions were in place at 31 December 2000:
Maturity
| | Forward sale of Gold
| | Bought Put Options
| | Written Call Options
|
| | | Amount ounces
| | Rate US$/ounce
| | Amount ounces
| | Strike rate US$/ounce
| | Amount ounces
| | Strike rate US$/ounce
|
2001 | | 66,100 | | 298 | | 24,100 | | 308 | | 22,500 | | 347 |
2002 | | 58,500 | | 298 | | 22,500 | | 310 | | 22,500 | | 347 |
2003 | | 54,300 | | 297 | | 22,500 | | 310 | | 22,500 | | 347 |
As these contracts are entered into for the purpose of hedging future production, any unrealized gains and losses on the contracts, together with the cost of the contracts, are deferred until the underlying production occurs.
F-48
WMC RESOURCES LTD AND CONTROLLED ENTITIES
Notes to the Combined Financial Statements
35. | | FINANCIAL INSTRUMENTS (Continued) |
| | | | WMC Resources is exposed to interest rate risk on its outstanding interest bearing liabilities and investments. Interest rate swaps and cross currency swaps allow the economic entity to manage its interest rate risk. |
| | | | (a) Interest rate and cross currency swaps |
| | | | As at 31 December 2001, WMC Resources had entered into the following interest rate hedging contracts in relation to its debt: |
Notional AUD principal
| | Interest swapped
| | Interest rate
| | Maturity
|
$m
| | | | Fixed
| | Float
| | |
| 100.0 | | Fixed for floating | | 6.00 | | 4.90 | | 27/5/2002 |
| 100.0 | | Fixed for floating | | 6.00 | | 4.90 | | 27/5/2002 |
| | | | | | | | |
| 200.0 | | | | | | | | |
|
Notional US principal
| | Interest swapped
| | Interest rate
| | Maturity
|
$m
| | | | Fixed
| | Float
| | |
| 25.0 | | Floating for fixed | | 7.02 | | 2.01 | | 15/11/2003 |
| 25.0 | | Floating for fixed | | 7.10 | | 2.01 | | 15/11/2013 |
| | | | | | | | |
| 50.0 | | | | | | | | |
|
| 25.0 | | Fixed for floating | | 6.50 | | 1.36 | | 15/11/2003 |
| 50.0 | | Fixed for floating | | 6.50 | | 0.93 | | 15/11/2003 |
| 25.0 | | Fixed for floating | | 6.75 | | 1.93 | | 1/12/2006 |
| 25.0 | | Fixed for floating | | 6.75 | | 1.91 | | 1/12/2006 |
| 25.0 | | Fixed for floating | | 6.75 | | 1.84 | | 1/12/2006 |
| 25.0 | | Fixed for floating | | 6.75 | | 1.83 | | 1/12/2006 |
| 25.0 | | Fixed for floating | | 7.55 | | 1.97 | | 15/11/2013 |
| 50.0 | | Fixed for floating | | 7.25 | | 1.94 | | 15/11/2013 |
| 40.0 | | Fixed for floating | | 7.25 | | 1.80 | | 15/11/2013 |
| 50.0 | | Fixed for floating | | 7.35 | | 2.77 | | 1/12/2026 |
| 25.0 | | Fixed for floating | | 7.35 | | 2.76 | | 1/12/2026 |
| 25.0 | | Fixed for floating | | 7.35 | | 2.80 | | 1/12/2026 |
| 50.0 | | Fixed for floating | | 7.35 | | 3.15 | | 2/12/2026 |
| | | | | | | | |
| 440.0 | | | | | | | | |
| | | | For comparison, WMC Resources had entered into the following interest rate swaps at 31 December 2000: |
Notional US principal
| | Interest swapped
| | Interest rate
| | Maturity
|
$m
| | | | Fixed
| | Float
| | |
| 150.0 | | Fixed for floating | | 6.64 | | 6.14 | | 15/11/2003 |
| 75.0 | | Fixed for floating | | 7.02 | | 6.76 | | 15/11/2003 |
| 100.0 | | Fixed for floating | | 6.50 | | 5.85 | | 17/11/2003 |
| 200.0 | | Fixed for floating | | 6.75 | | 6.56 | | 01/12/2006 |
| 115.0 | | Fixed for floating | | 7.25 | | 6.56 | | 15/11/2013 |
| 50.0 | | Fixed for floating | | 7.10 | | 6.76 | | 15/11/2013 |
| | | | | | | | |
| 690.0 | | | | | | | | |
F-49
WMC RESOURCES LTD AND CONTROLLED ENTITIES
Notes to the Combined Financial Statements
35. | | FINANCIAL INSTRUMENTS (Continued) |
| | B. | | Interest rate risk (continued) |
| | | | As at 31 December 2001, WMC Resources had entered into a cross currency swap, swapping A$380 million into US$ denominated debt of US$245.5 million as follows: |
A$m Debt
| | US$m Equivalent
| | Interest Rate
| | Maturity
|
| | | 2001 A$ Debt
| | 2001 US$ Debt
| |
| 50.0 | | 30.0 | | 5.30 | | 4.10 | | 2/4/2002 |
| 20.0 | | 12.6 | | 4.81 | | 2.92 | | 7/4/2002 |
| 50.0 | | 31.4 | | 4.81 | | 2.91 | | 7/4/2002 |
| 10.0 | | 6.3 | | 4.81 | | 5.12 | | 8/4/2002 |
| 200.0 | | 131.7 | | 4.85 | | 2.62 | | 8/5/2002 |
| 50.0 | | 33.5 | | 5.35 | | 3.06 | | 8/5/2009 |
| |
| | | | | | |
| 380.0 | | 245.5 | | | | | | |
| | | | For comparison, WMC Resources had entered into the following cross currency swaps at 31 December 2000: |
A$m debt
| | US$m equivalent
| | Interest Rate
| | Maturity
|
| | | A$ Debt
| | US$ Debt
| |
| | | | |
| 100.0 | | 60.4 | | 6.56 | | 7.51 | | 1/7/2001 |
| 40.0 | | 23.8 | | 6.55 | | 7.53 | | 1/7/2001 |
| 55.0 | | 33.0 | | 6.56 | | 7.26 | | 2/7/2001 |
| 90.0 | | 54.0 | | 6.56 | | 7.26 | | 2/7/2001 |
| 100.0 | | 60.0 | | 6.56 | | 7.28 | | 2/7/2001 |
| 50.0 | | 31.5 | | 7.03 | | 7.29 | | 8/4/2002 |
| 50.0 | | 31.5 | | 7.08 | | 7.72 | | 8/4/2002 |
| 50.0 | | 31.5 | | 7.01 | | 7.20 | | 8/4/2002 |
| 20.0 | | 12.6 | | 7.03 | | 7.26 | | 8/4/2002 |
| 200.0 | | 131.7 | | 6.81 | | 7.29 | | 28/5/2002 |
| 50.0 | | 33.5 | | 7.31 | | 7.29 | | 18/5/2009 |
| |
| | | | | | |
| 805.0 | | 503.5 | | | | | | |
(b) Interest rate caps
| | | | As at 31 December 2001, WMC Resources had entered into A$430 million of interest caps at 7.14% (2000: A$325 million at 8.27%). |
F-50
WMC RESOURCES LTD AND CONTROLLED ENTITIES
Notes to the Combined Financial Statements
35. FINANCIAL INSTRUMENTS (Continued)
(c) Interest rate risk exposure
WMC Resources’ exposure to interest rate risk and the effective weighted interest rate for classes of financial assets and liabilities is set out below:
| | | $ million
| | Floating interest rate%
| | | Fixed interest maturing in:
| | | Non- interest bearing
| | | Total
| |
As at 31 December 2001
| | | | 1 year or less
| | | Over 1 to 5 years
| | | More than 5 years
| | | |
Financial Assets | | | | | | | | | | | | | | | | | | | | |
| Cash assets | | | | 106.2 | | | 17.9 | | | — | | | — | | | — | | | 124.1 | |
| Receivables | | | | — | | | — | | | — | | | — | | | 977.4 | | | 977.4 | |
| Other financial assets | | | | — | | | — | | | — | | | — | | | 38.3 | | | 38.3 | |
| Interest rate swaps* | | | | 97.8 | | | 200.0 | | | 342.2 | | | 518.2 | | | — | | | 1,158.2 | |
| Cross currency swaps* | | | | 380.0 | | | — | | | — | | | — | | | — | | | 380.0 | |
| | | | |
|
| |
|
| |
|
| |
|
| |
|
| |
|
|
| | | | | 584.0 | | | 217.9 | | | 342.2 | | | 518.2 | | | 1,015.7 | | | 2,678.0 | |
| | | | |
|
| |
|
| |
|
| |
|
| |
|
| |
|
|
Weighted average interest rate | | | | 4.8 | % | | 6.1 | % | | 6.5 | % | | 6.5 | % | | | | | | |
|
Financial Liabilities | | | | | | | | | | | | | | | | | | | | |
| Payables | | | | — | | | — | | | — | | | — | | | 2,052.9 | | | 2,052.9 | |
| Bank overdrafts | | | | 0.2 | | | — | | | — | | | — | | | — | | | 0.2 | |
| Bank loans | | | | 167.3 | | | — | | | — | | | — | | | — | | | 167.3 | |
| Yankee Bond issues – $US | | | | — | | | — | | | 880.0 | | | 684.4 | | | — | | | 1,564.4 | |
| Australian Promissory Notes | | | | — | | | 240.0 | | | — | | | — | | | — | | | 240.0 | |
| Medium Term Bank Bilaterals | | | | — | | | 200.0 | | | — | | | 50.0 | | | — | | | 250.0 | |
| Interest rate swaps* | | | | 1,060.4 | | | — | | | 48.9 | | | 48.9 | | | — | | | 1,158.2 | |
| Cross currency swaps* | | | | 480.1 | | | — | | | — | | | — | | | — | | | 480.1 | |
| | | | |
|
| |
|
| |
|
| |
|
| |
|
| |
|
|
| | | | | 1,708.0 | | | 440.0 | | | 928.9 | | | 783.3 | | | 2,052.9 | | | 5,913.1 | |
| | | | |
|
| |
|
| |
|
| |
|
| |
|
| |
|
|
Weighted average interest rate | | | | 3.2 | % | | 5.1 | % | | 6.7 | % | | 6.6 | % | | | | | | |
|
| Net financial assets/(liabilities) | | | | (1,124.0 | ) | | (222.1 | ) | | (586.7 | ) | | (265.1 | ) | | (1,037.2 | ) | | (3,235.1 | ) |
| | | | |
|
| |
|
| |
|
| |
|
| |
|
| |
|
|
| | | $ million
| | Floating interest rate%
| | | Fixed interest maturing in:
| | | Non- interest bearing
| | | Total
| |
As at 31 December 2000
| | | | 1 year or less
| | | Over 1 to 5 years
| | | More than 5 years
| | | |
Financial Assets | | | | | | | | | | | | | | | | | | | | |
| Cash assets | | | | 43.3 | | | 19.0 | | | — | | | — | | | — | | | 62.3 | |
| Receivables | | | | — | | | — | | | — | | | — | | | 1,291.9 | | | 1,291.9 | |
| Other financial assets | | | | — | | | — | | | — | | | — | | | 38.8 | | | 38.8 | |
| Interest rate swaps* | | | | — | | | — | | | 585.8 | | | 657.9 | | | — | | | 1,243.7 | |
| Cross currency swaps* | | | | 805.0 | | | — | | | — | | | — | | | — | | | 805.0 | |
| | | | |
|
| |
|
| |
|
| |
|
| |
|
| |
|
|
| | | | | 848.3 | | | 19.0 | | | 585.8 | | | 657.9 | | | 1,330.7 | | | 3,441.7 | |
| | | | |
|
| |
|
| |
|
| |
|
| |
|
| |
|
|
Weighted average interest rate | | | | 6.7 | % | | 4.6 | % | | 6.8 | % | | 6.8 | % | | | | | | |
|
Financial Liabilities | | | | | | | | | | | | | | | | | | | | |
| Payables | | | | — | | | — | | | — | | | — | | | 1,784.6 | | | 1,784.6 | |
| Bank overdrafts | | | | 3.9 | | | — | | | — | | | — | | | — | | | 3.9 | |
| Bank loans | | | | 601.1 | | | — | | | — | | | — | | | — | | | 601.1 | |
| Yankee Bond issues – $US | | | | — | | | — | | | 811.2 | | | 630.8 | | | — | | | 1,442.0 | |
| Australian Promissory Notes | | | | — | | | 545.0 | | | — | | | — | | | — | | | 545.0 | |
| Medium Term Bank Bilaterals | | | | — | | | — | | | 200.0 | | | 50.0 | | | — | | | 250.0 | |
| Interest rate swaps* | | | | 1,243.7 | | | — | | | — | | | — | | | — | | | 1,243.7 | |
| Cross currency swaps* | | | | 907.3 | | | — | | | — | | | — | | | — | | | 907.3 | |
| | | | |
|
| |
|
| |
|
| |
|
| |
|
| |
|
|
| | | | | 2,756.0 | | | 545.0 | | | 1,011.2 | | | 680.8 | | | 1,784.6 | | | 6,777.6 | |
| | | | |
|
| |
|
| |
|
| |
|
| |
|
| |
|
|
Weighted average interest rate | | | | 6.8 | % | | 6.4 | % | | 6.7 | % | | 6.8 | % | | | | | | |
|
| Net financial assets/(liabilities) | | | | (1,907.7 | ) | | (526.0 | ) | | (425.4 | ) | | (22.9 | ) | | (453.9 | ) | | (3,335.9 | ) |
| | | | |
|
| |
|
| |
|
| |
|
| |
|
| |
|
|
| * | | Notional principal amounts |
F- 51
WMC RESOURCES LTD AND CONTROLLED ENTITIES
Notes to the Combined Financial Statements
35. FINANCIAL INSTRUMENTS (Continued)
C. Carrying amounts and estimated fair values of financial instruments
The carrying amounts and estimated fair values of the company’s financial instruments, referred to in Note 35A and 35B above were as follows:
| | | | | Millions of dollars | |
| | | | | Group equity consolidation
| |
| | | Notes
| | Carrying amount 2001 A$
| | | Fair value 2001 A$
| | | Carrying amount 2000 A$
| | | Fair value 2000 A$
| |
Recognized in the Balance Sheet | | | | | | | | | | | | | | |
Financial Assets | | | | | | | | | | | | | | |
| Cash assets | | 8 | | 124.1 | | | 124.1 | | | 62.3 | | | 62.3 | |
| Current other financial assets | | 10 | | 20.1 | | | 20.1 | | | 11.9 | | | 11.9 | |
| Current receivables | | 9 | | 496.0 | | | 582.3 | | | 690.9 | | | 702.5 | |
| Non-current receivables | | 13 | | 481.4 | | | 398.4 | | | 601.0 | | | 417.3 | |
| Non-current other financial assets | | 15 | | 18.2 | | | 19.2 | | | 26.9 | | | 34.2 | |
Financial Liabilities | | | | | | | | | | | | | | |
| Current payables | | 21 | | 855.2 | | | 855.6 | | | 658.1 | | | 808.5 | |
| Bank overdrafts | | 22 | | 0.2 | | | 0.2 | | | 3.9 | | | 3.9 | |
| Short term interest bearing liabilities | | 22 | | 584.1 | | | 584.1 | | | 360.2 | | | 360.2 | |
| Other current liabilities | | 25 | | 13.2 | | | 13.2 | | | 66.9 | | | 66.9 | |
| Non-current payables | | 26 | | 1,197.7 | | | 1,109.1 | | | 1,126.5 | | | 762.4 | |
| Long term interest bearing liabilities | | 27 | | 1,737.7 | | | 1,755.8 | | | 2,580.2 | | | 2,559.5 | |
| Other non-current liabilities | | 30 | | 9.3 | | | 9.3 | | | 78.0 | | | 78.0 | |
| | | | |
|
| |
|
| |
|
| |
|
|
Financial Instruments | | | | | | | | | | | | | | |
| Hedging contracts: | | | | | | | | | | | | | | |
| - forwards/swaps | | | | (816.5 | ) | | (729.2 | ) | | (431.4 | ) | | (457.6 | ) |
| - options | | | | (234.7 | ) | | (221.0 | ) | | (211.1 | ) | | (139.4 | ) |
| | | | |
|
| |
|
| |
|
| |
|
|
| | | | | (1,051.2 | ) | | (950.2 | ) | | (642.5 | ) | | (597.0 | ) |
| | | | |
|
| |
|
| |
|
| |
|
|
The following methods and assumptions were used to estimate the fair value of each class of financial instruments for which it is practicable to estimate a value:
Cash assets and current other financial assets
The carrying amount approximates fair value because of the short maturity of these instruments.
Non current other financial assets
The investments are carried at cost.
Debtors and creditors
The fair value of debtors and creditors relating to hedging contracts has been calculated on a mark-to-market basis using forward prices. Other current debtors and creditors mainly represent financial obligations incurred in exchange for goods and services provided and received by the economic entity in the normal course of its operations, net of provisions for doubtful debts. Due to the short-term nature of these financial obligations, their carrying values are estimated to equal their fair values.
Short and long term debt
The fair value of short-term debt and bank overdrafts is considered to approximate the carrying value due to the short maturity of the debt. Long-term debt comprises the Yankee Bond issues. The fair value of the Yankee Bond issue was determined on a mark-to-market basis. At December 31 2001 the 1993 Yankee Bond market value was US$412.9 million or A$807.5 million (2000: US$397.8 million; A$717.0 million) and the 1996 Yankee Bond market value was US$396.3 million or A$774.9 million (2000:US$390.7 million; A$704.3 million).
Foreign currency and commodity hedging contracts
Carrying amounts for commodity and foreign currency hedging contracts are based on the revaluation of open contracts at 31 December 2001 against spot rates at that date. The fair value disclosed represents the same contracts on a mark-to-market basis using forward rates and prices.
F-52
WMC RESOURCES LTD AND CONTROLLED ENTITIES
Notes to the Combined Financial Statements
35. FINANCIAL INSTRUMENTS (continued)
D. Deferred hedging gains and losses
As described in Note 1(e), Summary of Accounting Policies, gains and losses, premiums and discounts on hedging contracts and gains and losses associated with the revaluation of foreign denominated debt are deferred in the balance sheet until the underlying transaction takes place. Whether these deferred gains and losses will be realized and at what amount depends on commodity and currency price movements until the underlying date of the hedge contracts concerned. The expected recognition of the deferred gains and losses based on current valuations are shown below:
| | | Millions of dollars – 31 December 2001
| |
YEARS
| | <1 YEAR
| | | 1 - 2 YEARS
| | | 2 - 3 YEARS
| | | 3 - 4 YEARS
| | | 4 - 5 YEARS
| | | MORE THAN 5 YEARS
| | | TOTALS
| |
| Gains | | 164.1 | | | 185.7 | | | 7.0 | | | 11.0 | | | 3.1 | | | 250.8 | | | 621.7 | |
| Losses | | (321.8 | ) | | (341.9 | ) | | (170.5 | ) | | (179.4 | ) | | (46.3 | ) | | (907.7 | ) | | (1,967.6 | ) |
| | |
|
| |
|
| |
|
| |
|
| |
|
| |
|
| |
|
|
| Total | | (157.7 | ) | | (156.2 | ) | | (163.5 | ) | | (168.4 | ) | | (43.2 | ) | | (656.9 | ) | | (1,345.9 | ) |
| | |
|
| |
|
| |
|
| |
|
| |
|
| |
|
| |
|
|
| | | | | | | | | | | | | | | | | | | | | | |
| | | Total deferred on balance sheet (refer Note 12(a) ) | | (1,345.9 | ) |
| | | | | | | | | | | | | | | | | | | | |
|
|
For comparison, the following expected recognition of the deferred gains and losses based on valuations at 31 December 2000 are shown below:
| | | Millions of dollars – 31 December 2000
| |
YEARS
| | <1 YEAR
| | | 1 - 2 YEARS
| | | 2 - 3 YEARS
| | | 3 - 4 YEARS
| | | 4 - 5 YEARS
| | | MORE THAN 5 YEARS
| | | TOTALS
| |
| Gains | | 252.3 | | | 172.9 | | | 205.2 | | | 26.5 | | | 25.7 | | | 258.7 | | | 941.3 | |
| Losses | | (412.1 | ) | | (251.3 | ) | | (281.6 | ) | | (112.4 | ) | | (125.2 | ) | | (795.2 | ) | | (1,977.8 | ) |
| | |
|
| |
|
| |
|
| |
|
| |
|
| |
|
| |
|
|
| Total | | (159.8 | ) | | (78.4 | ) | | (76.4 | ) | | (85.9 | ) | | (99.5 | ) | | (536.5 | ) | | (1,036.5 | ) |
| | |
|
| |
|
| |
|
| |
|
| |
|
| |
|
| |
|
|
| | | | | | | | | | | | | | | | | | | | | | |
| | | Total deferred on balance sheet (refer Note 12(a)) | | (1,036.5 | ) |
| | | | | | | | | | | | | | | | | | | | |
|
|
E. Concentration of credit risk for derivative financial instruments
In the event of any counter parties failing to comply with the terms of derivative instrument contracts, the potential impact on the group would be determined by the market revaluation of any open contracts held with that counter party, except on the day of delivery in which case the potential loss for forward contracts would be the full principal amount. The group calculates credit exposures as the market revaluation plus a potential exposure amount. The potential exposure amount allows for the fact that the market revaluation of the contract may increase in the future. Exposures to any one counter party are strictly controlled by WMC Resources risk management policies relating to counter party limits. A geographical breakdown of the group’s credit risk for the derivative financial instruments is set out below.
| | | US$ Millions of dollars
|
Location
| | 2001
| | 2000
|
| Australia | | 190 | | 570 |
| America | | 138 | | 264 |
| Europe | | — | | 95 |
| Other | | — | | 10 |
| | |
| |
|
| | | 328 | | 939 |
| | |
| |
|
When computing the concentration of credit risk it is assumed that Australian companies, which WMC Resources deals with on the basis of an overseas parent company guarantee, are classified as Australian credit risk.
F. Infrastructure Bonds
WMC Resources Ltd has off-setting liabilities and assets relating to a Direct Infrastructure Bond issued by a WMC Resources subsidiary and the right to acquire an Indirect Infrastructure Bond. There is a right of simultaneous set-off between these two bonds on maturity or termination. The transaction on which interest is accruing, effective from 22 September 1997 will, unless previously terminated, result in income statement recognition as interest for a period of ten years and a corresponding reduction in the net liability of the bond. As part of the infrastructure bond transaction agreements, funds have been placed on deposit by another WMC Resources subsidiary with one of the other parties to the agreement and are being repaid, with interest, over the period of the transaction. In the event of changes to applicable laws the parties may cancel the transaction. If this happens, the liabilities and assets will be mutually settled and interest receivable will cease to accrue.
At balance date the balances of the components were:
| | | Millions of dollars
| |
| | | 2001
| | | 2000
| |
| • liability for Infrastructure Bond | | (370.4 | ) | | (344.3 | ) |
| • right to acquire Indirect Infrastructure Bond | | 296.5 | | | 265.1 | |
| • funds on deposit | | 71.2 | | | 76.9 | |
| | |
|
| |
|
|
| Net deferred revenue | | (2.7 | ) | | (2.3 | ) |
| | |
|
| |
|
|
F-53
WMC RESOURCES LTD AND CONTROLLED ENTITIES
Notes to the Combined Financial Statements
36. PARTICULARS RELATING TO ENTITIES COMBINED IN THE ECONOMIC ENTITY
Entities Combined
| | Notes
| | Place of Incorporation
|
NAME | | | | |
| WMC Resources Ltd | | | | VIC |
|
All controlled entities are wholly owned, unless otherwise indicated | | | | |
Controlled Entities | | | | |
| 141 Union Company | | B,a | | Delaware USA |
| A&BP Co. Pty Ltd | | C | | WA |
| Adwest Limited Partnership | | C | | |
| Agnew Mining Company Pty Ltd | | C | | WA |
| Albion Downs Pty. Ltd. | | C,g | | WA |
| Carson Hill Gold Mining Corporation | | B,a | | Delaware USA |
| Central Norseman Gold Corporation Ltd (owned 50.48%) | | | | VIC |
| Great Boulder Mines Pty Ltd | | C | | VIC |
| Hi-Fert Distributors Pty. Ltd. | | C | | SA |
| Hi-Fert Pty. Ltd. | | | | SA |
| Hillcrest Inc. (owned ~ 100%) | | A,j | | Philippines |
| Liberia Western Mining Corporation Limited (owned 97.4%) | | B,h | | Liberia |
| Minera WMC Chile Exploration Ltda | | B | | Chile |
| Mineracao Alfenus Limitada (owned ~ 100% | | B,h | | Brazil |
| Mineracao Ituverava Limitada (owned ~ 100%) | | B,h | | Brazil |
| Mineracao Jenipapo S.A. (owned ~ 100% | | B | | Brazil |
| Mineracao Wesminas Limitada (owned ~ 100%) | | B | | Brazil |
| Olympic Dam Marketing Pty. Ltd. | | C | | SA |
| P&DP Co. Pty Ltd | | C | | WA |
| PT Solok Mas Minerals (owned 80%) | | d,h | | Indonesia |
| PT WMC Services | | d | | Indonesia |
| Q.S. Mineracoa Ltda (owned ~ 100% | | | | Brazil |
| Ringwood Station Partnership | | | | |
| Three Springs Talc Pty Limited | | | | Australia |
| WPF Pty Ltd | | C | | QLD |
| Wesminco Oil Pty. Ltd. | | | | VIC |
| Western Exploration Pty. Ltd. | | C | | VIC |
| Western Hog Ranch Company | | B,a | | Nevada USA |
| Western Mining Corporation Pty Ltd | | C | | VIC |
| Western Venture Inc. | | B,a | | Delaware USA |
| Westmin Talc (UK) | | | | UK |
| Westmin Talc Pty Ltd | | | | VIC |
| Westminer Insurance Pte. Ltd. | | a | | Singapore |
| WMC (Argentina) Inc. | | B | | Delaware USA |
F-54
WMC RESOURCES LTD AND CONTROLLED ENTITIES
Notes to and forming part of the Financial Statements
36. PARTICULARS RELATING TO ENTITIES COMBINED IN THE ECONOMIC ENTITY (Continued)
Entities Combined
| | Notes
| | Place of Incorporation
|
| WMC (China) Pty Limited | | C | | VIC |
| WMC (Kunming) Pty Limited | | C | | VIC |
| WMC (Liberia) Limited | | | | Hong Kong |
| WMC (Mineral Sands) Limited | | | | Jersey |
| WMC (Olympic Dam Corporation) Pty. Ltd. | | | | SA |
| WMC (Olympic Dam Operations) Pty. Ltd. | | | | VIC |
| WMC (Overseas) Pty. Limited | | C | | VIC |
| WMC (Peru) Inc. | | d | | Delaware USA |
| WMC (Philippines) Inc. | | A,j | | Philippines |
| WMC (Uzbekistan) Ltd. | | | | Jersey |
| WMC (Yunnan) Pty Limited | | C | | VIC |
| WMC (Zarmitan) Ltd. | | | | Jersey |
| WMC Automation Pty Ltd | | C | | WA |
| WMC Chile S.A. | | d | | Chile |
| WMC Corporate Services Inc. | | B,d | | Delaware USA |
| WMC Exploration Corporation | | f | | Philippines |
| WMC Exploration Inc. | | | | Delaware USA |
| WMC Fertilizers Pty Ltd | | | | VIC |
| WMC Finance (USA) Limited | | | | VIC |
| WMC Finance Limited | | | | ACT |
| WMC Holdings Pty Ltd | | C | | SA |
| WMC Innovation Pty Ltd | | C | | VIC |
| WMC International Holdings Ltd. | | B,d | | Canada |
| WMC International Limited | | B,a | | Canada |
| WMC Kazakstan Ltd. | | | | Jersey |
| WMC Liberia Management Limited | | B,h | | Liberia |
| WMC Mineracao Limitada (owned ~ 100%) | | B,d | | Brazil |
| WMC Miniere Sarl | | j | | French Guiana |
| WMC Nickel Sales Corporation Limited | | B | | UK |
| WMC Participacoes Limitada | | B,i | | Brazil |
| WMC Petroleum (Malaysia) Snd. Bhd. (in liquidation) | | A | | Malaysia |
| WMC Resources International Pty. Ltd. | | | | VIC |
| WMC Securities Pty Ltd | | | | WA |
| WMC Services Pty. Limited | | C | | ACT |
| WMC Superannuation Fund Pty Ltd (owned 50%) | | | | Australia |
| WMC Xinjiang Mineral Industry Services Company | | | | China |
| Yakabindie Nickel Limited | | e | | NSW |
| Yeelirrie Development Company Pty. Ltd. | | C | | WA |
| Yeelirrie Management Services Pty. Ltd. | | C | | WA |
| Yeelirrie Pastoral Station Partnership | | | | |
F-55
WMC RESOURCES LTD AND CONTROLLED ENTITIES
Notes to and forming part of the Financial Statements
36. PARTICULARS RELATING TO ENTITIES COMBINED IN THE ECONOMIC ENTITY (Continued)
These combined entities:
| | A) | | have not been required to prepare audited accounts as they are in voluntary liquidation; |
| | B) | | have not prepared audited accounts either as they are non-operating or audited accounts are not required in their country of incorporation; |
| | C) | | as small proprietary corporations, are not required to prepare financial reports. |
| | All | | information contained in the combined financial statements with respect to the entities noted as A, B or C was audited; |
| | (a) | | Been translated as a self-sustaining entity. |
| | (b) | | The remaining shares are held in trust for the Company by the vendors, pending compliance with conditions precedent in the sales agreement. |
| | (c) | | Although not a company, included as a controlled entity in compliance with AASB 1024. |
| | (d) | | Has been translated as an integrated entity. |
| | (e) | | Yakabindie Nickel Limited, a company incorporating a lease and exploration work on the Yakabindie nickel project near Mount Keith, was acquired by the purchase method on January 25, 2001. Its purchase consideration was A$40 million, A$25 million of which was paid at the time of the acquisition with the remaining A$15 million due upon gaining approval to mine the property. The results of its operations since 25 January, 2001 have been incorporated into WMC Resources. There is no goodwill arising on acquisition. No pro forma revenue has been disclosed as it is immaterial. |
| | (f) | | This company is in the process of being liquidated. |
| | (g) | | This company is owned 100% by Newmount Mt Keith ACM Pty Ltd (with a call option in favour of, and a put option against, WMC Limited, both exercisable before 16 June, 2012). |
| | (h) | | This company is in the process of dissolution. |
| | (i) | | It is intended to dissolve this company. |
| | (j) | | WMC Resources International is currently in the process of selling to third parties. |
| | (k) | | WMC Resources has a 40% ownership in Agnew Pastoral Company Pty. Ltd. and Weebo Pastoral Company Pty. Ltd. which are accounted for as incorporated partnerships. |
| | (l) | | WMC Resources has a 80% ownership in Yunnan Hua Ao Nickel Exploration and Mining Co. Ltd and Yunnan Xin Ao Nickel Exploration and Mining Co. Ltd which are equity accounted. |
F-56
WMC RESOURCES LTD AND CONTROLLED ENTITIES
Notes to the Combined Financial Statements
| | | | | As at 31 December
|
| | | | | 2001 | | 2000 |
| | | | | A$
| | A$
|
|
37. | | CONTINGENT LIABILITIES AND GAINS | | | | |
|
(a) | | Ascertainable, unsecured | | | | |
| (i) | | Guarantees, insurance bonds and other liabilities including performance bonds for minimum work commitments in exploration blocks. | | 57.6 | | 60.2 |
| (ii) | | Contract disputes and other legal claims, arising out of WMC Resources ongoing mining and related construction activities. | | 7.5 | | 35.2 |
| (iii) | | As disclosed in the accounting policy Note 1(h), an assessment is made at each operation for future rehabilitation work which will be incurred as a result of currently existing circumstances and a provision is accumulated for this expenditure charged on a proportionate basis to production over the lesser of the life of operation or twenty years (thirty years for Olympic Dam). At 31 December 2001 WMC Resources had accrued rehabilitation provisions of $89.7 million (Dec 2000: $92.7 million). The company estimates that, as at 31 December 2001, the total rehabilitation costs that would be incurred upon the disposal or abandonment of its mineral properties would be $349.4 million (Dec 2000 : $354.8 million), resulting in an unaccrued liability of | | 259.7 | | 262.1 |
| | | | |
| |
|
(b) | | Unascertainable unsecured contingent liabilities and asset | | | | |
|
| (i) | | Under various joint venture production and exploration agreements. | | | | |
|
| (ii) | | Native Title: | | | | |
| | | The majority of WMC Resources’ interests fall within one or more Applications for Native Title Determination. The applications are filed for hearing in the Federal Court of Australia. WMC Resources cannot make any assessment whether existing assets or operations will be materially affected until it is determined what rights, if any, the applicants are entitled to. Recent decisions of the High Court indicate that each claim will be decided on its facts. | | | | |
|
| | | Consideration of the implications of Court Determinations makes it evident there are complex legal and factual issues potentially affecting existing and future WMC Resources’ interests. Accordingly, the impact of these developments cannot be determined at this time, although it is indicated that no native title rights reside in minerals where valid state legislation has placed minerals in Crown ownership. | | | | |
|
| (iii) | | An insurance claim related to the fire in the solvent extraction plant at Olympic Dam has been lodged with insurers. Investigations into the fire are in progress. The lead insurer has formally accepted liability with regard to the event. The actual claim will be predicated on an estimated rebuild cost and the business interruption impact. | | | | |
F-57
WMC RESOURCES LTD AND CONTROLLED ENTITIES
Notes to the Combined Financial Statements
| | | | | As at 31 December
|
| | | | | 2001 | | 2000 |
| | | | | A$
| | A$
|
38. | | | | | | |
(a) | | Capital expenditure contracted for: | | | | |
| | | Contracts for purchase of assets comprising mine properties and mine development, and property, plant and equipment. | | | | |
| | | Payments: | | | | |
| | | Within one year | | 35.4 | | 25.6 |
| | | | |
| |
|
| | | | | 35.4 | | 25.6 |
| | | | |
| |
|
|
(b) | | Potential expenditure on exploration and mining titles and attached business commitments | | | | |
| | | These tables set out estimates of expenditures which might have to be incurred for exploration, evaluation and mining activities during the life of current WMC Resources exploration and mining tenements and earning rights under farm-in and option entitlements. These sums are commitments for work expected to be beneficial to WMC Resources and include payments to vendors in which WMC Resources has earning rights. Australian mining laws generally require that certain levels of expenditure be incurred, rather than any payment made to Government, to maintain tenements in good standing. Mining laws in other jurisdictions may vary. This disclosure represents potential expenditure that may be reduced by seeking exemption from individual commitments or by relinquishment of tenure. | | | | |
|
(i) | | Exploration and mining titles | | | | |
| | | Within one year | | 19.2 | | 31.4 |
| | | Later than one year but not later than 5 years | | 95.4 | | 136.9 |
| | | Later than 5 years | | 260.5 | | 333.5 |
| | | | |
| |
|
| | | | | 375.1 | | 501.8 |
| | | | |
| |
|
|
(ii) | | Business undertaking commitments | | | | |
| | | Within one year | | 2.9 | | 13.7 |
| | | Later than one year but not later than 5 years | | 12.7 | | 38.5 |
| | | Later than 5 years | | 15.9 | | 82.8 |
| | | | |
| |
|
| | | | | 31.5 | | 135.0 |
| | | | |
| |
|
|
(c) | | Lease commitments contracted for operating leases (other than mineral and exploration leases) | | | | |
| | | The company and certain of its subsidiaries lease plant, | | | | |
| | | warehouse and office facilities and motor vehicles for varying | | | | |
| | | periods. Operating leases that expire generally are expected to | | | | |
| | | be renewed or replaced by other leases. The following is the | | | | |
| | | rental expense and the future minimum rental commitments. | | | | |
| (i) | | Lease commitments payable at balance date | | | | |
| | | Within one year | | 21.8 | | 25.7 |
| | | Later than one year but not later than 5 years | | 76.4 | | 90.3 |
| | | Later than 5 years | | 76.8 | | 93.9 |
| | | | |
| |
|
| | | | | 175.0 | | 209.9 |
| | | | |
| |
|
F-58
WMC RESOURCES LTD AND CONTROLLED ENTITIES
Notes to the Combined Financial Statements
| | | | | As at 31 December
|
| | | | | 2001 | | 2000 |
| | | | | A$
| | A$
|
38. | | COMMITMENTS (Continued) | | | | |
(d) | | Sub Leases | | | | |
| (i) | | Rental income included in profit and loss | | 1.2 | | 0.4 |
| | | | |
| |
|
| (ii) | | Lease commitments receivable at balance date | | | | |
| | | Within one year | | 1.6 | | 0.9 |
| | | Later than one year but not later than 5 years | | 4.9 | | 2.3 |
| | | Later than 5 years | | — | | 1.9 |
| | | | |
| |
|
| | | | | 6.5 | | 5.1 |
| | | | |
| |
|
(e) | | Other commitments (1) | | | | |
| | | Commitments for payments to suppliers under long-term contracts | | | | |
| | | existing at reporting date but not recognised as payable | | | | |
| | | Within one year | | 59.4 | | 59.4 |
| | | Later than one year but not later than 5 years | | 235.6 | | 235.6 |
| | | Later than 5 years | | 586.4 | | 645.8 |
| | | | |
| |
|
| | | | | 881.4 | | 940.8 |
| | | | |
| |
|
(1) WMC Resources is party to a number of gas supply, gas conversion, shiploading, rail transport and sulphuric acid supply agreements. Under these take or pay contracts, WMC Resources is obligated to pay a minimum amount for the above commodities and services even if those commodities or services are not required for operations. Commitments related to these contracts total A$194.9 million in 2002, A$201.9 million in 2003, A$221.5 million in 2004, A$231.3 million in 2005, A$235.4 million in 2006. Expenditures under these contracts totalled A$168.3 million in 2001, A$130.0 million in 2000 and A$99.8 million in 1999.
(f) Sales contracts and commitments
WMC Resources sells nickel metal, nickel matte, nickel concentrate and various intermediate-products. Approximately 75% of nickel metal sales for the year ended 31 December 2001 were made under short to medium term contractual arrangements, to a large number of customers in Europe, North America and Asia. These contracts extend through varying periods expiring between 2002 and 2004. Approximately 95% of nickel-in-matte and nickel-in-concentrate sales for the year ended 31 December 2001 were made under long term contracts expiring between 2002 and 2008. Prices in these contracts are generally not fixed, and provide for sales at prevailing market prices at the contractual settlement dates.
Approximately 90% of Olympic Dam’s copper production for the year ended 31 December 2001 was sold to customers in Europe, Australia and Asia under contracts which are negotiated. Prices in these contracts are generally not fixed, and provide for sales at prevailing market prices at the contractual settlement dates.
More than 90% of Olympic Dam’s uranium production is committed under long-term sales contracts with well established and reputable electricity generating utilities. Sales of uranium oxide in 2001 were made to the United Kingdom, Finland, Sweden, Belgium, France, Japan, Canada and the United States. Contract prices are fixed.
In relation to the fertilizer operations, supply contracts are in place with major Australian fertilizer distributors for the delivery of between 440,000 and 590,000 tonnes of DAP per year, depending on customer requirements. These contracts expire in 2004. Contracts covering domestic MAP sales of between 120,000 and 200,000 tonnes per year will become effective once commercial production volumes are commenced. These contracts extend through varying periods expiring between 2006 and 2009. WMC Resources has also contracted to export 350,000 tonnes per year of high analysis fertilizer into Asia. The arrangement provides for up to 500,000 tonnes per year to be sold if required by WMC Resources. Prices in these contracts are generally not fixed, and provide for sales at prevailing market prices at the contractual settlement dates. These contracts expire in 2005.
All of WMC Resources’ major products are able to be purchased on a spot market in order to fulfill the sales contracts referred to above if required.
F-59
WMC RESOURCES LTD AND CONTROLLED ENTITIES
Notes to the Combined Financial Statements
39. SUPERANNUATION BENEFITS
During the periods presented, all WMC Resources’ employees were members of the WMC Limited’s Superannuation Fund (later WMC Superannuation Plan). At the date of the demerger, WMC Resources assumed responsibility for the pension benefits for current and former employees of WMC Limited. WMC Resources’ employees continued as members of the WMC Limited Superannuation Fund following the demerger. The information presented is for the WMC Limited Superannuation Fund.
Prior to 27 July 2001, WMC Resources participated in the WMC Superannuation Fund. From 27 July 2001, all assets and liabilities of the WMC Superannuation Fund, future employer contributions and ongoing management of employee’s superannuation entitlements were transferred to the WMC Superannuation Plan (the Plan), an independently managed sub-plan of the Plum Superannuation Fund.
Plan membership is compulsory for all Australian resident employees and Australian expatriates, and provides lump sum benefits on retirement, permanent disability, death, resignation and retrenchment. WMC does not sponsor any other defined – benefit post retirement plans. For non-Australian employees WMC contributes to an appropriate accumulation plan as required by agreement or under local legislation.
The Plan has three categories of membership.
The Defined Benefit Category was closed to new members effective 1 July 1994, however, the then members had, and continue to have, the option to remain in the Defined Benefit Category or to transfer to the Accumulation Category. The Defined Benefit Category provides lump sum benefits based on period of service, age and final average salary. Members in this category make a compulsory contribution of 3.4 per cent deducted from after tax salary or 4.0 per cent deducted from before tax salary.
The Accumulation Category that all new staff members must join commenced on 1 July 1994. This category of membership offers a minimum company contribution (subject to certain cashing out options and legislation) of 11.5 per cent of basic annual salary to each member’s account in the Plan. Members also have the option to make voluntary contributions to their account.
The Superannuation Guarantee Category is a compulsory accumulation category for all employees under hourly paid awards. Under legislation the Group is required to make minimum contributions. Effective 1 July 2002, the contribution rate increased to 9 per cent of ordinary time earnings. Members also have the option to make voluntary contributions to their personal account.
WMC Resources and its controlled entities contribute to the Plan as required by the Plan rules, any relevant employee agreements, or legislation.
Actuarial assessment (where appropriate) of the Plan (and previously the WMC Superannuation Fund) is made at three yearly intervals, and the last such assessment was made as at 1 July 1999, by Mr R R Codron, BSc Hons, FIA, FIAA, ASIA. Based on the calculations made as part of that assessment, the Directors of the company are of the view that as at the date of the assessment, the assets of the Fund were sufficient to satisfy all benefits that would have vested under the Fund in the event of termination of the Fund or voluntary or compulsory termination of employment of each employee.
The principal assets of the Plan are managed by external investment managers appointed by the Trustee of the Fund and are regularly monitored by the Fund’s asset consultants. External managers may use derivatives as part of normal investment and risk management practice within the terms of their appointment and in accordance with the Risk Management Statement required by legislation. Investment managers are not permitted to use derivatives to gear investments.
The following amounts are based on information from the WMC Superannuation Fund which had a financial year ended 30 June. The most recent audited information available is at 30 June 2001.
F-60
WMC RESOURCES LTD AND CONTROLLED ENTITIES
Notes to the Combined Financial Statements
| | | | | Year to 31 Dec 2001 A$
| | | Year to 31 Dec 2000 A$
| | | Year to 31 Dec 1999 A$
| |
39. | | SUPERANNUATION BENEFITS (Continued) | | | | | | | | | |
|
| | | WESTMINER SUPERANNUATION FUND (WMC Limited’s Superannuation Fund) | | | | | | | | | |
|
| (a) | | Change in benefit obligation | | | | | | | | | |
| | | Benefit obligation at beginning of period | | 193.9 | | | 171.1 | | | 173.3 | |
| | | Service cost | | 26.1 | | | 24.2 | | | 26.0 | |
| | | Interest cost | | 10.2 | | | 11.0 | | | 10.6 | |
| | | Actuarial (gains) losses | | 12.9 | | | 5.7 | | | (9.7 | ) |
| | | Members transferring from other funds | | 1.7 | | | 3.4 | | | 2.3 | |
| | | Benefits and expenses paid | | (23.7 | ) | | (23.0 | ) | | (33.1 | ) |
| | | Plan participants contributions | | 1.3 | | | 1.4 | | | 1.7 | |
| | | | |
|
| |
|
| |
|
|
| | | Benefit obligation at end of period | | 222.4 | | | 193.8 | | | 171.1 | |
| | | | |
|
| |
|
| |
|
|
|
| (b) | | Change in plan assets | | | | | | | | | |
| | | Fair value of plan assets at beginning of period | | 202.3 | | | 195.4 | | | 181.8 | |
| | | Actual return on plan assets | | (0.7 | ) | | 24.7 | | | 23.0 | |
| | | Transfers in from other funds | | 1.7 | | | 3.4 | | | 2.3 | |
| | | Employer contributions | | 23.1 | | | 0.3 | | | 19.7 | |
| | | Plan participants’ contributions | | 1.3 | | | 1.4 | | | 1.7 | |
| | | Benefits and expenses paid | | (23.7 | ) | | (22.9 | ) | | (33.1 | ) |
| | | | |
|
| |
|
| |
|
|
| | | Fair value of plan assets at end of period | | 204.0 | | | 202.3 | | | 195.4 | |
| | | | |
|
| |
|
| |
|
|
|
| (c) | | Reconciliation of funded status | | | | | | | | | |
| | | Funded status | | (18.3 | ) | | 8.5 | | | 24.3 | |
| | | Unrecognized net gain | | (24.3 | ) | | (56.2 | ) | | (54.3 | ) |
| | | Unamortized prior service cost | | 0.1 | | | 0.3 | | | 0.4 | |
| | | Unrecognized net transition asset | | (1.6 | ) | | (4.9 | ) | | (8.1 | ) |
| | | | |
|
| |
|
| |
|
|
| | | Accrued pension cost | | (44.1 | ) | | (52.3 | ) | | (37.7 | ) |
| | | | |
|
| |
|
| |
|
|
|
| (d) | | Components of net periodic benefit costs | | | | | | | | | |
| | | Service cost | | 26.1 | | | 24.2 | | | 26.0 | |
| | | Interest cost | | 10.2 | | | 11.1 | | | 10.6 | |
| | | Expected return on plan assets | | (15.3 | ) | | (14.2 | ) | | (13.9 | ) |
| | | Amortization of prior service cost | | 0.1 | | | 0.1 | | | 0.1 | |
| | | Amortization of gain | | (3.0 | ) | | (2.9 | ) | | (1.6 | ) |
| | | Amortization of unrecognized net transition asset | | (3.3 | ) | | (3.3 | ) | | (3.2 | ) |
| | | | |
|
| |
|
| |
|
|
| | | Net periodic benefit costs | | 14.8 | | | 15.0 | | | 18.0 | |
| | | | |
|
| |
|
| |
|
|
|
| (e) | | Weighted average assumptions | | | | | | | | | |
| | | Discount rate | | 6.0 | | | 5.5 | | | 6.0 | |
| | | Expected long-term return on plan assets | | 7.5 | | | 7.5 | | | 7.5 | |
| | | Rate of compensation increase | | 3.5 | | | 3.5 | | | 3.5 | |
|
| (f) | | WMC are sponsors of defined contribution pension plans. | | | | | | | | | |
| | | Expenses relating to those plans were | | 23.1 | | | 0.3 | | | 19.7 | |
|
| (g) | | At balance date the plan holds 81,790 ordinary shares in WMC Limited (Dec 2000: 237,263; Dec 1999: 107,694). | | | | | | | | | |
F-61
WMC RESOURCES LTD AND CONTROLLED ENTITIES
Notes to the Combined Financial Statements
| | | | | |
40. | | RELATED PARTY TRANSACTIONS |
|
| | | Related parties of WMC Resources fall under the following categories: |
|
| (a) | | Controlled entities |
|
| | | Information relating to the investment in controlled entities is set out in Note 36. Information relating to dividends and interest are set out in Notes 2 and 3 respectively. |
|
| (b) | | Superannuation funds |
|
| | | Information relating to staff superannuation funds is set out in Note 39. |
|
| (c) | | Directors |
|
| | | (i) | | The names of each person holding the position of director of the parent entity during the financial year are: |
|
| | | | | I G R Burgess AO (Chairman) H M Morgan AO (Chief Executive Officer) Professor A Clarke AO P J Knight M J Phillips AM (Alternate D M Morley) R A G Vines I E Webber AO T C-E Bergman R Woodall AO (retired on 11 April 2001) D M Morley (retired on 11 April 2001) |
|
| | | (ii) | | Details of directors’ remuneration, superannuation and retirement payments are set out in Note 41. |
|
| | | | | Apart from the details disclosed in this note, no director has entered into a material contract with the Company or its controlled entities since the end of the previous financial year, and there were no material contracts involving directors’ interests existing at balance date. |
| | | | | Thousands of dollars
|
| | | | | 2001 A$
| | 2000 A$
|
| (d) | | Loans to directors | | | | |
| | | (i | ) | | The directors of WMC Resources were also, prior to the demerger, directors of WMC Limited, the parent entity of WMC Resources and the other businesses carved out and transferred to WMC Resources as part of the demerger. | | | | |
|
| | | | | | Loans to directors of subsidiary companies included in receivables comprise secured loans under the Employee Share Purchase Plan and the Senior Staff Share Issue. | | 4.9 | | 5.9 |
|
| | | | | | Two outstanding share plan loans to these directors have an aggregate balance of $4,919 (2000: $5,893). These relate to and are secured by shares allocated by WMC Limited under the 1988 allotment of the Employee Share Purchase Plan (loan to R T Bills) and the 1994 allotment of the Senior Staff Share Issue (loan to C W George). Both loans are interest free, have no stipulated repayment period, and are repayable principally by application of dividends, or at the discretion of the employee, or upon termination. | | | | |
|
| | | (ii | ) | | No new loans were made to directors during the financial year. | | | | |
|
| | | (iii | ) | | Loan re-payments received: Secured loans-share plans from all directors listed in (i) above as holding or having held loans | | 1.0 | | 0.8 |
| | | | | | | |
| |
|
F-62
WMC RESOURCES LTD AND CONTROLLED ENTITIES
Notes to the Combined Financial Statements
40. RELATED PARTY TRANSACTIONS(Continued)
(e) Shareholding transactions of directors
The directors of WMC Resources were also, prior to the demerger, directors of WMC Limited, the parent entity of WMC Resources and the other businesses carved out and transferred to WMC Resources as part of the demerger. The following information relates to their transactions as shareholders of WMC Limited.
Where a director of WMC Resources was a shareholder in WMC Resources Ltd, and prior to the demerger in WMC Limited, their transactions include:
– the purchase and/or sale of shares; and/or
– the receipt of dividends.
All these transactions were conducted on a commercial basis, on conditions no more favourable than those available to other shareholders.
Some directors of WMC Limited, who were also employees of the WMC Limited group were eligible to participate in the company’s Employee Share Scheme, and were issued with options, priced at market value. These transactions were conducted on a commercial basis on conditions no more beneficial than those available to other eligible employees.
| | | Number of Shares
|
| | | 2001 | | 2000 |
| The aggregate number of shares acquired by directors of the parent entity or their director related entities through purchases was: | | 10,000 | | 130,000 |
|
| The aggregate number of options acquired by directors of the parent entity or their director related entities through participation in the WMC Employee Share Scheme was: | | — | | 320,000 |
|
| The aggregate number of shares disposed of by directors of the parent entity or their director related entities was: | | | | |
| – fully paid shares | | 11,000 | | — |
| – partly paid shares | | — | | 100,000 |
| – options (lapsed) | | — | | 300,000 |
| – options (shares exercised and sold) | | 300,000 | | — |
| Details of shares and share options held by directors of the parent entity or their director related entities at 31 December are as follows: | | | | |
| – WMC Limited, fully paid shares | | 434,459 | | 435,459 |
| – WMC Limited, ordinary shares partly paid to five cents | | 331,000 | | 331,000 |
| – WMC Limited, options for ordinary shares | | 1,470,000 | | 1,770,000 |
| – Central Norseman Gold Corporation Limited, fully paid shares | | 2,000 | | 2,000 |
All other transactions relating to shares and options of WMC Limited, including the payment and receipt of dividends, were on the same basis as similar transactions with other shareholders.
(f) Other transactions of directors and director related entities
The directors of WMC Resources were also, prior to the demerger, directors of WMC Limited, the parent entity of WMC Resources and the other businesses carved out and transferred to WMC Resources as part of the demerger. The following information relates to their transactions as shareholders of WMC Limited.
A number of the directors of WMC Limited are also directors of other public companies that may have transactions with the WMC Group. The relevant directors do not believe that they have the capacity to control or significantly influence the financial or operating policies of either those companies or the WMC Group in their dealings with one another. Those companies are therefore not considered to be director-related entities for the disclosure requirements of Accounting Standard AASB 1017: Related Party Disclosures.
(i) Legal/financial service fees
A number of directors of WMC Limited controlled entities are associated with legal and financial service firms which have provided services to WMC Limited during the financial year, on normal commercial terms and conditions. The total of those services amounts to $916,259 (2000: $684,733).
(ii) Other transactions
Entities associated with directors of WMC Limited controlled entities have purchased fertilizer totalling $14,325 (2000: $16,898) on normal commercial terms and conditions from a WMC Limited controlled entity.
F-63
WMC RESOURCES LTD AND CONTROLLED ENTITIES
Notes to the Combined Financial Statements
41. REMUNERATION OF DIRECTORS
The directors of WMC Resources were also, prior to the demerger, directors of WMC Limited, the parent entity of WMC Resources and the other businesses carved out and transferred to WMC Resources as part of the demerger.
The disclosures below relate to their remuneration from WMC Limited.
| | | Thousands of Dollars
|
| | | Year to 31 Dec 2001 | | Year to 31 Dec 2000 | | Year to 31 Dec 1999 |
| | | A$
| | A$
| | A$
|
(a) Total income received, or due and receivable from: | | | | | | |
Parent entity | | | | | | |
| -Executive directors: | | 3,480 | | 2,505 | | 2,187 |
| -Non-executive directors: | | 884 | | 882 | | 1,322 |
Controlled entities | | | | | | |
| -Executive directors | | 10,895 | | 12,742 | | 9,095 |
| -Non-executive directors | | 259 | | 208 | | 343 |
| | |
| |
| |
|
CONSOLIDATED TOTAL: | | 15,518 | | 16,337 | | 12,947 |
| | |
| |
| |
|
(b) Certain directors may also receive options under the WMC Option Plan, refer to Note 40(e).
(c) The number of directors of the parent entity whose income from the parent entity or related bodies corporate
falls within the following bands:
| | | Number of Directors
|
| | | 2001
| | 2000
| | 1999
|
| $ 60,000 - $ 69,999 | | — | | — | | 5 |
| $ 70,000 - $ 79,999 | | 2 | | 4 | | 1 |
| $ 80,000 - $ 89,999 | | 2 | | — | | — |
| $ 90,000 - $ 99,999 | | — | | 1 | | — |
| $ 100,000 - $ 109,999 | | 1 | | — | | 1 |
| $ 120,000 - $ 129,999 | | — | | 1 | | — |
| $ 130,000 - $ 139,999 | | 1 | | — | | — |
| $ 140,000 - $ 149,999 | | — | | — | | 1 |
| $ 180,000 - $ 189,999 | | — | | 1 | | — |
| $ 200,000 - $ 209,999 | | 2 | | — | | — |
| $ 250,000 - $ 259,999 | | — | | 1 | | — |
| $ 340,000 - $ 349,999 | | — | | — | | 1 |
| $ 510,000 - $ 519,999 | | — | | — | | 1 |
| $ 800,000 - $ 809,999 | | — | | — | | 1 |
| $ 920,000 - $ 929,999 | | — | | 1 | | — |
| $ 1,410,000 - $ 1,419,999 | | 1 | | — | | — |
| $ 1,380,000 - $ 1,389,999 | | — | | — | | 1 |
| $ 1,570,000 - $ 1,579,999 | | — | | 1 | | — |
| $ 2,060,000 - $ 2,069,999 | | 1 | | — | | — |
| | |
| |
| |
|
| | | 10 | | 10 | | 12 |
| | |
| |
| |
|
Executive directors do not receive director’s fees, but are remunerated on the same basis (i.e. salary and benefits) as executive officers, as indicated in Note 42.
F-64
WMC RESOURCES LTD AND CONTROLLED ENTITIES
Notes to the Combined Financial Statements
42. REMUNERATION OF EXECUTIVES
| | | | | Number of Executive Officers Working within Australia
| | Working outside of Australia
|
| | | | | Group
| | Parent
| | Group
|
| | | | | 2001 | | 2001 | | 2000 | | 2000 | | 2001 | | 2000 | | 2001 | | 2000 |
| | | | | Current | | Former | | Current | | Former | | | | | | | | |
| (a)The number of executive officers, (including directors based in Australia, and outside of Australia, whose income from the group and related bodies corporate falls within the following bands: | | | | | | | | | | | | | | | | |
| $ 110,000 - | | $ | 119,999 | | – | | – | | – | | 1 | | – | | – | | – | | – |
| $ 130,000 - | | $ | 139,999 | | – | | – | | – | | 1 | | – | | – | | – | | – |
| $ 140,000 - | | $ | 149,999 | | 1 | | – | | – | | – | | – | | – | | – | | – |
| $ 170,000 - | | $ | 179,999 | | – | | – | | 1 | | 1 | | – | | – | | – | | – |
| $ 180,000 - | | $ | 189,999 | | – | | – | | 2 | | – | | – | | – | | – | | – |
| $ 190,000 - | | $ | 199,999 | | – | | – | | 3 | | – | | – | | – | | – | | – |
| $ 200,000 - | | $ | 209,999 | | – | | – | | 4 | | – | | – | | – | | – | | – |
| $ 210,000 - | | $ | 219,999 | | 2 | | – | | 4 | | – | | – | | – | | – | | 1 |
| $ 220,000 - | | $ | 229,999 | | – | | 1 | | 5 | | – | | – | | – | | – | | – |
| $ 230,000 - | | $ | 239,999 | | – | | – | | 8 | | – | | – | | – | | – | | – |
| $ 240,000 - | | $ | 249,999 | | 5 | | – | | 5 | | – | | – | | – | | – | | – |
| $ 250,000 - | | $ | 259,999 | | 7 | | – | | 5 | | – | | – | | – | | – | | – |
| $ 260,000 - | | $ | 269,999 | | 7 | | – | | 5 | | – | | – | | – | | – | | – |
| $ 270,000 - | | $ | 279,999 | | 2 | | – | | 2 | | – | | – | | – | | – | | – |
| $ 280,000 - | | $ | 289,999 | | 2 | | – | | 1 | | – | | – | | – | | – | | – |
| $ 290,000 - | | $ | 299,999 | | 2 | | – | | 3 | | – | | – | | – | | 1 | | – |
| $ 310,000 - | | $ | 319,999 | | 2 | | 1 | | 1 | | 1 | | – | | – | | – | | – |
| $ 320,000 - | | $ | 329,999 | | 3 | | – | | 2 | | – | | – | | – | | – | | 1 |
| $ 330,000 - | | $ | 339,999 | | – | | 1 | | 1 | | – | | – | | – | | – | | 1 |
| $ 340,000 - | | $ | 349,999 | | 1 | | – | | – | | – | | – | | – | | – | | – |
| $ 350,000 - | | $ | 359,999 | | – | | 1 | | – | | 2 | | – | | – | | – | | – |
| $ 360,000 - | | $ | 369,999 | | 1 | | – | | 3 | | – | | – | | – | | – | | – |
| $ 370,000 - | | $ | 379,999 | | 1 | | – | | – | | 1 | | – | | – | | – | | – |
| $ 380,000 - | | $ | 389,999 | | 1 | | – | | – | | – | | – | | – | | 1 | | – |
| $ 390,000 - | | $ | 399,999 | | – | | – | | – | | – | | – | | – | | 1 | | – |
| $ 400,000 - | | $ | 409,999 | | 2 | | – | | – | | 1 | | – | | – | | – | | – |
| $ 420,000 - | | $ | 429,999 | | – | | 1 | | 2 | | – | | – | | – | | – | | 1 |
| $ 430,000 - | | $ | 439,999 | | – | | 1 | | – | | – | | – | | – | | – | | – |
| $ 440,000 - | | $ | 449,999 | | – | | 2 | | – | | – | | – | | – | | – | | – |
| $ 470,000 - | | $ | 479,999 | | – | | – | | – | | – | | – | | – | | 1 | | – |
| $ 480,000 - | | $ | 489,999 | | – | | 1 | | – | | – | | – | | – | | – | | – |
| $ 500,000 - | | $ | 509,999 | | – | | 1 | | – | | – | | – | | – | | – | | – |
| $ 510,000 - | | $ | 519,999 | | 1 | | – | | – | | – | | – | | – | | – | | – |
| $ 520,000 - | | $ | 529,999 | | – | | – | | 1 | | – | | – | | – | | – | | – |
| $ 560,000 - | | $ | 569,999 | | 1 | | – | | – | | – | | – | | – | | – | | – |
| $ 630,000 - | | $ | 639,999 | | – | | 1 | | – | | – | | – | | – | | – | | – |
| $ 640,000 - | | $ | 649,999 | | – | | – | | 1 | | – | | – | | – | | – | | – |
| $ 670,000 - | | $ | 679,999 | | – | | – | | – | | 1 | | – | | – | | – | | – |
| $ 720,000 - | | $ | 729,999 | | – | | 1 | | – | | – | | – | | – | | – | | – |
| $ 750,000 - | | $ | 759,999 | | 1 | | – | | – | | – | | – | | – | | – | | – |
| $ 780,000 - | | $ | 789,999 | | – | | 1 | | 1 | | – | | – | | – | | – | | – |
| $ 800,000 - | | $ | 809,999 | | 1 | | – | | – | | – | | – | | – | | – | | – |
| $ 880,000 - | | $ | 889,999 | | – | | 1 | | – | | – | | – | | – | | – | | – |
| $ 900,000 - | | $ | 909,999 | | – | | – | | – | | – | | – | | – | | – | | 1 |
| $ 920,000 - | | $ | 929,999 | | – | | – | | 1 | | – | | – | | 1 | | – | | – |
| $ 1,050,000 - | | $ | 1,059,999 | | 1 | | – | | – | | – | | – | | – | | – | | – |
| $ 1,160,000 - | | $ | 1,169,999 | | – | | – | | – | | 1 | | – | | – | | – | | – |
| $ 1,320,000 - | | $ | 1,329,999 | | – | | – | | – | | – | | – | | – | | 1 | | – |
| $ 1,410,000 - | | $ | 1,419,999 | | 1 | | – | | – | | – | | 1 | | – | | 1 | | – |
| $ 1,430,000 - | | $ | 1,439,999 | | – | | 1 | | – | | – | | – | | – | | – | | – |
| $ 1,440,000 - | | $ | 1,449,999 | | – | | – | | – | | – | | – | | – | | 1 | | – |
| $ 1,450,000 - | | $ | 1,459,999 | | – | | – | | – | | 1 | | – | | – | | – | | – |
| $ 1,570,000 - | | $ | 1,579,999 | | – | | – | | 1 | | – | | – | | 1 | | – | | – |
| $ 1,630,000 - | | $ | 1,639,999 | | – | | – | | – | | 1 | | – | | – | | – | | – |
| $ 1,640,000 - | | $ | 1,649,999 | | – | | 1 | | – | | – | | – | | – | | – | | – |
| $ 1,700,000 - | | $ | 1,709,999 | | – | | – | | – | | – | | – | | – | | – | | 1 |
| $ 1,710,000 - | | $ | 1,719,999 | | – | | – | | – | | – | | – | | – | | – | | 1 |
| $ 2,060,000 - | | $ | 2,069,999 | | 1 | | – | | – | | – | | 1 | | – | | – | | – |
| | | | | |
| |
| |
| |
| |
| |
| |
| |
|
| | | | | | 46 | | 16 | | 62 | | 12 | | 2 | | 2 | | 7 | | 7 |
| | | | | |
| |
| |
| |
| |
| |
| |
| |
|
F-65
WMC RESOURCES LTD AND CONTROLLED ENTITIES
Notes to the Combined Financial Statements
42. REMUNERATION OF EXECUTIVES (Continued)
| | | Thousands of Dollars
|
| | | Year ended 31 Dec 2001 | | Year ended 31 Dec 2000 |
| | | A$
| | A$
|
(b) Total income received, or due and receivable, from WMC Resources and related bodies corporate by all Executive Officers (including Directors) working within Australia whose income exceeded $100,000 | | 28,293 | | 26,238 |
| | |
| |
|
- of which the total income received, or due and receivable, by 46 (2000: 62) currently employed Executive Officers (including Directors) whose income exceeded $100,000 was, and | | 18,216 | | 19,087 |
- of which the total income received or due and receivable by 16 (2000: 12) former Executive Officers whose income exceeded $100,000 was | | 10,077 | | 7,151 |
| | |
| |
|
| | | 28,293 | | 26,238 |
| | |
| |
|
43. REMUNERATION OF AUDITORS
| | | Thousands of Dollars
|
| | | Year ended 31 Dec 2001 | | Year ended 31 Dec 2000 |
| | | A$
| | A$
|
(a) Remuneration for audit or review of the financial reports of the parent entity or any entity in the economic entity: | | | | |
| Auditors of parent entity: | | | | |
| - parent entity | | 220 | | 220 |
| - controlled entities | | 827 | | 877 |
| Other member firms of PricewaterhouseCoopers International | | 115 | | 125 |
| Other auditors of controlled entities | | — | | 65 |
(b) Remuneration for other services by the parent entity auditors of controlled entities | | | | |
| - taxation services | | 450 | | 352 |
- other services (i) | | 813 | | 90 |
| | |
| |
|
| | | 2,425 | | 1,729 |
| | |
| |
|
(i) Includes fees in relation to the demerger and other services.
F-66
WMC RESOURCES LTD AND CONTROLLED ENTITIES
Notes to the Combined Financial Statements
44. | | RECONCILIATION TO US GAAP |
The accounting policies and accounting standards under which the combined financial statements of WMC Resources are prepared are in accordance with Australian GAAP. The major differences between Australian GAAP and US GAAP are summarised and reconciled below.
| | (a) | | Research and development |
Expenditure incurred on research and development may be capitalized and deferred in Australia to the extent that such expenditure is expected to be recoverable. Under US GAAP, all such expenditure is expensed as incurred.
The applicable Australian accounting standard relates only to disclosure. The accepted practice is to account for Company contributions on a cash rather than an accruals basis. WMC Resources does not account for excesses or shortfalls of the Superannuation Fund assets over accrued membership benefits. As this is contrary to US GAAP, WMC Resources has adopted the recognition provisions of FAS 87 “Employers Accounting for Pensions”, for US GAAP reconciliation purposes. Note 39 should be referred to for an explanation of the effect on the financial statements, including disclosures in accordance with FAS 132 “Employers Disclosures about Pensions and Other Postretirement Benefits”. WMC Resources does not sponsor post retirement defined-benefits other than pensions.
| | (c) | | Exploration and evaluation expenditure |
Expenditure incurred on the exploration and evaluation of minerals properties may be capitalised and deferred in Australia provided that such expenditure meets the criteria disclosed in Note 1(f). Under US GAAP geological and geophysical costs and costs of carrying and retaining undeveloped properties are charged to expense as incurred. Consequently any such costs incurred and capitalised in Australia as exploration and evaluation are expensed as incurred under US GAAP.
In 2001 capitalized exploration and expenditures included A$27.1 million for the acquisition of a prospective nickel property resulting from the acquisition of Yakabindie Nickel Limited. Under both Australian GAAP and US GAAP the cost of purchasing unproven property is capitalised when incurred, and either transferred to proved properties when proven or written off as impaired. Accordingly, this expenditure has not been included as a reconciling item.
Under Australian GAAP, deferred taxes are provided for using the liability method with the recognition and carry forward of future income tax benefits on a similar basis to FAS 109, except for tax assets and liabilities relating to temporary (timing) differences which are all classed as non-current. Consequently, no adjustment has been made in the method by which income taxes have been calculated and brought to account. Under US GAAP the future income tax benefits and liabilities would be required to be allocated in the balance sheet between current and non-current items. This allocation would not have a significant effect. Refer also to Note 5.
Under Statement of Position 98-5, “Reporting on the Costs of start-up activities”, the costs of start-up activities including organizational costs, are required to be expensed as incurred. Under Australian GAAP start up costs are capitalized and deferred as part of the mineral extraction or processing facilities being developed or constructed. These deferred costs are then amortized from the start of production over the life of the facilities concerned. SOP 98-5 became effective for WMC in 1999. Prospectively from 1999 for US GAAP reconciliation the costs of start-up activities are expensed as incurred. The net cumulative effect as at 31 December 1998 of this change in policy for WMC’s US GAAP reporting purposes was recognised as a separate charge in 1999.
| | (f) | | Real estate profit recognition |
In late 2000 WMC contracted to sell Tenements and Tenement assets at Kambalda to a third party. This sale was recognized under Australian GAAP in 2000. However consideration was not due under the contract until 2001, and some minor conditions precedent to closing had not been performed at 31 December 2000. Consequently under US GAAP the sale and profit were not recognized until 2001.
| | (g) | | Option payment capitalised |
An option payment for the right to participate in the Corridor Sands bankable feasibility study and earn an interest in any resultant development has been deferred and amortized over the period during which the study is undertaken. Under US GAAP the payment has been expensed when incurred.
F-67
WMC RESOURCES LTD AND CONTROLLED ENTITIES
Notes to the Combined Financial Statements
44. | | RECONCILIATION TO US GAAP (Continued) |
Under US GAAP bank overdrafts are not considered to be part of the net cash equivalents and so changes in bank overdrafts (net) are included in cash flows from financing activities. In addition, payments for research and development are included in cash flows from operating activities. Other differences in the US GAAP statement of cash flows relate to those items capitalized under A GAAP that would be expensed under US GAAP and would be included in the US GAAP cash flows from operating activities.
| | (i) | | Queensland Fertilizer Project feasibility studies and other assets |
For Australian GAAP, a write-off has been recognized for Queensland Fertilizer Project feasibility studies and other assets recognized on initial acquisition. These amounts have been previously written off for US GAAP.
| | (j) | | Fair value accounting for derivatives |
Adoption of FAS 133
WMC Resources adopted Statement of Financial Accounting Standards No. 133, “Accounting for Derivative Instruments and Hedging Activities” as amended by Statement of Financial Accounting Standards No. 137, “Accounting for Derivative Instruments and Hedging Activities – Deferral of the Effective Date of FASB Statement No. 133”, an amendment of FASB Statement No. 133, and Statement of Financial Accounting Standards No. 138, “Accounting for Certain Derivative Instruments and Certain Hedging Activities”, an amendment of FASB Statement No. 133 (all referred to hereafter as “FAS 133”), on 1 January 2001. In accordance with the transition provisions of FAS 133, WMC Resources recorded the following net-of-tax cumulative effect adjustments in earnings as of 1 January 2001:
| | | Millions(A$)
| |
| Related to previously designated fair value hedging relationships: | | | |
| Fair value of hedging instruments | | 36.0 | |
| Offsetting changes in fair value of hedged items | | (36.0 | ) |
| | |
|
|
| Total adjustment net of tax | | — | |
| | |
|
|
In addition, WMC Resources recorded the following net-of-tax cumulative-effect adjustments in other comprehensive income as of 1 January 2001.
| | | Millions(A$)
| |
| Related to previously designated fair value hedging relationships: | | | |
| Fair value of hedging instruments | | 29.2 | |
| Previously deferred hedging gains and losses | | (647.9 | ) |
| | |
|
|
| Total adjustment net of tax | | (618.7 | ) |
| | |
|
|
Accounting for Derivatives and Hedging Activities
WMC Resources formally documents all relationships between hedging instruments and hedged items, as well as its risk-management objective and strategy for undertaking various hedge transactions. This process includes linking all derivatives that are designated as fair-value, cash flow, or foreign-currency hedges to (1) specific assets and liabilities on the balance sheet or (2) specific firm commitments or forecasted transactions. WMC Resources also formally assesses (both at the hedge’s inception and on an ongoing basis) whether the derivatives that are used in hedging transactions have been highly effective in offsetting changes in the fair value or cash flows of hedged items and whether those derivatives may be expected to remain highly effective in future periods. When it is determined that a derivative is not (or has ceased to be) highly effective as a hedge, WMC Resources discontinues hedge accounting prospectively, as discussed below.
F-68
WMC RESOURCES LTD AND CONTROLLED ENTITIES
Notes to the Combined Financial Statements
44. | | RECONCILIATION TO US GAAP (Continued) |
| | (j) | | Fair value accounting for derivatives (continued) |
WMC Resources discontinues hedge accounting prospectively when (1) it determines that the derivative is no longer effective in offsetting changes in the fair value or cash flows of a hedged item (including hedged items such as firm commitments or forecasted transactions); (2) it is probable that the forecasted transaction will not occur; (3) a hedged firm commitment no longer meets the definition of a firm commitment; or (4) management determines that designating the derivative as a hedging instrument is no longer appropriate.
Fair-Value Hedges
WMC Resources uses interest rate swaps to convert a portion of its non pre payable fixed-rate debt into variable-rate debt. Under the interest rate swap contracts, WMC Resources agrees with other parties to exchange, at specified intervals, the difference between fixed-rate and floating-rate interest amounts, which is calculated based on an agreed-upon notional amount.
For the year ended 31 December 2001, WMC Resources recognized a net gain of $Nil, which represented the ineffective portion of all of WMC Resources fair-value hedges. All components of each derivative’s gain or loss were included in the assessment of hedge effectiveness.
Cash Flow Hedges
WMC Resources’ sales are denominated in the United States dollars. WMC Resources enters into foreign-exchange options and forward-exchange contracts as hedges of anticipated sales denominated in foreign currencies. WMC Resources enters into these contracts to protect itself against the risk that the eventual dollar-net-cash inflows resulting from direct-foreign-export sales will be adversely affected by changes in exchange rates.
As at 31 December 2001, WMC Resources recognized a net loss after tax of $4.6 million representing the change in time value on certain of WMC Resources’ forward contracts that had been excluded from the assessment of hedge effectiveness. A further net loss after tax of $6.6 million was recorded for the ineffective portion of certain options designated as cash flow hedges. In addition WMC Resources has elected to mark to market certain foreign currency purchased call options, resulting in a net loss after tax of $5.6 million.
The revaluation of foreign currency debt which is not treated as a hedge for accounting purposes under US GAAP resulted in a net loss after tax of $98.3 million.
The total of the adjustments referred to in the preceding two paragraphs on a pre-tax basis was $164.4 million.
As of 31 December 2001, $160.9 million of deferred net losses on derivative instruments accumulated in other comprehensive income are expected to be reclassified as earnings during the next twelve months.
The maximum term over which WMC Resources is hedging exposures to the variability of cash flows using derivative instruments for all forecasted transactions is nine years.
Subsequent gains and losses on cash flow hedges are taken to other comprehensive income and are reclassified to profit and loss in the same period the hedged transaction is recognized. Gains and losses on fair value hedges continue to be taken to profit and loss in subsequent periods, as offsetting gains and losses on hedged liabilities. In both cases, these gains and losses are not recognized under Australian GAAP until the hedged transaction is recognized.
FAS 133 requires that any component of the gain or loss which is deemed to be ineffective be taken to the Income Statement immediately. For Australian GAAP any ineffectiveness is recognized over the term of the derivative.
F-69
WMC RESOURCES LTD AND CONTROLLED ENTITIES
Notes to the Combined Financial Statements
44. | | RECONCILIATION TO US GAAP (Continued) |
| | (j) | | Fair value accounting for derivatives (continued) |
| | | | Hedges of Net Investments in Foreign Operations |
| | | | WMC Resources has numerous investments in foreign subsidiaries. The net assets of these subsidiaries are exposed to volatility in currency exchange rates. WMC Resources uses foreign denominated debt to naturally hedge its exposure and measures ineffectiveness of such hedges based upon the change in spot foreign exchange rates. The treatment of this debt as a net investment hedge is consistent under both Australian GAAP and US GAAP. An amount of $42.3 million has been charged to the foreign currency translation reserve, representing the increase in fair value of this debt for the period. |
| | (k) | | The right to Royalties received from sale of gold operations not recognised |
| | | | The right to royalties received in consideration for the gold mines sold during 2001 has been recognized at fair value under Australian GAAP and included in the determination of the gain on disposal. Under US GAAP, since the right to the royalties had not been realized at 31 December 2001, WMC has retained an amount of the carrying value of the mines on the balance sheet at 31 December 2001 in the proportion that the value of the right to the royalties bears to the total value of the consideration received. |
| | (l) | | Post-production waste removal costs |
| | | | Under Australian GAAP, expenditure incurred on post-production waste removal (stripping) is accumulated and deferred on the balance sheet as part of Mine properties and mine development. For US GAAP, these deferred production costs are classified in the balance sheet as other non-current assets. The total net book value of post-production costs capitalized was A$99.1 million for 2001, A$73.0 million for 2000 and A$54.9 million for 1999. |
| | | | Stripping expenditure, which for Australian GAAP purposes is shown as an investing cash flow, is considered an operating cash flow for US GAAP. |
| | (m) | | Amortization of mine development and deferred post-production waste removal costs |
| | | | WMC Resources intends to adopt a new accounting policy for mine depletion in its annual report on Form 20-F for the 12 months to 31 December 2002. The new policy will exclude future costs from the determination of the amortization rate for mine development and deferred post-production waste removal costs. This change will be recorded as a cumulative effect adjustment, effective 1 January 2002 in accordance with APB20, and will therefore impact the 6 month period to 30 June 2002. WMC Resources is currently evaluating the impact of this change on its financial positions and results of operations. |
F-70
WMC RESOURCES LTD AND CONTROLLED ENTITIES
Notes to the Combined Financial Statements
44. RECONCILIATION TO US GAAP(Continued)
| | | Year to 31 Dec 2001
| | | Year to 31 Dec 2000
| | | Year to 31 Dec 1999
| |
| | | A$
| | | A$
| | | A$
| |
INCOME AND COMPREHENSIVE INCOME STATEMENT – US GAAP RECONCILIATION
| | | | | | | | | |
| Net Income attributable to members of the holding | | | | | | | | | |
| company as reported | | 126.0 | | | 399.9 | | | 84.1 | |
| | |
|
| |
|
| |
|
|
Adjustments required to conform with US GAAP: | | | | | | | | | |
| - Research and development costs (a) | | 1.9 | | | 2.5 | | | 3.5 | |
| - Pension funds (b) | | 8.2 | | | (14.6 | ) | | 1.7 | |
| - Exploration expenditure capitalized (c) | | (3.7 | ) | | (6.7 | ) | | (15.5 | ) |
| - Start up costs (e) | | | | | | | | | |
| -capitalized cost | | — | | | (53.2 | ) | | (67.2 | ) |
| -amortization written back | | 7.0 | | | 3.6 | | | 8.2 | |
| - Real estate profit recognition (f) | | | | | | | | | |
| -sale of Kambalda tenements | | 20.2 | | | (20.2 | ) | | — | |
| - Option payment capitalized (g) | | | | | | | | | |
| -capitalised cost | | — | | | (28.6 | ) | | — | |
| -amortization written back | | 11.4 | | | 2.9 | | | — | |
| - Queensland Fertilizer Project feasibility studies and other assets (i) | | — | | | — | | | 25.4 | |
| - Fair value of accounting for derivatives (j) | | (164.4 | ) | | — | | | — | |
| - Royalty received from the sale of gold operations (k)* | | (13.6 | ) | | — | | | — | |
| - Other | | — | | | — | | | 2.0 | |
| - Income tax effect | | 44.7 | | | 22.0 | | | 9.9 | |
| | |
|
| |
|
| |
|
|
Total adjustments | | (88.3 | ) | | (92.3 | ) | | (32.0 | ) |
| | |
|
| |
|
| |
|
|
Net income in accordance with US GAAP | | 37.7 | | | 307.6 | | | 52.1 | |
| | |
|
| |
|
| |
|
|
| This is represented by: | | | | | | | | | |
| Net (loss)/income from continuing operations | | (231.5 | ) | | 241.6 | | | (22.2 | ) |
| Net income from discontinued operations | | 269.2 | | | 66.0 | | | 74.3 | |
| | |
|
| |
|
| |
|
|
Comprehensive Income | | | | | | | | | |
| Net income in accordance with US GAAP as above | | 37.7 | | | 307.6 | | | 52.1 | |
| Other comprehensive income as reported | | (14.1 | ) | | (19.2 | ) | | (50.0 | ) |
| Transitional adjustment on adoption of FAS 133 (j) | | (618.7 | ) | | — | | | — | |
| FAS 133 adjustment for current year | | (209.6 | ) | | — | | | — | |
| | |
|
| |
|
| |
|
|
Comprehensive (loss)/income in accordance with US GAAP | | (804.7 | ) | | 288.4 | | | 2.1 | |
| | |
|
| |
|
| |
|
|
| * | | This reconciliation item relates to discontinued operations. |
F-71
WMC RESOURCES LTD AND CONTROLLED ENTITIES
Notes to the Combined Financial Statements
44. RECONCILIATION TO US GAAP (Continued)
| | | As at 31 December
| |
| | | 2001
| | | 2000
| |
| | | A$
| | | A$
| |
SHAREHOLDERS’ EQUITY – US GAAP RECONCILIATION
| | | | | | |
| Shareholders’ equity as reported | | 3,220.3 | | | 3,123.8 | |
|
Adjustments required to conform with US GAAP: | | | | | | |
| - Research and development costs capitalized (a) | | (0.5 | ) | | (2.4 | ) |
| - Pension funds (b) | | (44.1 | ) | | (52.3 | ) |
| - Exploration expenditure capitalized (c) | | (37.4 | ) | | (33.7 | ) |
| - Start up costs (e) | | | | | | |
| -Cumulative adjustment to prior year earnings | | (116.8 | ) | | (67.0 | ) |
| -feasibility and evaluation costs capitalised | | (24.4 | ) | | (81.2 | ) |
| - Real estate profit recognition (f) | | | | | | |
| -sale of Kambalda tenements | | — | | | (20.2 | ) |
| - Option payment capitalized (g) | | | | | | |
| -current year adjustment | | (14.3 | ) | | (25.7 | ) |
| - Fair value accounting for derivatives (j) | | (1,347.7 | ) | | — | |
| - Royalty received from sale of gold operations (k) | | (13.6 | ) | | — | |
| - Other | | 1.4 | | | 1.4 | |
| - Income tax effect | | 445.9 | | | 46.2 | |
| | |
|
| |
|
|
| WMC Resources shareholders’ equity according to US GAAP | | 2,068.8 | | | 2,888.9 | |
| | |
|
| |
|
|
F-72
WMC RESOURCES LTD AND CONTROLLED ENTITIES
Notes to the Combined Financial Statements
44. RECONCILIATION TO US GAAP (Continued)
| | | As at 31 Dec 2001
| | | As at 31 Dec 2000
| |
| | | A$
| | | A$
| |
TOTAL ASSETS US GAAP RECONCILIATION
| | | | | | |
Total Assets reported using Australian GAAP | | 8,242.9 | | | 8,597.0 | |
| Adjustment for Research and development costs capitalized (Note 44 (a)) | | (0.5 | ) | | (2.4 | ) |
| Adjustment for Exploration expenditure capitalized (Note 44 (c)) | | (37.4 | ) | | (33.7 | ) |
| Adjustment for Start up costs (Note 44 (e)) | | (141.2 | ) | | (148.2 | ) |
| Adjustment for fair value of accounting for derivatives (Note 44 (j)) | | (1,345.9 | ) | | — | |
| Adjustment for Royalty received from sale of gold operations (Note 44 (k)) | | (13.6 | ) | | — | |
| Adjustment for profit recognition on sale of Kambalda tenements (Note 44 (f)) | | — | | | (20.2 | ) |
| Adjustment for Option payment capitalized (Note 44 (g)) | | (14.3 | ) | | (25.7 | ) |
| Other minor adjustments | | 1.4 | | | 1.4 | |
| | |
|
| |
|
|
Total Assets according to US GAAP | | 6,691.4 | | | 8,368.2 | |
| | |
|
| |
|
|
TOTAL LIABILITIES – US GAAP RECONCILIATION
| | | | | | |
Total Liabilities reported under Australian GAAP | | 5,013.6 | | | 5,459.7 | |
| Adjustment for Pension funds (Note 44 (b)) | | 44.1 | | | 52.3 | |
| Adjustment for fair value of accounting for derivatives (Note 44 (j)) | | 1.8 | | | — | |
| Income tax effect of US GAAP adjustments | | (445.9 | ) | | (46.2 | ) |
| | |
|
| |
|
|
Total Liabilities according to US GAAP | | 4,613.6 | | | 5,465.8 | |
| | |
|
| |
|
|
F-73
WMC RESOURCES LTD AND CONTROLLED ENTITIES
Notes to the Combined Financial Statements
44. RECONCILIATION TO US GAAP (Continued)
| | | Year to 31 Dec 2001 A$
| | | Year to
31 Dec 2000
A$
| | | Year to
31 Dec 1999
A$
| |
STATEMENT OF CASH FLOWS – US GAAP RECONCILIATION (h)
| | | | | | | | | |
|
| Cash flows from financing activities as reported | | (793.7 | ) | | (508.9 | ) | | 485.1 | |
| Changes in bank overdrafts (net) | | (3.7 | ) | | 3.1 | | | (5.8 | ) |
| | |
|
| |
|
| |
|
|
| Net cash (used in)/provided by financing activities – US GAAP | | (797.4 | ) | | (505.8 | ) | | 479.3 | |
| | |
|
| |
|
| |
|
|
| Cash flows from operating activities as reported | | 577.7 | | | 898.1 | | | 164.9 | |
| Payments for exploration expenditure expensed for US GAAP | | (3.7 | ) | | (6.7 | ) | | (15.5 | ) |
| Payments for start-up costs expensed for US GAAP | | — | | | (52.4 | ) | | (67.2 | ) |
| Option payment expensed for US GAAP | | — | | | (28.6 | ) | | — | |
| Payments for research and development | | — | | | (0.3 | ) | | (0.4 | ) |
| Deferred stripping expenditure reclassified from investing | | (102.1 | ) | | (72.1 | ) | | (58.6 | ) |
| | |
|
| |
|
| |
|
|
| Net cash provided by operating activities – US GAAP | | 471.9 | | | 738.0 | | | 23.2 | |
| | |
|
| |
|
| |
|
|
| Cash flows from investing activities as reported | | 279.1 | | | (419.3 | ) | | (624.7 | ) |
| Payments for exploration expenditure expensed for US GAAP | | 3.7 | | | 6.7 | | | 15.5 | |
| Payments for start-up costs expensed for US GAAP | | — | | | 52.4 | | | 67.2 | |
| Option payment expensed for US GAAP | | — | | | 28.6 | | | — | |
| Reclassification of payments for research and development to operating activities | | — | | | 0.3 | | | 0.4 | |
| Reclassification of deferred stripping expenditure | | 102.1 | | | 72.1 | | | 58.6 | |
| | |
|
| |
|
| |
|
|
| Net cash (used in) investing activities – US GAAP | | 384.9 | | | (259.2 | ) | | (483.0 | ) |
| | |
|
| |
|
| |
|
|
| Net increase/(decrease) in cash and cash equivalents | | 59.4 | | | (27.0 | ) | | 19.5 | |
| Cash and cash equivalents at the beginning of the year | | 62.3 | | | 76.6 | | | 58.2 | |
| Effects of exchange rate changes on opening foreign currency cash balances and on cash flows during the period | | 2.4 | | | 12.7 | | | (1.1 | ) |
| | |
|
| |
|
| |
|
|
| Cash and cash equivalents at the end of the financial year | | 124.1 | | | 62.3 | | | 76.6 | |
| | |
|
| |
|
| |
|
|
F-74
WMC RESOURCES LTD AND CONTROLLED ENTITIES
Notes to the Combined Financial Statements
45. | | RECENTLY ISSUED FINANCIAL ACCOUNTING STANDARDS |
| | | The Financial Accounting Standards Board has issued certain Statements of Financial Accounting Standards which are not effective with respect to the fiscal years presented in the combined financial statements. |
| | | SFAS No. 141 “Business Combinations” which addresses financial accounting and reporting for business combinations and supersedes APB Opinion No. 16, “Business Combinations”, was issued in June 2001 and is effective for business combinations initiated after 30 June 2001. It bans pooling-of-interest mergers and requires the use of the purchase method. Australian GAAP already requires the use of the purchase method in business acquisitions, so adoption of this standard did not have a significant impact on WMC Resources’ financial position or results. |
| | | SFAS No. 142 “Goodwill and Other Intangible Assets” which supersedes APB Opinion No. 17 was also issued in June 2001 and is effective for WMC Resources in 2002. It addresses how goodwill and other intangible assets should be accounted for after they have been initially recognized in the financial statements. Amortization of goodwill and indefinite-lived intangible assets ceases and is replaced by impairment tests. As WMC Resources does not have any goodwill or indefinite lived intangible assets, adoption of this standard did not have a significant impact on WMC Resources’ financial position or results of operations. |
| | | SFAS No. 143 “Accounting for Asset Retirement Obligations” was issued in 2001. It will be effective for WMC Resources in 2003. The statement requires an asset retirement obligation and a matching asset to be brought to account (calculated at a discounted present value) at the initial point the liability is incurred, generally when the mine is first commenced. The cost of the obligation is to be amortized over the life of a long-lived asset. Increases in the obligation as a result of the reduction of time are to be treated as interest. WMC Resources is currently assessing the impact of adopting this standard. |
| | | In August 2001, the FASB issued SFAS No. 144, “Accounting for the Impairment or Disposal of Long-Lived Assets.” This statement supersedes SFAS No. 121 and the accounting and reporting provisions of APB Opinion No. 30. This statement requires one accounting model to be used for long-lived assets to be held and used or disposed of by sale, whether previously held and used or newly acquired, and broadens the presentation of discontinued operations to include more disposal transactions. This statement was adopted by WMC Resources on 1 January 2002 and it did not have a material impact on the Company’s financial position or results of operations. |
| | | In April 2002, the FASB issued SFAS No. 145, “Rescission of FASB Statements No. 4, 44, and 64, Amendment of FASB Statement No.13, and Technical Corrections”. The standard rescinds FASB Statements No. 4 and 64 that deal with issues relating to the extinguishment of debt. The standard also rescinds FASB Statement No. 44 that deals with intangible assets of motor carriers. The standard modifies SFAS No.13, “Accounting for Leases”, so that certain capital lease modifications must be accounted for by lessees as sale-leaseback transactions. Additionally, the standard identifies amendments that should have been made to previously existing pronouncements and formally amends the appropriate pronouncements. SFAS No. 145 is effective for fiscal years beginning after 15 May 2002 with earlier adoption encouraged. WMC Resources is currently assessing the impact of adopting this standard which it intends on adopting for the 2003 fiscal year. |
| | | In July 2002, the FASB issued SFAS No. 146, “Accounting for Costs Associated with Exit or Disposal Activities”. The statement requires that costs associated with exit or disposal activities must be recognized when they are incurred rather than at the date of a commitment to an exit or disposal plan. Such costs include lease termination costs and certain employee severance costs associated with a restructuring, discontinued operations or other exit or disposal activity. We are currently reviewing SFAS No. 146, which is effective for exit or disposal activities initiated after 31 December 2002. |
F-75
WMC RESOURCES LTD AND CONTROLLED ENTITIES
Notes to the Combined Financial Statements
45. | | RECENTLY ISSUED FINANCIAL ACCOUNTING STANDARDS (Continued) |
| | | The Australian Accounting Standards Board (“AASB”) has issued or revised certain Accounting Standards that are not effective for the fiscal periods reported upon in the combined financial statements. |
| | | AASB 1020, “Income Taxes” was issued in December 1999. It will be effective for WMC Resources in 2004. WMC Resources is currently assessing the impact of adopting this standard on its financial report. |
| | | AASB 1005 “Segment Reporting” was revised in August 2000. It is effective for WMC Resources in 2002. This standard relates to disclosure. Adoption of this standard is not expected to have a significant impact on WMC Resources’ financial position or results. |
| | | AASB 1042, “Discontinuing Operations” was issued in August 2000. WMC Resources adopted this standard for the year ended 31 December 2001. This standard relates to disclosure requirements. Adoption of this standard did not have a significant impact on WMC Resources’ financial position or results. AASB 1027 “Earnings per Share” was revised in October 2000 and further amended in June 2001. It is effective for WMC in 2002. This standard relates to disclosure requirements. Adoption of this standard is not expected to have a significant impact on WMC Resources’ financial position or results. |
| | | AASB 1012 “Foreign Currency Translation” was revised in November 2000. It is effective for WMC Resources in 2002. Adoption of this standard is not expected to have a significant impact on WMC Resources’ financial position or results. |
| | | AASB 1028 “Employee Benefits” was revised in June 2001. It will be effective for WMC Resources in 2003. Adoption of this standard is not expected to have a significant impact on WMC Resources’ financial position or results. |
| | | AASB 1044 “Provisions, Contingent Liabilities and Contingent Assets” was issued in October 2001. WMC Resources has adopted the new standard from 1 January 2002. This standard was issued as a part of harmonization with International Accounting Standards. It largely codifies existing Australian practice, except that dividends must only be provided for when they are declared, determined or publicly recommended before balance date. A note disclosure will also be required for any contingent assets. Adoption of this standard did not have a significant impact on WMC Resources’ financial position or results, except that a provision will not be raised for any dividend declared after balance date but before directors’ adoption of the financial report. Any such declaration will be disclosed in the notes. |
46. | | EVENTS SUBSEQUENT TO BALANCE DATE |
| | | On 28 June 2002 the company entered into an agreement to sell the Long/Victor mines at Kambalda. This transaction will be brought to account in the second half of 2002, following satisfactory completion of commercial obligations by the buyer. |
| | | Sale of controlling interest in Central Norseman Gold Corporation Limited |
| | | The shareholders of Central Norseman Gold Corporation Limited (‘CNGC’), of which WMC Resources held a controlling interest of 50.48%, approved a proposed merger with Croesus Mining NL at a court ordered meeting on 11 January 2002. The merger effected by a scheme of arrangement was subsequently approved by the Supreme Court of Western Australia on 15 January 2002. Management of the Company passed from WMC Resources Ltd to Croesus on 18 January 2002. |
| | | WMC Resources received 4 Croesus shares plus $2.03 cash for every 10 CNGC shares held. WMC Resources has disposed its Croesus shares and this transaction resulted in total proceeds of $33.5 million and a pre-tax profit of $25.1 million, which has not been brought to account as at 31 December 2001. |
| | | Proceeds from the close out of some interest rate swap hedge positions |
| | | In January 2002, WMC Resources received proceeds in the amount of $71 million in relation to closing out its interest rate swap hedge positions. This transaction has not been brought to account as at 31 December 2001. |
| | | Acquisition of new businesses |
| | | In December 2002, WMC Resources acquired WMC Limited’s copper/uranium and fertilizer businesses, WMC Finance Ltd, WMC Finance (USA) Ltd, as well as other businesses not relating to AWAC for consideration equal to the fair value at the date of acquisition. Under Australian GAAP, the acquisition of these assets and businesses was effected at their fair value. Under US GAAP, assets and businesses transferred between entities under common control are accounted for at book value. |
F-76
WMC RESOURCES LTD
VALUATION AND QUALIFYING ACCOUNTS
(Millions of A$)
Description
| | Balance at beginning of year
| | Additions charged to costs and expenses
| | | Charged to other accounts
| | Deductions
| | | Balance at end of year
|
| | | Year ended 31 December, 2001 |
| Future income tax benefit valuation allowance | | 149.8 | | (39.2 | )(a) | | — | | — | | | 110.6 |
| Provision for doubtful debts | | 8.7 | | — | | | — | | (1.3 | ) | | 7.4 |
| Provision for obsolescence and loss | | 12.0 | | 4.0 | | | — | | (2.3 | ) | | 13.7 |
| Provision for diminution in value of investment | | 4.5 | | — | | | — | | — | | | 4.5 |
| | |
| |
|
| |
| |
|
| |
|
| | | 175.0 | | (35.2 | ) | | — | | (3.6 | ) | | 136.2 |
| | |
| |
|
| |
| |
|
| |
|
|
| | | Year ended 31 December, 2000 |
| Future income tax benefit valuation allowance | | 138.2 | | 11.6 | (a) | | — | | — | | | 149.8 |
| Provision for doubtful debts | | 6.9 | | 1.8 | | | — | | — | | | 8.7 |
| Provision for obsolescence and loss | | 8.3 | | 3.8 | | | — | | (0.1 | ) | | 12.0 |
| Provision for diminution in value of investment | | 2.9 | | 1.6 | | | — | | — | | | 4.5 |
| | |
| |
|
| |
| |
|
| |
|
| | | 156.3 | | 18.8 | | | — | | (0.1 | ) | | 175.0 |
| | |
| |
|
| |
| |
|
| |
|
|
| | | Year ended 31 December, 1999 |
| Future income tax benefit valuation allowance | | 153.8 | | (15.6 | )(a) | | — | | — | | | 138.2 |
| Provision for doubtful debts | | 7.4 | | — | | | — | | (0.5 | ) | | 6.9 |
| Provision for obsolescence and loss | | 13.4 | | 1.0 | | | — | | (6.1 | ) | | 8.3 |
| Provision for diminution in value of investment | | 3.6 | | — | | | — | | (0.7 | ) | | 2.9 |
| | |
| |
|
| |
| |
|
| |
|
| | | 178.2 | | (14.6 | ) | | — | | (7.3 | ) | | 156.3 |
| | |
| |
|
| |
| |
|
| |
|
| (a) | | Charged/(Credited) to income tax expense |
F-77
WMC RESOURCES LTD
(Australian Business Number 76 004 184 598)
AND CONTROLLED ENTITIES
U.S. FINANCIAL REPORT
AS OF AND FOR THE SIX MONTHS ENDED
30 JUNE 2002
Prepared in accordance
with Australian generally accepted
accounting principles (Australian GAAP)
except where noted
Amounts are stated in Australian dollars (A$) except where noted
F-1
WMC RESOURCES LTD AND CONTROLLED ENTITIES
Interim Combined Financial Statements as of and for the six months ended 30 June 2002
CONTENTS PAGE
| | 3 |
| | 4 |
| | 5 |
| | 6 |
| | 7 |
| | 8 |
| | 9 |
| | 10 |
| | 11 |
| | 12 |
| | 14 |
| | 15 |
| | 15 |
| | 15 |
| | 15 |
| | 16 |
| | 16 |
| | 16 |
| | 17 |
| | 17 |
| | 17 |
| | 17 |
| | 17 |
| | 18 |
| | 18 |
| | 18 |
| | 18 |
| | 19 |
| | 19 |
| | 19 |
| | 20 |
| | 21 |
| | 22 |
| | 28 |
| | 29 |
| | 30 |
| | 37 |
F-2
WMC RESOURCES LTD AND CONTROLLED ENTITIES INTERIM COMBINED STATEMENTS OF INCOME AND COMPREHENSIVE INCOME
(Millions of dollars except per share amounts)
| | | Notes
| | | Six months To June 30 2002 Unaudited A$
| | | Six months To June 30 2001 Unaudited
A$
| |
| Continuing Operations: | | | | | | | | | |
Net sales revenue | | 2 | | | 1,196.3 | | | 1,339.1 | |
| Cost of goods sold | | | | | (817.2 | ) | | (934.5 | ) |
| Selling and distribution | | | | | (82.1 | ) | | (79.6 | ) |
| General and administrative | | | | | (152.4 | ) | | (118.6 | ) |
| General and administrative — exceptional items | | 4 | | | (65.6 | ) | | (9.4 | ) |
| Exploration and evaluation | | | | | (14.4 | ) | | (36.2 | ) |
| Other expenses | | | | | (127.5 | ) | | (41.9 | ) |
| Other income | | 2 | | | 28.9 | | | 123.7 | |
| Other income — exceptional items | | | | | 137.9 | | | — | |
| | | | | |
|
| |
|
|
Profit before interest and income tax | | | | | 103.9 | | | 242.6 | |
| Interest expense | | 3 | (b) | | (78.7 | ) | | (174.3 | ) |
| | | | | |
|
| |
|
|
| Profit before income taxes | | | | | 25.2 | | | 68.3 | |
| Income tax expense | | 5 | | | (13.1 | ) | | (26.8 | ) |
| | | | | |
|
| |
|
|
Net profit from continuing operations | | | | | 12.1 | | | 41.5 | |
| | | | | |
|
| |
|
|
Discontinued Operations: | | | | | | | | | |
Net sales revenue | | 2 | | | (1.4 | ) | | 217.0 | |
| Net expenses | | | | | (5.5 | ) | | (124.1 | ) |
| Income tax credit/(expense) | | 5 | | | 0.6 | | | (18.3 | ) |
| Profit on sale of right to Gold Royalty | | 4 | | | 15.4 | | | — | |
| Profit on sale of Central Norseman Gold Corporation Limited | | 4 | | | 25.1 | | | — | |
| | | | | |
|
| |
|
|
| Net profit from discontinued operations | | | | | 34.2 | | | 74.6 | |
| | | | | |
|
| |
|
|
Combined Operations: | | | | | | | | | |
Net sales revenue | | 2 | | | 1,194.9 | | | 1,556.1 | |
| Cost of goods sold | | | | | (817.2 | ) | | (1,099.0 | ) |
| Selling and distribution | | | | | (82.1 | ) | | (80.8 | ) |
| General and administrative | | | | | (155.6 | ) | | (127.0 | ) |
| General and administrative — exceptional items | | 4 | | | (103.6 | ) | | (70.4 | ) |
| Exploration and evaluation | | | | | (17.2 | ) | | (48.2 | ) |
| Other expenses | | | | | (127.2 | ) | | (41.9 | ) |
| Other income | | 2 | | | 29.1 | | | 124.5 | |
| Other income — exceptional items | | 4 | | | 216.4 | | | 122.2 | |
| | | | | |
|
| |
|
|
Profit before interest and income tax | | | | | 137.5 | | | 335.5 | |
| Interest expense | | 3 | (b) | | (78.7 | ) | | (174.3 | ) |
| | | | | |
|
| |
|
|
| Profit before income taxes | | | | | 58.8 | | | 161.2 | |
| Income tax expense | | 5 | | | (12.5 | ) | | (45.1 | ) |
| | | | | |
|
| |
|
|
Net profit attributable to holding company shareholders | | | | | 46.3 | | | 116.1 | |
| Foreign currency adjustments | | | | | 37.7 | | | (24.6 | ) |
| | | | | |
|
| |
|
|
Total changes in equity other than those resulting from
transactions with owners as owners | | | | | 84.0 | | | 91.5 | |
| | | | | |
|
| |
|
|
|
| Net earnings per share attributable to holding company shareholders | | 6 | | | | | | | |
| — Australian GAAP (basic) — A$ | | | | | 0.04 | | | 0.10 | |
| — Australian GAAP (diluted) — A$ | | | | | 0.04 | | | 0.11 | |
| | | | | |
|
| |
|
|
The accompanying notes form part of these interim combined financial statements.
F-3
WMC RESOURCES LTD AND CONTROLLED ENTITIES INTERIM COMBINED BALANCE SHEETS
(Millions of dollars)
| | | Notes
| | As at 30 June 2002 Unaudited
A$
| | As at 31 December 2001 Unaudited A$
|
CURRENT ASSETS | | | | | | |
| Cash assets | | 8 | | 62.4 | | 124.1 |
| Receivables | | 9 | | 538.3 | | 496.0 |
| Other financial assets | | 10 | | 17.0 | | 20.1 |
| Inventories | | 11 | | 481.9 | | 410.2 |
| Other | | 12 | | 181.6 | | 230.5 |
| | | | |
| |
|
Total current assets | | | | 1,281.2 | | 1,280.9 |
| | | | |
| |
|
|
NON-CURRENT ASSETS | | | | | | |
| Receivables | | 13 | | 358.6 | | 481.4 |
| Other financial assets | | 14 | | 18.0 | | 18.2 |
| Inventories | | 15 | | 83.1 | | 82.4 |
| Exploration and evaluation | | 16 | | 62.3 | | 64.5 |
| Property, plant and equipment | | 17 | | 4,630.4 | | 4,775.3 |
| Deferred tax assets | | | | 284.7 | | 303.7 |
| Other | | 18 | | 743.5 | | 1,236.5 |
| | | | |
| |
|
Total non-current assets | | | | 6,180.6 | | 6,962.0 |
| | | | |
| |
|
TOTAL ASSETS | | | | 7,461.8 | | 8,242.9 |
| | | | |
| |
|
|
CURRENT LIABILITIES | | | | | | |
| Payables | | 19 | | 452.2 | | 855.2 |
| Interest bearing liabilities | | 20 | | 467.6 | | 584.3 |
| Current tax liabilities | | | | 3.2 | | 8.0 |
| Provisions | | 21 | | 71.3 | | 74.7 |
| Other | | 22 | | 20.3 | | 15.1 |
| | | | |
| |
|
Total current liabilities | | | | 1,014.6 | | 1,537.3 |
| | | | |
| |
|
|
NON-CURRENT LIABILITIES | | | | | | |
| Payables | | 23 | | 914.2 | | 1,197.7 |
| Interest bearing liabilities | | 24 | | 1,633.4 | | 1,737.7 |
| Deferred tax liabilities | | | | 439.6 | | 434.6 |
| Provisions | | 25 | | 97.8 | | 97.0 |
| Other | | 26 | | 2.8 | | 9.3 |
| | | | |
| |
|
| Total non-current liabilities | | | | 3,087.8 | | 3,476.3 |
| | | | |
| |
|
TOTAL LIABILITIES | | | | 4,102.4 | | 5,013.6 |
| | | | |
| |
|
| Minority shareholders’ interest in subsidiaries | | | | 0.8 | | 9.0 |
| | | | |
| |
|
NET ASSETS | | | | 3,358.6 | | 3,220.3 |
| | | | |
| |
|
|
EQUITY | | | | 3,358.6 | | 3,220.3 |
| | | | |
| |
|
Commitments | | 31 | | | | |
Contingent liabilities and gains | | 30 | | | | |
The accompanying notes form part of these interim combined financial statements.
F-4
WMC RESOURCES LTD AND CONTROLLED ENTITIES INTERIM COMBINED STATEMENTS OF CASH FLOWS
(Millions of dollars)
| | | | | | Six months | | | Six months | |
| | | | | | To 30 June | | | To 30 June | |
| | | | | | 2002 | | | 2001 | |
| | | | | | Unaudited | | | Unaudited | |
| | | Notes
| | | A$
| | | A$
| |
CASH FLOWS FROM OPERATING ACTIVITIES | | | | | | | | | |
| Receipts from customers | | | | | 1,136.0 | | | 1,628.7 | |
| Payments to suppliers and employees | | | | | (1,097.4 | ) | | (1,138.2 | ) |
| Interest and other items of a similar nature received | | | | | 17.9 | | | 16.2 | |
| Borrowing costs | | | | | (75.4 | ) | | (98.0 | ) |
| Proceeds from early termination of interest rate swaps | | | | | 71.2 | | | — | |
| Income taxes (paid)/refunded | | | | | (2.8 | ) | | (2.2 | ) |
| Proceeds from insurance claims | | | | | 22.9 | | | 39.0 | |
| Payments for: | | | | | | | | | |
| -exploration (grassroots) | | | | | (7.3 | ) | | (27.9 | ) |
| -exploration (additional, supporting existing operations) | | | | | (1.7 | ) | | (9.8 | ) |
| | | | | |
|
| |
|
|
Net cash provided by operating activities | | 27 | (a) | | 63.4 | | | 407.8 | |
| | | | | |
|
| |
|
|
CASH FLOWS FROM INVESTING ACTIVITIES | | | | | | | | | |
| Payments for property, plant and equipment | | | | | (137.6 | ) | | (199.1 | ) |
| Proceeds from sale of Central Norseman Gold Corporation Limited | | | | | 25.7 | | | — | |
| Proceeds from sale of equity interest in Mondo Minerals | | | | | — | | | 122.2 | |
| Proceeds from sale of investments | | | | | — | | | 12.4 | |
| Proceeds from sale of non-current assets | | | | | 3.3 | | | 42.3 | |
| Payments for closed out gold hedges | | | | | (24.7 | ) | | — | |
| Proceeds/(payments) for short term investments | | | | | 3.1 | | | (2.6 | ) |
| Payments for research and development | | | | | (0.4 | ) | | (0.1 | ) |
| Payments for evaluation expenditure | | | | | (3.3 | ) | | (29.9 | ) |
| | | | | |
|
| |
|
|
Net cash used in investing activities | | | | | (133.9 | ) | | (54.8 | ) |
| | | | | |
|
| |
|
|
CASH FLOWS FROM FINANCING ACTIVITIES | | | | | | | | | |
| Deemed equity contribution | | | | | 54.3 | | | 182.8 | |
| Proceeds from borrowings | | | | | 651.0 | | | 195.0 | |
| Repayments of borrowings | | | | | (687.6 | ) | | (532.0 | ) |
| | | | | |
|
| |
|
|
Net cash provided/(used in) by financing activities | | | | | 17.7 | | | (154.2 | ) |
| | | | | |
|
| |
|
|
Net (decrease)/increase in cash held | | | | | (52.8 | ) | | 198.8 | |
| Cash at the beginning of the financial period | | | | | 123.9 | | | 58.4 | |
| Effects of exchange rate changes on foreign currency cash balances | | | | | (8.7 | ) | | 3.6 | |
| | | | | |
|
| |
|
|
Cash at the end of the financial period | | (a | ) | | 62.4 | | | 260.8 | |
| | | | | |
|
| |
|
|
|
The accompanying notes form part of these interim combined financial statements. | | | | | | | | | |
|
(a) Reconciliation of Cash | | | | | | | | | |
| For the purposes of the combined statements of cash flows, cash represents | | | | | | | | | |
| cash on hand, at the bank and on short-term deposit (maturity of 3 months | | | | | | | | | |
| or less) less bank overdrafts: | | | | | | | | | |
|
Cash assets—US GAAP cash and cash equivalents | | 8 | | | 62.4 | | | 262.0 | |
| Bank overdrafts | | 20 | | | — | | | (1.2 | ) |
| | | | | |
|
| |
|
|
|
Australian GAAP cash and cash equivalents | | | | | 62.4 | | | 260.8 | |
| | | | | |
|
| |
|
|
The above statements differ from US GAAP in that under US GAAP bank overdrafts are not considered to be part of the net cash equivalents and so changes in bank overdrafts (net) would be included in cash flows from financing activities. In addition, payments for research and development would be included in cash flows from operating activities instead of investing activities. Refer to Note 32.
F-5
WMC RESOURCES LTD AND CONTROLLED ENTITIES INTERIM COMBINED STATEMENTS OF CHANGES IN EQUITY
(Millions of dollars)
| | | Six months | | Six months | |
| | | To 30 June | | To 30 June | |
| | | 2002 | | 2001 | |
| | | Unaudited | | Unaudited | |
| | | A$
| | A$
| |
| Equity at the beginning of the financial period | | 3,220.3 | | 3,123.8 | |
| Net income | | 46.3 | | 116.1 | |
| Other comprehensive income | | 37.7 | | (24.6 | ) |
| Deemed equity contribution/(distribution) | | 54.3 | | 182.8 | |
| | |
| |
|
|
Equity at the end of the financial period | | 3,358.6 | | 3,398.1 | |
| | |
| |
|
|
The accompanying notes form part of these interim combined financial statements.
F-6
WMC RESOURCES LTD AND CONTROLLED ENTITIES
Notes to the Interim Combined Financial Statements
1. SUMMARY OF SIGNIFICANT ACCOUNTING POLICIES
BASIS OF ACCOUNTING
The accompanying interim combined financial statements of WMC Resources Ltd and its controlled entities (“WMC Resources”) have been prepared for the interim six months ended 30 June 2002 in accordance with Australian Accounting Standards and other mandatory professional reporting requirements. These standards and reporting requirements form part of generally accepted accounting principles in Australia (Australian GAAP). Where these principles differ from those generally accepted in the United States of America (US GAAP), reference is made by footnote. A reconciliation of the major differences between these principles and those applicable under US GAAP is included as Note 32.
The financial report is prepared in accordance with the historical cost convention. Unless otherwise stated, the accounting policies adopted are consistent with those of the previous year.
The interim combined financial statements are presented on a carve-out basis and include the statements of income and comprehensive income, balance sheets, changes in equity and cash flows of WMC Resources’ existing nickel businesses as at 30 June, 2002 and the copper, uranium oxide and fertilizer businesses that were transferred to WMC Resources from WMC Limited in the demerger. Also included are the discontinued gold and talc operations of WMC Resources sold during 2002 and 2001. These interim combined financial statements have been prepared from historical accounting records of the WMC Limited Group and present substantially all of the operations of the businesses that will be owned and operated by WMC Resources as if WMC Resources had been a separate economic entity inclusive of all of these businesses for all periods presented.
Changes to equity in the periods presented arise from net income or loss, other comprehensive income and other deemed contributions/distributions with WMC Limited. Deemed equity contributions/distributions represent the net capital amounts received by WMC Resources from WMC Limited and also include the net contribution arising from businesses to be retained by WMC Limited.
The preparation of financial statements in conformity with generally accepted accounting principles (“GAAP”) requires management to make estimates and assumptions that affect the reported amounts of assets and liabilities and disclosure of contingent assets and liabilities at the dates of the financial statements and the reported amounts of revenues and expenses during the reporting periods. Actual results could differ from those estimates.
The financial information presented as of 30 June 2002 and for each of the six month periods ended 30 June 2002 and 2001 is unaudited. In the opinion of management, this financial information reflects all adjustments necessary for a fair presentation of the financial information for such periods. These adjustments, consist of normal recurring items. The results of operations for the six month period ended 30 June 2002 should not necessarily be taken as indicative of the results of operations that may be expected for the entire year ending 31 December 2002.
F-7
WMC RESOURCES LTD AND CONTROLLED ENTITIES
Notes to the Interim Combined Financial Statements
| | | Notes
| | | Six months To 30 June 2002 Unaudited A$
| | | Six months To 30 June 2001 Unaudited A$
| |
| | | | | | | | | |
Sales revenue from core operating activities: | | | | | | | | | |
Sale of goods from continuing operations(1) | | | | | 1,196.3 | | | 1,339.1 | |
| Sale of goods from discontinued operations | | | | | (1.4 | ) | | 217.0 | |
| | | | | |
|
| |
|
|
Net sales revenue | | 2 | (a) | | 1,194.9 | | | 1,556.1 | |
| | | | | |
|
| |
|
|
|
Other income: | | | | | | | | | |
| Interest received/receivable | | 3 | (b) | | 19.1 | | | 91.8 | |
| Profit on sale of non-current assets | | | | | — | | | 2.2 | |
| Insurance proceeds | | | | | — | | | 23.1 | |
| Other income | | | | | 9.8 | | | 6.6 | |
| | | | | |
|
| |
|
|
| Other income from continuing operations | | | | | 28.9 | | | 123.7 | |
| Other income from discontinued operations | | | | | 0.2 | | | 0.8 | |
| Profit on sale of non-current assets-discontinued operations | | | | | 40.5 | | | 61.7 | |
| | | | | |
|
| |
|
|
Total other income | | | | | 69.6 | | | 186.2 | |
| | | | | |
|
| |
|
|
|
SUBTOTAL NET REVENUES | | | | | 1,264.5 | | | 1,742.3 | |
|
| Proceeds from sale of non-current assets | | | | | 81.7 | | | 139.7 | |
| Less profit on disposal of non-current assets | | | | | (40.5 | ) | | (63.9 | ) |
| | | | | |
|
| |
|
|
OPERATING REVENUE — AUS. GAAP | | | | | 1,305.7 | | | 1,818.1 | |
| | | | | |
|
| |
|
|
|
(a) Net sales revenue includes: | | | | | | | | | |
| Currency hedging losses: | | | | | | | | | |
| -continuing operations | | | | | (64.4 | ) | | (124.5 | ) |
| -discontinued operations | | | | | (0.8 | ) | | (25.6 | ) |
| | | | | |
|
| |
|
|
| | | | | | (65.2 | ) | | (150.1 | ) |
| | | | | |
|
| |
|
|
|
| Commodity hedging (losses)/gains: | | | | | | | | | |
| -continuing operations | | | | | (2.8 | ) | | (0.1 | ) |
| -discontinued operations | | | | | (0.6 | ) | | 35.0 | |
| | | | | |
|
| |
|
|
| | | | | | (3.4 | ) | | 34.9 | |
| | | | | |
|
| |
|
|
| | | | | | (68.6 | ) | | (115.2 | ) |
| | | | | |
|
| |
|
|
(1) Amounts included in revenue which were based on provisional pricing | | | | | 80.0 | | | 114.6 | |
F-8
WMC RESOURCES LTD AND CONTROLLED ENTITIES
Notes to the Interim Combined Financial Statements
| | | Notes
| | Six months To 30 June 2002 Unaudited A$
| | | Six months To 30 June 2001 Unaudited A$
| |
3. DISCLOSURES ABOUT ITEMS INCLUDED IN OPERATING INCOME BEFORE INCOME TAX | | | |
|
Operating Income before income tax includes the following specific expenses: | | | | | | | | |
(a) Amortization and depreciation | | | | | | | | |
| Amortization: | | | | | | | | |
| — government facilities | | | | 0.8 | | | 0.9 | |
| — mine properties and mine development | | | | 72.4 | | | 113.0 | |
| — goodwill/intangibles | | | | 7.2 | | | 7.6 | |
| — research and development | | | | 0.3 | | | 1.1 | |
| Depreciation: | | | | | | | | |
| — plant and equipment | | | | 168.4 | | | 151.8 | |
| — land and buildings | | | | 13.0 | | | 9.5 | |
| | | | |
|
| |
|
|
| Total amortization and depreciation charged to profit | | | | 262.1 | | | 283.9 | |
| | | | |
|
| |
|
|
(b) Borrowing costs | | | | | | | | |
Interest received/receivable | | | | | | | | |
| — continuing operations | | 2 | | (19.1 | ) | | (91.8 | ) |
| — discontinued operations | | | | — | | | (0.7 | ) |
| | | | |
|
| |
|
|
| | | | | (19.1 | ) | | (92.5 | ) |
| | | | | | | | | |
| Add proceeds received from early termination of interest rate swaps | | 4 | | (75.9 | ) | | — | |
| | | | |
|
| |
|
|
| | | | | (95.0 | ) | | (92.5 | ) |
| Interest and finance charges paid/payable | | | | 78.7 | | | 174.3 | |
| | | | |
|
| |
|
|
Net (credit)/charge to income | | | | (16.3 | ) | | 81.8 | |
| | | | |
|
| |
|
|
F-9
WMC RESOURCES LTD AND CONTROLLED ENTITIES
Notes to the Interim Combined Financial Statements
| | | Notes
| | Six Months To 30 June 2002 Unaudited A$
| | | Six months To 30 June 2001 Unaudited A$
| |
| | | | | | | | |
Gains/(Charges) | | | | | | | | |
|
Continuing Operations: | | | | | | | | |
Insurance revenue in relation to fire at the Olympic Dam solvent extraction plant (1) | | | | 62.0 | | | — | |
| Cost associated with lost production due to the fire at the Olympic Dam solvent extraction plant | | | | (56.9 | ) | | — | |
| Proceeds received from early termination of Interest Rate Swaps | | 3 | | 75.9 | | | — | |
| Costs associated with preparation for the demerger | | | | (8.7 | ) | | — | |
| Cost of redundancies associated with the restructuring of service functions | | | | — | | | (9.4 | ) |
| | | | |
|
| |
|
|
Exceptional items before income tax | | | | 72.3 | | | (9.4 | ) |
|
Discontinued Operations: | | | | | | | | |
| Profit on sale of Central Norseman Gold Corporation Limited | | | | 25.1 | | | — | |
| Profit on sale of right to Gold Royalty | | | | 15.4 | | | — | |
| Profit on sale of equity interest in Mondo Minerals | | | | — | | | 61.2 | |
| | | | |
|
| |
|
|
Exceptional items before income tax | | | | 112.8 | | | 51.8 | |
| | | | |
|
| |
|
|
|
Income tax (charge)/credits on: | | | | | | | | |
| Insurance revenue in relation to fire at Olympic Dam | | | | (18.6 | ) | | — | |
| Proceeds received from early termination of Interest Rate Swaps | | | | (22.8 | ) | | — | |
| Costs associated with lost production due to fire at solvent extraction plant | | | | 17.1 | | | — | |
| Costs associated with preparation for the demerger | | | | 2.6 | | | — | |
| Cost of redundancies due to restructuring WMC service functions | | | | — | | | 2.8 | |
| Profit on sale of equity interest in Mondo Minerals | | | | — | | | (10.1 | ) |
| | | | |
|
| |
|
|
|
Income tax credit/(charge) on above exceptional items: | | | | | | | | |
— continuing operations | | 5 | | (21.7 | ) | | 2.8 | |
— discontinued operations | | 5 | | — | | | (10.1 | ) |
| | | | |
|
| |
|
|
Gain on exceptional items after tax | | | | 91.1 | | | 44.5 | |
| | | | |
|
| |
|
|
(1) Insurance proceeds are recognised when WMC Resources is satisfied that a valid claim exists which will be accepted, it is probable that the amount will flow to WMC Resources and the amount can be measured reliably. Under US GAAP, insurance proceeds are not recognized as revenue until realized, either through receipt of the insurance proceeds or an agreement with the insurance provider as to the amount of insurance proceeds to be received. However, for the fiscal years ended 31 December 2001, 2000, and 1999 there is no US GAAP difference relating to the insurance proceeds not received at year end as WMC Resources had an agreement from the insurance providers as to the amount of insurance proceeds to be received.
F-10
WMC RESOURCES LTD AND CONTROLLED ENTITIES Notes to the Interim Combined Financial Statements
| | | Notes
| | Six months To 30 June 2002 Unaudited A$
| | | Six months To 30 June 2001 Unaudited A$
| |
5. INCOME TAX | | | | | | | | |
Pre-tax operating income | | | | | | | | |
| Income from continuing operations | | | | 25.2 | | | 68.3 | |
| (Loss)/income from discontinued operations | | | | (6.9 | ) | | 92.9 | |
| Profit on sale of right to Gold Royalty | | | | 15.4 | | | — | |
| Gain on disposal of discontinued operations | | | | 25.1 | | | — | |
| | | | |
|
| |
|
|
Pre-tax operating income | | | | 58.8 | | | 161.2 | |
| | | | |
|
| |
|
|
Prima facie tax expense for the period at the rate of 30% | | | | (17.7 | ) | | (48.4 | ) |
The following tax effect on these items caused the total charge for income tax to vary from the above: | | | | | | | | |
| Non-assessable capital gains | | | | 9.5 | | | 4.5 | |
| Research and development | | | | 0.8 | | | 0.3 | |
| Depreciation and amortization | | | | 0.2 | | | (1.2 | ) |
| Non-deductible expenses | | | | (0.7 | ) | | (1.2 | ) |
| Future income tax benefits movements | | | | (4.8 | ) | | (2.0 | ) |
| Variance between Australian and foreign tax rates | | | | (0.8 | ) | | 0.7 | |
| Rebates/credits | | | | (0.4 | ) | | 0.1 | |
| Exempt income | | | | 1.5 | | | 0.7 | |
| | | | |
|
| |
|
|
| Income tax expense for the period | | | | (12.4 | ) | | (46.5 | ) |
| Adjustment for (under)/over provision in prior years | | | | (0.1 | ) | | 1.4 | |
| | | | |
|
| |
|
|
Total income tax expense | | | | (12.5 | ) | | (45.1 | ) |
| | | | |
|
| |
|
|
| Income tax expense comprises: | | | | | | | | |
Continuing Operations: | | | | | | | | |
| Income tax credit/(expense) comprises: | | | | | | | | |
| - Normal | | | | 8.6 | | | (29.6 | ) |
| - Exceptional gains and losses | | 4 | | (21.7 | ) | | 2.8 | |
| | | | |
|
| |
|
|
| | | | | (13.1 | ) | | (26.8 | ) |
| | | | |
|
| |
|
|
Discontinued Operations: | | | | | | | | |
| -Normal | | | | 0.6 | | | (8.2 | ) |
| -Exceptional gains and losses | | 4 | | — | | | (10.1 | ) |
| | | | |
|
| |
|
|
| | | | | 0.6 | | | (18.3 | ) |
| | | | |
|
| |
|
|
| | | | | (12.5 | ) | | (45.1 | ) |
| | | | |
|
| |
|
|
F-11
WMC RESOURCES LTD AND CONTROLLED ENTITIES
Notes to the Interim Combined Financial Statements
| | | Six months To 30 June 2002 Unaudited A$
| | Six months To 30 June 2001 Unaudited A$
| |
| | Cents per share | |
Unaudited pro forma basic earnings per share calculated on profit after income tax and minority interests.(1) | | 4.2 | | 10.5 | |
| | |
| |
|
|
| Unaudited pro forma diluted earnings per share calculated on profit after income tax and minority interests | | 4.4 | | 10.7 | |
| | |
| |
|
|
Unaudited pro forma basic earnings per share calculated on net income in accordance with US GAAP(2) (Note 32) | | 12.8 | | (0.1 | ) |
| | |
| |
|
|
(1)Australian GAAP | | | | | |
| Earnings per share from continuing operations | | 1.1 | | 3.8 | |
| Earnings per share from discontinued operations | | 3.1 | | 6.7 | |
| | |
| |
|
|
| | | 4.2 | | 10.5 | |
| | |
| |
|
|
(2)US GAAP | | | | | |
| Earnings per share from continuing operations | | 8.9 | | (6.8 | ) |
| Earnings per share from discontinued operations | | 3.9 | | 6.7 | |
| | |
| |
|
|
| | | 12.8 | | (0.1 | ) |
| | |
| |
|
|
| | | Number of shares | |
| Weighted average number of ordinary shares outstanding during the half year used in the calculation of basic earnings per share. | | 1,111,147,678 | | 1,100,779,558 | |
| Potential ordinary shares from the conversion of partly paid shares and options. | | 13,429,411 | | 16,290,238 | |
| | |
| |
|
|
| Weighted average number of ordinary shares outstanding during the half year including potential ordinary shares used in the calculation of diluted earnings per share. | | 1,124,577,089 | | 1,117,069,796 | |
| | |
| |
|
|
F-12
WMC RESOURCES LTD AND CONTROLLED ENTITIES
Notes to the Interim Combined Financial Statements
6. EARNINGS PER SHARE (Continued)
(a) Information concerning classification of securities
As a result of the demerger, existing WMC Limited shareholders received one WMC Resources share for every WMC Limited share owned. The unaudited pro forma disclosures in these carve-out financial statements are based on the number of shares and options of WMC Limited outstanding for the periods concerned.
The partly paid shares carry the right to participate in dividends in proportion to the amount paid relative to the total issue price (for partly paid shares issued in 1987, relative to the nominal value), and to that extent they have been recognised as equivalents of ordinary shares in the determination of basic earnings per share. At balance date there were no partly paid shares (June 2001: 656,000), callable at the option of the holders and which at balance date were considered dilutive for the purpose of the calculation of diluted earnings per share. At balance date there were 24,195,573 (June 2001: 20,286,724) options which were considered potentially dilutive and therefore, were used in the calculation of diluted earnings per share.
(b) Comparative information
The basic earnings per share as presented and diluted earnings per share for the current and previous periods have been adjusted for the conversion of partly paid shares. The adjustment is in accordance with the Australian Accounting Standard AASB 1027, “Earnings Per Share”.
(c) Conversion, call, subscription or issue after 30 June 2002
There have been no material conversions to, calls of, or subscriptions for ordinary shares or issues of potential ordinary shares since the reporting date and before completion of these financial statements except those consequent to the demerger.
| | | (Millions of $)
| |
| | | Six months To 30 June 2002 Unaudited A$
| | Six months To 30 June 2001 Unaudited A$
| |
(d) Reconciliation of earnings used in the calculation of earnings per share | | | | | |
Net Income | | 46.3 | | 116.1 | |
| Nominal interest from the conversion of partly paid shares and options | | 2.7 | | 3.4 | |
| | |
| |
|
|
Potential diluted earnings | | 49.0 | | 119.5 | |
| | |
| |
|
|
US GAAP earnings (Note 32) | | 142.5 | | (0.8 | ) |
| | |
| |
|
|
F-13
WMC RESOURCES LTD AND CONTROLLED ENTITIES
Notes to the Interim Combined Financial Statements
7. FINANCIAL REPORTING BY SEGMENT
| | | Sales Revenue(i)
| | | Profit Before Income Tax
| |
| | | Six months To 30 June 2002 Unaudited A$
| | | Six months To 30 June 2001 Unaudited A$
| | | Six months To 30 June 2002 Unaudited A$
| | | Six months To 30 June 2001 Unaudited A$
| |
Business Segments | | | | | | | | | | | | |
| Copper/uranium | | 318.9 | | | 430.7 | | | 14.8 | | | 85.3 | |
| Nickel | | 598.5 | | | 668.7 | | | 80.1 | | | 165.7 | |
| Fertilizer | | 269.7 | | | 239.7 | | | (16.3 | ) | | (17.1 | ) |
| Other | | 9.2 | | | — | | | 5.4 | | | 2.4 | |
Corporate and unallocated | | | | | | | | | | | | |
| New business | | — | | | — | | | (17.7 | ) | | (17.1 | ) |
| Regional exploration | | — | | | — | | | (9.7 | ) | | (30.1 | ) |
| Corporate | | — | | | — | | | (37.1 | ) | | (41.2 | ) |
| Finance and other costs | | — | | | — | | | (10.6 | ) | | 2.9 | |
| Net interest | | — | | | — | | | 16.3 | | | (82.5 | ) |
| | |
|
| |
|
| |
|
| |
|
|
Continuing Operations | | 1,196.3 | | | 1,339.1 | | | 25.2 | | | 68.3 | |
Discontinued Operations-Gold | | (1.4 | ) | | 204.0 | | | 33.9 | | | 26.9 | |
Discontinued Operations-Talc | | — | | | 13.0 | | | (0.3 | ) | | 66.0 | |
| | |
|
| |
|
| |
|
| |
|
|
Economic entity | | 1,194.9 | (ii) | | 1,556.1 | (ii) | | 58.8 | | | 161.2 | |
| | |
|
| |
|
| |
|
| |
|
|
| | (i) | | Sales revenue includes by-product sales, commodity and related currency hedging. Intra segment sales are on a commercial basis and are not significant. |
| | (ii) | | Total sales are sold to the following countries / regions: Australia 28% (2001: 34%), Europe 31% (29%), Japan 9% (13%), North America 9% (9% ), Taiwan 4% (4%) and Other 18% (11%). |
The segmental analysis has been prepared on the following basis:
| (a) | | Operating segments – WMC Resources’ activities have been segmented based on management reporting to the Chief Executive Officer as follows: |
| | - | | Copper/uranium. The multi-metal operations based on the Olympic Dam ore body, principally copper and uranium, but also gold and silver. |
| | - | | Other. This category includes other minor activities. |
Included with the major divisional business units above are any applicable hedging gains and losses and the revenues and costs of associated by-products. Other activities not identifiable with these segments are grouped under the heading “Corporate”. This category includes unallocated corporate overhead and disposals of corporate non-current assets. The New business segment includes identification, evaluation and implementation of new opportunities.
| (b) | | Segment results have been calculated after taking into account inter-segment sales and other eliminations. These sales are immaterial and are made on a commercial basis. |
F-14
WMC RESOURCES LTD AND CONTROLLED ENTITIES
Notes to the Interim Combined Financial Statements
| | | Notes
| | As at 30 June 2002 Unaudited A$
| | As at 31 Dec 2001 Unaudited A$
|
8. CURRENT ASSETS — CASH ASSETS | | | | | | |
| Cash at bank and on hand | | | | 52.3 | | 106.2 |
Short term deposits (maturity of three
months or less) | | | | 10.1 | | 17.9 |
| | | | |
| |
|
| | | | | 62.4 | | 124.1 |
| | | | |
| |
|
9. CURRENT ASSETS — RECEIVABLES
| Trade debtors | | 273.1 | | | 214.3 | |
| Provision for doubtful debts | | (6.0 | ) | | (6.7 | ) |
| | |
|
| |
|
|
| | | 267.1 | | | 207.6 | |
| | |
|
| |
|
|
| Other debtors | | 199.4 | | | 107.1 | |
| Provision for doubtful debts | | (0.2 | ) | | — | |
| | |
|
| |
|
|
| | | 199.2 | | | 107.1 | |
| | |
|
| |
|
|
| Debtors relating to hedging contracts | | 72.0 | | | 181.3 | |
| | |
|
| |
|
|
| | | 538.3 | | | 496.0 | |
| | |
|
| |
|
|
10. CURRENT ASSETS — OTHER FINANCIAL ASSETS | | | | | | |
| Short term deposits (maturity of over three months, and up to twelve months) | | 17.0 | | | 20.1 | |
| | |
|
| |
|
|
11. CURRENT ASSETS — INVENTORIES
| Stores at cost | | | | 66.5 | | | 71.9 | |
| Provision for obsolescence | | | | (1.1 | ) | | (0.8 | ) |
| | | | |
|
| |
|
|
| | | | | 65.4 | | | 71.1 | |
| | | | |
|
| |
|
|
| Trading stocks at cost | | | | 169.2 | | | 156.8 | |
| Trading stocks at net realisable value | | | | 14.0 | | | 34.5 | |
| Work in progress at cost | | | | 226.7 | | | 142.1 | |
| Work in progress at net realisable value | | | | 6.6 | | | 5.7 | |
| | | | |
|
| |
|
|
| | | | | 416.5 | | | 339.1 | |
| | | | |
|
| |
|
|
| | | | | | | | | |
Total current inventories | | 11(a) | | 481.9 | | | 410.2 | |
| | | | |
|
| |
|
|
| (a) Current inventories | | | | 481.9 | | | 410.2 | |
| Non-current inventories | | 15 | | 83.1 | | | 82.4 | |
| | | | |
|
| |
|
|
| Total inventories | | | | 565.0 | | | 492.6 | |
| | | | |
|
| |
|
|
F-15
WMC RESOURCES LTD AND CONTROLLED ENTITIES
Notes to the Interim Combined Financial Statements
| | | | | Notes
| | As at 30 June 2002 Unaudited A$
| | As at 31 Dec 2001 Unaudited A$
|
| | CURRENT ASSETS—OTHER | | | | | | |
| | | Prepayments | | | | 89.8 | | 58.4 |
| | | Deferred losses-hedging contracts | | 12(a) | | 82.2 | | 157.7 |
| | | Other | | | | 9.6 | | 14.4 |
| | | | | | |
| |
|
| | | | | | | 181.6 | | 230.5 |
| | | | | | |
| |
|
| | (a) | | Deferred gains and losses consist of realized and unrealized gains and losses arising from commodity hedging contracts and related currency hedging contracts that are in place, but which relate to commodities to be produced and sold in future years. The deferred gains and losses will be brought to account in the year that the related production is sold. Whether the unrealized deferred balances will be realized and at what amount depends upon commodity and currency prices at the time the underlying commodity being hedged is sold. |
In accordance with Australian accounting standards, the balance sheet position has been calculated using current spot prices at balance date. The amounts deferred in the balance sheet are set out below.
| | | Deferred losses: | | | | | | | | |
| | | — Current | | 12 | | (82.2 | ) | | (157.7 | ) |
| | | — Non-current | | 18 | | (716.1 | ) | | (1,188.2 | ) |
| | | | | | |
|
| |
|
|
| | | Net Position | | 29D | | (798.3 | ) | | (1,345.9 | ) |
| | | | | | |
|
| |
|
|
| | | The net amount that has been received/(paid) or is receivable/(payable) in the following currency: | | | | | | | | |
| | | — US dollars | | | | — | | | 21.8 | |
| | | | | | |
|
| |
|
|
| | | A$ equivalent of above currency | | | | — | | | 42.7 | |
| | | A$ equivalent of other items | | | | 0.2 | | | 0.4 | |
| | | In Australian dollars | | | | (798.5 | ) | | (1,389.0 | ) |
| | | | | | |
|
| |
|
|
| | | | | | | (798.3 | ) | | (1,345.9 | ) |
| | | | | | |
|
| |
|
|
Deferral of hedging gains and losses on the balance sheet is not in accordance with US GAAP, which requires hedging gains and losses to be included as part of other comprehensive income. Refer to Note 32(j).
13. NON-CURRENT ASSETS—RECEIVABLES
| | | Loans and debtors | | 11.1 | | 4.6 | |
| | | Provision for doubtful debts | | — | | (0.7 | ) |
| | | | |
| |
|
|
| | | | | 11.1 | | 3.9 | |
| | | Debtors relating to hedging contracts | | 347.5 | | 477.5 | |
| | | | |
| |
|
|
| | | | | 358.6 | | 481.4 | |
| | | | |
| |
|
|
|
14. NON-CURRENT ASSETS—OTHER FINANCIAL ASSETS | | | | | |
|
| | | Securities listed on prescribed stock exchanges | | | | | |
| | | Cost | | 0.1 | | 0.1 | |
| | | Provision for diminution in value of investments | | — | | — | |
| | | | |
| |
|
|
| | | Total investments in quoted companies | | 0.1 | | 0.1 | |
| | | | |
| |
|
|
| | | Quoted market value | | 1.7 | | 1.1 | |
| | | Other investments at cost | | 17.9 | | 18.1 | |
| | | | |
| |
|
|
| | | Total investments in unquoted entities | | 17.9 | | 18.1 | |
| | | | |
| |
|
|
| | | Total investments in other entities | | 18.0 | | 18.2 | |
| | | | |
| |
|
|
F-16
| | | | | Notes
| | As at 30 June 2002 Unaudited A$
| | | As at 31 Dec 2001 Unaudited A$
| |
| | NON-CURRENT ASSETS—INVENTORIES | | | | | | | | |
| | | Stores | | | | 46.9 | | | 44.9 | |
| | | Provision for obsolescence | | | | (14.1 | ) | | (12.9 | ) |
| | | | | | |
|
| |
|
|
| | | | | | | 32.8 | | | 32.0 | |
| | | | | | |
|
| |
|
|
| | | Stocks | | | | | | | | |
| | | Work-in-progress at cost | | | | 28.5 | | | 27.9 | |
| | | Work-in-progress at net realisable value | | | | 21.8 | | | 22.5 | |
| | | | | | |
|
| |
|
|
| | | | | | | 50.3 | | | 50.4 | |
| | | | | | |
|
| |
|
|
| | | | | 11(a) | | 83.1 | | | 82.4 | |
| | | | | | |
|
| |
|
|
| | NON-CURRENT ASSETS—EXPLORATION AND EVALUATION | | | | | | | | |
| | | Cost brought forward | | | | 64.5 | | | 33.7 | |
| | | — grassroots expenditure | | | | 7.3 | | | 57.2 | |
| | | — expenditure for additional reserves supporting existing operations | | | | 1.7 | | | 19.3 | |
| | | — evaluation expenditure | | | | 9.0 | | | 18.6 | |
| | | — write-offs | | | | (17.4 | ) | | (92.2 | ) |
| | | — disposals | | | | (1.1 | ) | | — | |
| | | — acquisitions | | | | — | | | 27.1 | |
| | | — foreign currency translation | | | | (1.7 | ) | | 0.8 | |
| | | | | | |
|
| |
|
|
| | | Cost carried forward | | | | 62.3 | | | 64.5 | |
| | | | | | |
|
| |
|
|
| | NON-CURRENT ASSETS—PROPERTY, PLANT AND EQUIPMENT | | | | | | | | |
| | | Government facilities | | | | 33.4 | | | 32.0 | |
| | | Mine properties and mine development | | | | 828.4 | | | 850.0 | |
| | | Property, land and buildings | | | | 377.2 | | | 385.9 | |
| | | Plant and equipment | | | | 3,391.4 | | | 3,507.4 | |
| | | | | | |
|
| |
|
|
| | | | | | | 4,630.4 | | | 4,775.3 | |
| | | | | | |
|
| |
|
|
| | NON-CURRENT ASSETS—OTHER ASSETS | | | | | | | | |
| | | Research and development | | | | 0.6 | | | 0.5 | |
| | | Capitalised systems upgrade | | | | 13.6 | | | 20.5 | |
| | | Deferred losses-hedging contracts | | 12(a) | | 716.1 | | | 1,188.2 | |
| | | Deferred borrowing costs and premiums | | | | — | | | 7.8 | |
| | | Other | | | | 13.2 | | | 19.5 | |
| | | | | | |
|
| |
|
|
| | | | | | | 743.5 | | | 1,236.5 | |
| | | | | | |
|
| |
|
|
| | CURRENT LIABILITIES—PAYABLES | | | | | | | | |
| | | Trade creditors | | | | 93.6 | | | 159.1 | |
| | | Creditors relating to hedging contracts | | | | 178.4 | | | 555.7 | |
| | | | | | |
|
| |
|
|
| | | Other creditors | | | | 180.2 | | | 140.4 | |
| | | | | | |
|
| |
|
|
| | | | | | | 452.2 | | | 855.2 | |
| | | | | | |
|
| |
|
|
F-17
WMC RESOURCES LTD AND SUBSIDIARIES
Notes to the Interim Combined Financial Statements
| | | | | Notes
| | | As at 30 June 2002 Unaudited A$
| | As at 31 Dec 2001 Unaudited A$
|
| | CURRENT LIABILITIES—INTEREST BEARING LIABILITIES | | | | | | | |
| | | Bank overdrafts | | | | | — | | 0.2 |
| | | Borrowings | | 24 | (a) | | 467.6 | | 584.1 |
| | | | | | | |
| |
|
| | | | | | | | 467.6 | | 584.3 |
| | | | | | | |
| |
|
| | | (a) Current Liabilities—borrowings and overdrafts | | | | | | | |
Category of aggregate short term borrowings
| | Balance at end of period
| | Weighted average interest rate on balance date borrowings
| | Maximum amount outstanding during period (i)
| | Average amount outstanding during period (ii)
| | Weighted average interest rate during period (iii)
|
| | | A$
| | %
| | A$
| | A$
| | %
|
Six months ended 30 June 2002 | | | | | | | | | | |
| Bank overdrafts | | — | | — | | — | | — | | — |
| Other loans | | 467.6 | | 4.36 | | 592.6 | | 481.5 | | 3.46 |
| | |
| | | | | | | | |
| | | 467.6 | | | | | | | | |
| | |
| | | | | | | | |
|
Year ended 31 December 2001 | | | | | | | | | | |
| Bank overdrafts | | 0.2 | | 8.00 | | 0.5 | | 0.2 | | 8.67 |
| Other loans | | 584.1 | | 3.20 | | 1,119.5 | | 752.9 | | 5.28 |
| | |
| | | | | | | | |
| | | 584.3 | | | | | | | | |
| | |
| | | | | | | | |
| | (i) | | Based on bank statement balances. |
| | (ii) | | Based on average monthly balances. |
| | (iii) | | Based on weighted average monthly interest rates. |
| | (iv) | | There are no significant unused committed lines of credit for short-term financing. |
| | | | | As at 30 June 2002 Unaudited
A$
| | As at 31 Dec 2001 Unaudited A$
|
| | CURRENT LIABILITIES—PROVISIONS | | | | |
| | | Employee entitlements | | 41.1 | | 46.8 |
| | | Rehabilitation | | 6.2 | | 5.8 |
| | | Other | | 24.0 | | 22.1 |
| | | | |
| |
|
| | | | | 71.3 | | 74.7 |
| | | | |
| |
|
| | CURRENT LIABILITIES—OTHER | | | | |
| | | Prepaid revenue | | 15.4 | | 8.0 |
| | | Other | | 4.9 | | 7.1 |
| | | | |
| |
|
| | | | | 20.3 | | 15.1 |
| | | | |
| |
|
| | NON-CURRENT LIABILITIES—PAYABLES | | | | |
| | | Creditors relating to hedging contracts | | 859.8 | | 1,142.3 |
| | | Other creditors | | 54.4 | | 55.4 |
| | | | |
| |
|
| | | | | 914.2 | | 1,197.7 |
| | | | |
| |
|
F-18
WMC RESOURCES LTD AND CONTROLLED ENTITIES
Notes to the Interim Combined Financial Statements
| | | | | | As at | | | As at | |
| | | | | | 30 June 2002 | | | 31 Dec 2001 | |
| | | | | | Unaudited | | | Unaudited | |
| | | Notes
| | | A$
| | | A$
| |
24. NON-CURRENT LIABILITIES—INTEREST BEARING LIABILITIES | | 24 | (a) | | 1,633.4 | | | 1,737.7 | |
| | | | | |
|
| |
|
|
| Borrowings | | | | | | | | | |
|
(a) Total borrowings | | | | | | | | | |
Disclosed as: | | | | | | | | | |
| — current liabilities (due in 12 months or less) | | 20 | | | 467.6 | | | 584.1 | |
| — non-current liabilities (due in more than 12 months) | | | | | 1,633.4 | | | 1,737.7 | |
| | | | | |
|
| |
|
|
| | | | | | 2,101.0 | | | 2,321.8 | |
| | | | | |
|
| |
|
|
|
(b) Description | | | | | | | | | |
Unsecured: | | | | | | | | | |
| US $200 million Notes at 7.35% due 1 December 2026 | | | | | 353.1 | | | 391.1 | |
| US $150 million Debentures at 7.25% due 15 November 2013 | | | | | 264.8 | | | 293.3 | |
| A $50 million Note at floating interest rates applicable | | | | | | | | | |
| in Australia due 18 May 2009 | | | | | — | | | 50.0 | * |
| US $200 million Notes at 6.75% due 1 December 2006 | | | | | 353.1 | | | 391.1 | |
| US $250 million Notes at 6.5% due 15 November 2003 | | | | | 441.4 | | | 488.9 | |
| A $200 million Notes at 6.0% due 25 May 2002 | | | | | — | | | 200.0 | * |
| Promissory notes (Weighted average rate of 5.04%— 2001:-4.38%) | | | | | 552.5 | | | 240.0 | |
| Bank loans at floating interest rates applicable in Australia | | | | | | | | | |
| (Weighted average rate of 2.87%—2001 :-3.14%) | | | | | 84.1 | * | | 230.1 | * |
| Bank loans at floating interest rates applicable in Australia | | | | | | | | | |
| (Weighted average rate of 2.45%—2001 :-1.8%) | | | | | 52.0 | | | 37.3 | |
| | | | | |
|
| |
|
|
| | | | | | 2,101.0 | | | 2,321.8 | |
| | | | | |
|
| |
|
|
| *These amounts have been swapped to US dollars (refer to Note 29B). | | | | | | | | . | |
|
25. NON-CURRENT LIABILITIES—PROVISIONS | | | | | | | | | |
| Employee entitlements | | | | | 12.1 | | | 12.6 | |
| Rehabilitation | | | | | 85.7 | | | 83.9 | |
| Other | | | | | — | | | 0.5 | |
| | | | | |
|
| |
|
|
| | | | | | 97.8 | | | 97.0 | |
| | | | | |
|
| |
|
|
26. NON-CURRENT LIABILITIES—OTHER | | | | | | | | | |
| Prepaid rent | | | | | — | | | 6.6 | |
| Other | | | | | 2.8 | | | 2.7 | |
| | | | | |
|
| |
|
|
| | | | | | 2.8 | | | 9.3 | |
| | | | | |
|
| |
|
|
F-19
WMC RESOURCES LTD AND CONTROLLED ENTITIES
Notes to the Interim Combined Financial Statements
| | | | | Notes
| | Six months To 30 June 2002 Unaudited A$
| | | Six months To 30 June 2001 Unaudited A$
| |
| | NOTES TO THE STATEMENTS OF CASH FLOWS | | | | | | | | |
| | | (a) Reconciliation of operating profit after income tax to net cash provided by operating activities | | | |
| | | | | | |
| | | Net Income before minority interests | | | | 45.6 | | | 115.7 | |
| | | Depreciation and amortization | | 3 | | 262.1 | | | 283.9 | |
| | | Borrowing costs amortization | | | | 0.7 | | | 3.1 | |
| | | Research and development written off | | | | 0.1 | | | 0.2 | |
| | | (Profit)/loss on disposal of non-current assets | | | | (36.1 | ) | | (63.9 | ) |
| | | Unrealized exchange losses/(gains) | | | | (3.6 | ) | | 6.5 | |
| | | Write down in value of inventory | | | | 4.2 | | | 18.9 | |
| | | Change in assets and liabilities adjusted for | | | | | | | | |
| | | (Increase)/Decrease in: | | | | | | | | |
| | | — inventories | | | | (81.9 | ) | | (10.8 | ) |
| | | — receivables | | | | 74.3 | | | (151.4 | ) |
| | | — future income tax benefits | | | | 19.0 | | | (53.7 | ) |
| | | — deferred losses | | | | 410.4 | | | (408.3 | ) |
| | | — other assets | | | | (2.0 | ) | | (14.3 | ) |
| | | (Decrease)/Increase in: | | | | | | | | |
| | | — accounts payable | | | | (649.9 | ) | | 576.2 | |
| | | — provision for income tax payable | | | | (2.6 | ) | | 7.7 | |
| | | — provision for deferred income tax | | | | 15.1 | | | 76.7 | |
| | | — other operating provisions | | | | 4.3 | | | 21.1 | |
| | | — other liabilities | | | | 3.7 | | | 0.2 | |
| | | | | | |
|
| |
|
|
| | | Net cash provided by operating activities | | | | 63.4 | | | 407.8 | |
| | | | | | |
|
| |
|
|
| | | (b) Financing facilities | | | | | | | | |
| | | Refer to Note 28. | | | | | | | | |
F-20
WMC RESOURCES LTD AND CONTROLLED ENTITIES
Notes to the Interim Combined Financial Statements
| | | Notes
| | | As at 30 June 2002 Unaudited A$
| | As at 31 Dec 2001 Unaudited A$
|
The total facilities available at balance date were as follows: | | | | | | | |
| Bank overdrafts | | | | | — | | 0.2 |
| Bank loan facilities | | 28 | (b) | | 794.5 | | 958.2 |
| Short term loan facilities | | | | | 417.6 | | 451.9 |
| Medium term loan facilities | | | | | 656.3 | | 488.9 |
| Long term loan facilities | | | | | 971.0 | | 1,141.0 |
| | | | | |
| |
|
| | | | | | 2,839.4 | | 3,040.2 |
| | | | | |
| |
|
Used at balance date: | | | | | | | |
| Bank overdrafts | | | | | — | | 0.2 |
| Bank loan facilities | | 28 | (b) | | 552.5 | | 240.0 |
| Short term loan facilities | | | | | 577.5 | | 451.9 |
| Medium term loan facilities | | | | | — | | 488.9 |
| Long term loan facilities | | | | | 971.0 | | 1,141.0 |
| | | | | |
| |
|
| | | | | | 2,101.0 | | 2,322.0 |
| | | | | |
| |
|
Available at balance date: | | | | | | | |
| Bank loan facilities | | 28 | (b) | | 738.4 | | 718.2 |
| | | | | |
| |
|
|
| (a) All facilities are in the names of WMC Finance Limited and WMC Finance (USA) Limited. The loan facilities are denominated in currencies as follows:- |
|
Bank loans facilities | | | | | | | |
| United States dollars | | | | | 450.0 | | 490.0 |
|
| In some cases, these facilities may be drawn in another currency to the equivalent value of the denominated currency. | | | | | | | |
|
Short term facilities | | | | | | | |
| Australian dollars | | | | | 417.6 | | 414.7 |
| United States dollars | | | | | — | | 19.0 |
|
Medium term facilities | | | | | | | |
| Australian dollars | | | | | 214.9 | | — |
| United States dollars | | | | | 250.0 | | 250.0 |
|
Long term facilities | | | | | | | |
| Australian dollars | | | | | — | | 65.5 |
| United States dollars | | | | | 550.0 | | 550.0 |
|
| (b) The bank loan facilities are available for general corporate purposes. $552.5 million (Dec 2001:$240.0 million) was utilised at balance date. The balances have been designated as credit standby facilities in respect of the US$ and A$ Commercial Paper programme, and therefore their use and availability has been determined in line with the outstandings under this programme. |
F-21
WMC RESOURCES LTD AND CONTROLLED ENTITIES
Notes to the Interim Combined Financial Statements
29. FINANCIAL INSTRUMENTS
A. Hedging position
WMC Resources’ revenues will vary significantly with movements in commodity prices and the A$/US$ exchange rate. In the past these risks were managed through a hedging programme which provided management with increased assurance of revenue outcomes when planning future activities.
The improved cost performance of the operations and the added diversity of revenue sources following the expansion of the Olympic Dam and the start up of the Queensland Fertilizer Operation have significantly improved expected cash flows throughout the business cycle. As a result, since December 1999, the Price Risk Management Policy has been revised to substantially reduce future hedging activity. Hedging is limited to gold revenue denominated in Australian dollars and revenue from specific projects where targeted returns can be secured.
As at 30 June 2002, WMC Resources had entered into a number of foreign exchange and commodity hedging contracts. These are explained below:
(i) Currency hedging
As at 30 June 2002, WMC Resources had the following hedge position against its currency exposures:
WMC Resources subsidiary entities
As at 30 June 2002, US$1,791.1 million (Dec 2001: US$2,104.3 million) had been hedged at an average rate of A$/US$0.6642 (Dec 2001: 0.6570) at maturities extending to 2008 using a combination of forward contracts and options as detailed in the table below:
Maturity
| | Forward sale of US$
| | Bought US$ Put Options
| | Written US$ Call Options
|
| | | Amount US$m
| | Rate A$/US$
| | Amount US$m
| | Strike rate A$/US$
| | Amount US$m
| | Strike rate A$/US$
|
| 2002 | | 119.3 | | 0.6796 | | 31.3 | | 0.6489 | | 31.3 | | 0.6489 |
| 2003 | | 195.6 | | 0.6821 | | 62.5 | | 0.6489 | | 62.5 | | 0.6489 |
| 2004 | | 228.4 | | 0.6753 | | 72.5 | | 0.6413 | | 72.5 | | 0.6413 |
| 2005 | | 228.3 | | 0.6887 | | 77.5 | | 0.6438 | | 77.5 | | 0.6438 |
| 2006 | | 155.6 | | 0.6828 | | 72.5 | | 0.6413 | | 72.5 | | 0.6413 |
| 2007-2008 | | 353.1 | | 0.6643 | | 194.5 | | 0.6123 | | 194.5 | | 0.6123 |
For comparison, the following foreign currency hedge positions were in place at 31 December 2001:
Maturity
| | Forward sale of US$
| | Bought US$ Put Options
| | Written US$ Call Options
|
| | | Amount US$m
| | Rate A$/US$
| | Amount US$m
| | Strike rate A$/US$
| | Amount US$m
| | Strike rate A$/US$
|
| 2002 | | 211.5 | | 0.6854 | | 252.3 | | 0.5875 | | 82.5 | | 0.6571 |
| 2003 | | 175.6 | | 0.6855 | | 82.5 | | 0.6571 | | 82.5 | | 0.6571 |
| 2004 | | 208.4 | | 0.6817 | | 92.5 | | 0.6500 | | 92.5 | | 0.6500 |
| 2005 | | 213.3 | | 0.6870 | | 92.5 | | 0.6500 | | 92.5 | | 0.6500 |
| 2006 | | 135.6 | | 0.6809 | | 92.5 | | 0.6500 | | 92.5 | | 0.6500 |
| 2007-2008 | | 338.1 | | 0.6595 | | 209.5 | | 0.6173 | | 209.5 | | 0.6173 |
F-22
WMC RESOURCES LTD AND CONTROLLED ENTITIES
Notes to the Interim Combined Financial Statements
29. FINANCIAL INSTRUMENTS (Continued)
A. Hedging position (continued)
(ii) Commodity hedging
As at 30 June 2002, WMC Resources had the following hedge positions against its commodity exposures:
Gold
658,400 ounces of gold relating to production from Olympic Dam (Dec 2001: 720,000 ounces) had been hedged at an average gold price of A$615 per ounce (Dec 2001: A$586 per ounce) with maturities extending to 2010 as follows:
Maturity
| | Forward Sale of Gold
|
| | | Amount of ounces
| | Rate: A$/ounce
|
| 2002 | | 48,200 | | 522 |
| 2003 | | 80,000 | | 548 |
| 2004 | | 80,000 | | 559 |
| 2005 | | 80,000 | | 579 |
| 2006-2010 | | 370,200 | | 661 |
For comparison, the following gold hedge positions were in place at 31 December 2001:
Maturity
| | Forward Sale of Gold
|
| | | Amount of ounces
| | Rate : A$/ounce
|
| 2002 | | 83,000 | | 500 |
| 2003 | | 80,000 | | 509 |
| 2004 | | 80,000 | | 521 |
| 2005 | | 80,000 | | 497 |
| 2006-2010 | | 397,000 | | 651 |
As these contracts are entered into for the purpose of hedging future production, any unrealized gains and losses on the contracts, together with the cost of the contracts, are deferred until the underlying production occurs.
B. Interest rate risk
WMC Resources is exposed to interest rate risk on its outstanding interest bearing liabilities and investments. Interest rate swaps and cross currency swaps allow WMC Resources to manage its interest rate risk.
(a) Interest rate and cross currency swaps
As at 30 June 2002, WMC Resources had not entered into any interest rate hedging contracts in relation to its debt.
F-23
WMC RESOURCES LTD AND CONTROLLED ENTITIES
Notes to the Interim Combined Financial Statements
29. FINANCIAL INSTRUMENTS (Continued)
B. Interest rate risk (continued)
For comparison, WMC Resources had entered into the following interest rate swaps at 31 December 2001:
Notional AUD principal | | Interest swapped
| | Interest rate
| | Maturity
|
$ m
| | | Fixed
| | Float
| |
| 100.0 | | Fixed for floating | | 6.00 | | 4.90 | | 27/5/2002 |
100.0
| | Fixed for floating | | 6.00 | | 4.90 | | 27/5/2002 |
| 200.0 | | | | | | | | |
|
Notional US principal
| | Interest swapped
| | Interest rate
| | Maturity
|
$ m
| | | Fixed
| | Float
| |
| 25.0 | | Floating for fixed | | 7.02 | | 2.01 | | 15/11/2003 |
25.0
| | Floating for fixed | | 7.10 | | 2.01 | | 15/11/2013 |
| 50.0 | | | | | | | | |
|
| 25.0 | | Fixed for floating | | 6.50 | | 1.36 | | 15/11/2003 |
| 50.0 | | Fixed for floating | | 6.50 | | 0.93 | | 15/11/2003 |
| 25.0 | | Fixed for floating | | 6.75 | | 1.93 | | 1/12/2006 |
| 25.0 | | Fixed for floating | | 6.75 | | 1.91 | | 1/12/2006 |
| 25.0 | | Fixed for floating | | 6.75 | | 1.84 | | 1/12/2006 |
| 25.0 | | Fixed for floating | | 6.75 | | 1.83 | | 1/12/2006 |
| 25.0 | | Fixed for floating | | 7.55 | | 1.97 | | 15/11/2013 |
| 50.0 | | Fixed for floating | | 7.25 | | 1.94 | | 15/11/2013 |
| 40.0 | | Fixed for floating | | 7.25 | | 1.80 | | 15/11/2013 |
| 50.0 | | Fixed for floating | | 7.35 | | 2.77 | | 1/12/2026 |
| 25.0 | | Fixed for floating | | 7.35 | | 2.76 | | 1/12/2026 |
| 25.0 | | Fixed for floating | | 7.35 | | 2.80 | | 1/12/2026 |
50.0
| | Fixed for floating | | 7.35 | | 3.15 | | 2/12/2026 |
| 440.0 | | | | | | | | |
As at 30 June 2002, WMC Resources had entered into cross currency swaps, swapping A$60 million into US$ denominated debt of US$36.3 million as follows:
A$m Debt
| | US$m Equivalent
| | Interest Rate
| | Maturity
|
| | | | | 2002 A$ Debt
| | 2002 US$ Debt
| | |
| 50.0 | | 30.0 | | 4.74 | | 2.11 | | 30/8/2002 |
10.0
| | 6.3
| | 4.95 | | 2.37 | | 30/8/2002 |
| 60.0 | | 36.3 | | | | | | |
For comparison, WMC Resources had entered into the following cross currency swaps at 31 December 2001:
A$m Debt
| | US$m Equivalent
| | Interest Rate A$ Debt
| | Maturity
|
| | | | | A$ Debt
| | US$ Debt
| | |
| 50.0 | | 30.0 | | 5.30 | | 4.10 | | 2/4/2002 |
| 20.0 | | 12.6 | | 4.81 | | 2.92 | | 7/4/2002 |
| 50.0 | | 31.4 | | 4.81 | | 2.91 | | 7/4/2002 |
| 10.0 | | 6.3 | | 4.81 | | 5.12 | | 8/4/2002 |
| 200.0 | | 131.7 | | 4.85 | | 2.62 | | 8/5/2002 |
50.0
| | 33.5
| | 5.35 | | 3.06 | | 8/5/2009 |
| 380.0 | | 245.5 | | | | | | |
(b) Interest rate caps
As at 30 June 2002, WMC Resources had entered into A$230 million of interest caps at 6.28% (Dec 2001: A$430 million at 7.14%).
F-24
WMC RESOURCES LTD AND CONTROLLED ENTITIES
Notes to the Interim Combined Financial Statements
29. FINANCIAL INSTRUMENTS (Continued)
(c) Interest rate risk exposure
WMC Resources’ exposure to interest rate risk and the effective weighted interest rate for classes of financial assets and liabilities is set out below:
As at 30 June 2002
| | | | | | | | Fixed interest maturing in:
| | | | | | | |
| | | $ million
| | Floating interest rate %
| | | 1 year or less
| | | Over 1 to 5 years
| | | More than 5 years
| | | Non- interest bearing
| | | Total
| |
Financial Assets | | | | | | | | | | | | | | | | | | | | |
| Cash assets | | | | 52.3 | | | 10.1 | | | — | | | — | | | — | | | 62.4 | |
| Receivables | | | | — | | | — | | | — | | | — | | | 896.9 | | | 896.9 | |
| Other financial assets | | | | — | | | — | | | — | | | — | | | 35.0 | | | 35.0 | |
| Cross currency swaps* | | | | 60.0 | | | — | | | — | | | — | | | — | | | 60.0 | |
| | | | |
|
| |
|
| |
|
| |
|
| |
|
| |
|
|
| | | | | 112.3 | | | 10.1 | | | — | | | — | | | 931.9 | | | 1,054.3 | |
| | | | |
|
| |
|
| |
|
| |
|
| |
|
| |
|
|
Weighted average interest rate | | | | 3.5 | % | | 2.0 | % | | — | | | — | | | | | | | |
|
Financial Liabilities | | | | | | | | | | | | | | | | | | | | |
| Payables | | | | — | | | — | | | — | | | — | | | 1,366.4 | | | 1,366.4 | |
| Bank loans | | | | — | | | 132.0 | | | — | | | — | | | — | | | 132.0 | |
| Yankee Bond issues — $US | | | | — | | | — | | | 794.5 | | | 617.9 | | | — | | | 1,412.4 | |
| Australian Promissory Notes | | | | — | | | 552.5 | | | — | | | — | | | — | | | 552.5 | |
| Cross currency swaps* | | | | 64.1 | | | — | | | — | | | — | | | — | | | 64.1 | |
| | | | |
|
| |
|
| |
|
| |
|
| |
|
| |
|
|
| | | | | 64.1 | | | 684.5 | | | 794.5 | | | 617.9 | | | 1,366.4 | | | 3,527.4 | |
| | | | |
|
| |
|
| |
|
| |
|
| |
|
| |
|
|
Weighted average interest rate | | | | 2.2 | % | | 4.9 | % | | 6.9 | % | | 6.9 | % | | | | | | |
|
| Net financial asset/(liabilities) | | | | 48.2 | | | (674.4 | ) | | (794.5 | ) | | (617.9 | ) | | (434.5 | ) | | (2,473.1 | ) |
| | | | |
|
| |
|
| |
|
| |
|
| |
|
| |
|
|
| | | | | | | | | | | | | | | | | | | | | |
As at 31 December 2001
| | | | | | | | Fixed interest maturing in:
| | | | | | | |
| | | $ million
| | Floating interest rate %
| | | 1 year or less
| | | Over 1 to 5 years
| | | More than 5 years
| | | Non- interest bearing
| | | Total
| |
Financial Assets | | | | | | | | | | | | | | | | | | | | |
| Cash assets | | | | 106.2 | | | 17.9 | | | — | | | — | | | — | | | 124.1 | |
| Receivables | | | | — | | | — | | | — | | | — | | | 977.4 | | | 977.4 | |
| Other financial assets | | | | — | | | — | | | — | | | — | | | 38.3 | | | 38.3 | |
| Interest rate swaps* | | | | 97.8 | | | 200.0 | | | 342.2 | | | 518.2 | | | — | | | 1,158.2 | |
| Cross currency swaps* | | | | 380.0 | | | — | | | — | | | — | | | — | | | 380.0 | |
| | | | |
|
| |
|
| |
|
| |
|
| |
|
| |
|
|
| | | | | 584.0 | | | 217.9 | | | 342.2 | | | 518.2 | | | 1,015.7 | | | 2,678.0 | |
| | | | |
|
| |
|
| |
|
| |
|
| |
|
| |
|
|
Weighted average interest rate | | | | 4.8 | % | | 6.1 | % | | 6.5 | % | | 6.5 | % | | | | | | |
|
Financial Liabilities | | | | | | | | | | | | | | | | | | | | |
| Payables | | | | — | | | — | | | — | | | — | | | 2,052.9 | | | 2,052.9 | |
| Bank overdrafts | | | | 0.2 | | | — | | | — | | | — | | | — | | | 0.2 | |
| Bank loans | | | | 167.3 | | | — | | | — | | | — | | | — | | | 167.3 | |
| Yankee Bond issues—$US | | | | — | | | — | | | 880.0 | | | 684.4 | | | — | | | 1,564.4 | |
| Australian Promissory Notes | | | | — | | | 240.0 | | | — | | | — | | | — | | | 240.0 | |
| Medium Term Bank Bilaterals | | | | — | | | 200.0 | | | — | | | 50.0 | | | — | | | 250.0 | |
| Interest rate swaps* | | | | 1,060.4 | | | — | | | 48.9 | | | 48.9 | | | — | | | 1,158.2 | |
| Cross currency swaps* | | | | 480.1 | | | — | | | — | | | — | | | — | | | 480.1 | |
| | | | |
|
| |
|
| |
|
| |
|
| |
|
| |
|
|
| | | | | 1,708.0 | | | 440.0 | | | 928.9 | | | 783.3 | | | 2,052.9 | | | 5,913.1 | |
| | | | |
|
| |
|
| |
|
| |
|
| |
|
| |
|
|
Weighted average interest rate | | | | 3.2 | % | | 5.1 | % | | 6.7 | % | | 6.6 | % | | | | | | |
|
| Net financial asset/(liabilities) | | | | (1,124.0 | ) | | (222.1 | ) | | (586.7 | ) | | (265.1 | ) | | (1,037.2 | ) | | (3,235.1 | ) |
| | | | |
|
| |
|
| |
|
| |
|
| |
|
| |
|
|
* Notional principal amounts
25
WMC RESOURCES LTD AND CONTROLLED ENTITIES
Notes to the Interim Combined Financial Statements
29. FINANCIAL INSTRUMENTS (Continued)
C. Carrying amounts and estimated fair values of financial instruments
The carrying amounts and estimated fair values of the company’s financial instruments, referred to in Note 29A and 29B above were as follows:
| | | Notes
| | Millions of dollars Group equity consolidation
| |
Recognised in the Balance Sheet | | | | Carrying amount June 2002 A$
| | | Fair value June 2002 A$
| | | Carrying amount Dec 2001 A$
| | | Fair value Dec 2001 A$
| |
Financial Assets | | | | | | | | | | | | | | |
| Cash assets | | 8 | | 62.4 | | | 62.4 | | | 124.1 | | | 124.1 | |
| Current other financial assets | | 10 | | 17.0 | | | 17.0 | | | 20.1 | | | 20.1 | |
| Current receivables | | 9 | | 538.3 | | | 535.7 | | | 496.0 | | | 582.3 | |
| Non-current receivables | | 13 | | 358.6 | | | 333.9 | | | 481.4 | | | 398.4 | |
| Non-current other financial assets | | 14 | | 18.0 | | | 19.6 | | | 18.2 | | | 19.2 | |
Financial Liabilities | | | | | | | | | | | | | | |
| Current payables | | 19 | | 452.2 | | | 471.1 | | | 855.2 | | | 855.6 | |
| Bank overdrafts | | 20 | | — | | | — | | | 0.2 | | | 0.2 | |
| Short term interest bearing liabilities | | 20 | | 467.6 | | | 467.6 | | | 584.1 | | | 584.1 | |
| Other current liabilities | | 22 | | 20.3 | | | 20.3 | | | 15.1 | | | 15.1 | |
| Non-current payables | | 23 | | 914.2 | | | 960.3 | | | 1,197.7 | | | 1,109.1 | |
| Long term interest bearing liabilities | | 24 | | 1,633.4 | | | 1,685.7 | | | 1,737.7 | | | 1,755.8 | |
| Other non-current liabilities | | 26 | | 2.8 | | | 2.8 | | | 9.3 | | | 9.3 | |
| | | | |
|
| |
|
| |
|
| |
|
|
Financial Instruments | | | | | | | | | | | | | | |
| Hedging contracts: | | | | | | | | | | | | | | |
| — forwards/swaps | | | | (476.1 | ) | | (567.1 | ) | | (816.5 | ) | | (729.2 | ) |
| — options | | | | (143.9 | ) | | (143.9 | ) | | (234.7 | ) | | (221.0 | ) |
| | | | |
|
| |
|
| |
|
| |
|
|
| | | | | (620.0 | ) | | (711.0 | ) | | (1,051.2 | ) | | (950.2 | ) |
| | | | |
|
| |
|
| |
|
| |
|
|
The following methods and assumptions were used to estimate the fair value of each class of financial instruments for which it is practicable to estimate a value:
Cash assets and current other financial assets
The carrying amount approximates fair value because of the short maturity of these instruments.
Non current other financial assets
The investments are carried at cost.
Debtors and creditors
The fair value of debtors and creditors relating to hedging contracts has been calculated on a mark-to-market basis using forward prices. Other current debtors and creditors mainly represent financial obligations incurred in exchange for goods and services provided and received by the economic entity in the normal course of its operations, net of provisions for doubtful debts. Due to the short-term nature of these financial obligations, their carrying values are estimated to equal their fair values.
Short and long term debt
The fair value of short-term debt and bank overdrafts is considered to approximate the carrying value due to the short maturity of the debt. Long-term debt comprises the Yankee Bond issues. The fair value of the Yankee Bond issue was determined on a mark-to-market basis. At June 30 2002 the 1993 Yankee Bond market value was US$422.2 million or A$745.3 million (Dec 2001: US$412.9 million; A$807.5 million) and the 1996 Yankee Bond market value was US$407.5 million or A$719.4 million (Dec 2001:US$396.3 million; A$774.9 million).
Foreign currency and commodity hedging contracts
Carrying amounts for commodity and foreign currency hedging contracts are based on the revaluation of open contracts at 30 June 2002 against spot rates at that date. The fair value disclosed represents the same contracts on a mark-to-market basis using forward rates and prices.
F-26
WMC RESOURCES LTD AND CONTROLLED ENTITIES
Notes to the Interim Combined Financial Statements
29. FINANCIAL INSTRUMENTS (continued)
D. Deferred hedging gains and losses
Gains and losses, premiums and discounts on hedging contracts and gains and losses associated with the revaluation of foreign denominated debt are deferred in the balance sheet until the underlying transaction takes place. Whether these deferred gains and losses will be realized and at what amount depends on commodity and currency price movements until the underlying date of the hedge contracts concerned. The expected recognition of the deferred gains and losses based on current valuations are shown below:
Millions of dollars—30 June 2002
YEARS | | <1 YEAR | | 1—2 YEARS | | 2—3 YEARS | | 3—4 YEARS | | 4—5 YEARS | | MORE THAN 5 YEARS | | TOTALS | |
| Gains | | 69.0 | | 133.9 | | 8.1 | | 9.9 | | 113.4 | | 74.2 | | 408.5 | |
| Losses | | (151.1) | | (238.6) | | (110.0) | | (102.5) | | (196.6) | | (408.0) | | (1,206.8 | ) |
| | |
| |
| |
| |
| |
| |
| |
|
|
| Total | | (82.1) | | (104.7) | | (101.9) | | (92.6) | | (83.2) | | (333.8) | | (798.3 | ) |
| | |
| |
| |
| |
| |
| |
| |
|
|
Total deferred on balance sheet (refer Note 12(a)) | | (798.3 | ) |
| | | | | | | | | | | | | | |
|
|
For comparison, the following expected recognition of the deferred gains and losses based on valuations at 31 December 2001 are shown below:
Millions of dollars—31 December 2001
YEARS | | <1 YEAR | | | 1—2 YEARS | | 2—3 YEARS | | 3—4 YEARS | | 4—5 YEARS | | MORE THAN 5 YEARS | | TOTALS | |
| Gains | | 164.1 | | | 185.7 | | 7.0 | | 11.0 | | 3.1 | | 250.8 | | 621.7 | |
| Losses | | (321.8 | ) | | (341.9) | | (170.5) | | (179.4) | | (46.3) | | (907.7) | | (1,967.6 | ) |
| | |
|
| |
| |
| |
| |
| |
| |
|
|
| Total | | (157.7 | ) | | (156.2) | | (163.5) | | (168.4) | | (43.2) | | (656.9) | | (1,345.9 | ) |
| | |
|
| |
| |
| |
| |
| |
| |
|
|
Total deferred on balance sheet (refer Note 12(a)) | | (1,345.9 | ) |
| | | | | | | | | | | | | | | |
|
|
E. Concentration of credit risk for derivative financial instruments
In the event of any counter parties failing to comply with the terms of derivative instrument contracts, the potential impact on the group would be determined by the market revaluation of any open contracts held with that counter party, except on the day of delivery in which case the potential loss for forward contracts would be the full principal amount. The group calculates credit exposures as the market revaluation plus a potential exposure amount. The potential exposure amount allows for the fact that the market revaluation of the contract may increase in the future. Exposures to any one counter party are strictly controlled by WMC Resources risk management policies relating to counter party limits. A geographical breakdown of the group’s credit risk for the derivative financial instruments is set out below.
Location | | US$ Millions of dollars
|
| | | June 2002
| | Dec 2001
|
| Australia | | 84 | | 190 |
| America | | 159 | | 138 |
| | |
| |
|
| | | 243 | | 328 |
| | |
| |
|
When computing the concentration of credit risk it is assumed that Australian companies, which WMC Resources deals with on the basis of an overseas parent company guarantee, are classified as Australian credit risk.
Page 27
WMC RESOURCES LTD AND CONTROLLED ENTITIES
Notes to the Interim Combined Financial Statements
30. CONTINGENT LIABILITIES AND GAINS
| | | | | As at 30 June 2002 Unaudited A$
| | As at 31 Dec 2001 Unaudited A$
|
(a) | | Ascertainable, unsecured | | | | |
| (i) | | Guarantees, insurance bonds and other liabilities including performance bonds for minimum work commitments in exploration blocks. | | 51.1 | | 57.6 |
| (ii) | | Contract disputes and other legal claims, arising out of WMC Resources ongoing mining and related construction activities. | | 4.9 | | 7.5 |
| (iii) | | An assessment is made at each operation for future rehabilitation work which will be incurred as a result of currently existing circumstances and a provision is accumulated for this expenditure charged on a proportionate basis to production over the lesser of the life of operation or twenty years (thirty years for Olympic Dam). At 31 December 2001 WMC Resources had accrued rehabilitation provisions of $91.9 million (Dec 2001: $89.7 million). The company estimates that, as at 30 June 2002, the total rehabilitation costs that would be incurred upon the disposal or abandonment of its mineral properties would be $ 358.9 million (Dec 2001 : $349.4 million), resulting in an unaccrued liability of | | 267.0 | | 259.7 |
| | | | |
| |
|
(b) Unascertainable unsecured contingent liabilities
(i) Under various joint venture production and exploration agreements.
(ii) Native Title:
The majority of WMC Resources’ interests fall within one or more Applications for Native Title Determination. The applications are filed for hearing in the Federal Court of Australia. The WMC group cannot make any assessment whether existing assets or operations will be materially affected until it is determined what rights, if any, the applicants are entitled to. Recent decisions of the High Court indicate that each claim will be decided on its facts.
Consideration of the implications of Court Determinations make it evident there are complex legal and factual issues potentially affecting existing and future WMC interests. Accordingly, the impact of these developments cannot be determined at this time, although it is indicated that no native title rights reside in minerals where valid state legislation has placed minerals in Crown ownership.
F-28
WMC RESOURCES LTD AND CONTROLLED ENTITIES
Notes to the Interim Combined Financial Statements
| | | | | As at 30 June 2002 Unaudited A$
| | As at 31 Dec 2001 Unaudited A$
|
| | COMMITMENTS | | | | |
| (a) | | Capital expenditure contracted for: | | | | |
| | | Contracts for purchase of assets comprising mine properties and mine
development, and property, plant and equipment. | | | | |
| | | Payments within one year | | 69.4 | | 35.4 |
| | | | |
| |
|
| | | | | 69.4 | | 35.4 |
| | | | |
| |
|
| (b) | | Potential expenditure on exploration and mining titles and attached
business commitments | | | | |
| | | These tables set out estimates of expenditures which might have to be
incurred for exploration, evaluation and mining activities during the life of
current WMC Resources exploration and mining tenements and earning
rights under farm-in and option entitlements. These sums are commitments
for work expected to be beneficial to WMC Resources and include payments
to vendors in which WMC Resources has earning rights. Australian mining
laws generally require that certain levels of expenditure be incurred, rather
than any payment made to Government, to maintain tenements in good
standing. Mining laws in other jurisdictions may vary. This disclosure
represents potential expenditure that may be reduced by seeking exemption
from individual commitments or by relinquishment of tenure. | | | | |
| (i) | | Exploration and mining titles | | | | |
| | | Within one year | | 16.6 | | 19.2 |
| | | Later than one year but not later than 5 years | | 69.2 | | 95.4 |
| | | Later than 5 years | | 131.0 | | 260.5 |
| | | | |
| |
|
| | | | | 216.8 | | 375.1 |
| | | | |
| |
|
| (ii) | | Business undertaking commitments | | | | |
| | | Within one year | | 8.1 | | 2.9 |
| | | Later than one year but not later than 5 years | | 29.8 | | 12.7 |
| | | Later than 5 years | | 44.5 | | 15.9 |
| | | | |
| |
|
| | | | | 82.4 | | 31.5 |
| | | | |
| |
|
| (c) | | Lease commitments contracted for operating leases (other than mineral and exploration leases) | | | | |
| | | The company and certain of its subsidiaries lease plant, warehouse and office facilities
and motor vehicles for varying periods. Operating leases that expire generally are
expected to be renewed or replaced by other leases. The following is the rental expense
and the future minimum rental commitments | | | | |
| (i) | | Lease commitments payable at balance date | | | | |
| | | Within one year | | 23.2 | | 21.8 |
| | | Later than one year but not later than 5 years | | 72.4 | | 76.4 |
| | | Later than 5 years | | 70.5 | | 76.8 |
| | | | |
| |
|
| | | | | 166.1 | | 175.0 |
| | | | |
| |
|
| (d) | | Sub Leases | | | | |
| (i) | | Rental income included in profit and loss | | 0.9 | | 1.2 |
| | | | |
| |
|
| (ii) | | Lease commitments receivable at balance date
Within one year | | 0.7 | | 1.6 |
| | | Later than one year but not later than 5 years | | 1.3 | | 4.9 |
| | | | |
| |
|
| | | | | 2.0 | | 6.5 |
| | | | |
| |
|
(e) | | Other commitments | | | | |
| | | Commitments for payments to suppliers under long-term contracts existing
at reporting date but not recognised as payable | | | | |
| | | Within one year | | 59.4 | | 59.4 |
| | | Later than one year but not later than 5 years | | 235.0 | | 235.6 |
| | | Later than 5 years | | 557.3 | | 586.4 |
| | | | |
| |
|
| | | | | 851.7 | | 881.4 |
| | | | |
| |
|
F-29
WMC RESOURCES LTD AND CONTROLLED ENTITIES
Notes to the Interim Combined Financial Statements
32. RECONCILIATION TO US GAAP
The accounting policies and accounting standards under which the combined financial statements of WMC Resources are prepared are in accordance with Australian GAAP. The major differences between Australian GAAP and US GAAP are summarised and reconciled below.
(a) Research and development
Expenditure incurred on research and development may be capitalised and deferred in Australia to the extent that such expenditure is expected to be recoverable. Under US GAAP, all such expenditure is expensed as incurred.
(b) Pension funds
The applicable Australian accounting standard relates only to disclosure. The accepted practice is to account for Company contributions on a cash rather than an accruals basis. WMC Resources does not account for excesses or shortfalls of the Superannuation Fund assets over accrued membership benefits. As this is contrary to US GAAP, WMC Resources has adopted the recognition provisions of FAS 87 “Employers Accounting for Pensions”, for US GAAP reconciliation purposes. WMC Resources does not sponsor post retirement defined-benefits other than pensions.
(c) Exploration and evaluation expenditure
Expenditure incurred on the exploration and evaluation of minerals properties may be capitalised and deferred in Australia to the extent that such expenditure is expected to be recoverable. Under US GAAP geological and geophysical costs and costs of carrying and retaining undeveloped properties are charged to expense as incurred. However, included in exploration and expenditure capitalised in the prior period under Australian GAAP is $25.2 million for the acquisition of Yakabindie Nickel Limited. This amount is not a reconciling item as it can be capitalised under US GAAP.
(d) Income tax
Under Australian GAAP, deferred taxes are provided for using the liability method with the recognition and carry forward of future income tax benefits on a similar basis to FAS 109, except for tax assets and liabilities relating to temporary (timing) differences which are all classed as non-current. Consequently, no adjustment has been made in the method by which income taxes have been calculated and brought to account. Under US GAAP the future income tax benefits and liabilities would be required to be allocated in the balance sheet between current and non-current items. This allocation would not have a significant effect.
(e) Start up costs
Under Statement of Position 98-5, “Reporting on the Costs of start-up activities”, the costs of start-up activities including organizational costs, are required to be expensed as incurred. Under Australian GAAP start up costs are capitalised and deferred as part of the mineral extraction or processing facilities being developed or constructed. These deferred costs are then amortised from the start of production over the life of the facilities concerned.
(f) Real estate profit recognition
Under US GAAP, real estate revenue is not recognised by the full accrual method until certain criteria are met. The sale of tenements at Kambalda did not meet all conditions in 2000.
(g) Option payment capitalised
An option payment for the right to participate in the Corridor Sands bankable feasibility study and earn an interest in any resultant development has been deferred and amortised over the period during which the study is undertaken. Under US GAAP the payment has been expensed when incurred.
F-30
WMC RESOURCES LTD AND CONTROLLED ENTITIES
Notes to the Interim Combined Financial Statements
32. | | RECONCILIATION TO US GAAP (Continued) |
Under US GAAP bank overdrafts are not considered to be part of the net cash equivalents and so changes in bank overdrafts (net) are included in cash flows from financing activities. In addition, payments for research and development are included in cash flows from operating activities. Other differences in the US GAAP statement of cash flows relate to those items capitalised under A GAAP that would be expensed under US GAAP and would be included in the US GAAP cash flows from operating activities.
| | (i) | | Fair value accounting for derivatives |
Under Australian GAAP, effective hedges are measured at spot price and hedging gains/losses are deferred on the balance sheet as part of other liabilities and assets. Under US GAAP effective hedges are measured at fair value and gains/losses are deferred as part of other comprehensive income.
Accounting for Derivatives and Hedging Activities
WMC Resources formally documents all relationships between hedging instruments and hedged items, as well as its risk-management objective and strategy for undertaking various hedge transactions. This process includes linking all derivatives that are designated as fair-value, cash flow, or foreign-currency hedges to (1) specific assets and liabilities on the balance sheet or (2) specific firm commitments or forecasted transactions. WMC Resources also formally assesses (both at the hedge’s inception and on an ongoing basis) whether the derivatives that are used in hedging transactions have been highly effective in offsetting changes in the fair value or cash flows of hedged items and whether those derivatives may be expected to remain highly effective in future periods. When it is determined that a derivative is not (or has ceased to be) highly effective as a hedge, WMC Resources discontinues hedge accounting prospectively, as discussed below.
WMC Resources discontinues hedge accounting prospectively when (1) it determines that the derivative is no longer effective in offsetting changes in the fair value or cash flows of a hedged item (including hedged items such as firm commitments or forecasted transactions); (2) it is probable that the forecasted transaction will not occur; (3) a hedged firm commitment no longer meets the definition of a firm commitment; or (4) management determines that designating the derivative as a hedging instrument is no longer appropriate.
Fair-Value Hedges
WMC Resources uses interest rate swaps to convert a portion of its non prepayable fixed-rate debt into variable-rate debt. Under the interest rate swap contracts, WMC Resources agrees with other parties to exchange, at specified intervals, the difference between fixed-rate and floating-rate interest amounts, which is calculated based on an agreed-upon notional amount.
For the six months ended June 30, 2002, WMC Resources recognized a net gain of $Nil, which represented the ineffective portion of all of WMC Resources fair-value hedges. All components of each derivative’s gain or loss were included in the assessment of hedge effectiveness.
F-31
WMC RESOURCES LTD AND CONTROLLED ENTITIES
Notes to the Interim Combined Financial Statements
32. | | RECONCILIATION TO US GAAP (Continued) |
| | (i) | | Fair value accounting for derivatives (continued) |
Cash Flow Hedges
WMC Resources’ sales are denominated in the United States dollars. WMC Resources enters into foreign-exchange options and forward-exchange contracts as hedges of anticipated sales denominated in foreign currencies. WMC Resources enters into these contracts to protect itself against the risk that the eventual dollar-net-cash inflows resulting from direct-foreign-export sales will be adversely affected by changes in exchange rates.
As at 30 June 2002 WMC Resources recognized a net gain after tax of $0.9 million representing the change in time value on certain of WMC Resources’ forward contracts that had been excluded from the assessment of hedge effectiveness. A further net gain after tax of $6.6 million was recorded for the ineffective portion of certain options designated as cash flow hedges. The reversal of realized amounts for Australian GAAP, that had previously been reported as ineffective under US GAAP, resulted in an after tax credit to income of $5.6 million.
The revaluation of foreign currency debt which is not treated as a hedge for accounting purposes under US GAAP resulted in a net gain after tax of $88.3 million.
Under Australian GAAP, an amount of $15.4m was deferred in the balance sheet at 30 June 2002 relating to cash proceeds on the early closure of an interest rate forward. This amount related to the repurchase of US dollar debt expected to occur on the demerger of WMC Resources. Under US GAAP, the proceeds received are recognised as revenue as the initial transaction for which the cover was obtained did not occur as designated.
The total of the adjustments referred to in the preceding three paragraphs on a pre-tax basis was $160.2 million.
As of 30 June 2002, $82.1 million of deferred net losses on derivative instruments accumulated in other comprehensive income are expected to be reclassified as earnings during the next twelve months.
The maximum term over which WMC Resources is hedging exposures to the variability of cash flows using derivative instruments for all forecasted transactions is seven years.
Subsequent gains and losses on cash flow hedges are taken to other comprehensive income and are reclassified to profit and loss in the same period the hedged transaction is recognized. Gains and losses on fair value hedges continue to be taken to profit and loss in subsequent periods, as offsetting gains and losses on hedged liabilities. In both cases, these gains and losses are not recognized under Australian GAAP until the hedged transaction is recognized.
FAS 133 requires that any component of the gain or loss which is deemed to be ineffective be taken to the Income Statement immediately. For Australian GAAP any ineffectiveness is recognized over the term of the derivative.
Hedges of Net Investments in Foreign Operations
WMC Resources has numerous investments in foreign subsidiaries. The net assets of these subsidiaries are exposed to volatility in currency exchange rates. WMC Resources uses foreign denominated debt to naturally hedge its exposure and measures ineffectiveness of such hedges based upon the change in spot foreign exchange rates. The treatment of this debt as a net investment hedge is consistent under both Australian GAAP and US GAAP. An amount of $48.7 million has been credited to the foreign currency translation reserve, representing the decrease in fair value of this debt for the period.
F-32
WMC RESOURCES LTD AND CONTROLLED ENTITIES
Notes to the Interim Combined Financial Statements
32. | | RECONCILIATION TO US GAAP (Continued) |
| | (j) | | The right to Royalties received from sale of gold operations not recognised |
The right to royalties received in consideration for the gold mines sold during 2001 has been recognized at fair value under Australian GAAP and included in the determination of the gain on disposal. Under US GAAP, since the right to the royalties received had not been realized at 31 December 2001, WMC Resources has retained an amount of the carrying value of the mines on the balance sheet at 31 December 2001 in the proportion that the value of the right to the royalties bears to the total value of the consideration received. The increase in net income of US GAAP represents the difference in carrying value when the royalty was sold during the six month period ended 30 June 2002.
| | (k) | | Revenue from insurance proceeds |
Under Australian GAAP, insurance proceeds are recognised when WMC Resources is satisfied that a valid claim exists which will be accepted, it is probable that the amount will flow to WMC Resources and the amount can be measured reliably. Under US GAAP, insurance proceeds are not recognized as revenue until realized, either through receipt of the insurance proceeds or an agreement with the insurance provider as to the amount of insurance proceeds to be received. As of 30 June 2002, WMC, had not yet received an agreement on the full amount of insurance proceeds to be received.
| | (l) | | Post–production waste removal costs |
Under Australian GAAP, expenditure incurred on post-production waste removal (stripping) is accumulated and deferred on the balance sheet as part of Mine properties and mine development. For US GAAP, these deferred costs are classified in the balance sheet as other non-current assets. The total net book value of post-production costs capitalized was A$111.1 million as at 30 June 2002 and A$99.1 million as at 31 December 2001.
Stripping expenditure, which for Australian GAAP purposes is shown as an investing cash flow, is considered as an operating cash flow for US GAAP.
| | (m) | | Amortization of mine development and deferred post-production waste removal costs |
Following discussions with the SEC, WMC Resources intends to adopt a new accounting policy for mine depletion in its annual report on Form 20-F for the 12 months to 31 December 2002. The new policy will exclude future costs from the determination of the amortization rate for mine development and deferred post-production waste removal costs. This change will be recorded as a cumulative effect adjustment, effective 1 January 2002 in accordance with APB20, and will therefore impact the 6 month period to 30 June 2002. WMC Resources is currently evaluating the impact of this change on its financial positions and results of operations.
F-33
WMC RESOURCES LTD AND CONTROLLED ENTITIES
Notes to the Interim Combined Financial Statements
32. | | RECONCILIATION TO US GAAP (Continued) |
| | | Six months To 30 June 2002 Unaudited A$
| | | Six months To 30 June 2001 Unaudited A$
| |
INCOME AND COMPREHENSIVE INCOME STATEMENT – US GAAP RECONCILIATION | | | | | | |
| Net Income attributable to members of the holding company as reported | | 46.3 | | | 116.1 | |
| | |
|
| |
|
|
|
Adjustments required to conform with US GAAP: | | | | | | |
| — Research and development costs (a) | | (0.1 | ) | | 1.2 | |
| — Pension funds (b) | | (0.3 | ) | | 4.0 | |
| — Exploration expenditure capitalised (c) | | (0.5 | ) | | — | |
| — Start up costs (e) | | | | | | |
| — amortization written back | | 3.5 | | | 3.5 | |
| — Real estate profit recognition (f) | | | | | | |
| — sale of Kambalda tenements | | — | | | 20.2 | |
| — Option payment capitalised (g) | | | | | | |
| — amortization written back | | 5.7 | | | 5.7 | |
| — Fair value accounting for derivatives (i) | | 160.2 | | | (207.8 | ) |
| — Royalty received from sale of gold operations (j) | | 13.6 | | | — | |
| — Revenue from insurance (k) | | (44.5 | ) | | — | |
| — Income tax effect | | (41.4 | ) | | 56.3 | |
| | |
|
| |
|
|
Total adjustments | | 96.2 | | | (116.9 | ) |
| | |
|
| |
|
|
Net income in accordance with US GAAP | | 142.5 | | | (0.8 | ) |
| | |
|
| |
|
|
|
| This is represented by: | | | | | | |
| Net income from continuing operations | | 99.3 | | | (75.4 | ) |
| Net income from discontinued operations | | 43.2 | | | 74.6 | |
| | |
|
| |
|
|
|
Comprehensive Income | | | | | | |
| Net income in accordance with US GAAP as above | | 142.5 | | | (0.8 | ) |
| Other comprehensive income as reported | | 37.7 | | | (24.6 | ) |
| Transitional adjustment on adoption of FAS 133 Note (i) | | — | | | (618.7 | ) |
| FAS 133 adjustment for current year | | 186.2 | | | (255.0 | ) |
| | |
|
| |
|
|
Comprehensive (loss)/income in accordance with US GAAP | | 366.4 | | | (899.1 | ) |
| | |
|
| |
|
|
F-34
WMC RESOURCES LTD AND CONTROLLED ENTITIES
Notes to the Interim Combined Financial Statements
32. | | RECONCILIATION TO US GAAP (Continued) |
| | | As at 30 June 2002 Uunaudited A$
| | | As at 31 Dec 2001 Uunaudited A$
| |
SHAREHOLDERS’ EQUITY – US GAAP RECONCILIATION | | | | | | |
| Shareholders’ equity as reported | | 3,358.6 | | | 3,220.3 | |
Adjustments required to conform with US GAAP: | | | | | | |
| — Research and development costs capitalised (a) | | (0.6 | ) | | (0.5 | ) |
| — Pension funds (b) | | (44.4 | ) | | (44.1 | ) |
| — Exploration expenditure capitalised (c) | | (35.2 | ) | | (37.4 | ) |
| — Start up costs (e) | | | | | | |
| — Cumulative adjustment to prior year earnings | | (110.8 | ) | | (116.8 | ) |
| — feasibility and evaluation costs capitalised | | (26.9 | ) | | (24.4 | ) |
| — Option payment capitalised (g) | | | | | | |
| — current year adjustment | | (8.6 | ) | | (14.3 | ) |
| — Fair value accounting for derivatives (i) | | (921.5 | ) | | (1,347.7 | ) |
| — Royalty received from sale of gold operations (j) | | — | | | (13.6 | ) |
| — Revenue from insurance (k) | | (44.5 | ) | | — | |
| — Other | | 1.4 | | | 1.4 | |
| — Income tax effect (excluding tax of associates) | | 321.6 | | | 445.9 | |
| | |
|
| |
|
|
| WMC Resources shareholders’ equity according to US GAAP | | 2,489.1 | | | 2,068.8 | |
| | |
|
| |
|
|
F-35
WMC RESOURCES LTD AND CONTROLLED ENTITIES
Notes to the Interim Combined Financial Statements
32. RECONCILIATION TO US GAAP (Continued)
| | | As at 30 June 2002 Unaudited A$
| | | As at 31 Dec 2001 Unaudited A$
| |
TOTAL ASSETS US GAAP RECONCILIATION | | | | | | |
Total Assets reported using Australian GAAP | | 7,461.8 | | | 8,242.9 | |
| Adjustment for Research and development costs capitalised (Note 32 (a)) | | (0.6 | ) | | (0.5 | ) |
| Adjustment for Exploration expenditure capitalised (Note 32 (c)) | | (35.2 | ) | | (37.4 | ) |
| Adjustment for Start up costs (Note 32 (e)) | | (137.7 | ) | | (141.2 | ) |
| Adjustment for fair value of accounting for derivatives (Note 32 (i)) | | (798.3 | ) | | (1,345.9 | ) |
| Adjustment for Royalty received from sale of gold operations (Note 32 (j)) | | — | | | (13.6 | ) |
| Adjustment for Insurance proceeds (Note 32 (k)) | | (44.5 | ) | | — | |
| Adjustment for Option payment capitalised (Note 32 (g)) | | (8.6 | ) | | (14.3 | ) |
| Other minor adjustments | | 1.4 | | | 1.4 | |
| | |
|
| |
|
|
Total Assets according to US GAAP | | 6,438.3 | | | 6,691.4 | |
| | |
|
| |
|
|
TOTAL LIABILITIES—US GAAP RECONCILIATION | | | | | | |
Total Liabilities reported under Australian GAAP | | 4,102.4 | | | 5,013.6 | |
| Adjustment for Pension funds (Note 32 (b)) | | 44.4 | | | 44.1 | |
| Adjustment for fair value of accounting for derivatives (Note 32 (i)) | | 123.2 | | | 1.8 | |
| Income tax effect of US GAAP adjustments | | (321.6 | ) | | (445.9 | ) |
| | |
|
| |
|
|
Total Liabilities according to US GAAP | | 3,948.4 | | | 4,613.6 | |
| | |
|
| |
|
|
F-36
WMC RESOURCES LTD AND CONTROLLED ENTITIES
Notes to the Interim Combined Financial Statements
32. RECONCILIATION TO US GAAP (Continued)
| | | Six months To 30 June 2002 Unaudited A$
| | | Six months To 30 June 2001 Unaudited A$
| |
STATEMENT OF CASH FLOWS – US GAAP RECONCILIATION (h) | | | | | | |
| Cash flows from financing activities as reported | | 17.7 | | | (154.2 | ) |
| Changes in bank overdrafts (net) | | (0.2 | ) | | (2.7 | ) |
| | |
|
| |
|
|
| Net cash provided by/(used in) financing activities – US GAAP | | 17.5 | | | (156.9 | ) |
| | |
|
| |
|
|
| Cash flows from operating activities as reported | | 63.4 | | | 407.8 | |
| Payments for exploration expenditure expensed for US GAAP | | (0.5 | ) | | — | |
| Payments for research and development | | (0.4 | ) | | (0.1 | ) |
| Deferred stripping expenditure reclassified from investing | | (50.3 | ) | | (49.5 | ) |
| | |
|
| |
|
|
| Net cash provided by operating activities – US GAAP | | 12.2 | | | 358.2 | |
| | |
|
| |
|
|
| Cash flows from investing activities as reported | | (133.9 | ) | | (54.8 | ) |
| Payments for exploration expenditure expensed for US GAAP | | 0.5 | | | | |
| Reclassification of payments for research and development to operating activities | | 0.4 | | | 0.1 | |
| Reclassification of deferred stripping expenditure | | 50.3 | | | 49.5 | |
| | |
|
| |
|
|
| Net cash (used in) investing activities – US GAAP | | (82.7 | ) | | (5.2 | ) |
| | |
|
| |
|
|
| Net increase/(decrease) in cash and cash equivalents | | (53.0 | ) | | 196.1 | |
| Cash and cash equivalents at the beginning of the year | | 124.1 | | | 62.3 | |
| Effects of exchange rate changes on opening foreign currency cash balances and on cash flows during the period | | (8.7 | ) | | 3.6 | |
| | |
|
| |
|
|
| Cash and cash equivalents at the end of the financial year | | 62.4 | | | 262.0 | |
| | |
|
| |
|
|
33. EVENTS SUBSEQUENT TO BALANCE DATE
Acquisition of new business
In December 2002, WMC Resources acquired WMC Limited’s copper/uranium and fertilizer businesses, WMC Finance Ltd, WMC Finance (USA) Ltd, as well as other businesses not relating to AWAC for consideration equal to the fair value at the date of acquisition. Under Australian GAAP, the acquisition of these assets and businesses was effected at their fair value. Under US GAAP, assets and businesses transferred between entities under common control are accounted for at book value.
Sale of Long/Victor
On 28 June 2002 the company entered into an agreement to sell the Long/Victor mines at Kambalda. This transaction will be brought to account in the second half of 2002, following satisfactory completion of commercial obligations by the buyer.
Option Plan/Stock Appreciation Plan
Prior to the demerger of WMC Ltd into Alumina Ltd and WMC Resources Ltd, WMC Limited has an employee stock option plan, an employee stock appreciation plan, and an employee share purchase plan. Options under the employee option plan were granted to employees with an exercise price generally equal to the weighted average sale price of WMC Limited shares on the ASX on the date of grant. The options vested in one year from the grant date. On August 13, 2002 WMC Ltd announced a suspension of any future allotments under the plan to senior executives.
F-37
WMC RESOURCES LTD AND CONTROLLED ENTITIES
Notes to the Interim Combined Financial Statements
33. EVENTS SUBSEQUENT TO BALANCE DATE (Continued)
The Stock Appreciation Plan (“SAP”) was designed to provide employees in countries outside of Australia with rights similar to those granted under the WMC Ltd option plan. These rights had a notional allotment price equal to the weighted average sale price of WMC Limited shares on the ASX on the trading date that the invitation to apply for the relevant right was extended. Upon redemption of the right by the holder prior to its expiry, the holder was entitled to a payment equal to any excess of the price of WMC Ltd shares on the ASX on the trading date immediately before redemption, and the allotment price.
WMC Ltd additionally had issued partly paid shares to senior executives. All amounts owing on these partly paid shares were paid in April 2002 and consequently all of these share became fully paid WMC Ltd shares.
In order to preserve the economic rights of holders of options and SAP rights following the demerger, the following proposal will be put to a vote of shareholders of WMC Ltd in connection with the demerger:
Option Plan
| | • | | An outstanding WMC Limited option becomes an option in Alumina Ltd, the continuing registrant from a legal and accounting perspective. |
| | • | | The option exercise price of the Alumina option is reduced based on the ratio of the volume-weighted average price of an Alumina share and a WMC Resources’ share over the first five trading days of the shares on the ASX after the listing date. |
| | • | | Each existing WMC Limited option holder receives one option in WMC Resources for each option held in WMC Limited. The exercise price of the WMC Resources’ option is based on the ratio of the volume-weighted average price of an Alumina share and a WMC Resources share over the first five trading days of the shares on the ASX after the listing date. |
| | • | | The aggregate exercise price of an Alumina option and a newly issued WMC Resources’ option will equal the total exercise price of the WMC Limited option before the demerger date. |
| | • | | All other terms (vesting period, expiration date) of the Alumina option and the newly issued WMC Resources’ option will be the same as the terms of the original WMC Limited option. |
Stock Appreciation Plan
| | • | | Each WMC Ltd SAP right becomes a SAP right in Alumina Ltd, the value of which will be based on the market price of the Alumina shares at the time of redemption. The notional allotment price was amended in a manner similar to that described above for the strike price of the employee options. |
| | • | | Holders of WMC Ltd SAP rights received one WMC Resources SAP right for each WMC Ltd SAP right held prior to the demerger. |
| | • | | The aggregate notional allotment prices of the Alumina Ltd and WMC Resources Ltd SAP rights will equal the notional allotment price of the WMC Ltd SAP rights prior to the demerger. |
| | • | | The Alumina Ltd and WMC Resources SAP rights will lapse at the same time as the WMC Ltd SAP would have lapsed. |
Under Australian GAAP, WMC Ltd accounted for proceeds received on issuance of shares following the exercise of employee stock options by crediting paid in capital. Under US GAAP, WMC Ltd accounted for the stock option plan in accordance with APB 25, and accordingly no compensation expense was recorded as the options had no intrinsic value when issued.
SAP rights have been accounted for by WMC Ltd under Australian GAAP by recognizing compensation expense as awards are paid. SAP rights have been accounted for by WMC Ltd for US GAAP as variable plans in accordance with APB 25, and therefore compensation expense is recorded each period in an amount that results in the cumulative compensation expense recorded since issuance being equal to the intrinsic value of the option at that time.
WMC Resources does not expect that the proposed modifications described above would result in a change in the manner in which the option plan or the SAP rights would be accounted for, however the final accounting treatment will depend on the exact terms and conditions of the plan as approved by shareholders.
WMC Resources proposes to implement employee share option plans for employees other than senior management, and SAP rights plans for employees outside Australia. These plans, subject to shareholder approval are expected to have terms substantially consistent with those of WMC Ltd as described above, and to be accounted for in a similar manner.
WMC Resources additionally proposes, subject to shareholder approval to implement an employee share purchase plan for senior staff. This plan would involve provision of share grants to senior staff based upon the performance of the company against a peer index of resource companies. Shares issued under this plan would be purchased on the market, on behalf of participants and all costs of these plans will are expected to be expensed as incurred.
F-38
WMC RESOURCES LTD
(Australian Business Number 76 004 184 598)
AND CONTROLLED ENTITIES
UNAUDITED PRO FORMA COMBINED FINANCIAL STATEMENTS
AS OF AND FOR THE YEAR ENDED 31 DECEMBER 2001
AND THE SIX MONTHS ENDED 30 JUNE 2002
Prepared in accordance
with Australian generally accepted
accounting principles (Australian GAAP)
except where noted
Amounts are stated in Australian dollars (A$) except where noted
P-1
WMC RESOURCES LTD AND CONTROLLED ENTITIES
UNAUDITED PRO FORMA COMBINED FINANCIAL STATEMENTS
CONTENTS PAGE
P-2
WMC RESOURCES LTD AND CONTROLLED ENTITIES
UNAUDITED PRO FORMA COMBINED FINANCIAL STATEMENTS
The unaudited pro forma combined financial statements are derived from the historical audited combined financial statements of WMC Resources Ltd for the fiscal year ended 31 December 2001 and the unaudited interim combined financial statements of WMC Resources Ltd for the six month period ended 30 June 2002. The unaudited pro forma combined statement of income for the year ended 31 December 2001 and for the six month period ended 30 June 2002 gives pro forma effect to the demerger which includes the internal reorganization and court-approved Scheme of Arrangement through a capital reduction and dividend distribution as if the demerger had occurred on 1 January 2001. As part of the Scheme of Arrangement, WMC Resources acquired from WMC Limited the shares it holds in the legal entities controlling Fertilizers and the Olympic Dam mining operations in return for the issue of WMC Resources shares. In addition, certain other non-AWAC entities including WMC Finance were transferred to WMC Resources. Under Australian GAAP, the transfers are accounted for at fair value. Under US GAAP, the transfers are accounted for at book value. The unaudited pro forma combined balance sheet as at 30 June 2002 gives pro forma effect to the demerger transactions as if they had occurred on 30 June 2002.
The unaudited pro forma financial information is presented for illustrative purposes only and does not purport to represent what the actual financial performance of WMC Resources Ltd would have been if the demerger had occurred at an earlier date. The pro forma adjustments are based upon currently available information and estimates and assumptions. Actual adjustments may differ from the pro forma adjustments, and therefore the future operating results of WMC Resources Ltd may differ materially from the unaudited pro forma information. These unaudited pro forma combined financial statements should be read in connection with, and are qualified by reference to, the historical combined financial statements and “Operating Review and Financial Prospects” located in this registration statement. For a discussion of the principal differences between generally accepted accounting principles in Australia (“AGAAP”) and the United States (“US GAAP”), and reconciliation to US GAAP net income and shareholders’ equity, see note 44 to the “Combined Financial Statements of WMC Resources for the fiscal years ended 31 December 2001, 2000, and 1999” and note 32 in the “Interim Combined Financial Statements of WMC Resources for the six month periods ended 30 June 2002 and 2001” included in this registration statement.
P-3
WMC RESOURCES LTD AND CONTROLLED ENTITIES
UNAUDITED PRO FORMA COMBINED BALANCE SHEET AS AT 30 JUNE 2002 A GAAP
A$ millions
| | Note Ref
| | As Reported WMC Resources(1)
| | Pro forma Adjustments
| | | Pro forma WMC Resources
|
CURRENT ASSETS | | | | | | | | | |
| Cash | | 3(c) | | 62.4 | | (20.8 | ) | | 41.6 |
| Receivables | | 3(d) | | 538.3 | | 9.3 | | | 547.6 |
| Inventories | | | | 481.9 | | — | | | 481.9 |
| Other current assets | | 3(b),3(d) | | 198.6 | | (91.7 | ) | | 106.9 |
| | | | |
| |
|
| |
|
Total current assets | | | | 1,281.2 | | (103.2 | ) | | 1,178.0 |
| | | | |
| |
|
| |
|
NON-CURRENT ASSETS | | | | | | | | | |
| Receivables | | 3(d) | | 358.6 | | (23.6 | ) | | 335.0 |
| Inventories | | | | 83.1 | | — | | | 83.1 |
| Future tax asset | | 3(e) | | 284.7 | | (260.0 | ) | | 24.7 |
| Property, plant & equipment | | 3(a) | | 4,630.4 | | 995.3 | | | 5,625.7 |
| Exploration and evaluation | | | | 62.3 | | — | | | 62.3 |
| Other non-current assets | | 3(d) | | 761.5 | | (716.4 | ) | | 45.1 |
| | | | |
| |
|
| |
|
Total non-current assets | | | | 6,180.6 | | (4.7 | ) | | 6,175.9 |
| | | | |
| |
|
| |
|
TOTAL ASSETS | | | | 7,461.8 | | (107.9 | ) | | 7,353.9 |
| | | | |
| |
|
| |
|
CURRENT LIABILITIES | | | | | | | | | |
| Payables | | 3(a),3(d) | | 452.2 | | 82.5 | | | 534.7 |
| Debt | | 3(b) | | 467.6 | | (267.6 | ) | | 200.0 |
| Provisions | | | | 71.3 | | — | | | 71.3 |
| Current tax liabilities | | | | 3.2 | | — | | | 3.2 |
| Other current liabilities | | | | 20.3 | | — | | | 20.3 |
| | | | |
| |
|
| |
|
Total current liabilities | | | | 1,014.6 | | (185.1 | ) | | 829.5 |
| | | | |
| |
|
| |
|
NON-CURRENT LIABILITIES | | | | | | | | | |
| Payables | | 3(d) | | 914.2 | | 46.4 | | | 960.6 |
| Debt | | 3(b) | | 1,633.4 | | (134.2 | ) | | 1,499.2 |
| Deferred tax liabilities | | | | 439.6 | | — | | | 439.6 |
| Provisions | | | | 97.8 | | — | | | 97.8 |
| Other non-current liabilities | | | | 2.8 | | — | | | 2.8 |
| | | | |
| |
|
| |
|
Total non-current liabilities | | | | 3,087.8 | | (87.8 | ) | | 3,000.0 |
| | | | |
| |
|
| |
|
TOTAL LIABILITIES | | | | 4,102.4 | | (272.9 | ) | | 3,829.5 |
| | | | |
| |
|
| |
|
| Minority shareholders’ interest in subsidiaries | | | | 0.8 | | — | | | 0.8 |
| | | | |
| |
|
| |
|
NET ASSETS /SHAREHOLDERS’ EQUITY | | | | 3,358.6 | | 165.0 | | | 3,523.6 |
| | | | |
| |
|
| |
|
The above unaudited pro forma combined balance sheet should be read in conjunction with the accompanying notes.
(1)Reported WMC Resources Ltd Interim Combined Balance Sheets as disclosed in the combined financial statements.
P-4
WMC RESOURCES LTD AND CONTROLLED ENTITIES
UNAUDITED RECONCILIATION OF A GAAP PRO FORMA SHAREHOLDERS’ EQUITY TO US GAAP AS AT 30 JUNE 2002
A$ millions
| | Note Ref
| | As at 30 June 2002
| |
Pro forma shareholders’ equity in accordance with A GAAP | | | | 3,523.6 | |
|
| US GAAP adjustments | | | | | |
| — Research and development costs capitalised | | | | (0.6 | ) |
| — Pension funds | | | | (44.4 | ) |
| — Exploration expenditure capitalised | | | | (35.2 | ) |
| — Start up costs | | | | | |
| — cumulative adjustment to prior year earnings | | | | (110.8 | ) |
| — feasibility and evaluation costs capitalised | | | | (26.9 | ) |
| — Option payment capitalised — current year adjustment | | | | (8.6 | ) |
| — Fair value of accounting for derivatives | | | | (921.5 | ) |
| — Revenue from insurance | | | | (44.5 | ) |
| — Other | | | | 1.4 | |
| — Income tax effect | | | | 321.6 | |
|
| Pro forma US GAAP adjustments | | | | | |
| — Reversal of fair value up-lift (pro forma adjustments) | | 4(a) | | (995.3 | ) |
| — Costs associated with extinguishment of USD debt | | 4(c) | | 198.2 | |
| — Reversal of fair value of derivatives | | 3(d) | | 889.8 | |
| | | | |
|
|
Total US GAAP adjustments | | | | (776.8 | ) |
| | | | |
|
|
Pro forma shareholders’ equity in accordance with US GAAP | | | | 2,746.8 | |
| | | | |
|
|
The above unaudited reconciliation of A GAAP pro forma shareholders’ equity to US GAAP should be read in conjunction with the accompanying notes.
P-5
WMC RESOURCES LTD AND CONTROLLED ENTITIES
UNAUDITED PRO FORMA COMBINED STATEMENT OF INCOME FOR THE YEAR ENDED 31 DECEMBER 2001
A$ millions (except per share amounts)
| | Note Ref
| | | As Reported WMC Resources(1)
| | | Pro forma Adjustments
| | | Pro forma WMC Resources
| |
Net sales revenue | | | | | 2,364.1 | | | — | | | 2,364.1 | |
| | | | | |
|
| |
|
| |
|
|
| Cost of goods sold | | 3 | (a) | | (1,878.7 | ) | | (9.1 | ) | | (1,887.8 | ) |
| Selling and distribution | | | | | (163.4 | ) | | — | | | (163.4 | ) |
| General and administrative | | | | | (224.1 | ) | | — | | | (224.1 | ) |
| Exceptional items | | | | | (92.5 | ) | | — | | | (92.5 | ) |
| | | | | |
|
| |
|
| |
|
|
| | | | | | 5.4 | | | (9.1 | ) | | (3.7 | ) |
| Exploration and evaluation | | | | | (71.9 | ) | | — | | | (71.9 | ) |
| Other expenses | | | | | (64.2 | ) | | — | | | (64.2 | ) |
| Other income | | | | | 202.6 | | | — | | | 202.6 | |
| | | | | |
|
| |
|
| |
|
|
Income before interest and income tax | | | | | 71.9 | | | (9.1 | ) | | 62.8 | |
| Interest expense | | 3 | (b) | | (295.2 | ) | | 38.7 | | | (256.5 | ) |
| | | | | |
|
| |
|
| |
|
|
| Income before income taxes | | | | | (223.3 | ) | | 29.6 | | | (193.7 | ) |
| Income tax credit | | 3 | (e) | | 65.8 | | | (11.6 | ) | | 54.2 | |
| | | | | |
|
| |
|
| |
|
|
Net(Loss) from continuing operations | | | | | (157.5 | ) | | 18.0 | | | (139.5 | ) |
| | | | | |
|
| |
|
| |
|
|
| Pro forma basic earnings per share from continuing operations—A$ | | 3 | (f) | | (0.14 | ) | | 0.02 | | | (0.12 | ) |
| Pro forma diluted earnings per share from continuing operations—A$ | | 3 | (f) | | (0.14 | ) | | 0.02 | | | (0.12 | ) |
| Pro forma basic number of shares outstanding | | 3 | (f) | | 1,103,323,901 | | | — | | | 1,103,323,901 | |
The above unaudited pro forma combined statement of income should be read in conjunction with the accompanying notes.
(1)Reported WMC Resources Ltd Interim Combined Statements of Income as disclosed in the combined financial statements.
P-6
WMC RESOURCES LTD AND CONTROLLED ENTITIES
UNAUDITED RECONCILIATION OF A GAAP PRO FORMA EARNINGS FROM CONTINUING OPERATIONS TO US GAAP FOR THE YEAR ENDED 31 DECEMBER 2001
A $millions (except per share amounts)
| | Note Ref
| | | Year ended 31 December 2001
|
Pro forma loss from continuing operations in accordance with A GAAP | | | | | (139.5) |
|
US GAAP adjustments | | | | | |
| • Fair value accounting for derivatives | | | | | (164.4) |
• Research and development costs expensed immediately under US GAAP but deferred and subsequently expensed under A GAAP | | | | | 1.9 |
| • Pension funds | | | | | 8.2 |
| • Exploration expenditure capitalised | | | | | (1.9) |
| • Option payment capitalised — amortisation written back | | | | | 11.4 |
| • Start up costs — amortisation written back | | | | | 7.0 |
| • Real estate profit recognition — sale of Kambalda tenements | | | | | 20.2 |
| • Income tax effect | | | | | 44.7 |
|
Pro forma US GAAP adjustments | | | | | |
| • Amortisation of fair value uplift | | 4 | (a) | | 9.1 |
| | | | | |
|
Total US GAAP adjustments | | | | | (63.8) |
| | | | | |
|
Pro forma loss from continuing operations in accordance with US GAAP | | | | | (203.3) |
| | | | | |
|
|
| Pro forma basic earnings per share from continuing operations in accordance with US GAAP | | 3 | (f) | | (0.18) |
| Pro forma diluted earnings per share from continuing operations in accordance with US GAAP | | 3 | (f) | | (0.18) |
| Pro forma basic number of shares outstanding | | 3 | (f) | | 1,103,323,901 |
| Pro forma diluted number of shares outstanding | | 3 | (f) | | 1,120,797,901 |
The above unaudited reconciliation of A GAAP pro forma earnings to US GAAP should be read in conjunction with the accompanying notes.
P-7
WMC RESOURCES LTD AND CONTROLLED ENTITIES
UNAUDITED PRO FORMA COMBINED STATEMENT OF INCOME FOR THE SIX MONTHS ENDED 30 JUNE 2002
A$ millions (except per share amounts)
| | Note Ref
| | As Reported WMC Resources(1)
| | Pro forma Adjustments
| | Pro forma WMC Resources
|
Net sales revenue | | | | 1,196.3 | | — | | 1,196.3 |
| | | | |
| |
| |
|
| Cost of goods sold | | 3(a) | | (817.2) | | (4.5) | | (821.7) |
| Selling and distribution | | | | (82.1) | | — | | (82.1) |
| General and administrative | | | | (152.4) | | — | | (152.4) |
| Exceptional items | | | | 72.3 | | — | | 72.3 |
| | | | |
| |
| |
|
| | | | | 216.9 | | (4.5) | | 212.4 |
| Exploration and evaluation | | | | (14.4) | | — | | (14.4) |
| Other expenses | | | | (127.5) | | — | | (127.5) |
| Other income | | | | 28.9 | | — | | 28.9 |
| | | | |
| |
| |
|
Income before interest and income tax | | | | 103.9 | | (4.5) | | 99.4 |
| Interest expense | | 3(b) | | (78.7) | | 18.6 | | (60.1) |
| | | | |
| |
| |
|
Income before income tax | | | | 25.2 | | 14.1 | | 39.3 |
| Income tax expense | | 3(e) | | (13.1) | | (5.6) | | (18.7) |
| | | | |
| |
| |
|
Net Income from continuing operations | | | | 12.1 | | 8.5 | | 20.6 |
| | | | |
| |
| |
|
| Pro forma basic and diluted earnings per share from continuing operations— A$ | | 3(f) | | 0.01 | | 0.01 | | 0.02 |
| Pro forma basic number of shares outstanding | | 3(f) | | 1,111,147,678 | | — | | 1,111,147,678 |
The above unaudited pro forma combined statement of income should be read in conjunction with the accompanying notes.
(1)Reported WMC Resources Ltd Interim Combined Statements of Income as disclosed in the combined financial statements.
P-8
WMC RESOURCES LTD AND CONTROLLED ENTITIES
UNAUDITED RECONCILIATION OF A GAAP PRO FORMA EARNINGS FROM CONTINUING OPERATIONS TO US GAAP FOR THE SIX MONTHS ENDED 30 JUNE 2002
A$ millions (except per share amounts)
| | Note Ref
| | | Six Months ended 30 June 2002
|
Pro forma income from continuing operations in accordance with A GAAP | | | | | 20.6 |
US GAAP adjustments | | | | | |
| • Fair value accounting for derivatives | | | | | 160.2 |
| • Research and development costs expensed immediately under US GAAP but deferred and subsequently expensed under A GAAP | | | | | (0.1) |
| • Pension funds | | | | | (0.3) |
| • Option payment capitalised—amortisation written back | | | | | 5.7 |
| • Start up costs— amortisation written back | | | | | 3.5 |
| • Revenue from insurance proceeds | | | | | (44.5) |
| • Income tax effect | | | | | (37.3) |
Pro forma US GAAP adjustments | | | | | |
| • Amortisation of fair value uplift | | 4 | (a) | | 4.5 |
| | | | | |
|
Total US GAAP adjustments | | | | | 91.7 |
| | | | | |
|
Pro forma income from continuing operations in accordance with US GAAP | | | | | 112.3 |
| | | | | |
|
| Pro forma basic and diluted earnings per share from continuing operations in accordance with US GAAP | | 3 | (f) | | 0.10 |
| Pro forma basic number of shares outstanding | | 3 | (f) | | 1,111,147,678 |
| Pro forma diluted number of shares outstanding | | 3 | (f) | | 1,124,577,089 |
The above unaudited reconciliation of A GAAP pro forma earnings to US GAAP should be read in conjunction with the accompanying notes.
P-9
WMC RESOURCES LTD AND CONTROLLED ENTITIES
NOTES TO THE UNAUDITED PRO FORMA COMBINED FINANCIAL STATEMENTS
The unaudited pro forma combined financial statements have been prepared in accordance with generally accepted accounting principles in Australia (“A GAAP”) and are presented in Australian dollars. A GAAP differs in some respects from generally accepted accounting principles in the United States of America, as they relate to WMC Resources Ltd. For a description of the differences between A GAAP and US GAAP and the related effect on the unaudited pro forma financial statements, see Notes 3 and 4 below.
2. Reorganization and demerger
Pursuant to the demerger, WMC Resources acquired WMC Limited’s copper/uranium and fertilizer businesses, WMC Finance Ltd and WMC Finance (USA) Ltd, as well as WMC Limited’s international exploration assets and business other than those relating to AWAC. The effect of the demerger was that eligible WMC Limited shareholders received one WMC Resources share for each WMC Limited share they held. WMC Limited has prepared separate unaudited pro forma financial statements for WMC Resources which give pro forma effect to the demerger and certain other pro forma adjustments. The WMC Resources unaudited pro forma financial statements reflect the historical financial statements of WMC Resources adjusted to give pro forma effect to the acquisition of WMC Limited’s copper/uranium and fertilizer businesses, WMC Finance Ltd and WMC Finance (USA) Ltd, as well as WMC Limited’s international exploration assets and business other than those relating to AWAC and certain other pro forma adjustments as more fully described under Note 3 below.
3. WMC Resources Ltd unaudited pro forma adjustments
(a) Property, plant and equipment and related amortization and depreciation
Under Australian GAAP, the acquisition by WMC Resources of WMC Limited’s copper/uranium and fertilizer businesses, WMC Finance Ltd and WMC Finance (USA) Ltd, as well as WMC Limited’s international exploration assets and business other than those relating to AWAC prior to the demerger resulted in the assets and liabilities being transferred at fair value on the date of transfer. The fair values of the net assets of the operations transferred have been calculated using discounted cash flow models. The unaudited pro forma combined balance sheet reflects an adjustment of $971.6 million to reflect property, plant and equipment at fair value as at 30 June 2002. An additional adjustment to property, plant and equipment of $23.7 million relates to the stamp duty paid on acquisition of the operations. The unaudited pro forma combined statements of income include an adjustment for the additional amortization expense resulting from the increase in carrying value of property, plant and equipment as if the increase in carrying value had been recorded as at 1 January 2001.
(b) Current and long-term debt and net borrowing costs
In conjunction with the scheme of arrangement, WMC Resources has obtained new credit facilities to replace the debt borrowings under WMC Limited’s credit facilities. Under A GAAP, the early extinguishment of WMC Limited’s borrowing facilities will result in a fair value adjustment to non-current debt in the unaudited pro forma combined balance sheet equal to the estimated fair value adjustment and premium of $198.2 million payable to existing US$ bond holders and the fair value adjustment of $9.4 million of capitalized borrowing costs associated with the existing debt recorded in other current assets. Under US GAAP, the early extinguishment of WMC Limited’s borrowing facilities will result in a loss of $198.2 million, which has not been reflected as a US GAAP adjustment to the unaudited pro forma combined statement of income as the loss is non-recurring.
The adjustment also reflects the $600 million of debt to be repaid by WMC Resources from funds injected by Alumina Ltd in accordance with the demerger agreement.
The unaudited pro forma combined statements of income includes an adjustment to reflect the reduced interest expense under the new debt balance. A change of 1/8 % in interest rates under the facilities would result in additional interest expense of $0.75 million for the six month period ending 30 June 2002.
(c ) Cash
Cash of $20.8 million has been allocated to the Alumina Ltd Group to fund the payment of Alumina Ltd’s share of AWAC’s acquisition of Reynold Metal Company’s 5% interest in MRN and 6% interest in Halco.
P-10
WMC RESOURCES LTD AND CONTROLLED ENTITIES
NOTES TO THE UNAUDITED PRO FORMA COMBINED FINANCIAL STATEMENTS
(d) Derivatives and hedging
Consistent with (a) above, the transfers of WMC Finance Ltd and WMC Finance (USA) Ltd prior to the demerger resulted in the accounting for the derivative financial instruments transferred at fair value on the date of transfer. Details of the fair value adjustments to the currency and commodity hedge book are detailed in the table below.
A$ millions
| | Reported Hedge Book balances as at 30 June 2002 (WMC)
| | | Acquisition adjustments
| | | Pro forma Hedge Book Fair Values as at 30 June 2002 (WMC Resources)
| |
| Receivables – current | | 60.1 | | | 9.3 | | | 69.4 | |
| Receivables – non current | | 346.4 | | | (23.6 | ) | | 322.8 | |
| Deferred losses – current | | 82.3 | | | (82.3 | ) | | — | |
| Deferred losses – non current | | 716.4 | | | (716.4 | ) | | — | |
| Accounts payable – current | | (166.9 | ) | | (30.4 | ) | | (197.3 | ) |
| Accounts payable – non current | | (859.5 | ) | | (46.4 | ) | | (905.9 | ) |
| | |
|
| |
|
| |
|
|
| Net position | | 178.8 | | | (889.8 | ) | | (711.0 | ) |
| | |
|
| |
|
| |
|
|
Under A GAAP, hedging and financial instruments are recognized at their fair values based on the mark to market commodity prices and exchange rates current on the date of the demerger. As a consequence, future A GAAP earnings will only be impacted by subsequent movements between these prices and exchange rates and the prices and exchange rates when they mature, rather than by movements between rates when the contracts were taken out and when they have matured. No pro forma adjustment has been made to reflect the earnings impact of recognizing hedging and financial instruments at their fair value as if the demerger had occurred on 1 January 2001.
The unaudited combined balance sheet also reflects an adjustment to payables of $23.7 million to reflect stamp duty paid on the acquisition of Fertilizers and Olympic Dam operations as discussed in (a) above and expected demerger expenses of $23.9 million.
No adjustment is made in the unaudited pro forma combined statement of income for demerger costs as they are non-recurring and will not have a continuing impact on results of operations.
(e) Income tax (expense) / credit
The unaudited pro forma combined statements of income include an adjustment to the income tax (expense) / credit in relation to the decreased interest expense under the new debt balance (see Note b above). The adjustment has been calculated at the statutory tax rate in effect during the periods presented of 30%. There is no tax effect applicable to the additional amortization expense discussed at
3(a) as these amounts are not deductible for tax purposes.
The unaudited pro forma combined balance sheet includes an adjustment of $260 million to reduce future tax assets previously recognised for accounting purposes in relation to certain carried forward tax losses that do not meet the virtual certainty test under AASB 1020 Income Taxes, post demerger.
(f) Pro forma earnings per share and weighted average shares outstanding
Pursuant to the demerger, each WMC shareholder received one share in WMC Resources for every share of WMC Limited. Accordingly, the one for one exchange did not have an impact on the calculation of the pro forma weighted average number of shares outstanding.
Pursuant to the Option Offer, shortly after the demerger is implemented WMC Resources intends to offer those employees who were WMC option holders, for each option held at the Option record date, one WMC Resources option and one Alumina SAP option. The replacement options will be on identical maturity terms with the strike price split between Alumina Ltd and WMC Resources Ltd. Accordingly, the issuance of the new options to replace the previously existing options exercised will not have an impact on the calculation of the pro forma diluted weighted average number of shares outstanding.
P-11
WMC RESOURCES LTD AND CONTROLLED ENTITIES
NOTES TO THE UNAUDITED PRO FORMA COMBINED FINANCIAL STATEMENTS
4. | | WMC Resources reconciliations to unaudited pro forma earnings from continuing operations and shareholders’ equity in accordance with US GAAP |
Under US GAAP, the demerger is similar to a pro-rata distribution of stock to shareholders and therefore the internal transfers of assets and liabilities made to effect the reorganization and demerger was accounted for at historical cost.
For an analysis of the US GAAP adjustments included in the historical WMC Resources financial statements, see Note 44 to the “Combined Financial Statements of WMC Resources for the Fiscal Years Ended 31 December 2001, 2000 and 1999” and Note 32 to the “Unaudited Interim Combined Financial Statements of WMC Resources for the six month periods ended 30 June 2002 and 2001 which are included in this registration statement.
Adjustments to determine unaudited pro forma earnings from continuing operations and unaudited pro forma shareholders’ equity in accordance with US GAAP arising in the pro forma financial statements are as follows:
(a) | | Property, plant and equipment and amortization and depreciation |
Under US GAAP, transfers of assets and liabilities between and among subsidiaries under common control are accounted for at book value. The reconciliations include adjustments to reverse the additional depreciation and amortization expense resulting from the increase in carrying value of property, plant and equipment recognized under A GAAP. In addition, the stamp duty of $23.7 million paid on the fair value transfer is expensed under US GAAP, as opposed to capitalized as part of the asset under A GAAP. This has not been reflected as a US GAAP adjustment to the unaudited pro forma combined statement of income as the loss is nonrecurring.
(b) | | Derivatives and Hedging |
Under US GAAP, transfers of assets and liabilities between and among subsidiaries under common control are accounted for at book value. The reconciliation to shareholders’ equity in accordance with US GAAP includes adjustments to reverse the accounting for the transfer of derivative financial instruments, including currency and commodity hedge contracts at fair value under A GAAP.
No pro forma adjustment has been made to reflect the earnings impact of recognizing hedging and financial instruments at their fair value as if the demerger had occurred on 1 January 2001. Refer discussion in note 3 (d).
Under US GAAP the estimated prepayment penalty to existing US$ bond holders of $149.1 million is included in the determination of loss on extinguishment of debt (as discussed above) and shown as a reduction to shareholders’ equity under US GAAP as opposed to A GAAP which includes the amount as a fair value adjustment. In addition, under A GAAP, the fair value of the US$ bonds have been adjusted to reflect the premium paid of $49.1 million and an adjustment of $149.1 million to account for the fair value of the bonds. This $198.2 million is therefore reversed under US GAAP.
P-12
Exhibit 1 – Constitution of WMC Resources, dated October 17, 2002
Exhibit 4 – Material contracts
| | A. | | Roxby Downs (Indenture Ratification) Act of 1982, came into operation on June 21, 1982. |
| | B. | | Form of Transitional Services Agreement between WMC Resources and Alumina Limited (formerly WMC Limited), dated on or about December 11, 2002 |
| | C. | | Form of Demerger Deed between WMC Resources and Alumina Limited (formerly WMC Limited), dated on or about December 11, 2002 |
| | D. | | Form of Subscription Agreement (Term Loan Facility) dated October 29, 2002 |
| | E. | | Form of Subscription Agreement (Syndicated Revolving Facility) dated November 14, 2002 |
Exhibit 8 – Significant Subsidiaries
Exhibit 10 – Other exhibits
Consent of PricewaterhouseCoopers, dated December 2, 2002
Grant Samuel Report, dated October 28, 2002
Pursuant to the requirements of Section 12 of the Securities Exchange Act of 1934, the Registrant certifies it meets all of the requirements for filing on Form 20-F and has duly caused this registration statement to be signed on its behalf by the undersigned, thereunto duly authorized.
| WMC RESOURCES LTD |
|
/s/ BRUCE R. BROOK
|
Name: Bruce R. Brook Title: Chief Financial Officer |
Date: December 2, 2002
-163-