Exhibit 99.1
FRIEDMAN BILLINGS RAMSEY
Friedman, Billings, Ramsey Group (“FBR Group”)
2004
This document is intended solely for the use of the party to whom FBR has provided it, and is not to be reprinted or redistributed without the permission of FBR. All references to “FBR” refer to Friedman, Billings, Ramsey Group, Inc., and its predecessors and subsidiaries as appropriate. Investment banking, sales, trading, and research services are provided by Friedman, Billings, Ramsey & Co., Inc. (FBR & Co.), except for those online offering, mutual fund distribution and discount brokerage services provided by FBR Investment Services, Inc. (FBRIS), and those services in the U.K., Europe and elsewhere outside the United States and Canada provided by Friedman, Billings, Ramsey International, Ltd. (FBRIL). FBR & Co. and FBRIS are broker-dealers registered with the SEC and are members of the NASD. FBRIL, based in the U.K, is regulated by the Financial Services Authority. Asset management services, including managed hedge funds, mutual funds, private equity and venture capital funds, are provided by FBR subsidiaries FBR Investment Management, Inc. (FBRIM), FBR Fund Advisers, Inc., and Money Management Advisers, Inc., which are investment advisers registered with the SEC. Banking services, including mutual fund custody and administration, are provided by FBR National Bank & Trust1.
On March 31, 2003, Friedman, Billings, Ramsey Group, Inc. merged with FBR Asset Investment Corporation, a real estate investment trust (“REIT”) managed by FBR prior to the merger. The merged company, Friedman, Billings, Ramsey Group, Inc. is structured as a REIT for U.S. Federal Income Tax purposes and conducts its brokerage, sales and trading, investment banking, asset management and banking business through taxable REIT subsidiaries.
This document is intended for information purposes only, and shall not constitute a solicitation or an offer to buy or sell, any security or services, or an endorsement of any particular investment strategy.
For additional important information, please visit our website, www.fbr.com.
CAUTIONS ABOUT FORWARD-LOOKING INFORMATION
This presentation and the information incorporated by reference in this presentation include forward looking statements within the meaning of Section 27A of the Securities Act of 1933, as amended, and Section 21E of the Securities Exchange Act of 1934, as amended. Some of the forward-looking statements can be identified by the use of forward-looking words such as “believes,” “expects,” “may,” “will,” “should,” “seeks,” “approximately,” “plans,” “estimates” or “anticipates” or the negative of those words or other comparable terminology. Statements concerning projections, future performance developments, events, revenues, expenses, earnings, run rates, and any other guidance on present or future periods constitute forward-looking statements. Such statements include, but are not limited to, those relating to the effects of growth, revenues and earnings, our principal investing activities, levels of assets under management and our current equity capital levels. Forward-looking statements involve risks and uncertainties. You should be aware that a number of important factors could cause our actual results to differ materially from those in the forward-looking statements. These factors include, but are not limited to, the overall environment for interest rates, repayment speeds within the mortgage backed securities market, risk associated with equity investments, the demand for public offerings, activity in the secondary securities markets, competition among financial services firms for business and personnel, the high degree of risk associated with venture capital investments, the effect of demand for public offerings, mutual fund and 401(k) pension plan inflows or outflows in the securities markets, volatility of the securities markets, available technologies, the effect of government regulation and of general economic conditions on our own business and on the business in the industry areas on which we focus, fluctuating quarterly operating results, the availability of capital to us and risks related to online commerce. We will not necessarily update the information presented or incorporated by reference in this presentation if any of these forward looking statements turn out to be inaccurate. Risks affecting our business are described throughout our Form 10-K, especially in the section entitled “Risk Factors” beginning on page 20. The entire Form 10-K, including the Consolidated Financial Statements and the notes and any other documents incorporated by reference into the Form 10-K, as well as, the Forms 10Q and 8-K filed subsequent to the forms 10K, should be read for a complete understanding of our business and the risks associated with that business.
1Member FDIC and an equal housing lender. Products offered by other FBR subsidiaries are not FDIC insured, not offered, guaranteed or endorsed by FBR National Bank & Trust, and may lose value.
FRIEDMAN BILLINGS RAMSEY
Page 2
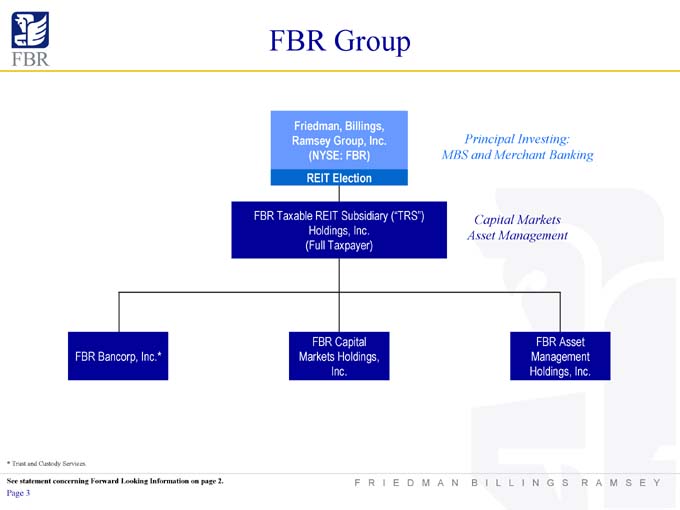
FBR Group
Friedman, Billings, Ramsey Group, Inc.
(NYSE: FBR) REIT Election
FBR Taxable REIT Subsidiary (“TRS”) Holdings, Inc.
(Full Taxpayer)
Principal Investing: MBS and Merchant Banking
Capital Markets Asset Management
FBR Bancorp, Inc.*
FBR Capital Markets Holdings, Inc.
FBR Asset Management Holdings, Inc.
* Trust and Custody Services.
See statement concerning Forward Looking Information on page 2.
FRIEDMAN BILLINGS RAMSEY
Page 3
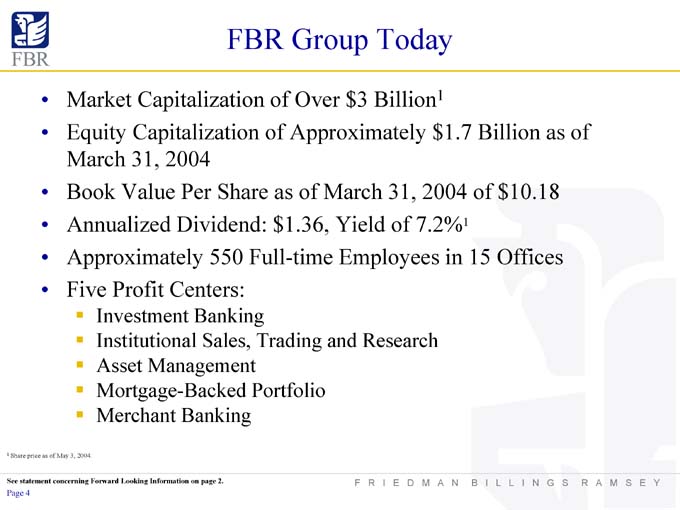
FBR Group Today
• Market Capitalization of Over $3 Billion1
• Equity Capitalization of Approximately $1.7 Billion as of March 31, 2004
• Book Value Per Share as of March 31, 2004 of $10.18
• Annualized Dividend: $1.36, Yield of 7.2%1
• Approximately 550 Full-time Employees in 15 Offices
• Five Profit Centers:
Investment Banking
Institutional Sales, Trading and Research
Asset Management
Mortgage-Backed Portfolio
Merchant Banking
1 Share price as of May 3, 2004.
See statement concerning Forward Looking Information on page 2.
FRIEDMAN BILLINGS RAMSEY
Page 4
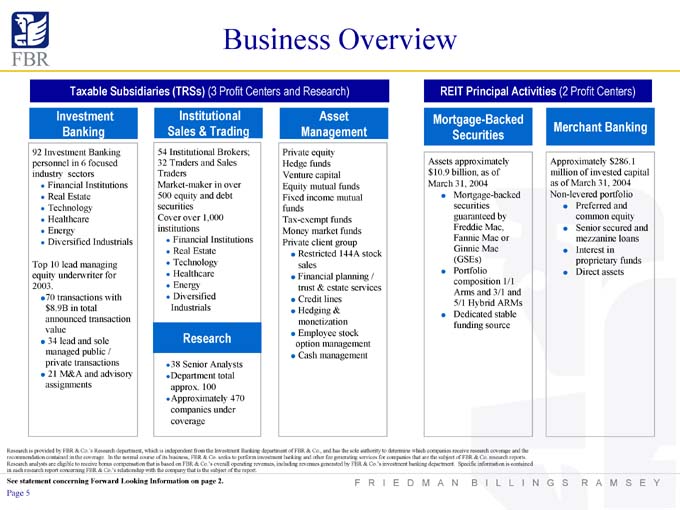
Business Overview
Taxable Subsidiaries (TRSs) (3 Profit Centers and Research)
Investment Banking
92 Investment Banking personnel in 6 focused industry sectors
Financial Institutions
Real Estate
Technology
Healthcare
Energy
Diversified Industrials
Top 10 lead managing equity underwriter for 2003.
70 transactions with $8.9B in total announced transaction value
34 lead and sole managed public / private transactions
21 M&A and advisory assignments
Institutional Sales & Trading
54 Institutional Brokers;
32 Traders and Sales Traders
Market-maker in over 500 equity and debt securities
Cover over 1,000 institutions
Financial Institutions
Real Estate
Technology
Healthcare
Energy
Diversified Industrials
Research
38 Senior Analysts
Department total approx. 100
Approximately 470 companies under coverage
Asset Management
Private equity Hedge funds Venture capital Equity mutual funds Fixed income mutual funds Tax-exempt funds Money market funds Private client group
Restricted 144A stock sales
Financial planning / trust & estate services
Credit lines
Hedging & monetization
Employee stock option management
Cash management
REIT Principal Activities (2 Profit Centers)
Mortgage-Backed Securities
Assets approximately $10.9 billion, as of March 31, 2004
Mortgage-backed securities guaranteed by Freddie Mac, Fannie Mae or Ginnie Mae (GSEs)
Portfolio composition 1/1 Arms and 3/1 and 5/1 Hybrid ARMs
Dedicated stable funding source
Merchant Banking
Approximately $286.1 million of invested capital as of March 31, 2004 Non-levered portfolio
Preferred and common equity
Senior secured and mezzanine loans
Interest in proprietary funds
Direct assets
Research is provided by FBR & Co.’s Research department, which is independent from the Investment Banking department of FBR & Co., and has the sole authority to determine which companies receive research coverage and the recommendation contained in the coverage. In the normal course of its business, FBR & Co. seeks to perform investment banking and other fee generating services for companies that are the subject of FBR & Co. research reports. Research analysts are eligible to receive bonus compensation that is based on FBR & Co.’s overall operating revenues, including revenues generated by FBR & Co.’s investment banking department. Specific information is contained in each research report concerning FBR & Co.’s relationship with the company that is the subject of the report.
See statement concerning Forward Looking Information on page 2.
FRIEDMAN BILLINGS RAMSEY
Page 5

Highlights
• Unique Capital Markets Investment and Distribution Franchise
• Only Independent Publicly Owned Broker / Dealer Formed Since 1972
• Greater than 35% Compound Annual Revenue Growth Rate Since 1992
• Strong First Quarter 2004 Performance
Raised over $4.5 Billion for Issuers
Net Income Profit Margin of 40.5%
Annualized ROE of 22.1%
• Most Efficient Platform in
Broker / Dealer Industry as Measured By Net Income and Revenue Per Employee
• Significant New Business Opportunities in Investment Banking and Asset Management
NET INCOME PER EMPLOYEE
THOUSANDS OF DOLLARS
$48.1 $25.7 $10.0 $12.9 $0.0 $188.5 $124.2 $116.2 $94.8 $80.6 $63.1 $519.7 $107.0
See statement concerning Forward Looking Information on page 2.
FRIEDMAN BILLINGS RAMSEY
Page 6
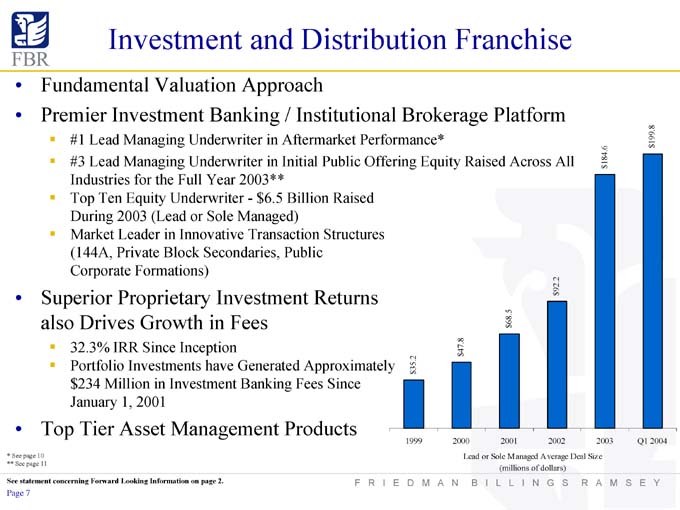
Investment and Distribution Franchise
• Fundamental Valuation Approach
• Premier Investment Banking / Institutional Brokerage Platform
#1 Lead Managing Underwriter in Aftermarket Performance*
#3 Lead Managing Underwriter in Initial Public Offering Equity Raised Across All Industries for the Full Year 2003**
Top Ten Equity Underwriter—$6.5 Billion Raised During 2003 (Lead or Sole Managed) Market Leader in Innovative Transaction Structures (144A, Private Block Secondaries, Public Corporate Formations)
• Superior Proprietary Investment Returns also Drives Growth in Fees
32.3% IRR Since Inception
Portfolio Investments have Generated Approximately $234 Million in Investment Banking Fees Since January 1, 2001
• Top Tier Asset Management Products
Lead or Sole Managed Average Deal Size (millions of dollars)
See page 10
** See page 11
See statement concerning Forward Looking Information on page 2.
FRIEDMAN BILLINGS RAMSEY
Page 7
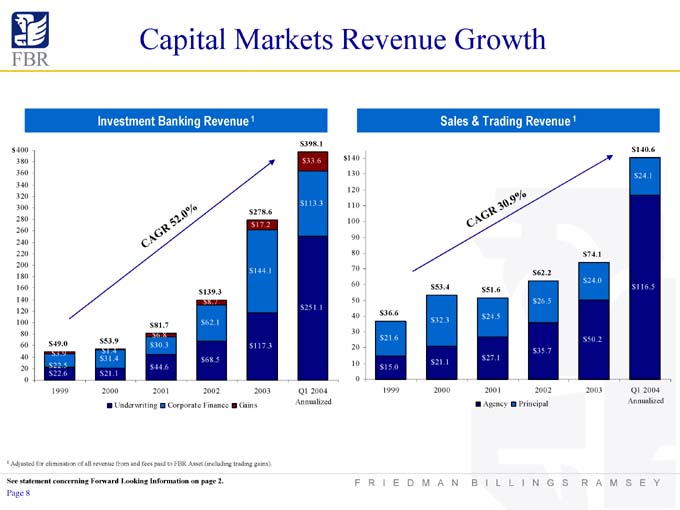
Capital Markets Revenue Growth
Investment Banking Revenue 1
$49.0 $3.9 $22.5 $22.6 1999
$53.9 $1.4 $31.4 $21.1 2000
$81.7 $6.8 $30.3 $44.6 2001
$139.3 $8.7 $62.1 $68.5 2002
$278.6 $17.2 $144.1 $117.3 2003
$398.1 $33.6 $113.3 $251.1 Q1 2004 Annualized
Underwriting Corporate Finance Gains
Sales & Trading Revenue 1
$36.6 $21.6 $15.0 1999
$53.4 $32.3 $21.1 2000
$51.6 $24.5 $27.1 2001
$62.2 $26.5 $35.7 2002
$74.1 $24.0 $50.2 2003
$140.6 $24.1 $116.5 Q1 2004 Annualized
Agency Principal
1 Adjusted for elimination of all revenue from and fees paid to FBR Asset (including trading gains).
See statement concerning Forward Looking Information on page 2.
Page 8
FRIEDMAN BILLINGS RAMSEY
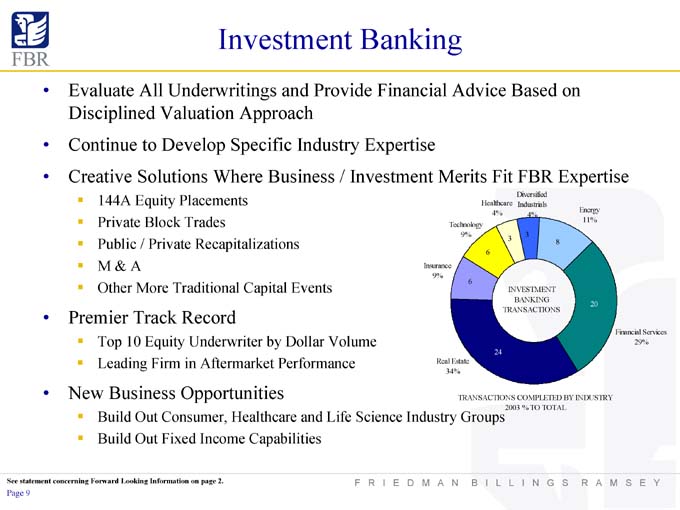
Investment Banking
• Evaluate All Underwritings and Provide Financial Advice Based on Disciplined Valuation Approach
• Continue to Develop Specific Industry Expertise
• Creative Solutions Where Business / Investment Merits Fit FBR Expertise
144A Equity Placements
Private Block Trades
Public / Private Recapitalizations
M & A
Other More Traditional Capital Events
• Premier Track Record
Top 10 Equity Underwriter by Dollar Volume
Leading Firm in Aftermarket Performance
• New Business Opportunities
Build Out Consumer, Healthcare and Life Science Industry Groups
Build Out Fixed Income Capabilities
Diversified Industrials 4%
Healthcare 4%
Energy 11%
Technology 9%
Insurance 9%
Financial Services 29%
Real Estate 34%
INVESTMENT BANKING TRANSACTIONS
TRANSACTIONS COMPLETED BY INDUSTRY
2003 % TO TOTAL
See statement concerning Forward Looking Information on page 2.
FRIEDMAN BILLINGS RAMSEY
Page 9
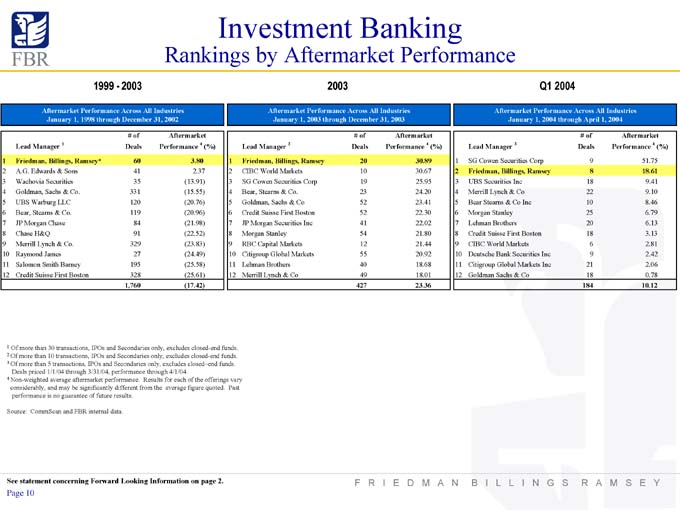
Investment Banking
Rankings by Aftermarket Performance
1999 - 2003
Aftermarket Performance Across All Industries
January 1, 1998 through December 31, 2002
# of Aftermarket
Lead Manager 1 Deals Performance 4 (%)
1 Friedman, Billings, Ramsey* 60 3.80
2 A.G. Edwards & Sons 41 2.37
3 Wachovia Securities 35 (13.91)
4 Goldman, Sachs & Co. 331 (15.55)
5 UBS Warburg LLC 120 (20.76)
6 Bear, Stearns & Co. 119 (20.96)
7 JP Morgan Chase 84 (21.98)
8 Chase H&Q 91 (22.52)
9 Merrill Lynch & Co. 329 (23.83)
10 Raymond James 27 (24.49)
11 Salomon Smith Barney 195 (25.58)
12 Credit Suisse First Boston 328 (25.61)
1,760 (17.42)
2003
Aftermarket Performance Across All Industries
January 1, 2003 through December 31, 2003
# of Aftermarket
Lead Manager 2 Deals Performance 4 (%)
1 Friedman, Billings, Ramsey 20 30.89
2 CIBC World Markets 10 30.67
3 SG Cowen Securities Corp 19 25.95
4 Bear, Stearns & Co. 23 24.20
5 Goldman, Sachs & Co 52 23.41
6 Credit Suisse First Boston 52 22.30
7 JP Morgan Securities Inc 41 22.02
8 Morgan Stanley 54 21.80
9 RBC Capital Markets 12 21.44
10 Citigroup Global Markets 55 20.92
11 Lehman Brothers 40 18.68
12 Merrill Lynch & Co 49 18.01
427 23.36
Q1 2004
Aftermarket Performance Across All Industries
January 1, 2004 through April 1, 2004
# of Aftermarket
Lead Manager 3 Deals Performance 4 (%)
1 SG Cowen Securities Corp 9 51.75
2 Friedman, Billings, Ramsey 8 18.61
3 UBS Securities Inc 18 9.41
4 Merrill Lynch & Co 22 9.10
5 Bear Stearns & Co Inc 10 8.46
6 Morgan Stanley 25 6.79
7 Lehman Brothers 20 6.13
8 Credit Suisse First Boston 18 3.13
9 CIBC World Markets 6 2.81
10 Deutsche Bank Securities Inc 9 2.42
11 Citigroup Global Markets Inc 21 2.06
12 Goldman Sachs & Co 18 0.78
1 Of more than 30 transactions, IPOs and Secondaries only, excludes closed-end funds.
2 Of more than 10 transactions, IPOs and Secondaries only, excludes closed-end funds.
3 Of more than 5 transactions, IPOs and Secondaries only, excludes closed–end funds. Deals priced 1/1/04 through 3/31/04, performance through 4/1/04.
4 Non-weighted average aftermarket performance. Results for each of the offerings vary considerably, and may be significantly different from the average figure quoted. Past performance is no guarantee of future results.
Source: CommScan and FBR internal data.
See statement concerning Forward Looking Information on page 2.
FRIEDMAN BILLINGS RAMSEY
Page 10
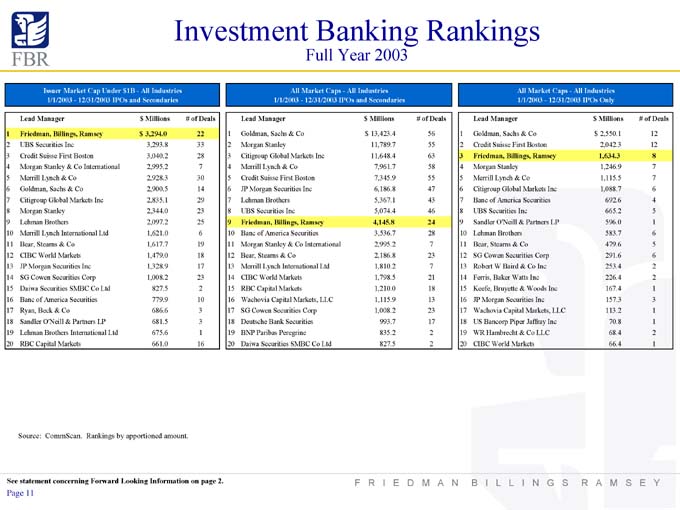
Investment Banking Rankings
Full Year 2003
Issuer Market Cap Under $1B—All Industries
1/1/2003—12/31/2003 IPOs and Secondaries
Lead Manager $ Millions # of Deals
1 Friedman, Billings, Ramsey $ 3,294.0 22
2 UBS Securities Inc 3,293.8 33
3 Credit Suisse First Boston 3,040.2 28
4 Morgan Stanley & Co International 2,995.2 7
5 Merrill Lynch & Co 2,928.3 30
6 Goldman, Sachs & Co 2,900.5 14
7 Citigroup Global Markets Inc 2,835.1 29
8 Morgan Stanley 2,344.0 23
9 Lehman Brothers 2,097.2 25
10 Merrill Lynch International Ltd 1,621.0 6
11 Bear, Stearns & Co 1,617.7 19
12 CIBC World Markets 1,479.0 18
13 JP Morgan Securities Inc 1,328.9 17
14 SG Cowen Securities Corp 1,008.2 23
15 Daiwa Securities SMBC Co Ltd 827.5 2
16 Banc of America Securities 779.9 10
17 Ryan, Beck & Co 686.6 3
18 Sandler O’Neill & Partners LP 681.5 3
19 Lehman Brothers International Ltd 675.6 1
20 RBC Capital Markets 661.0 16
All Market Caps—All Industries
1/1/2003—12/31/2003 IPOs and Secondaries
Lead Manager $ Millions # of Deals
1 Goldman, Sachs & Co $ 13,423.4 56
2 Morgan Stanley 11,789.7 55
3 Citigroup Global Markets Inc 11,648.4 63
4 Merrill Lynch & Co 7,961.7 58
5 Credit Suisse First Boston 7,345.9 55
6 JP Morgan Securities Inc 6,186.8 47
7 Lehman Brothers 5,367.1 43
8 UBS Securities Inc 5,074.4 46
9 Friedman, Billings, Ramsey 4,145.8 24
10 Banc of America Securities 3,536.7 28
11 Morgan Stanley & Co International 2,995.2 7
12 Bear, Stearns & Co 2,186.8 23
13 Merrill Lynch International Ltd 1,810.2 7
14 CIBC World Markets 1,798.5 21
15 RBC Capital Markets 1,210.0 18
16 Wachovia Capital Markets, LLC 1,115.9 13
17 SG Cowen Securities Corp 1,008.2 23
18 Deutsche Bank Securities 993.7 17
19 BNP Paribas Peregrine 835.2 2
20 Daiwa Securities SMBC Co Ltd 827.5 2
All Market Caps—All Industries
1/1/2003—12/31/2003 IPOs Only
Lead Manager $ Millions # of Deals
1 Goldman, Sachs & Co $ 2,550.1 12
2 Credit Suisse First Boston 2,042.3 12
3 Friedman, Billings, Ramsey 1,634.3 8
4 Morgan Stanley 1,246.9 7
5 Merrill Lynch & Co 1,115.5 7
6 Citigroup Global Markets Inc 1,088.7 6
7 Banc of America Securities 692.6 4
8 UBS Securities Inc 665.2 5
9 Sandler O’Neill & Partners LP 596.0 1
10 Lehman Brothers 583.7 6
11 Bear, Stearns & Co 479.6 5
12 SG Cowen Securities Corp 291.6 6
13 Robert W Baird & Co Inc 253.4 2
14 Ferris, Baker Watts Inc 226.4 2
15 Keefe, Bruyette & Woods Inc 167.4 1
16 JP Morgan Securities Inc 157.3 3
17 Wachovia Capital Markets, LLC 113.2 1
18 US Bancorp Piper Jaffray Inc 70.8 1
19 WR Hambrecht & Co LLC 68.4 2
20 CIBC World Markets 66.4 1
Source: CommScan. Rankings by apportioned amount.
See statement concerning Forward Looking Information on page 2.
FRIEDMAN BILLINGS RAMSEY
Page 11
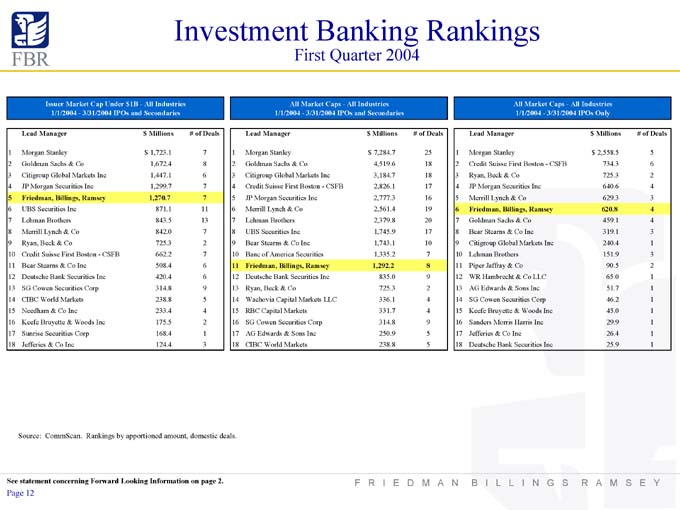
Investment Banking Rankings
First Quarter 2004
Issuer Market Cap Under $1B—All Industries
1/1/2004—3/31/2004 IPOs and Secondaries
Lead Manager $ Millions # of Deals
1 Morgan Stanley $ 1,723.1 7
2 Goldman Sachs & Co 1,672.4 8
3 Citigroup Global Markets Inc 1,447.1 6
4 JP Morgan Securities Inc 1,299.7 7
5 Friedman, Billings, Ramsey 1,270.7 7
6 UBS Securities Inc 871.1 11
7 Lehman Brothers 843.5 13
8 Merrill Lynch & Co 842.0 7
9 Ryan, Beck & Co 725.3 2
10 Credit Suisse First Boston—CSFB 662.2 7
11 Bear Stearns & Co Inc 508.4 6
12 Deutsche Bank Securities Inc 420.4 6
13 SG Cowen Securities Corp 314.8 9
14 CIBC World Markets 238.8 5
15 Needham & Co Inc 233.4 4
16 Keefe Bruyette & Woods Inc 175.5 2
17 Sunrise Securities Corp 168.4 1
18 Jefferies & Co Inc 124.4 3
All Market Caps—All Industries
1/1/2004—3/31/2004 IPOs and Secondaries
Lead Manager $ Millions # of Deals
1 Morgan Stanley $ 7,284.7 25
2 Goldman Sachs & Co 4,519.6 18
3 Citigroup Global Markets Inc 3,184.7 18
4 Credit Suisse First Boston—CSFB 2,826.1 17
5 JP Morgan Securities Inc 2,777.3 16
6 Merrill Lynch & Co 2,561.4 19
7 Lehman Brothers 2,379.8 20
8 UBS Securities Inc 1,745.9 17
9 Bear Stearns & Co Inc 1,743.1 10
10 Banc of America Securities 1,335.2 7
11 Friedman, Billings, Ramsey 1,292.2 8
12 Deutsche Bank Securities Inc 835.0 9
13 Ryan, Beck & Co 725.3 2
14 Wachovia Capital Markets LLC 336.1 4
15 RBC Capital Markets 331.7 4
16 SG Cowen Securities Corp 314.8 9
17 AG Edwards & Sons Inc 250.9 5
18 CIBC World Markets 238.8 5
All Market Caps—All Industries
1/1/2004—3/31/2004 IPOs Only
Lead Manager $ Millions # of Deals
1 Morgan Stanley $ 2,558.5 5
2 Credit Suisse First Boston—CSFB 734.3 6
3 Ryan, Beck & Co 725.3 2
4 JP Morgan Securities Inc 640.6 4
5 Merrill Lynch & Co 629.3 3
6 Friedman, Billings, Ramsey 620.8 4
7 Goldman Sachs & Co 459.1 4
8 Bear Stearns & Co Inc 319.1 3
9 Citigroup Global Markets Inc 240.4 1
10 Lehman Brothers 151.9 3
11 Piper Jaffray & Co 90.5 2
12 WR Hambrecht & Co LLC 65.0 1
13 AG Edwards & Sons Inc 51.7 1
14 SG Cowen Securities Corp 46.2 1
15 Keefe Bruyette & Woods Inc 45.0 1
16 Sanders Morris Harris Inc 29.9 1
17 Jefferies & Co Inc 26.4 1
18 Deutsche Bank Securities Inc 25.9 1
Source: CommScan. Rankings by apportioned amount, domestic deals.
See statement concerning Forward Looking Information on page 2.
FRIEDMAN BILLINGS RAMSEY
Page 12
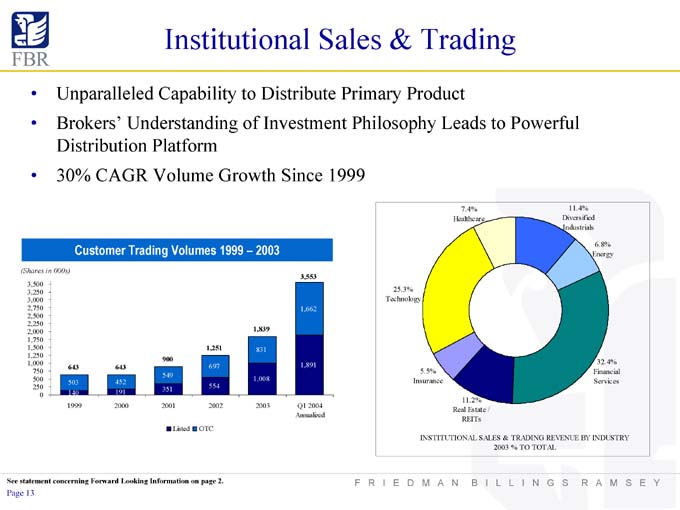
Institutional Sales & Trading
• Unparalleled Capability to Distribute Primary Product
• Brokers’ Understanding of Investment Philosophy Leads to Powerful Distribution Platform
• 30% CAGR Volume Growth Since 1999
Customer Trading Volumes 1999 – 2003
643 503 140 1999
643 452 191 2000
900 549 351 2001
1,251 697 554 2002
1,839 831 1,008 2003
3,553 1,662 1,891 Q1 2004 Annualized Listed OTC
7.4% Healthcare
11.4% Diversified Industrials
6.8% Energy
25.3% Technology
32.4% Financial Services
5.5% Insurance
11.2% Real Estate / REITs
INSTITUTIONAL SALES & TRADING REVENUE BY INDUSTRY
2003 % TO TOTAL
See statement concerning Forward Looking Information on page 2.
FRIEDMAN BILLINGS RAMSEY
Page 13
Research
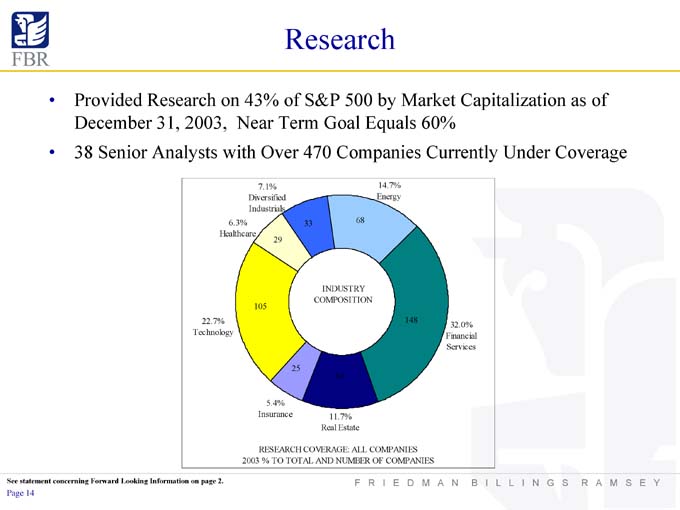
• Provided Research on 43% of S&P 500 by Market Capitalization as of December 31, 2003, Near Term Goal Equals 60%
• 38 Senior Analysts with Over 470 Companies Currently Under Coverage
INDUSTRY COMPOSITION
7.1% Diversified Industrials
14.7% Energy
6.3% Healthcare
22.7% Technology
32.0% Financial Services
5.4% Insurance
11.7% Real Estate
RESEARCH COVERAGE: ALL COMPANIES 2003 % TO TOTAL AND NUMBER OF COMPANIES
See statement concerning Forward Looking Information on page 2
FRIEDMAN BILLINGS RAMSEY
Page 14
Principal Investing
Mortgage-Backed Securities
• Approximately $10.9 Billion as of March 31, 2004
• Mortgage-Backed Securities Guaranteed by Freddie Mac, Fannie Mae, Ginnie Mae (All Adjustable Rate Securities)
• Low Duration of Approximately 1 – Limits Price Risk
• Leverage Guideline – 6x to 11x Debt to Equity, 9.5x Long-term Target
• Allocation of FBR Equity Capital: 50%—90% (Long-term Average Target 60%—65%)
• Established A1+/P1 Commercial Paper Diversified Funding Source
• Consistent Prepayments Allow for Continuous Reinvestment
• Long-term Average ROE of Approximately 24% (2.2% X 9.5x Leverage + 3.5% Asset Yield)
See statement concerning Forward Looking Information on page 2.
FRIEDMAN BILLINGS RAMSEY
Page 15
Principal Investing
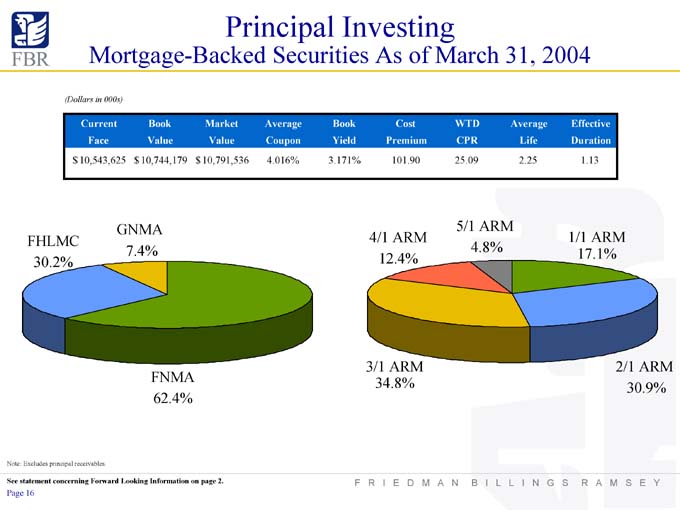
Mortgage-Backed Securities As of March 31, 2004
(Dollars in 000s)
Current Book Market Average Book Cost WTD Average Effective
Face Value Value Coupon Yield Premium CPR Life Duration
$10,543,625 $ 10,744,179 $10,791,536 4.016% 3.171% 101.90 25.09 2.25 1.13
GNMA 7.4%
FHLMC 30.2%
FNMA 62.4%
5/1 ARM 4.8%
4/1 ARM 12.4%
1/1 ARM 17.1%
3/1 ARM 34.8%
2/1 ARM 30.9%
Note: Excludes principal receivables.
See statement concerning Forward Looking Information on page 2.
FRIEDMAN BILLINGS RAMSEY
Page 16
Principal Investing
Merchant Banking
• All Investment Decisions Driven by Fundamental Valuation Approach
• Proprietary Deal Flow Through FBR & Co., Inc.
• Independent Due Diligence and Investment Committee Process
• Deep Industry Knowledge Allows for Expedited Execution and Innovative Structures Enhance Potential for Premium Returns
• Expert Analysis Improves Accuracy of our Predicted Liquidity Outcomes
• Non-levered Portfolio
• 10%—30% FBR Equity Allocation
• IRR of 32.3% from Inception to March 31, 2004
See statement concerning Forward Looking Information on page 2.
FRIEDMAN BILLINGS RAMSEY
Page 17
Access to Capital Drives Investment Banking Growth
Period of Investment Total Banking
Investment Amount Fees Earned
Fieldstone Mortgage Company Nov-03 $ 50,000,000 $ 42,000,000
Americredit Sep-02 40,329,295 26,462,476
American Financial Sep-02 40,000,001 1 43,883,007
Quanta Aug-03 25,000,000 35,090,698
Southwest Royalties Apr-02 18,333,333 2 1,714,662
Medical Properties Trust Mar-04 15,000,000 16,660,000
Oxford Mar-02 14,650,000 3 2,889,359
MCG Capital Nov-01 9,934,375 13,776,396
Saxon Jul-01 9,300,000 15,058,315
Annaly Jan-01 7,144,000 8,274,551
Accredited Home Lenders Feb-03 6,789,586 4,163,044
Equity Inns Jul-03 5,750,000 1,191,423
Franklin Oct-02 5,580,000 4,369,198
CMET Finance Holdings Dec-03 4,650,000 6,650,000
Anworth Dec-01 3,890,650 11,568,421
Atlas Pipeline Sep-03 - 4 375,000
Quaker Nov-02 - 5 113,789
$ 256,351,240 $234,240,339
1 Includes $5 million note which has been repaid and $35,000,001 equity investment.
2 Represents a loan commitment of up to $25,000,000, of which $18,333,333 was funded and has been repaid.
3 Includes $10 million note which has been repaid and $4,650,000 equity investment.
4 Represents a loan commitment of up to $25,000,000. None of this commitment has been funded to date. 5 Break-up fee.
See statement concerning Forward Looking Information on page 2.
FRIEDMAN BILLINGS RAMSEY
Page 18
Asset Management
• Broad Spectrum of Products – Mutual Funds / Alternative Asset Investments
• Mutual Funds
Financial Services
• FBR Small Cap Financial Fund
• FBR Financial Services Fund
Small Cap Stocks
• Small Cap Value Fund
Energy and Utilities
• American Gas Index
• Outstanding Alternative Asset
Investment Vehicles, Including
Hedge Funds
• Private Client Group Provides
Customized Wealth Management
Solutions to Individuals, Families
and Foundations Controlling
Significant Assets
Net Assets Under Management 1 (Millions)
$589 $635 $1,314 $1,534 $2,061 $2,374
12/31/99 12/31/00 12/31/01 12/31/02 12/31/03 3/31/04
1 Net assets under management represents total gross assets under management, net of any repo debt, margin loans, securities sold but not yet purchased, lines of credit, and any other liabilities. Excludes FBR Asset.
See statement concerning Forward Looking Information on page 2.
FRIEDMAN BILLINGS RAMSEY
Page 19
Selected Comparables
LTM Net Total
LTM Net Price/ Price / Indicated Closing
Fiscal Year LTM Period Equity LTM LTM Revenue Compensation/ Assets /
Broker / Dealer Income Per ROE Tangible LTM Dividend Price
End End Capital Net Income Net Revenue Per Net Revenue Tangible
Employee Book1 Diluted EPS Yield 5/3/04
Employee Equity
A. G. Edwards Inc. 29-Feb 29-Feb-04 $ 1,778,677 $ 159,485 $ 10 $ 2,496,355 $ 157 66.1% 2.49x 9.2% 1.66x 18.69x 1.7% $ 36.65
Bear Stearns 30-Nov 29-Feb-04 7,818,777 1,212,416 116 6,204,980 595 47.9% 30.38x 18.5% 1.98x 9.71x 1.0% 80.01
Goldman Sachs 30-Nov 27-Feb-04 22,235,000 3,636,000 189 17,753,000 921 46.5% 25.64x 23.6% 2.71x 13.78x 1.0% 96.92
Jefferies Group2 31-Dec 26-Mar-04 838,371 101,775 63 943,872 586 57.0% 14.90x 17.4% 2.68x 21.57x 0.9% 34.80
Legg Mason, Inc.3 31-Mar 31-Dec-03 1,485,751 254,505 48 1,785,825 338 56.8% 6.67x 20.1% 5.86x 25.83x 0.7% 90.28
Lehman Brothers 30-Nov 29-Feb-04 12,601,000 2,012,000 124 10,080,000 622 49.7% 36.33x 24.8% 2.26x 10.76x 0.7% 73.45
Merrill Lynch 31-Dec 26-Mar-04 27,226,000 4,559,000 95 21,440,000 446 46.9% 22.06x 20.0% 2.37x 12.26x 1.2% 54.82
Morgan Stanley 30-Nov 29-Feb-04 28,961,000 4,108,000 81 21,624,000 424 40.3% 23.96x 18.4% 2.06x 13.86x 1.9% 51.47
Raymond James Financial5 30-Sep 26-Mar-04 956,067 123,993 26 1,675,181 347 71.2% 7.74x 14.3% 2.09x 15.28x 1.4% 25.47
Stifel Financial Corp.6 31-Dec 31-Dec-03 100,045 15,007 13 216,512 187 65.1% 4.26x 16.7% 1.71x 12.28x 0.0% 22.40
SWS Group 30-Jun 26-Mar-04 254,551 7 0 351,431 373 42.8% 20.22x 3.7% 1.10x N/A 2.5% 15.86
Average Broker / Dealer $ 69 $ 454 53.7% 17.70x 17.0% 2.41x 15.40x 1.2%
FBR 31-Dec 31-Mar-04 $ 1,685,673 $ 285,330 $ 520 $732,928 $ 1,335 37.7% 7.48x 22.1% 1.98x 11.05x 7.2% $ 18.84
1 Market data as of 05/3/04.
2 No balance sheet figures provided in press release dated April 13, 2004, all balance sheet information is as of December 31, 2003.
3 Will announce operating results for fiscal 2004 fourth quarter and year ended March 31, 2004 on May 5, 2004.
4 No balance sheet figures provided in press release dated April 13, 2004, all balance sheet information is as of December 31, 2003.
5 Basic Shares Outstanding calculated pro forma to reflect March 2004 3-for-2 stock split.
6 Will announce operating results for 2004 first quarter ended March 31, 2004 on May 5, 2004.
See statement concerning Forward Looking Information on page 2.
FRIEDMAN BILLINGS RAMSEY
Page 20
Conclusion
• Unique Capital Markets Investment and Distribution Franchise
• Strong First Quarter 2004 Performance
Raised over $4.5 Billion for Issuers
Net Income Profit Margin of 40.5%
Annualized ROE of 22.1%
• Consistent Superior Risk Adjusted Returns on Invested Capital
• Leading Investment Banking Platform
#1 Lead Managing Underwriter in After-Market Performance Across All Industries*
#3 Lead Managing Underwriter in Initial Public Offering Equity Raised Across All Industries for Full Year 2003**
Top Ten Equity Underwriter—$6.5 Billion Raised During 2003
• Most Efficient Platform In Broker/Dealer Industry as Measured by Revenue and Net Income per Head
• Opportunities for Additional Growth
* See page 10 ** See page 11
See statement concerning Forward Looking Information on page 2.
FRIEDMAN BILLINGS RAMSEY
Page 21
F R I E D M A N B I L L I N G S R A M S E Y
APPENDIX
2004
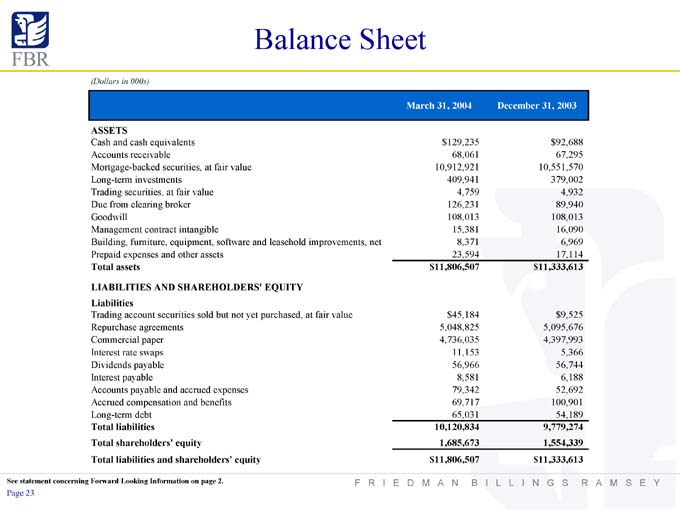
Balance Sheet
(Dollars in 000s)
March 31, 2004 December 31, 2003
ASSETS
Cash and cash equivalents $ 129,235 $ 92,688
Accounts receivable 68,061 67,295
Mortgage-backed securities, at fair value 10,912,921 10,551,570
Long-term investments 409,941 379,002
Trading securities, at fair value 4,759 4,932
Due from clearing broker 126,231 89,940
Goodwill 108,013 108,013
Management contract intangible 15,381 16,090
Building, furniture, equipment, software and leasehold improvements, net 8,371 6,969
Prepaid expenses and other assets 23,594 17,114
Total assets $ 11,806,507 $ 11,333,613
LIABILITIES AND SHAREHOLDERS’ EQUITY
Liabilities
Trading account securities sold but not yet purchased, at fair value $ 45,184 $9,525
Repurchase agreements 5,048,825 5,095,676
Commercial paper 4,736,035 4,397,993
Interest rate swaps 11,153 5,366
Dividends payable 56,966 56,744
Interest payable 8,581 6,188
Accounts payable and accrued expenses 79,342 52,692
Accrued compensation and benefits 69,717 100,901
Long-term debt 65,031 54,189
Total liabilities 10,120,834 9,779,274
Total shareholders’ equity 1,685,673 1,554,339
Total liabilities and shareholders’ equity $ 11,806,507 $ 11,333,613
See statement concerning Forward Looking Information on page 2.
FRIEDMAN BILLINGS RAMSEY
Page 23
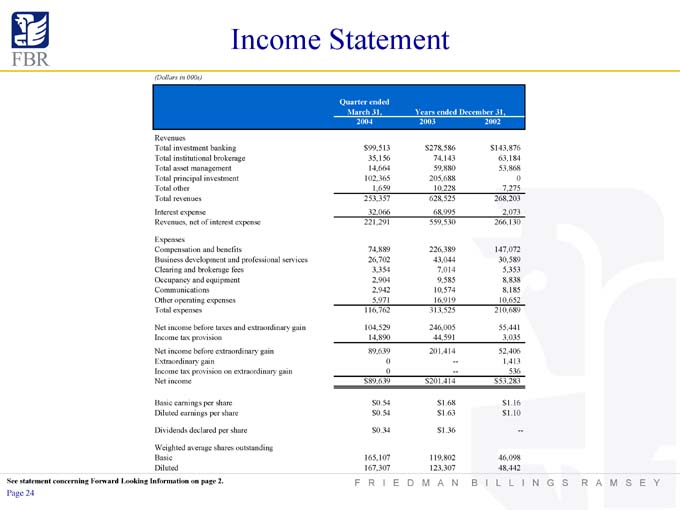
Income Statement
(Dollars in 000s)
Quarter ended
March 31, Years ended December 31,
2004 2003 2002
Revenues
Total investment banking $ 99,513 $ 278,586 $ 143,876
Total institutional brokerage 35,156 74,143 63,184
Total asset management 14,664 59,880 53,868
Total principal investment 102,365 205,688 0
Total other 1,659 10,228 7,275
Total revenues 253,357 628,525 268,203
Interest expense 32,066 68,995 2,073
Revenues, net of interest expense 221,291 559,530 266,130
Expenses
Compensation and benefits 74,889 226,389 147,072
Business development and professional services 26,702 43,044 30,589
Clearing and brokerage fees 3,354 7,014 5,353
Occupancy and equipment 2,904 9,585 8,838
Communications 2,942 10,574 8,185
Other operating expenses 5,971 16,919 10,652
Total expenses 116,762 313,525 210,689
Net income before taxes and extraordinary gain 104,529 246,005 55,441
Income tax provision 14,890 44,591 3,035
Net income before extraordinary gain 89,639 201,414 52,406
Extraordinary gain 0 — 1,413
Income tax provision on extraordinary gain 0 — 536
Net income $ 89,639 $ 201,414 $ 53,283
Basic earnings per share $ 0.54 $ 1.68 $ 1.16
Diluted earnings per share $ 0.54 $ 1.63 $ 1.10
Dividends declared per share $ 0.34 $ 1.36 —
Weighted average shares outstanding
Basic 165,107 119,802 46,098
Diluted 167,307 123,307 48,442
See statement concerning Forward Looking Information on page 2.
FRIEDMAN BILLINGS RAMSEY
Page 24
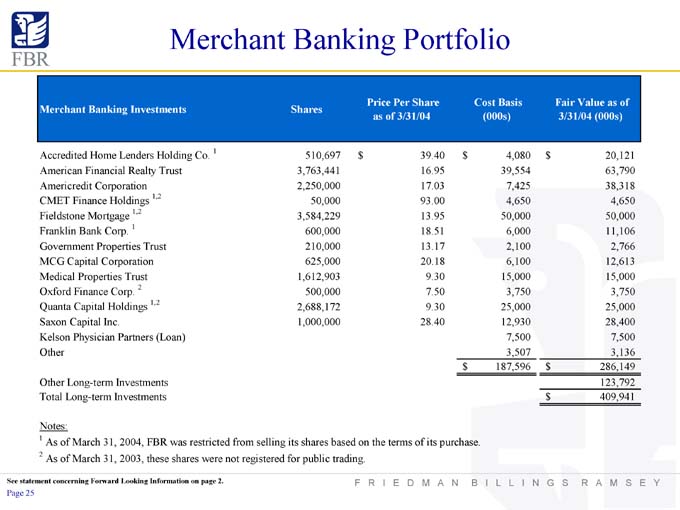
Merchant Banking Portfolio
Price Per Share Cost Basis Fair Value as of
Merchant Banking Investments Shares
as of 3/31/04 (000s) 3/31/04 (000s)
Accredited Home Lenders Holding Co. 1 510,697 $ 39.40 $ 4,080 $ 20,121
American Financial Realty Trust 3,763,441 16.95 39,554 63,790
Americredit Corporation 2,250,000 17.03 7,425 38,318
CMET Finance Holdings 1,2 50,000 93.00 4,650 4,650
Fieldstone Mortgage 1,2 3,584,229 13.95 50,000 50,000
Franklin Bank Corp. 1 600,000 18.51 6,000 11,106
Government Properties Trust 210,000 13.17 2,100 2,766
MCG Capital Corporation 625,000 20.18 6,100 12,613
Medical Properties Trust 1,612,903 9.30 15,000 15,000
Oxford Finance Corp. 2 500,000 7.50 3,750 3,750
Quanta Capital Holdings 1,2 2,688,172 9.30 25,000 25,000
Saxon Capital Inc. 1,000,000 28.40 12,930 28,400
Kelson Physician Partners (Loan) 7,500 7,500
Other 3,507 3,136
$ 187,596 $ 286,149
Other Long-term Investments 123,792
Total Long-term Investments $ 409,941
Notes:
1 As of March 31, 2004, FBR was restricted from selling its shares based on the terms of its purchase.
2 As of March 31, 2003, these shares were not registered for public trading.
See statement concerning Forward Looking Information on page 2.
FRIEDMAN BILLINGS RAMSEY
Page 25
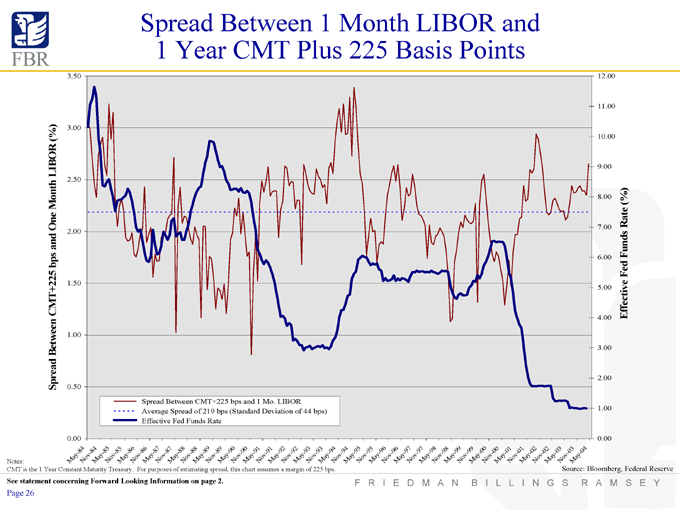
Spread Between 1 Month LIBOR and 1 Year CMT Plus 225 Basis Points
Spread Between CMT+225 bps and 1 Mo. LIBOR Average Spread of 219 bps (Standard Deviation of 44 bps) Effective Fed Funds Rate
Notes:
CMT is the 1 Year Constant Maturity Treasury. For purposes of estimating spread, this chart assumes a margin of 225 bps.See statement concerning Forward Looking Information on page 2.
Source: Bloomberg, Federal Reserve
Page 26