UNITED STATES
SECURITIES AND EXCHANGE COMMISSION
Washington, D.C. 20549
FORM N-CSR
CERTIFIED SHAREHOLDER REPORT OF REGISTERED
MANAGEMENT INVESTMENT COMPANIES
Investment Company Act file number | 811-21265 | ||||||||
| |||||||||
PowerShares Exchange-Traded Fund Trust | |||||||||
(Exact name of registrant as specified in charter) | |||||||||
| |||||||||
301 W. Roosevelt Road |
|
| |||||||
(Address of principal executive offices) |
| (Zip code) | |||||||
| |||||||||
H. Bruce Bond | |||||||||
(Name and address of agent for service) | |||||||||
| |||||||||
Registrant’s telephone number, including area code: | 800-983-0903 |
| |||||||
| |||||||||
Date of fiscal year end: | April 30 |
| |||||||
| |||||||||
Date of reporting period: | April 30, 2007 |
| |||||||
Item 1. Reports to Stockholders.
The Registrant’s annual report transmitted to shareholders pursuant to Rule 30e-1 under the Investment Company Act of 1940 is as follows:
2007 Annual Report to Shareholders
30 April 2007

PowerShares Dynamic Market Portfolio
PowerShares Dynamic OTC Portfolio
PowerShares Dynamic MagniQuant Portfolio
PowerShares FTSE RAFI US 1000 Portfolio

Table of Contents
| Shareholder Letter | 2 | ||||||
| The Market Environment | 3 | ||||||
| Manager's Analysis | 4 | ||||||
| Funds' Distribution History | 12 | ||||||
| Frequency Distribution of Discounts & Premiums | 14 | ||||||
| Fees and Expenses | 16 | ||||||
| Broad Market Portfolios | |||||||
| Schedules of Investments | |||||||
| PowerShares Dynamic Market Portfolio | 17 | ||||||
| PowerShares Dynamic OTC Portfolio | 19 | ||||||
| PowerShares Dynamic MagniQuant Portfolio | 21 | ||||||
| PowerShares FTSE RAFI US 1000 Portfolio | 24 | ||||||
| Statements of Assets and Liabilities | 36 | ||||||
| Statements of Operations | 37 | ||||||
| Statements of Changes in Net Assets | 38 | ||||||
| Financial Highlights | 40 | ||||||
| Notes to Financial Statements | 42 | ||||||
| Report of Independent Registered Public Accounting Firm | 50 | ||||||
| Supplemental Information (Unaudited) | 51 | ||||||
| Information about Advisory Agreement (Unaudited) | 56 | ||||||

My Fellow Investors,
It gives me great pleasure to report on the state of your investment(s) in PowerShares Exchange-Traded Funds and to thank you for your continued confidence in PowerShares Capital Management LLC.
Let me share with you the exciting events that have taken place at PowerShares as I look back over the past 12 months and at what the future may hold.
PowerShares has experienced significant growth over the past 12 months. We now have 70 exchange-traded funds ("ETFs") in the market, an increase of 33 funds from the 37 funds at the beginning of the fiscal year. PowerShares now offers more U.S. based equity ETFs than any other ETF sponsor. Assets under management increased almost 75%, from $6 billion to over $10 billion at April 30, 2007. This phenomenal growth demonstrates the continued strong demand for our original listings as well as the excellent reception of our new funds.
Of the new funds offered, 10 were FTSE RAFI funds, which were the first PowerShares Exchange-Traded Funds to be listed on the NASDAQ stock exchange, making PowerShares the only ETF sponsor to list ETFs on all three major U.S. exchanges: the American Stock Exchange, the NASDAQ, and the New York Stock Exchange.
PowerShares continues to be recognized as an innovator in the ETF marketplace. In 2007, our FTSE RAFI US 1000 Fund was awarded the most innovative new ETF at the Third Annual Global ETF Awards program.
Drawing on our increased resources as a member of the INVESCO family, we plan to introduce several PowerShares ETFs for international and global investing. These new funds will help to fulfill our goal of providing investor with the opportunity to invest in intelligent ETFs in marketplaces around the globe.
On behalf of PowerShares Capital Management LLC and the Board of Trustees for the PowerShares Exchanged-Traded Fund Trust, I want to thank you for your participation in the PowerShares family of exchange-traded funds. We look forward to serving you in the future.
Highest Regards,

H. Bruce Bond
President and Chairman of the Board of Trustees
PowerShares Exchange-Traded Fund Trust
2
The Market Environment
Although spikes of volatility marked the beginning and end of the reporting period, the U.S. equity marketplace provided strong results, with the S&P 500® Index posting double digit returns of 15.24%. At the beginning of the reporting period, enthusiasm over economic expansion gave way to uncertainty over interest rates and concern that corporate profits would be difficult to sustain. But by the end of summer 2006, energy prices had cooled and investors surmised the Fed's actions had contained inflation without significant damage to ongoing corporate earnings.
Stocks resumed their upward path until late February of 2007, when Chinese regulators threatened to clamp down on local trading practices, causing global markets to retreat sharply. Global concerns, coupled with a slowing housing market domestically and the Fed's insistence that inflation posed a greater risk than a recession, amplified volatility. However, a strong job market, sustained earnings and indications that inflation would remain contained were enough to resume the rally by the end of the reporting period.
The telecom and utilities sectors posted the best results, while technology and industrial sectors lagged. Bond prices recovered moderately during the reporting period as the Fed ended its two year hike on rates in June of 2006 and a retracting housing market eased inflation concerns. With a few bumps along the way, commodity prices continued their upward march.
3
Manager's Analysis
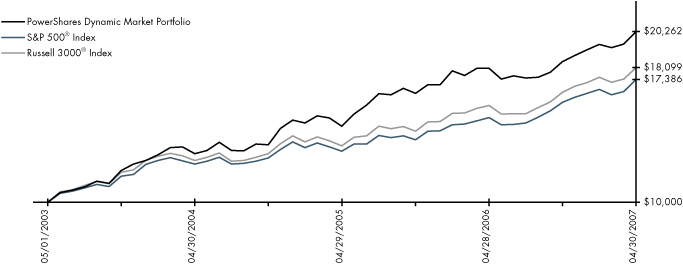
PowerShares Dynamic Market Portfolio (ticker: PWC)
The PowerShares Dynamic Market Portfolio returned 12.12% over the reporting period, while the S&P 500® Index returned 15.24% and the Russell 3000® Index returned 14.48%. Performance during the reporting period was somewhat narrow, making it difficult for the fund to keep pace due to its underweighting of names like Exxon Mobil, Microsoft, Johnson & Johnson and Altria Group relative to a cap-weighted portfolio.
Large cap and small cap value stocks were the biggest contributors to overall performance, while mid-cap growth stocks faired the worst. Consumer discretionary and staple stocks and industrial shares contributed the most to performance, while financials and technology contributed the least. Relative to the broad U.S. market, the Fund benefited from the index's effective stock selection in the food and staple retailing space, consumer durables and apparel stocks as well as commercial services companies; the index's stock selection was not effective among insurance, technology hardware or diversified financials, hurting the Fund's performance relative to the market.
The PowerShares Dynamic Market Portfolio bases its stock selection, portfolio management, and asset allocation decisions on an enhanced index called the Dynamic Market IntellidexSM Index. The Fund utilized a direct index replication method during the reporting period (less fees and expenses).
The index's investment decisions are derived from a proprietary methodology which incorporates some of the most technically advanced and robust institutional investment research available in the marketplace today.
Domestic companies are evaluated for inclusion in the index across numerous investment criteria including, fundamentals, valuation, timeliness and risk perspectives, providing a comprehensive determination of a company's overall investment potential. Securities identified by the criteria that possess the greatest capital appreciation potential are selected for the index and incorporated by the portfolio manager.
Sector Breakdown (% of the Fund's
Net Assets)
| Financials | 20.5 | ||||||
| Information Technology | 14.8 | ||||||
| Consumer Discretionary | 12.6 | ||||||
| Health Care | 12.2 | ||||||
| Industrials | 10.4 | ||||||
| Energy | 10.3 | ||||||
| Consumer Staples | 9.1 | ||||||
| Utilities | 3.6 | ||||||
| Materials | 3.6 | ||||||
| Telecommunication Services | 2.8 | ||||||
| Money Market Fund | 0.1 | ||||||
| Other | 0.0 | ||||||
Top Ten Fund Holdings (% of the Fund's
Net Assets)
| Security | |||||||
| Baker Hughes, Inc. | 4.0 | ||||||
| Exxon Mobil Corp. | 3.4 | ||||||
| General Mills, Inc. | 3.2 | ||||||
| PepsiCo, Inc. | 3.1 | ||||||
| Boeing Co. | 2.6 | ||||||
| PG&E Corp. | 2.5 | ||||||
| International Paper Co. | 2.5 | ||||||
| Hartford Financial Services Group (The), Inc. | 2.5 | ||||||
| ACE Ltd. (Cayman Islands) | 2.4 | ||||||
| Travelers Cos. (The), Inc. | 2.4 | ||||||
| Total | 28.6 | ||||||
Style Allocation (%)
| Large-Cap Value | 43.6 | ||||||
| Mid-Cap Value | 19.9 | ||||||
| Large-Cap Growth | 14.2 | ||||||
| Mid-Cap Growth | 10.4 | ||||||
| Small-Cap Value | 9.1 | ||||||
| Small-Cap Growth | 2.8 | ||||||
4
Manager's Analysis (Continued)
PowerShares Dynamic Market Portfolio (ticker: PWC)
Growth of a $10,000 Investment Since Inception
Fund Performance History (%) As of 30 April 2007
Index
| Avg. Ann.† | Fund Inception | ||||||||||||||||||
| 1 Year | 3 Year | Avg. Ann.† | Cumulative | ||||||||||||||||
| Dynamic Market IntellidexSM Index | 12.35 | 16.29 | 20.03 | 107.58 | |||||||||||||||
| S&P 500® Index | 15.24 | 12.25 | 14.83 | 73.86 | |||||||||||||||
| Russell 3000® Index | 14.48 | 13.08 | 15.99 | 80.99 | |||||||||||||||
Fund
| NAV Return | 12.12 | 15.77 | 19.31 | 102.62 | |||||||||||||||
| Share Price Return | 12.06 | 15.73 | 19.29 | 102.47 | |||||||||||||||
Fund Inception: 1 May 2003
Performance data quoted represents past performance. Past performance is not a guarantee of future results, current performance may be higher or lower than performance quoted. Investment returns and principal value will fluctuate and shares, when redeemed, may be worth more or less than their original cost. The Share Price performance reflects fee waivers, absent which, performance would have been lower. According to the Fund's most recent Prospectus, the Fund's total gross annual operating expenses was indicated as 0.63%. In the Financial Highlights section of this Annual Report, the Fund's net (subsidized) annualized total operating expense ratio was determined to be 0.60% while the Fund's gross annualized total operating expense ratio was 0.62%. The Adviser has contractually agreed to waive fees and/or pay certain Fund expenses which resulted in a lower fee actually paid by investors. This waiver extends through April 30, 200 8. Absent reimbursements or waivers, performance would have been lower. NAV and Share Price returns assume that dividends and capital gain distributions have been reinvested in the Fund at NAV and Share Price, respectively. The returns shown in the table above do not reflect the deduction of taxes that a shareholder would pay on Fund distributions or the redemption or sale of Fund Shares. See powershares.com to find the most recent month-end performance numbers.
The index performance results are based upon a hypothetical investment in its constituent securities. Index returns do not represent Fund returns. An investor cannot invest directly in an index. The index does not charge management fees or brokerage expenses, and no such fees or expenses were deducted from the hypothetical performance shown nor does the index lend securities, and no revenues from securities lending were added to the performance shown. In addition, the results actual investors might have achieved would have differed from those shown because of differences in the timing, amounts of their investments, and fees and expenses associated with an investment in the Fund.
The S&P 500® Index and the Russell 3000® Index are unmanaged indices used as measurements of change in stock market conditions based on the average performance of approximately 500 and 3,000 common stocks, respectively.
† Average annualized.
5
Manager's Analysis
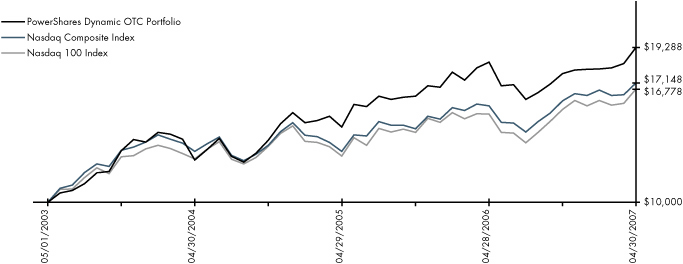
PowerShares Dynamic OTC Portfolio (ticker: PWO)
The PowerShares Dynamic OTC Portfolio returned 2.67% over the reporting period, while the Nasdaq Composite returned 8.72%. Performance during the period was narrow, driven buy a few of the largest names in the Nasdaq market, causing the Fund to trail due to its underweighting of names like Apple, Oracle and Cisco Systems relative to a cap-weighted portfolio. Exposure to software companies Citrix Systems and BEA Systems and communication equipment makers Tellabs and QLogic had a negative impact on fund performance as well.
The Fund suffered from more exposure to mid-cap growth names and less effective stock selection among large-cap value names. Health care equipment & services, insurance and software & services companies contributed the most to performance; technology hardware, consumer services and biotechnology companies contributed negatively.
The PowerShares Dynamic OTC Portfolio bases its stock selection, portfolio management, and asset allocation decisions on an enhanced index called the Dynamic OTC IntellidexSM Index. The Fund utilized a direct index replication method during the reporting period (less fees and expenses). The index's investment decisions are derived from a proprietary methodology which incorporates some of the most technically advanced and robust institutional investment research available in the marketplace today.
Domestic Nasdaq companies are evaluated for inclusion in the index across numerous investment criteria including, fundamentals, valuation, timeliness and risk perspectives, providing a comprehensive determination of company's overall investment potential. Securities identified by the criteria that possess the greatest capital appreciation potential are selected for the index and incorporated by the portfolio manager.
Sector Breakdown (% of the Fund's
Net Assets)
| Information Technology | 50.3 | ||||||
| Consumer Discretionary | 14.7 | ||||||
| Health Care | 13.8 | ||||||
| Financials | 10.5 | ||||||
| Industrials | 5.4 | ||||||
| Energy | 1.7 | ||||||
| Telecommunication Services | 1.6 | ||||||
| Consumer Staples | 1.5 | ||||||
| Materials | 0.7 | ||||||
| Other | (0.2 | ) | |||||
Style Allocation (%)
| Mid-Cap Growth | 39.5 | ||||||
| Small-Cap Value | 19.1 | ||||||
| Mid-Cap Value | 15.0 | ||||||
| Large-Cap Growth | 13.2 | ||||||
| Small-Cap Growth | 13.2 | ||||||
Top Ten Fund Holdings (% of the Fund's
Net Assets)
| Security | |||||||
| Apple, Inc. | 3.5 | ||||||
| Synopsys, Inc. | 3.2 | ||||||
| Microsoft Corp. | 3.2 | ||||||
| Compuware Corp. | 3.2 | ||||||
| BEA Systems, Inc. | 3.0 | ||||||
| Polycom, Inc. | 3.0 | ||||||
| QLogic Corp. | 3.0 | ||||||
| Fiserv, Inc. | 3.0 | ||||||
| Cisco Systems, Inc. | 3.0 | ||||||
| Autodesk, Inc. | 3.0 | ||||||
| Total | 31.1 | ||||||
6
Manager's Analysis (Continued)
PowerShares Dynamic OTC Portfolio (ticker: PWO)
Growth of a $10,000 Investment Since Inception
Fund Performance History (%) As of 30 April 2007
Index
| Avg. Ann.† | Fund Inception | ||||||||||||||||||
| 1 Year | 3 Year | Avg. Ann.† | Cumulative | ||||||||||||||||
| Dynamic OTC IntellidexSM Index | 2.99 | 15.21 | 18.57 | 97.62 | |||||||||||||||
| Nasdaq Composite Index | 8.72 | 9.56 | 14.43 | 71.48 | |||||||||||||||
| Nasdaq 100 Index | 9.82 | 10.05 | 13.81 | 67.78 | |||||||||||||||
Fund
| NAV Return | 2.67 | 14.62 | 17.85 | 92.88 | |||||||||||||||
| Share Price Return | 2.67 | 14.57 | 17.82 | 92.69 | |||||||||||||||
Fund Inception: 1 May 2003
Performance data quoted represents past performance. Past performance is not a guarantee of future results, current performance may be higher or lower than performance quoted. Investment returns and principal value will fluctuate and shares, when redeemed, may be worth more or less than their original cost. The Share Price performance reflects fee waivers, absent which, performance would have been lower. According to the Fund's most recent Prospectus, the Fund's total gross annual operating expenses was indicated as 0.69%. In the Financial Highlights section of this Annual Report, the Fund's net (subsidized) annualized total operating expense ratio was determined to be 0.60% while the Fund's gross annualized total operating expense ratio was 0.69%. The Adviser has contractually agreed to waive fees and/or pay certain Fund expenses which resulted in a lower fee actually paid by investors. This waiver extends through April 30, 200 8. Absent reimbursements or waivers, performance would have been lower. NAV and Share Price returns assume that dividends and capital gain distributions have been reinvested in the Fund at NAV and Share Price, respectively. The returns shown in the table above do not reflect the deduction of taxes that a shareholder would pay on Fund distributions or the redemption or sale of Fund Shares. See powershares.com to find the most recent month-end performance numbers.
The index performance results are hypothetical. Index returns do not represent Fund returns. An investor cannot invest directly in an index. The index does not charge management fees or brokerage expenses, and no such fees or expenses were deducted from the hypothetical performance shown nor does the index lend securities, and no revenues from securities lending were added to the performance shown. In addition, the results actual investors might have achieved would have differed from those shown because of differences in the timing, amounts of their investments, and fees and expenses associated with an investment in the Fund.
The Nasdaq Composite Index and the Nasdaq 100 Index are unmanaged indices used as a measurement of change in stock market conditions based on the average performance of approximately 3,300 and 100 common stocks, respectively.
† Average annualized.
7
Manager's Analysis
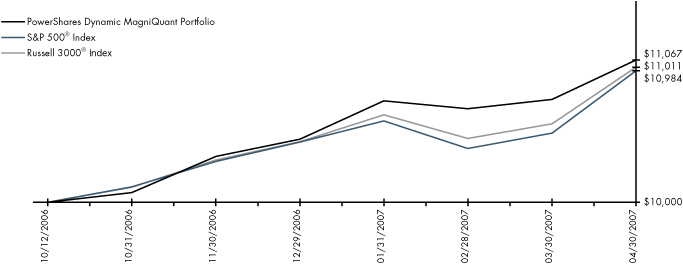
PowerShares Dynamic MagniQuant Portfolio (ticker: PIQ)
The PowerShares Dynamic MagniQuant Portfolio returned 10.67% since the Fund's inception on October 12, 2006, while the S&P 500® Index returned 9.84% and the Russell 3000® Index returned 10.11%.
Insurance, materials and capital goods stocks contributed the most to performance, while telecom and utilities contributed least. Relative to the broad U.S. market, the Fund benefited from the index's effective stock selection in the technology hardware, consumer durables and semiconductor space; stock selection was not as effective among pharmaceuticals, autos and consumer services stocks.
The PowerShares Dynamic MagniQuant Portfolio bases its stock selection, portfolio management, and asset allocation decisions on an enhanced index called the Dynamic Top 200 IntellidexSM Index. The Fund utilized a direct index replication method during the reporting period (less fees and expenses).
The index's investment decisions are derived from a proprietary methodology which incorporates some of the most technically advanced and robust institutional investment research available in the marketplace today. Domestic companies are evaluated for inclusion in the index across numerous investment criteria including, fundamentals, valuation, timeliness and risk perspectives, providing a comprehensive determination of company's overall investment potential. Securities identified by the criteria that possess the greatest capital appreciation potential are selected for the index and incorporated by the portfolio manager.
Sector Breakdown (% of the Fund's
Net Assets)
| Financials | 32.7 | ||||||
| Consumer Discretionary | 14.3 | ||||||
| Industrials | 13.8 | ||||||
| Information Technology | 12.4 | ||||||
| Health Care | 9.3 | ||||||
| Consumer Staples | 7.5 | ||||||
| Materials | 6.6 | ||||||
| Utilities | 2.2 | ||||||
| Telecommunication Services | 0.5 | ||||||
| Energy | 0.5 | ||||||
| Other | 0.2 | ||||||
Top Ten Fund Holdings (% of the Fund's
Net Assets)
| Security | |||||||
| Merck & Co., Inc. | 0.6 | ||||||
| Deckers Outdoor Corp. | 0.6 | ||||||
| GAMCO Investors. Inc., Class A | 0.6 | ||||||
| Cleveland-Cliffs, Inc. | 0.6 | ||||||
| Dean Foods Co. | 0.6 | ||||||
| Brocade Communications Systems, Inc. | 0.6 | ||||||
| Perini Corp. | 0.6 | ||||||
| Baxter International, Inc. | 0.6 | ||||||
| Honeywell International, Inc. | 0.6 | ||||||
| Seaboard Corp. | 0.5 | ||||||
| Total | 5.9 | ||||||
Style Allocation (%)
| Mid-Cap Value | 31.2 | ||||||
| Large-Cap Value | 20.6 | ||||||
| Small-Cap Value | 18.6 | ||||||
| Mid-Cap Growth | 14.7 | ||||||
| Large-Cap Growth | 11.2 | ||||||
| Small-Cap Growth | 3.7 | ||||||
8
Manager's Analysis (Continued)
PowerShares Dynamic MagniQuant Portfolio (ticker: PIQ)
Growth of a $10,000 Investment Since Inception
Fund Performance History (%) As of 30 April 2007
Index
| Fund Inception Cumulative | |||||||
| Dynamic Top 200 IntellidexSM Index | 11.06 | ||||||
| S&P 500® Index | 9.84 | ||||||
| Russell 3000® Index | 10.11 | ||||||
Fund
| NAV Return | 10.67 | ||||||
| Share Price Return | 10.84 | ||||||
Fund Inception: 12 October 2006
Performance data quoted represents past performance. Past performance is not a guarantee of future results, current performance may be higher or lower than performance quoted. Investment returns and principal value will fluctuate and shares, when redeemed, may be worth more or less than their original cost. The Share Price performance reflects fee waivers, absent which, performance would have been lower. According to the Fund's most recent Prospectus, the Fund's total gross annual operating expenses was indicated as 0.70%. In the Financial Highlights section of this Annual Report, the Fund's net (subsidized) annualized total operating expense ratio was determined to be 0.67% while the Fund's gross annualized total operating expense ratio was 0.84%. The Adviser has contractually agreed to waive fees and/or pay certain Fund expenses which resulted in a lower fee actually paid by investors. This waiver extends through April 30, 200 8. Absent reimbursements or waivers, performance would have been lower. NAV and Share Price returns assume that dividends and capital gain distributions have been reinvested in the Fund at NAV and Share Price, respectively. The returns shown in the table above do not reflect the deduction of taxes that a shareholder would pay on Fund distributions or the redemption or sale of Fund Shares. See powershares.com to find the most recent month-end performance numbers.
The index performance results are hypothetical. Index returns do not represent Fund returns. An investor cannot invest directly in an index. The index does not charge management fees or brokerage expenses, and no such fees or expenses were deducted from the hypothetical performance shown nor does the index lend securities, and no revenues from securities lending were added to the performance shown. In addition, the results actual investors might have achieved would have differed from those shown because of differences in the timing, amounts of their investments, and fees and expenses associated with an investment in the Fund.
The S&P 500® Index and the Russell 3000® Index are unmanaged indices used as a measurement of change in stock market conditions based on the average performance of approximately 500 and 3,000 common stocks, respectively.
9
Manager's Analysis
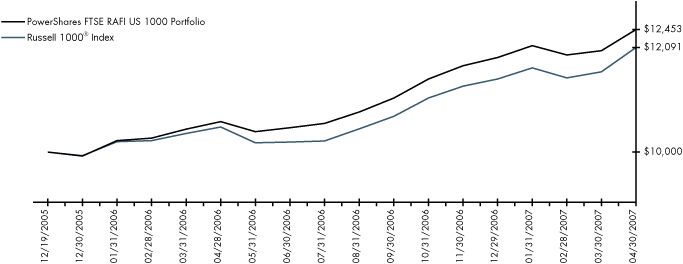
PowerShares FTSE RAFI US 1000 Portfolio (ticker: PRF)
The PowerShares FTSE RAFI US 1000 Portfolio posted strong results during the reporting period outperforming the S&P 500® and Russell 1000® total return indices. For the prior twelve months, the Fund returned 17.60%, outpacing the S&P 500® Index which returned 15.24% and the Russell 1000® which returned 15.16%.
Top gainers in the portfolio were utilities and telecommunications sectors. Relative to the S&P 500®, the consumer discretionary, information technology, and utilities sectors generated the greatest relative outperformance.
The index benefited from over-weighting the utilities and telecommunications sectors, and underweighting the information technology sector. Stock selection was most effective in the consumer discretionary and energy sectors.
The Fund seeks investment results that correspond generally to the price and yield (before the Fund's fees and expenses) of an equity index called the FTSE RAFI US 1000 Index. The FTSE RAFI US 1000 Index is designed to track the performance of the largest U.S. equities, selected based on the following four fundamental measures of firm size: book value, cash flow, sales and dividends. U.S. equities are then weighted by each of these four fundamental measures. An overall weight is calculated for each firm by equally-weighting each fundamental measure. Each of the 1,000 equities with the highest fundamental weight are then selected and assigned a weight equal to its fundamental weight. The portfolio manager incorporates the stocks selected by the index into the Fund.
Sector Breakdown (% of the Fund's
Net Assets)
| Financials | 22.2 | ||||||
| Consumer Discretionary | 13.4 | ||||||
| Consumer Staples | 11.5 | ||||||
| Industrials | 10.7 | ||||||
| Information Technology | 9.5 | ||||||
| Energy | 9.3 | ||||||
| Health Care | 9.1 | ||||||
| Utilities | 6.6 | ||||||
| Telecommunication Services | 3.9 | ||||||
| Materials | 3.7 | ||||||
| Money Market | 0.1 | ||||||
| Other | 0.0 | ||||||
Top Ten Fund Holdings (% of the Fund's
Net Assets)
| Security | |||||||
| Exxon Mobil Corp. | 2.9 | ||||||
| General Electric Co. | 2.7 | ||||||
| Kraft Foods, Inc., Class A | 2.2 | ||||||
| Citigroup, Inc. | 2.1 | ||||||
| Microsoft Corp. | 1.7 | ||||||
| Bank of America Corp. | 1.6 | ||||||
| Chevron Corp. | 1.5 | ||||||
| Wal-Mart Stores, Inc. | 1.5 | ||||||
| Verizon Communications, Inc. | 1.4 | ||||||
| AT&T, Inc. | 1.2 | ||||||
| Total | 18.8 | ||||||
Style Allocation (%)
| Large-Cap Value | 52.7 | ||||||
| Large-Cap Growth | 19.6 | ||||||
| Mid-Cap Value | 17.1 | ||||||
| Mid-Cap Growth | 7.0 | ||||||
| Small-Cap Value | 3.1 | ||||||
| Small-Cap Growth | 0.5 | ||||||
10
Manager's Analysis (Continued)
PowerShares FTSE RAFI US 1000 Portfolio (ticker: PRF)
Growth of a $10,000 Investment Since Inception
Fund Performance History (%) As of 30 April 2007
Index
| Avg. Ann.† | Fund Inception | ||||||||||||||
| 1 Year | Avg. Ann.† | Cumulative | |||||||||||||
| FTSE RAFI US 1000 Index | 18.51 | 18.36 | 25.80 | ||||||||||||
| S&P 500® Index | 15.24 | 14.79 | 20.66 | ||||||||||||
| Russell 1000® Index | 15.16 | 14.96 | 20.91 | ||||||||||||
Fund
| NAV Return | 17.60 | 17.48 | 24.53 | ||||||||||||
| Share Price Return | 17.69 | 17.00 | 23.83 | ||||||||||||
Fund Inception: 19 December 2005
Performance data quoted represents past performance. Past performance is not a guarantee of future results; current performance may be higher or lower than performance quoted. Investment returns and principal value will fluctuate and shares, when redeemed, may be worth more or less than their original cost. The Share Price performance reflects fee waivers, absent which, performance would have been lower. According to the Fund's most recent Prospectus, the Fund's total gross annual operating expenses was indicated as 1.00%. In the Financial Highlights section of this Annual Report, the Fund's net (subsidized) annualized total operating expense ratio was determined to be 0.70% while the Fund's gross annualized total operating expense ratio was 0.71%. The Adviser has contractually agreed to waive fees and/or pay certain Fund expenses which resulted in a lower fee actually paid by investors. This waiver extends through April 30, 200 8. Absent reimbursements or waivers, performance would have been lower. NAV and Share Price returns assume that dividends and capital gain distributions have been reinvested in the Fund at NAV and Share Price, respectively. The returns shown in the table above do not reflect the deduction of taxes that a shareholder would pay on Fund distributions or the redemption or sale of Fund Shares. See powershares.com to find the most recent month-end performance numbers.
The index performance results are hypothetical and index returns do not represent Fund returns. An investor cannot invest directly in an index. The index does not charge management fees or brokerage expenses, and no such fees or expenses were deducted from the hypothetical performance shown nor does the index lend securities, and no revenues from securities lending were added to the performance shown. In addition, the results actual investors might have achieved would have differed from those shown because of differences in the timing, amounts of their investments, and fees and expenses associated with an investment in the Fund.
The S&P 500® Index and the Russell 1000® Index are unmanaged indices based on the average performance of approximately 500 and 1,000 common stocks, respectively.
† Average annualized.
11
Funds' Distribution History
| Ex-Dividend | 4/13/07 | 3/16/07 | 3/15/07 | 2/15/07 | 1/15/07 | 12/15/06 | 11/15/06 | ||||||||||||||||||||||||||||
| Record | 4/17/07 | 3/20/07 | 3/20/07 | 2/20/07 | 1/17/07 | 12/19/06 | 11/17/06 | ||||||||||||||||||||||||||||
| Payable | 4/30/07 | 3/30/07 | 3/30/07 | 2/28/07 | 1/31/07 | 12/29/06 | 11/30/06 | ||||||||||||||||||||||||||||
| Fund | Ticker | ||||||||||||||||||||||||||||||||||
| PowerShares Dynamic Market Portfolio | PWC | — | 0.06501 | — | — | — | 0.16017 | — | |||||||||||||||||||||||||||
| PowerShares Dynamic OTC Portfolio | PWO | — | — | — | — | — | — | — | |||||||||||||||||||||||||||
| PowerShares Dynamic MagniQuant Portfolio | PIQ | — | 0.02020 | — | — | — | 0.03317 | — | |||||||||||||||||||||||||||
| PowerShares FTSE RAFI US 1000 Portfolio | PRF | — | 0.12360 | — | — | — | 0.20592 | — | |||||||||||||||||||||||||||
| Ex-Dividend | 12/30/05 | 12/16/05 | 9/16/05 | 6/17/05 | 4/1/05 | 3/18/05 | 12/31/04 | ||||||||||||||||||||||||||||
| Record | 1/4/06 | 12/20/05 | 9/20/05 | 6/21/05 | 4/5/05 | 3/22/05 | 1/4/05 | ||||||||||||||||||||||||||||
| Payable | 1/31/06 | 12/30/05 | 9/30/05 | 6/30/05 | 4/29/05 | 4/29/05 | 1/31/05 | ||||||||||||||||||||||||||||
| Fund | Ticker | ||||||||||||||||||||||||||||||||||
| PowerShares Dynamic Market Portfolio | PWC | — | 0.13055 | 0.04739 | 0.10797 | — | 0.02900 | — | |||||||||||||||||||||||||||
| PowerShares Dynamic OTC Portfolio | PWO | — | — | 0.05663 | — | — | — | — | |||||||||||||||||||||||||||
| PowerShares Dynamic MagniQuant Portfolio | PIQ | — | — | — | — | — | — | — | |||||||||||||||||||||||||||
| PowerShares FTSE RAFI US 1000 Portfolio | PRF | — | — | — | — | — | — | — | |||||||||||||||||||||||||||
12
| 10/16/06 | 9/15/06 | 8/15/06 | 7/14/06 | 6/16/06 | 6/15/06 | 5/15/06 | 3/17/06 | ||||||||||||||||||||||||||||
| 10/18/06 | 9/16/06 | 8/17/06 | 7/18/06 | 6/20/06 | 6/19/06 | 5/17/06 | 3/21/06 | ||||||||||||||||||||||||||||
| 10/31/06 | 9/29/06 | 8/31/06 | 7/31/06 | 6/30/06 | 6/30/06 | 5/31/06 | 3/30/06 | ||||||||||||||||||||||||||||
| Fund | |||||||||||||||||||||||||||||||||||
| PowerShares Dynamic Market Portfolio | — | 0.04994 | — | — | 0.04868 | — | — | 0.04452 | |||||||||||||||||||||||||||
| PowerShares Dynamic OTC Portfolio | — | — | — | — | — | — | — | — | |||||||||||||||||||||||||||
| PowerShares Dynamic MagniQuant Portfolio | — | — | — | — | — | — | — | — | |||||||||||||||||||||||||||
| PowerShares FTSE RAFI US 1000 Portfolio | — | 0.13450 | — | — | 0.14583 | — | — | 0.12172 | |||||||||||||||||||||||||||
| 12/17/04 | 9/17/04 | 6/18/04 | 3/19/04 | 12/24/03 | 9/19/03 | 6/20/03 | |||||||||||||||||||||||||
| 12/21/04 | 9/21/04 | 6/22/04 | 3/23/04 | 12/29/03 | 9/23/03 | 6/24/03 | |||||||||||||||||||||||||
| 1/31/05 | 10/29/04 | 7/30/04 | 4/30/04 | 1/30/04 | 10/31/03 | 7/31/03 | |||||||||||||||||||||||||
| Fund | |||||||||||||||||||||||||||||||
| PowerShares Dynamic Market Portfolio | 0.08784 | 0.03096 | 0.07211 | 0.05300 | 0.03646 | 0.04418 | 0.16848 | ||||||||||||||||||||||||
| PowerShares Dynamic OTC Portfolio | — | — | — | — | — | — | — | ||||||||||||||||||||||||
| PowerShares Dynamic MagniQuant Portfolio | — | — | — | — | — | — | — | ||||||||||||||||||||||||
| PowerShares FTSE RAFI US 1000 Portfolio | — | — | — | — | — | — | — | ||||||||||||||||||||||||
13
Frequency Distribution of Discounts & Premiums
Since Inception thru April 30, 2007
| Closing Price Above NAV | |||||||||||||||||||||||||||||||||||||||
Ticker | Fund Name | Inception | Days | 0-24 Basis Points | 25-49 Basis Points | 50-99 Basis Points | 100-149 Basis Points | 150-199 Basis Points | 200+ Basis Points | ||||||||||||||||||||||||||||||
| PWC | PowerShares Dynamic Market Portfolio | 5/1/03 | 892 | 567 | 63 | 9 | 0 | 0 | 0 | ||||||||||||||||||||||||||||||
| PWO | PowerShares Dynamic OTC Portfolio | 5/1/03 | 892 | 462 | 31 | 11 | 0 | 0 | 0 | ||||||||||||||||||||||||||||||
| PIQ | PowerShares Dynamic MagniQuant Portfolio | 10/12/06 | 136 | 77 | 1 | 0 | 0 | 0 | 0 | ||||||||||||||||||||||||||||||
| PRF | PowerShares FTSE RAFI US 1000 Portfolio | 12/19/05 | 332 | 219 | 7 | 1 | 0 | 0 | 0 | ||||||||||||||||||||||||||||||
14
| Closing Price Below NAV | |||||||||||||||||||||||||||
Ticker | -0-24 Basis Points | -25-49 Basis Points | -50-99 Basis Points | -100-149 Basis Points | -150-199 Basis Points | -200+ Basis Points | |||||||||||||||||||||
| PWC | 250 | 3 | 0 | 0 | 0 | 0 | |||||||||||||||||||||
| PWO | 374 | 12 | 2 | 0 | 0 | 0 | |||||||||||||||||||||
| PIQ | 58 | 0 | 0 | 0 | 0 | 0 | |||||||||||||||||||||
| PRF | 95 | 4 | 6 | 0 | 0 | 0 | |||||||||||||||||||||
15
Fees and Expenses
As a shareholder of a Fund of the PowerShares Exchange-Traded Fund Trust, you incur advisory fees and other Fund expenses. The expense examples below are intended to help you understand your ongoing costs (in dollars) of investing in the Funds and to compare these costs with the ongoing costs of investing in other mutual funds.
The example is based on an investment of $1,000 invested at the beginning of the period and held through the six-month period ended April 30, 2007.
Actual Expenses
The first line in the following tables provides information about actual account values and actual expenses. You may use the information in this line, together with the amount you invested, to estimate the expenses that you paid over the period. Simply divide your account value by $1,000 (for example, an $8,600 account value divided by $1,000 = 8.6), then multiply the result by the number in the first line under the heading "Expenses Paid During the Six-Month Period" to estimate the expenses you paid on your account during this period.
Hypothetical Example for Comparison Purposes
The second line in the following tables provides information about hypothetical account values and hypothetical expenses based on the Funds' actual expense ratio and an assumed annualized rate of return of 5% per year before expenses, which is not the Funds' actual return. The hypothetical account values and expenses may not be used to estimate the actual ending account balance or expenses you paid for the period. You may use this information to compare the ongoing costs of investing in the Funds and other funds. To do so, compare this 5% hypothetical example with the 5% hypothetical examples that appear in the shareholder reports of the other funds.
Please note that the expenses shown in the tables are meant to highlight your ongoing costs only, and do not reflect any transactional costs such as sales charges (loads). Therefore the second line in the table is useful in comparing ongoing costs only, and will not help you determine the relative total costs of owning different funds. In addition, if these transactional costs were included, your costs would have been higher.
| Beginning Account Value November 1, 2006 | Ending Account Value April 30, 2007 | Annualized Expense Ratio Based on the Six-Month Period | Expenses Paid During the Six-Month Period (1) | ||||||||||||||||
| PowerShares Dynamic Market Portfolio | |||||||||||||||||||
| Actual | $ | 1,000.00 | $ | 1,097.29 | 0.60 | % | $ | 3.12 | |||||||||||
| Hypothetical (5% return before expenses) | $ | 1,000.00 | $ | 1,021.82 | 0.60 | % | $ | 3.01 | |||||||||||
| PowerShares Dynamic OTC Portfolio | |||||||||||||||||||
| Actual | $ | 1,000.00 | $ | 1,068.54 | 0.60 | % | $ | 3.08 | |||||||||||
| Hypothetical (5% return before expenses) | $ | 1,000.00 | $ | 1,021.82 | 0.60 | % | $ | 3.01 | |||||||||||
| PowerShares Dynamic MagniQuant Portfolio | |||||||||||||||||||
| Actual | $ | 1,000.00 | $ | 1,098.87 | 0.67 | % | $ | 3.49 | |||||||||||
| Hypothetical (5% return before expenses) | $ | 1,000.00 | $ | 1,021.47 | 0.67 | % | $ | 3.36 | |||||||||||
| PowerShares FTSE RAFI US 1000 Portfolio | |||||||||||||||||||
| Actual | $ | 1,000.00 | $ | 1,092.60 | 0.69 | % | $ | 3.58 | |||||||||||
| Hypothetical (5% return before expenses) | $ | 1,000.00 | $ | 1,021.37 | 0.69 | % | $ | 3.46 | |||||||||||
(1) Expenses are calculated using the annualized expense ratio, which represents the ongoing expenses as a percentage of net assets for the six months ended April 30, 2007. Expenses are calculated by multiplying the Fund's annualized expense ratio by the average account value for the period; then multiplying the result by 181 and then dividing the result by 365. Expense ratios for the most recent half-year may differ from expense ratios based on the one year data in the financial highlights.
16
Schedule of Investments
PowerShares Dynamic Market Portfolio
April 30, 2007
| Number of Shares | Value | ||||||||||
| Common Stocks—99.9% | |||||||||||
| Consumer Discretionary—12.6% | |||||||||||
| 116,411 | American Eagle Outfitters, Inc. | $ | 3,430,632 | ||||||||
| 63,743 | Autoliv, Inc. | 3,706,655 | |||||||||
| 119,116 | Charlotte Russe Holding, Inc.* | 3,255,440 | |||||||||
| 58,205 | Deckers Outdoor Corp.* | 4,407,865 | |||||||||
| 126,302 | Hasbro, Inc. | 3,992,406 | |||||||||
| 68,596 | International Speedway Corp., Class A | 3,388,642 | |||||||||
| 801,889 | Mattel, Inc. | 22,693,460 | |||||||||
| 680,363 | Newell Rubbermaid, Inc. | 20,866,733 | |||||||||
| 370,920 | Nordstrom, Inc. | 20,370,926 | |||||||||
| 203,166 | Omnicom Group, Inc. | 21,273,512 | |||||||||
| 113,487 | Payless ShoeSource, Inc.* | 3,620,235 | |||||||||
| 251,660 | Sinclair Broadcast Group, Inc., Class A | 4,109,608 | |||||||||
| 143,942 | Tempur-Pedic International, Inc. | 3,738,174 | |||||||||
| 127,651 | Wolverine World Wide, Inc. | 3,648,266 | |||||||||
| 122,502,554 | |||||||||||
| Consumer Staples—9.1% | |||||||||||
| 102,039 | Campbell Soup Co. | 3,989,725 | |||||||||
| 167,392 | ConAgra Foods, Inc. | 4,114,495 | |||||||||
| 137,191 | Dean Foods Co. | 4,997,868 | |||||||||
| 523,173 | General Mills, Inc. | 31,338,064 | |||||||||
| 84,520 | J.M. Smucker (The) Co. | 4,717,906 | |||||||||
| 463,227 | PepsiCo, Inc. | 30,614,672 | |||||||||
| 1,944 | Seaboard Corp. | 4,846,392 | |||||||||
| 70,865 | UST, Inc. | 4,016,628 | |||||||||
| 88,635,750 | |||||||||||
| Energy—10.3% | |||||||||||
| 479,233 | Baker Hughes, Inc. | 38,525,541 | |||||||||
| 416,417 | Exxon Mobil Corp. | 33,055,181 | |||||||||
| 176,725 | Gulfmark Offshore, Inc.* | 8,465,128 | |||||||||
| 120,091 | Holly Corp. | 7,637,788 | |||||||||
| 140,355 | Plains Exploration & Production Co.* | 6,595,281 | |||||||||
| 67,976 | SEACOR Holdings, Inc.* | 6,476,753 | |||||||||
| 100,755,672 | |||||||||||
| Financials—20.5% | |||||||||||
| 397,904 | ACE Ltd. (Cayman Islands) | 23,659,372 | |||||||||
| 54,883 | AMBAC Financial Group, Inc. | 5,038,259 | |||||||||
| 135,307 | American Financial Group, Inc. | 4,772,278 | |||||||||
| 74,347 | Arch Capital Group Ltd. (Bermuda)* | 5,413,949 | |||||||||
| 90,988 | Assurant, Inc. | 5,234,540 | |||||||||
| 432,200 | Chubb (The) Corp. | 23,265,326 | |||||||||
| 124,537 | City Holding Co. | 4,728,670 | |||||||||
| 122,398 | FBL Financial Group, Inc., Class A | 4,741,699 | |||||||||
| 237,505 | Hartford Financial Services Group (The), Inc. | 24,035,505 | |||||||||
| 89,388 | Nationwide Financial Services, Inc., Class A | 5,106,736 | |||||||||
| 69,295 | PartnerRe Ltd. (Bermuda) | 4,990,626 | |||||||||
| 364,369 | Principal Financial Group, Inc. | 23,133,788 | |||||||||
| 984,321 | Progressive (The) Corp. | 22,708,285 | |||||||||
| 85,848 | RLI Corp. | 4,780,875 | |||||||||
| 71,952 | Safeco Corp. | 4,802,076 | |||||||||
| 75,957 | Transatlantic Holdings, Inc. | 5,278,252 | |||||||||
| Number of Shares | Value | ||||||||||
| Common Stocks (Continued) | |||||||||||
| 432,357 | Travelers Cos. (The), Inc. | $ | 23,390,514 | ||||||||
| 97,490 | Zenith National Insurance Corp. | 4,508,913 | |||||||||
| 199,589,663 | |||||||||||
| Health Care—12.2% | |||||||||||
| 88,633 | AMERIGROUP Corp.* | 2,493,246 | |||||||||
| 94,824 | Apria Healthcare Group, Inc.* | 3,009,714 | |||||||||
| 399,349 | Baxter International, Inc. | 22,615,134 | |||||||||
| 40,522 | Bio-Rad Laboratories, Inc., Class A* | 2,867,742 | |||||||||
| 65,692 | Chemed Corp. | 3,304,308 | |||||||||
| 138,236 | CIGNA Corp. | 21,508,139 | |||||||||
| 95,173 | DENTSPLY International, Inc. | 3,179,730 | |||||||||
| 59,965 | Edwards Lifesciences Corp.* | 2,938,285 | |||||||||
| 121,138 | Emergency Medical Services Corp., Class A* | 4,055,700 | |||||||||
| 51,470 | Hillenbrand Industries, Inc. | 3,147,391 | |||||||||
| 310,073 | Johnson & Johnson | 19,912,888 | |||||||||
| 78,565 | Lincare Holdings, Inc.* | 3,098,604 | |||||||||
| 776,403 | Pfizer, Inc. | 20,543,623 | |||||||||
| 55,054 | Techne Corp.* | 3,246,534 | |||||||||
| 38,359 | WellCare Health Plans, Inc.* | 3,091,352 | |||||||||
| 119,012,390 | |||||||||||
| Industrials—10.4% | |||||||||||
| 354,153 | Avery Dennison Corp. | 22,028,317 | |||||||||
| 266,520 | Boeing Co. | 24,786,359 | |||||||||
| 65,649 | Cascade Corp. | 4,068,269 | |||||||||
| 148,737 | Ennis, Inc. | 3,636,620 | |||||||||
| 97,820 | Equifax, Inc. | 3,893,236 | |||||||||
| 76,272 | John H. Harland Co. | 4,011,907 | |||||||||
| 235,634 | Lockheed Martin Corp. | 22,653,853 | |||||||||
| 104,123 | Perini Corp.* | 4,435,640 | |||||||||
| 56,552 | Teleflex, Inc. | 4,062,130 | |||||||||
| 163,924 | Tredegar Corp. | 3,830,904 | |||||||||
| 80,102 | Watson Wyatt Worldwide, Inc., Class A | 3,775,207 | |||||||||
| 101,182,442 | |||||||||||
| Information Technology—14.8% | |||||||||||
| 329,221 | BEA Systems, Inc.* | 3,881,516 | |||||||||
| 468,362 | Brocade Communications Systems, Inc.* | 4,575,897 | |||||||||
| 146,576 | Convergys Corp.* | 3,702,510 | |||||||||
| 116,740 | Dolby Laboratories, Inc., Class A* | 4,134,931 | |||||||||
| 697,120 | Electronic Data Systems Corp. | 20,383,788 | |||||||||
| 62,903 | Factset Research Systems, Inc. | 3,869,164 | |||||||||
| 98,005 | Fair Isaac Corp. | 3,499,759 | |||||||||
| 369,272 | Fiserv, Inc.* | 19,634,192 | |||||||||
| 206,647 | International Business Machines Corp. | 21,121,389 | |||||||||
| 108,410 | ManTech International Corp., Class A* | 3,326,019 | |||||||||
| 43,756 | Mettler Toledo International, Inc.* | 4,271,461 | |||||||||
| 149,189 | Synopsys, Inc.* | 4,126,568 | |||||||||
| 101,734 | Syntel, Inc. | 3,566,794 | |||||||||
| 629,740 | Total System Services, Inc. | 19,559,724 | |||||||||
| 195,248 | Western Digital Corp.* | 3,451,985 | |||||||||
| 1,129,500 | Xerox Corp.* | 20,895,749 | |||||||||
| 144,001,446 | |||||||||||
See Notes to Financial Statements.
17
Schedule of Investments (Continued)
PowerShares Dynamic Market Portfolio
April 30, 2007
| Number of Shares | Value | ||||||||||
| Common Stocks (Continued) | |||||||||||
| Materials—3.6% | |||||||||||
| 79,895 | Albemarle Corp. | $ | 3,391,543 | ||||||||
| 642,512 | International Paper Co. | 24,235,553 | |||||||||
| 102,141 | Sealed Air Corp. | 3,360,439 | |||||||||
| 90,285 | Sonoco Products Co. | 3,849,752 | |||||||||
| 34,837,287 | |||||||||||
| Telecommunication Services—2.8% | |||||||||||
| 147,050 | ALLTEL Corp. | 9,218,565 | |||||||||
| 249,191 | AT&T, Inc. | 9,648,675 | |||||||||
| 57,284 | CenturyTel, Inc. | 2,637,928 | |||||||||
| 44,676 | Golden Telecom, Inc. | 2,618,460 | |||||||||
| 47,145 | Telephone & Data Systems, Inc. | 2,684,908 | |||||||||
| 26,808,536 | |||||||||||
| Utilities—3.6% | |||||||||||
| 109,990 | Northwest Natural Gas Co. | 5,588,592 | |||||||||
| 487,894 | PG&E Corp. | 24,687,436 | |||||||||
| 102,025 | Wisconsin Energy Corp. | 4,977,800 | |||||||||
| 35,253,828 | |||||||||||
| Total Common Stocks (Cost $900,618,330) | 972,579,568 | ||||||||||
| Money Market Fund—0.1% | |||||||||||
| 681,728 | Liquid Assets Portfolio Private Class** (Cost $681,728) | 681,728 | |||||||||
| Total Investments (Cost $901,300,058)—100.0% | 973,261,296 | ||||||||||
| Liabilities in excess of other assets—0.0% | (156,684 | ) | |||||||||
| Net Assets—100.0% | $ | 973,104,612 | |||||||||
* Non-income producing security.
** Affiliated investment.
COUNTRY BREAKDOWN
April 30, 2007 (Unaudited)
| Value | Net Assets | ||||||||||
| United States | $ | 939,197,349 | 96.5 | % | |||||||
| Cayman Islands | 23,659,372 | 2.4 | |||||||||
| Bermuda | 10,404,575 | 1.1 | |||||||||
| Total investments | 973,261,296 | 100.0 | |||||||||
| Liabilities in excess of other assets | (156,684 | ) | (0.0 | ) | |||||||
| Net Assets | $ | 973,104,612 | 100.0 | % | |||||||
See Notes to Financial Statements.
18
Schedule of Investments
PowerShares Dynamic OTC Portfolio
April 30, 2007
| Number of Shares | Value | ||||||||||
| Common Stocks—100.2% | |||||||||||
| Consumer Discretionary—14.7% | |||||||||||
| 130,610 | American Eagle Outfitters, Inc. | $ | 3,849,077 | ||||||||
| 33,561 | Applebee's International, Inc. | 912,188 | |||||||||
| 36,476 | Big 5 Sporting Goods Corp. | 933,786 | |||||||||
| 28,636 | Charlotte Russe Holding, Inc.* | 782,622 | |||||||||
| 13,992 | Deckers Outdoor Corp.* | 1,059,614 | |||||||||
| 191,402 | Expedia, Inc.* | 4,520,915 | |||||||||
| 37,239 | Helen of Troy Ltd. (Bermuda)* | 845,325 | |||||||||
| 16,491 | International Speedway Corp., Class A | 814,655 | |||||||||
| 27,865 | Perry Ellis International, Inc.* | 925,118 | |||||||||
| 121,729 | Ross Stores, Inc. | 4,035,316 | |||||||||
| 60,505 | Sinclair Broadcast Group, Inc., Class A | 988,047 | |||||||||
| 152,755 | Staples, Inc. | 3,788,324 | |||||||||
| 23,454,987 | |||||||||||
| Consumer Staples—1.5% | |||||||||||
| 35,438 | Costco Wholesale Corp. | 1,898,414 | |||||||||
| 14,193 | USANA Health Sciences, Inc.* | 565,449 | |||||||||
| 2,463,863 | |||||||||||
| Energy—1.7% | |||||||||||
| 93,502 | Global Industries Ltd.* | 1,941,102 | |||||||||
| 29,336 | Matrix Service Co.* | 715,798 | |||||||||
| 2,656,900 | |||||||||||
| Financials—10.5% | |||||||||||
| 13,329 | American Physicians Capital, Inc.* | 527,029 | |||||||||
| 44,800 | Arch Capital Group Ltd. (Bermuda)* | 3,262,335 | |||||||||
| 13,704 | Argonaut Group, Inc.* | 460,591 | |||||||||
| 12,863 | City Holding Co. | 488,408 | |||||||||
| 12,798 | First Community Bancshares, Inc. | 420,670 | |||||||||
| 11,369 | FPIC Insurance Group, Inc.* | 523,656 | |||||||||
| 14,574 | Harleysville Group, Inc. | 445,090 | |||||||||
| 100,224 | IPC Holdings Ltd. (Bermuda) | 3,004,716 | |||||||||
| 16,408 | Ohio Casualty Corp. | 519,149 | |||||||||
| 62,589 | Philadelphia Consolidated Holding Co.* | 2,716,363 | |||||||||
| 10,938 | Safety Insurance Group, Inc. | 438,176 | |||||||||
| 46,556 | SEI Investments Co. | 2,841,313 | |||||||||
| 20,377 | Selective Insurance Group | 531,432 | |||||||||
| 21,373 | United America Indemnity Ltd., Class A (Cayman Islands)* | 533,898 | |||||||||
| 16,712,826 | |||||||||||
| Health Care—13.8% | |||||||||||
| 12,468 | Biosite, Inc.* | 1,153,290 | |||||||||
| 34,851 | Cross Country Healthcare, Inc.* | 686,216 | |||||||||
| 111,174 | DENTSPLY International, Inc. | 3,714,323 | |||||||||
| 46,051 | Express Scripts, Inc.* | 4,400,174 | |||||||||
| 91,762 | Lincare Holdings, Inc.* | 3,619,093 | |||||||||
| 15,786 | Magellan Health Services, Inc.* | 677,219 | |||||||||
| 22,883 | MedCath Corp.* | 680,083 | |||||||||
| 31,990 | PSS World Medical, Inc.* | 642,999 | |||||||||
| 29,500 | Sciele Pharma, Inc.* | 729,240 | |||||||||
| 12,249 | Techne Corp.* | 722,324 | |||||||||
| Number of Shares | Value | ||||||||||
| Common Stocks (Continued) | |||||||||||
| 93,444 | VCA Antech, Inc.* | $ | 3,684,497 | ||||||||
| 38,424 | ViroPharma, Inc.* | 579,434 | |||||||||
| 30,970 | Wright Medical Group, Inc.* | 731,511 | |||||||||
| 22,020,403 | |||||||||||
| Industrials—5.4% | |||||||||||
| 105,500 | Copart, Inc.* | 3,057,390 | |||||||||
| 79,682 | Herman Miller, Inc. | 2,741,858 | |||||||||
| 16,187 | Hub Group, Inc., Class A* | 582,732 | |||||||||
| 9,711 | Nordson Corp. | 445,055 | |||||||||
| 15,883 | Resources Connection, Inc.* | 479,190 | |||||||||
| 16,293 | TeleTech Holdings, Inc.* | 614,735 | |||||||||
| 12,371 | Woodward Governor Co. | 610,509 | |||||||||
| 8,531,469 | |||||||||||
| Information Technology—50.3% | |||||||||||
| 36,321 | Advanced Energy Industries, Inc.* | 889,865 | |||||||||
| 33,410 | Agilysys, Inc. | 702,612 | |||||||||
| 22,568 | Ansoft Corp.* | 728,721 | |||||||||
| 55,077 | Apple, Inc.* | 5,496,686 | |||||||||
| 857,635 | Atmel Corp.* | 4,562,618 | |||||||||
| 115,509 | Autodesk, Inc.* | 4,767,056 | |||||||||
| 410,517 | BEA Systems, Inc.* | 4,839,995 | |||||||||
| 88,338 | Brocade Communications Systems, Inc.* | 863,062 | |||||||||
| 178,323 | Cisco Systems, Inc.* | 4,768,357 | |||||||||
| 513,146 | Compuware Corp.* | 5,064,751 | |||||||||
| 20,369 | Comtech Telecommunications Corp.* | 770,967 | |||||||||
| 28,540 | Covansys Corp.* | 953,236 | |||||||||
| 150,820 | Credence Systems Corp.* | 559,542 | |||||||||
| 29,088 | CSG Systems International, Inc.* | 778,977 | |||||||||
| 61,274 | Cybersource Corp.* | 778,793 | |||||||||
| 89,699 | Fiserv, Inc.* | 4,769,296 | |||||||||
| 35,101 | Gevity HR, Inc. | 654,634 | |||||||||
| 36,789 | Global Imaging Systems, Inc.* | 1,062,834 | |||||||||
| 20,973 | Interdigital Communications Corp.* | 689,592 | |||||||||
| 31,191 | Inter-Tel, Inc. | 786,637 | |||||||||
| 24,466 | Intevac, Inc.* | 594,768 | |||||||||
| 30,300 | Jack Henry & Associates, Inc. | 719,625 | |||||||||
| 20,448 | ManTech International Corp., Class A* | 627,345 | |||||||||
| 41,316 | Mentor Graphics Corp.* | 668,493 | |||||||||
| 12,916 | MICROS Systems, Inc.* | 707,797 | |||||||||
| 169,747 | Microsoft Corp. | 5,082,225 | |||||||||
| 5,800 | MicroStrategy, Inc., Class A* | 659,808 | |||||||||
| 19,105 | MTS Systems Corp. | 812,154 | |||||||||
| 27,042 | National Instruments Corp. | 753,390 | |||||||||
| 26,063 | NETGEAR, Inc.* | 875,977 | |||||||||
| 35,795 | NetRatings, Inc.* | 744,894 | |||||||||
| 46,406 | Photronics, Inc.* | 698,410 | |||||||||
| 144,967 | Polycom, Inc.* | 4,827,401 | |||||||||
| 269,099 | QLogic Corp.* | 4,811,490 | |||||||||
| 12,083 | Rofin-Sinar Technologies, Inc.* | 800,861 | |||||||||
| 106,462 | Skyworks Solutions, Inc.* | 733,523 | |||||||||
| 45,027 | Sykes Enterprises, Inc.* | 831,198 | |||||||||
See Notes to Financial Statements.
19
Schedule of Investments (Continued)
PowerShares Dynamic OTC Portfolio
April 30, 2007
| Number of Shares | Value | ||||||||||
| Common Stocks (Continued) | |||||||||||
| 186,032 | Synopsys, Inc.* | $ | 5,145,646 | ||||||||
| 19,189 | Syntel, Inc. | 672,766 | |||||||||
| 22,290 | THQ, Inc.* | 743,817 | |||||||||
| 80,220 | TIBCO Software, Inc.* | 731,606 | |||||||||
| 53,770 | United Online, Inc. | 775,901 | |||||||||
| 15,048 | Varian Semiconductor Equipment Associates, Inc.* | 998,585 | |||||||||
| 40,548 | VASCO Data Security International, Inc.* | 867,322 | |||||||||
| 15,701 | WebEx Communications, Inc.* | 890,875 | |||||||||
| 80,264,108 | |||||||||||
| Materials—0.7% | |||||||||||
| 6,289 | Innospec, Inc. | 337,656 | |||||||||
| 18,833 | Sigma-Aldrich Corp. | 792,493 | |||||||||
| 1,130,149 | |||||||||||
| Telecommunication Services—1.6% | |||||||||||
| 11,819 | Golden Telecom, Inc. | 692,712 | |||||||||
| 25,054 | Leap Wireless International, Inc.* | 1,912,371 | |||||||||
| 2,605,083 | |||||||||||
| Total Investments (Cost $149,129,123)—100.2% | 159,839,788 | ||||||||||
| Liabilities in excess of other assets—(0.2%) | (240,843 | ) | |||||||||
| Net Assets—100.0% | $ | 159,598,945 | |||||||||
* Non-income producing security.
COUNTRY BREAKDOWN
April 30, 2007 (Unaudited)
| Value | Net Assets | ||||||||||
| United States | $ | 152,193,514 | 95.4 | % | |||||||
| Bermuda | 7,112,376 | 4.5 | |||||||||
| Cayman Islands | 533,898 | 0.3 | |||||||||
| Total investments | 159,839,788 | 100.2 | |||||||||
| Liabilities in excess of other assets | (240,843 | ) | (0.2 | ) | |||||||
| Net Assets | $ | 159,598,945 | 100.0 | % | |||||||
See Notes to Financial Statements.
20
Schedule of Investments
PowerShares Dynamic MagniQuant Portfolio
April 30, 2007
| Number of Shares | Value | ||||||||||
| Common Stocks—99.8% | |||||||||||
| Consumer Discretionary—14.3% | |||||||||||
| 12,853 | American Eagle Outfitters, Inc. | $ | 378,778 | ||||||||
| 7,039 | Autoliv, Inc. | 409,318 | |||||||||
| 11,599 | Brinker International, Inc. | 360,729 | |||||||||
| 11,164 | Brown Shoe Co., Inc. | 301,205 | |||||||||
| 13,151 | Charlotte Russe Holding, Inc.* | 359,417 | |||||||||
| 8,179 | Coach, Inc.* | 399,381 | |||||||||
| 6,426 | Deckers Outdoor Corp.* | 486,641 | |||||||||
| 8,085 | Genuine Parts Co. | 399,480 | |||||||||
| 15,100 | Hanesbrands, Inc.* | 401,509 | |||||||||
| 13,946 | Hasbro, Inc. | 440,833 | |||||||||
| 17,102 | Helen of Troy Ltd. (Bermuda)* | 388,215 | |||||||||
| 7,573 | International Speedway Corp., Class A | 374,106 | |||||||||
| 4,863 | J.C. Penney Co., Inc. | 384,615 | |||||||||
| 8,259 | Marriott International, Inc., Class A | 373,389 | |||||||||
| 15,178 | Mattel, Inc. | 429,537 | |||||||||
| 12,878 | Newell Rubbermaid, Inc. | 394,968 | |||||||||
| 7,021 | Nordstrom, Inc. | 385,593 | |||||||||
| 3,846 | Omnicom Group, Inc. | 402,715 | |||||||||
| 12,530 | Payless ShoeSource, Inc.* | 399,707 | |||||||||
| 4,669 | Polo Ralph Lauren Corp. | 430,062 | |||||||||
| 11,979 | Ross Stores, Inc. | 397,104 | |||||||||
| 27,786 | Sinclair Broadcast Group, Inc., Class A | 453,745 | |||||||||
| 6,029 | Starwood Hotels & Resorts Worldwide, Inc. | 404,064 | |||||||||
| 15,892 | Tempur-Pedic International, Inc. | 412,715 | |||||||||
| 14,357 | TJX Cos., Inc. | 400,417 | |||||||||
| 5,080 | VF Corp. | 446,075 | |||||||||
| 11,632 | Walt Disney (The) Co. | 406,887 | |||||||||
| 14,095 | Wolverine World Wide, Inc. | 402,835 | |||||||||
| 6,755 | Yum! Brands, Inc. | 417,864 | |||||||||
| 11,641,904 | |||||||||||
| Consumer Staples—7.5% | |||||||||||
| 6,382 | Altria Group, Inc. | 439,847 | |||||||||
| 9,760 | Campbell Soup Co. | 381,616 | |||||||||
| 16,010 | ConAgra Foods, Inc. | 393,526 | |||||||||
| 13,119 | Dean Foods Co. | 477,925 | |||||||||
| 7,148 | General Mills, Inc. | 428,165 | |||||||||
| 8,658 | H.J. Heinz Co. | 407,878 | |||||||||
| 8,085 | J.M. Smucker (The) Co. | 451,305 | |||||||||
| 10,385 | McCormick & Co., Inc. | 385,491 | |||||||||
| 7,859 | NBTY, Inc.* | 388,313 | |||||||||
| 6,329 | PepsiCo, Inc. | 418,284 | |||||||||
| 6,305 | Procter & Gamble (The) Co. | 405,475 | |||||||||
| 11,628 | Safeway, Inc. | 422,096 | |||||||||
| 186 | Seaboard Corp. | 463,698 | |||||||||
| 6,646 | USANA Health Sciences, Inc.* | 264,777 | |||||||||
| 6,778 | UST, Inc. | 384,177 | |||||||||
| 6,112,573 | |||||||||||
| Energy—0.5% | |||||||||||
| 4,136 | SEACOR Holdings, Inc.* | 394,078 | |||||||||
| Number of Shares | Value | ||||||||||
| Common Stocks (Continued) | |||||||||||
| Financials—32.7% | |||||||||||
| 6,037 | A.G. Edwards, Inc. | $ | 437,381 | ||||||||
| 7,097 | ACE Ltd. (Cayman Islands) | 421,988 | |||||||||
| 4,568 | AMBAC Financial Group, Inc. | 419,342 | |||||||||
| 11,263 | American Financial Group, Inc. | 397,246 | |||||||||
| 6,189 | Arch Capital Group Ltd. (Bermuda)* | 450,683 | |||||||||
| 11,044 | Argonaut Group, Inc.* | 371,189 | |||||||||
| 7,573 | Assurant, Inc. | 435,675 | |||||||||
| 7,733 | Bank of America Corp. | 393,610 | |||||||||
| 9,615 | Bank of New York (The) Co., Inc. | 389,215 | |||||||||
| 11,301 | CB Richard Ellis Group, Inc., Class A* | 382,539 | |||||||||
| 12,866 | Chittenden Corp. | 373,886 | |||||||||
| 7,709 | Chubb Corp. | 414,975 | |||||||||
| 10,366 | City Holding Co. | 393,597 | |||||||||
| 9,732 | CNA Financial Corp.* | 454,192 | |||||||||
| 18,810 | CNA Surety Corp.* | 388,238 | |||||||||
| 6,488 | Comerica, Inc. | 401,672 | |||||||||
| 13,642 | Commerce Group, Inc. | 444,866 | |||||||||
| 9,986 | Delphi Financial Group, Inc., Class A | 426,402 | |||||||||
| 11,266 | Eaton Vance Corp. | 430,587 | |||||||||
| 4,132 | Everest Re Group Ltd. (Bermuda) | 415,844 | |||||||||
| 10,188 | FBL Financial Group, Inc., Class A | 394,683 | |||||||||
| 3,303 | Franklin Resources, Inc. | 433,717 | |||||||||
| 10,576 | GAMCO Investors, Inc., Class A | 482,477 | |||||||||
| 1,888 | Goldman Sachs Group (The), Inc. | 412,736 | |||||||||
| 11,745 | Harleysville Group, Inc. | 358,692 | |||||||||
| 4,236 | Hartford Financial Services Group (The), Inc. | 428,683 | |||||||||
| 12,682 | HCC Insurance Holdings, Inc. | 388,830 | |||||||||
| 19,289 | Horace Mann Educators Corp. | 405,841 | |||||||||
| 13,846 | IPC Holdings Ltd. (Bermuda) | 415,103 | |||||||||
| 8,010 | JPMorgan Chase & Co. | 417,321 | |||||||||
| 10,459 | KeyCorp | 373,177 | |||||||||
| 5,171 | Lehman Brothers Holdings, Inc. | 389,273 | |||||||||
| 5,800 | Lincoln National Corp. | 412,670 | |||||||||
| 9,271 | Loews Corp. | 438,704 | |||||||||
| 831 | Markel Corp.* | 381,354 | |||||||||
| 9,051 | Mellon Financial Corp. | 388,559 | |||||||||
| 4,590 | Merrill Lynch & Co, Inc. | 414,156 | |||||||||
| 6,263 | MetLife, Inc. | 411,479 | |||||||||
| 6,062 | Moody's Corp. | 400,819 | |||||||||
| 7,442 | Nationwide Financial Services, Inc., Class A | 425,161 | |||||||||
| 10,448 | Odyssey Re Holdings Corp. | 437,771 | |||||||||
| 13,224 | Ohio Casualty Corp. | 418,407 | |||||||||
| 17,857 | Old Republic International Corp. | 379,818 | |||||||||
| 5,768 | PartnerRe Ltd. (Bermuda) | 415,411 | |||||||||
| 8,647 | Philadelphia Consolidated Holding Co.* | 375,280 | |||||||||
| 5,944 | Piper Jaffray Cos., Inc.* | 379,287 | |||||||||
| 8,594 | PMI Group (The), Inc. | 416,551 | |||||||||
| 6,499 | Principal Financial Group, Inc. | 412,622 | |||||||||
| 17,557 | Progressive (The) Corp. | 405,040 | |||||||||
| 4,421 | Prudential Financial, Inc. | 419,995 | |||||||||
| 6,962 | Reinsurance Group of America, Inc. | 433,802 | |||||||||
See Notes to Financial Statements.
21
Schedule of Investments (Continued)
PowerShares Dynamic MagniQuant Portfolio
April 30, 2007
| Number of Shares | Value | ||||||||||
| Common Stocks (Continued) | |||||||||||
| 7,145 | RLI Corp. | $ | 397,905 | ||||||||
| 5,989 | Safeco Corp. | 399,706 | |||||||||
| 8,815 | Safety Insurance Group, Inc. | 353,129 | |||||||||
| 6,432 | SEI Investments Co. | 392,545 | |||||||||
| 16,422 | Selective Insurance Group | 428,286 | |||||||||
| 5,905 | State Street Corp. | 406,677 | |||||||||
| 4,699 | SunTrust Banks, Inc. | 396,690 | |||||||||
| 6,322 | Transatlantic Holdings, Inc. | 439,316 | |||||||||
| 7,712 | Travelers Cos. (The), Inc. | 417,219 | |||||||||
| 17,225 | United America Indemnity Ltd., Class A (Cayman Islands)* | 430,281 | |||||||||
| 12,046 | W.R. Berkley Corp. | 391,375 | |||||||||
| 10,283 | Willis Group Holdings Ltd. (Bermuda) | 421,809 | |||||||||
| 5,606 | XL Capital Ltd., Class A (Cayman Islands) | 437,156 | |||||||||
| 8,115 | Zenith National Insurance Corp. | 375,319 | |||||||||
| 26,597,959 | |||||||||||
| Health Care—9.3% | |||||||||||
| 8,874 | Aetna, Inc. | 416,013 | |||||||||
| 11,685 | AMERIGROUP Corp.* | 328,699 | |||||||||
| 12,542 | Applera Corp. - Applied Biosystems Group | 391,812 | |||||||||
| 12,503 | Apria Healthcare Group, Inc.* | 396,845 | |||||||||
| 8,206 | Baxter International, Inc. | 464,706 | |||||||||
| 5,269 | Becton, Dickinson & Co. | 414,618 | |||||||||
| 2,841 | Cigna Corp. | 442,031 | |||||||||
| 7,332 | Coventry Health Care, Inc.* | 424,010 | |||||||||
| 12,550 | DENTSPLY International, Inc. | 419,296 | |||||||||
| 7,511 | Forest Laboratories, Inc.* | 399,660 | |||||||||
| 6,372 | Johnson & Johnson | 409,210 | |||||||||
| 7,123 | McKesson Corp. | 419,046 | |||||||||
| 9,518 | Merck & Co., Inc. | 489,606 | |||||||||
| 15,954 | Pfizer, Inc. | 422,143 | |||||||||
| 7,708 | UnitedHealth Group, Inc. | 408,986 | |||||||||
| 7,296 | Waters Corp.* | 433,601 | |||||||||
| 5,057 | WellCare Health Plans, Inc.* | 407,544 | |||||||||
| 4,780 | Zimmer Holdings, Inc.* | 432,494 | |||||||||
| 7,520,320 | |||||||||||
| Industrials—13.8% | |||||||||||
| 6,915 | Acuity Brands, Inc. | 408,815 | |||||||||
| 6,016 | Avery Dennison Corp. | 374,195 | |||||||||
| 4,527 | Boeing Co. | 421,011 | |||||||||
| 6,930 | Cascade Corp. | 429,452 | |||||||||
| 5,393 | Consolidated Graphics, Inc.* | 405,823 | |||||||||
| 8,538 | Cooper Industries Ltd., Class A (Bermuda) | 424,851 | |||||||||
| 13,625 | Copart, Inc.* | 394,853 | |||||||||
| 7,863 | Dollar Thrifty Automotive Group* | 368,617 | |||||||||
| 15,720 | Ennis, Inc. | 384,354 | |||||||||
| 10,340 | Equifax, Inc. | 411,532 | |||||||||
| 8,571 | Honeywell International, Inc. | 464,377 | |||||||||
| 13,254 | Horizon Lines, Inc., Class A | 450,769 | |||||||||
| 6,705 | ITT Corp. | 427,846 | |||||||||
| 8,062 | John H. Harland Co. | 424,061 | |||||||||
| Number of Shares | Value | ||||||||||
| Common Stocks (Continued) | |||||||||||
| 4,003 | Lockheed Martin Corp. | $ | 384,848 | ||||||||
| 6,437 | Manitowoc (The) Co., Inc. | 439,197 | |||||||||
| 7,981 | McDermott International, Inc. (Panama)* | 428,260 | |||||||||
| 5,492 | Northrop Grumman Corp. | 404,431 | |||||||||
| 11,005 | Perini Corp.* | 468,812 | |||||||||
| 8,521 | Pitney Bowes, Inc. | 409,008 | |||||||||
| 10,611 | R.R. Donnelley & Sons Co. | 426,562 | |||||||||
| 5,971 | Rockwell Collins, Inc. | 392,116 | |||||||||
| 5,977 | Teleflex, Inc. | 429,328 | |||||||||
| 7,596 | Thomas & Betts Corp.* | 413,830 | |||||||||
| 17,326 | Tredegar Corp. | 404,909 | |||||||||
| 6,051 | United Technologies Corp. | 406,204 | |||||||||
| 8,466 | Watson Wyatt Worldwide, Inc., Class A | 399,003 | |||||||||
| 11,197,064 | |||||||||||
| Information Technology—12.4% | |||||||||||
| 12,432 | Ansoft Corp.* | 401,429 | |||||||||
| 34,204 | BEA Systems, Inc.* | 403,265 | |||||||||
| 12,773 | BMC Software, Inc.* | 413,462 | |||||||||
| 48,659 | Brocade Communications Systems, Inc.* | 475,399 | |||||||||
| 14,857 | Cisco Systems, Inc.* | 397,276 | |||||||||
| 15,229 | Convergys Corp.* | 384,685 | |||||||||
| 12,129 | Dolby Laboratories, Inc., Class A* | 429,609 | |||||||||
| 14,110 | Electronic Data Systems Corp. | 412,576 | |||||||||
| 6,534 | Factset Research Systems, Inc. | 401,906 | |||||||||
| 10,183 | Fair Isaac Corp. | 363,635 | |||||||||
| 7,474 | Fiserv, Inc.* | 397,393 | |||||||||
| 10,013 | Hewlett-Packard Co. | 421,948 | |||||||||
| 20,165 | Ingram Micro, Inc., Class A* | 395,637 | |||||||||
| 4,182 | International Business Machines Corp. | 427,442 | |||||||||
| 6,433 | Lexmark International, Inc., Class A* | 350,599 | |||||||||
| 11,263 | ManTech International Corp., Class A* | 345,549 | |||||||||
| 4,546 | Mettler Toledo International, Inc.* | 443,781 | |||||||||
| 14,144 | Microsoft Corp. | 423,471 | |||||||||
| 8,480 | NCR Corp.* | 427,392 | |||||||||
| 22,421 | QLogic Corp.* | 400,887 | |||||||||
| 15,500 | Synopsys, Inc.* | 428,730 | |||||||||
| 10,570 | Syntel, Inc. | 370,584 | |||||||||
| 12,745 | Total System Services, Inc. | 395,860 | |||||||||
| 20,284 | Western Digital Corp.* | 358,621 | |||||||||
| 22,860 | Xerox Corp.* | 422,910 | |||||||||
| 10,094,046 | |||||||||||
| Materials—6.6% | |||||||||||
| 9,570 | Albemarle Corp. | 406,247 | |||||||||
| 6,932 | Cleveland-Cliffs, Inc. | 480,317 | |||||||||
| 7,714 | E.I. du Pont de Nemours & Co. | 379,297 | |||||||||
| 6,578 | Greif, Inc., Class A | 365,737 | |||||||||
| 19,445 | Hercules, Inc.* | 366,344 | |||||||||
| 10,994 | International Paper Co. | 414,694 | |||||||||
| 6,346 | Nucor Corp. | 402,717 | |||||||||
| 7,696 | OM Group, Inc.* | 404,271 | |||||||||
| 6,315 | Praxair, Inc. | 407,633 | |||||||||
See Notes to Financial Statements.
22
Schedule of Investments (Continued)
PowerShares Dynamic MagniQuant Portfolio
April 30, 2007
| Number of Shares | Value | ||||||||||
| Common Stocks (Continued) | |||||||||||
| 12,234 | Sealed Air Corp. | $ | 402,499 | ||||||||
| 9,624 | Sigma-Aldrich Corp. | 404,978 | |||||||||
| 10,813 | Sonoco Products Co. | 461,066 | |||||||||
| 4,390 | United States Steel Corp. | 445,761 | |||||||||
| 5,341,561 | |||||||||||
| Telecommunication Services—0.5% | |||||||||||
| 7,314 | Telephone & Data Systems, Inc. | 416,532 | |||||||||
| Utilities—2.2% | |||||||||||
| 8,702 | Edison International | 455,550 | |||||||||
| 9,001 | Northwest Natural Gas Co. | 457,340 | |||||||||
| 8,556 | PG&E Corp. | 432,934 | |||||||||
| 8,350 | Wisconsin Energy Corp. | 407,397 | |||||||||
| 1,753,221 | |||||||||||
| Total Investments (Cost $77,753,906)—99.8% | 81,069,258 | ||||||||||
| Other assets less liabilities—0.2% | 199,745 | ||||||||||
| Net Assets—100.0% | $ | 81,269,003 | |||||||||
* Non-income producing security.
COUNTRY BREAKDOWN
April 30, 2007 (Unaudited)
| Value | Net Assets | ||||||||||
| United States | $ | 76,419,657 | 94.1 | % | |||||||
| Bermuda | 2,931,916 | 3.6 | |||||||||
| Cayman Islands | 1,289,425 | 1.6 | |||||||||
| Panama | 428,260 | 0.5 | |||||||||
| Total investments | 81,069,258 | 99.8 | |||||||||
| Other assets less liabilities | 199,745 | 0.2 | |||||||||
| Net Assets | $ | 81,269,003 | 100.0 | % | |||||||
See Notes to Financial Statements.
23
Schedule of Investments
PowerShares FTSE RAFI US 1000 Portfolio
April 30, 2007
| Number of Shares | Value | ||||||||||
| Common Stocks—99.9% | |||||||||||
| Consumer Discretionary—13.4% | |||||||||||
| 2,727 | Abercrombie & Fitch Co., Class A | $ | 222,687 | ||||||||
| 7,530 | Advance Auto Parts, Inc. | 310,236 | |||||||||
| 7,909 | Amazon.com, Inc.* | 485,059 | |||||||||
| 9,718 | American Axle & Manufacturing Holdings, Inc. | 271,618 | |||||||||
| 5,630 | American Eagle Outfitters, Inc. | 165,916 | |||||||||
| 8,016 | American Greetings Corp., Class A | 204,007 | |||||||||
| 4,836 | AnnTaylor Stores Corp.* | 186,089 | |||||||||
| 4,406 | Apollo Group, Inc., Class A* | 208,404 | |||||||||
| 22,055 | ArvinMeritor, Inc. | 455,436 | |||||||||
| 10,008 | Asbury Automotive Group, Inc. | 287,930 | |||||||||
| 8,153 | Autoliv, Inc. | 474,097 | |||||||||
| 55,680 | Autonation, Inc.* | 1,138,099 | |||||||||
| 3,797 | AutoZone, Inc.* | 505,153 | |||||||||
| 7,036 | Barnes & Noble, Inc. | 278,133 | |||||||||
| 6,053 | Beazer Homes USA, Inc. | 202,049 | |||||||||
| 10,615 | Bed Bath & Beyond, Inc.* | 432,455 | |||||||||
| 12,986 | Belo Corp., Class A | 250,240 | |||||||||
| 24,796 | Best Buy Co., Inc. | 1,156,733 | |||||||||
| 10,633 | Big Lots, Inc.* | 342,383 | |||||||||
| 4,794 | Black & Decker Corp. | 434,912 | |||||||||
| 62,510 | Blockbuster, Inc., Class A* | 387,562 | |||||||||
| 37,601 | Blockbuster, Inc., Class B* | 217,710 | |||||||||
| 9,808 | Borders Group, Inc. | 207,047 | |||||||||
| 3,930 | BorgWarner, Inc. | 306,186 | |||||||||
| 3,828 | Boyd Gaming Corp. | 174,174 | |||||||||
| 8,840 | Brinker International, Inc. | 274,924 | |||||||||
| 11,407 | Brunswick Corp. | 373,693 | |||||||||
| 6,744 | Burger King Holdings, Inc. | 158,282 | |||||||||
| 10,691 | Cablevision Systems Corp., Class A* | 350,451 | |||||||||
| 5,874 | Career Education Corp.* | 173,518 | |||||||||
| 6,764 | CarMax, Inc.* | 168,559 | |||||||||
| 40,935 | Carnival Corp. (Panama) | 2,001,312 | |||||||||
| 3,420 | CBRL Group, Inc. | 152,464 | |||||||||
| 94,829 | CBS Corp., Class B | 3,012,717 | |||||||||
| 14,732 | Centex Corp. | 659,552 | |||||||||
| 14,766 | Charming Shoppes, Inc.* | 184,575 | |||||||||
| 98,291 | Charter Communications, Inc., Class A* | 296,839 | |||||||||
| 23,794 | Circuit City Stores, Inc. | 415,205 | |||||||||
| 4,431 | Claire's Stores, Inc. | 144,318 | |||||||||
| 34,124 | Clear Channel Communications, Inc. | 1,209,013 | |||||||||
| 11,251 | Clear Channel Outdoor Holdings, Inc., Class A* | 321,216 | |||||||||
| 4,124 | Coach, Inc.* | 201,375 | |||||||||
| 117,344 | Comcast Corp., Class A* | 3,128,392 | |||||||||
| 60,916 | Comcast Corp., Special Class A* | 1,608,182 | |||||||||
| 15,067 | Cooper Tire & Rubber Co. | 291,245 | |||||||||
| 31,690 | D.R. Horton, Inc. | 702,884 | |||||||||
| 7,781 | Darden Restaurants, Inc. | 322,756 | |||||||||
| 12,444 | Dillard's, Inc., Class A | 430,936 | |||||||||
| 40,042 | DIRECTV Group (The), Inc.* | 954,601 | |||||||||
| Number of Shares | Value | ||||||||||
| Common Stocks (Continued) | |||||||||||
| 18,776 | Discovery Holding Co., Class A* | $ | 408,378 | ||||||||
| 27,381 | Dollar General Corp. | 584,584 | |||||||||
| 7,254 | Dollar Tree Stores, Inc.* | 285,227 | |||||||||
| 5,964 | Dow Jones & Co., Inc. | 216,672 | |||||||||
| 56,127 | Eastman Kodak Co. | 1,398,124 | |||||||||
| 11,531 | EchoStar Communications Corp., Class A* | 536,537 | |||||||||
| 7,136 | EW Scripps Co., Class A | 308,989 | |||||||||
| 21,302 | Expedia, Inc.* | 503,153 | |||||||||
| 12,135 | Family Dollar Stores, Inc. | 386,378 | |||||||||
| 36,313 | Federated Department Stores, Inc. | 1,594,867 | |||||||||
| 15,717 | Foot Locker, Inc. | 373,907 | |||||||||
| 1,394,037 | Ford Motor Co. | 11,208,058 | |||||||||
| 9,901 | Fortune Brands, Inc. | 793,070 | |||||||||
| 10,263 | Furniture Brands International, Inc. | 165,029 | |||||||||
| 6,602 | GameStop Corp., Class A* | 218,988 | |||||||||
| 21,564 | Gannett Co., Inc. | 1,230,442 | |||||||||
| 62,146 | Gap (The), Inc. | 1,115,521 | |||||||||
| 2,989 | Garmin Ltd. (Cayman Islands) | 173,930 | |||||||||
| 382,478 | General Motors Corp. | 11,944,789 | |||||||||
| 16,276 | Genuine Parts Co. | 804,197 | |||||||||
| 2,732 | Getty Images, Inc.* | 142,064 | |||||||||
| 31,227 | Goodyear Tire & Rubber (The) Co.* | 1,038,610 | |||||||||
| 5,652 | Group 1 Automotive, Inc. | 231,732 | |||||||||
| 27,367 | H&R Block, Inc. | 618,768 | |||||||||
| 16,698 | Hanesbrands, Inc.* | 444,000 | |||||||||
| 9,693 | Harley-Davidson, Inc. | 613,761 | |||||||||
| 1,750 | Harman International Industries, Inc. | 213,308 | |||||||||
| 8,800 | Harrah's Entertainment, Inc. | 750,640 | |||||||||
| 10,394 | Hasbro, Inc. | 328,554 | |||||||||
| 7,051 | Hearst-Argyle Television, Inc. | 187,768 | |||||||||
| 13,153 | Hilton Hotels Corp. | 447,202 | |||||||||
| 138,763 | Home Depot (The), Inc. | 5,254,956 | |||||||||
| 11,615 | Hovnanian Enterprises, Inc., Class A* | 278,644 | |||||||||
| 23,944 | IAC/InterActiveCorp* | 912,745 | |||||||||
| 37,309 | Idearc, Inc. | 1,296,488 | |||||||||
| 9,019 | International Game Technology | 343,985 | |||||||||
| 34,362 | Interpublic Group of Cos., Inc.* | 435,710 | |||||||||
| 16,545 | J.C. Penney Co., Inc. | 1,308,544 | |||||||||
| 2,432 | Jack in the Box, Inc.* | 162,020 | |||||||||
| 14,851 | Johnson Controls, Inc. | 1,519,703 | |||||||||
| 12,493 | Jones Apparel Group, Inc. | 417,141 | |||||||||
| 9,762 | KB Home | 430,602 | |||||||||
| 4,524 | Kellwood Co. | 127,486 | |||||||||
| 16,042 | Kohl's Corp.* | 1,187,750 | |||||||||
| 3,724 | Lamar Advertising Co., Class A | 224,706 | |||||||||
| 1,934 | Las Vegas Sands Corp.* | 164,757 | |||||||||
| 10,476 | La-Z-Boy, Inc. | 122,464 | |||||||||
| 21,913 | Lear Corp.* | 804,645 | |||||||||
| 20,110 | Leggett & Platt, Inc. | 472,987 | |||||||||
| 16,796 | Lennar Corp., Class A | 717,357 | |||||||||
| 11,660 | Liberty Global, Inc., Class A* | 418,477 | |||||||||
| 11,671 | Liberty Global, Inc., Series C* | 389,928 | |||||||||
See Notes to Financial Statements.
24
Schedule of Investments (Continued)
PowerShares FTSE RAFI US 1000 Portfolio
April 30, 2007
| Number of Shares | Value | ||||||||||
| Common Stocks (Continued) | |||||||||||
| 2,792 | Liberty Media Corp. Capital, Series A* | $ | 315,412 | ||||||||
| 53,214 | Liberty Media Corp. Interactive, Series A* | 1,331,946 | |||||||||
| 36,148 | Limited Brands, Inc. | 996,600 | |||||||||
| 7,559 | Live Nation, Inc.* | 153,372 | |||||||||
| 7,773 | Liz Claiborne, Inc. | 347,609 | |||||||||
| 75,436 | Lowe's Cos., Inc. | 2,305,324 | |||||||||
| 5,965 | M.D.C. Holdings, Inc. | 305,766 | |||||||||
| 9,799 | Marriott International, Inc., Class A | 443,013 | |||||||||
| 22,319 | Mattel, Inc. | 631,628 | |||||||||
| 5,203 | McClatchy Co., Class A | 150,367 | |||||||||
| 63,229 | McDonald's Corp. | 3,052,696 | |||||||||
| 13,265 | McGraw-Hill (The) Cos., Inc. | 869,255 | |||||||||
| 2,356 | Meredith Corp. | 136,460 | |||||||||
| 4,320 | Meritage Homes Corp.* | 150,379 | |||||||||
| 9,751 | MGM MIRAGE* | 655,755 | |||||||||
| 6,212 | Mohawk Industries, Inc.* | 560,074 | |||||||||
| 16,272 | New York Times (The) Co., Class A | 380,765 | |||||||||
| 25,043 | Newell Rubbermaid, Inc. | 768,069 | |||||||||
| 79,981 | News Corp., Class A | 1,790,775 | |||||||||
| 36,398 | News Corp., Class B | 873,552 | |||||||||
| 21,178 | NIKE, Inc., Class B | 1,140,647 | |||||||||
| 9,216 | Nordstrom, Inc. | 506,143 | |||||||||
| 553 | NVR, Inc.* | 455,672 | |||||||||
| 25,018 | Office Depot, Inc.* | 841,105 | |||||||||
| 9,218 | OfficeMax, Inc. | 453,710 | |||||||||
| 8,571 | Omnicom Group, Inc. | 897,469 | |||||||||
| 5,334 | O'Reilly Automotive, Inc.* | 189,890 | |||||||||
| 5,890 | OSI Restaurant Partners, Inc. | 234,481 | |||||||||
| 6,398 | Payless ShoeSource, Inc.* | 204,096 | |||||||||
| 9,166 | PEP Boys-Manny Moe & Jack | 170,946 | |||||||||
| 6,598 | PetSmart, Inc. | 218,988 | |||||||||
| 22,084 | Pier 1 Imports, Inc. | 166,734 | |||||||||
| 2,875 | Polaris Industries, Inc. | 145,274 | |||||||||
| 2,722 | Polo Ralph Lauren Corp. | 250,723 | |||||||||
| 27,995 | Pulte Homes, Inc. | 753,066 | |||||||||
| 12,944 | RadioShack Corp. | 376,282 | |||||||||
| 51,100 | Regal Entertainment Group, Class A | 1,111,425 | |||||||||
| 11,683 | Rent-A-Center, Inc.* | 325,255 | |||||||||
| 7,741 | Ross Stores, Inc. | 256,614 | |||||||||
| 17,288 | Royal Caribbean Cruises Ltd. (Liberia) | 718,662 | |||||||||
| 5,707 | Ryland Group, Inc. | 252,820 | |||||||||
| 22,176 | Saks, Inc. | 464,365 | |||||||||
| 20,965 | Sally Beauty Holdings, Inc.* | 205,876 | |||||||||
| 5,904 | Scholastic Corp.* | 182,256 | |||||||||
| 11,696 | Sears Holdings Corp.* | 2,232,883 | |||||||||
| 18,586 | Service Corp. International | 225,820 | |||||||||
| 28,823 | ServiceMaster (The) Co. | 443,586 | |||||||||
| 7,764 | Sherwin-Williams (The) Co. | 495,110 | |||||||||
| 27,583 | Six Flags, Inc.* | 164,395 | |||||||||
| 4,648 | Snap-On, Inc. | 253,316 | |||||||||
| 10,086 | Sonic Automotive, Inc., Class A | 288,359 | |||||||||
| 9,265 | Standard-Pacific Corp. | 193,175 | |||||||||
| Number of Shares | Value | ||||||||||
| Common Stocks (Continued) | |||||||||||
| 6,348 | Stanley Works (The) | $ | 369,961 | ||||||||
| 33,055 | Staples, Inc. | 819,764 | |||||||||
| 15,068 | Starbucks Corp.* | 467,409 | |||||||||
| 11,518 | Starwood Hotels & Resorts Worldwide, Inc. | 771,936 | |||||||||
| 1,683 | Station Casinos, Inc. | 146,421 | |||||||||
| 50,605 | Sun-Times Media Group, Inc., Class A | 308,691 | |||||||||
| 6,023 | Talbots (The), Inc. | 141,540 | |||||||||
| 52,090 | Target Corp. | 3,092,583 | |||||||||
| 9,986 | Tenneco, Inc.* | 299,081 | |||||||||
| 5,916 | Tiffany & Co. | 282,134 | |||||||||
| 4,706 | Tim Hortons, Inc. | 148,380 | |||||||||
| 5,133 | Timberland Co., Class A* | 132,483 | |||||||||
| 216,491 | Time Warner, Inc. | 4,466,210 | |||||||||
| 29,836 | TJX Cos., Inc. | 832,126 | |||||||||
| 15,809 | Toll Brothers, Inc.* | 470,792 | |||||||||
| 31,765 | Tribune Co. | 1,041,892 | |||||||||
| 25,231 | TRW Automotive Holdings Corp.* | 935,061 | |||||||||
| 6,474 | Tupperware Brands Corp. | 182,049 | |||||||||
| 16,072 | United Auto Group, Inc. | 325,940 | |||||||||
| 7,475 | VF Corp. | 656,380 | |||||||||
| 33,304 | Viacom, Inc., Class B* | 1,373,790 | |||||||||
| 18,526 | Virgin Media, Inc. | 467,411 | |||||||||
| 74,989 | Visteon Corp.* | 683,900 | |||||||||
| 159,091 | Walt Disney (The) Co. | 5,565,004 | |||||||||
| 9,719 | Warner Music Group Corp. | 167,167 | |||||||||
| 523 | Washington Post (The) Co., Class B | 389,112 | |||||||||
| 9,364 | WCI Communities, Inc.* | 204,510 | |||||||||
| 10,739 | Wendy's International, Inc. | 404,860 | |||||||||
| 9,171 | Whirlpool Corp. | 972,401 | |||||||||
| 7,806 | Williams-Sonoma, Inc. | 274,927 | |||||||||
| 9,919 | Wyndham Worldwide Corp.* | 343,197 | |||||||||
| 10,763 | Yum! Brands, Inc. | 665,799 | |||||||||
| 7,481 | Zale Corp.* | 208,795 | |||||||||
| 141,749,332 | |||||||||||
| Consumer Staples—11.5% | |||||||||||
| 11,618 | Alberto-Culver Co. | 282,201 | |||||||||
| 165,552 | Altria Group, Inc. | 11,409,844 | |||||||||
| 45,840 | Anheuser-Busch Cos., Inc. | 2,254,870 | |||||||||
| 50,633 | Archer-Daniels-Midland Co. | 1,959,497 | |||||||||
| 20,698 | Avon Products, Inc. | 823,780 | |||||||||
| 11,922 | BJ's Wholesale Club, Inc.* | 411,667 | |||||||||
| 1,600 | Brown-Forman Corp., Class A | 107,168 | |||||||||
| 3,497 | Brown-Forman Corp., Class B | 223,563 | |||||||||
| 12,283 | Bunge Ltd. (Bermuda) | 930,560 | |||||||||
| 21,703 | Campbell Soup Co. | 848,587 | |||||||||
| 10,917 | Chiquita Brands International, Inc. | 161,899 | |||||||||
| 8,791 | Clorox Co. | 589,700 | |||||||||
| 118,450 | Coca-Cola (The) Co. | 6,181,906 | |||||||||
| 65,441 | Coca-Cola Enterprises, Inc. | 1,435,776 | |||||||||
| 21,535 | Colgate-Palmolive Co. | 1,458,781 | |||||||||
| 96,542 | ConAgra Foods, Inc. | 2,373,002 | |||||||||
See Notes to Financial Statements.
25
Schedule of Investments (Continued)
PowerShares FTSE RAFI US 1000 Portfolio
April 30, 2007
| Number of Shares | Value | ||||||||||
| Common Stocks (Continued) | |||||||||||
| 17,363 | Constellation Brands, Inc., Class A* | $ | 389,105 | ||||||||
| 6,166 | Corn Products International, Inc. | 245,530 | |||||||||
| 35,723 | Costco Wholesale Corp. | 1,913,681 | |||||||||
| 88,503 | CVS Corp. | 3,207,349 | |||||||||
| 14,903 | Dean Foods Co. | 542,916 | |||||||||
| 21,249 | Del Monte Foods Co. | 246,488 | |||||||||
| 2,573 | Energizer Holdings, Inc.* | 250,044 | |||||||||
| 9,552 | Estee Lauder (The) Cos., Inc., Class A | 491,164 | |||||||||
| 11,635 | Fresh Del Monte Produce, Inc. (Cayman Islands) | 237,005 | |||||||||
| 25,830 | General Mills, Inc. | 1,547,217 | |||||||||
| 11,766 | Great Atlantic & Pacific Tea Co., Inc.* | 378,748 | |||||||||
| 29,050 | H.J. Heinz Co. | 1,368,546 | |||||||||
| 11,743 | Hershey (The) Co. | 645,395 | |||||||||
| 9,889 | Hormel Foods Corp. | 376,672 | |||||||||
| 3,910 | J.M. Smucker (The) Co. | 218,256 | |||||||||
| 26,219 | Kellogg Co. | 1,387,247 | |||||||||
| 33,028 | Kimberly-Clark Corp. | 2,350,603 | |||||||||
| 700,781 | Kraft Foods, Inc., Class A | 23,455,139 | |||||||||
| 124,118 | Kroger (The) Co. | 3,662,722 | |||||||||
| 12,653 | Loews Corp. - Carolina Group | 968,334 | |||||||||
| 4,840 | Longs Drug Stores Corp. | 264,942 | |||||||||
| 6,914 | McCormick & Co., Inc. | 256,648 | |||||||||
| 6,235 | Molson Coors Brewing Co., Class B | 587,836 | |||||||||
| 5,374 | Nash Finch Co. | 209,425 | |||||||||
| 2,890 | NBTY, Inc.* | 142,795 | |||||||||
| 3,649 | Pantry (The), Inc.* | 164,169 | |||||||||
| 17,522 | Pathmark Stores, Inc.* | 221,128 | |||||||||
| 22,397 | Pepsi Bottling Group (The), Inc. | 734,846 | |||||||||
| 13,582 | PepsiAmericas, Inc. | 327,869 | |||||||||
| 68,326 | PepsiCo, Inc. | 4,515,665 | |||||||||
| 9,283 | Performance Food Group Co.* | 290,094 | |||||||||
| 7,038 | Pilgrim's Pride Corp. | 256,957 | |||||||||
| 111,858 | Procter & Gamble (The) Co. | 7,193,588 | |||||||||
| 28,641 | Reynolds American, Inc. | 1,840,471 | |||||||||
| 117,264 | Rite Aid Corp.* | 720,001 | |||||||||
| 5,877 | Ruddick Corp. | 176,486 | |||||||||
| 50,957 | Safeway, Inc. | 1,849,739 | |||||||||
| 107,644 | Sara Lee Corp. | 1,766,438 | |||||||||
| 61 | Seaboard Corp. | 152,073 | |||||||||
| 19,466 | Smithfield Foods, Inc.* | 595,076 | |||||||||
| 15,890 | Spectrum Brands, Inc.* | 110,594 | |||||||||
| 26,362 | SUPERVALU, Inc. | 1,210,016 | |||||||||
| 46,449 | Sysco Corp. | 1,520,740 | |||||||||
| 62,662 | Tyson Foods, Inc., Class A | 1,313,396 | |||||||||
| 4,259 | Universal Corp. | 266,954 | |||||||||
| 11,759 | UST, Inc. | 666,500 | |||||||||
| 44,867 | Walgreen Co. | 1,969,661 | |||||||||
| 320,622 | Wal-Mart Stores, Inc. | 15,364,206 | |||||||||
| 3,662 | Weis Markets, Inc. | 157,613 | |||||||||
| 4,895 | Whole Foods Market, Inc. | 229,037 | |||||||||
| 12,286 | Wm. Wrigley Jr. Co. | 723,400 | |||||||||
| 121,133,325 | |||||||||||
| Number of Shares | Value | ||||||||||
| Common Stocks (Continued) | |||||||||||
| Energy—9.3% | |||||||||||
| 39,347 | Anadarko Petroleum Corp. | $ | 1,835,931 | ||||||||
| 20,078 | Apache Corp. | 1,455,655 | |||||||||
| 5,107 | Arch Coal, Inc. | 184,209 | |||||||||
| 12,447 | Baker Hughes, Inc. | 1,000,614 | |||||||||
| 11,333 | BJ Services Co. | 324,804 | |||||||||
| 4,043 | Cameron International Corp.* | 261,057 | |||||||||
| 19,637 | Chesapeake Energy Corp. | 662,749 | |||||||||
| 209,452 | Chevron Corp. | 16,293,270 | |||||||||
| 7,614 | Cimarex Energy Co. | 299,992 | |||||||||
| 7,357 | CNX Gas Corp.* | 206,437 | |||||||||
| 134,588 | ConocoPhillips | 9,333,677 | |||||||||
| 6,056 | CONSOL Energy, Inc. | 253,565 | |||||||||
| 27,911 | Devon Energy Corp. | 2,033,875 | |||||||||
| 3,285 | Diamond Offshore Drilling, Inc. | 281,196 | |||||||||
| 8,686 | Dresser-Rand Group, Inc.* | 277,170 | |||||||||
| 102,371 | El Paso Corp. | 1,535,565 | |||||||||
| 4,630 | ENSCO International, Inc. | 261,039 | |||||||||
| 8,569 | EOG Resources, Inc. | 629,307 | |||||||||
| 381,432 | Exxon Mobil Corp. | 30,278,071 | |||||||||
| 2,779 | FMC Technologies, Inc.* | 196,976 | |||||||||
| 8,486 | Forest Oil Corp.* | 299,047 | |||||||||
| 6,095 | Foundation Coal Holdings, Inc. | 240,082 | |||||||||
| 4,658 | Frontier Oil Corp. | 164,567 | |||||||||
| 7,635 | GlobalSantaFe Corp. (Cayman Islands) | 488,106 | |||||||||
| 3,274 | Grant Prideco, Inc.* | 168,742 | |||||||||
| 17,225 | Halliburton Co. | 547,238 | |||||||||
| 7,434 | Hanover Compressor Co.* | 160,797 | |||||||||
| 28,383 | Hess Corp. | 1,610,735 | |||||||||
| 3,143 | Houston Exploration Co.* | 174,028 | |||||||||
| 5,132 | Kinder Morgan, Inc. | 546,866 | |||||||||
| 32,248 | Marathon Oil Corp. | 3,274,784 | |||||||||
| 6,231 | Massey Energy Co. | 167,801 | |||||||||
| 12,211 | Murphy Oil Corp. | 676,978 | |||||||||
| 16,210 | Nabors Industries Ltd. (Bermuda)* | 520,665 | |||||||||
| 6,063 | National-Oilwell Varco, Inc.* | 514,446 | |||||||||
| 9,497 | Newfield Exploration Co.* | 415,494 | |||||||||
| 3,508 | Noble Corp. (Cayman Islands) | 295,409 | |||||||||
| 5,960 | Noble Energy, Inc. | 350,508 | |||||||||
| 55,046 | Occidental Petroleum Corp. | 2,790,832 | |||||||||
| 3,373 | Overseas Shipholding Group, Inc. | 238,808 | |||||||||
| 7,472 | Patterson-UTI Energy, Inc. | 182,242 | |||||||||
| 7,746 | Peabody Energy Corp. | 371,653 | |||||||||
| 8,323 | Pioneer Natural Resources Co. | 417,815 | |||||||||
| 5,777 | Pogo Producing Co. | 278,798 | |||||||||
| 11,056 | Pride International, Inc.* | 362,747 | |||||||||
| 4,889 | Rowan Cos., Inc. | 179,133 | |||||||||
| 41,087 | Schlumberger Ltd. (Netherlands) | 3,033,453 | |||||||||
| 1,422 | SEACOR Holdings, Inc.* | 135,488 | |||||||||
| 6,400 | Ship Finance International Ltd. (Bermuda) | 190,336 | |||||||||
| 6,797 | Smith International, Inc. | 356,435 | |||||||||
| 3,578 | Southwestern Energy Co.* | 150,276 | |||||||||
| 56,331 | Spectra Energy Corp. | 1,470,239 | |||||||||
See Notes to Financial Statements.
26
Schedule of Investments (Continued)
PowerShares FTSE RAFI US 1000 Portfolio
April 30, 2007
| Number of Shares | Value | ||||||||||
| Common Stocks (Continued) | |||||||||||
| 5,649 | Stone Energy Corp.* | $ | 167,380 | ||||||||
| 14,745 | Sunoco, Inc. | 1,113,690 | |||||||||
| 6,335 | Teekay Shipping Corp. (Marshall Islands) | 377,883 | |||||||||
| 5,365 | Tesoro Corp. | 650,238 | |||||||||
| 3,150 | Tidewater, Inc. | 199,112 | |||||||||
| 8,468 | Transocean, Inc. (Cayman Islands)* | 729,942 | |||||||||
| 10,798 | USEC, Inc.* | 217,796 | |||||||||
| 43,655 | Valero Energy Corp. | 3,065,891 | |||||||||
| 15,551 | Weatherford International Ltd. (Bermuda)* | 816,272 | |||||||||
| 45,450 | Williams Cos., Inc. | 1,340,775 | |||||||||
| 3,104 | World Fuel Services Corp. | 143,436 | |||||||||
| 9,629 | XTO Energy, Inc. | 522,566 | |||||||||
| 97,724,688 | |||||||||||
| Financials—22.2% | |||||||||||
| 4,558 | A.G. Edwards, Inc. | 330,227 | |||||||||
| 22,804 | ACE Ltd. (Cayman Islands) | 1,355,926 | |||||||||
| 23,510 | AFLAC, Inc. | 1,207,003 | |||||||||
| 416 | Alleghany Corp.* | 148,845 | |||||||||
| 16,313 | Allied Capital Corp. | 471,446 | |||||||||
| 6,621 | Allied World Assurance Holdings Ltd. (Bermuda) | 293,443 | |||||||||
| 53,950 | Allstate (The) Corp. | 3,362,164 | |||||||||
| 6,402 | AMB Property Corp. | 389,946 | |||||||||
| 5,831 | AMBAC Financial Group, Inc. | 535,286 | |||||||||
| 9,512 | American Capital Strategies Ltd. | 463,044 | |||||||||
| 49,116 | American Express Co. | 2,979,868 | |||||||||
| 9,614 | American Financial Group, Inc. | 339,086 | |||||||||
| 12,950 | American Financial Realty Trust | 137,270 | |||||||||
| 5,778 | American Home Mortgage Investment Corp. | 143,179 | |||||||||
| 158,819 | American International Group, Inc. | 11,103,035 | |||||||||
| 3,068 | American National Insurance | 400,435 | |||||||||
| 11,269 | AmeriCredit Corp.* | 284,317 | |||||||||
| 16,280 | Ameriprise Financial, Inc. | 968,172 | |||||||||
| 30,389 | Annaly Capital Management, Inc. | 483,489 | |||||||||
| 26,312 | Aon Corp. | 1,019,590 | |||||||||
| 9,171 | Apartment Investment & Management Co., Class A | 507,156 | |||||||||
| 4,312 | Arch Capital Group Ltd. (Bermuda)* | 314,000 | |||||||||
| 14,098 | Archstone-Smith Trust | 734,647 | |||||||||
| 6,661 | Arthur J. Gallagher & Co. | 186,242 | |||||||||
| 5,084 | Aspen Insurance Holdings Ltd. (Bermuda) | 134,777 | |||||||||
| 9,705 | Associated Banc-Corp. | 314,248 | |||||||||
| 8,988 | Assurant, Inc. | 517,080 | |||||||||
| 8,979 | Astoria Financial Corp. | 238,482 | |||||||||
| 3,400 | AvalonBay Communities, Inc. | 415,684 | |||||||||
| 8,500 | Axis Capital Holdings Ltd. (Bermuda) | 315,350 | |||||||||
| 7,105 | BancorpSouth, Inc. | 174,570 | |||||||||
| 326,988 | Bank of America Corp. | 16,643,688 | |||||||||
| 3,439 | Bank of Hawaii Corp. | 181,923 | |||||||||
| 44,491 | Bank of New York (The) Co., Inc. | 1,800,996 | |||||||||
| 45,791 | BB&T Corp. | 1,905,821 | |||||||||
| Number of Shares | Value | ||||||||||
| Common Stocks (Continued) | |||||||||||
| 8,020 | Bear Stearns (The) Cos., Inc. | $ | 1,248,714 | ||||||||
| 3,055 | Berkshire Hathaway, Inc., Class B* | 11,083,539 | |||||||||
| 3,066 | BOK Financial Corp. | 157,378 | |||||||||
| 6,595 | Boston Properties, Inc. | 775,308 | |||||||||
| 4,449 | Brandywine Realty Trust | 146,283 | |||||||||
| 2,927 | BRE Properties, Inc. | 175,737 | |||||||||
| 3,609 | Camden Property Trust | 251,367 | |||||||||
| 18,211 | Capital One Financial Corp. | 1,352,349 | |||||||||
| 5,017 | CB Richard Ellis Group, Inc., Class A* | 169,825 | |||||||||
| 4,807 | CBL & Associates Properties, Inc. | 218,478 | |||||||||
| 35,868 | Charles Schwab (The) Corp. | 685,796 | |||||||||
| 322 | Chicago Mercantile Exchange Holdings, Inc., Class A | 166,394 | |||||||||
| 29,360 | Chubb (The) Corp. | 1,580,449 | |||||||||
| 12,882 | Cincinnati Financial Corp. | 582,782 | |||||||||
| 17,007 | CIT Group, Inc. | 1,014,468 | |||||||||
| 415,043 | Citigroup, Inc. | 22,254,605 | |||||||||
| 3,002 | City National Corp. | 219,806 | |||||||||
| 19,685 | CNA Financial Corp.* | 918,699 | |||||||||
| 10,078 | Colonial BancGroup (The), Inc. | 242,477 | |||||||||
| 3,970 | Colonial Properties Trust | 196,952 | |||||||||
| 16,806 | Comerica, Inc. | 1,040,459 | |||||||||
| 8,214 | Commerce Bancorp, Inc. | 274,676 | |||||||||
| 4,306 | Commerce Bancshares, Inc. | 203,846 | |||||||||
| 7,130 | Commerce Group, Inc. | 232,509 | |||||||||
| 6,543 | Compass Bancshares, Inc. | 446,102 | |||||||||
| 23,334 | Conseco, Inc.* | 412,778 | |||||||||
| 55,726 | Countrywide Financial Corp. | 2,066,320 | |||||||||
| 4,160 | Cousins Properties, Inc. | 139,651 | |||||||||
| 17,651 | Crescent Real Estate EQT Co. | 362,022 | |||||||||
| 3,318 | Cullen/Frost Bankers, Inc. | 169,782 | |||||||||
| 6,271 | Developers Diversified Realty Corp. | 408,242 | |||||||||
| 82,203 | Doral Financial Corp.* | 115,084 | |||||||||
| 2,108 | Downey Financial Corp. | 141,131 | |||||||||
| 12,538 | Duke Realty Corp. | 540,513 | |||||||||
| 18,836 | E*Trade Financial Corp.* | 415,899 | |||||||||
| 4,842 | Endurance Specialty Holdings Ltd. (Bermuda) | 181,188 | |||||||||
| 2,552 | Equity Lifestyle Properties, Inc. | 138,497 | |||||||||
| 5,374 | Equity One, Inc. | 150,096 | |||||||||
| 20,513 | Equity Residential | 952,419 | |||||||||
| 4,005 | Erie Indemnity Co., Class A | 210,463 | |||||||||
| 1,021 | Essex Property Trust, Inc. | 131,566 | |||||||||
| 3,862 | Everest Re Group Ltd. (Bermuda) | 388,672 | |||||||||
| 2,291 | Federal Realty Investment Trust | 206,579 | |||||||||
| 4,638 | Federated Investors, Inc., Class B | 176,986 | |||||||||
| 17,751 | Fidelity National Financial, Inc., Class A | 452,473 | |||||||||
| 47,662 | Fifth Third Bancorp | 1,934,601 | |||||||||
| 10,119 | First American Corp. | 521,129 | |||||||||
| 12,273 | First Horizon National Corp. | 481,224 | |||||||||
| 5,184 | First Industrial Realty Trust, Inc. | 227,007 | |||||||||
See Notes to Financial Statements.
27
Schedule of Investments (Continued)
PowerShares FTSE RAFI US 1000 Portfolio
April 30, 2007
| Number of Shares | Value | ||||||||||
| Common Stocks (Continued) | |||||||||||
| 10,163 | FirstMerit Corp. | $ | 212,203 | ||||||||
| 6,643 | Franklin Resources, Inc. | 872,292 | |||||||||
| 120,286 | Freddie Mac | 7,792,127 | |||||||||
| 19,712 | Fremont General Corp. | 148,826 | |||||||||
| 39,887 | Friedman Billings Ramsey Group, Inc., Class A | 221,373 | |||||||||
| 13,483 | Fulton Financial Corp. | 198,470 | |||||||||
| 8,428 | General Growth Properties, Inc. | 538,128 | |||||||||
| 75,025 | Genworth Financial, Inc., Class A | 2,737,662 | |||||||||
| 5,271 | Glimcher Realty Trust | 142,370 | |||||||||
| 18,419 | Goldman Sachs Group (The), Inc. | 4,026,578 | |||||||||
| 4,806 | Hanover Insurance Group (The), Inc. | 220,884 | |||||||||
| 21,615 | Hartford Financial Services Group (The), Inc. | 2,187,438 | |||||||||
| 5,453 | HCC Insurance Holdings, Inc. | 167,189 | |||||||||
| 10,786 | Health Care Property Investors, Inc. | 381,717 | |||||||||
| 5,154 | Health Care REIT, Inc. | 233,167 | |||||||||
| 5,581 | Healthcare Realty Trust, Inc. | 190,089 | |||||||||
| 5,722 | Highwoods Properties, Inc. | 233,343 | |||||||||
| 3,611 | Home Properties, Inc. | 201,133 | |||||||||
| 9,044 | Hospitality Properties Trust | 411,773 | |||||||||
| 14,305 | Host Hotels & Resorts, Inc. | 366,780 | |||||||||
| 24,978 | HRPT Properties Trust | 305,731 | |||||||||
| 31,562 | Hudson City Bancorp, Inc. | 420,406 | |||||||||
| 22,215 | Huntington Bancshares, Inc. | 492,729 | |||||||||
| 36,727 | IMPAC Mortgage Holdings, Inc. | 203,835 | |||||||||
| 6,560 | IndyMac Bancorp, Inc. | 198,374 | |||||||||
| 11,558 | iStar Financial, Inc. | 553,859 | |||||||||
| 11,076 | Janus Capital Group, Inc. | 277,122 | |||||||||
| 5,345 | Jefferies Group, Inc. | 169,437 | |||||||||
| 247,932 | JPMorgan Chase & Co. | 12,917,256 | |||||||||
| 38,212 | KeyCorp | 1,363,404 | |||||||||
| 9,696 | Kimco Realty Corp. | 466,087 | |||||||||
| 3,013 | LandAmerica Financial Group, Inc. | 242,095 | |||||||||
| 7,418 | Lazard Ltd., Class A (Bermuda) | 401,685 | |||||||||
| 2,979 | Legg Mason, Inc. | 295,487 | |||||||||
| 29,240 | Lehman Brothers Holdings, Inc. | 2,201,187 | |||||||||
| 8,236 | Leucadia National Corp. | 248,233 | |||||||||
| 7,990 | Liberty Property Trust | 386,636 | |||||||||
| 13,044 | Lincoln National Corp. | 928,081 | |||||||||
| 27,351 | Loews Corp. | 1,294,249 | |||||||||
| 5,939 | M&T Bank Corp. | 661,248 | |||||||||
| 2,960 | Macerich (The) Co. | 281,555 | |||||||||
| 8,090 | Mack-Cali Realty Corp. | 396,167 | |||||||||
| 409 | Markel Corp.* | 187,694 | |||||||||
| 61,592 | Marsh & McLennan Cos., Inc. | 1,956,162 | |||||||||
| 14,297 | Marshall & Ilsley Corp. | 686,542 | |||||||||
| 11,651 | MBIA, Inc. | 810,444 | |||||||||
| 21,393 | Mellon Financial Corp. | 918,401 | |||||||||
| 5,302 | Mercury General Corp. | 287,103 | |||||||||
| 52,799 | Merrill Lynch & Co. Inc. | 4,764,054 | |||||||||
| 50,457 | MetLife, Inc. | 3,315,025 | |||||||||
| Number of Shares | Value | ||||||||||
| Common Stocks (Continued) | |||||||||||
| 6,754 | MGIC Investment Corp. | $ | 416,114 | ||||||||
| 13,261 | Montpelier Re Holdings Ltd. (Bermuda) | 242,146 | |||||||||
| 3,631 | Moody's Corp. | 240,082 | |||||||||
| 70,352 | Morgan Stanley | 5,910,272 | |||||||||
| 67,582 | National City Corp. | 2,470,122 | |||||||||
| 11,097 | Nationwide Financial Services, Inc., Class A | 633,972 | |||||||||
| 5,673 | Nationwide Health Properties, Inc. | 181,876 | |||||||||
| 27,298 | New York Community Bancorp, Inc. | 476,623 | |||||||||
| 5,071 | Newcastle Investment Corp. | 148,124 | |||||||||
| 10,105 | Northern Trust Corp. | 636,110 | |||||||||
| 22,259 | Novastar Financial, Inc. | 163,826 | |||||||||
| 2,887 | Nuveen Investments, Inc., Class A | 153,877 | |||||||||
| 6,246 | NYSE Euronext* | 526,725 | |||||||||
| 4,461 | Odyssey Re Holdings Corp. | 186,916 | |||||||||
| 5,045 | Ohio Casualty Corp. | 159,624 | |||||||||
| 26,824 | Old Republic International Corp. | 570,546 | |||||||||
| 5,058 | PartnerRe Ltd. (Bermuda) | 364,277 | |||||||||
| 3,245 | Pennsylvania Real Estate Investment Trust | 150,763 | |||||||||
| 7,672 | People's United Financial, Inc. | 152,750 | |||||||||
| 13,523 | Phoenix (The) Cos., Inc. | 201,493 | |||||||||
| 15,776 | Plum Creek Timber Co., Inc. | 626,307 | |||||||||
| 5,963 | PMI Group (The), Inc. | 289,027 | |||||||||
| 25,852 | PNC Financial Services Group, Inc. | 1,915,633 | |||||||||
| 30,086 | Popular, Inc. | 505,746 | |||||||||
| 3,979 | Post Properties, Inc. | 186,496 | |||||||||
| 3,395 | Potlatch Corp. | 147,309 | |||||||||
| 13,966 | Principal Financial Group, Inc. | 886,701 | |||||||||
| 40,783 | Progressive (The) Corp. | 940,864 | |||||||||
| 10,290 | ProLogis | 666,792 | |||||||||
| 6,106 | Protective Life Corp. | 286,371 | |||||||||
| 29,784 | Prudential Financial, Inc. | 2,829,480 | |||||||||
| 5,356 | Public Storage, Inc. | 499,822 | |||||||||
| 5,358 | Radian Group, Inc. | 311,353 | |||||||||
| 5,809 | Raymond James Financial, Inc. | 178,220 | |||||||||
| 5,526 | Rayonier, Inc. | 239,663 | |||||||||
| 6,789 | Realty Income Corp. | 189,413 | |||||||||
| 4,285 | Redwood Trust, Inc. | 215,150 | |||||||||
| 3,328 | Regency Centers Corp. | 274,227 | |||||||||
| 37,508 | Regions Financial Corp. | 1,316,156 | |||||||||
| 4,700 | Reinsurance Group of America, Inc. | 292,857 | |||||||||
| 4,248 | RenaissanceRe Holdings Ltd. (Bermuda) | 230,029 | |||||||||
| 9,715 | Safeco Corp. | 648,379 | |||||||||
| 7,041 | Senior Housing Properties Trust | 160,746 | |||||||||
| 4,993 | Simon Property Group, Inc. | 575,593 | |||||||||
| 8,557 | Sky Financial Group, Inc. | 233,178 | |||||||||
| 1,174 | SL Green Realty Corp. | 165,417 | |||||||||
| 21,979 | SLM Corp. | 1,183,130 | |||||||||
| 5,572 | South Financial Group (The), Inc. | 126,094 | |||||||||
| 20,818 | Sovereign Bancorp, Inc. | 505,253 | |||||||||
| 4,028 | Stancorp Financial Group, Inc. | 191,733 | |||||||||
| 14,179 | State Street Corp. | 976,508 | |||||||||
See Notes to Financial Statements.
28
Schedule of Investments (Continued)
PowerShares FTSE RAFI US 1000 Portfolio
April 30, 2007
| Number of Shares | Value | ||||||||||
| Common Stocks (Continued) | |||||||||||
| 8,969 | Strategic Hotels & Resorts, Inc. | $ | 194,179 | ||||||||
| 1,368 | Student Loan Corp. | 278,662 | |||||||||
| 26,256 | SunTrust Banks, Inc. | 2,216,532 | |||||||||
| 18,127 | Synovus Financial Corp. | 572,088 | |||||||||
| 7,371 | T. Rowe Price Group, Inc. | 366,191 | |||||||||
| 10,556 | TCF Financial Corp. | 285,856 | |||||||||
| 11,989 | TD Ameritrade Holding Corp.* | 204,412 | |||||||||
| 14,186 | Thornburg Mortgage, Inc. | 394,371 | |||||||||
| 6,925 | Torchmark Corp. | 472,978 | |||||||||
| 4,265 | Transatlantic Holdings, Inc. | 296,375 | |||||||||
| 42,123 | Travelers (The) Cos., Inc. | 2,278,854 | |||||||||
| 6,902 | Tri-Continental Corp. | 173,654 | |||||||||
| 4,849 | Trustmark Corp. | 129,032 | |||||||||
| 132,320 | U.S. Bancorp | 4,545,192 | |||||||||
| 11,522 | UnionBanCal Corp. | 708,373 | |||||||||
| 8,663 | UDR, Inc. | 260,237 | |||||||||
| 8,241 | Unitrin, Inc. | 388,563 | |||||||||
| 40,708 | Unum Group | 1,012,815 | |||||||||
| 8,667 | Valley National Bancorp | 219,882 | |||||||||
| 3,865 | Ventas, Inc. | 162,948 | |||||||||
| 7,064 | Vornado Realty Trust | 838,002 | |||||||||
| 4,253 | W.P. Carey & Co. LLC | 145,665 | |||||||||
| 10,133 | W.R. Berkley Corp. | 329,221 | |||||||||
| 122,097 | Wachovia Corp. | 6,781,267 | |||||||||
| 8,049 | Washington Federal, Inc. | 190,842 | |||||||||
| 28,106 | Washington Mutual, Inc. | 1,179,890 | |||||||||
| 4,186 | Webster Financial Corp. | 186,068 | |||||||||
| 5,525 | Weingarten Realty Investors | 264,426 | |||||||||
| 232,933 | Wells Fargo & Co. | 8,359,965 | |||||||||
| 308 | Wesco Financial Corp. | 137,060 | |||||||||
| 625 | White Mountain Insurance Group Ltd. (Bermuda) | 358,125 | |||||||||
| 4,794 | Whitney Holding Corp. | 147,511 | |||||||||
| 7,603 | Willis Group Holdings Ltd. (Bermuda) | 311,875 | |||||||||
| 4,808 | Wilmington Trust Corp. | 194,532 | |||||||||
| 13,732 | XL Capital Ltd., Class A (Cayman Islands) | 1,070,821 | |||||||||
| 5,804 | Zions Bancorp. | 474,767 | |||||||||
| 234,388,701 | |||||||||||
| Health Care—9.1% | |||||||||||
| 78,841 | Abbott Laboratories | 4,463,977 | |||||||||
| 3,623 | Advanced Medical Optics, Inc.* | 146,478 | |||||||||
| 29,973 | Aetna, Inc. | 1,405,134 | |||||||||
| 7,539 | Alcon, Inc. (Switzerland) | 1,017,237 | |||||||||
| 2,556 | Allergan, Inc. | 309,787 | |||||||||
| 28,282 | AmerisourceBergen Corp. | 1,413,817 | |||||||||
| 39,104 | Amgen, Inc.* | 2,508,131 | |||||||||
| 7,534 | Applera Corp. - Applied Biosystems Group | 235,362 | |||||||||
| 4,686 | Apria Healthcare Group, Inc.* | 148,734 | |||||||||
| 3,572 | Barr Pharmaceuticals, Inc.* | 172,742 | |||||||||
| 4,553 | Bausch & Lomb, Inc. | 267,853 | |||||||||
| 26,672 | Baxter International, Inc. | 1,510,435 | |||||||||
| 3,598 | Beckman Coulter, Inc. | 225,990 | |||||||||
| 8,879 | Becton, Dickinson & Co. | 698,689 | |||||||||
| Number of Shares | Value | ||||||||||
| Common Stocks (Continued) | |||||||||||
| 12,748 | Biogen Idec, Inc.* | $ | 601,833 | ||||||||
| 5,913 | Biomet, Inc. | 255,442 | |||||||||
| 47,217 | Boston Scientific Corp.* | 729,030 | |||||||||
| 193,686 | Bristol-Myers Squibb Co. | 5,589,778 | |||||||||
| 3,091 | C.R. Bard, Inc. | 256,955 | |||||||||
| 36,335 | Cardinal Health, Inc. | 2,541,633 | |||||||||
| 4,067 | Charles River Laboratories International, Inc.* | 192,613 | |||||||||
| 8,786 | CIGNA Corp. | 1,367,014 | |||||||||
| 8,350 | Community Health Systems, Inc.* | 307,280 | |||||||||
| 8,104 | Coventry Health Care, Inc.* | 468,654 | |||||||||
| 3,392 | Dade Behring Holdings, Inc. | 166,581 | |||||||||
| 4,754 | DaVita, Inc.* | 259,616 | |||||||||
| 5,750 | DENTSPLY International, Inc. | 192,108 | |||||||||
| 68,471 | Eli Lilly & Co. | 4,048,690 | |||||||||
| 9,540 | Express Scripts, Inc.* | 911,547 | |||||||||
| 8,984 | Forest Laboratories, Inc.* | 478,039 | |||||||||
| 11,613 | Genentech, Inc.* | 928,924 | |||||||||
| 8,481 | Genzyme Corp.* | 553,894 | |||||||||
| 4,656 | Gilead Sciences, Inc.* | 380,488 | |||||||||
| 16,003 | Health Management Associates, Inc., Class A | 171,072 | |||||||||
| 11,413 | Health Net, Inc.* | 616,987 | |||||||||
| 5,223 | Henry Schein, Inc.* | 272,275 | |||||||||
| 4,386 | Hillenbrand Industries, Inc. | 268,204 | |||||||||
| 8,137 | Hospira, Inc.* | 329,955 | |||||||||
| 11,696 | Humana, Inc.* | 739,655 | |||||||||
| 6,492 | IMS Health, Inc. | 190,410 | |||||||||
| 3,393 | Invitrogen Corp.* | 222,140 | |||||||||
| 146,722 | Johnson & Johnson | 9,422,487 | |||||||||
| 7,130 | Kindred Healthcare, Inc.* | 248,980 | |||||||||
| 16,778 | King Pharmaceuticals, Inc.* | 343,110 | |||||||||
| 4,846 | Laboratory Corp. of America Holdings* | 382,543 | |||||||||
| 4,654 | LifePoint Hospitals, Inc.* | 169,918 | |||||||||
| 5,690 | Lincare Holdings, Inc.* | 224,414 | |||||||||
| 3,753 | Magellan Health Services, Inc.* | 161,004 | |||||||||
| 4,229 | Manor Care, Inc. | 274,420 | |||||||||
| 39,692 | McKesson Corp. | 2,335,080 | |||||||||
| 29,898 | Medco Health Solutions, Inc.* | 2,332,642 | |||||||||
| 5,561 | MedImmune, Inc.* | 315,197 | |||||||||
| 34,064 | Medtronic, Inc. | 1,803,008 | |||||||||
| 247,846 | Merck & Co., Inc. | 12,749,199 | |||||||||
| 12,324 | Mylan Laboratories, Inc. | 270,265 | |||||||||
| 7,944 | Omnicare, Inc. | 263,502 | |||||||||
| 5,648 | Owens & Minor, Inc. | 199,657 | |||||||||
| 5,491 | Patterson Cos., Inc.* | 198,005 | |||||||||
| 8,692 | PerkinElmer, Inc. | 210,346 | |||||||||
| 397,728 | Pfizer, Inc. | 10,523,884 | |||||||||
| 9,125 | Quest Diagnostics, Inc. | 446,121 | |||||||||
| 74,564 | Schering-Plough Corp. | 2,365,916 | |||||||||
| 10,112 | St. Jude Medical, Inc.* | 432,692 | |||||||||
| 7,537 | Stryker Corp. | 489,453 | |||||||||
See Notes to Financial Statements.
29
Schedule of Investments (Continued)
PowerShares FTSE RAFI US 1000 Portfolio
April 30, 2007
| Number of Shares | Value | ||||||||||
| Common Stocks (Continued) | |||||||||||
| 128,764 | Tenet Healthcare Corp.* | $ | 955,429 | ||||||||
| 7,432 | Thermo Fisher Scientific, Inc.* | 386,910 | |||||||||
| 9,371 | Triad Hospitals, Inc.* | 497,975 | |||||||||
| 45,956 | UnitedHealth Group, Inc. | 2,438,425 | |||||||||
| 4,421 | Universal Health Services, Inc., Class B | 268,443 | |||||||||
| 2,999 | Varian Medical Systems, Inc.* | 126,588 | |||||||||
| 10,961 | Watson Pharmaceuticals, Inc.* | 299,235 | |||||||||
| 35,151 | WellPoint, Inc.* | 2,775,874 | |||||||||
| 72,847 | Wyeth | 4,043,009 | |||||||||
| 6,628 | Zimmer Holdings, Inc.* | 599,701 | |||||||||
| 96,118,615 | |||||||||||
| Industrials—10.7% | |||||||||||
| 45,629 | 3M Co. | 3,776,712 | |||||||||
| 11,633 | ACCO Brands Corp.* | 276,865 | |||||||||
| 2,578 | Acuity Brands, Inc. | 152,411 | |||||||||
| 6,446 | AGCO Corp.* | 268,992 | |||||||||
| 4,538 | Alaska Air Group, Inc.* | 134,325 | |||||||||
| 3,494 | Alexander & Baldwin, Inc. | 186,754 | |||||||||
| 2,293 | Alliant Techsystems, Inc.* | 213,547 | |||||||||
| 60,730 | Allied Waste Industries, Inc.* | 811,960 | |||||||||
| 2,642 | AMERCO* | 184,834 | |||||||||
| 9,777 | American Standard Cos., Inc. | 538,322 | |||||||||
| 20,103 | AMR Corp.* | 524,487 | |||||||||
| 8,017 | Avery Dennison Corp. | 498,657 | |||||||||
| 81,537 | Avis Budget Group, Inc. | 2,293,636 | |||||||||
| 43,313 | Boeing Co. | 4,028,109 | |||||||||
| 6,000 | Briggs & Stratton Corp. | 178,020 | |||||||||
| 3,479 | Brink's (The) Co. | 220,917 | |||||||||
| 9,352 | Builders FirstSource, Inc.* | 150,848 | |||||||||
| 20,171 | Burlington Northern Santa Fe Corp. | 1,765,769 | |||||||||
| 4,583 | C.H. Robinson Worldwide, Inc. | 245,007 | |||||||||
| 3,889 | Carlisle Cos., Inc. | 160,149 | |||||||||
| 40,619 | Caterpillar, Inc. | 2,949,752 | |||||||||
| 4,195 | ChoicePoint, Inc.* | 159,284 | |||||||||
| 8,428 | Cintas Corp. | 315,797 | |||||||||
| 11,869 | Continental Airlines, Inc., Class B* | 433,931 | |||||||||
| 5,335 | Con-way, Inc. | 291,451 | |||||||||
| 11,251 | Cooper Industries Ltd., Class A (Bermuda) | 559,850 | |||||||||
| 2,888 | Corrections Corp. of America* | 164,038 | |||||||||
| 4,223 | Crane Co. | 179,520 | |||||||||
| 28,530 | CSX Corp. | 1,231,640 | |||||||||
| 6,876 | Cummins, Inc. | 633,692 | |||||||||
| 8,626 | Danaher Corp. | 614,085 | |||||||||
| 13,661 | Deere & Co. | 1,494,513 | |||||||||
| 7,496 | Deluxe Corp. | 283,724 | |||||||||
| 4,293 | Dollar Thrifty Automotive Group* | 201,256 | |||||||||
| 12,098 | Dover Corp. | 582,156 | |||||||||
| 1,761 | Dun & Bradstreet (The) Corp. | 159,018 | |||||||||
| 10,180 | Eaton Corp. | 908,158 | |||||||||
| 3,704 | EMCOR Group, Inc.* | 232,204 | |||||||||
| 49,917 | Emerson Electric Co. | 2,345,600 | |||||||||
| Number of Shares | Value | ||||||||||
| Common Stocks (Continued) | |||||||||||
| 4,751 | Equifax, Inc. | $ | 189,090 | ||||||||
| 4,270 | Expeditors International of Washington, Inc. | 178,486 | |||||||||
| 15,201 | FedEx Corp. | 1,602,793 | |||||||||
| 3,979 | Flowserve Corp. | 242,759 | |||||||||
| 5,900 | Fluor Corp. | 564,158 | |||||||||
| 5,851 | GATX Corp. | 286,758 | |||||||||
| 20,706 | General Dynamics Corp. | 1,625,421 | |||||||||
| 771,451 | General Electric Co. | 28,435,684 | |||||||||
| 9,354 | Goodrich Corp. | 531,681 | |||||||||
| 5,661 | Harsco Corp. | 288,711 | |||||||||
| 3,426 | HNI Corp. | 143,001 | |||||||||
| 56,809 | Honeywell International, Inc. | 3,077,912 | |||||||||
| 5,114 | Hubbell, Inc., Class B | 264,343 | |||||||||
| 20,974 | IKON Office Solutions, Inc. | 313,771 | |||||||||
| 27,959 | Illinois Tool Works, Inc. | 1,434,576 | |||||||||
| 21,931 | Ingersoll-Rand Co. Ltd., Class A (Bermuda) | 979,219 | |||||||||
| 8,860 | ITT Corp. | 565,357 | |||||||||
| 6,728 | Jacobs Engineering Group, Inc.* | 339,293 | |||||||||
| 7,149 | JB Hunt Transport Services, Inc. | 193,452 | |||||||||
| 4,624 | Kansas City Southern* | 171,782 | |||||||||
| 6,617 | Kelly Services, Inc., Class A | 189,908 | |||||||||
| 2,828 | Kennametal, Inc. | 199,544 | |||||||||
| 6,069 | L-3 Communications Holdings, Inc. | 545,785 | |||||||||
| 8,176 | Laidlaw International, Inc. | 280,028 | |||||||||
| 5,538 | Lennox International, Inc. | 187,240 | |||||||||
| 22,252 | Lockheed Martin Corp. | 2,139,307 | |||||||||
| 7,629 | Manpower, Inc. | 612,227 | |||||||||
| 41,679 | Masco Corp. | 1,134,086 | |||||||||
| 2,758 | Monster Worldwide, Inc.* | 115,974 | |||||||||
| 5,204 | Mueller Industries, Inc. | 170,691 | |||||||||
| 1,200 | NACCO Industries, Inc., Class A | 191,256 | |||||||||
| 25,116 | Norfolk Southern Corp. | 1,337,176 | |||||||||
| 32,063 | Northrop Grumman Corp. | 2,361,119 | |||||||||
| 2,662 | Oshkosh Truck Corp. | 148,912 | |||||||||
| 15,332 | PACCAR, Inc. | 1,287,581 | |||||||||
| 6,687 | Pall Corp. | 280,520 | |||||||||
| 7,373 | Parker Hannifin Corp. | 679,348 | |||||||||
| 8,483 | Pentair, Inc. | 272,644 | |||||||||
| 14,818 | PHH Corp.* | 451,949 | |||||||||
| 17,522 | Pitney Bowes, Inc. | 841,056 | |||||||||
| 2,685 | Precision Castparts Corp. | 279,535 | |||||||||
| 6,178 | Quanta Services, Inc.* | 169,833 | |||||||||
| 19,850 | R.R. Donnelley & Sons Co. | 797,970 | |||||||||
| 34,754 | Raytheon Co. | 1,860,729 | |||||||||
| 11,247 | Republic Services, Inc. | 314,129 | |||||||||
| 4,566 | Robert Half International, Inc. | 152,048 | |||||||||
| 7,966 | Rockwell Automation, Inc. | 474,296 | |||||||||
| 4,657 | Rockwell Collins, Inc. | 305,825 | |||||||||
| 8,796 | Ryder System, Inc. | 463,021 | |||||||||
| 1,001 | Sequa Corp., Class A* | 117,317 | |||||||||
See Notes to Financial Statements.
30
Schedule of Investments (Continued)
PowerShares FTSE RAFI US 1000 Portfolio
April 30, 2007
| Number of Shares | Value | ||||||||||
| Common Stocks (Continued) | |||||||||||
| 208 | Sequa Corp., Class B* | $ | 24,752 | ||||||||
| 6,881 | Shaw Group (The), Inc.* | 223,151 | |||||||||
| 46,014 | Southwest Airlines Co. | 660,301 | |||||||||
| 5,393 | SPX Corp. | 382,256 | |||||||||
| 12,596 | Steelcase, Inc., Class A | 245,874 | |||||||||
| 7,426 | Swift Transportation Co., Inc.* | 232,285 | |||||||||
| 6,354 | Tecumseh Products Co., Class A* | 64,557 | |||||||||
| 1,797 | Tecumseh Products Co., Class B* | 18,401 | |||||||||
| 3,264 | Teleflex, Inc. | 234,453 | |||||||||
| 4,298 | Terex Corp.* | 334,599 | |||||||||
| 9,819 | Textron, Inc. | 998,298 | |||||||||
| 10,735 | Timken (The) Co. | 354,040 | |||||||||
| 3,735 | Trinity Industries, Inc. | 173,304 | |||||||||
| 139,314 | Tyco International Ltd. (Bermuda) | 4,545,816 | |||||||||
| 19,477 | Union Pacific Corp. | 2,225,247 | |||||||||
| 63,030 | United Parcel Service, Inc., Class B | 4,439,203 | |||||||||
| 14,214 | United Rentals, Inc.* | 476,169 | |||||||||
| 4,440 | United Stationers, Inc.* | 264,269 | |||||||||
| 52,395 | United Technologies Corp. | 3,517,276 | |||||||||
| 5,919 | URS Corp.* | 258,660 | |||||||||
| 3,970 | USG Corp.* | 183,216 | |||||||||
| 5,709 | W.W. Grainger, Inc. | 471,678 | |||||||||
| 3,422 | Washington Group International, Inc.* | 229,000 | |||||||||
| 42,215 | Waste Management, Inc. | 1,579,263 | |||||||||
| 7,268 | Werner Enterprises, Inc. | 137,438 | |||||||||
| 3,090 | WESCO International, Inc.* | 195,195 | |||||||||
| 9,124 | YRC Worldwide, Inc.* | 363,044 | |||||||||
| 112,971,036 | |||||||||||
| Information Technology—9.5% | |||||||||||
| 32,272 | Accenture Ltd., Class A (Bermuda) | 1,261,835 | |||||||||
| 8,168 | Activision, Inc.* | 163,360 | |||||||||
| 6,338 | Adobe Systems, Inc.* | 263,407 | |||||||||
| 38,441 | Advanced Micro Devices, Inc.* | 531,255 | |||||||||
| 8,963 | Affiliated Computer Services, Inc., Class A* | 536,973 | |||||||||
| 17,298 | Agilent Technologies, Inc.* | 594,532 | |||||||||
| 2,569 | Alliance Data Systems Corp.* | 163,543 | |||||||||
| 8,042 | Altera Corp. | 181,267 | |||||||||
| 7,991 | Amdocs Ltd. (Guernsey)* | 293,669 | |||||||||
| 13,221 | Amkor Technology, Inc.* | 184,962 | |||||||||
| 10,646 | Analog Devices, Inc. | 411,149 | |||||||||
| 17,143 | Andrew Corp.* | 187,202 | |||||||||
| 3,321 | Anixter International, Inc.* | 237,784 | |||||||||
| 10,502 | Apple, Inc.* | 1,048,100 | |||||||||
| 47,473 | Applied Materials, Inc. | 912,431 | |||||||||
| 15,997 | Arrow Electronics, Inc.* | 632,201 | |||||||||
| 31,163 | Atmel Corp.* | 165,787 | |||||||||
| 24,722 | Automatic Data Processing, Inc. | 1,106,557 | |||||||||
| 33,450 | Avaya, Inc.* | 432,174 | |||||||||
| 13,075 | Avnet, Inc.* | 534,768 | |||||||||
| 13,004 | AVX Corp. | 216,387 | |||||||||
| 13,755 | BEA Systems, Inc.* | 162,171 | |||||||||
| Number of Shares | Value | ||||||||||
| Common Stocks (Continued) | |||||||||||
| 6,827 | Benchmark Electronics, Inc.* | $ | 144,596 | ||||||||
| 6,415 | BMC Software, Inc.* | 207,654 | |||||||||
| 7,464 | Broadcom Corp., Class A* | 242,953 | |||||||||
| 6,185 | Broadridge Financial Solutions, Inc.* | 123,947 | |||||||||
| 17,722 | CA, Inc. | 483,102 | |||||||||
| 12,216 | Cadence Design System, Inc.* | 271,195 | |||||||||
| 4,686 | CDW Corp. | 337,439 | |||||||||
| 5,933 | Ceridian Corp.* | 200,298 | |||||||||
| 9,252 | Check Point Software Technologies (Israel)* | 217,885 | |||||||||
| 3,598 | CheckFree Corp.* | 121,109 | |||||||||
| 143,105 | Cisco Systems, Inc.* | 3,826,627 | |||||||||
| 4,699 | Citrix Systems, Inc.* | 153,187 | |||||||||
| 24,056 | Computer Sciences Corp.* | 1,336,070 | |||||||||
| 20,219 | Compuware Corp.* | 199,562 | |||||||||
| 11,116 | Convergys Corp.* | 280,790 | |||||||||
| 26,639 | Corning, Inc.* | 631,877 | |||||||||
| 124,076 | Dell, Inc.* | 3,127,955 | |||||||||
| 5,066 | Diebold, Inc. | 241,496 | |||||||||
| 3,185 | DST Systems, Inc.* | 248,589 | |||||||||
| 29,388 | eBay, Inc.* | 997,429 | |||||||||
| 8,605 | Electronic Arts, Inc.* | 433,778 | |||||||||
| 64,611 | Electronic Data Systems Corp. | 1,889,226 | |||||||||
| 94,283 | EMC Corp.* | 1,431,216 | |||||||||
| 9,566 | Fairchild Semiconductor International, Inc.* | 168,362 | |||||||||
| 19,814 | Fidelity National Information Services, Inc. | 1,001,201 | |||||||||
| 47,528 | First Data Corp. | 1,539,907 | |||||||||
| 8,403 | Fiserv, Inc.* | 446,788 | |||||||||
| 70,188 | Flextronics International Ltd. (Singapore)* | 782,596 | |||||||||
| 71,517 | Gateway, Inc.* | 156,622 | |||||||||
| 1,927 | Google, Inc., Class A* | 908,349 | |||||||||
| 4,168 | Harris Corp. | 214,027 | |||||||||
| 7,888 | Hewitt Associates, Inc., Class A* | 234,668 | |||||||||
| 146,304 | Hewlett-Packard Co. | 6,165,250 | |||||||||
| 60,123 | Ingram Micro, Inc., Class A* | 1,179,613 | |||||||||
| 8,994 | Insight Enterprises, Inc.* | 178,261 | |||||||||
| 314,894 | Intel Corp. | 6,770,220 | |||||||||
| 90,478 | International Business Machines Corp. | 9,247,755 | |||||||||
| 4,095 | International Rectifier Corp.* | 144,472 | |||||||||
| 6,171 | Intersil Corp., Class A | 183,834 | |||||||||
| 9,306 | Intuit, Inc.* | 264,756 | |||||||||
| 9,161 | Iron Mountain, Inc.* | 257,424 | |||||||||
| 16,085 | Jabil Circuit, Inc. | 374,781 | |||||||||
| 9,601 | JDS Uniphase Corp.* | 158,224 | |||||||||
| 28,132 | Juniper Networks, Inc.* | 629,032 | |||||||||
| 5,314 | Kla-Tencor Corp. | 295,193 | |||||||||
| 3,484 | Lam Research Corp.* | 187,370 | |||||||||
| 7,387 | Lexmark International, Inc., Class A* | 402,592 | |||||||||
| 9,086 | Linear Technology Corp. | 339,998 | |||||||||
| 37,214 | LSI Logic Corp.* | 316,319 | |||||||||
See Notes to Financial Statements.
31
Schedule of Investments (Continued)
PowerShares FTSE RAFI US 1000 Portfolio
April 30, 2007
| Number of Shares | Value | ||||||||||
| Common Stocks (Continued) | |||||||||||
| 13,499 | Marvell Technology Group Ltd. (Bermuda)* | $ | 217,739 | ||||||||
| 2,919 | Mastercard, Inc., Class A | 325,994 | |||||||||
| 10,726 | Maxim Integrated Products, Inc. | 340,229 | |||||||||
| 5,661 | McAfee, Inc.* | 183,926 | |||||||||
| 1,592 | Mettler Toledo International, Inc.* | 155,411 | |||||||||
| 4,696 | Microchip Technology, Inc. | 189,437 | |||||||||
| 61,944 | Micron Technology, Inc.* | 710,498 | |||||||||
| 582,757 | Microsoft Corp. | 17,447,744 | |||||||||
| 5,280 | Molex, Inc. | 157,766 | |||||||||
| 4,486 | Molex, Inc., Class A | 120,180 | |||||||||
| 4,614 | MoneyGram International, Inc. | 131,176 | |||||||||
| 148,798 | Motorola, Inc. | 2,578,669 | |||||||||
| 8,491 | National Semiconductor Corp. | 223,313 | |||||||||
| 10,529 | NCR Corp.* | 530,662 | |||||||||
| 4,956 | Network Appliance, Inc.* | 184,413 | |||||||||
| 22,603 | Novell, Inc.* | 165,002 | |||||||||
| 6,275 | Novellus Systems, Inc.* | 203,122 | |||||||||
| 7,444 | NVIDIA Corp.* | 244,833 | |||||||||
| 128,980 | Oracle Corp.* | 2,424,824 | |||||||||
| 9,990 | Paychex, Inc. | 370,629 | |||||||||
| 9,521 | Perot Systems Corp., Class A* | 170,426 | |||||||||
| 30,260 | QUALCOMM, Inc. | 1,325,388 | |||||||||
| 7,386 | SanDisk Corp.* | 320,922 | |||||||||
| 164,964 | Sanmina-SCI Corp.* | 569,126 | |||||||||
| 22,703 | Seagate Technology (Cayman Islands) | 502,871 | |||||||||
| 230,032 | Solectron Corp.* | 770,607 | |||||||||
| 18,156 | Spansion, Inc., Class A* | 178,292 | |||||||||
| 184,819 | Sun Microsystems, Inc.* | 964,755 | |||||||||
| 24,223 | Symantec Corp.* | 426,325 | |||||||||
| 11,354 | SYNNEX Corp.* | 221,971 | |||||||||
| 6,842 | Synopsys, Inc.* | 189,250 | |||||||||
| 22,972 | Tech Data Corp.* | 816,425 | |||||||||
| 26,749 | Tellabs, Inc.* | 284,074 | |||||||||
| 8,567 | Teradyne, Inc.* | 149,494 | |||||||||
| 51,711 | Texas Instruments, Inc. | 1,777,307 | |||||||||
| 5,184 | Total System Services, Inc. | 161,015 | |||||||||
| 42,712 | Unisys Corp.* | 334,862 | |||||||||
| 17,274 | UTStarcom, Inc.* | 123,336 | |||||||||
| 9,856 | VeriSign, Inc.* | 269,562 | |||||||||
| 23,559 | Vishay Intertechnology, Inc.* | 392,257 | |||||||||
| 10,259 | Western Digital Corp.* | 181,379 | |||||||||
| 17,988 | Western Union (The) Co. | 378,647 | |||||||||
| 71,495 | Xerox Corp.* | 1,322,658 | |||||||||
| 9,602 | Xilinx, Inc. | 283,067 | |||||||||
| 25,275 | Yahoo!, Inc.* | 708,711 | |||||||||
| 99,645,402 | |||||||||||
| Materials—3.7% | |||||||||||
| 12,682 | Air Products & Chemicals, Inc. | 970,173 | |||||||||
| 3,493 | Airgas, Inc. | 155,613 | |||||||||
| 7,780 | AK Steel Holding Corp.* | 237,446 | |||||||||
| 3,763 | Albemarle Corp. | 159,739 | |||||||||
| Number of Shares | Value | ||||||||||
| Common Stocks (Continued) | |||||||||||
| 76,883 | Alcoa, Inc. | $ | 2,728,578 | ||||||||
| 1,788 | Allegheny Technologies, Inc. | 195,929 | |||||||||
| 8,391 | Ashland, Inc. | 503,041 | |||||||||
| 6,960 | Ball Corp. | 352,802 | |||||||||
| 9,154 | Bemis Co., Inc. | 304,096 | |||||||||
| 10,771 | Bowater, Inc. | 235,777 | |||||||||
| 4,658 | Cabot Corp. | 211,007 | |||||||||
| 16,453 | Celanese Corp., Series A | 545,746 | |||||||||
| 21,265 | Chemtura Corp. | 234,553 | |||||||||
| 7,632 | Commercial Metals Co. | 255,901 | |||||||||
| 19,769 | Crown Holdings, Inc.* | 477,817 | |||||||||
| 2,815 | Cytec Industries, Inc. | 154,544 | |||||||||
| 96,093 | Dow Chemical (The) Co. | 4,286,708 | |||||||||
| 73,531 | E.I. du Pont de Nemours & Co. | 3,615,519 | |||||||||
| 9,743 | Eastman Chemical Co. | 659,601 | |||||||||
| 9,826 | Ecolab, Inc. | 422,420 | |||||||||
| 3,010 | FMC Corp. | 231,559 | |||||||||
| 15,495 | Freeport-McMoRan Copper & Gold, Inc. | 1,040,644 | |||||||||
| 32,446 | Graphic Packaging Corp.* | 166,448 | |||||||||
| 2,094 | Greif, Inc., Class A | 116,426 | |||||||||
| 626 | Greif, Inc., Class B | 31,801 | |||||||||
| 8,510 | Hercules, Inc.* | 160,328 | |||||||||
| 27,193 | Huntsman Corp. | 532,983 | |||||||||
| 5,493 | International Flavors & Fragrances, Inc. | 267,344 | |||||||||
| 65,740 | International Paper Co. | 2,479,713 | |||||||||
| 13,812 | Louisiana-Pacific Corp. | 272,235 | |||||||||
| 5,683 | Lubrizol Corp. | 340,639 | |||||||||
| 20,874 | Lyondell Chemical Co. | 649,599 | |||||||||
| 1,712 | Martin Marietta Materials, Inc. | 249,644 | |||||||||
| 23,444 | MeadWestvaco Corp. | 782,092 | |||||||||
| 15,836 | Monsanto Co. | 934,166 | |||||||||
| 10,123 | Mosaic (The) Co.* | 298,629 | |||||||||
| 11,776 | Nalco Holding Co. | 313,006 | |||||||||
| 18,509 | Newmont Mining Corp. | 771,825 | |||||||||
| 12,870 | Nucor Corp. | 816,730 | |||||||||
| 9,230 | Olin Corp. | 158,202 | |||||||||
| 24,058 | Owens-Illinois, Inc.* | 723,905 | |||||||||
| 7,579 | Packaging Corporation of America | 187,656 | |||||||||
| 9,646 | Pactiv Corp.* | 333,559 | |||||||||
| 16,202 | PPG Industries, Inc. | 1,192,143 | |||||||||
| 14,078 | Praxair, Inc. | 908,735 | |||||||||
| 3,637 | Reliance Steel & Aluminum Co. | 216,038 | |||||||||
| 6,758 | Rockwood Holdings, Inc.* | 207,471 | |||||||||
| 16,539 | Rohm & Haas Co. | 846,301 | |||||||||
| 10,468 | RPM International, Inc. | 222,654 | |||||||||
| 3,289 | Scotts Miracle-Gro (The) Co., Class A | 147,906 | |||||||||
| 12,250 | Sealed Air Corp. | 403,025 | |||||||||
| 5,220 | Sigma-Aldrich Corp. | 219,658 | |||||||||
| 2,793 | Silgan Holdings, Inc. | 160,262 | |||||||||
| 50,152 | Smurfit-Stone Container Corp.* | 604,332 | |||||||||
| 9,056 | Sonoco Products Co. | 386,148 | |||||||||
| 9,417 | Southern Copper Corp. | 756,185 | |||||||||
See Notes to Financial Statements.
32
Schedule of Investments (Continued)
PowerShares FTSE RAFI US 1000 Portfolio
April 30, 2007
| Number of Shares | Value | ||||||||||
| Common Stocks (Continued) | |||||||||||
| 3,856 | Steel Dynamics, Inc. | $ | 170,859 | ||||||||
| 7,444 | Temple-Inland, Inc. | 440,983 | |||||||||
| 2,746 | Titanium Metals Corp.* | 94,819 | |||||||||
| 7,237 | United States Steel Corp. | 734,845 | |||||||||
| 6,415 | Valhi, Inc. | 107,644 | |||||||||
| 7,955 | Valspar (The) Corp. | 215,103 | |||||||||
| 3,754 | Vulcan Materials Co. | 464,257 | |||||||||
| 21,218 | Weyerhaeuser Co. | 1,680,890 | |||||||||
| 10,551 | Worthington Industries, Inc. | 234,760 | |||||||||
| 38,981,161 | |||||||||||
| Telecommunication Services—3.9% | |||||||||||
| 32,762 | ALLTEL Corp. | 2,053,850 | |||||||||
| 10,728 | American Tower Corp., Class A* | 407,664 | |||||||||
| 333,662 | AT&T, Inc. | 12,919,394 | |||||||||
| 11,046 | CenturyTel, Inc. | 508,668 | |||||||||
| 32,420 | Cincinnati Bell, Inc.* | 164,369 | |||||||||
| 42,827 | Citizens Communications Co. | 666,816 | |||||||||
| 5,674 | Crown Castle International Corp.* | 194,845 | |||||||||
| 23,237 | Embarq Corp. | 1,395,149 | |||||||||
| 21,949 | Level 3 Communications, Inc.* | 122,036 | |||||||||
| 2,107 | NII Holdings, Inc.* | 161,712 | |||||||||
| 129,463 | Qwest Communications International, Inc.* | 1,149,631 | |||||||||
| 255,317 | Sprint Nextel Corp. | 5,114,001 | |||||||||
| 4,257 | Telephone & Data Systems, Inc. | 242,436 | |||||||||
| 4,778 | Telephone & Data Systems, Inc., Special Shares | 252,278 | |||||||||
| 6,006 | U.S. Cellular Corp.* | 435,435 | |||||||||
| 400,902 | Verizon Communications, Inc. | 15,306,439 | |||||||||
| 41,094,723 | |||||||||||
| Utilities—6.6% | |||||||||||
| 45,097 | AES (The) Corp.* | 991,683 | |||||||||
| 6,915 | AGL Resources, Inc. | 301,079 | |||||||||
| 8,815 | Allegheny Energy, Inc.* | 471,250 | |||||||||
| 4,715 | ALLETE, Inc. | 228,253 | |||||||||
| 12,681 | Alliant Energy Corp. | 555,428 | |||||||||
| 25,259 | Ameren Corp. | 1,327,866 | |||||||||
| 58,843 | American Electric Power Co., Inc. | 2,955,095 | |||||||||
| 6,394 | Aqua America, Inc. | 141,371 | |||||||||
| 105,286 | Aquila, Inc.* | 434,831 | |||||||||
| 10,075 | Atmos Energy Corp. | 319,579 | |||||||||
| 7,926 | Avista Corp. | 186,974 | |||||||||
| 4,331 | Black Hills Corp. | 172,417 | |||||||||
| 68,013 | CenterPoint Energy, Inc. | 1,280,685 | |||||||||
| 5,801 | Cleco Corp. | 162,776 | |||||||||
| 34,595 | CMS Energy Corp. | 640,699 | |||||||||
| 33,621 | Consolidated Edison, Inc. | 1,723,412 | |||||||||
| 13,129 | Constellation Energy Group, Inc. | 1,170,056 | |||||||||
| 31,966 | Dominion Resources, Inc. | 2,915,299 | |||||||||
| 11,400 | DPL, Inc. | 357,390 | |||||||||
| 26,982 | DTE Energy Co. | 1,365,019 | |||||||||
| Number of Shares | Value | ||||||||||
| Common Stocks (Continued) | |||||||||||
| 120,114 | Duke Energy Corp. | $ | 2,464,739 | ||||||||
| 10,745 | Duquesne Light Holdings, Inc. | 214,255 | |||||||||
| 73,232 | Dynegy, Inc., Class A* | 689,113 | |||||||||
| 31,636 | Edison International | 1,656,145 | |||||||||
| 3,342 | Energen Corp. | 187,319 | |||||||||
| 25,252 | Energy East Corp. | 611,603 | |||||||||
| 16,099 | Entergy Corp. | 1,821,441 | |||||||||
| 5,034 | Equitable Resources, Inc. | 261,818 | |||||||||
| 42,656 | Exelon Corp. | 3,216,690 | |||||||||
| 31,686 | FirstEnergy Corp. | 2,168,590 | |||||||||
| 29,953 | FPL Group, Inc. | 1,928,075 | |||||||||
| 11,591 | Great Plains Energy, Inc. | 378,330 | |||||||||
| 11,389 | Hawaiian Electric Industries, Inc. | 299,758 | |||||||||
| 6,579 | IDACORP, Inc. | 226,647 | |||||||||
| 6,091 | Integrys Energy Group, Inc. | 341,705 | |||||||||
| 25,340 | KeySpan Corp. | 1,049,329 | |||||||||
| 13,474 | MDU Resources Group, Inc. | 408,262 | |||||||||
| 23,988 | Mirant Corp.* | 1,076,342 | |||||||||
| 7,820 | National Fuel Gas Co. | 367,618 | |||||||||
| 3,318 | New Jersey Resources Corp. | 178,177 | |||||||||
| 6,249 | Nicor, Inc. | 320,199 | |||||||||
| 45,663 | NiSource, Inc. | 1,122,853 | |||||||||
| 19,206 | Northeast Utilities | 617,857 | |||||||||
| 4,018 | NorthWestern Corp. | 141,193 | |||||||||
| 4,960 | NRG Energy, Inc.* | 391,642 | |||||||||
| 13,275 | NSTAR | 476,573 | |||||||||
| 10,895 | OGE Energy Corp. | 418,804 | |||||||||
| 11,376 | ONEOK, Inc. | 550,712 | |||||||||
| 27,410 | Pepco Holdings, Inc. | 809,143 | |||||||||
| 35,382 | PG&E Corp. | 1,790,329 | |||||||||
| 7,872 | Piedmont Natural Gas Co., Inc. | 207,742 | |||||||||
| 13,797 | Pinnacle West Capital Corp. | 666,257 | |||||||||
| 7,754 | PNM Resources, Inc. | 252,393 | |||||||||
| 7,753 | Portland General Electric Co. | 224,682 | |||||||||
| 25,442 | PPL Corp. | 1,109,526 | |||||||||
| 37,144 | Progress Energy, Inc. | 1,877,629 | |||||||||
| 23,161 | Public Service Enterprise Group, Inc. | 2,002,268 | |||||||||
| 16,549 | Puget Energy, Inc. | 427,295 | |||||||||
| 3,838 | Questar Corp. | 372,785 | |||||||||
| 339,263 | Reliant Energy, Inc.* | 7,555,388 | |||||||||
| 14,231 | SCANA Corp. | 619,475 | |||||||||
| 19,018 | Sempra Energy | 1,207,263 | |||||||||
| 16,633 | Sierra Pacific Resources* | 303,719 | |||||||||
| 82,370 | Southern (The) Co. | 3,112,763 | |||||||||
| 7,964 | Southern Union Co. | 242,583 | |||||||||
| 4,520 | Southwest Gas, Corp. | 171,263 | |||||||||
| 30,633 | TECO Energy, Inc. | 549,862 | |||||||||
| 24,320 | TXU Corp. | 1,594,906 | |||||||||
| 11,200 | UGI Corp. | 317,632 | |||||||||
| 4,167 | UIL Holdings Corp. | 142,303 | |||||||||
| 4,091 | Unisource Energy Corp. | 157,135 | |||||||||
| 10,557 | Vectren Corp. | 306,892 | |||||||||
See Notes to Financial Statements.
33
Schedule of Investments (Continued)
PowerShares FTSE RAFI US 1000 Portfolio
April 30, 2007
| Number of Shares | Value | ||||||||||
| Common Stocks (Continued) | |||||||||||
| 11,318 | Westar Energy, Inc. | $ | 308,076 | ||||||||
| 7,542 | WGL Holdings, Inc. | 255,221 | |||||||||
| 11,357 | Wisconsin Energy Corp. | 554,108 | |||||||||
| 62,964 | Xcel Energy, Inc. | 1,516,803 | |||||||||
| 69,942,392 | |||||||||||
| Total Common Stocks (Cost $989,381,932) | 1,053,749,375 | ||||||||||
| Money Market Fund—0.1% | |||||||||||
| 1,207,457 | Liquid Assets Portfolio Private Class** (Cost $1,207,457) | 1,207,457 | |||||||||
| Total Investments (Cost $990,589,389)—100.0% | 1,054,956,832 | ||||||||||
| Other assets less liabilities—0.0% | 231,778 | ||||||||||
| Net Assets—100.0% | $ | 1,055,188,610 | |||||||||
* Non-income producing security.
** Affiliated investment.
COUNTRY BREAKDOWN
April 30, 2007 (Unaudited)
| Value | Net Assets | ||||||||||
| United States | $ | 1,028,102,266 | 97.4 | % | |||||||
| Bermuda | 13,557,859 | 1.3 | |||||||||
| Cayman Islands | 4,854,010 | 0.5 | |||||||||
| Netherlands | 3,033,453 | 0.3 | |||||||||
| Panama | 2,001,312 | 0.2 | |||||||||
| Switzerland | 1,017,237 | 0.1 | |||||||||
| Singapore | 782,596 | 0.1 | |||||||||
| Liberia | 718,662 | 0.1 | |||||||||
| Marshall Islands | 377,883 | 0.0 | |||||||||
| Guernsey | 293,669 | 0.0 | |||||||||
| Israel | 217,885 | 0.0 | |||||||||
| Total investments | 1,054,956,832 | 100.0 | |||||||||
| Other assets less liabilities | 231,778 | 0.0 | |||||||||
| Net Assets | $ | 1,055,188,610 | 100.0 | % | |||||||
See Notes to Financial Statements.
34
This page intentionally left blank
Statements of Assets and Liabilities
PowerShares Exchange-Traded Funds
April 30, 2007
| PowerShares Dynamic Market Portfolio | PowerShares Dynamic OTC Portfolio | PowerShares Dynamic MagniQuant Portfolio | PowerShares FTSE RAFI US 1000 Portfolio | ||||||||||||||||
| ASSETS: | |||||||||||||||||||
| Unaffiliated investments at value | $ | 972,579,568 | $ | 159,839,788 | $ | 81,069,258 | $ | 1,053,749,375 | |||||||||||
| Affiliated investments at value | 681,728 | — | — | 1,207,457 | |||||||||||||||
| Cash | — | — | 227,624 | 409,362 | |||||||||||||||
| Receivables: | |||||||||||||||||||
| Dividends | 446,657 | 6,106 | 35,817 | 835,072 | |||||||||||||||
| Due from Adviser | 88,696 | 27,034 | 14,228 | 55,594 | |||||||||||||||
| Capital stock sold | — | — | — | 6,149,020 | |||||||||||||||
| Investments sold | — | — | — | 9,140,858 | |||||||||||||||
| Other assets | 7,158 | 8,956 | 17,886 | — | |||||||||||||||
| Total Assets | 973,803,807 | 159,881,884 | 81,364,813 | 1,071,546,738 | |||||||||||||||
| LIABILITIES: | |||||||||||||||||||
| Due to custodian | 1,925 | 116,420 | — | — | |||||||||||||||
| Payables: | |||||||||||||||||||
| Investments purchased | — | — | — | 15,604,153 | |||||||||||||||
| Accrued advisory fees | 392,847 | 64,907 | 31,424 | 406,780 | |||||||||||||||
| Accrued expenses | 304,423 | 101,612 | 64,386 | 347,195 | |||||||||||||||
| Total Liabilities | 699,195 | 282,939 | 95,810 | 16,358,128 | |||||||||||||||
| NET ASSETS | $ | 973,104,612 | $ | 159,598,945 | $ | 81,269,003 | $ | 1,055,188,610 | |||||||||||
| NET ASSETS CONSIST OF: | |||||||||||||||||||
| Paid-in capital | $ | 1,005,435,550 | $ | 187,973,752 | $ | 78,651,326 | $ | 990,335,583 | |||||||||||
| Undistributed net investment income | 2,394,598 | — | 196,534 | 1,674,587 | |||||||||||||||
| Accumulated net realized loss on investments | (106,686,774 | ) | (39,085,472 | ) | (894,209 | ) | (1,189,003 | ) | |||||||||||
| Net unrealized appreciation on investments | 71,961,238 | 10,710,665 | 3,315,352 | 64,367,443 | |||||||||||||||
| Net Assets | $ | 973,104,612 | $ | 159,598,945 | $ | 81,269,003 | $ | 1,055,188,610 | |||||||||||
| Shares outstanding (unlimited amount authorized, $0.01 par value) | 18,250,000 | 2,900,000 | 2,900,000 | 17,300,000 | |||||||||||||||
| Net asset value | $ | 53.32 | $ | 55.03 | $ | 28.02 | $ | 60.99 | |||||||||||
| Unaffiliated investments at cost | $ | 900,618,330 | $ | 149,129,123 | $ | 77,753,906 | $ | 989,381,932 | |||||||||||
| Affiliated investments at cost | $ | 681,728 | $ | — | $ | — | $ | 1,207,457 | |||||||||||
See Notes to Financial Statements.
36
Statements of Operations
| PowerShares Dynamic Market Portfolio | PowerShares Dynamic OTC Portfolio | PowerShares Dynamic MagniQuant Portfolio | PowerShares FTSE RAFI US 1000 Portfolio | ||||||||||||||||
| Year Ended April 30, 2007 | Year Ended April 30, 2007 | For the period October 12, 2006* through April 30, 2007 | Year Ended April 30, 2007 | ||||||||||||||||
| INVESTMENT INCOME: | |||||||||||||||||||
| Unaffiliated dividend income | $ | 13,497,548 | $ | 822,619 | $ | 499,195 | $ | 9,472,639 | |||||||||||
| Affiliated dividend income | 20,181 | — | — | 20,677 | |||||||||||||||
| Foreign withholding tax | — | — | — | (861 | ) | ||||||||||||||
| Total Income | 13,517,729 | 822,619 | 499,195 | 9,492,455 | |||||||||||||||
| EXPENSES: | |||||||||||||||||||
| Advisory fees | 4,602,483 | 906,029 | 146,255 | 2,258,401 | |||||||||||||||
| Printing | 415,758 | 88,746 | 17,273 | 222,010 | |||||||||||||||
| Licensing | 276,149 | 54,362 | 14,626 | 451,680 | |||||||||||||||
| Administration fees | 138,075 | 59,998 | 6,891 | 77,815 | |||||||||||||||
| Accounting | 92,050 | 54,998 | 5,375 | 57,855 | |||||||||||||||
| Custodian & transfer agent fees | 56,128 | 19,762 | 5,049 | 32,590 | |||||||||||||||
| Legal | 37,091 | 8,972 | 2,500 | 4,197 | |||||||||||||||
| Trustees | 34,942 | 6,494 | 1,187 | 18,740 | |||||||||||||||
| Audit | 16,500 | 16,500 | 16,500 | 16,500 | |||||||||||||||
| Listing fee and expenses | 12,151 | 10,523 | 10,000 | 5,186 | |||||||||||||||
| Registration & filings | — | — | 1,913 | 22,385 | |||||||||||||||
| Offering costs | — | — | 5,104 | 9,948 | |||||||||||||||
| Other expenses | 39,077 | 19,845 | 12,236 | 32,073 | |||||||||||||||
| Total Expenses | 5,720,404 | 1,246,229 | 244,909 | 3,209,380 | |||||||||||||||
| Less fees waived: | |||||||||||||||||||
| Advisory | (206,366 | ) | (158,385 | ) | (49,137 | ) | (62,357 | ) | |||||||||||
| Net Expenses | 5,514,038 | 1,087,844 | 195,772 | 3,147,023 | |||||||||||||||
| Net Investment Income (Loss) | 8,003,691 | (265,225 | ) | 303,423 | 6,345,432 | ||||||||||||||
| REALIZED AND UNREALIZED GAIN (LOSS) ON INVESTMENTS: | |||||||||||||||||||
| Net realized gain (loss) from: | |||||||||||||||||||
| Investments | (59,168,002 | ) | (20,320,844 | ) | (894,209 | ) | (1,185,394 | ) | |||||||||||
| In-kind redemptions | 125,856,245 | 27,485,411 | 2,366,191 | 21,836,853 | |||||||||||||||
| Net realized gain | 66,688,243 | 7,164,567 | 1,471,982 | 20,651,459 | |||||||||||||||
| Net change in unrealized appreciation/ depreciation on investments | 29,944,772 | (5,390,297 | ) | 3,315,352 | 61,838,256 | ||||||||||||||
| Net realized and unrealized gain on investments | 96,633,015 | 1,774,270 | 4,787,334 | 82,489,715 | |||||||||||||||
| Net increase in net assets resulting from operations | $ | 104,636,706 | $ | 1,509,045 | $ | 5,090,757 | $ | 88,835,147 | |||||||||||
* Commencement of Investment Operations.
See Notes to Financial Statements.
37
Statements of Changes in Net Assets
| PowerShares Dynamic Market Portfolio | PowerShares Dynamic OTC Portfolio | ||||||||||||||||||
| For the year ended April 30, 2007 | For the year ended April 30, 2006 | For the year ended April 30, 2007 | For the year ended April 30, 2006 | ||||||||||||||||
| OPERATIONS: | |||||||||||||||||||
| Net investment income (loss) | $ | 8,003,691 | $ | 4,507,218 | $ | (265,225 | ) | $ | (68,374 | ) | |||||||||
| Net realized gain on investments | 66,688,243 | 50,752,159 | 7,164,567 | 16,160,854 | |||||||||||||||
| Net change in unrealized appreciation/depreciation of investments | 29,944,772 | 45,428,370 | (5,390,297 | ) | 15,104,755 | ||||||||||||||
| Net increase in net assets resulting from operations | 104,636,706 | 100,687,747 | 1,509,045 | 31,197,235 | |||||||||||||||
| Undistributed net investment income included in the price of units issued and redeemed | 4,323 | — | 91,702 | — | |||||||||||||||
| DISTRIBUTIONS TO SHAREHOLDERS FROM: | |||||||||||||||||||
| Net investment income | (6,116,430 | ) | (4,155,736 | ) | — | (51,000 | ) | ||||||||||||
| Tax return of capital | — | — | — | (107,644 | ) | ||||||||||||||
| Total distributions | (6,116,430 | ) | (4,155,736 | ) | — | (158,644 | ) | ||||||||||||
| SHAREHOLDER TRANSACTIONS: | |||||||||||||||||||
| Proceeds from shares sold | 1,426,914,403 | 1,422,241,078 | 259,930,591 | 365,564,123 | |||||||||||||||
| Value of shares repurchased | (1,471,486,113 | ) | (883,237,374 | ) | (324,280,921 | ) | (239,909,539 | ) | |||||||||||
| Net income equalization | (4,323 | ) | — | (91,702 | ) | — | |||||||||||||
| Net increase (decrease) in net assets resulting from shares transactions | (44,576,033 | ) | 539,003,704 | (64,442,032 | ) | 125,654,584 | |||||||||||||
| Increase (decrease) in Net Assets | 53,948,566 | 635,535,715 | (62,841,285 | ) | 156,693,175 | ||||||||||||||
| NET ASSETS: | |||||||||||||||||||
| Beginning of period | 919,156,046 | 283,620,331 | 222,440,230 | 65,747,055 | |||||||||||||||
| End of period | $ | 973,104,612 | $ | 919,156,046 | $ | 159,598,945 | $ | 222,440,230 | |||||||||||
| Undistributed net investment income (loss) at end of period | $ | 2,394,598 | $ | 507,337 | $ | — | $ | — | |||||||||||
| CHANGES IN SHARES OUTSTANDING: | |||||||||||||||||||
| Shares sold | 29,700,000 | 31,600,000 | 5,150,000 | 7,500,000 | |||||||||||||||
| Shares repurchased | (30,650,000 | ) | (19,652,228 | ) | (6,400,000 | ) | (4,901,424 | ) | |||||||||||
| Shares outstanding, beginning of period | 19,200,000 | 7,252,228 | 4,150,000 | 1,551,424 | |||||||||||||||
| Shares outstanding, end of period | 18,250,000 | 19,200,000 | 2,900,000 | 4,150,000 | |||||||||||||||
* Commencement of Investment Operations.
See Notes to Financial Statements.
38
| PowerShares Dynamic MagniQuant Portfolio | PowerShares FTSE RAFI US 1000 Portfolio | ||||||||||||||
| For the period October 12, 2006* through April 30, 2007 | For the year ended April 30, 2007 | For the period December 19, 2005* through April 30, 2006 | |||||||||||||
| OPERATIONS: | |||||||||||||||
| Net investment income (loss) | $ | 303,423 | $ | 6,345,432 | $ | 323,389 | |||||||||
| Net realized gain on investments | 1,471,982 | 20,651,459 | 918,416 | ||||||||||||
| Net change in unrealized appreciation/depreciation of investments | 3,315,352 | 61,838,256 | 2,529,187 | ||||||||||||
| Net increase in net assets resulting from operations | 5,090,757 | 88,835,147 | 3,770,992 | ||||||||||||
| Undistributed net investment income included in the price of units issued and redeemed | 34,154 | 2,687,242 | — | ||||||||||||
| DISTRIBUTIONS TO SHAREHOLDERS FROM: | |||||||||||||||
| Net investment income | (106,889 | ) | (4,798,111 | ) | (194,752 | ) | |||||||||
| Tax return of capital | — | — | — | ||||||||||||
| Total distributions | (106,889 | ) | (4,798,111 | ) | (194,752 | ) | |||||||||
| SHAREHOLDER TRANSACTIONS: | |||||||||||||||
| Proceeds from shares sold | 118,994,387 | 1,023,566,925 | 121,737,639 | ||||||||||||
| Value of shares repurchased | (42,709,252 | ) | (157,298,357 | ) | (20,430,873 | ) | |||||||||
| Net income equalization | (34,154 | ) | (2,687,242 | ) | — | ||||||||||
| Net increase (decrease) in net assets resulting from shares transactions | 76,250,981 | 863,581,326 | 101,306,766 | ||||||||||||
| Increase (decrease) in Net Assets | 81,269,003 | 950,305,604 | 104,883,006 | ||||||||||||
| NET ASSETS: | |||||||||||||||
| Beginning of period | — | 104,883,006 | — | ||||||||||||
| End of period | $ | 81,269,003 | $ | 1,055,188,610 | $ | 104,883,006 | |||||||||
| Undistributed net investment income (loss) at end of period | $ | 196,534 | $ | 1,674,587 | $ | 129,021 | |||||||||
| CHANGES IN SHARES OUTSTANDING: | |||||||||||||||
| Shares sold | 4,500,000 | 18,000,000 | 2,400,000 | ||||||||||||
| Shares repurchased | (1,600,000 | ) | (2,700,000 | ) | (400,000 | ) | |||||||||
| Shares outstanding, beginning of period | — | 2,000,000 | — | ||||||||||||
| Shares outstanding, end of period | 2,900,000 | 17,300,000 | 2,000,000 | ||||||||||||
39
Financial Highlights
PowerShares Dynamic Market Portfolio
| For the year ended April 30, 2007 | For the year ended April 30, 2006 | For the year ended April 30, 2005 | For the year May 1, 2003* through April 30, 2004 | ||||||||||||||||
| PER SHARE OPERATING PERFORMANCE: | |||||||||||||||||||
| Net asset value at beginning of period | $ | 47.87 | $ | 39.11 | $ | 35.05 | $ | 26.99 | † | ||||||||||
| Net investment income** | 0.42 | 0.34 | 0.26 | 0.15 | † | ||||||||||||||
| Net realized and unrealized gain on investments | 5.35 | 8.75 | 4.02 | 8.09 | † | ||||||||||||||
| Total from operations . | 5.77 | 9.09 | 4.28 | 8.24 | † | ||||||||||||||
| Undistributed net investment income included in price of units issued and redeemed** | — | (a) | — | — | — | ||||||||||||||
| Distributions to shareholders from: | |||||||||||||||||||
| Net investment income | (0.32 | ) | (0.33 | ) | (0.22 | ) | (0.18 | )† | |||||||||||
| Net asset value at end of period | $ | 53.32 | $ | 47.87 | $ | 39.11 | $ | 35.05 | † | ||||||||||
| TOTAL RETURN*** | 12.12 | % | 23.30 | % | 12.23 | % | 30.50 | % | |||||||||||
| RATIOS/SUPPLEMENTAL DATA: | |||||||||||||||||||
| Net assets at end of period (000's omitted) . | $ | 973,105 | $ | 919,156 | $ | 283,620 | $ | 85,946 | |||||||||||
| Ratio to average net assets of: | |||||||||||||||||||
| Expenses, net of waivers | 0.60 | % | 0.60 | % | 0.60 | % | 0.60 | % | |||||||||||
| Expenses, prior to waivers | 0.62 | % | 0.63 | % | 0.70 | % | 1.26 | % | |||||||||||
| Net investment income, net of waivers | 0.87 | % | 0.76 | % | 0.68 | % | 0.46 | % | |||||||||||
| Portfolio turnover rate †† | 114 | % | 103 | % | 94 | % | 58 | % | |||||||||||
PowerShares Dynamic OTC Portfolio
| For the year ended April 30, 2007 | For the year ended April 30, 2006 | For the year ended April 30, 2005 | For the year May 1, 2003* through April 30, 2004 | ||||||||||||||||
| PER SHARE OPERATING PERFORMANCE: | |||||||||||||||||||
| Net asset value at beginning of period | $ | 53.60 | $ | 42.38 | $ | 36.59 | $ | 28.57 | † | ||||||||||
| Net investment loss** | (0.07 | ) | (0.02 | ) | (0.03 | ) | (0.04 | )† | |||||||||||
| Net realized and unrealized gain on investments | 1.47 | 11.30 | 5.82 | 8.06 | † | ||||||||||||||
| Total from operations | 1.40 | 11.28 | 5.79 | 8.02 | † | ||||||||||||||
| Undistributed net investment income included in price of units issued and redeemed** | 0.03 | — | — | — | |||||||||||||||
| Distributions to shareholders from: | |||||||||||||||||||
| Net investment income | — | (0.02 | ) | — | — | ||||||||||||||
| Tax return of capital | — | (0.04 | ) | — | — | ||||||||||||||
| Total distributions | — | (0.06 | ) | — | — | ||||||||||||||
| Net asset value at end of period | $ | 55.03 | $ | 53.60 | $ | 42.38 | $ | 36.59 | † | ||||||||||
| TOTAL RETURN*** | 2.67 | % | 26.63 | % | 15.81 | % | 28.07 | % | |||||||||||
| RATIOS/SUPPLEMENTAL DATA: | |||||||||||||||||||
| Net assets at end of period (000's omitted) | $ | 159,599 | $ | 222,440 | $ | 65,747 | $ | 34,817 | |||||||||||
| Ratio to average net assets of: | |||||||||||||||||||
| Expenses, net of waivers | 0.60 | % | 0.60 | % | 0.60 | % | 0.60 | % | |||||||||||
| Expenses, prior to waivers | 0.69 | % | 0.69 | % | 1.06 | % | 1.66 | % | |||||||||||
| Net investment loss, net of waivers | (0.15 | )% | (0.04 | )% | (0.06 | )% | (0.10 | )% | |||||||||||
| Portfolio turnover rate †† | 107 | % | 77 | % | 112 | % | 79 | % | |||||||||||
* Commencement of Investment Operations.
** Based on average shares outstanding.
*** Total investment return is calculated assuming an initial investment made at the net asset value at the beginning of the period, reinvestment of all dividends and distributions at net asset value during the period, and redemption on the last day of the period. Total investment return calculated for a period of less than one year is not annualized.
† Per share amounts have been adjusted for 4 for 1 stock split (See Note 9).
†† Portfolio turnover is not annualized and does not include securities received or delivered from processing creations or redemptions.
(a) Amount represents less than $0.005.
See Notes to Financial Statements.
40
Financial Highlights (Continued)
PowerShares Dynamic MagniQuant Portfolio
| For the period October 12, 2006* through April 30, 2007 | |||||||
| PER SHARE OPERATING PERFORMANCE: | |||||||
| Net asset value at beginning of period | $ | 25.37 | |||||
| Net investment income** | 0.15 | ||||||
| Net realized and unrealized gain on investments | 2.53 | ||||||
| Total from operations | 2.68 | ||||||
| Undistributed net investment income included in price of units issued and redeemed** | 0.02 | ||||||
| Distributions to shareholders from: | |||||||
| Net investment income | (0.05 | ) | |||||
| Net asset value at end of period | $ | 28.02 | |||||
| TOTAL RETURN*** | 10.67 | % | |||||
| RATIOS/SUPPLEMENTAL DATA: | |||||||
| Net assets at end of period (000's omitted) | $ | 81,269 | |||||
| Ratio to average net assets of: | |||||||
| Expenses, net of waivers | 0.67 | %† | |||||
| Expenses, prior to waivers | 0.84 | %† | |||||
| Net investment income, net of waivers | 1.04 | %† | |||||
| Portfolio turnover rate †† | 23 | % | |||||
PowerShares FTSE RAFI US 1000 Portfolio
| For the year ended April 30, 2007 | For the period December 19, 2005* through April 30, 2006 | ||||||||||
| PER SHARE OPERATING PERFORMANCE: | |||||||||||
| Net asset value at beginning of period | $ | 52.44 | $ | 49.64 | |||||||
| Net investment income** | 0.78 | 0.24 | |||||||||
| Net realized and unrealized gain on investments | 8.05 | 2.68 | |||||||||
| Total from operations | 8.83 | 2.92 | |||||||||
| Undistributed net investment income included in price of units issued and redeemed** | 0.33 | — | |||||||||
| Distributions to shareholders from: | |||||||||||
| Net investment income | (0.61 | ) | (0.12 | ) | |||||||
| Net asset value at end of period | $ | 60.99 | $ | 52.44 | |||||||
| TOTAL RETURN*** | 17.60 | % | 5.89 | % | |||||||
| RATIOS/SUPPLEMENTAL DATA: | |||||||||||
| Net assets at end of period (000's omitted) | $ | 1,055,189 | $ | 104,883 | |||||||
| Ratio to average net assets of: | |||||||||||
| Expenses, net of waivers | 0.70 | % | 0.76 | %† | |||||||
| Expenses, prior to waivers | 0.71 | %††† | 1.00 | %† | |||||||
| Net investment income, net of waivers | 1.40 | % | 1.38 | %† | |||||||
| Portfolio turnover rate †† | 8 | % | 2 | % | |||||||
* Commencement of Investment Operations.
** Based on average shares outstanding.
*** Total investment return is calculated assuming an initial investment made at the net asset value at the beginning of the period, reinvestment of all dividends and distributions at net asset value during the period, and redemption on the last day of the period. Total investment return calculated for a period of less than one year is not annualized.
† Annualized.
†† Portfolio turnover is not annualized and does not include securities received or delivered from processing creations or redemptions.
††† These expenses, prior to waivers include amounts reimbursed to the Adviser under the Expense Agreement of 0.02% for the year ended, April 30, 2007.
See Notes to Financial Statements.
41
Notes to Financial Statements
PowerShares Exchange-Traded Fund Trust
April 30, 2007
Note 1. Organization
PowerShares Exchange-Traded Fund Trust (the "Trust"), which is registered under the Investment Company Act of 1940, as amended (the "1940 Act"), is an exchange-traded, management investment company that was organized as a Massachusetts business trust on June 9, 2000. The Trust currently consists of seventy portfolios. This report includes the following portfolios:
| PowerShares Dynamic Market Portfolio | "Dynamic Market Portfolio" | ||||||
| PowerShares Dynamic OTC Portfolio | "Dynamic OTC Portfolio" | ||||||
| PowerShares Dynamic MagniQuant Portfolio | "Dynamic MagniQuant Portfolio" | ||||||
| PowerShares FTSE RAFI US 1000 Portfolio | "FTSE RAFI US 1000 Portfolio" | ||||||
Dynamic MagniQuant Portfolio commenced investment operations on October 12, 2006. Each portfolio represents a separate series of the Trust (the "Fund" or "Funds"). Each Fund's shares are listed and traded on the American Stock Exchange except for shares of the FTSE RAFI US 1000 Portfolio. The shares of FTSE RAFI US 1000 are traded on the New York Stock Exchange. The Funds' market prices may differ to some degree from the net asset value of the shares of each Fund. Unlike conventional mutual funds, each Fund issues and redeems shares on a continuous basis, at net asset value, only in a large specified number of shares, each called a "Creation Unit." Creation Units are issued and redeemed principally in-kind for securities included in the relevant index. Except when aggregated in Creation Units, shares are not individually redeemable securities of the Funds. The investment objective of each Fund is to seek investment results that correspond generally to the price and yield (before the Fund's fees and expenses) of the following equity indices:
| Fund | Index | ||||||
| Dynamic Market Portfolio | Dynamic Market IntellidexSM Index | ||||||
| Dynamic OTC Portfolio | Dynamic OTC IntellidexSM Index | ||||||
| Dynamic MagniQuant Portfolio | Top 200 Dynamic IntellidexSM Index | ||||||
| FTSE RAFI US 1000 Portfolio | FTSE RAFI US 1000 Index | ||||||
Note 2. Significant Accounting Policies
The preparation of the financial statements in accordance with accounting principles generally accepted in the United States of America requires management to make estimates and assumptions that affect the reported amounts and disclosures in the financial statements. Actual results could differ from these estimates.
A. Security Valuation
Securities are valued based on their last sale price. Price information on listed securities is taken from the exchange where the security is primarily traded. Securities regularly traded in an over-the-counter market are valued at the latest quoted sale price in such market or in the case of NASDAQ, at the NASDAQ official closing price. Other portfolio securities and assets for which market quotations are not readily available are valued at fair value as determined in good faith by the Trust's Pricing Committee in accordance with procedures adopted by the Board of Trustees. Investments in money market mutual funds are stated at net asset value.
B. Federal Income Taxes
Each Fund intends to comply with the provisions of the Internal Revenue Code applicable to regulated investment companies and will distribute all net investment income and net taxable capital gains to its shareholders. Therefore, no provision for Federal income taxes is required.
42
Notes to Financial Statements (Continued)
PowerShares Exchange-Traded Fund Trust
April 30, 2007
Income and capital gain distributions are determined in accordance with Federal income tax regulations, which may differ from accounting principles generally accepted in the United States. These differences are primarily due to differing book and tax treatments for in-kind transactions, losses deferred due to wash sales, losses deferred due to post-October losses and excise tax regulations.
C. Investment Income and Investment Transactions
Dividend income is recorded on the ex-dividend date. Interest income is recorded on the accrual basis. Investment transactions are recorded on the trade date. Realized gains and losses from the sale or disposition of securities are calculated on the specific identified cost basis. Corporate actions (including cash dividends) are recorded net of nonreclaimable foreign tax withholdings on the ex-dividend date.
D. Expenses
Expenses of the Trust, which are directly identifiable to a specific Fund, are applied to that Fund. Expenses which are not readily identifiable to a specific Fund are allocated in such a manner as deemed equitable, taking into consideration the nature and type of expense and the relative net assets of each Fund.
E. Dividends and Distributions to Shareholders
Each Fund declares and pays dividends from net investment income to its shareholders quarterly and distributes net realized taxable capital gains, if any, annually. Such distributions on a tax basis are determined in conformity with income tax regulations which may differ from accounting principles generally accepted in the United States of America. Distributions in excess of tax basis earnings and profits, if any, are reported in each Fund's financial statements as a return of capital.
F. Equalization
Beginning May 1, 2006 (or since inception, if later), all Funds use the accounting practice of equalization. This accounting method is used to keep the continuing shareholder's per share equity in undistributed net investment income from being affected by the continuous sales and redemptions of capital shares. Equalization is calculated on a per share basis whereby a portion of the proceeds from the sales and cost of repurchases of capital shares is applied to undistributed net investment income. The amount of equalization is disclosed in the Statements of Changes in Net Assets as undistributed net investment income included in the price of capital shares issued or redeemed. The distributions to shareholders of amounts so applied may be deemed to be a return of capital for tax purposes to the extent that such distributions exceed taxable income.
Note 3. Advisory and Administration Agreements
PowerShares Capital Management LLC (the "Adviser") has overall responsibility as the Funds' investment adviser for the selection and ongoing monitoring of the Funds' investments, managing the Funds' business affairs and providing certain clerical, bookkeeping and other administrative services. The fees paid by each Fund to the Adviser are accrued daily and are payable at 0.50% per annum on each Fund's average daily net assets.
Each Fund is responsible for all of its expenses, including the investment advisory fees, costs of transfer agency, custody, fund administration, legal, audit and other services, interest, taxes, brokerage commissions and other expenses connected with executions of portfolio transactions, any distribution fees or expenses and extraordinary expenses. Pursuant to the Investment Advisory Agreement with the Trust, for the Dynamic MagniQuant Portfolio and the FTSE RAFI 1000 Portfolio, the Adviser has agreed to waive fees and/or pay Fund expenses to the extent necessary to prevent the operating expenses of the Funds (excluding interest expense, brokerage commissions and other trading expenses, licensing fees,
43
Notes to Financial Statements (Continued)
PowerShares Exchange-Traded Fund Trust
April 30, 2007
offering costs, taxes and extraordinary expenses) from exceeding 0.60% of average daily net assets per year (the "Expense Cap"), at least until April 30, 2008. Offering costs excluded from the Expense Cap are: (a) legal fees pertaining to the Funds' shares offered for sale; (b) Securities and Exchange Commission and state registration fees; and (c) initial fees paid to be listed on an exchange. For the Dynamic Market Portfolio and the Dynamic OTC Portfolio, the Adviser has agreed to waive fees and/or pay Fund expenses to the extent necessary to prevent the operating expenses of the Funds (excluding interest expense, brokerage commissions and other trading expenses, taxes and extraordinary expenses) from exceeding 0.60% of average daily net assets per year at least until April 30, 2008.
For the period ended April 30, 2007, the Adviser waived and assumed the following fees and expenses:
| Fees Waived | Expenses Assumed | ||||||||||
| Dynamic Market Portfolio | $ | 206,366 | $ | — | |||||||
| Dynamic OTC Portfolio | 158,385 | — | |||||||||
| Dynamic MagniQuant Portfolio | 49,137 | — | |||||||||
| FTSE RAFI US 1000 Portfolio | 62,357 | — | |||||||||
Except for the Dynamic Market Portfolio and the Dynamic OTC Portfolio, the Trust and the Adviser have entered into an Excess Expense Agreement (the "Expense Agreement") in which expenses borne by the Adviser are subject to reimbursement by each Fund up to three years from the date the fee or expense was incurred, but no reimbursement payment will be made by each Fund if it would result in each Fund exceeding its Expense Cap as specified above. The Expense Agreement does not apply to the Dynamic Market Portfolio and Dynamic OTC Portfolio. Accordingly, expenses of these Funds borne by the Adviser are not subject to reimbursement.
During the period ended April 30, 2007, details of expense waivers and reimbursements to the Adviser under the Expense Agreement was as follows:
| Gross Waivers | Gross Reimbursements | Net Waivers | |||||||||||||
| FTSE RAFI US 1000 Portfolio | $ | (138,397 | ) | $ | 76,040 | $ | (62,357 | ) | |||||||
The net amounts of waivers are also shown on the Statements of Operations.
The amounts subject to reimbursement to the Adviser at April 30, 2007 are as follows:
| Reimbursements available during the fiscal years ending: | |||||||||||||||
| 04/30/08 | 04/30/09 | 04/30/10 | |||||||||||||
| Dynamic MagniQuant Portfolio | $ | 49,137 | $ | 49,137 | $ | 49,137 | |||||||||
| FTSE RAFI US 1000 Portfolio | 118,831 | 118,831 | 118,831 | ||||||||||||
44
Notes to Financial Statements (Continued)
PowerShares Exchange-Traded Fund Trust
April 30, 2007
Distribution Agreement
Effective September 18, 2006 (or since inception, if later), A I M Distributors, Inc. (the "Distributor") serves as the distributor of Creation Units of each Fund pursuant to a Distribution Agreement between the Distributor and the Trust. The Distributor does not maintain a secondary market in shares. Prior to September 18, 2006, ALPS Distributors, Inc. served as the distributor.
The Board of Trustees of the Trust has adopted a distribution plan pursuant to Rule 12b-1 under the 1940 Act. In accordance with the Rule 12b-1 plan, each Fund is authorized to pay an amount up to a maximum annual rate of 0.25% of the average daily net assets for certain distribution-related activities. No 12b-1 fees are currently charged to the Funds, and there are no plans to impose these fees.
Licensing Fee Agreements
The Adviser has entered into licensing agreements for each Fund with the following Licensors:
| Fund | Licensor | ||||||
| Dynamic Market Portfolio | American Stock Exchange | ||||||
| Dynamic OTC Portfolio | American Stock Exchange | ||||||
| Dynamic MagniQuant Portfolio | American Stock Exchange | ||||||
| FTSE RAFI US 1000 Portfolio | FTSE International Ltd. | ||||||
The above trademarks are owned by the respective Licensors. These trademarks have been licensed to the Adviser for use with the Funds. The Funds are not sponsored, endorsed, sold or promoted by the Licensors and the Licensors make no representation regarding the advisability of investing in any of these Funds. The Funds are required to pay the licensing fees which are shown on the Statements of Operations.
The Bank of New York serves as the administrator, custodian and fund accounting and transfer agent for each Fund.
Note 4. INVESCO Transaction and Transactions with Affiliates
On September 18, 2006, INVESCO PLC (formerly AMVESCAP PLC) and A I M Management Group, Inc., an indirect wholly-owned subsidiary of INVESCO PLC, announced that they had completed their acquisition of the Adviser (the "Acquisition"). The Board of Trustees, including a majority of the independent Trustees, and shareholders of each Fund had previously approved a new advisory agreement with the Adviser that became effective on September 18, 2006.
The Funds are permitted to invest daily available cash balances in affiliated money market funds. The Funds invest in the Liquid Assets Portfolio ("LAP") of the Short-Term Investments. LAP is advised by A I M Advisors, Inc., an affiliate of the Adviser.
45
Notes to Financial Statements (Continued)
PowerShares Exchange-Traded Fund Trust
April 30, 2007
Note 5. Federal Income Tax
At April 30, 2007, the components of accumulated earnings/loss on a tax-basis were as follows:
| Accumulated Earnings | Net Accumulated Capital and other Gains/Losses | Unrealized Appreciation/ Depreciation | Gross Unrealized Appreciation | Gross Unrealized Depreciation | Total Accumulated Earnings/Loss | ||||||||||||||||||||||
| Dynamic Market Portfolio | $ | 2,394,598 | $ | (93,407,517 | ) | $ | 71,875,919 | $ | 78,965,448 | $ | (7,089,529 | ) | $ | (19,137,000 | ) | ||||||||||||
| Dynamic OTC Portfolio | — | (33,418,433 | ) | 10,671,603 | 13,830,354 | (3,158,751 | ) | (22,746,830 | ) | ||||||||||||||||||
| Dynamic MagniQuant Portfolio | 196,534 | — | 3,315,352 | 4,405,525 | (1,090,173 | ) | 3,511,886 | ||||||||||||||||||||
| FTSE RAFI US 1000 Portfolio | 1,674,587 | (44,432 | ) | 63,239,109 | 69,936,942 | (6,697,833 | ) | 64,869,264 | |||||||||||||||||||
At April 30, 2007, the cost of investments for Federal income tax purposes was as follows:
| Dynamic Market Portfolio | $ | 901,385,377 | |||||
| Dynamic OTC Portfolio | 149,168,185 | ||||||
| Dynamic MagniQuant Portfolio | 77,753,906 | ||||||
| FTSE RAFI US 1000 Portfolio | 991,717,723 | ||||||
Distributions to Shareholders:
The tax character of distributions paid during the period ended April 30, 2007 was as follows:
| Distributions paid from Ordinary Income | |||||||
| Dynamic Market Portfolio | $ | 6,116,430 | |||||
| Dynamic MagniQuant Portfolio | 106,889 | ||||||
| FTSE RAFI US 1000 Portfolio | 4,798,111 | ||||||
The tax character of distributions paid during the period ended April 30, 2006 was as follows:
| Distributions paid from Ordinary Income | |||||||
| Dynamic Market Portfolio | $ | 4,155,736 | |||||
| Dynamic OTC Portfolio | 51,000 | ||||||
| FTSE RAFI US 1000 Portfolio | 194,752 | ||||||
| Distributions paid from Return of Capital | |||||||
| Dynamic OTC Portfolio | $ | 107,644 | |||||
46
Notes to Financial Statements (Continued)
PowerShares Exchange-Traded Fund Trust
April 30, 2007
At April 30, 2007, for Federal income tax purposes, the Funds have capital loss carryforwards available as shown in the table below, to the extent provided by the regulations, to offset future capital gains through the years indicated. To the extent that these loss carryforwards are used to offset future capital gains, it is probable that the capital gains so offset will not be distributed to shareholders.
| Capital Loss Available Through | Total | ||||||||||||||||||||||||||
| 2011 | 2012 | 2013 | 2014 | 2015 | Amount | ||||||||||||||||||||||
| Dynamic Market Portfolio | $ | 225,469 | $ | 8,920,879 | $ | 5,021,729 | $ | 13,686,812 | $ | 65,552,628 | $ | 93,407,517 | |||||||||||||||
| Dynamic OTC Portfolio | 252,044 | 651,452 | 5,297,385 | 5,449,844 | 21,767,708 | 33,418,433 | |||||||||||||||||||||
| FTSE RAFI US 1000 Portfolio | — | — | — | — | 44,432 | 44,432 | |||||||||||||||||||||
Capital losses incurred after October 31 ("post-October losses") within the taxable year are deemed to arise on the first business day of each Fund's next taxable year.
During the period ended April 30, 2007, the Funds incurred and will elect to defer net capital losses as follows:
| Post-October Losses | |||||||
| Dynamic Market Portfolio | $ | 13,193,938 | |||||
| Dynamic OTC Portfolio | 5,627,977 | ||||||
| Dynamic MagniQuant Portfolio | 894,209 | ||||||
| FTSE RAFI US 1000 Portfolio | 16,237 | ||||||
At April 30, 2007, the following reclassifications were made to the capital accounts of the Funds, to reflect permanent book/tax differences and income and gains available for distributions under income tax regulations, which are primarily due to the differences between book and tax treatment of investments in real estate investment trusts, investments in partnerships, wash sales from redemption in-kind transactions, redemption in-kind transactions, return of capital and net investment losses. Net investment income, net realized gains and net assets were not affected by these changes.
Undistributed Net Investment Income (Loss) | Undistributed Capital Gains/ (Accumulated Losses) | Paid in Capital | |||||||||||||
| Dynamic Market Portfolio | $ | (4,323 | ) | $ | (125,622,091 | ) | $ | 125,626,414 | |||||||
| Dynamic OTC Portfolio | 173,523 | (27,351,891 | ) | 27,178,368 | |||||||||||
| Dynamic MagniQuant Portfolio | (34,154 | ) | (2,366,191 | ) | 2,400,345 | ||||||||||
| FTSE RAFI US 1000 Portfolio | (2,688,997 | ) | (21,760,737 | ) | 24,449,734 | ||||||||||
47
Notes to Financial Statements (Continued)
PowerShares Exchange-Traded Fund Trust
April 30, 2007
Note 6. Investment Transactions
For the period ended April 30, 2007, the cost of securities purchased and proceeds from sales of securities, excluding short-term securities and in-kind transactions, were as follows:
| Purchases | Sales | ||||||||||
| Dynamic Market Portfolio | $ | 1,048,035,645 | $ | 1,053,064,043 | |||||||
| Dynamic OTC Portfolio | 194,086,392 | 196,895,072 | |||||||||
| Dynamic MagniQuant Portfolio | 12,759,491 | 12,940,641 | |||||||||
| FTSE RAFI US 1000 Portfolio | 37,061,432 | 45,751,002 | |||||||||
For the period ended April 30, 2007, in-kind transactions were as follows:
| Purchases | Sales | ||||||||||
| Dynamic Market Portfolio | $ | 1,419,715,581 | $ | 1,456,545,525 | |||||||
| Dynamic OTC Portfolio | 257,955,251 | 319,533,596 | |||||||||
| Dynamic MagniQuant Portfolio | 119,189,148 | 42,726,074 | |||||||||
| FTSE RAFI US 1000 Portfolio | 1,019,719,754 | 144,293,340 | |||||||||
There were no purchases or sales of U.S. government or government agency obligations for the period ended April 30, 2007. Gains on in-kind transactions are not considered taxable gains for Federal income tax purposes.
Note 7. Trustees' Fees
The Trust compensates each Trustee who is not an employee of the Adviser or its affiliates. The interested Trustee does not receive any Trustees' fees.
Note 8. Capital
Shares are created and redeemed by the Trust only in Creation Unit size aggregations of 100,000 (50,000 for Dynamic Market and Dynamic OTC Portfolios). Transaction fees at scheduled amounts ranging from $500 to $5,000 per Creation Unit are charged to those persons creating or redeeming Creation Units. Such transactions are generally permitted on an in-kind basis, with a balancing cash component to equate the transaction to the net asset value per unit of each Fund of the Trust on the transaction date.
Note 9. Stock Split
On July 15, 2003, the Board of Trustees of the Trust declared a 4-for-1 stock split for Dynamic Market Portfolio and Dynamic OTC Portfolio based on the shares outstanding at the close of business on July 15, 2003. The stock split entitled each shareholder of record three additional shares for every share of the Fund. Consequently, 901,671 shares were issued for Dynamic Market Portfolio and 601,068 shares were issued for Dynamic OTC Portfolio. All capital share activity and per share data have been restated to reflect these stock splits.
Note 10. Risk of Concentration
The Funds concentrate their investments in certain industries, subjecting them to greater risk than funds that invest in a wider range of industries.
48
Notes to Financial Statements (Continued)
PowerShares Exchange-Traded Fund Trust
April 30, 2007
Note 11. Indemnifications
Under the Trust's organizational documents, its Officers and Trustees are indemnified against certain liabilities arising out of the performance of their duties to the Trust. Additionally, in the normal course of business, the Trust enters into contracts with service providers that contain general indemnification clauses. The Trust's maximum exposure under these arrangements is unknown, as this would involve future claims that may be made against the Trust that have not yet occurred. However, based on experience, the Trust believes the risk of loss to be remote.
Note 12. New Accounting Pronouncements
On July 13, 2006, the Financial Accounting Standards Board ("FASB") issued FASB Interpretation No. 48, Accounting for Uncertainty in Income Taxes ("FIN 48"). FIN 48 prescribes a recognition threshold and measurement attribute for the financial statement recognition and measurement for a tax position taken or expected to be taken in a tax return. FIN 48 also provides guidance on derecognition, classification, interest and penalties, accounting in interim periods, disclosure and transition. On December 22, 2006, the Securities and Exchange Commission delayed the effective date of FIN 48, which will result in adoption for the Funds as of October 31, 2007. At this time, management is currently assessing the impact of FIN 48, if any, on the Funds' financial statements.
On September 20, 2006, the FASB released Statement of Financial Accounting Standards No. 157 "Fair Value Measurement" ("FAS 157"). FAS 157 establishes an authoritative definition of fair value, sets out a framework for measuring fair value, and requires additional disclosures about fair-value measurement. The application of FAS 157 is required for fiscal years beginning after November 15, 2007 and interim periods within those fiscal years. At this time, management is currently assessing the impact of FAS 157, if any, on the Funds' financial statements and intends for the Funds to adopt FAS 157 provisions during the fiscal year ending April 30, 2009.
49
Report of Independent Registered Public Accounting Firm
To the Board of Trustees and Shareholders of PowerShares Exchange-Traded Fund Trust
In our opinion, the accompanying statements of assets and liabilities, including the portfolios of investments, and the related statements of operations and of changes in net assets and the financial highlights present fairly, in all material respects, the financial position of the portfolios indicated in Note 1 of the financial statements comprising PowerShares Exchange-Traded Fund Trust (the "Trust") at April 30, 2007, the results of each of their operations, the changes in each of their net assets and the financial highlights, for each of the periods presented, in conformity with accounting principles generally accepted in the United States of America. These financial statements and financial highlights (hereafter referred to as "financial statements") are the responsibility of the Trust's management; our responsibility is to express an opinion on these financial statements based on our audits. We conducted our audits of thes e financial statements in accordance with the standards of the Public Company Accounting Oversight Board (United States). Those standards require that we plan and perform the audits to obtain reasonable assurance about whether the financial statements are free of material misstatement. An audit includes examining, on a test basis, evidence supporting the amounts and disclosures in the financial statements, assessing the accounting principles used and significant estimates made by management, and evaluating the overall financial statement presentation. We believe that our audits, which included confirmation of securities at April 30, 2007 by correspondence with the custodian and brokers, provide a reasonable basis for our opinion.
PricewaterhouseCoopers LLP
New York, New York
June 25, 2007
50
Supplemental Information (Unaudited)
Federal Income Tax Information
The percentages of investment income (dividend income plus short-term gains, if any) qualify as follows:
| Qualified dividend income | Dividends-received deduction | ||||||||||
| Dynamic Market Portfolio | 100 | % | 100 | % | |||||||
| Dynamic OTC Portfolio | 0 | % | 0 | % | |||||||
| Dynamic MagniQuant Portfolio | 100 | % | 100 | % | |||||||
| FTSE RAFI US 1000 Portfolio | 100 | % | 100 | % | |||||||
51
Supplemental Information (Unaudited) (Continued)
Trustees and Officers
The Trustees who are not affiliated with the Adviser or affiliates of the Adviser and executive officers of the Trust, their term of office and length of time served, their principal business occupations during the past five years, the number of portfolios in the Fund Complex overseen by each Trustee and the other directorships, if any, held by the Trustee, are shown below.
| Name, Address and Age of Independent Trustees | Position(s) with Trust | Length of Time Served* | Principal Occupation(s) During Past 5 Years | Number of Portfolios in Fund Complex*** Overseen by Trustees | Other Directorships Held by Trustees | ||||||||||||||||||
| Ronn R. Bagge (49) YQA Capital Management, LLC 1755 S. Naperville Rd., Suite 100 Wheaton, IL 60187 | Trustee | Since 2003 | YQA Capital Management LLC (July 1998-Present); formerly Owner/CEO of Electronic Dynamic Balancing Co., Inc. (high-speed rotating equipment service provider) | 79 | None | ||||||||||||||||||
| Marc M. Kole (47)** c/o PowerShares Capital Management LLC 301 W. Roosevelt Road Wheaton, IL 60187 | Trustee | Since 2006 | Controller, Priority Health (September 2005-present); Interim CFO, Priority Health (July 2006-February 2007); formerly Senior Vice President of Finance, United Healthcare (health insurance) (July 2004-July 2005); Senior Vice President of Finance, Oxford Health Plans (June 2000-July 2004) | 79 | None | ||||||||||||||||||
| D. Mark McMillan (44) c/o PowerShares Capital Management LLC 301 W. Roosevelt Road Wheaton, IL 60187 | Trustee | Since 2003 | Member, Bell, Boyd & Lloyd LLC (1989- Present) | 79 | None | ||||||||||||||||||
* This is the date the Trustee began serving the Trust.
** At a Board meeting held on December 14, 2006, Marc Kole was elected to serve as Trustee of the Trust.
*** Fund Complex includes all open-end funds (including all of their Portfolios) advised by the Adviser. The Fund Complex consists of the Trust's 70 Portfolios and one other exchange-traded fund trust with 9 Portfolios advised by the Adviser.
52
Supplemental Information (Unaudited) (Continued)
Trustees and Officers (Continued)
| Name, Address and Age of Independent Trustees | Position(s) with Trust | Length of Time Served* | Principal Occupation(s) During Past 5 Years | Number of Portfolios in Fund Complex*** Overseen by Trustees | Other Directorships Held by Trustees | ||||||||||||||||||
| Philip M. Nussbaum (45) c/o PowerShares Capital Management LLC 301 W. Roosevelt Road Wheaton, IL 60187 | Trustee | Since 2003 | Chairman, Performance Trust Capital Partners (formerly Betzold, Berg, Nussbaum & Heitman, Inc.); formerly Managing Director, Communication Institute (May 2002-August 2003); Executive Vice President of Finance, Betzold, Berg, Nussbaum & Heitman, Inc. (March 1994-1999) | 79 | None | ||||||||||||||||||
| Donald H. Wilson (47)** c/o PowerShares Capital Management LLC 301 W. Roosevelt Road Wheaton, IL 60187 | Trustee | Since 2006 | Executive Vice President and Chief Financial Officer, AMCORE Financial, Inc. (bank holding company) (February 2006-present); formerly, Senior Vice President and Treasurer, Marshall & Ilsley Corp. (bank holding company) (May 1995-February 2006) | 79 | None | ||||||||||||||||||
* This is the date the Trustee began serving the Trust.
** At a Board meeting held on December 14, 2006, Donald Wilson was elected to serve as Trustee of the Trust.
*** Fund Complex includes all open-end funds (including all of their Portfolios) advised by the Adviser. The Fund Complex consists of the Trust's 70 Portfolios and one other exchange-traded fund trust with 9 Portfolios advised by the Adviser.
53
Supplemental Information (Unaudited) (Continued)
Trustees and Officers (Continued)
| Name, Address and Age of Management Trustee | Position(s) with Trust | Length of Time Served* | Principal Occupation(s) During Past 5 Years | Number of Portfolios in Fund Complex*** Overseen by Trustee | Other Directorships Held by Trustee | ||||||||||||||||||
| H. Bruce Bond (44)** PowerShares Capital Management LLC 301 W. Roosevelt Road Wheaton, IL 60187 | Chairman of the Board, Trustee and Chief Executive Officer | Since 2003 | Managing Director, PowerShares Capital Management LLC (August 2002- Present); Manager, Nuveen Investments (April 1998- August 2002) | 79 | None | ||||||||||||||||||
* This is the date the Management Trustee began serving the Trust.
** Interested person as defined in Section 2(a)(19) of the 1940 Act.
*** Fund Complex includes all open-end funds (including all of their Portfolios) advised by the Adviser. The Fund Complex consists of the Trust's 70 Portfolios and one other exchange-traded fund trust with 9 Portfolios advised by the Adviser.
54
Supplemental Information (Unaudited) (Continued)
Trustees and Officers (Continued)
| Name, Address and Age of Officers | Position(s) with Trust | Length of Time Served* | Principal Occupation(s) During Past 5 Years | ||||||||||||
| Bruce T. Duncan (52) PowerShares Capital Management LLC 301 W. Roosevelt Road Wheaton, IL 60187 | Chief Financial Officer and Treasurer | Since 2006 | Senior Vice President of Finance, PowerShares Capital Management LLC (September 2005-Present); Private Practice Attorney (2000-2005); Vice President of Investor Relations, The ServiceMaster Company (1994-2000); Vice President of Taxes, The ServiceMaster Company (1990-2000) | ||||||||||||
| Kevin R. Gustafson (41) PowerShares Capital Management LLC 301 W. Roosevelt Road Wheaton, IL 60187 | Chief Compliance Officer | Since 2004 | General Counsel and Chief Compliance Officer, PowerShares Capital Management LLC (September 2004-Present); Attorney, Nyberg & Gustafson (2001-2004); Attorney, Burke, Warren, McKay & Serritella, P.C. (1997-2000) | ||||||||||||
| Keith Ovitt (44) PowerShares Capital Management LLC 301 W. Roosevelt Road Wheaton, IL 60187 | Secretary | Since 2003 | Managing Director, PowerShares Capital Management LLC (April 2003-Present); President, Ovitech (2002-2003); Vice President of Information Systems for DFG Foods, LLC (Division of FoodBrands America/Tyson Foods) (1999-2002); Systems Manager, Nabisco Biscuit Company (1997-1999) | ||||||||||||
* This is the period for which the Officers began serving the Trust. Each Officer serves an indefinite term, until his successor is elected.
55
Board Considerations Regarding Continuation of Investment Advisory Agreement (Unaudited)
At a meeting held on April 20, 2007, the Board of Trustees of the PowerShares Exchange-Traded Fund Trust (the "Trust"), including the Independent Trustees, unanimously approved the continuation of the Investment Advisory Agreement between PowerShares Capital Management LLC (the "Adviser") and the Trust for the following series (the "Funds"):
PowerShares Dynamic Market Portfolio
PowerShares Dynamic OTC Portfolio
PowerShares Golden Dragon Halter USX China Portfolio
PowerShares High Yield Equity Dividend AchieversTM Portfolio
PowerShares WilderHill Clean Energy Portfolio
PowerShares Dynamic Large Cap Growth Portfolio
PowerShares Dynamic Large Cap Value Portfolio
PowerShares Dynamic Mid Cap Growth Portfolio
PowerShares Dynamic Mid Cap Value Portfolio
PowerShares Dynamic Small Cap Growth Portfolio
PowerShares Dynamic Small Cap Value Portfolio
PowerShares Dynamic Biotechnology & Genome Portfolio
PowerShares Dynamic Food & Beverage Portfolio
PowerShares Dynamic Leisure and Entertainment Portfolio
PowerShares Dynamic Media Portfolio
PowerShares Dynamic Networking Portfolio
PowerShares Dynamic Pharmaceuticals Portfolio
PowerShares Dynamic Semiconductors Portfolio
PowerShares Dynamic Software Portfolio
PowerShares Zacks Micro Cap Portfolio
PowerShares Aerospace & Defense Portfolio
PowerShares Dynamic Hardware & Consumer Electronics Portfolio
PowerShares Dynamic Telecommunications & Wireless Portfolio
PowerShares Value Line Timeliness Select Portfolio
PowerShares Divided AchieversTM Portfolio
PowerShares International Dividend AchieversTM Portfolio
PowerShares High Growth Rate Dividend AchieversTM Portfolio
PowerShares Zacks Small Cap Portfolio
PowerShares Dynamic Building & Construction Portfolio
PowerShares Dynamic Energy Exploration & Production Portfolio
PowerShares Dynamic Insurance Portfolio
PowerShares Dynamic Oil & Gas Services Portfolio
PowerShares Dynamic Retail Portfolio
PowerShares Dynamic Utilities Portfolio
PowerShares Lux Nanotech Portfolio
PowerShares FTSE RAFI US 1000 Portfolio
PowerShares Water Resources Portfolio
The Trustees reviewed information from the Adviser describing: (i) the nature, extent and quality of services provided, (ii) the investment performance of the Funds and the Adviser, (iii) the costs of services provided and estimated profits realized by the Adviser, (iv) the extent to which economies of scale are realized as the Funds grow, (v) whether fee levels reflect any possible economies of scale for the benefit of Fund shareholders, (vi) comparisons of services rendered and amounts paid to other registered investment companies and (vii) any benefits realized by the Adviser from its relationship with each Fund. Based on all of the information considered and the conclusions reached, the Board, including the Independent Trustees, determined to approve the continuation of the Investment Advisory Agreement for each Fund listed above. No single factor was determinative in the Board's analysis.
56
Board Considerations Regarding Continuation of Investment Advisory Agreement (Unaudited) (Continued)
Nature, Extent and Quality of Services. In evaluating the nature, extent and quality of the Adviser's services, the Trustees reviewed information concerning the functions performed by the Adviser for the Funds, information describing the Adviser's current organization, including operations assistance provided by the Adviser's new parent organization, AMVESCAP LLC, and the background and experience of the persons responsible for the day-to-day management of the Funds. The Trustees reviewed matters related to the Adviser's portfolio transaction policies and procedures. The Trustees reviewed information on the performance of the Funds and the performance of their benchmark indices. The Trustees also reviewed reports on the correlation and tracking error between the underlying index and each Fund's performance and reviewed a report of a consultant to the Adviser on correlation and tracking error. The Trustees concluded that Funds are correlated to their underlying index and that the tracking error was within a reasonable range.
The Trustees also considered the services provided by the Adviser in its oversight of the Funds' administrator, custodian and transfer agent. They noted the significant amount of time and effort that had been devoted to this oversight function.
Based on their review, the Trustees found that the nature and extent of services provided to the Funds under the Investment Advisory Agreement are appropriate and that the quality is good.
Fees, Expenses and Profitability. The Trustees reviewed and discussed the information provided by the Adviser on each Fund's expense ratio and the advisory fee, as compared to three categories of comparable funds selected by Lipper Inc., an independent source: exchange-traded index funds ("ETFs"), open-end funds and closed-end funds. The Trustees also reviewed and discussed additional information prepared by Lipper Inc. on expense ratios and advisory fees of a broader universe of ETFs and other index funds. The Adviser supplemented the information prepared by Lipper Inc. with data it compiled on expense ratios and advisory fees of newer ETFs that recently commenced operations. The Trustees noted that the annual advisory fee charged to the Funds was identical (0.50% of average net assets), except for the advisory fee for the PowerShares High Yield Equi ty Dividend AchieversTM Portfolio, the PowerShares Dividend AchieversTM Portfolio, the PowerShares High Growth Rate Dividend AchieversTM Portfolio and the PowerShares International Dividend AchieversTM Portfolio (for each of which the annual advisory fee was 0.40% of average net assets), and that the Adviser had agreed to waive the fee and/or pay expenses to the extent necessary to prevent the annual operating expenses of each Fund (excluding interest expenses, licensing fees (for all Funds other than the initial two Funds, the PowerShares Dynamic OTC Portfolio and the PowerShares Dynamic Market Portfolio), brokerage commissions and other trading expenses, taxes and extraordinary expenses) from exceeding 0.60% (0.50% for the PowerShares High Yield Equity Dividend AchieversTM Portfolio, the PowerShares Dividend AchieversTM Portfolio, the PowerShares High Growth Rate Dividend AchieversTM Portfolio and the PowerShares International Div idend AchieversTM Portfolio) at least until April 30, 2008. The Trustees noted that the Adviser does not provide investment management services to clients other than the Trust. The Trustees noted that the advisory fees were at the higher end of the ETF universe, but were generally lower than fees for open-end (non-ETF) funds and closed-end funds, and were reasonable because of the complexity of the indices, which generally require more frequent rebalancing of the portfolios, the distinguishing factors of the Funds, and the higher administrative, operational and management oversight costs for the Adviser. The Board therefore concluded that the advisory fee and expense ratio of each Fund are competitive and that the advisory fee for each Fund is reasonable and appropriate in amount in light of the quality of services provided and the expense cap in place.
57
Board Considerations Regarding Continuation of Investment Advisory Agreement (Unaudited) (Continued)
In conjunction with their review of fees, the Trustees also considered information provided by the Adviser on the revenues received by the Adviser under the Agreement, as well as the fees waived and expenses reimbursed by the Adviser for the Funds. The Trustees reviewed information provided by the Adviser on its profitability as well as any profits realized by the Adviser from its relationship to each Fund. The Trustees noted the Adviser's statement that its costs of managing the Funds generally exceeded the amount payable as management fees under the Investment Advisory Agreement, and that most of the Funds were operating in a cash loss position. The Trustees concluded that the profitability to the Adviser of the advisory services provided to the Funds is not unreasonable.
Economies of Scale and Whether Fee Levels Reflect These Economies of Scale. The Trustees reviewed the information provided by the Adviser as to the extent to which economies of scale are realized as each Fund grows and whether fee levels reflect economies of scale for the benefit of shareholders. The Trustees reviewed each Fund's asset size, expense ratio, expense limitation agreed to by the Adviser and whether the investment process produced economies of scale. The Trustees noted that certain fixed costs associated with the management of the Funds are being reduced on a per-Fund basis as additional Funds are added, and that the gradual reduction of the per-Fund cost enabled the Adviser to operate some of the Funds under the expense cap, which potentially would lower the costs to shareholders. The Trustees noted that the Excess Expense Agreement with the Trust provided that the Adviser was entitled to be reimbursed by each Fund for fees waived or expenses absorbed pursuant to the expense cap for a period of three years from the date the fee or expense was incurred, provided that no reimbursement would be made that would result in a Fund exceeding its expense cap.
The Trustees noted that the Adviser had not identified any further benefits that it derived from its relationship with the Funds, and had noted that it does not have any soft-dollar arrangements.
Based on all of the information considered and the conclusions reached, the Board, including the Independent Trustees, determined to approve the continuation of the Investment Advisory Agreement for each Fund listed above. No single factor was determinative in the Board's analysis.
58
PowerShares Leading the Intelligent ETF Revolution
PowerShares continues to offer new solutions to the complex needs demanded by advisors and investors today. PowerShares is "Leading the Intelligent ETF Revolution" providing investment advisors and investors with institutional-caliber asset management by seeking to replicate enhanced indexes in one of the more benefit-rich investment vehicles available in the marketplace today, the exchange-traded fund (EFT). Each PowerShares fund can be classified into one of three different categories based on the objective and characteristics of its underlying index: Intelligent Index, Intelligent Exposure and Intelligent Access.
For most recent portfolio performance, please visit our website at www.powershares.com
This page contains advertising materials and should not be viewed as part of the Annual Report.
59
Intelligent Index
PowerShares believes that having insight into a stock's investment merit can have a positive impact on performance. Therefore, most PowerShares ETFs are based on Intelligent Indexes, which seek to provide alpha1 by identifying stocks with the greatest investment merit. These indexes use proprietary methodologies to identify financially strong, effectively managed and attractively priced companies with strong capital appreciation potential. Because their objective is to maximize performance, Intelligent Indexes may look different from the market.
Exchange-Traded Funds
Intelligent Index
PWC - Dynamic Market
PWO - Dynamic OTC
PIQ - Dynamic MagniQuant
PJF - Dynamic Large Cap
PJG - Dynamic Mid Cap
PJM - Dynamic Small Cap
PWB - Dynamic Large Cap Growth
PWV - Dynamic Large Cap Value
PWJ - Dynamic Mid Cap Growth
PWP - Dynamic Mid Cap Value
PWT - Dynamic Small Cap Growth
PWY - Dynamic Small Cap Value
PGZ - Dynamic Aggressive Growth
PVM - Dynamic Deep Value
PYZ - Dynamic Basic Materials Sector
PEZ - Dynamic Consumer Discretionary Sector
PSL - Dynamic Consumer Staples Sector
PXI - Dynamic Energy Sector
PFI - Dynamic Financials Sector
PTH - Dynamic Healthcare Sector
PRN - Dynamic Industrials Sector
PTF - Dynamic Technology Sector
PTE - Dynamic Telecommunications & Wireless
PUI - Dynamic Utilities
PJB - Dynamic Banking
PBE - Dynamic Biotechnology & Genome
PKB - Dynamic Building & Construction
PXE - Dynamic Energy Exploration & Production
PBJ - Dynamic Food & Beverage
PHW - Dynamic Hardware & Consumer Electronics
PTJ - Dynamic Healthcare Services
PIC - Dynamic Insurance
PEJ - Dynamic Leisure and Entertainment
PBS - Dynamic Media
PXQ - Dynamic Networking
PXJ - Dynamic Oil & Gas Services
PJP - Dynamic Pharmaceuticals
PMR - Dynamic Retail
PSI - Dynamic Semiconductors
PSJ - Dynamic Software
1 Alpha is a measure of risk adjusted performance relative to a benchmark or the market.
This page contains advertising materials and should not be viewed as part of the Annual Report.
60
Intelligent Exposure
For investors looking for more market-like exposure, PowerShares offers a lineup of ETFs that seek to track indexes with an Intelligent Exposure objective. These indexes seek to provide accurate exposure to the economy, yet are constructed using more sophisticated techniques than traditional benchmark indexes, which typically use a weighting structure based on market capitalization. Under this traditional structure, market speculation can lead to significant mispricing of stocks and, therefore, suboptimal weights in the index. But indexes seeking Intelligent Exposure use a weighting structure based on company fundamentals: sales, cash flow, book value and dividends. PowerShares believes these factors paint a truer picture of a company's size and lead to more optimal index weightings.
Exchange-Traded Funds
Intelligent Exposure
PRF - FTSE RAFI US 1000
PRFZ - FTSE RAFI US 1500 Small-Mid
PRFM - FTSE RAFI Basic Materials Sector
PRFG - FTSE RAFI Consumer Goods Sector
PRFS - FTSE RAFI Consumer Services Sector
PRFE - FTSE RAFI Energy Sector
PRFF - FTSE RAFI Financials Sector
PRFH - FTSE RAFI Health Care Sector
PRFN - FTSE RAFI Industrials Sector
PRFQ - FTSE RAFI Telecom & Technology Sector
PRFU - FTSE RAFI Utilities Sector
Intelligent Access
Without targeted investment products, unique market segments such as currency or nanotech may be difficult for investors to access. These segments are the focus of indexes that promote Intelligent Access. PowerShares has a diverse lineup of ETFs based on indexes that offer exposure to specific, unique or previously uncovered market areas.
Exchange-Traded Funds
Intelligent Access
PPA - Aerospace & Defense
ADRA - BLDRS Asia 50 ADR Index Fund
ADRD - BLDRS Developed Markets 100 ADR Index Fund
ADRE - BLDRS Emerging Markets 50 ADR Index Fund
ADRU - BLDRS Europe 100 ADR Index Fun
PKW - Buyback Achievers
PZD - Cleantech
PFM - Dividend Achievers
PDP - DWA Technical Lenders
PGF - Financial Preferred
PGJ - Golden Dragon Halter USX China
PHJ - High Growth Rate Dividend Achievers
PEY - High Yield Equity Dividend Achievers
PID - International Dividend Achievers
PSP - Listed Private Equity
PXN - Lux Nanotech
QQQQ - PowerShares QQQ
PYH - Value Line Industry Rotation
PIV - Value Line Timeliness Select
PHO - Water Resources
PBW - Wilderhill Clean Energy
PUW - Wilderhill Progressive Energy
PZI - Zacks Micro Cap
PZJ - Zacks Small Cap
This page contains advertising materials and should not be viewed as part of the Annual Report.
61
PowerShares Asset Class Guide
Domestic Equity
Broad
PWC Dynamic Market
PWO Dynamic OTC
PIV Value Line Timeliness Select
PRF FTSE RAFI US 1000
PRFZ FTSE RAFI US 1500
PIQ Dynamic MagniQuant
QQQQ PowerShares QQQ
PKW Buyback Achievers
PDP DWA Technical Leaders
PVM Dynamic Deep Value
PGZ Dynamic Aggressive Growth
Style
PJF Dynamic Large Cap
PWB Dynamic Large Cap Growth
PWV Dynamic Large Cap Value
PJG Dynamic Mid Cap
PWJ Dynamic Mid Cap Growth
PWP Dynamic Mid Cap Value
PJM Dynamic Small Cap
PWT Dynamic Small Cap Growth
PWY Dynamic Small Cap Value
PZJ Zacks Small Cap
PZI Zacks Micro Cap
International/Region
Region
PPGJ Golden Dragon Halter USX China
ADRA BLDRS Asia 50 ADR Index Fund
ADRD BLDRS Developed Markets 100 ADR Index Fund
ADRE BLDRS Emerging Markets 50 ADR Index Fund
ADRU BLDRS Europe 100 ADR Index Fund
Income
PID International Dividend Achievers
Income/Dividend
PEY High Yield Equity Dividend Achievers
PHJ High Growth Rate Dividend Achievers
PFM Dividend Achievers
PGF Financial Preferred
Sector and Industry
Sector
PUI Dynamic Utilities
PYZ Dynamic Basic Materials Sector
PEZ Dynamic Consumer Discretionary Sector
PSL Dynamic Consumer Staples Sector
PXI Dynamic Energy Sector
PFI Dynamic Financial Sector
PTH Dynamic Healthcare Sector
PRN Dynamic Industrials Sector
PTF Dynamic Technology Sector
PTE Dynamic Telecommunications & Wireless
PRFG FTSE RAFI Consumer Goods Sector
PRFS FTSE RAFI Consumer Services Sector
PRFE FTSE RAFI Energy Sector
PRFF FTSE RAFI Financials Sector
PRFH FTSE RAFI Health Care Sector
PRFN FTSE RAFI Industrials Sector
PRFM FTSE RAFI Basic Materials Sector
PRFQ FTSE RAFI Telecommunications & Technology Sector
PRFU FTSE RAFI Utilities Sector
Industry
PJB Dynamic Banking Sector
PBE Dynamic Biotechnology & Genome
PKB Dynamic Building & Construction
PXE Dynamic Energy Exploration & Production
PBJ Dynamic Food & Beverage
PHW Dynamic Hardware & Consumer Electronics
PTJ Dynamic Healthcare Services Sector
PIC Dynamic Insurance
PEJ Dynamic Leisure and Entertainment
PBS Dynamic Media
PXQ Dynamic Networking
PXJ Dynamic Oil & Gas Services
PJP Dynamic Pharmaceuticals
PMR Dynamic Retail
PSI Dynamic Semiconductors
PSJ Dynamic Software
PPA Aerospace & Defense
PBW Clean Energy
PZD Cleantech
PSP Listed Private Equity
PXN Nanotech
PUW Progressive Energy
PYH Value Line Industry Rotation
PHO Water Resources
This page contains advertising materials and should not be viewed as part of the Annual Report.
62
PowerShares Risk Spectrum
Domestic Equity
More Conservative
Dynamic Deep Value
Dynamic Large Cap
Dynamic Mid Cap
Dynamic MagniQuant
Buyback Achievers
DWA Technical Leaders
Dynamic Small Cap
Dynamic Large Cap Value
FTSE RAFI US 1000
Dynamic Mid Cap Value
Dynamic Market
Dynamic Aggressive Growth
Dynamic Small Cap Value
FTSE RAFI US 1500 Small-Mid
Zacks Micro Cap
PowerShares QQQ
Dynamic Large Cap Growth
Dynamic Mid Cap Growth
Zacks Small Cap
Value Line Timeliness Select
Dynamic Small Cap Growth
Dynamic OTC
More Aggressive
International/Region
More Conservative
BLDRS Europe 100 ADR Index Fund
BLDRS Developed Markets 100 ADR Index Fund
BLDRS Asia 50 Index Fund
International Dividend Achievers
BLDRS Emerging Markets 50 ADR Index Fund
Golden Dragon Halter USX China
More Aggressive
Income/Dividend
More Conservative
Financial Preferred
High Yield Equity Dividend Achievers
Dividend Achievers
High Growth Rate Dividend Achievers
More Aggressive
Sector and Industry
More Conservative
Dynamic Consumer Staples Sector
Dynamic Food & Beverage
Dynamic Banking Sector
Dynamic Financial Sector
Dynamic Utilities
Dynamic Insurance
FTSE RAFI Health Care Sector
Dynamic Healthcare Sector
FTSE RAFI Financials Sector
Dynamic Industrials Sector
Dynamic Media
Aerospace & Defense
FTSE RAFI Industrials Sector
Dynamic Pharmaceuticals
Dynamic Consumer Discretionary Sector
Dynamic Healthcare Services Sector
Dynamic Leisure and Entertainment
FTSE RAFI Consumer Goods Sector
FTSE RAFI Utilities Sector
Water Resources
FTSE RAFI Consumer Services Sector
FTSE RAFI Basic Materials Sector
Dynamic Basic Materials Sector
Dynamic Retail
FTSE RAFI Energy Sector
Dynamic Energy Sector
Dynamic Building & Construction
Value Line Industry Rotation
Dynamic Technology Sector
Progressive Energy
Dynamic Biotechnology & Genome
Dynamic Software
Nanotech
Dynamic Energy Exploration & Production
FTSE RAFI Telecommunications & Technology Sector
Dynamic Hardware & Consumer Electronics
Dynamic Telecommunications & Wireless
Dynamic Oil & Gas Services
Cleantech
Listed Private Equity
Clean Energy
Dynamic Networking
Dynamic Semiconductors
More Aggressive
This page contains advertising materials and should not be viewed as part of the Annual Report.
63
Exchange-Traded Funds
ETFs are investment funds that trade like individual stocks on all of the major exchanges, similar to shares of publicly held companies. They can be bought and sold on an exchange at any moment during market hours. Since they are listed and traded on an exchange, you can be confident that you are investing in a well-regulated market.
ETFs are one of the fastest growing investment products in the worldwide financial marketplace. As of 3.31.2007, 432 ETFs were listed in the U.S. with $433 billion in assets, up from two products with only $1 billion in assets in 1995.
ETFs seek investment results that correspond generally to the price and yield (before fees and expenses) of a listed index. While most ETFs share a similar objective, the principal investment strategies of the underlying indexes can have substantial differences. It is important to gain a clear understanding of an ETF's underlying index as the index's objective is inherently passed on to the fund shareholders by seeking to replicate the index.
Indexes
An index is a selection process or appointed committee that groups selected securities together to track their movement in aggregate. While only a few indexes are mentioned on the daily news, there are hundreds of indexes in existence today that differ from each other in diverse ways.
Broad Market
Broad market indexes are what most people think of when an index is mentioned. These indexes are designed to track the performance of the broad market.
Benchmark
Benchmark indexes are created to set a standard by which the performance or movement of individual securities and asset managers can be measured.
Exchange Composite
These indexes are designed to provide a comprehensive measure of the performance of all commons stocks listed on a particular exchange.
Sector or Industry
The aggregate financial marketplace is generally broken down into roughly ten sectors which are further dissected into many specific industries.
Style
Style indexes are created to identify groups of stocks that are either growth (companies currently experiencing appreciation or significant earnings or revenue growth) or value (companies determined to be under priced by fundamental measures) oriented.
Company Size
Market-capitalization indexes group together companies that are similar in size based on the number of outstanding shares times the share price, while fundamentally weighted indexes group together stocks of companies based on their financial fundamental valuation.
International / Country
International indexes group together stocks of companies that are affiliated by location outside of the U.S. or companies located with a specific country or region.
Income / Bond
Income indexes group stocks based on their type of income of securities, while bond indexes are designed to show the average performance of a group of debt securities.
This page contains advertising materials and should not be viewed as part of the Annual Report.
64
Specialty / Enhanced
Many other specialty indexes are created with specific investment management objectives or for customized purposes. These indexes can be created specifically with the intention to be used as the basis for an ETF. Investor targets can be met through an ETF where the index has the objective(s) of capital appreciation, risk control, income or diversification.
Benefits of PowerShares
PowerShares ETFs offer investors a low-cost, tax-efficient investment in a professionally crafted portfolio consisting of some of the best managed companies and most timely investments. See important risk factors in back.
Tax Advantaged Product Design
Taxes may be one of the most critical and overlooked factors in wealth creation over time. The ETF product structure defers some or possibly all capital gains until investors sell their shares.
Low Ownership Cost
ETFs provide lower ownership cost because of their efficient structure. PowerShares have established expense caps to make the cost of ownership clear and straightforward for investors. Ordinary brokerage commissions apply.
Flexibility, Transparency
PowerShares' ETFs offer flexibility as shares can be bought and sold throughout the day through exchange trading. Fund holdings are disclosed every day. Options based on the funds are available, possibly increasing financial management opportunities for advisors and their clients.
Near Instant Liquidity, Trades at or Close to NAV
PowerShares may be bought and sold on the exchange at any time during market hours. Although shares are not individually redeemable directly from the fund itself, authorized participants may acquire shares and tender shares for redemption, through creation unit aggregations. ETFs area not closed-end funds and trade at or near net asset values.
This page contains advertising materials and should not be viewed as part of the Annual Report.
65
This page intentionally left blank
This page intentionally left blank
This page intentionally left blank
PROXY VOTING POLICIES AND PROCEDURES
A description of the Funds' proxy voting policies and procedures that the Funds use to determine how to vote proxies relating to portfolio securities is available, without charge and upon request, by calling (800) 337-4246. This information is also available on the Securities and Exchange Commission's ("Commission") website at www.sec.gov.
Information regarding how the Funds voted proxies for portfolio securities, if applicable, during the most recent 12-month period ended June 30, is also available, without charge and upon request, by (i) calling (800) 337-4246; or (ii) accessing the Funds' Form N-PX on the Commission's website at www.sec.gov.
QUARTERLY PORTFOLIOS
The Funds file their complete schedules of portfolio holdings with the Commission for the first and third quarters of each fiscal year on Form N-Q. The Funds' Forms N-Q are available on the Commission's website at www.sec.gov. The Funds' Forms N-Q may also be reviewed and copied at the Commission's Public Reference Room in Washington, DC; information on the operation of the Public Reference Room may be obtained by calling (800) SEC-0330.
There are risks involved in investing in ETFs, including possible loss of money. Investing in securities of small and medium sized companies involves greater risk than is customarily associated with investing in more established companies, and investments in concentrated industry sectors involve greater risks than investments that are more diversified. PowerShares ETFs are not actively managed and are subject to risks similar to stocks, including those related to short selling and margin maintenance. PowerShares ETFs are not FDIC insured, may lose value and have no bank guarantee. PowerShares is a registered trademark of PowerShares Capital Management LLC. Past performance is not a guarantee of future results.
A I M Distributors, Inc. is the distributor of the PowerShares Exchange-Traded Fund Trust.
An investor should consider each Fund's investment objective, risks, charges and expenses carefully before investing. For more complete information about PowerShares ETFs call A I M Distributors, Inc. at (800) 337-4246 or visit our website powershares.com for a prospectus. Please read the prospectus carefully before investing.

301 W. Roosevelt Road
Wheaton, IL 60187
800.983.0903
www.powershares.com
P-PS-AR-2
2007 Annual Report to Shareholders
30 April 2007

PowerShares Dynamic Large Cap Growth Portfolio
PowerShares Dynamic Large Cap Value Portfolio
PowerShares Dynamic Mid Cap Growth Portfolio
PowerShares Dynamic Mid Cap Value Portfolio
PowerShares Dynamic Small Cap Growth Portfolio
PowerShares Dynamic Small Cap Value Portfolio
PowerShares Dynamic Large Cap Portfolio
PowerShares Dynamic Mid Cap Portfolio
PowerShares Dynamic Small Cap Portfolio
PowerShares Dynamic Aggressive Growth Portfolio
PowerShares Dynamic Deep Value Portfolio
PowerShares Zacks Micro Cap Portfolio
PowerShares Zacks Small Cap Portfolio

Table of Contents
| Shareholder Letter | 2 | ||||||
| The Market Environment | 3 | ||||||
| Manager's Analysis | 4 | ||||||
| Funds' Distribution History | 30 | ||||||
| Frequency Distribution of Discounts & Premiums | 32 | ||||||
| Fees and Expenses | 34 | ||||||
| Style Portfolios | |||||||
| Schedules of Investments | |||||||
| PowerShares Dynamic Large Cap Growth Portfolio | 37 | ||||||
| PowerShares Dynamic Large Cap Value Portfolio | 38 | ||||||
| PowerShares Dynamic Mid Cap Growth Portfolio | 39 | ||||||
| PowerShares Dynamic Mid Cap Value Portfolio | 41 | ||||||
| PowerShares Dynamic Small Cap Growth Portfolio | 43 | ||||||
| PowerShares Dynamic Small Cap Value Portfolio | 45 | ||||||
| PowerShares Dynamic Large Cap Portfolio | 47 | ||||||
| PowerShares Dynamic Mid Cap Portfolio | 49 | ||||||
| PowerShares Dynamic Small Cap Portfolio | 51 | ||||||
| PowerShares Dynamic Aggressive Growth Portfolio | 54 | ||||||
| PowerShares Dynamic Deep Value Portfolio | 56 | ||||||
| PowerShares Zacks Micro Cap Portfolio | 58 | ||||||
| PowerShares Zacks Small Cap Portfolio | 63 | ||||||
| Statements of Assets and Liabilities | 66 | ||||||
| Statements of Operations | 68 | ||||||
| Statements of Changes in Net Assets | 70 | ||||||
| Financial Highlights | 74 | ||||||
| Notes to Financial Statements | 81 | ||||||
| Report of Independent Registered Public Accounting Firm | 92 | ||||||
| Supplemental Information (Unaudited) | 93 | ||||||
| Information about Advisory Agreement (Unaudited) | 98 | ||||||

To My Fellow Investors,
It gives me great pleasure to report on the state of your investment(s) in PowerShares Exchange-Traded Funds and to thank you for your continued confidence in PowerShares Capital Management LLC.
Let me share with you the exciting events that have taken place at PowerShares as I look back over the past 12 months and at what the future may hold.
PowerShares has experienced significant growth over the past 12 months. We now have 70 exchange-traded funds ("ETFs") in the market, an increase of 33 funds from the 37 funds at the beginning of the fiscal year. PowerShares now offers more U.S. based equity ETFs than any other ETF sponsor. Assets under management increased almost 75%, from $6 billion to over $10 billion at April 30, 2007. This phenomenal growth demonstrates the continued strong demand for our original listings as well as the excellent reception of our new funds.
Of the new funds offered, 10 were FTSE RAFI funds, which were the first PowerShares Exchange-Traded Funds to be listed on the NASDAQ stock exchange, making PowerShares the only ETF sponsor to list ETFs on all three major U.S. exchanges: the American Stock Exchange, the NASDAQ, and the New York Stock Exchange.
PowerShares continues to be recognized as an innovator in the ETF marketplace. In 2007, our FTSE RAFI US 1000 Fund was awarded the most innovative new ETF at the Third Annual Global ETF Awards program.
Drawing on our increased resources as a member of the INVESCO family, we plan to introduce several PowerShares ETFs for international and global investing. These new funds will help to fulfill our goal of providing investors with the opportunity to invest in intelligent ETFs in marketplaces around the globe.
On behalf of PowerShares Capital Management LLC and the Board of Trustees for the PowerShares Exchanged-Traded Fund Trust, I want to thank you for your participation in the PowerShares family of exchange-traded funds. We look forward to serving you in the future.
Highest Regards,

H. Bruce Bond
President and Chairman of the Board of Trustees
PowerShares Exchange-Traded Fund Trust
2
The Market Environment
Although spikes of volatility marked the beginning and end of the reporting period, the U.S. equity marketplace provided strong results, with the S&P 500® Index posting double digit returns of 15.24%. At the beginning of the reporting period, enthusiasm over economic expansion gave way to uncertainty over interest rates and concern that corporate profits would be difficult to sustain. But by the end of summer 2006, energy prices had cooled and investors surmised the Fed's actions had contained inflation without significant damage to ongoing corporate earnings.
Stocks resumed their upward path until late February of 2007, when Chinese regulators threatened to clamp down on local trading practices, causing global markets to retreat sharply. Global concerns, coupled with a slowing housing market domestically and the Fed's insistence that inflation posed a greater risk than a recession, amplified volatility. However, a strong job market, sustained earnings and indications that inflation would remain contained were enough to resume the rally by the end of the reporting period.
The telecom and utilities sectors posted the best results, while technology and industrial sectors lagged. Bond prices recovered moderately during the reporting period as the Fed ended its two year hike on rates in June of 2006 and a retracting housing market eased inflation concerns. With a few bumps along the way, commodity prices continued their upward march.
3
Manager's Analysis
PowerShares Dynamic Large Cap Growth Portfolio (ticker: PWB)
The PowerShares Dynamic Large Cap Growth Portfolio is based on the Dynamic Large Cap Growth IntellidexSM Index and seeks to provide capital appreciation while maintaining consistent and stylistically accurate exposure.
The PowerShares Dynamic Large Cap Growth Portfolio posted a return of 6.92% over the reporting period. During this time, growth stocks trailed value stocks. The Fund behaved accordingly and underperformed the general market. Financials stock Goldman Sachs contributed significantly to the Fund's performance. Information stock Qualcomm and energy stock Peabody hurt the Fund's performance.
Sector Breakdown (% of the Fund's
Net Assets)
| Information Technology | 29.4 | ||||||
| Health Care | 23.4 | ||||||
| Consumer Discretionary | 21.8 | ||||||
| Industrials | 9.9 | ||||||
| Financials | 7.1 | ||||||
| Energy | 5.5 | ||||||
| Utilities | 2.9 | ||||||
| Money Market Fund | 0.1 | ||||||
| Other | (0.1 | ) | |||||
Style Allocation (%)
| Large-Cap Growth | 100.0 | ||||||
Top Ten Fund Holdings (% of the Fund's
Net Assets)
| Security | |||||||
| Schlumberger Ltd. (Netherlands) | 3.8 | ||||||
| Apple, Inc. | 3.7 | ||||||
| Oracle Corp. | 3.7 | ||||||
| 3M Co. | 3.6 | ||||||
| Dell, Inc. | 3.5 | ||||||
| Microsoft Corp. | 3.4 | ||||||
| Medtronic, Inc. | 3.4 | ||||||
| Boeing Co. | 3.4 | ||||||
| Google, Inc., Class A | 3.3 | ||||||
| UnitedHealth Group, Inc. | 3.3 | ||||||
| Total | 35.1 | ||||||
4
Manager's Analysis (Continued)
PowerShares Dynamic Large Cap Growth Portfolio (ticker: PWB)
Growth of a $10,000 Investment Since Inception
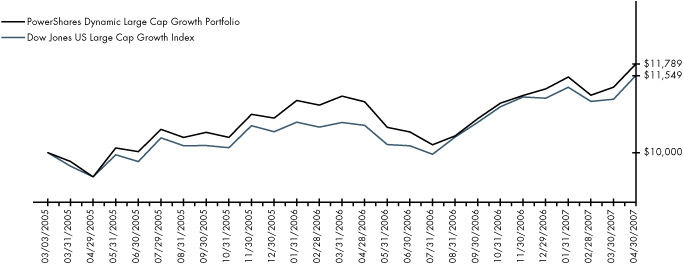
Fund Performance History (%) As of 30 April 2007
Index
| Avg. Ann.† | Fund Inception | ||||||||||||||
| 1 Year | Avg. Ann.† | Cumulative | |||||||||||||
| Dynamic Large Cap Growth IntellidexSM Index | 7.65 | 8.67 | 19.66 | ||||||||||||
| Dow Jones US Large Cap Growth Index | 9.48 | 6.90 | 15.49 | ||||||||||||
| Russell 1000® Growth Index | 12.25 | 10.40 | 23.80 | ||||||||||||
Fund
| NAV Return | 6.92 | 7.92 | 17.89 | ||||||||||||
| Share Price Return | 7.01 | 7.85 | 17.73 | ||||||||||||
Fund Inception: 3 March 2005
Performance data quoted represents past performance. Past performance is not a guarantee of future results, current performance may be higher or lower than performance quoted. Investment returns and principal value will fluctuate and shares, when redeemed, may be worth more or less than their original cost. The Share Price performance reflects fee waivers, absent which, performance would have been lower. According to the Fund's most recent Prospectus, the Fund's total gross annual operating expenses was indicated as 0.80%. In the Financial Highlights section of this Annual Report, the Fund's net (subsidized) annualized total operating expense ratio was determined to be 0.63% while the Fund's gross annualized total operating expense ratio was 0.68%. The Adviser has contractually agreed to waive fees and/or pay certain Fund expenses which resulted in a lower fee actually paid by investors. This waiver extends through April 30, 200 8. Absent reimbursements or waivers, performance would have been lower. NAV and Share Price returns assume that dividends and capital gain distributions have been reinvested in the Fund at NAV and Share Price, respectively. The returns shown in the table above do not reflect the deduction of taxes that a shareholder would pay on Fund distributions or the redemption or sale of Fund Shares. See powershares.com to find the most recent month-end performance numbers.
The index performance results are hypothetical. Index returns do not represent Fund returns. An investor cannot invest directly in an index. The index does not charge management fees or brokerage expenses, and no such fees or expenses were deducted from the hypothetical performance shown nor does the index lend securities, and no revenues from securities lending were added to the performance shown. In addition, the results actual investors might have achieved would have differed from those shown because of differences in the timing, amounts of their investments, and fees and expenses associated with an investment in the Fund.
The Dow Jones US Large Cap Growth Index and the Russell 1000® Growth Index are unmanaged indices that are broad measurements of change in stock market conditions based on the average performance of approximately 108 and 671, respectively, widely held stocks.
† Average annualized.
5
Manager's Analysis
PowerShares Dynamic Large Cap Value Portfolio (ticker: PWV)
The PowerShares Dynamic Large Cap Value Portfolio is based on the Dynamic Large Cap Value IntellidexSM Index and seeks to provide capital appreciation while maintaining consistent and stylistically accurate exposure.
The PowerShares Dynamic Large Cap Value Portfolio performed very well over the reporting period posting a 20.85% return. The Fund was the best performing PowerShares style fund over this period. Financials was the most heavily weighted sector in the Fund with Morgan Stanley, JP Morgan, and Merrill Lynch making significant contributions to performance. The Fund also benefited from good stock selection within industrials and information technology. In particular, allocations to technology stock IBM and industrials stock Paccar boosted the Fund's performance.
Sector Breakdown (% of the Fund's
Net Assets)
| Financials | 40.4 | ||||||
| Health Care | 10.5 | ||||||
| Consumer Staples | 9.0 | ||||||
| Energy | 8.5 | ||||||
| Industrials | 7.4 | ||||||
| Telecommunication Services | 6.6 | ||||||
| Utilities | 6.0 | ||||||
| Information Technology | 4.8 | ||||||
| Materials | 4.1 | ||||||
| Consumer Discretionary | 2.7 | ||||||
| Other | 0.0 | ||||||
Style Allocation (%)
| Large-Cap Value | 100.0 | ||||||
Top Ten Fund Holdings (% of the Fund's
Net Assets)
| Security | |||||||
| Merck & Co., Inc. | 3.9 | ||||||
| Chevron Corp. | 3.5 | ||||||
| Altria Group, Inc. | 3.5 | ||||||
| Exxon Mobil Corp. | 3.4 | ||||||
| AT&T, Inc. | 3.4 | ||||||
| International Business Machines Corp. | 3.4 | ||||||
| Morgan Stanley | 3.4 | ||||||
| Pfizer, Inc. | 3.3 | ||||||
| JPMorgan Chase & Co. | 3.3 | ||||||
| American International Group, Inc. | 3.3 | ||||||
| Total | 34.4 | ||||||
6
Manager's Analysis (Continued)
PowerShares Dynamic Large Cap Value Portfolio (ticker: PWV)
Growth of a $10,000 Investment Since Inception
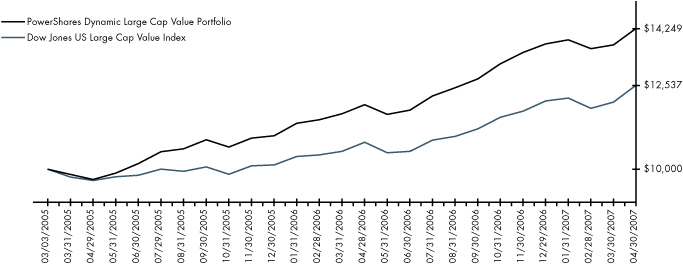
Fund Performance History (%) As of 30 April 2007
Index
| Avg. Ann.† | Fund Inception | ||||||||||||||
| 1 Year | Avg. Ann.† | Cumulative | |||||||||||||
| Dynamic Large Cap Value IntellidexSM Index | 21.62 | 18.63 | 44.60 | ||||||||||||
| Dow Jones US Large Cap Value Index | 15.93 | 11.04 | 25.37 | ||||||||||||
| Russell 1000® Value Index | 18.15 | 14.76 | 34.60 | ||||||||||||
Fund
| NAV Return | 20.85 | 17.82 | 42.49 | ||||||||||||
| Share Price Return | 20.85 | 17.77 | 42.35 | ||||||||||||
Fund Inception: 3 March 2005
Performance data quoted represents past performance. Past performance is not a guarantee of future results, current performance may be higher or lower than performance quoted. Investment returns and principal value will fluctuate and shares, when redeemed, may be worth more or less than their original cost. The Share Price performance reflects fee waivers, absent which, performance would have been lower. According to the Fund's most recent Prospectus, the Fund's total gross annual operating expenses was indicated as 0.94%. In the Financial Highlights section of this Annual Report, the Fund's net (subsidized) annualized total operating expense ratio was determined to be 0.63% while the Fund's gross annualized total operating expense ratio was 0.67%. The Adviser has contractually agreed to waive fees and/or pay certain Fund expenses which resulted in a lower fee actually paid by investors. This waiver extends through April 30, 200 8. Absent reimbursements or waivers, performance would have been lower. NAV and Share Price returns assume that dividends and capital gain distributions have been reinvested in the Fund at NAV and Share Price, respectively. The returns shown in the table above do not reflect the deduction of taxes that a shareholder would pay on Fund distributions or the redemption or sale of Fund Shares. See powershares.com to find the most recent month-end performance numbers.
The index performance results are hypothetical. Index returns do not represent Fund returns. An investor cannot invest directly in an index. The index does not charge management fees or brokerage expenses, and no such fees or expenses were deducted from the hypothetical performance shown nor does the index lend securities, and no revenues from securities lending were added to the performance shown. In addition, the results actual investors might have achieved would have differed from those shown because of differences in the timing, amounts of their investments, and fees and expenses associated with an investment in the Fund.
The Dow Jones US Large Cap Value Index and the Russell 1000® Value Index are unmanaged indices that are broad measurements of change in stock market conditions based on the average performance of approximately 130 and 597, respectively, widely held stocks.
† Average annualized.
7
Manager's Analysis
PowerShares Dynamic Mid Cap Growth Portfolio (ticker: PWJ)
The PowerShares Dynamic Mid Cap Growth Portfolio is based on the Dynamic Mid Cap Growth IntellidexSM Index and seeks to provide capital appreciation while maintaining consistent and stylistically accurate exposure.
The PowerShares Dynamic Mid Cap Growth Portfolio performed the best of the three PowerShares growth funds, posting a solid 12.91% return for the reporting period. The highest contributing sector was consumer discretionary with Coach, Starwood Hotels, and Polo Ralph Lauren making solid contributions. Industries aerospace and defense and textiles contributed significantly to the Fund's performance while oil and gas and commercial services lagged.
Sector Breakdown (% of the Fund's
Net Assets)
| Consumer Discretionary | 23.4 | ||||||
| Information Technology | 22.7 | ||||||
| Health Care | 14.6 | ||||||
| Financials | 12.4 | ||||||
| Industrials | 10.1 | ||||||
| Materials | 7.4 | ||||||
| Energy | 4.7 | ||||||
| Utilities | 3.5 | ||||||
| Telecommunication Services | 0.6 | ||||||
| Consumer Staples | 0.5 | ||||||
| Other | 0.1 | ||||||
Style Allocation (%)
| Mid-Cap Growth | 100.0 | ||||||
Top Ten Fund Holdings (% of the Fund's
Net Assets)
| Security | |||||||
| Express Scripts, Inc. | 3.8 | ||||||
| CBOT Holdings, Inc., Class A | 3.6 | ||||||
| Allegheny Energy, Inc. | 3.5 | ||||||
| ENSCO International, Inc. | 3.4 | ||||||
| Precision Castparts Corp. | 3.3 | ||||||
| Polo Ralph Lauren Corp. | 3.3 | ||||||
| Humana, Inc. | 3.3 | ||||||
| T. Rowe Price Group, Inc. | 3.2 | ||||||
| Biomet, Inc. | 3.2 | ||||||
| Allegheny Technologies, Inc. | 3.2 | ||||||
| Total | 33.8 | ||||||
8
Manager's Analysis (Continued)
PowerShares Dynamic Mid Cap Growth Portfolio (ticker: PWJ)
Growth of a $10,000 Investment Since Inception
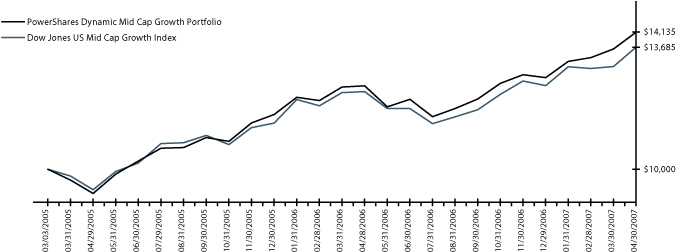
Fund Performance History (%) As of 30 April 2007
Index
| Avg. Ann.† | Fund Inception | ||||||||||||||
| 1 Year | Avg. Ann.† | Cumulative | |||||||||||||
| Dynamic Mid Cap Growth IntellidexSM Index | 13.55 | 18.24 | 43.58 | ||||||||||||
| Dow Jones US Mid Cap Growth Index | 10.89 | 15.64 | 36.85 | ||||||||||||
| Russell Mid Cap Growth Index | 11.13 | 14.61 | 34.23 | ||||||||||||
Fund
| NAV Return | 12.91 | 17.39 | 41.35 | ||||||||||||
| Share Price Return | 12.89 | 17.31 | 41.14 | ||||||||||||
Fund Inception: 3 March 2005
Performance data quoted represents past performance. Past performance is not a guarantee of future results, current performance may be higher or lower than performance quoted. Investment returns and principal value will fluctuate and shares, when redeemed, may be worth more or less than their original cost. The Share Price performance reflects fee waivers, absent which, performance would have been lower. According to the Fund's most recent Prospectus, the Fund's total gross annual operating expenses was indicated as 0.90%. In the Financial Highlights section of this Annual Report, the Fund's net (subsidized) annualized total operating expense ratio was determined to be 0.63% while the Fund's gross annualized total operating expense ratio was 0.73%. The Adviser has contractually agreed to waive fees and/or pay certain Fund expenses which resulted in a lower fee actually paid by investors. This waiver extends through April 30, 200 8. Absent reimbursements or waivers, performance would have been lower. NAV and Share Price returns assume that dividends and capital gain distributions have been reinvested in the Fund at NAV and Share Price, respectively. The returns shown in the table above do not reflect the deduction of taxes that a shareholder would pay on Fund distributions or the redemption or sale of Fund Shares. See powershares.com to find the most recent month-end performance numbers.
The index performance results are hypothetical. Index returns do not represent Fund returns. An investor cannot invest directly in an index. The index does not charge management fees or brokerage expenses, and no such fees or expenses were deducted from the hypothetical performance shown nor does the index lend securities, and no revenues from securities lending were added to the performance shown. In addition, the results actual investors might have achieved would have differed from those shown because of differences in the timing, amounts of their investments, and fees and expenses associated with an investment in the Fund.
The Dow Jones US Mid Cap Growth Index and the Russell Mid Cap Growth Index are unmanaged indices that are broad measurements of change in stock market conditions based on the average performance of approximately 210 and 528, respectively, widely held stocks.
† Average annualized.
9
Manager's Analysis
PowerShares Dynamic Mid Cap Value Portfolio (ticker: PWP)
The PowerShares Dynamic Mid Cap Value Portfolio is based on the Dynamic Mid Cap Value IntellidexSM Index and seeks to provide capital appreciation while maintaining consistent and stylistically accurate exposure.
The PowerShares Dynamic Mid Cap Value Portfolio posted solid results during the fiscal year, returning 19.14%, making it the second best performing PowerShares style fund. Financial and industrial stocks contributed most to Fund performance with large allocations and strong returns. Health care was a lower weighted sector, however, it made significant contributions to performance due to the strong performance from CIGNA. Energy stocks lagged being the only sector with negative contribution.
Sector Breakdown (% of the Fund's
Net Assets)
| Financials | 29.3 | ||||||
| Consumer Discretionary | 19.0 | ||||||
| Industrials | 18.7 | ||||||
| Information Technology | 9.0 | ||||||
| Consumer Staples | 8.9 | ||||||
| Materials | 7.5 | ||||||
| Health Care | 3.9 | ||||||
| Utilities | 2.4 | ||||||
| Telecommunication Services | 0.6 | ||||||
| Money Market Fund | 0.2 | ||||||
| Other | 0.5 | ||||||
Style Allocation (%)
| Mid-Cap Value | 100.0 | ||||||
Top Ten Fund Holdings (% of the Fund's
Net Assets)
| Security | |||||||
| CNA Financial Corp. | 3.5 | ||||||
| VF Corp. | 3.4 | ||||||
| United States Steel Corp. | 3.4 | ||||||
| CIGNA Corp. | 3.4 | ||||||
| XL Capital Ltd., Class A (Cayman Islands) | 3.3 | ||||||
| Eaton Corp. | 3.3 | ||||||
| Mattel, Inc. | 3.3 | ||||||
| Parker Hannifin Corp. | 3.3 | ||||||
| ITT Corp. | 3.3 | ||||||
| NCR Corp. | 3.3 | ||||||
| Total | 33.5 | ||||||
10
Manager's Analysis (Continued)
PowerShares Dynamic Mid Cap Value Portfolio (ticker: PWP)
Growth of a $10,000 Investment Since Inception
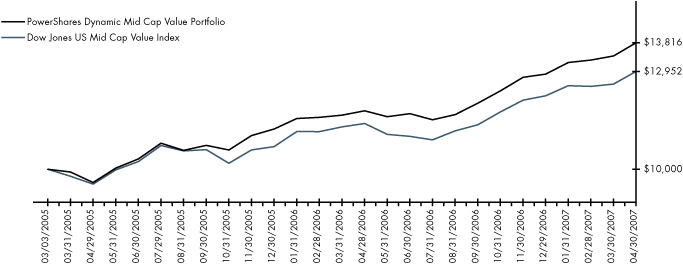
Fund Performance History (%) As of 30 April 2007
Index
| Avg. Ann.† | Fund Inception | ||||||||||||||
| 1 Year | Avg. Ann.† | Cumulative | |||||||||||||
| Dynamic Mid Cap Value IntellidexSM Index | 20.04 | 17.18 | 40.83 | ||||||||||||
| Dow Jones US Mid Cap Value Index | 13.82 | 12.73 | 29.52 | ||||||||||||
| Russell Mid Cap Value Index | 19.66 | 18.21 | 43.51 | ||||||||||||
Fund
| NAV Return | 19.14 | 16.15 | 38.16 | ||||||||||||
| Share Price Return | 19.17 | 16.10 | 38.02 | ||||||||||||
Fund Inception: 3 March 2005
Performance data quoted represents past performance. Past performance is not a guarantee of future results, current performance may be higher or lower than performance quoted. Investment returns and principal value will fluctuate and shares, when redeemed, may be worth more or less than their original cost. The Share Price performance reflects fee waivers, absent which, performance would have been lower. According to the Fund's most recent Prospectus, the Fund's total gross annual operating expenses was indicated as 1.13%. In the Financial Highlights section of this Annual Report, the Fund's net (subsidized) annualized total operating expense ratio was determined to be 0.63% while the Fund's gross annualized total operating expense ratio was 0.82%. The Adviser has contractually agreed to waive fees and/or pay certain Fund expenses which resulted in a lower fee actually paid by investors. This waiver extends through April 30, 200 8. Absent reimbursements or waivers, performance would have been lower. NAV and Share Price returns assume that dividends and capital gain distributions have been reinvested in the Fund at NAV and Share Price, respectively. The returns shown in the table above do not reflect the deduction of taxes that a shareholder would pay on Fund distributions or the redemption or sale of Fund Shares. See powershares.com to find the most recent month-end performance numbers.
The index performance results are based upon a hypothetical investment in its constituent securities. Index returns do not represent Fund returns. An investor cannot invest directly in an index. The index does not charge management fees or brokerage expenses, and no such fees or expenses were deducted from the hypothetical performance shown nor does the index lend securities, and no revenues from securities lending were added to the performance shown. In addition, the results actual investors might have achieved would have differed from those shown because of differences in the timing, amounts of their investments, and fees and expenses associated with an investment in the Fund.
The Dow Jones US Mid Cap Value Index and the Russell Mid Cap Value Index are unmanaged indices that are broad measurements of change in stock market conditions based on the average performance of approximately 229 and 470, respectively, widely held stocks.
† Average annualized.
11
Manager's Analysis
PowerShares Dynamic Small Cap Growth Portfolio (ticker: PWT)
The PowerShares Dynamic Small Cap Growth Portfolio is based on the Dynamic Small Cap Growth IntellidexSM Index and seeks to provide capital appreciation while maintaining consistent and stylistically accurate exposure.
The PowerShares Dynamic Small Cap Growth Portfolio posted the weakest results of the six original PowerShares style funds during the fiscal year, returning 0.43%. Consumer discretionary and materials stocks led performance in the Fund. Consumer staples, information technology, and industrials lagged.
Sector Breakdown (% of the Fund's
Net Assets)
| Consumer Discretionary | 26.6 | ||||||
| Information Technology | 25.5 | ||||||
| Health Care | 18.3 | ||||||
| Industrials | 13.1 | ||||||
| Financials | 10.8 | ||||||
| Telecommunication Services | 2.3 | ||||||
| Materials | 1.8 | ||||||
| Energy | 0.9 | ||||||
| Consumer Staples | 0.8 | ||||||
| Other | (0.1 | ) | |||||
Style Allocation (%)
| Small-Cap Growth | 100.0 | ||||||
Top Ten Fund Holdings (% of the Fund's
Net Assets)
| Security | |||||||
| International Securities Exchange Holdings, Inc. | 3.1 | ||||||
| WebEx Communications, Inc. | 2.8 | ||||||
| CommScope, Inc. | 2.8 | ||||||
| DeVry, Inc. | 2.7 | ||||||
| TeleTech Holdings, Inc. | 2.7 | ||||||
| GFI Group, Inc. | 2.6 | ||||||
| Cohen & Steers, Inc. | 2.6 | ||||||
| Aeropostale, Inc. | 2.5 | ||||||
| West Pharmaceutical Services, Inc. | 2.5 | ||||||
| Valeant Pharmaceuticals International | 2.4 | ||||||
| Total | 26.7 | ||||||
12
Manager's Analysis (Continued)
PowerShares Dynamic Small Cap Growth Portfolio (ticker: PWT)
Growth of a $10,000 Investment Since Inception
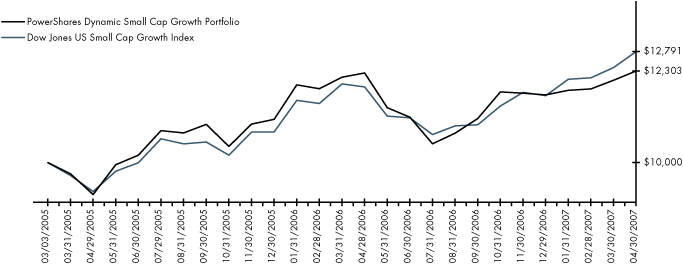
Fund Performance History (%) As of 30 April 2007
Index
| Avg. Ann.† | Fund Inception | ||||||||||||||
| 1 Year | Avg. Ann.† | Cumulative | |||||||||||||
| Dynamic Small Cap Growth IntellidexSM Index | 0.84 | 10.55 | 24.18 | ||||||||||||
| Dow Jones US Small Cap Growth Index | 7.48 | 12.08 | 27.91 | ||||||||||||
| Russell 2000® Growth Index | 4.53 | 12.03 | 27.80 | ||||||||||||
Fund
| NAV Return | 0.43 | 10.08 | 23.03 | ||||||||||||
| Share Price Return | 0.38 | 9.99 | 22.83 | ||||||||||||
Fund Inception: 3 March 2005
Performance data quoted represents past performance. Past performance is not a guarantee of future results, current performance may be higher or lower than performance quoted. Investment returns and principal value will fluctuate and shares, when redeemed, may be worth more or less than their original cost. The Share Price performance reflects fee waivers, absent which, performance would have been lower. According to the Fund's most recent Prospectus, the Fund's total gross annual operating expenses was indicated as 0.90%. In the Financial Highlights section of this Annual Report, the Fund's net (subsidized) annualized total operating expense ratio was determined to be 0.63% while the Fund's gross annualized total operating expense ratio was 0.84%. The Adviser has contractually agreed to waive fees and/or pay certain Fund expenses which resulted in a lower fee actually paid by investors. This waiver extends through April 30, 200 8. Absent reimbursements or waivers, performance would have been lower. NAV and Share Price returns assume that dividends and capital gain distributions have been reinvested in the Fund at NAV and Share Price, respectively. The returns shown in the table above do not reflect the deduction of taxes that a shareholder would pay on Fund distributions or the redemption or sale of Fund Shares. See powershares.com to find the most recent month-end performance numbers.
The index performance results are hypothetical. Index returns do not represent Fund returns. An investor cannot invest directly in an index. The index does not charge management fees or brokerage expenses, and no such fees or expenses were deducted from the hypothetical performance shown nor does the index lend securities, and no revenues from securities lending were added to the performance shown. In addition, the results actual investors might have achieved would have differed from those shown because of differences in the timing, amounts of their investments, and fees and expenses associated with an investment in the Fund.
The Dow Jones US Small Cap Growth Index and the Russell 2000® Growth Index are unmanaged indices that are broad measurements of change in stock market conditions based on the average performance of approximately 305 and 1,274 widely held stocks, respectively.
† Average annualized.
13
Manager's Analysis
PowerShares Dynamic Small Cap Value Portfolio (ticker: PWY)
The PowerShares Dynamic Small Cap Value Portfolio is based on the Dynamic Small Cap Value IntellidexSM Index and seeks to provide capital appreciation while maintaining consistent and stylistically accurate exposure.
The PowerShares Dynamic Small Cap Value Portfolio posted a 10.64% return over the reporting period. Small cap stocks underperformed during the period but value outperformed growth. The Fund was in the middle of the pack for the six original PowerShares style funds. The Fund had balanced contributions from various sectors with energy, materials, consumer staples, and industrials leading the way. No sector contributed negatively to the Fund's performance.
Sector Breakdown (% of the Fund's
Net Assets)
| Financials | 45.2 | ||||||
| Consumer Discretionary | 13.9 | ||||||
| Industrials | 12.9 | ||||||
| Energy | 12.1 | ||||||
| Information Technology | 7.1 | ||||||
| Materials | 4.1 | ||||||
| Health Care | 3.4 | ||||||
| Utilities | 0.8 | ||||||
| Consumer Staples | 0.5 | ||||||
| Other | 0.0 | ||||||
Style Allocation (%)
| Small-Cap Value | 100.0 | ||||||
Top Ten Fund Holdings (% of the Fund's
Net Assets)
| Security | |||||||
| Global Industries, Ltd. | 3.5 | ||||||
| Western Refining, Inc. | 3.2 | ||||||
| Deluxe Corp. | 2.6 | ||||||
| Commerce Group (The), Inc. | 2.5 | ||||||
| Perot Systems Corp., Class A | 2.4 | ||||||
| Delphi Financial Group, Inc., Class A | 2.4 | ||||||
| ProAssurance Corp. | 2.4 | ||||||
| Phoenix (The) Cos., Inc. | 2.4 | ||||||
| IKON Office Solutions, Inc. | 2.4 | ||||||
| Ohio Casualty Corp. | 2.3 | ||||||
| Total | 26.1 | ||||||
14
Manager's Analysis (Continued)
PowerShares Dynamic Small Cap Value Portfolio (ticker: PWY)
Growth of a $10,000 Investment Since Inception
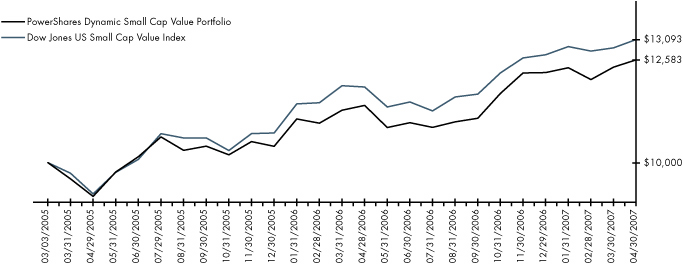
Fund Performance History (%) As of 30 April 2007
Index
| Avg. Ann.† | Fund Inception | ||||||||||||||
| 1 Year | Avg. Ann.† | Cumulative | |||||||||||||
| Dynamic Small Cap Value IntellidexSM Index | 11.49 | 12.09 | 27.95 | ||||||||||||
| Dow Jones US Small Cap Value Index | 10.02 | 13.30 | 30.93 | ||||||||||||
| Russell 2000® Value Index | 11.22 | 14.48 | 33.89 | ||||||||||||
Fund
| NAV Return | 10.64 | 11.23 | 25.83 | ||||||||||||
| Share Price Return | 10.71 | 11.16 | 25.67 | ||||||||||||
Fund Inception: 3 March 2005
Performance data quoted represents past performance. Past performance is not a guarantee of future results, current performance may be higher or lower than performance quoted. Investment returns and principal value will fluctuate and shares, when redeemed, may be worth more or less than their original cost. The Share Price performance reflects fee waivers, absent which, performance would have been lower. According to the Fund's most recent Prospectus, the Fund's total gross annual operating expenses was indicated as 1.06%. In the Financial Highlights section of this Annual Report, the Fund's net (subsidized) annualized total operating expense ratio was determined to be 0.63% while the Fund's gross annualized total operating expense ratio was 0.80%. The Adviser has contractually agreed to waive fees and/or pay certain Fund expenses which resulted in a lower fee actually paid by investors. This waiver extends through April 30, 200 8. Absent reimbursements or waivers, performance would have been lower. NAV and Share Price returns assume that dividends and capital gain distributions have been reinvested in the Fund at NAV and Share Price, respectively. The returns shown in the table above do not reflect the deduction of taxes that a shareholder would pay on Fund distributions or the redemption or sale of Fund Shares. See powershares.com to find the most recent month-end performance numbers.
The index performance results are hypothetical. Index returns do not represent Fund returns. An investor cannot invest directly in an index. The index does not charge management fees or brokerage expenses, and no such fees or expenses were deducted from the hypothetical performance shown nor does the index lend securities, and no revenues from securities lending were added to the performance shown. In addition, the results actual investors might have achieved would have differed from those shown because of differences in the timing, amounts of their investments, and fees and expenses associated with an investment in the Fund.
The Dow Jones US Small Cap Value Index and the Russell 2000® Value Index are unmanaged indices that are broad measurements of change in stock market conditions based on the average performance of approximately 373 and 1,281, respectively, widely held stocks.
† Average annualized.
15
Manager's Analysis
PowerShares Dynamic Large Cap Portfolio (ticker: PJF)
The PowerShares Dynamic Large Cap Portfolio is based on the Dynamic Large Cap IntellidexSM Index and seeks investment results that correspond generally to the price and yield (before the Fund's fees and expenses) of that equity index.
The PowerShares Dynamic Large Cap Portfolio posted a 7.55% return since its inception on December 1, 2006 through April 30, 2007. Good stock selection within the financial and health care sectors boosted the Fund's performance. In particular large brokerage houses such as JP Morgan, Morgan Stanley, and Goldman Sachs helped the Fund's performance. No sector contributed negatively to the Fund's performance.
Sector Breakdown (% of the Fund's
Net Assets)
| Financials | 31.8 | ||||||
| Health Care | 14.1 | ||||||
| Consumer Staples | 11.8 | ||||||
| Industrials | 11.6 | ||||||
| Information Technology | 11.1 | ||||||
| Consumer Discretionary | 8.5 | ||||||
| Utilities | 4.5 | ||||||
| Energy | 3.6 | ||||||
| Materials | 3.5 | ||||||
| Money Market Fund | 0.4 | ||||||
| Other | (0.9 | ) | |||||
Style Allocation (%)
| Large-Cap Value | 61.7 | ||||||
| Large-Cap Growth | 38.3 | ||||||
Top Ten Fund Holdings (% of the Fund's
Net Assets)
| Security | |||||||
| Merck & Co., Inc. | 2.0 | ||||||
| Schlumberger Ltd. (Netherlands) | 1.9 | ||||||
| Apple, Inc. | 1.9 | ||||||
| Oracle Corp. | 1.8 | ||||||
| Coca-Cola (The) Co. | 1.8 | ||||||
| Wyeth | 1.8 | ||||||
| Altria Group, Inc. | 1.8 | ||||||
| Exxon Mobil Corp. | 1.7 | ||||||
| General Electric Co. | 1.7 | ||||||
| International Business Machines Corp. | 1.7 | ||||||
| Total | 18.1 | ||||||
16
Manager's Analysis (Continued)
PowerShares Dynamic Large Cap Portfolio (ticker: PJF)
Growth of a $10,000 Investment Since Inception
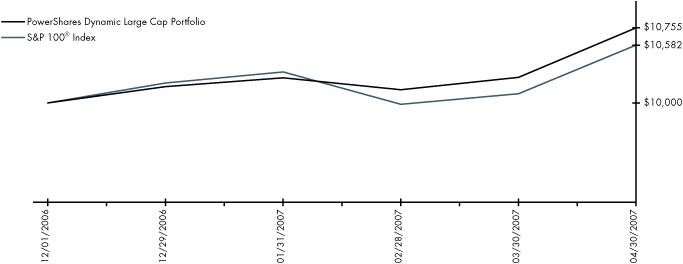
Fund Performance History (%) As of 30 April 2007
Index
| Fund Inception Cumulative | |||||||
| Dynamic Large Cap IntellidexSM Index | 7.08 | ||||||
| S&P 100® Index | 5.82 | ||||||
| Russell Top 200® Index | 6.46 | ||||||
Fund
| NAV Return | 7.55 | ||||||
| Share Price Return | 7.53 | ||||||
Fund Inception: 1 December 2006
Performance data quoted represents past performance. Past performance is not a guarantee of future results, current performance may be higher or lower than performance quoted. Investment returns and principal value will fluctuate and shares, when redeemed, may be worth more or less than their original cost. The Share Price performance reflects fee waivers, absent which, performance would have been lower. According to the Fund's most recent Prospectus, the Fund's total gross annual operating expenses was indicated as 0.70%. In the Financial Highlights section of this Annual Report, the Fund's net (subsidized) annualized total operating expense ratio was determined to be 0.74% while the Fund's gross annualized total operating expense ratio was 1.45%. The Adviser has contractually agreed to waive fees and/or pay certain Fund expenses which resulted in a lower fee actually paid by investors. This waiver extends through April 30, 200 8. Absent reimbursements or waivers, performance would have been lower. NAV and Share Price returns assume that dividends and capital gain distributions have been reinvested in the Fund at NAV and Share Price, respectively. The returns shown in the table above do not reflect the deduction of taxes that a shareholder would pay on Fund distributions or the redemption or sale of Fund Shares. See powershares.com to find the most recent month-end performance numbers.
The index performance results are hypothetical. Index returns do not represent Fund returns. An investor cannot invest directly in an index. The index does not charge management fees or brokerage expenses, and no such fees or expenses were deducted from the hypothetical performance shown nor does the index lend securities, and no revenues from securities lending were added to the performance shown. In addition, the results actual investors might have achieved would have differed from those shown because of differences in the timing, amounts of their investments, and fees and expenses associated with an investment in the Fund.
The S&P 100® Index and the Russell Top 200® Index are unmanaged indices that are broad measurements of change in stock market conditions based on the average performance of approximately 100 and 200, respectively, widely held stocks.
17
Managers' Analysis
PowerShares Dynamic Mid Cap Portfolio (ticker: PJG)
The PowerShares Dynamic Mid Cap Portfolio is based on the Dynamic Mid Cap IntellidexSM Index and seeks investment results that correspond generally to the price and yield (before the Fund's fees and expenses) of that equity index.
The PowerShares Dynamic Mid Cap Portfolio posted an 11.04% return since its inception on December 1, 2006 through April 30, 2007. Since the Fund's inception mid cap stocks have performed very well. Good stock selection within financials and health care has driven much of the Fund's performance. Consumer discretionary, industrials, and materials also made contributions to the Fund's performance. No sector contributed negatively to the Fund's performance.
Sector Breakdown (% of the Fund's
Net Assets)
| Financials | 25.3 | ||||||
| Consumer Discretionary | 18.7 | ||||||
| Industrials | 14.3 | ||||||
| Information Technology | 13.2 | ||||||
| Health Care | 10.9 | ||||||
| Consumer Staples | 6.2 | ||||||
| Materials | 4.6 | ||||||
| Utilities | 4.2 | ||||||
| Energy | 2.6 | ||||||
| Telecommunications | 0.3 | ||||||
| Money Market Fund | 0.5 | ||||||
| Other | (0.8 | ) | |||||
Style Allocation (%)
| Mid-Cap Value | 70.7 | ||||||
| Mid-Cap Growth | 29.3 | ||||||
Top Ten Fund Holdings (% of the Fund's
Net Assets)
| Security | |||||||
| Express Scripts, Inc. | 1.9 | ||||||
| PPL Corp. | 1.8 | ||||||
| Unum Group | 1.8 | ||||||
| Allegheny Energy, Inc. | 1.8 | ||||||
| CNA Financial Corp. | 1.8 | ||||||
| ENSCO International, Inc. | 1.8 | ||||||
| VF Corp. | 1.7 | ||||||
| United States Steel Corp. | 1.7 | ||||||
| Estee Lauder (The) Cos., Inc., Class A | 1.7 | ||||||
| CIGNA Corp. | 1.7 | ||||||
| Total | 17.7 | ||||||
18
Managers' Analysis (Continued)
PowerShares Dynamic Mid Cap Portfolio (ticker: PJG)
Growth of a $10,000 Investment Since Inception
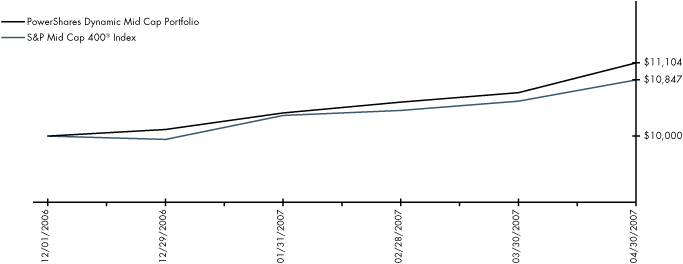
Fund Performance History (%) As of 30 April 2007
Index
| Fund Inception Cumulative | |||||||
| Dynamic Mid Cap IntellidexSM Index | 10.78 | ||||||
| S&P Mid Cap 400® Index | 8.47 | ||||||
| Russell Mid Cap Index | 8.60 | ||||||
Fund
| NAV Return | 11.04 | ||||||
| Share Price Return | 11.15 | ||||||
Fund Inception: 1 December 2006
Performance data quoted represents past performance. Past performance is not a guarantee of future results, current performance may be higher or lower than performance quoted. Investment returns and principal value will fluctuate and shares, when redeemed, may be worth more or less than their original cost. The Share Price performance reflects fee waivers, absent which, performance would have been lower. According to the Fund's most recent Prospectus, the Fund's total gross annual operating expenses was indicated as 0.70%. In the Financial Highlights section of this Annual Report, the Fund's net (subsidized) annualized total operating expense ratio was determined to be 0.74% while the Fund's gross annualized total operating expense ratio was 1.55%. The Adviser has contractually agreed to waive fees and/or pay certain Fund expenses which resulted in a lower fee actually paid by investors. This waiver extends through April 30, 200 8. Absent reimbursements or waivers, performance would have been lower. NAV and Share Price returns assume that dividends and capital gain distributions have been reinvested in the Fund at NAV and Share Price, respectively. The returns shown in the table above do not reflect the deduction of taxes that a shareholder would pay on Fund distributions or the redemption or sale of Fund Shares. See powershares.com to find the most recent month-end performance numbers.
The index performance results are hypothetical. Index returns do not represent Fund returns. An investor cannot invest directly in an index. The index does not charge management fees or brokerage expenses, and no such fees or expenses were deducted from the hypothetical performance shown nor does the index lend securities, and no revenues from securities lending were added to the performance shown. In addition, the results actual investors might have achieved would have differed from those shown because of differences in the timing, amounts of their investments, and fees and expenses associated with an investment in the Fund.
The S&P Mid Cap 400® Index and the Russell Mid Cap Index are unmanaged indices that are broad measurements of change in stock market conditions based on the average performance of approximately 400 and 765, respectively, widely held stocks.
19
Manager's Analysis
PowerShares Dynamic Small Cap Portfolio (ticker: PJM)
The PowerShares Dynamic Small Cap Portfolio is based on the Dynamic Small Cap IntellidexSM Index and seeks investment results that correspond generally to the price and yield (before the Fund's fees and expenses) of that equity index.
The PowerShares Dynamic Small Cap Portfolio posted a 6.01% return since its inception on December 1, 2006 through April 30, 2007. Since the Fund's inception small cap stocks have lagged the overall market. The Fund benefited from good stock selection within the energy sector. Global Industries and Western Refining in particular made large contributions to the Fund's performance. Since inception, the Fund outperformed relative to other small cap indices, such as the S&P Small Cap 600® Index, which returned 5.96% and the Russell 2000® Index, which returned 4.78%.
Sector Breakdown (% of the Fund's
Net Assets)
| Financials | 24.3 | ||||||
| Consumer Discretionary | 21.9 | ||||||
| Industrials | 19.1 | ||||||
| Information Technology | 16.4 | ||||||
| Health Care | 9.6 | ||||||
| Energy | 5.5 | ||||||
| Telecommunication Services | 1.1 | ||||||
| Materials | 1.1 | ||||||
| Consumer Staples | 0.9 | ||||||
| Utilities | 0.4 | ||||||
| Money Market Fund | 0.4 | ||||||
| Other | (0.7 | ) | |||||
Style Allocation (%)
| Small-Cap Value | 67.5 | ||||||
| Small-Cap Growth | 32.5 | ||||||
Top Ten Fund Holdings (% of the Fund's
Net Assets)
| Security | |||||||
| Global Industries, Ltd. | 1.8 | ||||||
| Western Refining, Inc. | 1.6 | ||||||
| WebEx Communications, Inc. | 1.4 | ||||||
| CommScope, Inc. | 1.4 | ||||||
| Deluxe Corp. | 1.3 | ||||||
| DeVry, Inc. | 1.3 | ||||||
| TeleTech Holdings, Inc. | 1.3 | ||||||
| Cohen & Steers, Inc. | 1.3 | ||||||
| Wabtec Corp. | 1.3 | ||||||
| Commerce Group (The), Inc | 1.3 | ||||||
| Total | 14.0 | ||||||
20
Manager's Analysis (Continued)
PowerShares Dynamic Small Cap Portfolio (ticker: PJM)
Growth of a $10,000 Investment Since Inception
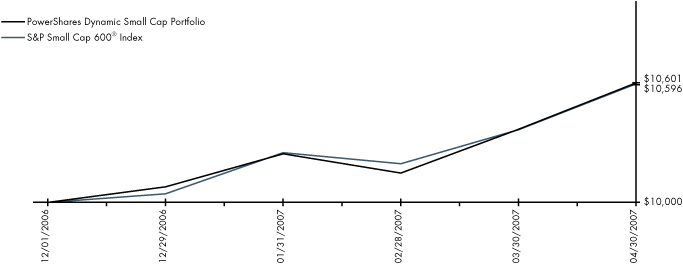
Fund Performance History (%) As of 30 April 2007
Index
| Fund Inception Cumulative | |||||||
| Dynamic Small Cap IntellidexSM Index | 6.12 | ||||||
| S&P Small Cap 600® Index | 5.96 | ||||||
| Russell 2000® Index | 4.78 | ||||||
Fund
| NAV Return | 6.01 | ||||||
| Share Price Return | 6.03 | ||||||
Fund Inception: 1 December 2006
Performance data quoted represents past performance. Past performance is not a guarantee of future results, current performance may be higher or lower than performance quoted. Investment returns and principal value will fluctuate and shares, when redeemed, may be worth more or less than their original cost. The Share Price performance reflects fee waivers, absent which, performance would have been lower. According to the Fund's most recent Prospectus, the Fund's total gross annual operating expenses was indicated as 0.70%. In the Financial Highlights section of this Annual Report, the Fund's net (subsidized) annualized total operating expense ratio was determined to be 0.74% while the Fund's gross annualized total operating expense ratio was 1.55%. The Adviser has contractually agreed to waive fees and/or pay certain Fund expenses which resulted in a lower fee actually paid by investors. This waiver extends through April 30, 200 8. Absent reimbursements or waivers, performance would have been lower. NAV and Share Price returns assume that dividends and capital gain distributions have been reinvested in the Fund at NAV and Share Price, respectively. The returns shown in the table above do not reflect the deduction of taxes that a shareholder would pay on Fund distributions or the redemption or sale of Fund Shares. See powershares.com to find the most recent month-end performance numbers.
The index performance results are hypothetical. Index returns do not represent Fund returns. An investor cannot invest directly in an index. The index does not charge management fees or brokerage expenses, and no such fees or expenses were deducted from the hypothetical performance shown nor does the index lend securities, and no revenues from securities lending were added to the performance shown. In addition, the results actual investors might have achieved would have differed from those shown because of differences in the timing, amounts of their investments, and fees and expenses associated with an investment in the Fund.
The S&P Small Cap 600® Index and the Russell 2000® Index are unmanaged indices that are broad measurements of change in stock market conditions based on the average performance of approximately 600 and 2,000, respectively, widely held stocks.
21
Manager's Analysis
PowerShares Dynamic Aggressive Growth Portfolio (ticker: PGZ)
The PowerShares Dynamic Aggressive Growth Portfolio is based on the Dynamic Aggressive Growth IntellidexSM Index and seeks investment results that correspond generally to the price and yield (before the Fund's fees and expenses) of that equity index.
The PowerShares Dynamic Aggressive Growth Portfolio posted a 6.11% return since its inception on December 20, 2006 through April 30, 2007. Industrials, information technology, and health care all made significant contributions to the Fund's performance. The consumer staples sector was the only sector making a slightly negative contribution to performance.
Sector Breakdown (% of the Fund's
Net Assets)
| Information Technology | 28.3 | ||||||
| Health Care | 24.9 | ||||||
| Industrials | 19.0 | ||||||
| Consumer Discretionary | 16.1 | ||||||
| Financials | 5.2 | ||||||
| Energy | 2.2 | ||||||
| Materials | 2.0 | ||||||
| Utilities | 1.1 | ||||||
| Telecommunications | 1.0 | ||||||
| Consumer Staples | 0.6 | ||||||
| Money Market Fund | 0.1 | ||||||
| Other | (0.5 | ) | |||||
Style Allocation (%)
| Mid-Cap Growth | 53.1 | ||||||
| Small-Cap Growth | 35.9 | ||||||
| Large-Cap Growth | 11.0 | ||||||
Top Ten Fund Holdings (% of the Fund's
Net Assets)
| Security | |||||||
| Schering-Plough Corp. | 1.3 | ||||||
| WebEx Communications, Inc. | 1.2 | ||||||
| ITT Educational Services, Inc. | 1.2 | ||||||
| Harman International Industries, Inc. | 1.2 | ||||||
| Foster Wheeler Ltd. (Bermuda) | 1.2 | ||||||
| Middleby (The) Corp. | 1.2 | ||||||
| Brocade Communications Systems, Inc. | 1.2 | ||||||
| CBOT Holdings, Inc., Class A | 1.1 | ||||||
| Cytyc Corp. | 1.1 | ||||||
| Perini Corp. | 1.1 | ||||||
| Total | 11.8 | ||||||
22
Manager's Analysis (Continued)
PowerShares Dynamic Aggressive Growth Portfolio (ticker: PGZ)
Growth of a $10,000 Investment Since Inception
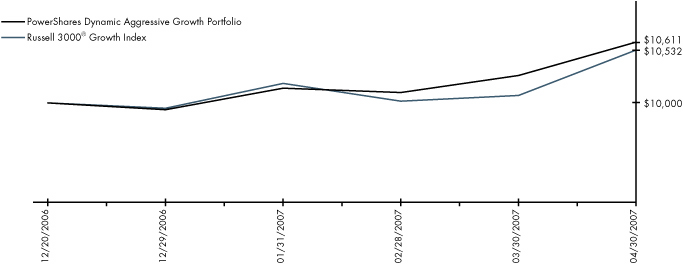
Fund Performance History (%) As of 30 April 2007
Index
| Fund Inception Cumulative | |||||||
| Dynamic Aggressive Growth IntellidexSM Index | 6.39 | ||||||
| Russell 3000® Growth Index | 5.32 | ||||||
| S&P 500® Pure Growth Index | 5.44 | ||||||
Fund
| NAV Return | 6.11 | ||||||
| Share Price Return | 6.11 | ||||||
Fund Inception: 20 December 2006
Performance data quoted represents past performance. Past performance is not a guarantee of future results, current performance may be higher or lower than performance quoted. Investment returns and principal value will fluctuate and shares, when redeemed, may be worth more or less than their original cost. The Share Price performance reflects fee waivers, absent which, performance would have been lower. According to the Fund's most recent Prospectus, the Fund's total gross annual operating expenses was indicated as 0.70%. In the Financial Highlights section of this Annual Report, the Fund's net (subsidized) annualized total operating expense ratio was determined to be 0.75% while the Fund's gross annualized total operating expense ratio was 1.76%. The Adviser has contractually agreed to waive fees and/or pay certain Fund expenses which resulted in a lower fee actually paid by investors. This waiver extends through April 30, 200 8. Absent reimbursements or waivers, performance would have been lower. NAV and Share Price returns assume that dividends and capital gain distributions have been reinvested in the Fund at NAV and Share Price, respectively. The returns shown in the table above do not reflect the deduction of taxes that a shareholder would pay on Fund distributions or the redemption or sale of Fund Shares. See powershares.com to find the most recent month-end performance numbers.
The index performance results are hypothetical. Index returns do not represent Fund returns. An investor cannot invest directly in an index. The index does not charge management fees or brokerage expenses, and no such fees or expenses were deducted from the hypothetical performance shown nor does the index lend securities, and no revenues from securities lending were added to the performance shown. In addition, the results actual investors might have achieved would have differed from those shown because of differences in the timing, amounts of their investments, and fees and expenses associated with an investment in the Fund.
The Russell 3000® Growth Index and the S&P 500® Pure Growth Index are unmanaged indices that are broad measurements of change in stock market conditions based on the average performance of approximately 3,000 and 151, respectively, widely held stocks.
23
Manager's Analysis
PowerShares Dynamic Deep Value Portfolio (ticker: PVM)
The PowerShares Dynamic Deep Value Portfolio is based on the Dynamic Deep Value IntellidexSM Index and seeks investment results that correspond generally to the price and yield (before the Fund's fees and expenses) of that equity index.
The PowerShares Dynamic Deep Value Portfolio posted a 5.59% return since its inception on December 20, 2006 through April 30, 2007. While value stocks have done very well over the past year, they have pulled back slightly since the Fund's inception. Financials have the largest weighting in the Fund and have lagged the overall market. Materials, industrials, and consumer staples all posted solid returns and contributed positively to the Fund's performance.
Sector Breakdown (% of the Fund's
Net Assets)
| Financials | 46.5 | ||||||
| Consumer Staples | 9.3 | ||||||
| Industrials | 9.2 | ||||||
| Materials | 9.2 | ||||||
| Information Technology | 7.7 | ||||||
| Utilities | 7.3 | ||||||
| Health Care | 5.3 | ||||||
| Consumer Discretionary | 4.9 | ||||||
| Energy | 1.1 | ||||||
| Money Market Fund | 0.7 | ||||||
| Other | (1.2 | ) | |||||
Style Allocation (%)
| Mid-Cap Value | 39.9 | ||||||
| Large-Cap Value | 34.0 | ||||||
| Small-Cap Value | 26.1 | ||||||
Top Ten Fund Holdings (% of the Fund's
Net Assets)
| Security | |||||||
| Cummins, Inc. | 1.3 | ||||||
| Merck & Co., Inc. | 1.2 | ||||||
| GAMCO Investors, Inc., Class A | 1.2 | ||||||
| Energen Corp. | 1.2 | ||||||
| Cleveland-Cliffs, Inc. | 1.2 | ||||||
| Dean Foods Co. | 1.1 | ||||||
| Universal Corp. | 1.1 | ||||||
| Sonoco Products Co. | 1.1 | ||||||
| Northwest Natural Gas Co. | 1.1 | ||||||
| Edison International | 1.1 | ||||||
| Total | 11.6 | ||||||
24
Manager's Analysis (Continued)
PowerShares Dynamic Deep Value Portfolio (ticker: PVM)
Growth of a $10,000 Investment Since Inception
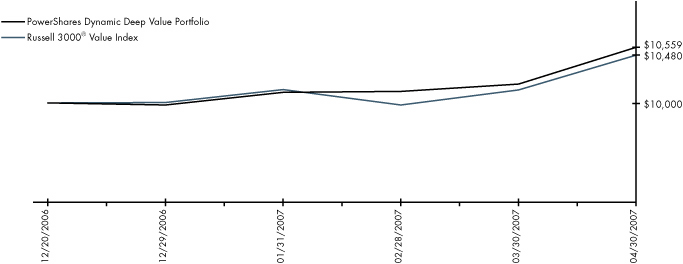
Fund Performance History (%) As of 30 April 2007
Index
| Fund Inception Cumulative | |||||||
| Dynamic Deep Value IntellidexSM Index | 5.82 | ||||||
| Russell 3000® Value Index | 4.80 | ||||||
| S&P 500® Pure Value Index | 6.76 | ||||||
Fund
| NAV Return | 5.59 | ||||||
| Share Price Return | 5.61 | ||||||
Fund Inception: 20 December 2006
Performance data quoted represents past performance. Past performance is not a guarantee of future results, current performance may be higher or lower than performance quoted. Investment returns and principal value will fluctuate and shares, when redeemed, may be worth more or less than their original cost. The Share Price performance reflects fee waivers, absent which, performance would have been lower. According to the Fund's most recent Prospectus, the Fund's total gross annual operating expenses was indicated as 0.70%. In the Financial Highlights section of this Annual Report, the Fund's net (subsidized) annualized total operating expense ratio was determined to be 0.74% while the Fund's gross annualized total operating expense ratio was 1.55%. The Adviser has contractually agreed to waive fees and/or pay certain Fund expenses which resulted in a lower fee actually paid by investors. This waiver extends through April 30, 200 8. Absent reimbursements or waivers, performance would have been lower. NAV and Share Price returns assume that dividends and capital gain distributions have been reinvested in the Fund at NAV and Share Price, respectively. The returns shown in the table above do not reflect the deduction of taxes that a shareholder would pay on Fund distributions or the redemption or sale of Fund Shares. See powershares.com to find the most recent month-end performance numbers.
The index performance results are hypothetical. Index returns do not represent Fund returns. An investor cannot invest directly in an index. The index does not charge management fees or brokerage expenses, and no such fees or expenses were deducted from the hypothetical performance shown nor does the index lend securities, and no revenues from securities lending were added to the performance shown. In addition, the results actual investors might have achieved would have differed from those shown because of differences in the timing, amounts of their investments, and fees and expenses associated with an investment in the Fund.
The Russell 3000® Value Index and the S&P 500® Pure Value Index are unmanaged indices that are broad measurements of change in stock market conditions based on the average performance of approximately 1,878 and 142, respectively, widely held stocks.
25
Manager's Analysis
PowerShares Zacks Micro Cap Portfolio (ticker: PZI)
The PowerShares Zacks Micro Cap Portfolio seeks to replicate, before fees and expenses, the Zacks Micro Cap Index, and is designed to identify a group of micro cap stocks with the greatest potential to outperform passive benchmark micro cap indices and other actively managed U.S. micro cap strategies. Due to their low correlation to large, medium and small sized companies, micro caps may complement existing blended portfolios by improving risk adjusted performance.
The PowerShares Zacks Micro Cap Portfolio returned 4.99% over the past year, performing in-line with the comparable Russell Micro Cap Index which returned 5.15% over the same period.
The consumer discretionary, consumer staples and financials sectors provided significant contributions to the Fund's performance. Performance lagged in the technology and industrials sectors.
Sector Breakdown (% of the Fund's
Net Assets)
| Financials | 25.0 | ||||||
| Information Technology | 20.9 | ||||||
| Consumer Discretionary | 18.9 | ||||||
| Industrials | 14.3 | ||||||
| Health Care | 7.4 | ||||||
| Materials | 4.3 | ||||||
| Energy | 4.0 | ||||||
| Consumer Staples | 3.0 | ||||||
| Telecommunication Services | 1.3 | ||||||
| Utilities | 0.7 | ||||||
| Rights | 0.0 | ||||||
| Money Market Fund | 0.1 | ||||||
| Other | 0.1 | ||||||
Style Allocation (%)
| Small-Cap Value | 58.3 | ||||||
| Small-Cap Growth | 41.7 | ||||||
Top Ten Fund Holdings (% of the Fund's
Net Assets)
| Security | |||||||
| Twin Disc, Inc. | 0.4 | ||||||
| Jinpan International Ltd. | |||||||
| (British Virgin Islands) | 0.4 | ||||||
| AZZ, Inc. | 0.3 | ||||||
| Libbey, Inc. | 0.3 | ||||||
| NexCen Brands, Inc. | 0.3 | ||||||
| T-3 Energy Services, Inc. | 0.3 | ||||||
| Globecomm Systems, Inc. | 0.3 | ||||||
| K2, Inc. | 0.3 | ||||||
| Ampco-Pittsburgh Corp. | 0.3 | ||||||
| Echelon Corp. | 0.3 | ||||||
| Total | 3.2 | ||||||
26
Manager's Analysis (Continued)
PowerShares Zacks Micro Cap Portfolio (ticker: PZI)
Growth of a $10,000 Investment Since Inception
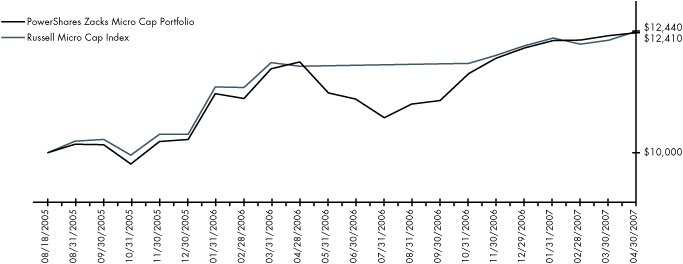
Fund Performance History (%) As of 30 April 2007
Index
| Avg. Ann.† | Fund Inception | ||||||||||||||
| 1 Year | Avg. Ann.† | Cumulative | |||||||||||||
| Zacks Micro Cap Index | 5.03 | 13.54 | 24.08 | ||||||||||||
| Russell Micro Cap Index | 5.15 | 13.71 | 24.40 | ||||||||||||
| S&P 500® Index | 15.24 | 14.29 | 25.48 | ||||||||||||
Fund
| NAV Return | 4.99 | 13.55 | 24.10 | ||||||||||||
| Share Price Return | 4.65 | 13.23 | 23.49 | ||||||||||||
Fund Inception: 18 August 2005
Performance data quoted represents past performance. Past performance is not a guarantee of future results, current performance may be higher or lower than performance quoted. Investment returns and principal value will fluctuate and shares, when redeemed, may be worth more or less than their original cost. The Share Price performance reflects fee waivers, absent which, performance would have been lower. According to the Fund's most recent Prospectus, the Fund's total gross annual operating expenses was indicated as 0.82%. In the Financial Highlights section of this Annual Report, the Fund's net (subsidized) annualized total operating expense ratio was determined to be 0.71% while the Fund's gross annualized total operating expense ratio was 0.78%. The Adviser has contractually agreed to waive fees and/or pay certain Fund expenses which resulted in a lower fee actually paid by investors. This waiver extends through April 30, 200 8. Absent reimbursements or waivers, performance would have been lower. NAV and Share Price returns assume that dividends and capital gain distributions have been reinvested in the Fund at NAV and Share Price, respectively. The returns shown in the table above do not reflect the deduction of taxes that a shareholder would pay on Fund distributions or the redemption or sale of Fund Shares. See powershares.com to find the most recent month-end performance numbers.
The index performance results are hypothetical. Index returns do not represent Fund returns. An investor cannot invest directly in an index. The index does not charge management fees or brokerage expenses, and no such fees or expenses were deducted from the hypothetical performance shown nor does the index lend securities, and no revenues from securities lending were added to the performance shown. In addition, the results actual investors might have achieved would have differed from those shown because of differences in the timing, amounts of their investments, and fees and expenses associated with an investment in the Fund.
The Russell Micro Cap Index and the S&P 500® Index are unmanaged indices based on the average performance of approximately 1,000 and 500 common stocks, respectively.
† Average annualized.
27
Manager's Analysis (Continued)
PowerShares Zacks Small Cap Portfolio (ticker: PZJ)
The PowerShares Zacks Small Cap Portfolio is based on the Zacks Small Cap Index. The index is designed to identify a group of small cap stocks with the greatest potential to outperform passive benchmark small cap indices and other actively managed U.S. small cap strategies. The portfolio is rebalanced and reconstituted quarterly.
For the year ending April 30, 2007 the Small Cap Portfolio returned 3.03%, lagging the broader market as most small caps did. The Fund was underweight in many sectors which performed well, especially the telecommunications, energy and utilities sectors. The portfolio's higher weighted sectors, specifically technology and health care, dragged the Fund down additionally by their negative performance.
Sector Breakdown (% of the Fund's
Net Assets)
| Information Technology | 19.5 | ||||||
| Consumer Discretionary | 19.0 | ||||||
| Health Care | 16.3 | ||||||
| Financials | 12.1 | ||||||
| Industrials | 11.0 | ||||||
| Energy | 8.5 | ||||||
| Materials | 6.0 | ||||||
| Consumer Staples | 3.6 | ||||||
| Utilities | 2.1 | ||||||
| Telecommunication Services | 1.6 | ||||||
| Money Market Fund | 0.0 | ||||||
| Other | 0.3 | ||||||
Style Allocation (%)
| Small-Cap Growth | 50.6 | ||||||
| Small-Cap Value | 49.4 | ||||||
Top Ten Fund Holdings (% of the Fund's
Net Assets)
| Security | |||||||
| Echelon Corp. | 0.7 | ||||||
| USEC, Inc. | 0.6 | ||||||
| Dendrite International, Inc. | 0.6 | ||||||
| Covansys Corp. | 0.6 | ||||||
| CommScope, Inc. | 0.6 | ||||||
| TeleTech Holdings, Inc. | 0.6 | ||||||
| Sinclair Broadcast Group, Inc., Class A | 0.5 | ||||||
| Dril-Quip, Inc. | 0.5 | ||||||
| Nuance Communications, Inc. | 0.5 | ||||||
| PharmaNet Development Group, Inc. | 0.5 | ||||||
| Total | 5.7 | ||||||
28
Manager's Analysis (Continued)
PowerShares Zacks Small Cap Portfolio (ticker: PZJ)
Growth of a $10,000 Investment Since Inception

Fund Performance History (%) As of 30 April 2007
Index
| Avg. Ann.† 1 Year | Fund Inception Cumulative | ||||||||||
| Zacks Small Cap Index | 2.77 | 8.24 | |||||||||
| Russell 2000® Index | 7.83 | 12.87 | |||||||||
| S&P Small Cap Index | 5.29 | 11.62 | |||||||||
Fund
| NAV Return | 3.03 | 8.51 | |||||||||
| Share Price Return | 2.94 | 8.32 | |||||||||
Fund Inception: 16 February 2006
Performance data quoted represents past performance. Past performance is not a guarantee of future results, current performance may be higher or lower than performance quoted. Investment returns and principal value will fluctuate and shares, when redeemed, may be worth more or less than their original cost. The Share Price performance reflects fee waivers, absent which, performance would have been lower. According to the Fund's most recent Prospectus, the Fund's total gross annual operating expenses was indicated as 1.17%. In the Financial Highlights section of this Annual Report, the Fund's net (subsidized) annualized total operating expense ratio was determined to be 0.71% while the Fund's gross annualized total operating expense ratio was 0.89%. The Adviser has contractually agreed to waive fees and/or pay certain Fund expenses which resulted in a lower fee actually paid by investors. This waiver extends through April 30, 200 8. Absent reimbursements or waivers, performance would have been lower. NAV and Share Price returns assume that dividends and capital gain distributions have been reinvested in the Fund at NAV and Share Price, respectively. The returns shown in the table above do not reflect the deduction of taxes that a shareholder would pay on Fund distributions or the redemption or sale of Fund Shares. See powershares.com to find the most recent month-end performance numbers.
The index performance results are hypothetical. Index returns do not represent Fund returns. An investor cannot invest directly in an index. The index does not charge management fees or brokerage expenses, and no such fees or expenses were deducted from the hypothetical performance shown nor does the index lend securities, and no revenues from securities lending were added to the performance shown. In addition, the results actual investors might have achieved would have differed from those shown because of differences in the timing, amounts of their investments, and fees and expenses associated with an investment in the Fund.
The Russell 2000® Index and the S&P Small Cap Index are unmanaged indices based on the average performance of approximately 2,000 and 600 common stocks, respectively.
† Average annualized.
29
Funds' Distribution History
| Ex-Dividend | 4/13/07 | 3/16/07 | 3/15/07 | 2/15/07 | 1/12/07 | 12/15/06 | 11/15/06 | ||||||||||||||||||||||||||||
| Record | 4/17/07 | 3/20/07 | 3/20/07 | 2/20/07 | 1/16/07 | 12/19/06 | 11/17/06 | ||||||||||||||||||||||||||||
| Payable | 4/30/07 | 3/30/07 | 3/30/07 | 2/28/07 | 1/31/07 | 12/29/06 | 11/30/06 | ||||||||||||||||||||||||||||
| Fund | Ticker | ||||||||||||||||||||||||||||||||||
| PowerShares Dynamic Large Cap Growth Portfolio | PWB | — | — | — | — | — | 0.01906 | — | |||||||||||||||||||||||||||
| PowerShares Dynamic Large Cap Value Portfolio | PWV | — | 0.06823 | — | — | — | 0.11068 | — | |||||||||||||||||||||||||||
| PowerShares Dynamic Mid Cap Growth Portfolio | PWJ | — | — | — | — | — | 0.09682 | — | |||||||||||||||||||||||||||
| PowerShares Dynamic Mid Cap Value Portfolio | PWP | — | 0.03230 | — | — | — | 0.11224 | — | |||||||||||||||||||||||||||
| PowerShares Dynamic Small Cap Growth Portfolio | PWT | — | — | — | — | — | — | — | |||||||||||||||||||||||||||
| PowerShares Dynamic Small Cap Value Portfolio | PWY | — | 0.03120 | — | — | — | 0.05147 | — | |||||||||||||||||||||||||||
| PowerShares Dynamic Large Cap Portfolio | PJF | — | 0.05700 | — | — | — | 0.01958 | — | |||||||||||||||||||||||||||
| PowerShares Dynamic Mid Cap Portfolio | PJG | — | 0.02010 | — | — | — | 0.04345 | — | |||||||||||||||||||||||||||
| PowerShares Dynamic Small Cap Portfolio | PJM | — | — | — | — | — | 0.00194 | — | |||||||||||||||||||||||||||
| PowerShares Dynamic Aggressive Growth Portfolio | PGZ | — | — | — | — | — | — | — | |||||||||||||||||||||||||||
| PowerShares Dynamic Deep Value Portfolio | PVM | — | 0.07260 | — | — | — | — | — | |||||||||||||||||||||||||||
| PowerShares Zacks Micro Cap Portfolio | PZI | — | — | — | — | — | 0.02151 | — | |||||||||||||||||||||||||||
| PowerShares Zacks Small Cap Portfolio | PZJ | — | 0.01358 | — | — | — | 0.01065 | — | |||||||||||||||||||||||||||
| Ex-Dividend | 12/30/05 | 12/16/05 | 9/16/05 | 6/17/05 | 4/1/05 | 3/18/05 | |||||||||||||||||||||||||
| Record | 1/4/06 | 12/20/05 | 9/20/05 | 6/21/05 | 4/5/05 | 3/22/05 | |||||||||||||||||||||||||
| Payable | 1/31/06 | 12/30/05 | 9/30/05 | 6/30/05 | 4/29/05 | 4/29/05 | |||||||||||||||||||||||||
| Fund | Ticker | ||||||||||||||||||||||||||||||
| PowerShares Dynamic Large Cap Growth Portfolio | PWB | — | 0.00241 | — | — | — | — | ||||||||||||||||||||||||
| PowerShares Dynamic Large Cap Value Portfolio | PWV | — | 0.07647 | 0.05490 | 0.06233 | — | 0.01222 | ||||||||||||||||||||||||
| PowerShares Dynamic Mid Cap Growth Portfolio | PWJ | — | — | — | — | — | — | ||||||||||||||||||||||||
| PowerShares Dynamic Mid Cap Value Portfolio | PWP | — | 0.12251 | 0.04806 | 0.04852 | — | 0.02010 | ||||||||||||||||||||||||
| PowerShares Dynamic Small Cap Growth Portfolio | PWT | — | — | — | — | — | — | ||||||||||||||||||||||||
| PowerShares Dynamic Small Cap Value Portfolio | PWY | — | 0.02879 | 0.02835 | 0.03471 | — | — | ||||||||||||||||||||||||
| PowerShares Dynamic Large Cap Portfolio | PJF | — | — | — | — | — | — | ||||||||||||||||||||||||
| PowerShares Dynamic Mid Cap Portfolio | PJG | — | — | — | — | — | — | ||||||||||||||||||||||||
| PowerShares Dynamic Small Cap Portfolio | PJM | — | — | — | — | — | — | ||||||||||||||||||||||||
| PowerShares Dynamic Aggressive Growth Portfolio | PGZ | — | — | — | — | — | — | ||||||||||||||||||||||||
| PowerShares Dynamic Deep Value Portfolio | PVM | — | — | — | — | — | — | ||||||||||||||||||||||||
| PowerShares Zacks Micro Cap Portfolio | PZI | — | 0.01012 | — | — | — | — | ||||||||||||||||||||||||
| PowerShares Zacks Small Cap Portfolio | PZJ | — | — | — | — | — | — | ||||||||||||||||||||||||
30
| 10/13/06 | 9/15/06 | 8/15/06 | 7/14/06 | 6/16/06 | 6/15/06 | 5/15/06 | 3/17/06 | ||||||||||||||||||||||||||||
| 10/17/06 | 9/16/06 | 8/17/06 | 7/18/06 | 6/20/06 | 6/19/06 | 5/17/06 | 3/21/06 | ||||||||||||||||||||||||||||
| 10/31/06 | 9/29/06 | 8/31/06 | 7/31/06 | 6/30/06 | 6/30/06 | 5/31/06 | 3/30/06 | ||||||||||||||||||||||||||||
| Fund | |||||||||||||||||||||||||||||||||||
| PowerShares Dynamic Large Cap Growth Portfolio | — | — | — | — | 0.00120 | — | — | — | |||||||||||||||||||||||||||
| PowerShares Dynamic Large Cap Value Portfolio | — | 0.05101 | — | — | 0.05675 | — | — | 0.04783 | |||||||||||||||||||||||||||
| PowerShares Dynamic Mid Cap Growth Portfolio | — | — | — | — | 0.01708 | — | — | — | |||||||||||||||||||||||||||
| PowerShares Dynamic Mid Cap Value Portfolio | — | 0.03813 | — | — | 0.05155 | — | — | 0.03356 | |||||||||||||||||||||||||||
| PowerShares Dynamic Small Cap Growth Portfolio | — | — | — | — | — | — | — | — | |||||||||||||||||||||||||||
| PowerShares Dynamic Small Cap Value Portfolio | — | 0.02539 | — | — | 0.02139 | — | — | 0.01644 | |||||||||||||||||||||||||||
| PowerShares Dynamic Large Cap Portfolio | — | — | — | — | — | — | — | — | |||||||||||||||||||||||||||
| PowerShares Dynamic Mid Cap Portfolio | — | — | — | — | — | — | — | — | |||||||||||||||||||||||||||
| PowerShares Dynamic Small Cap Portfolio | — | — | — | — | — | — | — | — | |||||||||||||||||||||||||||
| PowerShares Dynamic Aggressive Growth Portfolio | — | — | — | — | — | — | — | — | |||||||||||||||||||||||||||
| PowerShares Dynamic Deep Value Portfolio | — | — | — | — | — | — | — | — | |||||||||||||||||||||||||||
| PowerShares Zacks Micro Cap Portfolio | — | — | — | — | — | — | — | — | |||||||||||||||||||||||||||
| PowerShares Zacks Small Cap Portfolio | — | 0.01385 | — | — | 0.01784 | — | — | — | |||||||||||||||||||||||||||
31
Frequency Distribution of Discounts & Premiums
Since Inception thru April 30, 2007
| Closing Price Above NAV | |||||||||||||||||||||||||||||||||||||||
| Ticker | Fund Name | Inception | Days | 0-24 Basis Points | 25-49 Basis Points | 50-99 Basis Points | 100-149 Basis Points | 150-199 Basis Points | 200+ Basis Points | ||||||||||||||||||||||||||||||
| PWB | PowerShares Dynamic Large Cap Growth Portfolio | 3/3/05 | 543 | 344 | 18 | 1 | 0 | 0 | 0 | ||||||||||||||||||||||||||||||
| PWV | PowerShares Dynamic Large Cap Value Portfolio | 3/3/05 | 543 | 380 | 10 | 5 | 0 | 0 | 0 | ||||||||||||||||||||||||||||||
| PWJ | PowerShares Dynamic Mid Cap Growth Portfolio | 3/3/05 | 543 | 297 | 5 | 3 | 0 | 0 | 0 | ||||||||||||||||||||||||||||||
| PWP | PowerShares Dynamic Mid Cap Value Portfolio | 3/3/05 | 543 | 296 | 4 | 2 | 0 | 0 | 0 | ||||||||||||||||||||||||||||||
| PWT | PowerShares Dynamic Small Cap Growth Portfolio | 3/3/05 | 543 | 277 | 16 | 2 | 0 | 0 | 0 | ||||||||||||||||||||||||||||||
| PWY | PowerShares Dynamic Small Cap Value Portfolio | 3/3/05 | 543 | 286 | 15 | 3 | 0 | 0 | 0 | ||||||||||||||||||||||||||||||
| PJF | PowerShares Dynamic Large Cap Portfolio | 12/1/06 | 101 | 28 | 0 | 1 | 0 | 0 | 0 | ||||||||||||||||||||||||||||||
| PJG | PowerShares Dynamic Mid Cap Portfolio | 12/1/06 | 101 | 44 | 6 | 0 | 0 | 0 | 0 | ||||||||||||||||||||||||||||||
| PJM | PowerShares Dynamic Small Cap Portfolio | 12/1/06 | 101 | 22 | 1 | 0 | 0 | 0 | 0 | ||||||||||||||||||||||||||||||
| PGZ | PowerShares Dynamic Aggressive Growth Portfolio | 12/20/06 | 88 | 19 | 4 | 0 | 0 | 0 | 0 | ||||||||||||||||||||||||||||||
| PVM | PowerShares Dynamic Deep Value Portfolio | 12/20/06 | 88 | 35 | 0 | 0 | 0 | 0 | 0 | ||||||||||||||||||||||||||||||
| PZI | PowerShares Zacks Micro Cap Portfolio | 8/18/05 | 426 | 175 | 16 | 5 | 0 | 0 | 0 | ||||||||||||||||||||||||||||||
| PZJ | PowerShares Zacks Small Cap Portfolio | 2/16/06 | 300 | 156 | 4 | 0 | 0 | 0 | 0 | ||||||||||||||||||||||||||||||
32
| Closing Price Below NAV | |||||||||||||||||||||||||||
| Ticker | -0-24 Basis Points | -25-49 Basis Points | -50-99 Basis Points | -100-149 Basis Points | -150-199 Basis Points | -200+ Basis Points | |||||||||||||||||||||
| PWB | 176 | 3 | 1 | 0 | 0 | 0 | |||||||||||||||||||||
| PWV | 139 | 6 | 3 | 0 | 0 | 0 | |||||||||||||||||||||
| PWJ | 233 | 4 | 1 | 0 | 0 | 0 | |||||||||||||||||||||
| PWP | 239 | 2 | 0 | 0 | 0 | 0 | |||||||||||||||||||||
| PWT | 232 | 13 | 3 | 0 | 0 | 0 | |||||||||||||||||||||
| PWY | 229 | 7 | 3 | 0 | 0 | 0 | |||||||||||||||||||||
| PJF | 72 | 0 | 0 | 0 | 0 | 0 | |||||||||||||||||||||
| PJG | 50 | 1 | 0 | 0 | 0 | 0 | |||||||||||||||||||||
| PJM | 77 | 1 | 0 | 0 | 0 | 0 | |||||||||||||||||||||
| PGZ | 58 | 7 | 0 | 0 | 0 | 0 | |||||||||||||||||||||
| PVM | 53 | 0 | 0 | 0 | 0 | 0 | |||||||||||||||||||||
| PZI | 222 | 7 | 1 | 0 | 0 | 0 | |||||||||||||||||||||
| PZJ | 138 | 2 | 0 | 0 | 0 | 0 | |||||||||||||||||||||
33
Fees and Expenses
As a shareholder of a Fund of the PowerShares Exchange-Traded Fund Trust, you incur advisory fees and other Fund expenses. The expense examples below are intended to help you understand your ongoing costs (in dollars) of investing in the Funds and to compare these costs with the ongoing costs of investing in other mutual funds.
The example is based on an investment of $1,000 invested at the beginning of the period and held through the six-month (or shorter) period ended April 30, 2007.
Actual Expenses
The first line in the following tables provides information about actual account values and actual expenses. You may use the information in this line, together with the amount you invested, to estimate the expenses that you paid over the period. Simply divide your account value by $1,000 (for example, an $8,600 account value divided by $1,000 = 8.6), then multiply the result by the number in the first line under the heading "Expenses Paid During the Six-Month Period" to estimate the expenses you paid on your account during this period.
Hypothetical Example for Comparison Purposes
The second line in the following tables provides information about hypothetical account values and hypothetical expenses based on the Funds' actual expense ratio and an assumed annualized rate of return of 5% per year before expenses, which is not the Funds' actual return. The hypothetical account values and expenses may not be used to estimate the actual ending account balance or expenses you paid for the period. You may use this information to compare the ongoing costs of investing in the Funds and other funds. To do so, compare this 5% hypothetical example with the 5% hypothetical examples that appear in the shareholder reports of the other funds.
Please note that the expenses shown in the tables are meant to highlight your ongoing costs only, and do not reflect any transactional costs such as sales charges (loads). Therefore the second line in the table is useful in comparing ongoing costs only, and will not help you determine the relative total costs of owning different funds. In addition, if these transactional costs were included, your costs would have been higher.
| Beginning Account Value November 1, 2006 | Ending Account Value April 30, 2007 | Annualized Expense Ratio Based on the Six-Month Period | Expenses Paid During the Six-Month Period (1) | ||||||||||||||||
| PowerShares Dynamic Large Cap Growth Portfolio Actual | $ | 1,000.00 | $ | 1,072.38 | 0.63 | % | $ | 3.24 | |||||||||||
| Hypothetical (5% return before expenses) | $ | 1,000.00 | $ | 1,021.67 | 0.63 | % | $ | 3.16 | |||||||||||
| PowerShares Dynamic Large Cap Value Portfolio Actual | $ | 1,000.00 | $ | 1,098.80 | 0.63 | % | $ | 3.28 | |||||||||||
| Hypothetical (5% return before expenses) | $ | 1,000.00 | $ | 1,021.67 | 0.63 | % | $ | 3.16 | |||||||||||
| PowerShares Dynamic Mid Cap Growth Portfolio Actual | $ | 1,000.00 | $ | 1,123.25 | 0.63 | % | $ | 3.32 | |||||||||||
| Hypothetical (5% return before expenses) | $ | 1,000.00 | $ | 1,021.67 | 0.63 | % | $ | 3.16 | |||||||||||
| PowerShares Dynamic Mid Cap Value Portfolio Actual | $ | 1,000.00 | $ | 1,136.84 | 0.63 | % | $ | 3.34 | |||||||||||
| Hypothetical (5% return before expenses) | $ | 1,000.00 | $ | 1,021.67 | 0.63 | % | $ | 3.16 | |||||||||||
34
Fees and Expenses (Continued)
| Beginning Account Value November 1, 2006 | Ending Account Value April 30, 2007 | Annualized Expense Ratio Based on the Six-Month Period | Expenses Paid During the Six-Month Period (1) | ||||||||||||||||
| PowerShares Dynamic Small Cap Growth Portfolio Actual | $ | 1,000.00 | $ | 1,044.97 | 0.63 | % | $ | 3.19 | |||||||||||
| Hypothetical (5% return before expenses) | $ | 1,000.00 | $ | 1,021.67 | 0.63 | % | $ | 3.16 | |||||||||||
| PowerShares Dynamic Small Cap Value Portfolio Actual | $ | 1,000.00 | $ | 1,080.33 | 0.63 | % | $ | 3.25 | |||||||||||
| Hypothetical (5% return before expenses) | $ | 1,000.00 | $ | 1,021.67 | 0.63 | % | $ | 3.16 | |||||||||||
| Beginning Account Value December 1, 2006 (Commencement of Investment Operations) | Ending Account Value April 30, 2007 | Annualized Expense Ratio Based on Number of Days in the Period | Expenses Paid During Period (2) December 1, 2006 (Commencement of Investment Operations) to April 30, 2007 | ||||||||||||||||
| PowerShares Large Cap Portfolio Actual | $ | 1,000.00 | $ | 1,075.52 | 0.88 | % | $ | 3.75 | |||||||||||
| Hypothetical (5% return before expenses) | $ | 1,000.00 | $ | 1,020.43 | 0.88 | % | $ | 4.41 | |||||||||||
| PowerShares Mid Cap Portfolio Actual | $ | 1,000.00 | $ | 1,110.40 | 0.89 | % | $ | 3.86 | |||||||||||
| Hypothetical (5% return before expenses) | $ | 1,000.00 | $ | 1,020.38 | 0.89 | % | $ | 4.46 | |||||||||||
| PowerShares Small Cap Portfolio Actual | $ | 1,000.00 | $ | 1,060.07 | 0.89 | % | $ | 3.77 | |||||||||||
| Hypothetical (5% return before expenses) | $ | 1,000.00 | $ | 1,020.38 | 0.89 | % | $ | 4.46 | |||||||||||
| Beginning Account Value December 20, 2006 (Commencement of Investment Operations) | Ending Account Value April 30, 2007 | Annualized Expense Ratio Based on Number of Days in the Period | Expenses Paid During Period (3) December 20, 2006 (Commencement of Investment Operations) to April 30, 2007 | ||||||||||||||||
| PowerShares Dynamic Aggressive Growth Portfolio Actual | $ | 1,000.00 | $ | 1,061.14 | 0.87 | % | $ | 3.22 | |||||||||||
| Hypothetical (5% return before expenses) | $ | 1,000.00 | $ | 1,020.48 | 0.87 | % | $ | 4.36 | |||||||||||
| PowerShares Dynamic Deep Value Portfolio Actual | $ | 1,000.00 | $ | 1,055.91 | 0.90 | % | $ | 3.32 | |||||||||||
| Hypothetical (5% return before expenses) | $ | 1,000.00 | $ | 1,020.33 | 0.90 | % | $ | 4.51 | |||||||||||
35
Fees and Expenses (Continued)
| Beginning Account Value November 1, 2006 | Ending Account Value April 30, 2007 | Annualized Expense Ratio Based on the Six-Month Period | Expenses Paid During the Six-Month Period (1) | ||||||||||||||||
| PowerShares Zacks Micro Cap Portfolio Actual | $ | 1,000.00 | $ | 1,071.38 | 0.70 | % | $ | 3.60 | |||||||||||
| Hypothetical (5% return before expenses) | $ | 1,000.00 | $ | 1,021.32 | 0.70 | % | $ | 3.51 | |||||||||||
| PowerShares Zacks Small Cap Portfolio Actual | $ | 1,000.00 | $ | 1,062.31 | 0.70 | % | $ | 3.58 | |||||||||||
| Hypothetical (5% return before expenses) | $ | 1,000.00 | $ | 1,021.32 | 0.70 | % | $ | 3.51 | |||||||||||
(1) Expenses are calculated using the annualized expense ratio, which represents the ongoing expenses as a percentage of net assets for the six months ended April 30, 2007. Expenses are calculated by multiplying the Fund's annualized expense ratio by the average account value for the period; then multiplying the result by 181 and then dividing the result by 365. Expense ratios for the most recent half-year may differ from expense ratios based on the one year data in the financial highlights.
(2) Expenses are calculated using the annualized expense ratio, which represents the ongoing expenses as a percentage of net assets for the period December 1, 2006 (commencement of investment operations) to April 30, 2007. Expenses are calculated by multiplying the Fund's annualized expense ratio by the average account value for the period; then multiplying the result by 151 and then dividing the result by 365.
(3) Expenses are calculated using the annualized expense ratio, which represents the ongoing expenses as a percentage of net assets for the period December 20, 2006 (commencement of investment operations) to April 30, 2007. Expenses are calculated by multiplying the Fund's annualized expense ratio by the average account value for the period; then multiplying the result by 132 and then dividing the result by 365.
36
Schedule of Investments
PowerShares Dynamic Large Cap Growth Portfolio
April 30, 2007
| Number of Shares | Value | ||||||||||
| Common Stocks—100.0% | |||||||||||
| Consumer Discretionary—21.8% | |||||||||||
| 78,792 | Coach, Inc.* | $ | 3,847,413 | ||||||||
| 172,084 | DIRECTV Group (The), Inc.* | 4,102,483 | |||||||||
| 90,181 | International Game Technology | 3,439,503 | |||||||||
| 46,846 | J.C. Penney Co., Inc. | 3,705,050 | |||||||||
| 54,233 | Kohl's Corp.* | 4,015,411 | |||||||||
| 79,556 | Marriott International, Inc., Class A | 3,596,727 | |||||||||
| 58,960 | McGraw-Hill (The) Cos., Inc. | 3,863,649 | |||||||||
| 389,112 | News Corp., Class A | 8,712,218 | |||||||||
| 67,626 | Nordstrom, Inc. | 3,714,020 | |||||||||
| 144,805 | Staples, Inc. | 3,591,164 | |||||||||
| 145,593 | Target Corp. | 8,643,856 | |||||||||
| 261,438 | Walt Disney (The) Co. | 9,145,102 | |||||||||
| 60,376,596 | |||||||||||
| Energy—5.5% | |||||||||||
| 60,241 | Baker Hughes, Inc. | 4,842,774 | |||||||||
| 142,256 | Schlumberger Ltd. (Netherlands) | 10,502,760 | |||||||||
| 15,345,534 | |||||||||||
| Financials—7.1% | |||||||||||
| 204,746 | Charles Schwab (The) Corp. | 3,914,744 | |||||||||
| 7,224 | Chicago Mercantile Exchange Holdings, Inc., Class A | 3,733,002 | |||||||||
| 31,816 | Franklin Resources, Inc. | 4,177,759 | |||||||||
| 58,391 | Moody's Corp. | 3,860,813 | |||||||||
| 56,881 | State Street Corp. | 3,917,394 | |||||||||
| 19,603,712 | |||||||||||
| Health Care—23.4% | |||||||||||
| 138,711 | Amgen, Inc.* | 8,896,924 | |||||||||
| 79,046 | Baxter International, Inc. | 4,476,375 | �� | ||||||||
| 50,751 | Becton, Dickinson & Co. | 3,993,596 | |||||||||
| 83,952 | Biogen Idec, Inc.* | 3,963,374 | |||||||||
| 54,352 | Cardinal Health, Inc. | 3,801,922 | |||||||||
| 72,351 | Forest Laboratories, Inc.* | 3,849,797 | |||||||||
| 68,605 | McKesson Corp. | 4,036,032 | |||||||||
| 178,908 | Medtronic, Inc. | 9,469,601 | |||||||||
| 165,291 | Schering-Plough Corp. | 5,244,683 | |||||||||
| 61,395 | Stryker Corp. | 3,986,991 | |||||||||
| 173,240 | UnitedHealth Group, Inc. | 9,192,114 | |||||||||
| 46,043 | Zimmer Holdings, Inc.* | 4,165,971 | |||||||||
| 65,077,380 | |||||||||||
| Industrials—9.9% | |||||||||||
| 120,548 | 3M Co. | 9,977,758 | |||||||||
| 101,761 | Boeing Co. | 9,463,773 | |||||||||
| 53,156 | Danaher Corp. | 3,784,176 | |||||||||
| 37,901 | Union Pacific Corp. | 4,330,189 | |||||||||
| 27,555,896 | |||||||||||
| Number of Shares | Value | ||||||||||
| Common Stocks (Continued) | |||||||||||
| Information Technology—29.4% | |||||||||||
| 96,904 | Adobe Systems, Inc.* | $ | 4,027,330 | ||||||||
| 103,141 | Apple, Inc.* | 10,293,473 | |||||||||
| 205,173 | Applied Materials, Inc. | 3,943,425 | |||||||||
| 85,657 | Automatic Data Processing, Inc. | 3,834,007 | |||||||||
| 333,946 | Cisco Systems, Inc.* | 8,929,716 | |||||||||
| 182,196 | Corning, Inc.* | 4,321,689 | |||||||||
| 379,783 | Dell, Inc.* | 9,574,329 | |||||||||
| 19,523 | Google, Inc., Class A* | 9,202,752 | |||||||||
| 317,889 | Microsoft Corp. | 9,517,597 | |||||||||
| 546,193 | Oracle Corp.* | 10,268,428 | |||||||||
| 92,903 | Paychex, Inc. | 3,446,701 | |||||||||
| 122,237 | Texas Instruments, Inc. | 4,201,286 | |||||||||
| 81,560,733 | |||||||||||
| Utilities—2.9% | |||||||||||
| 176,717 | AES (The) Corp.* | 3,886,007 | |||||||||
| 65,599 | TXU Corp. | 4,301,982 | |||||||||
| 8,187,989 | |||||||||||
| Total Common Stocks (Cost $257,181,909) | 277,707,840 | ||||||||||
| Money Market Fund—0.1% | |||||||||||
| 157,501 | Liquid Assets Portfolio Private Class** (Cost $157,501) | 157,501 | |||||||||
| Total Investments (Cost $257,339,410)—100.1% | 277,865,341 | ||||||||||
| Liabilities in excess of other assets—(0.1%) | (267,792 | ) | |||||||||
| Net Assets—100.0% | $ | 277,597,549 | |||||||||
* Non-income producing security.
** Affiliated investments.
COUNTRY BREAKDOWN
April 30, 2007 (Unaudited)
| Value | Net Assets | ||||||||||
| United States | $ | 267,362,581 | 96.3 | % | |||||||
| Netherlands | 10,502,760 | 3.8 | |||||||||
| Total investments | 277,865,341 | 100.1 | |||||||||
| Liabilities in excess of other assets | (267,792 | ) | (0.1 | ) | |||||||
| Net Assets | $ | 277,597,549 | 100.0 | % | |||||||
See Notes to Financial Statements.
37
Schedule of Investments
PowerShares Dynamic Large Cap Value Portfolio
April 30, 2007
| Number of Shares | Value | ||||||||||
| Common Stocks—100.0% | |||||||||||
| Consumer Discretionary—2.7% | |||||||||||
| 204,893 | Gap (The), Inc. | $ | 3,677,829 | ||||||||
| 88,221 | McDonald's Corp. | 4,259,310 | |||||||||
| 7,937,139 | |||||||||||
| Consumer Staples—9.0% | |||||||||||
| 147,883 | Altria Group, Inc. | 10,192,096 | |||||||||
| 96,917 | Campbell Soup Co. | 3,789,455 | |||||||||
| 70,983 | General Mills, Inc. | 4,251,882 | |||||||||
| 85,975 | H.J. Heinz Co. | 4,050,282 | |||||||||
| 63,831 | Reynolds American, Inc. | 4,101,780 | |||||||||
| 26,385,495 | |||||||||||
| Energy—8.5% | |||||||||||
| 133,259 | Chevron Corp. | 10,366,218 | |||||||||
| 125,906 | Exxon Mobil Corp. | 9,994,418 | |||||||||
| 43,836 | Marathon Oil Corp. | 4,451,546 | |||||||||
| 24,812,182 | |||||||||||
| Financials—40.4% | |||||||||||
| 70,481 | ACE Ltd. (Cayman Islands) | 4,190,800 | |||||||||
| 137,678 | American International Group, Inc. | 9,625,069 | |||||||||
| 64,807 | Ameriprise Financial, Inc. | 3,854,072 | |||||||||
| 179,170 | Bank of America Corp. | 9,119,753 | |||||||||
| 76,555 | Chubb (The) Corp. | 4,120,956 | |||||||||
| 176,135 | Citigroup, Inc. | 9,444,359 | |||||||||
| 112,155 | Genworth Financial, Inc., Class A | 4,092,536 | |||||||||
| 42,072 | Hartford Financial Services Group (The), Inc. | 4,257,686 | |||||||||
| 185,597 | JPMorgan Chase & Co. | 9,669,604 | |||||||||
| 103,862 | KeyCorp | 3,705,796 | |||||||||
| 57,598 | Lincoln National Corp. | 4,098,098 | |||||||||
| 92,059 | Loews Corp. | 4,356,232 | |||||||||
| 62,200 | MetLife, Inc. | 4,086,540 | |||||||||
| 116,966 | Morgan Stanley | 9,826,313 | |||||||||
| 53,759 | PNC Financial Services Group, Inc. | 3,983,542 | |||||||||
| 174,353 | Progressive (The) Corp. | 4,022,324 | |||||||||
| 43,906 | Prudential Financial, Inc. | 4,171,070 | |||||||||
| 46,658 | SunTrust Banks, Inc. | 3,938,868 | |||||||||
| 76,585 | Travelers Cos. (The), Inc. | 4,143,249 | |||||||||
| 111,049 | U.S. Bancorp | 3,814,533 | |||||||||
| 265,814 | Wells Fargo & Co. | 9,540,064 | |||||||||
| 118,061,464 | |||||||||||
| Health Care—10.5% | |||||||||||
| 147,638 | Johnson & Johnson | 9,481,312 | |||||||||
| 220,559 | Merck & Co., Inc. | 11,345,556 | |||||||||
| 369,668 | Pfizer, Inc. | 9,781,415 | |||||||||
| 30,608,283 | |||||||||||
| Number of Shares | Value | ||||||||||
| Common Stocks (Continued) | |||||||||||
| Industrials—7.4% | |||||||||||
| 85,113 | Honeywell International, Inc. | $ | 4,611,422 | ||||||||
| 39,751 | Lockheed Martin Corp. | 3,821,661 | |||||||||
| 54,544 | Northrop Grumman Corp. | 4,016,620 | |||||||||
| 55,433 | PACCAR, Inc. | 4,655,264 | |||||||||
| 117,210 | Waste Management, Inc. | 4,384,826 | |||||||||
| 21,489,793 | |||||||||||
| Information Technology—4.8% | |||||||||||
| 96,908 | International Business Machines Corp. | 9,904,967 | |||||||||
| 227,010 | Xerox Corp.* | 4,199,685 | |||||||||
| 14,104,652 | |||||||||||
| Materials—4.1% | |||||||||||
| 76,600 | E.I. du Pont de Nemours & Co. | 3,766,422 | |||||||||
| 109,174 | International Paper Co. | 4,118,043 | |||||||||
| 63,019 | Nucor Corp. | 3,999,186 | |||||||||
| 11,883,651 | |||||||||||
| Telecommunication Services—6.6% | |||||||||||
| 255,968 | AT&T, Inc. | 9,911,080 | |||||||||
| 246,575 | Verizon Communications, Inc. | 9,414,234 | |||||||||
| 19,325,314 | |||||||||||
| Utilities—6.0% | |||||||||||
| 203,863 | Duke Energy Corp. | 4,183,269 | |||||||||
| 86,412 | Edison International | 4,523,668 | |||||||||
| 63,907 | FirstEnergy Corp. | 4,373,795 | |||||||||
| 84,972 | PG&E Corp. | 4,299,583 | |||||||||
| 17,380,315 | |||||||||||
| Total Investments (Cost $270,452,046)—100.0% | 291,988,288 | ||||||||||
| Other assets less liabilities—0.0% | 141,610 | ||||||||||
| Net Assets—100.0% | $ | 292,129,898 | |||||||||
* Non-income producing security.
COUNTRY BREAKDOWN
April 30, 2007 (Unaudited)
| Value | Net Assets | ||||||||||
| United States | $ | 287,797,488 | 98.6 | % | |||||||
| Cayman Islands | 4,190,800 | 1.4 | |||||||||
| Total investments | 291,988,288 | 100.0 | |||||||||
| Other assets less liabilities | 141,610 | 0.0 | |||||||||
| Net Assets | $ | 292,129,898 | 100.0 | % | |||||||
See Notes to Financial Statements.
38
Schedule of Investments
PowerShares Dynamic Mid Cap Growth Portfolio
April 30, 2007
| Number of Shares | Value | ||||||||||
| Common Stocks—99.9% | |||||||||||
| Consumer Discretionary—23.4% | |||||||||||
| 13,258 | Abercrombie & Fitch Co., Class A | $ | 1,082,648 | ||||||||
| 33,250 | American Eagle Outfitters, Inc. | 979,878 | |||||||||
| 139,619 | Bed Bath & Beyond, Inc.* | 5,688,078 | |||||||||
| 48,326 | Burger King Holdings, Inc. | 1,134,211 | |||||||||
| 208,693 | Clear Channel Outdoor Holdings, Inc., Class A* | 5,958,185 | |||||||||
| 103,384 | Garmin Ltd. (Cayman Islands) | 6,015,915 | |||||||||
| 10,239 | Harman International Industries, Inc. | 1,248,032 | |||||||||
| 12,859 | ITT Educational Services, Inc.* | 1,250,023 | |||||||||
| 23,587 | Men's Wearhouse (The), Inc. | 1,020,610 | |||||||||
| 18,868 | Phillips-Van Heusen | 1,054,721 | |||||||||
| 67,895 | Polo Ralph Lauren Corp. | 6,253,808 | |||||||||
| 30,990 | Ross Stores, Inc. | 1,027,319 | |||||||||
| 87,664 | Starwood Hotels & Resorts Worldwide, Inc. | 5,875,241 | |||||||||
| 208,767 | TJX Cos. (The), Inc. | 5,822,512 | |||||||||
| 44,411,181 | |||||||||||
| Consumer Staples—0.5% | |||||||||||
| 20,329 | NBTY, Inc.* | 1,004,456 | |||||||||
| Energy—4.7% | |||||||||||
| 116,179 | ENSCO International, Inc. | 6,550,172 | |||||||||
| 15,652 | FMC Technologies, Inc.* | 1,109,414 | |||||||||
| 23,300 | Grant Prideco, Inc.* | 1,200,882 | |||||||||
| 8,860,468 | |||||||||||
| Financials—12.4% | |||||||||||
| 37,403 | Brown & Brown, Inc. | 963,127 | |||||||||
| 164,324 | CB Richard Ellis Group, Inc., Class A* | 5,562,367 | |||||||||
| 36,576 | CBOT Holdings, Inc., Class A* | 6,900,795 | |||||||||
| 29,145 | Eaton Vance Corp. | 1,113,922 | |||||||||
| 23,295 | First Marblehead (The) Corp. | 844,444 | |||||||||
| 9,672 | Jones Lang LaSalle, Inc. | 1,039,643 | |||||||||
| 16,637 | SEI Investments Co. | 1,015,356 | |||||||||
| 122,625 | T. Rowe Price Group, Inc. | 6,092,010 | |||||||||
| 23,531,664 | |||||||||||
| Health Care—14.6% | |||||||||||
| 32,444 | Applera Corp. - Applied Biosystems Group | 1,013,551 | |||||||||
| 140,210 | Biomet, Inc. | 6,057,071 | |||||||||
| 32,464 | DENTSPLY International, Inc. | 1,084,622 | |||||||||
| 20,451 | Edwards Lifesciences Corp.* | 1,002,099 | |||||||||
| 75,589 | Express Scripts, Inc.* | 7,222,528 | |||||||||
| 97,661 | Humana, Inc.* | 6,176,081 | |||||||||
| 21,250 | Mentor Corp. | 826,838 | |||||||||
| 18,778 | Techne Corp.* | 1,107,339 | |||||||||
| 27,288 | VCA Antech, Inc.* | 1,075,966 | |||||||||
| 18,871 | Waters Corp.* | 1,121,504 | |||||||||
| 13,084 | WellCare Health Plans, Inc.* | 1,054,440 | |||||||||
| 27,742,039 | |||||||||||
| Number of Shares | Value | ||||||||||
| Common Stocks (Continued) | |||||||||||
| Industrials—10.1% | |||||||||||
| 17,891 | Acuity Brands, Inc. | $ | 1,057,716 | ||||||||
| 35,245 | Copart, Inc.* | 1,021,400 | |||||||||
| 26,620 | Herman Miller, Inc. | 915,994 | |||||||||
| 22,709 | Jacobs Engineering Group, Inc.* | 1,145,215 | |||||||||
| 16,650 | Manitowoc Co. (The), Inc. | 1,136,030 | |||||||||
| 20,647 | McDermott International, Inc. (Panama)* | 1,107,918 | |||||||||
| 60,520 | Precision Castparts Corp. | 6,300,738 | |||||||||
| 25,448 | Robert Half International, Inc. | 847,418 | |||||||||
| 86,820 | Rockwell Collins, Inc. | 5,701,469 | |||||||||
| 19,233,898 | |||||||||||
| Information Technology—22.7% | |||||||||||
| 16,797 | Alliance Data Systems Corp.* | 1,069,297 | |||||||||
| 31,175 | Amphenol Corp., Class A | 1,094,554 | |||||||||
| 184,851 | Atmel Corp.* | 983,407 | |||||||||
| 139,950 | Autodesk, Inc.* | 5,775,737 | |||||||||
| 88,481 | BEA Systems, Inc.* | 1,043,191 | |||||||||
| 33,043 | BMC Software, Inc.* | 1,069,602 | |||||||||
| 125,876 | Brocade Communications Systems, Inc.* | 1,229,809 | |||||||||
| 62,836 | Cognizant Technology Solutions Corp., Class A* | 5,617,538 | |||||||||
| 31,374 | Dolby Laboratories, Inc.* | 1,111,267 | |||||||||
| 16,903 | Factset Research Systems, Inc. | 1,039,704 | |||||||||
| 47,542 | Gartner, Inc.* | 1,199,485 | |||||||||
| 33,409 | McAfee, Inc.* | 1,085,458 | |||||||||
| 108,381 | MEMC Electronic Materials, Inc.* | 5,947,949 | |||||||||
| 11,760 | Mettler Toledo International, Inc.* | 1,148,011 | |||||||||
| 34,633 | MoneyGram International, Inc. | 984,616 | |||||||||
| 32,805 | Novellus Systems, Inc.* | 1,061,898 | |||||||||
| 182,038 | NVIDIA Corp.* | 5,987,229 | |||||||||
| 31,247 | Polycom, Inc.* | 1,040,525 | |||||||||
| 58,002 | QLogic Corp.* | 1,037,076 | |||||||||
| 40,098 | Synopsys, Inc.* | 1,109,111 | |||||||||
| 32,971 | Total System Services, Inc. | 1,024,079 | |||||||||
| 21,443 | Varian Semiconductor Equipment Associates, Inc.* | 1,422,958 | |||||||||
| 43,082,501 | |||||||||||
| Materials—7.4% | |||||||||||
| 55,130 | Allegheny Technologies, Inc. | 6,041,145 | |||||||||
| 135,543 | Ecolab, Inc. | 5,826,994 | |||||||||
| 17,014 | Greif, Inc., Class A | 945,978 | |||||||||
| 43,602 | Nalco Holding Co. | 1,158,941 | |||||||||
| 13,973,058 | |||||||||||
| Telecommunication Services—0.6% | |||||||||||
| 18,922 | Telephone & Data Systems, Inc. | 1,077,608 | |||||||||
See Notes to Financial Statements.
39
Schedule of Investments (Continued)
PowerShares Dynamic Mid Cap Growth Portfolio
April 30, 2007
| Number of Shares | Value | ||||||||||
| Common Stocks (Continued) | |||||||||||
| Utilities—3.5% | |||||||||||
| 124,084 | Allegheny Energy, Inc.* | $ | 6,633,530 | ||||||||
| Total Investments (Cost $171,435,629)—99.9% | 189,550,403 | ||||||||||
| Other assets less liabilities—0.1% | 243,656 | ||||||||||
| Net Assets—100.0% | $ | 189,794,059 | |||||||||
* Non-income producing security.
COUNTRY BREAKDOWN
April 30, 2007 (Unaudited)
| Value | Net Assets | ||||||||||
| United States | $ | 182,426,570 | 96.1 | % | |||||||
| Cayman Islands | 6,015,915 | 3.2 | |||||||||
| Panama | 1,107,918 | 0.6 | |||||||||
| Total investments | 189,550,403 | 99.9 | |||||||||
| Other assets less liabilities | 243,656 | 0.1 | |||||||||
| Net Assets | $ | 189,794,059 | 100.0 | % | |||||||
See Notes to Financial Statements.
40
Schedule of Investments
PowerShares Dynamic Mid Cap Value Portfolio
April 30, 2007
| Number of Shares | Value | ||||||||||
| Common Stocks—99.3% | |||||||||||
| Consumer Discretionary—19.0% | |||||||||||
| 10,493 | Autoliv, Inc. | $ | 610,168 | ||||||||
| 7,804 | BorgWarner, Inc. | 608,010 | |||||||||
| 67,745 | Genuine Parts Co. | 3,347,280 | |||||||||
| 22,509 | Hanesbrands, Inc.* | 598,514 | |||||||||
| 20,789 | Hasbro, Inc. | 657,140 | |||||||||
| 11,290 | International Speedway Corp., Class A | 557,726 | |||||||||
| 127,189 | Mattel, Inc. | 3,599,449 | |||||||||
| 107,914 | Newell Rubbermaid, Inc. | 3,309,722 | |||||||||
| 18,679 | Payless ShoeSource, Inc.* | 595,860 | |||||||||
| 48,939 | Sherwin-Williams (The) Co. | 3,120,840 | |||||||||
| 42,570 | VF Corp. | 3,738,073 | |||||||||
| 20,742,782 | |||||||||||
| Consumer Staples—8.9% | |||||||||||
| 134,164 | ConAgra Foods, Inc. | 3,297,751 | |||||||||
| 19,557 | Dean Foods Co. | 712,461 | |||||||||
| 6,962 | Energizer Holdings, Inc.* | 676,567 | |||||||||
| 12,052 | J.M. Smucker (The) Co. | 672,743 | |||||||||
| 8,364 | Loews Corp. - Carolina Group | 640,097 | |||||||||
| 15,482 | McCormick & Co., Inc. | 574,692 | |||||||||
| 56,794 | UST, Inc. | 3,219,084 | |||||||||
| 9,793,395 | |||||||||||
| Financials—29.3% | |||||||||||
| 9,000 | A.G. Edwards, Inc. | 652,050 | |||||||||
| 38,279 | AMBAC Financial Group, Inc. | 3,514,012 | |||||||||
| 16,790 | American Financial Group, Inc. | 592,183 | |||||||||
| 11,290 | Assurant, Inc. | 649,514 | |||||||||
| 11,441 | Bank of Hawaii Corp. | 605,229 | |||||||||
| 81,553 | CNA Financial Corp.* | 3,806,079 | |||||||||
| 54,368 | Comerica, Inc. | 3,365,923 | |||||||||
| 10,869 | Erie Indemnity Co., Class A | 571,166 | |||||||||
| 6,160 | Everest Re Group, Ltd. (Bermuda) | 619,942 | |||||||||
| 16,358 | Federated Investors, Inc., Class B | 624,221 | |||||||||
| 27,583 | M&T Bank Corp. | 3,071,091 | |||||||||
| 62,355 | Nationwide Financial Services, Inc., Class A | 3,562,341 | |||||||||
| 15,575 | Odyssey Re Holdings Corp. | 652,593 | |||||||||
| 26,620 | Old Republic International Corp. | 566,207 | |||||||||
| 8,599 | PartnerRe Ltd. (Bermuda) | 619,300 | |||||||||
| 12,812 | PMI Group (The), Inc. | 620,998 | |||||||||
| 13,437 | Protective Life Corp. | 630,195 | |||||||||
| 10,379 | Reinsurance Group of America, Inc. | 646,716 | |||||||||
| 8,928 | Safeco Corp. | 595,855 | |||||||||
| 22,328 | TCF Financial Corp. | 604,642 | |||||||||
| 9,367 | Torchmark Corp. | 639,766 | |||||||||
| 12,766 | Unitrin, Inc. | 601,917 | |||||||||
| 17,959 | W.R. Berkley Corp. | 583,488 | |||||||||
| 46,985 | XL Capital Ltd., Class A (Cayman Islands) | 3,663,890 | |||||||||
| 32,059,318 | |||||||||||
| Number of Shares | Value | ||||||||||
| Common Stocks (Continued) | |||||||||||
| Health Care—3.9% | |||||||||||
| 23,804 | CIGNA Corp. | $ | 3,703,664 | ||||||||
| 10,117 | Hillenbrand Industries, Inc. | 618,655 | |||||||||
| 4,322,319 | |||||||||||
| Industrials—18.7% | |||||||||||
| 8,969 | Avery Dennison Corp. | 557,872 | |||||||||
| 8,426 | Cummins, Inc. | 776,540 | |||||||||
| 40,756 | Eaton Corp. | 3,635,843 | |||||||||
| 56,187 | ITT Corp. | 3,585,292 | |||||||||
| 9,269 | Kennametal, Inc. | 654,021 | |||||||||
| 39,020 | Parker Hannifin Corp. | 3,595,303 | |||||||||
| 71,402 | Pitney Bowes, Inc. | 3,427,296 | |||||||||
| 88,920 | R.R. Donnelley & Sons Co. | 3,574,584 | |||||||||
| 8,911 | Teleflex, Inc. | 640,077 | |||||||||
| 20,446,828 | |||||||||||
| Information Technology—9.0% | |||||||||||
| 46,944 | Avaya, Inc.* | 606,516 | |||||||||
| 118,232 | Electronic Data Systems Corp. | 3,457,104 | |||||||||
| 15,180 | Fair Isaac Corp. | 542,078 | |||||||||
| 30,061 | Ingram Micro, Inc., Class A* | 589,797 | |||||||||
| 9,590 | Lexmark International, Inc., Class A* | 522,655 | |||||||||
| 71,062 | NCR Corp.* | 3,581,525 | |||||||||
| 30,240 | Western Digital Corp.* | 534,643 | |||||||||
| 9,834,318 | |||||||||||
| Materials—7.5% | |||||||||||
| 17,745 | Bemis Co., Inc. | 589,489 | |||||||||
| 20,564 | Celanese Corp., Series A | 682,108 | |||||||||
| 10,335 | Cleveland-Cliffs, Inc. | 716,112 | |||||||||
| 7,926 | FMC Corp. | 609,747 | |||||||||
| 28,989 | Hercules, Inc.* | 546,153 | |||||||||
| 14,348 | Sigma-Aldrich Corp. | 603,764 | |||||||||
| 16,120 | Sonoco Products Co. | 687,357 | |||||||||
| 36,794 | United States Steel Corp. | 3,736,062 | |||||||||
| 8,170,792 | |||||||||||
| Telecommunication Services—0.6% | |||||||||||
| 13,249 | CenturyTel, Inc. | 610,116 | |||||||||
| Utilities—2.4% | |||||||||||
| 12,777 | Energen Corp. | 716,151 | |||||||||
| 14,263 | ONEOK, Inc. | 690,472 | |||||||||
| 22,526 | Pepco Holdings, Inc. | 664,967 | |||||||||
| 12,448 | Wisconsin Energy Corp. | 607,338 | |||||||||
| 2,678,928 | |||||||||||
| Total Common Stocks (Cost $98,634,795) | 108,658,796 | ||||||||||
See Notes to Financial Statements.
41
Schedule of Investments (Continued)
PowerShares Dynamic Mid Cap Value Portfolio
April 30, 2007
| Number of Shares | Value | ||||||||||
| Money Market Fund—0.2% | |||||||||||
| 191,310 | Liquid Assets Portfolio Private Class** (Cost $191,310) | $ | 191,310 | ||||||||
| Total Investments (Cost $98,826,105)—99.5% | 108,850,106 | ||||||||||
| Other assets less liabilities—0.5% | 506,223 | ||||||||||
| Net Assets—100.0% | $ | 109,356,329 | |||||||||
* Non-income producing security.
** Affiliated investment.
COUNTRY BREAKDOWN
April 30, 2007 (Unaudited)
| Value | Net Assets | ||||||||||
| United States | $ | 103,946,974 | 95.0 | % | |||||||
| Cayman Islands | 3,663,890 | 3.4 | |||||||||
| Bermuda | 1,239,242 | 1.1 | |||||||||
| Total investments | 108,850,106 | 99.5 | |||||||||
| Other assets less liabilities | 506,223 | 0.5 | |||||||||
| Net Assets | $ | 109,356,329 | 100.0 | % | |||||||
See Notes to Financial Statements.
42
Schedule of Investments
PowerShares Dynamic Small Cap Growth Portfolio
April 30, 2007
| Number of Shares | Value | ||||||||||
| Common Stocks—100.1% | |||||||||||
| Consumer Discretionary—26.6% | |||||||||||
| 51,137 | Aaron Rents, Inc. | $ | 1,450,757 | ||||||||
| 37,630 | Aeropostale, Inc.* | 1,548,474 | |||||||||
| 5,810 | Arbitron, Inc. | 286,317 | |||||||||
| 39,343 | Brown Shoe Co., Inc. | 1,061,474 | |||||||||
| 9,620 | Build-A-Bear-Workshop, Inc.* | 265,031 | |||||||||
| 10,839 | Carter's, Inc.* | 283,982 | |||||||||
| 8,514 | Charlotte Russe Holding, Inc.* | 232,688 | |||||||||
| 25,360 | Children's Place Retail Stores (The), Inc.* | 1,340,783 | |||||||||
| 8,749 | Coinstar, Inc.* | 272,006 | |||||||||
| 4,157 | Deckers Outdoor Corp.* | 314,810 | |||||||||
| 49,757 | DeVry, Inc. | 1,641,483 | |||||||||
| 34,601 | DSW, Inc., Class A* | 1,341,135 | |||||||||
| 13,270 | GSI Commerce, Inc.* | 293,267 | |||||||||
| 6,718 | Gymboree (The) Corp.* | 256,493 | |||||||||
| 8,225 | Hibbett Sports Goods, Inc.* | 239,759 | |||||||||
| 26,793 | Morningstar, Inc.* | 1,395,112 | |||||||||
| 42,013 | Pinnacle Entertainment, Inc.* | 1,179,725 | |||||||||
| 7,146 | Skechers U.S.A., Inc., Class A* | 224,384 | |||||||||
| 11,725 | Strayer Education, Inc. | 1,457,886 | |||||||||
| 74,873 | Triarc Cos., Inc., Class B | 1,218,184 | |||||||||
| 16,303,750 | |||||||||||
| Consumer Staples—0.8% | |||||||||||
| 19,020 | Playtex Products, Inc.* | 289,484 | |||||||||
| 4,303 | USANA Health Sciences, Inc.* | 171,432 | |||||||||
| 460,916 | |||||||||||
| Energy—0.9% | |||||||||||
| 18,755 | Input/Output, Inc.* | 262,382 | |||||||||
| 7,172 | NATCO Group, Inc., Class A* | 273,971 | |||||||||
| 536,353 | |||||||||||
| Financials—10.8% | |||||||||||
| 31,197 | Cohen & Steers, Inc. | 1,600,718 | |||||||||
| 23,246 | GFI Group, Inc.* | 1,609,786 | |||||||||
| 28,981 | International Securities Exchange Holdings, Inc. | 1,932,743 | |||||||||
| 32,979 | Investment Technology Group, Inc.* | 1,247,925 | |||||||||
| 8,543 | Penson Worldwide, Inc.* | 229,123 | |||||||||
| 6,620,295 | |||||||||||
| Health Care—18.3% | |||||||||||
| 41,178 | AMERIGROUP Corp.* | 1,158,337 | |||||||||
| 9,350 | AMN Healthcare Services, Inc.* | 227,673 | |||||||||
| 12,122 | Conceptus Inc* | 250,683 | |||||||||
| 7,940 | CorVel Corp.* | 215,889 | |||||||||
| 13,370 | Cross Country Healthcare, Inc.* | 263,255 | |||||||||
| 4,140 | Dionex Corp.* | 285,660 | |||||||||
| 10,340 | Emergency Medical Services Corp., Class A* | 346,183 | |||||||||
| 38,800 | Incyte Corp.* | 299,148 | |||||||||
| 5,830 | LCA-Vision, Inc. | 244,685 | |||||||||
| 8,780 | MedCath Corp.* | 260,942 | |||||||||
| 52,061 | Medicines (The) Co.* | 1,185,950 | |||||||||
| Number of Shares | Value | ||||||||||
| Common Stocks (Continued) | |||||||||||
| 9,556 | Meridian Bioscience, Inc. | $ | 284,100 | ||||||||
| 7,710 | Myriad Genetics, Inc.* | 281,800 | |||||||||
| 10,380 | Noven Pharmaceuticals, Inc.* | 242,996 | |||||||||
| 12,270 | PSS World Medical, Inc.* | 246,627 | |||||||||
| 12,250 | Regeneron Pharmaceuticals, Inc.* | 333,200 | |||||||||
| 11,317 | Sciele Pharma, Inc.* | 279,756 | |||||||||
| 35,393 | Sunrise Senior Living, Inc.* | 1,355,198 | |||||||||
| 81,475 | Valeant Pharmaceuticals International | 1,468,179 | |||||||||
| 14,738 | ViroPharma, Inc.* | 222,249 | |||||||||
| 30,460 | West Pharmaceutical Services, Inc. | 1,515,994 | |||||||||
| 11,886 | Wright Medical Group, Inc.* | 280,747 | |||||||||
| 11,249,251 | |||||||||||
| Industrials—13.1% | |||||||||||
| 7,040 | Administaff, Inc. | 233,658 | |||||||||
| 4,900 | Advisory Board (The) Co.* | 232,652 | |||||||||
| 2,740 | AMREP Corp. | 165,112 | |||||||||
| 11,344 | Cenveo, Inc.* | 290,974 | |||||||||
| 5,032 | Clean Harbors, Inc.* | 234,089 | |||||||||
| 4,909 | CRA International, Inc.* | 253,157 | |||||||||
| 8,843 | Healthcare Services Group, Inc. | 247,604 | |||||||||
| 5,600 | Heidrick & Struggles International, Inc.* | 264,208 | |||||||||
| 8,583 | Horizon Lines, Inc., Class A | 291,908 | |||||||||
| 7,894 | Hub Group, Inc., Class A* | 284,184 | |||||||||
| 7,926 | II-VI, Inc.* | 214,715 | |||||||||
| 10,662 | InfraSource Services, Inc.* | 355,898 | |||||||||
| 11,260 | Knoll, Inc. | 261,457 | |||||||||
| 10,810 | Korn/Ferry International* | 254,792 | |||||||||
| 2,251 | Middleby (The) Corp.* | 309,017 | |||||||||
| 13,550 | Orbital Sciences Corp.* | 282,789 | |||||||||
| 45,313 | Owens Corning, Inc.* | 1,388,843 | |||||||||
| 7,120 | Perini Corp.* | 303,312 | |||||||||
| 7,920 | RBC Bearings, Inc.* | 301,039 | |||||||||
| 7,750 | Resources Connection, Inc.* | 233,817 | |||||||||
| 43,259 | TeleTech Holdings, Inc.* | 1,632,162 | |||||||||
| 8,035,387 | |||||||||||
| Information Technology—25.5% | |||||||||||
| 12,950 | Advanced Energy Industries, Inc.* | 317,275 | |||||||||
| 8,048 | Ansoft Corp.* | 259,870 | |||||||||
| 11,416 | Blackbaud, Inc. | 252,065 | |||||||||
| 17,940 | C-COR, Inc.* | 221,021 | |||||||||
| 36,810 | CommScope, Inc.* | 1,717,187 | |||||||||
| 7,260 | Comtech Telecommunications Corp.* | 274,791 | |||||||||
| 29,080 | Harmonic, Inc.* | 240,492 | |||||||||
| 16,240 | Interwoven, Inc.* | 247,985 | |||||||||
| 11,091 | j2 Global Communications, Inc.* | 318,977 | |||||||||
| 9,112 | Manhattan Associates, Inc.* | 263,519 | |||||||||
| 7,296 | ManTech International Corp., Class A* | 223,841 | |||||||||
| 80,210 | Mentor Graphics Corp.* | 1,297,798 | |||||||||
| 11,257 | MicroStrategy, Inc., Class A* | 1,280,596 | |||||||||
| 9,289 | NETGEAR, Inc.* | 312,203 | |||||||||
| 12,760 | NetRatings, Inc.* | 265,536 | |||||||||
See Notes to Financial Statements.
43
Schedule of Investments (Continued)
PowerShares Dynamic Small Cap Growth Portfolio
April 30, 2007
| Number of Shares | Value | ||||||||||
| Common Stocks (Continued) | |||||||||||
| 171,900 | RealNetworks, Inc.* | $ | 1,297,845 | ||||||||
| 10,000 | Synaptics, Inc.* | 299,600 | |||||||||
| 6,840 | Syntel, Inc. | 239,810 | |||||||||
| 33,210 | Tessera Technologies, Inc.* | 1,421,056 | |||||||||
| 43,270 | THQ, Inc.* | 1,443,920 | |||||||||
| 155,737 | TIBCO Software, Inc.* | 1,420,321 | |||||||||
| 30,482 | WebEx Communications, Inc.* | 1,729,549 | |||||||||
| 11,728 | Websense, Inc.* | 289,799 | |||||||||
| 15,635,056 | |||||||||||
| Materials—1.8% | |||||||||||
| 31,956 | Hecla Mining Co.* | 281,532 | |||||||||
| 4,855 | Innospec, Inc. | 260,665 | |||||||||
| 14,910 | Myers Industries, Inc. | 334,730 | |||||||||
| 17,419 | Wausau Paper Corp. | 234,460 | |||||||||
| 1,111,387 | |||||||||||
| Telecommunication Services—2.3% | |||||||||||
| 24,428 | Golden Telecom, Inc. | 1,431,725 | |||||||||
| Total Investments (Cost $56,727,751)—100.1% | 61,384,120 | ||||||||||
| Liabilities in excess of other assets—(0.1%) | (37,389 | ) | |||||||||
| Net Assets—100.0% | $ | 61,346,731 | |||||||||
* Non-income producing security.
See Notes to Financial Statements.
44
Schedule of Investments
PowerShares Dynamic Small Cap Value Portfolio
April 30, 2007
| Number of Shares | Value | ||||||||||
| Common Stocks—100.0% | |||||||||||
| Consumer Discretionary—13.9% | |||||||||||
| 20,437 | American Greetings Corp., Class A | $ | 520,122 | ||||||||
| 79,513 | Ameristar Casinos, Inc. | 2,414,015 | |||||||||
| 18,426 | Asbury Automotive Group, Inc. | 530,116 | |||||||||
| 141,948 | Belo Corp., Class A | 2,735,338 | |||||||||
| 13,359 | Bob Evans Farms, Inc. | 490,275 | |||||||||
| 13,842 | Buckle (The), Inc. | 493,052 | |||||||||
| 10,471 | CBRL Group, Inc. | 466,797 | |||||||||
| 45,485 | Coinmach Service Corp., Class A | 481,231 | |||||||||
| 84,637 | Domino's Pizza, Inc. | 2,729,543 | |||||||||
| 20,784 | Helen of Troy Ltd. (Bermuda)* | 471,797 | |||||||||
| 8,521 | IHOP Corp. | 502,057 | |||||||||
| 36,928 | Journal Communications, Inc., Class A | 498,159 | |||||||||
| 63,490 | Regis Corp. | 2,427,223 | |||||||||
| 33,766 | Sinclair Broadcast Group, Inc., Class A | 551,399 | |||||||||
| 61,319 | Stewart Enterprises, Inc., Class A | 461,119 | |||||||||
| 20,617 | Tupperware Brands Corp. | 579,750 | |||||||||
| 16,351,993 | |||||||||||
| Consumer Staples—0.5% | |||||||||||
| 9,036 | Universal Corp. | 566,376 | |||||||||
| Energy—12.1% | |||||||||||
| 195,951 | Global Industries, Ltd.* | 4,067,943 | |||||||||
| 72,296 | Grey Wolf, Inc.* | 517,639 | |||||||||
| 13,077 | Gulfmark Offshore, Inc.* | 626,388 | |||||||||
| 72,361 | St. Mary Land & Exploration Co. | 2,649,860 | |||||||||
| 96,369 | Western Refining, Inc. | 3,818,140 | |||||||||
| 59,539 | Whiting Petroleum Corp.* | 2,620,907 | |||||||||
| 14,300,877 | |||||||||||
| Financials—45.2% | |||||||||||
| 10,971 | Advanta Corp., Class B | 502,691 | |||||||||
| 26,111 | Alfa Corp. | 468,431 | |||||||||
| 14,663 | AMCORE Financial, Inc. | 419,508 | |||||||||
| 13,420 | Argonaut Group, Inc.* | 451,046 | |||||||||
| 9,981 | BancFirst Corp. | 427,287 | |||||||||
| 104,567 | BancorpSouth, Inc. | 2,569,211 | |||||||||
| 14,441 | Capital City Bank Group, Inc. | 430,486 | |||||||||
| 16,386 | Chemical Financial Corp. | 437,998 | |||||||||
| 15,633 | Chittenden Corp. | 454,295 | |||||||||
| 12,597 | City Holding Co. | 478,308 | |||||||||
| 22,859 | CNA Surety Corp.* | 471,810 | |||||||||
| 90,258 | Commerce Group (The), Inc. | 2,943,313 | |||||||||
| 22,115 | Community Bank System, Inc. | 453,357 | |||||||||
| 66,065 | Delphi Financial Group, Inc., Class A | 2,820,975 | |||||||||
| 40,046 | Downey Financial Corp. | 2,681,080 | |||||||||
| 12,377 | FBL Financial Group, Inc., Class A | 479,485 | |||||||||
| 11,537 | First Financial Bankshares, Inc. | 446,482 | |||||||||
| 185,598 | First Niagara Financial Group, Inc. | 2,524,133 | |||||||||
| 12,851 | GAMCO Investors, Inc., Class A | 586,263 | |||||||||
| 19,649 | Glacier Bancorp, Inc. | 422,061 | |||||||||
| 58,631 | Hancock Holding Co. | 2,293,645 | |||||||||
| Number of Shares | Value | ||||||||||
| Common Stocks (Continued) | |||||||||||
| 14,269 | Harleysville Group, Inc. | $ | 435,775 | ||||||||
| 23,440 | Horace Mann Educators Corp. | 493,178 | |||||||||
| 10,442 | Infinity Property & Casualty Corp. | 485,657 | |||||||||
| 88,086 | International Bancshares Corp. | 2,532,472 | |||||||||
| 91,606 | IPC Holdings Ltd. (Bermuda) | 2,746,348 | |||||||||
| 9,431 | Navigators Group, Inc.* | 481,830 | |||||||||
| 39,605 | Ocwen Financial Corp.* | 564,767 | |||||||||
| 87,484 | Ohio Casualty Corp. | 2,767,994 | |||||||||
| 5,096 | Park National Corp. | 452,372 | |||||||||
| 186,749 | Phoenix (The) Cos., Inc. | 2,782,560 | |||||||||
| 58,332 | Potlatch Corp. | 2,531,025 | |||||||||
| 52,271 | ProAssurance Corp.* | 2,814,271 | |||||||||
| 27,303 | Provident Financial Services, Inc. | 467,973 | |||||||||
| 8,685 | RLI Corp. | 483,668 | |||||||||
| 10,712 | Safety Insurance Group, Inc. | 429,123 | |||||||||
| 19,957 | Selective Insurance Group, Inc. | 520,479 | |||||||||
| 14,797 | State Auto Financial Corp. | 444,650 | |||||||||
| 22,225 | Sterling Financial Corp. | 370,046 | |||||||||
| 91,113 | Trustmark Corp. | 2,424,517 | |||||||||
| 69,624 | UMB Financial Corp. | 2,723,691 | |||||||||
| 20,930 | United America Indemnity Ltd., Class A (Cayman Islands)* | 522,831 | |||||||||
| 13,692 | United Fire & Casualty Co. | 503,181 | |||||||||
| 53,687 | Zenith National Insurance Corp. | 2,483,024 | |||||||||
| 53,223,297 | |||||||||||
| Health Care—3.4% | |||||||||||
| 15,193 | Apria Healthcare Group, Inc.* | 482,226 | |||||||||
| 8,975 | Biosite, Inc.* | 830,187 | |||||||||
| 61,893 | Magellan Health Services, Inc.* | 2,655,210 | |||||||||
| 3,967,623 | |||||||||||
| Industrials—12.9% | |||||||||||
| 11,616 | American Woodmark Corp. | 400,868 | |||||||||
| 53,127 | Armstrong World Industries, Inc.* | 2,709,477 | |||||||||
| 8,332 | Cascade Corp. | 516,334 | |||||||||
| 6,554 | Consolidated Graphics, Inc.* | 493,189 | |||||||||
| 81,695 | Deluxe Corp. | 3,092,156 | |||||||||
| 9,558 | Dollar Thrifty Automotive Group, Inc.* | 448,079 | |||||||||
| 19,103 | Ennis, Inc. | 467,068 | |||||||||
| 185,852 | IKON Office Solutions, Inc. | 2,780,346 | |||||||||
| 9,793 | John H. Harland Co. | 515,112 | |||||||||
| 25,446 | Labor Ready, Inc.* | 552,178 | |||||||||
| 17,291 | Pacer International, Inc. | 441,785 | |||||||||
| 148,093 | SAIC, Inc.* | 2,708,621 | |||||||||
| 15,125,213 | |||||||||||
| Information Technology—7.1% | |||||||||||
| 22,364 | Agilysys, Inc. | 470,315 | |||||||||
| 19,103 | Covansys Corp.* | 638,040 | |||||||||
| 19,471 | CSG Systems International, Inc.* | 521,434 | |||||||||
| 26,487 | Emulex Corp.* | 555,697 | |||||||||
| 234,281 | Gateway, Inc.* | 513,076 | |||||||||
See Notes to Financial Statements.
45
Schedule of Investments (Continued)
PowerShares Dynamic Small Cap Value Portfolio
April 30, 2007
| Number of Shares | Value | ||||||||||
| Common Stocks (Continued) | |||||||||||
| 24,627 | Global Imaging Systems, Inc.* | $ | 711,474 | ||||||||
| 21,737 | Paxar Corp.* | 652,327 | |||||||||
| 157,951 | Perot Systems Corp., Class A* | 2,827,323 | |||||||||
| 31,063 | Photronics, Inc.* | 467,498 | |||||||||
| 71,262 | Skyworks Solutions, Inc.* | 490,995 | |||||||||
| 35,991 | United Online, Inc. | 519,350 | |||||||||
| 8,367,529 | |||||||||||
| Materials—4.1% | |||||||||||
| 104,324 | H.B. Fuller Co. | 2,667,565 | |||||||||
| 12,089 | Metal Management, Inc. | 581,118 | |||||||||
| 9,349 | OM Group, Inc.* | 491,103 | |||||||||
| 12,554 | Quanex Corp. | 540,199 | |||||||||
| 19,403 | Sensient Technologies Corp. | 507,970 | |||||||||
| 4,787,955 | |||||||||||
| Utilities—0.8% | |||||||||||
| 10,941 | Northwest Natural Gas Co. | 555,913 | |||||||||
| 12,843 | UIL Holdings Corp. | 438,588 | |||||||||
| 994,501 | |||||||||||
| Total Investments (Cost $112,586,475)—100.0% | 117,685,364 | ||||||||||
| Liabilities in excess of other assets—(0.0%) | (5,502 | ) | |||||||||
| Net Assets—100.0% | $ | 117,679,862 | |||||||||
* Non-income producing security.
COUNTRY BREAKDOWN
April 30, 2007 (Unaudited)
| Value | Net Assets | ||||||||||
| United States | $ | 113,944,388 | 96.8 | % | |||||||
| Bermuda | 3,218,145 | 2.7 | |||||||||
| Cayman Islands | 522,831 | 0.5 | |||||||||
| Total investments | 117,685,364 | 100.0 | |||||||||
| Liabilities in excess of other assets | (5,502 | ) | (0.0 | ) | |||||||
| Net Assets | $ | 117,679,862 | 100.0 | % | |||||||
See Notes to Financial Statements.
46
Schedule of Investments
PowerShares Dynamic Large Cap Portfolio
April 30, 2007
| Number of Shares | Value | ||||||||||
| Common Stocks—100.5% | |||||||||||
| Consumer Discretionary—8.5% | |||||||||||
| 1,522 | Coach, Inc.* | $ | 74,319 | ||||||||
| 904 | J.C. Penney Co., Inc. | 71,497 | |||||||||
| 1,048 | Kohl's Corp.* | 77,594 | |||||||||
| 1,536 | Marriott International, Inc., Class A | 69,443 | |||||||||
| 1,139 | McGraw-Hill (The) Cos., Inc. | 74,639 | |||||||||
| 1,408 | NIKE, Inc., Class B | 75,835 | |||||||||
| 1,305 | Nordstrom, Inc. | 71,671 | |||||||||
| 715 | Omnicom Group, Inc. | 74,868 | |||||||||
| 2,797 | Staples, Inc. | 69,366 | |||||||||
| 5,049 | Walt Disney (The) Co. | 176,613 | |||||||||
| 1,257 | Yum! Brands, Inc. | 77,758 | |||||||||
| 913,603 | |||||||||||
| Consumer Staples—11.8% | |||||||||||
| 2,767 | Altria Group, Inc. | 190,702 | |||||||||
| 1,816 | Campbell Soup Co. | 71,006 | |||||||||
| 3,754 | Coca-Cola (The) Co. | 195,920 | |||||||||
| 1,112 | Colgate-Palmolive Co. | 75,327 | |||||||||
| 1,329 | General Mills, Inc. | 79,607 | |||||||||
| 1,611 | H.J. Heinz Co. | 75,894 | |||||||||
| 1,086 | Kimberly-Clark Corp. | 77,291 | |||||||||
| 2,747 | PepsiCo, Inc. | 181,549 | |||||||||
| 2,738 | Procter & Gamble (The) Co. | 176,081 | |||||||||
| 1,196 | Reynolds American, Inc. | 76,855 | |||||||||
| 2,162 | Safeway, Inc. | 78,481 | |||||||||
| 1,278,713 | |||||||||||
| Energy—3.6% | |||||||||||
| 2,359 | Exxon Mobil Corp. | 187,257 | |||||||||
| 2,747 | Schlumberger Ltd. (Netherlands) | 202,811 | |||||||||
| 390,068 | |||||||||||
| Financials—31.8% | |||||||||||
| 1,321 | ACE Ltd. (Cayman Islands) | 78,547 | |||||||||
| 1,565 | AFLAC, Inc. | 80,347 | |||||||||
| 1,242 | Allstate (The) Corp. | 77,401 | |||||||||
| 3,058 | American Express Co. | 185,529 | |||||||||
| 2,579 | American International Group, Inc. | 180,298 | |||||||||
| 1,213 | Ameriprise Financial, Inc. | 72,137 | |||||||||
| 3,357 | Bank of America Corp. | 170,871 | |||||||||
| 1,788 | Bank of New York (The) Co., Inc. | 72,378 | |||||||||
| 3,954 | Charles Schwab (The) Corp. | 75,600 | |||||||||
| 1,435 | Chubb (The) Corp. | 77,246 | |||||||||
| 1,873 | Fifth Third Bancorp | 76,025 | |||||||||
| 614 | Franklin Resources, Inc. | 80,624 | |||||||||
| 819 | Goldman Sachs Group (The), Inc. | 179,042 | |||||||||
| 788 | Hartford Financial Services Group (The), Inc. | 79,746 | |||||||||
| 3,477 | JPMorgan Chase & Co. | 181,152 | |||||||||
| 1,945 | KeyCorp | 69,398 | |||||||||
| 962 | Lehman Brothers Holdings, Inc. | 72,419 | |||||||||
| 1,079 | Lincoln National Corp. | 76,771 | |||||||||
| Number of Shares | Value | ||||||||||
| Common Stocks (Continued) | |||||||||||
| 1,724 | Loews Corp. | $ | 81,580 | ||||||||
| 1,685 | Mellon Financial Corp. | 72,337 | |||||||||
| 1,993 | Merrill Lynch & Co, Inc. | 179,828 | |||||||||
| 1,164 | MetLife, Inc. | 76,475 | |||||||||
| 1,128 | Moody's Corp. | 74,583 | |||||||||
| 2,190 | Morgan Stanley | 183,982 | |||||||||
| 1,008 | PNC Financial Services Group, Inc. | 74,693 | |||||||||
| 1,208 | Principal Financial Group, Inc. | 76,696 | |||||||||
| 3,266 | Progressive (The) Corp. | 75,347 | |||||||||
| 823 | Prudential Financial, Inc. | 78,185 | |||||||||
| 1,099 | State Street Corp. | 75,688 | |||||||||
| 875 | SunTrust Banks, Inc. | 73,868 | |||||||||
| 1,434 | Travelers Cos., (The), Inc. | 77,579 | |||||||||
| 4,855 | U.S. Bancorp | 166,769 | |||||||||
| 4,979 | Wells Fargo & Co. | 178,696 | |||||||||
| 3,431,837 | |||||||||||
| Health Care—14.1% | |||||||||||
| 1,651 | Aetna, Inc. | 77,399 | |||||||||
| 1,527 | Baxter International, Inc. | 86,474 | |||||||||
| 979 | Becton, Dickinson & Co. | 77,038 | |||||||||
| 1,398 | Forest Laboratories, Inc.* | 74,388 | |||||||||
| 2,766 | Johnson & Johnson | 177,632 | |||||||||
| 1,326 | McKesson Corp. | 78,009 | |||||||||
| 4,132 | Merck & Co., Inc. | 212,549 | |||||||||
| 6,925 | Pfizer, Inc. | 183,235 | |||||||||
| 3,193 | Schering-Plough Corp. | 101,314 | |||||||||
| 3,345 | UnitedHealth Group, Inc. | 177,486 | |||||||||
| 3,503 | Wyeth | 194,416 | |||||||||
| 889 | Zimmer Holdings, Inc.* | 80,437 | |||||||||
| 1,520,377 | |||||||||||
| Industrials—11.6% | |||||||||||
| 998 | 3M Co. | 82,604 | |||||||||
| 1,966 | Boeing Co. | 182,839 | |||||||||
| 1,027 | Danaher Corp. | 73,112 | |||||||||
| 962 | General Dynamics Corp. | 75,517 | |||||||||
| 5,055 | General Electric Co. | 186,328 | |||||||||
| 1,595 | Honeywell International, Inc. | 86,417 | |||||||||
| 745 | Lockheed Martin Corp. | 71,624 | |||||||||
| 1,022 | Northrop Grumman Corp. | 75,260 | |||||||||
| 1,387 | Raytheon Co. | 74,260 | |||||||||
| 732 | Union Pacific Corp. | 83,631 | |||||||||
| 2,626 | United Technologies Corp. | 176,283 | |||||||||
| 2,195 | Waste Management, Inc. | 82,115 | |||||||||
| 1,249,990 | |||||||||||
| Information Technology—11.1% | |||||||||||
| 1,992 | Apple, Inc.* | 198,801 | |||||||||
| 6,449 | Cisco Systems, Inc.* | 172,446 | |||||||||
| 4,347 | Hewlett-Packard Co. | 183,183 | |||||||||
| 1,816 | International Business Machines Corp. | 185,613 | |||||||||
| 6,139 | Microsoft Corp. | 183,802 | |||||||||
See Notes to Financial Statements.
47
Schedule of Investments (Continued)
PowerShares Dynamic Large Cap Portfolio
April 30, 2007
| Number of Shares | Value | ||||||||||
| Common Stocks (Continued) | |||||||||||
| 10,547 | Oracle Corp.* | $ | 198,284 | ||||||||
| 4,253 | Xerox Corp.* | 78,681 | |||||||||
| 1,200,810 | |||||||||||
| Materials—3.5% | |||||||||||
| 980 | Air Products & Chemicals, Inc. | 74,970 | |||||||||
| 1,434 | E.I. du Pont de Nemours & Co. | 70,510 | |||||||||
| 2,046 | International Paper Co. | 77,175 | |||||||||
| 1,181 | Nucor Corp. | 74,946 | |||||||||
| 1,175 | Praxair, Inc. | 75,846 | |||||||||
| 373,447 | |||||||||||
| Utilities—4.5% | |||||||||||
| 3,413 | AES (The) Corp.* | 75,052 | |||||||||
| 3,819 | Duke Energy Corp. | 78,366 | |||||||||
| 1,620 | Edison International | 84,807 | |||||||||
| 1,591 | PG&E Corp. | 80,505 | |||||||||
| 1,013 | Public Service Enterprise Group, Inc. | 87,573 | |||||||||
| 1,267 | TXU Corp. | 83,090 | |||||||||
| 489,393 | |||||||||||
| Total Common Stocks (Cost $10,212,001) | 10,848,238 | ||||||||||
| Money Market Fund—0.4% | |||||||||||
| 43,653 | Liquid Assets Portfolio Private Class** (Cost $43,653) | 43,653 | |||||||||
| Total Investments (Cost $10,255,654)—100.9% | 10,891,891 | ||||||||||
| Liabilities in excess of other assets—(0.9%) | (93,414 | ) | |||||||||
| Net Assets—100.0% | $ | 10,798,477 | |||||||||
* Non-income producing security.
** Affiliated investment.
COUNTRY BREAKDOWN
April 30, 2007 (Unaudited)
| Value | Net Assets | ||||||||||
| United States | $ | 10,610,533 | 98.3 | % | |||||||
| Netherlands | 202,811 | 1.9 | |||||||||
| Cayman Islands | 78,547 | 0.7 | |||||||||
| Total Investments | 10,891,891 | 100.9 | |||||||||
| Liabilities in excess of other assets | (93,414 | ) | (0.9 | ) | |||||||
| Net Assets | $ | 10,798,477 | 100.0 | % | |||||||
See Notes to Financial Statements.
48
Schedule of Investments
PowerShares Dynamic Mid Cap Portfolio
April 30, 2007
| Number of Shares | Value | ||||||||||
| Common Stocks—100.3% | |||||||||||
| Consumer Discretionary—18.7% | |||||||||||
| 989 | American Eagle Outfitters, Inc. | $ | 29,146 | ||||||||
| 542 | Autoliv, Inc. | 31,517 | |||||||||
| 1,350 | AutoZone, Inc.* | 179,604 | |||||||||
| 893 | Brinker International, Inc. | 27,772 | |||||||||
| 899 | Claire's Stores, Inc. | 29,280 | |||||||||
| 3,639 | E.W. Scripps Co., Class A | 157,569 | |||||||||
| 3,497 | Genuine Parts Co. | 172,787 | |||||||||
| 1,162 | Hanesbrands, Inc.* | 30,898 | |||||||||
| 305 | Harman International Industries, Inc. | 37,176 | |||||||||
| 1,073 | Hasbro, Inc. | 33,918 | |||||||||
| 583 | International Speedway Corp., Class A | 28,800 | |||||||||
| 441 | Jack in the Box, Inc.* | 29,379 | |||||||||
| 6,566 | Mattel, Inc. | 185,818 | |||||||||
| 5,571 | Newell Rubbermaid, Inc. | 170,863 | |||||||||
| 964 | Payless Shoesource, Inc.* | 30,752 | |||||||||
| 2,020 | Polo Ralph Lauren Corp. | 186,062 | |||||||||
| 922 | Ross Stores, Inc. | 30,564 | |||||||||
| 2,526 | Sherwin-Williams (The) Co. | 161,083 | |||||||||
| 2,608 | Starwood Hotels & Resorts Worldwide, Inc. | 174,788 | |||||||||
| 6,211 | TJX Cos. (The), Inc. | 173,225 | |||||||||
| 2,198 | VF Corp. | 193,006 | |||||||||
| 2,094,007 | |||||||||||
| Consumer Staples—6.2% | |||||||||||
| 6,926 | ConAgra Foods, Inc. | 170,241 | |||||||||
| 1,010 | Dean Foods Co. | 36,794 | |||||||||
| 3,734 | Estee Lauder (The) Cos., Inc., Class A | 192,002 | |||||||||
| 622 | J.M. Smucker (The) Co. | 34,720 | |||||||||
| 799 | McCormick & Co., Inc. | 29,659 | |||||||||
| 605 | NBTY, Inc.* | 29,893 | |||||||||
| 14 | Seaboard Corp. | 34,902 | |||||||||
| 2,932 | UST, Inc. | 166,186 | |||||||||
| 694,397 | |||||||||||
| Energy—2.6% | |||||||||||
| 3,456 | ENSCO International, Inc. | 194,850 | |||||||||
| 563 | Holly Corp. | 35,807 | |||||||||
| 658 | Plains Exploration & Production Co.* | 30,919 | |||||||||
| 318 | SEACOR Holdings, Inc.* | 30,299 | |||||||||
| 291,875 | |||||||||||
| Financials—25.3% | |||||||||||
| 465 | A.G. Edwards, Inc. | 33,689 | |||||||||
| 1,976 | AMBAC Financial Group, Inc. | 181,397 | |||||||||
| 867 | American Financial Group, Inc. | 30,579 | |||||||||
| 476 | Arch Capital Group Ltd. (Bermuda)* | 34,662 | |||||||||
| 583 | Assurant, Inc. | 33,540 | |||||||||
| 4,889 | CB Richard Ellis Group, Inc., Class A* | 165,493 | |||||||||
| 4,210 | CNA Financial Corp.* | 196,481 | |||||||||
| 2,807 | Comerica, Inc. | 173,781 | |||||||||
| 867 | Eaton Vance Corp. | 33,137 | |||||||||
| 561 | Erie Indemnity Co., Class A | 29,481 | |||||||||
| Number of Shares | Value | ||||||||||
| Common Stocks (Continued) | |||||||||||
| 318 | Everest Re Group Ltd. (Bermuda) | $ | 32,004 | ||||||||
| 844 | Federated Investors, Inc., Class B | 32,207 | |||||||||
| 976 | HCC Insurance Holdings, Inc. | 29,924 | |||||||||
| 288 | Jones Lang LaSalle, Inc. | 30,957 | |||||||||
| 1,424 | M&T Bank Corp. | 158,548 | |||||||||
| 64 | Markel Corp.* | 29,370 | |||||||||
| 3,219 | Nationwide Financial Services, Inc., Class A | 183,901 | |||||||||
| 2,815 | Northern Trust Corp. | 177,204 | |||||||||
| 804 | Odyssey Re Holdings Corp. | 33,688 | |||||||||
| 1,374 | Old Republic International Corp. | 29,225 | |||||||||
| 444 | PartnerRe Ltd. (Bermuda) | 31,977 | |||||||||
| 665 | Philadelphia Consolidated Holding Co.* | 28,861 | |||||||||
| 661 | PMI Group (The), Inc. | 32,039 | |||||||||
| 694 | Protective Life Corp. | 32,549 | |||||||||
| 536 | Reinsurance Group of America, Inc. | 33,398 | |||||||||
| 461 | Safeco Corp. | 30,767 | |||||||||
| 495 | SEI Investments Co. | 30,210 | |||||||||
| 5,339 | Synovus Financial Corp. | 168,499 | |||||||||
| 3,648 | T. Rowe Price Group, Inc. | 181,233 | |||||||||
| 1,153 | TCF Financial Corp. | 31,223 | |||||||||
| 487 | Transatlantic Holdings, Inc. | 33,842 | |||||||||
| 659 | Unitrin, Inc. | 31,072 | |||||||||
| 8,145 | Unum Group | 202,647 | |||||||||
| 927 | W.R. Berkley Corp. | 30,118 | |||||||||
| 1,223 | Waddell & Reed Financial, Inc., Class A | 29,621 | |||||||||
| 55 | White Mountain Insurance Group Ltd. (Bermuda) | 31,515 | |||||||||
| 791 | Willis Group Holdings Ltd. (Bermuda) | 32,447 | |||||||||
| 2,426 | XL Capital Ltd., Class A (Cayman Islands) | 189,179 | |||||||||
| 2,830,465 | |||||||||||
| Health Care—10.9% | |||||||||||
| 3,214 | AmerisourceBergen Corp. | 160,668 | |||||||||
| 965 | Applera Corp. - Applied Biosystems Group | 30,147 | |||||||||
| 411 | Bio-Rad Laboratories, Inc., Class A* | 29,086 | |||||||||
| 1,229 | CIGNA Corp. | 191,220 | |||||||||
| 3,172 | Coventry Health Care, Inc.* | 183,437 | |||||||||
| 966 | DENTSPLY International, Inc. | 32,274 | |||||||||
| 608 | Edwards Lifesciences Corp.* | 29,792 | |||||||||
| 2,249 | Express Scripts, Inc.* | 214,892 | |||||||||
| 522 | Hillenbrand Industries, Inc. | 31,920 | |||||||||
| 2,905 | Humana, Inc.* | 183,712 | |||||||||
| 797 | Lincare Holdings, Inc.* | 31,434 | |||||||||
| 559 | Techne Corp.* | 32,964 | |||||||||
| 561 | Waters Corp.* | 33,340 | |||||||||
| 389 | WellCare Health Plans, Inc.* | 31,350 | |||||||||
| 1,216,236 | |||||||||||
| Industrials—14.3% | |||||||||||
| 532 | Acuity Brands, Inc. | 31,452 | |||||||||
| 463 | Avery Dennison Corp. | 28,799 | |||||||||
| 3,693 | Cooper Industries Ltd., Class A (Bermuda) | 183,764 | |||||||||
| 1,049 | Copart, Inc.* | 30,400 | |||||||||
See Notes to Financial Statements.
49
Schedule of Investments (Continued)
PowerShares Dynamic Mid Cap Portfolio
April 30, 2007
| Number of Shares | Value | ||||||||||
| Common Stocks (Continued) | |||||||||||
| 435 | Cummins, Inc. | $ | 40,090 | ||||||||
| 796 | Equifax, Inc. | 31,681 | |||||||||
| 869 | Gardner Denver, Inc.* | 32,848 | |||||||||
| 616 | Goodrich Corp. | 35,013 | |||||||||
| 792 | Herman Miller, Inc. | 27,253 | |||||||||
| 2,901 | ITT Corp. | 185,112 | |||||||||
| 676 | Jacobs Engineering Group, Inc.* | 34,091 | |||||||||
| 478 | Kennametal, Inc. | 33,728 | |||||||||
| 495 | Manitowoc (The) Co., Inc. | 33,774 | |||||||||
| 401 | Manpower, Inc. | 32,180 | |||||||||
| 614 | McDermott International, Inc. (Panama)* | 32,947 | |||||||||
| 2,014 | Parker Hannifin Corp. | 185,569 | |||||||||
| 3,686 | Pitney Bowes, Inc. | 176,928 | |||||||||
| 4,590 | R.R. Donnelley & Sons Co. | 184,517 | |||||||||
| 2,583 | Rockwell Collins, Inc. | 169,626 | |||||||||
| 460 | Teleflex, Inc. | 33,042 | |||||||||
| 585 | Thomas & Betts Corp.* | 31,871 | |||||||||
| 685 | URS Corp.* | 29,935 | |||||||||
| 1,604,620 | |||||||||||
| Information Technology—13.2% | |||||||||||
| 5,315 | Agilent Technologies, Inc.* | 182,676 | |||||||||
| 5,499 | Atmel Corp.* | 29,255 | |||||||||
| 4,163 | Autodesk, Inc.* | 171,807 | |||||||||
| 2,632 | BEA Systems, Inc.* | 31,031 | |||||||||
| 983 | BMC Software, Inc.* | 31,820 | |||||||||
| 3,745 | Brocade Communications Systems, Inc.* | 36,589 | |||||||||
| 1,172 | Convergys Corp.* | 29,605 | |||||||||
| 933 | Dolby Laboratories, Inc., Class A* | 33,047 | |||||||||
| 425 | DST Systems, Inc.* | 33,171 | |||||||||
| 6,104 | Electronic Data Systems Corp. | 178,480 | |||||||||
| 503 | FactSet Research Systems, Inc. | 30,940 | |||||||||
| 784 | Fair Isaac Corp. | 27,997 | |||||||||
| 3,233 | Fiserv, Inc.* | 171,899 | |||||||||
| 1,552 | Ingram Micro, Inc., Class A* | 30,450 | |||||||||
| 495 | Lexmark International, Inc., Class A* | 26,978 | |||||||||
| 994 | McAfee, Inc.* | 32,295 | |||||||||
| 350 | Mettler Toledo International, Inc.* | 34,167 | |||||||||
| 3,669 | NCR Corp.* | 184,917 | |||||||||
| 930 | Polycom, Inc.* | 30,969 | |||||||||
| 1,726 | QLogic Corp.* | 30,861 | |||||||||
| 1,219 | Sybase, Inc.* | 29,488 | |||||||||
| 1,193 | Synopsys, Inc.* | 32,998 | |||||||||
| 981 | Total System Services, Inc. | 30,470 | |||||||||
| 1,561 | Western Digital Corp.* | 27,598 | |||||||||
| 1,479,508 | |||||||||||
| Materials—4.6% | |||||||||||
| 737 | Albemarle Corp. | 31,286 | |||||||||
| 916 | Bemis Co., Inc. | 30,430 | |||||||||
| 534 | Cleveland-Cliffs, Inc. | 37,001 | |||||||||
| 506 | Greif, Inc., Class A | 28,134 | |||||||||
| 1,496 | Hercules, Inc.* | 28,185 | |||||||||
| Number of Shares | Value | ||||||||||
| Common Stocks (Continued) | |||||||||||
| 1,297 | Nalco Holding Co. | $ | 34,474 | ||||||||
| 946 | Pactiv Corp.* | 32,713 | |||||||||
| 942 | Sealed Air Corp. | 30,992 | |||||||||
| 741 | Sigma-Aldrich Corp. | 31,181 | |||||||||
| 832 | Sonoco Products Co. | 35,476 | |||||||||
| 1,899 | United States Steel Corp. | 192,823 | |||||||||
| 512,695 | |||||||||||
| Telecommunication Services—0.3% | |||||||||||
| 563 | Telephone & Data Systems, Inc. | 32,063 | |||||||||
| Utilities—4.2% | |||||||||||
| 3,691 | Allegheny Energy, Inc.* | 197,321 | |||||||||
| 660 | Energen Corp. | 36,993 | |||||||||
| 4,708 | PPL Corp. | 205,316 | |||||||||
| 643 | Wisconsin Energy Corp. | 31,372 | |||||||||
| 471,002 | |||||||||||
| Total Common Stocks (Cost $10,459,596) | 11,226,868 | ||||||||||
| Money Market Fund—0.5% | |||||||||||
| 48,241 | Liquid Assets Portfolio Private Class** (Cost $48,241) | 48,241 | |||||||||
| Total Investments (Cost $10,507,837)—100.8% | 11,275,109 | ||||||||||
| Liabilities in excess of other assets—(0.8%) | (84,691 | ) | |||||||||
| Net Assets—100.0% | $ | 11,190,418 | |||||||||
* Non-income producing security.
** Affiliated investment.
COUNTRY BREAKDOWN
April 30, 2007 (Unaudited)
| Value | Net Assets | ||||||||||
| United States | $ | 10,706,614 | 95.7 | % | |||||||
| Bermuda | 346,369 | 3.1 | |||||||||
| Cayman Islands | 189,179 | 1.7 | |||||||||
| Panama | 32,947 | 0.3 | |||||||||
| Total Investments | 11,275,109 | 100.8 | |||||||||
| Liabilities in excess of other assets | (84,691 | ) | (0.8 | ) | |||||||
| Net Assets | $ | 11,190,418 | 100.0 | % | |||||||
See Notes to Financial Statements.
50
Schedule of Investments
PowerShares Dynamic Small Cap Portfolio
April 30, 2007
| Number of Shares | Value | ||||||||||
| Common Stocks—100.3% | |||||||||||
| Consumer Discretionary—21.9% | |||||||||||
| 3,316 | Aaron Rents, Inc. | $ | 94,075 | ||||||||
| 2,440 | Aeropostale, Inc.* | 100,407 | |||||||||
| 705 | American Greetings Corp., Class A | 17,942 | |||||||||
| 2,746 | Ameristar Casinos, Inc. | 83,369 | |||||||||
| 3,524 | Applebee's International, Inc. | 95,782 | |||||||||
| 635 | Asbury Automotive Group, Inc. | 18,269 | |||||||||
| 4,906 | Belo Corp., Class A | 94,539 | |||||||||
| 2,516 | Blockbuster, Inc., Class A* | 15,599 | |||||||||
| 463 | Bob Evans Farms, Inc. | 16,992 | |||||||||
| 2,552 | Brown Shoe Co., Inc. | 68,853 | |||||||||
| 478 | Buckle (The), Inc. | 17,026 | |||||||||
| 362 | CBRL Group, Inc. | 16,138 | |||||||||
| 553 | Charlotte Russe Holding, Inc.* | 15,113 | |||||||||
| 1,646 | Children's Place Retail Stores (The), Inc.* | 87,024 | |||||||||
| 1,572 | Coinmach Service Corp., Class A | 16,632 | |||||||||
| 269 | Deckers Outdoor Corp.* | 20,371 | |||||||||
| 3,228 | DeVry, Inc. | 106,493 | |||||||||
| 2,926 | Domino's Pizza, Inc. | 94,364 | |||||||||
| 804 | Dress Barn, Inc.* | 16,008 | |||||||||
| 609 | Fossil, Inc.* | 17,156 | |||||||||
| 435 | Gymboree (The) Corp.* | 16,608 | |||||||||
| 717 | Helen of Troy Ltd. (Bermuda)* | 16,276 | |||||||||
| 534 | Hibbett Sports, Inc.* | 15,566 | |||||||||
| 294 | IHOP Corp. | 17,322 | |||||||||
| 1,275 | Journal Communications, Inc., Class A | 17,200 | |||||||||
| 642 | Modine Manufacturing Co. | 14,849 | |||||||||
| 1,730 | Priceline.com, Inc.* | 96,258 | |||||||||
| 2,193 | Regis Corp. | 83,838 | |||||||||
| 474 | Scholastic Corp.* | 14,632 | |||||||||
| 1,165 | Sinclair Broadcast Group, Inc., Class A | 19,024 | |||||||||
| 463 | Skechers U.S.A., Inc., Class A* | 14,538 | |||||||||
| 592 | Steven Madden Ltd. | 17,612 | |||||||||
| 2,118 | Stewart Enterprises, Inc., Class A | 15,927 | |||||||||
| 759 | Strayer Education, Inc. | 94,374 | |||||||||
| 3,632 | Tempur-Pedic International, Inc. | 94,323 | |||||||||
| 4,857 | Triarc Cos., Inc., Class B | 79,023 | |||||||||
| 711 | Tupperware Brands Corp. | 19,993 | |||||||||
| 3,223 | Wolverine World Wide, Inc. | 92,113 | |||||||||
| 1,751,628 | |||||||||||
| Consumer Staples—0.9% | |||||||||||
| 2,035 | Alliance One International, Inc.* | 19,963 | |||||||||
| 1,233 | Playtex Products, Inc.* | 18,766 | |||||||||
| 312 | Universal Corp. | 19,556 | |||||||||
| 278 | USANA Health Sciences, Inc.* | 11,076 | |||||||||
| 69,361 | |||||||||||
| Energy—5.5% | |||||||||||
| 505 | Copano Energy LLC | 19,725 | |||||||||
| 6,771 | Global Industries, Ltd.* | 140,566 | |||||||||
| 2,497 | Grey Wolf, Inc.* | 17,879 | |||||||||
| 452 | Gulfmark Offshore, Inc.* | 21,651 | |||||||||
| Number of Shares | Value | ||||||||||
| Common Stocks (Continued) | |||||||||||
| 306 | Lufkin Industries, Inc. | $ | 19,039 | ||||||||
| 2,499 | St. Mary Land & Exploration Co. | 91,513 | |||||||||
| 3,330 | Western Refining, Inc. | 131,935 | |||||||||
| 442,308 | |||||||||||
| Financials—24.3% | |||||||||||
| 379 | Advanta Corp., Class B | 17,366 | |||||||||
| 901 | Alfa Corp. | 16,164 | |||||||||
| 507 | AMCORE Financial, Inc. | 14,505 | |||||||||
| 464 | Argonaut Group, Inc.* | 15,595 | |||||||||
| 344 | BancFirst Corp. | 14,727 | |||||||||
| 3,614 | BancorpSouth, Inc. | 88,796 | |||||||||
| 498 | Capital City Bank Group, Inc. | 14,845 | |||||||||
| 566 | Chemical Financial Corp. | 15,129 | |||||||||
| 541 | Chittenden Corp. | 15,721 | |||||||||
| 434 | City Holding Co. | 16,479 | |||||||||
| 791 | CNA Surety Corp.* | 16,326 | |||||||||
| 2,024 | Cohen & Steers, Inc. | 103,851 | |||||||||
| 3,119 | Commerce Group (The), Inc. | 101,711 | |||||||||
| 2,284 | Delphi Financial Group, Inc., Class A | 97,527 | |||||||||
| 1,383 | Downey Financial Corp. | 92,592 | |||||||||
| 428 | FBL Financial Group, Inc., Class A | 16,581 | |||||||||
| 400 | First Financial Bankshares, Inc. | 15,480 | |||||||||
| 6,413 | First Niagara Financial Group, Inc. | 87,217 | |||||||||
| 446 | GAMCO Investors, Inc., Class A | 20,347 | |||||||||
| 680 | Glacier Bancorp, Inc. | 14,606 | |||||||||
| 493 | Harleysville Group, Inc. | 15,056 | |||||||||
| 369 | Hilb, Rogal & Hobbs Co. | 16,033 | |||||||||
| 810 | Horace Mann Educators Corp. | 17,042 | |||||||||
| 360 | Infinity Property & Casualty Corp. | 16,744 | |||||||||
| 3,043 | International Bancshares Corp. | 87,486 | |||||||||
| 2,138 | Investment Technology Group, Inc.* | 80,902 | |||||||||
| 3,166 | IPC Holdings Ltd. (Bermuda) | 94,917 | |||||||||
| 326 | Navigators Group, Inc.* | 16,655 | |||||||||
| 1,367 | Ocwen Financial Corp.* | 19,493 | |||||||||
| 3,023 | Ohio Casualty Corp. | 95,648 | |||||||||
| 177 | Park National Corp. | 15,712 | |||||||||
| 6,454 | Phoenix (The) Cos., Inc. | 96,165 | |||||||||
| 249 | Piper Jaffray Cos.* | 15,889 | |||||||||
| 2,017 | Potlatch Corp. | 87,518 | |||||||||
| 1,806 | ProAssurance Corp.* | 97,235 | |||||||||
| 945 | Provident Financial Services, Inc. | 16,197 | |||||||||
| 299 | RLI Corp. | 16,651 | |||||||||
| 370 | Safety Insurance Group, Inc. | 14,822 | |||||||||
| 690 | Selective Insurance Group | 17,995 | |||||||||
| 511 | State Auto Financial Corp. | 15,356 | |||||||||
| 768 | Sterling Financial Corp. | 12,787 | |||||||||
| 603 | SWS Group, Inc. | 15,672 | |||||||||
| 1,657 | Trustco Bank Corp. | 15,195 | |||||||||
| 3,147 | Trustmark Corp. | 83,742 | |||||||||
| 724 | United America Indemnity Ltd., Class A (Cayman Islands)* | 18,086 | |||||||||
See Notes to Financial Statements.
51
Schedule of Investments (Continued)
PowerShares Dynamic Small Cap Portfolio
April 30, 2007
| Number of Shares | Value | ||||||||||
| Common Stocks (Continued) | |||||||||||
| 474 | United Fire & Casualty Co. | $ | 17,419 | ||||||||
| 888 | Universal American Financial Corp.* | 16,481 | |||||||||
| 533 | WesBanco, Inc. | 15,633 | |||||||||
| 525 | WP Carey & Co. LLC | 17,981 | |||||||||
| 1,856 | Zenith National Insurance Corp. | 85,840 | |||||||||
| 1,947,917 | |||||||||||
| Health Care—9.6% | |||||||||||
| 2,672 | AMERIGROUP Corp.* | 75,163 | |||||||||
| 607 | AMN Healthcare Services, Inc.* | 14,780 | |||||||||
| 710 | Amsurg Corp., Class A* | 16,295 | |||||||||
| 526 | Apria Healthcare Group, Inc.* | 16,695 | |||||||||
| 310 | Biosite, Inc.* | 28,675 | |||||||||
| 363 | Chemed Corp. | 18,259 | |||||||||
| 787 | Conceptus Inc* | 16,275 | |||||||||
| 670 | Emergency Medical Services Corp., Class A* | 22,432 | |||||||||
| 2,516 | Incyte Corp.* | 19,398 | |||||||||
| 2,140 | Magellan Health Services, Inc.* | 91,807 | |||||||||
| 570 | MedCath Corp.* | 16,940 | |||||||||
| 3,376 | Medicines (The) Co.* | 76,905 | |||||||||
| 311 | National Healthcare Corp. | 15,957 | |||||||||
| 797 | PSS World Medical, Inc.* | 16,020 | |||||||||
| 733 | Sciele Pharma, Inc.* | 18,120 | |||||||||
| 3,435 | STERIS Corp. | 87,799 | |||||||||
| 2,294 | Sunrise Senior Living, Inc.* | 87,837 | |||||||||
| 1,638 | Varian, Inc.* | 94,939 | |||||||||
| 955 | ViroPharma, Inc.* | 14,401 | |||||||||
| 771 | Wright Medical Group, Inc.* | 18,211 | |||||||||
| 766,908 | |||||||||||
| Industrials—19.1% | |||||||||||
| 626 | ABM Industries, Inc. | 17,616 | |||||||||
| 455 | Administaff, Inc. | 15,101 | |||||||||
| 402 | American Woodmark Corp. | 13,873 | |||||||||
| 178 | AMREP Corp. | 10,726 | |||||||||
| 1,835 | Armstrong World Industries, Inc.* | 93,585 | |||||||||
| 290 | Cascade Corp. | 17,971 | |||||||||
| 293 | Ceradyne, Inc.* | 17,243 | |||||||||
| 2,795 | CLARCOR, Inc. | 88,154 | |||||||||
| 227 | Consolidated Graphics, Inc.* | 17,082 | |||||||||
| 318 | CRA International, Inc.* | 16,399 | |||||||||
| 2,822 | Deluxe Corp. | 106,813 | |||||||||
| 329 | Dollar Thrifty Automotive Group, Inc.* | 15,424 | |||||||||
| 1,519 | EMCOR Group, Inc.* | 95,226 | |||||||||
| 661 | Ennis, Inc. | 16,161 | |||||||||
| 573 | Healthcare Services Group, Inc. | 16,044 | |||||||||
| 362 | Heidrick & Struggles International, Inc.* | 17,079 | |||||||||
| 556 | Horizon Lines, Inc., Class A | 18,910 | |||||||||
| 512 | Hub Group, Inc., Class A* | 18,432 | |||||||||
| 6,422 | IKON Office Solutions, Inc. | 96,073 | |||||||||
| 691 | InfraSource Services, Inc.* | 23,066 | |||||||||
| 340 | John H. Harland Co. | 17,884 | |||||||||
| 730 | Knoll, Inc. | 16,951 | |||||||||
| Number of Shares | Value | ||||||||||
| Common Stocks (Continued) | |||||||||||
| 701 | Korn/Ferry International* | $ | 16,523 | ||||||||
| 879 | Labor Ready, Inc.* | 19,074 | |||||||||
| 147 | Middleby (The) Corp.* | 20,180 | |||||||||
| 1,671 | Nordson Corp. | 76,582 | |||||||||
| 599 | Pacer International, Inc. | 15,304 | |||||||||
| 464 | Perini Corp.* | 19,766 | |||||||||
| 512 | RBC Bearings, Inc.* | 19,461 | |||||||||
| 502 | Resources Connection, Inc.* | 15,145 | |||||||||
| 406 | Robbins & Myers, Inc. | 15,603 | |||||||||
| 729 | Rollins, Inc. | 16,818 | |||||||||
| 5,116 | SAIC, Inc.* | 93,572 | |||||||||
| 2,806 | TeleTech Holdings, Inc.* | 105,870 | |||||||||
| 726 | Tredegar Corp. | 16,967 | |||||||||
| 2,757 | Wabtec Corp. | 102,423 | |||||||||
| 3,132 | Waste Connections, Inc.* | 97,624 | |||||||||
| 1,935 | Watson Wyatt Worldwide, Inc., Class A | 91,197 | |||||||||
| 391 | Woodward Governor Co. | 19,296 | |||||||||
| 1,527,218 | |||||||||||
| Information Technology—16.4% | |||||||||||
| 4,210 | Acxiom Corp. | 95,146 | |||||||||
| 840 | Advanced Energy Industries, Inc.* | 20,580 | |||||||||
| 772 | Agilysys, Inc. | 16,235 | |||||||||
| 523 | Ansoft Corp.* | 16,888 | |||||||||
| 6,111 | Arris Group, Inc.* | 90,565 | |||||||||
| 776 | Benchmark Electronics, Inc.* | 16,436 | |||||||||
| 2,387 | CommScope, Inc.* | 111,353 | |||||||||
| 473 | Comtech Telecommunications Corp.* | 17,903 | |||||||||
| 661 | Covansys Corp.* | 22,077 | |||||||||
| 674 | CSG Systems International, Inc.* | 18,050 | |||||||||
| 915 | Emulex Corp.* | 19,197 | |||||||||
| 8,095 | Gateway, Inc.* | 17,728 | |||||||||
| 850 | Global Imaging Systems, Inc.* | 24,557 | |||||||||
| 386 | Imation Corp. | 14,247 | |||||||||
| 2,642 | Interdigital Communications Corp.* | 86,869 | |||||||||
| 720 | Inter-Tel, Inc. | 18,158 | |||||||||
| 3,816 | Jack Henry & Associates, Inc. | 90,630 | |||||||||
| 473 | ManTech International Corp., Class A* | 14,512 | |||||||||
| 957 | Mentor Graphics Corp.* | 15,484 | |||||||||
| 729 | MicroStrategy, Inc., Class A* | 82,931 | |||||||||
| 441 | MTS Systems Corp. | 18,747 | |||||||||
| 604 | Netgear, Inc.* | 20,301 | |||||||||
| 828 | NetRatings, Inc.* | 17,231 | |||||||||
| 753 | Paxar Corp.* | 22,598 | |||||||||
| 1,072 | Photronics, Inc.* | 16,134 | |||||||||
| 279 | Rofin-Sinar Technologies, Inc.* | 18,492 | |||||||||
| 2,462 | Skyworks Solutions, Inc.* | 16,963 | |||||||||
| 1,430 | SMART Modular Technologies (WWH), Inc. (Cayman Islands)* | 19,019 | |||||||||
| 1,041 | Sykes Enterprises, Inc.* | 19,217 | |||||||||
| 445 | Syntel, Inc. | 15,602 | |||||||||
| 2,808 | THQ, Inc.* | 93,703 | |||||||||
See Notes to Financial Statements.
52
Schedule of Investments (Continued)
PowerShares Dynamic Small Cap Portfolio
April 30, 2007
| Number of Shares | Value | ||||||||||
| Common Stocks (Continued) | |||||||||||
| 10,102 | TIBCO Software, Inc.* | $ | 92,130 | ||||||||
| 1,244 | United Online, Inc. | 17,951 | |||||||||
| 1,976 | WebEx Communications, Inc.* | 112,117 | |||||||||
| 1,309,751 | |||||||||||
| Materials—1.1% | |||||||||||
| 314 | Innospec, Inc. | 16,859 | |||||||||
| 417 | Metal Management, Inc. | 20,045 | |||||||||
| 324 | OM Group, Inc.* | 17,020 | |||||||||
| 434 | Quanex Corp. | 18,675 | |||||||||
| 669 | Sensient Technologies Corp. | 17,514 | |||||||||
| 90,113 | |||||||||||
| Telecommunication Services—1.1% | |||||||||||
| 1,585 | Golden Telecom, Inc. | 92,897 | |||||||||
| Utilities—0.4% | |||||||||||
| 377 | Northwest Natural Gas Co. | 19,155 | |||||||||
| 445 | UIL Holdings Corp. | 15,197 | |||||||||
| 34,352 | |||||||||||
| Total Common Stocks (Cost $7,743,960) | 8,032,453 | ||||||||||
| Money Market Fund—0.4% | |||||||||||
| 29,042 | Liquid Assets Portfolio Private Class** (Cost $29,042) | 29,042 | |||||||||
| Total Investments (Cost $7,773,002)—100.7% | 8,061,495 | ||||||||||
| Liabilities in excess of other assets—(0.7%) | (56,359 | ) | |||||||||
| Net Assets—100.0% | $ | 8,005,136 | |||||||||
* Non-income producing security.
** Affiliated investment.
COUNTRY BREAKDOWN
April 30, 2007 (Unaudited)
| Value | Net Assets | ||||||||||
| United States | $ | 7,913,197 | 98.8 | % | |||||||
| Bermuda | 111,193 | 1.4 | |||||||||
| Cayman Islands | 37,105 | 0.5 | |||||||||
| Total Investments | 8,061,495 | 100.7 | |||||||||
| Liabilities in excess of other assets | (56,359 | ) | (0.7 | ) | |||||||
| Net Assets | $ | 8,005,136 | 100.0 | % | |||||||
See Notes to Financial Statements.
53
Schedule of Investments
PowerShares Dynamic Aggressive Growth Portfolio
April 30, 2007
| Number of Shares | Value | ||||||||||
| Common Stocks—100.4% | |||||||||||
| Consumer Discretionary—16.1% | |||||||||||
| 2,752 | Aeropostale, Inc.* | $ | 113,245 | ||||||||
| 3,698 | Clear Channel Outdoor Holdings, Inc., Class A* | 105,578 | |||||||||
| 2,108 | Coach, Inc.* | 102,934 | |||||||||
| 3,638 | DeVry, Inc. | 120,018 | |||||||||
| 4,604 | DIRECTV (The) Group, Inc.* | 109,759 | |||||||||
| 1,832 | Garmin Ltd. (Cayman Islands) | 106,604 | |||||||||
| 2,476 | Guess?, Inc. | 97,554 | |||||||||
| 2,674 | Gymboree (The) Corp.* | 102,093 | |||||||||
| 1,020 | Harman International Industries, Inc. | 124,328 | |||||||||
| 3,276 | Hibbett Sports, Inc.* | 95,495 | |||||||||
| 1,280 | ITT Educational Services, Inc.* | 124,429 | |||||||||
| 1,452 | Kohl's Corp.* | 107,506 | |||||||||
| 1,880 | Phillips-Van Heusen Corp. | 105,092 | |||||||||
| 1,203 | Polo Ralph Lauren Corp. | 110,808 | |||||||||
| 2,844 | Skechers U.S.A., Inc., Class A* | 89,302 | |||||||||
| 5,476 | Triarc Cos., Inc., Class B | 89,095 | |||||||||
| 1,703,840 | |||||||||||
| Consumer Staples—0.6% | |||||||||||
| 1,712 | USANA Health Sciences, Inc.* | 68,206 | |||||||||
| Energy—2.2% | |||||||||||
| 1,559 | FMC Technologies, Inc.* | 110,502 | |||||||||
| 1,632 | Schlumberger Ltd. (Netherlands) | 120,490 | |||||||||
| 230,992 | |||||||||||
| Financials—5.2% | |||||||||||
| 648 | CBOT Holdings, Inc., Class A* | 122,259 | |||||||||
| 2,282 | Cohen & Steers, Inc. | 117,089 | |||||||||
| 964 | Jones Lang LaSalle, Inc. | 103,620 | |||||||||
| 1,562 | Moody's Corp. | 103,279 | |||||||||
| 1,658 | SEI Investments Co. | 101,188 | |||||||||
| 547,435 | |||||||||||
| Health Care—24.9% | |||||||||||
| 3,012 | AMERIGROUP Corp.* | 84,728 | |||||||||
| 3,722 | AMN Healthcare Services, Inc.* | 90,631 | |||||||||
| 1,942 | Cerner Corp.* | 103,392 | |||||||||
| 4,826 | Conceptus Inc* | 99,802 | |||||||||
| 3,462 | Cytyc Corp.* | 121,966 | |||||||||
| 1,650 | Dionex Corp.* | 113,850 | |||||||||
| 1,936 | Forest Laboratories, Inc.* | 103,015 | |||||||||
| 2,156 | Gen-Probe, Inc.* | 110,193 | |||||||||
| 1,210 | IDEXX Laboratories, Inc.* | 109,106 | |||||||||
| 15,447 | Incyte Corp.* | 119,096 | |||||||||
| 3,495 | MedCath Corp.* | 103,871 | |||||||||
| 3,808 | Medicines (The) Co.* | 86,746 | |||||||||
| 2,118 | Mentor Corp. | 82,411 | |||||||||
| 1,916 | Pediatrix Medical Group, Inc.* | 109,308 | |||||||||
| 4,886 | PSS World Medical, Inc.* | 98,209 | |||||||||
| 4,422 | Schering-Plough Corp. | 140,309 | |||||||||
| 4,506 | Sciele Pharma, Inc.* | 111,388 | |||||||||
| Number of Shares | Value | ||||||||||
| Common Stocks (Continued) | |||||||||||
| 1,956 | Sepracor, Inc.* | $ | 104,998 | ||||||||
| 1,642 | Stryker Corp. | 106,631 | |||||||||
| 2,588 | Sunrise Senior Living, Inc.* | 99,095 | |||||||||
| 2,718 | VCA Antech, Inc.* | 107,171 | �� | ||||||||
| 5,870 | ViroPharma, Inc.* | 88,520 | |||||||||
| 1,880 | Waters Corp.* | 111,728 | |||||||||
| 1,302 | WellCare Health Plans, Inc.* | 104,928 | |||||||||
| 4,730 | Wright Medical Group, Inc.* | 111,723 | |||||||||
| 2,622,815 | |||||||||||
| Industrials—19.0% | |||||||||||
| 2,802 | Administaff, Inc. | 92,998 | |||||||||
| 1,091 | AMREP Corp. | 65,744 | |||||||||
| 2,004 | Clean Harbors, Inc.* | 93,226 | |||||||||
| 1,968 | Corrections Corp. of America* | 111,782 | |||||||||
| 1,790 | Foster Wheeler Ltd. (Bermuda)* | 123,207 | |||||||||
| 3,522 | Healthcare Services Group, Inc. | 98,616 | |||||||||
| 2,652 | Herman Miller, Inc. | 91,255 | |||||||||
| 3,416 | Horizon Lines, Inc., Class A | 116,178 | |||||||||
| 3,142 | Hub Group, Inc., Class A* | 113,112 | |||||||||
| 2,698 | IHS, Inc., Class A* | 111,535 | |||||||||
| 2,262 | Jacobs Engineering Group, Inc.* | 114,073 | |||||||||
| 2,058 | McDermott International, Inc. (Panama)* | 110,432 | |||||||||
| 894 | Middleby (The) Corp.* | 122,728 | |||||||||
| 2,836 | Perini Corp.* | 120,814 | |||||||||
| 3,152 | RBC Bearings, Inc.* | 119,808 | |||||||||
| 3,084 | Resources Connection, Inc.* | 93,044 | |||||||||
| 2,534 | Robert Half International, Inc. | 84,382 | |||||||||
| 5,250 | Steelcase, Inc., Class A | 102,480 | |||||||||
| 3,164 | TeleTech Holdings, Inc.* | 119,378 | |||||||||
| 2,004,792 | |||||||||||
| Information Technology—28.3% | |||||||||||
| 5,942 | Activision, Inc.* | 118,840 | |||||||||
| 2,594 | Adobe Systems, Inc.* | 107,807 | |||||||||
| 1,674 | Alliance Data Systems Corp.* | 106,567 | |||||||||
| 4,778 | Altera Corp. | 107,696 | |||||||||
| 3,108 | Amphenol Corp., Class A | 109,122 | |||||||||
| 3,204 | Ansoft Corp.* | 103,457 | |||||||||
| 1,184 | Apple, Inc.* | 118,163 | |||||||||
| 18,417 | Atmel Corp.* | 97,978 | |||||||||
| 2,480 | Autodesk, Inc.* | 102,350 | |||||||||
| 12,542 | Brocade Communications Systems, Inc.* | 122,536 | |||||||||
| 7,142 | C-COR, Inc.* | 87,989 | |||||||||
| 1,114 | Cognizant Technology Solutions Corp., Class A* | 99,592 | |||||||||
| 3,126 | Dolby Laboratories, Inc., Class A* | 110,723 | |||||||||
| 1,684 | FactSet Research Systems, Inc. | 103,583 | |||||||||
| 2,932 | Flir Systems, Inc.* | 118,717 | |||||||||
| 4,736 | Gartner, Inc.* | 119,489 | |||||||||
| 2,092 | Harris Corp. | 107,424 | |||||||||
| 1,922 | MEMC Electronic Materials, Inc.* | 105,479 | |||||||||
| 5,866 | Mentor Graphics Corp.* | 94,912 | |||||||||
See Notes to Financial Statements.
54
Schedule of Investments (Continued)
PowerShares Dynamic Aggressive Growth Portfolio
April 30, 2007
| Number of Shares | Value | ||||||||||
| Common Stocks (Continued) | |||||||||||
| 1,834 | MICROS Systems, Inc.* | $ | 100,503 | ||||||||
| 3,840 | National Instruments Corp. | 106,982 | |||||||||
| 5,082 | NetRatings, Inc.* | 105,756 | |||||||||
| 3,228 | NVIDIA Corp.* | 106,169 | |||||||||
| 2,486 | Paychex, Inc. | 92,231 | |||||||||
| 3,114 | Polycom, Inc.* | 103,696 | |||||||||
| 2,724 | Syntel, Inc. | 95,503 | |||||||||
| 3,164 | THQ, Inc.* | 105,583 | |||||||||
| 2,230 | WebEx Communications, Inc.* | 126,531 | |||||||||
| 2,985,378 | |||||||||||
| Materials—2.0% | |||||||||||
| 2,402 | Ecolab, Inc. | 103,262 | |||||||||
| 1,933 | Innospec, Inc. | 103,783 | |||||||||
| 207,045 | |||||||||||
| Telecommunication Services—1.0% | |||||||||||
| 1,478 | U.S. Cellular Corp.* | 107,155 | |||||||||
| Utilities—1.1% | |||||||||||
| 2,198 | Allegheny Energy, Inc.* | 117,505 | |||||||||
| Total Common Stocks (Cost $9,963,387) | 10,595,163 | ||||||||||
| Money Market Fund—0.1% | |||||||||||
| 12,057 | Liquid Assets Portfolio Private Class** (Cost $12,057) | 12,057 | |||||||||
| Total Investments (Cost $9,975,444)—100.5% | 10,607,220 | ||||||||||
| Liabilities in excess of other assets—(0.5%) | (55,514 | ) | |||||||||
| Net Assets—100.0% | $ | 10,551,706 | |||||||||
* Non-income producing security.
** Affiliated investment.
COUNTRY BREAKDOWN
April 30, 2007 (Unaudited)
| Value | Net Assets | ||||||||||
| United States | $ | 10,146,487 | 96.2 | % | |||||||
| Bermuda | 123,207 | 1.2 | |||||||||
| Netherlands | 120,490 | 1.1 | |||||||||
| Panama | 110,432 | 1.0 | |||||||||
| Cayman Islands | 106,604 | 1.0 | |||||||||
| Total Investments | 10,607,220 | 100.5 | |||||||||
| Liabilities in excess of other assets | (55,514 | ) | (0.5 | ) | |||||||
| Net Assets | $ | 10,551,706 | 100.0 | % | |||||||
See Notes to Financial Statements.
55
Schedule of Investments
PowerShares Dynamic Deep Value Portfolio
April 30, 2007
| Number of Shares | Value | ||||||||||
| Common Stocks—100.5% | |||||||||||
| Consumer Discretionary—4.9% | |||||||||||
| 2,698 | Autoliv, Inc. | $ | 156,889 | ||||||||
| 6,556 | Helen of Troy Ltd. (Bermuda)* | 148,821 | |||||||||
| 2,904 | International Speedway Corp., Class A | 143,458 | |||||||||
| 4,936 | Newell Rubbermaid, Inc. | 151,387 | |||||||||
| 1,948 | VF Corp. | 171,054 | |||||||||
| 771,609 | |||||||||||
| Consumer Staples—9.3% | |||||||||||
| 2,446 | Altria Group, Inc. | 168,578 | |||||||||
| 3,740 | Campbell Soup Co. | 146,234 | |||||||||
| 6,138 | ConAgra Foods, Inc. | 150,872 | |||||||||
| 5,002 | Dean Foods Co. | 182,223 | |||||||||
| 2,740 | General Mills, Inc. | 164,126 | |||||||||
| 3,320 | H.J. Heinz Co. | 156,405 | |||||||||
| 3,100 | J.M. Smucker (The) Co. | 173,042 | |||||||||
| 2,852 | Universal Corp. | 178,763 | |||||||||
| 2,598 | UST, Inc. | 147,255 | |||||||||
| 1,467,498 | |||||||||||
| Energy—1.1% | |||||||||||
| 2,084 | Exxon Mobil Corp. | 165,428 | |||||||||
| Financials—46.5% | |||||||||||
| 2,722 | ACE Ltd. (Cayman Islands) | 161,850 | |||||||||
| 1,752 | AMBAC Financial Group, Inc. | 160,834 | |||||||||
| 4,626 | AMCORE Financial, Inc. | 132,350 | |||||||||
| 4,318 | American Financial Group, Inc. | 152,296 | |||||||||
| 2,502 | Ameriprise Financial, Inc. | 148,794 | |||||||||
| 2,904 | Assurant, Inc. | 167,067 | |||||||||
| 2,964 | Bank of America Corp. | 150,868 | |||||||||
| 4,932 | Chittenden Corp. | 143,324 | |||||||||
| 2,956 | Chubb (The) Corp. | 159,121 | |||||||||
| 3,974 | City Holding Co. | 150,893 | |||||||||
| 2,486 | Comerica, Inc. | 153,908 | |||||||||
| 5,230 | Commerce (The) Group, Inc. | 170,550 | |||||||||
| 3,828 | Delphi Financial Group, Inc., Class A | 163,456 | |||||||||
| 1,584 | Everest Re Group Ltd. (Bermuda) | 159,414 | |||||||||
| 3,906 | FBL Financial Group, Inc., Class A | 151,318 | |||||||||
| 4,054 | GAMCO Investors, Inc., Class A | 184,942 | |||||||||
| 4,502 | Harleysville Group, Inc. | 137,491 | |||||||||
| 1,624 | Hartford Financial Services Group (The), Inc. | 164,349 | |||||||||
| 7,394 | Horace Mann Educators Corp. | 155,570 | |||||||||
| 5,308 | IPC Holdings, Ltd. (Bermuda) | 159,134 | |||||||||
| 3,070 | JPMorgan Chase & Co. | 159,947 | |||||||||
| 4,010 | KeyCorp | 143,077 | |||||||||
| 2,222 | Lincoln National Corp. | 158,095 | |||||||||
| 3,554 | Loews Corp. | 168,175 | |||||||||
| 2,400 | MetLife, Inc. | 157,680 | |||||||||
| 2,852 | Nationwide Financial Services, Inc., Class A | 162,935 | |||||||||
| 5,070 | Ohio Casualty Corp. | 160,415 | |||||||||
| 6,846 | Old Republic International Corp. | 145,614 | |||||||||
| 2,212 | PartnerRe Ltd. (Bermuda) | 159,308 | |||||||||
| Number of Shares | Value | ||||||||||
| Common Stocks (Continued) | |||||||||||
| 3,294 | PMI Group (The), Inc. | $ | 159,660 | ||||||||
| 2,074 | PNC Financial Services Group, Inc. | 153,683 | |||||||||
| 6,730 | Progressive (The) Corp. | 155,261 | |||||||||
| 1,694 | Prudential Financial, Inc. | 160,930 | |||||||||
| 2,670 | Reinsurance Group of America, Inc. | 166,368 | |||||||||
| 2,740 | RLI Corp. | 152,591 | |||||||||
| 2,296 | Safeco Corp. | 153,235 | |||||||||
| 3,380 | Safety Insurance Group, Inc. | 135,403 | |||||||||
| 6,296 | Selective Insurance Group | 164,200 | |||||||||
| 4,668 | State Auto Financial Corp. | 140,273 | |||||||||
| 1,802 | SunTrust Banks, Inc. | 152,125 | |||||||||
| 2,956 | Travelers (The) Cos., Inc. | 159,920 | |||||||||
| 6,603 | United America Indemnity Ltd., Class A (Cayman Islands)* | 164,943 | |||||||||
| 3,284 | Unitrin, Inc. | 154,841 | |||||||||
| 4,398 | Wells Fargo & Co. | 157,844 | |||||||||
| 4,618 | W.R. Berkley Corp. | 150,039 | |||||||||
| 2,150 | XL Capital Ltd., Class A (Cayman Islands) | 167,657 | |||||||||
| 3,112 | Zenith National Insurance Corp. | 143,930 | |||||||||
| 7,335,678 | |||||||||||
| Health Care—5.3% | |||||||||||
| 1,088 | CIGNA Corp. | 169,282 | |||||||||
| 2,602 | Hillenbrand Industries, Inc. | 159,112 | |||||||||
| 2,442 | Johnson & Johnson | 156,825 | |||||||||
| 3,650 | Merck & Co., Inc. | 187,757 | |||||||||
| 6,116 | Pfizer, Inc. | 161,829 | |||||||||
| 834,805 | |||||||||||
| Industrials—9.2% | |||||||||||
| 2,306 | Avery Dennison Corp. | 143,433 | |||||||||
| 2,657 | Cascade Corp. | 164,654 | |||||||||
| 2,168 | Cummins, Inc. | 199,803 | |||||||||
| 3,090 | John H. Harland Co. | 162,534 | |||||||||
| 1,536 | Lockheed Martin Corp. | 147,671 | |||||||||
| 2,104 | Northrop Grumman Corp. | 154,939 | |||||||||
| 3,266 | Pitney Bowes, Inc. | 156,768 | |||||||||
| 4,068 | R.R. Donnelley & Sons Co. | 163,534 | |||||||||
| 2,292 | Teleflex, Inc. | 164,634 | |||||||||
| 1,457,970 | |||||||||||
| Information Technology—7.7% | |||||||||||
| 5,410 | Electronic Data Systems Corp. | 158,188 | |||||||||
| 3,904 | Fair Isaac Corp. | 139,412 | |||||||||
| 7,730 | Ingram Micro, Inc., Class A* | 151,663 | |||||||||
| 1,604 | International Business Machines Corp. | 163,944 | |||||||||
| 2,466 | Lexmark International, Inc., Class A* | 134,397 | |||||||||
| 3,252 | NCR Corp.* | 163,901 | |||||||||
| 9,799 | Photronics, Inc.* | 147,475 | |||||||||
| 8,764 | Xerox Corp.* | 162,134 | |||||||||
| 1,221,114 | |||||||||||
See Notes to Financial Statements.
56
Schedule of Investments (Continued)
PowerShares Dynamic Deep Value Portfolio
April 30, 2007
| Number of Shares | Value | ||||||||||
| Common Stocks (Continued) | |||||||||||
| Materials—9.2% | |||||||||||
| 4,564 | Bemis Co., Inc. | $ | 151,616 | ||||||||
| 2,658 | Cleveland-Cliffs, Inc. | 184,173 | |||||||||
| 2,958 | E.I. du Pont de Nemours & Co. | 145,445 | |||||||||
| 4,214 | International Paper Co. | 158,952 | |||||||||
| 2,432 | Nucor Corp. | 154,335 | |||||||||
| 2,950 | OM Group, Inc.* | 154,964 | |||||||||
| 6,122 | Sensient Technologies Corp. | 160,274 | |||||||||
| 4,146 | Sonoco Products Co. | 176,785 | |||||||||
| 1,682 | United States Steel Corp. | 170,790 | |||||||||
| 1,457,334 | |||||||||||
| Utilities—7.3% | |||||||||||
| 7,870 | Duke Energy Corp. | 161,492 | |||||||||
| 3,336 | Edison International | 174,640 | |||||||||
| 3,286 | Energen Corp. | 184,179 | |||||||||
| 3,450 | Northwest Natural Gas Co. | 175,295 | |||||||||
| 3,280 | PG&E Corp. | 165,968 | |||||||||
| 4,051 | UIL Holdings Corp. | 138,342 | |||||||||
| 3,202 | Wisconsin Energy Corp. | 156,226 | |||||||||
| 1,156,142 | |||||||||||
| Total Common Stocks (Cost $15,352,764) | 15,867,578 | ||||||||||
| Money Market Fund—0.7% | |||||||||||
| 111,523 | Liquid Assets Portfolio Private Class** (Cost $111,523) | 111,523 | |||||||||
| Total Investments (Cost $15,464,287)—101.2% | 15,979,101 | ||||||||||
| Liabilities in excess of other assets—(1.2%) | (193,483 | ) | |||||||||
| Net Assets—100.0% | $ | 15,785,618 | |||||||||
* Non-income producing security.
** Affiliated investment.
COUNTRY BREAKDOWN
April 30, 2007 (Unaudited)
| Value | Net Assets | ||||||||||
| United States | $ | 14,857,974 | 94.1 | % | |||||||
| Bermuda | 626,677 | 4.0 | |||||||||
| Cayman Islands | 494,450 | 3.1 | |||||||||
| Total Investments | 15,979,101 | 101.2 | |||||||||
| Liabilities in excess of other assets | (193,483 | ) | (1.2 | ) | |||||||
| Net Assets | $ | 15,785,618 | 100.0 | % | |||||||
See Notes to Financial Statements.
57
Schedule of Investments
PowerShares Zacks Micro Cap Portfolio
April 30, 2007
| Number of Shares | Value | ||||||||||
| Common Stocks—99.8% | |||||||||||
| Consumer Discretionary—18.9% | |||||||||||
| 25,109 | 4Kids Entertainment, Inc.* | $ | 408,523 | ||||||||
| 22,261 | A.C. Moore Arts & Crafts, Inc.* | 457,018 | |||||||||
| 10,300 | Ambassadors International, Inc. | 421,476 | |||||||||
| 32,229 | Audiovox Corp., Class A* | 463,775 | |||||||||
| 6,645 | Avatar Holdings, Inc.* | 498,840 | |||||||||
| 16,755 | Benihana, Inc., Class A* | 489,916 | |||||||||
| 42,054 | Bluegreen Corp.* | 464,697 | |||||||||
| 33,368 | Books-A-Million, Inc. | 556,578 | |||||||||
| 20,458 | Carmike Cinemas, Inc. | 511,041 | |||||||||
| 58,715 | Carriage Services, Inc. * | 479,702 | |||||||||
| 10,442 | Churchill Downs, Inc. | 487,537 | |||||||||
| 45,852 | Cobra Electronics Corp. | 458,520 | |||||||||
| 12,673 | CSS Industries, Inc. | 505,653 | |||||||||
| 50,646 | Cumulus Media, Inc., Class A* | 475,566 | |||||||||
| 27,293 | Delta Apparel, Inc. | 471,077 | |||||||||
| 28,574 | DG Fastchannel, Inc.* | 519,761 | |||||||||
| 11,582 | Duckwall-ALCO Stores, Inc.* | 440,695 | |||||||||
| 17,135 | E Com Ventures, Inc.* | 538,210 | |||||||||
| 54,585 | Exide Technologies* | 513,645 | |||||||||
| 9,778 | Fisher Communications, Inc.* | 474,429 | |||||||||
| 32,324 | Fred's, Inc. | 466,759 | |||||||||
| 28,717 | FTD Group, Inc. | 512,598 | |||||||||
| 25,631 | Fuel Systems Solutions, Inc.* | 433,164 | |||||||||
| 30,188 | Gaiam, Inc., Class A* | 459,160 | |||||||||
| 38,874 | GameTech International, Inc.* | 445,496 | |||||||||
| 42,577 | Gander Mountain Co.* | 540,302 | |||||||||
| 13,955 | GenTek, Inc.* | 457,166 | |||||||||
| 24,919 | G-III Apparel Group, Ltd.* | 440,070 | |||||||||
| 33,273 | Gottschalks, Inc.* | 443,862 | |||||||||
| 45,567 | Gray Television, Inc. | 486,200 | |||||||||
| 35,884 | Great Wolf Resorts, Inc.* | 455,368 | |||||||||
| 78,745 | Harris Interactive, Inc.* | 474,045 | |||||||||
| 64,173 | Hartmarx Corp.* | 422,258 | |||||||||
| 33,938 | Haverty Furniture Cos., Inc. | 433,049 | |||||||||
| 64,980 | Hayes Lemmerz International, Inc.* | 370,386 | |||||||||
| 20,932 | Helen of Troy Ltd. (Bermuda)* | 475,156 | |||||||||
| 23,685 | Hooker Furniture Corp. | 521,781 | |||||||||
| 75,280 | Interstate Hotels & Resorts, Inc.* | 389,198 | |||||||||
| 19,888 | JAKKS Pacific, Inc.* | 477,909 | |||||||||
| 17,420 | Jo-Ann Stores, Inc.* | 521,729 | |||||||||
| 39,301 | K2, Inc.* | 593,051 | |||||||||
| 42,577 | Lakes Entertainment, Inc.* | 527,103 | |||||||||
| 16,043 | Landry's Restaurants, Inc. | 476,477 | |||||||||
| 33,890 | Libbey, Inc. | 632,048 | |||||||||
| 17,325 | Lithia Motors, Inc., Class A | 466,909 | |||||||||
| 46,754 | LJ International, Inc. (British Virgin Islands)* | 458,189 | |||||||||
| 35,552 | Lodgian, Inc.* | 491,329 | |||||||||
| 17,895 | M/I Homes, Inc. | 532,018 | |||||||||
| 29,808 | Monaco Coach Corp. | 456,957 | |||||||||
| 14,335 | Mothers Work, Inc.* | 501,725 | |||||||||
| 16,138 | Movado Group, Inc. | 531,263 | |||||||||
| Number of Shares | Value | ||||||||||
| Common Stocks (Continued) | |||||||||||
| 39,919 | Multimedia Games, Inc.* | $ | 447,093 | ||||||||
| 7,689 | National Presto Industries, Inc. | 454,343 | |||||||||
| 126,638 | Navarre Corp.* | 538,212 | |||||||||
| 24,635 | O'Charleys, Inc.* | 520,045 | |||||||||
| 47,655 | PC Mall, Inc.* | 505,143 | |||||||||
| 14,857 | Perry Ellis International, Inc.* | 493,252 | |||||||||
| 38,162 | Red Lion Hotels Corp.* | 486,566 | |||||||||
| 29,049 | Rex Stores Corp.* | 484,828 | |||||||||
| 14,240 | Shoe Carnival, Inc.* | 447,706 | |||||||||
| 102,336 | Silverleaf Resorts, Inc.* | 510,657 | |||||||||
| 118,759 | Spanish Broadcasting System, Inc., Class A* | 404,968 | |||||||||
| 20,458 | Spartan Motors, Inc. | 582,643 | |||||||||
| 27,815 | Standard Motor Products, Inc. | 509,849 | |||||||||
| 14,714 | Steinway Musical Instruments | 464,962 | |||||||||
| 19,508 | StoneMor Partners LP | 508,183 | |||||||||
| 45,852 | Stoneridge, Inc.* | 532,342 | |||||||||
| 30,853 | Stride Rite (The) Corp. | 435,027 | |||||||||
| 35,314 | Sturm Ruger & Co., Inc.* | 455,904 | |||||||||
| 22,783 | Superior Industries International, Inc. | 520,592 | |||||||||
| 25,489 | Syms Corp. * | 448,352 | |||||||||
| 56,531 | Syntax-Brillian Corp.* | 403,631 | |||||||||
| 25,347 | Systemax, Inc. | 431,659 | |||||||||
| 26,296 | Trump Entertainment Resorts, Inc.* | 426,784 | |||||||||
| 17,040 | Universal Electronics, Inc.* | 482,232 | |||||||||
| 26,059 | West Marine, Inc.* | 383,067 | |||||||||
| 36,407,424 | |||||||||||
| Consumer Staples—3.0% | |||||||||||
| 50,598 | American Oriental Bioengineering, Inc.* | 503,450 | |||||||||
| 10,680 | Andersons (The), Inc. | 496,086 | |||||||||
| 35,314 | Cal-Maine Foods, Inc. | 477,445 | |||||||||
| 33,890 | Chiquita Brands International, Inc. | 502,589 | |||||||||
| 14,145 | Imperial Sugar Co. | 420,955 | |||||||||
| 23,306 | MGP Ingredients, Inc. | 464,022 | |||||||||
| 13,765 | Nash Finch Co. | 536,422 | |||||||||
| 27,055 | National Beverage Corp.* | 420,976 | |||||||||
| 40,061 | Prestige Brands Holdings, Inc.* | 521,194 | |||||||||
| 30,900 | PriceSmart, Inc. | 513,867 | |||||||||
| 69,110 | Schiff Nutrition International, Inc.* | 487,225 | |||||||||
| 17,705 | Spartan Stores, Inc. | 456,081 | |||||||||
| 5,800,312 | |||||||||||
| Energy—4.0% | |||||||||||
| 12,958 | Adams Resources & Energy, Inc. | 486,573 | |||||||||
| 30,141 | Allis-Chalmers Energy, Inc.* | 583,228 | |||||||||
| 9,920 | Atlas Pipeline Partners, LP | 495,504 | |||||||||
| 13,860 | Bolt Technology Corp.* | 562,993 | |||||||||
| 34,982 | Callon Petroleum Co.* | 482,752 | |||||||||
| 9,588 | Dawson Geophysical Co.* | 492,823 | |||||||||
| 13,243 | Global Partners LP | 495,818 | |||||||||
| 17,752 | Gulf Island Fabrication, Inc. | 533,093 | |||||||||
| 48,747 | Harvest Natural Resources, Inc.* | 489,907 | |||||||||
| 8,212 | Hiland Partners LP | 447,308 | |||||||||
See Notes to Financial Statements.
58
Schedule of Investments (Continued)
PowerShares Zacks Micro Cap Portfolio
April 30, 2007
| Number of Shares | Value | ||||||||||
| Common Stocks (Continued) | |||||||||||
| 12,151 | Martin Midstream Partners LP | $ | 517,147 | ||||||||
| 30,046 | NGP Capital Resources Co. | 469,919 | |||||||||
| 46,659 | OMNI Energy Services Corp.* | 448,393 | |||||||||
| 23,590 | T-3 Energy Services, Inc.* | 601,545 | |||||||||
| 12,768 | Trico Marine Services, Inc.* | 494,249 | |||||||||
| 7,601,252 | |||||||||||
| Financials—25.0% | |||||||||||
| 18,132 | 1st Source Corp. | 448,586 | |||||||||
| 27,435 | Affirmative Insurance Holdings, Inc. | 445,270 | |||||||||
| 39,159 | Affordable Residential Communities, Inc.* | 459,335 | |||||||||
| 54,538 | Alesco Financial, Inc. | 478,298 | |||||||||
| 15,664 | American Campus Communities, Inc. | 479,632 | |||||||||
| 11,866 | American Physicians Capital, Inc.* | 469,182 | |||||||||
| 24,919 | American Safety Insurance Holdings Ltd. (Bermuda)* | 517,068 | |||||||||
| 25,204 | Amerisafe, Inc.* | 507,357 | |||||||||
| 48,605 | Anworth Mortgage Asset Corp. | 466,608 | |||||||||
| 15,616 | Arbor Realty Trust, Inc. | 480,817 | |||||||||
| 28,527 | Banco Latinoamericano de Exportaciones, S.A., Class E (Panama) | 558,843 | |||||||||
| 18,274 | Bancorp (The), Inc.* | 440,952 | |||||||||
| 29,191 | BankFinancial Corp. | 464,137 | |||||||||
| 11,439 | Banner Corp. | 426,903 | |||||||||
| 14,097 | Berkshire Hills Bancorp, Inc. | 454,487 | |||||||||
| 15,711 | BRT Realty Trust | 485,941 | |||||||||
| 44,333 | Capital Lease Funding, Inc. | 495,200 | |||||||||
| 3,085 | Capital Southwest Corp. | 477,558 | |||||||||
| 47,560 | Capstead Mortgage Corp. | 477,978 | |||||||||
| 29,334 | Cedar Shopping Centers, Inc. | 468,464 | |||||||||
| 54,918 | Centennial Bank Holdings, Inc.* | 481,082 | |||||||||
| 31,707 | CFS Bancorp, Inc. | 470,849 | |||||||||
| 20,837 | Citizens First Bancorp, Inc. | 438,827 | |||||||||
| 13,100 | Community Trust Bancorp, Inc. | 435,706 | |||||||||
| 10,965 | Crescent Banking Co. | 458,885 | |||||||||
| 57,433 | Delta Financial Corp. | 574,903 | |||||||||
| 35,884 | Dime Community Bancshares, Inc. | 477,616 | |||||||||
| 27,957 | Donegal Group, Inc., Class A | 424,108 | |||||||||
| 32,134 | Education Realty Trust, Inc. | 457,588 | |||||||||
| 18,417 | EMC Insurance Group, Inc. | 462,267 | |||||||||
| 32,229 | EZCORP, Inc., Class A* | 488,269 | |||||||||
| 39,112 | Feldman Mall Properties, Inc. | 450,961 | |||||||||
| 23,685 | Financial Institutions, Inc. | 455,699 | |||||||||
| 15,331 | First Financial Corp. | 437,240 | |||||||||
| 22,119 | First Place Financial Corp. | 442,601 | |||||||||
| 29,286 | Flushing Financial Corp. | 455,397 | |||||||||
| 10,632 | FPIC Insurance Group, Inc.* | 489,710 | |||||||||
| 26,581 | Franklin Bank Corp.* | 414,664 | |||||||||
| 23,685 | Gladstone Commercial Corp. | 472,516 | |||||||||
| 31,944 | Gladstone Investment Corp. | 457,758 | |||||||||
| 14,002 | Greene County Bancshares, Inc. | 470,747 | |||||||||
| 17,752 | Heartland Financial USA, Inc. | 454,629 | |||||||||
| Number of Shares | Value | ||||||||||
| Common Stocks (Continued) | |||||||||||
| 34,650 | Hercules Technology Growth Capital, Inc. | $ | 477,131 | ||||||||
| 40,298 | Hersha Hospitality Trust | 478,740 | |||||||||
| 14,524 | Independent Bank Corp. | 431,363 | |||||||||
| 21,312 | Integra Bank Corp. | 484,209 | |||||||||
| 16,993 | International Assets Holding Corp.* | 387,610 | |||||||||
| 16,565 | Intervest Bancshares Corp.* | 421,745 | |||||||||
| 44,855 | Investors Real Estate Trust | 473,220 | |||||||||
| 25,489 | Irwin Financial Corp. | 408,589 | |||||||||
| 9,113 | ITLA Capital Corp. | 463,943 | |||||||||
| 15,189 | James River Group, Inc. | 471,315 | |||||||||
| 24,967 | JER Investors Trust, Inc. | 439,669 | |||||||||
| 23,828 | Kite Realty Group Trust | 476,560 | |||||||||
| 32,229 | KNBT Bancorp, Inc. | 483,757 | |||||||||
| 18,322 | LTC Properties, Inc. | 459,333 | |||||||||
| 53,114 | Luminent Mortgage Capital, Inc. | 438,722 | |||||||||
| 27,957 | MainSource Financial Group, Inc. | 451,506 | |||||||||
| 28,384 | MarketAxess Holdings, Inc.* | 464,930 | |||||||||
| 43,194 | Meadowbrook Insurance Group, Inc.* | 479,885 | |||||||||
| 41,532 | Medallion Financial Corp. | 494,646 | |||||||||
| 32,324 | Medical Properties Trust, Inc. | 460,294 | |||||||||
| 23,875 | Mercer Insurance Group, Inc. | 445,746 | |||||||||
| 61,658 | MFA Mortgage Investments, Inc. | 450,103 | |||||||||
| 32,846 | Mission West Properties | 480,209 | |||||||||
| 47,893 | NexCen Brands, Inc.* | 609,677 | |||||||||
| 11,629 | NYMAGIC, Inc. | 476,208 | |||||||||
| 16,660 | Omega Financial Corp. | 467,313 | |||||||||
| 14,287 | Oppenheimer Holdings, Inc., Class A (Canada) | 557,192 | |||||||||
| 40,298 | Oriental Financial Group | 466,248 | |||||||||
| 41,532 | Partners Trust Financial Group, Inc. | 460,175 | |||||||||
| 33,463 | Patriot Capital Funding, Inc. | 475,509 | |||||||||
| 17,942 | Peoples Financial Corp. | 451,241 | |||||||||
| 15,569 | Pinnacle Financial Partners, Inc.* | 455,705 | |||||||||
| 50,598 | PMA Capital Corp., Class A* | 474,103 | |||||||||
| 24,065 | Presidential Life Corp. | 457,476 | |||||||||
| 38,637 | Primus Guaranty Ltd. (Bermuda)* | 467,121 | |||||||||
| 20,458 | ProCentury Corp. | 463,169 | |||||||||
| 33,558 | Provident New York Bancorp | 456,724 | |||||||||
| 19,224 | Renasant Corp. | 447,342 | |||||||||
| 21,027 | Republic Bancorp, Inc., Class A | 384,584 | |||||||||
| 20,078 | Resource America, Inc., Class A | 443,925 | |||||||||
| 29,429 | Resource Capital Corp. | 479,693 | |||||||||
| 11,819 | Safety Insurance Group, Inc. | 473,469 | |||||||||
| 20,932 | SCPIE Holdings, Inc.* | 456,946 | |||||||||
| 25,821 | SeaBright Insurance Holdings, Inc.* | 479,496 | |||||||||
| 23,590 | Security Bank Corp. | 466,374 | |||||||||
| 18,464 | Southwest Bancorp, Inc. | 452,368 | |||||||||
| 61,420 | Specialty Underwriters' Alliance, Inc.* | 501,187 | |||||||||
| 25,536 | Sun Bancorp, Inc.* | 481,609 | |||||||||
| 43,953 | Superior Bancorp* | 455,793 | |||||||||
| 62,227 | Supertel Hospitality, Inc. | 500,305 | |||||||||
| 19,129 | SWS Group, Inc. | 497,163 | |||||||||
See Notes to Financial Statements.
59
Schedule of Investments (Continued)
PowerShares Zacks Micro Cap Portfolio
April 30, 2007
| Number of Shares | Value | ||||||||||
| Common Stocks (Continued) | |||||||||||
| 13,575 | Taylor Capital Group, Inc. | $ | 403,721 | ||||||||
| 20,458 | United America Indemnity Ltd., Class A (Cayman Islands)* | 511,040 | |||||||||
| 43,004 | United Community Financial Corp. | 443,801 | |||||||||
| 19,888 | United Western Bancorp, Inc. | 467,567 | |||||||||
| 24,302 | Urstadt Biddle Properties, Inc., Class A | 440,838 | |||||||||
| 27,150 | Wauwatosa Holdings, Inc.* | 475,397 | |||||||||
| 44,285 | Westfield Financial, Inc. | 447,279 | |||||||||
| 36,833 | Willow Financial Bancorp, Inc. | 422,843 | |||||||||
| 71,863 | Winthrop Realty Trust | 476,452 | |||||||||
| 7,357 | WSFS Financial Corp. | 474,600 | |||||||||
| 48,019,516 | |||||||||||
| Health Care—7.4% | |||||||||||
| 48,225 | Albany Molecular Research, Inc.* | 463,442 | |||||||||
| 21,834 | American Dental Partners, Inc.* | 466,811 | |||||||||
| 18,132 | Arrhythmia Research Technology | 417,943 | |||||||||
| 24,730 | Bradley Pharmaceuticals, Inc.* | 485,450 | |||||||||
| 19,318 | Cambrex Corp. | 468,655 | |||||||||
| 27,245 | Chindex International, Inc.* | 547,352 | |||||||||
| 27,530 | Cholestech Corp.* | 533,531 | |||||||||
| 26,059 | Cross Country Healthcare, Inc.* | 513,102 | |||||||||
| 56,484 | CryoLife, Inc.* | 556,367 | |||||||||
| 16,471 | Cynosure, Inc., Class A* | 515,048 | |||||||||
| 62,512 | Cypress Bioscience, Inc.* | 569,485 | |||||||||
| 23,543 | Gentiva Health Services, Inc.* | 440,725 | |||||||||
| 18,606 | Greatbatch, Inc.* | 540,132 | |||||||||
| 40,678 | Hanger Orthopedic Group, Inc.* | 484,882 | |||||||||
| 21,692 | HMS Holdings Corp.* | 480,695 | |||||||||
| 120,847 | I-trax, Inc.* | 537,769 | |||||||||
| 25,299 | Lifecore Biomedical, Inc.* | 468,537 | |||||||||
| 42,577 | Maxygen, Inc.* | 456,851 | |||||||||
| 17,420 | MedCath Corp.* | 517,722 | |||||||||
| 20,458 | Noven Pharmaceuticals, Inc.* | 478,922 | |||||||||
| 62,180 | Osteotech, Inc.* | 472,568 | |||||||||
| 18,274 | PharmaNet Development Group, Inc.* | 498,697 | |||||||||
| 27,150 | Res-Care, Inc.* | 485,985 | |||||||||
| 20,837 | Rochester Medical Corp.* | 488,628 | |||||||||
| 39,491 | Savient Pharmaceuticals, Inc.* | 454,147 | |||||||||
| 56,199 | Sonic Innovations, Inc.* | 552,436 | |||||||||
| 35,124 | Synovis Life Technologies, Inc.* | 450,641 | |||||||||
| 75,850 | Theragenics Corp.* | 456,617 | |||||||||
| 17,800 | Zoll Medical Corp.* | 430,226 | |||||||||
| 14,233,366 | |||||||||||
| Industrials—14.3% | |||||||||||
| 32,514 | Accuride Corp.* | 475,030 | |||||||||
| 7,215 | Ameron International Corp. | 498,845 | |||||||||
| 16,423 | Ampco-Pittsburgh Corp. | 591,556 | |||||||||
| 6,171 | Amrep Corp. | 371,864 | |||||||||
| 17,230 | Angelica Corp. | 448,669 | |||||||||
| 11,297 | AZZ, Inc.* | 645,059 | |||||||||
| 30,188 | Bowne & Co., Inc. | 503,536 | |||||||||
| Number of Shares | Value | ||||||||||
| Common Stocks (Continued) | |||||||||||
| 16,423 | CDI Corp. | $ | 486,449 | ||||||||
| 59,569 | China Yuchai International Ltd. (Bermuda) | 551,013 | |||||||||
| 13,290 | CIRCOR International, Inc. | 483,756 | |||||||||
| 23,068 | Commercial Vehicle Group, Inc.* | 453,517 | |||||||||
| 39,634 | Comfort Systems USA, Inc. | 495,029 | |||||||||
| 23,875 | COMSYS IT Partners, Inc.* | 543,395 | |||||||||
| 23,495 | Cornell Cos., Inc.* | 562,000 | |||||||||
| 21,929 | Cubic Corp. | 441,431 | |||||||||
| 18,464 | Ducommun, Inc.* | 526,593 | |||||||||
| 24,492 | Eagle Bulk Shipping, Inc. (Marshall Islands) | 551,560 | |||||||||
| 17,467 | Eastern (The) Co. | 456,937 | |||||||||
| 17,752 | Ennis, Inc. | 434,036 | |||||||||
| 23,828 | Exponent, Inc.* | 503,962 | |||||||||
| 81,308 | ExpressJet Holdings, Inc.* | 485,409 | |||||||||
| 52,212 | First Consulting Group, Inc.* | 519,509 | |||||||||
| 79,030 | Frontier Airlines Holdings, Inc.* | 467,858 | |||||||||
| 14,809 | Gorman-Rupp (The) Co. | 474,925 | |||||||||
| 18,132 | Hardinge, Inc. | 504,251 | |||||||||
| 43,194 | Hi-Shear Technology Corp. | 479,885 | |||||||||
| 11,107 | Hurco Cos., Inc.* | 489,930 | |||||||||
| 30,378 | Jinpan International Ltd. (British Virgin Islands) | 654,342 | |||||||||
| 18,749 | Kadant, Inc.* | 514,660 | |||||||||
| 20,363 | Kaman Corp. | 505,002 | |||||||||
| 34,507 | Kforce, Inc.* | 473,781 | |||||||||
| 23,021 | L.B. Foster Co., Class A* | 529,023 | |||||||||
| 12,626 | Ladish Co., Inc.* | 513,373 | |||||||||
| 13,053 | Layne Christensen Co.* | 494,317 | |||||||||
| 25,489 | LMI Aerospace, Inc.* | 496,016 | |||||||||
| 34,365 | LSI Industries, Inc. | 541,592 | |||||||||
| 29,903 | Lydall, Inc.* | 434,790 | |||||||||
| 25,631 | MFRI, Inc.* | 478,787 | |||||||||
| 64,790 | Navios Maritime Holdings, Inc. (Marshall Islands) | 566,913 | |||||||||
| 23,021 | P.A.M. Transportation Services, Inc.* | 439,010 | |||||||||
| 41,485 | PeopleSupport, Inc.* | 521,466 | |||||||||
| 27,483 | Pinnacle Airlines Corp.* | 449,897 | |||||||||
| 14,857 | Powell Industries, Inc.* | 467,847 | |||||||||
| 12,721 | Robbins & Myers, Inc. | 488,868 | |||||||||
| 24,730 | Rush Enterprises, Inc., Class A* | 514,384 | |||||||||
| 53,826 | Spherion Corp.* | 460,212 | |||||||||
| 13,718 | Superior Essex, Inc.* | 489,733 | |||||||||
| 15,094 | Tennant Co. | 483,310 | |||||||||
| 18,749 | Titan International, Inc. | 528,347 | |||||||||
| 11,107 | Twin Disc, Inc. | 672,640 | |||||||||
| 27,530 | U.S. Xpress Enterprises, Inc., Class A* | 394,230 | |||||||||
| 18,132 | Volt Information Sciences, Inc.* | 463,454 | |||||||||
| 17,277 | Waste Industries USA, Inc. | 453,694 | |||||||||
| 47,798 | Waste Services, Inc.* | 472,244 | |||||||||
| 62,512 | WCA Waste Corp.* | 566,359 | |||||||||
| 27,514,295 | |||||||||||
See Notes to Financial Statements.
60
Schedule of Investments (Continued)
PowerShares Zacks Micro Cap Portfolio
April 30, 2007
| Number of Shares | Value | ||||||||||
| Common Stocks (Continued) | |||||||||||
| Information Technology—20.9% | |||||||||||
| 29,998 | Acacia Research - Acacia Technologies* | $ | 447,570 | ||||||||
| 28,764 | Actel Corp.* | 421,105 | |||||||||
| 94,029 | ActivIdentity Corp.* | 468,264 | |||||||||
| 68,350 | Agile Software Corp.* | 491,437 | |||||||||
| 249,954 | Alliance Fiber Optic Products, Inc.* | 499,908 | |||||||||
| 26,960 | Anaren, Inc.* | 510,083 | |||||||||
| 69,110 | AsiaInfo Holdings, Inc.* | 531,456 | |||||||||
| 27,008 | Authorize.Net Holdings, Inc.* | 476,421 | |||||||||
| 41,580 | Avici Systems, Inc.* | 330,561 | |||||||||
| 99,156 | AXT, Inc.* | 397,616 | |||||||||
| 74,189 | Bell Microproducts, Inc.* | 504,485 | |||||||||
| 90,137 | Borland Software Corp.* | 502,063 | |||||||||
| 55,013 | CalAmp Corp.* | 458,258 | |||||||||
| 82,020 | Captaris, Inc.* | 495,401 | |||||||||
| 92,938 | Carrier Access Corp.* | 447,032 | |||||||||
| 34,270 | C-COR, Inc.* | �� | 422,206 | ||||||||
| 68,730 | ChipMOS TECHNOLOGIES Ltd. (Bermuda)* | 475,612 | |||||||||
| 60,329 | Ciber, Inc.* | 491,681 | |||||||||
| 34,460 | Cray, Inc.* | 429,027 | |||||||||
| 34,365 | CTS Corp. | 449,494 | |||||||||
| 60,661 | Datalink Corp.* | 380,344 | |||||||||
| 37,403 | Digi International, Inc.* | 476,888 | |||||||||
| 46,991 | Digimarc Corp.* | 453,463 | |||||||||
| 58,478 | Ditech Networks, Inc.* | 508,759 | |||||||||
| 19,603 | DTS, Inc.* | 438,715 | |||||||||
| 45,045 | Echelon Corp.* | 583,333 | |||||||||
| 56,294 | Edgewater Technology, Inc.* | 495,387 | |||||||||
| 24,635 | EMS Technologies, Inc.* | 462,645 | |||||||||
| 49,981 | eSpeed, Inc., Class A* | 462,824 | |||||||||
| 35,884 | Exar Corp.* | 483,716 | |||||||||
| 76,704 | Exfo Electro-Optical Engineering, Inc. (Canada)* | 510,082 | |||||||||
| 16,471 | FARO Technologies, Inc.* | 526,743 | |||||||||
| 16,755 | Forrester Research, Inc.* | 431,944 | |||||||||
| 44,760 | Gerber Scientific, Inc.* | 448,048 | |||||||||
| 28,384 | GigaMedia Ltd. (Singapore)* | 399,647 | |||||||||
| 44,380 | Globecomm Systems, Inc.* | 594,247 | |||||||||
| 29,856 | Greenfield Online, Inc.* | 488,444 | |||||||||
| 20,363 | Hutchinson Technology, Inc.* | 386,897 | |||||||||
| 31,944 | Infocrossing, Inc.* | 510,785 | |||||||||
| 44,380 | Internet Capital Group, Inc.* | 531,229 | |||||||||
| 28,100 | Interwoven, Inc.* | 429,087 | |||||||||
| 126,638 | Iomega Corp.* | 505,286 | |||||||||
| 31,612 | JDA Software Group, Inc.* | 562,694 | |||||||||
| 62,085 | KEMET Corp.* | 526,481 | |||||||||
| 35,409 | Keynote Systems, Inc.* | 481,562 | |||||||||
| 118,759 | Leadis Technology, Inc.* | 410,906 | |||||||||
| 57,766 | Merix Corp.* | 430,934 | |||||||||
| 32,134 | Methode Electronics, Inc. | 484,581 | |||||||||
| 133,805 | MRV Communications, Inc.* | 464,303 | |||||||||
| Number of Shares | Value | ||||||||||
| Common Stocks (Continued) | |||||||||||
| 114,724 | Napster, Inc.* | $ | 465,779 | ||||||||
| 32,182 | NCI, Inc., Class A* | 474,041 | |||||||||
| 37,166 | Ness Technologies, Inc.* | 495,794 | |||||||||
| 52,497 | Netscout Systems, Inc.* | 432,050 | |||||||||
| 48,984 | Network Equipment Technologies, Inc.* | 526,578 | |||||||||
| 29,618 | Novatel Wireless, Inc.* | 538,751 | |||||||||
| 45,092 | NU Horizons Electronics Corp.* | 509,540 | |||||||||
| 26,438 | Oplink Communications, Inc.* | 438,078 | |||||||||
| 35,172 | OPNET Technologies, Inc.* | 395,685 | |||||||||
| 17,942 | OSI Systems, Inc.* | 473,848 | |||||||||
| 49,791 | Pacific Internet Ltd. (Singapore)* | 491,437 | |||||||||
| 33,226 | PC Connection, Inc.* | 426,290 | |||||||||
| 46,706 | PC-Tel, Inc.* | 466,593 | |||||||||
| 51,358 | Pegasystems, Inc. | 488,928 | |||||||||
| 52,782 | Perceptron, Inc.* | 473,982 | |||||||||
| 48,557 | Pericom Semiconductor Corp.* | 486,056 | |||||||||
| 28,052 | Qiao Xing Universal Telephone, Inc. (British Virgin Islands)* | 462,858 | |||||||||
| 50,836 | Richardson Electronics, Ltd. | 445,832 | |||||||||
| 27,245 | Rudolph Technologies, Inc.* | 470,521 | |||||||||
| 79,173 | S1 Corp.* | 514,625 | |||||||||
| 160,434 | Safeguard Scientifics, Inc.* | 482,906 | |||||||||
| 58,335 | SeaChange International, Inc.* | 501,681 | |||||||||
| 56,816 | SonicWALL, Inc.* | 463,619 | |||||||||
| 38,637 | Spectrum Control, Inc.* | 526,236 | |||||||||
| 34,080 | SRS Labs, Inc.* | 449,856 | |||||||||
| 67,449 | STEC, Inc.* | 542,290 | |||||||||
| 64,031 | Stratos International, Inc.* | 514,169 | |||||||||
| 59,522 | SumTotal Systems, Inc.* | 473,795 | |||||||||
| 84,204 | SupportSoft, Inc.* | 452,176 | |||||||||
| 22,356 | SYNNEX Corp.* | 437,060 | |||||||||
| 127,682 | TeleCommunication Systems, Inc., Class A* | 514,558 | |||||||||
| 24,540 | Telvent GIT, S.A. (Spain)* | 466,996 | |||||||||
| 17,467 | Tessco Technologies, Inc.* | 497,810 | |||||||||
| 37,830 | Tollgrade Communications, Inc.* | 452,069 | |||||||||
| 27,435 | Ultra Clean Holdings, Inc.* | 401,648 | |||||||||
| 25,584 | Vignette Corp.* | 473,816 | |||||||||
| 40,247,605 | |||||||||||
| Materials—4.3% | |||||||||||
| 20,173 | A. Schulman, Inc. | 467,207 | |||||||||
| 36,596 | Buckeye Technologies, Inc.* | 463,671 | |||||||||
| 31,470 | Chesapeake Corp. | 464,497 | |||||||||
| 77,369 | ICO, Inc.* | 512,956 | |||||||||
| 8,259 | Innospec, Inc. | 443,426 | |||||||||
| 33,511 | Landec Corp.* | 425,925 | |||||||||
| 39,729 | Mercer International, Inc.* | 487,078 | |||||||||
| 11,914 | Northwest Pipe Co.* | 425,926 | |||||||||
| 10,727 | Novamerican Steel, Inc. (Canada)* | 539,567 | |||||||||
| 15,331 | Olympic Steel, Inc. | 510,216 | |||||||||
| 77,843 | PolyOne Corp.* | 510,650 | |||||||||
| 70,344 | Pope & Talbot, Inc.* | 522,656 | |||||||||
See Notes to Financial Statements.
61
Schedule of Investments (Continued)
PowerShares Zacks Micro Cap Portfolio
April 30, 2007
| Number of Shares | Value | ||||||||||
| Common Stocks (Continued) | |||||||||||
| 19,129 | Schweitzer-Mauduit International, Inc. | $ | 525,091 | ||||||||
| 18,084 | Stepan Co. | 517,926 | |||||||||
| 32,989 | Tronox, Inc., Class A | 466,135 | |||||||||
| 10,015 | Universal Stainless & Alloy Products, Inc.* | 446,068 | |||||||||
| 20,030 | Wheeling-Pittsburgh Corp.* | 483,524 | |||||||||
| 8,212,519 | |||||||||||
| Telecommunication Services—1.3% | |||||||||||
| 18,179 | Atlantic Tele-Network, Inc. | 458,838 | |||||||||
| 19,698 | CT Communications, Inc. | 480,828 | |||||||||
| 35,647 | D&E Communications, Inc. | 519,733 | |||||||||
| 57,576 | Gilat Satellite Networks Ltd. (Israel)* | 525,094 | |||||||||
| 43,573 | InPhonic, Inc.* | 415,686 | |||||||||
| 2,400,179 | |||||||||||
| Utilities—0.7% | |||||||||||
| 16,471 | Central Vermont Public Service Corp. | 530,366 | |||||||||
| 121,464 | Star Gas Partners LP* | 493,144 | |||||||||
| 103,475 | U.S. Energy Systems, Inc.* | 399,413 | |||||||||
| 1,422,923 | |||||||||||
| Total Common Stocks (Cost $178,446,306) | 191,859,391 | ||||||||||
| Rights—0.0% | |||||||||||
| 91,636 | Hayes Lemmerz International, Inc. - Rights* (Cost $0) | — | |||||||||
| Money Market Fund—0.1% | |||||||||||
| 257,574 | Liquid Assets Portfolio Private Class** (Cost $257,574) | 257,574 | |||||||||
| Total Investments (Cost $178,703,880)—99.9% | 192,116,965 | ||||||||||
| Other assets less liabilities—0.1% | 193,225 | ||||||||||
| Net Assets—100.0% | $ | 192,310,190 | |||||||||
* Non-income producing security.
** Affiliated investment.
COUNTRY BREAKDOWN
April 30, 2007 (Unaudited)
| Value | Net Assets | ||||||||||
| United States | $ | 182,377,235 | 94.8 | % | |||||||
| Bermuda | 2,485,970 | 1.3 | |||||||||
| Canada | 1,606,841 | 0.8 | |||||||||
| British Virgin Islands | 1,575,389 | 0.8 | |||||||||
| Marshall Islands | 1,118,473 | 0.6 | |||||||||
| Singapore | 891,084 | 0.5 | |||||||||
| Panama | 558,843 | 0.3 | |||||||||
| Israel | 525,094 | 0.3 | |||||||||
| Cayman Islands | 511,040 | 0.3 | |||||||||
| Spain | 466,996 | 0.2 | |||||||||
| Total investments | 192,116,965 | 99.9 | |||||||||
| Other assets less liabilities | 193,225 | 0.1 | |||||||||
| Net Assets | $ | 192,310,190 | 100.0 | % | |||||||
See Notes to Financial Statements.
62
Schedule of Investments
PowerShares Zacks Small Cap Portfolio
April 30, 2007
| Number of Shares | Value | ||||||||||
| Common Stocks—99.7% | |||||||||||
| Consumer Discretionary—19.0% | |||||||||||
| 6,368 | Ambassadors International, Inc. | $ | 260,579 | ||||||||
| 11,735 | American Greetings Corp., Class A | 298,656 | |||||||||
| 6,087 | Arbitron, Inc. | 299,967 | |||||||||
| 16,046 | Arctic Cat, Inc. | 285,619 | |||||||||
| 18,543 | Audiovox Corp., Class A* | 266,834 | |||||||||
| 42,765 | Blockbuster, Inc., Class A* | 265,143 | |||||||||
| 21,748 | Bluegreen Corp.* | 240,315 | |||||||||
| 15,485 | Books-A-Million, Inc. | 258,290 | |||||||||
| 7,786 | Brown Shoe Co., Inc. | 210,066 | |||||||||
| 8,485 | Buckle (The), Inc. | 302,236 | |||||||||
| 5,680 | Buffalo Wild Wings, Inc.* | 370,790 | |||||||||
| 9,510 | Build-A-Bear-Workshop, Inc.* | 262,000 | |||||||||
| 14,286 | Centerplate, Inc. | 255,148 | |||||||||
| 29,043 | China Automotive Systems, Inc.* | 218,113 | |||||||||
| 4,706 | Chipotle Mexican Grill, Inc., Class A* | 306,972 | |||||||||
| 4,466 | Deckers Outdoor Corp.* | 338,210 | |||||||||
| 27,359 | dELiA*s, Inc.* | 235,561 | |||||||||
| 53,102 | Denny's Corp.* | 249,048 | |||||||||
| 5,520 | Dick's Sporting Goods, Inc.* | 309,617 | |||||||||
| 12,893 | Dress Barn (The), Inc.* | 256,700 | |||||||||
| 7,109 | DSW, Inc., Class A* | 275,545 | |||||||||
| 15,316 | FTD Group, Inc. | 273,391 | |||||||||
| 22,936 | Gaiam, Inc., Class A* | 348,857 | |||||||||
| 42,215 | Home Solutions of America, Inc.* | 200,099 | |||||||||
| 15,410 | iRobot Corp.* | 244,248 | |||||||||
| 7,840 | J. Crew Group, Inc.* | 317,442 | |||||||||
| 11,222 | Jo-Ann Stores, Inc.* | 336,099 | |||||||||
| 11,665 | Kimball International, Inc., Class B | 209,970 | |||||||||
| 8,934 | K-Swiss, Inc., Class A | 258,014 | |||||||||
| 22,035 | La-Z-Boy, Inc. | 257,589 | |||||||||
| 10,395 | LodgeNet Entertainment Corp.* | 354,262 | |||||||||
| 21,599 | Lodgian, Inc.* | 298,498 | |||||||||
| 15,532 | Martha Stewart Living Omnimedia, Inc., Class A | 295,263 | |||||||||
| 36,599 | Mediacom Communications Corp., Class A* | 315,849 | |||||||||
| 10,716 | Modine Manufacturing Co. | 247,861 | |||||||||
| 27,631 | Multimedia Games, Inc.* | 309,467 | |||||||||
| 12,474 | Netflix, Inc.* | 276,549 | |||||||||
| 14,933 | Noble International, Ltd. | 243,259 | |||||||||
| 21,485 | Outdoor Channel Holdings, Inc.* | 221,295 | |||||||||
| 12,256 | Riviera Holdings Corp.* | 366,822 | |||||||||
| 23,715 | Sinclair Broadcast Group, Inc., Class A | 387,266 | |||||||||
| 8,823 | Stage Stores, Inc. | 194,547 | |||||||||
| 10,150 | Standard-Pacific Corp. | 211,627 | |||||||||
| 39,336 | Stewart Enterprises, Inc., Class A | 295,807 | |||||||||
| 29,856 | Technical Olympic USA, Inc. | 130,471 | |||||||||
| 14,237 | Town Sports International Holdings, Inc.* | 324,461 | |||||||||
| 12,014 | Tupperware Brands Corp. | 337,834 | |||||||||
| 9,945 | Warnaco Group (The), Inc.* | 281,245 | |||||||||
| 17,688 | World Wrestling Entertainment, Inc., Class A | 300,873 | |||||||||
| 13,604,374 | |||||||||||
| Number of Shares | Value | ||||||||||
| Common Stocks (Continued) | |||||||||||
| Consumer Staples—3.6% | |||||||||||
| 6,936 | Andersons (The), Inc. | $ | 322,177 | ||||||||
| 14,684 | Elizabeth Arden, Inc.* | 330,537 | |||||||||
| 4,855 | Green Mountain Coffee Roasters, Inc.* | 296,738 | |||||||||
| 8,896 | Imperial Sugar Co. | 264,745 | |||||||||
| 25,911 | Pathmark Stores, Inc.* | 326,997 | |||||||||
| 9,368 | Sanderson Farms, Inc. | 370,317 | |||||||||
| 28,978 | Topps (The) Co., Inc. | 287,172 | |||||||||
| 18,973 | Wild Oats Markets, Inc.* | 342,083 | |||||||||
| 2,540,766 | |||||||||||
| Energy—8.5% | |||||||||||
| 15,808 | Allis-Chalmers Energy, Inc.* | 305,885 | |||||||||
| 9,137 | Bill Barrett Corp.* | 337,155 | |||||||||
| 8,792 | Copano Energy LLC | 343,416 | |||||||||
| 7,571 | Dril-Quip, Inc.* | 382,336 | |||||||||
| 23,939 | Exploration Co. of Delaware (The)* | 248,247 | |||||||||
| 7,444 | GMX Resources, Inc.* | 249,374 | |||||||||
| 7,826 | Goodrich Petroleum Corp.* | 274,927 | |||||||||
| 7,799 | Gulf Island Fabrication, Inc. | 234,204 | |||||||||
| 7,914 | GulfMark Offshore, Inc.* | 379,081 | |||||||||
| 8,880 | Markwest Energy Partners, LP | 333,000 | |||||||||
| 15,253 | Matrix Service Co.* | 372,173 | |||||||||
| 7,866 | Nordic American Tanker Shipping Ltd. (Bermuda) | 302,998 | |||||||||
| 17,063 | Pacific Ethanol, Inc.* | 252,532 | |||||||||
| 14,442 | Parallel Petroleum Corp.* | 333,755 | |||||||||
| 3,884 | Penn Virginia Corp. | 310,914 | |||||||||
| 8,215 | Teekay LNG Partners, LP (Marshall Islands) | 316,688 | |||||||||
| 8,570 | Trico Marine Services, Inc.* | 331,745 | |||||||||
| 20,708 | USEC, Inc.* | 417,680 | |||||||||
| 6,948 | Williams Partners LP | 333,018 | |||||||||
| 6,059,128 | |||||||||||
| Financials—12.1% | |||||||||||
| 13,213 | 21st Century Insurance Group | 274,963 | |||||||||
| 7,253 | American Physicians Capital, Inc.* | 286,784 | |||||||||
| 17,743 | Amerisafe, Inc.* | 357,167 | |||||||||
| 7,997 | Argonaut Group, Inc.* | 268,779 | |||||||||
| 21,446 | Brookline Bancorp, Inc. | 255,636 | |||||||||
| 13,788 | CNA Surety Corp.* | 284,584 | |||||||||
| 3,982 | Downey Financial Corp. | 266,595 | |||||||||
| 16,944 | EZCORP, Inc., Class A* | 256,702 | |||||||||
| 21,521 | First Commonwealth Financial Corp. | 239,529 | |||||||||
| 36,043 | Friedman, Billings, Ramsey Group, Inc., Class A | 200,039 | |||||||||
| 15,387 | Knight Capital Group, Inc., Class A* | 249,269 | |||||||||
| 22,307 | MarketAxess Holdings, Inc.* | 365,389 | |||||||||
| 14,263 | MCG Capital Corp. | 251,314 | |||||||||
| 7,954 | MI Developments, Inc., Class A (Cananda) | 308,615 | |||||||||
| 6,060 | Navigators Group (The), Inc.* | 309,605 | |||||||||
| 6,936 | NYMAGIC, Inc. | 284,029 | |||||||||
| 9,607 | Ohio Casualty Corp. | 303,965 | |||||||||
See Notes to Financial Statements.
63
Schedule of Investments (Continued)
PowerShares Zacks Small Cap Portfolio
April 30, 2007
| Number of Shares | Value | ||||||||||
| Common Stocks (Continued) | |||||||||||
| 24,761 | Partners Trust Financial Group, Inc. | $ | 274,352 | ||||||||
| 19,353 | Phoenix (The) Cos., Inc. | 288,360 | |||||||||
| 4,152 | Piper Jaffray Cos., Inc.* | 264,939 | |||||||||
| 5,851 | Potlatch Corp. | 253,875 | |||||||||
| 5,603 | ProAssurance Corp.* | 301,666 | |||||||||
| 8,043 | Provident Bankshares Corp. | 257,698 | |||||||||
| 5,042 | RLI Corp. | 280,789 | |||||||||
| 26,133 | Sanders Morris Harris Group, Inc. | 304,972 | |||||||||
| 15,527 | SeaBright Insurance Holdings, Inc.* | 288,336 | |||||||||
| 9,570 | TierOne Corp. | 232,455 | |||||||||
| 22,162 | TradeStation Group, Inc.* | 269,933 | |||||||||
| 12,106 | United America Indemnity Ltd., Class A (Cayman Islands)* | 302,408 | |||||||||
| 8,406 | United Fire & Casualty Co. | 308,920 | |||||||||
| 6,465 | World Acceptance Corp.* | 277,542 | |||||||||
| 8,669,209 | |||||||||||
| Health Care—16.3% | |||||||||||
| 6,309 | Adams Respiratory Therapeutics, Inc.* | 236,651 | |||||||||
| 18,642 | Alkermes, Inc.* | 306,288 | |||||||||
| 11,248 | AMN Healthcare Services, Inc.* | 273,889 | |||||||||
| 4,792 | Analogic Corp. | 293,750 | |||||||||
| 18,064 | Applera Corp. - Celera Group* | 252,896 | |||||||||
| 17,470 | Aspect Medical Systems, Inc.* | 268,339 | |||||||||
| 15,098 | BioMarin Pharmaceuticals, Inc.* | 243,984 | |||||||||
| 13,880 | Bradley Pharmaceuticals, Inc.* | 272,464 | |||||||||
| 6,029 | CorVel Corp.* | 163,928 | |||||||||
| 34,014 | Cypress Bioscience, Inc.* | 309,868 | |||||||||
| 26,156 | Dendrite International, Inc.* | 415,880 | |||||||||
| 28,167 | Diversa Corp.* | 204,774 | |||||||||
| 13,618 | FoxHollow Technologies, Inc.* | 303,545 | |||||||||
| 13,526 | Given Imaging Ltd. (Israel)* | 331,252 | |||||||||
| 14,511 | HMS Holdings Corp.* | 321,564 | |||||||||
| 7,264 | Illumina, Inc.* | 237,024 | |||||||||
| 7,960 | inVentiv Health, Inc.* | 302,082 | |||||||||
| 6,875 | Inverness Medical Innovations, Inc.* | 275,344 | |||||||||
| 27,123 | Isis Pharmaceuticals, Inc.* | 277,468 | |||||||||
| 12,200 | Martek Biosciences Corp.* | 263,398 | |||||||||
| 9,729 | MedCath Corp.* | 289,146 | |||||||||
| 9,308 | Medicines (The) Co.* | 212,036 | |||||||||
| 7,445 | Medicis Pharmaceutical Corp., Class A | 226,328 | |||||||||
| 14,289 | MGI Pharma, Inc.* | 314,644 | |||||||||
| 11,923 | Micrus Endovascular Corp.* | 265,048 | |||||||||
| 22,695 | Nektar Therapeutics* | 280,737 | |||||||||
| 8,310 | Omrix Biopharmaceuticals, Inc.* | 295,005 | |||||||||
| 34,201 | OraSure Technologies, Inc.* | 254,797 | |||||||||
| 31,656 | Pain Therapeutics, Inc.* | 245,967 | |||||||||
| 13,918 | PharmaNet Development Group, Inc.* | 379,822 | |||||||||
| 8,928 | Pharmion Corp.* | 270,429 | |||||||||
| 20,435 | Quidel Corp.* | 285,681 | |||||||||
| 19,038 | Savient Pharmaceuticals, Inc.* | 218,937 | |||||||||
| 14,632 | Somanetics Corp.* | 276,545 | |||||||||
| Number of Shares | Value | ||||||||||
| Common Stocks (Continued) | |||||||||||
| 8,657 | SonoSite, Inc.* | $ | 250,880 | ||||||||
| 21,700 | Trimeris, Inc.* | 166,439 | |||||||||
| 13,668 | TriZetto Group (The), Inc.* | 266,253 | |||||||||
| 27,233 | Visicu, Inc.* | 248,637 | |||||||||
| 14,234 | Volcano Corp.* | 287,242 | |||||||||
| 5,721 | WebMD Health Corp., Class A* | 297,492 | |||||||||
| 13,051 | Wright Medical Group, Inc.* | 308,265 | |||||||||
| 8,658 | Zoll Medical Corp.* | 209,264 | |||||||||
| 17,662 | ZymoGenetics, Inc.* | 264,224 | |||||||||
| 11,668,206 | |||||||||||
| Industrials—11.0% | |||||||||||
| 9,458 | AAR CORP.* | 288,847 | |||||||||
| 10,717 | ABM Industries, Inc. | 301,576 | |||||||||
| 8,939 | Aircastle Ltd. (Bermuda) | 298,563 | |||||||||
| 5,730 | Alexander & Baldwin, Inc. | 306,268 | |||||||||
| 7,497 | A.O. Smith Corp. | 285,636 | |||||||||
| 22,595 | Casella Waste Systems, Inc., Class A* | 210,134 | |||||||||
| 14,220 | Central Parking Corp. | 318,244 | |||||||||
| 17,584 | Chart Industries, Inc.* | 331,458 | |||||||||
| 8,231 | CLARCOR, Inc. | 259,606 | |||||||||
| 5,054 | Copa Holdings SA, Class A (Panama) | 307,688 | |||||||||
| 5,999 | CoStar Group, Inc.* | 292,811 | |||||||||
| 9,672 | Fuel Tech. Inc.* | 243,154 | |||||||||
| 18,808 | GenCorp, Inc.* | 250,523 | |||||||||
| 10,108 | Genesee & Wyoming, Inc., Class A* | 274,837 | |||||||||
| 14,686 | Hexcel Corp.* | 318,686 | |||||||||
| 12,169 | Houston Wire & Cable Co* | 358,742 | |||||||||
| 17,781 | Hudson Highland Group, Inc.* | 290,008 | |||||||||
| 8,102 | Layne Christensen Co.* | 306,823 | |||||||||
| 9,582 | McGrath RentCorp | 288,897 | |||||||||
| 12,227 | PeopleSupport, Inc.* | 153,693 | |||||||||
| 8,539 | PW Eagle, Inc. | 277,005 | |||||||||
| 9,132 | Superior Essex, Inc.* | 326,012 | |||||||||
| 10,366 | TeleTech Holdings, Inc.* | 391,109 | |||||||||
| 5,051 | Triumph Group, Inc. | 307,151 | |||||||||
| 7,409 | Viad Corp. | 302,584 | |||||||||
| 7,914 | Volt Information Sciences, Inc.* | 202,282 | |||||||||
| 4,996 | Washington Group International, Inc.* | 334,332 | |||||||||
| 7,826,669 | |||||||||||
| Information Technology—19.5% | |||||||||||
| 16,002 | Actel Corp.* | 234,269 | |||||||||
| 36,387 | AsiaInfo Holdings, Inc.* | 279,816 | |||||||||
| 21,460 | Bottomline Technologies, Inc.* | 266,533 | |||||||||
| 20,242 | C-COR, Inc.* | 249,381 | |||||||||
| 14,474 | Cohu, Inc. | 297,875 | |||||||||
| 13,315 | Color Kinetics, Inc.* | 269,629 | |||||||||
| 8,687 | CommScope, Inc.* | 405,249 | |||||||||
| 12,449 | Covansys Corp.* | 415,797 | |||||||||
| 7,984 | Daktronics, Inc. | 181,876 | |||||||||
| 8,303 | Dolby Laboratories, Inc., Class A* | 294,092 | |||||||||
| 37,354 | Echelon Corp.* | 483,734 | |||||||||
See Notes to Financial Statements.
64
Schedule of Investments (Continued)
PowerShares Zacks Small Cap Portfolio
April 30, 2007
| Number of Shares | Value | ||||||||||
| Common Stocks (Continued) | |||||||||||
| 21,653 | Exar Corp.* | $ | 291,882 | ||||||||
| 11,337 | FARO Technologies, Inc.* | 362,557 | |||||||||
| 9,094 | FLIR Systems, Inc.* | 368,216 | |||||||||
| 20,108 | Greenfield Online, Inc.* | 328,967 | |||||||||
| 30,950 | Harmonic, Inc.* | 255,956 | |||||||||
| 12,694 | Hutchinson Technology, Inc.* | 241,186 | |||||||||
| 12,766 | i2 Technologies, Inc.* | 325,022 | |||||||||
| 12,079 | InfoSpace, Inc.* | 309,947 | |||||||||
| 13,556 | Interactive Intelligence, Inc.* | 198,867 | |||||||||
| 43,682 | Intervoice, Inc.* | 277,818 | |||||||||
| 13,113 | Intevac, Inc.* | 318,777 | |||||||||
| 4,892 | Itron, Inc.* | 329,427 | |||||||||
| 9,354 | Knot (The), Inc.* | 199,521 | |||||||||
| 29,297 | Kulicke & Soffa Industries, Inc.* | 292,384 | |||||||||
| 14,315 | Liquidity Services, Inc.* | 298,897 | |||||||||
| 23,297 | Marchex, Inc., Class B | 297,969 | |||||||||
| 14,972 | Mentor Graphics Corp.* | 242,247 | |||||||||
| 22,040 | Mercury Computer Systems, Inc.* | 299,083 | |||||||||
| 57,431 | Microtune, Inc.* | 247,528 | |||||||||
| 15,605 | NetRatings, Inc.* | 324,740 | |||||||||
| 34,162 | NetScout Systems, Inc.* | 281,153 | |||||||||
| 24,649 | Nuance Communications, Inc.* | 379,841 | |||||||||
| 21,749 | OPNET Technologies, Inc.* | 244,676 | |||||||||
| 16,545 | PC Connection, Inc.* | 212,272 | |||||||||
| 16,773 | Photronics, Inc.* | 252,434 | |||||||||
| 28,767 | SeaChange International, Inc.* | 247,396 | |||||||||
| 25,281 | Semitool, Inc.* | 262,417 | |||||||||
| 7,925 | SINA Corp. (Cayman Islands)* | 273,254 | |||||||||
| 20,481 | Smith Micro Software, Inc.* | 325,443 | |||||||||
| 43,358 | SupportSoft, Inc.* | 232,833 | |||||||||
| 7,625 | Tech Data Corp.* | 270,993 | |||||||||
| 16,098 | Techwell, Inc.* | 229,718 | |||||||||
| 18,444 | Tekelec* | 264,487 | |||||||||
| 20,688 | Tyler Technologies, Inc.* | 247,222 | |||||||||
| 6,492 | VistaPrint Ltd. (Bermuda)* | 242,671 | |||||||||
| 19,687 | WebSide Story, Inc.* | 219,707 | |||||||||
| 13,500 | Xyratex Ltd. (Bermuda)* | 302,130 | |||||||||
| 18,260 | Zygo Corp.* | 292,343 | |||||||||
| 13,970,232 | |||||||||||
| Materials—6.0% | |||||||||||
| 16,200 | Chesapeake Corp. | 239,112 | |||||||||
| 9,053 | Compass Minerals International, Inc. | 310,880 | |||||||||
| 12,450 | Headwaters, Inc.* | 269,792 | |||||||||
| 5,420 | Innospec, Inc. | 291,000 | |||||||||
| 11,077 | Koppers Holdings, Inc. | 320,568 | |||||||||
| 23,111 | Landec Corp.* | 293,741 | |||||||||
| 23,053 | Mercer International, Inc.* | 282,630 | |||||||||
| 6,746 | Metal Management, Inc. | 324,280 | |||||||||
| 5,060 | NewMarket Corp. | 238,478 | |||||||||
| 17,095 | Olin Corp. | 293,008 | |||||||||
| 8,566 | Rock-Tenn Co., Class A | 327,735 | |||||||||
| Number of Shares | Value | ||||||||||
| Common Stocks (Continued) | |||||||||||
| 14,551 | Symyx Technologies, Inc.* | $ | 167,482 | ||||||||
| 20,374 | Terra Industries, Inc.* | 359,397 | |||||||||
| 3,830 | Texas Industries, Inc. | 291,731 | |||||||||
| 11,645 | Wheeling-Pittsburgh Corp.* | 281,110 | |||||||||
| 4,290,944 | |||||||||||
| Telecommunication Services—1.6% | |||||||||||
| 17,578 | Alaska Communications Systems Group, Inc. | 279,490 | |||||||||
| 9,452 | Atlantic Tele-Network, Inc. | 238,569 | |||||||||
| 9,766 | Cbeyond, Inc.* | 339,661 | |||||||||
| 28,937 | Dobson Communications Corp., Class A* | 263,616 | |||||||||
| 1,121,336 | |||||||||||
| Utilities—2.1% | |||||||||||
| 11,148 | Avista Corp. | 262,981 | |||||||||
| 11,564 | El Paso Electric Co.* | 305,290 | |||||||||
| 6,208 | Nicor, Inc. | 318,098 | |||||||||
| 7,204 | Southwest Gas, Corp. | 272,960 | |||||||||
| 7,323 | Suburban Propane Partners, L.P. | 358,827 | |||||||||
| 1,518,156 | |||||||||||
| Total Common Stocks (Cost $68,935,496) | 71,269,020 | ||||||||||
| Money Market Fund—0.0% | |||||||||||
| 24,193 | Liquid Assets Portfolio Private Class** (Cost $24,193) | 24,193 | |||||||||
| Total Investments (Cost $68,959,689)—99.7% | 71,293,213 | ||||||||||
| Other assets less liabilities—0.3% | 236,726 | ||||||||||
| Net Assets—100.0% | $ | 71,529,939 | |||||||||
* Non-income producing security.
** Affiliated Investment.
COUNTRY BREAKDOWN
April 30, 2007 (Unaudited)
| Value | Net Assets | ||||||||||
| United States | $ | 68,306,946 | 95.5 | % | |||||||
| Bermuda | 1,146,362 | 1.6 | |||||||||
| Cayman Islands | 575,662 | 0.8 | |||||||||
| Israel | 331,252 | 0.5 | |||||||||
| Marshall Islands | 316,688 | 0.5 | |||||||||
| Canada | 308,615 | 0.4 | |||||||||
| Panama | 307,688 | 0.4 | |||||||||
| Total investments | 71,293,213 | 99.7 | |||||||||
| Other assets less liabilities | 236,726 | 0.3 | |||||||||
| Net Assets | $ | 71,529,939 | 100.0 | % | |||||||
See Notes to Financial Statements.
65
Statements of Assets and Liabilities
April 30, 2007
| PowerShares Dynamic Large Cap Growth Portfolio | PowerShares Dynamic Large Cap Value Portfolio | PowerShares Dynamic Mid Cap Growth Portfolio | PowerShares Dynamic Mid Cap Value Portfolio | PowerShares Dynamic Small Cap Growth Portfolio | PowerShares Dynamic Small Cap Value Portfolio | PowerShares Dynamic Large Cap Portfolio | |||||||||||||||||||||||||
| ASSETS: | |||||||||||||||||||||||||||||||
| Unaffiliated investment at value | $ | 277,707,840 | $ | 291,988,288 | $ | 189,550,403 | $ | 108,658,796 | $ | 61,384,120 | $ | 117,685,364 | $ | 10,848,238 | |||||||||||||||||
| Affiliated investment at value | 157,501 | — | — | 191,310 | — | — | 43,653 | ||||||||||||||||||||||||
| Cash | — | 48,490 | 364,941 | 545,223 | 13,982 | 6,008 | — | ||||||||||||||||||||||||
| Receivables: | |||||||||||||||||||||||||||||||
| Dividends | 39,066 | 309,188 | 5,953 | 42,029 | 8,296 | 78,031 | 7,355 | ||||||||||||||||||||||||
| Due from Adviser | 25,724 | 61,118 | 16,751 | 15,604 | 11,838 | 16,653 | 5,873 | ||||||||||||||||||||||||
| Capital stock sold | — | — | 2,153,820 | — | — | 1,912,120 | — | ||||||||||||||||||||||||
| Investments sold | — | — | — | — | — | — | — | ||||||||||||||||||||||||
| Other assets | 8,167 | 8,167 | 8,168 | 8,167 | 8,167 | 8,168 | 10,496 | ||||||||||||||||||||||||
| Total Assets | 277,938,298 | 292,415,251 | 192,100,036 | 109,461,129 | 61,426,403 | 119,706,344 | 10,915,615 | ||||||||||||||||||||||||
| LIABILITIES: | |||||||||||||||||||||||||||||||
| Due to custodian | 123,652 | — | — | — | — | — | 64,555 | ||||||||||||||||||||||||
| Payables: | |||||||||||||||||||||||||||||||
| Investments purchased | — | — | 2,155,704 | — | — | 1,911,480 | — | ||||||||||||||||||||||||
| Accrued advisory fees | 111,880 | 121,447 | 73,306 | 43,469 | 25,189 | 46,606 | 5,078 | ||||||||||||||||||||||||
| Accrued expenses | 105,217 | 163,906 | 76,967 | 61,331 | 54,483 | 68,396 | 47,505 | ||||||||||||||||||||||||
| Total Liabilities | 340,749 | 285,353 | 2,305,977 | 104,800 | 79,672 | 2,026,482 | 117,138 | ||||||||||||||||||||||||
| NET ASSETS | $ | 277,597,549 | $ | 292,129,898 | $ | 189,794,059 | $ | 109,356,329 | $ | 61,346,731 | $ | 117,679,862 | $ | 10,798,477 | |||||||||||||||||
| NET ASSETS CONSIST OF: | |||||||||||||||||||||||||||||||
| Paid-in capital | $ | 270,900,675 | $ | 271,074,705 | $ | 182,763,778 | $ | 102,757,546 | $ | 73,181,268 | $ | 119,987,051 | $ | 10,161,099 | |||||||||||||||||
| Undistributed net investment income | — | 1,248,210 | — | 298,057 | — | 25,537 | 18,586 | ||||||||||||||||||||||||
| Accumulated net realized (loss) on investments | (13,829,057 | ) | (1,729,259 | ) | (11,084,493 | ) | (3,723,275 | ) | (16,490,906 | ) | (7,431,615 | ) | (17,445 | ) | |||||||||||||||||
| Net unrealized appreciation on investments | 20,525,931 | 21,536,242 | 18,114,774 | 10,024,001 | 4,656,369 | 5,098,889 | 636,237 | ||||||||||||||||||||||||
| Net Assets | $ | 277,597,549 | $ | 292,129,898 | $ | 189,794,059 | $ | 109,356,329 | $ | 61,346,731 | $ | 117,679,862 | $ | 10,798,477 | |||||||||||||||||
| Shares outstanding (unlimited amount authorized, $0.01 par value) | 15,900,000 | 14,100,000 | 9,000,000 | 5,400,000 | 3,300,000 | 6,300,000 | 400,000 | ||||||||||||||||||||||||
| Net asset value | $ | 17.46 | $ | 20.72 | $ | 21.09 | $ | 20.25 | $ | 18.59 | $ | 18.68 | $ | 27.00 | |||||||||||||||||
| Unaffiliated investments at cost | $ | 257,181,909 | $ | 270,452,046 | $ | 171,435,629 | $ | 98,634,795 | $ | 56,727,751 | $ | 112,586,475 | $ | 10,212,001 | |||||||||||||||||
| Affiliated investments at cost | $ | 157,501 | — | — | 191,310 | — | — | 43,653 | |||||||||||||||||||||||
See Notes to Financial Statements.
66
| PowerShares Dynamic Mid Cap Portfolio | PowerShares Dynamic Small Cap Portfolio | PowerShares Dynamic Aggressive Growth Portfolio | PowerShares Dynamic Deep Value Portfolio | PowerShares Zacks Micro Cap Portfolio | PowerShares Zacks Small Cap Portfolio | ||||||||||||||||||||||
| ASSETS: | |||||||||||||||||||||||||||
| Unaffiliated investment at value | $ | 11,226,868 | $ | 8,032,453 | $ | 10,595,163 | $ | 15,867,578 | $ | 191,859,391 | $ | 71,269,020 | |||||||||||||||
| Affiliated investment at value | 48,241 | 29,042 | 12,057 | 111,523 | 257,574 | 24,193 | |||||||||||||||||||||
| Cash | — | — | — | — | — | 294,882 | |||||||||||||||||||||
| Receivables: | |||||||||||||||||||||||||||
| Dividends | 2,895 | 4,032 | 1,094 | 9,764 | 77,509 | 18,189 | |||||||||||||||||||||
| Due from Adviser | 5,972 | 8,195 | 7,530 | 7,251 | 19,966 | 16,405 | |||||||||||||||||||||
| Capital stock sold | — | — | — | — | — | — | |||||||||||||||||||||
| Investments sold | — | — | — | — | 457,769 | — | |||||||||||||||||||||
| Other assets | 11,106 | 10,494 | 8,245 | 9,781 | 7,152 | — | |||||||||||||||||||||
| Total Assets | 11,295,082 | 8,084,216 | 10,624,089 | 16,005,897 | 192,679,361 | 71,622,689 | |||||||||||||||||||||
| LIABILITIES: | |||||||||||||||||||||||||||
| Due to custodian | 52,922 | 27,951 | 20,859 | 166,237 | 188,657 | — | |||||||||||||||||||||
| Payables: | |||||||||||||||||||||||||||
| Investments purchased | — | — | — | — | — | — | |||||||||||||||||||||
| Accrued advisory fees | 4,558 | 4,096 | 4,337 | 6,430 | 79,376 | 29,523 | |||||||||||||||||||||
| Accrued expenses | 47,184 | 47,033 | 47,187 | 47,612 | 101,138 | 63,227 | |||||||||||||||||||||
| Total Liabilities | 104,664 | 79,080 | 72,383 | 220,279 | 369,171 | 92,750 | |||||||||||||||||||||
| NET ASSETS | $ | 11,190,418 | $ | 8,005,136 | $ | 10,551,706 | $ | 15,785,618 | $ | 192,310,190 | $ | 71,529,939 | |||||||||||||||
| NET ASSETS CONSIST OF: | |||||||||||||||||||||||||||
| Paid-in capital | $ | 10,483,821 | $ | 8,137,235 | $ | 10,121,826 | $ | 15,234,712 | $ | 200,743,714 | $ | 75,969,670 | |||||||||||||||
| Undistributed net investment income | 16,473 | 193 | — | 88,918 | 257,890 | — | |||||||||||||||||||||
| Accumulated net realized (loss) on investments | (77,148 | ) | (420,785 | ) | (201,896 | ) | (52,826 | ) | (22,104,499 | ) | (6,773,255 | ) | |||||||||||||||
| Net unrealized appreciation on investments | 767,272 | 288,493 | 631,776 | 514,814 | 13,413,085 | 2,333,524 | |||||||||||||||||||||
| Net Assets | $ | 11,190,418 | $ | 8,005,136 | $ | 10,551,706 | $ | 15,785,618 | $ | 192,310,190 | $ | 71,529,939 | |||||||||||||||
| Shares outstanding (unlimited amount authorized, $0.01 par value) | 400,000 | 300,000 | 400,000 | 600,000 | 10,500,000 | 2,600,000 | |||||||||||||||||||||
| Net asset value | $ | 27.98 | $ | 26.68 | $ | 26.38 | $ | 26.31 | $ | 18.32 | $ | 27.51 | |||||||||||||||
| Unaffiliated investments at cost | $ | 10,459,596 | $ | 7,743,960 | $ | 9,963,387 | $ | 15,352,764 | $ | 178,446,306 | $ | 68,935,496 | |||||||||||||||
| Affiliated investments at cost | 48,241 | 29,042 | 12,057 | 111,523 | 257,574 | 24,193 | |||||||||||||||||||||
67
Statements of Operations
| PowerShares Dynamic Large Cap Growth Portfolio | PowerShares Dynamic Large Cap Value Portfolio | PowerShares Dynamic Mid Cap Growth Portfolio | PowerShares Dynamic Mid Cap Value Portfolio | PowerShares Dynamic Small Cap Growth Portfolio | PowerShares Dynamic Small Cap Value Portfolio | PowerShares Dynamic Large Cap Portfolio | |||||||||||||||||||||||||
| Year Ended April 30, 2007 | Year Ended April 30, 2007 | Year Ended April 30, 2007 | Year Ended April 30, 2007 | Year Ended April 30, 2007 | Year Ended April 30, 2007 | For the period December 01, 2006* through April 30, 2007 | |||||||||||||||||||||||||
| INVESTMENT INCOME: | |||||||||||||||||||||||||||||||
| Unaffiliated dividend income | $ | 1,444,978 | $ | 6,705,962 | $ | 543,334 | $ | 1,577,593 | $ | 209,802 | $ | 1,064,678 | $ | 109,030 | |||||||||||||||||
| Affiliated dividend income | 4,208 | 16,144 | 18,787 | 9,109 | 75 | 6,982 | 486 | ||||||||||||||||||||||||
| Foreign withholding taxes | — | — | — | — | — | (243 | ) | — | |||||||||||||||||||||||
| Total Income | 1,449,186 | 6,722,106 | 562,121 | 1,586,702 | 209,877 | 1,071,417 | 109,516 | ||||||||||||||||||||||||
| EXPENSES: | |||||||||||||||||||||||||||||||
| Advisory fees | 959,057 | 1,274,562 | 582,772 | 349,618 | 332,868 | 392,569 | 30,709 | ||||||||||||||||||||||||
| Printing | 89,660 | 148,642 | 52,076 | 30,392 | 31,940 | 35,405 | 3,262 | ||||||||||||||||||||||||
| Administration fees | 59,999 | 60,051 | 59,999 | 59,999 | 59,999 | 59,999 | 921 | ||||||||||||||||||||||||
| Licensing | 57,543 | 76,474 | 34,966 | 20,977 | 19,972 | 23,554 | 3,071 | ||||||||||||||||||||||||
| Accounting | 54,999 | 54,998 | 54,998 | 54,998 | 54,998 | 54,998 | 614 | ||||||||||||||||||||||||
| Audit | 16,500 | 16,500 | 16,500 | 16,500 | 16,500 | 16,500 | 16,500 | ||||||||||||||||||||||||
| Custodian & transfer agent fees | 15,582 | 19,185 | 13,230 | 11,201 | 13,681 | 13,711 | 1,508 | ||||||||||||||||||||||||
| Listing fee and expenses | 10,348 | 10,209 | 10,238 | 10,132 | 10,282 | 10,154 | 10,001 | ||||||||||||||||||||||||
| Legal | 9,162 | 11,302 | 5,881 | 3,515 | 4,829 | 3,880 | 5,000 | ||||||||||||||||||||||||
| Trustees | 7,492 | 11,884 | 4,542 | 2,648 | 2,428 | 3,097 | 317 | ||||||||||||||||||||||||
| Registration & filings | 5,644 | 8,121 | 3,472 | 1,961 | — | 2,137 | 425 | ||||||||||||||||||||||||
| Offering costs | — | — | — | — | — | — | 4,526 | ||||||||||||||||||||||||
| Other expenses | 14,127 | 18,366 | 13,335 | 11,722 | 14,931 | 14,181 | 12,419 | ||||||||||||||||||||||||
| Total Expenses | 1,300,113 | 1,710,294 | 852,009 | 573,663 | 562,428 | 630,185 | 89,273 | ||||||||||||||||||||||||
| Less fees waived: | |||||||||||||||||||||||||||||||
| Advisory | (91,092 | ) | (97,962 | ) | (116,666 | ) | (132,535 | ) | (142,404 | ) | (134,256 | ) | (30,709 | ) | |||||||||||||||||
| Other fees assumed by the Adviser | — | — | — | — | — | — | (13,397 | ) | |||||||||||||||||||||||
| Net Expenses | 1,209,021 | 1,612,332 | 735,343 | 441,128 | 420,024 | 495,929 | 45,167 | ||||||||||||||||||||||||
| Net Investment Income (Loss) | 240,165 | 5,109,774 | (173,222 | ) | 1,145,574 | (210,147 | ) | 575,488 | 64,349 | ||||||||||||||||||||||
| REALIZED AND UNREALIZED GAIN (LOSS) ON INVESTMENTS: | |||||||||||||||||||||||||||||||
| Net realized gain (loss) from: | |||||||||||||||||||||||||||||||
| Investments | (11,183,241 | ) | (1,507,094 | ) | (10,112,923 | ) | (3,017,108 | ) | (13,877,331 | ) | (5,655,420 | ) | (17,445 | ) | |||||||||||||||||
| In-kind redemptions | 10,897,165 | 26,157,333 | 12,789,122 | 7,709,436 | 10,521,127 | 12,251,981 | 282,942 | ||||||||||||||||||||||||
| Net realized gain (loss) | (286,076 | ) | 24,650,239 | 2,676,199 | 4,692,328 | (3,356,204 | ) | 6,596,561 | 265,497 | ||||||||||||||||||||||
| Net change in unrealized appreciation/ depreciation on investments | 16,420,488 | 16,864,450 | 13,821,191 | 7,757,823 | (1,366,638 | ) | 1,084,508 | 636,237 | |||||||||||||||||||||||
| Net realized and unrealized gain (loss) on investments | 16,134,412 | 41,514,689 | 16,497,390 | 12,450,151 | (4,722,842 | ) | 7,681,069 | 901,734 | |||||||||||||||||||||||
| Net increase (decrease) in net assets resulting from operations | $ | 16,374,577 | $ | 46,624,463 | $ | 16,324,168 | $ | 13,595,725 | $ | (4,932,989 | ) | $ | 8,256,557 | $ | 966,083 | ||||||||||||||||
* Commencement of Investment Operations.
See Notes to Financial Statements.
68
| PowerShares Dynamic Mid Cap Portfolio | PowerShares Dynamic Small Cap Portfolio | PowerShares Dynamic Aggressive Growth Portfolio | PowerShares Dynamic Deep Value Portfolio | PowerShares Zacks Micro Cap Portfolio | PowerShares Zacks Small Cap Portfolio | ||||||||||||||||||||||
| For the period December 01, 2006* through April 30, 2007 | For the period December 01, 2006* through April 30, 2007 | For the period December 20, 2006* through April 30, 2007 | For the period December 20, 2006* through April 30, 2007 | Year Ended April 30, 2007 | Year Ended April 30, 2007 | ||||||||||||||||||||||
| INVESTMENT INCOME: | |||||||||||||||||||||||||||
| Unaffiliated dividend income | $ | 91,261 | $ | 44,510 | $ | 10,755 | $ | 171,897 | $ | 1,712,452 | $ | 571,618 | |||||||||||||||
| Affiliated dividend income | 402 | 310 | 130 | 811 | 3,772 | 1,325 | |||||||||||||||||||||
| Foreign withholding taxes | — | (23 | ) | — | — | (1,433 | ) | (477 | ) | ||||||||||||||||||
| Total Income | 91,663 | 44,797 | 10,885 | 172,708 | 1,714,791 | 572,466 | |||||||||||||||||||||
| EXPENSES: | |||||||||||||||||||||||||||
| Advisory fees | 27,683 | 28,828 | 22,379 | 27,514 | 806,124 | 315,967 | |||||||||||||||||||||
| Printing | 3,346 | 3,268 | 3,226 | 3,194 | 74,850 | 34,860 | |||||||||||||||||||||
| Administration fees | 830 | 865 | 671 | 825 | 59,999 | 44,939 | |||||||||||||||||||||
| Licensing | 2,768 | 2,883 | 2,238 | 2,752 | 161,225 | 63,193 | |||||||||||||||||||||
| Accounting | 554 | 576 | 448 | 550 | 54,998 | 40,520 | |||||||||||||||||||||
| Audit | 16,500 | 16,500 | 16,500 | 16,500 | 16,500 | 16,500 | |||||||||||||||||||||
| Custodian & transfer agent fees | 1,477 | 3,670 | 1,424 | 1,475 | 26,465 | 7,924 | |||||||||||||||||||||
| Listing fee and expenses | 10,001 | 10,001 | 10,000 | 10,000 | 10,373 | 10,140 | |||||||||||||||||||||
| Legal | 5,000 | 5,000 | 5,000 | 5,000 | 6,398 | 2,369 | |||||||||||||||||||||
| Trustees | 297 | 317 | 261 | 310 | 6,441 | 2,486 | |||||||||||||||||||||
| Registration & filings | 422 | 426 | 417 | 420 | 3,929 | 2,456 | |||||||||||||||||||||
| Offering costs | 4,558 | 4,526 | 3,855 | 3,928 | 7,803 | 6,773 | |||||||||||||||||||||
| Other expenses | 12,234 | 12,333 | 12,235 | 12,884 | 22,655 | 15,149 | |||||||||||||||||||||
| Total Expenses | 85,670 | 89,193 | 78,654 | 85,352 | 1,257,760 | 563,276 | |||||||||||||||||||||
| Less fees waived: | |||||||||||||||||||||||||||
| Advisory | (27,683 | ) | (28,828 | ) | (22,379 | ) | (27,514 | ) | (120,775 | ) | (112,053 | ) | |||||||||||||||
| Other fees assumed by the Adviser | (16,907 | ) | (17,728 | ) | (22,792 | ) | (16,959 | ) | — | — | |||||||||||||||||
| Net Expenses | 41,080 | 42,637 | 33,483 | 40,879 | 1,136,985 | 451,223 | |||||||||||||||||||||
| Net Investment Income (Loss) | 50,583 | 2,160 | (22,598 | ) | 131,829 | 577,806 | 121,243 | ||||||||||||||||||||
| REALIZED AND UNREALIZED GAIN (LOSS) ON INVESTMENTS: | |||||||||||||||||||||||||||
| Net realized gain (loss) from: | |||||||||||||||||||||||||||
| Investments | (77,148 | ) | (421,666 | ) | (201,896 | ) | (52,826 | ) | (17,555,594 | ) | (6,727,499 | ) | |||||||||||||||
| In-kind redemptions | 671,650 | 775,063 | 407,050 | 286,927 | 23,844,722 | 8,342,942 | |||||||||||||||||||||
| Net realized gain (loss) | 594,502 | 353,397 | 205,154 | 234,101 | 6,289,128 | 1,615,443 | |||||||||||||||||||||
| Net change in unrealized appreciation/ depreciation on investments | 767,272 | 288,493 | 631,776 | 514,814 | 1,294,918 | (234,214 | ) | ||||||||||||||||||||
| Net realized and unrealized gain (loss) on investments | 1,361,774 | 641,890 | 836,930 | 748,915 | 7,584,046 | 1,381,229 | |||||||||||||||||||||
| Net increase (decrease) in net assets resulting from operations | $ | 1,412,357 | $ | 644,050 | $ | 814,332 | $ | 880,744 | $ | 8,161,852 | $ | 1,502,472 | |||||||||||||||
69
Statements of Changes in Net Assets
| PowerShares Dynamic Large Cap Growth Portfolio | PowerShares Dynamic Large Cap Value Portfolio | PowerShares Dynamic Mid Cap Growth Portfolio | |||||||||||||||||||||||||
| For the year ended April 30, 2007 | For the year ended April 30, 2006 | For the year ended April 30, 2007 | For the year ended April 30, 2006 | For the year ended April 30, 2007 | For the year ended April 30, 2006 | ||||||||||||||||||||||
| OPERATIONS: | |||||||||||||||||||||||||||
| Net investment income (loss) | $ | 240,165 | $ | (25,037 | ) | $ | 5,109,774 | $ | 706,423 | $ | (173,222 | ) | $ | 711,633 | |||||||||||||
| Net realized gain (loss) on investments | (286,076 | ) | 1,512,408 | 24,650,239 | 1,817,524 | 2,676,199 | 4,852,586 | ||||||||||||||||||||
| Net change in unrealized appreciation/depreciation of investments | 16,420,488 | 4,485,766 | 16,864,450 | 4,964,860 | 13,821,191 | 4,866,054 | |||||||||||||||||||||
| Net increase (decrease) in net assets resulting from operations | 16,374,577 | 5,973,137 | 46,624,463 | 7,488,807 | 16,324,168 | 10,430,273 | |||||||||||||||||||||
| Undistributed net investment income (loss) included in the price of units issued and redeemed | 32,897 | — | 339,753 | — | 117,894 | — | |||||||||||||||||||||
| DISTRIBUTIONS TO SHAREHOLDERS FROM: | |||||||||||||||||||||||||||
| Net investment income | (240,165 | ) | (12,532 | ) | (3,984,387 | ) | (613,947 | ) | (711,633 | ) | — | ||||||||||||||||
| Tax return of capital | (3,527 | ) | — | — | — | (9,929 | ) | — | |||||||||||||||||||
| Total distributions to shareholders | (243,692 | ) | (12,532 | ) | (3,984,387 | ) | (613,947 | ) | (721,562 | ) | — | ||||||||||||||||
| SHAREHOLDER TRANSACTIONS: | |||||||||||||||||||||||||||
| Proceeds from shares sold | 289,938,897 | 170,931,671 | 482,570,049 | 98,229,981 | 199,694,174 | 147,620,675 | |||||||||||||||||||||
| Value of shares repurchased | (177,221,894 | ) | (36,609,670 | ) | (323,612,201 | ) | (24,738,806 | ) | (128,827,369 | ) | (63,075,340 | ) | |||||||||||||||
| Net income equalization | (32,897 | ) | — | (339,753 | ) | — | (117,894 | ) | — | ||||||||||||||||||
| Net increase (decrease) in net assets resulting from share transactions | 112,684,106 | 134,322,001 | 158,618,095 | 73,491,175 | 70,748,911 | 84,545,335 | |||||||||||||||||||||
| Increase (Decrease) in Net Assets | 128,847,888 | 140,282,606 | 201,597,924 | 80,366,035 | 86,469,411 | 94,975,608 | |||||||||||||||||||||
| NET ASSETS: | |||||||||||||||||||||||||||
| Beginning of period | 148,749,661 | 8,467,055 | 90,531,974 | 10,165,939 | 103,324,648 | 8,349,040 | |||||||||||||||||||||
| End of period | $ | 277,597,549 | $ | 148,749,661 | $ | 292,129,898 | $ | 90,531,974 | $ | 189,794,059 | $ | 103,324,648 | |||||||||||||||
| Undistributed net investment income | $ | — | $ | — | $ | 1,248,210 | $ | 117,050 | $ | — | $ | 711,633 | |||||||||||||||
| CHANGES IN SHARES OUTSTANDING: | |||||||||||||||||||||||||||
| Shares sold | 17,800,000 | 10,800,000 | 25,900,000 | 6,000,000 | 10,400,000 | 8,500,000 | |||||||||||||||||||||
| Shares repurchased | (11,000,000 | ) | (2,300,000 | ) | (17,000,000 | ) | (1,500,000 | ) | (6,900,000 | ) | (3,600,000 | ) | |||||||||||||||
| Shares outstanding, beginning of period | 9,100,000 | 600,000 | 5,200,000 | 700,000 | 5,500,000 | 600,000 | |||||||||||||||||||||
| Shares outstanding, end of period | 15,900,000 | 9,100,000 | 14,100,000 | 5,200,000 | 9,000,000 | 5,500,000 | |||||||||||||||||||||
* Commencement of Investment Operations.
See Notes to Financial Statements.
70
| PowerShares Dynamic Mid Cap Value Portfolio | PowerShares Dynamic Small Cap Growth Portfolio | PowerShares Dynamic Small Cap Value Portfolio | |||||||||||||||||||||||||
| For the year ended April 30, 2007 | For the year ended April 30, 2006 | For the year ended April 30, 2007 | For the year ended April 30, 2006 | For the year ended April 30, 2007 | For the year ended April 30, 2006 | ||||||||||||||||||||||
| OPERATIONS: | |||||||||||||||||||||||||||
| Net investment income (loss) | $ | 1,145,574 | $ | 350,133 | $ | (210,147 | ) | $ | 298,325 | $ | 575,488 | $ | 229,170 | ||||||||||||||
| Net realized gain (loss) on investments | 4,692,328 | 1,294,587 | (3,356,204 | ) | 4,333,954 | 6,596,561 | 923,701 | ||||||||||||||||||||
| Net change in unrealized appreciation/depreciation of investments | 7,757,823 | 2,697,692 | (1,366,638 | ) | 6,844,625 | 1,084,508 | 4,894,679 | ||||||||||||||||||||
| Net increase (decrease) in net assets resulting from operations | 13,595,725 | 4,342,412 | (4,932,989 | ) | 11,476,904 | 8,256,557 | 6,047,550 | ||||||||||||||||||||
| Undistributed net investment income (loss) included in the price of units issued and redeemed | 54,435 | — | (92,734 | ) | — | 48,335 | — | ||||||||||||||||||||
| DISTRIBUTIONS TO SHAREHOLDERS FROM: | |||||||||||||||||||||||||||
| Net investment income | (891,950 | ) | (398,693 | ) | — | — | (591,897 | ) | (190,946 | ) | |||||||||||||||||
| Tax return of capital | — | — | — | — | — | — | |||||||||||||||||||||
| Total distributions to shareholders | (891,950 | ) | (398,693 | ) | — | — | (591,897 | ) | (190,946 | ) | |||||||||||||||||
| SHAREHOLDER TRANSACTIONS: | |||||||||||||||||||||||||||
| Proceeds from shares sold | 136,706,085 | 60,676,498 | 98,612,408 | 161,744,388 | 136,778,591 | 74,827,926 | |||||||||||||||||||||
| Value of shares repurchased | (96,868,606 | ) | (17,930,961 | ) | (150,797,541 | ) | (64,483,667 | ) | (93,102,785 | ) | (23,996,062 | ) | |||||||||||||||
| Net income equalization | (54,435 | ) | — | 92,734 | — | (48,335 | ) | — | |||||||||||||||||||
| Net increase (decrease) in net assets resulting from share transactions | 39,783,044 | 42,745,537 | (52,092,399 | ) | 97,260,721 | 43,627,471 | 50,831,864 | ||||||||||||||||||||
| Increase (Decrease) in Net Assets | 52,541,254 | 46,689,256 | (57,118,122 | ) | 108,737,625 | 51,340,466 | 56,688,468 | ||||||||||||||||||||
| NET ASSETS: | |||||||||||||||||||||||||||
| Beginning of period | 56,815,075 | 10,125,819 | 118,464,853 | 9,727,228 | 66,339,396 | 9,650,928 | |||||||||||||||||||||
| End of period | $ | 109,356,329 | $ | 56,815,075 | $ | 61,346,731 | $ | 118,464,853 | $ | 117,679,862 | $ | 66,339,396 | |||||||||||||||
| Undistributed net investment income | $ | 298,057 | $ | 44,433 | $ | — | $ | — | $ | 25,537 | $ | 45,098 | |||||||||||||||
| CHANGES IN SHARES OUTSTANDING: | |||||||||||||||||||||||||||
| Shares sold | 7,500,000 | 3,700,000 | 5,700,000 | 9,400,000 | 7,800,000 | 4,700,000 | |||||||||||||||||||||
| Shares repurchased | (5,400,000 | ) | (1,100,000 | ) | (8,800,000 | ) | (3,700,000 | ) | (5,400,000 | ) | (1,500,000 | ) | |||||||||||||||
| Shares outstanding, beginning of period | 3,300,000 | 700,000 | 6,400,000 | 700,000 | 3,900,000 | 700,000 | |||||||||||||||||||||
| Shares outstanding, end of period | 5,400,000 | 3,300,000 | 3,300,000 | 6,400,000 | 6,300,000 | 3,900,000 | |||||||||||||||||||||
71
Statements of Changes in Net Assets (Continued)
| PowerShares Dynamic Large Cap Portfolio | PowerShares Dynamic Mid Cap Portfolio | PowerShares Dynamic Small Cap Portfolio | PowerShares Dynamic Aggressive Growth Portfolio | PowerShares Dynamic Deep Value Portfolio | |||||||||||||||||||
| For the period December 01, 2006* through April 30, 2007 | For the period December 01, 2006* through April 30, 2007 | For the period December 01, 2006* through April 30, 2007 | For the period December 20, 2006* through April 30, 2007 | For the period December 20, 2006* through April 30, 2007 | |||||||||||||||||||
| OPERATIONS: | |||||||||||||||||||||||
| Net investment income (loss) | $ | 64,349 | $ | 50,583 | $ | 2,160 | $ | (22,598 | ) | $ | 131,829 | ||||||||||||
| Net realized gain (loss) on investments | 265,497 | 594,502 | 353,397 | 205,154 | 234,101 | ||||||||||||||||||
| Net change in unrealized appreciation/depreciation of investments | 636,237 | 767,272 | 288,493 | 631,776 | 514,814 | ||||||||||||||||||
| Net increase in net assets resulting from operations | 966,083 | 1,412,357 | 644,050 | 814,332 | 880,744 | ||||||||||||||||||
| Undistributed net investment income (loss) included in the price of units issued and redeemed | (6,528 | ) | (1,941 | ) | (1,680 | ) | 3,814 | 1,491 | |||||||||||||||
| DISTRIBUTIONS TO SHAREHOLDERS FROM: | |||||||||||||||||||||||
| Net investment income | (45,948 | ) | (34,110 | ) | (1,164 | ) | — | (43,560 | ) | ||||||||||||||
| Tax return of capital | — | — | — | — | — | ||||||||||||||||||
| Total distributions to shareholders | (45,948 | ) | (34,110 | ) | (1,164 | ) | — | (43,560 | ) | ||||||||||||||
| SHAREHOLDER TRANSACTIONS: | |||||||||||||||||||||||
| Proceeds from shares sold | 20,205,371 | 23,082,797 | 20,297,119 | 19,881,714 | 19,997,872 | ||||||||||||||||||
| Value of shares repurchased | (10,327,029 | ) | (13,270,626 | ) | (12,934,869 | ) | (10,144,340 | ) | (5,049,438 | ) | |||||||||||||
| Net income equalization | 6,528 | 1,941 | 1,680 | (3,814 | ) | (1,491 | ) | ||||||||||||||||
| Net increase in net assets resulting from share transactions | 9,884,870 | 9,814,112 | 7,363,930 | 9,733,560 | 14,946,943 | ||||||||||||||||||
| Increase in Net Assets | 10,798,477 | 11,190,418 | 8,005,136 | 10,551,706 | 15,785,618 | ||||||||||||||||||
| NET ASSETS: | |||||||||||||||||||||||
| Beginning of period | — | — | — | — | — | ||||||||||||||||||
| End of period | $ | 10,798,477 | $ | 11,190,418 | $ | 8,005,136 | $ | 10,551,706 | $ | 15,785,618 | |||||||||||||
| Undistributed net investment income | $ | 18,586 | $ | 16,473 | $ | 193 | $ | — | $ | 88,918 | |||||||||||||
| CHANGES IN SHARES OUTSTANDING: | |||||||||||||||||||||||
| Shares sold | 800,000 | 900,000 | 800,000 | 800,000 | 800,000 | ||||||||||||||||||
| Shares repurchased | (400,000 | ) | (500,000 | ) | (500,000 | ) | (400,000 | ) | (200,000 | ) | |||||||||||||
| Shares outstanding, beginning of period | — | — | — | — | — | ||||||||||||||||||
| Shares outstanding, end of period | 400,000 | 400,000 | 300,000 | 400,000 | 600,000 | ||||||||||||||||||
* Commencement of Investment Operations.
See Notes to Financial Statements.
72
| PowerShares Zacks Micro Cap Portfolio | PowerShares Zacks Small Cap Portfolio | ||||||||||||||||||
| For the year ended April 30, 2007 | For the period August 18, 2005* through April 30, 2006 | For the year ended April 30, 2007 | For the period February 16, 2006* through April 30, 2006 | ||||||||||||||||
| OPERATIONS: | |||||||||||||||||||
| Net investment income (loss) | $ | 577,806 | $ | 5,125 | $ | 121,243 | $ | 26,152 | |||||||||||
| Net realized gain (loss) on investments | 6,289,128 | 5,059,182 | 1,615,443 | (74,085 | ) | ||||||||||||||
| Net change in unrealized appreciation/depreciation of investments | 1,294,918 | 12,118,167 | (234,214 | ) | 2,567,738 | ||||||||||||||
| Net increase in net assets resulting from operations | 8,161,852 | 17,182,474 | 1,502,472 | 2,519,805 | |||||||||||||||
| Undistributed net investment income (loss) included in the price of units issued and redeemed | 53,014 | — | 7,230 | — | |||||||||||||||
| DISTRIBUTIONS TO SHAREHOLDERS FROM: | |||||||||||||||||||
| Net investment income | (206,496 | ) | (50,928 | ) | (126,531 | ) | — | ||||||||||||
| Tax return of capital | — | (17,888 | ) | (10,819 | ) | — | |||||||||||||
| Total distributions to shareholders | (206,496 | ) | (68,816 | ) | (137,350 | ) | — | ||||||||||||
| SHAREHOLDER TRANSACTIONS: | |||||||||||||||||||
| Proceeds from shares sold | 139,710,391 | 188,141,968 | 82,223,254 | 56,346,347 | |||||||||||||||
| Value of shares repurchased | (114,331,138 | ) | (46,280,045 | ) | (70,924,589 | ) | — | ||||||||||||
| Net income equalization | (53,014 | ) | — | (7,230 | ) | — | |||||||||||||
| Net increase in net assets resulting from share transactions | 25,326,239 | 141,861,923 | 11,291,435 | 56,346,347 | |||||||||||||||
| Increase in Net Assets | 33,334,609 | 158,975,581 | 12,663,787 | 58,866,152 | |||||||||||||||
| NET ASSETS: | |||||||||||||||||||
| Beginning of period | 158,975,581 | — | 58,866,152 | — | |||||||||||||||
| End of period | $ | 192,310,190 | $ | 158,975,581 | $ | 71,529,939 | $ | 58,866,152 | |||||||||||
| Undistributed net investment income | $ | 257,890 | $ | — | $ | — | $ | 26,152 | |||||||||||
| CHANGES IN SHARES OUTSTANDING: | |||||||||||||||||||
| Shares sold | 8,100,000 | 12,000,000 | 3,100,000 | 2,200,000 | |||||||||||||||
| Shares repurchased | (6,700,000 | ) | (2,900,000 | ) | (2,700,000 | ) | — | ||||||||||||
| Shares outstanding, beginning of period | 9,100,000 | — | 2,200,000 | — | |||||||||||||||
| Shares outstanding, end of period | 10,500,000 | 9,100,000 | 2,600,000 | 2,200,000 | |||||||||||||||
73
Financial Highlights
PowerShares Dynamic Large Cap Growth Portfolio
| For the year ended April 30, 2007 | For the year ended April 30, 2006 | For the period March 3, 2005* through April 30, 2005 | |||||||||||||
| PER SHARE OPERATING PERFORMANCE: | |||||||||||||||
| Net asset value at beginning of period | $ | 16.35 | $ | 14.11 | $ | 14.83 | |||||||||
| Net investment income (loss)** | 0.02 | (0.01 | ) | — | (a) | ||||||||||
| Net realized and unrealized gain (loss) on investments | 1.11 | 2.25 | (0.72 | ) | |||||||||||
| Total from operations | 1.13 | 2.24 | (0.72 | ) | |||||||||||
| Undistributed net investment income included in price of units issued and redeemed** | — | (a) | — | — | |||||||||||
| Distributions to shareholders from: | |||||||||||||||
| Net investment income | (0.02 | ) | — | (a) | — | ||||||||||
| Tax return of capital | — | (a) | — | — | |||||||||||
| Total distributions | (0.02 | ) | — | — | |||||||||||
| Net asset value at end of period | $ | 17.46 | $ | 16.35 | $ | 14.11 | |||||||||
| TOTAL RETURN*** | 6.92 | % | 15.89 | % | (4.87 | )% | |||||||||
| RATIOS/SUPPLEMENTAL DATA: | |||||||||||||||
| Net assets at end of period (000's omitted) | $ | 277,598 | $ | 148,750 | $ | 8,467 | |||||||||
| Ratio to average net assets of: | |||||||||||||||
| Expenses, net of waivers | 0.63 | % | 0.64 | % | 0.63 | %† | |||||||||
| Expenses, prior to waivers | 0.68 | %††† | 0.80 | % | 2.45 | %† | |||||||||
| Net investment income (loss), net of waivers | 0.13 | % | (0.04 | )% | 0.13 | %† | |||||||||
| Portfolio turnover rate †† | 57 | % | 73 | % | 2 | % | |||||||||
PowerShares Dynamic Large Cap Value Portfolio
| For the year ended April 30, 2007 | For the year ended April 30, 2006 | For the period March 3, 2005* through April 30, 2005 | |||||||||||||
| PER SHARE OPERATING PERFORMANCE: | |||||||||||||||
| Net asset value at beginning of period | $ | 17.41 | $ | 14.52 | $ | 15.00 | |||||||||
| Net investment income** | 0.39 | 0.28 | 0.05 | ||||||||||||
| Net realized and unrealized gain (loss) on investments | 3.18 | 2.85 | (0.52 | ) | |||||||||||
| Total from operations | 3.57 | 3.13 | (0.47 | ) | |||||||||||
| Undistributed net investment income included in price of units issued and redeemed** | 0.03 | — | — | ||||||||||||
| Distributions to shareholders from: | |||||||||||||||
| Net investment income | (0.29 | ) | (0.24 | ) | (0.01 | ) | |||||||||
| Net asset value at end of period | $ | 20.72 | $ | 17.41 | $ | 14.52 | |||||||||
| TOTAL RETURN*** | 20.85 | % | 21.71 | % | (3.11 | )% | |||||||||
| RATIOS/SUPPLEMENTAL DATA: | |||||||||||||||
| Net assets at end of period (000's omitted) | $ | 292,130 | $ | 90,532 | $ | 10,166 | |||||||||
| Ratio to average net assets of: | |||||||||||||||
| Expenses, net of waivers | 0.63 | % | 0.65 | % | 0.63 | %† | |||||||||
| Expenses, prior to waivers | 0.67 | %††† | 0.94 | % | 2.16 | %† | |||||||||
| Net investment income, net of waivers | 2.00 | % | 1.75 | % | 1.99 | %† | |||||||||
| Portfolio turnover rate †† | 16 | % | 29 | % | 0 | % | |||||||||
* Commencement of Investment Operations.
** Based on average shares outstanding.
*** Total investment return is calculated assuming an initial investment made at the net asset value at the beginning of the period, reinvestment of all dividends and distributions at net asset value during the period, and redemption on the last day of the period. Total investment return calculated for a period of less than one year is not annualized.
† Annualized.
†† Portfolio turnover is not annualized and does not include securities received or delivered from processing creations or redemptions.
††† These expenses, prior to waivers, include amounts reimbursed to the Adviser under the Expense Agreement of less than 0.01% and 0.02%, for the Large Cap Growth and Large Cap Value Portfolios, respectively, for the year ended April 30, 2007.
(a) Amount represents less than $0.005.
See Notes to Financial Statements.
74
Financial Highlights (Continued)
PowerShares Dynamic Mid Cap Growth Portfolio
| For the year ended April 30, 2007 | For the year ended April 30, 2006 | For the period March 3, 2005* through April 30, 2005 | |||||||||||||
| PER SHARE OPERATING PERFORMANCE: | |||||||||||||||
| Net asset value at beginning of period | $ | 18.79 | $ | 13.92 | $ | 15.01 | |||||||||
| Net investment income (loss)** | (0.03 | ) | 0.28 | (0.01 | ) | ||||||||||
| Net realized and unrealized gain (loss) on investments | 2.42 | 4.59 | (1.08 | ) | |||||||||||
| Total from operations | 2.39 | 4.87 | (1.09 | ) | |||||||||||
| Undistributed net investment income included in price of units issued and redeemed** | 0.02 | — | — | ||||||||||||
| Distributions to shareholders from: | |||||||||||||||
| Net investment income | (0.11 | ) | — | — | |||||||||||
| Tax return of capital | — | (a) | — | — | |||||||||||
| Total distributions | (0.11 | ) | — | — | |||||||||||
| Net asset value at end of period | $ | 21.09 | $ | 18.79 | $ | 13.92 | |||||||||
| TOTAL RETURN*** | 12.91 | % | 34.99 | % | (7.30 | )% | |||||||||
| RATIOS/SUPPLEMENTAL DATA: | |||||||||||||||
| Net assets at end of period (000's omitted) | $ | 189,794 | $ | 103,325 | $ | 8,349 | |||||||||
| Ratio to average net assets of: | |||||||||||||||
| Expenses, net of waivers | 0.63 | % | 0.65 | % | 0.63 | %† | |||||||||
| Expenses, prior to waivers | 0.73 | %††† | 0.90 | % | 2.45 | %† | |||||||||
| Net investment income (loss), net of waivers | (0.15 | )% | 1.56 | % | (0.20 | )%† | |||||||||
| Portfolio turnover rate †† | 69 | % | 86 | % | 1 | % | |||||||||
PowerShares Dynamic Mid Cap Value Portfolio
| For the year ended April 30, 2007 | For the year ended April 30, 2006 | For the period March 3, 2005* through April 30, 2005 | |||||||||||||
| PER SHARE OPERATING PERFORMANCE: | |||||||||||||||
| Net asset value at beginning of period | $ | 17.22 | $ | 14.47 | $ | 15.10 | |||||||||
| Net investment income** | 0.29 | 0.22 | 0.15 | ||||||||||||
| Net realized and unrealized gain (loss) on investments | 2.96 | 2.78 | (0.76 | ) | |||||||||||
| Total from operations | 3.25 | 3.00 | (0.61 | ) | |||||||||||
| Undistributed net investment income included in price of units issued and redeemed** | 0.01 | — | — | ||||||||||||
| Distributions to shareholders from: | |||||||||||||||
| Net investment income | (0.23 | ) | (0.25 | ) | (0.02 | ) | |||||||||
| Net asset value at end of period | $ | 20.25 | $ | 17.22 | $ | 14.47 | |||||||||
| TOTAL RETURN*** | 19.14 | % | 20.85 | % | (4.07 | )% | |||||||||
| RATIOS/SUPPLEMENTAL DATA: | |||||||||||||||
| Net assets at end of period (000's omitted) | $ | 109,356 | $ | 56,815 | $ | 10,126 | |||||||||
| Ratio to average net assets of: | |||||||||||||||
| Expenses, net of waivers | 0.63 | % | 0.67 | % | 0.63 | %† | |||||||||
| Expenses, prior to waivers | 0.82 | % | 1.13 | % | 2.14 | %† | |||||||||
| Net investment income, net of waivers | 1.64 | % | 1.33 | % | 6.34 | %† | |||||||||
| Portfolio turnover rate †† | 43 | % | 117 | % | 1 | % | |||||||||
* Commencement of Investment Operations.
** Based on average shares outstanding.
*** Total investment return is calculated assuming an initial investment made at the net asset value at the beginning of the period, reinvestment of all dividends and distributions at net asset value during the period, and redemption on the last day of the period. Total investment return calculated for a period of less than one year is not annualized.
† Annualized.
†† Portfolio turnover is not annualized and does not include securities received or delivered from processing creations or redemptions.
††† These expenses, prior to waivers, include amounts reimbursed to the Adviser under the Expense Agreement of less than 0.01% for the year ended April 30, 2007.
(a) Amount represents less than $0.005.
See Notes to Financial Statements.
75
Financial Highlights (Continued)
PowerShares Dynamic Small Cap Growth Portfolio
| For the year ended April 30, 2007 | For the year ended April 30, 2006 | For the period March 3, 2005* through April 30, 2005 | |||||||||||||
| PER SHARE OPERATING PERFORMANCE: | |||||||||||||||
| Net asset value at beginning of period | $ | 18.51 | $ | 13.90 | $ | 15.11 | |||||||||
| Net investment income (loss)** | (0.05 | ) | 0.11 | (0.01 | ) | ||||||||||
| Net realized and unrealized gain (loss) on investments | 0.15 | 4.50 | (1.20 | ) | |||||||||||
| Total from operations | 0.10 | 4.61 | (1.21 | ) | |||||||||||
| Undistributed net investment loss included in price of units issued and redeemed** | (0.02 | ) | — | — | |||||||||||
| Net asset value at end of period | $ | 18.59 | $ | 18.51 | $ | 13.90 | |||||||||
| TOTAL RETURN*** | 0.43 | % | 33.17 | % | (8.02 | )% | |||||||||
| RATIOS/SUPPLEMENTAL DATA: | |||||||||||||||
| Net assets at end of period (000's omitted) | $ | 61,347 | $ | 118,465 | $ | 9,727 | |||||||||
| Ratio to average net assets of: | |||||||||||||||
| Expenses, net of waivers | 0.63 | % | 0.65 | % | 0.63 | %† | |||||||||
| Expenses, prior to waivers | 0.84 | % | 0.90 | % | 2.34 | %† | |||||||||
| Net investment loss, net of waivers | (0.32 | )% | 0.65 | % | (0.48 | )%† | |||||||||
| Portfolio turnover rate †† | 114 | % | 120 | % | 0 | % | |||||||||
PowerShares Dynamic Small Cap Value Portfolio
| For the year ended April 30, 2007 | For the year ended April 30, 2006 | For the period March 3, 2005* through April 30, 2005 | |||||||||||||
| PER SHARE OPERATING PERFORMANCE: | |||||||||||||||
| Net asset value at beginning of period | $ | 17.01 | $ | 13.79 | $ | 15.06 | |||||||||
| Net investment income** | 0.13 | 0.11 | 0.01 | ||||||||||||
| Net realized and unrealized gain (loss) on investments | 1.66 | 3.22 | (1.28 | ) | |||||||||||
| Total from operations | 1.79 | 3.33 | (1.27 | ) | |||||||||||
| Undistributed net investment income included in price of units issued and redeemed** | 0.01 | — | — | ||||||||||||
| Distributions to shareholders from: | |||||||||||||||
| Net investment income | (0.13 | ) | (0.11 | ) | — | ||||||||||
| Net asset value at end of period | $ | 18.68 | $ | 17.01 | $ | 13.79 | |||||||||
| TOTAL RETURN*** | 10.64 | % | 24.20 | % | (8.46 | )% | |||||||||
| RATIOS/SUPPLEMENTAL DATA: | |||||||||||||||
| Net assets at end of period (000's omitted) | $ | 117,680 | $ | 66,339 | $ | 9,651 | |||||||||
| Ratio to average net assets of: | |||||||||||||||
| Expenses, net of waivers | 0.63 | % | 0.66 | % | 0.63 | %† | |||||||||
| Expenses, prior to waivers | 0.80 | % | 1.06 | % | 2.36 | %† | |||||||||
| Net investment income, net of waivers | 0.73 | % | 0.73 | % | 0.45 | %† | |||||||||
| Portfolio turnover rate †† | 76 | % | 118 | % | 0 | % | |||||||||
* Commencement of Investment Operations.
** Based on average shares outstanding.
*** Total investment return is calculated assuming an initial investment made at the net asset value at the beginning of the period, reinvestment of all dividends and distributions at net asset value during the period, and redemption on the last day of the period. Total investment return calculated for a period of less than one year is not annualized.
† Annualized.
†† Portfolio turnover is not annualized and does not include securities received or delivered from processing creations or redemptions.
See Notes to Financial Statements.
76
Financial Highlights (Continued)
PowerShares Dynamic Large Cap Portfolio
| For the period December 01, 2006* through April 30, 2007 | |||||||
| PER SHARE OPERATING PERFORMANCE: | |||||||
| Net asset value at beginning of period | $ | 25.18 | |||||
| Net investment income** | 0.12 | ||||||
| Net realized and unrealized gain on investments | 1.79 | ||||||
| Total from operations | 1.91 | ||||||
| Undistributed net investment loss included in price of units issued and redeemed** | (0.01 | ) | |||||
| Distributions to shareholders from: | |||||||
| Net investment income | (0.08 | ) | |||||
| Net asset value at end of period | $ | 27.00 | |||||
| TOTAL RETURN*** | 7.55 | % | |||||
| RATIOS/SUPPLEMENTAL DATA: | |||||||
| Net assets at end of period (000's omitted) | $ | 10,798 | |||||
| Ratio to average net assets of: | |||||||
| Expenses, net of waivers | 0.74 | %† | |||||
| Expenses, prior to waivers | 1.45 | %† | |||||
| Net investment income, net of waivers | 1.05 | %† | |||||
| Portfolio turnover rate †† | 3 | % | |||||
PowerShares Dynamic Mid Cap Portfolio
| For the period December 01, 2006* through April 30, 2007 | |||||||
| PER SHARE OPERATING PERFORMANCE: | |||||||
| Net asset value at beginning of period | $ | 25.26 | |||||
| Net investment income** | 0.10 | ||||||
| Net realized and unrealized gain on investments | 2.68 | ||||||
| Total from operations | 2.78 | ||||||
| Undistributed net investment loss included in price of units issued and redeemed** | — | (a) | |||||
| Distributions to shareholders from: | |||||||
| Net investment income | (0.06 | ) | |||||
| Net asset value at end of period | $ | 27.98 | |||||
| TOTAL RETURN*** | 11.04 | % | |||||
| RATIOS/SUPPLEMENTAL DATA: | |||||||
| Net assets at end of period (000's omitted) | $ | 11,190 | |||||
| Ratio to average net assets of: | |||||||
| Expenses, net of waivers | 0.74 | %† | |||||
| Expenses, prior to waivers | 1.55 | %† | |||||
| Net investment income, net of waivers | 0.91 | %† | |||||
| Portfolio turnover rate †† | 7 | % | |||||
* Commencement of Investment Operations.
** Based on average shares outstanding.
*** Total investment return is calculated assuming an initial investment made at the net asset value at the beginning of the period, reinvestment of all dividends and distributions at net asset value during the period, and redemption on the last day of the period. Total investment return calculated for a period of less than one year is not annualized.
† Annualized.
†† Portfolio turnover is not annualized and does not include securities received or delivered from processing creations or redemptions.
(a) Amount represents less than $0.005.
See Notes to Financial Statements.
77
Financial Highlights (Continued)
PowerShares Dynamic Small Cap Portfolio
| For the period December 01, 2006* through April 30, 2007 | |||||||
| PER SHARE OPERATING PERFORMANCE: | |||||||
| Net asset value at beginning of period | $ | 25.17 | |||||
| Net investment income** | — | (a) | |||||
| Net realized and unrealized gain on investments | 1.51 | ||||||
| Total from operations | 1.51 | ||||||
| Undistributed net investment loss included in price of units issued and redeemed** | — | (a) | |||||
| Distributions to shareholders from: | |||||||
| Net investment income | — | (a) | |||||
| Net asset value at end of period | $ | 26.68 | |||||
| TOTAL RETURN*** | 6.01 | % | |||||
| RATIOS/SUPPLEMENTAL DATA: | |||||||
| Net assets at end of period (000's omitted) | $ | 8,005 | |||||
| Ratio to average net assets of: | |||||||
| Expenses, net of waivers | 0.74 | %† | |||||
| Expenses, prior to waivers | 1.55 | %† | |||||
| Net investment income, net of waivers | 0.04 | %† | |||||
| Portfolio turnover rate †† | 52 | % | |||||
PowerShares Dynamic Aggressive Growth Portfolio
| For the period December 20, 2006* through April 30, 2007 | |||||||
| PER SHARE OPERATING PERFORMANCE: | |||||||
| Net asset value at beginning of period | $ | 24.86 | |||||
| Net investment loss** | (0.05 | ) | |||||
| Net realized and unrealized gain on investments | 1.56 | ||||||
| Total from operations | 1.51 | ||||||
| Undistributed net investment income included in price of units issued and redeemed** | 0.01 | ||||||
| Net asset value at end of period | $ | 26.38 | |||||
| TOTAL RETURN*** | 6.11 | % | |||||
| RATIOS/SUPPLEMENTAL DATA: | |||||||
| Net assets at end of period (000's omitted) | $ | 10,552 | |||||
| Ratio to average net assets of: | |||||||
| Expenses, net of waivers | 0.75 | %† | |||||
| Expenses, prior to waivers | 1.76 | %† | |||||
| Net investment loss, net of waivers | (0.50 | )%† | |||||
| Portfolio turnover rate †† | 11 | % | |||||
* Commencement of Investment Operations.
** Based on average shares outstanding.
*** Total investment return is calculated assuming an initial investment made at the net asset value at the beginning of the period, reinvestment of all dividends and distributions at net asset value during the period, and redemption on the last day of the period. Total investment return calculated for a period of less than one year is not annualized.
† Annualized.
†† Portfolio turnover is not annualized and does not include securities received or delivered from processing creations or redemptions.
(a) Amount represents less than $0.005.
See Notes to Financial Statements.
78
Financial Highlights (Continued)
PowerShares Dynamic Deep Value Portfolio
| For the period December 20, 2006* through April 30, 2007 | |||||||
| Net asset value at beginning of period | $ | 24.99 | |||||
| Net investment income** | 0.22 | ||||||
| Net realized and unrealized gain on investments | 1.17 | ||||||
| Total from operations | 1.39 | ||||||
| Undistributed net investment income included in price of units issued and redeemed** | — | (a) | |||||
| Distributions to shareholders from: | |||||||
| Net investment income | (0.07 | ) | |||||
| Net asset value at end of period | $ | 26.31 | |||||
| TOTAL RETURN*** | 5.59 | % | |||||
| RATIOS/SUPPLEMENTAL DATA: | |||||||
| Net assets at end of period (000's omitted) | $ | 15,786 | |||||
| Ratio to average net assets of: | |||||||
| Expenses, net of waivers | 0.74 | %† | |||||
| Expenses, prior to waivers | 1.55 | %† | |||||
| Net investment income, net of waivers | 2.40 | %† | |||||
| Portfolio turnover rate †† | 7 | % | |||||
PowerShares Zacks Micro Cap Portfolio
| For the year ended April 30, 2007 | For the period August 18, 2005* through April 30, 2006 | ||||||||||
| PER SHARE OPERATING PERFORMANCE: | |||||||||||
| Net asset value at beginning of period | $ | 17.47 | $ | 14.79 | |||||||
| Net investment income** | 0.06 | — | (a) | ||||||||
| Net realized and unrealized gain on investments | 0.80 | 2.69 | |||||||||
| Total from operations | 0.86 | 2.69 | |||||||||
| Undistributed net investment income included in price of units issued and redeemed** | 0.01 | — | |||||||||
| Distributions to shareholders from: | |||||||||||
| Net investment income | (0.02 | ) | (0.01 | ) | |||||||
| Tax return of capital | — | — | (a) | ||||||||
| Total distributions | (0.02 | ) | (0.01 | ) | |||||||
| Net asset value at end of period | $ | 18.32 | $ | 17.47 | |||||||
| TOTAL RETURN*** | 4.99 | % | 18.20 | % | |||||||
| RATIOS/SUPPLEMENTAL DATA: | |||||||||||
| Net assets at end of period (000's omitted) | $ | 192,310 | $ | 158,976 | |||||||
| Ratio to average net assets of: | |||||||||||
| Expenses, net of waivers | 0.71 | % | 0.72 | %† | |||||||
| Expenses, prior to waivers | 0.78 | % | 0.82 | %† | |||||||
| Net investment income, net of waivers | 0.36 | % | 0.01 | %† | |||||||
| Portfolio turnover rate †† | 72 | % | 78 | % | |||||||
* Commencement of Investment Operations.
** Based on average shares outstanding.
*** Total investment return is calculated assuming an initial investment made at the net asset value at the beginning of the period, reinvestment of all dividends and distributions at net asset value during the period, and redemption on the last day of the period. Total investment return calculated for a period of less than one year is not annualized.
† Annualized.
†† Portfolio turnover is not annualized and does not include securities received or delivered from processing creations or redemptions.
(a) Amount represents less than $0.005.
See Notes to Financial Statements.
79
Financial Highlights (Continued)
PowerShares Zacks Small Cap Portfolio
| For the year ended April 30, 2007 | For the period February 16, 2006* through April 30, 2006 | ||||||||||
| PER SHARE OPERATING PERFORMANCE: | |||||||||||
| Net asset value at beginning of period | $ | 26.76 | $ | 25.41 | |||||||
| Net investment income** | 0.05 | 0.02 | |||||||||
| Net realized and unrealized gain on investments | 0.76 | 1.33 | |||||||||
| Total from operations | 0.81 | 1.35 | |||||||||
| Undistributed net investment income included in price of units issued and redeemed** | — | (a) | — | ||||||||
| Distributions to shareholders from: | |||||||||||
| Net investment income | (0.06 | ) | — | ||||||||
| Tax return of capital | — | (a) | — | ||||||||
| Total distributions | (0.06 | ) | — | ||||||||
| Net asset value at end of period | $ | 27.51 | $ | 26.76 | |||||||
| TOTAL RETURN*** | 3.03 | % | 5.31 | % | |||||||
| RATIOS/SUPPLEMENTAL DATA: | |||||||||||
| Net assets at end of period (000's omitted) | $ | 71,530 | $ | 58,866 | |||||||
| Ratio to average net assets of: | |||||||||||
| Expenses, net of waivers | 0.71 | % | 0.75 | %† | |||||||
| Expenses, prior to waivers | 0.89 | %††† | 1.17 | %† | |||||||
| Net investment income, net of waivers | 0.19 | % | 0.30 | %† | |||||||
| Portfolio turnover rate †† | 87 | % | 1 | % | |||||||
* Commencement of Investment Operations.
** Based on average shares outstanding.
*** Total investment return is calculated assuming an initial investment made at the net asset value at the beginning of the period, reinvestment of all dividends and distributions at net asset value during the period, and redemption on the last day of the period. Total investment return calculated for a period of less than one year is not annualized.
† Annualized.
†† Portfolio turnover is not annualized and does not include securities received or delivered from processing creations or redemptions.
††† These expenses, prior to waivers, include amounts reimbursed to the Adviser under the Expense Agreement of less than 0.01% for the year ended April 30, 2007.
(a) Amount represents less than $0.005.
See Notes to Financial Statements.
80
Notes to Financial Statements
PowerShares Exchange-Traded Fund Trust
April 30, 2007
Note 1. Organization
PowerShares Exchange-Traded Fund Trust (the "Trust"), which is registered under the Investment Company Act of 1940, as amended (the "1940 Act"), is an exchange-traded, management investment company that was organized as a Massachusetts business trust on June 9, 2000. The Trust currently consists of seventy portfolios. This report includes the following portfolios:
| PowerShares Dynamic Large Cap Growth Portfolio | "Dynamic Large Cap Growth Portfolio" | ||||||
| PowerShares Dynamic Large Cap Value Portfolio | "Dynamic Large Cap Value Portfolio" | ||||||
| PowerShares Dynamic Mid Cap Growth Portfolio | "Dynamic Mid Cap Growth Portfolio" | ||||||
| PowerShares Dynamic Mid Cap Value Portfolio | "Dynamic Mid Cap Value Portfolio" | ||||||
| PowerShares Dynamic Small Cap Growth Portfolio | "Dynamic Small Cap Growth Portfolio" | ||||||
| PowerShares Dynamic Small Cap Value Portfolio | "Dynamic Small Cap Value Portfolio" | ||||||
| PowerShares Dynamic Large Cap Portfolio | "Dynamic Large Cap Portfolio" | ||||||
| PowerShares Dynamic Mid Cap Portfolio | "Dynamic Mid Cap Portfolio" | ||||||
| PowerShares Dynamic Small Cap Portfolio | "Dynamic Small Cap Portfolio" | ||||||
| PowerShares Dynamic Aggressive Growth Portfolio | "Dynamic Aggressive Growth Portfolio" | ||||||
| PowerShares Dynamic Deep Value Portfolio | "Dynamic Deep Value Portfolio" | ||||||
| PowerShares Zacks Micro Cap Portfolio | "Zacks Micro Cap Portfolio" | ||||||
| PowerShares Zacks Small Cap Portfolio | "Zacks Small Cap Portfolio" | ||||||
Dynamic Large Cap Portfolio, Dynamic Mid Cap Portfolio and Dynamic Small Cap Portfolio commenced investment operations on December 1, 2006. Dynamic Aggressive Growth Portfolio and Dynamic Deep Value Portfolio commenced investment operations on December 20, 2006. Each portfolio represents a separate series of the Trust (the "Fund" or "Funds"). Each Fund's shares are listed and traded on the American Stock Exchange. The Funds' market prices may differ to some degree from the net asset value of the shares of each Fund. Unlike conventional mutual funds, each Fund issues and redeems shares on a continuous basis, at net asset value, only in a large specified number of shares, each called a "Creation Unit." Creation Units are issued and redeemed principally in-kind for securities included in the relevant index. Except when aggregated in Creation Units, shares are not individually redeemable securities of the Funds. The investment objec tive of each Fund is to seek investment results that correspond generally to the price and yield (before the Fund's fees and expenses) of the following equity indices:
| Fund | Index | ||||||
| Dynamic Large Cap Growth Portfolio | Dynamic Large Cap Growth IntellidexSM Index | ||||||
| Dynamic Large Cap Value Portfolio | Dynamic Large Cap Value IntellidexSM Index | ||||||
| Dynamic Mid Cap Growth Portfolio | Dynamic Mid Cap Growth IntellidexSM Index | ||||||
| Dynamic Mid Cap Value Portfolio | Dynamic Mid Cap Value IntellidexSM Index | ||||||
| Dynamic Small Cap Growth Portfolio | Dynamic Small Cap Growth IntellidexSM Index | ||||||
| Dynamic Small Cap Value Portfolio | Dynamic Small Cap Value IntellidexSM Index | ||||||
| Dynamic Large Cap Portfolio | Dynamic Large Cap IntellidexSM Index | ||||||
| Dynamic Mid Cap Portfolio | Dynamic Mid Cap IntellidexSM Index | ||||||
| Dynamic Small Cap Portfolio | Dynamic Small Cap IntellidexSM Index | ||||||
| Dynamic Aggressive Growth Portfolio | Dynamic Aggressive Growth IntellidexSM Index | ||||||
| Dynamic Deep Value Portfolio | Dynamic Deep Value IntellidexSM Index | ||||||
| Zacks Micro Cap Portfolio | Zacks Micro Cap Index | ||||||
| Zacks Small Cap Portfolio | Zacks Small Cap Index | ||||||
81
Notes to Financial Statements (Continued)
PowerShares Exchange-Traded Fund Trust
April 30, 2007
Note 2. Significant Accounting Policies
The preparation of the financial statements in accordance with accounting principles generally accepted in the United States of America requires management to make estimates and assumptions that affect the reported amounts and disclosures in the financial statements. Actual results could differ from these estimates.
A. Security Valuation
Securities are valued based on their last sale price. Price information on listed securities is taken from the exchange where the security is primarily traded. Securities regularly traded in an over-the-counter market are valued at the latest quoted sale price in such market or in the case of NASDAQ, at the NASDAQ official closing price. Other portfolio securities and assets for which market quotations are not readily available are valued at fair value as determined in good faith by the Trust's Pricing Committee in accordance with procedures adopted by the Board of Trustees. Investments in money market mutual funds are stated at net asset value.
B. Federal Income Taxes
Each Fund intends to comply with the provisions of the Internal Revenue Code applicable to regulated investment companies and will distribute all net investment income and net taxable capital gains to its shareholders. Therefore, no provision for Federal income taxes is required.
Income and capital gain distributions are determined in accordance with Federal income tax regulations, which may differ from accounting principles generally accepted in the United States. These differences are primarily due to differing book and tax treatments for in-kind transactions, losses deferred due to wash sales, losses deferred due to post-October losses and excise tax regulations.
C. Investment Income and Investment Transactions
Dividend income is recorded on the ex-dividend date. Interest income is recorded on the accrual basis. Investment transactions are recorded on the trade date. Realized gains and losses from the sale or disposition of securities are calculated on the specific identified cost basis. Corporate actions (including cash dividends) are recorded net of nonreclaimable foreign tax withholdings on the ex-dividend date.
D. Expenses
Expenses of the Trust, which are directly identifiable to a specific Fund, are applied to that Fund. Expenses which are not readily identifiable to a specific Fund are allocated in such a manner as deemed equitable, taking into consideration the nature and type of expense and the relative net assets of each Fund.
E. Dividends and Distributions to Shareholders
Each Fund declares and pays dividends from net investment income to its shareholders quarterly and distributes net realized taxable capital gains, if any, annually. Such distributions on a tax basis are determined in conformity with income tax regulations which may differ from accounting principles generally accepted in the United States of America. Distributions in excess of tax basis earnings and profits, if any, are reported in each Fund's financial statements as a return of capital.
F. Equalization
Beginning May 1, 2006 (or since inception, if later), all Funds use the accounting practice of equalization. This accounting method is used to keep the continuing shareholder's per share equity in undistributed net investment income from being affected by the continuous sales and redemptions of capital shares. Equalization is calculated on a per share basis whereby a portion of the proceeds from the sales and cost
82
Notes to Financial Statements (Continued)
PowerShares Exchange-Traded Fund Trust
April 30, 2007
of repurchases of capital shares is applied to undistributed net investment income. The amount of equalization is disclosed in the Statements of Changes in Net Assets as undistributed net investment income included in the price of capital shares issued or redeemed. The distributions to shareholders of amounts so applied may be deemed to be a return of capital for tax purposes to the extent that such distributions exceed taxable income.
Note 3. Advisory and Administration Agreements
PowerShares Capital Management LLC (the "Adviser") has overall responsibility as the Funds' investment adviser for the selection and ongoing monitoring of the Funds' investments, managing the Funds' business affairs and providing certain clerical, bookkeeping and other administrative services. The fees paid by each Fund to the Adviser are accrued daily and are payable at 0.50% per annum on each Fund's average daily net assets.
Each Fund is responsible for all of its expenses, including the investment advisory fees, costs of transfer agency, custody, fund administration, legal, audit and other services, interest, taxes, brokerage commissions and other expenses connected with executions of portfolio transactions, any distribution fees or expenses and extraordinary expenses. Pursuant to the Investment Advisory Agreement with the Trust, the Adviser has agreed to waive fees and/or pay Fund expenses to the extent necessary to prevent the operating expenses of the Funds (excluding interest expense, brokerage commissions and other trading expenses, licensing fees, offering costs, taxes and extraordinary expenses) from exceeding 0.60% of average daily net assets per year (the "Expense Cap"), at least until April 30, 2008. Offering costs excluded from the Expense Cap are: (a) legal fees pertaining to the Funds' shares offered for sale; (b) Securities and Exchan ge Commission and state registration fees; and (c) initial fees paid to be listed on an exchange.
For the period ended April 30, 2007, the Adviser waived and assumed the following fees and expenses:
| Fees Waived | Expenses Assumed | ||||||||||
| Dynamic Large Cap Growth Portfolio | $ | 91,092 | $ | — | |||||||
| Dynamic Large Cap Value Portfolio | 97,962 | — | |||||||||
| Dynamic Mid Cap Growth Portfolio | 116,666 | — | |||||||||
| Dynamic Mid Cap Value Portfolio | 132,535 | — | |||||||||
| Dynamic Small Cap Growth Portfolio | 142,404 | — | |||||||||
| Dynamic Small Cap Value Portfolio | 134,256 | — | |||||||||
| Dynamic Large Cap Portfolio | 30,709 | 13,397 | |||||||||
| Dynamic Mid Cap Portfolio | 27,683 | 16,907 | |||||||||
| Dynamic Small Cap Portfolio | 28,828 | 17,728 | |||||||||
| Dynamic Aggressive Growth Portfolio | 22,379 | 22,792 | |||||||||
| Dynamic Deep Value Portfolio | 27,514 | 16,959 | |||||||||
| Zacks Micro Cap Portfolio | 120,775 | — | |||||||||
| Zacks Small Cap Portfolio | 112,053 | — | |||||||||
The Trust and the Adviser have entered into an Excess Expense Agreement (the "Expense Agreement") in which expenses borne by the Adviser are subject to reimbursement by the Fund up to three years from the date the fee or expense was incurred, but no reimbursement payment will be made by the Fund if it would result in the Fund exceeding its Expense Cap as specified above.
83
Notes to Financial Statements (Continued)
PowerShares Exchange-Traded Fund Trust
April 30, 2007
During the period ended April 30, 2007, the details of expense waivers and reimbursements to the Adviser under the Expense Agreement were as follows:
| Gross Waivers | Gross Reimbursements | Net Waivers | |||||||||||||
| Dynamic Large Cap Growth Portfolio | $ | (93,963 | ) | $ | 2,871 | $ | (91,092 | ) | |||||||
| Dynamic Large Cap Value Portfolio | (150,581 | ) | 52,619 | (97,962 | ) | ||||||||||
| Dynamic Mid Cap Growth Portfolio | (119,729 | ) | 3,063 | (116,666 | ) | ||||||||||
| Zacks Small Cap Portfolio | (114,733 | ) | 2,680 | (112,053 | ) | ||||||||||
The net amount of waivers or reimbursements are also shown on the Statements of Operations.
The amounts subject to reimbursement to the Adviser at April 30, 2007 are as follows:
| Reimbursements available during the fiscal years ending: | |||||||||||||||
| 04/30/08 | 04/30/09 | 04/30/10 | |||||||||||||
| Dynamic Large Cap Growth Portfolio | $ | 223,785 | $ | 201,225 | $ | 93,963 | |||||||||
| Dynamic Large Cap Value Portfolio | 238,999 | 238,999 | 150,581 | ||||||||||||
| Dynamic Mid Cap Growth Portfolio | 254,735 | 232,284 | 119,729 | ||||||||||||
| Dynamic Mid Cap Value Portfolio | 279,940 | 254,617 | 132,535 | ||||||||||||
| Dynamic Small Cap Growth Portfolio | 283,057 | 257,513 | 142,404 | ||||||||||||
| Dynamic Small Cap Value Portfolio | 284,741 | 259,190 | 134,256 | ||||||||||||
| Dynamic Large Cap Portfolio | 44,106 | 44,106 | 44,106 | ||||||||||||
| Dynamic Mid Cap Portfolio | 44,590 | 44,590 | 44,590 | ||||||||||||
| Dynamic Small Cap Portfolio | 46,556 | 46,556 | 46,556 | ||||||||||||
| Dynamic Aggressive Growth Portfolio | 45,171 | 45,171 | 45,171 | ||||||||||||
| Dynamic Deep Value Portfolio | 44,473 | 44,473 | 44,473 | ||||||||||||
| Dynamic Zacks Micro Cap Portfolio | 198,807 | 198,807 | 120,775 | ||||||||||||
| Dynamic Zacks Small Cap Portfolio | 148,291 | 148,291 | 114,733 | ||||||||||||
Distribution Agreement
Effective September 18, 2006 (or since inception, if later), A I M Distributors, Inc. (the "Distributor") serves as the distributor of Creation Units of each Fund pursuant to a Distribution Agreement between the Distributor and the Trust. The Distributor does not maintain a secondary market in shares. Prior to September 18, 2006, ALPS Distributors, Inc. served as the distributor.
The Board of Trustees of the Trust has adopted a distribution plan pursuant to Rule 12b-1 under the 1940 Act. In accordance with the Rule 12b-1 plan, each Fund is authorized to pay an amount up to a maximum annual rate of 0.25% of the average daily net assets for certain distribution-related activities. No 12b-1 fees are currently charged to the Funds, and there are no plans to impose these fees.
84
Notes to Financial Statements (Continued)
PowerShares Exchange-Traded Fund Trust
April 30, 2007
Licensing Fee Agreements
The Adviser has entered into licensing agreements for each Fund with the following "Licensors":
| Fund | Licensor | ||||||
| Dynamic Large Cap Growth Portfolio | American Stock Exchange | ||||||
| Dynamic Large Cap Value Portfolio | American Stock Exchange | ||||||
| Dynamic Mid Cap Growth Portfolio | American Stock Exchange | ||||||
| Dynamic Mid Cap Value Portfolio | American Stock Exchange | ||||||
| Dynamic Small Cap Growth Portfolio | American Stock Exchange | ||||||
| Dynamic Small Cap Value Portfolio | American Stock Exchange | ||||||
| Dynamic Large Cap Portfolio | American Stock Exchange | ||||||
| Dynamic Mid Cap Portfolio | American Stock Exchange | ||||||
| Dynamic Small Cap Portfolio | American Stock Exchange | ||||||
| Dynamic Aggressive Growth Portfolio | American Stock Exchange | ||||||
| Dynamic Deep Value Portfolio | American Stock Exchange | ||||||
| Zacks Micro Cap Portfolio | Zacks Investment Research, Inc. | ||||||
| Zacks Small Cap Value Portfolio | Zacks Investment Research, Inc. | ||||||
The above trademarks are owned by the respective Licensors. These trademarks have been licensed to the Adviser for use with the Funds. The Funds are not sponsored, endorsed, sold or promoted by the Licensors and the Licensors make no representation regarding the advisability of investing in any of these Funds. The Funds are required to pay the licensing fees, which are shown on the Statements of Operations.
The Bank of New York serves as the administrator, custodian and fund accounting and transfer agent for each Fund.
Note 4. INVESCO Transaction and Transactions with Affiliates
On September 18, 2006, INVESCO PLC (formerly AMVECAP PLC) and A I M Management Group, Inc., an indirect wholly-owned subsidiary of INVESCO PLC, announced that they had completed their acquisition of the Adviser (the "Acquisition"). The Board of Trustees, including a majority of the independent Trustees, and shareholders of each Fund had previously approved a new advisory agreement with the Adviser that became effective on September 18, 2006.
The Funds are permitted to invest daily available cash balances in affiliated money market funds. The Funds invest in the Liquid Assets Portfolio ("LAP") of the Short-Term Investments. LAP is advised by A I M Advisors, Inc., an affiliate of the Adviser.
85
Notes to Financial Statements (Continued)
PowerShares Exchange-Traded Fund Trust
April 30, 2007
Note 5. Federal Income Tax
At April 30, 2007, the components of accumulated earnings/loss on a tax-basis were as follows:
| Accumulated Earnings | Net Accumulated Capital and other Gains/Losses | Unrealized Appreciation/ Depreciation | Gross Unrealized Appreciation | Gross Unrealized Depreciation | Total Accumulated Earnings/Loss | ||||||||||||||||||||||
| Dynamic Large Cap Growth Portfolio | $ | — | $ | (11,107,930 | ) | $ | 20,398,165 | $ | 22,504,269 | $ | (2,106,104 | ) | $ | 9,290,235 | |||||||||||||
| Dynamic Large Cap Value Portfolio | 1,248,210 | (1,449,557 | ) | 21,451,096 | 23,494,556 | (2,043,460 | ) | 21,249,749 | |||||||||||||||||||
| Dynamic Mid Cap Growth Portfolio | — | (8,478,077 | ) | 18,065,322 | 19,088,650 | (1,023,328 | ) | 9,587,245 | |||||||||||||||||||
| Dynamic Mid Cap Value Portfolio | 298,057 | (2,622,571 | ) | 10,008,064 | 10,711,193 | (703,129 | ) | 7,683,550 | |||||||||||||||||||
| Dynamic Small Cap Growth Portfolio | — | (13,917,821 | ) | 4,646,608 | 6,951,511 | (2,304,903 | ) | (9,271,213 | ) | ||||||||||||||||||
| Dynamic Small Cap Value Portfolio | 25,537 | (4,632,871 | ) | 4,870,856 | 7,910,846 | (3,039,990 | ) | 263,522 | |||||||||||||||||||
| Dynamic Large Cap Portfolio | 18,586 | — | 636,237 | 686,709 | (50,472 | ) | 654,823 | ||||||||||||||||||||
| Dynamic Mid Cap Portfolio | 16,473 | — | 767,272 | 855,164 | (87,892 | ) | 783,745 | ||||||||||||||||||||
| Dynamic Small Cap Portfolio | 193 | — | 279,291 | 557,738 | (278,447 | ) | 279,484 | ||||||||||||||||||||
| Dynamic Aggressive Growth Portfolio | — | — | 631,776 | 927,079 | (295,303 | ) | 631,776 | ||||||||||||||||||||
| Dynamic Deep Value Portfolio | 88,918 | — | 514,814 | 832,768 | (317,954 | ) | 603,732 | ||||||||||||||||||||
| Zacks Micro Cap Portfolio | 303,896 | (17,123,772 | ) | 13,167,092 | 20,122,429 | (6,955,337 | ) | (3,652,784 | ) | ||||||||||||||||||
| Zacks Small Cap Portfolio | — | (3,417,527 | ) | 2,125,762 | 6,684,009 | (4,558,247 | ) | (1,291,765 | ) | ||||||||||||||||||
At April 30, 2007, the cost of investments for Federal income tax purposes was as follows:
| Dynamic Large Cap Growth Portfolio | $ | 257,467,176 | |||||
| Dynamic Large Cap Value Portfolio | 270,537,192 | ||||||
| Dynamic Mid Cap Growth Portfolio | 171,485,081 | ||||||
| Dynamic Mid Cap Value Portfolio | 98,842,042 | ||||||
| Dynamic Small Cap Growth Portfolio | 56,737,512 | ||||||
| Dynamic Small Cap Value Portfolio | 112,814,508 | ||||||
| Dynamic Large Cap Portfolio | 10,255,654 | ||||||
| Dynamic Mid Cap Portfolio | 10,507,837 | ||||||
| Dynamic Small Cap Portfolio | 7,782,204 | ||||||
| Dynamic Aggressive Growth Portfolio | 9,975,444 | ||||||
| Dynamic Deep Value Portfolio | 15,464,287 | ||||||
| Zacks Micro Cap Portfolio | 178,949,873 | ||||||
| Zacks Small Cap Portfolio | 69,167,451 | ||||||
86
Notes to Financial Statements (Continued)
PowerShares Exchange-Traded Fund Trust
April 30, 2007
Distributions to Shareholders:
The tax character of distributions paid during the period ended April 30, 2007 was as follows:
| Distributions paid from Ordinary Income | |||||||
| Dynamic Large Cap Growth Portfolio | $ | 240,165 | |||||
| Dynamic Large Cap Value Portfolio | 3,984,387 | ||||||
| Dynamic Mid Cap Growth Portfolio | 711,633 | ||||||
| Dynamic Mid Cap Value Portfolio | 891,950 | ||||||
| Dynamic Small Cap Value Portfolio | 591,897 | ||||||
| Dynamic Large Cap Portfolio | 45,948 | ||||||
| Dynamic Mid Cap Portfolio | 34,110 | ||||||
| Dynamic Small Cap Portfolio | 1,164 | ||||||
| Dynamic Deep Value Portfolio | 43,560 | ||||||
| Zacks Micro Cap Portfolio | 206,496 | ||||||
| Zacks Small Cap Portfolio | 126,531 | ||||||
| Distributions paid from Return of Capital | |||||||
| Dynamic Large Cap Growth Portfolio | $ | 3,527 | |||||
| Dynamic Mid Cap Growth Portfolio | 9,929 | ||||||
| Zacks Small Cap Portfolio | 10,819 | ||||||
The tax character of distributions paid during the year ended April 30, 2006 was as follows:
| Distributions paid from Ordinary Income | |||||||
| Dynamic Large Cap Growth Portfolio | $ | 12,532 | |||||
| Dynamic Large Cap Value Portfolio | 613,947 | ||||||
| Dynamic Mid Cap Value Portfolio | 398,693 | ||||||
| Dynamic Small Cap Value Portfolio | 190,946 | ||||||
| Zacks Micro Cap Portfolio | 50,928 | ||||||
| Distributions paid from Return of Capital | |||||||
| Zacks Micro Cap Portfolio | $ | 17,888 | |||||
87
Notes to Financial Statements (Continued)
PowerShares Exchange-Traded Fund Trust
April 30, 2007
At April 30, 2007, for Federal income tax purposes, the Funds have capital loss carryforwards available as shown in the table below, to the extent provided by the regulations, to offset future capital gains through the years indicated. To the extent that these loss carryforwards are used to offset future capital gains, it is probable that the capital gains so offset will not be distributed to shareholders.
| Capital Loss Available Through | Total | ||||||||||||||
| 2014 | 2015 | Amount | |||||||||||||
| Dynamic Large Cap Growth Portfolio | $ | 191,864 | $ | 10,916,066 | $ | 11,107,930 | |||||||||
| Dynamic Large Cap Value Portfolio | 70,814 | 1,378,743 | 1,449,557 | ||||||||||||
| Dynamic Mid Cap Growth Portfolio | 422,220 | 8,055,857 | 8,478,077 | ||||||||||||
| Dynamic Mid Cap Value Portfolio | 237,806 | 2,384,765 | 2,622,571 | ||||||||||||
| Dynamic Small Cap Growth Portfolio | 823,782 | 13,094,039 | 13,917,821 | ||||||||||||
| Dynamic Small Cap Value Portfolio | 703,862 | 3,929,009 | 4,632,871 | ||||||||||||
| Zacks Micro Cap Portfolio | 1,951,245 | 15,172,527 | 17,123,772 | ||||||||||||
| Zacks Small Cap Portfolio | — | 3,417,527 | 3,417,527 | ||||||||||||
Capital losses incurred after October 31 ("post-October losses") within the taxable year deemed to arise on the first business day of each Fund's next taxable year.
During the period ended April 30, 2007, the Funds incurred and will elect to defer net capital losses as follows:
| Post-October Losses | |||||||
| Dynamic Large Cap Growth Portfolio | $ | 2,593,361 | |||||
| Dynamic Large Cap Value Portfolio | 194,556 | ||||||
| Dynamic Mid Cap Growth Portfolio | 2,556,964 | ||||||
| Dynamic Mid Cap Value Portfolio | 1,084,767 | ||||||
| Dynamic Small Cap Growth Portfolio | 2,563,324 | ||||||
| Dynamic Small Cap Value Portfolio | 2,570,711 | ||||||
| Dynamic Large Cap Portfolio | 17,445 | ||||||
| Dynamic Mid Cap Portfolio | 77,148 | ||||||
| Dynamic Small Cap Portfolio | 411,583 | ||||||
| Dynamic Aggressive Growth Portfolio | 201,896 | ||||||
| Dynamic Deep Value Portfolio | 52,826 | ||||||
| Zacks Micro Cap Portfolio | 4,734,734 | ||||||
| Zacks Small Cap Portfolio | 3,147,966 | ||||||
88
Notes to Financial Statements (Continued)
PowerShares Exchange-Traded Fund Trust
April 30, 2007
At April 30, 2007, the following reclassifications were made to the capital accounts of the Funds, to reflect permanent book/tax differences and income and gains available for distributions under income tax regulations, which are primarily due to the differences between book and tax treatment of investments in real estate investment trusts, investments in partnerships, wash sales from redemption in-kind transactions, redemption in-kind transactions, return of capital and net investment losses. Net investment income, net realized gains and net assets were not affected by these changes.
| Undistributed Net Investment Income (Loss) | Undistributed Capital Gains/ (Accumulated Losses) | Paid in Capital | |||||||||||||
| Dynamic Large Cap Growth Portfolio | $ | (29,370 | ) | $ | (10,863,504 | ) | $ | 10,892,874 | |||||||
| Dynamic Large Cap Value Portfolio | (333,980 | ) | (26,125,923 | ) | 26,459,903 | ||||||||||
| Dynamic Mid Cap Growth Portfolio | 65,257 | (12,750,214 | ) | 12,684,957 | |||||||||||
| Dynamic Mid Cap Value Portfolio | (54,435 | ) | (7,700,152 | ) | 7,754,587 | ||||||||||
| Dynamic Small Cap Growth Portfolio | 302,881 | (10,460,800 | ) | 10,157,919 | |||||||||||
| Dynamic Small Cap Value Portfolio | (51,487 | ) | (12,187,046 | ) | 12,238,533 | ||||||||||
| Dynamic Large Cap Portfolio | 6,713 | (282,942 | ) | 276,229 | |||||||||||
| Dynamic Mid Cap Portfolio | 1,941 | (671,650 | ) | 669,709 | |||||||||||
| Dynamic Small Cap Portfolio | 877 | (774,182 | ) | 773,305 | |||||||||||
| Dynamic Aggressive Growth Portfolio | 18,784 | (407,050 | ) | 388,266 | |||||||||||
| Dynamic Deep Value Portfolio | (842 | ) | (286,927 | ) | 287,769 | ||||||||||
| Zacks Micro Cap Portfolio | (166,434 | ) | (23,630,645 | ) | 23,797,079 | ||||||||||
| Zacks Small Cap Portfolio | (17,275 | ) | (8,314,613 | ) | 8,331,888 | ||||||||||
Note 6. Investment Transactions
For the period ended April 30, 2007, the cost of securities purchased and proceeds from sales of securities, excluding short-term securities and in-kind transactions, were as follows:
| Purchases | Sales | ||||||||||
| Dynamic Large Cap Growth Portfolio | $ | 113,415,415 | $ | 110,419,047 | |||||||
| Dynamic Large Cap Value Portfolio | 39,959,827 | 39,318,058 | |||||||||
| Dynamic Mid Cap Growth Portfolio | 82,731,328 | 83,871,284 | |||||||||
| Dynamic Mid Cap Value Portfolio | 30,981,146 | 31,099,869 | |||||||||
| Dynamic Small Cap Growth Portfolio | 78,354,579 | 79,612,452 | |||||||||
| Dynamic Small Cap Value Portfolio | 60,826,637 | 63,013,811 | |||||||||
| Dynamic Large Cap Portfolio | 555,493 | 488,166 | |||||||||
| Dynamic Mid Cap Portfolio | 1,014,245 | 1,051,407 | |||||||||
| Dynamic Small Cap Portfolio | 7,592,907 | 7,074,469 | |||||||||
| Dynamic Aggressive Growth Portfolio | 1,314,921 | 1,354,937 | |||||||||
| Dynamic Deep Value Portfolio | 1,201,271 | 1,031,183 | |||||||||
| Zacks Micro Cap Portfolio | 116,221,483 | 116,681,614 | |||||||||
| Zacks Small Cap Value Portfolio | 55,608,442 | 56,035,570 | |||||||||
89
Notes to Financial Statements (Continued)
PowerShares Exchange-Traded Fund Trust
April 30, 2007
For the period ended April 30, 2007, in-kind transactions were as follows:
| Purchases | Sales | ||||||||||
| Dynamic Large Cap Growth Portfolio | $ | 288,006,950 | $ | 178,034,600 | |||||||
| Dynamic Large Cap Value Portfolio | 481,910,735 | 322,514,174 | |||||||||
| Dynamic Mid Cap Growth Portfolio | 200,994,260 | 129,379,665 | |||||||||
| Dynamic Mid Cap Value Portfolio | 134,468,919 | 94,622,733 | |||||||||
| Dynamic Small Cap Growth Portfolio | 99,604,479 | 150,690,125 | |||||||||
| Dynamic Small Cap Value Portfolio | 139,842,501 | 93,869,051 | |||||||||
| Dynamic Large Cap Portfolio | 18,891,121 | 9,011,944 | |||||||||
| Dynamic Mid Cap Portfolio | 22,968,898 | 13,066,642 | |||||||||
| Dynamic Small Cap Portfolio | 19,409,619 | 12,537,494 | |||||||||
| Dynamic Aggressive Growth Portfolio | 19,034,228 | 9,235,979 | |||||||||
| Dynamic Deep Value Portfolio | 20,746,048 | 5,797,473 | |||||||||
| Zacks Micro Cap Portfolio | 139,132,828 | 113,017,598 | |||||||||
| Zacks Small Cap Value Portfolio | 81,907,301 | 70,411,287 | |||||||||
There were no purchases or sales of U.S. government or government agency obligations for the period ended April 30, 2007. Gains on in-kind transactions are not considered taxable gains for Federal income tax purposes.
Note 7. Trustees' Fees
The Trust compensates each Trustee who is not an employee of the Adviser or its affiliates. The interested Trustee does not receive any Trustees' fees.
Note 8. Capital
Shares are created and redeemed by the Trust only in Creation Unit size aggregations of 100,000. Transaction fees at scheduled amounts ranging from $500 to $2,000 per Creation Unit are charged to those persons creating or redeeming Creation Units. Such transactions are generally permitted on an in-kind basis, with a balancing cash component to equate the transaction to the net asset value per unit of each Fund of the Trust on the transaction date.
Note 9. Risk of Concentration
The Funds concentrate their investments in certain industries, subjecting them to greater risk than funds that invest in a wider range of industries.
Note 10. Indemnifications
Under the Trust's organizational documents, its Officers and Trustees are indemnified against certain liabilities arising out of the performance of their duties to the Trust. Additionally, in the normal course of business, the Trust enters into contracts with service providers that contain general indemnification clauses. The Trust's maximum exposure under these arrangements is unknown, as this would involve future claims that may be made against the Trust that have not yet occurred. However, based on experience, the Trust believes the risk of loss to be remote.
90
Notes to Financial Statements (Continued)
PowerShares Exchange-Traded Fund Trust
April 30, 2007
Note 11. New Accounting Pronouncements
On July 13, 2006, the Financial Accounting Standards Board ("FASB") issued FASB Interpretation No. 48, Accounting for Uncertainty in Income Taxes ("FIN 48"). FIN 48 prescribes a recognition threshold and measurement attribute for the financial statement recognition and measurement for a tax position taken or expected to be taken in a tax return. FIN 48 also provides guidance on derecognition, classification, interest and penalties, accounting in interim periods, disclosure and transition. On December 22, 2006, the Securities and Exchange Commission delayed the effective date of FIN 48, which will result in adoption for the Funds as of October 31, 2007. At this time, management is currently assessing the impact of FIN 48, if any, on the Funds' financial statements.
On September 20, 2006, the FASB released Statement of Financial Accounting Standards No. 157 "Fair Value Measurement" ("FAS 157"). FAS 157 establishes an authoritative definition of fair value, sets out a framework for measuring fair value, and requires additional disclosures about fair-value measurement. The application of FAS 157 is required for fiscal years beginning after November 15, 2007 and interim periods within those fiscal years. At this time, management is currently assessing the impact of FAS 157, if any, on the Funds' financial statements and intends for the Funds to adopt FAS 157 provisions during the fiscal year ending April 30, 2009.
91
Report of Independent Registered Public Accounting Firm
To the Board of Trustees and Shareholders of PowerShares Exchange-Traded Fund Trust:
In our opinion, the accompanying statements of assets and liabilities, including the portfolios of investments, and the related statements of operations and of changes in net assets and the financial highlights present fairly, in all material respects, the financial position of the portfolios indicated in Note 1 of the financial statements comprising PowerShares Exchange-Traded Fund Trust (the "Trust") at April 30, 2007, the results of each of their operations, the changes in each of their net assets and the financial highlights, for each of the periods presented, in conformity with accounting principles generally accepted in the United States of America. These financial statements and financial highlights (hereafter referred to as "financial statements") are the responsibility of the Trust's management; our responsibility is to express an opinion on these financial statements based on our audits. We conducted our audits of thes e financial statements in accordance with the standards of the Public Company Accounting Oversight Board (United States). Those standards require that we plan and perform the audits to obtain reasonable assurance about whether the financial statements are free of material misstatement. An audit includes examining, on a test basis, evidence supporting the amounts and disclosures in the financial statements, assessing the accounting principles used and significant estimates made by management, and evaluating the overall financial statement presentation. We believe that our audits, which included confirmation of securities at April 30, 2007 by correspondence with the custodian and brokers, provide a reasonable basis for our opinion.
PricewaterhouseCoopers LLP
New York, New York
June 25, 2007
92
Supplemental Information (Unaudited)
Federal Income Tax Information
The percentages of investment income (dividend income plus short-term gains, if any) qualify as follows:
| Qualified dividend income | Dividends-received deduction | ||||||||||
| Dynamic Large Cap Growth Portfolio | 100 | % | 100 | % | |||||||
| Dynamic Large Cap Value Portfolio | 100 | % | 100 | % | |||||||
| Dynamic Mid Cap Growth Portfolio | 100 | % | 100 | % | |||||||
| Dynamic Mid Cap Value Portfolio | 100 | % | 100 | % | |||||||
| Dynamic Small Cap Growth Portfolio | 0 | % | 0 | % | |||||||
| Dynamic Small Cap Value Portfolio | 100 | % | 100 | % | |||||||
| Dynamic Large Cap Portfolio | 100 | % | 100 | % | |||||||
| Dynamic Mid Cap Portfolio | 100 | % | 100 | % | |||||||
| Dynamic Small Cap Portfolio | 100 | % | 100 | % | |||||||
| Dynamic Aggressive Growth Portfolio | 0 | % | 0 | % | |||||||
| Dynamic Deep Value Portfolio | 100 | % | 100 | % | |||||||
| Zacks Micro Cap Portfolio | 100 | % | 100 | % | |||||||
| Zacks Small Cap Portfolio | 100 | % | 100 | % | |||||||
93
Supplemental Information (Unaudited) (Continued)
Trustees and Officers
The Trustees who are not affiliated with the Adviser or affiliates of the Adviser and executive officers of the Trust, their term of office and length of time served, their principal business occupations during the past five years, the number of portfolios in the Fund Complex overseen by each Trustee and the other directorships, if any, held by the Trustee, are shown below.
| Name, Address and Age of Independent Trustees | Position(s) with Trust | Length of Time Served* | Principal Occupation(s) During Past 5 Years | Number of Portfolios in Fund Complex*** Overseen by Trustees | Other Directorships Held by Trustees | ||||||||||||||||||
| Ronn R. Bagge (49) YQA Capital Management, LLC 1755 S. Naperville Rd., Suite 100 Wheaton, IL 60187 | Trustee | Since 2003 | YQA Capital Management LLC (July 1998-Present); formerly Owner/CEO of Electronic Dynamic Balancing Co., Inc. (high-speed rotating equipment service provider) | 79 | None | ||||||||||||||||||
| Marc M. Kole (47)** c/o PowerShares Capital Management LLC 301 W. Roosevelt Road Wheaton, IL 60187 | Trustee | Since 2006 | Controller, Priority Health (September 2005-present); Interim CFO, Priority Health (July 2006-February 2007); formerly Senior Vice President of Finance, United Healthcare (health insurance) (July 2004-July 2005); Senior Vice President of Finance, Oxford Health Plans (June 2000-July 2004) | 79 | None | ||||||||||||||||||
| D. Mark McMillan (44) c/o PowerShares Capital Management LLC 301 W. Roosevelt Road Wheaton, IL 60187 | Trustee | Since 2003 | Member, Bell, Boyd & Lloyd LLC (1989-Present) | 79 | None | ||||||||||||||||||
* This is the date the Trustee began serving the Trust.
** At a Board meeting held on December 14, 2006, Marc Kole was elected to serve as Trustee of the Trust.
*** Fund Complex includes all open-end funds (including all of their Portfolios) advised by the Adviser. The Fund Complex consists of the Trust's 70 Portfolios and one other exchange-traded fund trust with 9 Portfolios advised by the Adviser.
94
Supplemental Information (Unaudited) (Continued)
Trustees and Officers (Continued)
| Name, Address and Age of Independent Trustees | Position(s) with Trust | Length of Time Served* | Principal Occupation(s) During Past 5 Years | Number of Portfolios in Fund Complex*** Overseen by Trustees | Other Directorships Held by Trustees | ||||||||||||||||||
| Philip M. Nussbaum (45) c/o PowerShares Capital Management LLC 301 W. Roosevelt Road Wheaton, IL 60187 | Trustee | Since 2003 | Chairman, Performance Trust Capital Partners (formerly Betzold, Berg, Nussbaum & Heitman, Inc.); formerly Managing Director, Communication Institute (May 2002-August 2003); Executive Vice President of Finance, Betzold, Berg, Nussbaum & Heitman, Inc. (March 1994-1999) | 79 | None | ||||||||||||||||||
| Donald H. Wilson (47)** c/o PowerShares Capital Management LLC 301 W. Roosevelt Road Wheaton, IL 60187 | Trustee | Since 2006 | Executive Vice President and Chief Financial Officer, AMCORE Financial, Inc. (bank holding company) (February 2006-present); formerly, Senior Vice President and Treasurer, Marshall & Ilsley Corp. (bank holding company) (May 1995-February 2006) | 79 | None | ||||||||||||||||||
* This is the date the Trustee began serving the Trust.
** At a Board meeting held on December 14, 2006, Donald Wilson was elected to serve as Trustee of the Trust.
*** Fund Complex includes all open-end funds (including all of their Portfolios) advised by the Adviser. The Fund Complex consists of the Trust's 70 Portfolios and one other exchange-traded fund trust with 9 Portfolios advised by the Adviser.
95
Supplemental Information (Unaudited) (Continued)
Trustees and Officers (Continued)
| Name, Address and Age of Management Trustee | Position(s) with Trust | Length of Time Served* | Principal Occupation(s) During Past 5 Years | Number of Portfolios in Fund Complex*** Overseen by Trustee | Other Directorships Held by Trustee | ||||||||||||||||||
| H. Bruce Bond (44)** PowerShares Capital Management LLC 301 W. Roosevelt Road Wheaton, IL 60187 | Chairman of the Board, Trustee and Chief Executive Officer | Since 2003 | Managing Director, PowerShares Capital Management LLC (August 2002-Present); Manager, Nuveen Investments (April 1998-August 2002) | 79 | None | ||||||||||||||||||
* This is the date the Management Trustee began serving the Trust.
** Interested person as defined in Section 2(a)(19) of the 1940 Act.
*** Fund Complex includes all open-end funds (including all of their Portfolios) advised by the Adviser. The Fund Complex consists of the Trust's 70 Portfolios and one other exchange-traded fund trust with 9 Portfolios advised by the Adviser.
96
Supplemental Information (Unaudited) (Continued)
Trustees and Officers (Continued)
| Name, Address and Age of Officers | Position(s) with Trust | Length of Time Served* | Principal Occupation(s) During Past 5 Years | ||||||||||||
| Bruce T. Duncan (52) PowerShares Capital Management LLC 301 W. Roosevelt Road Wheaton, IL 60187 | Chief Financial Officer and Treasurer | Since 2006 | Senior Vice President of Finance, PowerShares Capital Management LLC (September 2005-Present); Private Practice Attorney (2000-2005); Vice President of Investor Relations, The ServiceMaster Company (1994-2000); Vice President of Taxes, The ServiceMaster Company (1990-2000) | ||||||||||||
| Kevin R. Gustafson (41) PowerShares Capital Management LLC 301 W. Roosevelt Road Wheaton, IL 60187 | Chief Compliance Officer | Since 2004 | General Counsel and Chief Compliance Officer, PowerShares Capital Management LLC (September 2004-Present); Attorney, Nyberg & Gustafson (2001-2004); Attorney, Burke, Warren, McKay & Serritella, P.C. (1997-2000) | ||||||||||||
| Keith Ovitt (44) PowerShares Capital Management LLC 301 W. Roosevelt Road Wheaton, IL 60187 | Secretary | Since 2003 | Managing Director, PowerShares Capital Management LLC (April 2003-Present); President, Ovitech (2002-2003); Vice President of Information Systems for DFG Foods, LLC (Division of FoodBrands America/Tyson Foods) (1999-2002); Systems Manager, Nabisco Biscuit Company (1997-1999) | ||||||||||||
* This is the period for which the Officers began serving the Trust. Each Officer serves an indefinite term, until his successor is elected.
97
Board Considerations Regarding Continuation of Investment Advisory Agreement (Unaudited)
At a meeting held on April 20, 2007, the Board of Trustees of the PowerShares Exchange-Traded Fund Trust (the "Trust"), including the Independent Trustees, unanimously approved the continuation of the Investment Advisory Agreement between PowerShares Capital Management LLC (the "Adviser") and the Trust for the following series (the "Funds"):
PowerShares Dynamic Market Portfolio
PowerShares Dynamic OTC Portfolio
PowerShares Golden Dragon Halter USX China Portfolio
PowerShares High Yield Equity Dividend AchieversTM Portfolio
PowerShares WilderHill Clean Energy Portfolio
PowerShares Dynamic Large Cap Growth Portfolio
PowerShares Dynamic Large Cap Value Portfolio
PowerShares Dynamic Mid Cap Growth Portfolio
PowerShares Dynamic Mid Cap Value Portfolio
PowerShares Dynamic Small Cap Growth Portfolio
PowerShares Dynamic Small Cap Value Portfolio
PowerShares Dynamic Biotechnology & Genome Portfolio
PowerShares Dynamic Food & Beverage Portfolio
PowerShares Dynamic Leisure and Entertainment Portfolio
PowerShares Dynamic Media Portfolio
PowerShares Dynamic Networking Portfolio
PowerShares Dynamic Pharmaceuticals Portfolio
PowerShares Dynamic Semiconductors Portfolio
PowerShares Dynamic Software Portfolio
PowerShares Zacks Micro Cap Portfolio
PowerShares Aerospace & Defense Portfolio
PowerShares Dynamic Hardware & Consumer Electronics Portfolio
PowerShares Dynamic Telecommunications & Wireless Portfolio
PowerShares Value Line Timeliness Select Portfolio
PowerShares Divided AchieversTM Portfolio
PowerShares International Dividend AchieversTM Portfolio
PowerShares High Growth Rate Dividend AchieversTM Portfolio
PowerShares Zacks Small Cap Portfolio
PowerShares Dynamic Building & Construction Portfolio
PowerShares Dynamic Energy Exploration & Production Portfolio
PowerShares Dynamic Insurance Portfolio
PowerShares Dynamic Oil & Gas Services Portfolio
PowerShares Dynamic Retail Portfolio
PowerShares Dynamic Utilities Portfolio
PowerShares Lux Nanotech Portfolio
PowerShares FTSE RAFI US 1000 Portfolio
PowerShares Water Resources Portfolio
The Trustees reviewed information from the Adviser describing: (i) the nature, extent and quality of services provided, (ii) the investment performance of the Funds and the Adviser, (iii) the costs of services provided and estimated profits realized by the Adviser, (iv) the extent to which economies of scale are realized as the Funds grow, (v) whether fee levels reflect any possible economies of scale for the benefit of Fund shareholders, (vi) comparisons of services rendered and amounts paid to other registered investment companies and (vii) any benefits realized by the Adviser from its relationship with each Fund. Based on all of the information considered and the conclusions reached, the Board, including the Independent Trustees, determined to approve the continuation of the Investment Advisory Agreement for each Fund listed above. No single factor was determinative in the Board's analysis.
Nature, Extent and Quality of Services. In evaluating the nature, extent and quality of the Adviser's services, the Trustees reviewed information concerning the functions performed by the Adviser for the
98
Board Considerations Regarding Continuation of Investment Advisory Agreement (Unaudited) (Continued)
Funds, information describing the Adviser's current organization, including operations assistance provided by the Adviser's new parent organization, AMVESCAP LLC, and the background and experience of the persons responsible for the day-to-day management of the Funds. The Trustees reviewed matters related to the Adviser's portfolio transaction policies and procedures. The Trustees reviewed information on the performance of the Funds and the performance of their benchmark indices. The Trustees also reviewed reports on the correlation and tracking error between the underlying index and each Fund's performance and reviewed a report of a consultant to the Adviser on correlation and tracking error. The Trustees concluded that Funds are correlated to their underlying index and that the tracking error was within a reasonable range.
The Trustees also considered the services provided by the Adviser in its oversight of the Funds' administrator, custodian and transfer agent. They noted the significant amount of time and effort that had been devoted to this oversight function.
Based on their review, the Trustees found that the nature and extent of services provided to the Funds under the Investment Advisory Agreement are appropriate and that the quality is good.
Fees, Expenses and Profitability. The Trustees reviewed and discussed the information provided by the Adviser on each Fund's expense ratio and the advisory fee, as compared to three categories of comparable funds selected by Lipper Inc., an independent source: exchange-traded index funds ("ETFs"), open-end funds and closed-end funds. The Trustees also reviewed and discussed additional information prepared by Lipper Inc. on expense ratios and advisory fees of a broader universe of ETFs and other index funds. The Adviser supplemented the information prepared by Lipper Inc. with data it compiled on expense ratios and advisory fees of newer ETFs that recently commenced operations. The Trustees noted that the annual advisory fee charged to the Funds was identical (0.50% of average net assets), except for the advisory fee for the PowerShares High Yield Equi ty Dividend AchieversTM Portfolio, the PowerShares Dividend AchieversTM Portfolio, the PowerShares High Growth Rate Dividend AchieversTM Portfolio and the PowerShares International Dividend AchieversTM Portfolio (for each of which the annual advisory fee was 0.40% of average net assets), and that the Adviser had agreed to waive the fee and/or pay expenses to the extent necessary to prevent the annual operating expenses of each Fund (excluding interest expenses, licensing fees (for all Funds other than the initial two Funds, the PowerShares Dynamic OTC Portfolio and the PowerShares Dynamic Market Portfolio), brokerage commissions and other trading expenses, taxes and extraordinary expenses) from exceeding 0.60% (0.50% for the PowerShares High Yield Equity Dividend AchieversTM Portfolio, the PowerShares Dividend AchieversTM Portfolio, the PowerShares High Growth Rate Dividend AchieversTM Portfolio and the PowerShares International Div idend AchieversTM Portfolio) at least until April 30, 2008. The Trustees noted that the Adviser does not provide investment management services to clients other than the Trust. The Trustees noted that the advisory fees were at the higher end of the ETF universe, but were generally lower than fees for open-end (non-ETF) funds and closed-end funds, and were reasonable because of the complexity of the indices, which generally require more frequent rebalancing of the portfolios, the distinguishing factors of the Funds, and the higher administrative, operational and management oversight costs for the Adviser. The Board therefore concluded that the advisory fee and expense ratio of each Fund are competitive and that the advisory fee for each Fund is reasonable and appropriate in amount in light of the quality of services provided and the expense cap in place.
99
Board Considerations Regarding Continuation of Investment Advisory Agreement (Unaudited) (Continued)
In conjunction with their review of fees, the Trustees also considered information provided by the Adviser on the revenues received by the Adviser under the Agreement, as well as the fees waived and expenses reimbursed by the Adviser for the Funds. The Trustees reviewed information provided by the Adviser on its profitability as well as any profits realized by the Adviser from its relationship to each Fund. The Trustees noted the Adviser's statement that its costs of managing the Funds generally exceeded the amount payable as management fees under the Investment Advisory Agreement, and that most of the Funds were operating in a cash loss position. The Trustees concluded that the profitability to the Adviser of the advisory services provided to the Funds is not unreasonable.
Economies of Scale and Whether Fee Levels Reflect These Economies of Scale. The Trustees reviewed the information provided by the Adviser as to the extent to which economies of scale are realized as each Fund grows and whether fee levels reflect economies of scale for the benefit of shareholders. The Trustees reviewed each Fund's asset size, expense ratio, expense limitation agreed to by the Adviser and whether the investment process produced economies of scale. The Trustees noted that certain fixed costs associated with the management of the Funds are being reduced on a per-Fund basis as additional Funds are added, and that the gradual reduction of the per-Fund cost enabled the Adviser to operate some of the Funds under the expense cap, which potentially would lower the costs to shareholders. The Trustees noted that the Excess Expense Agreement with the Trust provided that the Adviser was entitled to be reimbursed by each Fund for fees waived or expenses absorbed pursuant to the expense cap for a period of three years from the date the fee or expense was incurred, provided that no reimbursement would be made that would result in a Fund exceeding its expense cap.
The Trustees noted that the Adviser had not identified any further benefits that it derived from its relationship with the Funds, and had noted that it does not have any soft-dollar arrangements.
Based on all of the information considered and the conclusions reached, the Board, including the Independent Trustees, determined to approve the continuation of the Investment Advisory Agreement for each Fund listed above. No single factor was determinative in the Board's analysis.
100
PowerShares Leading the Intelligent ETF Revolution
PowerShares continues to offer new solutions to the complex needs demanded by advisors and investors today. PowerShares is "Leading the Intelligent ETF Revolution" providing investment advisors and investors with institutional-caliber asset management by seeking to replicate enhanced indexes in one of the more benefit-rich investment vehicles available in the marketplace today, the exchange-traded fund (EFT). Each PowerShares fund can be classified into one of three different categories based on the objective and characteristics of its underlying index: Intelligent Index, Intelligent Exposure and Intelligent Access.
For most recent portfolio performance, please visit our website at www.powershares.com
This page contains advertising materials and should not be viewed as part of the Annual Report.
101
Intelligent Index
PowerShares believes that having insight into a stock's investment merit can have a positive impact on performance. Therefore, most PowerShares ETFs are based on Intelligent Indexes, which seek to provide alpha1 by identifying stocks with the greatest investment merit. These indexes use proprietary methodologies to identify financially strong, effectively managed and attractively priced companies with strong capital appreciation potential. Because their objective is to maximize performance, Intelligent Indexes may look different from the market.
Exchange-Traded Funds
Intelligent Index
PWC - Dynamic Market
PWO - Dynamic OTC
PIQ - Dynamic MagniQuant
PJF - Dynamic Large Cap
PJG - Dynamic Mid Cap
PJM - Dynamic Small Cap
PWB - Dynamic Large Cap Growth
PWV - Dynamic Large Cap Value
PWJ - Dynamic Mid Cap Growth
PWP - Dynamic Mid Cap Value
PWT - Dynamic Small Cap Growth
PWY - Dynamic Small Cap Value
PGZ - Dynamic Aggressive Growth
PVM - Dynamic Deep Value
PYZ - Dynamic Basic Materials Sector
PEZ - Dynamic Consumer Discretionary Sector
PSL - Dynamic Consumer Staples Sector
PXI - Dynamic Energy Sector
PFI - Dynamic Financials Sector
PTH - Dynamic Healthcare Sector
PRN - Dynamic Industrials Sector
PTF - Dynamic Technology Sector
PTE - Dynamic Telecommunications & Wireless
PUI - Dynamic Utilities
PJB - Dynamic Banking
PBE - Dynamic Biotechnology & Genome
PKB - Dynamic Building & Construction
PXE - Dynamic Energy Exploration & Production
PBJ - Dynamic Food & Beverage
PHW - Dynamic Hardware & Consumer Electronics
PTJ - Dynamic Healthcare Services
PIC - Dynamic Insurance
PEJ - Dynamic Leisure and Entertainment
PBS - Dynamic Media
PXQ - Dynamic Networking
PXJ - Dynamic Oil & Gas Services
PJP - Dynamic Pharmaceuticals
PMR - Dynamic Retail
PSI - Dynamic Semiconductors
PSJ - Dynamic Software
1 Alpha is a measure of risk adjusted performance relative to a benchmark or the market.
This page contains advertising materials and should not be viewed as part of the Annual Report.
102
Intelligent Exposure
For investors looking for more market-like exposure, PowerShares offers a lineup of ETFs that seek to track indexes with an Intelligent Exposure objective. These indexes seek to provide accurate exposure to the economy, yet are constructed using more sophisticated techniques than traditional benchmark indexes, which typically use a weighting structure based on market capitalization. Under this traditional structure, market speculation can lead to significant mispricing of stocks and, therefore, suboptimal weights in the index. But indexes seeking Intelligent Exposure use a weighting structure based on company fundamentals: sales, cash flow, book value and dividends. PowerShares believes these factors paint a truer picture of a company's size and lead to more optimal index weightings.
Exchange-Traded Funds
Intelligent Exposure
PRF - FTSE RAFI US 1000
PRFZ - FTSE RAFI US 1500 Small-Mid
PRFM - FTSE RAFI Basic Materials Sector
PRFG - FTSE RAFI Consumer Goods Sector
PRFS - FTSE RAFI Consumer Services Sector
PRFE - FTSE RAFI Energy Sector
PRFF - FTSE RAFI Financials Sector
PRFH - FTSE RAFI Health Care Sector
PRFN - FTSE RAFI Industrials Sector
PRFQ - FTSE RAFI Telecom & Technology Sector
PRFU - FTSE RAFI Utilities Sector
Intelligent Access
Without targeted investment products, unique market segments such as currency or nanotech may be difficult for investors to access. These segments are the focus of indexes that promote Intelligent Access. PowerShares has a diverse lineup of ETFs based on indexes that offer exposure to specific, unique or previously uncovered market areas.
Exchange-Traded Funds
Intelligent Access
PPA - Aerospace & Defense
ADRA - BLDRS Asia 50 ADR Index Fund
ADRD - BLDRS Developed Markets 100 ADR Index Fund
ADRE - BLDRS Emerging Markets 50 ADR Index Fund
ADRU - BLDRS Europe 100 ADR Index Fund
PKW - Buyback Achievers
PZD - Cleantech
PFM - Dividend Achievers
PDP - DWA Technical Lenders
PGF - Financial Preferred
PGJ - Golden Dragon Halter USX China
PHJ - High Growth Rate Dividend Achievers
PEY - High Yield Equity Dividend Achievers
PID - International Dividend Achievers
PSP - Listed Private Equity
PXN - Lux Nanotech
QQQQ - PowerShares QQQ
PYH - Value Line Industry Rotation
PIV - Value Line Timeliness Select
PHO - Water Resources
PBW - WilderHill Clean Energy
PUW - WilderHill Progressive Energy
PZI - Zacks Micro Cap
PZJ - Zacks Small Cap
This page contains advertising materials and should not be viewed as part of the Annual Report.
103
PowerShares Asset Class Guide
Domestic Equity
Broad
PWC Dynamic Market
PWO Dynamic OTC
PIV Value Line Timeliness Select
PRF FTSE RAFI US 1000
PRFZ FTSE RAFI US 1500
PIQ Dynamic MagniQuant
QQQQ PowerShares QQQ
PKW Buyback Achievers
PDP DWA Technical Leaders
PVM Dynamic Deep Value
PGZ Dynamic Aggressive Growth
Style
PJF Dynamic Large Cap
PWB Dynamic Large Cap Growth
PWV Dynamic Large Cap Value
PJG Dynamic Mid Cap
PWJ Dynamic Mid Cap Growth
PWP Dynamic Mid Cap Value
PJM Dynamic Small Cap
PWT Dynamic Small Cap Growth
PWY Dynamic Small Cap Value
PZJ Zacks Small Cap
PZI Zacks Micro Cap
International/Region
Region
PPGJ Golden Dragon Halter USX China
ADRA BLDRS Asia 50 ADR Index Fund
ADRD BLDRS Developed Markets 100 ADR Index Fund
ADRE BLDRS Emerging Markets 50 ADR Index Fund
ADRU BLDRS Europe 100 ADR Index Fund
Income
PID International Dividend Achievers
Income/Dividend
PEY High Yield Equity Dividend Achievers
PHJ High Growth Rate Dividend Achievers
PFM Dividend Achievers
PGF Financial Preferred
Sector and Industry
Sector
PUI Dynamic Utilities
PYZ Dynamic Basic Materials Sector
PEZ Dynamic Consumer Discretionary Sector
PSL Dynamic Consumer Staples Sector
PXI Dynamic Energy Sector
PFI Dynamic Financial Sector
PTH Dynamic Healthcare Sector
PRN Dynamic Industrials Sector
PTF Dynamic Technology Sector
PTE Dynamic Telecommunications & Wireless
PRFG FTSE RAFI Consumer Goods Sector
PRFS FTSE RAFI Consumer Services Sector
PRFE FTSE RAFI Energy Sector
PRFF FTSE RAFI Financials Sector
PRFH FTSE RAFI Health Care Sector
PRFN FTSE RAFI Industrials Sector
PRFM FTSE RAFI Basic Materials Sector
PRFQ FTSE RAFI Telecommunications & Technology Sector
PRFU FTSE RAFI Utilities Sector
Industry
PJB Dynamic Banking Sector
PBE Dynamic Biotechnology & Genome
PKB Dynamic Building & Construction
PXE Dynamic Energy Exploration & Production
PBJ Dynamic Food & Beverage
PHW Dynamic Hardware & Consumer Electronics
PTJ Dynamic Healthcare Services Sector
PIC Dynamic Insurance
PEJ Dynamic Leisure and Entertainment
PBS Dynamic Media
PXQ Dynamic Networking
PXJ Dynamic Oil & Gas Services
PJP Dynamic Pharmaceuticals
PMR Dynamic Retail
PSI Dynamic Semiconductors
PSJ Dynamic Software
PPA Aerospace & Defense
PBW Clean Energy
PZD Cleantech
PSP Listed Private Equity
PXN Nanotech
PUW Progressive Energy
PYH Value Line Industry Rotation
PHO Water Resources
This page contains advertising materials and should not be viewed as part of the Annual Report.
104
PowerShares Risk Spectrum
Domestic Equity
More Conservative
Dynamic Deep Value
Dynamic Large Cap
Dynamic Mid Cap
Dynamic MagniQuant
Buyback Achievers
DWA Technical Leaders
Dynamic Small Cap
Dynamic Large Cap Value
FTSE RAFI US 1000
Dynamic Mid Cap Value
Dynamic Market
Dynamic Aggressive Growth
Dynamic Small Cap Value
FTSE RAFI US 1500 Small-Mid
Zacks Micro Cap
PowerShares QQQ
Dynamic Large Cap Growth
Dynamic Mid Cap Growth
Zacks Small Cap
Value Line Timeliness Select
Dynamic Small Cap Growth
Dynamic OTC
More Aggressive
International/Region
More Conservative
BLDRS Europe 100 ADR Index Fund
BLDRS Developed Markets 100 ADR Index Fund
BLDRS Asia 50 ADR Index Fund
International Dividend Achievers
BLDRS Emerging Markets 50 ADR Index Fund
Golden Dragon Halter USX China
More Aggressive
Income/Dividend
More Conservative
Financial Preferred
High Yield Equity Dividend Achievers
Dividend Achievers
High Growth Rate Dividend Achievers
More Aggressive
Sector and Industry
More Conservative
Dynamic Consumer Staples Sector
Dynamic Food & Beverage
Dynamic Banking Sector
Dynamic Financial Sector
Dynamic Utilities
Dynamic Insurance
FTSE RAFI Health Care Sector
Dynamic Healthcare Sector
FTSE RAFI Financials Sector
Dynamic Industrials Sector
Dynamic Media
Aerospace & Defense
FTSE RAFI Industrials Sector
Dynamic Pharmaceuticals
Dynamic Consumer Discretionary Sector
Dynamic Healthcare Services Sector
Dynamic Leisure and Entertainment
FTSE RAFI Consumer Goods Sector
FTSE RAFI Utilities Sector
Water Resources
FTSE RAFI Consumer Services Sector
FTSE RAFI Basic Materials Sector
Dynamic Basic Materials Sector
Dynamic Retail
FTSE RAFI Energy Sector
Dynamic Energy Sector
Dynamic Building & Construction
Value Line Industry Rotation
Dynamic Technology Sector
Progressive Energy
Dynamic Biotechnology & Genome
Dynamic Software
Nanotech
Dynamic Energy Exploration & Production
FTSE RAFI Telecommunications & Technology Sector
Dynamic Hardware & Consumer Electronics
Dynamic Telecommunications & Wireless
Dynamic Oil & Gas Services
Cleantech
Listed Private Equity
Clean Energy
Dynamic Networking
Dynamic Semiconductors
More Aggressive
This page contains advertising materials and should not be viewed as part of the Annual Report.
105
Exchange-Traded Funds
ETFs are investment funds that trade like individual stocks on all of the major exchanges, similar to shares of publicly held companies. They can be bought and sold on an exchange at any moment during market hours. Since they are listed and traded on an exchange, you can be confident that you are investing in a well-regulated market.
ETFs are one of the fastest growing investment products in the worldwide financial marketplace. As of 3.31.2007, 432 ETFs were listed in the U.S. with $433 billion in assets, up from two products with only $1 billion in assets in 1995.
ETFs seek investment results that correspond generally to the price and yield (before fees and expenses) of a listed index. While most ETFs share a similar objective, the principal investment strategies of the underlying indexes can have substantial differences. It is important to gain a clear understanding of an ETF's underlying index as the index's objective is inherently passed on to the fund shareholders by seeking to replicate the index.
Indexes
An index is a selection process or appointed committee that groups selected securities together to track their movement in aggregate. While only a few indexes are mentioned on the daily news, there are hundreds of indexes in existence today that differ from each other in diverse ways.
Broad Market
Broad market indexes are what most people think of when an index is mentioned. These indexes are designed to track the performance of the broad market.
Benchmark
Benchmark indexes are created to set a standard by which the performance or movement of individual securities and asset managers can be measured.
Exchange Composite
These indexes are designed to provide a comprehensive measure of the performance of all commons stocks listed on a particular exchange.
Sector or Industry
The aggregate financial marketplace is generally broken down into roughly ten sectors which are further dissected into many specific industries.
Style
Style indexes are created to identify groups of stocks that are either growth (companies currently experiencing appreciation or significant earnings or revenue growth) or value (companies determined to be under priced by fundamental measures) oriented.
Company Size
Market-capitalization indexes group together companies that are similar in size based on the number of outstanding shares times the share price, while fundamentally weighted indexes group together stocks of companies based on their financial fundamental valuation.
International / Country
International indexes group together stocks of companies that are affiliated by location outside of the U.S. or companies located with a specific country or region.
Income / Bond
Income indexes group stocks based on their type of income of securities, while bond indexes are designed to show the average performance of a group of debt securities.
This page contains advertising materials and should not be viewed as part of the Annual Report.
106
Specialty / Enhanced
Many other specialty indexes are created with specific investment management objectives or for customized purposes. These indexes can be created specifically with the intention to be used as the basis for an ETF. Investor targets can be met through an ETF where the index has the objective(s) of capital appreciation, risk control, income or diversification.
Benefits of PowerShares
PowerShares ETFs offer investors a low-cost, tax-efficient investment in a professionally crafted portfolio consisting of some of the best managed companies and most timely investments. See important risk factors in back.
Tax Advantaged Product Design
Taxes may be one of the most critical and overlooked factors in wealth creation over time. The ETF product structure defers some or possibly all capital gains until investors sell their shares.
Low Ownership Cost
ETFs provide lower ownership cost because of their efficient structure. PowerShares have established expense caps to make the cost of ownership clear and straightforward for investors. Ordinary brokerage commissions apply.
Flexibility, Transparency
PowerShares' ETFs offer flexibility as shares can be bought and sold throughout the day through exchange trading. Fund holdings are disclosed every day. Options based on the funds are available, possibly increasing financial management opportunities for advisors and their clients.
Near Instant Liquidity, Trades at or Close to NAV
PowerShares may be bought and sold on the exchange at any time during market hours. Although shares are not individually redeemable directly from the fund itself, authorized participants may acquire shares and tender shares for redemption, through creation unit aggregations. ETFs area not closed-end funds and trade at or near net asset values.
This page contains advertising materials and should not be viewed as part of the Annual Report.
107
This page intentionally left blank
PROXY VOTING POLICIES AND PROCEDURES
A description of the Funds' proxy voting policies and procedures that the Funds use to determine how to vote proxies relating to portfolio securities is available, without charge and upon request, by calling (800) 337-4246. This information is also available on the Securities and Exchange Commission's ("Commission") website at www.sec.gov.
Information regarding how the Funds voted proxies for portfolio securities, if applicable, during the most recent 12-month period ended June 30, is also available, without charge and upon request, by (i) calling (800) 337-4246; or (ii) accessing the Funds' Form N-PX on the Commission's website at www.sec.gov.
QUARTERLY PORTFOLIOS
The Funds file their complete schedules of portfolio holdings with the Commission for the first and third quarters of each fiscal year on Form N-Q. The Funds' Forms N-Q are available on the Commission's website at www.sec.gov. The Funds' Forms N-Q may also be reviewed and copied at the Commission's Public Reference Room in Washington, DC; information on the operation of the Public Reference Room may be obtained by calling (800) SEC-0330.
There are risks involved in investing in ETFs, including possible loss of money. Investing in securities of small and medium sized companies involves greater risk than is customarily associated with investing in more established companies, and investments in concentrated industry sectors involve greater risks than investments that are more diversified. PowerShares ETFs are not actively managed and are subject to risks similar to stocks, including those related to short selling and margin maintenance. PowerShares ETFs are not FDIC insured, may lose value and have no bank guarantee. PowerShares is a registered trademark of PowerShares Capital Management LLC. Past performance is not a guarantee of future results.
A I M Distributors, Inc. is the distributor of the PowerShares Exchange-Traded Fund Trust.
An investor should consider each Fund's investment objective, risks, charges and expenses carefully before investing. For more complete information about PowerShares ETFs call A I M Distributors, Inc. at (800) 337-4246 or visit our website powershares.com for a prospectus. Please read the prospectus carefully before investing.

301 W. Roosevelt Road
Wheaton, IL 60187
800.983.0903
www.powershares.com
P-PS-AR-5
2007 Annual Report to Shareholders
30 April 2007

PowerShares Dividend AchieversTM Portfolio
PowerShares High Yield Equity Dividend
AchieversTM Portfolio
PowerShares High Growth Rate Dividend
AchieversTM Portfolio
PowerShares International Dividend
AchieversTM Portfolio
PowerShares Buyback AchieversTM Portfolio
PowerShares Financial Preferred Portfolio

Table of Contents
| Shareholder Letter | 2 | ||||||
| The Market Environment | 3 | ||||||
| Manager's Analysis | 4 | ||||||
| Funds' Distribution History | 16 | ||||||
| Frequency Distribution of Discounts & Premiums | 18 | ||||||
| Fees and Expenses | 20 | ||||||
| Dividend Income Portfolios | |||||||
| Schedules of Investments | |||||||
| PowerShares Dividend AchieversTM Portfolio | 22 | ||||||
| PowerShares High Yield Equity Dividend AchieversTM Portfolio | 26 | ||||||
| PowerShares High Growth Rate Dividend AchieversTM Portfolio | 27 | ||||||
| PowerShares International Dividend AchieversTM Portfolio | 29 | ||||||
| PowerShares Buyback AchieversTM Portfolio | 31 | ||||||
| PowerShares Financial Preferred Portfolio | 34 | ||||||
| Statements of Assets and Liabilities | 36 | ||||||
| Statements of Operations | 38 | ||||||
| Statements of Changes in Net Assets | 40 | ||||||
| Financial Highlights | 42 | ||||||
| Notes to Financial Statements | 45 | ||||||
| Report of Independent Registered Public Accounting Firm | 53 | ||||||
| Supplemental Information (Unaudited) | 54 | ||||||
| Information about Advisory Agreement (Unaudited) | 59 | ||||||

To My Fellow Investors,
It gives me great pleasure to report on the state of your investment(s) in PowerShares Exchange-Traded Funds and to thank you for your continued confidence in PowerShares Capital Management LLC.
Let me share with you the exciting events that have taken place at PowerShares as I look back over the past 12 months and at what the future may hold.
PowerShares has experienced significant growth over the past 12 months. We now have 70 exchange-traded funds ("ETFs") in the market, an increase of 33 funds from the 37 funds at the beginning of the fiscal year. PowerShares now offers more U.S. based equity ETFs than any other ETF sponsor. Assets under management increased almost 75%, from $6 billion to over $10 billion at April 30, 2007. This phenomenal growth demonstrates the continued strong demand for our original listings as well as the excellent reception of our new funds.
Of the new funds offered, 10 were FTSE RAFI funds, which were the first PowerShares Exchange-Traded Funds to be listed on the NASDAQ stock exchange, making PowerShares the only ETF sponsor to list ETFs on all three major U.S. exchanges: the American Stock Exchange, the NASDAQ, and the New York Stock Exchange.
PowerShares continues to be recognized as an innovator in the ETF marketplace. In 2007, our FTSE RAFI US 1000 Fund was awarded the most innovative new ETF at the Third Annual Global ETF Awards program.
Drawing on our increased resources as a member of the INVESCO family, we plan to introduce several PowerShares ETFs for international and global investing. These new funds will help to fulfill our goal of providing Investors with the opportunity to invest in intelligent ETFs in marketplaces around the globe.
On behalf of PowerShares Capital Management LLC and the Board of Trustees for the PowerShares Exchanged-Traded Fund Trust, I want to thank you for your participation in the PowerShares family of exchange-traded funds. We look forward to serving you in the future.
Highest Regards,

H. Bruce Bond
President and Chairman of the Board of Trustees
PowerShares Exchange-Traded Fund Trust
2
The Market Environment
Although spikes of volatility marked the beginning and end of the reporting period, the U.S. equity marketplace provided strong results, with the S&P 500® Index posting double digit returns of 15.24%. At the beginning of the reporting period, enthusiasm over economic expansion gave way to uncertainty over interest rates and concern that corporate profits would be difficult to sustain. But by the end of summer 2006, energy prices had cooled and investors surmised the Fed's actions had contained inflation without significant damage to ongoing corporate earnings.
Stocks resumed their upward path until late February of 2007, when Chinese regulators threatened to clamp down on local trading practices, causing global markets to retreat sharply. Global concerns, coupled with a slowing housing market domestically and the Fed's insistence that inflation posed a greater risk than a recession, amplified volatility. However, a strong job market, sustained earnings and indications that inflation would remain contained were enough to resume the rally by the end of the reporting period.
The telecom and utilities sectors posted the best results, while technology and industrial sectors lagged. Bond prices recovered moderately during the reporting period as the Fed ended its two year hike on rates in June of 2006 and a retracting housing market eased inflation concerns. With a few bumps along the way, commodity prices continued their upward march.
3
Manager's Analysis
PowerShares Dividend AchieversTM Portfolio (ticker: PFM)
The PowerShares Dividend AchieversTM Portfolio is based on the Broad Dividend AchieversTM Index and seeks investment results that correspond generally to the price and yield (before the Fund's fees and expenses) of that equity index.
The Broad Dividend AchieversTM Index is designed to track the performance of companies that meet the requirements to be classified as "Dividend AchieversTM." To become eligible for inclusion in the Broad Dividend AchieversTM Index, a company must be incorporated in the United States or territories, trade on the New York Stock Exchange ("NYSE"), American Stock Exchange ("AMEX") or NASDAQ, and must have raised its annual regular cash dividend payments for at least each of the last ten consecutive fiscal years.
Over the past year the portfolio had a solid return of 14.26% compared with the broad S&P 500® Index which returned 15.24%. The Fund distributions during that same time period totaled $0.31 per share. Much of the Fund's performance came from large cap companies. The consumer staples, healthcare, financials and energy sectors were the leading contributors to performance of the Fund over the year. All sectors showed positive contribution to return with materials and utilities lagging the rest.
Sector Breakdown (% of the Fund's
Net Assets)
| Financials | 30.2 | ||||||
| Consumer Staples | 18.4 | ||||||
| Industrials | 12.1 | ||||||
| Health Care | 11.9 | ||||||
| Energy | 8.3 | ||||||
| Consumer Discretionary | 7.0 | ||||||
| Telecommunication Services | 4.3 | ||||||
| Information Technology | 3.6 | ||||||
| Materials | 2.4 | ||||||
| Utilities | 1.8 | ||||||
| Money Market Fund | 0.0 | ||||||
| Other | 0.0 | ||||||
Style Allocation (%)
| Large-Cap Value | 68.1 | ||||||
| Large-Cap Growth | 15.2 | ||||||
| Mid-Cap Value | 10.1 | ||||||
| Mid-Cap Growth | 4.1 | ||||||
| Small-Cap Value | 2.2 | ||||||
| Small-Cap Growth | 0.3 | ||||||
Top Ten Fund Holdings (% of the Fund's
Net Assets)
| Security | |||||||
| General Electric Co. | 5.2 | ||||||
| Exxon Mobil Corp. | 5.0 | ||||||
| Citigroup, Inc. | 4.6 | ||||||
| AT&T, Inc. | 4.2 | ||||||
| Bank of America Corp. | 3.9 | ||||||
| Procter & Gamble (The) Co. | 3.5 | ||||||
| Wal-Mart Stores, Inc. | 3.4 | ||||||
| Pfizer, Inc. | 3.3 | ||||||
| Johnson & Johnson | 3.2 | ||||||
| American International Group, Inc. | 3.2 | ||||||
| Total | 39.5 | ||||||
4
Manager's Analysis (Continued)
PowerShares Dividend AchieversTM Portfolio (ticker: PFM)
Growth of a $10,000 Investment Since Inception
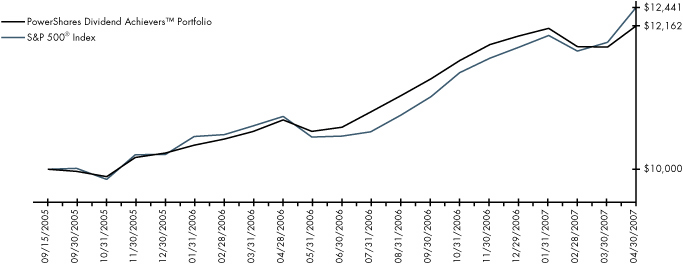
Fund Performance History (%) As of 30 April 2007
Index
| Avg. Ann.† | Fund Inception | ||||||||||||||
| 1 Year | Avg. Ann.† | Cumulative | |||||||||||||
| Broad Dividend AchieversTM Index | 14.88 | 13.47 | 22.75 | ||||||||||||
| S&P 500® Index | 15.24 | 14.42 | 24.41 | ||||||||||||
| Dow Jones Industrial Average Index | 17.60 | 16.70 | 28.47 | ||||||||||||
Fund
| NAV Return | 14.26 | 12.83 | 21.62 | ||||||||||||
| Share Price Return | 14.28 | 12.91 | 21.77 | ||||||||||||
Fund Inception: 15 September 2005
Performance data quoted represents past performance. Past performance is not a guarantee of future results; current performance may be higher or lower than performance quoted. Investment returns and principal value will fluctuate and shares, when redeemed, may be worth more or less than their original cost. The Share Price performance reflects fee waivers, absent which, performance would have been lower. According to the Fund's most recent Prospectus, the Fund's total gross annual operating expenses was indicated as 1.02%. In the Financial Highlights section of this Annual Report, the Fund's net (subsidized) annualized total operating expense ratio was determined to be 0.60% while the Fund's gross annualized total operating expense ratio was 0.92%. The Adviser has contractually agreed to waive fees and/or pay certain Fund expenses which resulted in a lower fee actually paid by investors. This waiver extends through April 30, 200 8. Absent reimbursements or waivers, performance would have been lower. NAV and Share Price returns assume that dividends and capital gain distributions have been reinvested in the Fund at NAV and Share Price, respectively. The returns shown in the table above do not reflect the deduction of taxes that a shareholder would pay on Fund distributions or the redemption or sale of Fund Shares. See powershares.com to find the most recent month-end performance numbers.
The Index performance results are hypothetical and index returns do not represent Fund returns. An investor cannot invest directly in an index. The Index does not charge management fees or brokerage expenses, and no such fees or expenses were deducted from the hypothetical performance shown nor does the index lend securities, and no revenues from securities lending were added to the performance shown. In addition, the results actual investors might have achieved would have differed from those shown because of differences in the timing, amounts of their investments, and fees and expenses associated with an investment in the Fund.
The S&P 500® Index and Dow Jones Industrial Average Index are unmanaged indices based on the average performance of approximately 500 and 30 common stocks, respectively.
† Average annualized.
5
Manager's Analysis
PowerShares High Yield Equity Dividend AchieversTM Portfolio (ticker: PEY)
The PowerShares High Yield Equity Dividend AchieversTM Portfolio is based on the Mergent Dividend AchieversTM 50 Index. The Mergent Dividend AchieversTM 50 Index seeks to deliver high current income and capital appreciation. It is comprised of the fifty highest yielding companies with at least ten years of consecutive dividend increases. The Index's high dividend yield approach provides exposure to deep value companies while the long-term dividend growth requirement attempts to minimize exposure to distressed value companies. The yield weighted portfolio is rebalanced quarterly and reconstituted annually.
During the reporting period the Fund returned 9.28% underperforming the broad S&P 500® Index which returned 15.24%. The Fund distributions during that same time period ending April 30, 2007 totaled $0.63 per share.
The utilities sector contributed the greatest to the Fund's performance followed by consumer staples. Utilities were lead by gas and electric utility stocks which continued to outpace the overall market. Peoples Energy and FPL Group lead the way in the utilities sectors while Universal Corp. lead the way in consumer staples. Much of the Fund's underperformance to the broader market came from an over-allocation to the financials sector. Within the financials sector commercial banks underperformed the market due in part to the uncertainty of interest rates and the sub-prime crisis which cast a shadow over those that had large exposure to these types of loans.
Sector Breakdown (% of the Fund's
Net Assets)
| Financials | 64.8 | ||||||
| Utilities | 21.9 | ||||||
| Consumer Discretionary | 3.3 | ||||||
| Consumer Staples | 3.3 | ||||||
| Health Care | 2.2 | ||||||
| Telecommunication Services | 1.8 | ||||||
| Materials | 1.5 | ||||||
| Industrials | 1.2 | ||||||
| Other | (0.0 | ) | |||||
Style Allocation (%)
| Small-Cap Value | 49.0 | ||||||
| Mid-Cap Value | 28.9 | ||||||
| Large-Cap Value | 22.1 | ||||||
Top Ten Fund Holdings (% of the Fund's
Net Assets)
| Security | |||||||
| Corus Bankshares, Inc. | 2.8 | ||||||
| First Commonwealth Financial Corp. | 2.8 | ||||||
| FirstMerit Corp. | 2.7 | ||||||
| F.N.B. Corp. | 2.7 | ||||||
| Washington Mutual, Inc. | 2.6 | ||||||
| Progress Energy, Inc. | 2.3 | ||||||
| Old National Bancorp | 2.3 | ||||||
| U.S. Bancorp | 2.2 | ||||||
| Pfizer, Inc. | 2.2 | ||||||
| Consolidated Edison, Inc. | 2.2 | ||||||
| Total | 24.8 | ||||||
6
Manager's Analysis (Continued)
PowerShares High Yield Equity Dividend AchieversTM Portfolio (ticker: PEY)
Growth of a $10,000 Investment Since Inception
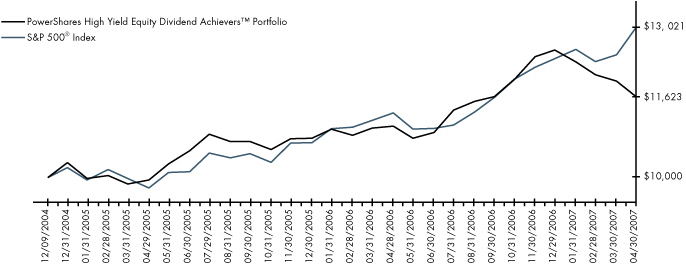
Fund Performance History (%) As of 30 April 2007
Index
| Avg. Ann.† | Fund Inception | ||||||||||||||
| 1 Year | Avg. Ann.† | Cumulative | |||||||||||||
| Mergent Dividend AchieversTM 50 Index | 8.78 | 6.00 | 14.93 | ||||||||||||
| S&P 500® Index | 15.24 | 11.68 | 30.21 | ||||||||||||
| S&P Citigroup Large Cap Value Index | 15.63 | 14.64 | 38.61 | ||||||||||||
Fund
| NAV Return | 9.28 | 6.50 | 16.23 | ||||||||||||
| Share Price Return | 8.47 | 6.15 | 15.33 | ||||||||||||
Fund Inception: 9 December 2004
Performance data quoted represents past performance. Past performance is not a guarantee of future results; current performance may be higher or lower than performance quoted. Investment returns and principal value will fluctuate and shares, when redeemed, may be worth more or less than their original cost. The Share Price performance reflects fee waivers, absent which, performance would have been lower. According to the Fund's most recent Prospectus, the Fund's total gross annual operating expenses was indicated as 0.65%. In the Financial Highlights section of this Annual Report, the Fund's annualized total operating expense ratio (prior to net reimbursements to the Adviser) was determined to be 0.60% while the Fund's annualized total operating expense ratio (after net reimbursements to the Adviser) was 0.60%. The Adviser has contractually agreed to waive fees and/or pay certain Fund expenses which resulted in a lower fee actua lly paid by investors. This waiver extends through April 30, 2008. Absent reimbursements or waivers, performance would have been lower. NAV and Share Price returns assume that dividends and capital gain distributions have been reinvested in the Fund at NAV and Share Price, respectively. The returns shown in the table above do not reflect the deduction of taxes that a shareholder would pay on Fund distributions or the redemption or sale of Fund Shares. See powershares.com to find the most recent month-end performance numbers.
The Index performance results are hypothetical and index returns do not represent Fund returns. An investor cannot invest directly in an index. The Index does not charge management fees or brokerage expenses, and no such fees or expenses were deducted from the hypothetical performance shown nor does the index lend securities, and no revenues from securities lending were added to the performance shown. In addition, the results actual investors might have achieved would have differed from those shown because of differences in the timing, amounts of their investments, and fees and expenses associated with an investment in the Fund.
The S&P 500® Index and the S&P Citigroup Large Cap Value Index are unmanaged indices based on the average performance of approximately 500 and 350 common stocks, respectively.
† Average annualized.
7
Manager's Analysis
PowerShares High Growth Rate Dividend AchieversTM Portfolio (ticker: PHJ)
The PowerShares High Growth Rate Dividend AchieversTM Portfolio is based on the High Growth Rate Dividend AchieversTM Index and seeks investment results that correspond generally to the price and yield (before the Fund's fees and expenses) of that equity index.
The High Growth Rate Dividend AchieversTM Index is designed to track the performance of the 100 companies with the highest annual dividend growth rate over the last 10 years that meet the requirements to be classified as "High Growth Rate Dividend AchieversTM." To become eligible for inclusion in the High Growth Rate Dividend AchieversTM Index, a company must be incorporated in the United States or its territories, trade on the NYSE, NASDAQ or AMEX, and its aggregate annual regular dividend payments must have increased consistently over the course of the last 10 or more fiscal years.
During the reporting period the Fund returned 7.11% underperforming the Dow Jones Industrials Index which returned 17.60%. The Fund distributions during that same time period ending April 30, 2007 totaled $0.30 per share.
The financials sector, which makes up nearly one half of the portfolio, contributed the most to performance followed by health care and consumer discretionary. Within financials, diversified financial services and insurance were the leaders with Citigroup, Inc. and AIG being the top performers. Industrials were the lone sector which showed a small negative contribution to return for the portfolio driven mainly by aerospace & defense along with commercial services & supplies companies.
Sector Breakdown (% of the Fund's
Net Assets)
| Financials | 45.3 | ||||||
| Health Care | 17.4 | ||||||
| Consumer Discretionary | 14.2 | ||||||
| Industrials | 9.2 | ||||||
| Consumer Staples | 5.4 | ||||||
| Information Technology | 3.7 | ||||||
| Materials | 3.4 | ||||||
| Energy | 1.2 | ||||||
| Money Market | 0.0 | ||||||
| Other | 0.2 | ||||||
Style Allocation (%)
| Large-Cap Value | 60.5 | ||||||
| Large-Cap Growth | 22.1 | ||||||
| Mid-Cap Value | 7.5 | ||||||
| Mid-Cap Growth | 7.3 | ||||||
| Small-Cap Value | 2.2 | ||||||
| Small-Cap Growth | 0.4 | ||||||
Top Ten Fund Holdings (% of the Fund's
Net Assets)
| Security | |||||||
| Bank of America Corp. | 4.1 | ||||||
| American International Group, Inc. | 4.0 | ||||||
| Johnson & Johnson | 4.0 | ||||||
| Wells Fargo & Co. | 4.0 | ||||||
| U.S. Bancorp | 4.0 | ||||||
| United Technologies Corp. | 4.0 | ||||||
| Pfizer, Inc. | 4.0 | ||||||
| Wal-Mart Stores, Inc. | 4.0 | ||||||
| McDonald's Corp. | 4.0 | ||||||
| Medtronic, Inc. | 4.0 | ||||||
| Total | 40.1 | ||||||
8
Manager's Analysis (Continued)
PowerShares High Growth Rate Dividend AchieversTM Portfolio (ticker: PHJ)
Growth of a $10,000 Investment Since Inception
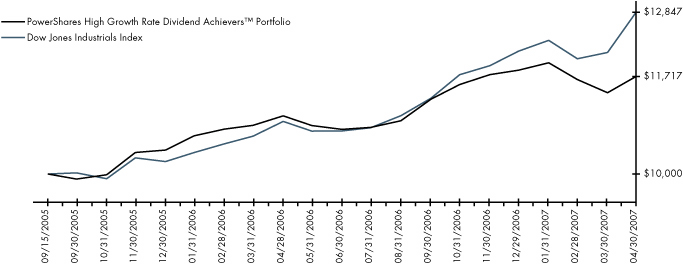
Fund Performance History (%) As of 30 April 2007
Index
| Avg. Ann.† | Fund Inception | ||||||||||||||
| 1 Year | Avg. Ann.† | Cumulative | |||||||||||||
| High Growth Rate Dividend AchieversTM Index | 8.19 | 11.13 | 18.67 | ||||||||||||
| Dow Jones Industrials Index | 17.60 | 16.70 | 28.47 | ||||||||||||
| S&P 500® Index | 15.24 | 14.42 | 24.41 | ||||||||||||
Fund
| NAV Return | 7.11 | 10.26 | 17.17 | ||||||||||||
| Share Price Return | 7.21 | 10.30 | 17.24 | ||||||||||||
Fund Inception: 15 September 2005
Performance data quoted represents past performance. Past performance is not a guarantee of future results; current performance may be higher or lower than performance quoted. Investment returns and principal value will fluctuate and shares, when redeemed, may be worth more or less than their original cost. The Share Price performance reflects fee waivers, absent which, performance would have been lower. According to the Fund's most recent Prospectus, the Fund's total gross annual operating expenses was indicated as 1.00%. In the Financial Highlights section of this Annual Report, the Fund's net (subsidized) annualized total operating expense ratio was determined to be 0.61% while the Fund's gross annualized total operating expense ratio was 1.04%. The Adviser has contractually agreed to waive fees and/or pay certain Fund expenses which resulted in a lower fee actually paid by investors. This waiver extends through April 30, 200 8. Absent reimbursements or waivers, performance would have been lower. NAV and Share Price returns assume that dividends and capital gain distributions have been reinvested in the Fund at NAV and Share Price, respectively. The returns shown in the table above do not reflect the deduction of taxes that a shareholder would pay on Fund distributions or the redemption or sale of Fund Shares. See powershares.com to find the most recent month-end performance numbers.
The index performance results are hypothetical and index returns do not represent Fund returns. An investor cannot invest directly in an index. The index does not charge management fees or brokerage expenses, and no such fees or expenses were deducted from the hypothetical performance shown nor does the index lend securities, and no revenues from securities lending were added to the performance shown. In addition, the results actual investors might have achieved would have differed from those shown because of differences in the timing, amounts of their investments, and fees and expenses associated with an investment in the Fund.
The Dow Jones Industrials Index and the S&P 500® Index are unmanaged indices based on the average performance of approximately 30 and 500 common stocks, respectively.
† Average annualized.
9
Manager's Analysis
PowerShares International Dividend AchieversTM Portfolio (ticker: PID)
The PowerShares International Dividend AchieversTM Portfolio is based on the International Dividend AchieversTM Index and seeks investment results that correspond generally to the price and yield (before the Fund's fees and expenses) of that equity index.
The International Dividend AchieversTM Index is designed to track the performance of dividend paying American Depositary Receipts and non-U.S. common or ordinary stocks trading on the NYSE, NASDAQ or AMEX. To become eligible for inclusion in the International Dividend AchieversTM Index, a company's aggregate annual regular dividend payments must have increased consistently over the course of the last five calendar or fiscal years.
During the reporting period the Fund returned 22.56% outperforming the broad S&P 500® Index which returned 15.24%. The Fund distributions during that same time period ending April 30, 2007 totaled $0.53 per share.
The financials, utilities and consumer staples sectors were the strongest contributors to the Fund's performance. Commercial banks and insurance were the leaders within the financials sector while electric utilities and multi-utilities were leaders in the utilities sector. The information technology sector was the lone laggard on performance for the year. Electronic equipment & instruments were the biggest drag on performance within information technology, specifically Nam Tai Electronics, Inc. From a geographical perspective, the United Kingdom, Netherlands, Spain and Canada contributed the most to Fund performance while Chile, South Africa and the British Virgin Islands lagged.
Sector Breakdown (% of the Fund's
Net Assets)
| Financials | 38.1 | ||||||
| Energy | 11.3 | ||||||
| Consumer Staples | 10.4 | ||||||
| Utilities | 8.4 | ||||||
| Consumer Discretionary | 8.0 | ||||||
| Information Technology | 7.8 | ||||||
| Industrials | 6.0 | ||||||
| Materials | 4.9 | ||||||
| Telecommunication Services | 3.4 | ||||||
| Health Care | 1.9 | ||||||
| Other | (0.2 | ) | |||||
Style Allocation (%)
| Large-Cap Value | 51.0 | ||||||
| Large-Cap Growth | 22.1 | ||||||
| Mid-Cap Value | 17.8 | ||||||
| Small-Cap Value | 5.9 | ||||||
| Mid-Cap Growth | 2.6 | ||||||
| Small-Cap Growth | 0.6 | ||||||
Top Ten Fund Holdings (% of the Fund's
Net Assets)
| Security | |||||||
| Nam Tai Electronics, Inc. | 5.4 | ||||||
| Endesa SA ADR | 2.9 | ||||||
| Tomkins PLC ADR | 2.7 | ||||||
| HSBC Holdings PLC ADR | 2.5 | ||||||
| Barclays PLC ADR | 2.4 | ||||||
| Westpac Banking Corp. ADR | 2.3 | ||||||
| National Australia Bank Ltd. ADR | 2.2 | ||||||
| Australia and New Zealand Banking Group Ltd. ADR | 2.2 | ||||||
| Bank of Montreal | 2.0 | ||||||
| BP PLC ADR | 2.0 | ||||||
| Total | 26.6 | ||||||
10
Manager's Analysis (Continued)
PowerShares International Dividend AchieversTM Portfolio (ticker: PID)
Growth of a $10,000 Investment Since Inception

Fund Performance History (%) As of 30 April 2007
Index
| Avg. Ann.† | Fund Inception | ||||||||||||||
| 1 Year | Avg. Ann.† | Cumulative | |||||||||||||
| International Dividend AchieversTM Index | 22.06 | 22.88 | 39.68 | ||||||||||||
| MSCI EAFE Index | 20.32 | 26.33 | 46.10 | ||||||||||||
| S&P 500® Index | 15.24 | 14.42 | 24.41 | ||||||||||||
Fund
| NAV Return | 22.56 | 23.24 | 40.34 | ||||||||||||
| Share Price Return | 22.59 | 23.25 | 40.37 | ||||||||||||
Fund Inception: 15 September 2005
Performance data quoted represents past performance. Past performance is not a guarantee of future results; current performance may be higher or lower than performance quoted. Investment returns and principal value will fluctuate and shares, when redeemed, may be worth more or less than their original cost. The Share Price performance reflects fee waivers, absent which, performance would have been lower. According to the Fund's most recent Prospectus, the Fund's total gross annual operating expenses was indicated as 0.69%. In the Financial Highlights section of this Annual Report, the Fund's net (subsidized) annualized total operating expense ratio was determined to be 0.60% while the Fund's gross annualized total operating expense ratio was 0.62%. The Adviser has contractually agreed to waive fees and/or pay certain Fund expenses which resulted in a lower fee actually paid by investors. This waiver extends through April 30, 200 8. Absent reimbursements or waivers, performance would have been lower. NAV and Share Price returns assume that dividends and capital gain distributions have been reinvested in the Fund at NAV and Share Price, respectively. The returns shown in the table above do not reflect the deduction of taxes that a shareholder would pay on Fund distributions or the redemption or sale of Fund Shares. See powershares.com to find the most recent month-end performance numbers.
The Index performance results are hypothetical and index returns do not represent Fund returns. An investor cannot invest directly in an index. The Index does not charge management fees or brokerage expenses, and no such fees or expenses were deducted from the hypothetical performance shown nor does the index lend securities, and no revenues from securities lending were added to the performance shown. In addition, the results actual investors might have achieved would have differed from those shown because of differences in the timing, amounts of their investments, and fees and expenses associated with an investment in the Fund.
The MSCI EAFE Index and the S&P 500® Index are unmanaged indices based on the average performance of approximately 1,000 widely held stocks traded on exchanges outside the U.S. and 500 common stocks on U.S. exchanges, respectively.
† Average annualized.
11
Manager's Analysis
PowerShares Buyback AchieversTM Portfolio (ticker: PKW)
The PowerShares Buyback AchieversTM Portfolio is based on the Share BuyBack AchieversTM Index and seeks investment results that correspond generally to the price and yield (before the Fund's fees and expenses) of that equity index. To become eligible for inclusion in the Index, a company must be incorporated in the U.S., trade on a U.S. exchange and must have repurchased at least 5% or more of its outstanding shares for the trailing 12 months.
Since its December 20, 2006 inception date, the portfolio returned 4.13% compared with the S&P 500® Index which returned 4.78%. The information technology sector, led by semiconductors & semiconductor equipment, was the strongest contributor to the Fund's return. The energy and financials sectors were also strong contributors to return. The consumer discretionary sector was the laggard, due mostly to unfavorable stock selection within the household durables and automobile industries.
Sector Breakdown (% of the Fund's
Net Assets)
| Consumer Discretionary | 27.6 | ||||||
| Information Technology | 21.4 | ||||||
| Health Care | 15.2 | ||||||
| Financials | 13.3 | ||||||
| Energy | 8.4 | ||||||
| Industrials | 5.9 | ||||||
| Consumer Staples | 3.2 | ||||||
| Materials | 2.8 | ||||||
| Utilities | 1.2 | ||||||
| Telecommunication Services | 1.0 | ||||||
| Other | (0.0 | ) | |||||
Style Allocation (%)
| Large-Cap Growth | 33.1 | ||||||
| Large-Cap Value | 27.9 | ||||||
| Mid-Cap Value | 21.2 | ||||||
| Mid-Cap Growth | 11.0 | ||||||
| Small-Cap Value | 5.4 | ||||||
| Small-Cap Growth | 1.4 | ||||||
Top Ten Fund Holdings (% of the Fund's
Net Assets)
| Security | |||||||
| Microsoft Corp. | 5.2 | ||||||
| Exxon Mobil Corp. | 5.0 | ||||||
| Time Warner, Inc. | 5.0 | ||||||
| Amgen, Inc. | 4.8 | ||||||
| Goldman Sachs Group (The), Inc. | 4.6 | ||||||
| Texas Instruments, Inc. | 3.2 | ||||||
| Prudential Financial, Inc. | 2.9 | ||||||
| EMC Corp. | 2.0 | ||||||
| DIRECTV Group (The), Inc. | 1.9 | ||||||
| Viacom, Inc., Class B | 1.8 | ||||||
| Total | 36.4 | ||||||
12
Manager's Analysis (Continued)
PowerShares Buyback AchieversTM Portfolio (ticker: PKW)
Growth of a $10,000 Investment Since Inception
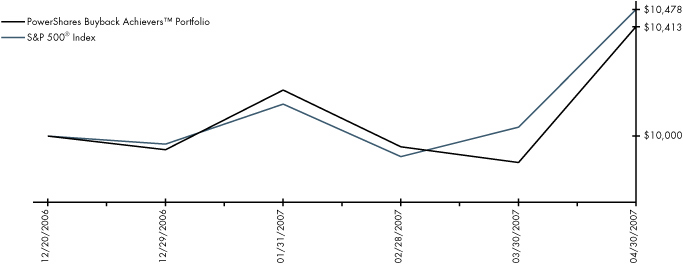
Fund Performance History (%) As of 30 April 2007
Index
| Fund Inception Cumulative | |||||||
| Share BuyBack AchieversTM Index | 4.45 | ||||||
| S&P 500® Index | 4.78 | ||||||
| Russell 1000® Growth Index | 5.15 | ||||||
Fund
| NAV Return | 4.13 | ||||||
| Share Price Return | 4.33 | ||||||
Fund Inception: 20 December 2006
Performance data quoted represents past performance. Past performance is not a guarantee of future results; current performance may be higher or lower than performance quoted. Investment returns and principal value will fluctuate and shares, when redeemed, may be worth more or less than their original cost. The Share Price performance reflects fee waivers, absent which, performance would have been lower. According to the Fund's most recent Prospectus, the Fund's total gross annual operating expenses was indicated as 0.75%. In the Financial Highlights section of this Annual Report, the Fund's net (subsidized) annualized total operating expense ratio was determined to be 0.73% while the Fund's gross annualized total operating expense ratio was 1.04%. The Adviser has contractually agreed to waive fees and/or pay certain Fund expenses which resulted in a lower fee actually paid by investors. This waiver extends through April 30, 200 8. Absent reimbursements or waivers, performance would have been lower. NAV and Share Price returns assume that dividends and capital gain distributions have been reinvested in the Fund at NAV and Share Price, respectively. The returns shown in the table above do not reflect the deduction of taxes that a shareholder would pay on Fund distributions or the redemption or sale of Fund Shares. See powershares.com to find the most recent month-end performance numbers.
The Index performance results are hypothetical and index returns do not represent Fund returns. An investor cannot invest directly in an index. The Index does not charge management fees or brokerage expenses, and no such fees or expenses were deducted from the hypothetical performance shown nor does the index lend securities, and no revenues from securities lending were added to the performance shown. In addition, the results actual investors might have achieved would have differed from those shown because of differences in the timing, amounts of their investments, and fees and expenses associated with an investment in the Fund.
The S&P 500® Index and the Russell 1000® Growth Index are unmanaged indices that are broad-measurements of change in stock market conditions based on the average performance of approximately 500 and 671 common stocks, respectively, widely held stocks.
13
Manager's Analysis
PowerShares Financial Preferred Portfolio (ticker: PGF)
The PowerShares Financial Preferred Portfolio is based on the Wachovia Hybrid & Preferred Securities Financial Index (WHPSSM Financial Index). The Index tracks the performance of U.S. listed preferred stocks issued in the U.S. market by financial institutions and currently includes approximately 30 securities selected by Wachovia pursuant to a proprietary selection methodology.
Since its December 1, 2006 inception date, the portfolio returned 1.18% compared with the S&P 500® Index which returned 6.87%. The Fund distributions during that same time period ending April 30, 2007 totaled $0.63 per share.
This Fund's policy is to invest in financial institutions with strong credit ratings and a history of paying dividends over a long period of time. Many investors view the underlying securities as income paying vehicles rather than appreciating assets.
Industry Breakdown (% of the Fund's
Net Assets)
| Insurance | 42.3 | ||||||
| Banks | 37.2 | ||||||
| Diversified Financial Services | 20.7 | ||||||
| Money Market | 0.2 | ||||||
| Other | (0.4 | ) | |||||
Style Allocation (%)
| Large-Cap Value | 83.6 | ||||||
| Mid-Cap Value | 13.9 | ||||||
| Large-Cap Growth | 2.5 | ||||||
Top Ten Fund Holdings (% of the Fund's
Net Assets)
| Security | |||||||
| HSBC Holdings PLC, 6.20%, Series A (United Kingdom) | 6.9 | ||||||
| ING Groep NV, 7.20% (Netherlands) | 5.2 | ||||||
| Metlife, Inc., 6.50%, Series B | 4.9 | ||||||
| Royal Bank of Scotland Group PLC, 6.35%, Series N (United Kingdom) | 4.8 | ||||||
| Bank of America Corp., 6.20%, Series D | 4.5 | ||||||
| Barclays Bank PLC, 6.63%, Series 2 (United Kingdom) | 4.5 | ||||||
| Lehman Brothers Holdings, 6.50% | 4.5 | ||||||
| ACE Ltd., 7.80%, Series C (Cayman Islands) | 4.5 | ||||||
| Goldman Sachs Group, Inc., 6.20%, Series B | 4.5 | ||||||
| Merrill Lynch & Co., Inc., 6.38%, Series 3 | 4.5 | ||||||
| Total | 48.8 | ||||||
14
Manager's Analysis (Continued)
PowerShares Financial Preferred Portfolio (ticker: PGF)
Growth of a $10,000 Investment Since Inception
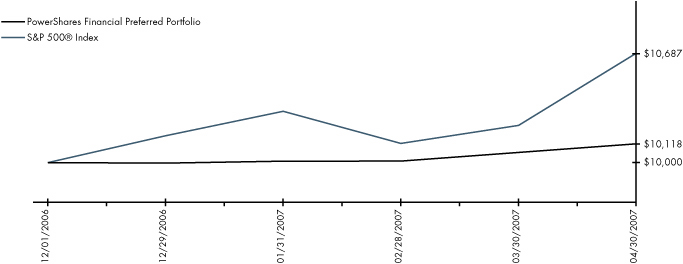
Fund Performance History (%) As of 30 April 2007
Index
| Fund Inception Cumulative | |||||||
| Wachovia Hybrid & Preferred Securities Financial Index | 1.47 | ||||||
| Dow Jones Corporate Bond Index | 1.21 | ||||||
| S&P 500® Index | 6.87 | ||||||
Fund
| NAV Return | 1.18 | ||||||
| Share Price Return | -0.09 | ||||||
Fund Inception: 01 December 2006
Performance data quoted represents past performance. Past performance is not a guarantee of future results; current performance may be higher or lower than performance quoted. Investment returns and principal value will fluctuate and shares, when redeemed, may be worth more or less than their original cost. The Share Price performance reflects fee waivers, absent which, performance would have been lower. According to the Fund's most recent Prospectus, the Fund's total gross annual operating expenses was indicated as 0.75%. In the Financial Highlights section of this Annual Report, the Fund's net (subsidized) annualized total operating expense ratio was determined to be 0.72% while the Fund's gross annualized total operating expense ratio was 0.89%. The Adviser has contractually agreed to waive fees and/or pay certain Fund expenses which resulted in a lower fee actually paid by investors. This waiver extends through April 30, 200 8. Absent reimbursements or waivers, performance would have been lower. NAV and Share Price returns assume that dividends and capital gain distributions have been reinvested in the Fund at NAV and Share Price, respectively. The returns shown in the table above do not reflect the deduction of taxes that a shareholder would pay on Fund distributions or the redemption or sale of Fund Shares. See powershares.com to find the most recent month-end performance numbers.
The Index performance results are hypothetical and index returns do not represent Fund returns. An investor cannot invest directly in an index. The Index does not charge management fees or brokerage expenses, and no such fees or expenses were deducted from the hypothetical performance shown nor does the index lend securities, and no revenues from securities lending were added to the performance shown. In addition, the results actual investors might have achieved would have differed from those shown because of differences in the timing, amounts of their investments, and fees and expenses associated with an investment in the Fund.
The Dow Jones Corporate Bond Index and S&P 500® Index are unmanaged indices used as a measurement of change in market conditions based on the average performance of approximately 96 bonds and 500 common stocks, respectively.
15
Funds' Distribution History
| Ex-Dividend | 4/13/07 | 3/16/07 | 3/15/07 | 2/15/07 | 1/12/07 | 12/15/06 | 11/15/06 | ||||||||||||||||||||||||||||
| Record | 4/17/07 | 3/20/07 | 3/20/07 | 2/20/07 | 1/16/07 | 12/19/06 | 11/17/06 | ||||||||||||||||||||||||||||
| Payable | 4/30/07 | 3/30/07 | 3/30/07 | 2/28/07 | 1/31/07 | 12/29/06 | 11/30/06 | ||||||||||||||||||||||||||||
| Fund | Ticker | ||||||||||||||||||||||||||||||||||
| PowerShares Dividend AchieversTM Portfolio | PFM | — | 0.07520 | — | — | — | 0.11050 | — | |||||||||||||||||||||||||||
| PowerShares High Yield Equity Dividend AchieversTM Portfolio | PEY | 0.05003 | — | 0.05020 | 0.05006 | 0.05012 | 0.06648 | 0.05501 | |||||||||||||||||||||||||||
| PowerShares High Growth Rate Dividend AchieversTM Portfolio | PHJ | — | 0.07020 | — | — | — | 0.13210 | — | |||||||||||||||||||||||||||
| PowerShares International Dividend AchieversTM Portfolio | PID | — | 0.11020 | — | — | — | 0.16748 | — | |||||||||||||||||||||||||||
| PowerShares Buyback AchieversTM Portfolio | PKW | — | 0.02102 | — | — | — | — | — | |||||||||||||||||||||||||||
| PowerShares Financial Preferred Portfolio | PGF | 0.11205 | — | 0.11020 | 0.11250 | 0.11260 | 0.18568 | — | |||||||||||||||||||||||||||
| Ex-Dividend | 12/30/05 | 12/16/05 | 9/16/05 | 6/17/05 | |||||||||||||||||||
| Record | 1/4/06 | 12/20/05 | 9/20/05 | 6/21/05 | |||||||||||||||||||
| Payable | 1/31/06 | 12/30/05 | 9/30/05 | 6/30/05 | |||||||||||||||||||
| Fund | Ticker | ||||||||||||||||||||||
| PowerShares Dividend AchieversTM Portfolio | PFM | — | 0.08740 | — | — | ||||||||||||||||||
| PowerShares High Yield Equity Dividend AchieversTM Portfolio | PEY | — | 0.11320 | 0.11490 | 0.12828 | ||||||||||||||||||
| PowerShares High Growth Rate Dividend AchieversTM Portfolio | PHJ | — | 0.08594 | — | — | ||||||||||||||||||
| PowerShares International Dividend AchieversTM Portfolio | PID | — | 0.07747 | — | — | ||||||||||||||||||
| PowerShares Buyback AchieversTM Portfolio | PKW | — | — | — | — | ||||||||||||||||||
| PowerShares Financial Preferred Portfolio | PGF | — | — | — | — | ||||||||||||||||||
16
| 10/13/06 | 9/15/06 | 8/15/06 | 7/14/06 | 6/16/06 | 6/15/06 | 5/15/06 | 3/17/06 | ||||||||||||||||||||||||||||
| 10/17/06 | 9/16/06 | 8/17/06 | 7/18/06 | 6/20/06 | 6/19/06 | 5/17/06 | 3/21/06 | ||||||||||||||||||||||||||||
| 10/31/06 | 9/29/06 | 8/31/06 | 7/31/06 | 6/30/06 | 6/30/06 | 5/31/06 | 3/30/06 | ||||||||||||||||||||||||||||
| Fund | |||||||||||||||||||||||||||||||||||
| PowerShares Dividend AchieversTM Portfolio | — | 0.05029 | — | — | 0.07671 | — | — | 0.07660 | |||||||||||||||||||||||||||
| PowerShares High Yield Equity Dividend AchieversTM Portfolio | 0.05529 | 0.05518 | 0.05512 | 0.05523 | — | 0.04512 | 0.03950 | 0.12300 | |||||||||||||||||||||||||||
| PowerShares High Growth Rate Dividend AchieversTM Portfolio | — | 0.03428 | — | — | 0.06068 | — | — | 0.05916 | |||||||||||||||||||||||||||
| PowerShares International Dividend AchieversTM Portfolio | — | 0.12589 | — | — | 0.12567 | — | — | 0.11910 | |||||||||||||||||||||||||||
| PowerShares Buyback AchieversTM Portfolio | — | — | — | — | — | — | — | — | |||||||||||||||||||||||||||
| PowerShares Financial Preferred Portfolio | — | — | — | — | — | — | — | — | |||||||||||||||||||||||||||
| 4/1/05 | 3/18/05 | 12/31/04 | 12/17/04 | ||||||||||||||||
| 4/5/05 | 3/22/05 | 1/4/05 | 12/21/04 | ||||||||||||||||
| 4/29/05 | 4/29/05 | 1/31/05 | 1/31/05 | ||||||||||||||||
| Fund | |||||||||||||||||||
| PowerShares Dividend AchieversTM Portfolio | — | — | — | — | |||||||||||||||
| PowerShares High Yield Equity Dividend AchieversTM Portfolio | 0.03688 | 0.09700 | 0.00859 | 0.02742 | |||||||||||||||
| PowerShares High Growth Rate Dividend AchieversTM Portfolio | — | — | — | — | |||||||||||||||
| PowerShares International Dividend AchieversTM Portfolio | — | — | — | — | |||||||||||||||
| PowerShares Buyback AchieversTM Portfolio | — | — | — | — | |||||||||||||||
| PowerShares Financial Preferred Portfolio | — | — | — | — | |||||||||||||||
17
Frequency Distribution of Discounts & Premiums
Since Inception thru April 30, 2007
| Closing Price Above NAV | |||||||||||||||||||||||||||||||||||||||
Ticker | Fund Name | Inception | Days | 0-24 Basis Points | 25-49 Basis Points | 50-99 Basis Points | 100-149 Basis Points | 150-199 Basis Points | 200+ Basis Points | ||||||||||||||||||||||||||||||
| PFM | PowerShares Dividend AchieversTM Portfolio | 9/15/05 | 407 | 274 | 20 | 0 | 0 | 0 | 0 | ||||||||||||||||||||||||||||||
| PEY | PowerShares High Yield Equity Dividend AchieversTM Portfolio | 12/9/04 | 600 | 278 | 19 | 0 | 0 | 0 | 0 | ||||||||||||||||||||||||||||||
| PHJ | PowerShares High Growth Rate Dividend AchieversTM Portfolio | 9/15/05 | 407 | 260 | 11 | 0 | 0 | 0 | 0 | ||||||||||||||||||||||||||||||
| PID | PowerShares International Dividend AchieversTM Portfolio | 9/15/05 | 407 | 296 | 21 | 2 | 0 | 0 | 0 | ||||||||||||||||||||||||||||||
| PKW | PowerShares Buyback AchieversTM Portfolio | 12/20/06 | 88 | 53 | 17 | 0 | 0 | 0 | 0 | ||||||||||||||||||||||||||||||
| PGF | PowerShares Financial Preferred Portfolio | 12/1/06 | 101 | 60 | 35 | 3 | 0 | 0 | 0 | ||||||||||||||||||||||||||||||
18
| Closing Price Below NAV | |||||||||||||||||||||||||||
Ticker | -0-24 Basis Points | -25-49 Basis Points | -50-99 Basis Points | -100-149 Basis Points | -150-199 Basis Points | -200+ Basis Points | |||||||||||||||||||||
| PFM | 112 | 1 | 0 | 0 | 0 | 0 | |||||||||||||||||||||
| PEY | 270 | 31 | 2 | 0 | 0 | 0 | |||||||||||||||||||||
| PHJ | 134 | 2 | 0 | 0 | 0 | 0 | |||||||||||||||||||||
| PID | 87 | 1 | 0 | 0 | 0 | 0 | |||||||||||||||||||||
| PKW | 17 | 1 | 0 | 0 | 0 | 0 | |||||||||||||||||||||
| PGF | 3 | 0 | 0 | 0 | 0 | 0 | |||||||||||||||||||||
19
Fees and Expenses
As a shareholder of a Fund of the PowerShares Exchange-Traded Fund Trust, you incur advisory fees and other Fund expenses. The expense examples below are intended to help you understand your ongoing costs (in dollars) of investing in the Funds and to compare these costs with the ongoing costs of investing in other mutual funds.
The example is based on an investment of $1,000 invested at the beginning of the period and held through the six-month (or shorter) period ended April 30, 2007.
Actual Expenses
The first line in the following tables provides information about actual account values and actual expenses. You may use the information in this line, together with the amount you invested, to estimate the expenses that you paid over the period. Simply divide your account value by $1,000 (for example, an $8,600 account value divided by $1,000 = 8.6), then multiply the result by the number in the first line under the heading "Expenses Paid During the Six-Month Period" to estimate the expenses you paid on your account during this period.
Hypothetical Example for Comparison Purposes
The second line in the following tables provides information about hypothetical account values and hypothetical expenses based on the Funds' actual expense ratio and an assumed annualized rate of return of 5% per year before expenses, which is not the Funds' actual return. The hypothetical account values and expenses may not be used to estimate the actual ending account balance or expenses you paid for the period. You may use this information to compare the ongoing costs of investing in the Funds and other funds. To do so, compare this 5% hypothetical example with the 5% hypothetical examples that appear in the shareholder reports of the other funds.
Please note that the expenses shown in the tables are meant to highlight your ongoing costs only, and do not reflect any transactional costs such as sales charges (loads). Therefore the second line in the table is useful in comparing ongoing costs only, and will not help you determine the relative total costs of owning different funds. In addition, if these transactional costs were included, your costs would have been higher.
| Beginning Account Value November 1, 2006 | Ending Account Value April 30, 2007 | Annualized Expense Ratio Based on the Six-Month Period | Expenses Paid During the Six-Month Period (1) | ||||||||||||||||
| PowerShares Dividend AchieversTM Portfolio Actual | $ | 1,000.00 | $ | 1,060.70 | 0.59 | % | $ | 3.01 | |||||||||||
| Hypothetical (5% return before expenses) | $ | 1,000.00 | $ | 1,021.87 | 0.59 | % | $ | 2.96 | |||||||||||
| PowerShares High Yield Equity Dividend AchieversTM Portfolio Actual | $ | 1,000.00 | $ | 1,015.66 | 0.60 | % | $ | 3.00 | |||||||||||
| Hypothetical (5% return before expenses) | $ | 1,000.00 | $ | 1,021.82 | 0.60 | % | $ | 3.01 | |||||||||||
| PowerShares High Growth Rate Dividend | |||||||||||||||||||
| AchieversTM Portfolio | |||||||||||||||||||
| Actual | $ | 1,000.00 | $ | 1,024.99 | 0.60 | % | $ | 3.01 | |||||||||||
| Hypothetical (5% return before expenses) | $ | 1,000.00 | $ | 1,021.82 | 0.60 | % | $ | 3.01 | |||||||||||
| PowerShares International Dividend AchieversTM Portfolio Actual | $ | 1,000.00 | $ | 1,145.98 | 0.60 | % | $ | 3.19 | |||||||||||
| Hypothetical (5% return before expenses) | $ | 1,000.00 | $ | 1,021.82 | 0.60 | % | $ | 3.01 | |||||||||||
20
Fees and Expenses (Continued)
| Beginning Account Value December 20, 2006 (Commencement of Investment Operations) | Ending Account Value April 30, 2007 | Annualized Expense Ratio Based on Number of Days in the Period | Expenses Paid During Period (2) December 20, 2006 (Commencement of Investment Operations) to April 30, 2007 | ||||||||||||||||
| PowerShares Buyback AchieversTM Portfolio Actual | $ | 1,000.00 | $ | 1,041.33 | 0.73 | % | $ | 2.67 | |||||||||||
| Hypothetical (5% return before expenses) | $ | 1,000.00 | $ | 1,021.17 | 0.73 | % | $ | 3.66 | |||||||||||
| Beginning Account Value December 1, 2006 (Commencement of Investment Operations) | Ending Account Value April 30, 2007 | Annualized Expense Ratio Based on Number of Days in the Period | Expenses Paid During Period (3) December 1, 2006 (Commencement of Investment Operations) to April 30, 2007 | ||||||||||||||||
| PowerShares Financial Preferred Portfolio Actual | $ | 1,000.00 | $ | 1,011.80 | 0.72 | % | $ | 2.98 | |||||||||||
| Hypothetical (5% return before expenses) | $ | 1,000.00 | $ | 1,021.22 | 0.72 | % | $ | 3.61 | |||||||||||
(1) Expenses are calculated using the annualized expense ratio, which represents the ongoing expenses as a percentage of net assets for the six months ended April 30, 2007. Expenses are calculated by multiplying the Fund's annualized expense ratio by the average account value for the period; then multiplying the result by 181 and then dividing the result by 365. Expense ratios for the most recent half-year may differ from expense ratios based on the one year data in the financial highlights.
(2) Expenses are calculated using the annualized expense ratio, which represents the ongoing expenses as a percentage of net assets for the period December 20, 2006 (commencement of investment operations) to April 30, 2007. Expenses are calculated by multiplying the Fund's annualized expense ratio by the average account value for the period; then multiplying the result by 132 and then dividing the result by 365.
(3) Expenses are calculated using the annualized expense ratio, which represents the ongoing expenses as a percentage of net assets for the period December 1, 2006 (commencement of investment operations) to April 30, 2007. Expenses are calculated by multiplying the Fund's annualized expense ratio by the average account value for the period; then multiplying the result by 151 and then dividing the result by 365.
21
Schedule of Investments
PowerShares Dividend AchieversTM Portfolio
April 30, 2007
| Number of Shares | Value | ||||||||||
| Common Stocks—100.0% | |||||||||||
| Consumer Discretionary—7.0% | |||||||||||
| 903 | Applebee's International, Inc. | $ | 24,544 | ||||||||
| 247 | Bandag, Inc. | 12,459 | |||||||||
| 658 | Cedar Fair, L.P. | 19,154 | |||||||||
| 152 | Courier Corp. | 6,050 | |||||||||
| 1,832 | Family Dollar Stores, Inc. | 58,331 | |||||||||
| 2,853 | Gannett Co., Inc. | 162,792 | |||||||||
| 2,071 | Genuine Parts Co. | 102,328 | |||||||||
| 3,128 | Harley-Davidson, Inc. | 198,065 | |||||||||
| 906 | Harte-Hanks, Inc. | 23,647 | |||||||||
| 276 | Haverty Furniture Cos., Inc. | 3,522 | |||||||||
| 33,121 | Home Depot (The), Inc. | 1,254,291 | |||||||||
| 697 | John Wiley & Sons, Inc., Class A | 26,103 | |||||||||
| 2,386 | Johnson Controls, Inc. | 244,159 | |||||||||
| 624 | La-Z-Boy, Inc. | 7,295 | |||||||||
| 2,155 | Leggett & Platt, Inc. | 50,686 | |||||||||
| 6,586 | Lowe's Cos., Inc. | 201,268 | |||||||||
| 398 | Matthews International Corp., Class A | 16,780 | |||||||||
| 14,506 | McDonald's Corp. | 700,349 | |||||||||
| 4,267 | McGraw-Hill (The) Cos., Inc. | 279,616 | |||||||||
| 293 | Media General, Inc., Class A | 10,765 | |||||||||
| 584 | Meredith Corp. | 33,825 | |||||||||
| 1,748 | New York Times (The) Co., Class A | 40,903 | |||||||||
| 3,130 | Nordstrom, Inc. | 171,900 | |||||||||
| 431 | Polaris Industries, Inc. | 21,778 | |||||||||
| 1,688 | Ross Stores, Inc. | 55,957 | |||||||||
| 3,543 | ServiceMaster (The) Co. | 54,527 | |||||||||
| 1,602 | Sherwin-Williams (The) Co. | 102,160 | |||||||||
| 1,006 | Stanley Works (The) | 58,630 | |||||||||
| 323 | Superior Industries International, Inc. | 7,381 | |||||||||
| 661 | Talbots (The), Inc. | 15,534 | |||||||||
| 10,428 | Target Corp. | 619,109 | |||||||||
| 5,510 | TJX (The) Cos., Inc. | 153,674 | |||||||||
| 1,367 | VF Corp. | 120,036 | |||||||||
| 675 | Wolverine World Wide, Inc. | 19,292 | |||||||||
| 4,876,910 | |||||||||||
| Consumer Staples—18.4% | |||||||||||
| 25,504 | Altria Group, Inc. | 1,757,736 | |||||||||
| 9,265 | Anheuser-Busch Cos., Inc. | 455,745 | |||||||||
| 7,928 | Archer-Daniels-Midland Co. | 306,814 | |||||||||
| 5,341 | Avon Products, Inc. | 212,572 | |||||||||
| 1,495 | Brown-Forman Corp., Class B | 95,575 | |||||||||
| 798 | Church & Dwight Co., Inc. | 40,483 | |||||||||
| 1,837 | Clorox Co. | 123,226 | |||||||||
| 28,054 | Coca-Cola (The) Co. | 1,464,138 | |||||||||
| 6,212 | Colgate-Palmolive Co. | 420,801 | |||||||||
| 2,803 | Hershey (The) Co. | 154,053 | |||||||||
| 1,675 | Hormel Foods Corp. | 63,801 | |||||||||
| 5,544 | Kimberly-Clark Corp. | 394,566 | |||||||||
| 384 | Lancaster Colony Corp. | 16,216 | |||||||||
| 1,587 | McCormick & Co., Inc. | 58,909 | |||||||||
| Number of Shares | Value | ||||||||||
| Common Stocks (Continued) | |||||||||||
| 19,784 | PepsiCo, Inc. | $ | 1,307,525 | ||||||||
| 38,323 | Procter & Gamble (The) Co. | 2,464,551 | |||||||||
| 2,552 | SUPERVALU, Inc. | 117,137 | |||||||||
| 7,493 | Sysco Corp. | 245,321 | |||||||||
| 672 | Tootsie Roll Industries, Inc. | 19,481 | |||||||||
| 315 | Universal Corp. | 19,744 | |||||||||
| 12,114 | Walgreen Co. | 531,805 | |||||||||
| 50,093 | Wal-Mart Stores, Inc. | 2,400,457 | |||||||||
| 3,354 | Wm. Wrigley Jr. Co. | 197,484 | |||||||||
| 12,868,140 | |||||||||||
| Energy—8.3% | |||||||||||
| 498 | Buckeye Partners L.P. | 26,832 | |||||||||
| 26,207 | Chevron Corp. | 2,038,643 | |||||||||
| 43,717 | Exxon Mobil Corp. | 3,470,255 | |||||||||
| 1,254 | Helmerich & Payne, Inc. | 40,492 | |||||||||
| 672 | Holly Corp. | 42,739 | |||||||||
| 2,746 | Kinder Morgan Energy Partners, L.P. | 152,266 | |||||||||
| 1,091 | TEPPCO Partners, L.P. | 49,695 | |||||||||
| 5,820,922 | |||||||||||
| Financials—30.2% | |||||||||||
| 273 | 1st Source Corp. | 6,754 | |||||||||
| 5,962 | AFLAC, Inc. | 306,089 | |||||||||
| 250 | Alabama National BanCorp. | 15,655 | |||||||||
| 977 | Alfa Corp. | 17,527 | |||||||||
| 10,690 | Allstate (The) Corp. | 666,201 | |||||||||
| 1,236 | AMBAC Financial Group, Inc. | 113,465 | |||||||||
| 31,597 | American International Group, Inc. | 2,208,946 | |||||||||
| 266 | Anchor BanCorp Wisconsin, Inc. | 7,161 | |||||||||
| 1,201 | Arthur J. Gallagher & Co. | 33,580 | |||||||||
| 1,548 | Associated Banc-Corp. | 50,124 | |||||||||
| 1,184 | Astoria Financial Corp. | 31,447 | |||||||||
| 191 | BancFirst Corp. | 8,177 | |||||||||
| 960 | BancorpSouth, Inc. | 23,587 | |||||||||
| 53,914 | Bank of America Corp. | 2,744,224 | |||||||||
| 603 | Bank of Hawaii Corp. | 31,899 | |||||||||
| 727 | BankAtlantic Bancorp, Inc., Class A | 7,008 | |||||||||
| 154 | Banner Corp. | 5,747 | |||||||||
| 6,586 | BB&T Corp. | 274,109 | |||||||||
| 1,706 | Brown & Brown, Inc. | 43,930 | |||||||||
| 223 | Capital City Bank Group, Inc. | 6,648 | |||||||||
| 796 | CBL & Associates Properties, Inc. | 36,178 | |||||||||
| 302 | Chemical Financial Corp. | 8,072 | |||||||||
| 542 | Chittenden Corp. | 15,751 | |||||||||
| 4,962 | Chubb (The) Corp. | 267,104 | |||||||||
| 2,094 | Cincinnati Financial Corp. | 94,733 | |||||||||
| 59,542 | Citigroup, Inc. | 3,192,643 | |||||||||
| 590 | City National Corp. | 43,200 | |||||||||
| 1,856 | Colonial BancGroup (The), Inc. | 44,655 | |||||||||
| 563 | Colonial Properties Trust | 27,930 | |||||||||
| 1,915 | Comerica, Inc. | 118,558 | |||||||||
| 2,319 | Commerce Bancorp, Inc. | 77,547 | |||||||||
See Notes to Financial Statements.
22
Schedule of Investments (Continued)
PowerShares Dividend AchieversTM Portfolio
April 30, 2007
| Number of Shares | Value | ||||||||||
| Common Stocks (Continued) | |||||||||||
| 842 | Commerce Bancshares, Inc. | $ | 39,860 | ||||||||
| 809 | Commerce Group (The), Inc. | 26,381 | |||||||||
| 366 | Community Bank System, Inc. | 7,503 | |||||||||
| 286 | Community Banks, Inc. | 6,758 | |||||||||
| 185 | Community Trust Bancorp, Inc. | 6,153 | |||||||||
| 1,583 | Compass Bancshares, Inc. | 107,929 | |||||||||
| 683 | Corus Bankshares, Inc. | 11,481 | |||||||||
| 729 | Cullen/Frost Bankers, Inc. | 37,303 | |||||||||
| 1,015 | CVB Financial Corp. | 12,048 | |||||||||
| 1,662 | Duke Realty Corp. | 71,649 | |||||||||
| 288 | EastGroup Properties, Inc. | 14,432 | |||||||||
| 1,535 | Eaton Vance Corp. | 58,668 | |||||||||
| 664 | Erie Indemnity Co., Class A | 34,893 | |||||||||
| 294 | Essex Property Trust, Inc. | 37,885 | |||||||||
| 734 | F.N.B. Corp. | 12,317 | |||||||||
| 673 | Federal Realty Investment Trust | 60,684 | |||||||||
| 6,681 | Fifth Third Bancorp | 271,182 | |||||||||
| 175 | First BanCorp. | 3,645 | |||||||||
| 261 | First Busey Corp. | 5,249 | |||||||||
| 426 | First Charter Corp. | 9,346 | |||||||||
| 898 | First Commonwealth Financial Corp. | 9,995 | |||||||||
| 137 | First Community Bancshares, Inc. | 4,503 | |||||||||
| 252 | First Financial Bankshares, Inc. | 9,752 | |||||||||
| 161 | First Financial Corp. | 4,592 | |||||||||
| 145 | First Financial Holdings, Inc. | 4,911 | |||||||||
| 201 | First Indiana Corp. | 3,903 | |||||||||
| 608 | First Midwest Bancorp, Inc. | 21,852 | |||||||||
| 253 | First State Bancorp. | 5,290 | |||||||||
| 973 | FirstMerit Corp. | 20,316 | |||||||||
| 256 | Flushing Financial Corp. | 3,981 | |||||||||
| 1,247 | Forest City Enterprises, Inc., Class A | 83,312 | |||||||||
| 3,081 | Franklin Resources, Inc. | 404,566 | |||||||||
| 12,031 | Freddie Mac | 779,368 | |||||||||
| 2,102 | Fulton Financial Corp. | 30,941 | |||||||||
| 2,961 | General Growth Properties, Inc. | 189,060 | |||||||||
| 640 | Glacier Bancorp, Inc. | 13,747 | |||||||||
| 620 | Greater Bay Bancorp | 15,990 | |||||||||
| 387 | Harleysville Group, Inc. | 11,819 | |||||||||
| 352 | Harleysville National Corp. | 5,942 | |||||||||
| 3,846 | Hartford Financial Services Group (The), Inc. | 389,215 | |||||||||
| 1,359 | HCC Insurance Holdings, Inc. | 41,667 | |||||||||
| 2,495 | Health Care Property Investors, Inc. | 88,298 | |||||||||
| 581 | Healthcare Realty Trust, Inc. | 19,789 | |||||||||
| 200 | Heartland Financial USA, Inc. | 5,122 | |||||||||
| 444 | Hilb Rogal & Hobbs Co. | 19,292 | |||||||||
| 403 | Home Properties, Inc. | 22,447 | |||||||||
| 149 | Horizon Financial Corp. | 3,130 | |||||||||
| 156 | IBERIABANK Corp. | 8,188 | |||||||||
| 274 | Independent Bank Corp. | 4,521 | |||||||||
| 811 | Investors Financial Services Corp. | 50,185 | |||||||||
| 362 | Irwin Financial Corp. | 5,803 | |||||||||
| 4,791 | KeyCorp | 170,943 | |||||||||
| Number of Shares | Value | ||||||||||
| Common Stocks (Continued) | |||||||||||
| 3,057 | Kimco Realty Corp. | $ | 146,950 | ||||||||
| 6,323 | Legg Mason, Inc. | 627,178 | |||||||||
| 331 | Lehman Brothers Holdings, Inc. | 24,918 | |||||||||
| 853 | Lexington Realty Trust | 17,819 | |||||||||
| 1,112 | Liberty Property Trust | 53,810 | |||||||||
| 3,362 | Lincoln National Corp. | 239,206 | |||||||||
| 1,325 | M&T Bank Corp. | 147,526 | |||||||||
| 874 | Macerich (The) Co. | 83,135 | |||||||||
| 400 | MAF Bancorp, Inc. | 16,060 | |||||||||
| 228 | Mainsource Financial Group, Inc. | 3,682 | |||||||||
| 3,117 | Marshall & Ilsley Corp. | 149,678 | |||||||||
| 1,623 | MBIA, Inc. | 112,896 | |||||||||
| 664 | Mercury General Corp. | 35,956 | |||||||||
| 234 | Midland (The) Co. | 10,270 | |||||||||
| 7,963 | National City Corp. | 291,048 | |||||||||
| 579 | National Penn Bancshares, Inc. | 10,735 | |||||||||
| 793 | National Retail Properties, Inc. | 18,992 | |||||||||
| 2,665 | Northern Trust Corp. | 167,762 | |||||||||
| 964 | Nuveen Investments, Inc., Class A | 51,381 | |||||||||
| 808 | Old National Bancorp | 14,447 | |||||||||
| 2,808 | Old Republic International Corp. | 59,726 | |||||||||
| 159 | Old Second Bancorp, Inc. | 4,652 | |||||||||
| 154 | Omega Financial Corp. | 4,320 | |||||||||
| 571 | Pacific Capital Bancorp | 15,377 | |||||||||
| 169 | Park National Corp. | 15,002 | |||||||||
| 128 | Peoples Bancorp, Inc. | 3,206 | |||||||||
| 3,654 | People's United Financial, Inc. | 72,751 | |||||||||
| 248 | Progressive (The) Corp. | 5,721 | |||||||||
| 3,112 | ProLogis | 201,658 | |||||||||
| 850 | Protective Life Corp. | 39,865 | |||||||||
| 391 | Provident Bankshares Corp. | 12,528 | |||||||||
| 1,227 | Realty Income Corp. | 34,233 | |||||||||
| 841 | Regency Centers Corp. | 69,298 | |||||||||
| 189 | Renasant Corp. | 4,398 | |||||||||
| 293 | RLI Corp. | 16,317 | |||||||||
| 302 | S&T Bancorp, Inc. | 9,833 | |||||||||
| 191 | Sandy Spring Bancorp, Inc. | 6,162 | |||||||||
| 232 | Seacoast Banking Corp. of Florida | 5,310 | |||||||||
| 1,200 | SEI Investments Co. | 73,236 | |||||||||
| 172 | Simmons First National Corp., Class A | 4,529 | |||||||||
| 1,427 | Sky Financial Group, Inc. | 38,886 | |||||||||
| 4,985 | SLM Corp. | 268,343 | |||||||||
| 907 | South Financial Group (The), Inc. | 20,525 | |||||||||
| 173 | Southwest Bancorp, Inc. | 4,239 | |||||||||
| 249 | Sovran Self Storage, Inc. | 13,760 | |||||||||
| 499 | State Auto Financial Corp. | 14,995 | |||||||||
| 4,078 | State Street Corp. | 280,852 | |||||||||
| 227 | Sterling Bancorp | 3,929 | |||||||||
| 875 | Sterling Bancshares, Inc. | 10,001 | |||||||||
| 361 | Sterling Financial Corp. | 6,011 | |||||||||
| 222 | Sun Communities, Inc. | 6,607 | |||||||||
| 4,330 | SunTrust Banks, Inc. | 365,539 | |||||||||
See Notes to Financial Statements.
23
Schedule of Investments (Continued)
PowerShares Dividend AchieversTM Portfolio
April 30, 2007
| Number of Shares | Value | ||||||||||
| Common Stocks (Continued) | |||||||||||
| 633 | Susquehanna Bancshares, Inc. | $ | 14,103 | ||||||||
| 175 | SY Bancorp, Inc. | 4,123 | |||||||||
| 3,970 | Synovus Financial Corp. | 125,293 | |||||||||
| 3,226 | T. Rowe Price Group, Inc. | 160,268 | |||||||||
| 380 | Tanger Factory Outlet Centers, Inc. | 15,405 | |||||||||
| 638 | Taubman Centers, Inc. | 35,760 | |||||||||
| 1,584 | TCF Financial Corp. | 42,895 | |||||||||
| 802 | Transatlantic Holdings, Inc. | 55,731 | |||||||||
| 707 | Trustmark Corp. | 18,813 | |||||||||
| 21,157 | U.S. Bancorp | 726,743 | |||||||||
| 1,646 | UDR, Inc. | 49,446 | |||||||||
| 511 | UMB Financial Corp. | 19,990 | |||||||||
| 498 | United Bankshares, Inc. | 16,683 | |||||||||
| 143 | Universal Health Realty Income Trust | 5,036 | |||||||||
| 1,399 | Valley National Bancorp | 35,493 | |||||||||
| 1,841 | Vornado Realty Trust | 218,398 | |||||||||
| 1,062 | Washington Federal, Inc. | 25,180 | |||||||||
| 3,911 | Washington Mutual, Inc. | 164,184 | |||||||||
| 547 | Washington Real Estate Investment Trust | 20,709 | |||||||||
| 163 | Washington Trust Bancorp, Inc. | 4,187 | |||||||||
| 687 | Webster Financial Corp. | 30,537 | |||||||||
| 1,050 | Weingarten Realty Investors | 50,253 | |||||||||
| 41,034 | Wells Fargo & Co. | 1,472,710 | |||||||||
| 257 | WesBanco, Inc. | 7,538 | |||||||||
| 86 | Wesco Financial Corp. | 38,270 | |||||||||
| 190 | West Coast Bancorp. | 5,903 | |||||||||
| 366 | Westamerica Bancorp. | 17,140 | |||||||||
| 801 | Whitney Holding Corp. | 24,647 | |||||||||
| 831 | Wilmington Trust Corp. | 33,622 | |||||||||
| 21,170,773 | |||||||||||
| Health Care—11.9% | |||||||||||
| 18,741 | Abbott Laboratories | 1,061,115 | |||||||||
| 548 | Arrow International, Inc. | 17,448 | |||||||||
| 749 | Beckman Coulter, Inc. | 47,045 | |||||||||
| 2,971 | Becton, Dickinson & Co. | 233,788 | |||||||||
| 1,257 | C.R. Bard, Inc. | 104,494 | |||||||||
| 4,862 | Cardinal Health, Inc. | 340,097 | |||||||||
| 1,848 | DENTSPLY International, Inc. | 61,742 | |||||||||
| 13,773 | Eli Lilly & Co. | 814,397 | |||||||||
| 747 | Hillenbrand Industries, Inc. | 45,679 | |||||||||
| 35,160 | Johnson & Johnson | 2,257,975 | |||||||||
| 13,986 | Medtronic, Inc. | 740,279 | |||||||||
| 319 | Meridian Bioscience, Inc. | 9,484 | |||||||||
| 86,073 | Pfizer, Inc. | 2,277,492 | |||||||||
| 4,965 | Stryker Corp. | 322,427 | |||||||||
| 401 | West Pharmaceutical Services, Inc. | 19,958 | |||||||||
| 8,353,420 | |||||||||||
| Industrials—12.1% | |||||||||||
| 8,747 | 3M Co. | 723,989 | |||||||||
| 373 | A.O. Smith Corp. | 14,211 | |||||||||
| 595 | ABM Industries, Inc. | 16,743 | |||||||||
| Number of Shares | Value | ||||||||||
| Common Stocks (Continued) | |||||||||||
| 1,294 | Avery Dennison Corp. | $ | 80,487 | ||||||||
| 173 | Badger Meter, Inc. | 4,152 | |||||||||
| 655 | Brady Corp., Class A | 21,523 | |||||||||
| 600 | Briggs & Stratton Corp. | 17,802 | |||||||||
| 754 | Carlisle Cos., Inc. | 31,050 | |||||||||
| 7,844 | Caterpillar, Inc. | 569,631 | |||||||||
| 1,927 | Cintas Corp. | 72,205 | |||||||||
| 623 | Clarcor, Inc. | 19,649 | |||||||||
| 3,755 | Danaher Corp. | 267,318 | |||||||||
| 962 | Donaldson Co., Inc. | 34,555 | |||||||||
| 2,483 | Dover Corp. | 119,482 | |||||||||
| 9,691 | Emerson Electric Co. | 455,380 | |||||||||
| 2,600 | Expeditors International of Washington, Inc. | 108,680 | |||||||||
| 281 | Franklin Electric Co., Inc. | 11,968 | |||||||||
| 4,913 | General Dynamics Corp. | 385,671 | |||||||||
| 98,254 | General Electric Co. | 3,621,643 | |||||||||
| 162 | Gorman-Rupp (The) Co. | 5,195 | |||||||||
| 1,021 | Harsco Corp. | 52,071 | |||||||||
| 582 | HNI Corp. | 24,293 | |||||||||
| 6,787 | Illinois Tool Works, Inc. | 348,241 | |||||||||
| 261 | LSI Industries, Inc. | 4,113 | |||||||||
| 4,756 | Masco Corp. | 129,411 | |||||||||
| 306 | McGrath Rentcorp | 9,226 | |||||||||
| 437 | Mine Safety Appliances Co. | 18,420 | |||||||||
| 100 | NACCO Industries, Inc., Class A | 15,938 | |||||||||
| 409 | Nordson Corp. | 18,744 | |||||||||
| 1,406 | Parker Hannifin Corp. | 129,549 | |||||||||
| 1,213 | Pentair, Inc. | 38,986 | |||||||||
| 2,676 | Pitney Bowes, Inc. | 128,448 | |||||||||
| 219 | Raven Industries, Inc. | 6,327 | |||||||||
| 1,072 | Roper Industries, Inc. | 60,096 | |||||||||
| 475 | Teleflex, Inc. | 34,119 | |||||||||
| 229 | Tennant Co. | 7,333 | |||||||||
| 12,078 | United Technologies Corp. | 810,797 | |||||||||
| 229 | Universal Forest Products, Inc. | 10,639 | |||||||||
| 1,015 | W.W. Grainger, Inc. | 83,859 | |||||||||
| 8,511,944 | |||||||||||
| Information Technology—3.6% | |||||||||||
| 6,683 | Automatic Data Processing, Inc. | 299,131 | |||||||||
| 798 | Diebold, Inc. | 38,041 | |||||||||
| 18,034 | International Business Machines Corp. | 1,843,255 | |||||||||
| 1,091 | Jack Henry & Associates, Inc. | 25,911 | |||||||||
| 3,635 | Linear Technology Corp. | 136,022 | |||||||||
| 4,639 | Paychex, Inc. | 172,107 | |||||||||
| 2,514,467 | |||||||||||
| Materials—2.4% | |||||||||||
| 2,629 | Air Products & Chemicals, Inc. | 201,119 | |||||||||
| 1,153 | Albemarle Corp. | 48,945 | |||||||||
| 421 | AptarGroup, Inc. | 30,838 | |||||||||
| 1,270 | Bemis Co., Inc. | 42,189 | |||||||||
| 3,044 | Ecolab, Inc. | 130,862 | |||||||||
See Notes to Financial Statements.
24
Schedule of Investments (Continued)
PowerShares Dividend AchieversTM Portfolio
April 30, 2007
| Number of Shares | Value | ||||||||||
| Common Stocks (Continued) | |||||||||||
| 737 | H.B. Fuller Co. | $ | 18,845 | ||||||||
| 547 | Martin Marietta Materials, Inc. | 79,764 | |||||||||
| 426 | Myers Industries, Inc. | 9,564 | |||||||||
| 3,662 | Nucor Corp. | 232,391 | |||||||||
| 1,992 | PPG Industries, Inc. | 146,571 | |||||||||
| 3,871 | Praxair, Inc. | 249,872 | |||||||||
| 2,632 | Rohm & Haas Co. | 134,679 | |||||||||
| 1,468 | RPM International, Inc. | 31,224 | |||||||||
| 1,595 | Sigma-Aldrich Corp. | 67,118 | |||||||||
| 1,208 | Sonoco Products Co. | 51,509 | |||||||||
| 1,245 | Valspar (The) Corp. | 33,665 | |||||||||
| 1,154 | Vulcan Materials Co. | 142,715 | |||||||||
| 1,651,870 | |||||||||||
| Telecommunication Services—4.3% | |||||||||||
| 75,837 | AT&T, Inc. | 2,936,408 | |||||||||
| 1,353 | CenturyTel, Inc. | 62,306 | |||||||||
| 2,998,714 | |||||||||||
| Utilities—1.8% | |||||||||||
| 207 | American States Water Co. | 7,377 | |||||||||
| 1,610 | Aqua America, Inc. | 35,597 | |||||||||
| 1,076 | Atmos Energy Corp. | 34,131 | |||||||||
| 457 | Black Hills Corp. | 18,193 | |||||||||
| 251 | California Water Service Group | 9,756 | |||||||||
| 3,146 | Consolidated Edison, Inc. | 161,264 | |||||||||
| 871 | Energen Corp. | 48,820 | |||||||||
| 4,936 | FPL Group, Inc. | 317,730 | |||||||||
| 916 | Integrys Energy Group, Inc. | 51,388 | |||||||||
| 2,200 | MDU Resources Group, Inc. | 66,660 | |||||||||
| 255 | MGE Energy, Inc. | 9,211 | |||||||||
| 1,005 | National Fuel Gas Co. | 47,245 | |||||||||
| 339 | New Jersey Resources Corp. | 18,204 | |||||||||
| 359 | Otter Tail Corp. | 12,278 | |||||||||
| 906 | Piedmont Natural Gas Co., Inc. | 23,909 | |||||||||
| 1,215 | Pinnacle West Capital Corp. | 58,672 | |||||||||
| 3,123 | Progress Energy, Inc. | 157,868 | |||||||||
| 1,045 | Questar Corp. | 101,501 | |||||||||
| 222 | SJW Corp. | 7,695 | |||||||||
| 290 | Southwest Water Co. | 3,941 | |||||||||
| 1,288 | UGI Corp. | 36,528 | |||||||||
| 982 | Vectren Corp. | 28,547 | |||||||||
| 597 | WGL Holdings, Inc. | 20,202 | |||||||||
| 1,276,717 | |||||||||||
| Total Common Stocks (Cost $64,063,398) | 70,043,877 | ||||||||||
Money Market Fund—0.0%
| 27,578 | Liquid Assets Portfolio Private Class* (Cost $27,578) | 27,578 | |||||||||
| Total Investments (Cost $64,090,976)—100.0% | 70,071,455 | ||||||||||
| Other assets less liabilities—0.0% | 7,480 | ||||||||||
| Net Assets—100.0% | $ | 70,078,935 | |||||||||
* Affiliated investment.
See Notes to Financial Statements.
25
Schedule of Investments
PowerShares High Yield Equity Dividend AchieversTM Portfolio
April 30, 2007
| Number of Shares | Value | ||||||||||
| Common Stocks—100.0% | |||||||||||
| Consumer Discretionary—3.3% | |||||||||||
| 688,652 | La-Z-Boy, Inc. | $ | 8,050,342 | ||||||||
| 436,852 | ServiceMaster (The) Co. | 6,723,152 | |||||||||
| 14,773,494 | |||||||||||
| Consumer Staples—3.3% | |||||||||||
| 122,043 | Altria Group, Inc. | 8,411,204 | |||||||||
| 96,040 | Universal Corp. | 6,019,787 | |||||||||
| 14,430,991 | |||||||||||
| Financials—64.8% | |||||||||||
| 340,173 | Arthur J. Gallagher & Co. | 9,511,237 | |||||||||
| 226,433 | Associated Banc-Corp. | 7,331,901 | |||||||||
| 186,962 | Bank of America Corp. | 9,516,366 | |||||||||
| 211,214 | BB&T Corp. | 8,790,727 | |||||||||
| 169,659 | Citigroup, Inc. | 9,097,116 | |||||||||
| 148,755 | Comerica, Inc. | 9,209,422 | |||||||||
| 255,555 | Commerce Group (The), Inc. | 8,333,649 | |||||||||
| 407,062 | Community Bank System, Inc. | 8,344,771 | |||||||||
| 737,767 | Corus Bankshares, Inc. | 12,401,862 | |||||||||
| 694,851 | F.N.B. Corp. | 11,659,600 | |||||||||
| 230,593 | Fifth Third Bancorp | 9,359,770 | |||||||||
| 368,049 | First BanCorp. | 7,666,461 | |||||||||
| 1,108,091 | First Commonwealth Financial Corp. | 12,333,052 | |||||||||
| 559,827 | FirstMerit Corp. | 11,689,188 | |||||||||
| 591,761 | Fulton Financial Corp. | 8,710,722 | |||||||||
| 567,686 | Harleysville National Corp. | 9,582,540 | |||||||||
| 233,242 | KeyCorp | 8,322,075 | |||||||||
| 154,558 | Mercury General Corp. | 8,369,316 | |||||||||
| 238,978 | National City Corp. | 8,734,646 | |||||||||
| 569,420 | Old National Bancorp | 10,181,230 | |||||||||
| 333,585 | Omega Financial Corp. | 9,357,059 | |||||||||
| 94,914 | Park National Corp. | 8,425,516 | |||||||||
| 242,912 | Provident Bankshares Corp. | 7,782,900 | |||||||||
| 237,777 | S&T Bancorp, Inc. | 7,742,019 | |||||||||
| 295,183 | Sky Financial Group, Inc. | 8,043,737 | |||||||||
| 508,335 | Sterling Bancorp | 8,799,279 | |||||||||
| 406,348 | Susquehanna Bancshares, Inc. | 9,053,433 | |||||||||
| 291,343 | TCF Financial Corp. | 7,889,568 | |||||||||
| 286,015 | U.S. Bancorp | 9,824,615 | |||||||||
| 317,597 | Washington Federal, Inc. | 7,530,225 | |||||||||
| 273,446 | Washington Mutual, Inc. | 11,479,263 | |||||||||
| 285,073,265 | |||||||||||
| Health Care—2.2% | |||||||||||
| 371,198 | Pfizer, Inc. | 9,821,899 | |||||||||
| Industrials—1.2% | |||||||||||
| 110,865 | Emerson Electric Co. | 5,209,546 | |||||||||
| Materials—1.5% | |||||||||||
| 303,279 | RPM International, Inc. | 6,450,744 | |||||||||
| Telecommunication Services—1.8% | |||||||||||
| 199,641 | AT&T, Inc. | 7,730,100 | |||||||||
| Number of Shares | Value | ||||||||||
| Common Stocks (Continued) | |||||||||||
| Utilities—21.9% | |||||||||||
| 274,734 | Atmos Energy Corp. | $ | 8,714,562 | ||||||||
| 204,626 | Black Hills Corp. | 8,146,161 | |||||||||
| 187,918 | Consolidated Edison, Inc. | 9,632,677 | |||||||||
| 159,596 | Integrys Energy Group, Inc. | 8,953,336 | |||||||||
| 230,353 | MGE Energy, Inc. | 8,320,350 | |||||||||
| 201,584 | Otter Tail Corp. | 6,894,173 | |||||||||
| 301,443 | Piedmont Natural Gas Co., Inc. | 7,955,081 | |||||||||
| 187,821 | Pinnacle West Capital Corp. | 9,069,876 | |||||||||
| 202,086 | Progress Energy, Inc. | 10,215,446 | |||||||||
| 318,665 | Vectren Corp. | 9,263,592 | |||||||||
| 273,384 | WGL Holdings, Inc. | 9,251,315 | |||||||||
| 96,416,569 | |||||||||||
| Total Investments (Cost $446,695,792)—100.0% | 439,906,608 | ||||||||||
| Liabilities in excess of other assets—(0.0%) | (86,239 | ) | |||||||||
| Net Assets—100.0% | $ | 439,820,369 | |||||||||
See Notes to Financial Statements.
26
Schedule of Investments
PowerShares High Growth Rate Dividend AchieversTM Portfolio
April 30, 2007
| Number of Shares | Value | ||||||||||
| Common Stocks—99.8% | |||||||||||
| Consumer Discretionary—14.2% | |||||||||||
| 2,238 | Applebee's International, Inc. | $ | 60,829 | ||||||||
| 376 | Courier Corp. | 14,965 | |||||||||
| 7,756 | Harley-Davidson, Inc. | 491,110 | |||||||||
| 2,247 | Harte-Hanks, Inc. | 58,647 | |||||||||
| 42,024 | Home Depot (The), Inc. | 1,591,449 | |||||||||
| 1,729 | John Wiley & Sons, Inc., Class A | 64,751 | |||||||||
| 45,483 | Lowe's Cos., Inc. | 1,389,960 | |||||||||
| 34,589 | McDonald's Corp. | 1,669,957 | |||||||||
| 1,068 | Polaris Industries, Inc. | 53,966 | |||||||||
| 4,187 | Ross Stores, Inc. | 138,799 | |||||||||
| 13,662 | TJX Cos. (The), Inc. | 381,033 | |||||||||
| 1,673 | Wolverine World Wide, Inc. | 47,814 | |||||||||
| 5,963,280 | |||||||||||
| Consumer Staples—5.4% | |||||||||||
| 18,580 | Sysco Corp. | 608,309 | |||||||||
| 34,965 | Wal-Mart Stores, Inc. | 1,675,523 | |||||||||
| 2,283,832 | |||||||||||
| Energy—1.2% | |||||||||||
| 1,667 | Holly Corp. | 106,021 | |||||||||
| 6,808 | Kinder Morgan Energy Partners, L.P. | 377,504 | |||||||||
| 483,525 | |||||||||||
| Financials—45.3% | |||||||||||
| 14,782 | AFLAC, Inc. | 758,908 | |||||||||
| 619 | Alabama National BanCorp. | 38,762 | |||||||||
| 24,399 | American International Group, Inc. | 1,705,733 | |||||||||
| 659 | Anchor BanCorp Wisconsin, Inc. | 17,740 | |||||||||
| 2,978 | Arthur J. Gallagher & Co. | 83,265 | |||||||||
| 2,936 | Astoria Financial Corp. | 77,980 | |||||||||
| 473 | BancFirst Corp. | 20,249 | |||||||||
| 33,573 | Bank of America Corp. | 1,708,865 | |||||||||
| 383 | Banner Corp. | 14,294 | |||||||||
| 4,231 | Brown & Brown, Inc. | 108,948 | |||||||||
| 31,023 | Citigroup, Inc. | 1,663,453 | |||||||||
| 1,464 | City National Corp. | 107,194 | |||||||||
| 5,750 | Commerce Bancorp, Inc. | 192,280 | |||||||||
| 1,694 | Corus Bankshares, Inc. | 28,476 | |||||||||
| 2,516 | CVB Financial Corp. | 29,865 | |||||||||
| 3,806 | Eaton Vance Corp. | 145,465 | |||||||||
| 1,648 | Erie Indemnity Co., Class A | 86,602 | |||||||||
| 16,565 | Fifth Third Bancorp | 672,373 | |||||||||
| 433 | First Bancorp. | 9,019 | |||||||||
| 627 | First State Bancorp. | 13,111 | |||||||||
| 636 | Flushing Financial Corp. | 9,890 | |||||||||
| 3,091 | Forest City Enterprises, Inc., Class A | 206,510 | |||||||||
| 19,914 | Freddie Mac | 1,290,029 | |||||||||
| 1,586 | Glacier Bancorp, Inc. | 34,067 | |||||||||
| 1,537 | Greater Bay Bancorp | 39,639 | |||||||||
| 3,370 | HCC Insurance Holdings, Inc. | 103,324 | |||||||||
| 388 | IBERIABANK Corp. | 20,366 | |||||||||
| Number of Shares | Value | ||||||||||
| Common Stocks (Continued) | |||||||||||
| 680 | Independent Bank Corp. | $ | 11,220 | ||||||||
| 2,011 | Investors Financial Services Corp. | 124,441 | |||||||||
| 898 | Irwin Financial Corp. | 14,395 | |||||||||
| 4,023 | Legg Mason, Inc. | 399,041 | |||||||||
| 16,040 | Lehman Brothers Holdings, Inc. | 1,207,491 | |||||||||
| 3,285 | M&T Bank Corp. | 365,752 | |||||||||
| 992 | MAF Bancorp, Inc. | 39,829 | |||||||||
| 1,647 | Mercury General Corp. | 89,185 | |||||||||
| 2,391 | Nuveen Investments, Inc., Class A | 127,440 | |||||||||
| 6,962 | Old Republic International Corp. | 148,082 | |||||||||
| 395 | Old Second Bancorp, Inc. | 11,558 | |||||||||
| 1,415 | Pacific Capital Bancorp | 38,106 | |||||||||
| 9,059 | People's United Financial, Inc. | 180,365 | |||||||||
| 969 | Provident Bankshares Corp. | 31,047 | |||||||||
| 433 | S.Y. Bancorp, Inc. | 10,201 | |||||||||
| 2,976 | SEI Investments Co. | 181,625 | |||||||||
| 3,539 | Sky Financial Group, Inc. | 96,438 | |||||||||
| 12,361 | SLM Corp. | 665,393 | |||||||||
| 430 | Southwest Bancorp, Inc. | 10,535 | |||||||||
| 1,237 | State Auto Financial Corp. | 37,172 | |||||||||
| 10,111 | State Street Corp. | 696,345 | |||||||||
| 562 | Sterling Bancorp | 9,728 | |||||||||
| 9,843 | Synovus Financial Corp. | 310,645 | |||||||||
| 7,999 | T. Rowe Price Group, Inc. | 397,390 | |||||||||
| 3,895 | TCF Financial Corp. | 105,477 | |||||||||
| 49,285 | U.S. Bancorp | 1,692,940 | |||||||||
| 26,775 | Washington Mutual, Inc. | 1,124,015 | |||||||||
| 47,208 | Wells Fargo & Co. | 1,694,295 | |||||||||
| 471 | West Coast Bancorp | 14,634 | |||||||||
| 908 | Westamerica Bancorp | 42,522 | |||||||||
| 19,063,714 | |||||||||||
| Health Care—17.4% | |||||||||||
| 1,359 | Arrow International, Inc. | 43,271 | |||||||||
| 7,366 | Becton, Dickinson & Co. | 579,631 | |||||||||
| 12,055 | Cardinal Health, Inc. | 843,247 | |||||||||
| 26,507 | Johnson & Johnson | 1,702,280 | |||||||||
| 31,493 | Medtronic, Inc. | 1,666,924 | |||||||||
| 792 | Meridian Bioscience, Inc. | 23,546 | |||||||||
| 63,728 | Pfizer, Inc. | 1,686,243 | |||||||||
| 12,312 | Stryker Corp. | 799,541 | |||||||||
| 7,344,683 | |||||||||||
| Industrials—9.2% | |||||||||||
| 4,778 | Cintas Corp. | 179,032 | |||||||||
| 9,311 | Danaher Corp. | 662,850 | |||||||||
| 2,385 | Donaldson Co., Inc. | 85,669 | |||||||||
| 6,447 | Expeditors International of Washington, Inc. | 269,485 | |||||||||
| 696 | Franklin Electric Co., Inc. | 29,643 | |||||||||
| 16,829 | Illinois Tool Works, Inc. | 863,496 | |||||||||
| 647 | LSI Industries, Inc. | 10,197 | |||||||||
| 758 | McGrath Rentcorp | 22,854 | |||||||||
| 1,085 | Mine Safety Appliances Co. | 45,733 | |||||||||
See Notes to Financial Statements.
27
Schedule of Investments (Continued)
PowerShares High Growth Rate Dividend AchieversTM Portfolio
April 30, 2007
| Number of Shares | Value | ||||||||||
| Common Stocks (Continued) | |||||||||||
| 543 | Raven Industries, Inc. | $ | 15,687 | ||||||||
| 25,171 | United Technologies Corp. | 1,689,728 | |||||||||
| 3,874,374 | |||||||||||
| Information Technology—3.7% | |||||||||||
| 16,572 | Automatic Data Processing, Inc. | 741,763 | |||||||||
| 2,705 | Jack Henry & Associates, Inc. | 64,244 | |||||||||
| 9,013 | Linear Technology Corp. | 337,266 | |||||||||
| 11,502 | Paychex, Inc. | 426,724 | |||||||||
| 1,569,997 | |||||||||||
| Materials—3.4% | |||||||||||
| 1,045 | AptarGroup, Inc. | 76,546 | |||||||||
| 9,081 | Nucor Corp. | 576,280 | |||||||||
| 9,598 | Praxair, Inc. | 619,552 | |||||||||
| 3,954 | Sigma-Aldrich Corp. | 166,384 | |||||||||
| 1,438,762 | |||||||||||
| Total Common Stocks (Cost $39,913,828) | 42,022,167 | ||||||||||
Money Market Fund—0.0%
| 6,625 | Liquid Assets Portfolio Private Class* (Cost $6,625) | 6,625 | |||||||||
| Total Investments (Cost $39,920,453)—99.8% | 42,028,792 | ||||||||||
| Other assets less liabilities—0.2% | 98,738 | ||||||||||
| Net Assets—100.0% | $ | 42,127,530 | |||||||||
* Affiliated investment.
See Notes to Financial Statements.
28
Schedule of Investments
PowerShares International Dividend AchieversTM Portfolio
April 30, 2007
| Number of Shares | Value | ||||||||||
| Common Stocks—100.2% | |||||||||||
| Consumer Discretionary—8.0% | |||||||||||
| 138,422 | Honda Motor Co. Ltd. ADR | $ | 4,765,869 | ||||||||
| 73,839 | Luxottica Group SpA ADR | 2,557,783 | |||||||||
| 537,760 | Pearson PLC ADR | 9,174,187 | |||||||||
| 50,977 | Publicis Groupe ADR | 2,426,505 | |||||||||
| 194,753 | Reed Elsevier NVADR | 7,330,503 | |||||||||
| 142,213 | Reed Elsevier PLC ADR | 7,187,445 | |||||||||
| 164,288 | Thomson (The) Corp. | 7,236,886 | |||||||||
| 49,924 | WPP Group PLC ADR | 3,707,356 | |||||||||
| 44,386,534 | |||||||||||
| Consumer Staples—10.4% | |||||||||||
| 168,331 | British American Tobacco PLC ADR | 10,480,288 | |||||||||
| 30,250 | Bunge Ltd. | 2,291,740 | |||||||||
| 105,968 | Cadbury Schweppes PLC ADR | 5,621,602 | |||||||||
| 109,823 | Diageo PLC ADR | 9,269,061 | |||||||||
| 113,720 | Groupe Danone ADR | 3,773,230 | |||||||||
| 96,005 | Imperial Tobacco Group PLC ADR | 8,391,797 | |||||||||
| 290,615 | Unilever NV | 8,863,758 | |||||||||
| 275,467 | Unilever PLC ADR | 8,624,872 | |||||||||
| 57,316,348 | |||||||||||
| Energy—11.3% | |||||||||||
| 39,022 | BG Group PLC ADR | 2,806,852 | |||||||||
| 164,632 | BP PLC ADR | 11,083,027 | |||||||||
| 27,535 | Canadian Natural Resources Ltd. | 1,641,361 | |||||||||
| 301,701 | Enbridge, Inc. | 9,956,133 | |||||||||
| 59,876 | Imperial Oil Ltd. | 2,277,084 | |||||||||
| 163,364 | Norsk Hydro ASA ADR | 5,644,226 | |||||||||
| 272,097 | Sasol Ltd. ADR | 9,297,554 | |||||||||
| 305,076 | TransCanada Corp. | 10,906,468 | |||||||||
| 168,996 | Yanzhou Coal Mining Co. Ltd. ADR | 8,693,154 | |||||||||
| 62,305,859 | |||||||||||
| Financials—38.1% | |||||||||||
| 212,596 | ABN AMRO Holding NV ADR | 10,300,276 | |||||||||
| 89,667 | ACE Ltd. | 5,331,600 | |||||||||
| 132,290 | Allianz SE ADR | 2,939,484 | |||||||||
| 153,780 | Allied Irish Banks PLC ADR | 9,332,908 | |||||||||
| 94,656 | Australia and New Zealand Banking Group Ltd. ADR | 11,988,182 | |||||||||
| 314,687 | Banco Bilbao Vizcaya Argentaria SA ADR | 7,533,607 | |||||||||
| 469,443 | Banco Santander Central Hispanic SA ADR | 8,304,447 | |||||||||
| 113,443 | Bank of Ireland ADR | 9,825,298 | |||||||||
| 179,951 | Bank of Montreal | 11,279,329 | |||||||||
| 201,341 | Bank of Nova Scotia | 9,700,609 | |||||||||
| 225,975 | Barclays PLC ADR | 13,115,589 | |||||||||
| 141,293 | Brookfield Properties Corp. | 5,802,904 | |||||||||
| 107,590 | Canadian Imperial Bank of Commerce | 9,514,184 | |||||||||
| 132,052 | Credicorp Ltd. | 6,890,473 | |||||||||
| 30,066 | Everest Re Group Ltd. | 3,025,842 | |||||||||
| 152,759 | HSBC Holdings PLC ADR | 14,108,820 | |||||||||
| 172,871 | Manulife Financial Corp. | 6,242,372 | |||||||||
| Number of Shares | Value | ||||||||||
| Common Stocks (Continued) | |||||||||||
| 117,455 | Max Capital Group Ltd. | $ | 3,147,794 | ||||||||
| 67,643 | National Australia Bank Ltd. ADR | 12,026,925 | |||||||||
| 6,978 | ORIX Corp. ADR | 943,984 | |||||||||
| 99,907 | PartnerRe Ltd. | 7,195,302 | |||||||||
| 95,509 | RenaissanceRe Holdings Ltd. | 5,171,812 | |||||||||
| 163,021 | Royal Bank of Canada | 8,486,873 | |||||||||
| 157,730 | Sun Life Financial, Inc. | 7,468,516 | |||||||||
| 139,124 | Toronto-Dominion (The) Bank | 8,503,259 | |||||||||
| 112,755 | Westpac Banking Corp. ADR | 12,549,632 | |||||||||
| 210,730,021 | |||||||||||
| Health Care—1.9% | |||||||||||
| 52,044 | Fresenius Medical Care AG ADR | 2,606,884 | |||||||||
| 30,682 | Novo-Nordisk A/S ADR | 3,019,416 | |||||||||
| 39,384 | Smith & Nephew PLC ADR | 2,455,592 | |||||||||
| 56,923 | Teva Pharmaceutical Industries Ltd. ADR | 2,180,720 | |||||||||
| 10,262,612 | |||||||||||
| Industrials—6.0% | |||||||||||
| 100,444 | Canadian National Railway Co. | 5,046,307 | |||||||||
| 124,493 | TNT NV ADR | 5,619,614 | |||||||||
| 691,621 | Tomkins PLC ADR | 14,724,611 | |||||||||
| 83,597 | Volvo AB ADR | 8,131,480 | |||||||||
| 33,522,012 | |||||||||||
| Information Technology—7.8% | |||||||||||
| 70,780 | Canon, Inc. ADR | 3,977,836 | |||||||||
| 41,578 | Dassault Systemes SA ADR | 2,469,733 | |||||||||
| 30,944 | KYOCERA Corp. ADR | 3,017,040 | |||||||||
| 2,289,869 | Nam Tai Electronics, Inc. | 29,676,702 | |||||||||
| 51,071 | SAP AG ADR | 2,451,408 | |||||||||
| 71,645 | Satyam Computer Services Ltd. ADR | 1,782,528 | |||||||||
| 43,375,247 | |||||||||||
| Materials—4.9% | |||||||||||
| 77,161 | Akzo Nobel NV ADR | 6,142,016 | |||||||||
| 96,563 | BHP Billiton Ltd. ADR | 4,716,137 | |||||||||
| 140,561 | Compania de Minas Buenaventura SA ADR | 4,579,477 | |||||||||
| 107,184 | CRH PLC ADR | 4,788,981 | |||||||||
| 84,155 | Hanson PLC ADR | 7,143,076 | |||||||||
| 27,369,687 | |||||||||||
| Telecommunication Services—3.4% | |||||||||||
| 21,672 | America Movil SAB de CV ADR | 1,138,430 | |||||||||
| 310,616 | NTT DoCoMo, Inc. ADR | 5,283,578 | |||||||||
| 27,702 | Rostelecom ADR | 1,464,051 | |||||||||
| 98,790 | Telenor ASA ADR | 5,558,914 | |||||||||
| 184,228 | Vodafone Group PLC ADR | 5,292,870 | |||||||||
| 18,737,843 | |||||||||||
| Utilities—8.4% | |||||||||||
| 122,238 | Consolidated Water Co., Inc. | 3,167,187 | |||||||||
| 127,849 | E.ON AG ADR | 6,409,070 | |||||||||
| 291,111 | Endesa SA ADR | 15,900,483 | |||||||||
| 264,885 | Huaneng Power International, Inc. ADR | 10,751,682 | |||||||||
See Notes to Financial Statements.
29
Schedule of Investments (Continued)
PowerShares International Dividend AchieversTM Portfolio
April 30, 2007
| Number of Shares | Value | ||||||||||
| Common Stocks (Continued) | |||||||||||
| 126,545 | National Grid PLC ADR | $ | 9,967,950 | ||||||||
| 46,196,372 | |||||||||||
| Total Investments (Cost $511,348,641)—100.2% | 554,202,535 | ||||||||||
| Liabilities in excess of other assets—(0.2%) | (1,002,540 | ) | |||||||||
| Net Assets—100.0% | $ | 553,199,995 | |||||||||
ADR American Depositary Receipt.
COUNTRY BREAKDOWN
April 30, 2007 (Unaudited)
| Value | Net Assets | ||||||||||
| United Kingdom | $ | 143,154,995 | 25.9 | % | |||||||
| Canada | 104,062,285 | 18.8 | |||||||||
| Australia | 41,280,876 | 7.5 | |||||||||
| Netherlands | 38,256,167 | 6.9 | |||||||||
| Spain | 31,738,537 | 5.7 | |||||||||
| British Virgin Islands | 29,676,702 | 5.4 | |||||||||
| Bermuda | 27,722,963 | 5.0 | |||||||||
| Ireland | 23,947,187 | 4.3 | |||||||||
| China | 19,444,836 | 3.5 | |||||||||
| Japan | 17,988,307 | 3.3 | |||||||||
| Germany | 14,406,846 | 2.6 | |||||||||
| Norway | 11,203,140 | 2.0 | |||||||||
| South Africa | 9,297,554 | 1.7 | |||||||||
| France | 8,669,468 | 1.6 | |||||||||
| Cayman Islands | 8,498,787 | 1.5 | |||||||||
| Sweden | 8,131,480 | 1.5 | |||||||||
| Peru | 4,579,477 | 0.8 | |||||||||
| Denmark | 3,019,416 | 0.5 | |||||||||
| Italy | 2,557,783 | 0.5 | |||||||||
| Israel | 2,180,720 | 0.4 | |||||||||
| India | 1,782,528 | 0.3 | |||||||||
| Russia | 1,464,051 | 0.3 | |||||||||
| Mexico | 1,138,430 | 0.2 | |||||||||
| Total investments | 554,202,535 | 100.2 | |||||||||
| Liabilities in excess of other assets | (1,002,540 | ) | (0.2 | ) | |||||||
| Net Assets | $ | 553,199,995 | 100.0 | % | |||||||
See Notes to Financial Statements.
30
Schedule of Investments
PowerShares Buyback AchieversTM Portfolio
April 30, 2007
| Number of Shares | Value | ||||||||||
| Common Stocks —100.0% | |||||||||||
| Consumer Discretionary—27.6% | |||||||||||
| 2,272 | American Greetings Corp., Class A | $ | 57,822 | ||||||||
| 895 | Audiovox Corp., Class A* | 12,879 | |||||||||
| 3,194 | Autoliv, Inc. | 185,731 | |||||||||
| 8,386 | AutoNation, Inc.* | 171,410 | |||||||||
| 2,796 | AutoZone, Inc.* | 371,980 | |||||||||
| 11,325 | Bed Bath & Beyond, Inc.* | 461,381 | |||||||||
| 4,090 | Belo Corp., Class A | 78,814 | |||||||||
| 2,621 | Black & Decker Corp. | 237,777 | |||||||||
| 630 | Blue Nile, Inc.* | 29,648 | |||||||||
| 2,341 | Borders Group, Inc. | 49,419 | |||||||||
| 1,064 | Brookfield Homes Corp. | 36,133 | |||||||||
| 1,007 | CBRL Group, Inc. | 44,892 | |||||||||
| 4,774 | Centex Corp. | 213,732 | |||||||||
| 3,720 | Claire's Stores, Inc. | 121,160 | |||||||||
| 19,830 | Clear Channel Communications, Inc. | 702,577 | |||||||||
| 1,450 | Columbia Sportswear Co. | 90,770 | |||||||||
| 3,453 | Corinthian Colleges, Inc.* | 47,755 | |||||||||
| 254 | CPI Corp. | 14,608 | |||||||||
| 1,701 | Cumulus Media, Inc., Class A* | 15,972 | |||||||||
| 423 | Cutter & Buck, Inc. | 5,994 | |||||||||
| 48,961 | DIRECTV Group (The), Inc.* | 1,167,229 | |||||||||
| 1,305 | Dover Downs Gaming & Entertainment, Inc. | 16,978 | |||||||||
| 152 | Duckwall-ALCO Stores, Inc.* | 5,784 | |||||||||
| 1,623 | Entercom Communications Corp., Class A | 45,022 | |||||||||
| 4,154 | Entravision Communications Corp., Class A* | 40,751 | |||||||||
| 1,932 | Furniture Brands International, Inc. | 31,067 | |||||||||
| 32,598 | Gap (The), Inc. | 585,134 | |||||||||
| 5,708 | Gentex Corp. | 101,602 | |||||||||
| 10,293 | Harley-Davidson, Inc. | 651,753 | |||||||||
| 2,981 | Harte-Hanks, Inc. | 77,804 | |||||||||
| 6,429 | Hasbro, Inc. | 203,221 | |||||||||
| 1,264 | Hibbett Sports, Inc.* | 36,846 | |||||||||
| 715 | IHOP Corp. | 42,128 | |||||||||
| 1,627 | ITT Educational Services, Inc.* | 158,161 | |||||||||
| 1,292 | Jackson Hewitt Tax Service, Inc. | 35,633 | |||||||||
| 4,336 | Jones Apparel Group, Inc. | 144,779 | |||||||||
| 3,570 | KB Home | 157,473 | |||||||||
| 1,036 | Kellwood Co. | 29,194 | |||||||||
| 12,834 | Kohl's Corp.* | 950,229 | |||||||||
| 15,440 | Marriott International, Inc., Class A | 698,042 | |||||||||
| 3,391 | Marvel Entertainment, Inc.* | 100,136 | |||||||||
| 15,766 | Mattel, Inc. | 446,178 | |||||||||
| 14,042 | McGraw-Hill (The) Cos., Inc. | 920,172 | |||||||||
| 4,392 | Mediacom Communications Corp., Class A* | 37,903 | |||||||||
| 590 | Midas, Inc.* | 12,892 | |||||||||
| 133 | Mity Enterprises, Inc.* | 2,664 | |||||||||
| 1,261 | Nautilus, Inc. | 17,414 | |||||||||
| 227 | NVR, Inc.* | 187,048 | |||||||||
| 10,982 | Office Depot, Inc.* | 369,215 | |||||||||
| 6,678 | Omnicom Group, Inc. | 699,253 | |||||||||
| 2,793 | Pacific Sunwear Of California* | 58,457 | |||||||||
| Number of Shares | Value | ||||||||||
| Common Stocks (Continued) | |||||||||||
| 1,417 | Polaris Industries, Inc. | $ | 71,601 | ||||||||
| 533 | Pre-Paid Legal Services, Inc. | 30,408 | |||||||||
| 1,392 | Progressive Gaming International Corp.* | 6,069 | |||||||||
| 3,945 | Radio One, Inc., Class D* | 27,852 | |||||||||
| 2,170 | Ruby Tuesday, Inc. | 58,069 | |||||||||
| 1,702 | Ryland Group, Inc. | 75,399 | |||||||||
| 953 | Salem Communications Corp., Class A* | 10,979 | |||||||||
| 344 | Smith & Wollensky Restaurant Group (The), Inc.* | 3,440 | |||||||||
| 2,668 | Sonic Corp.* | 59,870 | |||||||||
| 747 | Standard Motor Products, Inc. | 13,693 | |||||||||
| 2,587 | Standard-Pacific Corp. | 53,939 | |||||||||
| 437 | Stanley Furniture Co., Inc. | 9,457 | |||||||||
| 2,288 | Station Casinos, Inc. | 199,056 | |||||||||
| 4,217 | Stewart Enterprises, Inc., Class A | 31,712 | |||||||||
| 905 | Sturm Ruger & Co., Inc.* | 11,684 | |||||||||
| 3,206 | Sun-Times Media Group, Inc., Class A | 19,557 | |||||||||
| 265 | Superior Uniform Group, Inc. | 3,434 | |||||||||
| 3,353 | Tempur-Pedic International, Inc. | 87,077 | |||||||||
| 2,479 | Timberland Co., Class A* | 63,983 | |||||||||
| 151,008 | Time Warner, Inc. | 3,115,294 | |||||||||
| 9,599 | Tribune Co. | 314,847 | |||||||||
| 27,624 | Viacom, Inc., Class B* | 1,139,490 | |||||||||
| 1,677 | WCI Communities, Inc.* | 36,626 | |||||||||
| 3,142 | Weight Watchers International, Inc. | 150,785 | |||||||||
| 10,536 | Yum! Brands, Inc. | 651,757 | |||||||||
| 17,226,694 | |||||||||||
| Consumer Staples—3.2% | |||||||||||
| 15,587 | Campbell Soup Co. | 609,453 | |||||||||
| 759 | Chattem, Inc.* | 43,369 | |||||||||
| 2,243 | Energizer Holdings, Inc.* | 217,975 | |||||||||
| 8,258 | Estee Lauder (The) Cos., Inc., Class A | 424,626 | |||||||||
| 9,223 | Hershey (The) Co. | 506,896 | |||||||||
| 1,263 | Lancaster Colony Corp. | 53,336 | |||||||||
| 1,405 | Performance Food Group Co.* | 43,906 | |||||||||
| 1,072 | Ralcorp Holdings, Inc.* | 70,548 | |||||||||
| 1,970,109 | |||||||||||
| Energy—8.4% | |||||||||||
| 12,799 | Baker Hughes, Inc. | 1,028,912 | |||||||||
| 11,719 | BJ Services Co. | 335,867 | |||||||||
| 39,331 | Exxon Mobil Corp. | 3,122,094 | |||||||||
| 2,212 | Holly Corp. | 140,683 | |||||||||
| 6,256 | Patterson-UTI Energy, Inc. | 152,584 | |||||||||
| 590 | Petroleum Development Corp.* | 30,680 | |||||||||
| 4,849 | Sunoco, Inc. | 366,245 | |||||||||
| 1,204 | Universal Compression Holdings, Inc.* | 80,150 | |||||||||
| 5,257,215 | |||||||||||
| Financials—13.3% | |||||||||||
| 1,197 | Affiliated Managers Group, Inc.* | 140,803 | |||||||||
| 238 | American Bank, Inc. | 1,964 | |||||||||
| 456 | American Physicians Capital, Inc.* | 18,030 | |||||||||
See Notes to Financial Statements.
31
Schedule of Investments (Continued)
PowerShares Buyback AchieversTM Portfolio
April 30, 2007
| Number of Shares | Value | ||||||||||
| Common Stocks (Continued) | |||||||||||
| 4,693 | AmeriCredit Corp.* | $ | 118,404 | ||||||||
| 1,387 | Asset Acceptance Capital Corp.* | 25,549 | |||||||||
| 699 | Associated Estates Realty Corp. | 10,611 | |||||||||
| 4,862 | Assurant, Inc. | 279,711 | |||||||||
| 3,896 | Astoria Financial Corp. | 103,478 | |||||||||
| 748 | Beverly Hills Bancorp, Inc. | 4,989 | |||||||||
| 265 | Camden National Corp. | 10,497 | |||||||||
| 2,187 | Erie Indemnity Co., Class A | 114,927 | |||||||||
| 417 | Federal Agricultural Mortgage Corp., Class C | 11,417 | |||||||||
| 136 | First Federal Bankshares Inc. | 2,568 | |||||||||
| 1,559 | First Financial Bancorp | 23,229 | |||||||||
| 1,128 | GAMCO Investors, Inc., Class A | 51,459 | |||||||||
| 17,616 | Genworth Financial, Inc., Class A | 642,808 | |||||||||
| 13,090 | Goldman Sachs Group (The), Inc. | 2,861,604 | |||||||||
| 2,049 | Hanover Insurance Group (The), Inc. | 94,172 | |||||||||
| 976 | Housevalues, Inc.* | 4,743 | |||||||||
| 22,190 | Hudson City Bancorp, Inc. | 295,571 | |||||||||
| 7,583 | Janus Capital Group, Inc. | 189,727 | |||||||||
| 1,105 | KNBT Bancorp, Inc. | 16,586 | |||||||||
| 52 | MFB Corp. | 1,781 | |||||||||
| 3,319 | MGIC Investment Corp. | 204,484 | |||||||||
| 101 | Monarch Community Bancorp, Inc. | 1,202 | |||||||||
| 11,130 | Moody's Corp. | 735,915 | |||||||||
| 55 | North Central Bancshares, Inc. | 2,236 | |||||||||
| 3,173 | Nuveen Investments, Inc., Class A | 169,121 | |||||||||
| 214 | Oak Hill Financial, Inc. | 4,926 | |||||||||
| 1,748 | Partners Trust Financial Group, Inc. | 19,368 | |||||||||
| 738 | Piper Jaffray Cos.* | 47,092 | |||||||||
| 73 | Provident Community Bancshares, Inc. | 1,460 | |||||||||
| 2,663 | Provident Financial Services, Inc. | 45,644 | |||||||||
| 18,784 | Prudential Financial, Inc. | 1,784,479 | |||||||||
| 783 | QC Holdings, Inc. | 10,281 | |||||||||
| 143 | Team Financial, Inc. | 2,162 | |||||||||
| 3,902 | Torchmark Corp. | 266,507 | |||||||||
| 8,319,505 | |||||||||||
| Health Care—15.2% | |||||||||||
| 2,391 | Advanced Medical Optics, Inc.* | 96,668 | |||||||||
| 20,475 | Aetna, Inc. | 959,868 | |||||||||
| 402 | America Service Group, Inc.* | 6,553 | |||||||||
| 7,572 | AmerisourceBergen Corp. | 378,524 | |||||||||
| 46,645 | Amgen, Inc.* | 2,991,809 | |||||||||
| 1,781 | AMICAS, Inc.* | 5,254 | |||||||||
| 7,336 | Applera Corp. - Applied Biosystems Group | 229,177 | |||||||||
| 1,731 | Apria Healthcare Group, Inc.* | 54,942 | |||||||||
| 640 | Biosite, Inc.* | 59,200 | |||||||||
| 15,998 | Cardinal Health, Inc. | 1,119,060 | |||||||||
| 2,675 | Charles River Laboratories International, Inc.* | 126,688 | |||||||||
| 3,895 | CIGNA Corp. | 606,023 | |||||||||
| 1,120 | Conmed Corp.* | 33,958 | |||||||||
| 6,774 | Emdeon Corp.* | 109,332 | |||||||||
| 5,444 | Express Scripts, Inc.* | 520,174 | |||||||||
| Number of Shares | Value | ||||||||||
| Common Stocks (Continued) | |||||||||||
| 12,703 | Forest Laboratories, Inc.* | $ | 675,927 | ||||||||
| 7,841 | IMS Health, Inc. | 229,977 | |||||||||
| 1,881 | Invitrogen Corp.* | 123,149 | |||||||||
| 4,701 | Laboratory Corp. of America Holdings* | 371,097 | |||||||||
| 2,912 | Manor Care, Inc. | 188,960 | |||||||||
| 4,859 | PerkinElmer, Inc. | 117,588 | |||||||||
| 903 | PolyMedica Corp. | 36,517 | |||||||||
| 2,116 | Savient Pharmaceuticals, Inc.* | 24,334 | |||||||||
| 2,592 | STERIS Corp. | 66,252 | |||||||||
| 4,032 | Waters Corp.* | 239,622 | |||||||||
| 4,096 | Watson Pharmaceuticals, Inc.* | 111,821 | |||||||||
| 9,482,474 | |||||||||||
| Industrials—5.9% | |||||||||||
| 143 | Aerosonic Corp.* | 1,115 | |||||||||
| 1,169 | Albany International Corp., Class A | 44,773 | |||||||||
| 1,318 | Alliant Techsystems, Inc.* | 122,745 | |||||||||
| 1,120 | Bowne & Co., Inc. | 18,682 | |||||||||
| 1,938 | Brink's (The) Co. | 123,063 | |||||||||
| 2,664 | CBIZ, Inc.* | 18,541 | |||||||||
| 1,289 | Central Parking Corp. | 28,848 | |||||||||
| 1,861 | Con-way, Inc. | 101,666 | |||||||||
| 1,424 | Diamond Management & Technology Consultants, Inc. | 16,148 | |||||||||
| 947 | Dollar Thrifty Automotive Group* | 44,395 | |||||||||
| 2,376 | Dun & Bradstreet (The) Corp. | 214,553 | |||||||||
| 591 | Exponent, Inc.* | 12,500 | |||||||||
| 656 | GP Strategies Corp.* | 6,284 | |||||||||
| 719 | Heidrick & Struggles International, Inc.* | 33,922 | |||||||||
| 2,538 | Herman Miller, Inc. | 87,333 | |||||||||
| 1,915 | HNI Corp. | 79,932 | |||||||||
| 674 | Innovative Solutions & Support, Inc.* | 18,292 | |||||||||
| 5,711 | JB Hunt Transport Services, Inc. | 154,540 | |||||||||
| 1,031 | John H. Harland Co. | 54,231 | |||||||||
| 4,373 | Joy Global, Inc. | 221,405 | |||||||||
| 3,066 | Kansas City Southern* | 113,902 | |||||||||
| 1,972 | Knoll, Inc. | 45,790 | |||||||||
| 340 | Lawson Products | 12,155 | |||||||||
| 15,650 | Masco Corp. | 425,837 | |||||||||
| 806 | NCI Building Systems, Inc.* | 40,276 | |||||||||
| 1,346 | Nordson Corp. | 61,687 | |||||||||
| 112 | Paragon Technologies, Inc.* | 626 | |||||||||
| 214 | Preformed Line Products Co. | 9,031 | |||||||||
| 7,740 | Republic Services, Inc. | 216,178 | |||||||||
| 6,621 | Rockwell Automation, Inc. | 394,214 | |||||||||
| 2,444 | Ryder System, Inc. | 128,652 | |||||||||
| 2,262 | Spherion Corp.* | 19,340 | |||||||||
| 2,386 | SPX Corp. | 169,120 | |||||||||
| 4,992 | Textron, Inc. | 507,536 | |||||||||
| 1,611 | Toro (The) Co. | 80,953 | |||||||||
| 608 | U.S. Xpress Enterprises, Inc., Class A* | 8,707 | |||||||||
| 1,186 | United Stationers, Inc.* | 70,591 | |||||||||
| 3,707,563 | |||||||||||
See Notes to Financial Statements.
32
Schedule of Investments (Continued)
PowerShares Buyback AchieversTM Portfolio
April 30, 2007
| Number of Shares | Value | ||||||||||
| Common Stocks (Continued) | |||||||||||
| Information Technology—21.4% | |||||||||||
| 3,131 | Acxiom Corp. | $ | 70,761 | ||||||||
| 2,767 | ADTRAN, Inc. | 70,420 | |||||||||
| 1,098 | Advent Software, Inc.* | 36,849 | |||||||||
| 16,132 | Agilent Technologies, Inc.* | 554,457 | |||||||||
| 13,337 | Analog Devices, Inc. | 515,075 | |||||||||
| 55,827 | Applied Materials, Inc. | 1,072,994 | |||||||||
| 1,379 | ATMI, Inc.* | 42,652 | |||||||||
| 15,666 | BEA Systems, Inc.* | 184,702 | |||||||||
| 249 | Blonder Tongue Laboratories, Inc.* | 433 | |||||||||
| 8,152 | BMC Software, Inc.* | 263,880 | |||||||||
| 21,076 | CA, Inc. | 574,532 | |||||||||
| 1,777 | Cognex Corp. | 38,294 | |||||||||
| 6,923 | Computer Sciences Corp.* | 384,503 | |||||||||
| 12,959 | Compuware Corp.* | 127,905 | |||||||||
| 356 | Cyberoptics Corp.* | 4,678 | |||||||||
| 2,626 | Diebold, Inc. | 125,181 | |||||||||
| 2,633 | DST Systems, Inc.* | 205,506 | |||||||||
| 4,925 | EarthLink, Inc.* | 37,726 | |||||||||
| 83,890 | EMC Corp. | 1,273,449 | |||||||||
| 2,283 | Fair Isaac Corp. | 81,526 | |||||||||
| 6,774 | Fiserv, Inc.* | 360,174 | |||||||||
| 2,648 | Flir Systems, Inc.* | 107,218 | |||||||||
| 977 | Gevity HR, Inc. | 18,221 | |||||||||
| 5,419 | Intersil Corp., Class A | 161,432 | |||||||||
| 3,837 | Lexmark International, Inc., Class A* | 209,117 | |||||||||
| 3,104 | Micrel, Inc. | 38,955 | |||||||||
| 108,870 | Microsoft Corp. | 3,259,567 | |||||||||
| 496 | MicroStrategy, Inc., Class A* | 56,425 | |||||||||
| 730 | MTS Systems Corp. | 31,032 | |||||||||
| 12,529 | National Semiconductor Corp. | 329,513 | |||||||||
| 1,816 | NMS Communications Corp* | 3,269 | |||||||||
| 13,549 | Novell, Inc.* | 98,908 | |||||||||
| 5,037 | Novellus Systems, Inc.* | 163,048 | |||||||||
| 522 | Numerex Corp., Class A* | 5,873 | |||||||||
| 509 | Overland Storage, Inc.* | 1,899 | |||||||||
| 318 | Perceptron, Inc.* | 2,856 | |||||||||
| 3,632 | Polycom, Inc.* | 120,946 | |||||||||
| 1,160 | Renaissance Learning, Inc. | 14,152 | |||||||||
| 1,221 | Selectica, Inc.* | 2,418 | |||||||||
| 1,420 | Sigmatel, Inc.* | 5,467 | |||||||||
| 735 | SM&A* | 5,461 | |||||||||
| 36,951 | Symantec Corp.* | 650,338 | |||||||||
| 212 | TESSCO Technologies, Inc.* | 6,042 | |||||||||
| 57,688 | Texas Instruments, Inc. | 1,982,736 | |||||||||
| 609 | Travelzoo, Inc.* | 16,906 | |||||||||
| 1,795 | Websense, Inc.* | 44,354 | |||||||||
| 13,361,850 | |||||||||||
| Materials—2.8% | |||||||||||
| 1,078 | A. Schulman, Inc. | 24,966 | |||||||||
| 318 | AEP Industries, Inc.* | 13,534 | |||||||||
| Number of Shares | Value | ||||||||||
| Common Stocks (Continued) | |||||||||||
| 2,503 | Ashland, Inc. | $ | 150,055 | ||||||||
| 1,646 | Cleveland-Cliffs, Inc. | 114,051 | |||||||||
| 1,931 | Eagle Materials, Inc. | 86,142 | |||||||||
| 268 | Friedman Industries, Inc. | 2,640 | |||||||||
| 17,917 | International Paper Co. | 675,830 | |||||||||
| 5,311 | Pactiv Corp.* | 183,654 | |||||||||
| 3,797 | Vulcan Materials Co. | 469,575 | |||||||||
| 1,720,447 | |||||||||||
| Telecommunication Services—1.0% | |||||||||||
| 4,451 | CenturyTel, Inc. | 204,969 | |||||||||
| 11,302 | Crown Castle International Corp.* | 388,110 | |||||||||
| 3,281 | IDT Corp., Class B | 36,255 | |||||||||
| 629,334 | |||||||||||
| Utilities—1.2% | |||||||||||
| 405 | Central Vermont Public Service Corp. | 13,041 | |||||||||
| 14,021 | PG&E Corp. | 709,463 | |||||||||
| 722,504 | |||||||||||
| Total Investments (Cost $61,009,146)—100.0% | 62,397,695 | ||||||||||
| Liabilities in excess of other assets—(0.0%) | (14,555 | ) | |||||||||
| Net Assets—100.0% | $ | 62,383,140 | |||||||||
* Non-income producing security.
See Notes to Financial Statements.
33
Schedule of Investments
PowerShares Financial Preferred Portfolio
April 30, 2007
| Number of Shares | Value | ||||||||||
| Preferred Stocks—100.2% | |||||||||||
| Banks—37.2% | |||||||||||
| 92,482 | Abbey National PLC, 7.38%, Series C (United Kingdom) | $ | 2,346,268 | ||||||||
| 171,573 | Bank of America Corp., 6.20%, Series D | 4,503,791 | |||||||||
| 171,500 | Barclays Bank PLC, 6.63%, Series 2 (United Kingdom) | 4,503,590 | |||||||||
| 268,137 | HSBC Holdings PLC, 6.20%, Series A (United Kingdom) | 6,794,592 | |||||||||
| 158,092 | Royal Bank of Scotland Group PLC, 5.75%, Series L (United Kingdom) | 3,797,370 | |||||||||
| 102,171 | Royal Bank of Scotland Group PLC, 6.25%, Series P (United Kingdom) | 2,602,295 | |||||||||
| 186,207 | Royal Bank of Scotland Group PLC, 6.35%, Series N (United Kingdom) | 4,725,934 | |||||||||
| 171,896 | Royal Bank of Scotland Group PLC, 6.40%, Series M (United Kingdom) | 4,390,224 | |||||||||
| 124,514 | Royal Bank of Scotland Group PLC, 6.75%, Series Q (United Kingdom) | 3,244,835 | |||||||||
| 36,908,899 | |||||||||||
| Diversified Financial Services—20.7% | |||||||||||
| 169,903 | CIT Group, Inc., 6.35%, Series A | 4,415,779 | |||||||||
| 172,656 | Goldman Sachs Group, Inc., 6.20%, Series B | 4,430,353 | |||||||||
| 106,811 | HSBC Finance Corp., 6.36% | 2,766,405 | |||||||||
| 171,459 | Lehman Brothers Holdings, 6.50% | 4,464,792 | |||||||||
| 169,226 | Merrill Lynch & Co., Inc., 6.38%, Series 3 | 4,423,568 | |||||||||
| 20,500,897 | |||||||||||
| Insurance—42.3% | |||||||||||
| 172,775 | ACE Ltd., 7.80%, Series C (Cayman Islands) | 4,452,412 | |||||||||
| 129,291 | Aegon NV, 6.38% (Netherlands) | 3,357,687 | |||||||||
| 54,548 | Aegon NV, 6.50% (Netherlands) | 1,396,429 | |||||||||
| 170,305 | Axis Capital Holdings Ltd., 7.25%, Series A (Bermuda) | 4,419,415 | |||||||||
| 129,742 | ING Groep NV, 6.13% (Netherlands) | 3,263,011 | |||||||||
| 92,650 | ING Groep NV, 6.20% (Netherlands) | 2,329,221 | |||||||||
| 147,878 | ING Groep NV, 7.05% (Netherlands) | 3,753,144 | |||||||||
| 203,663 | ING Groep NV, 7.20% (Netherlands) | 5,179,149 | |||||||||
| 183,293 | Metlife, Inc., 6.50%, Series B | 4,824,271 | |||||||||
| 171,459 | PartnerRe Ltd., 6.75%, Series C (Bermuda) | 4,360,202 | |||||||||
| 55,991 | Prudential PLC, 6.50% (United Kingdom) | 1,439,529 | |||||||||
| 123,836 | Prudential PLC, 6.75% (United Kingdom) | 3,183,824 | |||||||||
| 41,958,294 | |||||||||||
| Total Preferred Stocks (Cost $99,862,311) | 99,368,090 | ||||||||||
Money Market Fund—0.2%
| 150,774 | Liquid Assets Portfolio Private Class* (Cost $150,774) | 150,774 | |||||||||
| Total Investments (Cost $100,013,085)—100.4% | 99,518,864 | ||||||||||
| Liabilities in excess of other assets—(0.4%) | (400,624 | ) | |||||||||
| Net Assets—100.0% | $ | 99,118,240 | |||||||||
* Affiliated investment.
COUNTRY BREAKDOWN
April 30, 2007 (Unaudited)
| Value | Net Assets | ||||||||||
| United Kingdom | $ | 37,028,461 | 37.3 | % | |||||||
| United States | 29,979,733 | 30.2 | |||||||||
| Netherlands | 19,278,641 | 19.5 | |||||||||
| Bermuda | 8,779,617 | 8.9 | |||||||||
| Cayman Islands | 4,452,412 | 4.5 | |||||||||
| Total Investments | 99,518,864 | 100.4 | |||||||||
| Liabilities in excess of other assets | (400,624 | ) | (0.4 | ) | |||||||
| Net Assets | $ | 99,118,240 | 100.0 | % | |||||||
See Notes to Financial Statements.
34
This page intentionally left blank
Statements of Assets and Liabilities
April 30, 2007
| PowerShares Dividend AchieversTM Portfolio | PowerShares High Yield Equity Dividend AchieversTM Portfolio | PowerShares High Growth Rate Dividend AchieversTM Portfolio | |||||||||||||
| ASSETS: | |||||||||||||||
| Unaffiliated investments at value | $ | 70,043,877 | $ | 439,906,608 | $ | 42,022,167 | |||||||||
| Affiliated investments at value | 27,578 | — | 6,625 | ||||||||||||
| Cash | — | — | 87,491 | ||||||||||||
| Receivables: | |||||||||||||||
| Investments sold | 3,459,752 | 29,861,348 | 883,778 | ||||||||||||
| Capital stock sold | 1,751,973 | 25,313,403 | 1,685,101 | ||||||||||||
| Dividends | 78,209 | 1,021,460 | 35,471 | ||||||||||||
| Due from Adviser | 18,281 | 30,955 | 13,694 | ||||||||||||
| Total Assets | 75,379,670 | 496,133,774 | 44,734,327 | ||||||||||||
| LIABILITIES: | |||||||||||||||
| Due to custodian | 206,594 | 1,589,382 | — | ||||||||||||
| Payables: | |||||||||||||||
| Investments purchased | 3,268,137 | 29,054,701 | 867,114 | ||||||||||||
| Capital stock purchased | 1,751,973 | 25,313,403 | 1,685,101 | ||||||||||||
| Accrued advisory fees | 22,412 | 145,476 | 13,259 | ||||||||||||
| Accrued expenses | 51,619 | 210,443 | 41,323 | ||||||||||||
| Total Liabilities | 5,300,735 | 56,313,405 | 2,606,797 | ||||||||||||
| NET ASSETS | $ | 70,078,935 | $ | 439,820,369 | $ | 42,127,530 | |||||||||
| NET ASSETS CONSIST OF: | |||||||||||||||
| Paid-in capital | $ | 64,215,859 | $ | 457,269,226 | $ | 40,262,598 | |||||||||
| Undistributed net investment income | 14,002 | — | 15,907 | ||||||||||||
| Accumulated net realized loss on investments | (131,405 | ) | (10,659,673 | ) | (259,314 | ) | |||||||||
| Net unrealized appreciation/depreciation on investments | 5,980,479 | (6,789,184 | ) | 2,108,339 | |||||||||||
| Net Assets | $ | 70,078,935 | $ | 439,820,369 | $ | 42,127,530 | |||||||||
| Shares outstanding (unlimited amount authorized, $0.01 par value) | 4,000,000 | 27,800,000 | 2,500,000 | ||||||||||||
| Net asset value | $ | 17.52 | $ | 15.82 | $ | 16.85 | |||||||||
| Unaffiliated investments at cost | $ | 64,063,398 | $ | 446,695,792 | $ | 39,913,828 | |||||||||
| Affiliated investments at cost | $ | 27,578 | $ | — | $ | 6,625 | |||||||||
See Notes to Financial Statements.
36
| PowerShares International Dividend AchieversTM Portfolio | PowerShares Buyback AchieversTM Portfolio | PowerShares Financial Preferred Portfolio | |||||||||||||
| ASSETS: | |||||||||||||||
| Unaffiliated investments at value | $ | 554,202,535 | $ | 62,397,695 | $ | 99,368,090 | |||||||||
| Affiliated investments at value | — | — | 150,774 | ||||||||||||
| Cash | — | 23,413 | — | ||||||||||||
| Receivables: | |||||||||||||||
| Investments sold | 43,593,623 | 2,149,676 | — | ||||||||||||
| Capital stock sold | 38,268,821 | 2,599,298 | — | ||||||||||||
| Dividends | 3,057,313 | 20,164 | 65,680 | ||||||||||||
| Due from Adviser | 42,138 | 6,079 | 2,683 | ||||||||||||
| Total Assets | 639,164,430 | 67,196,325 | 99,587,227 | ||||||||||||
| LIABILITIES: | |||||||||||||||
| Due to custodian | 230,259 | — | 369,349 | ||||||||||||
| Payables: | |||||||||||||||
| Investments purchased | 53,184,355 | 2,141,819 | — | ||||||||||||
| Capital stock purchased | 32,186,182 | 2,599,298 | — | ||||||||||||
| Accrued advisory fees | 169,439 | 23,643 | 38,305 | ||||||||||||
| Accrued expenses | 194,200 | 48,425 | 61,333 | ||||||||||||
| Total Liabilities | 85,964,435 | 4,813,185 | 468,987 | ||||||||||||
| NET ASSETS | $ | 553,199,995 | $ | 62,383,140 | $ | 99,118,240 | |||||||||
| NET ASSETS CONSIST OF: | |||||||||||||||
| Paid-in capital | $ | 515,223,090 | $ | 61,295,512 | $ | 99,612,461 | |||||||||
| Undistributed net investment income | 678,573 | — | — | ||||||||||||
| Accumulated net realized loss on investments | (5,555,562 | ) | (300,921 | ) | — | ||||||||||
| Net unrealized appreciation/depreciation on investments | 42,853,894 | 1,388,549 | (494,221 | ) | |||||||||||
| Net Assets | $ | 553,199,995 | $ | 62,383,140 | $ | 99,118,240 | |||||||||
| Shares outstanding (unlimited amount authorized, $0.01 par value) | 27,500,000 | 2,400,000 | 4,000,000 | ||||||||||||
| Net asset value | $ | 20.12 | $ | 25.99 | $ | 24.78 | |||||||||
| Unaffiliated investments at cost | $ | 511,348,641 | $ | 61,009,146 | $ | 99,862,311 | |||||||||
| Affiliated investments at cost | $ | — | $ | — | $ | 150,774 | |||||||||
37
Statements of Operations
| PowerShares Dividend AchieversTM Portfolio | PowerShares High Yield Equity Dividend AchieversTM Portfolio | PowerShares High Growth Rate Dividend AchieversTM Portfolio | |||||||||||||
| Year Ended April 30, 2007 | Year Ended April 30, 2007 | Year Ended April 30, 2007 | |||||||||||||
| INVESTMENT INCOME: | |||||||||||||||
| Unaffiliated dividend income | $ | 1,161,193 | $ | 17,771,067 | $ | 829,839 | |||||||||
| Affiliated dividend income | 2,882 | 16,255 | 2,091 | ||||||||||||
| Foreign withholding taxes | (105 | ) | — | (437 | ) | ||||||||||
| Total Income | 1,163,970 | 17,787,322 | 831,493 | ||||||||||||
| EXPENSES: | |||||||||||||||
| Advisory fees | 183,332 | 1,746,064 | 134,649 | ||||||||||||
| Administration fees | 59,999 | 65,479 | 59,999 | ||||||||||||
| Accounting | 54,998 | 54,998 | 54,998 | ||||||||||||
| Licensing | 41,162 | 436,515 | 33,662 | ||||||||||||
| Printing | 22,042 | 187,884 | 14,726 | ||||||||||||
| Audit | 16,500 | 16,500 | 16,500 | ||||||||||||
| Custodian & transfer agent fees | 14,001 | 27,327 | 7,202 | ||||||||||||
| Listing fee and expenses | 10,056 | 11,060 | 10,063 | ||||||||||||
| Offering costs | 1,877 | — | 3,474 | ||||||||||||
| Trustees | 1,865 | 16,182 | 1,367 | ||||||||||||
| Registration & filings | 1,531 | — | 1,603 | ||||||||||||
| Legal | 934 | 18,225 | 1,084 | ||||||||||||
| Other expenses | 15,249 | 24,038 | 10,994 | ||||||||||||
| Total Expenses | 423,546 | 2,604,272 | 350,321 | ||||||||||||
| Expenses reimbursed to the Adviser under the Expense Agreement | — | 15,435 | — | ||||||||||||
| Less fees waived: | |||||||||||||||
| Advisory | (150,733 | ) | — | (134,649 | ) | ||||||||||
| Other fees assumed by Adviser | — | — | (9,614 | ) | |||||||||||
| Net Expenses | 272,813 | 2,619,707 | 206,058 | ||||||||||||
| Net Investment Income | 891,157 | 15,167,615 | 625,435 | ||||||||||||
| REALIZED AND UNREALIZED GAIN (LOSS) ON INVESTMENTS: | |||||||||||||||
| Net realized gain (loss) from: | |||||||||||||||
| Investments | (92,413 | ) | (4,614,514 | ) | (207,727 | ) | |||||||||
| In-kind redemptions | 945,228 | 26,581,454 | 1,356,887 | ||||||||||||
| Net realized gain | 852,815 | 21,966,940 | 1,149,160 | ||||||||||||
| Net change in unrealized appreciation/ depreciation on investments | 4,770,653 | 594,916 | 643,486 | ||||||||||||
| Net realized and unrealized gain (loss) on investments | 5,623,468 | 22,561,856 | 1,792,646 | ||||||||||||
| Net increase in net assets resulting from operations | $ | 6,514,625 | $ | 37,729,471 | $ | 2,418,081 | |||||||||
* Commencement of Investment Operations.
See Notes to Financial Statements.
38
| PowerShares International Dividend AchieversTM Portfolio | PowerShares Buyback AchieversTM Portfolio | PowerShares Financial Preferred Portfolio | |||||||||||||
| Year Ended April 30, 2007 | For the period December 20, 2006* through April 30, 2007 | For the period December 01, 2006* through April 30, 2007 | |||||||||||||
| INVESTMENT INCOME: | |||||||||||||||
| Unaffiliated dividend income | $ | 12,518,016 | $ | 121,962 | $ | 1,230,486 | |||||||||
| Affiliated dividend income | 8,288 | — | 864 | ||||||||||||
| Foreign withholding taxes | (871,494 | ) | — | — | |||||||||||
| Total Income | 11,654,810 | 121,962 | 1,231,350 | ||||||||||||
| EXPENSES: | |||||||||||||||
| Advisory fees | 1,302,547 | 69,278 | 114,962 | ||||||||||||
| Administration fees | 63,706 | 2,078 | 3,449 | ||||||||||||
| Accounting | 54,999 | 1,386 | 2,299 | ||||||||||||
| Licensing | 325,637 | 13,856 | 22,993 | ||||||||||||
| Printing | 153,512 | 7,427 | 11,371 | ||||||||||||
| Audit | 16,500 | 12,500 | 12,500 | ||||||||||||
| Custodian & transfer agent fees | 22,282 | 4,169 | 2,350 | ||||||||||||
| Listing fee and expenses | 10,388 | 10,000 | 10,001 | ||||||||||||
| Offering costs | 8,591 | 3,887 | 4,237 | ||||||||||||
| Trustees | 13,306 | 586 | 869 | ||||||||||||
| Registration & filings | 9,616 | 1,490 | 2,462 | ||||||||||||
| Legal | 13,218 | 5,000 | 5,000 | ||||||||||||
| Other expenses | 17,158 | 12,359 | 12,234 | ||||||||||||
| Total Expenses | 2,011,460 | 144,016 | 204,727 | ||||||||||||
| Expenses reimbursed to the Adviser under the Expense Agreement | — | — | — | ||||||||||||
| Less fees waived: | |||||||||||||||
| Advisory | (48,441 | ) | (42,482 | ) | (39,008 | ) | |||||||||
| Other fees assumed by Adviser | — | — | — | ||||||||||||
| Net Expenses | 1,963,019 | 101,534 | 165,719 | ||||||||||||
| Net Investment Income | 9,691,791 | 20,428 | 1,065,631 | ||||||||||||
| REALIZED AND UNREALIZED GAIN (LOSS) ON INVESTMENTS: | |||||||||||||||
| Net realized gain (loss) from: | |||||||||||||||
| Investments | (5,371,094 | ) | (300,921 | ) | — | ||||||||||
| In-kind redemptions | 36,316,615 | 703,967 | 38,292 | ||||||||||||
| Net realized gain | 30,945,521 | 403,046 | 38,292 | ||||||||||||
| Net change in unrealized appreciation/ depreciation on investments | 34,368,081 | 1,388,549 | (494,221 | ) | |||||||||||
| Net realized and unrealized gain (loss) on investments | 65,313,602 | 1,791,595 | (455,929 | ) | |||||||||||
| Net increase in net assets resulting from operations | $ | 75,005,393 | $ | 1,812,023 | $ | 609,702 | |||||||||
39
Statements of Changes in Net Assets
| PowerShares Dividend AchieversTM Portfolio | PowerShares High Yield Equity Dividend AchieversTM Portfolio | PowerShares High Growth Rate Dividend AchieversTM Portfolio | |||||||||||||||||||||||||
| For the year ended April 30, 2007 | For the period September 15, 2005* through April 30, 2006 | For the year ended April 30, 2007 | For the year ended April 30, 2006 | For the year ended April 30, 2007 | For the period September 15, 2005* through April 30, 2006 | ||||||||||||||||||||||
| OPERATIONS: | |||||||||||||||||||||||||||
| Net investment income | $ | 891,157 | $ | 290,043 | $ | 15,167,615 | $ | 15,812,670 | $ | 625,435 | $ | 275,802 | |||||||||||||||
| Net realized gain on investments | 852,815 | 187,718 | 21,966,940 | 11,949,376 | 1,149,160 | 894,796 | |||||||||||||||||||||
| Net change in unrealized appreciation/ depreciation on investments | 4,770,653 | 1,209,826 | 594,916 | 955,503 | 643,486 | 1,464,853 | |||||||||||||||||||||
| Net increase in net assets resulting from operations | 6,514,625 | 1,687,587 | 37,729,471 | 28,717,549 | 2,418,081 | 2,635,451 | |||||||||||||||||||||
| Undistributed net investment income included in price of units issued and redeemed | 70,102 | (770 | ) | (112,827 | ) | 522,910 | 14,460 | 4,850 | |||||||||||||||||||
| DISTRIBUTIONS TO SHAREHOLDERS FROM: | |||||||||||||||||||||||||||
| Net investment income | (892,954 | ) | (272,220 | ) | (16,754,893 | ) | (14,376,272 | ) | (627,388 | ) | (257,942 | ) | |||||||||||||||
| Tax return of capital | — | — | (788,801 | ) | — | — | — | ||||||||||||||||||||
| Total distributions to shareholders | (892,954 | ) | (272,220 | ) | (17,543,694 | ) | (14,376,272 | ) | (627,388 | ) | (257,942 | ) | |||||||||||||||
| SHAREHOLDER TRANSACTIONS: | |||||||||||||||||||||||||||
| Proceeds from shares sold | 49,447,993 | 28,151,565 | 191,978,674 | 315,767,012 | 26,475,751 | 37,416,728 | |||||||||||||||||||||
| Value of shares repurchased | (8,439,931 | ) | (6,117,730 | ) | (232,033,594 | ) | (184,663,966 | ) | (13,366,288 | ) | (12,566,863 | ) | |||||||||||||||
| Net income equalization | (70,102 | ) | 770 | 112,827 | (522,910 | ) | (14,460 | ) | (4,850 | ) | |||||||||||||||||
| Net increase (decrease) in net assets resulting from share transactions | 40,937,960 | 22,034,605 | (39,942,093 | ) | 130,580,136 | 13,095,003 | 24,845,015 | ||||||||||||||||||||
| Increase (Decrease) in Net Assets | 46,629,733 | 23,449,202 | (19,869,143 | ) | 145,444,323 | 14,900,156 | 27,227,374 | ||||||||||||||||||||
| NET ASSETS: | |||||||||||||||||||||||||||
| Beginning of period | 23,449,202 | — | 459,689,512 | 314,245,189 | 27,227,374 | — | |||||||||||||||||||||
| End of period | $ | 70,078,935 | $ | 23,449,202 | $ | 439,820,369 | $ | 459,689,512 | $ | 42,127,530 | $ | 27,227,374 | |||||||||||||||
| Undistributed net investment income | $ | 14,002 | $ | 16,670 | $ | — | $ | 1,587,278 | $ | 15,907 | $ | 17,860 | |||||||||||||||
| CHANGES IN SHARES OUTSTANDING: | |||||||||||||||||||||||||||
| Shares sold | 3,000,000 | 1,900,000 | 12,000,000 | 20,900,000 | 1,600,000 | 2,500,000 | |||||||||||||||||||||
| Shares repurchased | (500,000 | ) | (400,000 | ) | (14,700,000 | ) | (12,200,000 | ) | (800,000 | ) | (800,000 | ) | |||||||||||||||
| Shares outstanding, beginning of period | 1,500,000 | — | 30,500,000 | 21,800,000 | 1,700,000 | — | |||||||||||||||||||||
| Shares outstanding, end of period | 4,000,000 | 1,500,000 | 27,800,000 | 30,500,000 | 2,500,000 | 1,700,000 | |||||||||||||||||||||
* Commencement of Investment Operations.
See Notes to Financial Statements.
40
| PowerShares International Dividend AchieversTM Portfolio | PowerShares Buyback AchieversTM Portfolio | PowerShares Financial Preferred Portfolio | |||||||||||||||||
| For the year ended April 30, 2007 | For the period September 15, 2005* through April 30, 2006 | For the period December 20, 2006* through April 30, 2007 | For the period December 01, 2006* through April 30, 2007 | ||||||||||||||||
| OPERATIONS: | |||||||||||||||||||
| Net investment income | $ | 9,691,791 | $ | 1,849,152 | $ | 20,428 | $ | 1,065,631 | |||||||||||
| Net realized gain on investments | 30,945,521 | 5,624,937 | 403,046 | 38,292 | |||||||||||||||
| Net change in unrealized appreciation/ depreciation on investments | 34,368,081 | 8,485,813 | 1,388,549 | (494,221 | ) | ||||||||||||||
| Net increase in net assets resulting from operations | 75,005,393 | 15,959,902 | 1,812,023 | 609,702 | |||||||||||||||
| Undistributed net investment income included in price of units issued and redeemed | 2,016,764 | (246,561 | ) | 19,385 | 193,038 | ||||||||||||||
| DISTRIBUTIONS TO SHAREHOLDERS FROM: | |||||||||||||||||||
| Net investment income | (9,485,475 | ) | (1,377,038 | ) | (39,938 | ) | (1,336,352 | ) | |||||||||||
| Tax return of capital | — | — | — | — | |||||||||||||||
| Total distributions to shareholders | (9,485,475 | ) | (1,377,038 | ) | (39,938 | ) | (1,336,352 | ) | |||||||||||
| SHAREHOLDER TRANSACTIONS: | |||||||||||||||||||
| Proceeds from shares sold | 518,438,866 | 211,304,049 | 78,476,709 | 104,833,729 | |||||||||||||||
| Value of shares repurchased | (201,601,419 | ) | (55,044,283 | ) | (17,865,654 | ) | (4,988,839 | ) | |||||||||||
| Net income equalization | (2,016,764 | ) | 246,561 | (19,385 | ) | (193,038 | ) | ||||||||||||
| Net increase (decrease) in net assets resulting from share transactions | 314,820,683 | 156,506,327 | 60,591,670 | 99,651,852 | |||||||||||||||
| Increase (Decrease) in Net Assets | 382,357,365 | 170,842,630 | 62,383,140 | 99,118,240 | |||||||||||||||
| NET ASSETS: | |||||||||||||||||||
| Beginning of period | 170,842,630 | — | — | — | |||||||||||||||
| End of period | $ | 553,199,995 | $ | 170,842,630 | $ | 62,383,140 | $ | 99,118,240 | |||||||||||
| Undistributed net investment income | $ | 678,573 | $ | 472,257 | $ | — | $ | — | |||||||||||
| CHANGES IN SHARES OUTSTANDING: | |||||||||||||||||||
| Shares sold | 28,200,000 | 13,500,000 | 3,100,000 | 4,200,000 | |||||||||||||||
| Shares repurchased | (10,800,000 | ) | (3,400,000 | ) | (700,000 | ) | (200,000 | ) | |||||||||||
| Shares outstanding, beginning of period | 10,100,000 | — | — | — | |||||||||||||||
| Shares outstanding, end of period | 27,500,000 | 10,100,000 | 2,400,000 | 4,000,000 | |||||||||||||||
41
Financial Highlights
PowerShares Dividend AchieversTM Portfolio
| For the year ended April 30, 2007 | For the period September 15, 2005* through April 30, 2006 | ||||||||||
| PER SHARE OPERATING PERFORMANCE: | |||||||||||
| Net asset value at beginning of period | $ | 15.63 | $ | 14.84 | |||||||
| Net investment income** | 0.32 | 0.17 | |||||||||
| Net realized and unrealized gain on investments | 1.85 | 0.78 | |||||||||
| Total from operations | 2.17 | 0.95 | |||||||||
| Undistributed net investment income included in price of units issued and redeemed** | 0.03 | — | (a) | ||||||||
| Distributions to shareholders from: | |||||||||||
| Net investment income | (0.31 | ) | (0.16 | ) | |||||||
| Net asset value at end of period | $ | 17.52 | $ | 15.63 | |||||||
| TOTAL RETURN*** | 14.26 | % | 6.45 | % | |||||||
| RATIOS/SUPPLEMENTAL DATA: | |||||||||||
| Net assets at end of period (000's omitted) | $ | 70,079 | $ | 23,449 | |||||||
| Ratio to average net assets of: | |||||||||||
| Expenses, net of waivers | 0.60 | % | 0.67 | %† | |||||||
| Expenses, prior to waivers | 0.92 | % | 1.02 | %† | |||||||
| Net investment income, net of waivers | 1.94 | % | 1.81 | %† | |||||||
| Portfolio turnover rate †† | 9 | % | 8 | % | |||||||
PowerShares High Yield Equity Dividend AchieversTM Portfolio
| For the year ended April 30, 2007 | For the year ended April 30, 2006 | For the period December 9, 2004* through April 30, 2005 | |||||||||||||
| PER SHARE OPERATING PERFORMANCE: | |||||||||||||||
| Net asset value at beginning of period | $ | 15.07 | $ | 14.41 | $ | 14.79 | |||||||||
| Net investment income** | 0.54 | 0.53 | 0.18 | ||||||||||||
| Net realized and unrealized gain (loss) on investments | 0.84 | 0.59 | (0.39 | ) | |||||||||||
| Total from operations | 1.38 | 1.12 | (0.21 | ) | |||||||||||
| Undistributed net investment income included in price of units issued and redeemed** | — | (a) | 0.02 | — | |||||||||||
| Distributions to shareholders from: | |||||||||||||||
| Net investment income | (0.60 | ) | (0.48 | ) | (0.17 | ) | |||||||||
| Tax return of capital | (0.03 | ) | — | — | |||||||||||
| Total distributions | (0.63 | ) | (0.48 | ) | (0.17 | ) | |||||||||
| Net asset value at end of period | $ | 15.82 | $ | 15.07 | $ | 14.41 | |||||||||
| TOTAL RETURN*** | 9.28 | % | 7.92 | % | (1.44 | )% | |||||||||
| RATIOS/SUPPLEMENTAL DATA: | |||||||||||||||
| Net assets at end of period (000's omitted) | $ | 439,820 | $ | 459,690 | $ | 314,245 | |||||||||
| Ratio to average net assets of: | |||||||||||||||
| Expenses, net of waivers and reimbursements | 0.60 | % | 0.61 | % | 0.60 | %† | |||||||||
| Expenses, prior to waivers and reimbursements | 0.60 | %††† | 0.65 | % | 0.66 | %† | |||||||||
| Net investment income, net of waivers and reimbursements | 3.47 | % | 3.49 | % | 3.57 | %† | |||||||||
| Portfolio turnover rate †† | 20 | % | 9 | % | 21 | % | |||||||||
* Commencement of Investment Operations.
** Based on average shares outstanding.
*** Total investment return is calculated assuming an initial investment made at the net asset value at the beginning of the period, reinvestment of all dividends and distributions at net asset value during the period, and redemption on the last day of the period. Total investment return calculated for a period of less than one year is not annualized.
† Annualized.
†† Portfolio turnover is not annualized and does not include securities received or delivered from processing creations or redemptions.
††† These expenses, prior to waivers, exclude amounts reimbursed to the Adviser under the Expense Agreement of 0.02% for the year ended April 30, 2007.
(a) Amount represents less than $0.01.
See Notes to Financial Statements.
42
Financial Highlights (Continued)
PowerShares High Growth Rate Dividend AchieversTM Portfolio
| For the year ended April 30, 2007 | For the period September 15, 2005* through April 30, 2006 | ||||||||||
| PER SHARE OPERATING PERFORMANCE: | |||||||||||
| Net asset value at beginning of period | $ | 16.02 | $ | 14.78 | |||||||
| Net investment income** | 0.30 | 0.15 | |||||||||
| Net realized and unrealized gain on investments | 0.82 | 1.24 | |||||||||
| Total from operations | 1.12 | 1.39 | |||||||||
| Undistributed net investment income included in price of units issued and redeemed** | 0.01 | — | (a) | ||||||||
| Distributions to shareholders from: | |||||||||||
| Net investment income | (0.30 | ) | (0.15 | ) | |||||||
| Net asset value at end of period | 16.85 | $ | 16.02 | ||||||||
| TOTAL RETURN*** | 7.11 | % | 9.39 | % | |||||||
| RATIOS/SUPPLEMENTAL DATA: | |||||||||||
| Net assets at end of period (000's omitted) | $ | 42,128 | $ | 27,227 | |||||||
| Ratio to average net assets of: | |||||||||||
| Expenses, net of waivers | 0.61 | % | 0.66 | %† | |||||||
| Expenses, prior to waivers | 1.04 | % | 1.00 | %† | |||||||
| Net investment income, net of waivers | 1.86 | % | 1.59 | %† | |||||||
| Portfolio turnover rate †† | 12 | % | 20 | % | |||||||
PowerShares International Dividend AchieversTM Portfolio
| For the year ended April 30, 2007 | For the period September 15, 2005* through April 30, 2006 | ||||||||||
| PER SHARE OPERATING PERFORMANCE: | |||||||||||
| Net asset value at beginning of period | $ | 16.92 | $ | 14.96 | |||||||
| Net investment income** | 0.53 | 0.28 | |||||||||
| Net realized and unrealized gain on investments | 3.09 | 1.84 | |||||||||
| Total from operations | 3.62 | 2.12 | |||||||||
| Undistributed net investment income included in price of units issued and redeemed** | 0.11 | 0.04 | |||||||||
| Distributions to shareholders from: | |||||||||||
| Net investment income | (0.53 | ) | (0.20 | ) | |||||||
| Net asset value at end of period | 20.12 | $ | 16.92 | ||||||||
| TOTAL RETURN*** | 22.56 | % | 14.50 | % | |||||||
| RATIOS/SUPPLEMENTAL DATA: | |||||||||||
| Net assets at end of period (000's omitted) | $ | 553,200 | $ | 170,843 | |||||||
| Ratio to average net assets of: | |||||||||||
| Expenses, net of waivers | 0.60 | % | 0.62 | %† | |||||||
| Expenses, prior to waivers | 0.62 | %††† | 0.69 | %† | |||||||
| Net investment income, net of waivers | 2.98 | % | 3.06 | %† | |||||||
| Portfolio turnover rate †† | 22 | % | 8 | % | |||||||
* Commencement of Investment Operations.
** Based on average shares outstanding.
*** Total investment return is calculated assuming an initial investment made at the net asset value at the beginning of the period, reinvestment of all dividends and distributions at net asset value during the period, and redemption on the last day of the period. Total investment return calculated for a period of less than one year is not annualized.
† Annualized.
†† Portfolio turnover is not annualized and does not include securities received or delivered from processing creations or redemptions.
††† These expenses, prior to waivers, exclude amounts reimbursed to the Adviser under the Expense Agreement of 0.02% for the year ended April 30, 2007.
(a) Amount represents less than $0.01.
See Notes to Financial Statements.
43
Financial Highlights (Continued)
PowerShares Buyback AchieversTM Portfolio
| For the period December 20, 2006* through April 30, 2007 | |||||||
| PER SHARE OPERATING PERFORMANCE: | |||||||
| Net asset value at beginning of period | $ | 24.98 | |||||
| Net investment income** | 0.01 | ||||||
| Net realized and unrealized gain on investments | 1.01 | ||||||
| Total from operations | 1.02 | ||||||
| Undistributed net investment income included in price of units issued and redeemed** | 0.01 | ||||||
| Distributions to shareholders from: | |||||||
| Net investment income | (0.02 | ) | |||||
| Net asset value at end of period | 25.99 | ||||||
| TOTAL RETURN*** | 4.13 | % | |||||
| RATIOS/SUPPLEMENTAL DATA: | |||||||
| Net assets at end of period (000's omitted) | $ | 62,383 | |||||
| Ratio to average net assets of: | |||||||
| Expenses, net of waivers | 0.73 | %† | |||||
| Expenses, prior to waivers | 1.04 | %† | |||||
| Net investment income, net of waivers | 0.15 | %† | |||||
| Portfolio turnover rate †† | 38 | % | |||||
PowerShares Financial Preferred Portfolio
| For the period December 1, 2006* through April 30, 2007 | |||||||
| PER SHARE OPERATING PERFORMANCE: | |||||||
| Net asset value at beginning of period | $ | 25.12 | |||||
| Net investment income** | 0.41 | ||||||
| Net realized and unrealized loss on investments | (0.19 | ) | |||||
| Total from operations | 0.22 | ||||||
| Undistributed net investment income included in price of units issued and redeemed** | 0.07 | ||||||
| Distributions to shareholders from: | |||||||
| Net investment income | (0.63 | ) | |||||
| Net asset value at end of period | 24.78 | ||||||
| TOTAL RETURN*** | 1.18 | % | |||||
| RATIOS/SUPPLEMENTAL DATA: | |||||||
| Net assets at end of period (000's omitted) | $ | 99,118 | |||||
| Ratio to average net assets of: | |||||||
| Expenses, net of waivers | 0.72 | %† | |||||
| Expenses, prior to waivers | 0.89 | %† | |||||
| Net investment income, net of waivers | 4.63 | %† | |||||
| Portfolio turnover rate †† | 0 | % | |||||
* Commencement of Investment Operations.
** Based on average shares outstanding.
*** Total investment return is calculated assuming an initial investment made at the net asset value at the beginning of the period, reinvestment of all dividends and distributions at net asset value during the period, and redemption on the last day of the period. Total investment return calculated for a period of less than one year is not annualized.
† Annualized.
†† Portfolio turnover is not annualized and does not include securities received or delivered from processing creations or redemptions.
See Notes to Financial Statements.
44
Notes to Financial Statements
PowerShares Exchange-Traded Fund Trust
April 30, 2007
Note 1. Organization
PowerShares Exchange-Traded Fund Trust (the "Trust"), which is registered under the Investment Company Act of 1940, as amended (the "1940 Act"), is an exchange-traded, management investment company that was organized as a Massachusetts business trust on June 9, 2000. The Trust currently consists of seventy portfolios. This report includes the following portfolios:
| PowerShares Dividend AchieversTM Portfolio | "Dividend AchieversTM Portfolio" | ||||||
| PowerShares High Yield Equity Dividend AchieversTM Portfolio | "High Yield Equity Dividend AchieversTM Portfolio" | ||||||
| PowerShares High Growth Rate Dividend AchieversTM Portfolio | "High Growth Rate Dividend AchieversTM Portfolio" | ||||||
| PowerShares International Dividend AchieversTM Portfolio | "International Dividend AchieversTM Portfolio" | ||||||
| PowerShares Buyback AchieversTM Portfolio | "Buyback AchieversTM Portfolio" | ||||||
| PowerShares Financial Preferred Portfolio | "Financial Preferred Portfolio" | ||||||
Buyback AchieversTM Portfolio commenced investment operations on December 20, 2006. Financial Preferred Portfolio commenced investment operations on December 1, 2006. Each portfolio represents a separate series of the Trust (the "Fund" or "Funds"). Each Fund's shares are listed and traded on the American Stock Exchange. The Funds' market prices may differ to some degree from the net asset value of the shares of each Fund. Unlike conventional mutual funds, each Fund issues and redeems shares on a continuous basis, at net asset value, only in a large specified number of shares, each called a "Creation Unit." Creation Units are issued and redeemed principally in-kind for securities included in the relevant index. Except when aggregated in Creation Units, shares are not individually redeemable securities of the Funds. The investment objective of each Fund is to seek investment results that correspond generally to the pric e and yield (before the Fund's fees and expenses) of the following equity indices:
| Fund | Index | ||||||
| Dividend AchieversTM Portfolio | Broad Dividend AchieversTM Index | ||||||
| High Yield Equity Dividend AchieversTM Portfolio | Mergent Dividend AchieversTM 50 Index | ||||||
| High Growth Rate Dividend AchieversTM Portfolio | High Growth Rate Dividend AchieversTM Index | ||||||
| International Dividend AchieversTM Portfolio | International Dividend AchieversTM Index | ||||||
| Buyback AchieversTM Portfolio | Share BuyBack AchieversTM Index | ||||||
| Financial Preferred Portfolio | Wachovia Hybrid & Preferred Securities Financial Index | ||||||
Note 2. Significant Accounting Policies
The preparation of the financial statements in accordance with accounting principles generally accepted in the United States of America requires management to make estimates and assumptions that affect the reported amounts and disclosures in the financial statements. Actual results could differ from these estimates.
A. Security Valuation
Securities are valued based on their last sale price. Price information on listed securities is taken from the exchange where the security is primarily traded. Securities regularly traded in an over-the-counter market are valued at the latest quoted sale price in such market or in the case of NASDAQ, at the NASDAQ
45
Notes to Financial Statements (Continued)
PowerShares Exchange-Traded Fund Trust
April 30, 2007
official closing price. Preferred securities for which current market quotations are readily available are valued at the closing price. Other portfolio securities and assets for which market quotations are not readily available are valued at fair value as determined in good faith by the Trust's Pricing Committee in accordance with procedures adopted by the Board of Trustees. Investments in money market mutual funds are stated at net asset value.
B. Federal Income Taxes
Each Fund intends to comply with the provisions of the Internal Revenue Code applicable to regulated investment companies and will distribute all net investment income and net taxable capital gains to its shareholders. Therefore, no provision for Federal income taxes is required.
Income and capital gain distributions are determined in accordance with Federal income tax regulations, which may differ from accounting principles generally accepted in the United States. These differences are primarily due to differing book and tax treatments for in-kind transactions, losses deferred due to wash sales, losses deferred due to post-October losses and excise tax regulations.
C. Investment Income and Investment Transactions
Dividend income is recorded on the ex-dividend date. Interest income is recorded on the accrual basis. Investment transactions are recorded on the trade date. Realized gains and losses from the sale or disposition of securities are calculated on the specific identified cost basis. Corporate actions (including cash dividends) are recorded net of nonreclaimable foreign tax withholdings on the ex-dividend date.
D. Expenses
Expenses of the Trust, which are directly identifiable to a specific Fund, are applied to that Fund. Expenses which are not readily identifiable to a specific Fund are allocated in such a manner as deemed equitable, taking into consideration the nature and type of expense and the relative net assets of each Fund.
E. Dividends and Distributions to Shareholders
Each Fund (except for the High Yield Equity Dividend AchieversTM Portfolio and Financial Preferred Portfolio, which declare and pay dividends monthly) declares and pays dividends from net investment income to its shareholders quarterly and distributes net realized taxable capital gains, if any, annually. Such distributions on a tax basis are determined in conformity with income tax regulations which may differ from accounting principles generally accepted in the United States of America. Distributions in excess of tax basis earnings and profits, if any, are reported in each Fund's financial statements as a return of capital.
F. Equalization
All Funds use the accounting practice of equalization. This accounting method is used to keep the continuing shareholder's per share equity in undistributed net investment income from being affected by the continuous sales and redemptions of capital shares. Equalization is calculated on a per share basis whereby a portion of the proceeds from the sales and cost of repurchases of capital shares is applied to undistributed net investment income. The amount of equalization is disclosed in the Statements of Changes in Net Assets as undistributed net investment income included in the price of capital shares issued or redeemed. The distributions to shareholders of amounts so applied may be deemed to be a return of capital for tax purposes to the extent that such distributions exceed taxable income.
46
Notes to Financial Statements (Continued)
PowerShares Exchange-Traded Fund Trust
April 30, 2007
Note 3. Advisory and Administration Agreements
PowerShares Capital Management LLC (the "Adviser") has overall responsibility as the Funds' investment adviser for the selection and ongoing monitoring of the Funds' investments, managing the Funds' business affairs and providing certain clerical, bookkeeping and other administrative services.
The fees paid by each Fund to the Adviser are accrued daily and are payable at 0.40% per annum on each Fund's average daily net assets except for the Buyback AchieversTM Portfolio and Financial Preferred Portfolio, which pay 0.50% per annum on the Funds' average daily net assets.
Each Fund is responsible for all of its expenses, including the investment advisory fees, costs of transfer agency, custody, fund administration, legal, audit and other services, interest, taxes, brokerage commissions and other expenses connected with executions of portfolio transactions, any distribution fees or expenses and extraordinary expenses. Pursuant to the Investment Advisory Agreement with the Trust, the Adviser has agreed to waive fees and/or pay Fund expenses to the extent necessary to prevent the operating expenses of the Funds (excluding interest expense, brokerage commissions and other trading expenses, licensing fees, offering costs, taxes and extraordinary expenses) from exceeding 0.50% (0.60% for the Buyback AchieversTM Portfolio and Financial Preferred Portfolio) of average daily net assets per year (the "Expense Cap"), at least until April 30, 2008. Offering costs excluded from the Expense Cap are: (a) legal fees pertaining to the Funds' shares offered for sale; (b) Securities and Exchange Commission and state registration fees; and (c) initial fees paid to be listed on an exchange.
For the period ended April 30, 2007, the Adviser waived and assumed the following fees and expenses:
| Fees Waived | Expenses Assumed | ||||||||||
| Dividend AchieversTM Portfolio | $ | 150,733 | $ | — | |||||||
| High Growth Rate Dividend AchieversTM Portfolio | 134,649 | 9,614 | |||||||||
| International Dividend AchieversTM Portfolio | 48,441 | — | |||||||||
| Buyback AchieversTM Portfolio | 42,482 | — | |||||||||
| Financial Preferred Portfolio | 39,008 | — | |||||||||
The Trust and the Adviser have entered into an Excess Expense Agreement (the "Expense Agreement") in which expenses borne by the Adviser are subject to reimbursement by the Fund up to three years from the date the fee or expense was incurred, but no reimbursement payment will be made by the Fund if it would result in the Fund exceeding its Expense Cap as specified above.
During the period ended April 30, 2007, the details of expense waivers and reimbursements to the Adviser under the Expense Agreement were as follows:
| Gross Waivers | Gross Reimbursements | Net (Waivers)/ Reimbursements | |||||||||||||
| High Yield Equity Dividend AchieversTM Portfolio | $ | (67,568 | ) | $ | 83,003 | $ | 15,435 | ||||||||
| International Dividend AchieversTM Portfolio | (100,872 | ) | 52,431 | (48,441 | ) | ||||||||||
The net amounts of waivers or reimbursements are also shown on the Statements of Operations.
47
Notes to Financial Statements (Continued)
PowerShares Exchange-Traded Fund Trust
April 30, 2007
The amounts subject to reimbursement to the Adviser at April 30, 2007 are as follows:
| Reimbursements available during the fiscal years ending: | |||||||||||||||
| 04/30/08 | 04/30/09 | 04/30/10 | |||||||||||||
| Dividend AchieversTM Portfolio | $ | 207,937 | $ | 207,937 | $ | 150,733 | |||||||||
| High Yield Equity Dividend AchieversTM Portfolio | 177,851 | 177,851 | 67,569 | ||||||||||||
| High Growth Rate Dividend AchieversTM Portfolio | 203,239 | 203,239 | 144,263 | ||||||||||||
| International Dividend AchieversTM Portfolio | 91,555 | 91,555 | 91,555 | ||||||||||||
| Buyback AchieversTM Portfolio | 42,482 | 42,482 | 42,482 | ||||||||||||
| Financial Preferred Portfolio | 39,008 | 39,008 | 39,008 | ||||||||||||
Distribution Agreement
Effective September 18, 2006 (or since inception, if later), A I M Distributors, Inc. (the "Distributor") serves as the distributor of Creation Units of each Fund pursuant to a Distribution Agreement between the Distributor and the Trust. The Distributor does not maintain a secondary market in shares. Prior to September 18, 2006, ALPS Distributors, Inc. served as the distributor.
The Board of Trustees of the Trust has adopted a distribution plan pursuant to Rule 12b-1 under the 1940 Act. In accordance with the Rule 12b-1 plan, each Fund is authorized to pay an amount up to a maximum annual rate of 0.25% of the average daily net assets for certain distribution-related activities. No 12b-1 fees are currently charged to the Funds, and there are no plans to impose these fees.
Licensing Fee Agreements
The Adviser has entered into licensing agreements for each Fund with the following Licensors:
| Fund | Licensor | ||||||
| Dividend AchieversTM Portfolio | Mergent, Inc. | ||||||
| High Yield Equity Dividend AchieversTM Portfolio | Mergent, Inc. | ||||||
| High Growth Rate Dividend AchieversTM Portfolio | Mergent, Inc. | ||||||
| International Dividend AchieversTM Portfolio | Mergent, Inc. | ||||||
| Buyback AchieversTM Portfolio | Mergent, Inc. | ||||||
| Financial Preferred Portfolio | Wachovia Capital Markets, LLC | ||||||
The above trademarks are owned by the respective Licensors. These trademarks have been licensed to the Adviser for use with the Funds. The Funds are not sponsored, endorsed, sold or promoted by the Licensors and the Licensors make no representation regarding the advisability of investing in any of these Funds. The Funds are required to pay the licensing fees which are shown on the Statements of Operations.
The Bank of New York serves as the administrator, custodian and fund accounting and transfer agent for each Fund.
Note 4. INVESCO Transactions and Transactions with Affiliates
On September 18, 2006, INVESCO PLC (formerly AMVESCAP PLC) and A I M Management Group, Inc., an indirect wholly-owned subsidiary of INVESCO PLC, announced that they had completed their acquisition of the Adviser (the "Acquisition"). The Board of Trustees, including a majority of the
48
Notes to Financial Statements (Continued)
PowerShares Exchange-Traded Fund Trust
April 30, 2007
independent Trustees, and shareholders of each Fund had previously approved a new advisory agreement with the Adviser that became effective on September 18, 2006.
The Funds are permitted to invest daily available cash balances in affiliated money market funds. The Funds invest in the Liquid Assets Portfolio ("LAP") of the Short-Term Investments. LAP is advised by A I M Advisors, Inc., an affiliate of the Adviser.
Note 5. Federal Income Tax
At April 30, 2007, the components of accumulated earnings/loss on a tax-basis were as follows:
| Accumulated Earnings | Net Accumulated Capital and other Gains/Losses | Unrealized Appreciation/ Depreciation | Gross Unrealized Appreciation | Gross Unrealized Depreciation | Total Accumulated Earnings/Loss | ||||||||||||||||||||||
| Dividend AchieversTM Portfolio | $ | 14,002 | $ | (7,896 | ) | $ | 5,914,488 | $ | 6,149,529 | $ | (235,041 | ) | $ | 5,920,594 | |||||||||||||
| High Yield Equity Dividend AchieversTM Portfolio | — | (9,622,631 | ) | (7,826,226 | ) | 19,632,682 | (27,458,908 | ) | (17,448,857 | ) | |||||||||||||||||
| High Growth Rate Dividend AchieversTM Portfolio | 15,907 | (17,498 | ) | 2,036,611 | 2,559,881 | (523,270 | ) | 2,035,020 | |||||||||||||||||||
| International Dividend AchieversTM Portfolio | 678,573 | (404,939 | ) | 39,756,200 | 48,849,481 | (9,093,281 | ) | 40,029,834 | |||||||||||||||||||
| Buyback AchieversTM Portfolio(1) | — | — | 1,310,718 | 2,344,182 | (1,033,464 | ) | 1,310,718 | ||||||||||||||||||||
| Financial Preferred Portfolio(1) | — | — | (494,221 | ) | 18,428 | (512,649 | ) | (494,221 | ) | ||||||||||||||||||
At April 30, 2007, the cost of investments for Federal income tax purposes was as follows:
| Dividend AchieversTM Portfolio | $ | 64,156,967 | |||||
| High Yield Equity Dividend AchieversTM Portfolio | 447,732,834 | ||||||
| High Growth Rate Dividend AchieversTM Portfolio | 39,992,181 | ||||||
| International Dividend AchieversTM Portfolio | 514,446,335 | ||||||
| Buyback AchieversTM Portfolio(1) | 61,086,977 | ||||||
| Financial Preferred Portfolio(1) | 100,013,085 | ||||||
Distributions to Shareholders:
The tax character of distributions paid during the period ended April 30, 2007 was as follows:
| Distributions paid from Ordinary Income | |||||||
| Dividend AchieversTM Portfolio | $ | 892,954 | |||||
| High Yield Equity Dividend AchieversTM Portfolio | 16,754,893 | ||||||
| High Growth Rate Dividend AchieversTM Portfolio | 627,388 | ||||||
| International Dividend AchieversTM Portfolio | 9,485,475 | ||||||
| Buyback AchieversTM Portfolio(1) | 39,938 | ||||||
| Financial Preferred Portfolio(1) | 1,336,352 | ||||||
| Distributions paid from Return of Capital | |||||||
| High Yield Equity Dividend AchieversTM Portfolio | $ | 788,801 | |||||
49
Notes to Financial Statements (Continued)
PowerShares Exchange-Traded Fund Trust
April 30, 2007
The tax character of distributions paid during the year ended April 30, 2006 was as follows:
| Distributions paid from Ordinary Income | |||||||
| Dividend AchieversTM Portfolio | $ | 272,220 | |||||
| High Yield Equity Dividend AchieversTM Portfolio | 14,376,272 | ||||||
| High Growth Rate Dividend AchieversTM Portfolio | 257,942 | ||||||
| International Dividend AchieversTM Portfolio | 1,377,038 | ||||||
At April 30, 2007, for Federal income tax purposes, the Funds have capital loss carryforwards available as shown in the table below, to the extent provided by the regulations, to offset future capital gains through the years indicated. To the extent that these loss carryforwards are used to offset future capital gains, it is probable that the capital gains so offset will not be distributed to shareholders.
| Capital Loss Available Through | Total | ||||||||||||||
| 2014 | 2015 | Amount | |||||||||||||
| Dividend AchieversTM Portfolio | $ | 7,896 | $ | — | $ | 7,896 | |||||||||
| High Yield Equity Dividend AchieversTM Portfolio | 2,613,033 | 7,009,598 | 9,622,631 | ||||||||||||
| High Growth Rate Dividend AchieversTM Portfolio | 1,847 | 15,651 | 17,498 | ||||||||||||
| International Dividend AchieversTM Portfolio | 183,478 | 221,461 | 404,939 | ||||||||||||
During the fiscal year ended April 30, 2007, the Dividend AchieversTM Portfolio utilized capital loss carryforwards of $15,673.
Capital losses incurred after October 31 ("post-October losses") within the taxable year are deemed to arise on the first business day of each Fund's next taxable year.
During the period ended April 30, 2007, the Funds incurred and will elect to defer net capital losses as follows:
| Post-October Losses | |||||||
| Dividend AchieversTM Portfolio | $ | 57,518 | |||||
| High Growth Rate Dividend AchieversTM Portfolio | 170,088 | ||||||
| International Dividend AchieversTM Portfolio | 2,052,929 | ||||||
| Buyback AchieversTM Portfolio(1) | 223,090 | ||||||
At April 30, 2007, the following reclassifications were made to the capital accounts of the Funds, to reflect permanent book/tax differences and income and gains available for distributions under income tax regulations, which are primarily due to the differences between book and tax treatment of investments in real estate investment trusts, investments in partnerships, wash sales from redemption in-kind
50
Notes to Financial Statements (Continued)
PowerShares Exchange-Traded Fund Trust
April 30, 2007
transactions, redemption in-kind transactions, return of capital and net investment losses. Net investment income, net realized gains and net assets were not affected by these changes.
Undistributed Net Investment Income (Loss) | Undistributed Capital Gains/ (Accumulated Losses) | Paid-in Capital | |||||||||||||
| Dividend AchieversTM Portfolio | $ | (70,973 | ) | $ | (941,037 | ) | $ | 1,012,010 | |||||||
| High Yield Equity Dividend AchieversTM Portfolio | 901,628 | (25,660,068 | ) | 24,758,440 | |||||||||||
| High Growth Rate Dividend AchieversTM Portfolio | (14,460 | ) | (1,344,638 | ) | 1,359,098 | ||||||||||
| International Dividend AchieversTM Portfolio | (2,016,764 | ) | (36,105,278 | ) | 38,122,042 | ||||||||||
| Buyback AchieversTM Portfolio(1) | 125 | (703,967 | ) | 703,842 | |||||||||||
| Financial Preferred Portfolio(1) | 77,683 | (38,292 | ) | (39,391 | ) | ||||||||||
Note 6. Investment Transactions
For the period ended April 30, 2007, the cost of securities purchased and proceeds from sales of securities, excluding short-term securities and in-kind transactions, were as follows:
| Purchases | Sales | ||||||||||
| Dividend AchieversTM Portfolio | $ | 4,238,564 | $ | 3,940,741 | |||||||
| High Yield Equity Dividend AchieversTM Portfolio | 88,758,184 | 85,522,073 | |||||||||
| High Growth Rate Dividend AchieversTM Portfolio | 4,310,676 | 3,941,585 | |||||||||
| International Dividend AchieversTM Portfolio | 85,583,214 | 74,149,741 | |||||||||
| Buyback AchieversTM Portfolio(1) | 15,602,159 | 15,707,780 | |||||||||
| Financial Preferred Portfolio(1) | — | 26 | |||||||||
For the period ended April 30, 2007, in-kind transactions were as follows:
| Purchases | Sales | ||||||||||
| Dividend AchieversTM Portfolio | $ | 45,801,226 | $ | 5,068,367 | |||||||
| High Yield Equity Dividend AchieversTM Portfolio | 179,240,506 | 224,781,075 | |||||||||
| High Growth Rate Dividend AchieversTM Portfolio | 22,013,238 | 9,367,644 | |||||||||
| International Dividend AchieversTM Portfolio | 504,640,396 | 198,148,637 | |||||||||
| Buyback AchieversTM Portfolio(1) | 76,623,757 | 15,912,036 | |||||||||
| Financial Preferred Portfolio(1) | 103,844,521 | 4,020,476 | |||||||||
There were no purchases or sales of U.S. government or government agency obligations for the period ended April 30, 2007. Gains on in-kind transactions are not considered taxable gains for Federal income tax purposes.
Note 7. Trustees' Fees
The Trust compensates each Trustee who is not an employee of the Adviser or its affiliates. The interested Trustee does not receive any Trustees' fees.
(1) First tax year-end will be August 31, 2007.
51
Notes to Financial Statements (Continued)
PowerShares Exchange-Traded Fund Trust
April 30, 2007
Note 8. Capital
Shares are created and redeemed by the Trust only in Creation Unit size aggregations of 100,000. Transaction fees at scheduled amounts ranging from $500 to $1,600 per Creation Unit are charged to those persons creating or redeeming Creation Units. Such transactions are generally permitted on an in-kind basis, with a balancing cash component to equate the transaction to the net asset value per unit of each Fund of the Trust on the transaction date.
Note 9. Risk of Concentration
The Buyback AchieversTM Portfolio and Financial Preferred Portfolio concentrate their investments in certain industries or companies, subjecting them to greater risk than funds that invest in a wider range of industries.
Note 10. Indemnifications
Under the Trust's organizational documents, its Officers and Trustees are indemnified against certain liabilities arising out of the performance of their duties to the Trust. Additionally, in the normal course of business, the Trust enters into contracts with service providers that contain general indemnification clauses. The Trust's maximum exposure under these arrangements is unknown, as this would involve future claims that may be made against the Trust that have not yet occurred. However, based on experience, the Trust believes the risk of loss to be remote.
Note 11. New Accounting Pronouncements
On July 13, 2006, the Financial Accounting Standards Board ("FASB") issued FASB Interpretation No. 48, Accounting for Uncertainty in Income Taxes ("FIN 48"). FIN 48 prescribes a recognition threshold and measurement attribute for the financial statement recognition and measurement for a tax position taken or expected to be taken in a tax return. FIN 48 also provides guidance on derecognition, classification, interest and penalties, accounting in interim periods, disclosure and transition. On December 22, 2006, the Securities and Exchange Commission delayed the effective date of FIN 48, which will result in adoption for the Funds as of October 31, 2007. At this time, management is currently assessing the impact of FIN 48, if any, on the Funds' financial statements.
On September 20, 2006, the FASB released Statement of Financial Accounting Standards No. 157 "Fair Value Measurement" ("FAS 157"). FAS 157 establishes an authoritative definition of fair value, sets out a framework for measuring fair value, and requires additional disclosures about fair-value measurement. The application of FAS 157 is required for fiscal years beginning after November 15, 2007 and interim periods within those fiscal years. At this time, management is currently assessing the impact of FAS 157, if any, on the Funds' financial statements and intends for the Funds to adopt FAS 157 provisions during the fiscal year ending April 30, 2009.
52
Report of Independent Registered Public Accounting Firm
To the Board of Trustees and Shareholders of PowerShares Exchange-Traded Fund Trust
In our opinion, the accompanying statements of assets and liabilities, including the portfolios of investments, and the related statements of operations and of changes in net assets and the financial highlights present fairly, in all material respects, the financial position of the portfolios indicated in Note 1 of the financial statements comprising PowerShares Exchange-Traded Fund Trust (the "Trust") at April 30, 2007, the results of each of their operations, the changes in each of their net assets and the financial highlights, for each of the periods presented, in conformity with accounting principles generally accepted in the United States of America. These financial statements and financial highlights (hereafter referred to as "financial statements") are the responsibility of the Trust's management; our responsibility is to express an opinion on these financial statements based on our audits. We conducted our audits of thes e financial statements in accordance with the standards of the Public Company Accounting Oversight Board (United States). Those standards require that we plan and perform the audits to obtain reasonable assurance about whether the financial statements are free of material misstatement. An audit includes examining, on a test basis, evidence supporting the amounts and disclosures in the financial statements, assessing the accounting principles used and significant estimates made by management, and evaluating the overall financial statement presentation. We believe that our audits, which included confirmation of securities at April 30, 2007 by correspondence with the custodian and brokers, provide a reasonable basis for our opinion.
PricewaterhouseCoopers LLP
New York, New York
June 25, 2007
53
Supplemental Information (Unaudited)
Federal Income Tax Information
The percentages of investment income (dividend income plus short-term gains, if any) qualify as follows:
| Qualified dividend income | Dividends-received deduction | ||||||||||
| PowerShares Dividend AchieversTM Portfolio | 100 | % | 100 | % | |||||||
| PowerShares High Yield Equity Dividend AchieversTM Portfolio | 100 | % | 100 | % | |||||||
| PowerShares High Growth Rate Dividend AchieversTM Portfolio | 100 | % | 100 | % | |||||||
| PowerShares International Dividend AchieversTM Portfolio | 100 | % | 0 | % | |||||||
| Buyback AchieversTM Portfolio | 100 | % | 100 | % | |||||||
| Financial Preferred Portfolio | 100 | % | 91 | % | |||||||
54
Supplemental Information (Unaudited) (Continued)
Trustees and Officers
The Trustees who are not affiliated with the Adviser or affiliates of the Adviser and executive officers of the Trust, their term of office and length of time served, their principal business occupations during the past five years, the number of portfolios in the Fund Complex overseen by each Trustee and the other directorships, if any, held by the Trustee, are shown below.
| Name, Address and Age of Management Trustees | Position(s) with Trust | Length of Time Served* | Principal Occupation(s) During Past 5 Years | Number of Portfolios in Fund Complex*** Overseen by Trustees | Other Directorships Held by Trustees | ||||||||||||||||||
| Ronn R. Bagge (49) YQA Capital Management, LLC 1755 S. Naperville Rd., Suite 100 Wheaton, IL 60187 | Trustee | Since 2003 | YQA Capital Management LLC (July 1998-Present); formerly Owner/CEO of Electronic Dynamic Balancing Co., Inc. (high-speed rotating equipment service provider) | 79 | None | ||||||||||||||||||
| Marc M. Kole (47)** c/o PowerShares Capital Management LLC 301 W. Roosevelt Road Wheaton, IL 60187 | Trustee | Since 2006 | Controller, Priority Health (September 2005-present); Interim CFO, Priority Health (July 2006-February 2007); formerly Senior Vice President of Finance, United Healthcare (health insurance) (July 2004-July 2005); Senior Vice President of Finance, Oxford Health Plans (June 2000-July 2004) | 79 | None | ||||||||||||||||||
| D. Mark McMillan (44) c/o PowerShares Capital Management LLC 301 W. Roosevelt Road Wheaton, IL 60187 | Trustee | Since 2003 | Member, Bell, Boyd & Lloyd LLC (1989- Present) | 79 | None | ||||||||||||||||||
* This is the date the Trustee began serving the Trust.
** At a Board meeting held on December 14, 2006, Marc Kole was elected to serve as Trustee of the Trust.
*** Fund Complex includes all open-end funds (including all of their Portfolios) advised by the Adviser. The Fund Complex consists of the Trust's 70 Portfolios and one other exchange-traded fund trust with 9 Portfolios advised by the Adviser.
55
Supplemental Information (Unaudited) (Continued)
Trustees and Officers (Continued)
| Name, Address and Age of Independent Trustees | Position(s) with Trust | Length of Time Served* | Principal Occupation(s) During Past 5 Years | Number of Portfolios in Fund Complex*** Overseen by Trustees | Other Directorships Held by Trustees | ||||||||||||||||||
| Philip M. Nussbaum (45) c/o PowerShares Capital Management LLC 301 W. Roosevelt Road Wheaton, IL 60187 | Trustee | Since 2003 | Chairman, Performance Trust Capital Partners (formerly Betzold, Berg, Nussbaum & Heitman, Inc.); formerly Managing Director, Communication Institute (May 2002-August 2003); Executive Vice President of Finance, Betzold, Berg, Nussbaum & Heitman, Inc. (March 1994-1999) | 79 | None | ||||||||||||||||||
| Donald H. Wilson (47)** c/o PowerShares Capital Management LLC 301 W. Roosevelt Road Wheaton, IL 60187 | Trustee | Since 2006 | Executive Vice President and Chief Financial Officer, AMCORE Financial, Inc. (bank holding company) (February 2006-present); formerly, Senior Vice President and Treasurer, Marshall & Ilsley Corp. (bank holding company) (May 1995-February 2006) | 79 | None | ||||||||||||||||||
* This is the date the Trustee began serving the Trust.
** At a Board meeting held on December 14, 2006, Donald Wilson was elected to serve as Trustee of the Trust.
*** Fund Complex includes all open-end funds (including all of their Portfolios) advised by the Adviser. The Fund Complex consists of the Trust's 70 Portfolios and one other exchange-traded fund trust with 9 Portfolios advised by the Adviser.
56
Supplemental Information (Unaudited) (Continued)
Trustees and Officers (Continued)
| Name, Address and Age of Management Trustee | Position(s) with Trust | Length of Time Served* | Principal Occupation(s) During Past 5 Years | Number of Portfolios in Fund Complex*** Overseen by Trustee | Other Directorships Held by Trustee | ||||||||||||||||||
| H. Bruce Bond (44)** PowerShares Capital Management LLC 301 W. Roosevelt Road Wheaton, IL 60187 | Chairman of the Board, Trustee and Chief Executive Officer | Since 2003 | Managing Director, PowerShares Capital Management LLC (August 2002- Present); Manager, Nuveen Investments (April 1998- August 2002) | 79 | None | ||||||||||||||||||
* This is the date the Management Trustee began serving the Trust.
** Interested person as defined in Section 2(a)(19) of the 1940 Act.
*** Fund Complex includes all open-end funds (including all of their Portfolios) advised by the Adviser. The Fund Complex consists of the Trust's 70 Portfolios and one other exchange-traded fund trust with 9 Portfolios advised by the Adviser.
57
Supplemental Information (Unaudited) (Continued)
Trustees and Officers (Continued)
| Name, Address and Age of Officers | Position(s) with Trust | Length of Time Served* | Principal Occupation(s) During Past 5 Years | ||||||||||||
| Bruce T. Duncan (52) PowerShares Capital Management LLC 301 W. Roosevelt Road Wheaton, IL 60187 | Chief Financial Officer and Treasurer | Since 2006 | Senior Vice President of Finance, PowerShares Capital Management LLC (September 2005-Present); Private Practice Attorney (2000-2005); Vice President of Investor Relations, The ServiceMaster Company (1994-2000); Vice President of Taxes, The ServiceMaster Company (1990-2000) | ||||||||||||
| Kevin R. Gustafson (41) PowerShares Capital Management LLC 301 W. Roosevelt Road Wheaton, IL 60187 | Chief Compliance Officer | Since 2004 | General Counsel and Chief Compliance Officer, PowerShares Capital Management LLC (September 2004-Present); Attorney, Nyberg & Gustafson (2001-2004); Attorney, Burke, Warren, McKay & Serritella, P.C. (1997-2000) | ||||||||||||
| Keith Ovitt (44) PowerShares Capital Management LLC 301 W. Roosevelt Road Wheaton, IL 60187 | Secretary | Since 2003 | Managing Director, PowerShares Capital Management LLC (April 2003-Present); President, Ovitech (2002-2003); Vice President of Information Systems for DFG Foods, LLC (Division of FoodBrands America/Tyson Foods) (1999-2002); Systems Manager, Nabisco Biscuit Company (1997-1999) | ||||||||||||
* This is the period for which the Officers began serving the Trust. Each Officer serves an indefinite term, until his successor is elected.
58
Board Considerations Regarding Continuation of Investment Advisory Agreement (Unaudited)
At a meeting held on April 20, 2007, the Board of Trustees of the PowerShares Exchange-Traded Fund Trust (the "Trust"), including the Independent Trustees, unanimously approved the continuation of the Investment Advisory Agreement between PowerShares Capital Management LLC (the "Adviser") and the Trust for the following series (the "Funds"):
PowerShares Dynamic Market Portfolio
PowerShares Dynamic OTC Portfolio
PowerShares Golden Dragon Halter USX China Portfolio
PowerShares High Yield Equity Dividend AchieversTM Portfolio
PowerShares WilderHill Clean Energy Portfolio
PowerShares Dynamic Large Cap Growth Portfolio
PowerShares Dynamic Large Cap Value Portfolio
PowerShares Dynamic Mid Cap Growth Portfolio
PowerShares Dynamic Mid Cap Value Portfolio
PowerShares Dynamic Small Cap Growth Portfolio
PowerShares Dynamic Small Cap Value Portfolio
PowerShares Dynamic Biotechnology & Genome Portfolio
PowerShares Dynamic Food & Beverage Portfolio
PowerShares Dynamic Leisure and Entertainment Portfolio
PowerShares Dynamic Media Portfolio
PowerShares Dynamic Networking Portfolio
PowerShares Dynamic Pharmaceuticals Portfolio
PowerShares Dynamic Semiconductors Portfolio
PowerShares Dynamic Software Portfolio
PowerShares Zacks Micro Cap Portfolio
PowerShares Aerospace & Defense Portfolio
PowerShares Dynamic Hardware & Consumer Electronics Portfolio
PowerShares Dynamic Telecommunications & Wireless Portfolio
PowerShares Value Line Timeliness Select Portfolio
PowerShares Divided AchieversTM Portfolio
PowerShares International Dividend AchieversTM Portfolio
PowerShares High Growth Rate Dividend AchieversTM Portfolio
PowerShares Zacks Small Cap Portfolio
PowerShares Dynamic Building & Construction Portfolio
PowerShares Dynamic Energy Exploration and Production Portfolio
PowerShares Dynamic Insurance Portfolio
PowerShares Dynamic Oil and Gas Services Portfolio
PowerShares Dynamic Retail Portfolio
PowerShares Dynamic Utilities Portfolio
PowerShares Lux Nanotech Portfolio
PowerShares FTSE RAFI US 1000 Portfolio
PowerShares Water Resources Portfolio
The Trustees reviewed information from the Adviser describing: (i) the nature, extent and quality of services provided, (ii) the investment performance of the Funds and the Adviser, (iii) the costs of services provided and estimated profits realized by the Adviser, (iv) the extent to which economies of scale are realized as the Funds grow, (v) whether fee levels reflect any possible economies of scale for the benefit of Fund shareholders, (vi) comparisons of services rendered and amounts paid to other registered investment companies and (vii) any benefits realized by the Adviser from its relationship with each Fund. Based on all of the information considered and the conclusions reached, the Board, including the Independent Trustees, determined to approve the continuation of the Investment Advisory Agreement for each Fund listed above. No single factor was determinative in the Board's analysis.
59
Board Considerations Regarding Continuation of Investment Advisory Agreement (Unaudited) (Continued)
Nature, Extent and Quality of Services. In evaluating the nature, extent and quality of the Adviser's services, the Trustees reviewed information concerning the functions performed by the Adviser for the Funds, information describing the Adviser's current organization, including operations assistance provided by the Adviser's new parent organization, AMVESCAP LLC, and the background and experience of the persons responsible for the day-to-day management of the Funds. The Trustees reviewed matters related to the Adviser's portfolio transaction policies and procedures. The Trustees reviewed information on the performance of the Funds and the performance of their benchmark indices. The Trustees also reviewed reports on the correlation and tracking error between the underlying index and each Fund's performance and reviewed a report of a consultant to the Adviser on correlation and tracking error. The Trustees concluded that Funds are correlated to their underlying index and that the tracking error was within a reasonable range.
The Trustees also considered the services provided by the Adviser in its oversight of the Funds' administrator, custodian and transfer agent. They noted the significant amount of time and effort that had been devoted to this oversight function.
Based on their review, the Trustees found that the nature and extent of services provided to the Funds under the Investment Advisory Agreement are appropriate and that the quality is good.
Fees, Expenses and Profitability. The Trustees reviewed and discussed the information provided by the Adviser on each Fund's expense ratio and the advisory fee, as compared to three categories of comparable funds selected by Lipper Inc., an independent source: exchange-traded index funds ("ETFs"), open-end funds and closed-end funds. The Trustees also reviewed and discussed additional information prepared by Lipper Inc. on expense ratios and advisory fees of a broader universe of ETFs and other index funds. The Adviser supplemented the information prepared by Lipper Inc. with data it compiled on expense ratios and advisory fees of newer ETFs that recently commenced operations. The Trustees noted that the annual advisory fee charged to the Funds was identical (0.50% of average net assets), except for the advisory fee for the PowerShares High Yield Equi ty Dividend AchieversTM Portfolio, the PowerShares Dividend AchieversTM Portfolio, the PowerShares High Growth Rate Dividend AchieversTM Portfolio and the PowerShares International Dividend AchieversTM Portfolio (for each of which the annual advisory fee was 0.40% of average net assets), and that the Adviser had agreed to waive the fee and/or pay expenses to the extent necessary to prevent the annual operating expenses of each Fund (excluding interest expenses, licensing fees (for all Funds other than the initial two Funds, the PowerShares Dynamic OTC Portfolio and the PowerShares Dynamic Market Portfolio), brokerage commissions and other trading expenses, taxes and extraordinary expenses) from exceeding 0.60% (0.50% for the PowerShares High Yield Equity Dividend AchieversTM Portfolio, the PowerShares Dividend AchieversTM Portfolio, the PowerShares High Growth Rate Dividend AchieversTM Portfolio and the PowerShares International Div idend AchieversTM Portfolio) at least until April 30, 2008. The Trustees noted that the Adviser does not provide investment management services to clients other than the Trust. The Trustees noted that the advisory fees were at the higher end of the ETF universe, but were generally lower than fees for open-end (non-ETF) funds and closed-end funds, and were reasonable because of the complexity of the indices, which generally require more frequent rebalancing of the portfolios, the distinguishing factors of the Funds, and the higher administrative, operational and management oversight costs for the Adviser. The Board therefore concluded that the advisory fee and expense ratio of each Fund are competitive and that the advisory fee for each Fund is reasonable and appropriate in amount in light of the quality of services provided and the expense cap in place.
60
Board Considerations Regarding Continuation of Investment Advisory Agreement (Unaudited) (Continued)
In conjunction with their review of fees, the Trustees also considered information provided by the Adviser on the revenues received by the Adviser under the Agreement, as well as the fees waived and expenses reimbursed by the Adviser for the Funds. The Trustees reviewed information provided by the Adviser on its profitability as well as any profits realized by the Adviser from its relationship to each Fund. The Trustees noted the Adviser's statement that its costs of managing the Funds generally exceeded the amount payable as management fees under the Investment Advisory Agreement, and that most of the Funds were operating in a cash loss position. The Trustees concluded that the profitability to the Adviser of the advisory services provided to the Funds is not unreasonable.
Economies of Scale and Whether Fee Levels Reflect These Economies of Scale. The Trustees reviewed the information provided by the Adviser as to the extent to which economies of scale are realized as each Fund grows and whether fee levels reflect economies of scale for the benefit of shareholders. The Trustees reviewed each Fund's asset size, expense ratio, expense limitation agreed to by the Adviser and whether the investment process produced economies of scale. The Trustees noted that certain fixed costs associated with the management of the Funds are being reduced on a per-Fund basis as additional Funds are added, and that the gradual reduction of the per-Fund cost enabled the Adviser to operate some of the Funds under the expense cap, which potentially would lower the costs to shareholders. The Trustees noted that the Excess Expense Agreement with the Trust provided that the Adviser was entitled to be reimbursed by each Fund for fees waived or expenses absorbed pursuant to the expense cap for a period of three years from the date the fee or expense was incurred, provided that no reimbursement would be made that would result in a Fund exceeding its expense cap.
The Trustees noted that the Adviser had not identified any further benefits that it derived from its relationship with the Funds, and had noted that it does not have any soft-dollar arrangements.
Based on all of the information considered and the conclusions reached, the Board, including the Independent Trustees, determined to approve the continuation of the Investment Advisory Agreement for each Fund listed above. No single factor was determinative in the Board's analysis.
61
PowerShares Leading the Intelligent ETF Revolution
PowerShares continues to offer new solutions to the complex needs demanded by advisors and investors today. PowerShares is "Leading the Intelligent ETF Revolution" providing investment advisors and investors with institutional-caliber asset management by seeking to replicate enhanced indexes in one of the more benefit-rich investment vehicles available in the marketplace today, the exchange-traded fund (ETF). Each PowerShares fund can be classified into one of three different categories based on the objective and characteristics of its underlying index: Intelligent Index, Intelligent Exposure and Intelligent Access.
For most recent portfolio performance, please visit our website at www.powershares.com
This page contains advertising materials and should not be viewed as part of the Annual Report.
62
Intelligent Index
PowerShares believes that having insight into a stock's investment merit can have a positive impact on performance. Therefore, most PowerShares ETFs are based on Intelligent Indexes, which seek to provide alpha1 by identifying stocks with the greatest investment merit. These indexes use proprietary methodologies to identify financially strong, effectively managed and attractively priced companies with strong capital appreciation potential. Because their objective is to maximize performance, Intelligent Indexes may look different from the market.
Exchange-Traded Funds
Intelligent Index
PWC - Dynamic Market
PWO - Dynamic OTC
PIQ - Dynamic MagniQuant
PJF - Dynamic Large Cap
PJG - Dynamic Mid Cap
PJM - Dynamic Small Cap
PWB - Dynamic Large Cap Growth
PWV ;- Dynamic Large Cap Value
PWJ - Dynamic Mid Cap Growth
PWP - Dynamic Mid Cap Value
PWT - Dynamic Small Cap Growth
PWY - Dynamic Small Cap Value
PGZ - Dynamic Aggressive Growth
PVM - Dynamic Deep Value
PYZ - Dynamic Basic Materials Sector ;
PEZ - Dynamic Consumer Discretionary Sector
PSL - Dynamic Consumer Staples Sector
PXI - Dynamic Energy Sector
PFI - Dynamic Financials Sector
PTH - Dynamic Healthcare Sector
PRN - Dynamic Industrials Sector
PTF - Dynamic Technology Sector
PTE - Dynamic Telecommunications & Wireless
PUI - Dynamic Utilities
PJB - Dynamic Banking
PBE - Dynamic Biotechnology & Genome
PKB - Dynamic Building & Construction
PXE - Dynamic Energy Exploration & Production
PBJ - Dynamic Food & Beverage
PHW - Dynamic Hardware & Consumer Electronics
PTJ - Dynamic Healthcare Services
PIC - Dynamic Insurance
PEJ - Dynamic Leisure and Entertainment
PBS - Dynamic Media
PXQ - Dynamic Networking
PXJ - Dynamic Oil & Gas Services
PJP - Dynamic Pharmaceuticals
PMR - Dynamic Retail
PSI - Dynamic Semiconductors
PSJ - Dynamic Software
1 Alpha is a measure of risk adjusted performance relative to a benchmark or the market.
This page contains advertising materials and should not be viewed as part of the Annual Report.
63
Intelligent Exposure
For investors looking for more market-like exposure, PowerShares offers a lineup of ETFs that seek to track indexes with an Intelligent Exposure objective. These indexes seek to provide accurate exposure to the economy, yet are constructed using more sophisticated techniques than traditional benchmark indexes, which typically use a weighting structure based on market capitalization. Under this traditional structure, market speculation can lead to significant mispricing of stocks and, therefore, suboptimal weights in the index. But indexes seeking Intelligent Exposure use a weighting structure based on company fundamentals: sales, cash flow, book value and dividends. PowerShares believes these factors paint a truer picture of a company's size and lead to more optimal index weightings.
Exchange-Traded Funds
Intelligent Exposure
PRF - FTSE RAFI US 1000
PRFZ - FTSE RAFI US 1500 Small-Mid
PRFM - FTSE RAFI Basic Materials Sector
PRFG - FTSE RAFI Consumer Goods Sector
PRFS - FTSE RAFI Consumer Services Sector
PRFE - FTSE RAFI Energy Sector
PRFF - FTSE RAFI Financials Sector
PRFH - FTSE RAFI Health Care Sector
PRFN - FTSE RAFI Industrials Sector
PRFQ - FTSE RAFI Telecom & Technology Sector
PRFU - FTSE RAFI Utilities Sector
Intelligent Access
Without targeted investment products, unique market segments such as currency or nanotech may be difficult for investors to access. These segments are the focus of indexes that promote Intelligent Access. PowerShares has a diverse lineup of ETFs based on indexes that offer exposure to specific, unique or previously uncovered market areas.
Exchange-Traded Funds
Intelligent Access
PPA - Aerospace & Defense
ADRA - BLDRS Asia 50 ADR Index Fund
ADRD - BLDRS Developed Markets 100 ADR Index Fund
ADRE - BLDRS Emerging Markets 50 ADR Index Fund
ADRU - BLDRS Europe 100 ADR Index Fund
PKW - Buyback Achievers
PZD - Cleantech
PFM - Dividend Achievers
PDP - DWA Technical Lenders
PGF - Financial Preferred
PGJ - Golden Dragon Halter USX China
PHJ - High Growth Rate Dividend Achievers
PEY - High Yield Equity Dividend Achievers
PID - International Dividend Achievers
PSP - Listed Private Equity
PXN - Lux Nanotech
QQQQ - PowerShares QQQ
PYH - Value Line Industry Rotation
PIV - Value Line Timeliness Select
PHO - Water Resources
PBW - WilderHill Clean Energy
PUW - &n bsp;WilderHill Progressive Energy
PZI - Zacks Micro Cap
PZJ - Zacks Small Cap
This page contains advertising materials and should not be viewed as part of the Annual Report.
64
PowerShares Asset Class Guide
Domestic Equity
Broad
PWC Dynamic Market
PWO Dynamic OTC
PIV Value Line Timeliness Select
PRF FTSE RAFI US 1000
PRFZ FTSE RAFI US 1500
PIQ Dynamic MagniQuant
QQQQ PowerShares QQQ
PKW Buyback Achievers
PDP DWA Technical Leaders
PVM Dynamic Deep Value
PGZ Dynamic Aggressive Growth
Style
PJF Dynamic Large Cap
PWB Dynamic Large Cap Growth
PWV Dynamic Large Cap Value
PJG Dynamic Mid Cap
PWJ Dynamic Mid Cap Growth
PWP Dynamic Mid Cap Value
PJM Dynamic Small Cap
PWT Dynamic Small Cap Growth
PWY Dynamic Small Cap Value
PZJ Zacks Small Cap
PZI Zacks Micro Cap
International/Region
Region
PPGJ Golden Dragon Halter USX China
ADRA BLDRS Asia 50 ADR Index Fund
ADRD BLDRS Developed Markets 100 ADR Index Fund
ADRE BLDRS Emerging Markets 50 ADR Index Fund
ADRU BLDRS Europe 100 ADR Index Fund
Income
PID International Dividend Achievers
Income/Dividend
PEY High Yield Equity Dividend Achievers
PHJ High Growth Rate Dividend Achievers
PFM Dividend Achievers
PGF Financial Preferred
Sector and Industry
Sector
PUI Dynamic Utilities
PYZ Dynamic Basic Materials Sector
PEZ Dynamic Consumer Discretionary Sector
PSL Dynamic Consumer Staples Sector
PXI Dynamic Energy Sector
PFI Dynamic Financial Sector
PTH Dynamic Healthcare Sector
PRN Dynamic Industrials Sector
PTF Dynamic Technology Sector
PTE Dynamic Telecommunications & Wireless
PRFG FTSE RAFI Consumer Goods Sector
PRFS FTSE RAFI Consumer Services Sector
PRFE FTSE RAFI Energy Sector
PRFF FTSE RAFI Financials Sector
PRFH FTSE RAFI Health Care Sector
PRFN FTSE RAFI Industrials Sector
PRFM FTSE RAFI Basic Materials Sector
PRFQ FTSE RAFI Telecommunications & Technology Sector
PRFU FTSE RAFI Utilities Sector
Industry
PJB Dynamic Banking Sector
PBE Dynamic Biotechnology & Genome
PKB Dynamic Building & Construction
PXE Dynamic Energy Exploration & Production
PBJ Dynamic Food & Beverage
PHW Dynamic Hardware & Consumer Electronics
PTJ Dynamic Healthcare Services Sector
PIC Dynamic Insurance
PEJ Dynamic Leisure and Entertainment
PBS Dynamic Media
PXQ Dynamic Networking
PXJ Dynamic Oil & Gas Services
PJP Dynamic Pharmaceuticals
PMR Dynamic Retail
PSI Dynamic Semiconductors
PSJ Dynamic Software
PPA Aerospace & Defense
PBW Clean Energy
PZD Cleantech
PSP Listed Private Equity
PXN Nanotech
PUW Progressive Energy
PYH Value Line Industry Rotation
PHO Water Resources
This page contains advertising materials and should not be viewed as part of the Annual Report.
65
PowerShares Risk Spectrum
Domestic Equity
More Conservative
Dynamic Deep Value
Dynamic Large Cap
Dynamic Mid Cap
Dynamic MagniQuant
Buyback Achievers
DWA Technical Leaders
Dynamic Small Cap
Dynamic Large Cap Value
FTSE RAFI US 1000
Dynamic Mid Cap Value
Dynamic Market
Dynamic Aggressive Growth
Dynamic Small Cap Value
FTSE RAFI US 1500 Small-Mid
Zacks Micro Cap
PowerShares QQQ
Dynamic Large Cap Growth
Dynamic Mid Cap Growth
Zacks Small Cap
Value Line Timeliness Select
Dynamic Small Cap Growth
Dynamic OTC
More Aggressive
International/Region
More Conservative
BLDRS Europe 100 ADR Index Fund
BLDRS Developed Markets 100 ADR Index Fund
BLDRS Asia 50 ADR Index Fund
International Dividend Achievers
BLDRS Emerging Markets 50 ADR Index Fund
Golden Dragon Halter USX China
More Aggressive
Income/Dividend
More Conservative
Financial Preferred
High Yield Equity Dividend Achievers
Dividend Achievers
High Growth Rate Dividend Achievers
More Aggressive
Sector and Industry
More Conservative
Dynamic Consumer Staples Sector
Dynamic Food & Beverage
Dynamic Banking Sector
Dynamic Financial Sector
Dynamic Utilities
Dynamic Insurance
FTSE RAFI Health Care Sector
Dynamic Healthcare Sector
FTSE RAFI Financials Sector
Dynamic Industrials Sector
Dynamic Media
Aerospace & Defense
FTSE RAFI Industrials Sector
Dynamic Pharmaceuticals
Dynamic Consumer Discretionary Sector
Dynamic Healthcare Services Sector
Dynamic Leisure and Entertainment
FTSE RAFI Consumer Goods Sector
FTSE RAFI Utilities Sector
Water Resources
FTSE RAFI Consumer Services Sector
FTSE RAFI Basic Materials Sector
Dynamic Basic Materials Sector
Dynamic Retail
FTSE RAFI Energy Sector
Dynamic Energy Sector
Dynamic Building & Construction
Value Line Industry Rotation
Dynamic Technology Sector
Progressive Energy
Dynamic Biotechnology & Genome
Dynamic Software
Nanotech
Dynamic Energy Exploration & Production
FTSE RAFI Telecommunications & Technology Sector
Dynamic Hardware & Consumer Electronics
Dynamic Telecommunications & Wireless
Dynamic Oil & Gas Services
Cleantech
Listed Private Equity
Clean Energy
Dynamic Networking
Dynamic Semiconductors
More Aggressive
This page contains advertising materials and should not be viewed as part of the Annual Report.
66
Exchange-Traded Funds
ETFs are investment funds that trade like individual stocks on all of the major exchanges, similar to shares of publicly held companies. They can be bought and sold on an exchange at any moment during market hours. Since they are listed and traded on an exchange, you can be confident that you are investing in a well-regulated market.
ETFs are one of the fastest growing investment products in the worldwide financial marketplace. As of 3.31.2007, 432 ETFs were listed in the U.S. with $433 billion in assets, up from two products with only $1 billion in assets in 1995.
ETFs seek investment results that correspond generally to the price and yield (before fees and expenses) of a listed index. While most ETFs share a similar objective, the principal investment strategies of the underlying indexes can have substantial differences. It is important to gain a clear understanding of an ETF's underlying index as the index's objective is inherently passed on to the fund shareholders by seeking to replicate the index.
Indexes
An index is a selection process or appointed committee that groups selected securities together to track their movement in aggregate. While only a few indexes are mentioned on the daily news, there are hundreds of indexes in existence today that differ from each other in diverse ways.
Broad Market
Broad market indexes are what most people think of when an index is mentioned. These indexes are designed to track the performance of the broad market.
Benchmark
Benchmark indexes are created to set a standard by which the performance or movement of individual securities and asset managers can be measured.
Exchange Composite
These indexes are designed to provide a comprehensive measure of the performance of all commons stocks listed on a particular exchange.
Sector or Industry
The aggregate financial marketplace is generally broken down into roughly ten sectors which are further dissected into many specific industries.
Style
Style indexes are created to identify groups of stocks that are either growth (companies currently experiencing appreciation or significant earnings or revenue growth) or value (companies determined to be under priced by fundamental measures) oriented.
Company Size
Market-capitalization indexes group together companies that are similar in size based on the number of outstanding shares times the share price, while fundamentally weighted indexes group together stocks of companies based on their financial fundamental valuation.
International / Country
International indexes group together stocks of companies that are affiliated by location outside of the U.S. or companies located with a specific country or region.
Income / Bond
Income indexes group stocks based on their type of income of securities, while bond indexes are designed to show the average performance of a group of debt securities.
This page contains advertising materials and should not be viewed as part of the Annual Report.
67
Specialty / Enhanced
Many other specialty indexes are created with specific investment management objectives or for customized purposes. These indexes can be created specifically with the intention to be used as the basis for an ETF. Investor targets can be met through an ETF where the index has the objective(s) of capital appreciation, risk control, income or diversification.
Benefits of PowerShares
PowerShares ETFs offer investors a low-cost, tax-efficient investment in a professionally crafted portfolio consisting of some of the best managed companies and most timely investments. See important risk factors in back.
Tax Advantaged Product Design
Taxes may be one of the most critical and overlooked factors in wealth creation over time. The ETF product structure defers some or possibly all capital gains until investors sell their shares.
Low Ownership Cost
ETFs provide lower ownership cost because of their efficient structure. PowerShares have established expense caps to make the cost of ownership clear and straightforward for investors. Ordinary brokerage commissions apply.
Flexibility, Transparency
PowerShares' ETFs offer flexibility as shares can be bought and sold throughout the day through exchange trading. Fund holdings are disclosed every day. Options based on the funds are available, possibly increasing financial management opportunities for advisors and their clients.
Near Instant Liquidity, Trades at or Close to NAV
PowerShares may be bought and sold on the exchange at any time during market hours. Although shares are not individually redeemable directly from the fund itself, authorized participants may acquire shares and tender shares for redemption, through creation unit aggregations. ETFs are not closed-end funds and trade at or near net asset values.
This page contains advertising materials and should not be viewed as part of the Annual Report.
68
PROXY VOTING POLICIES AND PROCEDURES
A description of the Funds' proxy voting policies and procedures that the Funds use to determine how to vote proxies relating to portfolio securities is available, without charge and upon request, by calling (800) 337-4246. This information is also available on the Securities and Exchange Commission's ("Commission") website at www.sec.gov.
Information regarding how the Funds voted proxies for portfolio securities, if applicable, during the most recent 12-month period ended June 30, is also available, without charge and upon request, by (i) calling (800) 337-4246; or (ii) accessing the Funds' Form N-PX on the Commission's website at www.sec.gov.
QUARTERLY PORTFOLIOS
The Funds file their complete schedules of portfolio holdings with the Commission for the first and third quarters of each fiscal year on Form N-Q. The Funds' Forms N-Q are available on the Commission's website at www.sec.gov. The Funds' Forms N-Q may also be reviewed and copied at the Commission's Public Reference Room in Washington, DC; information on the operation of the Public Reference Room may be obtained by calling (800) SEC-0330.
There are risks involved in investing in ETFs, including possible loss of money. Investing in securities of small and medium sized companies involves greater risk than is customarily associated with investing in more established companies, and investments in concentrated industry sectors involve greater risks than investments that are more diversified. PowerShares FTFs are not actively managed and are subject to risks similar to stocks, including those related to short selling and margin maintenance. PowerShares FTFs are not FDIC insured, may lose value and have no bank guarantee. PowerShares is a registered trademark of PowerShares Capital Management LLC. Past performance is not a guarantee of future results.
A I M Distributors, Inc. is the distributor of the PowerShares Exchange-Traded Fund Trust.
An investor should consider each Fund's investment objective, risks, charges and expenses carefully before investing. For more complete information about PowerShares FTFs call A I M Distributors, Inc. at (800) 337-4246 or visit our website powershares.com for a prospectus. Please read the prospectus carefully before investing.

301 W. Roosevelt Road
Wheaton, IL 60187
800.983.0903
www.powershares.com
P-PS-AR-1
2007 Annual Report to Shareholders
30 April 2007

PowerShares Aerospace & Defense Portfolio
PowerShares CleantechTM Portfolio
PowerShares Golden Dragon Halter USX China Portfolio
PowerShares Listed Private Equity Portfolio
PowerShares Lux Nanotech Portfolio
PowerShares Value Line TimelinessTM Select Portfolio
PowerShares Value Line Industry Rotation Portfolio
PowerShares Water Resources Portfolio
PowerShares WilderHill Clean Energy Portfolio
PowerShares WilderHill Progressive Energy Portfolio
PowerShares DWA Technical LeadersTM Portfolio

Table of Contents
| Shareholder Letter | 2 | ||||||
| The Market Environment | 3 | ||||||
| Manager's Analysis | 4 | ||||||
| Funds' Distribution History | 28 | ||||||
| Frequency Distribution of Discounts & Premiums | 30 | ||||||
| Fees and Expenses | 32 | ||||||
| Specialty Portfolios | |||||||
| Schedules of Investments | |||||||
| PowerShares Aerospace & Defense Portfolio | 35 | ||||||
| PowerShares CleantechTM Portfolio | 37 | ||||||
| PowerShares Golden Dragon Halter USX China Portfolio | 39 | ||||||
| PowerShares Listed Private Equity Portfolio | 41 | ||||||
| PowerShares Lux Nanotech Portfolio | 42 | ||||||
| PowerShares Value Line TimelinessTM Select Portfolio | 43 | ||||||
| PowerShares Value Line Industry Rotation Portfolio | 44 | ||||||
| PowerShares Water Resources Portfolio | 46 | ||||||
| PowerShares WilderHill Clean Energy Portfolio | 47 | ||||||
| PowerShares WilderHill Progressive Energy Portfolio | 48 | ||||||
| PowerShares DWA Technical LeadersTM Portfolio | 50 | ||||||
| Statements of Assets and Liabilities | 52 | ||||||
| Statements of Operations | 54 | ||||||
| Statements of Changes in Net Assets | 56 | ||||||
| Financial Highlights | 60 | ||||||
| Notes to Financial Statements | 66 | ||||||
| Report of Independent Registered Public Accounting Firm | 76 | ||||||
| Supplemental Information (Unaudited) | 77 | ||||||
| Information about Advisory Agreement (Unaudited) | 82 | ||||||

To My Fellow Investors,
It gives me great pleasure to report on the state of your investment(s) in PowerShares Exchange-Traded Funds and to thank you for your continued confidence in PowerShares Capital Management LLC.
Let me share with you the exciting events that have taken place at PowerShares as I look back over the past 12 months and at what the future may hold.
PowerShares has experienced significant growth over the past 12 months. We now have 70 exchange-traded funds ("ETFs") in the market, an increase of 33 funds from the 37 funds at the beginning of the fiscal year. PowerShares now offers more U.S. based equity ETFs than any other ETF sponsor. Assets under management increased almost 75%, from $6 billion to over $10 billion at April 30, 2007. This phenomenal growth demonstrates the continued strong demand for our original listings as well as the excellent reception of our new funds.
Of the new funds offered, 10 were FTSE RAFI funds, which were the first PowerShares Exchange-Traded Funds to be listed on the NASDAQ stock exchange, making PowerShares the only ETF sponsor to list ETFs on all three major U.S. exchanges: the American Stock Exchange, the NASDAQ, and the New York Stock Exchange.
PowerShares continues to be recognized as an innovator in the ETF marketplace. In 2007, our FTSE RAFI US 1000 Fund was awarded the most innovative new ETF at the Third Annual Global ETF Awards program.
Drawing on our increased resources as a member of the INVESCO family, we plan to introduce several PowerShares ETFs for international and global investing. These new funds will help to fulfill our goal of providing investors with the opportunity to invest in intelligent ETFs in marketplaces around the globe.
On behalf of PowerShares Capital Management LLC and the Board of Trustees for the PowerShares Exchanged-Traded Fund Trust, I want to thank you for your participation in the PowerShares family of exchange-traded funds. We look forward to serving you in the future.
Highest Regards,

H. Bruce Bond
President and Chairman of the Board of Trustees
PowerShares Exchange-Traded Fund Trust
2
The Market Environment
Although spikes of volatility marked the beginning and end of the reporting period, the U.S. equity marketplace provided strong results, with the S&P® 500 Index posting double digit returns of 15.24%. At the beginning of the reporting period, enthusiasm over economic expansion gave way to uncertainty over interest rates and concern that corporate profits would be difficult to sustain. But by the end of summer 2006 energy prices had cooled and investors surmised the Fed's actions had contained inflation without significant damage to ongoing corporate earnings.
Stocks resumed their upward path until late February of 2007, when Chinese regulators threatened to clamp down on local trading practices, causing global markets to retreat sharply. Global concerns, coupled with a slowing housing market domestically and the Fed's insistence that inflation posed a greater risk than a recession, amplified volatility. However, a strong job market, sustained earnings and indications that inflation would remain contained were enough to resume the rally by the end of the reporting period.
The telecom and utilities sectors posted the best results, while technology and industrial sectors lagged. Bond prices recovered moderately during the reporting period as the Fed ended its two year hike on rates in June of 2006 and a retracting housing market eased inflation concerns. With a few bumps along the way, commodity prices continued their upward march.
3
Manager's Analysis
PowerShares Aerospace & Defense Portfolio (ticker: PPA)
The PowerShares Aerospace & Defense Portfolio continues to provide investors with a means to participate in a sector that has now beaten the S&P 500® Index for seven consecutive years returning 19.33% in 2006 and is outperforming the broad market YTD in 2007 by more than 5%. During the period of this report, the fund gained 16.66%.
The period began with a decline in the Fund of nearly 10% from May to mid-August, ultimately hitting a low of $15.64 on June 13 and remaining relatively flat through mid-August when the Fund began a steady rise to the $20.19 level it reached on April 30, 2007. This run-up was only interrupted in late-February when a global sell-off due to concerns about U.S. real estate and Chinese stocks saw the Fund decline by 5%. The sell-off was short-lived and the Fund price rebounded to previous levels on April 16th.
Performance in the sector continues to be driven by several factors including government support for defense and homeland security activities along with recent U.S. successes in capturing greater market share for manufacturing commercial aircraft. With a portfolio defined by the underlying SPADE Defense Index, constituents represent a diversified offering of large, mid, and small cap companies as well as enabling the Fund to capture current and future spending in areas such as armor for vehicles and soldiers, night vision systems, border security, defense IT, and secure communications.
With the core defense budget forecast to grow through 2011 and additional appropriations anticipated to continue funding the wars in Iraq and Afghanistan, replenish and repair military systems, and develop new border security initiatives, increased funding for the sector over the next several years is anticipated. The primary risk to the sector remains politics.
Industry Breakdown (% of the Fund's
Net Assets)
| Aerospace/Defense | 49.0 | ||||||
| Miscellaneous Manufacturing | 10.6 | ||||||
| Media | 9.2 | ||||||
| Electronics | 9.2 | ||||||
| Computers | 5.8 | ||||||
| Metal/Fabricate Hardware | 4.1 | ||||||
| Telecommunications | 3.9 | ||||||
| Auto Manufacturers | 2.7 | ||||||
| Packaging & Containers | 2.5 | ||||||
| Commercial Services | 1.3 | ||||||
| Engineering & Construction | 1.2 | ||||||
| Software | 0.5 | ||||||
| Other | 0.0 | ||||||
Top Ten Fund Holdings (% of the Fund's
Net Assets)
| Security | |||||||
| Boeing Co. | 5.8 | ||||||
| Honeywell International, Inc. | 5.8 | ||||||
| United Technologies Corp. | 5.7 | ||||||
| Lockheed Martin Corp. | 5.4 | ||||||
| EchoStar Communications Corp., Class A | 4.7 | ||||||
| DIRECTV Group (The), Inc. | 4.5 | ||||||
| Raytheon Co. | 4.4 | ||||||
| General Dynamics Corp. | 4.4 | ||||||
| Northrop Grumman Corp. | 4.3 | ||||||
| Garmin Ltd. (Cayman Islands) | 4.1 | ||||||
| Total | 49.1 | ||||||
Style Allocation (%)
| Large-Cap Value | 25.4 | ||||||
| Mid-Cap Value | 20.8 | ||||||
| Mid-Cap Growth | 19.5 | ||||||
| Large-Cap Growth | 19.4 | ||||||
| Small-Cap Value | 8.9 | ||||||
| Small-Cap Growth | 6.0 | ||||||
4
Manager's Analysis (Continued)
PowerShares Aerospace & Defense Portfolio (ticker: PPA)
Growth of a $10,000 Investment Since Inception
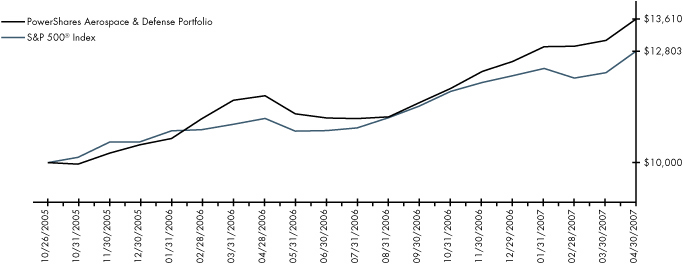
Fund Performance History (%) As of 30 April 2007
Index
| Avg Ann† | Fund Inception | ||||||||||||||
| 1 Year | Avg Ann† | Cumulative | |||||||||||||
| SPADETM Defense Index | 16.29 | 22.24 | 35.41 | ||||||||||||
| S&P 500® Index | 15.24 | 17.78 | 28.03 | ||||||||||||
| Russell 3000® Index | 14.48 | 18.02 | 28.42 | ||||||||||||
Fund
| NAV Return | 16.66 | 22.65 | 36.10 | ||||||||||||
| Share Price Return | 16.60 | 22.67 | 36.12 | ||||||||||||
Fund Inception: 26 October 2005
Performance data quoted represents past performance. Past performance is not a guarantee of future results; current performance may be higher or lower than performance quoted. Investment returns and principal value will fluctuate and shares, when redeemed, may be worth more or less than their original cost. The Share Price performance reflects fee waivers, absent which, performance would have been lower. According to the Fund's most recent Prospectus, the Fund's total gross annual operating expenses was indicated as 0.80%. In the Financial Highlights section of this Annual Report, the Fund's net (subsidized) annualized total operating expense ratio was determined to be 0.66% while the Fund's gross annualized total operating expense ratio was 0.77%. The Adviser has contractually agreed to waive fees and/or pay certain Fund expenses which resulted in a lower fee actually paid by investors. This waiver extends through April 30, 200 8. Absent reimbursements or waivers, performance would have been lower. NAV and Share Price returns assume that dividends and capital gain distributions have been reinvested in the Fund at NAV and Share Price, respectively. The returns shown in the table above do not reflect the deduction of taxes that a shareholder would pay on Fund distributions or the redemption or sale of Fund Shares. See powershares.com to find the most recent month-end performance numbers.
The index performance results are hypothetical and index returns do not represent Fund returns. An investor cannot invest directly in an index. The index does not charge management fees or brokerage expenses, and no such fees or expenses were deducted from the hypothetical performance shown nor does the index lend securities, and no revenues from securities lending were added to the performance shown. In addition, the results actual investors might have achieved would have differed from those shown because of differences in the timing, amounts of their investments, and fees and expenses associated with an investment in the Fund.
The S&P 500® Index and the Russell 3000® Index are unmanaged indices based on the average performance of approximately 500 and 3,000 common stocks, respectively.
† Average annualized.
5
Manager's Analysis
PowerShares CleantechTM Portfolio (ticker: PZD)
The PowerShares CleantechTM Portfolio is based on the CleantechTM Index and seeks investment results that correspond generally to the price and yield (before the Fund's fees and expenses) of that equity index. The index focuses on companies with products & services that are considered to be truly "clean" – hence the CleantechTM Index's minimal exposure to grain ethanol and clean-coal. The index screens for companies that have businesses based on significant technology and expertise instead of more general commodity producers, regulated utilities, and scrap recyclers. The index strives to contain the best cleantech companies that would most likely reflect the growth of the sector.
Since its October 24, 2006 inception date, the Fund has shown solid performance returning 9.64% outpacing the NASDAQ Composite Index, which returned 7.69%, and the S&P 500® Index, which returned 8.66%.
In addition to the rise of most broad equity markets, a significant factor in the strong performance was the meteoric rise of the larger solar photovoltaic ("PV") companies. Most major solar PV stocks rose 40%-200% and the winter saw four major solar PV company IPOs in the U.S. alone. In fact, three of them were from China and more Chinese PV IPOs are on the way. While the PV market is indeed frothy, demand for solar PV systems is being driven primarily by government incentive programs around the world. The performance of solar stocks is in stark contrast to many ethanol, clean-coal, and fuel-cell stocks which continue to perform poorly despite massive new government incentives for grain-based ethanol, biofuels, and clean coal.
Industry Breakdown (% of the Fund's
Net Assets)
| Miscellaneous Manufacturing | 24.5 | ||||||
| Electronics | 14.1 | ||||||
| Energy-Alternate Sources | 10.8 | ||||||
| Environmental Control | 10.1 | ||||||
| Semiconductors | 8.9 | ||||||
| Electrical Components & Equipment | 6.0 | ||||||
| Water | 3.3 | ||||||
| Hand/Machine Tools | 3.1 | ||||||
| Telecommunications | 3.0 | ||||||
| Machinery-Diversified | 3.0 | ||||||
| Chemicals | 2.9 | ||||||
| Office Funishings | 2.5 | ||||||
| Biotechnology | 2.4 | ||||||
| Engineering & Construction | 1.4 | ||||||
| Building Materials | 1.4 | ||||||
| Electric | 1.4 | ||||||
| Computers | 1.2 | ||||||
| Oil & Gas Services | 0.7 | ||||||
| Money Market | 0.0 | ||||||
| Other | (0.7 | ) | |||||
Top Ten Fund Holdings (% of the Fund's
Net Assets)
| Security | |||||||
| Cree, Inc. | 3.6 | ||||||
| Woodward Governor Co. | 3.6 | ||||||
| Veolia Environnement ADR (France) | 3.3 | ||||||
| Siemens AG ADR (Germany) | 3.3 | ||||||
| Hexcel Corp. | 3.2 | ||||||
| Nalco Holding Co. | 3.2 | ||||||
| Pall Corp. | 3.2 | ||||||
| First Solar, Inc. | 3.2 | ||||||
| Trimble Navigation Ltd. | 3.1 | ||||||
| Baldor Electric Co. | 3.1 | ||||||
| Total | 32.8 | ||||||
Style Allocation (%)
| Small-Cap Growth | 44.5 | ||||||
| Mid-Cap Growth | 26.1 | ||||||
| Small-Cap Value | 13.9 | ||||||
| Large-Cap Growth | 6.3 | ||||||
| Mid-Cap Value | 5.9 | ||||||
| Large-Cap Value | 3.3 | ||||||
6
Manager's Analysis (Continued)
PowerShares CleantechTM Portfolio (ticker: PZD)
Growth of a $10,000 Investment Since Inception
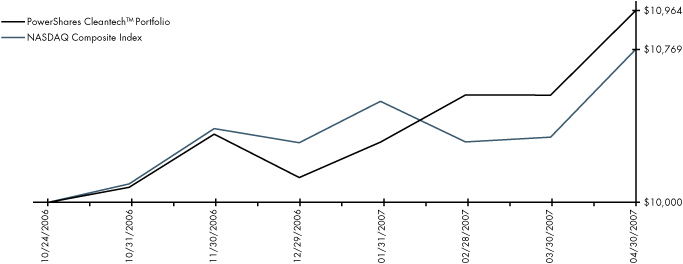
Fund Performance History (%) As of 30 April 2007
Index
| Fund Inception Cumulative | |||||||
| CleantechTM Index | 9.80 | ||||||
| NASDAQ Composite Index | 7.69 | ||||||
| S&P 500® Index | 8.66 | ||||||
Fund
| NAV Return | 9.64 | ||||||
| Share Price Return | 9.68 | ||||||
Fund Inception: 24 October 2006
Performance data quoted represents past performance. Past performance is not a guarantee of future results, current performance may be higher or lower than performance quoted. Investment returns and principal value will fluctuate and shares, when redeemed, may be worth more or less than their original cost. The Share Price performance reflects fee waivers, absent which, performance would have been lower. According to the Fund's most recent Prospectus, the Fund's total gross annual operating expenses was indicated as 0.75%. In the Financial Highlights section of this Annual Report, the Fund's net (subsidized) annualized total operating expense ratio was determined to be 0.71% while the Fund's gross annualized total operating expense ratio was 1.06%. The Adviser has contractually agreed to waive fees and/or pay certain Fund expenses which resulted in a lower fee actually paid by investors. This waiver extends through April 30, 200 8. Absent reimbursements or waivers, performance would have been lower. NAV and Share Price returns assume that dividends and capital gain distributions have been reinvested in the Fund at NAV and Share Price, respectively. The returns shown in the table above do not reflect the deduction of taxes that a shareholder would pay on Fund distributions or the redemption or sale of Fund Shares. See powershares.com to find the most recent month-end performance numbers.
The index performance results are hypothetical. Index returns do not represent Fund returns. An investor cannot invest directly in an index. The index does not charge management fees or brokerage expenses, and no such fees or expenses were deducted from the hypothetical performance shown nor does the index lend securities, and no revenues from securities lending were added to the performance shown. In addition, the results actual investors might have achieved would have differed from those shown because of differences in the timing, amounts of their investments, and fees and expenses associated with an investment in the Fund.
The NASDAQ Composite Index and the S&P 500® Index are unmanaged indices based on the average performance of approximately 3,300 and 500 common stocks, respectively.
7
Manager's Analysis
PowerShares Golden Dragon Halter USX China Portfolio (ticker: PGJ)
The PowerShares Golden Dragon Halter USX China Portfolio is based on the Halter USX China IndexSM. The Halter USX China IndexSM is comprised of companies whose common stock is publicly traded in the United States and the majority of whose business is conducted within the People's Republic of China. It was created by the Halter Financial Group in response to the unique economic opportunities taking place in China, as well as the current dynamics in the United States capital markets. While there is strong demand for Chinese equity, U.S. investors still seek and prefer the transparency offered with a U.S. listing. The listing of Chinese companies in the U.S. is a growing trend and this index is intended to provide a valuable tracking and information tool for the investment community.
Over the past year the portfolio had a solid return of 28.53% compared with the broad S&P 500® Index which returned 15.24%. Telecommunication services, financials and energy sectors led the way contributing to the strong performance. Within telecommunications, the wireless telecommunication services industry led the way via strong returns from China Mobile and China Unicom. China Life Insurance was the biggest contributor from the financials sector. The consumer staples and healthcare sectors lagged, while the semiconductor and chemical industries underperformed, contributing to some drag on performance for the year.
Sector Breakdown (% of the Fund's
Net Assets)
| Telecommunication Services | 19.1 | ||||||
| Information Technology | 18.8 | ||||||
| Energy | 18.7 | ||||||
| Industrials | 13.3 | ||||||
| Consumer Discretionary | 8.6 | ||||||
| Materials | 8.4 | ||||||
| Utilities | 4.8 | ||||||
| Financials | 4.7 | ||||||
| Health Care | 2.8 | ||||||
| Consumer Staples | 0.5 | ||||||
| Other | 0.3 | ||||||
Style Allocation (%)
| Large-Cap Growth | 30.4 | ||||||
| Small-Cap Growth | 20.9 | ||||||
| Mid-Cap Growth | 17.8 | ||||||
| Mid-Cap Value | 17.5 | ||||||
| Large-Cap Value | 8.7 | ||||||
| Small-Cap Value | 4.7 | ||||||
Top Ten Fund Holdings (% of the Fund's
Net Assets)
| Security | |||||||
| China Mobile Ltd. ADR | 5.8 | ||||||
| PetroChina Co. Ltd. ADR | 5.6 | ||||||
| Aluminum Corp. of China Ltd. ADR | 4.9 | ||||||
| Huaneng Power International, Inc. ADR | 4.8 | ||||||
| China Life Insurance Co. Ltd. ADR | 4.7 | ||||||
| China Unicom Ltd. ADR | 4.7 | ||||||
| China Petroleum and Chemical Corp. ADR | 4.5 | ||||||
| China Netcom Group Corp. Ltd. ADR | 4.5 | ||||||
| Suntech Power Holdings Co. Ltd. ADR | 4.4 | ||||||
| CNOOC Ltd. ADR | 4.4 | ||||||
| Total | 48.3 | ||||||
8
Manager's Analysis (Continued)
PowerShares Golden Dragon Halter USX China Portfolio (ticker: PGJ)
Growth of a $10,000 Investment Since Inception
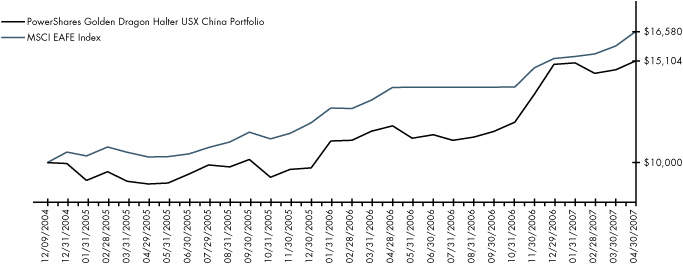
Fund Performance History (%) As of 30 April 2007
Index
| Avg Ann† | Fund Inception | ||||||||||||||
| 1 Year | Avg Ann† | Cumulative | |||||||||||||
| Halter USX China IndexSM | 29.46 | 19.71 | 53.69 | ||||||||||||
| MSCI EAFE Index | 20.32 | 23.57 | 65.80 | ||||||||||||
| S&P 500® Index | 15.24 | 11.68 | 30.21 | ||||||||||||
Fund
| NAV Return | 28.53 | 18.84 | 51.04 | ||||||||||||
| Share Price Return | 28.37 | 18.71 | 50.66 | ||||||||||||
Fund Inception: 9 December 2004
*Performance data quoted represents past performance. Past performance is not a guarantee of future results, current performance may be higher or lower than performance quoted. Investment returns and principal value will fluctuate and shares, when redeemed, may be worth more or less than their original cost. The Share Price performance reflects fee waivers, absent which, performance would have been lower. According to the Fund's most recent Prospectus, the Fund's total gross annual operating expenses was indicated as 0.88%. In the Financial Highlights section of this Annual Report, the Fund's net (subsidized) annualized total operating expense ratio was determined to be 0.70% while the Fund's gross annualized total operating expense ratio was 0.72%. The Adviser has contractually agreed to waive fees and/or pay certain Fund expenses which resulted in a lower fee actually paid by investors. This waiver extends through April 30, 20 08. Absent reimbursements or waivers, performance would have been lower. NAV and Share Price returns assume that dividends and capital gain distributions have been reinvested in the Fund at NAV and Share Price, respectively. The returns shown in the table above do not reflect the deduction of taxes that a shareholder would pay on Fund distributions or the redemption or sale of Fund Shares. See powershares.com to find the most recent month-end performance numbers.
The index performance results are hypothetical. Index returns do not represent Fund returns. An investor cannot invest directly in an index. The index does not charge management fees or brokerage expenses, and no such fees or expenses were deducted from the hypothetical performance shown nor does the index lend securities, and no revenues from securities lending were added to the performance shown. In addition, the results actual investors might have achieved would have differed from those shown because of differences in the timing, amounts of their investments, and fees and expenses associated with an investment in the Fund.
The MSCI EAFE Index and the S&P 500® Index are unmanaged indices used as a measurement of change in stock market conditions based on the average performance of approximately 1,000 and 500 common stocks, respectively.
† Average annualized.
9
Manager's Analysis
PowerShares Listed Private Equity Portfolio (ticker: PSP)
The PowerShares Listed Private Equity Portfolio is based on the Red Rocks Listed Private Equity IndexSM and seeks investment results that correspond generally to the price and yield (before the Fund's fees and expenses) of that equity index. The index was rebalanced at the end of March 2007 to reflect changes in the available companies within the domestic listed private equity universe.
The PowerShares Listed Private Equity Portfolio, and the Red Rocks Capital Listed Private Equity IndexSM that it is based on, has performed well since the Fund's inception on October 24, 2006. The index has outperformed almost all relevant indices (Dow Jones Industrials, S&P 500®, NASDAQ Composite, Russell 2000®) during this period of time. The Fund continues to be the only vehicle that provides investors with diversified access to the private equity asset class.
A current trend seems to be brand name private equity firms which continue to explore coming to market with public offerings. The consensus is that the future of listed private equity continues to remain good as the cumulative market capitalization is approaching $250 billion and represents over 200 companies worldwide.
Industry Breakdown (% of the Fund's
Net Assets)
| Investment Companies | 42.8 | ||||||
| Diversified Financial Services | 19.3 | ||||||
| REITS | 11.3 | ||||||
| Holding Companies-Diversified | 8.5 | ||||||
| Banks | 6.2 | ||||||
| Commercial Services | 6.0 | ||||||
| Internet | 5.7 | ||||||
| Money Market Fund | 0.1 | ||||||
| Other | 0.1 | ||||||
Style Allocation (%)
| Mid-Cap Value | 33.3 | ||||||
| Small-Cap Value | 27.5 | ||||||
| Mid-Cap Growth | 27.3 | ||||||
| Small-Cap Growth | 11.9 | ||||||
Top Ten Fund Holdings (% of the Fund's
Net Assets)
| Security | |||||||
| American Capital Strategies Ltd. | 9.2 | ||||||
| Fortress Investment Group LLC, Class A | 8.6 | ||||||
| Leucadia National Corp. | 8.5 | ||||||
| CapitalSource, Inc. | 6.7 | ||||||
| Allied Capital Corp. | 6.4 | ||||||
| SVB Financial Group | 6.2 | ||||||
| CIT Group, Inc. | 4.8 | ||||||
| Apollo Investment Corp. | 4.8 | ||||||
| Macquarie Infrastructure Co. Trust | 4.7 | ||||||
| KKR Financial Holdings LLC | 4.6 | ||||||
| Total | 64.5 | ||||||
10
Manager's Analysis (Continued)
PowerShares Listed Private Equity Portfolio (ticker: PSP)
Growth of a $10,000 Investment Since Inception
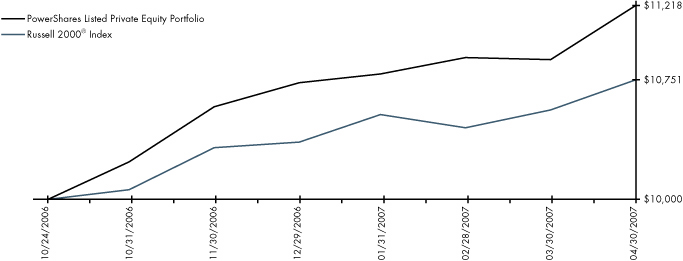
Fund Performance History (%) As of 30 April 2007
Index
| Fund Inception Cumulative | |||||||
| Red Rocks Listed Private Equity Index | 13.47 | ||||||
| S&P 500 Pure Growth Index | 14.93 | ||||||
| Russell 2000® Index | 7.51 | ||||||
Fund
| NAV Return | 12.18 | ||||||
| Share Price Return | 12.16 | ||||||
Fund Inception: 24 October 2006
Performance data quoted represents past performance. Past performance is not a guarantee of future results, current performance may be higher or lower than performance quoted. Investment returns and principal value will fluctuate and shares, when redeemed, may be worth more or less than their original cost. The Share Price performance reflects fee waivers, absent which, performance would have been lower. According to the Fund's most recent Prospectus, the Fund's total gross annual operating expenses was indicated as 0.75%. In the Financial Highlights section of this Annual Report, the Fund's net (subsidized) annualized total operating expense ratio was determined to be 0.71% while the Fund's gross annualized total operating expense ratio was 0.82%. The Adviser has contractually agreed to waive fees and/or pay certain Fund expenses which resulted in a lower fee actually paid by investors. This waiver extends through April 30, 200 8. Absent reimbursements or waivers, performance would have been lower. NAV and Share Price returns assume that dividends and capital gain distributions have been reinvested in the Fund at NAV and Share Price, respectively. The returns shown in the table above do not reflect the deduction of taxes that a shareholder would pay on Fund distributions or the redemption or sale of Fund Shares. See powershares.com to find the most recent month-end performance numbers.
The index performance results are hypothetical. Index returns do not represent Fund returns. An investor cannot invest directly in an index. The index does not charge management fees or brokerage expenses, and no such fees or expenses were deducted from the hypothetical performance shown nor does the index lend securities, and no revenues from securities lending were added to the performance shown. In addition, the results actual investors might have achieved would have differed from those shown because of differences in the timing, amounts of their investments, and fees and expenses associated with an investment in the Fund.
The S&P 500 Pure Growth Index and the Russell 2000® Index are unmanaged indices used as a measurement of change in stock market conditions based on the average performance of approximately 151 and 2,000 common stocks, respectively.
11
Manager's Analysis
PowerShares Lux Nanotech Portfolio (ticker: PXN)
The PowerShares Lux Nanotech Portfolio is based on the Lux NanotechTM Index and seeks investment results that correspond generally to the price and yield (before the Fund's fees and expenses) of that equity index.
Although the portfolio had negative performance for the period, the portfolio's outlook remains promising based on the strong results from its constituent companies. The portfolio continued to grow throughout 2006 and benefited from Fortune 500 corporations' increased interest in nanotechnology development. IBM and Hewlett-Packard recently announced landmark nanotechnology breakthroughs in semiconductors, while instrumentation providers like FEI Company report record orders and revenues due to rising nanotech R&D investment. Since inception in October 2005, the portfolio has shown a positive annualized return for investors.
Industry Breakdown (% of the Fund's
Net Assets)
| Pharmaceuticals | 17.9 | ||||||
| Chemicals | 11.8 | ||||||
| Miscellaneous Manufacturing | 11.5 | ||||||
| Commercial Services | 11.3 | ||||||
| Computers | 9.7 | ||||||
| Electronics | 9.5 | ||||||
| Semiconductors | 7.7 | ||||||
| Investment Companies | 4.9 | ||||||
| Software | 4.8 | ||||||
| Energy-Alternate Sources | 4.6 | ||||||
| Healthcare-Products | 3.7 | ||||||
| Auto Manufacturers | 2.6 | ||||||
| Other | 0.0 | ||||||
Style Allocation (%)
| Small-Cap Growth | 47.1 | ||||||
| Large-Cap Value | 21.5 | ||||||
| Small-Cap Value | 14.1 | ||||||
| Mid-Cap Growth | 10.8 | ||||||
| Large-Cap Growth | 6.5 | ||||||
Top Ten Fund Holdings (% of the Fund's
Net Assets)
| Security | |||||||
| Arrowhead Research Corp. | 6.7 | ||||||
| Nanophase Technologies Corp. | 5.5 | ||||||
| Flamel Technologies ADR (France) | 5.3 | ||||||
| Abraxis BioScience, Inc. | 5.1 | ||||||
| Harris & Harris Group, Inc. | 4.9 | ||||||
| Elan Corp. PLC ADR (Ireland) | 4.9 | ||||||
| FEI Co. | 4.9 | ||||||
| Accelrys, Inc. | 4.8 | ||||||
| Headwaters, Inc. | 4.6 | ||||||
| NVE Corp. | 4.6 | ||||||
| Total | 51.3 | ||||||
12
Manager's Analysis (Continued)
PowerShares Lux Nanotech Portfolio (ticker: PXN)
Growth of a $10,000 Investment Since Inception
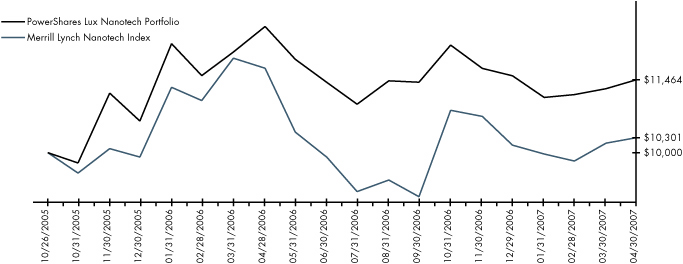
Fund Performance History (%) As of 30 April 2007
Index
| Avg Ann† | Fund Inception | ||||||||||||||
| 1 Year | Avg Ann† | Cumulative | |||||||||||||
| Lux Nanotech IndexTM | -10.31 | 7.66 | 11.79 | ||||||||||||
| Merrill Lynch Nanotech Index | -11.93 | 1.99 | 3.01 | ||||||||||||
| S&P 500® Index | 15.24 | 17.78 | 28.03 | ||||||||||||
Fund
| NAV Return | -8.24 | 9.47 | 14.64 | ||||||||||||
| Share Price Return | -7.97 | 9.78 | 15.12 | ||||||||||||
Fund Inception: 26 October 2005
Performance data quoted represents past performance. Past performance is not a guarantee of future results; current performance may be higher or lower than performance quoted. Investment returns and principal value will fluctuate and shares, when redeemed, may be worth more or less than their original cost. The Share Price performance reflects fee waivers, absent which, performance would have been lower. According to the Fund's most recent Prospectus, the Fund's total gross annual operating expenses was indicated as 0.83%. In the Financial Highlights section of this Annual Report, the Fund's net (subsidized) annualized total operating expense ratio was determined to be 0.71% while the Fund's gross annualized total operating expense ratio was 0.79%. The Adviser has contractually agreed to waive fees and/or pay certain Fund expenses which resulted in a lower fee actually paid by investors. This waiver extends through April 30, 200 8. Absent reimbursements or waivers, performance would have been lower. NAV and Share Price returns assume that dividends and capital gain distributions have been reinvested in the Fund at NAV and Share Price, respectively. The returns shown in the table above do not reflect the deduction of taxes that a shareholder would pay on Fund distributions or the redemption or sale of Fund Shares. See powershares.com to find the most recent month-end performance numbers.
The index performance results are hypothetical and index returns do not represent Fund returns. An investor cannot invest directly in an index. The index does not charge management fees or brokerage expenses, and no such fees or expenses were deducted from the hypothetical performance shown nor does the index lend securities, and no revenues from securities lending were added to the performance shown. In addition, the results actual investors might have achieved would have differed from those shown because of differences in the timing, amounts of their investments, and fees and expenses associated with an investment in the Fund.
The Merrill Lynch Nanotech Index and the S&P 500® Index are unmanaged indices based on the average performance of approximately 27 and 500 common stocks, respectively.
† Average annualized.
13
Manager's Analysis
PowerShares Value Line TimelinessTM Select Portfolio (ticker: PIV)
The PowerShares Value Line TimelinessTM Select Portfolio seeks investment results that correspond generally to the price and yield (before the Fund's fees and expenses) of an equity index called the Value Line TimelinessTM Select Index. The Value Line Index is comprised of the 50 domestic stocks with the greatest capital appreciation potential as identified by the Value Line Timeliness Select Methodology. The Value Line Index seeks to provide market out-performance and reduce risk by incorporating Value Line's Safety Ranking into the investment process.
The objective of the Value Line Index is to represent a group of U.S. common stocks that have the potential to outperform the U.S. equity market. Stocks are selected using a proprietary rules-based discipline, which selects stocks with the greatest potential for capital appreciation based on the three core Value Line Ranking Systems.
Over the past year the portfolio posted a 2.93% return. The Fund lagged the broader market due to higher allocations in the small and mid cap names. The Fund did benefit from strong performance in the consumer discretionary and telecommunication services sectors which each contributed positively to performance. Multi-line retail and household durables such as Big Lots and Tempur-Pedic helped with positive contribution to return. Energy, materials and industrials sectors had a negative contribution to return which caused a drag on performance for the year. Stock selection in the energy sector caused most of the underperformance when compared to the overall market.
Sector Breakdown (% of the Fund's
Net Assets)
| Consumer Discretionary | 25.9 | ||||||
| Information Technology | 24.1 | ||||||
| Health Care | 16.3 | ||||||
| Industrials | 8.1 | ||||||
| Financials | 8.0 | ||||||
| Materials | 7.8 | ||||||
| Consumer Staples | 5.7 | ||||||
| Telecommunication Services | 4.1 | ||||||
| Other | 0.0 | ||||||
Style Allocation (%)
| Mid-Cap Growth | 29.1 | ||||||
| Large-Cap Growth | 25.9 | ||||||
| Small-Cap Growth | 14.8 | ||||||
| Large-Cap Value | 14.0 | ||||||
| Mid-Cap Value | 12.2 | ||||||
| Small-Cap Value | 4.0 | ||||||
Top Ten Fund Holdings (% of the Fund's
Net Assets)
| Security | |||||||
| Varian Semiconductor Equipment Associates, Inc. | 2.7 | ||||||
| Schering-Plough Corp. | 2.6 | ||||||
| Big Lots, Inc. | 2.4 | ||||||
| Cytyc Corp. | 2.3 | ||||||
| Gartner, Inc. | 2.2 | ||||||
| DeVry, Inc. | 2.2 | ||||||
| Flir Systems, Inc. | 2.2 | ||||||
| TeleTech Holdings, Inc. | 2.2 | ||||||
| Honeywell International, Inc. | 2.2 | ||||||
| Rock-Tenn Co., Class A | 2.1 | ||||||
| Total | 23.1 | ||||||
14
Manager's Analysis (Continued)
PowerShares Value Line TimelinessTM Select Portfolio (ticker: PIV)
Growth of a $10,000 Investment Since Inception
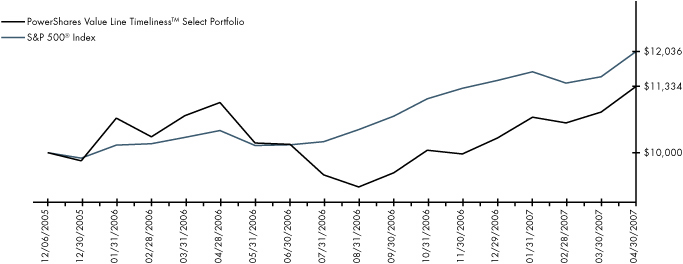
Fund Performance History (%) As of 30 April 2007
Index
| Avg Ann† | Fund Inception | ||||||||||||||
| 1 Year | Avg Ann† | Cumulative | |||||||||||||
| Value Line TimelinessTM Select Index | 2.55 | 9.09 | 12.93 | ||||||||||||
| S&P 500® Index | 15.24 | 14.18 | 20.36 | ||||||||||||
| Russell 2000® Index | 7.83 | 14.24 | 20.44 | ||||||||||||
Fund
| NAV Return | 2.93 | 9.37 | 13.34 | ||||||||||||
| Share Price Return | 2.78 | 9.00 | 12.80 | ||||||||||||
Fund Inception: 6 December 2005
Performance data quoted represents past performance. Past performance is not a guarantee of future results; current performance may be higher or lower than performance quoted. Investment returns and principal value will fluctuate and shares, when redeemed, may be worth more or less than their original cost. The Share Price performance reflects fee waivers, absent which, performance would have been lower. According to the Fund's most recent Prospectus, the Fund's total gross annual operating expenses was indicated as 0.78%. In the Financial Highlights section of this Annual Report, the Fund's net (subsidized) annualized total operating expense ratio was determined to be 0.70% while the Fund's gross annualized total operating expense ratio was 0.75%. The Adviser has contractually agreed to waive fees and/or pay certain Fund expenses which resulted in a lower fee actually paid by investors. This waiver extends through April 30, 200 8. Absent reimbursements or waivers, performance would have been lower. NAV and Share Price returns assume that dividends and capital gain distributions have been reinvested in the Fund at NAV and Share Price, respectively. The returns shown in the table above do not reflect the deduction of taxes that a shareholder would pay on Fund distributions or the redemption or sale of Fund Shares. See powershares.com to find the most recent month-end performance numbers.
The index performance results are hypothetical and index returns do not represent Fund returns. An investor cannot invest directly in an index. The index does not charge management fees or brokerage expenses, and no such fees or expenses were deducted from the hypothetical performance shown nor does the index lend securities, and no revenues from securities lending were added to the performance shown. In addition, the results actual investors might have achieved would have differed from those shown because of differences in the timing, amounts of their investments, and fees and expenses associated with an investment in the Fund.
The S&P 500® Index and the Russell 2000® Index are unmanaged indices based on the average performance of approximately 500 and 2,000 common stocks, respectively.
† Average annualized.
15
Manager's Analysis
PowerShares Value Line Industry Rotation Portfolio (ticker: PYH)
The PowerShares Value Line Industry Rotation Portfolio is based on the Value Line Industry Rotation Index. The Index is comprised of 75 stocks chosen based on both their TimelinessTM rank and their industry TimelinessTM rank.
Since its December 1, 2006 inception date, the Fund has shown strong performance returning 11.36%. Over that short time, the portfolio outperformed the S&P 500® Index which returned 6.87%. The Fund has outperformed the broad market due to strong performances within the consumer discretionary, information technology and industrial sectors. Big Lots, Priceline.com and Mattel were the biggest performers within the consumer discretionary sector while Varian Semiconductor Equipment was the top contributor for information technology. Industrials were lead by Teletech Holdings.
16
Manager's Analysis (Continued)
PowerShares Value Line Industry Rotation Portfolio (ticker: PYH)
Industry Breakdown (% of the Fund's
Net Assets)
| Media | 9.6 | ||||||
| Commercial Services | 8.3 | ||||||
| Retail | 7.8 | ||||||
| Chemicals | 6.7 | ||||||
| Internet | 5.5 | ||||||
| Electronics | 5.4 | ||||||
| Insurance | 4.3 | ||||||
| Semiconductors | 4.2 | ||||||
| Telecommunications | 4.1 | ||||||
| Computers | 2.9 | ||||||
| Mining | 2.8 | ||||||
| Diversified Financial Services | 2.7 | ||||||
| Advertising | 2.7 | ||||||
| Airlines | 2.1 | ||||||
| Pharmaceuticals | 1.8 | ||||||
| Agriculture | 1.5 | ||||||
| Oil & Gas Services | 1.5 | ||||||
| Miscellaneous Manufacturing | 1.5 | ||||||
| Forest Products & Paper | 1.5 | ||||||
| Transportation | 1.5 | ||||||
| Toys/Games/Hobbies | 1.4 | ||||||
| Leisure Time | 1.4 | ||||||
| Office/Business Equipment | 1.4 | ||||||
| Closed-end Funds | 1.4 | ||||||
| Home Furnishings | 1.4 | ||||||
| Iron/Steel | 1.4 | ||||||
| Healthcare-Products | 1.4 | ||||||
| Metal Fabricate/Hardware | 1.4 | ||||||
| Packaging & Containers | 1.3 | ||||||
| Biotechnology | 1.3 | ||||||
| Healthcare-Services | 1.3 | ||||||
| Real Estate | 1.3 | ||||||
| Lodging | 1.3 | ||||||
| Apparel | 1.3 | ||||||
| Aerospace/Defense | 1.3 | ||||||
| Software | 1.2 | ||||||
| Money Market Fund | 0.1 | ||||||
| Other | 0.0 | ||||||
Top Ten Fund Holdings (% of the Fund's
Net Assets)
| Security | |||||||
| Varian Semiconductor Equipment Associates, Inc. | 1.8 | ||||||
| Schering-Plough Corp. | 1.8 | ||||||
| Reuters Group PLC ADR (United Kingdom) | 1.5 | ||||||
| Universal Corp. | 1.5 | ||||||
| DeVry, Inc. | 1.5 | ||||||
| Core Laboratories N.V. (Netherlands) | 1.5 | ||||||
| Honeywell International, Inc. | 1.5 | ||||||
| Gartner, Inc. | 1.5 | ||||||
| TeleTech Holdings, Inc. | 1.5 | ||||||
| Apple, Inc. | 1.5 | ||||||
| Total | 15.6 | ||||||
Style Allocation (%)
| Mid-Cap Growth | 25.6 | ||||||
| Large-Cap Growth | 23.0 | ||||||
| Small-Cap Growth | 18.1 | ||||||
| Mid-Cap Value | 14.4 | ||||||
| Large-Cap Value | 11.6 | ||||||
| Small-Cap Value | 7.3 | ||||||
17
Manager's Analysis (Continued)
PowerShares Value Line Industry Rotation Portfolio (ticker: PYH)
Growth of a $10,000 Investment Since Inception
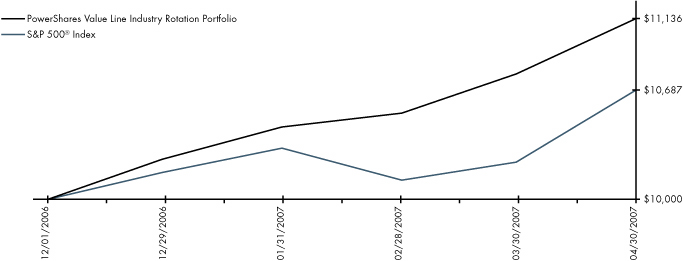
Fund Performance History (%) As of 30 April 2007
Index
| Fund Inception Cumulative | |||||||
| Value Line Industry Rotation Index | 11.33 | ||||||
| S&P 500® Index | 6.87 | ||||||
| Russell 2000® Index | 4.78 | ||||||
Fund
| NAV Return | 11.36 | ||||||
| Share Price Return | 11.36 | ||||||
Fund Inception: 1 December 2006
Performance data quoted represents past performance. Past performance is not a guarantee of future results, current performance may be higher or lower than performance quoted. Investment returns and principal value will fluctuate and shares, when redeemed, may be worth more or less than their original cost. The Share Price performance reflects fee waivers, absent which, performance would have been lower. According to the Fund's most recent Prospectus, the Fund's total gross annual operating expenses was indicated as 0.75%. In the Financial Highlights section of this Annual Report, the Fund's net (subsidized) annualized total operating expense ratio was determined to be 0.75% while the Fund's gross annualized total operating expense ratio was 1.21%. The Adviser has contractually agreed to waive fees and/or pay certain Fund expenses which resulted in a lower fee actually paid by investors. This waiver extends through April 30, 200 8. Absent reimbursements or waivers, performance would have been lower. NAV and Share Price returns assume that dividends and capital gain distributions have been reinvested in the Fund at NAV and Share Price, respectively. The returns shown in the table above do not reflect the deduction of taxes that a shareholder would pay on Fund distributions or the redemption or sale of Fund Shares. See powershares.com to find the most recent month-end performance numbers.
The index performance results are based upon a hypothetical investment in its constituent securities. Index returns do not represent Fund returns. An investor cannot invest directly in an index. The index does not charge management fees or brokerage expenses, and no such fees or expenses were deducted from the hypothetical performance shown nor does the index lend securities, and no revenues from securities lending were added to the performance shown. In addition, the results actual investors might have achieved would have differed from those shown because of differences in the timing, amounts of their investments, and fees and expenses associated with an investment in the Fund.
The S&P 500® Index and Russell 2000® Index are unmanaged indices used as a measurement of change in stock market conditions based on the average performance of approximately 500 and 2,000 common stocks, respectively.
18
Manager's Analysis
PowerShares Water Resources Portfolio (ticker: PHO)
The PowerShares Water Resources Portfolio, launched in December 2005, has experienced exceptional interest since inception. The Fund filled the demand by investors to participate in the growth of an industry focused on one of the most vital resources on earth: water. Virtually every country in the world is presented with some combination of water quality and quantity issues that require significant expenditures to resolve.
The Fund seeks investment results that correspond generally to the price and yield (before the Fund's fees and expenses) of an equity index called the Palisades Water Index. The Palisades Water Index includes water companies drawn from the following sectors: water utilities, treatment, analytical and monitoring, infrastructure and distribution, water resource management, and conglomerate water companies.
During the reporting period the Fund has returned 6.26% and since inception it has returned 26.85%. Multi-Utilities and Commercial Services and Supplies, which make up about 15% of the Fund, had strong performance during the reporting period. The Fund allocated its largest percentage to machinery which has lagged the overall market. Within that industry Badger Meter and Mueller Water Products had the largest drag on the fund's performance.
Industry Breakdown (% of the Fund's
Net Assets)
| Water | 21.2 | ||||||
| Miscellaneous Manufacturing | 20.8 | ||||||
| Electronics | 11.7 | ||||||
| Engineering & Construction | 9.7 | ||||||
| Environmental Control | 9.0 | ||||||
| Machinery-Diversified | 8.3 | ||||||
| Metal Fabricate/Hardware | 7.5 | ||||||
| Hand/Machine Tools | 2.7 | ||||||
| Biotechnology | 2.5 | ||||||
| Electrical Components & Equipment | 1.7 | ||||||
| Electric | 1.7 | ||||||
| Healthcare-Products | 1.6 | ||||||
| Chemicals | 1.4 | ||||||
| Money Market Fund | 0.0 | ||||||
| Other | 0.2 | ||||||
Style Allocation (%)
| Small-Cap Value | 32.0 | ||||||
| Mid-Cap Growth | 20.2 | ||||||
| Small-Cap Growth | 19.1 | ||||||
| Mid-Cap Value | 14.6 | ||||||
| Large-Cap Growth | 8.9 | ||||||
| Large-Cap Value | 5.2 | ||||||
Top Ten Fund Holdings (% of the Fund's
Net Assets)
| Security | |||||||
| Tetra Tech, Inc. | 4.5 | ||||||
| Valmont Industries, Inc. | 4.4 | ||||||
| Veolia Environnement ADR (France) | 4.2 | ||||||
| Itron, Inc. | 3.8 | ||||||
| URS Corp. | 3.8 | ||||||
| Layne Christensen Co. | 3.4 | ||||||
| Watts Water Technologies, Inc., Class A | 3.2 | ||||||
| IDEXX Laboratories, Inc. | 3.1 | ||||||
| Roper Industries, Inc. | 3.1 | ||||||
| Mueller Water Products, Inc., Class B | 3.1 | ||||||
| Total | 36.6 | ||||||
19
Manager's Analysis (Continued)
PowerShares Water Resources Portfolio (ticker: PHO)
Growth of a $10,000 Investment Since Inception
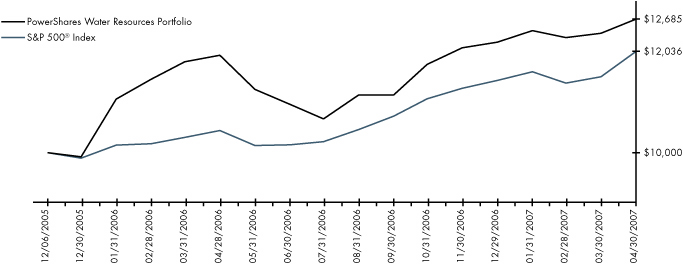
Fund Performance History (%) As of 30 April 2007
Index
| Avg Ann† | Fund Inception | ||||||||||||||
| 1 Year | Avg Ann† | Cumulative | |||||||||||||
| Palisades Water Index | 6.90 | 19.16 | 27.75 | ||||||||||||
| S&P 500® Index | 15.24 | 14.18 | 20.36 | ||||||||||||
| Dow Jones Utility Index | 30.64 | 19.66 | 28.51 | ||||||||||||
Fund
| NAV Return | 6.26 | 18.56 | 26.85 | ||||||||||||
| Share Price Return | 5.94 | 17.65 | 25.50 | ||||||||||||
Fund Inception: 6 December 2005
Performance data quoted represents past performance. Past performance is not a guarantee of future results; current performance may be higher or lower than performance quoted. Investment returns and principal value will fluctuate and shares, when redeemed, may be worth more or less than their original cost. The Share Price performance reflects fee waivers, absent which, performance would have been lower. According to the Fund's most recent Prospectus, the Fund's total gross annual operating expenses was indicated as 0.70%. In the Financial Highlights section of this Annual Report, the Fund's net (subsidized) annualized total operating expense ratio was determined to be 0.66% while the Fund's gross annualized total operating expense ratio was 0.67%. The Adviser has contractually agreed to waive fees and/or pay certain Fund expenses which resulted in a lower fee actually paid by investors. This waiver extends through April 30, 200 8. Absent reimbursements or waivers, performance would have been lower. NAV and Share Price returns assume that dividends and capital gain distributions have been reinvested in the Fund at NAV and Share Price, respectively. The returns shown in the table above do not reflect the deduction of taxes that a shareholder would pay on Fund distributions or the redemption or sale of Fund Shares. See powershares.com to find the most recent month-end performance numbers.
The index performance results are hypothetical and index returns do not represent Fund returns. An investor cannot invest directly in an index. The index does not charge management fees or brokerage expenses, and no such fees or expenses were deducted from the hypothetical performance shown nor does the index lend securities, and no revenues from securities lending were added to the performance shown. In addition, the results actual investors might have achieved would have differed from those shown because of differences in the timing, amounts of their investments, and fees and expenses associated with an investment in the Fund.
The S&P 500® Index and the Dow Jones Utility Index are unmanaged indices based on the average performance of approximately 500 and 15 common stocks, respectively.
† Average annualized.
20
Manager's Analysis
PowerShares WilderHill Clean Energy Portfolio (ticker: PBW)
The PowerShares WilderHill Clean Energy Portfolio is based on the WilderHill Clean Energy Index and seeks investment results that correspond generally to the price and yield (before the Fund's fees and expenses) of that equity index.
Over the past year, the portfolio has returned -13.58%. The past 12 months began, coincidentally, at a recent high in clean energy valuations which peaked in May 2006. The summer of 2006 was afterwards marked by a significant downturn in ethanol, followed by an unusually long period of sideways movement for the remainder of the year.
Since the beginning of 2007, there has been greater attention paid to clean energy technologies with renewed interest in solar power, especially new thin film and the China-based solar PV makers. Other areas of interest include using better energy efficiency tools, a growth in the demand for wind power, as well as the potential for advanced cellulosic biofuels. This is led in part by prospects for ongoing lofty oil prices, concern for energy security, ongoing fuel diversification, and lately an increasing look at major opportunities possibly found in climate change.
Industry Breakdown (% of the Fund's
Net Assets)
| Energy-Alternate Sources | 27.4 | ||||||
| Semiconductors | 18.2 | ||||||
| Electrical Components & Equipment | 15.1 | ||||||
| Chemicals | 10.9 | ||||||
| Electric | 7.8 | ||||||
| Electronics | 6.6 | ||||||
| Computers | 6.0 | ||||||
| Auto Parts & Equipment | 2.7 | ||||||
| Biotechnology | 2.7 | ||||||
| Agriculture | 2.5 | ||||||
| Other | 0.1 | ||||||
Style Allocation (%)
| Small-Cap Growth | 56.4 | ||||||
| Mid-Cap Growth | 16.4 | ||||||
| Small-Cap Value | 10.6 | ||||||
| Large-Cap Growth | 8.8 | ||||||
| Mid-Cap Value | 5.3 | ||||||
| Large-Cap Value | 2.5 | ||||||
Top Ten Fund Holdings (% of the Fund's
Net Assets)
| Security | |||||||
| SunPower Corp., Class A | 4.0 | ||||||
| Echelon Corp. | 3.8 | ||||||
| Cypress Semiconductor Corp. | 3.6 | ||||||
| Cree, Inc. | 3.6 | ||||||
| First Solar, Inc. | 3.2 | ||||||
| OM Group, Inc. | 3.2 | ||||||
| Universal Display Corp. | 3.2 | ||||||
| KYOCERA Corp. ADR (Japan) | 3.1 | ||||||
| Suntech Power Holdings Co., Ltd. ADR (Cayman Islands) | 3.1 | ||||||
| Applied Materials, Inc. | 3.1 | ||||||
| Total | 33.9 | ||||||
21
Manager's Analysis (Continued)
PowerShares WilderHill Clean Energy Portfolio (ticker: PBW)
Growth of a $10,000 Investment Since Inception
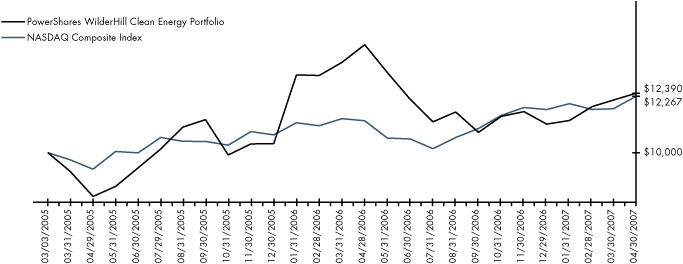
Fund Performance History (%) As of 30 April 2007
Index
| Avg Ann† | Fund Inception | ||||||||||||||
| 1 Year | Avg Ann† | Cumulative | |||||||||||||
| WilderHill Clean Energy Index | -15.53 | 9.46 | 21.54 | ||||||||||||
| NASDAQ Composite Index | 8.72 | 9.93 | 22.67 | ||||||||||||
| S&P 500® Index | 15.24 | 11.86 | 27.38 | ||||||||||||
Fund
| NAV Return | -13.58 | 10.44 | 23.90 | ||||||||||||
| Share Price Return | -13.51 | 10.54 | 24.15 | ||||||||||||
Fund Inception: 3 March 2005
Performance data quoted represents past performance. Past performance is not a guarantee of future results, current performance may be higher or lower than performance quoted. Investment returns and principal value will fluctuate and shares, when redeemed, may be worth more or less than their original cost. The Share Price performance reflects fee waivers, absent which, performance would have been lower. According to the Fund's most recent Prospectus, the Fund's total gross annual operating expenses was indicated as 0.75%. In the Financial Highlights section of this Annual Report, the Fund's annualized total operating expense ratio (prior to net reimbursements to the Adviser) was determined to be 0.69% while the Fund's annualized total operating expense ratio (after net reimbursements to the Adviser) was 0.70%. The Adviser has contractually agreed to waive fees and/or pay certain Fund expenses which resulted in a lower fee actua lly paid by investors. This waiver extends through April 30, 2008. Absent reimbursements or waivers, performance would have been lower. NAV and Share Price returns assume that dividends and capital gain distributions have been reinvested in the Fund at NAV and Share Price, respectively. The returns shown in the table above do not reflect the deduction of taxes that a shareholder would pay on Fund distributions or the redemption or sale of Fund Shares. See powershares.com to find the most recent month-end performance numbers.
The index performance results are hypothetical. Index returns do not represent Fund returns. An investor cannot invest directly in an index. The index does not charge management fees or brokerage expenses, and no such fees or expenses were deducted from the hypothetical performance shown nor does the index lend securities, and no revenues from securities lending were added to the performance shown. In addition, the results actual investors might have achieved would have differed from those shown because of differences in the timing, amounts of their investments, and fees and expenses associated with an investment in the Fund.
The NASDAQ Composite Index and the S&P 500® Index are unmanaged indices based on the average performance of approximately 3,300 and 500 common stocks, respectively.
† Average annualized.
22
Manager's Analysis
PowerShares WilderHill Progressive Energy Portfolio (ticker: PUW)
The PowerShares WilderHill Progressive Energy Portfolio is based on the WilderHill Progressive Energy Index and seeks investment results that correspond generally to the price and yield (before the Fund's fees and expenses) of that equity index.
Since its October 24, 2006 inception date, the Fund has shown a strong performance returning 15.01%. Over that short time, the portfolio outpaced the overall NASDAQ Composite Index which returned 7.69%. Since a run-up in valuations that had reached a brief peak in Spring 2006, alternative energy stocks and hence the portfolio slowly declined to a low by the Fall.
Following a brief correction in the broader stock market, the outlook changed rather significantly in early 2007. Attention was sharply drawn to the possible regulation of carbon dioxide due in part to growing attention to climate change as markets renewed a search for stocks that could benefit from opportunities from reduced carbon. Uranium stocks saw some significant movement upwards as did those involved with pollution controls. New breakthroughs in energy efficiency likewise enabled the portfolio to turn in a strong performance since its inception.
Industry Breakdown (% of the Fund's
Net Assets)
| Electrical Components & Equipment | 11.3 | ||||||
| Semiconductors | 10.1 | ||||||
| Electric | 9.9 | ||||||
| Auto Parts & Equipment | 8.5 | ||||||
| Oil & Gas | 8.3 | ||||||
| Energy-Alternate Sources | 7.9 | ||||||
| Miscellaneous Manufacturing | 6.9 | ||||||
| Mining | 6.4 | ||||||
| Gas | 5.9 | ||||||
| Chemicals | 5.5 | ||||||
| Environmental Control | 4.9 | ||||||
| Auto Manufacturers | 4.0 | ||||||
| Food | 2.8 | ||||||
| Telecommunications | 2.2 | ||||||
| Hand/Machine Tools | 2.2 | ||||||
| Aerospace/Defense | 2.1 | ||||||
| Investment Companies | 0.5 | ||||||
| Oil & Gas Services | 0.4 | ||||||
| Electronics | 0.4 | ||||||
| Money Market Fund | 0.3 | ||||||
| Other | (0.5 | ) | |||||
Top Ten Fund Holdings (% of the Fund's
Net Assets)
| Security | |||||||
| Tenneco, Inc. | 3.3 | ||||||
| USEC, Inc. | 3.3 | ||||||
| Cameco Corp. (Canada) | 3.1 | ||||||
| Energizer Holdings, Inc. | 2.9 | ||||||
| Fuel Tech, Inc. | 2.9 | ||||||
| Chesapeake Energy Corp. | 2.9 | ||||||
| Exide Technologies | 2.9 | ||||||
| Aventine Renewable Energy Holdings, Inc. | 2.9 | ||||||
| Methanex Corp. (Canada) | 2.8 | ||||||
| SunOpta, Inc. (Canada) | 2.8 | ||||||
| Total | 29.8 | ||||||
Style Allocation (%)
| Small-Cap Growth | 30.1 | ||||||
| Small-Cap Value | 18.3 | ||||||
| Mid-Cap Value | 15.1 | ||||||
| Large-Cap Growth | 13.4 | ||||||
| Large-Cap Value | 13.2 | ||||||
| Mid-Cap Growth | 9.9 | ||||||
23
Manager's Analysis (Continued)
PowerShares WilderHill Progressive Energy Portfolio (ticker: PUW)
Growth of a $10,000 Investment Since Inception
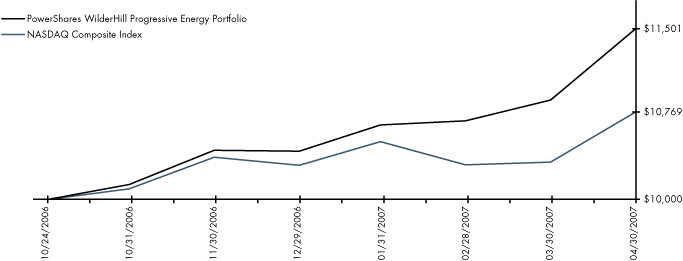
Fund Performance History (%) As of 30 April 2007
Index
| Fund Inception Cumulative | |||||||
| WilderHill Progressive Energy Index | 14.71 | ||||||
| NASDAQ Composite Index | 7.69 | ||||||
| S&P 500® Index | 8.66 | ||||||
Fund
| NAV Return | 15.01 | ||||||
| Share Price Return | 15.12 | ||||||
Fund Inception: 24 October 2006
Performance data quoted represents past performance. Past performance is not a guarantee of future results, current performance may be higher or lower than performance quoted. Investment returns and principal value will fluctuate and shares, when redeemed, may be worth more or less than their original cost. The Share Price performance reflects fee waivers, absent which, performance would have been lower. According to the Fund's most recent Prospectus, the Fund's total gross annual operating expenses was indicated as 0.75%. In the Financial Highlights section of this Annual Report, the Fund's net (subsidized) annualized total operating expense ratio was determined to be 0.74% while the Fund's gross annualized total operating expense ratio was 1.09%. The Adviser has contractually agreed to waive fees and/or pay certain Fund expenses which resulted in a lower fee actually paid by investors. This waiver extends through April 30, 200 8. Absent reimbursements or waivers, performance would have been lower. NAV and Share Price returns assume that dividends and capital gain distributions have been reinvested in the Fund at NAV and Share Price, respectively. The returns shown in the table above do not reflect the deduction of taxes that a shareholder would pay on Fund distributions or the redemption or sale of Fund Shares. See powershares.com to find the most recent month-end performance numbers.
The index performance results are hypothetical. Index returns do not represent Fund returns. An investor cannot invest directly in an index. The index does not charge management fees or brokerage expenses, and no such fees or expenses were deducted from the hypothetical performance shown nor does the index lend securities, and no revenues from securities lending were added to the performance shown. In addition, the results actual investors might have achieved would have differed from those shown because of differences in the timing, amounts of their investments, and fees and expenses associated with an investment in the Fund.
The NASDAQ Composite Index and the S&P 500® Index are unmanaged indices based on the average performance of approximately 3,300 and 500 common stocks, respectively.
24
Manager's Analysis
PowerShares DWA Technical LeadersTM Portfolio (ticker: PDP)
The PowerShares DWA Technical LeadersTM Portfolio is based on the Dorsey Wright Technical LeadersTM Index which includes approximately 100 U.S.-listed companies that demonstrate strong relative strength characteristics. The Index is constructed pursuant to Dorsey Wright proprietary methodology, which takes into account, among other factors, the performance of each of the 3,000 largest U.S.-listed companies as compared to a benchmark index, and the relative performance of industry sectors and sub-sectors. Stocks that are selected receive a modified equal weighting.
This is a new portfolio launched on March 1, 2007, and since its inception, the Fund has had a positive return of 6.81%. The Fund has outperformed the S&P 500® Index since its inception.
Industry Breakdown (% of the Fund's
Net Assets)
| Financials | 17.1 | ||||||
| Industrials | 17.0 | ||||||
| Materials | 14.5 | ||||||
| Consumer Discretionary | 12.8 | ||||||
| Energy | 9.0 | ||||||
| Telecommunication Services | 8.5 | ||||||
| Health Care | 8.0 | ||||||
| Utilities | 4.9 | ||||||
| Information Technology | 4.7 | ||||||
| Consumer Staples | 3.3 | ||||||
| Other | 0.2 | ||||||
Style Allocation (%)
| Mid-Cap Growth | 55.5 | ||||||
| Large-Cap Growth | 19.4 | ||||||
| Mid-Cap Value | 19.2 | ||||||
| Large-Cap Value | 4.3 | ||||||
| Small-Cap Value | 1.6 | ||||||
Top Ten Fund Holdings (% of the Fund's
Net Assets)
| Security | |||||||
| Holly Corp. | 5.6 | ||||||
| Titanium Metals Corp. | 5.0 | ||||||
| NII Holdings, Inc. | 4.6 | ||||||
| American Tower Corp., Class A | 3.3 | ||||||
| Allegheny Technologies, Inc. | 2.5 | ||||||
| Energizer Holdings, Inc. | 2.2 | ||||||
| Covanta Holding Corp. | 2.2 | ||||||
| Williams (The) Cos., Inc. | 2.0 | ||||||
| Jarden Corp. | 1.8 | ||||||
| Pediatrix Medical Group, Inc. | 1.8 | ||||||
| Total | 31.0 | ||||||
25
Manager's Analysis (Continued)
PowerShares DWA Technical LeadersTM Portfolio (ticker: PDP)
Fund Performance History (%) As of 30 April 2007
Index
| Fund Inception Cumulative | |||||||
| Dorsey Wright Technical LeadersTM Index | 6.77 | ||||||
| S&P 500® Index | 5.87 | ||||||
| Russell 3000® Index | 5.35 | ||||||
Fund
| NAV | 6.81 | ||||||
| Share Price Return | 6.85 | ||||||
Fund Inception: 1 March 2007
Performance data quoted represents past performance. Past performance is not a guarantee of future results, current performance may be higher or lower than performance quoted. Investment returns and principal value will fluctuate and shares, when redeemed, may be worth more or less than their original cost. The Share Price performance reflects fee waivers, absent which, performance would have been lower. According to the Fund's most recent Prospectus, the Fund's total gross annual operating expenses was indicated as 0.75%. In the Financial Highlights section of this Annual Report, the Fund's net (subsidized) annualized total operating expense ratio was determined to be 0.72% while the Fund's gross annualized total operating expense ratio was 1.78%. The Adviser has contractually agreed to waive fees and/or pay certain Fund expenses which resulted in a lower fee actually paid by investors. This waiver extends through April 30, 200 8. Absent reimbursements or waivers, performance would have been lower. NAV and Share Price returns assume that dividends and capital gain distributions have been reinvested in the Fund at NAV and Share Price, respectively. The returns shown in the table above do not reflect the deduction of taxes that a shareholder would pay on Fund distributions or the redemption or sale of Fund Shares. See powershares.com to find the most recent month-end performance numbers.
The index performance results are based upon a hypothetical investment in its constituent securities. Index returns do not represent Fund returns. An investor cannot invest directly in an index. The index does not charge management fees or brokerage expenses, and no such fees or expenses were deducted from the hypothetical performance shown nor does the index lend securities, and no revenues from securities lending were added to the performance shown. In addition, the results actual investors might have achieved would have differed from those shown because of differences in the timing, amounts of their investments, and fees and expenses associated with an investment in the Fund.
The S&P 500® Index and the Russell 3000® Index are unmanaged indices used as a measurement of change in stock market conditions based on the average performance of approximately 500 and 3,000 common stocks, respectively.
26
This page intentionally left blank
Funds' Distribution History
| Ex-Dividend | 4/16/07 | 3/16/07 | 3/15/07 | 2/15/07 | 1/15/07 | 12/15/06 | 11/15/06 | ||||||||||||||||||||||||||||
| Record | 4/18/07 | 3/20/07 | 3/20/07 | 2/20/07 | 1/17/07 | 12/19/06 | 11/17/06 | ||||||||||||||||||||||||||||
| Payable | 4/30/07 | 3/30/07 | 3/30/07 | 2/28/07 | 1/31/07 | 12/29/06 | 11/30/06 | ||||||||||||||||||||||||||||
| Fund | Ticker | ||||||||||||||||||||||||||||||||||
| PowerShares Aerospace & Defense Portfolio | PPA | — | 0.01223 | — | — | — | 0.00968 | — | |||||||||||||||||||||||||||
| PowerShares CleantechTM Portfolio | PZD | — | — | — | — | — | — | — | |||||||||||||||||||||||||||
| PowerShares Golden Dragon Halter USX China Portfolio | PGJ | — | — | — | — | — | 0.00598 | — | |||||||||||||||||||||||||||
| PowerShares Listed Private Equity Portfolio | PSP | — | 0.07235 | — | — | — | 0.26528 | — | |||||||||||||||||||||||||||
| PowerShares Lux Nanotech Portfolio | PXN | — | — | — | — | — | — | — | |||||||||||||||||||||||||||
| PowerShares Value Line TimelinessTM Select Portfolio | PIV | — | — | — | — | — | — | — | |||||||||||||||||||||||||||
| PowerShares Value Line Industry Rotation Portfolio | PYH | — | — | — | — | — | 0.01016 | — | |||||||||||||||||||||||||||
| PowerShares Water Resources Portfolio | PHO | — | 0.02358 | — | — | — | 0.07779 | — | |||||||||||||||||||||||||||
| PowerShares WilderHill Clean Energy Portfolio | PBW | — | — | — | — | — | 0.03675 | — | |||||||||||||||||||||||||||
| PowerShares WilderHill Progressive Energy Portfolio | PUW | — | 0.01250 | — | — | — | 0.00451 | — | |||||||||||||||||||||||||||
| PowerShares DWA Technical LeadersTM Portfolio | PDP | — | — | — | — | — | — | — | |||||||||||||||||||||||||||
| Ex-Dividend | 12/30/05 | 12/16/05 | 9/16/05 | 6/17/05 | 4/1/05 | 3/18/05 | |||||||||||||||||||||||||||||
| Record | 1/4/06 | 12/20/05 | 9/20/05 | 6/21/05 | 4/5/05 | 3/22/05 | |||||||||||||||||||||||||||||
| Payable | 1/31/06 | 12/30/05 | 9/30/05 | 6/30/05 | 4/29/05 | 4/29/05 | |||||||||||||||||||||||||||||
| Fund | Ticker | ||||||||||||||||||||||||||||||||||
| PowerShares Aerospace & Defense Portfolio | PPA | — | 0.02191 | — | — | — | — | ||||||||||||||||||||||||||||
| PowerShares CleantechTM Portfolio | PZD | — | — | — | — | — | — | ||||||||||||||||||||||||||||
| PowerShares Golden Dragon Halter USX China Portfolio | PGJ | — | 0.00132 | 0.11161 | 0.04962 | — | — | ||||||||||||||||||||||||||||
| PowerShares Listed Private Equity Portfolio | PSP | — | — | — | — | — | — | ||||||||||||||||||||||||||||
| PowerShares Lux Nanotech Portfolio | PXN | 0.06725 | 0.01063 | — | — | — | — | ||||||||||||||||||||||||||||
| PowerShares Value Line TimelinessTM Select Portfolio | PIV | — | — | — | — | — | — | ||||||||||||||||||||||||||||
| PowerShares Value Line Industry Rotation Portfolio | PYH | — | — | — | — | — | — | ||||||||||||||||||||||||||||
| PowerShares Water Resources Portfolio | PHO | 0.02682 | 0.00627 | — | — | — | — | ||||||||||||||||||||||||||||
| PowerShares WilderHill Clean Energy Portfolio | PBW | — | — | — | — | — | — | ||||||||||||||||||||||||||||
| PowerShares WilderHill Progressive Energy Portfolio | PUW | — | — | — | — | — | — | ||||||||||||||||||||||||||||
| PowerShares DWA Technical LeadersTM Portfolio | PDP | — | — | — | — | — | — | ||||||||||||||||||||||||||||
28
| 10/16/06 | 9/15/06 | 8/15/06 | 7/14/06 | 6/16/06 | 6/15/06 | 5/15/06 | 3/17/06 | ||||||||||||||||||||||||||||
| 10/18/06 | 9/16/06 | 8/17/06 | 7/18/06 | 6/20/06 | 6/19/06 | 5/17/06 | 3/21/06 | ||||||||||||||||||||||||||||
| 10/31/06 | 9/29/06 | 8/31/06 | 7/31/06 | 6/30/06 | 6/30/06 | 5/31/06 | 3/30/06 | ||||||||||||||||||||||||||||
| Fund | |||||||||||||||||||||||||||||||||||
| PowerShares Aerospace & Defense Portfolio | — | 0.02002 | — | — | 0.02120 | — | — | — | |||||||||||||||||||||||||||
| PowerShares CleantechTM Portfolio | — | — | — | — | — | — | — | — | |||||||||||||||||||||||||||
| PowerShares Golden Dragon Halter USX China Portfolio | — | 0.08011 | — | — | 0.12430 | — | — | — | |||||||||||||||||||||||||||
| PowerShares Listed Private Equity Portfolio | — | — | — | — | — | — | — | — | |||||||||||||||||||||||||||
| PowerShares Lux Nanotech Portfolio | — | — | — | — | — | — | — | — | |||||||||||||||||||||||||||
| PowerShares Value Line TimelinessTM Select Portfolio | — | — | — | — | — | — | — | — | |||||||||||||||||||||||||||
| PowerShares Value Line Industry Rotation Portfolio | — | — | — | — | — | — | — | — | |||||||||||||||||||||||||||
| PowerShares Water Resources Portfolio | — | 0.03621 | — | — | 0.03737 | — | — | — | |||||||||||||||||||||||||||
| PowerShares WilderHill Clean Energy Portfolio | — | — | — | — | 0.01037 | — | — | — | |||||||||||||||||||||||||||
| PowerShares WilderHill Progressive Energy Portfolio | — | — | — | — | — | — | — | — | |||||||||||||||||||||||||||
| PowerShares DWA Technical LeadersTM Portfolio | — | — | — | — | — | — | — | — | |||||||||||||||||||||||||||
| 12/17/04 | 12/31/04 | 9/17/04 | 6/18/04 | 3/19/04 | 12/24/03 | 9/19/03 | 6/20/03 | ||||||||||||||||||||||||||||
| 12/21/04 | 1/4/05 | 9/21/04 | 6/22/04 | 3/23/04 | 12/29/03 | 9/23/03 | 6/24/03 | ||||||||||||||||||||||||||||
| 1/31/05 | 1/31/05 | 10/29/04 | 7/30/04 | 4/30/04 | 1/30/04 | 10/31/03 | 7/31/03 | ||||||||||||||||||||||||||||
| Fund | |||||||||||||||||||||||||||||||||||
| PowerShares Aerospace & Defense Portfolio | — | — | — | — | — | — | — | — | |||||||||||||||||||||||||||
| PowerShares CleantechTM Portfolio | — | — | — | — | — | — | — | — | |||||||||||||||||||||||||||
| PowerShares Golden Dragon Halter USX China Portfolio | — | — | — | — | — | — | — | — | |||||||||||||||||||||||||||
| PowerShares Listed Private Equity Portfolio | — | — | — | — | — | — | — | — | |||||||||||||||||||||||||||
| PowerShares Lux Nanotech Portfolio | — | — | — | — | — | — | — | — | |||||||||||||||||||||||||||
| PowerShares Value Line TimelinessTM Select Portfolio | — | — | — | — | — | — | — | — | |||||||||||||||||||||||||||
| PowerShares Value Line Industry Rotation Portfolio | — | — | — | — | — | — | — | — | |||||||||||||||||||||||||||
| PowerShares Water Resources Portfolio | — | — | — | — | — | — | — | — | |||||||||||||||||||||||||||
| PowerShares WilderHill Clean Energy Portfolio | — | — | — | — | — | — | — | — | |||||||||||||||||||||||||||
| PowerShares WilderHill Progressive Energy Portfolio | — | — | — | — | — | — | — | — | |||||||||||||||||||||||||||
| PowerShares DWA Technical LeadersTM Portfolio | — | — | — | — | — | — | — | — | |||||||||||||||||||||||||||
29
Frequency Distribution of Discounts & Premiums
Since Inception thru April 30, 2007
| Closing Price Above NAV | |||||||||||||||||||||||||||||||||||||||
Ticker | Fund Name | Inception | Days | 0-24 Basis Points | 25-49 Basis Points | 50-99 Basis Points | 100-149 Basis Points | 150-199 Basis Points | 200+ Basis Points | ||||||||||||||||||||||||||||||
| PPA | PowerShares Aerospace & Defense Portfolio | 10/26/05 | 378 | 203 | 8 | 1 | 0 | 0 | 0 | ||||||||||||||||||||||||||||||
| PZD | PowerShares CleantechTM Portfolio | 10/24/06 | 128 | 31 | 2 | 0 | 0 | 0 | 0 | ||||||||||||||||||||||||||||||
| PGJ | PowerShares Golden Dragon Halter USX China Portfolio | 12/9/04 | 600 | 323 | 85 | 17 | 0 | 0 | 0 | ||||||||||||||||||||||||||||||
| PSP | PowerShares Listed Private Equity Portfolio | 10/24/06 | 128 | 85 | 0 | 0 | 0 | 0 | 0 | ||||||||||||||||||||||||||||||
| PXN | PowerShares Lux Nanotech Portfolio | 10/26/05 | 378 | 196 | 33 | 9 | 5 | 1 | 0 | ||||||||||||||||||||||||||||||
| PIV | PowerShares Value Line TimelinessTM Select Portfolio | 12/6/05 | 350 | 188 | 10 | 1 | 0 | 0 | 0 | ||||||||||||||||||||||||||||||
| PYH | PowerShares Value Line Industry Rotation Portfolio | 12/1/06 | 101 | 47 | 0 | 1 | 0 | 0 | 0 | ||||||||||||||||||||||||||||||
| PHO | PowerShares Water Resources Portfolio | 12/6/05 | 350 | 168 | 73 | 11 | 1 | 0 | 0 | ||||||||||||||||||||||||||||||
| PBW | PowerShares WilderHill Clean Energy Portfolio | 3/3/05 | 543 | 256 | 82 | 10 | 2 | 0 | 0 | ||||||||||||||||||||||||||||||
| PUW | PowerShares WilderHill Progressive Energy Portfolio | 10/24/06 | 128 | 35 | 1 | 0 | 0 | 0 | 0 | ||||||||||||||||||||||||||||||
| PDP | PowerShares DWA Technical LeadersTM Portfolio | 3/1/07 | 42 | 24 | 0 | 0 | 0 | 0 | 0 | ||||||||||||||||||||||||||||||
30
| Closing Price Below NAV | |||||||||||||||||||||||||||
Ticker | -0-24 Basis Points | -25-49 Basis Points | -50-99 Basis Points | -100-149 Basis Points | -150-199 Basis Points | -200+ Basis Points | |||||||||||||||||||||
| PPA | 164 | 2 | 0 | 0 | 0 | 0 | |||||||||||||||||||||
| PZD | 91 | 4 | 0 | 0 | 0 | 0 | |||||||||||||||||||||
| PGJ | 160 | 12 | 3 | 0 | 0 | 0 | |||||||||||||||||||||
| PSP | 41 | 2 | 0 | 0 | 0 | 0 | |||||||||||||||||||||
| PXN | 128 | 5 | 0 | 0 | 1 | 0 | |||||||||||||||||||||
| PIV | 148 | 3 | 0 | 0 | 0 | 0 | |||||||||||||||||||||
| PYH | 51 | 2 | 0 | 0 | 0 | 0 | |||||||||||||||||||||
| PHO | 91 | 6 | 0 | 0 | 0 | 0 | |||||||||||||||||||||
| PBW | 172 | 20 | 1 | 0 | 0 | 0 | |||||||||||||||||||||
| PUW | 90 | 2 | 0 | 0 | 0 | 0 | |||||||||||||||||||||
| PDP | 18 | 0 | 0 | 0 | 0 | 0 | |||||||||||||||||||||
31
Fees and Expenses
As a shareholder of a Fund of the PowerShares Exchange-Traded Fund Trust, you incur advisory fees and other Fund expenses. The expense examples below are intended to help you understand your ongoing costs (in dollars) of investing in the Funds and to compare these costs with the ongoing costs of investing in other mutual funds.
The example is based on an investment of $1,000 invested at the beginning of the period and held through the six-month (or shorter) period ended April 30, 2007.
Actual Expenses
The first line in the following tables provides information about actual account values and actual expenses. You may use the information in this line, together with the amount you invested, to estimate the expenses that you paid over the period. Simply divide your account value by $1,000 (for example, an $8,600 account value divided by $1,000 = 8.6), then multiply the result by the number in the first line under the heading "Expenses Paid During the Six-Month Period" to estimate the expenses you paid on your account during this period.
Hypothetical Example for Comparison Purposes
The second line in the following tables provides information about hypothetical account values and hypothetical expenses based on the Funds' actual expense ratio and an assumed annualized rate of return of 5% per year before expenses, which is not the Funds' actual return. The hypothetical account values and expenses may not be used to estimate the actual ending account balance or expenses you paid for the period. You may use this information to compare the ongoing costs of investing in the Funds and other funds. To do so, compare this 5% hypothetical example with the 5% hypothetical examples that appear in the shareholder reports of the other funds.
Please note that the expenses shown in the tables are meant to highlight your ongoing costs only, and do not reflect any transactional costs such as sales charges (loads). Therefore the second line in the table is useful in comparing ongoing costs only, and will not help you determine the relative total costs of owning different funds. In addition, if these transactional costs were included, your costs would have been higher.
| Beginning Account Value November 1, 2006 | Ending Account Value April 30, 2007 | Annualized Expense Ratio Based on the Six-Month Period | Expenses Paid During the Six-Month Period (1) | ||||||||||||||||
| PowerShares Aerospace & Defense Portfolio Actual | $ | 1,000.00 | $ | 1,150.45 | 0.66 | % | $ | 3.52 | |||||||||||
| Hypothetical (5% return before expenses) | $ | 1,000.00 | $ | 1,021.52 | 0.66 | % | $ | 3.31 | |||||||||||
| PowerShares CleantechTM Portfolio Actual | $ | 1,000.00 | $ | 1,082.77 | 0.71 | % | $ | 3.67 | |||||||||||
| Hypothetical (5% return before expenses) | $ | 1,000.00 | $ | 1,021.27 | 0.71 | % | $ | 3.56 | |||||||||||
| PowerShares Golden Dragon Halter USX China Portfolio Actual | $ | 1,000.00 | $ | 1,278.27 | 0.70 | % | $ | 3.95 | |||||||||||
| Hypothetical (5% return before expenses) | $ | 1,000.00 | $ | 1,021.32 | 0.70 | % | $ | 3.51 | |||||||||||
| PowerShares Listed Private Equity Portfolio Actual | $ | 1,000.00 | $ | 1,097.78 | 0.71 | % | $ | 3.69 | |||||||||||
| Hypothetical (5% return before expenses) | $ | 1,000.00 | $ | 1,021.27 | 0.71 | % | $ | 3.56 | |||||||||||
32
Fees and Expenses (Continued)
| Beginning Account Value November 1, 2006 | Ending Account Value April 30, 2007 | Annualized Expense Ratio Based on the Six-Month Period | Expenses Paid During the Six-Month Period (1) | ||||||||||||||||
| PowerShares Lux Nanotech Portfolio Actual | $ | 1,000.00 | $ | 945.38 | 0.70 | % | $ | 3.38 | |||||||||||
| Hypothetical (5% return before expenses) | $ | 1,000.00 | $ | 1,021.32 | 0.70 | % | $ | 3.51 | |||||||||||
| PowerShares Value Line TimelinessTM Select Portfolio Actual | $ | 1,000.00 | $ | 1,127.56 | 0.70 | % | $ | 3.69 | |||||||||||
| Hypothetical (5% return before expenses) | $ | 1,000.00 | $ | 1,021.32 | 0.70 | % | $ | 3.51 | |||||||||||
| Beginning Account Value December 1, 2006 (Commencement of Investment Operations) | Ending Account Value April 30, 2007 | Annualized Expense Ratio based on number of days in the period | Expenses Paid During Period (2) December 1, 2006 (Commencement of Investment Operations) to April 30, 2007 | ||||||||||||||||
| PowerShares Value Line Industry Rotation Portfolio Actual | $ | 1,000.00 | $ | 1,113.57 | 0.75 | % | $ | 3.26 | |||||||||||
| Hypothetical (5% return before expenses) | $ | 1,000.00 | $ | 1,021.08 | 0.75 | % | $ | 3.76 | |||||||||||
| Beginning Account Value November 1, 2006 | Ending Account Value April 30, 2007 | Annualized Expense Ratio Based on the Six-Month Period | Expenses Paid During the Six-Month Period (1) | ||||||||||||||||
| PowerShares Water Resource Portfolio Actual | $ | 1,000.00 | $ | 1,082.77 | 0.65 | % | $ | 3.36 | |||||||||||
| Hypothetical (5% return before expenses) | $ | 1,000.00 | $ | 1,021.57 | 0.65 | % | $ | 3.26 | |||||||||||
| PowerShares WilderHill Clean Energy Portfolio Actual | $ | 1,000.00 | $ | 1,081.69 | 0.69 | % | $ | 3.56 | |||||||||||
| Hypothetical (5% return before expenses) | $ | 1,000.00 | $ | 1,021.37 | 0.69 | % | $ | 3.46 | |||||||||||
| PowerShares WilderHill Progressive Energy Portfolio Actual | $ | 1,000.00 | $ | 1,138.66 | 0.74 | % | $ | 3.92 | |||||||||||
| Hypothetical (5% return before expenses) | $ | 1,000.00 | $ | 1,021.12 | 0.74 | % | $ | 3.71 | |||||||||||
33
Fees and Expenses (Continued)
| Beginning Account Value March 1, 2007 (Commencement of Investment Operations) | Ending Account Value April 30, 2007 | Annualized Expense Ratio based on number of days in the period | Expenses Paid During Period (3) March 1, 2007 (Commencement of Investment Operations) to April 30, 2007 | ||||||||||||||||
| PowerShares DWA Technical LeadersTM Portfolio Actual | $ | 1,000.00 | $ | 1,067.61 | 0.72 | % | $ | 1.26 | |||||||||||
| Hypothetical (5% return before expenses) | $ | 1,000.00 | $ | 1,021.22 | 0.72 | % | $ | 3.61 | |||||||||||
(1) Expenses are calculated using the annualized expense ratio, which represents the ongoing expenses as a percentage of net assets for the six months ended April 30, 2007. Expenses are calculated by multiplying the Fund's annualized expense ratio by the average account value for the period; then multiplying the result by 181 and then dividing the result by 365. Expense ratios for the most recent half-year may differ from expense ratios based on the one year data in the financial highlights.
(2) Expenses are calculated using the annualized expense ratio, which represents the ongoing expenses as a percentage of net assets for the period December 1, 2006 (commencement of investment operations) to April 30, 2007. Expenses are calculated by multiplying the Fund's annualized expense ratio by the average account value for the period; then multiplying the result by 151 and then dividing the result by 365.
(3) Expenses are calculated using the annualized expense ratio, which represents the ongoing expenses as a percentage of net assets for the period March 1, 2007 (commencement of investment operations) to April 30, 2007. Expenses are calculated by multiplying the Fund's annualized expense ratio by the average account value for the period; then multiplying the result by 61 and then dividing the result by 365.
34
Schedule of Investments
PowerShares Aerospace and Defense Portfolio
April 30, 2007
| Number of Shares | Value | ||||||||||
| Common Stocks—100.0% | |||||||||||
| Aerospace/Defense—49.0% | |||||||||||
| 18,224 | Aerovironment, Inc.* | $ | 389,994 | ||||||||
| 31,834 | Alliant Techsystems, Inc.* | 2,964,700 | |||||||||
| 21,522 | Argon ST, Inc.* | 564,092 | |||||||||
| 34,321 | Armor Holdings, Inc.* | 2,453,952 | |||||||||
| 125,271 | Boeing Co. | 11,650,203 | |||||||||
| 39,124 | DRS Technologies, Inc. | 1,968,328 | |||||||||
| 20,354 | EDO Corp. | 559,735 | |||||||||
| 24,696 | Esterline Technologies Corp.* | 1,030,564 | |||||||||
| 53,969 | GenCorp, Inc.* | 718,867 | |||||||||
| 113,029 | General Dynamics Corp. | 8,872,777 | |||||||||
| 121,043 | Goodrich Corp. | 6,880,084 | |||||||||
| 13,481 | Herley Industries, Inc.* | 208,281 | |||||||||
| 89,239 | L-3 Communications Holdings, Inc. | 8,025,263 | |||||||||
| 113,298 | Lockheed Martin Corp. | 10,892,470 | |||||||||
| 40,971 | Moog, Inc., Class A* | 1,742,087 | |||||||||
| 14,693 | MTC Technologies, Inc.* | 303,557 | |||||||||
| 117,122 | Northrop Grumman Corp. | 8,624,864 | |||||||||
| 57,073 | Orbital Sciences Corp.* | 1,191,114 | |||||||||
| 166,075 | Raytheon Co. | 8,891,656 | |||||||||
| 115,174 | Rockwell Collins, Inc. | 7,563,477 | |||||||||
| 33,643 | Teledyne Technologies, Inc.* | 1,483,993 | |||||||||
| 10,770 | United Industrial Corp. | 526,868 | |||||||||
| 171,525 | United Technologies Corp. | 11,514,473 | |||||||||
| 99,021,399 | |||||||||||
| Auto Manufacturers—2.7% | |||||||||||
| 65,474 | Force Protection, Inc.* | 1,420,786 | |||||||||
| 71,375 | Oshkosh Truck Corp. | 3,992,717 | |||||||||
| 5,413,503 | |||||||||||
| Commercial Services—1.3% | |||||||||||
| 55,031 | DynCorp International, Inc., Class A* | 825,465 | |||||||||
| 94,811 | SAIC, Inc.* | 1,734,093 | |||||||||
| 2,559,558 | |||||||||||
| Computers—5.8% | |||||||||||
| 29,702 | CACI International, Inc., Class A* | 1,358,272 | |||||||||
| 149,377 | Computer Sciences Corp.* | 8,296,399 | |||||||||
| 21,463 | Mercury Computer Systems, Inc.* | 291,253 | |||||||||
| 12,528 | SI International, Inc.* | 331,491 | |||||||||
| 54,693 | SRA International, Inc., Class A* | 1,336,150 | |||||||||
| 11,613,565 | |||||||||||
| Electronics—9.2% | |||||||||||
| 8,860 | American Science & Engineering, Inc.* | 416,420 | |||||||||
| 91,285 | Cogent, Inc.* | 1,281,641 | |||||||||
| 25,797 | Cubic Corp. | 519,294 | |||||||||
| 63,968 | FLIR Systems, Inc.* | 2,590,064 | |||||||||
| 143,384 | Garmin Ltd. (Cayman Islands) | 8,343,516 | |||||||||
| 70,070 | L-1 Identity Solutions, Inc.* | 1,346,745 | |||||||||
| 16,276 | OSI Systems, Inc.* | 429,849 | |||||||||
| 59,911 | Taser International, Inc.* | 517,032 | |||||||||
| 107,383 | Trimble Navigation Ltd.* | 3,079,744 | |||||||||
| 18,524,305 | |||||||||||
| Number of Shares | Value | ||||||||||
| Common Stocks (Continued) | |||||||||||
| Engineering & Construction—1.2% | |||||||||||
| 20,696 | Stanley, Inc.* | $ | 312,717 | ||||||||
| 50,691 | URS Corp.* | 2,215,196 | |||||||||
| 2,527,913 | |||||||||||
| Media—9.2% | |||||||||||
| 385,972 | DIRECTV Group (The), Inc.* | 9,201,573 | |||||||||
| 203,233 | EchoStar Communications Corp., Class A* | 9,456,432 | |||||||||
| 18,658,005 | |||||||||||
| Metal Fabricate/Hardware—4.1% | |||||||||||
| 14,002 | Ladish Co., Inc.* | 569,321 | |||||||||
| 74,346 | Precision Castparts Corp. | 7,740,162 | |||||||||
| 8,309,483 | |||||||||||
| Miscellaneous Manufacturing—10.6% | |||||||||||
| 26,204 | Ceradyne, Inc.* | 1,542,105 | |||||||||
| 214,519 | Honeywell International, Inc. | 11,622,640 | |||||||||
| 128,107 | ITT Corp. | 8,174,508 | |||||||||
| 21,339,253 | |||||||||||
| Packaging & Containers—2.5% | |||||||||||
| 99,612 | Ball Corp. | 5,049,332 | |||||||||
| Software—0.5% | |||||||||||
| 32,659 | ManTech International Corp., Class A* | 1,001,978 | |||||||||
| Telecommunications—3.9% | |||||||||||
| 11,719 | Applied Signal Technology, Inc. | 195,356 | |||||||||
| 129,456 | Harris Corp. | 6,647,565 | |||||||||
| 14,435 | KVH Industries, Inc.* | 134,967 | |||||||||
| 27,973 | ViaSat, Inc.* | 959,474 | |||||||||
| 7,937,362 | |||||||||||
| Total Common Stocks (Cost $181,276,150) | 201,955,656 | ||||||||||
| Money Market Fund—0.0% | |||||||||||
| 42,459 | Liquid Assets Portfolio Private Class** (Cost $42,459) | 42,459 | |||||||||
| Total Investments (Cost $181,318,609)—100.0% | 201,998,115 | ||||||||||
| Liabilities in excess of other assets—(0.0%) | (111,994 | ) | |||||||||
| Net Assets—100.0% | $ | 201,886,121 | |||||||||
* Non-income producing security.
** Affiliated investment.
See Notes to Financial Statements.
35
Schedule of Investments (Continued)
PowerShares Aerospace and Defense Portfolio
April 30, 2007
COUNTRY BREAKDOWN
April 30, 2007 (Unaudited)
| Value | Net Assets | ||||||||||
| United States | $ | 193,654,599 | 95.9 | % | |||||||
| Cayman Islands | 8,343,516 | 4.1 | |||||||||
| Total investments | 201,998,115 | 100.0 | |||||||||
| Liabilities in excess of other assets | (111,994 | ) | (0.0 | ) | |||||||
| Net Assets | $ | 201,886,121 | 100.0 | % | |||||||
See Notes to Financial Statements.
36
Schedule of Investments
PowerShares CleantechTM Portfolio
April 30, 2007
| Number of Shares | Value | ||||||||||
| Common Stocks—100.7% | |||||||||||
| Biotechnology—2.4% | |||||||||||
| 17,478 | Diversa Corp.* | $ | 127,065 | ||||||||
| 18,565 | Martek Biosciences Corp.* | 400,818 | |||||||||
| 527,883 | |||||||||||
| Building Materials—1.4% | |||||||||||
| 14,395 | Trex Co., Inc.* | 293,514 | |||||||||
| Chemicals—2.9% | |||||||||||
| 22,613 | Landec Corp.* | 287,411 | |||||||||
| 11,305 | Zoltek Cos., Inc.* | 344,124 | |||||||||
| 631,535 | |||||||||||
| Computers—1.2% | |||||||||||
| 11,622 | Echelon Corp.* | 150,505 | |||||||||
| 8,775 | Maxwell Technologies, Inc.* | 106,616 | |||||||||
| 257,121 | |||||||||||
| Electric—1.4% | |||||||||||
| 7,990 | Ormat Technologies, Inc. | 291,555 | |||||||||
| Electrical Components & Equipment—6.0% | |||||||||||
| 10,846 | American Superconductor Corp.* | 156,616 | |||||||||
| 16,189 | Color Kinetics, Inc.* | 327,827 | |||||||||
| 5,051 | Energy Conversion Devices, Inc.* | 178,856 | |||||||||
| 22,099 | EnerSys* | 359,993 | |||||||||
| 65,187 | Power-One, Inc.* | 277,697 | |||||||||
| 1,300,989 | |||||||||||
| Electronics—14.1% | |||||||||||
| 11,464 | Badger Meter, Inc. | 275,136 | |||||||||
| 9,558 | Dionex Corp.* | 659,502 | |||||||||
| 9,824 | Itron, Inc.* | 661,548 | |||||||||
| 23,830 | Trimble Navigation Ltd.* | 683,444 | |||||||||
| 15,658 | Woodward Governor Co. | 772,723 | |||||||||
| 3,052,353 | |||||||||||
| Energy - Alternate Sources—10.8% | |||||||||||
| 11,464 | First Solar, Inc.* | 687,726 | |||||||||
| 22,826 | Headwaters, Inc.* | 494,639 | |||||||||
| 8,353 | SunPower Corp., Class A* | 506,860 | |||||||||
| 17,943 | Suntech Power Holdings Co., Ltd. ADR (Cayman Islands)* | 650,972 | |||||||||
| 2,340,197 | |||||||||||
| Engineering & Construction—1.4% | |||||||||||
| 15,272 | Insituform Technologies, Inc., Class A* | 311,549 | |||||||||
| Environmental Control—10.1% | |||||||||||
| 10,905 | Clean Harbors, Inc.* | 507,301 | |||||||||
| 15,100 | Fuel Tech, Inc.* | 379,614 | |||||||||
| 26,196 | Nalco Holding Co. | 696,290 | |||||||||
| 29,471 | Tetra Tech, Inc.* | 613,586 | |||||||||
| 2,196,791 | |||||||||||
| Number of Shares | Value | ||||||||||
| Common Stocks (Continued) | |||||||||||
| Hand/Machine Tools—3.1% | |||||||||||
| 17,098 | Baldor Electric Co. | $ | 673,490 | ||||||||
| Machinery - Diversified—3.0% | |||||||||||
| 12,415 | Kadant, Inc.* | 340,791 | |||||||||
| 10,130 | Lindsay Corp. | 309,472 | |||||||||
| 650,263 | |||||||||||
| Miscellaneous Manufacturing—24.5% | |||||||||||
| 20,040 | Clarcor, Inc. | 632,062 | |||||||||
| 17,807 | Donaldson Co., Inc. | 639,627 | |||||||||
| 13,830 | ESCO Technologies, Inc.* | 630,095 | |||||||||
| 32,190 | Hexcel Corp.* | 698,523 | |||||||||
| 16,431 | Pall Corp. | 689,280 | |||||||||
| 11,809 | Roper Industries, Inc. | 662,013 | |||||||||
| 5,856 | Siemens AG ADR (Germany) | 708,401 | |||||||||
| 9,037 | SPX Corp. | 640,543 | |||||||||
| 5,300,544 | |||||||||||
| Office Furnishings—2.5% | |||||||||||
| 31,888 | Interface, Inc., Class A | 537,313 | |||||||||
| Oil & Gas Services—0.7% | |||||||||||
| 12,798 | Metretek Technologies, Inc.* | 158,055 | |||||||||
| Semiconductors—8.9% | |||||||||||
| 38,629 | Cree, Inc.* | 788,032 | |||||||||
| 16,390 | International Rectifier Corp.* | 578,239 | |||||||||
| 10,231 | MEMC Electronic Materials, Inc.* | 561,477 | |||||||||
| 1,927,748 | |||||||||||
| Telecommunications—3.0% | |||||||||||
| 27,558 | Corning, Inc.* | 653,676 | |||||||||
| Water—3.3% | |||||||||||
| 8,611 | Veolia Environnement ADR (France) | 710,321 | |||||||||
| Total Common Stocks (Cost $20,809,234) | 21,814,897 | ||||||||||
| Money Market Fund—0.0% | |||||||||||
| 7,092 | Liquid Assets Portfolio Private Class** (Cost $7,092) | 7,092 | |||||||||
| Total Investments (Cost $20,816,326)—100.7% | 21,821,989 | ||||||||||
| Liabilities in excess of other assets—(0.7%) | (159,169 | ) | |||||||||
| Net Assets—100.0% | $ | 21,662,820 | |||||||||
ADR American Depositary Receipt.
* Non-income producing security.
** Affiliated investment.
See Notes to Financial Statements.
37
Schedule of Investments (Continued)
PowerShares CleantechTM Portfolio
April 30, 2007
COUNTRY BREAKDOWN
April 30, 2007 (Unaudited)
| Value | Net Assets | ||||||||||
| United States | $ | 19,752,295 | 91.2 | % | |||||||
| France | 710,321 | 3.3 | |||||||||
| Germany | 708,401 | 3.2 | |||||||||
| Cayman Islands | 650,972 | 3.0 | |||||||||
| Total investments | 21,821,989 | 100.7 | |||||||||
| Liabilities in excess of other assets | (159,169 | ) | (0.7 | ) | |||||||
| Net Assets | $ | 21,662,820 | 100.0 | % | |||||||
See Notes to Financial Statements.
38
Schedule of Investments
PowerShares Golden Dragon Halter USX China Portfolio
April 30, 2007
| Number of Shares | Value | ||||||||||
| Common Stocks—99.7% | |||||||||||
| Consumer Discretionary—8.6% | |||||||||||
| 120,271 | Brilliance China Automotive Holdings Ltd. ADR* | $ | 2,567,786 | ||||||||
| 76,355 | China Automotive Systems, Inc.* | 573,426 | |||||||||
| 105,629 | Ctrip.com International Ltd. ADR | 7,491,209 | |||||||||
| 82,364 | eLong, Inc. ADR* | 801,402 | |||||||||
| 365,645 | Focus Media Holding Ltd. ADR* | 13,528,864 | |||||||||
| 105,685 | Home Inns & Hotels Management, Inc. ADR* | 3,621,825 | |||||||||
| 115,661 | New Oriental Education & Technology Group, Inc. ADR* | 5,060,169 | |||||||||
| 57,808 | SORL Auto Parts, Inc.* | 497,149 | |||||||||
| 34,141,830 | |||||||||||
| Consumer Staples—0.5% | |||||||||||
| 171,905 | New Dragon Asia Corp.* | 235,510 | |||||||||
| 76,918 | Origin Agritech Ltd.* | 665,341 | |||||||||
| 233,873 | Tiens Biotech Group USA, Inc.* | 975,250 | |||||||||
| 1,876,101 | |||||||||||
| Energy—18.7% | |||||||||||
| 201,804 | China Petroleum and Chemical Corp. ADR | 17,599,327 | |||||||||
| 202,574 | CNOOC Ltd. ADR | 17,334,257 | |||||||||
| 197,494 | PetroChina Co. Ltd. ADR | 22,146,977 | |||||||||
| 322,506 | Yanzhou Coal Mining Co. Ltd. ADR | 16,589,709 | |||||||||
| 73,670,270 | |||||||||||
| Financials—4.7% | |||||||||||
| 400,611 | China Life Insurance Co. Ltd. ADR | 18,564,314 | |||||||||
| Health Care—2.8% | |||||||||||
| 89,702 | China Medical Technologies, Inc. ADR* | 2,167,200 | |||||||||
| 23,075 | Chindex International, Inc.* | 463,577 | |||||||||
| 346,636 | Mindray Medical International Ltd. ADR | 7,976,094 | |||||||||
| 128,048 | Sinovac Biotech Ltd.* | 391,827 | |||||||||
| 10,998,698 | |||||||||||
| Industrials—13.3% | |||||||||||
| 89,957 | 51job, Inc. ADR* | 1,448,308 | |||||||||
| 89,407 | Canadian Solar, Inc.* | 952,185 | |||||||||
| 160,289 | China Bak Battery, Inc.* | 573,835 | |||||||||
| 159,566 | China Eastern Airlines Corp. Ltd. ADR* | 4,715,175 | |||||||||
| 286,821 | China Southern Airlines Co. Ltd. ADR* | 6,338,744 | |||||||||
| 122,186 | China Yuchai International Ltd. | 1,130,220 | |||||||||
| 49,224 | Deswell Industries, Inc. | 604,963 | |||||||||
| 464,477 | Guangshen Railway Co. Ltd. ADR | 16,995,213 | |||||||||
| 157,368 | Solarfun Power Holdings Co. Ltd. ADR* | 2,245,641 | |||||||||
| 479,377 | Suntech Power Holdings Co. Ltd. ADR* | 17,391,798 | |||||||||
| 52,396,082 | |||||||||||
| Information Technology—18.8% | |||||||||||
| 281,957 | Actions Semiconductor Co. Ltd. ADR* | 2,035,730 | |||||||||
| 143,536 | AsiaInfo Holdings, Inc.* | 1,103,792 | |||||||||
| 110,288 | Baidu.com ADR* | 13,408,814 | |||||||||
| 366,072 | CDC Corp., Class A* | 3,276,344 | |||||||||
| Number of Shares | Value | ||||||||||
| Common Stocks (Continued) | |||||||||||
| 66,443 | China Finance Online Co. Ltd. ADR* | $ | 449,155 | ||||||||
| 143,870 | China Techfaith Wireless Communication Technology Ltd. ADR* | 1,165,347 | |||||||||
| 108,540 | Comtech Group, Inc.* | 1,914,646 | |||||||||
| 73,105 | Hurray! Holding Co. Ltd. ADR* | 374,298 | |||||||||
| 75,214 | INTAC International, Inc.* | 535,524 | |||||||||
| 115,242 | KongZhong Corp. ADR* | 768,664 | |||||||||
| 146,893 | Nam Tai Electronics, Inc. | 1,903,733 | |||||||||
| 427,984 | Netease.com, Inc. ADR* | 7,737,950 | |||||||||
| 114,724 | Ninetowns Internet Technology Group Co. Ltd. ADR* | 491,019 | |||||||||
| 96,485 | Qiao Xing Universal Telephone, Inc.* | 1,592,003 | |||||||||
| 1,210,122 | Semiconductor Manufacturing International Corp. ADR* | 9,051,712 | |||||||||
| 232,749 | Shanda Interactive Entertainment Ltd. ADR* | 5,828,035 | |||||||||
| 178,810 | SINA Corp.* | 6,165,369 | |||||||||
| 120,268 | Sohu.com, Inc.* | 3,045,186 | |||||||||
| 29,261 | Telestone Technologies Corp.* | 220,921 | |||||||||
| 79,387 | The9 Ltd. ADR* | 3,247,722 | |||||||||
| 174,571 | Tom Online, Inc. ADR* | 2,615,074 | |||||||||
| 69,555 | Trina Solar Ltd. ADR* | 3,716,324 | |||||||||
| 396,182 | UTStarcom, Inc.* | 2,828,739 | |||||||||
| 141,765 | Webzen, Inc. ADR* | 593,995 | |||||||||
| 74,070,096 | |||||||||||
| Materials—8.4% | |||||||||||
| 658,934 | Aluminum Corp. of China Ltd. ADR | 19,142,032 | |||||||||
| 42,828 | Fuwei Films Holdings Co. Ltd.* | 426,995 | |||||||||
| 236,057 | Sinopec Shanghai Petrochemical Co. Ltd. ADR | 13,408,038 | |||||||||
| 32,977,065 | |||||||||||
| Telecommunication Services—19.1% | |||||||||||
| 505,320 | China Mobile Ltd. ADR | 22,744,453 | |||||||||
| 358,521 | China Netcom Group Corp. Ltd. ADR | 17,589,040 | |||||||||
| 346,885 | China Telecom Corp. Ltd. ADR | 16,386,847 | |||||||||
| 1,273,905 | China Unicom Ltd. ADR | 18,458,884 | |||||||||
| 84,341 | Linktone Ltd. ADR* | 298,567 | |||||||||
| 75,477,791 | |||||||||||
| Utilities—4.8% | |||||||||||
| 468,280 | Huaneng Power International, Inc. ADR | 19,007,485 | |||||||||
| Total Investments (Cost $360,111,785)—99.7% | 393,179,732 | ||||||||||
| Other assets less liabilities—0.3% | 1,140,639 | ||||||||||
| Net Assets—100.0% | $ | 394,320,371 | |||||||||
ADR American Depositary Receipt.
* Non-income producing security.
See Notes to Financial Statements.
39
Schedule of Investments (Continued)
PowerShares Golden Dragon Halter USX China Portfolio
April 30, 2007
COUNTRY BREAKDOWN
April 30, 2007 (Unaudited)
| Value | Net Assets | ||||||||||
| China | $ | 173,510,217 | 44.0 | % | |||||||
| Cayman Islands | 120,173,275 | 30.5 | |||||||||
| Hong Kong | 76,126,634 | 19.3 | |||||||||
| United States | 12,967,553 | 3.3 | |||||||||
| British Virgin Islands | 4,766,040 | 1.2 | |||||||||
| Bermuda | 3,698,006 | 0.9 | |||||||||
| Canada | 952,185 | 0.2 | |||||||||
| South Korea | 593,995 | 0.2 | |||||||||
| Antigua | 391,827 | 0.1 | |||||||||
| Total investments | 393,179,732 | 99.7 | |||||||||
| Other assets less liabilities | 1,140,639 | 0.3 | |||||||||
| Net Assets | $ | 394,320,371 | 100.0 | % | |||||||
See Notes to Financial Statements.
40
Schedule of Investments
PowerShares Listed Private Equity Portfolio
April 30, 2007
| Number of Shares | Value | ||||||||||
| Common Stocks—99.8% | |||||||||||
| Banks—6.2% | |||||||||||
| 182,345 | SVB Financial Group* | $ | 9,339,711 | ||||||||
| Commercial Services—6.0% | |||||||||||
| 128,168 | Compass Diversified Trust | 2,026,336 | |||||||||
| 164,242 | Macquarie Infrastructure Co. Trust | 6,993,424 | |||||||||
| 9,019,760 | |||||||||||
| Diversified Financial Services—19.3% | |||||||||||
| 41,133 | Affiliated Managers Group, Inc.* | 4,838,475 | |||||||||
| 120,826 | CIT Group, Inc. | 7,207,271 | |||||||||
| 141,274 | Evercore Partners, Inc., Class A | 4,088,470 | |||||||||
| 444,455 | Fortress Investment Group LLC, Class A | 12,893,639 | |||||||||
| 29,027,855 | |||||||||||
| Holding Companies - Diversified—8.5% | |||||||||||
| 420,931 | Leucadia National Corp. | 12,686,860 | |||||||||
| Internet—5.7% | |||||||||||
| 1,832,490 | CMGI, Inc.* | 3,848,229 | |||||||||
| 201,390 | Internet Capital Group, Inc.* | 2,410,638 | |||||||||
| 759,354 | Safeguard Scientifics, Inc.* | 2,285,656 | |||||||||
| 8,544,523 | |||||||||||
| Investment Companies—42.8% | |||||||||||
| 331,322 | Allied Capital Corp. | 9,575,206 | |||||||||
| 282,735 | American Capital Strategies Ltd. | 13,763,539 | |||||||||
| 327,953 | Apollo Investment Corp. | 7,205,127 | |||||||||
| 237,020 | Ares Capital Corp. | 4,256,879 | |||||||||
| 19,041 | Capital Southwest Corp. | 2,947,547 | |||||||||
| 78,999 | Gladstone Capital Corp. | 1,880,176 | |||||||||
| 124,260 | Gladstone Investment Corp. | 1,780,646 | |||||||||
| 43,246 | H&Q Healthcare Investors | 767,184 | |||||||||
| 26,227 | H&Q Life Sciences Investors | 379,505 | |||||||||
| 143,127 | Harris & Harris Group, Inc.* | 1,915,039 | |||||||||
| 136,871 | Hercules Technology Growth Capital, Inc. | 1,884,714 | |||||||||
| 114,765 | Kohlberg Capital Corp. | 2,058,884 | |||||||||
| 236,640 | MCG Capital Corp. | 4,169,597 | |||||||||
| 138,668 | MVC Capital, Inc. | 2,436,397 | |||||||||
| 116,485 | NGP Capital Resources Co. | 1,821,825 | |||||||||
| 132,456 | Patriot Capital Funding, Inc. | 1,882,200 | |||||||||
| 110,500 | Prospect Energy Corp. | 1,895,075 | |||||||||
| 129,058 | Technology Investment Capital Corp. | 2,182,371 | |||||||||
| 83,045 | UTEK Corp. | 1,403,460 | |||||||||
| 64,205,371 | |||||||||||
| REITS—11.3% | |||||||||||
| 388,688 | CapitalSource, Inc. | 10,016,490 | |||||||||
| 258,142 | KKR Financial Holdings LLC | 6,894,973 | |||||||||
| 16,911,463 | |||||||||||
| Total Common Stocks (Cost $144,981,833) | 149,735,543 | ||||||||||
| Number of Shares | Value | ||||||||||
| Money Market Fund—0.1% | |||||||||||
| 240,589 | Liquid Assets Portfolio Private Class** (Cost $240,589) | $ | 240,589 | ||||||||
| Total Investments (Cost $145,222,422)—99.9% | 149,976,132 | ||||||||||
| Other assets less liabilities—0.1% | 102,226 | ||||||||||
| Net Assets—100.0% | $ | 150,078,358 | |||||||||
REITS Real Estate Investment Trusts.
* Non-income producing security.
** Affiliated investment.
See Notes to Financial Statements.
41
Schedule of Investments
PowerShares Lux Nanotech Portfolio
April 30, 2007
| Number of Shares | Value | ||||||||||
| Common Stocks—100.0% | |||||||||||
| Auto Manufacturers—2.6% | |||||||||||
| 34,223 | Toyota Motor Corp. ADR (Japan) | $ | 4,155,357 | ||||||||
| Chemicals—11.8% | |||||||||||
| 59,814 | Air Products & Chemicals, Inc. | 4,575,771 | |||||||||
| 41,231 | BASF AG ADR (Germany) | 4,898,655 | |||||||||
| 90,182 | E.I. du Pont de Nemours & Co. | 4,434,249 | |||||||||
| 417,415 | Symyx Technologies* | 4,804,447 | |||||||||
| 18,713,122 | |||||||||||
| Commercial Services—11.3% | |||||||||||
| 2,297,049 | Altair Nanotechnologies, Inc. (Canada)* | 7,212,734 | |||||||||
| 1,655,079 | Arrowhead Research Corp.* | 10,658,709 | |||||||||
| 17,871,443 | |||||||||||
| Computers—9.7% | |||||||||||
| 1,166,183 | Cambridge Display Technology, Inc.* | 5,900,886 | |||||||||
| 111,658 | Hewlett-Packard Co. | 4,705,268 | |||||||||
| 47,420 | International Business Machines Corp. | 4,846,798 | |||||||||
| 15,452,952 | |||||||||||
| Electronics—9.5% | |||||||||||
| 210,388 | FEI Co.* | 7,826,433 | |||||||||
| 277,157 | NVE Corp.* | 7,239,341 | |||||||||
| 15,065,774 | |||||||||||
| Energy - Alternate Sources—4.6% | |||||||||||
| 339,769 | Headwaters, Inc.* | 7,362,794 | |||||||||
| Healthcare - Products—3.7% | |||||||||||
| 2,144,249 | Immunicon Corp.* | 5,789,472 | |||||||||
| Investment Companies—4.9% | |||||||||||
| 587,162 | Harris & Harris Group, Inc.* | 7,856,228 | |||||||||
| Miscellaneous Manufacturing—11.5% | |||||||||||
| 58,209 | 3M Co. | 4,817,959 | |||||||||
| 125,510 | General Electric Co. | 4,626,299 | |||||||||
| 1,318,307 | Nanophase Technologies Corp.* | 8,793,107 | |||||||||
| 18,237,365 | |||||||||||
| Pharmaceuticals—17.9% | |||||||||||
| 297,148 | Abraxis BioScience, Inc.* | 8,174,542 | |||||||||
| 565,269 | Elan Corp. PLC ADR (Ireland)* | 7,845,934 | |||||||||
| 290,542 | Flamel Technologies ADR (France)* | 8,399,569 | |||||||||
| 1,324,476 | NUCRYST Pharmaceuticals Corp. (Canada)* | 4,092,631 | |||||||||
| 28,512,676 | |||||||||||
| Semiconductors—7.7% | |||||||||||
| 235,678 | Intel Corp. | 5,067,077 | |||||||||
| 395,422 | Veeco Instruments, Inc.* | 7,228,314 | |||||||||
| 12,295,391 | |||||||||||
| Number of Shares | Value | ||||||||||
| Common Stocks (Continued) | |||||||||||
| Software—4.8% | |||||||||||
| 1,177,060 | Accelrys, Inc.* | $ | 7,674,431 | ||||||||
| Total Investments (Cost $163,571,016)—100.0% | 158,987,005 | ||||||||||
| Other assets less liabilities—0.0% | 65,315 | ||||||||||
| Net Assets—100.0% | $ | 159,052,320 | |||||||||
ADR American Depositary Receipt.
* Non-income producing security.
COUNTRY BREAKDOWN
April 30, 2007 (Unaudited)
| Value | Net Assets | ||||||||||
| United States | $ | 122,382,125 | 77.0 | % | |||||||
| Canada | 11,305,365 | 7.1 | |||||||||
| France | 8,399,569 | 5.3 | |||||||||
| Ireland | 7,845,934 | 4.9 | |||||||||
| Germany | 4,898,655 | 3.1 | |||||||||
| Japan | 4,155,357 | 2.6 | |||||||||
| Total investments | 158,987,005 | 100.0 | |||||||||
| Other assets less liabilities | 65,315 | 0.0 | |||||||||
| Net Assets | $ | 159,052,320 | 100.0 | % | |||||||
See Notes to Financial Statements.
42
Schedule of Investments
PowerShares Value Line Timeliness SelectTM Portfolio
April 30, 2007
| Number of Shares | Value | ||||||||||
| Common Stocks—100.0% | |||||||||||
| Consumer Discretionary—25.9% | |||||||||||
| 168,070 | American Eagle Outfitters, Inc. | $ | 4,953,023 | ||||||||
| 199,911 | Big Lots, Inc.* | 6,437,133 | |||||||||
| 106,769 | Coach, Inc.* | 5,213,530 | |||||||||
| 183,400 | DeVry, Inc. | 6,050,366 | |||||||||
| 229,552 | DIRECTV Group (The), Inc.* | 5,472,520 | |||||||||
| 179,068 | Hasbro, Inc. | 5,660,339 | |||||||||
| 197,965 | Mattel, Inc. | 5,602,410 | |||||||||
| 88,993 | Nordstrom, Inc. | 4,887,496 | |||||||||
| 93,774 | Phillips-Van Heusen Corp. | 5,241,967 | |||||||||
| 99,023 | Priceline.com, Inc.* | 5,509,640 | |||||||||
| 84,123 | Target Corp. | 4,994,383 | |||||||||
| 151,006 | Walt Disney (The) Co. | 5,282,190 | |||||||||
| 189,757 | Warnaco Group (The), Inc.* | 5,366,328 | |||||||||
| 70,671,325 | |||||||||||
| Consumer Staples—5.7% | |||||||||||
| 103,077 | NBTY, Inc.* | 5,093,035 | |||||||||
| 149,140 | Safeway, Inc. | 5,413,781 | |||||||||
| 116,411 | Walgreen Co. | 5,110,443 | |||||||||
| 15,617,259 | |||||||||||
| Financials—8.0% | |||||||||||
| 76,573 | American International Group, Inc. | 5,353,218 | |||||||||
| 125,024 | CNA Financial Corp.* | 5,834,870 | |||||||||
| 42,293 | Franklin Resources, Inc. | 5,553,494 | |||||||||
| 159,016 | Synovus Financial Corp. | 5,018,545 | |||||||||
| 21,760,127 | |||||||||||
| Health Care—16.3% | |||||||||||
| 79,551 | Amgen, Inc.* | 5,102,401 | |||||||||
| 193,226 | AMN Healthcare Services, Inc.* | 4,705,053 | |||||||||
| 174,131 | Cytyc Corp.* | 6,134,635 | |||||||||
| 162,318 | Immucor, Inc.* | 5,296,436 | |||||||||
| 221,786 | Schering-Plough Corp. | 7,037,270 | |||||||||
| 98,744 | Sepracor, Inc.* | 5,300,578 | |||||||||
| 83,683 | Stryker Corp. | 5,434,374 | |||||||||
| 61,752 | Zimmer Holdings, Inc.* | 5,587,321 | |||||||||
| 44,598,068 | |||||||||||
| Industrials—8.1% | |||||||||||
| 238,846 | Apogee Enterprises, Inc. | 5,751,412 | |||||||||
| 110,182 | Honeywell International, Inc. | 5,969,661 | |||||||||
| 159,747 | II-VI, Inc.* | 4,327,546 | |||||||||
| 158,358 | TeleTech Holdings, Inc.* | 5,974,847 | |||||||||
| 22,023,466 | |||||||||||
| Information Technology—24.1% | |||||||||||
| 193,776 | Cisco Systems, Inc.* | 5,181,570 | |||||||||
| 129,983 | Cognos, Inc. (Canada)* | 5,603,567 | |||||||||
| 148,058 | Flir Systems, Inc.* | 5,994,868 | |||||||||
| 241,129 | Gartner, Inc.* | 6,083,685 | |||||||||
| 162,229 | NVIDIA Corp.* | 5,335,712 | |||||||||
| 286,079 | PC Connection, Inc.* | 3,670,394 | |||||||||
| Number of Shares | Value | ||||||||||
| Common Stocks (Continued) | |||||||||||
| 155,794 | Polycom, Inc.* | $ | 5,187,940 | ||||||||
| 37,841 | Research In Motion Ltd. (Canada)* | 4,979,119 | |||||||||
| 145,990 | Telefonaktiebolaget LM Ericsson ADR (Sweden) | 5,572,438 | |||||||||
| 579,027 | TIBCO Software, Inc.* | 5,280,726 | |||||||||
| 109,547 | Varian Semiconductor Equipment Associates, Inc.* | 7,269,540 | |||||||||
| 295,135 | Xerox Corp.* | 5,459,998 | |||||||||
| 65,619,557 | |||||||||||
| Materials—7.8% | |||||||||||
| 100,869 | E.I. du Pont de Nemours & Co. | 4,959,729 | |||||||||
| 109,075 | International Flavors & Fragrances, Inc. | 5,308,680 | |||||||||
| 152,741 | Rock-Tenn Co., Class A | 5,843,870 | |||||||||
| 158,154 | Sealed Air Corp. | 5,203,267 | |||||||||
| 21,315,546 | |||||||||||
| Telecommunication Services—4.1% | |||||||||||
| 143,313 | AT&T, Inc. | 5,549,079 | |||||||||
| 88,560 | BT Group PLC ADR (United Kingdom) | 5,574,852 | |||||||||
| 11,123,931 | |||||||||||
| Total Investments (Cost $248,844,632)—100.0% | 272,729,279 | ||||||||||
| Liabilities in excess of other assets—0.0% | (121,700 | ) | |||||||||
| Net Assets—100.0% | $ | 272,607,579 | |||||||||
ADR American Depositary Receipt.
* Non-income producing security.
COUNTRY BREAKDOWN
April 30, 2007 (Unaudited)
| Value | Net Assets | ||||||||||
| United States | $ | 250,999,303 | 92.1 | % | |||||||
| Canada | 10,582,686 | 3.9 | |||||||||
| United Kingdom | 5,574,852 | 2.0 | |||||||||
| Sweden | 5,572,438 | 2.0 | |||||||||
| Total investments | 272,729,279 | 100.0 | |||||||||
| Liabilities in excess of other assets | (121,700 | ) | 0.0 | ||||||||
| Net Assets | $ | 272,607,579 | 100.0 | % | |||||||
See Notes to Financial Statements.
43
Schedule of Investments
PowerShares Value Line Industry Rotation Portfolio
April 30, 2007
| Number of Shares | Value | ||||||||||
| Common Stocks—99.9% | |||||||||||
| Advertising—2.7% | |||||||||||
| 4,280 | Omnicom Group, Inc. | $ | 448,159 | ||||||||
| 5,958 | WPP Group PLC ADR (United Kingdom) | 442,441 | |||||||||
| 890,600 | |||||||||||
| Aerospace/Defense—1.3% | |||||||||||
| 8,351 | DRS Technologies, Inc. | 420,139 | |||||||||
| Agriculture—1.5% | |||||||||||
| 8,282 | Universal Corp. | 519,116 | |||||||||
| Airlines—2.1% | |||||||||||
| 12,224 | AMR Corp.* | 318,924 | |||||||||
| 10,572 | Continental Airlines, Inc., Class B* | 386,512 | |||||||||
| 705,436 | |||||||||||
| Apparel—1.3% | |||||||||||
| 10,692 | Guess?, Inc. | 421,265 | |||||||||
| Biotechnology—1.3% | |||||||||||
| 6,870 | Amgen, Inc.* | 440,642 | |||||||||
| Chemicals—6.7% | |||||||||||
| 10,655 | Albemarle Corp. | 452,305 | |||||||||
| 9,621 | Cabot Corp. | 435,831 | |||||||||
| 8,590 | E.I. du Pont de Nemours and Co. | 422,370 | |||||||||
| 9,434 | International Flavors & Fragrances, Inc. | 459,153 | |||||||||
| 2,722 | Potash Corp. of Saskatchewan (Canada) | 488,654 | |||||||||
| 2,258,313 | |||||||||||
| Closed-end Funds—1.4% | |||||||||||
| 41,599 | DNP Select Income Fund, Inc. | 468,821 | |||||||||
| Commercial Services—8.3% | |||||||||||
| 16,079 | AMN Healthcare Services, Inc.* | 391,524 | |||||||||
| 15,722 | DeVry, Inc. | 518,668 | |||||||||
| 20,466 | Gartner, Inc.* | 516,357 | |||||||||
| 34,217 | On Assignment, Inc.* | 382,546 | |||||||||
| 3,704 | Strayer Education, Inc. | 460,555 | |||||||||
| 13,665 | TeleTech Holdings, Inc.* | 515,580 | |||||||||
| 2,785,230 | |||||||||||
| Computers—2.9% | |||||||||||
| 5,108 | Apple, Inc.* | 509,779 | |||||||||
| 15,710 | Electronic Data Systems Corp. | 459,360 | |||||||||
| 969,139 | |||||||||||
| Diversified Financial Services—2.7% | |||||||||||
| 23,667 | Charles Schwab (The) Corp. | 452,513 | |||||||||
| 5,621 | Morgan Stanley | 472,220 | |||||||||
| 924,733 | |||||||||||
| Electronics—5.4% | |||||||||||
| 12,376 | Avnet, Inc.* | 506,179 | |||||||||
| 13,251 | FEI Co.* | 492,937 | |||||||||
| 7,918 | Garmin Ltd. (Cayman Islands) | 460,748 | |||||||||
| Number of Shares | Value | ||||||||||
| Common Stocks (Continued) | |||||||||||
| 13,628 | II-VI, Inc.* | $ | 369,183 | ||||||||
| 1,829,047 | |||||||||||
| Forest Products & Paper—1.5% | |||||||||||
| 13,111 | Rock-Tenn Co., Class A | 501,627 | |||||||||
| Healthcare - Products—1.4% | |||||||||||
| 7,096 | Stryker Corp. | 460,814 | |||||||||
| Healthcare - Services—1.3% | |||||||||||
| 12,058 | LifePoint Hospitals, Inc.* | 440,238 | |||||||||
| Home Furnishings—1.4% | |||||||||||
| 8,709 | Sony Corp. ADR (Japan) | 463,841 | |||||||||
| Insurance—4.3% | |||||||||||
| 6,616 | American International Group, Inc. | 462,525 | |||||||||
| 10,835 | CNA Financial Corp. | 505,669 | |||||||||
| 6,243 | XL Capital Ltd., Class A (Cayman Islands) | 486,829 | |||||||||
| 1,455,023 | |||||||||||
| Internet—5.5% | |||||||||||
| 58,274 | 1-800-FLOWERS.COM, Inc., Class A* | 471,437 | |||||||||
| 29,729 | Emdeon Corp.* | 479,826 | |||||||||
| 27,937 | Interwoven, Inc.* | 426,598 | |||||||||
| 8,427 | Priceline.com, Inc.* | 468,878 | |||||||||
| 1,846,739 | |||||||||||
| Iron/Steel—1.4% | |||||||||||
| 4,220 | Allegheny Technologies, Inc. | 462,428 | |||||||||
| Leisure Time—1.4% | |||||||||||
| 11,957 | WMS Industries, Inc.* | 476,606 | |||||||||
| Lodging—1.3% | |||||||||||
| 6,269 | MGM MIRAGE* | 421,590 | |||||||||
| Media—9.6% | |||||||||||
| 16,874 | Comcast Corp., Class A* | 445,474 | |||||||||
| 19,892 | DIRECTV Group (The), Inc.* | 474,225 | |||||||||
| 33,840 | Journal Communications, Inc., Class A | 456,502 | |||||||||
| 7,634 | Meredith Corp. | 442,161 | |||||||||
| 18,322 | News Corp., Class B | 439,728 | |||||||||
| 9,082 | Reuters Group PLC ADR (United Kingdom) | 520,216 | |||||||||
| 12,953 | Walt Disney (The) Co. | 453,096 | |||||||||
| 3,231,402 | |||||||||||
| Metal Fabricate/Hardware—1.4% | |||||||||||
| 4,636 | Precision Castparts Corp. | 482,654 | |||||||||
| Mining—2.8% | |||||||||||
| 9,552 | Brush Engineered Materials, Inc.* | 458,687 | |||||||||
| 3,798 | Vulcan Materials Co. | 469,699 | |||||||||
| 928,386 | |||||||||||
See Notes to Financial Statements.
44
Schedule of Investments (Continued)
PowerShares Value Line Industry Rotation Portfolio
April 30, 2007
| Number of Shares | Value | ||||||||||
| Common Stocks (Continued) | |||||||||||
| Miscellaneous Manufacturing—1.5% | |||||||||||
| 9,542 | Honeywell International, Inc. | $ | 516,986 | ||||||||
| Office/Business Equipment—1.4% | |||||||||||
| 25,454 | Xerox Corp.* | 470,899 | |||||||||
| Oil & Gas Services—1.5% | |||||||||||
| 5,695 | Core Laboratories N.V. (Netherlands)* | 517,789 | |||||||||
| Packaging & Containers—1.3% | |||||||||||
| 13,623 | Sealed Air Corp. | 448,197 | |||||||||
| Pharmaceuticals—1.8% | |||||||||||
| 19,105 | Schering-Plough Corp. | 606,202 | |||||||||
| Real Estate—1.3% | |||||||||||
| 12,583 | CB Richard Ellis Group, Inc., Class A* | 425,935 | |||||||||
| Retail—7.8% | |||||||||||
| 3,475 | AutoZone, Inc.* | 462,313 | |||||||||
| 16,043 | Carmax, Inc.* | 399,792 | |||||||||
| 6,268 | Kohl's Corp.* | 464,082 | |||||||||
| 7,816 | Nordstrom, Inc. | 429,255 | |||||||||
| 8,615 | OfficeMax, Inc. | 424,030 | |||||||||
| 10,042 | Walgreen Co. | 440,844 | |||||||||
| 2,620,316 | |||||||||||
| Semiconductors—4.2% | |||||||||||
| 13,134 | ATMI, Inc.* | 406,235 | |||||||||
| 26,677 | Integrated Device Technology, Inc.* | 399,621 | |||||||||
| 9,229 | Varian Semiconductor Equipment Associates, Inc.* | 612,437 | |||||||||
| 1,418,293 | |||||||||||
| Software—1.2% | |||||||||||
| 7,887 | Infosys Technologies Ltd. ADR (India) | 412,884 | |||||||||
| Telecommunications—4.1% | |||||||||||
| 12,298 | AT&T, Inc. | 476,179 | |||||||||
| 7,523 | BT Group PLC ADR (United Kingdom) | 473,573 | |||||||||
| 16,541 | Cisco Systems, Inc.* | 442,306 | |||||||||
| 1,392,058 | |||||||||||
| Toys/Games/Hobbies—1.4% | |||||||||||
| 16,899 | Mattel, Inc. | 478,242 | |||||||||
| Transportation—1.5% | |||||||||||
| 13,372 | Kansas City Southern* | 496,770 | |||||||||
| Total Common Stocks (Cost $31,869,464) | 33,608,400 | ||||||||||
| Number of Shares | Value | ||||||||||
| Money Market Fund—0.1% | |||||||||||
| 31,821 | Liquid Assets Portfolio Private Class** (Cost $31,821) | $ | 31,821 | ||||||||
| Total Investments (Cost $31,901,285)—100.0% | 33,640,221 | ||||||||||
| Other assets less liabilities—0.0% | 9,598 | ||||||||||
| Net Assets—100.0% | $ | 33,649,819 | |||||||||
ADR American Depositary Receipt.
* Non-income producing security.
** Affiliated investment.
COUNTRY BREAKDOWN
April 30, 2007 (Unaudited)
| Value | Net Assets | ||||||||||
| United States | $ | 29,373,246 | 87.3 | % | |||||||
| United Kingdom | 1,436,230 | 4.3 | |||||||||
| Cayman Islands | 947,577 | 2.8 | |||||||||
| Netherlands | 517,789 | 1.5 | |||||||||
| Canada | 488,654 | 1.5 | |||||||||
| Japan | 463,841 | 1.4 | |||||||||
| India | 412,884 | 1.2 | |||||||||
| Total investments | 33,640,221 | 100.0 | |||||||||
| Other assets less liabilities | 9,598 | 0.0 | |||||||||
| Net Assets | $ | 33,649,819 | 100.0 | % | |||||||
See Notes to Financial Statements.
45
Schedule of Investments
PowerShares Water Resources Portfolio
April 30, 2007
| Number of Shares | Value | ||||||||||
| Common Stocks—99.8% | |||||||||||
| Biotechnology—2.5% | |||||||||||
| 540,751 | Millipore Corp.* | $ | 39,923,646 | ||||||||
| Chemicals—1.4% | |||||||||||
| 380,411 | Ashland, Inc. | 22,805,639 | |||||||||
| Electric—1.7% | |||||||||||
| 474,801 | Suez SA ADR (France) | 27,111,137 | |||||||||
| Electrical Components & Equipment—1.7% | |||||||||||
| 585,555 | Emerson Electric Co. | 27,515,229 | |||||||||
| Electronics—11.7% | |||||||||||
| 1,245,236 | Agilent Technologies, Inc.* | 42,798,761 | |||||||||
| 1,339,422 | Badger Meter, Inc. | 32,146,128 | |||||||||
| 917,975 | Itron, Inc.* | 61,816,437 | |||||||||
| 1,263,486 | Watts Water Technologies, Inc., Class A | 51,171,183 | |||||||||
| 187,932,509 | |||||||||||
| Engineering & Construction—9.7% | |||||||||||
| 1,964,730 | Insituform Technologies, Inc., Class A* | 40,080,492 | |||||||||
| 1,446,668 | Layne Christensen Co.* | 54,785,317 | |||||||||
| 1,386,763 | URS Corp.* | 60,601,543 | |||||||||
| 155,467,352 | |||||||||||
| Environmental Control—9.0% | |||||||||||
| 3,850,728 | Calgon Carbon Corp.* | 30,459,259 | |||||||||
| 1,609,784 | Nalco Holding Co. | 42,788,059 | |||||||||
| 3,457,891 | Tetra Tech, Inc.* | 71,993,291 | |||||||||
| 145,240,609 | |||||||||||
| Hand/Machine Tools—2.7% | |||||||||||
| 1,022,205 | Franklin Electric Co., Inc. | 43,535,711 | |||||||||
| Healthcare - Products—1.6% | |||||||||||
| 290,039 | IDEXX Laboratories, Inc.* | 26,152,817 | |||||||||
| Machinery - Diversified—8.3% | |||||||||||
| 439,038 | Flowserve Corp. | 26,785,708 | |||||||||
| 686,959 | Gorman-Rupp (The) Co. | 22,030,775 | |||||||||
| 963,008 | IDEX Corp. | 50,529,031 | |||||||||
| 1,093,226 | Lindsay Corp. | 33,398,054 | |||||||||
| 132,743,568 | |||||||||||
| Metal Fabricate/Hardware—7.5% | |||||||||||
| 3,463,190 | Mueller Water Products, Inc., Class B | 49,627,513 | |||||||||
| 1,118,421 | Valmont Industries, Inc. | 70,326,312 | |||||||||
| 119,953,825 | |||||||||||
| Miscellaneous Manufacturing—20.8% | |||||||||||
| 385,373 | Ameron International Corp. | 26,644,689 | |||||||||
| 584,391 | Danaher Corp. | 41,602,795 | |||||||||
| 702,050 | General Electric Co. | 25,877,563 | |||||||||
| 642,639 | ITT Corp. | 41,006,795 | |||||||||
| Number of Shares | Value | ||||||||||
| Common Stocks (Continued) | |||||||||||
| 1,009,696 | Pall Corp. | $ | 42,356,747 | ||||||||
| 1,275,214 | Pentair, Inc. | 40,985,378 | |||||||||
| 1,149,115 | PW Eagle, Inc. | 37,277,291 | |||||||||
| 898,477 | Roper Industries, Inc. | 50,368,620 | |||||||||
| 231,350 | Siemens AG ADR (Germany) | 27,986,410 | |||||||||
| 334,106,288 | |||||||||||
| Water—21.2% | |||||||||||
| 979,458 | American States Water Co. | 34,907,883 | |||||||||
| 1,670,625 | Aqua America, Inc. | 36,937,519 | |||||||||
| 936,153 | California Water Service Group | 36,388,267 | |||||||||
| 1,083,030 | Companhia de Saneamento Basico do Estado de Sao Paulo ADR (Brazil) | 37,418,687 | |||||||||
| 1,140,438 | Consolidated Water Co., Ltd. (Cayman Islands) | 29,548,749 | |||||||||
| 842,916 | SJW Corp. | 29,215,469 | |||||||||
| 2,295,164 | Southwest Water Co. | 31,191,279 | |||||||||
| 1,280,643 | United Utilities PLC ADR (United Kingdom) | 38,432,096 | |||||||||
| 809,970 | Veolia Environnement ADR (France) | 66,814,424 | |||||||||
| 340,854,373 | |||||||||||
| Total Common Stocks (Cost $1,479,589,297) | 1,603,342,703 | ||||||||||
| Money Market Fund—0.0% | |||||||||||
| 182,440 | Liquid Assets Portfolio Private Class** (Cost $182,440) | 182,440 | |||||||||
| Total Investments (Cost $1,479,771,737)—99.8% | 1,603,525,143 | ||||||||||
| Other assets less liabilities—0.2% | 3,256,540 | ||||||||||
| Net Assets—100.0% | $ | 1,606,781,683 | |||||||||
ADR American Depositary Receipt.
* Non-income producing security.
** Affiliated investment.
COUNTRY BREAKDOWN
April 30, 2007 (Unaudited)
| Value | Net Assets | ||||||||||
| United States | $ | 1,376,213,640 | 85.7 | % | |||||||
| France | 93,925,561 | 5.9 | |||||||||
| United Kingdom | 38,432,096 | 2.4 | |||||||||
| Brazil | 37,418,687 | 2.3 | |||||||||
| Cayman Islands | 29,548,749 | 1.8 | |||||||||
| Germany | 27,986,410 | 1.7 | |||||||||
| Total investments | 1,603,525,143 | 99.8 | |||||||||
| Other assets less liabilities | �� | 3,256,540 | 0.2 | ||||||||
| Net Assets | $ | 1,606,781,683 | 100.0 | % | |||||||
See Notes to Financial Statements.
46
Schedule of Investments
PowerShares WilderHill Clean Energy Portfolio
April 30, 2007
| Number of Shares | Value | ||||||||||
| Common Stocks—99.9% | |||||||||||
| Agriculture—2.5% | |||||||||||
| 501,880 | Andersons (The), Inc. | $ | 23,312,326 | ||||||||
| Auto Parts & Equipment—2.7% | |||||||||||
| 1,456,571 | Fuel Systems Solutions, Inc.* | 24,616,050 | |||||||||
| Biotechnology—2.7% | |||||||||||
| 3,346,375 | Diversa Corp.* | 24,328,146 | |||||||||
| Chemicals—10.9% | |||||||||||
| 296,316 | Air Products & Chemicals, Inc. | 22,668,174 | |||||||||
| 562,471 | OM Group, Inc.* | 29,546,601 | |||||||||
| 348,964 | Praxair, Inc. | 22,525,626 | |||||||||
| 826,006 | Zoltek Cos., Inc.* | 25,143,623 | |||||||||
| 99,884,024 | |||||||||||
| Computers—6.0% | |||||||||||
| 2,684,280 | Echelon Corp.* | 34,761,426 | |||||||||
| 1,611,374 | Maxwell Technologies, Inc.* | 19,578,194 | |||||||||
| 54,339,620 | |||||||||||
| Electric—7.8% | |||||||||||
| 676,346 | IDACORP, Inc. | 23,300,120 | |||||||||
| 683,820 | Ormat Technologies, Inc. | 24,952,591 | |||||||||
| 895,890 | Puget Energy, Inc. | 23,131,880 | |||||||||
| 71,384,591 | |||||||||||
| Electrical Components & Equipment—15.1% | |||||||||||
| 2,512,359 | Active Power, Inc.* | 4,446,875 | |||||||||
| 1,837,196 | American Superconductor Corp.* | 26,529,110 | |||||||||
| 4,627,859 | Capstone Turbine Corp.* | 4,627,859 | |||||||||
| 1,356,936 | Color Kinetics, Inc.* | 27,477,954 | |||||||||
| 708,626 | Energy Conversion Devices, Inc.* | 25,092,447 | |||||||||
| 1,099,476 | Medis Technologies Ltd.* | 16,788,999 | |||||||||
| 446,186 | Ultralife Batteries, Inc.* | 4,185,225 | |||||||||
| 1,849,413 | Universal Display Corp.* | 28,813,854 | |||||||||
| 137,962,323 | |||||||||||
| Electronics—6.6% | |||||||||||
| 411,642 | Itron, Inc.* | 27,719,972 | |||||||||
| 290,125 | KYOCERA Corp. ADR (Japan) | 28,287,188 | |||||||||
| 1,025,084 | UQM Technologies, Inc.* | 4,336,105 | |||||||||
| 60,343,265 | |||||||||||
| Energy - Alternate Sources—27.4% | |||||||||||
| 3,310,155 | Ballard Power Systems, Inc. (Canada)* | 16,550,775 | |||||||||
| 625,314 | EuroTrust A/S ADR (Denmark)* | 10,442,744 | |||||||||
| 2,726,014 | Evergreen Solar, Inc.* | 26,633,157 | |||||||||
| 495,334 | First Solar, Inc.* | 29,715,087 | |||||||||
| 2,236,067 | FuelCell Energy, Inc.* | 15,741,912 | |||||||||
| 1,165,708 | MGP Ingredients, Inc. | 23,209,246 | |||||||||
| 1,383,919 | Pacific Ethanol, Inc.* | 20,482,001 | |||||||||
| 6,066,802 | Plug Power, Inc.* | 19,171,094 | |||||||||
| 610,219 | SunPower Corp., Class A* | 37,028,090 | |||||||||
| Number of Shares | Value | ||||||||||
| Common Stocks (Continued) | |||||||||||
| 775,444 | Suntech Power Holdings Co., Ltd. ADR (Cayman Islands)* | $ | 28,133,108 | ||||||||
| 1,166,931 | VeraSun Energy Corp.* | 23,256,935 | |||||||||
| 250,364,149 | |||||||||||
| Semiconductors—18.2% | |||||||||||
| 1,459,102 | Applied Materials, Inc. | 28,043,940 | |||||||||
| 1,624,392 | Cree, Inc.* | 33,137,597 | |||||||||
| 1,456,959 | Cypress Semiconductor Corp.* | 33,247,804 | |||||||||
| 4,825,665 | Emcore Corp.* | 23,887,042 | |||||||||
| 691,446 | International Rectifier Corp.* | 24,394,215 | |||||||||
| 439,135 | MEMC Electronic Materials, Inc.* | 24,099,729 | |||||||||
| 166,810,327 | |||||||||||
| Total Investments (Cost $884,874,304)—99.9% | 913,344,821 | ||||||||||
| Other assets less liabilities—0.1% | 999,972 | ||||||||||
| Net Assets—100.0% | $ | 914,344,793 | |||||||||
ADR American Depositary Receipt.
* Non-income producing security.
COUNTRY BREAKDOWN
April 30, 2007 (Unaudited)
| Value | Net Assets | ||||||||||
| United States | $ | 829,931,006 | 90.8 | % | |||||||
| Japan | 28,287,188 | 3.1 | |||||||||
| Cayman Islands | 28,133,108 | 3.1 | |||||||||
| Canada | 16,550,775 | 1.8 | |||||||||
| Denmark | 10,442,744 | 1.1 | |||||||||
| Total investments | 913,344,821 | 99.9 | |||||||||
| Other assets less liabilities | 999,972 | 0.1 | |||||||||
| Net Assets | $ | 914,344,793 | 100.0 | % | |||||||
See Notes to Financial Statements.
47
Schedule of Investments
PowerShares WilderHill Progressive Energy Portfolio
April 30, 2007
| Number of Shares | Value | ||||||||||
| Common Stocks—100.2% | |||||||||||
| Aerospace/Defense—2.1% | |||||||||||
| 7,072 | United Technologies Corp. | $ | 474,743 | ||||||||
| Auto Manufacturers—4.0% | |||||||||||
| 13,577 | Honda Motor Co. Ltd. ADR (Japan) | 467,456 | |||||||||
| 3,703 | Toyota Motor Corp. ADR (Japan) | 449,618 | |||||||||
| 917,074 | |||||||||||
| Auto Parts & Equipment—8.5% | |||||||||||
| 69,595 | Exide Technologies* | 654,889 | |||||||||
| 5,145 | Johnson Controls, Inc. | 526,488 | |||||||||
| 25,568 | Tenneco, Inc.* | 765,761 | |||||||||
| 1,947,138 | |||||||||||
| Chemicals—5.5% | |||||||||||
| 27,104 | Methanex Corp. (Canada) | 649,954 | |||||||||
| 45,974 | SGL Carbon AG ADR (Germany)* | 604,098 | |||||||||
| 1,254,052 | |||||||||||
| Electric—9.9% | |||||||||||
| 9,656 | Alliant Energy Corp. | 422,933 | |||||||||
| 9,570 | CPFL Energia S.A. ADR (Brazil) | 452,757 | |||||||||
| 26,853 | Enersis S.A. ADR (Chile) | 508,595 | |||||||||
| 7,067 | FPL Group, Inc. | 454,903 | |||||||||
| 8,886 | Wisconsin Energy Corp. | 433,548 | |||||||||
| 2,272,736 | |||||||||||
| Electrical Components & Equipment—11.3% | |||||||||||
| 6,831 | Energizer Holdings, Inc.* | 663,838 | |||||||||
| 34,184 | EnerSys* | 556,857 | |||||||||
| 52,365 | GrafTech International Ltd.* | 522,603 | |||||||||
| 81,028 | Power-One, Inc.* | 345,179 | |||||||||
| 45,837 | Vicor Corp. | 491,373 | |||||||||
| 2,579,850 | |||||||||||
| Electronics—0.4% | |||||||||||
| 3,946 | Badger Meter, Inc. | 94,704 | |||||||||
| Energy - Alternate Sources—7.9% | |||||||||||
| 34,068 | Aventine Renewable Energy Holdings, Inc.* | 654,447 | |||||||||
| 21,341 | Covanta Holding Corp.* | 523,708 | |||||||||
| 29,338 | Headwaters, Inc.* | 635,754 | |||||||||
| 1,813,909 | |||||||||||
| Environmental Control—4.9% | |||||||||||
| 26,276 | Fuel Tech, Inc.* | 660,579 | |||||||||
| 194,250 | Rentech, Inc.* | 466,200 | |||||||||
| 1,126,779 | |||||||||||
| Food—2.8% | |||||||||||
| 49,963 | SunOpta, Inc. (Canada)* | 646,521 | |||||||||
| Number of Shares | Value | ||||||||||
| Common Stocks (Continued) | |||||||||||
| Gas—5.9% | |||||||||||
| 10,609 | KeySpan Corp. | $ | 439,319 | ||||||||
| 9,497 | Northwest Natural Gas Co. | 482,542 | |||||||||
| 16,362 | Piedmont Natural Gas Co., Inc. | 431,793 | |||||||||
| 1,353,654 | |||||||||||
| Hand/Machine Tools—2.2% | |||||||||||
| 12,568 | Baldor Electric Co. | 495,054 | |||||||||
| Investment Companies—0.5% | |||||||||||
| 8,450 | Harris & Harris Group, Inc.* | 113,061 | |||||||||
| Mining—6.4% | |||||||||||
| 15,220 | Cameco Corp. (Canada) | 709,556 | |||||||||
| 37,597 | USEC, Inc.* | 758,332 | |||||||||
| 1,467,888 | |||||||||||
| Miscellaneous Manufacturing—6.9% | |||||||||||
| 5,782 | Eaton Corp. | 515,812 | |||||||||
| 24,432 | Hexcel Corp.* | 530,174 | |||||||||
| 4,475 | Siemens AG ADR (Germany) | 541,341 | |||||||||
| 1,587,327 | |||||||||||
| Oil & Gas—8.3% | |||||||||||
| 8,512 | BG Group PLC ADR (United Kingdom) | 612,268 | |||||||||
| 19,500 | Chesapeake Energy Corp. | 658,125 | |||||||||
| 18,365 | Sasol Ltd. ADR (South Africa) | 627,532 | |||||||||
| 1,897,925 | |||||||||||
| Oil & Gas Services—0.4% | |||||||||||
| 8,258 | Metretek Technologies, Inc.* | 101,986 | |||||||||
| Semiconductors—10.1% | |||||||||||
| 45,416 | Entegris, Inc.* | 532,276 | |||||||||
| 27,151 | Fairchild Semiconductor International, Inc.* | 477,858 | |||||||||
| 10,449 | IXYS Corp.* | 95,713 | |||||||||
| 14,324 | Linear Technology Corp. | 536,003 | |||||||||
| 14,430 | O2Micro International Ltd. ADR (Cayman Islands)* | 149,495 | |||||||||
| 48,701 | ON Semiconductor Corp.* | 521,588 | |||||||||
| 2,312,933 | |||||||||||
| Telecommunications—2.2% | |||||||||||
| 21,055 | Corning, Inc.* | 499,425 | |||||||||
| Total Common Stocks (Cost $21,119,496) | 22,956,759 | ||||||||||
See Notes to Financial Statements.
48
Schedule of Investments (Continued)
PowerShares WilderHill Progressive Energy Portfolio
April 30, 2007
| Number of Shares | Value | ||||||||||
| Money Market Fund—0.3% | |||||||||||
| 57,665 | Liquid Assets Portfolio Private Class** (Cost $57,665) | $ | 57,665 | ||||||||
| Total Investments (Cost $21,177,161)—100.5% | 23,014,424 | ||||||||||
| Liabilities in excess of other assets—(0.5%) | (109,767 | ) | |||||||||
| Net Assets—100.0% | $ | 22,904,657 | |||||||||
ADR American Depositary Receipt.
* Non-income producing security.
** Affiliated investment.
COUNTRY BREAKDOWN
April 30, 2007 (Unaudited)
| Value | Net Assets | ||||||||||
| United States | $ | 16,595,233 | 72.4 | % | |||||||
| Canada | 2,006,031 | 8.8 | |||||||||
| Germany | 1,145,439 | 5.0 | |||||||||
| Japan | 917,074 | 4.0 | |||||||||
| South Africa | 627,532 | 2.7 | |||||||||
| United Kingdom | 612,268 | 2.7 | |||||||||
| Chile | 508,595 | 2.2 | |||||||||
| Brazil | 452,757 | 2.0 | |||||||||
| Cayman Islands | 149,495 | 0.7 | |||||||||
| Total investments | 23,014,424 | 100.5 | |||||||||
| Liabilities in excess of other assets | (109,767 | ) | (0.5 | ) | |||||||
| Net Assets | $ | 22,904,657 | 100.0 | % | |||||||
See Notes to Financial Statements.
49
Schedule of Investments
PowerShares DWA Technical LeadersTM Portfolio
April 30, 2007
| Number of Shares | Value | ||||||||||
| Common Stocks—99.8% | |||||||||||
| Consumer Discretionary—12.8% | |||||||||||
| 6,058 | BorgWarner, Inc. | $ | 471,979 | ||||||||
| 27,419 | Coach, Inc.* | 1,338,870 | |||||||||
| 8,676 | Dick's Sporting Goods, Inc.* | 486,637 | |||||||||
| 13,814 | GameStop Corp., Class A* | 458,210 | |||||||||
| 10,076 | Harman International Industries, Inc. | 1,228,164 | |||||||||
| 13,571 | Hilton Hotels Corp. | 461,414 | |||||||||
| 23,638 | International Game Technology | 901,553 | |||||||||
| 39,322 | Jarden Corp.* | 1,657,028 | |||||||||
| 11,915 | KB Home | 525,571 | |||||||||
| 7,302 | MGM MIRAGE* | 491,060 | |||||||||
| 7,230 | Polo Ralph Lauren Corp. | 665,955 | |||||||||
| 6,519 | R.H. Donnelley Corp.* | 509,069 | |||||||||
| 4,389 | Sears Holdings Corp.* | 837,904 | |||||||||
| 25,455 | Urban Outfitters, Inc.* | 655,721 | |||||||||
| 5,441 | Wynn Resorts Ltd. | 556,125 | |||||||||
| 8,277 | Yum! Brands, Inc. | 512,015 | |||||||||
| 11,757,275 | |||||||||||
| Consumer Staples—3.3% | |||||||||||
| 9,758 | Church & Dwight Co., Inc. | 495,023 | |||||||||
| 12,779 | Dean Foods Co.* | 465,539 | |||||||||
| 21,020 | Energizer Holdings, Inc.* | 2,042,724 | |||||||||
| 3,003,286 | |||||||||||
| Energy—9.0% | |||||||||||
| 80,666 | Holly Corp. | 5,130,357 | |||||||||
| 9,997 | Noble Energy, Inc. | 587,924 | |||||||||
| 61,316 | Williams (The) Cos., Inc. | 1,808,822 | |||||||||
| 13,522 | XTO Energy, Inc. | 733,839 | |||||||||
| 8,260,942 | |||||||||||
| Financials—17.1% | |||||||||||
| 5,579 | Affiliated Managers Group, Inc.* | 656,258 | |||||||||
| 8,139 | Bank of Hawaii Corp. | 430,553 | |||||||||
| 6,058 | BlackRock, Inc. | 906,883 | |||||||||
| 1,409 | Chicago Mercantile Exchange Holdings, Inc., Class A | 728,101 | |||||||||
| 8,206 | Developers Diversified Realty Corp. | 534,211 | |||||||||
| 25,230 | Eaton Vance Corp. | 964,291 | |||||||||
| 5,472 | Federal Realty Investment Trust | 493,410 | |||||||||
| 8,886 | First American Corp. | 457,629 | |||||||||
| 11,653 | Forest City Enterprises, Inc., Class A | 778,537 | |||||||||
| 3,633 | Franklin Resources, Inc. | 477,049 | |||||||||
| 11,182 | General Growth Properties, Inc. | 713,971 | |||||||||
| 47,794 | Hudson City Bancorp, Inc. | 636,616 | |||||||||
| 9,881 | Jones Lang LaSalle, Inc. | 1,062,108 | |||||||||
| 8,783 | Kimco Realty Corp. | 422,199 | |||||||||
| 5,186 | Macerich (The) Co. | 493,292 | |||||||||
| 13,678 | Marshall & Ilsley Corp. | 656,818 | |||||||||
| 24,922 | People's United Financial, Inc. | 496,197 | |||||||||
| 21,185 | Philadelphia Consolidated Holding Corp.* | 919,429 | |||||||||
| 4,632 | Public Storage, Inc. | 432,258 | |||||||||
| Number of Shares | Value | ||||||||||
| Common Stocks (Continued) | |||||||||||
| 5,181 | Regency Centers Corp. | $ | 426,914 | ||||||||
| 4,313 | Simon Property Group, Inc. | 497,203 | |||||||||
| 4,864 | SL Green Realty Corp. | 685,338 | |||||||||
| 9,018 | Taubman Centers, Inc. | 505,459 | |||||||||
| 32,843 | Ventas, Inc. | 1,384,660 | |||||||||
| 15,759,384 | |||||||||||
| Health Care—8.0% | |||||||||||
| 14,740 | Aetna, Inc. | 691,011 | |||||||||
| 21,298 | Celgene Corp.* | 1,302,585 | |||||||||
| 13,379 | Covance, Inc.* | 809,430 | |||||||||
| 5,289 | C.R. Bard, Inc. | 439,675 | |||||||||
| 12,480 | Gilead Sciences, Inc.* | 1,019,866 | |||||||||
| 13,794 | Health Net, Inc.* | 745,704 | |||||||||
| 14,179 | Henry Schein, Inc.* | 739,151 | |||||||||
| 28,819 | Pediatrix Medical Group, Inc.* | 1,644,123 | |||||||||
| 7,391,545 | |||||||||||
| Industrials—17.0% | |||||||||||
| 6,081 | Alliant Techsystems, Inc.* | 566,324 | |||||||||
| 8,779 | American Standard Cos., Inc. | 483,372 | |||||||||
| 17,482 | AMETEK, Inc. | 634,247 | |||||||||
| 8,568 | Brink's (The) Co. | 544,068 | |||||||||
| 17,666 | C.H. Robinson Worldwide, Inc. | 944,424 | |||||||||
| 19,449 | Corrections Corp. of America* | 1,104,703 | |||||||||
| 81,143 | Covanta Holding Corp.* | 1,991,248 | |||||||||
| 5,221 | Dun & Bradstreet (The) Corp. | 471,456 | |||||||||
| 33,315 | J.B. Hunt Transport Services, Inc. | 901,504 | |||||||||
| 15,398 | Kansas City Southern* | 572,036 | |||||||||
| 19,929 | Landstar System, Inc. | 962,770 | |||||||||
| 6,049 | Lockheed Martin Corp. | 581,551 | |||||||||
| 9,723 | Manitowoc (The) Co., Inc. | 663,400 | |||||||||
| 8,671 | PACCAR, Inc. | 728,191 | |||||||||
| 6,832 | Precision Castparts Corp. | 711,280 | |||||||||
| 9,104 | Roper Industries, Inc. | 510,370 | |||||||||
| 17,454 | Stericycle, Inc.* | 1,520,942 | |||||||||
| 11,820 | Terex Corp.* | 920,187 | |||||||||
| 16,313 | Toro (The) Co. | 819,728 | |||||||||
| 15,631,801 | |||||||||||
| Information Technology—4.7% | |||||||||||
| 13,071 | Apple, Inc.* | 1,304,486 | |||||||||
| 19,863 | Autodesk, Inc.* | 819,746 | |||||||||
| 7,132 | Cognizant Technology Solutions Corp., Class A* | 637,601 | |||||||||
| 9,161 | Harris Corp. | 470,417 | |||||||||
| 10,219 | MEMC Electronic Materials, Inc.* | 560,819 | |||||||||
| 19,678 | Trimble Navigation Ltd.* | 564,365 | |||||||||
| 4,357,434 | |||||||||||
| Materials—14.5% | |||||||||||
| 20,793 | Airgas, Inc. | 926,328 | |||||||||
| 12,850 | Albemarle Corp. | 545,483 | |||||||||
| 21,104 | Allegheny Technologies, Inc. | 2,312,576 | |||||||||
See Notes to Financial Statements.
50
Schedule of Investments (Continued)
PowerShares DWA Technical LeadersTM Portfolio
April 30, 2007
| Number of Shares | Value | ||||||||||
| Common Stocks (Continued) | |||||||||||
| 5,674 | Carpenter Technology Corp. | $ | 688,653 | ||||||||
| 34,036 | Commercial Metals Co. | 1,141,227 | |||||||||
| 13,616 | Eagle Materials, Inc. | 607,410 | |||||||||
| 8,120 | Monsanto Co. | 478,999 | |||||||||
| 12,837 | Nucor Corp. | 814,636 | |||||||||
| 10,024 | Reliance Steel & Aluminum Co. | 595,426 | |||||||||
| 134,163 | Titanium Metals Corp.* | 4,632,648 | |||||||||
| 5,567 | United States Steel Corp. | 565,273 | |||||||||
| 13,308,659 | |||||||||||
| Telecommunication Services—8.5% | |||||||||||
| 79,142 | American Tower Corp., Class A* | 3,007,396 | |||||||||
| 54,658 | NII Holdings, Inc.* | 4,195,001 | |||||||||
| 22,233 | SBA Communications Corp., Class A* | 654,095 | |||||||||
| 7,856,492 | |||||||||||
| Utilities—4.9% | |||||||||||
| 58,254 | AES (The) Corp.* | 1,281,006 | |||||||||
| 11,275 | Allegheny Energy, Inc.* | 602,762 | |||||||||
| 12,788 | Energen Corp. | 716,767 | |||||||||
| 5,602 | Entergy Corp. | 633,810 | |||||||||
| 15,011 | Equitable Resources, Inc. | 780,722 | |||||||||
| 10,682 | PG&E Corp. | 540,509 | |||||||||
| 4,555,576 | |||||||||||
| Total Investments (Cost $89,893,209)—99.8% | 91,882,394 | ||||||||||
| Other assets less liabilities—0.2% | 207,902 | ||||||||||
| Net Assets—100.0% | $ | 92,090,296 | |||||||||
* Non-income producing security.
See Notes to Financial Statements.
51
Statements of Assets and Liabilities
PowerShares Exchange-Traded Funds
April 30, 2007
| PowerShares Aerospace & Defense Portfolio | PowerShares CleantechTM Portfolio | PowerShares Golden Dragon Halter USX China Portfolio | PowerShares Listed Private Equity Portfolio | PowerShares Lux Nanotech Portfolio | PowerShares Value Line TimelinessTM Select Portfolio | ||||||||||||||||||||||
| ASSETS: | |||||||||||||||||||||||||||
| Unaffiliated investments at value | $ | 201,955,656 | $ | 21,814,897 | $ | 393,179,732 | $ | 149,735,543 | $ | 158,987,005 | $ | 272,729,279 | |||||||||||||||
| Affiliated investments at value | 42,459 | 7,092 | — | 240,589 | — | — | |||||||||||||||||||||
| Cash | — | — | — | — | 29,220 | — | |||||||||||||||||||||
| Receivables: | |||||||||||||||||||||||||||
| Investments sold | 226,686 | — | 785,056 | 239,528 | — | — | |||||||||||||||||||||
| Dividends | 67,842 | 2,008 | 1,410,229 | 1,031 | 159,309 | 168,838 | |||||||||||||||||||||
| Due from Adviser | 17,768 | 9,815 | 36,881 | 9,046 | 17,790 | 17,950 | |||||||||||||||||||||
| Capital stock sold | — | — | — | 5,593,123 | 3,495,655 | — | |||||||||||||||||||||
| Other assets | 6,542 | 5,047 | 5,897 | 10,720 | 6,542 | 16,001 | |||||||||||||||||||||
| Total Assets | 202,316,953 | 21,838,859 | 395,417,795 | 155,829,580 | 162,695,521 | 272,932,068 | |||||||||||||||||||||
| LIABILITIES: | |||||||||||||||||||||||||||
| Due to custodian | 267,440 | 112,356 | 789,801 | 44,348 | — | 89,964 | |||||||||||||||||||||
| Payables: | |||||||||||||||||||||||||||
| Investments purchased | 4,713 | — | — | 5,569,217 | 3,498,416 | — | |||||||||||||||||||||
| Accrued advisory fees | 76,386 | 8,028 | 157,350 | 57,426 | �� | 63,806 | 105,082 | ||||||||||||||||||||
| Accrued expenses | 82,293 | 55,655 | 150,273 | 80,231 | 80,979 | 129,443 | |||||||||||||||||||||
| Total Liabilities | 430,832 | 176,039 | 1,097,424 | 5,751,222 | 3,643,201 | 324,489 | |||||||||||||||||||||
| NET ASSETS | $ | 201,886,121 | $ | 21,662,820 | $ | 394,320,371 | $ | 150,078,358 | $ | 159,052,320 | $ | 272,607,579 | |||||||||||||||
| NET ASSETS CONSIST OF: | |||||||||||||||||||||||||||
| Paid-in capital | $ | 184,643,111 | $ | 21,809,750 | $ | 371,292,863 | $ | 145,680,524 | $ | 171,527,744 | $ | 283,922,664 | |||||||||||||||
| Undistributed net investment income | — | — | 588,109 | 624,862 | — | — | |||||||||||||||||||||
| Accumulated net realized loss on investments | (3,436,496 | ) | (1,152,593 | ) | (10,628,548 | ) | (980,738 | ) | (7,891,413 | ) | (35,199,732 | ) | |||||||||||||||
| Net unrealized appreciation / depreciation on investments | 20,679,506 | 1,005,663 | 33,067,947 | 4,753,710 | (4,584,011 | ) | 23,884,647 | ||||||||||||||||||||
| Net Assets | $ | 201,886,121 | $ | 21,662,820 | $ | 394,320,371 | $ | 150,078,358 | $ | 159,052,320 | $ | 272,607,579 | |||||||||||||||
| Shares outstanding (unlimited amount authorized, $0.01 par value) | 10,000,000 | 800,000 | 18,400,000 | 5,400,000 | 9,100,000 | 15,500,000 | |||||||||||||||||||||
| Net asset value | $ | 20.19 | $ | 27.08 | $ | 21.43 | $ | 27.79 | $ | 17.48 | $ | 17.59 | |||||||||||||||
| Unaffiliated investments at cost | $ | 181,276,150 | $ | 20,809,234 | $ | 360,111,785 | $ | 144,981,833 | $ | 163,571,016 | $ | 248,844,632 | |||||||||||||||
| Affiliated investments at cost | $ | 42,459 | $ | 7,092 | $ | — | $ | 240,589 | $ | — | $ | — | |||||||||||||||
See Notes to Financial Statements.
52
| PowerShares Value Line Industry Rotation Portfolio | PowerShares Water Resources Portfolio | PowerShares WilderHill Clean Energy Portfolio | PowerShares WilderHill Progressive Energy Portfolio | PowerShares DWA Technical LeadersTM Portfolio | |||||||||||||||||||
| ASSETS: | |||||||||||||||||||||||
| Unaffiliated investments at value | $ | 33,608,400 | $ | 1,603,342,703 | $ | 913,344,821 | $ | 22,956,759 | $ | 91,882,394 | |||||||||||||
| Affiliated investments at value | 31,821 | 182,440 | — | 57,665 | — | ||||||||||||||||||
| Cash | 47,162 | 1,796,142 | 770,201 | — | 268,920 | ||||||||||||||||||
| Receivables: | |||||||||||||||||||||||
| Investments sold | — | — | — | — | — | ||||||||||||||||||
| Dividends | 15,406 | 1,953,478 | 451,680 | 38,154 | 14,660 | ||||||||||||||||||
| Due from Adviser | 2,084 | 96,548 | 36,786 | 9,333 | 33,001 | ||||||||||||||||||
| Capital stock sold | — | 5,830,654 | 7,826,625 | — | 5,210,529 | ||||||||||||||||||
| Other assets | 8,214 | 6,001 | 8,167 | 6,134 | — | ||||||||||||||||||
| Total Assets | 33,713,087 | 1,613,207,966 | 922,438,280 | 23,068,045 | 97,409,504 | ||||||||||||||||||
| LIABILITIES: | |||||||||||||||||||||||
| Due to custodian | — | — | — | 98,480 | — | ||||||||||||||||||
| Payables: | |||||||||||||||||||||||
| Investments purchased | — | 4,927,265 | 7,453,038 | — | 5,204,101 | ||||||||||||||||||
| Accrued advisory fees | 12,824 | 646,140 | 373,553 | 8,607 | 27,277 | ||||||||||||||||||
| Accrued expenses | 50,444 | 852,878 | 266,896 | 56,301 | 87,830 | ||||||||||||||||||
| Total Liabilities | 63,268 | 6,426,283 | 8,093,487 | 163,388 | 5,319,208 | ||||||||||||||||||
| NET ASSETS | $ | 33,649,819 | $ | 1,606,781,683 | $ | 914,344,793 | $ | 22,904,657 | $ | 92,090,296 | |||||||||||||
| NET ASSETS CONSIST OF: | |||||||||||||||||||||||
| Paid-in capital | $ | 32,294,112 | $ | 1,516,173,780 | $ | 1,019,796,842 | $ | 21,300,872 | $ | 90,114,840 | |||||||||||||
| Undistributed net investment income | — | 152,360 | — | 46,410 | 105,514 | ||||||||||||||||||
| Accumulated net realized loss on investments | (383,229 | ) | (33,297,863 | ) | (133,922,566 | ) | (279,888 | ) | (119,243 | ) | |||||||||||||
| Net unrealized appreciation / depreciation on investments | 1,738,936 | 123,753,406 | 28,470,517 | 1,837,263 | 1,989,185 | ||||||||||||||||||
| Net Assets | $ | 33,649,819 | $ | 1,606,781,683 | $ | 914,344,793 | $ | 22,904,657 | $ | 92,090,296 | |||||||||||||
| Shares outstanding (unlimited amount authorized, $0.01 par value) | 1,200,000 | 83,700,000 | 47,400,000 | 800,000 | 3,600,000 | ||||||||||||||||||
| Net asset value | $ | 28.04 | $ | 19.20 | $ | 19.29 | $ | 28.63 | $ | 25.58 | |||||||||||||
| Unaffiliated investments at cost | $ | 31,869,464 | $ | 1,479,589,297 | $ | 884,874,304 | $ | 21,119,496 | $ | 89,893,209 | |||||||||||||
| Affiliated investments at cost | $ | 31,821 | $ | 182,440 | $ | — | $ | 57,665 | $ | — | |||||||||||||
53
Statements of Operations
| PowerShares Aerospace & Defense Portfolio | PowerShares CleantechTM Portfolio | PowerShares Golden Dragon Halter USX China Portfolio | PowerShares Listed Private Equity Portfolio | PowerShares Lux Nanotech Portfolio | PowerShares Value Line TimelinessTM Select Portfolio | ||||||||||||||||||||||
| For the year ended April 30, 2007 | For the period October 24, 2006* through April 30, 2007 | For the year ended April 30, 2007 | For the period October 24, 2006* through April 30, 2007 | For the year ended April 30, 2007 | For the year ended April 30, 2007 | ||||||||||||||||||||||
| INVESTMENT INCOME: | |||||||||||||||||||||||||||
| Unaffiliated dividend income | $ | 1,111,500 | $ | 56,663 | $ | 5,243,788 | $ | 1,590,308 | $ | 837,654 | $ | 1,296,960 | |||||||||||||||
| Affiliated dividend income | 1,772 | 74 | 16,435 | 1,797 | 1 | — | |||||||||||||||||||||
| Foreign withholding taxes | — | — | (7,987 | ) | — | (42,132 | ) | (7,402 | ) | ||||||||||||||||||
| Total Income | 1,113,272 | 56,737 | 5,252,236 | 1,592,105 | 795,523 | 1,289,558 | |||||||||||||||||||||
| EXPENSES: | |||||||||||||||||||||||||||
| Advisory fees | 589,182 | 68,193 | 1,483,381 | 194,749 | 647,239 | 997,000 | |||||||||||||||||||||
| Licensing | 70,702 | 10,229 | 297,646 | 38,950 | 129,448 | 199,400 | |||||||||||||||||||||
| Administration fees | 59,999 | 3,133 | 60,622 | 6,572 | 59,999 | 56,817 | |||||||||||||||||||||
| Printing | 56,809 | 12,174 | 136,048 | 21,334 | 57,314 | 94,397 | |||||||||||||||||||||
| Accounting | 54,998 | 2,376 | 54,998 | 4,669 | 54,998 | 51,356 | |||||||||||||||||||||
| Audit | 16,500 | 16,500 | 16,500 | 16,500 | 16,500 | 16,500 | |||||||||||||||||||||
| Custodian & transfer agent fees | 11,288 | 1,947 | 20,397 | 3,165 | 10,674 | 20,023 | |||||||||||||||||||||
| Listing fee and expenses | 10,202 | 10,000 | 10,560 | 10,000 | 10,260 | 10,432 | |||||||||||||||||||||
| Trustees | 4,595 | 556 | 10,723 | 1,555 | 5,102 | 7,541 | |||||||||||||||||||||
| Registration & filings | 4,428 | 914 | 9,185 | 3,576 | 3,377 | 5,338 | |||||||||||||||||||||
| Offering costs | 4,325 | 3,973 | — | 4,328 | 8,562 | 8,548 | |||||||||||||||||||||
| Legal | 3,482 | 2,501 | 17,228 | 2,500 | 6,303 | 7,410 | |||||||||||||||||||||
| Other expenses | 15,210 | 12,236 | 18,856 | 12,236 | 11,568 | 16,644 | |||||||||||||||||||||
| Total Expenses | 901,720 | 144,732 | 2,136,144 | 320,134 | 1,021,344 | 1,491,406 | |||||||||||||||||||||
| Expenses reimbursed to the Adviser under the Expense Agreement | — | — | — | — | — | — | |||||||||||||||||||||
| Less fees waived: | |||||||||||||||||||||||||||
| Advisory | (118,441 | ) | (48,163 | ) | (56,468 | ) | (42,623 | ) | (106,037 | ) | (86,448 | ) | |||||||||||||||
| Other fees assumed by the Adviser | — | — | — | — | — | — | |||||||||||||||||||||
| Net Expenses | 783,279 | 96,569 | 2,079,676 | 277,511 | 915,307 | 1,404,958 | |||||||||||||||||||||
| Net Investment Income (Loss) | 329,993 | (39,832 | ) | 3,172,560 | 1,314,594 | (119,784 | ) | (115,400 | ) | ||||||||||||||||||
| REALIZED AND UNREALIZED GAIN (LOSS) ON INVESTMENTS: | |||||||||||||||||||||||||||
| Net realized gain (loss) from: | |||||||||||||||||||||||||||
| Investments | (3,319,816 | ) | (1,152,593 | ) | (8,992,084 | ) | (980,738 | ) | (7,759,188 | ) | (32,589,754 | ) | |||||||||||||||
| In-kind redemptions | 11,911,867 | 2,240,254 | 57,668,468 | 2,121,560 | 10,196,890 | 26,523,153 | |||||||||||||||||||||
| Net realized gain (loss) | 8,592,051 | 1,087,661 | 48,676,384 | 1,140,822 | 2,437,702 | (6,066,601 | ) | ||||||||||||||||||||
| Net change in unrealized appreciation/ depreciation on investments | 12,375,809 | 1,005,663 | 13,246,066 | 4,753,710 | (12,992,856 | ) | 13,228,112 | ||||||||||||||||||||
| Net realized and unrealized gain (loss) on investments | 20,967,860 | 2,093,324 | 61,922,450 | 5,894,532 | (10,555,154 | ) | 7,161,511 | ||||||||||||||||||||
| Net increase (decrease) in net assets resulting from operations | $ | 21,297,853 | $ | 2,053,492 | $ | 65,095,010 | $ | 7,209,126 | $ | (10,674,938 | ) | $ | 7,046,111 | ||||||||||||||
* Commencement of investment operations.
See Notes to Financial Statements.
54
| PowerShares Value Line Industry Rotation Portfolio | PowerShares Water Resources Portfolio | PowerShares WilderHill Clean Energy Portfolio | PowerShares WilderHill Progressive Energy Portfolio | PowerShares DWA Technical LeadersTM Portfolio | |||||||||||||||||||
| For the period December 1, 2006* through April 30, 2007 | For the year ended April 30, 2007 | For the year ended April 30, 2007 | For the period October 24, 2006* through April 30, 2007 | For the period March 1, 2007* through April 30, 2007 | |||||||||||||||||||
| INVESTMENT INCOME: | |||||||||||||||||||||||
| Unaffiliated dividend income | $ | 67,185 | $ | 19,714,410 | $ | 6,657,581 | $ | 163,713 | $ | 156,345 | |||||||||||||
| Affiliated dividend income | 260 | 54,451 | 35,897 | 574 | — | ||||||||||||||||||
| Foreign withholding taxes | (296 | ) | (230,966 | ) | (8,235 | ) | (4,838 | ) | — | ||||||||||||||
| Total Income | 67,149 | 19,537,895 | 6,685,243 | 159,449 | 156,345 | ||||||||||||||||||
| EXPENSES: | |||||||||||||||||||||||
| Advisory fees | 43,161 | 6,033,534 | 3,585,302 | 67,358 | 35,114 | ||||||||||||||||||
| Licensing | 8,632 | 905,031 | 717,060 | 13,472 | 7,023 | ||||||||||||||||||
| Administration fees | 1,295 | 181,009 | 107,561 | 3,105 | 1,053 | ||||||||||||||||||
| Printing | 3,890 | 569,431 | 294,678 | 11,325 | 50,000 | ||||||||||||||||||
| Accounting | 863 | 120,672 | 71,707 | 2,358 | 702 | ||||||||||||||||||
| Audit | 12,500 | 16,500 | 16,500 | 16,500 | 12,500 | ||||||||||||||||||
| Custodian & transfer agent fees | 1,632 | 63,542 | 42,609 | 1,937 | 1,551 | ||||||||||||||||||
| Listing fee and expenses | 10,001 | 12,217 | 11,709 | 10,000 | 3,000 | ||||||||||||||||||
| Trustees | 379 | 48,110 | 27,693 | 565 | 90 | ||||||||||||||||||
| Registration & filings | 654 | 41,233 | 28,145 | 847 | 1,095 | ||||||||||||||||||
| Offering costs | 4,340 | 8,313 | — | 4,041 | 1,671 | ||||||||||||||||||
| Legal | 5,000 | 38,172 | 27,226 | 2,500 | 2,500 | ||||||||||||||||||
| Other expenses | 12,286 | 61,673 | 29,175 | 12,400 | 9,011 | ||||||||||||||||||
| Total Expenses | 104,633 | 8,099,437 | 4,959,365 | 146,408 | 125,310 | ||||||||||||||||||
| Expenses reimbursed to the Adviser under the Expense Agreement | — | — | 34,877 | — | — | ||||||||||||||||||
| Less fees waived: | |||||||||||||||||||||||
| Advisory | (40,101 | ) | (175,648 | ) | — | (47,367 | ) | (35,114 | ) | ||||||||||||||
| Other fees assumed by the Adviser | — | — | — | — | (39,365 | ) | |||||||||||||||||
| Net Expenses | 64,532 | 7,923,789 | 4,994,242 | 99,041 | 50,831 | ||||||||||||||||||
| Net Investment Income (Loss) | 2,617 | 11,614,106 | 1,691,001 | 60,408 | 105,514 | ||||||||||||||||||
| REALIZED AND UNREALIZED GAIN (LOSS) ON INVESTMENTS: | |||||||||||||||||||||||
| Net realized gain (loss) from: | |||||||||||||||||||||||
| Investments | (383,229 | ) | (32,163,257 | ) | (130,207,317 | ) | (279,888 | ) | (119,243 | ) | |||||||||||||
| In-kind redemptions | 720,690 | 49,558,259 | 72,566,396 | 1,927,839 | 185,521 | ||||||||||||||||||
| Net realized gain (loss) | 337,461 | 17,395,002 | (57,640,921 | ) | 1,647,951 | 66,278 | |||||||||||||||||
| Net change in unrealized appreciation/ depreciation on investments | 1,738,936 | 62,772,486 | (51,974,247 | ) | 1,837,263 | 1,989,185 | |||||||||||||||||
| Net realized and unrealized gain (loss) on investments | 2,076,397 | 80,167,488 | (109,615,168 | ) | 3,485,214 | 2,055,463 | |||||||||||||||||
| Net increase (decrease) in net assets resulting from operations | $ | 2,079,014 | $ | 91,781,594 | $ | (107,924,167 | ) | $ | 3,545,622 | $ | 2,160,977 | ||||||||||||
55
Statements of Changes in Net Assets
| PowerShares Aerospace & Defense Portfolio | PowerShares CleantechTM Portfolio | PowerShares Golden Dragon Halter USX China Portfolio | |||||||||||||||||||||
| For the year ended April 30, 2007 | For the period October 26, 2005* through April 30, 2006 | For the period October 24, 2006* through April 30, 2007 | For the year ended April 30, 2007 | For the year ended April 30, 2006 | |||||||||||||||||||
| OPERATIONS: | |||||||||||||||||||||||
| Net investment income (loss) | $ | 329,993 | $ | 91,022 | $ | (39,832 | ) | $ | 3,172,560 | $ | 1,067,194 | ||||||||||||
| Net realized gain (loss) on investments | 8,592,051 | 159,769 | 1,087,661 | 48,676,384 | 1,538,875 | ||||||||||||||||||
| Net change in unrealized appreciation/depreciation on investments | 12,375,809 | 8,303,697 | 1,005,663 | 13,246,066 | 23,738,694 | ||||||||||||||||||
| Net increase (decrease) in net assets resulting from operations | 21,297,853 | 8,554,488 | 2,053,492 | 65,095,010 | 26,344,763 | ||||||||||||||||||
| Undistributed net investment income (loss) included in the price of units issued and redeemed | 13,857 | — | 6,280 | 111,037 | — | ||||||||||||||||||
| DISTRIBUTIONS TO SHAREHOLDERS FROM: | |||||||||||||||||||||||
| Net investment income | (362,663 | ) | (59,157 | ) | — | (3,191,113 | ) | (741,732 | ) | ||||||||||||||
| Tax return of capital | (25,620 | ) | — | — | — | — | |||||||||||||||||
| Total distributions to shareholders | (388,283 | ) | (59,157 | ) | — | (3,191,113 | ) | (741,732 | ) | ||||||||||||||
| SHAREHOLDER TRANSACTIONS: | |||||||||||||||||||||||
| Proceeds from shares sold | 149,636,041 | 79,923,553 | 48,140,438 | 286,475,511 | 182,731,681 | ||||||||||||||||||
| Value of shares repurchased | (53,795,021 | ) | (3,283,353 | ) | (28,531,110 | ) | (192,389,311 | ) | (19,388,492 | ) | |||||||||||||
| Net income equalization | (13,857 | ) | — | (6,280 | ) | (111,037 | ) | — | |||||||||||||||
| Net increase in net assets resulting from shares transactions | 95,827,163 | 76,640,200 | 19,603,048 | 93,975,163 | 163,343,189 | ||||||||||||||||||
| Increase in Net Assets | 116,750,590 | 85,135,531 | 21,662,820 | 155,990,097 | 188,946,220 | ||||||||||||||||||
| NET ASSETS: | |||||||||||||||||||||||
| Beginning of period | 85,135,531 | — | — | 238,330,274 | 49,384,054 | ||||||||||||||||||
| End of period | $ | 201,886,121 | $ | 85,135,531 | $ | 21,662,820 | $ | 394,320,371 | $ | 238,330,274 | |||||||||||||
| Undistributed net investment income at end of period | $ | — | $ | 32,046 | $ | — | $ | 588,109 | $ | 606,662 | |||||||||||||
| CHANGES IN SHARES OUTSTANDING: | |||||||||||||||||||||||
| Shares sold | 8,100,000 | 5,100,000 | 1,900,000 | 14,400,000 | 11,600,000 | ||||||||||||||||||
| Shares repurchased | (3,000,000 | ) | (200,000 | ) | (1,100,000 | ) | (10,100,000 | ) | (1,300,000 | ) | |||||||||||||
| Shares outstanding, beginning of period | 4,900,000 | — | — | 14,100,000 | 3,800,000 | ||||||||||||||||||
| Shares outstanding, end of period | 10,000,000 | 4,900,000 | 800,000 | 18,400,000 | 14,100,000 | ||||||||||||||||||
* Commencement of Investment Operations.
See Notes to Financial Statements.
56
| PowerShares Listed Private Equity Portfolio | PowerShares Lux Nanotech Portfolio | PowerShares Value Line TimelinessTM Select Portfolio | |||||||||||||||||||||
| For the period October 24, 2006* through April 30, 2007 | For the year ended April 30, 2007 | For the period October 26, 2005* through April 30, 2006 | For the year ended April 30, 2007 | For the period December 6, 2005* through April 30, 2006 | |||||||||||||||||||
| OPERATIONS: | |||||||||||||||||||||||
| Net investment income (loss) | $ | 1,314,594 | $ | (119,784 | ) | $ | 56,369 | $ | (115,400 | ) | $ | (125,631 | ) | ||||||||||
| Net realized gain (loss) on investments | 1,140,822 | 2,437,702 | 4,225,042 | (6,066,601 | ) | 73,298 | |||||||||||||||||
| Net change in unrealized appreciation/depreciation on investments | 4,753,710 | (12,992,856 | ) | 8,408,845 | 13,228,112 | 10,656,535 | |||||||||||||||||
| Net increase (decrease) in net assets resulting from operations | 7,209,126 | (10,674,938 | ) | 12,690,256 | 7,046,111 | 10,604,202 | |||||||||||||||||
| Undistributed net investment income (loss) included in the price of units issued and redeemed | 242,577 | (40,198 | ) | — | (29,370 | ) | — | ||||||||||||||||
| DISTRIBUTIONS TO SHAREHOLDERS FROM: | |||||||||||||||||||||||
| Net investment income | (689,732 | ) | — | (22,920 | ) | — | — | ||||||||||||||||
| Tax return of capital | — | — | (147,353 | ) | — | — | |||||||||||||||||
| Total distributions to shareholders | (689,732 | ) | — | (170,273 | ) | — | — | ||||||||||||||||
| SHAREHOLDER TRANSACTIONS: | |||||||||||||||||||||||
| Proceeds from shares sold | 162,455,219 | 91,815,890 | 117,694,691 | 461,154,401 | 206,285,386 | ||||||||||||||||||
| Value of shares repurchased | (18,896,255 | ) | (34,505,044 | ) | (17,798,262 | ) | (378,402,470 | ) | (34,080,051 | ) | |||||||||||||
| Net income equalization | (242,577 | ) | 40,198 | — | 29,370 | — | |||||||||||||||||
| Net increase in net assets resulting from shares transactions | 143,316,387 | 57,351,044 | 99,896,429 | 82,781,301 | 172,205,335 | ||||||||||||||||||
| Increase in Net Assets | 150,078,358 | 46,635,908 | 112,416,412 | 89,798,042 | 182,809,537 | ||||||||||||||||||
| NET ASSETS: | |||||||||||||||||||||||
| Beginning of period | — | 112,416,412 | — | 182,809,537 | — | ||||||||||||||||||
| End of period | $ | 150,078,358 | $ | 159,052,320 | $ | 112,416,412 | $ | 272,607,579 | $ | 182,809,537 | |||||||||||||
| Undistributed net investment income at end of period | $ | 624,862 | $ | — | $ | — | $ | — | $ | — | |||||||||||||
| CHANGES IN SHARES OUTSTANDING: | |||||||||||||||||||||||
| Shares sold | 6,100,000 | 5,200,000 | 6,900,000 | 29,200,000 | 12,800,000 | ||||||||||||||||||
| Shares repurchased | (700,000 | ) | (2,000,000 | ) | (1,000,000 | ) | (24,400,000 | ) | (2,100,000 | ) | |||||||||||||
| Shares outstanding, beginning of period | — | 5,900,000 | — | 10,700,000 | — | ||||||||||||||||||
| Shares outstanding, end of period | 5,400,000 | 9,100,000 | 5,900,000 | 15,500,000 | 10,700,000 | ||||||||||||||||||
57
Statements of Changes in Net Assets (Continued)
| PowerShares Value Line Industry Rotation Portfolio | PowerShares Water Resources Portfolio | ||||||||||||||
| For the period December 1, 2006* through April 30, 2007 | For the year ended April 30, 2007 | For the period December 6, 2005* through April 30, 2006 | |||||||||||||
| OPERATIONS: | |||||||||||||||
| Net investment income (loss) | $ | 2,617 | $ | 11,614,106 | $ | 713,009 | |||||||||
| Net realized gain (loss) on investments | 337,461 | 17,395,002 | 3,680,611 | ||||||||||||
| Net change in unrealized appreciation/depreciation on investments | 1,738,936 | 62,772,486 | 60,980,920 | ||||||||||||
| Net increase (decrease) in net assets resulting from operations | 2,079,014 | 91,781,594 | 65,374,540 | ||||||||||||
| Undistributed net investment income (loss) included in the price of units issued and redeemed | 2,011 | 1,052,528 | — | ||||||||||||
| DISTRIBUTIONS TO SHAREHOLDERS FROM: | |||||||||||||||
| Net investment income | (2,669 | ) | (11,901,149 | ) | (291,087 | ) | |||||||||
| Tax return of capital | (4,445 | ) | — | — | |||||||||||
| Total distributions to shareholders | (7,114 | ) | (11,901,149 | ) | (291,087 | ) | |||||||||
| SHAREHOLDER TRANSACTIONS: | |||||||||||||||
| Proceeds from shares sold | 39,530,660 | 875,926,807 | 963,167,470 | ||||||||||||
| Value of shares repurchased | (7,952,741 | ) | (340,233,615 | ) | (37,042,877 | ) | |||||||||
| Net income equalization | (2,011 | ) | (1,052,528 | ) | — | ||||||||||
| Net increase in net assets resulting from shares transactions | 31,575,908 | 534,640,664 | 926,124,593 | ||||||||||||
| Increase in Net Assets | 33,649,819 | 615,573,637 | 991,208,046 | ||||||||||||
| NET ASSETS: | |||||||||||||||
| Beginning of period | — | 991,208,046 | — | ||||||||||||
| End of period | $ | 33,649,819 | $ | 1,606,781,683 | $ | 991,208,046 | |||||||||
| Undistributed net investment income at end of period | $ | — | $ | 152,360 | $ | 421,922 | |||||||||
| CHANGES IN SHARES OUTSTANDING: | |||||||||||||||
| Shares sold | 1,500,000 | 48,400,000 | 56,400,000 | ||||||||||||
| Shares repurchased | (300,000 | ) | (19,000,000 | ) | (2,100,000 | ) | |||||||||
| Shares outstanding, beginning of period | — | 54,300,000 | — | ||||||||||||
| Shares outstanding, end of period | 1,200,000 | 83,700,000 | 54,300,000 | ||||||||||||
* Commencement of Investment Operations.
See Notes to Financial Statements.
58
| PowerShares WilderHill Clean Energy Portfolio | PowerShares WilderHill Progressive Energy Portfolio | PowerShares DWA Technical LeadersTM Portfolio | |||||||||||||||||
| For the year ended April 30, 2007 | For the year ended April 30, 2006 | For the period October 24, 2006* through April 30, 2007 | For the period March 1, 2007* through April 30, 2007 | ||||||||||||||||
| OPERATIONS: | |||||||||||||||||||
| Net investment income (loss) | $ | 1,691,001 | $ | (782,921 | ) | $ | 60,408 | $ | 105,514 | ||||||||||
| Net realized gain (loss) on investments | (57,640,921 | ) | 19,308,968 | 1,647,951 | 66,278 | ||||||||||||||
| Net change in unrealized appreciation/depreciation on investments | (51,974,247 | ) | 84,680,554 | 1,837,263 | 1,989,185 | ||||||||||||||
| Net increase (decrease) in net assets resulting from operations | (107,924,167 | ) | 103,206,601 | 3,545,622 | 2,160,977 | ||||||||||||||
| Undistributed net investment income (loss) included in the price of units issued and redeemed | 188,257 | — | (2,980 | ) | 177,364 | ||||||||||||||
| DISTRIBUTIONS TO SHAREHOLDERS FROM: | |||||||||||||||||||
| Net investment income | (1,691,001 | ) | — | (14,162 | ) | — | |||||||||||||
| Tax return of capital | (160,324 | ) | — | — | — | ||||||||||||||
| Total distributions to shareholders | (1,851,325 | ) | — | (14,162 | ) | — | |||||||||||||
| SHAREHOLDER TRANSACTIONS: | |||||||||||||||||||
| Proceeds from shares sold | 602,781,817 | 667,646,977 | 40,867,799 | 92,402,327 | |||||||||||||||
| Value of shares repurchased | (301,601,160 | ) | (74,926,387 | ) | (21,494,602 | ) | (2,473,008 | ) | |||||||||||
| Net income equalization | (188,257 | ) | — | 2,980 | (177,364 | ) | |||||||||||||
| Net increase in net assets resulting from shares transactions | 300,992,400 | 592,720,590 | 19,376,177 | 89,751,955 | |||||||||||||||
| Increase in Net Assets | 191,405,165 | 695,927,191 | 22,904,657 | 92,090,296 | |||||||||||||||
| NET ASSETS: | |||||||||||||||||||
| Beginning of period | 722,939,628 | 27,012,437 | — | — | |||||||||||||||
| End of period | $ | 914,344,793 | $ | 722,939,628 | $ | 22,904,657 | $ | 92,090,296 | |||||||||||
| Undistributed net investment income at end of period | $ | — | $ | — | $ | 46,410 | $ | 105,514 | |||||||||||
| CHANGES IN SHARES OUTSTANDING: | |||||||||||||||||||
| Shares sold | 31,600,000 | 34,200,000 | 1,600,000 | 3,700,000 | |||||||||||||||
| Shares repurchased | (16,500,000 | ) | (4,000,000 | ) | (800,000 | ) | (100,000 | ) | |||||||||||
| Shares outstanding, beginning of period | 32,300,000 | 2,100,000 | — | — | |||||||||||||||
| Shares outstanding, end of period | 47,400,000 | 32,300,000 | 800,000 | 3,600,000 | |||||||||||||||
59
Financial Highlights
PowerShares Aerospace & Defense Portfolio
| For the year ended April 30, 2007 | For the period October 26, 2005* through April 30, 2006 | ||||||||||
| PER SHARE OPERATING PERFORMANCE: | |||||||||||
| Net asset value at beginning of period | $ | 17.37 | $ | 14.91 | |||||||
| Net investment income** | 0.05 | 0.03 | |||||||||
| Net realized and unrealized gain on investments | 2.83 | 2.45 | |||||||||
| Total from operations | 2.88 | 2.48 | |||||||||
| Undistributed net investment income included in price of units issued and redeemed** | — | (a) | — | ||||||||
| Distributions to shareholders from: | |||||||||||
| Net investment income | (0.06 | ) | (0.02 | ) | |||||||
| Tax return of capital | — | (a) | — | ||||||||
| Total distributions | (0.06 | ) | (0.02 | ) | |||||||
| Net asset value at end of period | $ | 20.19 | $ | 17.37 | |||||||
| TOTAL RETURN*** | 16.66 | % | 16.66 | % | |||||||
| RATIOS/SUPPLEMENTAL DATA: | |||||||||||
| Net assets at end of period (000's omitted) | $ | 201,886 | $ | 85,136 | |||||||
| Ratio to average net assets of: | |||||||||||
| Expenses, net of waivers | 0.66 | % | 0.68 | %† | |||||||
| Expenses, prior to waivers | 0.77 | % | 0.80 | %† | |||||||
| Net investment income, net of waivers | 0.28 | % | 0.31 | %† | |||||||
| Portfolio turnover rate †† | 16 | % | 1 | % | |||||||
PowerShares CleantechTM Portfolio
| For the period October 24, 2006* through April 30, 2007 | |||||||
| PER SHARE OPERATING PERFORMANCE: | |||||||
| Net asset value at beginning of period | $ | 24.70 | |||||
| Net investment loss** | (0.04 | ) | |||||
| Net realized and unrealized gain on investments | 2.41 | ||||||
| Total from operations | 2.37 | ||||||
| Undistributed net investment income included in price of units issued and redeemed** | 0.01 | ||||||
| Net asset value at end of period | $ | 27.08 | |||||
| TOTAL RETURN*** | 9.64 | % | |||||
| RATIOS/SUPPLEMENTAL DATA: | |||||||
| Net assets at end of period (000's omitted) | $ | 21,663 | |||||
| Ratio to average net assets of: | |||||||
| Expenses, net of waivers | 0.71 | %† | |||||
| Expenses, prior to waivers | 1.06 | %† | |||||
| Net investment loss, net of waivers | (0.29 | )%† | |||||
| Portfolio turnover rate †† | 22 | % | |||||
* Commencement of Investment Operations.
** Based on average shares outstanding.
*** Total investment return is calculated assuming an initial investment made at the net asset value at the beginning of the period, reinvestment of all dividends and distributions at net asset value during the period, and redemption on the last day of the period. Total investment return calculated for a period of less than one year is not annualized.
† Annualized.
†† Portfolio turnover is not annualized and does not include securities received or delivered from processing creations or redemptions.
(a) Amount represents less than $0.005.
See Notes to Financial Statements.
60
Financial Highlights (Continued)
PowerShares Golden Dragon Halter USX China Portfolio
| For the year ended April 30, 2007 | For the year ended April 30, 2006 | For the period December 9, 2004* through April 30, 2005 | |||||||||||||
| PER SHARE OPERATING PERFORMANCE: | |||||||||||||||
| Net asset value at beginning of period | $ | 16.90 | $ | 13.00 | $ | 14.55 | |||||||||
| Net investment income** | 0.20 | 0.17 | 0.06 | ||||||||||||
| Net realized and unrealized gain (loss) on investments | 4.53 | 3.89 | (1.61 | ) | |||||||||||
| Total from operations | 4.73 | 4.06 | (1.55 | ) | |||||||||||
| Undistributed net investment income included in price of units issued and redeemed** | 0.01 | — | — | ||||||||||||
| Distributions to shareholders from: | |||||||||||||||
| Net investment income | (0.21 | ) | (0.16 | ) | — | ||||||||||
| Net asset value at end of period | $ | 21.43 | $ | 16.90 | $ | 13.00 | |||||||||
| TOTAL RETURN*** | 28.53 | % | 31.52 | % | (10.68 | )% | |||||||||
| RATIOS/SUPPLEMENTAL DATA: | |||||||||||||||
| Net assets at end of period (000's omitted) | $ | 394,320 | $ | 238,330 | $ | 49,384 | |||||||||
| Ratio to average net assets of: | |||||||||||||||
| Expenses, net of waivers | 0.70 | % | 0.71 | % | 0.70 | %† | |||||||||
| Expenses, prior to waivers | 0.72 | %††† | 0.88 | % | 0.97 | %† | |||||||||
| Net investment income, net of waivers | 1.06 | % | 1.18 | % | 1.24 | %† | |||||||||
| Portfolio turnover rate †† | 17 | % | 21 | % | 9 | % | |||||||||
PowerShares Listed Private Equity Portfolio
| For the period October 24, 2006* through April 30, 2007 | |||||||
| PER SHARE OPERATING PERFORMANCE: | |||||||
| Net asset value at beginning of period | $ | 25.09 | |||||
| Net investment income** | 0.44 | ||||||
| Net realized and unrealized gain on investments | 2.52 | ||||||
| Total from operations | 2.96 | ||||||
| Undistributed net investment income included in price of units issued and redeemed** | 0.08 | ||||||
| Distributions to shareholders from: | |||||||
| Net investment income | (0.34 | ) | |||||
| Net asset value at end of period | $ | 27.79 | |||||
| TOTAL RETURN*** | 12.18 | % | |||||
| RATIOS/SUPPLEMENTAL DATA: | |||||||
| Net assets at end of period (000's omitted) | $ | 150,078 | |||||
| Ratio to average net assets of: | |||||||
| Expenses, net of waivers | 0.71 | %† | |||||
| Expenses, prior to waivers | 0.82 | %† | |||||
| Net investment income, net of waivers | 3.38 | %† | |||||
| Portfolio turnover rate †† | 19 | % | |||||
* Commencement of Investment Operations.
** Based on average shares outstanding.
*** Total investment return is calculated assuming an initial investment made at the net asset value at the beginning of the period, reinvestment of all dividends and distributions at net asset value during the period, and redemption on the last day of the period. Total investment return calculated for a period of less than one year is not annualized.
† Annualized.
†† Portfolio turnover is not annualized and does not include securities received or delivered from processing creations or redemptions.
††† These expenses, prior to waivers, include amounts reimbursed to the Adviser under the Expense Agreement of 0.01% for the year ended April 30, 2007.
See Notes to Financial Statements.
61
Financial Highlights (Continued)
PowerShares Lux Nanotech Portfolio
| For the year ended April 30, 2007 | For the period October 26, 2005* through April 30, 2006 | ||||||||||
| PER SHARE OPERATING PERFORMANCE: | |||||||||||
| Net asset value at beginning of period | $ | 19.05 | $ | 15.32 | |||||||
| Net investment income (loss)** | (0.02 | ) | 0.02 | ||||||||
| Net realized and unrealized gain (loss) on investments | (1.54 | ) | 3.79 | ||||||||
| Total from operations | (1.56 | ) | 3.81 | ||||||||
| Undistributed net investment income included in price of units issued and redeemed** | (0.01 | ) | — | ||||||||
| Distributions to shareholders from: | |||||||||||
| Net investment income | — | (0.01 | ) | ||||||||
| Tax return of capital | — | (0.07 | ) | ||||||||
| Total distributions | — | (0.08 | ) | ||||||||
| Net asset value at end of period | $ | 17.48 | $ | 19.05 | |||||||
| TOTAL RETURN*** | (8.24 | )% | 24.94 | % | |||||||
| RATIOS/SUPPLEMENTAL DATA: | |||||||||||
| Net assets at end of period (000's omitted) | $ | 159,052 | $ | 112,416 | |||||||
| Ratio to average net assets of: | |||||||||||
| Expenses, net of waivers | 0.71 | % | 0.73 | %† | |||||||
| Expenses, prior to waivers | 0.79 | % | 0.83 | %† | |||||||
| Net investment income (loss), net of waivers | (0.09 | )% | 0.17 | %† | |||||||
| Portfolio turnover rate †† | 16 | % | 6 | % | |||||||
PowerShares Value Line TimelinessTM Select Portfolio
| For the year ended April 30, 2007 | For the period December 6, 2005* through April 30, 2006 | ||||||||||
| PER SHARE OPERATING PERFORMANCE: | |||||||||||
| Net asset value at beginning of period | $ | 17.09 | $ | 15.52 | |||||||
| Net investment loss** | (0.01 | ) | (0.02 | ) | |||||||
| Net realized and unrealized gain on investments | 0.51 | 1.59 | |||||||||
| Total from operations | 0.50 | 1.57 | |||||||||
| Undistributed net investment income included in price of units issued and redeemed** | — | (a) | — | ||||||||
| Net asset value at end of period | $ | 17.59 | $ | 17.09 | |||||||
| TOTAL RETURN*** | 2.93 | % | 10.12 | % | |||||||
| RATIOS/SUPPLEMENTAL DATA: | |||||||||||
| Net assets at end of period (000's omitted) | $ | 272,608 | $ | 182,810 | |||||||
| Ratio to average net assets of: | |||||||||||
| Expenses, net of waivers | 0.70 | % | 0.71 | %† | |||||||
| Expenses, prior to waivers | 0.75 | %††† | 0.78 | %† | |||||||
| Net investment loss, net of waivers | (0.06 | )% | (0.30 | )%† | |||||||
| Portfolio turnover rate †† | 113 | % | 39 | % | |||||||
* Commencement of Investment Operations.
** Based on average shares outstanding.
*** Total investment return is calculated assuming an initial investment made at the net asset value at the beginning of the period, reinvestment of all dividends and distributions at net asset value during the period, and redemption on the last day of the period. Total investment return calculated for a period of less than one year is not annualized.
† Annualized.
†† Portfolio turnover is not annualized and does not include securities received or delivered from processing creations or redemptions.
††† These expenses, prior to waivers, include amounts reimbursed to the Adviser under the Expense Agreement of less than 0.01% for the year ended April 30, 2007.
(a) Amount represents less than $0.005.
See Notes to Financial Statements.
62
Financial Highlights (Continued)
PowerShares Value Line Industry Rotation Portfolio
| For the period December 1, 2006* through April 30, 2007 | |||||||
| PER SHARE OPERATING PERFORMANCE: | |||||||
| Net asset value at beginning of period | $ | 25.19 | |||||
| Net investment income** | — | (a) | |||||
| Net realized and unrealized gain on investments | 2.86 | ||||||
| Total from operations | 2.86 | ||||||
| Undistributed net investment income included in price of units issued and redeemed** | — | (a) | |||||
| Distributions to shareholders from: | |||||||
| Net investment income | — | (a) | |||||
| Tax return of capital | (0.01 | ) | |||||
| Total distributions | (0.01 | ) | |||||
| Net asset value at end of period | $ | 28.04 | |||||
| TOTAL RETURN*** | 11.36 | % | |||||
| RATIOS/SUPPLEMENTAL DATA: | |||||||
| Net assets at end of period (000's omitted) | $ | 33,650 | |||||
| Ratio to average net assets of: | |||||||
| Expenses, net of waivers | 0.75 | %† | |||||
| Expenses, prior to waivers | 1.21 | %† | |||||
| Net investment income, net of waivers | 0.03 | %† | |||||
| Portfolio turnover rate †† | 13 | % | |||||
PowerShares Water Resources Portfolio
| For the year ended April 30, 2007 | For the period December 6, 2005* through April 30, 2006 | ||||||||||
| PER SHARE OPERATING PERFORMANCE: | |||||||||||
| Net asset value at beginning of period | $ | 18.25 | $ | 15.32 | |||||||
| Net investment income** | 0.17 | 0.02 | |||||||||
| Net realized and unrealized gain on investments | 0.93 | 2.94 | |||||||||
| Total from operations | 1.10 | 2.96 | |||||||||
| Undistributed net investment income included in price of units issued and redeemed** | 0.02 | — | |||||||||
| Distributions to shareholders from: | |||||||||||
| Net investment income | (0.17 | ) | (0.03 | ) | |||||||
| Net asset value at end of period | $ | 19.20 | $ | 18.25 | |||||||
| TOTAL RETURN*** | 6.26 | % | 19.38 | % | |||||||
| RATIOS/SUPPLEMENTAL DATA: | |||||||||||
| Net assets at end of period (000's omitted) | $ | 1,606,782 | $ | 991,208 | |||||||
| Ratio to average net assets of: | |||||||||||
| Expenses, net of waivers | 0.66 | % | 0.67 | %† | |||||||
| Expenses, prior to waivers | 0.67 | %††† | 0.70 | %† | |||||||
| Net investment income, net of waivers | 0.96 | % | 0.40 | %† | |||||||
| Portfolio turnover rate †† | 27 | % | 2 | % | |||||||
* Commencement of Investment Operations.
** Based on average shares outstanding.
*** Total investment return is calculated assuming an initial investment made at the net asset value at the beginning of the period, reinvestment of all dividends and distributions at net asset value during the period, and redemption on the last day of the period. Total investment return calculated for a period of less than one year is not annualized.
† Annualized.
†† Portfolio turnover is not annualized and does not include securities received or delivered from processing creations or redemptions.
††† These expenses, prior to waivers, include amounts reimbursed to the Adviser under the Expense Agreement of less than 0.01% for the year ended April 30, 2007.
(a) Amount represents less than $0.005.
See Notes to Financial Statements.
63
Financial Highlights (Continued)
PowerShares WilderHill Clean Energy Portfolio
| For the year ended April 30, 2007 | For the year ended April 30, 2006 | For the period March 3, 2005* through April 30, 2005 | |||||||||||||
| PER SHARE OPERATING PERFORMANCE: | |||||||||||||||
| Net asset value at beginning of period | $ | 22.38 | $ | 12.86 | $ | 15.61 | |||||||||
| Net investment income** | 0.04 | (0.07 | ) | (0.01 | ) | ||||||||||
| Net realized and unrealized gain (loss) on investments | (3.09 | ) | 9.59 | (2.74 | ) | ||||||||||
| Total from operations | (3.05 | ) | 9.52 | (2.75 | ) | ||||||||||
| Undistributed net investment income included in price of units issued and redeemed** | 0.01 | — | — | ||||||||||||
| Distributions to shareholders from: | |||||||||||||||
| Net investment income | (0.05 | ) | — | — | |||||||||||
| Tax return of capital | — | (a) | — | — | |||||||||||
| Total distributions | (0.05 | ) | — | — | |||||||||||
| Net asset value at end of period | $ | 19.29 | $ | 22.38 | $ | 12.86 | |||||||||
| TOTAL RETURN*** | (13.58 | )% | 74.03 | % | (17.59 | )% | |||||||||
| RATIOS/SUPPLEMENTAL DATA: | |||||||||||||||
| Net assets at end of period (000's omitted) | $ | 914,345 | $ | 722,940 | $ | 27,012 | |||||||||
| Ratio to average net assets of: | |||||||||||||||
| Expenses, net of waivers and reimbursements | 0.70 | % | 0.71 | % | 0.70 | %† | |||||||||
| Expenses, prior to waivers and reimbursements | 0.69 | %††† | 0.75 | % | 1.35 | %† | |||||||||
| Net investment income (loss), net of waivers and reimbursements | 0.24 | %†††† | (0.39 | )% | (0.31 | )%† | |||||||||
| Portfolio turnover rate †† | 41 | % | 6 | % | 9 | % | |||||||||
PowerShares WilderHill Progressive Energy Portfolio
| For the period October 24, 2006* through April 30, 2007 | |||||||
| PER SHARE OPERATING PERFORMANCE: | |||||||
| Net asset value at beginning of period | $ | 24.91 | |||||
| Net investment income** | 0.06 | ||||||
| Net realized and unrealized gain on investments | 3.68 | ||||||
| Total from operations | 3.74 | ||||||
| Undistributed net investment income (loss) included in price of units issued and redeemed** | — | (a) | |||||
| Distributions to shareholders from: | |||||||
| Net investment income | (0.02 | ) | |||||
| Net asset value at end of period | $ | 28.63 | |||||
| TOTAL RETURN*** | 15.01 | % | |||||
| RATIOS/SUPPLEMENTAL DATA: | |||||||
| Net assets at end of period (000's omitted) | $ | 22,905 | |||||
| Ratio to average net assets of: | |||||||
| Expenses, net of waivers | 0.74 | %† | |||||
| Expenses, prior to waivers | 1.09 | %† | |||||
| Net investment income, net of waivers | 0.45 | %† | |||||
| Portfolio turnover rate †† | 12 | % | |||||
* Commencement of Investment Operations.
** Based on average shares outstanding.
*** Total investment return is calculated assuming an initial investment made at the net asset value at the beginning of the period, reinvestment of all dividends and distributions at net asset value during the period, and redemption on the last day of the period. Total investment return calculated for a period of less than one year is not annualized.
† Annualized.
†† Portfolio turnover is not annualized and does not include securities received or delivered from processing creations or redemptions.
††† These expenses, prior to waivers, include amounts reimbursed to the Adviser under the Expense Agreement of 0.02% for the year ended April 30, 2007.
†††† Net investment income per share and the ratio of net investment income to average net assets include a special cash dividend received of $6.72 per share owned of Scottish Power Plc ADR on May 18, 2006. Net investment loss per share and the ratio of net investment loss to average net assets excluding the special dividend were $(0.04) and (0.23)%, respectively, for the year ended April 30, 2007.
(a) Amount represents less than $0.005.
See Notes to Financial Statements.
64
Financial Highlights (Continued)
PowerShares DWA Technical LeadersTM Portfolio
| For the period March 1, 2007* through April 30, 2007 | |||||||
| PER SHARE OPERATING PERFORMANCE: | |||||||
| Net asset value at beginning of period | $ | 23.95 | |||||
| Net investment income** | 0.04 | ||||||
| Net realized and unrealized gain on investments | 1.52 | ||||||
| Total from operations | 1.56 | ||||||
| Undistributed net investment income (loss) included in price of units issued and redeemed** | 0.07 | ||||||
| Net asset value at end of period | $ | 25.58 | |||||
| TOTAL RETURN*** | 6.81 | % | |||||
| RATIOS/SUPPLEMENTAL DATA: | |||||||
| Net assets at end of period (000's omitted) | $ | 92,090 | |||||
| Ratio to average net assets of: | |||||||
| Expenses, net of waivers | 0.72 | %† | |||||
| Expenses, prior to waivers | 1.78 | %† | |||||
| Net investment income, net of waivers††† | 1.50 | %† | |||||
| Portfolio turnover rate †† | 9 | % | |||||
* Commencement of Investment Operations.
** Based on average shares outstanding.
*** Total investment return is calculated assuming an initial investment made at the net asset value at the beginning of the period, reinvestment of all dividends and distributions at net asset value during the period, and redemption on the last day of the period. Total investment return calculated for a period of less than one year is not annualized.
† Annualized.
†† Portfolio turnover is not annualized and does not include securities received or delivered from processing creations or redemptions.
††† Net investment income per share and the ratio of net investment income to average net assets include a special cash dividend received of $15.00 per share owned of Dean Foods Co. on April 2, 2007. Net investment loss per share and the ratio of net investment loss to average net assets excluding the special dividend were less than $0.005 and (0.11)%, respectively, for the year ended April 30, 2007.
See Notes to Financial Statements.
65
Notes to Financial Statements
PowerShares Exchange-Traded Fund Trust
April 30, 2007
Note 1. Organization
PowerShares Exchange-Traded Fund Trust (the "Trust"), which is registered under the Investment Company Act of 1940, as amended (the "1940 Act"), is an exchange-traded, management investment company that was organized as a Massachusetts business trust on June 9, 2000. The Trust currently consists of seventy portfolios. This report includes the following portfolios:
PowerShares Aerospace & Defense Portfolio - "Aerospace & Defense Portfolio"
PowerShares CleantechTM Portfolio - "CleantechTM Portfolio"
PowerShares Golden Dragon Halter USX China Portfolio - "Golden Dragon Halter USX China Porfolio"
PowerShares Listed Private Equity Portfolio - "Listed Private Equity Portfolio"
PowerShares Lux Nanotech Portfolio - "Lux Nanotech Portfolio"
PowerShares Value Line TimelinessTM Select Portfolio - "Value Line TimelinessTM Select Portfolio"
PowerShares Value Line Industry Rotation Portfolio - "Value Line Industry Rotation Portfolio"
PowerShares Water Resources Portfolio - "Water Resources Portfolio"
PowerShares WilderHill Clean Energy Portfolio - "WilderHill Clean Energy Portfolio"
PowerShares WilderHill Progressive Energy Portfolio - "WilderHill Progressive Energy Portfolio"
PowerShares DWA Technical LeadersTM Portfolio - "DWA Technical LeadersTM Portfolio"
The Value Line Industry Rotation Portfolio and the DWA Technical LeadersTM Portfolio commenced investment operations on December 1, 2006 and March 1, 2007, respectively. Each portfolio represents a separate series of the Trust (the "Fund" or "Funds"). Each Fund's shares are listed and traded on the American Stock Exchange except for shares of the DWA Technical LeadersTM Portfolio. The shares of DWA Technical LeadersTM Portfolio are traded on the New York Stock Exchange. The Funds' market prices may differ to some degree from the net asset value of the shares of each Fund. Unlike conventional mutual funds, each Fund issues and redeems shares on a continuous basis, at net asset value, only in a large specified number of shares, each called a "Creation Unit." Creation Units are issued and redeemed principally in-kind for securities included in the relevant index. Except when aggregated in Creation U nits, shares are not individually redeemable securities of the Funds. The investment objective of each Fund is to seek investment results that correspond generally to the price and yield (before the Fund's fees and expenses) of the following equity indices:
| Fund | Index | ||||||
| Aerospace & Defense Portfolio | SPADETM Defense Index | ||||||
| CleantechTM Portfolio | CleantechTM Index | ||||||
| Golden Dragon Halter USX China Portfolio | USX China IndexSM | ||||||
| Listed Private Equity Portfolio | Red Rocks Listed Private Equity Index | ||||||
| Lux Nanotech Portfolio | Lux Nanotech IndexTM | ||||||
| Value Line TimelinessTM Select Portfolio | Value Line TimelinessTM Select Index | ||||||
| Value Line Industry Rotation Portfolio | Value Line Industry Rotation Index | ||||||
| Water Resources Portfolio | Palisades Water Index | ||||||
| WilderHill Clean Energy Portfolio | WilderHill Clean Energy Index | ||||||
| WilderHill Progressive Energy Portfolio | Progressive Energy Index | ||||||
| DWA Technical LeadersTM Portfolio | Dorsey Wright Technical LeadersTM Index | ||||||
66
Notes to Financial Statements (Continued)
PowerShares Exchange-Traded Fund Trust
April 30, 2007
Note 2. Significant Accounting Policies
The preparation of the financial statements in accordance with accounting principles generally accepted in the United States of America requires management to make estimates and assumptions that affect the reported amounts and disclosures in the financial statements. Actual results could differ from these estimates.
A. Security Valuation
Securities are valued based on their last sale price. Price information on listed securities is taken from the exchange where the security is primarily traded. Securities regularly traded in an over-the-counter market are valued at the latest quoted sale price in such market or in the case of NASDAQ, at the NASDAQ official closing price. Other portfolio securities and assets for which market quotations are not readily available are valued at fair value as determined in good faith by the Trust's Pricing Committee in accordance with procedures adopted by the Board of Trustees. Investments in money market mutual funds are stated at net asset value.
B. Federal Income Taxes
Each Fund intends to comply with the provisions of the Internal Revenue Code applicable to regulated investment companies and will distribute all net investment income and net taxable capital gains to its shareholders. Therefore, no provision for Federal income taxes is required.
Income and capital gain distributions are determined in accordance with Federal income tax regulations, which may differ from accounting principles generally accepted in the United States. These differences are primarily due to differing book and tax treatments for in-kind transactions, losses deferred due to wash sales, losses deferred due to post-October losses and excise tax regulations.
C. Investment Income and Investment Transactions
Dividend income is recorded on the ex-dividend date. Interest income is recorded on the accrual basis. Investment transactions are recorded on the trade date. Realized gains and losses from the sale or disposition of securities are calculated on the specific identified cost basis. Corporate actions (including cash dividends) are recorded net of nonreclaimable foreign tax withholdings on the ex-dividend date.
D. Expenses
Expenses of the Trust, which are directly identifiable to a specific Fund, are applied to that Fund. Expenses which are not readily identifiable to a specific Fund are allocated in such a manner as deemed equitable, taking into consideration the nature and type of expense and the relative net assets of each Fund.
E. Dividends and Distributions to Shareholders
Each Fund declares and pays dividends from net investment income, if any, to its shareholders quarterly and distributes net realized taxable capital gains, if any, annually. Such distributions on a tax basis are determined in conformity with income tax regulations which may differ from accounting principles generally accepted in the United States of America. Distributions in excess of tax basis earnings and profits, if any, are reported in each Fund's financial statements as a return of capital.
F. Equalization
Beginning May 1, 2006 (or since inception, if later), all Funds use the accounting practice of equalization. This accounting method is used to keep the continuing shareholder's per share equity in undistributed net investment income from being affected by the continuous sales and redemptions of capital shares. Equalization is calculated on a per share basis whereby a portion of the proceeds from the sales and cost of repurchases of capital shares is applied to undistributed net investment income. The amount of
67
Notes to Financial Statements (Continued)
PowerShares Exchange-Traded Fund Trust
April 30, 2007
equalization is disclosed in the Statements of Changes in Net Assets as undistributed net investment income included in the price of capital shares issued or redeemed. The distributions to shareholders of amounts so applied may be deemed to be a return of capital for tax purposes to the extent that such distributions exceed taxable income.
Note 3. Advisory and Administration Agreements
PowerShares Capital Management LLC (the "Adviser") has overall responsibility as the Funds' investment adviser for the selection and ongoing monitoring of the Funds' investments, managing the Funds' business affairs and providing certain clerical, bookkeeping and other administrative services. The fees paid by each Fund to the Adviser are accrued daily and are payable at 0.50% per annum on each Fund's average daily net assets.
Each Fund is responsible for all of its expenses, including the investment advisory fees, costs of transfer agency, custody, fund administration, legal, audit and other services, interest, taxes, brokerage commissions and other expenses connected with executions of portfolio transactions, any distribution fees or expenses and extraordinary expenses. Pursuant to the Investment Advisory Agreement with the Trust, the Adviser has agreed to waive fees and/or pay Fund expenses to the extent necessary to prevent the operating expenses of the Funds (excluding interest expense, brokerage commissions and other trading expenses, licensing fees, offering costs, taxes and extraordinary expenses) from exceeding 0.60% of average daily net assets per year (the "Expense Cap"), at least until April 30, 2008. Offering costs excluded from the Expense Cap are: (a) legal fees pertaining to the Funds' shares offered for sale; (b) Securities and Exchan ge Commission and state registration fees; and (c) initial fees paid to be listed on an exchange.
For the period ended April 30, 2007, the Adviser waived and assumed the following fees and expenses:
| Fees Waived | Expenses Assumed | ||||||||||
| Aerospace & Defense Portfolio | $ | 118,441 | $ | — | |||||||
| CleantechTM Portfolio | 48,163 | — | |||||||||
| Golden Dragon Halter USX China Portfolio | 56,468 | — | |||||||||
| Listed Private Equity Portfolio | 42,623 | — | |||||||||
| Lux Nanotech Portfolio | 106,037 | — | |||||||||
| Value Line TimelinessTM Select Portfolio | 86,448 | — | |||||||||
| Value Line Industry Rotation Portfolio | 40,101 | — | |||||||||
| Water Resources Portfolio | 175,648 | — | |||||||||
| WilderHill Clean Energy Portfolio | (34,877 | ) | — | ||||||||
| WilderHill Progressive Energy Portfolio | 47,367 | — | |||||||||
| DWA Technical LeadersTM Portfolio | 35,114 | 39,365 | |||||||||
The Trust and the Adviser have entered into an Excess Expense Agreement (the "Expense Agreement") in which expenses borne by the Adviser are subject to reimbursement by the Fund up to three years from the date the fee or expense was incurred, but no reimbursement payment will be made by the Fund if it would result in the Fund exceeding its Expense Cap as specified above.
68
Notes to Financial Statements (Continued)
PowerShares Exchange-Traded Fund Trust
April 30, 2007
During the period ended April 30, 2007, the details of expense waivers and reimbursements to the Adviser under the Expense Agreement were as follows:
| Gross Waivers | Gross Reimbursements | Net (Waivers)/ Reimbursements | |||||||||||||
| Golden Dragon Halter USX China Portfolio | $ | (85,394 | ) | $ | 28,926 | $ | (56,468 | ) | |||||||
| Value Line TimelinessTM Select Portfolio | (86,482 | ) | 34 | (86,448 | ) | ||||||||||
| Water Resources Portfolio | (214,855 | ) | 39,207 | (175,648 | ) | ||||||||||
| WilderHill Clean Energy Portfolio | (92,363 | ) | 127,240 | 34,877 | |||||||||||
The net amounts of waivers or reimbursements are also shown on the Statements of Operations.
The amounts subject to reimbursement to the Adviser at April 30, 2007 are as follows:
| Reimbursements available during the fiscal years ended: | |||||||||||||||
| 04/30/08 | 04/30/09 | 04/30/10 | |||||||||||||
| Aerospace & Defense Portfolio | $ | 153,499 | $ | 153,499 | $ | 118,441 | |||||||||
| CleantechTM Portfolio | 48,163 | 48,163 | 48,163 | ||||||||||||
| Golden Dragon Halter USX China Portfolio | 245,699 | 245,699 | 85,394 | ||||||||||||
| Listed Private Equity Portfolio | 42,623 | 42,623 | 42,623 | ||||||||||||
| Lux Nanotech Portfolio | 139,117 | 139,117 | 106,037 | ||||||||||||
| Value Line TimelinessTM Select Portfolio | 115,504 | 115,504 | 86,482 | ||||||||||||
| Value Line Industry Rotation Portfolio | 40,101 | 40,101 | 40,101 | ||||||||||||
| Water Resources Portfolio | 214,854 | 214,854 | 214,855 | ||||||||||||
| WilderHill Clean Energy Portfolio | 83,653 | 83,653 | 83,653 | ||||||||||||
| WilderHill Progressive Energy Portfolio | 47,367 | 47,367 | 47,367 | ||||||||||||
| DWA Technical LeadersTM Portfolio | 74,479 | 74,479 | 74,479 | ||||||||||||
Distribution Agreement
Effective September 18, 2006 (or since inception, if later), A I M Distributors, Inc. (the "Distributor") serves as the distributor of Creation Units of each Fund pursuant to a Distribution Agreement between the Distributor and the Trust. The Distributor does not maintain a secondary market in shares. Prior to September 18, 2007, ALPS Distributors, Inc. served as the distributor.
The Board of Trustees of the Trust has adopted a distribution plan pursuant to Rule 12b-1 under the 1940 Act. In accordance with the Rule 12b-1 plan, each Fund is authorized to pay an amount up to a maximum annual rate of 0.25% of the average daily net assets for certain distribution-related activities. No 12b-1 fees are currently charged to the Funds, and there are no plans to impose these fees.
Licensing Fee Agreements
The Adviser has entered into licensing agreements for each Fund with the following "Licensors":
| Fund | Licensor | ||||||
| Aerospace & Defense Portfolio | International Space Business Council | ||||||
| CleantechTM Portfolio | Cleantech Capital Indices, LLC | ||||||
| Golden Dragon Halter USX China Portfolio | Halter Financial Group | ||||||
| Listed Private Equity Portfolio | Red Rocks Capital Partners, LLC | ||||||
| Lux Nanotech Portfolio | Lux Research, Inc. | ||||||
69
Notes to Financial Statements (Continued)
PowerShares Exchange-Traded Fund Trust
April 30, 2007
| Fund | Licensor | ||||||
| Value Line TimelinessTM Select Portfolio | Value Line Publishing, Inc. | ||||||
| Value Line Industry Rotation Portfolio | Value Line Publishing, Inc. | ||||||
| Water Resources Portfolio | Palisades Water Index Associates, LLC | ||||||
| WilderHill Clean Energy Portfolio | WilderShares, LLC | ||||||
| WilderHill Progressive Energy Portfolio | WilderShares, LLC | ||||||
| DWA Technical LeadersTM Portfolio | Dorsey, Wright & Associates, Inc. | ||||||
The above trademarks are trademarks owned by the respective Licensors. These trademarks have been licensed to the Advisor for use with the Funds. The Funds are not sponsored, endorsed, sold or promoted by the Licensors and the Licensors make no representation regarding the advisability of investing in any of these Funds. The Funds are required to pay the licensing fees, which are shown on the Statements of Operations.
The Bank of New York serves as the administrator, custodian and fund accounting and transfer agent for each Fund.
Note 4. INVESCO Transaction and Transactions with Affiliates
On September 18, 2006, INVESCO PLC (formerly AMVESCAP PLC) and A I M Management Group, Inc., an indirect wholly-owned subsidiary of INVESCO PLC, announced that they had completed their acquisition of the Adviser (the "Acquisition"). The Board of Trustees, including a majority of the independent Trustees, and shareholders of each Fund had previously approved a new advisory agreement with the Adviser that became effective on September 18, 2006.
The Funds are permitted to invest daily available cash balances in affiliated money market funds. The Funds invest in the Liquid Assets Portfolio ("LAP") of the Short-Term Investments. LAP is advised by A I M Advisors, Inc., an affiliate of the Adviser.
Note 5. Federal Income Tax
At April 30, 2007, the components of accumulated earnings/loss on a tax-basis were as follows:
| Accumulated Earnings | Net Accumulated Capital and other Gains/Losses | Unrealized Appreciation/ Depreciation | Gross Unrealized Appreciation | Gross Unrealized Depreciation | Total Accumulated Earnings/Loss | ||||||||||||||||||||||
| Aerospace & Defense Portfolio | $ | — | $ | (104,662 | ) | $ | 20,242,829 | $ | 21,422,833 | $ | (1,180,004 | ) | $ | 20,138,167 | |||||||||||||
| CleantechTM Portfolio | — | — | 969,297 | 1,601,544 | (632,247 | ) | 969,297 | ||||||||||||||||||||
| Golden Dragon Halter USX China Portfolio | 588,109 | (4,146,823 | ) | 27,610,073 | 42,069,391 | (14,459,318 | ) | 24,051,359 | |||||||||||||||||||
| Listed Private Equity Portfolio | 624,862 | — | 4,463,705 | 6,830,565 | (2,366,860 | ) | 5,088,567 | ||||||||||||||||||||
| Lux Nanotech Portfolio | — | (3,986,980 | ) | (7,299,490 | ) | 13,099,355 | (20,398,845 | ) | (11,286,470 | ) | |||||||||||||||||
| Value Line TimelinessTM Select Portfolio | — | (28,753,751 | ) | 23,837,184 | 26,254,954 | (2,417,770 | ) | (4,916,567 | ) | ||||||||||||||||||
| Value Line Industry Rotation Portfolio | — | — | 1,738,936 | 2,133,020 | (394,084 | ) | 1,738,936 | ||||||||||||||||||||
| Water Resources Portfolio | 152,360 | (11,876,489 | ) | 104,906,849 | 157,620,457 | (52,713,608 | ) | 93,182,720 | |||||||||||||||||||
| WilderHill Clean Energy Portfolio | — | (91,631,944 | ) | 12,375,260 | 97,982,596 | (85,607,336 | ) | (79,256,684 | ) | ||||||||||||||||||
| WilderHill Progressive Energy Portfolio | 46,410 | — | 1,826,709 | 2,767,811 | (941,102 | ) | 1,873,119 | ||||||||||||||||||||
| DWA Technical LeadersTM Portfolio | 105,514 | — | 1,948,508 | 2,880,946 | (932,438 | ) | 2,054,022 | ||||||||||||||||||||
70
Notes to Financial Statements (Continued)
PowerShares Exchange-Traded Fund Trust
April 30, 2007
At April 30, 2007, the cost of investments for Federal income tax purposes was as follows:
| Aerospace & Defense Portfolio | $ | 181,755,286 | |||||
| CleantechTM Portfolio | 20,852,691 | ||||||
| Golden Dragon Halter USX China Portfolio | 365,569,659 | ||||||
| Listed Private Equity Portfolio | 145,512,427 | ||||||
| Lux Nanotech Portfolio | 166,286,495 | ||||||
| Value Line TimelinessTM Select Portfolio | 248,892,095 | ||||||
| Value Line Industry Rotation Portfolio | 31,901,285 | ||||||
| Water Resources Portfolio | 1,498,618,294 | ||||||
| WilderHill Clean Energy Portfolio | 900,969,561 | ||||||
| WilderHill Progressive Energy Portfolio | 21,187,715 | ||||||
| DWA Technical LeadersTM Portfolio | 89,933,886 | ||||||
Distributions to Shareholders
The tax character of distributions paid during the period ended April 30, 2007 was as follows:
| Distributions paid from Ordinary Income | |||||||
| Aerospace & Defense Portfolio | $ | 362,663 | |||||
| Golden Dragon Halter USX China Portfolio | 3,191,113 | ||||||
| Listed Private Equity Portfolio | 689,732 | ||||||
| Value Line Industry Rotation Portfolio | 2,669 | ||||||
| Water Resources Portfolio | 11,901,149 | ||||||
| WilderHill Clean Energy Portfolio | 1,691,001 | ||||||
| WilderHill Progressive Energy Portfolio | 14,162 | ||||||
| Distributions paid from Return of Capital | |||||||
| Aerospace & Defense Portfolio | $ | 25,620 | |||||
| Value Line Industry Rotation Portfolio | 4,445 | ||||||
| WilderHill Clean Energy Portfolio | 160,324 | ||||||
The tax character of distributions paid during the period ended April 30, 2006 was as follows:
| Distributions paid from Ordinary Income | |||||||
| Aerospace & Defense Portfolio | $ | 59,157 | |||||
| Golden Dragon Halter USX China Portfolio | 741,732 | ||||||
| Lux Nanotech Portfolio | 22,920 | ||||||
| Water Resources Portfolio | 291,087 | ||||||
71
Notes to Financial Statements (Continued)
PowerShares Exchange-Traded Fund Trust
April 30, 2007
At April 30, 2007, for Federal income tax purposes, the Funds have capital loss carryforwards available as shown in the table below, to the extent provided by the regulations, to offset future capital gains through the years indicated. To the extent that these loss carryforwards are used to offset future capital gains, it is probable that the capital gains so offset will not be distributed to shareholders.
| Capital Loss Available Through | Total | ||||||||||||||||||||||||||
| 2011 | 2012 | 2013 | 2014 | 2015 | Amount | ||||||||||||||||||||||
| Aerospace & Defense Portfolio | — | — | — | — | $ | 104,662 | $ | 104,662 | |||||||||||||||||||
| Golden Dragon Halter USX China Portfolio | — | — | — | $ | 1,018,146 | 3,128,677 | 4,146,823 | ||||||||||||||||||||
| Lux Nanotech Portfolio | — | — | — | — | 3,986,980 | 3,986,980 | |||||||||||||||||||||
| Value Line TimelinessTM Select Portfolio | — | — | — | — | 28,753,751 | 28,753,751 | |||||||||||||||||||||
| Water Resources Portfolio | — | — | — | — | 11,876,489 | 11,876,489 | |||||||||||||||||||||
| WilderHill Clean Energy Portfolio | — | — | — | 2,098,368 | 89,533,576 | 91,631,944 | |||||||||||||||||||||
During the period ended April 30, 2007, the Funds incurred and will elect to defer net capital losses as follows:
| Post-October Losses | |||||||
| Aerospace & Defense Portfolio | $ | 2,895,157 | |||||
| CleantechTM Portfolio | 1,116,227 | ||||||
| Golden Dragon Halter USX China Portfolio | 1,023,851 | ||||||
| Listed Private Equity Portfolio | 690,733 | ||||||
| Lux Nanotech Portfolio | 1,188,954 | ||||||
| Value Line TimelinessTM Select Portfolio | 6,398,518 | ||||||
| Value Line Industry Rotation Portfolio | 383,229 | ||||||
| Water Resources Portfolio | 2,574,817 | ||||||
| WilderHill Clean Energy Portfolio | 26,195,365 | ||||||
| WilderHill Progressive Energy Portfolio | 269,334 | ||||||
| DWA Technical LeadersTM Portfolio | 78,566 | ||||||
At April 30, 2007, the following reclassifications were made to the capital accounts of the Funds, to reflect permanent book/tax differences and income and gains available for distributions under income tax regulations, which are primarily due to the differences between book and tax treatment of investments in real estate investment trusts, investments in partnerships, wash sales from redemption in-kind transactions,
72
Notes to Financial Statements (Continued)
PowerShares Exchange-Traded Fund Trust
April 30, 2007
redemption in-kind transactions, return of capital and net investment losses. Net investment income, net realized gains and net assets were not affected by these changes.
| Undistributed Net Investment Income (Loss) | Undistributed Capital Gains/ (Accumulated Losses) | Paid in Capital | |||||||||||||
| Aerospace & Defense Portfolio | $ | 12,387 | $ | (11,896,499 | ) | $ | 11,884,112 | ||||||||
| CleantechTM Portfolio | 33,552 | (2,240,254 | ) | 2,206,702 | |||||||||||
| Golden Dragon Halter USX China Portfolio | (111,037 | ) | (54,584,958 | ) | 54,695,995 | ||||||||||
| Listed Private Equity Portfolio | (242,577 | ) | (2,121,560 | ) | 2,364,137 | ||||||||||
| Lux Nanotech Portfolio | 159,982 | (10,063,576 | ) | 9,903,594 | |||||||||||
| Value Line TimelinessTM Select Portfolio | 144,770 | (26,480,023 | ) | 26,335,253 | |||||||||||
| Value Line Industry Rotation Portfolio | 2,486 | (720,690 | ) | 718,204 | |||||||||||
| Water Resources Portfolio | (1,035,047 | ) | (48,790,388 | ) | 49,825,435 | ||||||||||
| WilderHill Clean Energy Portfolio | (27,933 | ) | (71,268,087 | ) | 71,296,020 | ||||||||||
| WilderHill Progressive Energy Portfolio | 3,144 | (1,927,839 | ) | 1,924,695 | |||||||||||
| DWA Technical LeadersTM Portfolio | (177,364 | ) | (185,521 | ) | 362,885 | ||||||||||
Note 6. Investment Transactions
For the period ended April 30, 2007, the cost of securities purchased and proceeds from sales of securities, excluding short-term securities and in-kind transactions, were as follows:
| Purchases | Sales | ||||||||||
| Aerospace & Defense Portfolio | $ | 19,479,601 | $ | 19,680,199 | |||||||
| CleantechTM Portfolio | 6,828,394 | 5,914,997 | |||||||||
| Golden Dragon Halter USX China Portfolio | 49,946,633 | 54,352,642 | |||||||||
| Listed Private Equity Portfolio | 15,571,174 | 15,751,654 | |||||||||
| Lux Nanotech Portfolio | 27,704,989 | 20,422,728 | |||||||||
| Value Line TimelinessTM Select Portfolio | 234,359,363 | 227,910,002 | |||||||||
| Value Line Industry Rotation Portfolio | 3,006,675 | 2,837,779 | |||||||||
| Water Resources Portfolio | 396,198,468 | 328,604,791 | |||||||||
| WilderHill Clean Energy Portfolio | 313,312,800 | 297,149,472 | |||||||||
| WilderHill Progressive Energy Portfolio | 3,639,278 | 3,165,375 | |||||||||
| DWA Technical LeadersTM Portfolio | 4,256,014 | 4,203,584 | |||||||||
For the period ended April 30, 2007, in-kind transactions were as follows:
| Purchases | Sales | ||||||||||
| Aerospace & Defense Portfolio | $ | 150,589,982 | $ | 54,513,558 | |||||||
| CleantechTM Portfolio | 48,014,060 | 29,205,884 | |||||||||
| Golden Dragon Halter USX China Portfolio | 289,697,318 | 191,546,762 | |||||||||
| Listed Private Equity Portfolio | 160,963,994 | 16,942,503 | |||||||||
| Lux Nanotech Portfolio | 83,410,466 | 33,574,516 | |||||||||
| Value Line TimelinessTM Select Portfolio | 455,194,731 | 378,899,393 | |||||||||
| Value Line Industry Rotation Portfolio | 38,179,488 | 6,816,382 | |||||||||
73
Notes to Financial Statements (Continued)
PowerShares Exchange-Traded Fund Trust
April 30, 2007
| Purchases | Sales | ||||||||||
| Water Resources Portfolio | $ | 732,888,932 | $ | 268,302,798 | |||||||
| WilderHill Clean Energy Portfolio | 578,512,908 | 294,712,311 | |||||||||
| WilderHill Progressive Energy Portfolio | 38,237,548 | 19,239,907 | |||||||||
| DWA Technical LeadersTM Portfolio | 93,181,839 | 3,407,338 | |||||||||
There were no purchases or sales of U.S. government or government agency obligations for the period ended April 30, 2007. Gains on in-kind transactions are not considered taxable gains for Federal income tax purposes.
Note 7. Trustees' Fees
The Trust compensates each Trustee who is not an employee of the Adviser or its affiliates. The interested Trustee does not receive any Trustees' fees.
Note 8. Capital
Shares are created and redeemed by the Trust only in Creation Unit size aggregations of 100,000. Transaction fees at scheduled amounts of $500 per Creation Unit are charged to those persons creating or redeeming Creation Units. Such transactions are generally permitted on an in-kind basis, with a balancing cash component to equate the transaction to the net asset value per unit of each Fund of the Trust on the transaction date.
Note 9. Risk of Concentration
The Funds concentrate their investments in certain industries, subjecting them to greater risk than funds that invest in a wider range of industries.
Note 10. Indemnifications
Under the Trust's organizational documents, its Officers and Trustees are indemnified against certain liabilities arising out of the performance of their duties to the Trust. Additionally, in the normal course of business, the Trust enters into contracts with service providers that contain general indemnification clauses. The Trust's maximum exposure under these arrangements is unknown, as this would involve future claims that may be made against the Trust that have not yet occurred. However, based on experience, the Trust believes the risk of loss to be remote.
Note 11. New Accounting Pronouncements
On July 13, 2006, the Financial Accounting Standards Board ("FASB") issued FASB Interpretation No. 48, Accounting for Uncertainty in Income Taxes ("FIN 48"). FIN 48 prescribes a recognition threshold and measurement attribute for the financial statement recognition and measurement for a tax position taken or expected to be taken in a tax return. FIN 48 also provides guidance on derecognition, classification, interest and penalties, accounting in interim periods, disclosure and transition. On December 22, 2006, the Securities and Exchange Commission delayed the effective date of FIN 48, which will result in adoption for the Funds as of October 31, 2007. At this time, management is currently assessing the impact of FIN 48, if any, on the Funds' financial statements.
74
Notes to Financial Statements (Continued)
PowerShares Exchange-Traded Fund Trust
April 30, 2007
On September 20, 2006, the FASB released Statement of Financial Accounting Standards No. 157 "Fair Value Measurement" ("FAS 157"). FAS 157 establishes an authoritative definition of fair value, sets out a framework for measuring fair value, and requires additional disclosures about fair-value measurement. The application of FAS 157 is required for fiscal years beginning after November 15, 2007 and interim periods within those fiscal years. At this time, management is currently assessing the impact of FAS 157, if any, on the Funds' financial statements and intends for the Funds to adopt FAS 157 provisions during the fiscal year ending April 30, 2009.
75
Report of Independent Registered Public Accounting Firm
To the Board of Trustees and Shareholders of PowerShares Exchange-Traded Fund Trust:
In our opinion, the accompanying statements of assets and liabilities, including the portfolios of investments, and the related statements of operations and of changes in net assets and the financial highlights present fairly, in all material respects, the financial position of the portfolios indicated in Note 1 of the financial statements comprising PowerShares Exchange-Traded Fund Trust (the "Trust") at April 30, 2007, the results of each of their operations, the changes in each of their net assets and the financial highlights, for each of the periods presented, in conformity with accounting principles generally accepted in the United States of America. These financial statements and financial highlights (hereafter referred to as "financial statements") are the responsibility of the Trust's management; our responsibility is to express an opinion on these financial statements based on our audits. We conducted our audits of thes e financial statements in accordance with the standards of the Public Company Accounting Oversight Board (United States). Those standards require that we plan and perform the audits to obtain reasonable assurance about whether the financial statements are free of material misstatement. An audit includes examining, on a test basis, evidence supporting the amounts and disclosures in the financial statements, assessing the accounting principles used and significant estimates made by management, and evaluating the overall financial statement presentation. We believe that our audits, which included confirmation of securities at April 30, 2007 by correspondence with the custodian and brokers, provide a reasonable basis for our opinion.
PricewaterhouseCoopers LLP
New York, New York
June 25, 2007
76
Supplemental Information (Unaudited)
Federal Income Tax Information
The percentages of investment income (dividend income plus short-term gains, if any) qualify as follows:
| Qualified dividend income | Dividends-received deduction | ||||||||||
| Aerospace & Defense Portfolio | 100 | % | 100 | % | |||||||
| CleantechTM Portfolio | 0 | % | 0 | % | |||||||
| Golden Dragon Halter USX China Portfolio | 100 | % | 0 | % | |||||||
| Listed Private Equity Portfolio | 100 | % | 100 | % | |||||||
| Lux Nanotech Portfolio | 0 | % | 0 | % | |||||||
| Value Line TimelinessTM Select Portfolio | 0 | % | 0 | % | |||||||
| Value Line Industry Rotation Portfolio | 100 | % | 100 | % | |||||||
| Water Resources Portfolio | 100 | % | 100 | % | |||||||
| WilderHill Clean Energy Portfolio | 100 | % | 100 | % | |||||||
| WilderHill Progressive Energy Portfolio | 100 | % | 100 | % | |||||||
| DWA Technical LeadersTM Portfolio | 0 | % | 0 | % | |||||||
77
Supplemental Information (Unaudited) (Continued)
Trustees and Officers
The Trustees who are not affiliated with the Adviser or affiliates of the Adviser and executive officers of the Trust, their term of office and length of time served, their principal business occupations during the past five years, the number of portfolios in the Fund Complex overseen by each Trustee and the other directorships, if any, held by the Trustee, are shown below.
| Name, Address and Age of Independent Trustees | Position(s) with Trust | Length of Time Served* | Principal Occupation(s) During Past 5 Years | Number of Portfolios in Fund Complex*** Overseen by Trustees | Other Directorships Held by Trustees | ||||||||||||||||||
| Ronn R. Bagge (49) YQA Capital Management, LLC 1755 S. Naperville Rd., Suite 100 Wheaton, IL 60187 | Trustee | Since 2003 | YQA Capital Management LLC (July 1998-Present); formerly Owner/CEO of Electronic Dynamic Balancing Co., Inc. (high-speed rotating equipment service provider) | 79 | None | ||||||||||||||||||
| Marc M. Kole (47)** c/o PowerShares Capital Management LLC 301 W. Roosevelt Road Wheaton, IL 60187 | Trustee | Since 2006 | Controller, Priority Health (September 2005-present); Interim CFO, Priority Health (July 2006-February 2007); formerly Senior Vice President of Finance, United Healthcare (health insurance) (July 2004-July 2005); Senior Vice President of Finance, Oxford Health Plans (June 2000-July 2004) | 79 | None | ||||||||||||||||||
| D. Mark McMillan (44) c/o PowerShares Capital Management LLC 301 W. Roosevelt Road Wheaton, IL 60187 | Trustee | Since 2003 | Member, Bell, Boyd & Lloyd LLC (1989- Present) | 79 | None | ||||||||||||||||||
* This is the date the Trustee began serving the Trust.
** At a Board meeting held on December 14, 2006, Marc Kole was elected to serve as Trustee of the Trust.
*** Fund Complex includes all open-end funds (including all of their Portfolios) advised by the Adviser. The Fund Complex consists of the Trust's 70 Portfolios and one other exchange-traded fund trust with 9 Portfolios advised by the Adviser.
78
Supplemental Information (Unaudited) (Continued)
Trustees and Officers (Continued)
| Name, Address and Age of Independent Trustees | Position(s) with Trust | Length of Time Served* | Principal Occupation(s) During Past 5 Years | Number of Portfolios in Fund Complex*** Overseen by Trustees | Other Directorships Held by Trustees | ||||||||||||||||||
| Philip M. Nussbaum (45) c/o PowerShares Capital Management LLC 301 W. Roosevelt Road Wheaton, IL 60187 | Trustee | Since 2003 | Chairman, Performance Trust Capital Partners (formerly Betzold, Berg, Nussbaum & Heitman, Inc.); formerly Managing Director, Communication Institute (May 2002-August 2003); Executive Vice President of Finance, Betzold, Berg, Nussbaum & Heitman, Inc. (March 1994- 1999) | 79 | None | ||||||||||||||||||
| Donald H. Wilson (47)** c/o PowerShares Capital Management LLC 301 W. Roosevelt Road Wheaton, IL 60187 | Trustee | Since 2006 | Executive Vice President and Chief Financial Officer, AMCORE Financial, Inc. (bank holding company) (February 2006-present); formerly, Senior Vice President and Treasurer, Marshall & Ilsley Corp. (bank holding company) (May 1995-February 2006) | 79 | None | ||||||||||||||||||
* This is the date the Trustee began serving the Trust.
** At a Board meeting held on December 14, 2006, Donald Wilson was elected to serve as Trustee of the Trust.
*** Fund Complex includes all open-end funds (including all of their Portfolios) advised by the Adviser. The Fund Complex consists of the Trust's 70 Portfolios and one other exchange-traded fund trust with 9 Portfolios advised by the Adviser.
79
Supplemental Information (Unaudited) (Continued)
Trustees and Officers (Continued)
| Name, Address and Age of Management Trustee | Position(s) with Trust | Length of Time Served* | Principal Occupation(s) During Past 5 Years | Number of Portfolios in Fund Complex*** Overseen by Trustee | Other Directorships Held by Trustee | ||||||||||||||||||
| H. Bruce Bond (44)** PowerShares Capital Management LLC 301 W. Roosevelt Road Wheaton, IL 60187 | Chairman of the Board, Trustee and Chief Executive Officer | Since 2003 | Managing Director, PowerShares Capital Management LLC (August 2002-Present); Manager, Nuveen Investments (April 1998-August 2002) | 79 | None | ||||||||||||||||||
* This is the date the Management Trustee began serving the Trust.
** Interested person as defined in Section 2(a)(19) of the 1940 Act.
*** Fund Complex includes all open-end funds (including all of their Portfolios) advised by the Adviser. The Fund Complex consists of the Trust's 70 Portfolios and one other exchange-traded fund trust with 9 Portfolios advised by the Adviser.
80
Supplemental Information (Unaudited) (Continued)
Trustees and Officers (Continued)
| Name, Address and Age of Officers | Position(s) with Trust | Length of Time Served* | Principal Occupation(s) During Past 5 Years | ||||||||||||
| Bruce T. Duncan (52) PowerShares Capital Management LLC 301 W. Roosevelt Road Wheaton, IL 60187 | Chief Financial Officer and Treasurer | Since 2006 | Senior Vice President of Finance, PowerShares Capital Management LLC (September 2005-Present); Private Practice Attorney (2000-2005); Vice President of Investor Relations, The ServiceMaster Company (1994-2000); Vice President of Taxes, The ServiceMaster Company (1990-2000) | ||||||||||||
| Kevin R. Gustafson (41) PowerShares Capital Management LLC 301 W. Roosevelt Road Wheaton, IL 60187 | Chief Compliance Officer | Since 2004 | General Counsel and Chief Compliance Officer, PowerShares Capital Management LLC (September 2004-Present); Attorney, Nyberg & Gustafson (2001- 2004); Attorney, Burke, Warren, McKay & Serritella, P.C. (1997-2000) | ||||||||||||
| Keith Ovitt (44) PowerShares Capital Management LLC 301 W. Roosevelt Road Wheaton, IL 60187 | Secretary | Since 2003 | Managing Director, PowerShares Capital Management LLC (April 2003-Present); President, Ovitech (2002-2003); Vice President of Information Systems for DFG Foods, LLC (Division of FoodBrands America/Tyson Foods) (1999-2002); Systems Manager, Nabisco Biscuit Company (1997-1999) | ||||||||||||
* This is the period for which the Officers began serving the Trust. Each Officer serves an indefinite term, until his successor is elected.
81
Board Considerations Regarding Continuation of Investment
Advisory Agreement (Unaudited)
At a meeting held on April 20, 2007, the Board of Trustees of the PowerShares Exchange-Traded Fund Trust (the "Trust"), including the Independent Trustees, unanimously approved the continuation of the Investment Advisory Agreement between PowerShares Capital Management LLC (the "Adviser") and the Trust for the following series (the "Funds"):
PowerShares Dynamic Market Portfolio
PowerShares Dynamic OTC Portfolio
PowerShares Golden Dragon Halter USX China Portfolio
PowerShares High Yield Equity Dividend AchieversTM Portfolio
PowerShares WilderHill Clean Energy Portfolio
PowerShares Dynamic Large Cap Growth Portfolio
PowerShares Dynamic Large Cap Value Portfolio
PowerShares Dynamic Mid Cap Growth Portfolio
PowerShares Dynamic Mid Cap Value Portfolio
PowerShares Dynamic Small Cap Growth Portfolio
PowerShares Dynamic Small Cap Value Portfolio
PowerShares Dynamic Biotechnology & Genome Portfolio
PowerShares Dynamic Food & Beverage Portfolio
PowerShares Dynamic Leisure and Entertainment Portfolio
PowerShares Dynamic Media Portfolio
PowerShares Dynamic Networking Portfolio
PowerShares Dynamic Pharmaceuticals Portfolio
PowerShares Dynamic Semiconductors Portfolio
PowerShares Dynamic Software Portfolio
PowerShares Zacks Micro Cap Portfolio
PowerShares Aerospace & Defense Portfolio
PowerShares Dynamic Hardware & Consumer Electronics Portfolio
PowerShares Dynamic Telecommunications & Wireless Portfolio
PowerShares Value Line Timeliness Select Portfolio
PowerShares Divided AchieversTM Portfolio
PowerShares International Dividend AchieversTM Portfolio
PowerShares High Growth Rate Dividend AchieversTM Portfolio
PowerShares Zacks Small Cap Portfolio
PowerShares Dynamic Building & Construction Portfolio
PowerShares Dynamic Energy Exploration & Production Portfolio
PowerShares Dynamic Insurance Portfolio
PowerShares Dynamic Oil & Gas Services Portfolio
PowerShares Dynamic Retail Portfolio
PowerShares Dynamic Utilities Portfolio
PowerShares Lux Nanotech Portfolio
PowerShares FTSE RAFI US 1000 Portfolio
PowerShares Water Resources Portfolio
The Trustees reviewed information from the Adviser describing: (i) the nature, extent and quality of services provided, (ii) the investment performance of the Funds and the Adviser, (iii) the costs of services provided and estimated profits realized by the Adviser, (iv) the extent to which economies of scale are realized as the Funds grow, (v) whether fee levels reflect any possible economies of scale for the benefit of Fund shareholders, (vi) comparisons of services rendered and amounts paid to other registered investment companies and (vii) any benefits realized by the Adviser from its relationship with each Fund. Based on all of the information considered and the conclusions reached, the Board, including the Independent Trustees, determined to approve the continuation of the Investment Advisory Agreement for each Fund listed above. No single factor was determinative in the Board's analysis.
Nature, Extent and Quality of Services. In evaluating the nature, extent and quality of the Adviser's services, the Trustees reviewed information concerning the functions performed by the Adviser for the
82
Board Considerations Regarding Continuation of Investment
Advisory Agreement (Unaudited) (Continued)
Funds, information describing the Adviser's current organization, including operations assistance provided by the Adviser's new parent organization, AMVESCAP LLC, and the background and experience of the persons responsible for the day-to-day management of the Funds. The Trustees reviewed matters related to the Adviser's portfolio transaction policies and procedures. The Trustees reviewed information on the performance of the Funds and the performance of their benchmark indices. The Trustees also reviewed reports on the correlation and tracking error between the underlying index and each Fund's performance and reviewed a report of a consultant to the Adviser on correlation and tracking error. The Trustees concluded that Funds are correlated to their underlying index and that the tracking error was within a reasonable range.
The Trustees also considered the services provided by the Adviser in its oversight of the Funds' administrator, custodian and transfer agent. They noted the significant amount of time and effort that had been devoted to this oversight function.
Based on their review, the Trustees found that the nature and extent of services provided to the Funds under the Investment Advisory Agreement are appropriate and that the quality is good.
Fees, Expenses and Profitability. The Trustees reviewed and discussed the information provided by the Adviser on each Fund's expense ratio and the advisory fee, as compared to three categories of comparable funds selected by Lipper Inc., an independent source: exchange-traded index funds ("ETFs"), open-end funds and closed-end funds. The Trustees also reviewed and discussed additional information prepared by Lipper Inc. on expense ratios and advisory fees of a broader universe of ETFs and other index funds. The Adviser supplemented the information prepared by Lipper Inc. with data it compiled on expense ratios and advisory fees of newer ETFs that recently commenced operations. The Trustees noted that the annual advisory fee charged to the Funds was identical (0.50% of average net assets), except for the advisory fee for the PowerShares High Yield Equi ty Dividend AchieversTM Portfolio, the PowerShares Dividend AchieversTM Portfolio, the PowerShares High Growth Rate Dividend AchieversTM Portfolio and the PowerShares International Dividend AchieversTM Portfolio (for each of which the annual advisory fee was 0.40% of average net assets), and that the Adviser had agreed to waive the fee and/or pay expenses to the extent necessary to prevent the annual operating expenses of each Fund (excluding interest expenses, licensing fees (for all Funds other than the initial two Funds, the PowerShares Dynamic OTC Portfolio and the PowerShares Dynamic Market Portfolio), brokerage commissions and other trading expenses, taxes and extraordinary expenses) from exceeding 0.60% (0.50% for the PowerShares High Yield Equity Dividend AchieversTM Portfolio, the PowerShares Dividend AchieversTM Portfolio, the PowerShares High Growth Rate Dividend AchieversTM Portfolio and the PowerShares International Div idend AchieversTM Portfolio) at least until April 30, 2008. The Trustees noted that the Adviser does not provide investment management services to clients other than the Trust. The Trustees noted that the advisory fees were at the higher end of the ETF universe, but were generally lower than fees for open-end (non-ETF) funds and closed-end funds, and were reasonable because of the complexity of the indices, which generally require more frequent rebalancing of the portfolios, the distinguishing factors of the Funds, and the higher administrative, operational and management oversight costs for the Adviser. The Board therefore concluded that the advisory fee and expense ratio of each Fund are competitive and that the advisory fee for each Fund is reasonable and appropriate in amount in light of the quality of services provided and the expense cap in place.
83
Board Considerations Regarding Continuation of Investment
Advisory Agreement (Unaudited) (Continued)
In conjunction with their review of fees, the Trustees also considered information provided by the Adviser on the revenues received by the Adviser under the Agreement, as well as the fees waived and expenses reimbursed by the Adviser for the Funds. The Trustees reviewed information provided by the Adviser on its profitability as well as any profits realized by the Adviser from its relationship to each Fund. The Trustees noted the Adviser's statement that its costs of managing the Funds generally exceeded the amount payable as management fees under the Investment Advisory Agreement, and that most of the Funds were operating in a cash loss position. The Trustees concluded that the profitability to the Adviser of the advisory services provided to the Funds is not unreasonable.
Economies of Scale and Whether Fee Levels Reflect These Economies of Scale. The Trustees reviewed the information provided by the Adviser as to the extent to which economies of scale are realized as each Fund grows and whether fee levels reflect economies of scale for the benefit of shareholders. The Trustees reviewed each Fund's asset size, expense ratio, expense limitation agreed to by the Adviser and whether the investment process produced economies of scale. The Trustees noted that certain fixed costs associated with the management of the Funds are being reduced on a per-Fund basis as additional Funds are added, and that the gradual reduction of the per-Fund cost enabled the Adviser to operate some of the Funds under the expense cap, which potentially would lower the costs to shareholders. The Trustees noted that the Excess Expense Agreement with the Trust provided that the Adviser was entitled to be reimbursed by each Fund for fees waived or expenses absorbed pursuant to the expense cap for a period of three years from the date the fee or expense was incurred, provided that no reimbursement would be made that would result in a Fund exceeding its expense cap.
The Trustees noted that the Adviser had not identified any further benefits that it derived from its relationship with the Funds, and had noted that it does not have any soft-dollar arrangements.
Based on all of the information considered and the conclusions reached, the Board, including the Independent Trustees, determined to approve the continuation of the Investment Advisory Agreement for each Fund listed above. No single factor was determinative in the Board's analysis.
84
PowerShares Leading the Intelligent ETF Revolution
PowerShares continues to offer new solutions to the complex needs demanded by advisors and investors today. PowerShares is "Leading the Intelligent ETF Revolution" providing investment advisors and investors with institutional-caliber asset management by seeking to replicate enhanced indexes in one of the more benefit-rich investment vehicles available in the marketplace today, the exchange-traded fund (EFT). Each PowerShares fund can be classified into one of three different categories based on the objective and characteristics of its underlying index: Intelligent Index, Intelligent Exposure and Intelligent Access.
For most recent portfolio performance, please visit our website at www.powershares.com.
This page contains advertising materials and should not be viewed as part of the Annual Report.
85
Intelligent Index
PowerShares believes that having insight into a stock's investment merit can have a positive impact on performance. Therefore, most PowerShares ETFs are based on Intelligent Indexes, which seek to provide alpha1 by identifying stocks with the greatest investment merit. These indexes use proprietary methodologies to identify financially strong, effectively managed and attractively priced companies with strong capital appreciation potential. Because their objective is to maximize performance, Intelligent Indexes may look different from the market.
Exchange-Traded Funds
Intelligent Index
PWC - Dynamic Market
PWO - Dynamic OTC
PIQ - Dynamic MagniQuant
PJF - Dynamic Large Cap
PJG - Dynamic Mid Cap
PJM - Dynamic Small Cap
PWB - Dynamic Large Cap Growth
PWV - Dynamic Large Cap Value
PWJ - Dynamic Mid Cap Growth
PWP - Dynamic Mid Cap Value
PWT - Dynamic Small Cap Growth
PWY - Dynamic Small Cap Value
PGZ - Dynamic Aggressive Growth
PVM - Dynamic Deep Value
PYZ - Dynamic Basic Materials Sector
PEZ - Dynamic Consumer Discretionary Sector
PSL - Dynamic Consumer Staples Sector
PXI - Dynamic Energy Sector
PFI - Dynamic Financials Sector
PTH - Dynamic Healthcare Sector
PRN - Dynamic Industrials Sector
PTF - Dynamic Technology Sector
PTE - Dynamic Telecommunications & Wireless
PUI - Dynamic Utilities
PJB - Dynamic Banking
PBE - Dynamic Biotechnology & Genome
PKB - Dynamic Building & Construction
PXE - Dynamic Energy Exploration & Production
PBJ - Dynamic Food & Beverage
PHW - Dynamic Hardware & Consumer Electronics
PTJ - Dynamic Healthcare Services
PIC - Dynamic Insurance
PEJ - Dynamic Leisure and Entertainment
PBS - Dynamic Media
PXQ - Dynamic Networking
PXJ - Dynamic Oil & Gas Services
PJP - Dynamic Pharmaceuticals
PMR - Dynamic Retail
PSI - Dynamic Semiconductors
PSJ - Dynamic Software
1 Alpha is a measure of risk adjusted performance relative to a benchmark or the market.
This page contains advertising materials and should not be viewed as part of the Annual Report.
86
Intelligent Exposure
For investors looking for more market-like exposure, PowerShares offers a lineup of ETFs that seek to track indexes with an Intelligent Exposure objective. These indexes seek to provide accurate exposure to the economy, yet are constructed using more sophisticated techniques than traditional benchmark indexes, which typically use a weighting structure based on market capitalization. Under this traditional structure, market speculation can lead to significant mispricing of stocks and, therefore, suboptimal weights in the index. But indexes seeking Intelligent Exposure use a weighting structure based on company fundamentals: sales, cash flow, book value and dividends. PowerShares believes these factors paint a truer picture of a company's size and lead to more optimal index weightings.
Exchange-Traded Funds
Intelligent Exposure
PRF - FTSE RAFI US 1000
PRFZ - FTSE RAFI US 1500 Small-Mid
PRFM - FTSE RAFI Basic Materials Sector
PRFG - FTSE RAFI Consumer Goods Sector
PRFS - FTSE RAFI Consumer Services Sector
PRFE - FTSE RAFI Energy Sector
PRFF - FTSE RAFI Financials Sector
PRFH - FTSE RAFI Health Care Sector
PRFN - FTSE RAFI Industrials Sector
PRFQ - FTSE RAFI Telecom & Technology Sector
PRFU - FTSE RAFI Utilities Sector
Intelligent Access
Without targeted investment products, unique market segments such as currency or nanotech may be difficult for investors to access. These segments are the focus of indexes that promote Intelligent Access. PowerShares has a diverse lineup of ETFs based on indexes that offer exposure to specific, unique or previously uncovered market areas.
Exchange-Traded Funds
Intelligent Access
PPA - Aerospace & Defense
ADRA - BLDRS Asia 50 ADR Index Fund
ADRD - BLDRS Developed Markets 100 ADR Index Fund
ADRE - BLDRS Emerging Markets 50 ADR Index Fund
ADRU - BLDRS Europe 100 ADR Index Fund
PKW - Buyback Achievers
PZD - Cleantech
PFM - Dividend Achievers
PDP - DWA Technical Lenders
PGF - Financial Preferred
PGJ - Golden Dragon Halter USX China
PHJ - High Growth Rate Dividend Achievers
PEY - High Yield Equity Dividend Achievers
PID - International Dividend Achievers
PSP - Listed Private Equity
PXN - Lux Nanotech
QQQQ - PowerShares QQQ
PYH - Value Line Industry Rotation
PIV - Value Line Timeliness Select
PHO - Water Resources
PBW - WilderHill Clean Energy
PUW - WilderHill Progressive Energy
PZI - Zacks Micro Cap
PZJ - Zacks Small Cap
This page contains advertising materials and should not be viewed as part of the Annual Report.
87
PowerShares Asset Class Guide
Domestic Equity
Broad
PWC Dynamic Market
PWO Dynamic OTC
PIV Value Line Timeliness Select
PRF FTSE RAFI US 1000
PRFZ FTSE RAFI US 1500
PIQ Dynamic MagniQuant
QQQQ PowerShares QQQ
PKW Buyback Achievers
PDP DWA Technical Leaders
PVM Dynamic Deep Value
PGZ Dynamic Aggressive Growth
Style
PJF Dynamic Large Cap
PWB Dynamic Large Cap Growth
PWV Dynamic Large Cap Value
PJG Dynamic Mid Cap
PWJ Dynamic Mid Cap Growth
PWP Dynamic Mid Cap Value
PJM Dynamic Small Cap
PWT Dynamic Small Cap Growth
PWY Dynamic Small Cap Value
PZJ Zacks Small Cap
PZI Zacks Micro Cap
International/Region
Region
PPGJ Golden Dragon Halter USX China
ADRA BLDRS Asia 50 ADR Index Fund
ADRD BLDRS Developed Markets 100 ADR Index Fund
ADRE BLDRS Emerging Markets 50 ADR Index Fund
ADRU BLDRS Europe 100 ADR Index Fund
Income
PID International Dividend Achievers
Income/Dividend
PEY High Yield Equity Dividend Achievers
PHJ High Growth Rate Dividend Achievers
PFM Dividend Achievers
PGF Financial Preferred
Sector and Industry
Sector
PUI Dynamic Utilities
PYZ Dynamic Basic Materials Sector
PEZ Dynamic Consumer Discretionary Sector
PSL Dynamic Consumer Staples Sector
PXI Dynamic Energy Sector
PFI Dynamic Financial Sector
PTH Dynamic Healthcare Sector
PRN Dynamic Industrials Sector
PTF Dynamic Technology Sector
PTE Dynamic Telecommunications & Wireless
PRFQ FTSE RAFI Consumer Goods Sector
PRFS FTSE RAFI Consumer Services Sector
PRFE FTSE RAFI Energy Sector
PRFF FTSE RAFI Financials Sector
PRFH FTSE RAFI Health Care Sector
PRFN FTSE RAFI Industrials Sector
PRFM FTSE RAFI Basic Materials Sector
PRFQ FTSE RAFI Telecommunications & Technology Sector
PRFU FTSE RAFI Utilities Sector
Industry
PJB Dynamic Banking Sector
PBE Dynamic Biotechnology & Genome
PKB Dynamic Building & Construction
PXE Dynamic Energy Exploration & Production
PBJ Dynamic Food & Beverage
PHW Dynamic Hardware & Consumer Electronics
PTJ Dynamic Healthcare Services Sector
PIC Dynamic Insurance
PEJ Dynamic Leisure and Entertainment
PBS Dynamic Media
PXQ Dynamic Networking
PXJ Dynamic Oil & Gas Services
PJP Dynamic Pharmaceuticals
PMR Dynamic Retail
PSI Dynamic Semiconductors
PSJ Dynamic Software
PPA Aerospace & Defense
PBW Clean Energy
PZD Cleantech
PSP Listed Private Equity
PXN Nanotech
PUW Progressive Energy
PYH Value Line Industry Rotation
PHO Water Resources
This page contains advertising materials and should not be viewed as part of the Annual Report.
88
PowerShares Risk Spectrum
Domestic Equity
More Conservative
Dynamic Deep Value
Dynamic Large Cap
Dynamic Mid Cap
Dynamic MagniQuant
Buyback Achievers
DWA Technical Leaders
Dynamic Small Cap
Dynamic Large Cap Value
FTSE RAFI US 1000
Dynamic Mid Cap Value
Dynamic Market
Dynamic Aggressive Growth
Dynamic Small Cap Value
FTSE RAFI US 1500 Small-Mid
Zacks Micro Cap
PowerShares QQQ
Dynamic Large Cap Growth
Dynamic Mid Cap Growth
Zacks Small Cap
Value Line Timeliness Select
Dynamic Small Cap Growth
Dynamic OTC
More Aggressive
International/Region
More Conservative
BLDRS Europe 100 ADR Index Fund
BLDRS Developed Markets 100 ADR Index Fund
BLDRS Asia 50 ADR Index Fund
International Dividend Achievers
BLDRS Emerging Markets 50 ADR Index Fund
Golden Dragon Halter USX China
More Aggressive
Income/Dividend
More Conservative
Financial Preferred
High Yield Equity Dividend Achievers
Dividend Achievers
High Growth Rate Dividend Achievers
More Aggressive
Sector and Industry
More Conservative
Dynamic Consumer Staples Sector
Dynamic Food & Beverage
Dynamic Banking Sector
Dynamic Financial Sector
Dynamic Utilities
Dynamic Insurance
FTSE RAFI Health Care Sector
Dynamic Healthcare Sector
FTSE RAFI Financials Sector
Dynamic Industrials Sector
Dynamic Media
Aerospace & Defense
FTSE RAFI Industrials Sector
Dynamic Pharmaceuticals
Dynamic Consumer Discretionary Sector
Dynamic Healthcare Services Sector
Dynamic Leisure and Entertainment
FTSE RAFI Consumer Goods Sector
FTSE RAFI Utilities Sector
Water Resources
FTSE RAFI Consumer Services Sector
FTSE RAFI Basic Materials Sector
Dynamic Basic Materials Sector
Dynamic Retail
FTSE RAFI Energy Sector
Dynamic Energy Sector
Dynamic Building & Construction
Value Line Industry Rotation
Dynamic Technology Sector
Progressive Energy
Dynamic Biotechnology & Genome
Dynamic Software
Nanotech
Dynamic Energy Exploration & Production
FTSE RAFI Telecommunications & Technology Sector
Dynamic Hardware & Consumer Electronics
Dynamic Telecommunications & Wireless
Dynamic Oil & Gas Services
Cleantech
Listed Private Equity
Clean Energy
Dynamic Networking
Dynamic Semiconductors
More Aggressive
This page contains advertising materials and should not be viewed as part of the Annual Report.
89
Exchange-Traded Funds
ETFs are investment funds that trade like individual stocks on all of the major exchanges, similar to shares of publicly held companies. They can be bought and sold on an exchange at any moment during market hours. Since they are listed and traded on an exchange, you can be confident that you are investing in a well-regulated market.
ETFs are one of the fastest growing investment products in the worldwide financial marketplace. As of 3.31.2007, 432 ETFs were listed in the U.S. with $433 billion in assets, up from two products with only $1 billion in assets in 1995.
ETFs seek investment results that correspond generally to the price and yield (before fees and expenses) of a listed index. While most ETFs share a similar objective, the principal investment strategies of the underlying indexes can have substantial differences. It is important to gain a clear understanding of an ETF's underlying index as the index's objective is inherently passed on to the fund shareholders by seeking to replicate the index.
Indexes
An index is a selection process or appointed committee that groups selected securities together to track their movement in aggregate. While only a few indexes are mentioned on the daily news, there are hundreds of indexes in existence today that differ from each other in diverse ways.
Broad Market
Broad market indexes are what most people think of when an index is mentioned. These indexes are designed to track the performance of the broad market.
Benchmark
Benchmark indexes are created to set a standard by which the performance or movement of individual securities and asset managers can be measured.
Exchange Composite
These indexes are designed to provide a comprehensive measure of the performance of all commons stocks listed on a particular exchange.
Sector or Industry
The aggregate financial marketplace is generally broken down into roughly ten sectors which are further dissected into many specific industries.
Style
Style indexes are created to identify groups of stocks that are either growth (companies currently experiencing appreciation or significant earnings or revenue growth) or value (companies determined to be under priced by fundamental measures) oriented.
Company Size
Market-capitalization indexes group together companies that are similar in size based on the number of outstanding shares times the share price, while fundamentally weighted indexes group together stocks of companies based on their financial fundamental valuation.
International / Country
International indexes group together stocks of companies that are affiliated by location outside of the U.S. or companies located with a specific country or region.
Income / Bond
Income indexes group stocks based on their type of income of securities, while bond indexes are designed to show the average performance of a group of debt securities.
This page contains advertising materials and should not be viewed as part of the Annual Report.
90
Specialty / Enhanced
Many other specialty indexes are created with specific investment management objectives or for customized purposes. These indexes can be created specifically with the intention to be used as the basis for an ETF. Investor targets can be met through an ETF where the index has the objective(s) of capital appreciation, risk control, income or diversification.
Benefits of PowerShares
PowerShares ETFs offer investors a low-cost, tax-efficient investment in a professionally crafted portfolio consisting of some of the best managed companies and most timely investments. See important risk factors in back.
Tax Advantaged Product Design
Taxes may be one of the most critical and overlooked factors in wealth creation over time. The ETF product structure defers some or possibly all capital gains until investors sell their shares.
Low Ownership Cost
ETFs provide lower ownership cost because of their efficient structure. PowerShares have established expense caps to make the cost of ownership clear and straightforward for investors. Ordinary brokerage commissions apply.
Flexibility, Transparency
PowerShares' ETFs offer flexibility as shares can be bought and sold throughout the day through exchange trading. Fund holdings are disclosed every day. Options based on the funds are available, possibly increasing financial management opportunities for advisors and their clients.
Near Instant Liquidity, Trades at or Close to NAV
PowerShares may be bought and sold on the exchange at any time during market hours. Although shares are not individually redeemable directly from the fund itself, authorized participants may acquire shares and tender shares for redemption, through creation unit aggregations. ETFs are not closed-end funds and trade at or near net asset values.
This page contains advertising materials and should not be viewed as part of the Annual Report.
91
This page intentionally left blank
PROXY VOTING POLICIES AND PROCEDURES
A description of the Funds' proxy voting policies and procedures that the Funds use to determine how to vote proxies relating to portfolio securities is available, without charge and upon request, by calling (800) 337-4246. This information is also available on the Securities and Exchange Commission's ("Commission") website at www.sec.gov.
Information regarding how the Funds voted proxies for portfolio securities, if applicable, during the most recent 12-month period ended June 30, is also available, without charge and upon request, by (i) calling (800) 337-4246; or (ii) accessing the Funds' Form N-PX on the Commission's website at www.sec.gov.
QUARTERLY PORTFOLIOS
The Funds file their complete schedules of portfolio holdings with the Commission for the first and third quarters of each fiscal year on Form N-Q. The Funds' Forms N-Q are available on the Commission's website at www.sec.gov. The Funds' Forms N-Q may also be reviewed and copied at the Commission's Public Reference Room in Washington, DC; information on the operation of the Public Reference Room may be obtained by calling (800) SEC-0330.
There are risks involved in investing in ETFs, including possible loss of money. Investing in securities of small and medium sized companies involves greater risk than is customarily associated with investing in more established companies, and investments in concentrated industry sectors involve greater risks than investments that are more diversified. PowerShares ETFs are not actively managed and are subject to risks similar to stocks, including those related to short selling and margin maintenance. PowerShares ETFs are not FDIC insured, may lose value and have no bank guarantee. PowerShares is a registered trademark of PowerShares Capital Management LLC. Past performance is not a guarantee of future results.
A I M Distributors, Inc. is the distributor of the PowerShares Exchange-Traded Fund Trust.
An investor should consider each Fund's investment objective, risks, charges and expenses carefully before investing. For more complete information about PowerShares ETFs call A I M Distributors, Inc. at (800) 337-4246 or visit our website powershares.com for a prospectus. Please read the prospectus carefully before investing.

301 W. Roosevelt Road
Wheaton, IL 60187
800.983.0903
www.powershares.com
P-PS-AR-4
2007 Annual Report to Shareholders
30 April 2007

PowerShares Dynamic Basic Materials Sector Portfolio
PowerShares Dynamic Consumer Discretionary Sector Portfolio
PowerShares Dynamic Consumer Staples Sector Portfolio
PowerShares Dynamic Energy Sector Portfolio
PowerShares Dynamic Financial Sector Portfolio
PowerShares Dynamic Healthcare Sector Portfolio
PowerShares Dynamic Industrials Sector Portfolio
PowerShares Dynamic Technology Sector Portfolio
PowerShares Dynamic Telecommunications & Wireless Portfolio
PowerShares Dynamic Utilities Portfolio

Table of Contents
| Shareholder Letter | 2 | ||||||
| The Market Environment | 3 | ||||||
| Manager's Analysis | 4 | ||||||
| Funds' Distribution History | 24 | ||||||
| Frequency Distribution of Discounts & Premiums | 26 | ||||||
| Fees and Expenses | 28 | ||||||
| Sector Portfolios | |||||||
| Schedules of Investments | |||||||
| PowerShares Dynamic Basic Materials Sector Portfolio | 30 | ||||||
| PowerShares Dynamic Consumer Discretionary Sector Portfolio | 31 | ||||||
| PowerShares Dynamic Consumer Staples Sector Portfolio | 33 | ||||||
| PowerShares Dynamic Energy Sector Portfolio | 34 | ||||||
| PowerShares Dynamic Financial Sector Portfolio | 35 | ||||||
| PowerShares Dynamic Healthcare Sector Portfolio | 36 | ||||||
| PowerShares Dynamic Industrials Sector Portfolio | 37 | ||||||
| PowerShares Dynamic Technology Sector Portfolio | 39 | ||||||
| PowerShares Dynamic Telecommunications & Wireless Portfolio | 40 | ||||||
| PowerShares Dynamic Utilities Portfolio | 41 | ||||||
| Statements of Assets and Liabilities | 42 | ||||||
| Statements of Operations | 44 | ||||||
| Statements of Changes in Net Assets | 46 | ||||||
| Financial Highlights | 48 | ||||||
| Notes to Financial Statements | 53 | ||||||
| Report of Independent Registered Public Accounting Firm | 62 | ||||||
| Supplemental Information (Unaudited) | 63 | ||||||
| Information about Advisory Agreement (Unaudited) | 68 | ||||||

To My Fellow Investors,
It gives me great pleasure to report on the state of your investment(s) in PowerShares Exchange-Traded Funds and to thank you for your continued confidence in PowerShares Capital Management LLC.
Let me share with you the exciting events that have taken place at PowerShares as I look back over the past 12 months and at what the future may hold.
PowerShares has experienced significant growth over the past 12 months. We now have 70 exchange-traded funds ("ETFs") in the market, an increase of 33 funds from the 37 funds at the beginning of the fiscal year. PowerShares now offers more U.S. based equity ETFs than any other ETF sponsor. Assets under management increased almost 75%, from $6 billion to over $10 billion at April 30, 2007. This phenomenal growth demonstrates the continued strong demand for our original listings as well as the excellent reception of our new funds.
Of the new funds offered, 10 were FTSE RAFI funds, which were the first PowerShares Exchange-Traded Funds to be listed on the NASDAQ stock exchange, making PowerShares the only ETF sponsor to list ETFs on all three major U.S. exchanges: the American Stock Exchange, the NASDAQ, and the New York Stock Exchange.
PowerShares continues to be recognized as an innovator in the ETF marketplace. In 2007, our FTSE RAFI US 1000 Fund was awarded the most innovative new ETF at the Third Annual Global ETF Awards program.
Drawing on our increased resources as a member of the INVESCO family, we plan to introduce several PowerShares ETFs for international and global investing. These new funds will help to fulfill our goal of providing investors with the opportunity to invest in intelligent ETFs in marketplaces around the globe.
On behalf of PowerShares Capital Management LLC and the Board of Trustees for the PowerShares Exchanged-Traded Fund Trust, I want to thank you for your participation in the PowerShares family of exchange-traded funds. We look forward to serving you in the future.
Highest Regards,

H. Bruce Bond
President and Chairman of the Board of Trustees
PowerShares Exchange-Traded Fund Trust
2
The Market Environment
Although spikes of volatility marked the beginning and end of the reporting period, the U.S. equity marketplace provided strong results, with the S&P 500 Index posting double digit returns of 15.24%. At the beginning of the reporting period, enthusiasm over economic expansion gave way to uncertainty over interest rates and concern that corporate profits would be difficult to sustain. But by the end of summer 2006, energy prices had cooled and investors surmised the Fed's actions had contained inflation without significant damage to ongoing corporate earnings.
Stocks resumed their upward path until late February of 2007, when Chinese regulators threatened to clamp down on local trading practices, causing global markets to retreat sharply. Global concerns, coupled with a slowing housing market domestically and the Fed's insistence that inflation posed a greater risk than a recession, amplified volatility. However, a strong job market, sustained earnings and indications that inflation would remain contained were enough to resume the rally by the end of the reporting period.
The telecom and utilities sectors posted the best results, while technology and industrial sectors lagged. Bond prices recovered moderately during the reporting period as the Fed ended its two year hike on rates in June of 2006 and a retracting housing market eased inflation concerns. With a few bumps along the way, commodity prices continued their upward march.
3
Manager's Analysis
PowerShares Dynamic Basic Materials Sector Portfolio (ticker: PYZ)
The PowerShares Dynamic Basic Materials Sector Portfolio is based on the Dynamic Basic Materials Sector IntellidexSM index and seeks investment results that correspond generally to the price and yield (before the Fund's fees and expenses) of that equity index.
Since its October 12, 2006 inception date, the Fund has shown strong performance, returning 24.69%. Over that short time, the portfolio outperformed the overall S&P Materials Index which had a positive return of 20.74%. Metals & mining, chemicals, and containers & packaging led the way with the largest percent of contribution to return. All industries within basic materials performed well with none of them showing a negative return for the period.
Industry Breakdown (% of the Fund's
Net Assets)
| Chemicals | 47.2 | ||||||
| Iron/Steel | 14.1 | ||||||
| Packaging & Containers | 12.5 | ||||||
| Mining | 12.1 | ||||||
| Forest Products & Paper | 6.7 | ||||||
| Miscellaneous Manufacturing | 3.2 | ||||||
| Environmental Control | 1.6 | ||||||
| Metal Fabricate/Hardware | 1.5 | ||||||
| Energy-Alternate Sources | 1.2 | ||||||
| Money Market | 0.2 | ||||||
| Other | (0.3 | ) | |||||
Style Allocation (%)
| Mid-Cap Value | 40.6 | ||||||
| Large-Cap Value | 17.5 | ||||||
| Small-Cap Value | 16.7 | ||||||
| Mid-Cap Growth | 12.8 | ||||||
| Small-Cap Growth | 7.0 | ||||||
| Large-Cap Growth | 5.4 | ||||||
Top Ten Fund Holdings
(% of the Fund's Net Assets)
| Security | |||||||
| Freeport-McMoRan Copper & Gold, Inc., Class B | 2.8 | ||||||
| United States Steel Corp. | 2.7 | ||||||
| PPG Industries, Inc. | 2.7 | ||||||
| Southern Copper Corp. | 2.7 | ||||||
| Dow Chemical (The) Co. | 2.6 | ||||||
| Allegheny Technologies, Inc. | 2.6 | ||||||
| International Paper Co. | 2.5 | ||||||
| Alcoa, Inc. | 2.5 | ||||||
| Praxair, Inc. | 2.5 | ||||||
| Nucor Corp. | 2.5 | ||||||
| Total | 26.1 | ||||||
4
Manager's Analysis (Continued)
PowerShares Dynamic Basic Materials Sector Portfolio (ticker: PYZ)
Growth of a $10,000 Investment Since Inception
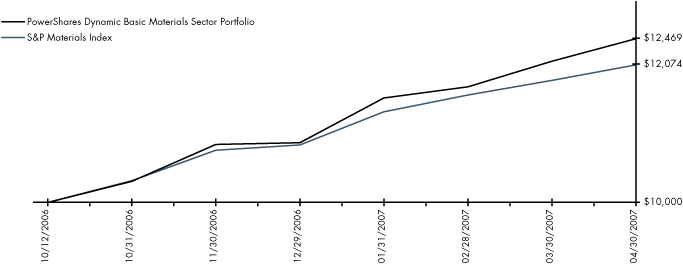
Fund Performance History (%) As of 30 April 2007
Index
| Fund Inception Cumulative | |||||||
| Dynamic Basic Materials Sector IntellidexSM Index | 25.36 | ||||||
| S&P Materials Index | 20.74 | ||||||
| Dow Jones Basic Materials Index | 20.21 | ||||||
Fund
| NAV Return | 24.69 | ||||||
| Share Price Return | 24.86 | ||||||
Fund Inception: 12 October 2006
Performance data quoted represents past performance. Past performance is not a guarantee of future results, current performance may be higher or lower than performance quoted. Investment returns and principal value will fluctuate and shares, when redeemed, may be worth more or less than their original cost. The Share Price performance reflects fee waivers, absent which, performance would have been lower. According to the Fund's most recent Prospectus, the Fund's total gross annual operating expenses was indicated as 0.70%. In the Financial Highlights section of this Annual Report, the Fund's net (subsidized) annualized total operating expense ratio was determined to be 0.71% while the Fund's gross annualized total operating expense ratio was 1.32%. The Adviser has contractually agreed to waive fees and/or pay certain Fund expenses which resulted in a lower fee actually paid by investors. This waiver extends through April 30, 200 8. Absent reimbursements or waivers, performance would have been lower. NAV and Share Price returns assume that dividends and capital gain distributions have been reinvested in the Fund at NAV and Share Price, respectively. The returns shown in the table above do not reflect the deduction of taxes that a shareholder would pay on Fund distributions or the redemption or sale of Fund Shares. See powershares.com to find the most recent month-end performance numbers.
The index performance results are hypothetical. Index returns do not represent Fund returns. An investor cannot invest directly in an index. The index does not charge management fees or brokerage expenses, and no such fees or expenses were deducted from the hypothetical performance shown nor does the index lend securities, and no revenues from securities lending were added to the performance shown. In addition, the results actual investors might have achieved would have differed from those shown because of differences in the timing, amounts of their investments, and fees and expenses associated with an investment in the Fund.
The S&P Materials Index and the Dow Jones Basic Materials Index are unmanaged indices based on the average performance of approximately 30 and 90 common stocks, respectively.
5
Manager's Analysis
PowerShares Dynamic Consumer Discretionary Sector Portfolio (ticker: PEZ)
The PowerShares Dynamic Consumer Discretionary Sector Portfolio is based on the Dynamic Consumer Discretionary Sector IntellidexSM Index and seeks investment results that correspond generally to the price and yield (before the Fund's fees and expenses) of that equity index.
Since its October 12, 2006 inception date, the Fund has shown strong performance, returning 13.11%. Over that short time, the portfolio outperformed the S&P Consumer Discretionary Index, which returned 6.77%. Specialty retail, textiles, apparel & luxury goods and household materials led the way with the largest percent of contribution to return.
All industries within the consumer discretionary sector performed well for the year. Asbury Automotive Group and Aeropostale were leading the way in the specialty retail, with Polo Ralph Lauren and Deckers Outdoor posting strong results in the textiles, apparel & luxury goods space. Tempur-Pedic International and ITT Educational Services also contributed positively to the overall return of the portfolio.
Industry Breakdown (% of the Fund's
Net Assets)
| Retail | 38.3 | ||||||
| Apparel | 18.7 | ||||||
| Media | 6.7 | ||||||
| Commercial Services | 5.9 | ||||||
| Household Products/Wares | 5.9 | ||||||
| Lodging | 4.8 | ||||||
| Toys/Games/Hobbies | 4.1 | ||||||
| Home Furnishings | 3.0 | ||||||
| Auto Parts & Equipment | 2.7 | ||||||
| Advertising | 2.5 | ||||||
| Distribution/Wholesale | 2.4 | ||||||
| Housewares | 2.4 | ||||||
| Home Builders | 1.6 | ||||||
| Entertainment | 1.2 | ||||||
| Money Market | 0.3 | ||||||
| Other | (0.5 | ) | |||||
Style Allocation (%)
| Mid-Cap Value | 27.4 | ||||||
| Small-Cap Value | 27.2 | ||||||
| Mid-Cap Growth | 16.3 | ||||||
| Large-Cap Growth | 11.9 | ||||||
| Small-Cap Growth | 9.7 | ||||||
| Large-Cap Value | 7.5 | ||||||
Top Ten Fund Holdings
(% of the Fund's Net Assets)
| Security | |||||||
| VF Corp. | 2.7 | ||||||
| Polo Ralph Lauren Corp. | 2.6 | ||||||
| Mattel, Inc. | 2.6 | ||||||
| Yum! Brands, Inc. | 2.6 | ||||||
| NIKE, Inc., Class B | 2.5 | ||||||
| Walt Disney (The) Co. | 2.5 | ||||||
| Starwood Hotels & Resorts Worldwide, Inc. | 2.5 | ||||||
| Omnicom Group, Inc. | 2.5 | ||||||
| TJX Cos., Inc. | 2.5 | ||||||
| Coach, Inc. | 2.4 | ||||||
| Total | 25.4 | ||||||
6
Manager's Analysis (Continued)
PowerShares Dynamic Consumer Discretionary Sector Portfolio (ticker: PEZ)
Growth of a $10,000 Investment Since Inception
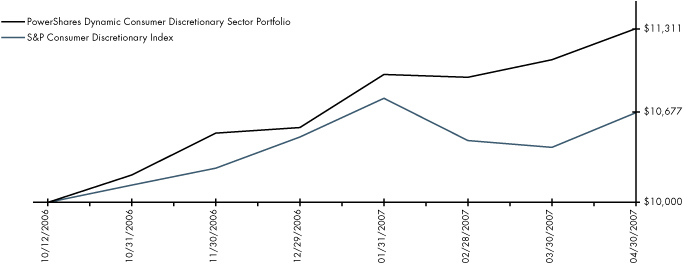
Fund Performance History (%) As of 30 April 2007
Index
| Fund Inception Cumulative | |||||||
| Dynamic Consumer Discretionary Sector IntellidexSM Index | 13.54 | ||||||
| S&P Consumer Discretionary Index | 6.77 | ||||||
| Dow Jones Consumer Services Index | 7.17 | ||||||
Fund
| NAV Return | 13.11 | ||||||
| Share Price Return | 13.19 | ||||||
Fund Inception: 12 October 2006
Performance data quoted represents past performance. Past performance is not a guarantee of future results, current performance may be higher or lower than performance quoted. Investment returns and principal value will fluctuate and shares, when redeemed, may be worth more or less than their original cost. The Share Price performance reflects fee waivers, absent which, performance would have been lower. According to the Fund's most recent Prospectus, the Fund's total gross annual operating expenses was indicated as 0.70%. In the Financial Highlights section of this Annual Report, the Fund's net (subsidized) annualized total operating expense ratio was determined to be 0.72% while the Fund's gross annualized total operating expense ratio was 1.41%. The Adviser has contractually agreed to waive fees and/or pay certain Fund expenses which resulted in a lower fee actually paid by investors. This waiver extends through April 30, 200 8. Absent reimbursements or waivers, performance would have been lower. NAV and Share Price returns assume that dividends and capital gain distributions have been reinvested in the Fund at NAV and Share Price, respectively. The returns shown in the table above do not reflect the deduction of taxes that a shareholder would pay on Fund distributions or the redemption or sale of Fund Shares. See powershares.com to find the most recent month-end performance numbers.
The index performance results are hypothetical. Index returns do not represent Fund returns. An investor cannot invest directly in an index. The index does not charge management fees or brokerage expenses, and no such fees or expenses were deducted from the hypothetical performance shown nor does the index lend securities, and no revenues from securities lending were added to the performance shown. In addition, the results actual investors might have achieved would have differed from those shown because of differences in the timing, amounts of their investments, and fees and expenses associated with an investment in the Fund.
The S&P Consumer Discretionary Index and the Dow Jones Consumer Services Index are unmanaged indices based on the average performance of approximately 86 and 250 common stocks, respectively.
7
Manager's Analysis
PowerShares Dynamic Consumer Staples Sector Portfolio (ticker: PSL)
The PowerShares Dynamic Consumer Staples Sector Portfolio is based on the Dynamic Consumer Staples Sector IntellidexSM Index and seeks investment results that correspond generally to the price and yield (before the Fund's fees and expenses) of that equity index.
Since its October 12, 2006 inception date, the Fund has shown strong performance with a positive 12.69% return for the period. Over that short time, the portfolio outperformed the S&P Consumer Staples Index which returned 9.42%. Food products and food & staples retailing led the way with the largest percent of contribution to return. All industries within consumer staples performed well during this time with none showing negative returns. Seaboard Corp., a food products company, was the largest contributor to returns while Kroger, a food & staples retailing company, and NVTY Inc., categorized in the personal products industry, also contributed to the positive results. Brown-Forman and WE-40 were the biggest drags on performance.
Industry Breakdown (% of the Fund's
Net Assets)
| Food | 38.7 | ||||||
| Agriculture | 13.2 | ||||||
| Beverages | 13.1 | ||||||
| Retail | 11.5 | ||||||
| Cosmetic/Personal Care | 10.3 | ||||||
| Household Products/Wares | 6.7 | ||||||
| Pharmaceuticals | 2.1 | ||||||
| Electrical Components & Equipment | 1.5 | ||||||
| Distribution/Wholesale | 1.4 | ||||||
| Miscellaneous Manufacturing | 1.2 | ||||||
| Money Market | 0.8 | ||||||
| Other | (0.5 | ) | |||||
Style Allocation (%)
| Large-Cap Value | 29.1 | ||||||
| Mid-Cap Value | 25.0 | ||||||
| Small-Cap Value | 18.3 | ||||||
| Large-Cap Growth | 17.5 | ||||||
| Small-Cap Growth | 6.1 | ||||||
| Mid-Cap Growth | 4.0 | ||||||
Top Ten Fund Holdings
(% of the Fund's Net Assets)
| Security | |||||||
| Kroger (The) Co. | 2.8 | ||||||
| CVS Corp. | 2.7 | ||||||
| Coca-Cola (The) Co. | 2.7 | ||||||
| Altria Group, Inc. | 2.6 | ||||||
| Kellogg Co. | 2.6 | ||||||
| General Mills, Inc. | 2.5 | ||||||
| PepsiCo, Inc. | 2.5 | ||||||
| Kimberly-Clark Corp. | 2.5 | ||||||
| Reynolds American, Inc. | 2.5 | ||||||
| Kraft Foods, Inc., Class A | 2.4 | ||||||
| Total | 25.8 | ||||||
8
Manager's Analysis (Continued)
PowerShares Dynamic Consumer Staples Sector Portfolio (ticker: PSL)
Growth of a $10,000 Investment Since Inception
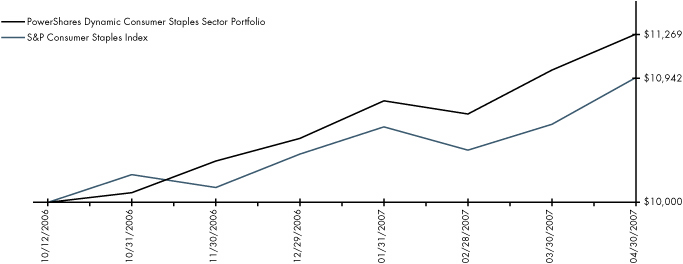
Fund Performance History (%) As of 30 April 2007
Index
| Fund Inception Cumulative | |||||||
| Dynamic Consumer Staples Sector IntellidexSM Index | 13.10 | ||||||
| S&P Consumer Staples Index | 9.42 | ||||||
| Dow Jones Consumer Goods Index | 9.85 | ||||||
Fund
| NAV Return | 12.69 | ||||||
| Share Price Return | 12.75 | ||||||
Fund Inception: 12 October 2006
Performance data quoted represents past performance. Past performance is not a guarantee of future results, current performance may be higher or lower than performance quoted. Investment returns and principal value will fluctuate and shares, when redeemed, may be worth more or less than their original cost. The Share Price performance reflects fee waivers, absent which, performance would have been lower. According to the Fund's most recent Prospectus, the Fund's total gross annual operating expenses was indicated as 0.70%. In the Financial Highlights section of this Annual Report, the Fund's net (subsidized) annualized total operating expense ratio was determined to be 0.73% while the Fund's gross annualized total operating expense ratio was 1.46%. The Adviser has contractually agreed to waive fees and/or pay certain Fund expenses which resulted in a lower fee actually paid by investors. This waiver extends through April 30, 200 8. Absent reimbursements or waivers, performance would have been lower. NAV and Share Price returns assume that dividends and capital gain distributions have been reinvested in the Fund at NAV and Share Price, respectively. The returns shown in the table above do not reflect the deduction of taxes that a shareholder would pay on Fund distributions or the redemption or sale of Fund Shares. See powershares.com to find the most recent month-end performance numbers.
The index performance results are hypothetical. Index returns do not represent Fund returns. An investor cannot invest directly in an index. The index does not charge management fees or brokerage expenses, and no such fees or expenses were deducted from the hypothetical performance shown nor does the index lend securities, and no revenues from securities lending were added to the performance shown. In addition, the results actual investors might have achieved would have differed from those shown because of differences in the timing, amounts of their investments, and fees and expenses associated with an investment in the Fund.
The S&P Consumer Staples Index and the Dow Jones Consumer Goods Index are unmanaged indices based on the average performance of approximately 39 and 160 common stocks, respectively.
9
Manager's Analysis
PowerShares Dynamic Energy Sector Portfolio (ticker: PXI)
The PowerShares Dynamic Energy Sector Portfolio is based on the Dynamic Energy Sector IntellidexSM Index and seeks investment results that correspond generally to the price and yield (before the Fund's fees and expenses) of that equity index.
Since its October 12, 2006 inception date, the portfolio has performed very well returning 23.78% compared to the overall S&P Energy Index which returned 20.21% for the time period. Tesoro, USEC and Valero Energy led the way in the oil gas & consumable fuels industry while TODOCO and Schlumberger led the way in energy equipment & services industry. Swift Energy and Hercules Offshore were two of the recent laggards, but overall the energy sector showed strong performance due to global demand in energy products and uncertainty of the supply of those products.
Industry Breakdown (% of the Fund's
Net Assets)
| Oil & Gas | 46.3 | ||||||
| Oil & Gas Services | 25.6 | ||||||
| Gas | 12.8 | ||||||
| Pipelines | 5.6 | ||||||
| Coal | 2.8 | ||||||
| Mining | 1.6 | ||||||
| Transportation | 1.6 | ||||||
| Electric | 1.4 | ||||||
| Energy-Alternate Sources | 1.3 | ||||||
| Retail | 1.2 | ||||||
| Money Market | 0.2 | ||||||
| Other | (0.4 | ) | |||||
Style Allocation (%)
| Mid-Cap Growth | 20.0 | ||||||
| Large-Cap Value | 19.1 | ||||||
| Large-Cap Growth | 18.0 | ||||||
| Mid-Cap Value | 17.5 | ||||||
| Small-Cap Value | 15.9 | ||||||
| Small-Cap Growth | 9.5 | ||||||
Top Ten Fund Holdings
(% of the Fund's Net Assets)
| Security | |||||||
| Baker Hughes, Inc. | 2.8 | ||||||
| National Oilwell Varco, Inc. | 2.7 | ||||||
| Valero Energy Corp. | 2.7 | ||||||
| Schlumberger Ltd. (Netherlands) | 2.6 | ||||||
| Devon Energy Corp. | 2.5 | ||||||
| Marathon Oil Corp. | 2.5 | ||||||
| Chevron Corp. | 2.5 | ||||||
| Transocean, Inc. (Cayman Islands) | 2.5 | ||||||
| Exxon Mobil Corp. | 2.4 | ||||||
| Occidental Petroleum Corp. | 2.4 | ||||||
| Total | 25.6 | ||||||
10
Manager's Analysis (Continued)
PowerShares Dynamic Energy Sector Portfolio (ticker: PXI)
Growth of a $10,000 Investment Since Inception
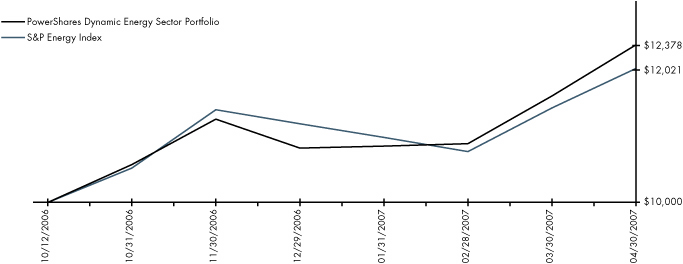
Fund Performance History (%) As of 30 April 2007
Index
| Fund Inception Cumulative | |||||||
| Dynamic Energy Sector IntellidexSM Index | 24.18 | ||||||
| S&P Energy Index | 20.21 | ||||||
| Dow Jones Oil & Gas Index | 20.64 | ||||||
Fund
| NAV Return | 23.78 | ||||||
| Share Price Return | 23.92 | ||||||
Fund Inception: 12 October 2006
Performance data quoted represents past performance. Past performance is not a guarantee of future results, current performance may be higher or lower than performance quoted. Investment returns and principal value will fluctuate and shares, when redeemed, may be worth more or less than their original cost. The Share Price performance reflects fee waivers, absent which, performance would have been lower. According to the Fund's most recent Prospectus, the Fund's total gross annual operating expenses was indicated as 0.70%. In the Financial Highlights section of this Annual Report, the Fund's net (subsidized) annualized total operating expense ratio was determined to be 0.71% while the Fund's gross annualized total operating expense ratio was 1.22%. The Adviser has contractually agreed to waive fees and/or pay certain Fund expenses which resulted in a lower fee actually paid by investors. This waiver extends through April 30, 200 8. Absent reimbursements or waivers, performance would have been lower. NAV and Share Price returns assume that dividends and capital gain distributions have been reinvested in the Fund at NAV and Share Price, respectively. The returns shown in the table above do not reflect the deduction of taxes that a shareholder would pay on Fund distributions or the redemption or sale of Fund Shares. See powershares.com to find the most recent month-end performance numbers.
The index performance results are hypothetical. Index returns do not represent Fund returns. An investor cannot invest directly in an index. The index does not charge management fees or brokerage expenses, and no such fees or expenses were deducted from the hypothetical performance shown nor does the index lend securities, and no revenues from securities lending were added to the performance shown. In addition, the results actual investors might have achieved would have differed from those shown because of differences in the timing, amounts of their investments, and fees and expenses associated with an investment in the Fund.
The S&P Energy Index and the Dow Jones Oil & Gas Index are unmanaged indices based on the average performance of approximately 29 and 70 common stocks, respectively.
11
Manager's Analysis
PowerShares Dynamic Financial Sector Portfolio (ticker: PFI)
The PowerShares Dynamic Financial Sector Portfolio is based on the Dynamic Financial Sector IntellidexSM Index and seeks investment results that correspond generally to the price and yield (before the Fund's fees and expenses) of that equity index.
Since its October 12, 2006 inception date, the portfolio, after fees and expenses, has returned 5.72% compared to the S&P Financials Index which returned 6.06%. Insurance and capital markets companies were the largest contributors to performance. Loews Corp., Hartford Financial Services and Principal Financial Group were the largest contributors to performance in the insurance industry. Franklin Resources and Goldman Sachs were the leaders in the capital markets industry. The financial sector has been relatively uneasy for months due to sub-prime and inflation concerns.
Industry Breakdown (% of the Fund's
Net Assets)
| Banks | 11.1 | ||||||
| Commercial Services | 2.5 | ||||||
| Diversified Financial Services | 12.2 | ||||||
| Insurance | 72.0 | ||||||
| Real Estate | 1.3 | ||||||
| Software | 1.3 | ||||||
| Money Market | 0.6 | ||||||
| Other | (1.0 | ) | |||||
Style Allocation (%)
| Mid-Cap Value | 35.1 | ||||||
| Large-Cap Value | 28.0 | ||||||
| Small-Cap Value | 25.4 | ||||||
| Large-Cap Growth | 7.6 | ||||||
| Mid-Cap Growth | 3.9 | ||||||
Top Ten Fund Holdings
(% of the Fund's Net Assets)
| Security | |||||||
| Loews Corp. | 2.7 | ||||||
| XL Capital Ltd., Class A (Cayman Islands) | 2.7 | ||||||
| Franklin Resources, Inc. | 2.7 | ||||||
| Hartford Financial Services Group (The), Inc. | 2.6 | ||||||
| ACE Ltd. (Cayman Islands) | 2.6 | ||||||
| Prudential Financial, Inc. | 2.6 | ||||||
| Travelers Cos. (The), Inc. | 2.6 | ||||||
| Chubb Corp. | 2.5 | ||||||
| Principal Financial Group, Inc. | 2.5 | ||||||
| Goldman Sachs Group (The), Inc. | 2.5 | ||||||
| Total | 26.0 | ||||||
12
Manager's Analysis (Continued)
PowerShares Dynamic Financial Sector Portfolio (ticker: PFI)
Growth of a $10,000 Investment Since Inception

Fund Performance History (%) As of 30 April 2007
Index
| Fund Inception Cumulative | |||||||
| Dynamic Financial Sector IntellidexSM Index | 6.06 | ||||||
| S&P Financials Index | 6.06 | ||||||
| Dow Jones Financials Index | 4.31 | ||||||
Fund
| NAV Return | 5.72 | ||||||
| Share Price Return | 5.86 | ||||||
Fund Inception: 12 October 2006
Performance data quoted represents past performance. Past performance is not a guarantee of future results, current performance may be higher or lower than performance quoted. Investment returns and principal value will fluctuate and shares, when redeemed, may be worth more or less than their original cost. The Share Price performance reflects fee waivers, absent which, performance would have been lower. According to the Fund's most recent Prospectus, the Fund's total gross annual operating expenses was indicated as 0.70%. In the Financial Highlights section of this Annual Report, the Fund's net (subsidized) annualized total operating expense ratio was determined to be 0.72% while the Fund's gross annualized total operating expense ratio was 1.38%. The Adviser has contractually agreed to waive fees and/or pay certain Fund expenses which resulted in a lower fee actually paid by investors. This waiver extends through April 30, 200 8. Absent reimbursements or waivers, performance would have been lower. NAV and Share Price returns assume that dividends and capital gain distributions have been reinvested in the Fund at NAV and Share Price, respectively. The returns shown in the table above do not reflect the deduction of taxes that a shareholder would pay on Fund distributions or the redemption or sale of Fund Shares. See powershares.com to find the most recent month-end performance numbers.
The index performance results are hypothetical. Index returns do not represent Fund returns. An investor cannot invest directly in an index. The index does not charge management fees or brokerage expenses, and no such fees or expenses were deducted from the hypothetical performance shown nor does the index lend securities, and no revenues from securities lending were added to the performance shown. In addition, the results actual investors might have achieved would have differed from those shown because of differences in the timing, amounts of their investments, and fees and expenses associated with an investment in the Fund.
The S&P Financials Index and the Dow Jones Financials Index are unmanaged indices based on the average performance of approximately 89 and 300 common stocks, respectively.
13
Manager's Analysis
PowerShares Dynamic Healthcare Sector Portfolio (ticker: PTH)
The PowerShares Dynamic Healthcare Sector Portfolio is based on the Dynamic Healthcare Sector IntellidexSM Index and seeks investment results that correspond generally to the price and yield (before the Fund's fees and expenses) of that equity index.
Since its October 12, 2006 inception date, the portfolio had a solid return of 14.31% compared with the S&P Health Care Index which returned 9.59%. The two industries which led the way were health care providers & services and health care equipment & supplies. CIGNA and Humana led the way in the health care providers & services industry while Caremark Rx lagged. Biosite was the strongest performer for the portfolio along with Kinetic Concepts and Baxter.
Industry Breakdown (% of the Fund's
Net Assets)
| Healthcare-Products | 32.8 | ||||||
| Healthcare-Services | 25.8 | ||||||
| Pharmaceuticals | 17.7 | ||||||
| Electronics | 9.1 | ||||||
| Commercial Services | 8.2 | ||||||
| Biotechnology | 2.7 | ||||||
| Insurance | 2.6 | ||||||
| Software | 1.3 | ||||||
| Money Market | 0.0 | ||||||
| Other | (0.2 | ) | |||||
Style Allocation (%)
| Mid-Cap Growth | 27.3 | ||||||
| Small-Cap Growth | 18.8 | ||||||
| Large-Cap Growth | 17.6 | ||||||
| Small-Cap Value | 13.5 | ||||||
| Mid-Cap Value | 12.3 | ||||||
| Large-Cap Value | 10.5 | ||||||
Top Ten Fund Holdings
(% of the Fund's Net Assets)
| Security | |||||||
| Merck & Co., Inc. | 2.9 | ||||||
| Baxter International, Inc. | 2.8 | ||||||
| Cigna Corp. | 2.6 | ||||||
| Waters Corp. | 2.6 | ||||||
| Zimmer Holdings, Inc. | 2.6 | ||||||
| Humana, Inc. | 2.5 | ||||||
| Coventry Health Care, Inc. | 2.5 | ||||||
| Pfizer, Inc. | 2.5 | ||||||
| McKesson Corp. | 2.5 | ||||||
| Aetna, Inc. | 2.5 | ||||||
| Total | 26.0 | ||||||
14
Manager's Analysis (Continued)
PowerShares Dynamic Healthcare Sector Portfolio (ticker: PTH)
Growth of a $10,000 Investment Since Inception
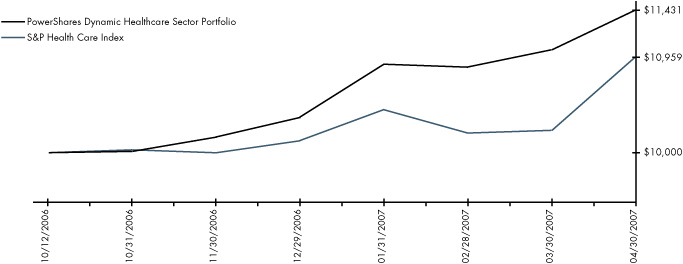
Fund Performance History (%) As of 30 April 2007
Index
| Fund Inception Cumulative | |||||||
| Dynamic Healthcare Sector IntellidexSM Index | 14.78 | ||||||
| S&P Health Care Index | 9.59 | ||||||
| Dow Jones Healthcare Index | 8.19 | ||||||
Fund
| NAV Return | 14.31 | ||||||
| Share Price Return | 14.35 | ||||||
Fund Inception: 12 October 2006
Performance data quoted represents past performance. Past performance is not a guarantee of future results, current performance may be higher or lower than performance quoted. Investment returns and principal value will fluctuate and shares, when redeemed, may be worth more or less than their original cost. The Share Price performance reflects fee waivers, absent which, performance would have been lower. According to the Fund's most recent Prospectus, the Fund's total gross annual operating expenses was indicated as 0.70%. In the Financial Highlights section of this Annual Report, the Fund's net (subsidized) annualized total operating expense ratio was determined to be 0.71% while the Fund's gross annualized total operating expense ratio was 1.20%. The Adviser has contractually agreed to waive fees and/or pay certain Fund expenses which resulted in a lower fee actually paid by investors. This waiver extends through April 30, 200 8. Absent reimbursements or waivers, performance would have been lower. NAV and Share Price returns assume that dividends and capital gain distributions have been reinvested in the Fund at NAV and Share Price, respectively. The returns shown in the table above do not reflect the deduction of taxes that a shareholder would pay on Fund distributions or the redemption or sale of Fund Shares. See powershares.com to find the most recent month-end performance numbers.
The index performance results are hypothetical. Index returns do not represent Fund returns. An investor cannot invest directly in an index. The index does not charge management fees or brokerage expenses, and no such fees or expenses were deducted from the hypothetical performance shown nor does the index lend securities, and no revenues from securities lending were added to the performance shown. In addition, the results actual investors might have achieved would have differed from those shown because of differences in the timing, amounts of their investments, and fees and expenses associated with an investment in the Fund.
The S&P Health Care Index and the Dow Jones Healthcare Index are unmanaged indices based on the average performance of approximately 56 and 180 common stocks, respectively.
15
Manager's Analysis
PowerShares Dynamic Industrials Sector Portfolio (ticker: PRN)
The PowerShares Dynamic Industrials Sector Portfolio is based on the Dynamic Industrials Sector IntellidexSM Index and seeks investment results that correspond generally to the price and yield (before the Fund's fees and expenses) of that equity index.
Since its October 12, 2006 inception date, the portfolio returned 14.28% compared with the S&P Industrials Index which returned 8.21%. Machinery, commercial services & supplies and aerospace & defense were the top performing industries. Cummins, Terex and JLG Industries led the way in the machinery industry. Also contributing to the Fund's positive performance were Manpower, within the commercial services & supplies industry, and Precision CastParts, within the aerospace & defense industry. Due to rising prices in most markets in April, very few stocks contributed negatively to performance.
Industry Breakdown (% of the Fund's
Net Assets)
| Commercial Services | 22.9 | ||||||
| Aerospace/Defense | 17.1 | ||||||
| Miscellaneous Manufacturing | 15.9 | ||||||
| Machinery-Diversified | 8.6 | ||||||
| Engineering & Construction | 7.6 | ||||||
| Household Products/Wares | 5.0 | ||||||
| Transportation | 4.2 | ||||||
| Office/Business Equipment | 3.9 | ||||||
| Electronics | 2.9 | ||||||
| Office Furnishings | 2.5 | ||||||
| Hand/Machine Tools | 1.5 | ||||||
| Machinery-Construction & Mining | 1.5 | ||||||
| Metal Fabricate/Hardware | 1.5 | ||||||
| Building Materials | 1.3 | ||||||
| Environmental Control | 1.3 | ||||||
| Retail | 1.3 | ||||||
| Home Furnishings | 1.1 | ||||||
| Money Market | 0.1 | ||||||
| Other | (0.2 | ) | |||||
Style Allocation (%)
| Small-Cap Value | 22.7 | ||||||
| Mid-Cap Value | 21.6 | ||||||
| Small-Cap Growth | 18.8 | ||||||
| Mid-Cap Growth | 16.8 | ||||||
| Large-Cap Value | 12.7 | ||||||
| Large-Cap Growth | 7.4 | ||||||
Top Ten Fund Holdings
(% of the Fund's Net Assets)
| Security | |||||||
| Cummins, Inc. | 3.2 | ||||||
| Honeywell International, Inc. | 2.8 | ||||||
| ITT Corp. | 2.6 | ||||||
| R.R. Donnelley & Sons Co. | 2.6 | ||||||
| Cooper Industries Ltd., Class A (Bermuda) | 2.6 | ||||||
| Boeing Co. | 2.5 | ||||||
| Manpower, Inc. | 2.5 | ||||||
| Pitney Bowes, Inc. | 2.5 | ||||||
| United Technologies Corp. | 2.5 | ||||||
| General Dynamics Corp. | 2.5 | ||||||
| Total | 26.3 | ||||||
16
Manager's Analysis (Continued)
PowerShares Dynamic Industrials Sector Portfolio (ticker: PRN)
Growth of a $10,000 Investment Since Inception
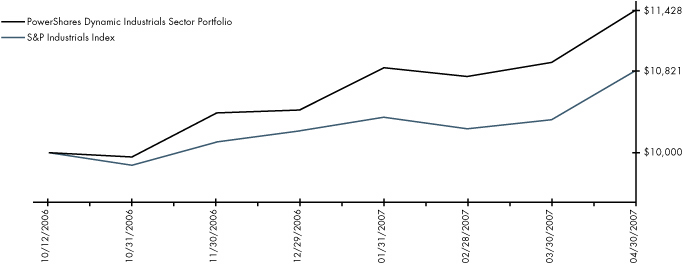
Fund Performance History (%) As of 30 April 2007
Index
| Fund Inception Cumulative | |||||||
| Dynamic Industrials Sector IntellidexSM Index | 14.70 | ||||||
| S&P Industrials Index | 8.21 | ||||||
| Dow Jones Industrials Index | 10.07 | ||||||
Fund
| NAV Return | 14.28 | ||||||
| Share Price Return | 14.37 | ||||||
Fund Inception: 12 October 2006
Performance data quoted represents past performance. Past performance is not a guarantee of future results, current performance may be higher or lower than performance quoted. Investment returns and principal value will fluctuate and shares, when redeemed, may be worth more or less than their original cost. The Share Price performance reflects fee waivers, absent which, performance would have been lower. According to the Fund's most recent Prospectus, the Fund's total gross annual operating expenses was indicated as 0.70%. In the Financial Highlights section of this Annual Report, the Fund's net (subsidized) annualized total operating expense ratio was determined to be 0.71% while the Fund's gross annualized total operating expense ratio was 1.19%. The Adviser has contractually agreed to waive fees and/or pay certain Fund expenses which resulted in a lower fee actually paid by investors. This waiver extends through April 30, 200 8. Absent reimbursements or waivers, performance would have been lower. NAV and Share Price returns assume that dividends and capital gain distributions have been reinvested in the Fund at NAV and Share Price, respectively. The returns shown in the table above do not reflect the deduction of taxes that a shareholder would pay on Fund distributions or the redemption or sale of Fund Shares. See powershares.com to find the most recent month-end performance numbers.
The index performance results are hypothetical. Index returns do not represent Fund returns. An investor cannot invest directly in an index. The index does not charge management fees or brokerage expenses, and no such fees or expenses were deducted from the hypothetical performance shown nor does the index lend securities, and no revenues from securities lending were added to the performance shown. In addition, the results actual investors might have achieved would have differed from those shown because of differences in the timing, amounts of their investments, and fees and expenses associated with an investment in the Fund.
The S&P Industrials Index and the Dow Jones Industrials Index are unmanaged indices based on the average performance of approximately 52 and 270 common stocks, respectively.
17
Manager's Analysis
PowerShares Dynamic Technology Sector Portfolio (ticker: PTF)
The PowerShares Dynamic Technology Sector Portfolio is based on the Dynamic Technology Sector IntellidexSM Index and seeks investment results that correspond generally to the price and yield (before the Fund's fees and expenses) of that equity index.
Since its October 12, 2006 inception date, the portfolio returned 8.69% while the S&P Information Technology Index returned 7.19%. IT services was the strongest industry followed by semiconductors & semiconductor equipment and computers & peripherals. MEMC Electronic Materials was the largest contributor to returns for the period. Covansys and Cognizant Technology Solutions in IT services along with NCR in the computers & peripherals industries added to the positive returns for the portfolio.
Industry Breakdown (% of the Fund's
Net Assets)
| Computers | 35.9 | ||||||
| Software | 21.2 | ||||||
| Telecommunications | 12.0 | ||||||
| Electronics | 9.7 | ||||||
| Semiconductors | 5.7 | ||||||
| Office/Business Equipment | 4.5 | ||||||
| Commercial Services | 4.2 | ||||||
| Internet | 4.1 | ||||||
| Electrical Components & Equipment | 1.6 | ||||||
| Distribution/Wholesale | 1.3 | ||||||
| Other | (0.2 | ) | |||||
Style Allocation (%)
| Mid-Cap Growth | 28.5 | ||||||
| Mid-Cap Value | 21.4 | ||||||
| Small-Cap Value | 19.4 | ||||||
| Small-Cap Growth | 12.9 | ||||||
| Large-Cap Growth | 12.8 | ||||||
| Large-Cap Value | 5.0 | ||||||
Top Ten Fund Holdings
(% of the Fund's Net Assets)
| Security | |||||||
| Apple, Inc. | 2.8 | ||||||
| International Business Machines Corp. | 2.6 | ||||||
| NCR Corp. | 2.6 | ||||||
| Microsoft Corp. | 2.6 | ||||||
| Amphenol Corp., Class A | 2.6 | ||||||
| Xerox Corp. | 2.6 | ||||||
| Agilent Technologies, Inc. | 2.6 | ||||||
| Hewlett-Packard Co. | 2.5 | ||||||
| BMC Software, Inc. | 2.5 | ||||||
| Electronic Data Systems Corp. | 2.5 | ||||||
| Total | 25.9 | ||||||
18
Manager's Analysis (Continued)
PowerShares Dynamic Technology Sector Portfolio (ticker: PTF)
Growth of a $10,000 Investment Since Inception
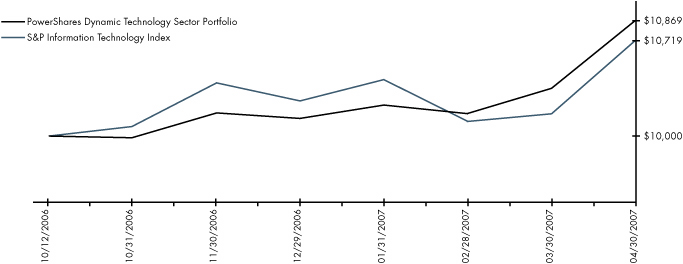
Fund Performance History (%) As of 30 April 2007
Index
| Fund Inception Cumulative | |||||||
| Dynamic Technology Sector IntellidexSM Index | 9.11 | ||||||
| S&P Information Technology Index | 7.19 | ||||||
| Dow Jones Technology Index | 6.79 | ||||||
Fund
| NAV Return | 8.69 | ||||||
| Share Price Return | 8.77 | ||||||
Fund Inception: 12 October 2006
Performance data quoted represents past performance. Past performance is not a guarantee of future results, current performance may be higher or lower than performance quoted. Investment returns and principal value will fluctuate and shares, when redeemed, may be worth more or less than their original cost. The Share Price performance reflects fee waivers, absent which, performance would have been lower. According to the Fund's most recent Prospectus, the Fund's total gross annual operating expenses was indicated as 0.70%. In the Financial Highlights section of this Annual Report, the Fund's net (subsidized) annualized total operating expense ratio was determined to be 0.71% while the Fund's gross annualized total operating expense ratio was 1.25%. The Adviser has contractually agreed to waive fees and/or pay certain Fund expenses which resulted in a lower fee actually paid by investors. This waiver extends through April 30, 200 8. Absent reimbursements or waivers, performance would have been lower. NAV and Share Price returns assume that dividends and capital gain distributions have been reinvested in the Fund at NAV and Share Price, respectively. The returns shown in the table above do not reflect the deduction of taxes that a shareholder would pay on Fund distributions or the redemption or sale of Fund Shares. See powershares.com to find the most recent month-end performance numbers.
The index performance results are hypothetical. Index returns do not represent Fund returns. An investor cannot invest directly in an index. The index does not charge management fees or brokerage expenses, and no such fees or expenses were deducted from the hypothetical performance shown nor does the index lend securities, and no revenues from securities lending were added to the performance shown. In addition, the results actual investors might have achieved would have differed from those shown because of differences in the timing, amounts of their investments, and fees and expenses associated with an investment in the Fund.
The S&P Information Technology Index and the Dow Jones Technology Index are unmanaged indices based on the average performance of approximately 88 and 252 common stocks, respectively.
19
Manager's Analysis
PowerShares Dynamic Telecommunications & Wireless Portfolio (ticker: PTE)
The PowerShares Dynamic Telecommunications & Wireless Portfolio is based on the Dynamic Telecommunications & Wireless IntellidexSM Index and seeks investment results that correspond generally to the price and yield (before the Fund's fees and expenses) of that equity index.
Over the past year, the portfolio has returned 19.93% benefiting from strong returns in AT&T, Qwest Communications, Golden Telecom and BellSouth which led the way in the diversified telecommunications industry. DIRECTV and Liberty Global added positively to the portfolio within the media industry. Cisco was another strong performer within the communications equipment group, while the laggards for the portfolio were Broadwing and Covad Communications Group in diversified telecommunication as well as Syniverse Holdings in wireless telecommunication services.
Industry Breakdown (% of the Fund's
Net Assets)
| Telecommunications | 69.9 | ||||||
| Media | 19.4 | ||||||
| Internet | 2.8 | ||||||
| Software | 2.8 | ||||||
| Electronics | 2.7 | ||||||
| Commercial Services | 2.5 | ||||||
| Other | (0.1 | ) | |||||
Style Allocation (%)
| Small-Cap Value | 27.4 | ||||||
| Large-Cap Growth | 19.9 | ||||||
| Mid-Cap Growth | 16.5 | ||||||
| Mid-Cap Value | 16.1 | ||||||
| Large-Cap Value | 15.1 | ||||||
| Small-Cap Growth | 5.0 | ||||||
Top Ten Fund Holdings
(% of the Fund's Net Assets)
| Security | |||||||
| Liberty Global, Inc., Class A | 5.9 | ||||||
| EchoStar Communications Corp., Class A | 5.4 | ||||||
| AT&T, Inc. | 5.2 | ||||||
| DIRECTV Group (The), Inc. | 5.1 | ||||||
| ALLTEL Corp. | 4.9 | ||||||
| Verizon Communications, Inc. | 4.9 | ||||||
| Cisco Systems, Inc. | 4.8 | ||||||
| American Tower Corp., Class A | 4.6 | ||||||
| Plantronics, Inc. | 3.2 | ||||||
| Mediacom Communications Corp., Class A | 2.9 | ||||||
| Total | 46.9 | ||||||
20
Manager's Analysis (Continued)
PowerShares Dynamic Telecommunications & Wireless Portfolio (ticker: PTE)
Growth of a $10,000 Investment Since Inception
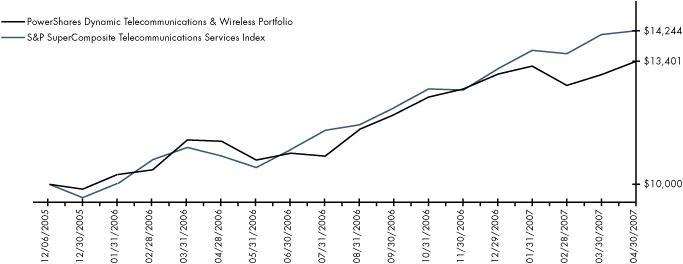
Fund Performance History (%) As of 30 April 2007
Index
| Avg. Ann.† | Fund Inception | ||||||||||||||
| 1 Year | Avg. Ann.† | Cumulative | |||||||||||||
| Dynamic Telecommunications and Wireless IntellidexSM Index | 20.80 | 24.56 | 35.92 | ||||||||||||
| S&P SuperComposite Telecommunications Services Index | 32.11 | 28.81 | 42.44 | ||||||||||||
| Russell 3000® Index | 14.48 | 14.31 | 20.55 | ||||||||||||
Fund
| NAV Return | 19.93 | 23.31 | 34.01 | ||||||||||||
| Share Price Return | 19.93 | 23.36 | 34.09 | ||||||||||||
Fund Inception: 6 December 2005
Performance data quoted represents past performance. Past performance is not a guarantee of future results, current performance may be higher or lower than performance quoted. Investment returns and principal value will fluctuate and shares, when redeemed, may be worth more or less than their original cost. The Share Price performance reflects fee waivers, absent which, performance would have been lower. According to the Fund's most recent Prospectus, the Fund's total gross annual operating expenses was indicated as 0.97%. In the Financial Highlights section of this Annual Report, the Fund's net (subsidized) annualized total operating expense ratio was determined to be 0.66% while the Fund's gross annualized total operating expense ratio was 1.12%. The Adviser has contractually agreed to waive fees and/or pay certain Fund expenses which resulted in a lower fee actually paid by investors. This waiver extends through April 30, 200 8. Absent reimbursements or waivers, performance would have been lower. NAV and Share Price returns assume that dividends and capital gain distributions have been reinvested in the Fund at NAV and Share Price, respectively. The returns shown in the table above do not reflect the deduction of taxes that a shareholder would pay on Fund distributions or the redemption or sale of Fund Shares. See powershares.com to find the most recent month-end performance numbers.
The index performance results are hypothetical. Index returns do not represent Fund returns. An investor cannot invest directly in an index. The index does not charge management fees or brokerage expenses, and no such fees or expenses were deducted from the hypothetical performance shown nor does the index lend securities, and no revenues from securities lending were added to the performance shown. In addition, the results actual investors might have achieved would have differed from those shown because of differences in the timing, amounts of their investments, and fees and expenses associated with an investment in the Fund.
The S&P SuperComposite Telecommunications Services Index and the Russell 3000® Index are unmanaged indices based on the average performance of 13 and 3,000 common stocks, respectively.
† Average annualized.
21
Manager's Analysis
PowerShares Dynamic Utilities Portfolio (ticker: PUI)
The PowerShares Dynamic Utilities Portfolio is based on the Dynamic Utilities IntellidexSM Index and seeks investment results that correspond generally to the price and yield (before the Fund's fees and expenses) of that equity index.
Over the past year, the portfolio has returned a solid 28.48% for investors. Multi-line and electric utilities companies made up a vast majority of the portfolios holdings and contributed the largest contribution to return. Gas utilities and independent power producers had significantly less representation in the portfolio but they did have strong positive returns for the year.
Public Services Enterprise Group, Sempra Energy and PG&E Corp. were the best performing multi-line utility companies while PPL Corp. and FirstEnergy Corp. were the top performing electric utilities within the portfolio. AES Corp. within independent power producers industry and Northwest Natural Gas within gas utilities also added to the strong performance for the year.
Industry Breakdown (% of the Fund's
Net Assets)
| Electric | 86.4 | ||||||
| Energy-Alternate Sources | 2.7 | ||||||
| Gas | 10.7 | ||||||
| Other | 0.2 | ||||||
Style Allocation (%)
| Large-Cap Value | 36.7 | ||||||
| Mid-Cap Value | 34.4 | ||||||
| Small-Cap Value | 18.7 | ||||||
| Mid-Cap Growth | 5.5 | ||||||
| Large-Cap Growth | 4.7 | ||||||
Top Ten Fund Holdings
(% of the Fund's Net Assets)
| Security | |||||||
| PPL Corp. | 5.5 | ||||||
| Public Service Enterprise Group, Inc. | 5.5 | ||||||
| Edison International | 5.3 | ||||||
| TXU Corp. | 5.2 | ||||||
| FirstEnergy Corp. | 5.2 | ||||||
| PG&E Corp. | 5.1 | ||||||
| Duke Energy Corp. | 4.9 | ||||||
| AES (The) Corp. | 4.7 | ||||||
| Northwest Natural Gas Co. | 2.9 | ||||||
| Allegheny Energy, Inc. | 2.9 | ||||||
| Total | 47.2 | ||||||
22
Manager's Analysis (Continued)
PowerShares Dynamic Utilities Portfolio (ticker: PUI)
Growth of a $10,000 Investment Since Inception

Fund Performance History (%) As of 30 April 2007
Index
| Avg. Ann.† | Fund Inception | ||||||||||||||
| 1 Year | Avg. Ann.† | Cumulative | |||||||||||||
| Dynamic Utilities IntellidexSM Index | 29.26 | 24.95 | 39.96 | ||||||||||||
| S&P SuperComposite Utilities Index | 34.97 | 25.36 | 40.66 | ||||||||||||
| Russell 3000® Index | 14.48 | 18.02 | 28.42 | ||||||||||||
Fund
| NAV Return | 28.48 | 24.10 | 38.53 | ||||||||||||
| Share Price Return | 28.60 | 24.20 | 38.70 | ||||||||||||
Fund Inception: 26 October 2005
Performance data quoted represents past performance. Past performance is not a guarantee of future results, current performance may be higher or lower than performance quoted. Investment returns and principal value will fluctuate and shares, when redeemed, may be worth more or less than their original cost. The Share Price performance reflects fee waivers, absent which, performance would have been lower. According to the Fund's most recent Prospectus, the Fund's total gross annual operating expenses was indicated as 0.89%. In the Financial Highlights section of this Annual Report, the Fund's net (subsidized) annualized total operating expense ratio was determined to be 0.63% while the Fund's gross annualized total operating expense ratio was 0.92%. The Adviser has contractually agreed to waive fees and/or pay certain Fund expenses which resulted in a lower fee actually paid by investors. This waiver extends through April 30, 200 8. Absent reimbursements or waivers, performance would have been lower. NAV and Share Price returns assume that dividends and capital gain distributions have been reinvested in the Fund at NAV and Share Price, respectively. The returns shown in the table above do not reflect the deduction of taxes that a shareholder would pay on Fund distributions or the redemption or sale of Fund Shares. See powershares.com to find the most recent month-end performance numbers.
The Index performance results are hypothetical. Index returns do not represent Fund returns. An investor cannot invest directly in an index. The Index does not charge management fees or brokerage expenses, and no such fees or expenses were deducted from the hypothetical performance shown nor does the index lend securities, and no revenues from securities lending were added to the performance shown. In addition, the results actual investors might have achieved would have differed from those shown because of differences in the timing, amounts of their investments, and fees and expenses associated with an investment in the Fund.
The S&P SuperComposite Utilities Index and the Russell 3000® Index are unmanaged indices based on the average performance of 82 and 3,000 common stocks, respectively.
† Average annualized.
23
Funds' Distribution History
| Ex-Dividend | 04/16/07 | 03/16/07 | 03/15/07 | 02/15/07 | 01/15/07 | 12/15/06 | 11/15/06 | ||||||||||||||||||||||||||||
| Record | 04/18/07 | 03/20/07 | 03/20/07 | 02/20/07 | 01/17/07 | 12/19/06 | 11/17/06 | ||||||||||||||||||||||||||||
| Payable | 04/30/07 | 03/30/07 | 03/30/07 | 02/28/07 | 01/31/07 | 12/29/06 | 11/30/06 | ||||||||||||||||||||||||||||
| Fund | Ticker | ||||||||||||||||||||||||||||||||||
| PowerShares Dynamic Basic Materials Sector Portfolio | PYZ | — | 0.03850 | — | — | — | 0.15875 | — | |||||||||||||||||||||||||||
| PowerShares Dynamic Consumer Discretionary Sector Portfolio | PEZ | — | — | — | — | — | 0.16398 | — | |||||||||||||||||||||||||||
| PowerShares Dynamic Consumer Staples Sector Portfolio | PSL | — | 0.03510 | — | — | — | 0.23925 | — | |||||||||||||||||||||||||||
| PowerShares Dynamic Energy Sector Portfolio | PXI | — | 0.00830 | — | — | — | 0.02386 | — | |||||||||||||||||||||||||||
| PowerShares Dynamic Financial Sector Portfolio | PFI | — | 0.01860 | — | — | — | 0.06758 | — | |||||||||||||||||||||||||||
| PowerShares Dynamic Healthcare Sector Portfolio | PTH | — | — | — | — | — | — | — | |||||||||||||||||||||||||||
| PowerShares Dynamic Industrials Sector Portfolio | PRN | — | 0.03620 | — | — | — | 0.01397 | — | |||||||||||||||||||||||||||
| PowerShares Dynamic Technology Sector Portfolio | PTF | — | — | — | — | — | — | — | |||||||||||||||||||||||||||
| PowerShares Dynamic Telecommunications & Wireless Portfolio | PTE | — | — | — | — | — | 0.14163 | — | |||||||||||||||||||||||||||
| PowerShares Dynamic Utilities Portfolio | PUI | — | 0.08250 | — | — | — | 0.13668 | — | |||||||||||||||||||||||||||
| Ex-Dividend | 12/30/05 | 12/16/05 | 09/16/05 | 06/17/05 | 04/01/05 | 03/18/05 | |||||||||||||||||||||||||||||
| Record | 01/04/06 | 12/20/05 | 09/20/05 | 06/21/05 | 04/05/05 | 03/22/05 | |||||||||||||||||||||||||||||
| Payable | 01/31/06 | 12/30/05 | 09/30/05 | 06/30/05 | 04/29/05 | 04/29/05 | |||||||||||||||||||||||||||||
| Fund | Ticker | ||||||||||||||||||||||||||||||||||
| PowerShares Dynamic Basic Materials Sector Portfolio | PYZ | — | — | — | — | — | — | ||||||||||||||||||||||||||||
| PowerShares Dynamic Consumer Discretionary Sector Portfolio | PEZ | — | — | — | — | — | — | ||||||||||||||||||||||||||||
| PowerShares Dynamic Consumer Staples Sector Portfolio | PSL | — | — | — | — | — | — | ||||||||||||||||||||||||||||
| PowerShares Dynamic Energy Sector Portfolio | PXI | — | — | — | — | — | — | ||||||||||||||||||||||||||||
| PowerShares Dynamic Financial Sector Portfolio | PFI | — | — | — | — | — | — | ||||||||||||||||||||||||||||
| PowerShares Dynamic Healthcare Sector Portfolio | PTH | — | — | — | — | — | — | ||||||||||||||||||||||||||||
| PowerShares Dynamic Industrials Sector Portfolio | PRN | — | — | — | — | — | — | ||||||||||||||||||||||||||||
| PowerShares Dynamic Technology Sector Portfolio | PTF | — | — | — | — | — | — | ||||||||||||||||||||||||||||
| PowerShares Dynamic Telecommunications & Wireless Portfolio | PTE | — | 0.00158 | — | — | — | — | ||||||||||||||||||||||||||||
| PowerShares Dynamic Utilities Portfolio | PUI | — | 0.10928 | — | — | — | — | ||||||||||||||||||||||||||||
24
| 10/16/06 | 09/15/06 | 08/15/06 | 07/14/06 | 06/16/06 | 06/15/06 | 05/15/06 | 03/17/06 | ||||||||||||||||||||||||||||
| 10/18/06 | 09/16/06 | 08/17/06 | 07/18/06 | 06/20/06 | 06/19/06 | 05/17/06 | 03/21/06 | ||||||||||||||||||||||||||||
| 10/31/06 | 09/29/06 | 08/31/06 | 07/31/06 | 06/30/06 | 06/30/06 | 05/31/06 | 03/30/06 | ||||||||||||||||||||||||||||
| Fund | |||||||||||||||||||||||||||||||||||
| PowerShares Dynamic Basic Materials Sector Portfolio | — | — | — | — | — | — | — | — | |||||||||||||||||||||||||||
| PowerShares Dynamic Consumer Discretionary Sector Portfolio | — | — | — | — | — | — | — | — | |||||||||||||||||||||||||||
| PowerShares Dynamic Consumer Staples Sector Portfolio | — | — | — | — | — | — | — | — | |||||||||||||||||||||||||||
| PowerShares Dynamic Energy Sector Portfolio | — | — | — | — | — | — | — | — | |||||||||||||||||||||||||||
| PowerShares Dynamic Financial Sector Portfolio | — | — | — | — | — | — | — | — | |||||||||||||||||||||||||||
| PowerShares Dynamic Healthcare Sector Portfolio | — | — | — | — | — | — | — | — | |||||||||||||||||||||||||||
| PowerShares Dynamic Industrials Sector Portfolio | — | — | — | — | — | — | — | — | |||||||||||||||||||||||||||
| PowerShares Dynamic Technology Sector Portfolio | — | — | — | — | — | — | — | — | |||||||||||||||||||||||||||
| PowerShares Dynamic Telecommunications & Wireless Portfolio | — | 0.03081 | — | — | 0.03188 | — | — | 0.03180 | |||||||||||||||||||||||||||
| PowerShares Dynamic Utilities Portfolio | — | 0.06053 | — | — | 0.10547 | — | — | 0.07089 | |||||||||||||||||||||||||||
| 12/17/04 | 12/31/04 | 09/17/04 | 06/18/04 | 03/19/04 | 12/24/03 | 09/19/03 | 06/20/03 | ||||||||||||||||||||||||||||
| 12/21/04 | 01/04/05 | 09/21/04 | 06/22/04 | 03/23/04 | 12/29/03 | 09/23/03 | 06/24/03 | ||||||||||||||||||||||||||||
| 01/31/05 | 01/31/05 | 10/29/04 | 07/30/04 | 04/30/04 | 01/30/04 | 10/31/03 | 07/31/03 | ||||||||||||||||||||||||||||
| Fund | |||||||||||||||||||||||||||||||||||
| PowerShares Dynamic Basic Materials Sector Portfolio | — | — | — | — | — | — | — | — | |||||||||||||||||||||||||||
| PowerShares Dynamic Consumer Discretionary Sector Portfolio | — | — | — | — | — | — | — | — | |||||||||||||||||||||||||||
| PowerShares Dynamic Consumer Staples Sector Portfolio | — | — | — | — | — | — | — | — | |||||||||||||||||||||||||||
| PowerShares Dynamic Energy Sector Portfolio | — | — | — | — | — | — | — | — | |||||||||||||||||||||||||||
| PowerShares Dynamic Financial Sector Portfolio | — | — | — | — | — | — | — | — | |||||||||||||||||||||||||||
| PowerShares Dynamic Healthcare Sector Portfolio | — | — | — | — | — | — | — | — | |||||||||||||||||||||||||||
| PowerShares Dynamic Industrials Sector Portfolio | — | — | — | — | — | — | — | — | |||||||||||||||||||||||||||
| PowerShares Dynamic Technology Sector Portfolio | — | — | — | — | — | — | — | — | |||||||||||||||||||||||||||
| PowerShares Dynamic Telecommunications & Wireless Portfolio | — | — | — | — | — | — | — | — | |||||||||||||||||||||||||||
| PowerShares Dynamic Utilities Portfolio | — | — | — | — | — | — | — | — | |||||||||||||||||||||||||||
25
Frequency Distribution of Discounts & Premiums
Since Inception thru April 30, 2007
| Closing Price Above NAV | |||||||||||||||||||||||||||||||||||||||
| Ticker | Fund Name | Inception | Days | 0-24 Basis Points | 25-49 Basis Points | 50-99 Basis Points | 100-149 Basis Points | 150-199 Basis Points | 200+ Basis Points | ||||||||||||||||||||||||||||||
| PYZ | PowerShares Dynamic Basic Materials Sector Portfolio | 10/12/06 | 136 | 56 | 1 | 0 | 0 | 0 | 0 | ||||||||||||||||||||||||||||||
| PEZ | PowerShares Dynamic Consumer Discretionary Sector Portfolio | 10/12/06 | 136 | 47 | 5 | 0 | 0 | 0 | 0 | ||||||||||||||||||||||||||||||
| PSL | PowerShares Dynamic Consumer Staples Sector Portfolio | 10/12/06 | 136 | 33 | 5 | 0 | 0 | 0 | 0 | ||||||||||||||||||||||||||||||
| PXI | PowerShares Dynamic Energy Sector Portfolio | 10/12/06 | 136 | 27 | 1 | 0 | 0 | 0 | 0 | ||||||||||||||||||||||||||||||
| PFI | PowerShares Dynamic Financial Sector Portfolio | 10/12/06 | 136 | 38 | 0 | 0 | 0 | 0 | 0 | ||||||||||||||||||||||||||||||
| PTH | PowerShares Dynamic Healthcare Sector Portfolio | 10/12/06 | 136 | 29 | 1 | 0 | 0 | 0 | 0 | ||||||||||||||||||||||||||||||
| PRN | PowerShares Dynamic Industrials Sector Portfolio | 10/12/06 | 136 | 55 | 2 | 0 | 0 | 0 | 0 | ||||||||||||||||||||||||||||||
| PTF | PowerShares Dynamic Technology Sector Portfolio | 10/12/06 | 136 | 51 | 9 | 0 | 0 | 0 | 0 | ||||||||||||||||||||||||||||||
| PTE | PowerShares Dynamic Telecommunications & Wireless Portfolio | 12/06/05 | 350 | 137 | 21 | 2 | 0 | 0 | 0 | ||||||||||||||||||||||||||||||
| PUI | PowerShares Dynamic Utilities Portfolio | 10/26/05 | 378 | 147 | 3 | 2 | 0 | 0 | 0 | ||||||||||||||||||||||||||||||
26
| Closing Price Below NAV | |||||||||||||||||||||||||||
| Ticker | -0-24 Basis Points | -25-49 Basis Points | -50-99 Basis Points | -100-149 Basis Points | -150-199 Basis Points | -200+ Basis Points | |||||||||||||||||||||
| PYZ | 79 | 0 | 0 | 0 | 0 | 0 | |||||||||||||||||||||
| PEZ | 83 | 1 | 0 | 0 | 0 | 0 | |||||||||||||||||||||
| PSL | 96 | 2 | 0 | 0 | 0 | 0 | |||||||||||||||||||||
| PXI | 108 | 0 | 0 | 0 | 0 | 0 | |||||||||||||||||||||
| PFI | 98 | 0 | 0 | 0 | 0 | 0 | |||||||||||||||||||||
| PTH | 105 | 1 | 0 | 0 | 0 | 0 | |||||||||||||||||||||
| PRN | 77 | 2 | 0 | 0 | 0 | 0 | |||||||||||||||||||||
| PTF | 76 | 0 | 0 | 0 | 0 | 0 | |||||||||||||||||||||
| PTE | 179 | 9 | 2 | 0 | 0 | 0 | |||||||||||||||||||||
| PUI | 222 | 4 | 0 | 0 | 0 | 0 | |||||||||||||||||||||
27
Fees and Expenses
As a shareholder of a Fund of the PowerShares Exchange-Traded Fund Trust, you incur advisory fees and other Fund expenses. The expense examples below are intended to help you understand your ongoing costs (in dollars) of investing in the Funds and to compare these costs with the ongoing costs of investing in other mutual funds.
The example is based on an investment of $1,000 invested at the beginning of the period and held through the six-month period ended April 30, 2007.
Actual Expenses
The first line in the following tables provides information about actual account values and actual expenses. You may use the information in this line, together with the amount you invested, to estimate the expenses that you paid over the period. Simply divide your account value by $1,000 (for example, an $8,600 account value divided by $1,000 = 8.6), then multiply the result by the number in the first line under the heading "Expenses Paid During the Six-Month Period" to estimate the expenses you paid on your account during this period.
Hypothetical Example for Comparison Purposes
The second line in the following tables provides information about hypothetical account values and hypothetical expenses based on the Funds' actual expense ratio and an assumed annualized rate of return of 5% per year before expenses, which is not the Funds' actual return. The hypothetical account values and expenses may not be used to estimate the actual ending account balance or expenses you paid for the period. You may use this information to compare the ongoing costs of investing in the Funds and other funds. To do so, compare this 5% hypothetical example with the 5% hypothetical examples that appear in the shareholder reports of the other funds.
Please note that the expenses shown in the tables are meant to highlight your ongoing costs only, and do not reflect any transactional costs such as sales charges (loads). Therefore the second line in the table is useful in comparing ongoing costs only, and will not help you determine the relative total costs of owning different funds. In addition, if these transactional costs were included, your costs would have been higher.
| Beginning Account Value November 1, 2006 | Ending Account Value April 30, 2007 | Annualized Expense Ratio Based on the Six-Month Period | Expenses Paid During the Six-Month Period (1) | ||||||||||||||||
| PowerShares Dynamic Basic Materials Sector Portfolio Actual | $ | 1,000.00 | $ | 1,208.59 | 0.71 | % | $ | 3.91 | |||||||||||
| Hypothetical (5% return before expenses) | $ | 1,000.00 | $ | 1,021.26 | 0.71 | % | $ | 3.58 | |||||||||||
| PowerShares Dynamic Consumer Discretionary Sector Portfolio Actual | $ | 1,000.00 | $ | 1,108.40 | 0.72 | % | $ | 3.78 | |||||||||||
| Hypothetical (5% return before expenses) | $ | 1,000.00 | $ | 1,021.26 | 0.72 | % | $ | 3.58 | |||||||||||
| PowerShares Dynamic Consumer Staples Sector Portfolio Actual | $ | 1,000.00 | $ | 1,118.50 | 0.73 | % | $ | 3.82 | |||||||||||
| Hypothetical (5% return before expenses) | $ | 1,000.00 | $ | 1,021.19 | 0.73 | % | $ | 3.79 | |||||||||||
28
Fees and Expenses (Continued)
| Beginning Account Value November 1, 2006 | Ending Account Value April 30, 2007 | Annualized Expense Ratio Based on the Six-Month Period | Expenses Paid During the Six-Month Period (1) | ||||||||||||||||
| PowerShares Dynamic Energy Sector Portfolio Actual | $ | 1,000.00 | $ | 1,171.10 | 0.70 | % | $ | 3.79 | |||||||||||
| Hypothetical (5% return before expenses) | $ | 1,000.00 | $ | 1,021.30 | 0.70 | % | $ | 3.53 | |||||||||||
| PowerShares Dynamic Financial Sector Portfolio Actual | $ | 1,000.00 | $ | 1,064.00 | 0.72 | % | $ | 3.68 | |||||||||||
| Hypothetical (5% return before expenses) | $ | 1,000.00 | $ | 1,021.23 | 0.72 | % | $ | 3.60 | |||||||||||
| PowerShares Dynamic Healthcare Sector Portfolio Actual | $ | 1,000.00 | $ | 1,141.80 | 0.70 | % | $ | 3.68 | |||||||||||
| Hypothetical (5% return before expenses) | $ | 1,000.00 | $ | 1,021.30 | 0.70 | % | $ | 3.53 | |||||||||||
| PowerShares Dynamic Industrials Sector Portfolio Actual | $ | 1,000.00 | $ | 1,147.80 | 0.71 | % | $ | 3.77 | |||||||||||
| Hypothetical (5% return before expenses) | $ | 1,000.00 | $ | 1,021.28 | 0.71 | % | $ | 3.55 | |||||||||||
| PowerShares Dynamic Technology Sector Portfolio Actual | $ | 1,000.00 | $ | 1,088.20 | 0.71 | % | $ | 3.66 | |||||||||||
| Hypothetical (5% return before expenses) | $ | 1,000.00 | $ | 1,021.29 | 0.71 | % | $ | 3.54 | |||||||||||
| PowerShares Dynamic Telecommunications & Wireless Portfolio Actual | $ | 1,000.00 | $ | 1,084.80 | 0.64 | % | $ | 3.32 | |||||||||||
| Hypothetical (5% return before expenses) | $ | 1,000.00 | $ | 1,021.61 | 0.64 | % | $ | 3.22 | |||||||||||
| PowerShares Dynamic Utilities Portfolio Actual | $ | 1,000.00 | $ | 1,112.80 | 0.62 | % | $ | 3.26 | |||||||||||
| Hypothetical (5% return before expenses) | $ | 1,000.00 | $ | 1,021.71 | 0.62 | % | $ | 3.12 | |||||||||||
(1) Expenses are calculated using the annualized expense ratio, which represents the ongoing expenses as a percentage of net assets for the six months ended April 30, 2007. Expenses are calculated by multiplying the Fund's annualized expense ratio by the average account value for the period; then multiplying the result by 181 and then dividing the result by 365. Expense ratios for the most recent half-year may differ from expense ratios based on the one year data in the financial highlights.
29
Schedule of Investments
PowerShares Dynamic Basic Materials Sector Portfolio
April 30, 2007
| Number of Shares | Value | ||||||||||
| Common Stocks—100.1% | |||||||||||
| Chemicals—47.2% | |||||||||||
| 6,138 | Air Products & Chemicals, Inc. | $ | 469,557 | ||||||||
| 6,229 | Airgas, Inc. | 277,502 | |||||||||
| 6,087 | Albemarle Corp. | 258,393 | |||||||||
| 5,496 | Cabot Corp. | 248,969 | |||||||||
| 8,775 | Celanese Corp., Series A | 291,067 | |||||||||
| 4,274 | Cytec Industries, Inc. | 234,643 | |||||||||
| 10,971 | Dow Chemical (The) Co. | 489,416 | |||||||||
| 8,996 | E.I. du Pont de Nemours and Co. | 442,333 | |||||||||
| 4,289 | Eastman Chemical Co. | 290,365 | |||||||||
| 10,872 | Ecolab, Inc. | 467,387 | |||||||||
| 3,381 | FMC Corp. | 260,100 | |||||||||
| 10,031 | H.B. Fuller Co. | 256,493 | |||||||||
| 12,370 | Hercules, Inc.* | 233,051 | |||||||||
| 12,150 | Huntsman Corp. | 238,140 | |||||||||
| 4,770 | Innospec, Inc. | 256,101 | |||||||||
| 4,830 | Lubrizol Corp. | 289,510 | |||||||||
| 14,925 | Lyondell Chemical Co. | 464,466 | |||||||||
| 4,181 | Minerals Technologies, Inc. | 265,995 | |||||||||
| 4,896 | OM Group, Inc.* | 257,187 | |||||||||
| 7,037 | PPG Industries, Inc. | 517,782 | |||||||||
| 7,365 | Praxair, Inc. | 475,411 | |||||||||
| 8,671 | Rohm & Haas Co. | 443,695 | |||||||||
| 10,799 | RPM International, Inc. | 229,695 | |||||||||
| 10,157 | Sensient Technologies Corp. | 265,910 | |||||||||
| 6,122 | Sigma-Aldrich Corp. | 257,614 | |||||||||
| 9,613 | Spartech Corp. | 269,741 | |||||||||
| 9,330 | Valspar Corp. | 252,283 | |||||||||
| 9,898 | W.R. Grace & Co.* | 263,287 | |||||||||
| 8,966,093 | |||||||||||
| Energy - Alternate Sources—1.2% | |||||||||||
| 10,409 | Headwaters, Inc.* | 225,563 | |||||||||
| Environmental Control—1.6% | |||||||||||
| 6,327 | Metal Management, Inc. | 304,139 | |||||||||
| Forest Products & Paper—6.7% | |||||||||||
| 12,821 | International Paper Co. | 483,608 | |||||||||
| 7,492 | Rock-Tenn Co., Class A | 286,644 | |||||||||
| 4,732 | Temple-Inland, Inc. | 280,324 | |||||||||
| 17,118 | Wausau Paper Corp. | 230,408 | |||||||||
| 1,280,984 | |||||||||||
| Iron/Steel—14.1% | |||||||||||
| 4,421 | Allegheny Technologies, Inc. | 484,453 | |||||||||
| 2,110 | Carpenter Technology Corp. | 256,091 | |||||||||
| 5,038 | Chaparral Steel Co. | 355,179 | |||||||||
| 4,409 | Cleveland-Cliffs, Inc. | 305,500 | |||||||||
| 7,402 | Nucor Corp. | 469,731 | |||||||||
| 6,480 | Steel Dynamics, Inc. | 287,129 | |||||||||
| 5,121 | United States Steel Corp. | 519,986 | |||||||||
| 2,678,069 | |||||||||||
| Number of Shares | Value | ||||||||||
| Common Stocks (Continued) | |||||||||||
| Metal Fabricate/Hardware—1.5% | |||||||||||
| 6,573 | Quanex Corp. | $ | 282,836 | ||||||||
| Mining—12.1% | |||||||||||
| 13,590 | Alcoa, Inc. | 482,309 | |||||||||
| 5,483 | Century Aluminum Co.* | 259,401 | |||||||||
| 7,957 | Freeport-McMoRan Copper & Gold, Inc., Class B | 534,392 | |||||||||
| 31,404 | Hecla Mining Co.* | 276,669 | |||||||||
| 6,356 | Southern Copper Corp. | 510,387 | |||||||||
| 6,837 | Titanium Metals Corp.* | 236,082 | |||||||||
| 2,299,240 | |||||||||||
| Miscellaneous Manufacturing—3.2% | |||||||||||
| 3,892 | AptarGroup, Inc. | 285,089 | |||||||||
| 14,649 | Myers Industries, Inc. | 328,870 | |||||||||
| 613,959 | |||||||||||
| Packaging & Containers—12.5% | |||||||||||
| 5,509 | Ball Corp. | 279,251 | |||||||||
| 7,572 | Bemis Co. | 251,542 | |||||||||
| 11,155 | Crown Holdings, Inc.* | 269,616 | |||||||||
| 50,686 | Graphic Packaging Corp.* | 260,019 | |||||||||
| 4,184 | Greif, Inc., Class A | 232,630 | |||||||||
| 10,265 | Packaging Corp. of America | 254,161 | |||||||||
| 7,818 | Pactiv Corp.* | 270,346 | |||||||||
| 7,782 | Sealed Air Corp. | 256,028 | |||||||||
| 6,879 | Sonoco Products Co. | 293,322 | |||||||||
| 2,366,915 | |||||||||||
| Total Common Stocks (Cost $17,063,351) | 19,017,798 | ||||||||||
| Money Market Fund—0.2% | |||||||||||
| 31,916 | Liquid Assets Portfolio Private Class** (Cost $31,916) | 31,916 | |||||||||
| Total Investments (Cost $17,095,267)—100.3% | 19,049,714 | ||||||||||
| Liabilities in excess of other assets—(0.3%) | (61,856 | ) | |||||||||
| Net Assets—100.0% | $ | 18,987,858 | |||||||||
* Non-income producing security.
** Affiliated investment.
See Notes to Financial Statements.
30
Schedule of Investments
PowerShares Dynamic Consumer Discretionary Sector Portfolio
April 30, 2007
| Number of Shares | Value | ||||||||||
| Common Stocks—100.2% | |||||||||||
| Advertising—2.5% | |||||||||||
| 4,039 | Omnicom Group, Inc. | $ | 422,924 | ||||||||
| Apparel—18.7% | |||||||||||
| 8,592 | Coach, Inc.* | 419,547 | |||||||||
| 3,680 | Deckers Outdoor Corp.* | 278,686 | |||||||||
| 5,945 | Gymboree (The) Corp.* | 226,980 | |||||||||
| 8,650 | Hanesbrands, Inc.* | 230,004 | |||||||||
| 5,047 | Liz Claiborne, Inc. | 225,702 | |||||||||
| 7,947 | NIKE, Inc., Class B | 428,025 | |||||||||
| 4,903 | Polo Ralph Lauren Corp. | 451,615 | |||||||||
| 8,087 | Steven Madden Ltd.* | 240,588 | |||||||||
| 5,336 | VF Corp. | 468,555 | |||||||||
| 8,075 | Wolverine World Wide, Inc. | 230,784 | |||||||||
| 3,200,486 | |||||||||||
| Auto Parts & Equipment—2.7% | |||||||||||
| 4,032 | Autoliv, Inc. | 234,461 | |||||||||
| 2,999 | BorgWarner, Inc. | 233,652 | |||||||||
| 468,113 | |||||||||||
| Commercial Services—5.9% | |||||||||||
| 8,314 | Aaron Rents, Inc. | 235,868 | |||||||||
| 21,443 | Coinmach Service Corp., Class A | 226,867 | |||||||||
| 8,089 | DeVry, Inc. | 266,856 | |||||||||
| 2,848 | ITT Educational Services, Inc. | 276,854 | |||||||||
| 1,006,445 | |||||||||||
| Distribution/Wholesale—2.4% | |||||||||||
| 8,490 | Genuine Parts Co. | 419,491 | |||||||||
| Entertainment—1.2% | |||||||||||
| 4,339 | International Speedway Corp., Class A | 214,347 | |||||||||
| Home Builders—1.6% | |||||||||||
| 341 | NVR, Inc.* | 280,984 | |||||||||
| Home Furnishings—3.0% | |||||||||||
| 2,268 | Harman International Industries, Inc. | 276,446 | |||||||||
| 9,104 | Tempur-Pedic International, Inc. | 236,431 | |||||||||
| 512,877 | |||||||||||
| Household Products/Wares—5.9% | |||||||||||
| 9,636 | American Greetings Corp., Class A | 245,236 | |||||||||
| 9,799 | Helen of Troy Ltd. (Bermuda)* | 222,437 | |||||||||
| 6,212 | Jarden Corp.* | 261,774 | |||||||||
| 9,722 | Tupperware Brands Corp. | 273,383 | |||||||||
| 1,002,830 | |||||||||||
| Housewares—2.4% | |||||||||||
| 13,525 | Newell Rubbermaid, Inc. | 414,812 | |||||||||
| Number of Shares | Value | ||||||||||
| Common Stocks (Continued) | |||||||||||
| Lodging—4.8% | |||||||||||
| 8,674 | Marriott International, Inc., Class A | $ | 392,152 | ||||||||
| 6,333 | Starwood Hotels & Resorts Worldwide, Inc. | 424,437 | |||||||||
| 816,589 | |||||||||||
| Media—6.7% | |||||||||||
| 17,410 | Journal Communications, Inc., Class A | 234,861 | |||||||||
| 3,929 | Meredith Corp. | 227,568 | |||||||||
| 15,918 | Sinclair Broadcast Group, Inc., Class A | 259,941 | |||||||||
| 12,217 | Walt Disney (The) Co. | 427,350 | |||||||||
| 1,149,720 | |||||||||||
| Retail—38.3% | |||||||||||
| 6,117 | Aeropostale, Inc.* | 251,715 | |||||||||
| 7,364 | American Eagle Outfitters | 217,017 | |||||||||
| 8,830 | Applebee's International, Inc. | 239,999 | |||||||||
| 8,688 | Asbury Automotive Group, Inc. | 249,954 | |||||||||
| 34,333 | Blockbuster, Inc., Class A* | 212,865 | |||||||||
| 6,297 | Bob Evans Farms, Inc. | 231,100 | |||||||||
| 6,645 | Brinker International, Inc. | 206,660 | |||||||||
| 6,395 | Brown Shoe Co. Inc. | 172,537 | |||||||||
| 6,525 | Buckle (The), Inc. | 232,421 | |||||||||
| 10,701 | Burger King Holdings, Inc. | 251,152 | |||||||||
| 4,937 | CBRL Group, Inc. | 220,091 | |||||||||
| 7,535 | Charlotte Russe Holdings, Inc.* | 205,932 | |||||||||
| 4,123 | Children's Place Retail Stores (The), Inc.* | 217,983 | |||||||||
| 6,697 | Claire's Stores, Inc. | 218,121 | |||||||||
| 7,770 | Family Dollar Stores, Inc. | 247,397 | |||||||||
| 4,018 | IHOP Corp. | 236,741 | |||||||||
| 5,108 | J.C. Penney Co., Inc. | 403,992 | |||||||||
| 3,279 | Jack in the Box, Inc.* | 218,447 | |||||||||
| 5,222 | Men's Wearhouse (The), Inc. | 225,956 | |||||||||
| 7,374 | Nordstrom, Inc. | 404,980 | |||||||||
| 7,178 | Payless ShoeSource, Inc.* | 228,978 | |||||||||
| 6,862 | Ross Stores, Inc. | 227,475 | |||||||||
| 15,789 | Staples, Inc. | 391,567 | |||||||||
| 15,080 | TJX Cos., Inc. | 420,581 | |||||||||
| 7,094 | Yum! Brands, Inc. | 438,834 | |||||||||
| 6,572,495 | |||||||||||
| Toys/Games/Hobbies—4.1% | |||||||||||
| 7,989 | Hasbro, Inc. | 252,532 | |||||||||
| 15,940 | Mattel, Inc. | 451,102 | |||||||||
| 703,634 | |||||||||||
| Total Common Stocks (Cost $16,375,574) | 17,185,747 | ||||||||||
See Notes to Financial Statements.
31
Schedule of Investments (Continued)
PowerShares Dynamic Consumer Discretionary Sector Portfolio
April 30, 2007
| Number of Shares | Value | ||||||||||
| Money Market Fund—0.3% | |||||||||||
| 45,074 | Liquid Assets Portfolio Private Class** (Cost $45,074) | $ | 45,074 | ||||||||
| Total Investments (Cost $16,420,648)—100.5% | 17,230,821 | ||||||||||
| Liabilities in excess of other assets—(0.5%) | (74,423 | ) | |||||||||
| Net Assets—100.0% | $ | 17,156,398 | |||||||||
* Non-income producing security.
** Affiliated investment.
COUNTRY BREAKDOWN
April 30, 2007 (Unaudited)
| Value | Net Assets | ||||||||||
| United States | $ | 17,008,384 | 99.2 | % | |||||||
| Bermuda | 222,437 | 1.3 | |||||||||
| Total investments | 17,230,821 | 100.5 | |||||||||
| Liabilities in excess of other assets | (74,423 | ) | (0.5 | ) | |||||||
| Net Assets | $ | 17,156,398 | 100.0 | % | |||||||
See Notes to Financial Statements.
32
Schedule of Investments
PowerShares Dynamic Consumer Staples Sector Portfolio
April 30, 2007
| Number of Shares | Value | ||||||||||
| Common Stocks—99.7% | |||||||||||
| Agriculture—13.2% | |||||||||||
| 17,633 | Alliance One International, Inc.* | $ | 172,980 | ||||||||
| 4,258 | Altria Group, Inc. | 293,461 | |||||||||
| 1,765 | Bunge Ltd. (Bermuda) | 133,716 | |||||||||
| 2,043 | Loews Corp. - Carolina Group | 156,351 | |||||||||
| 4,291 | Reynolds American, Inc. | 275,740 | |||||||||
| 2,708 | Universal Corp. | 169,737 | |||||||||
| 2,468 | UST, Inc. | 139,886 | |||||||||
| 7,912 | Vector Group Ltd. | 144,394 | |||||||||
| 1,486,265 | |||||||||||
| Beverages—13.1% | |||||||||||
| 5,451 | Anheuser-Busch Cos., Inc. | 268,135 | |||||||||
| 2,293 | Brown-Forman Corp., Class B | 146,591 | |||||||||
| 5,773 | Coca-Cola (The) Co. | 301,293 | |||||||||
| 1,749 | Molson Coors Brewing Co., Class B | 164,896 | |||||||||
| 4,614 | Pepsi Bottling Group, Inc. | 151,385 | |||||||||
| 6,729 | PepsiAmericas, Inc. | 162,438 | |||||||||
| 4,225 | PepsiCo, Inc. | 279,230 | |||||||||
| 1,473,968 | |||||||||||
| Cosmetics/Personal Care—10.3% | |||||||||||
| 6,373 | Alberto-Culver Co. | 154,800 | |||||||||
| 3,859 | Avon Products, Inc. | 153,588 | |||||||||
| 2,671 | Chattem, Inc.* | 152,621 | |||||||||
| 3,993 | Colgate-Palmolive Co. | 270,486 | |||||||||
| 3,142 | Estee Lauder (The) Cos., Inc., Class A | 161,562 | |||||||||
| 4,209 | Procter & Gamble Co. | 270,681 | |||||||||
| 1,163,738 | |||||||||||
| Distribution/Wholesale—1.4% | |||||||||||
| 5,224 | Central European Distribution Corp.* | 155,414 | |||||||||
| Electrical Components & Equipment—1.5% | |||||||||||
| 1,700 | Energizer Holdings, Inc.* | 165,206 | |||||||||
| Food—38.7% | |||||||||||
| 3,553 | Campbell Soup Co. | 138,922 | |||||||||
| 5,829 | ConAgra Foods, Inc. | 143,277 | |||||||||
| 4,555 | Corn Products International, Inc. | 181,380 | |||||||||
| 4,781 | Dean Foods Co.* | 174,172 | |||||||||
| 4,771 | General Mills, Inc. | 285,783 | |||||||||
| 3,152 | H.J. Heinz Co. | 148,491 | |||||||||
| 3,989 | Hormel Foods Corp. | 151,941 | |||||||||
| 3,567 | Ingles Markets, Inc., Class A | 128,269 | |||||||||
| 3,683 | J & J Snack Foods Corp. | 143,527 | |||||||||
| 2,943 | J.M. Smucker (The) Co. | 164,278 | |||||||||
| 5,474 | Kellogg Co. | 289,629 | |||||||||
| 8,202 | Kraft Foods, Inc., Class A | 274,521 | |||||||||
| 10,629 | Kroger (The) Co. | 313,661 | |||||||||
| 3,781 | McCormick & Co., Inc. | 140,351 | |||||||||
| 2,473 | Ralcorp Holdings, Inc.* | 162,748 | |||||||||
| 5,190 | Ruddick Corp. | 155,856 | |||||||||
| 4,235 | Safeway, Inc. | 153,731 | |||||||||
| 8,627 | Sara Lee Corp. | 141,569 | |||||||||
| Number of Shares | Value | ||||||||||
| Common Stocks (Continued) | |||||||||||
| 68 | Seaboard Corp. | $ | 169,524 | ||||||||
| 8,084 | Sysco Corp. | 264,670 | |||||||||
| 4,983 | Tootsie Roll Industries, Inc. | 144,457 | |||||||||
| 8,023 | Tyson Foods, Inc., Class A | 168,162 | |||||||||
| 3,407 | Weis Markets, Inc. | 146,637 | |||||||||
| 2,945 | Wm. Wrigley Jr. Co. | 173,402 | |||||||||
| 4,358,958 | |||||||||||
| Household Products/Wares—6.7% | |||||||||||
| 3,165 | Church & Dwight Co., Inc. | 160,560 | |||||||||
| 2,285 | Clorox Co. | 153,278 | |||||||||
| 3,898 | Kimberly-Clark Corp. | 277,421 | |||||||||
| 10,699 | Playtex Products, Inc.* | 162,839 | |||||||||
| 754,098 | |||||||||||
| Miscellaneous Manufacturing—1.2% | |||||||||||
| 3,327 | Lancaster Colony Corp. | 140,499 | |||||||||
| Pharmaceuticals—2.1% | |||||||||||
| 2,861 | NBTY, Inc.* | 141,362 | |||||||||
| 2,420 | USANA Health Sciences, Inc.* | 96,413 | |||||||||
| 237,775 | |||||||||||
| Retail—11.5% | |||||||||||
| 4,458 | BJ's Wholesale Club, Inc.* | 153,935 | |||||||||
| 4,747 | Costco Wholesale Corp. | 254,297 | |||||||||
| 8,400 | CVS Corp. | 304,416 | |||||||||
| 3,141 | Longs Drug Stores Corp. | 171,938 | |||||||||
| 8,389 | Nu Skin Enterprises, Inc., Class A | 145,381 | |||||||||
| 5,504 | Wal-Mart Stores, Inc. | 263,752 | |||||||||
| 1,293,719 | |||||||||||
| Total Common Stocks (Cost $10,464,776) | 11,229,640 | ||||||||||
| Money Market Fund—0.8% | |||||||||||
| 94,474 | Liquid Assets Portfolio Private Class** (Cost $94,474) | 94,474 | |||||||||
| Total Investments (Cost $10,559,250)—100.5% | 11,324,114 | ||||||||||
| Liabilities in excess of other assets—(0.5%) | (59,783 | ) | |||||||||
| Net Assets—100.00% | $ | 11,264,331 | |||||||||
* Non-income producing security.
** Affiliated investment.
COUNTRY BREAKDOWN
April 30, 2007 (Unaudited)
| Value | Net Assets | ||||||||||
| United States | $ | 11,190,398 | 99.3 | % | |||||||
| Bermuda | 133,716 | 1.2 | |||||||||
| Total investments | 11,324,114 | 100.5 | |||||||||
| Liabilities in excess of other assets | (59,783 | ) | (0.5 | ) | |||||||
| Net Assets | $ | 11,264,331 | 100.0 | % | |||||||
See Notes to Financial Statements.
33
Schedule of Investments
PowerShares Dynamic Energy Sector Portfolio
April 30, 2007
| Number of Shares | Value | ||||||||||
| Common Stocks—100.2% | |||||||||||
| Coal—2.8% | |||||||||||
| 10,107 | Alliance Holdings GP LP | $ | 270,969 | ||||||||
| 15,544 | Alpha Natural Resources, Inc.* | 269,999 | |||||||||
| 540,968 | |||||||||||
| Electric—1.4% | |||||||||||
| 8,690 | MDU Resources Group, Inc. | 263,307 | |||||||||
| Energy - Alternate Sources—1.3% | |||||||||||
| 9,907 | Covanta Holding Corp.* | 243,118 | |||||||||
| Gas—12.8% | |||||||||||
| 5,577 | AGL Resources, Inc. | 242,823 | |||||||||
| 7,277 | Atmos Energy Corp. | 230,826 | |||||||||
| 4,938 | Energen Corp. | 276,774 | |||||||||
| 5,024 | Nicor, Inc. | 257,430 | |||||||||
| 9,691 | NiSource, Inc. | 238,302 | |||||||||
| 5,186 | Northwest Natural Gas Co. | 263,501 | |||||||||
| 7,124 | Sempra Energy | 452,231 | |||||||||
| 8,774 | UGI Corp. | 248,831 | |||||||||
| 7,237 | WGL Holdings, Inc. | 244,900 | |||||||||
| 2,455,618 | |||||||||||
| Mining—1.6% | |||||||||||
| 15,332 | USEC, Inc.* | 309,246 | |||||||||
| Oil & Gas—46.3% | |||||||||||
| 8,917 | BreitBurn Energy Partners L.P. | 326,362 | |||||||||
| 6,674 | Cabot Oil & Gas Corp. | 243,067 | |||||||||
| 6,075 | Chevron Corp. | 472,574 | |||||||||
| 6,425 | ConocoPhillips | 445,574 | |||||||||
| 6,527 | Devon Energy Corp. | 475,622 | |||||||||
| 4,603 | ENSCO International, Inc. | 259,517 | |||||||||
| 13,558 | EXCO Resources, Inc.* | 227,639 | |||||||||
| 5,740 | Exxon Mobil Corp. | 455,641 | |||||||||
| 7,788 | Frontier Oil Corp. | 275,150 | |||||||||
| 34,279 | Grey Wolf, Inc.* | 245,438 | |||||||||
| 7,768 | Hess Corp. | 440,834 | |||||||||
| 4,214 | Holly Corp. | 268,010 | |||||||||
| 4,663 | Marathon Oil Corp. | 473,528 | |||||||||
| 7,361 | Noble Energy, Inc. | 432,900 | |||||||||
| 8,948 | Occidental Petroleum Corp. | 453,664 | |||||||||
| 26,225 | Parker Drilling Co.* | 284,804 | |||||||||
| 4,925 | Plains Exploration & Production Co.* | 231,426 | |||||||||
| 6,302 | St. Mary Land & Exploration Co. | 230,779 | |||||||||
| 2,581 | Tesoro Corp. | 312,817 | |||||||||
| 6,896 | Todco.* | 313,492 | |||||||||
| 5,482 | Transocean, Inc. (Cayman Islands)* | 472,548 | |||||||||
| 7,346 | Valero Energy Corp. | 515,909 | |||||||||
| 8,393 | Western Refining, Inc. | 332,531 | |||||||||
| 5,185 | Whiting Petroleum Corp.* | 228,244 | |||||||||
| 8,213 | XTO Energy, Inc. | 445,720 | |||||||||
| 8,863,790 | |||||||||||
| Number of Shares | Value | ||||||||||
| Common Stocks (Continued) | |||||||||||
| Oil & Gas Services—25.6% | |||||||||||
| 6,606 | Baker Hughes, Inc. | $ | 531,057 | ||||||||
| 4,010 | Cameron International Corp.* | 258,926 | |||||||||
| 3,486 | FMC Technologies, Inc.* | 247,088 | |||||||||
| 17,065 | Global Industries Ltd.* | 354,269 | |||||||||
| 5,189 | Grant Prideco, Inc.* | 267,441 | |||||||||
| 13,684 | Halliburton Co. | 434,741 | |||||||||
| 16,690 | Input/Output, Inc.* | 233,493 | |||||||||
| 4,189 | Lufkin Industries, Inc. | 260,640 | |||||||||
| 6,387 | NATCO Group, Inc., Class A* | 243,983 | |||||||||
| 6,181 | National Oilwell Varco, Inc.* | 524,458 | |||||||||
| 5,734 | Oceaneering International, Inc.* | 272,594 | |||||||||
| 6,685 | Schlumberger Ltd. (Netherlands) | 493,554 | |||||||||
| 2,383 | SEACOR Holdings, Inc.* | 227,052 | |||||||||
| 7,759 | Superior Energy Services, Inc.* | 281,884 | |||||||||
| 4,320 | Tidewater, Inc. | 273,067 | |||||||||
| 4,904,247 | |||||||||||
| Pipelines—5.6% | |||||||||||
| 6,894 | Copano Energy LLC | 269,280 | |||||||||
| 6,365 | DCP Midstream Partners, LP | 260,965 | |||||||||
| 5,513 | ONEOK, Inc. | 266,884 | |||||||||
| 2,899 | Questar Corp. | 281,580 | |||||||||
| 1,078,709 | |||||||||||
| Retail—1.2% | |||||||||||
| 4,923 | World Fuel Services Corp. | 227,492 | |||||||||
| Transportation—1.6% | |||||||||||
| 6,201 | Gulfmark Offshore, Inc.* | 297,028 | |||||||||
| Total Common Stocks (Cost $15,860,048) | 19,183,523 | ||||||||||
| Money Market Fund—0.2% | |||||||||||
| 31,280 | Liquid Assets Portfolio Private Class** (Cost $31,280) | 31,280 | |||||||||
| Total Investments (Cost $15,891,328)—100.4% | 19,214,803 | ||||||||||
| Liabilities in excess of other assets—(0.4%) | (77,522 | ) | |||||||||
| Net Assets—100.0% | $ | 19,137,281 | |||||||||
* Non-income producing security.
** Affiliated investment.
COUNTRY BREAKDOWN
April 30, 2007 (Unaudited)
| Value | Net Assets | ||||||||||
| United States | $ | 18,248,701 | 95.3 | % | |||||||
| Netherlands | 493,554 | 2.6 | |||||||||
| Cayman Islands | 472,548 | 2.5 | |||||||||
| Total investments | 19,214,803 | 100.4 | |||||||||
| Liabilities in excess of other assets | (77,522 | ) | (0.4 | ) | |||||||
| Net Assets | $ | 19,137,281 | 100.0 | % | |||||||
See Notes to Financial Statements.
34
Schedule of Investments
PowerShares Dynamic Financial Sector Portfolio
April 30, 2007
| Number of Shares | Value | ||||||||||
| Common Stocks—100.4% | |||||||||||
| Banks—11.1% | |||||||||||
| 3,417 | Chittenden Corp. | $ | 99,298 | ||||||||
| 2,754 | City Holding Co. | 104,569 | |||||||||
| 1,723 | Comerica, Inc. | 106,671 | |||||||||
| 5,091 | KeyCorp | 181,647 | |||||||||
| 2,877 | State Street Corp. | 198,139 | |||||||||
| 2,287 | SunTrust Banks, Inc. | 193,069 | |||||||||
| 883,393 | |||||||||||
| Commercial Services—2.5% | |||||||||||
| 2,951 | Moody's Corp. | 195,120 | |||||||||
| Diversified Financial Services—12.2% | |||||||||||
| 1,602 | AG Edwards, Inc. | 116,065 | |||||||||
| 2,992 | Eaton Vance Corp. | 114,354 | |||||||||
| 1,609 | Franklin Resources, Inc. | 211,277 | |||||||||
| 2,809 | GAMCO Investors, Inc., Class A | 128,147 | |||||||||
| 919 | Goldman Sachs Group (The), Inc. | 200,903 | |||||||||
| 1,580 | Piper Jaffray Cos., Inc.* | 100,820 | |||||||||
| 4,219 | Waddell & Reed Financial, Inc., Class A | 102,184 | |||||||||
| 973,750 | |||||||||||
| Insurance—72.0% | |||||||||||
| 3,455 | ACE Ltd. (Cayman Islands) | 205,434 | |||||||||
| 1,214 | AMBAC Financial Group, Inc. | 111,445 | |||||||||
| 2,990 | American Financial Group, Inc. | 105,457 | |||||||||
| 1,644 | Arch Capital Group Ltd. (Bermuda)* | 119,716 | |||||||||
| 2,932 | Argonaut Group, Inc.* | 98,545 | |||||||||
| 2,012 | Assurant, Inc. | 115,750 | |||||||||
| 3,753 | Chubb Corp. | 202,024 | |||||||||
| 4,993 | CNA Surety Corp.* | 103,056 | |||||||||
| 3,623 | Commerce Group, Inc. | 118,146 | |||||||||
| 2,651 | Delphi Financial Group, Class A | 113,198 | |||||||||
| 1,097 | Everest Re Group, Ltd. (Bermuda) | 110,402 | |||||||||
| 2,705 | FBL Financial Group, Inc., Class A | 104,792 | |||||||||
| 3,121 | Harleysville Group, Inc. | 95,315 | |||||||||
| 2,062 | Hartford Financial Services Group (The), Inc. | 208,674 | |||||||||
| 3,367 | HCC Insurance Holdings, Inc. | 103,232 | |||||||||
| 5,121 | Horace Mann Educators Corp. | 107,746 | |||||||||
| 3,676 | IPC Holdings, Ltd. (Bermuda) | 110,206 | |||||||||
| 2,822 | Lincoln National Corp. | 200,785 | |||||||||
| 4,512 | Loews Corp. | 213,509 | |||||||||
| 221 | Markel Corp.* | 101,419 | |||||||||
| 1,976 | Nationwide Financial Services, Class A | 112,889 | |||||||||
| 2,776 | Odyssey Re Holdings Corp. | 116,314 | |||||||||
| 3,511 | Ohio Casualty Corp. | 111,088 | |||||||||
| 4,741 | Old Republic International Corp. | 100,841 | |||||||||
| 1,532 | PartnerRe Ltd. (Bermuda) | 110,335 | |||||||||
| 2,296 | Philadelphia Consolidated Holding Co.* | 99,646 | |||||||||
| 2,282 | PMI Group (The), Inc. | 110,609 | |||||||||
| 3,165 | Principal Financial Group, Inc. | 200,946 | |||||||||
| 8,549 | Progressive (The) Corp. | 197,225 | |||||||||
| 2,152 | Prudential Financial, Inc. | 204,440 | |||||||||
| Number of Shares | Value | ||||||||||
| Common Stocks (Continued) | |||||||||||
| 1,848 | Reinsurance Group of America, Inc. | $ | 115,149 | ||||||||
| 1,899 | RLI Corp. | 105,755 | |||||||||
| 1,592 | Safeco Corp. | 106,250 | |||||||||
| 2,343 | Safety Insurance Group, Inc. | 93,861 | |||||||||
| 4,362 | Selective Insurance Group, Inc. | 113,761 | |||||||||
| 1,678 | Transatlantic Holdings, Inc. | 116,604 | |||||||||
| 3,754 | Travelers Cos. (The), Inc. | 203,091 | |||||||||
| 4,575 | United America Indemnity Ltd., Class A (Cayman Islands)* | 114,284 | |||||||||
| 2,275 | Unitrin, Inc. | 107,266 | |||||||||
| 3,200 | W.R. Berkley Corp. | 103,968 | |||||||||
| 188 | White Mountains Insurance Group Ltd. (Bermuda) | 107,724 | |||||||||
| 2,730 | Willis Group Holdings Ltd. (Bermuda) | 111,985 | |||||||||
| 2,731 | XL Capital Ltd., Class A (Cayman Islands) | 212,963 | |||||||||
| 2,155 | Zenith National Insurance Corp. | 99,669 | |||||||||
| 5,725,514 | |||||||||||
| Real Estate—1.3% | |||||||||||
| 3,001 | CB Richard Ellis Group, Inc., Class A* | 101,584 | |||||||||
| Software—1.3% | |||||||||||
| 1,710 | SEI Investments Co. | 104,361 | |||||||||
| Total Common Stocks (Cost $7,543,612) | 7,983,722 | ||||||||||
| Money Market Fund—0.6% | |||||||||||
| 46,642 | Liquid Assets Portfolio Private Class** (Cost $46,642) | 46,642 | |||||||||
| Total Investments (Cost $7,590,254)—101.0% | 8,030,364 | ||||||||||
| Liabilities in excess of other assets—(1.0%) | (75,986 | ) | |||||||||
| Net Assets—100.0% | $ | 7,954,378 | |||||||||
* Non-income producing security.
** Affiliated investment.
COUNTRY BREAKDOWN
April 30, 2007 (Unaudited)
| Value | Net Assets | ||||||||||
| United States | $ | 6,827,315 | 85.9 | % | |||||||
| Bermuda | 670,368 | 8.4 | |||||||||
| Cayman Islands | 532,681 | 6.7 | |||||||||
| Total investments | 8,030,364 | 101.0 | |||||||||
| Liabilities in excess of other assets | (75,986 | ) | (1.0 | ) | |||||||
| Net Assets | $ | 7,954,378 | 100.0 | % | |||||||
See Notes to Financial Statements.
35
Schedule of Investments
PowerShares Dynamic Healthcare Sector Portfolio
April 30, 2007
| Number of Shares | Value | ||||||||||
| Common Stocks—100.2% | |||||||||||
| Biotechnology—2.7% | |||||||||||
| 9,979 | Bio-Rad Laboratories, Inc., Class A* | $ | 706,214 | ||||||||
| 111,901 | Incyte Corp.* | 862,757 | |||||||||
| 1,568,971 | |||||||||||
| Commercial Services—8.2% | |||||||||||
| 26,953 | AMN Healthcare Services, Inc.* | 656,306 | |||||||||
| 16,170 | Chemed Corp. | 813,351 | |||||||||
| 38,570 | Cross Country Healthcare, Inc.* | 759,443 | |||||||||
| 29,826 | Emergency Medical Services Corp., Class A* | 998,574 | |||||||||
| 24,385 | McKesson Corp. | 1,434,570 | |||||||||
| 4,662,244 | |||||||||||
| Electronics—9.1% | |||||||||||
| 42,932 | Applera Corp. - Applied Biosystems Group | 1,341,196 | |||||||||
| 11,960 | Dionex Corp.* | 825,240 | |||||||||
| 31,094 | PerkinElmer, Inc. | 752,475 | |||||||||
| 13,382 | Varian, Inc.* | 775,621 | |||||||||
| 24,969 | Waters Corp.* | 1,483,907 | |||||||||
| 5,178,439 | |||||||||||
| Healthcare - Products—32.8% | |||||||||||
| 28,089 | Baxter International, Inc. | 1,590,681 | |||||||||
| 18,031 | Becton, Dickinson & Co. | 1,418,859 | |||||||||
| 13,800 | Biosite, Inc.* | 1,276,500 | |||||||||
| 34,954 | Conceptus, Inc.* | 722,849 | |||||||||
| 25,070 | Cytyc Corp.* | 883,216 | |||||||||
| 18,386 | Dade Behring Holdings, Inc. | 902,936 | |||||||||
| 23,428 | Dentsply International, Inc. | 782,729 | |||||||||
| 14,762 | Edwards Lifesciences Corp.* | 723,338 | |||||||||
| 15,622 | Gen-Probe, Inc.* | 798,440 | |||||||||
| 12,668 | Hillenbrand Industries, Inc. | 774,648 | |||||||||
| 8,765 | IDEXX Laboratories, Inc.* | 790,340 | |||||||||
| 21,808 | Johnson & Johnson | 1,400,510 | |||||||||
| 15,023 | Kinetic Concepts, Inc.* | 751,150 | |||||||||
| 15,342 | Mentor Corp. | 596,957 | |||||||||
| 22,406 | Patterson Cos., Inc.* | 807,960 | |||||||||
| 35,394 | PSS World Medical, Inc.* | 711,419 | |||||||||
| 28,052 | STERIS Corp. | 717,009 | |||||||||
| 13,548 | Techne Corp.* | 798,926 | |||||||||
| 34,269 | Wright Medical Group, Inc.* | 809,434 | |||||||||
| 16,364 | Zimmer Holdings, Inc.* | 1,480,615 | |||||||||
| 18,738,516 | |||||||||||
| Healthcare - Services—25.8% | |||||||||||
| 30,371 | Aetna, Inc. | 1,423,792 | |||||||||
| 21,826 | AMERIGROUP Corp.* | 613,965 | |||||||||
| 31,512 | AmSurg Corp.* | 723,200 | |||||||||
| 23,347 | Apria Healthcare Group, Inc.* | 741,034 | |||||||||
| 25,090 | Coventry Health Care, Inc.* | 1,450,955 | |||||||||
| 14,001 | Health Net, Inc.* | 756,894 | |||||||||
| 22,986 | Humana, Inc.* | 1,453,636 | |||||||||
| 19,345 | Lincare Holdings, Inc.* | 762,967 | |||||||||
| 17,465 | Magellan Health Services, Inc.* | 749,249 | |||||||||
| Number of Shares | Value | ||||||||||
| Common Stocks (Continued) | |||||||||||
| 13,948 | Manor Care, Inc. | $ | 905,086 | ||||||||
| 25,328 | Medcath Corp.* | 752,748 | |||||||||
| 13,808 | National Healthcare Corp. | 708,488 | |||||||||
| 13,880 | Pediatrix Medical Group, Inc.* | 791,854 | |||||||||
| 26,387 | UnitedHealth Group, Inc. | 1,400,094 | |||||||||
| 12,927 | Universal Health Services, Inc., Class B | 784,927 | |||||||||
| 9,444 | WellCare Health Plans, Inc.* | 761,092 | |||||||||
| 14,779,981 | |||||||||||
| Insurance—2.6% | |||||||||||
| 9,724 | Cigna Corp. | 1,512,957 | |||||||||
| Pharmaceuticals—17.7% | |||||||||||
| 25,430 | AmerisourceBergen Corp. | 1,271,246 | |||||||||
| 25,710 | Forest Laboratories, Inc.* | 1,368,029 | |||||||||
| 27,584 | Medicines (The), Co.* | 628,364 | |||||||||
| 32,587 | Merck & Co., Inc. | 1,676,274 | |||||||||
| 34,974 | Mylan Laboratories, Inc. | 766,980 | |||||||||
| 54,613 | Pfizer, Inc. | 1,445,060 | |||||||||
| 32,647 | Sciele Pharma, Inc.* | 807,034 | |||||||||
| 19,691 | VCA Antech, Inc.* | 776,416 | |||||||||
| 42,512 | ViroPharma, Inc.* | 641,081 | |||||||||
| 26,122 | Watson Pharmaceuticals, Inc.* | 713,131 | |||||||||
| 10,093,615 | |||||||||||
| Software—1.3% | |||||||||||
| 14,062 | Cerner Corp.* | 748,661 | |||||||||
| Total Common Stocks (Cost $56,142,137) | 57,283,384 | ||||||||||
| Money Market Fund—0.0% | |||||||||||
| 14,039 | Liquid Assets Portfolio Private Class** (Cost $14,039) | 14,039 | |||||||||
| Total Investments (Cost $56,156,176)—100.2% | 57,297,423 | ||||||||||
| Liabilities in excess of other assets—(0.2%) | (114,388 | ) | |||||||||
| Net Assets—100.0% | $ | 57,183,035 | |||||||||
* Non-income producing security.
** Affiliated investment.
See Notes to Financial Statements.
36
Schedule of Investments
PowerShares Dynamic Industrials Sector Portfolio
April 30, 2007
| Number of Shares | Value | ||||||||||
| Common Stocks—100.1% | |||||||||||
| Aerospace/Defense—17.1% | |||||||||||
| 7,291 | Boeing Co. | $ | 678,062 | ||||||||
| 8,327 | General Dynamics Corp. | 653,670 | |||||||||
| 6,447 | Lockheed Martin Corp. | 619,815 | |||||||||
| 8,846 | Northrop Grumman Corp. | 651,419 | |||||||||
| 12,008 | Raytheon Co. | 642,908 | |||||||||
| 9,615 | Rockwell Collins, Inc. | 631,417 | |||||||||
| 9,745 | United Technologies Corp. | 654,182 | |||||||||
| 4,531,473 | |||||||||||
| Building Materials—1.3% | |||||||||||
| 10,115 | Lennox International, Inc. | 341,988 | |||||||||
| Commercial Services—22.9% | |||||||||||
| 13,094 | ABM Industries, Inc. | 368,465 | |||||||||
| 9,549 | Administaff, Inc. | 316,931 | |||||||||
| 4,738 | Consolidated Graphics, Inc.* | 356,535 | |||||||||
| 12,004 | Healthcare Services Group. | 336,112 | |||||||||
| 7,599 | Heidrick & Struggles International, Inc.* | 358,521 | |||||||||
| 14,667 | Korn/Ferry International* | 345,701 | |||||||||
| 18,395 | Labor Ready, Inc.* | 399,172 | |||||||||
| 8,386 | Manpower, Inc. | 672,977 | |||||||||
| 15,201 | Quanta Services, Inc.* | 417,875 | |||||||||
| 10,511 | Resources Connection, Inc.* | 317,117 | |||||||||
| 15,246 | Rollins, Inc. | 351,725 | |||||||||
| 17,089 | R.R. Donnelley & Sons Co. | 686,977 | |||||||||
| 19,663 | SAIC, Inc.* | 359,636 | |||||||||
| 10,783 | TeleTech Holdings, Inc.* | 406,843 | |||||||||
| 7,437 | Watson Wyatt Worldwide, Inc., Class A | 350,506 | |||||||||
| 6,045,093 | |||||||||||
| Electronics—2.9% | |||||||||||
| 6,673 | Thomas & Betts Corp.* | 363,545 | |||||||||
| 8,187 | Woodward Governor Co. | 404,028 | |||||||||
| 767,573 | |||||||||||
| Engineering & Construction—7.6% | |||||||||||
| 14,472 | Infrasource Services, Inc.* | 483,075 | |||||||||
| 7,712 | Jacobs Engineering Group, Inc.* | 388,916 | |||||||||
| 7,011 | McDermott International, Inc. (Panama)* | 376,210 | |||||||||
| 9,668 | Perini Corp.* | 411,857 | |||||||||
| 7,814 | URS Corp.* | 341,472 | |||||||||
| 2,001,530 | |||||||||||
| Environmental Control—1.3% | |||||||||||
| 12,502 | Republic Services, Inc. | 349,181 | |||||||||
| Hand/Machine Tools—1.5% | |||||||||||
| 5,462 | Kennametal, Inc. | 385,399 | |||||||||
| Home Furnishings—1.1% | |||||||||||
| 8,399 | American Woodmark Corp. | 289,849 | |||||||||
| Number of Shares | Value | ||||||||||
| Common Stocks (Continued) | |||||||||||
| Household Products/Wares—5.0% | |||||||||||
| 9,689 | Avery Dennison Corp. | $ | 602,656 | ||||||||
| 13,810 | Ennis, Inc. | 337,655 | |||||||||
| 7,082 | John H. Harland Co. | 372,513 | |||||||||
| 1,312,824 | |||||||||||
| Machinery-Construction & Mining—1.5% | |||||||||||
| 5,056 | Terex Corp.* | 393,610 | |||||||||
| Machinery-Diversified—8.6% | |||||||||||
| 6,088 | Cascade Corp. | 377,273 | |||||||||
| 9,101 | Cummins, Inc. | 838,748 | |||||||||
| 9,921 | Gardner Denver, Inc.* | 375,014 | |||||||||
| 5,655 | Manitowoc (The) Co., Inc. | 385,841 | |||||||||
| 6,426 | Nordson Corp. | 294,504 | |||||||||
| 2,271,380 | |||||||||||
| Metal Fabricate/Hardware—1.5% | |||||||||||
| 10,743 | RBC Bearings, Inc. | 408,341 | |||||||||
| Miscellaneous Manufacturing—15.9% | |||||||||||
| 6,075 | Acuity Brands, Inc. | 359,154 | |||||||||
| 6,122 | Ceradyne, Inc.* | 360,280 | |||||||||
| 13,750 | Cooper Industries Ltd., Class A (Bermuda) | 684,200 | |||||||||
| 8,887 | Danaher Corp. | 632,666 | |||||||||
| 13,803 | Honeywell International, Inc. | 747,847 | |||||||||
| 10,799 | ITT Corp. | 689,084 | |||||||||
| 5,251 | Teleflex, Inc. | 377,179 | |||||||||
| 15,220 | Tredegar Corp. | 355,691 | |||||||||
| 4,206,101 | |||||||||||
| Office Furnishings—2.5% | |||||||||||
| 9,039 | Herman Miller, Inc. | 311,032 | |||||||||
| 15,286 | Knoll, Inc. | 354,941 | |||||||||
| 665,973 | |||||||||||
| Office/Business Equipment—3.9% | |||||||||||
| 24,677 | IKON Office Solutions, Inc. | 369,168 | |||||||||
| 13,722 | Pitney Bowes, Inc. | 658,656 | |||||||||
| 1,027,824 | |||||||||||
| Retail—1.3% | |||||||||||
| 11,968 | Copart, Inc.* | 346,833 | |||||||||
| Transportation—4.2% | |||||||||||
| 11,642 | Horizon Lines, Inc., Class A | 395,945 | |||||||||
| 10,712 | HUB Group, Inc., Class A* | 385,632 | |||||||||
| 12,502 | Pacer International, Inc. | 319,426 | |||||||||
| 1,101,003 | |||||||||||
| Total Common Stocks (Cost $24,471,820) | 26,445,975 | ||||||||||
See Notes to Financial Statements.
37
Schedule of Investments (Continued)
PowerShares Dynamic Industrials Sector Portfolio
April 30, 2007
| Number of Shares | Value | ||||||||||
| Money Market Fund—0.1% | |||||||||||
| 21,219 | Liquid Assets Portfolio Private Class** (Cost $21,219) | $ | 21,219 | ||||||||
| Total Investments (Cost $24,493,039)—100.2% | 26,467,194 | ||||||||||
| Liabilities in excess of other assets—(0.2%) | (57,861 | ) | |||||||||
| Net Assets—100.0% | $ | 26,409,333 | |||||||||
* Non-income producing security.
** Affiliated investments.
COUNTRY BREAKDOWN
April 30, 2007 (Unaudited)
| Value | Net Assets | ||||||||||
| United States | $ | 25,406,783 | 96.2 | % | |||||||
| Bermuda | 684,200 | 2.6 | |||||||||
| Panama | 376,210 | 1.4 | |||||||||
| Total investments | 26,467,193 | 100.2 | |||||||||
| Liabilities in excess of other assets | (57,860 | ) | (0.2 | ) | |||||||
| Net Assets | $ | 26,409,333 | 100.0 | % | |||||||
See Notes to Financial Statements.
38
Schedule of Investments
PowerShares Dynamic Technology Sector Portfolio
April 30, 2007
| Number of Shares | Value | ||||||||||
| Common Stocks—100.2% | |||||||||||
| Commercial Services—4.2% | |||||||||||
| 4,754 | Alliance Data Systems Corp.* | $ | 302,640 | ||||||||
| 11,149 | Convergys Corp.* | 281,624 | |||||||||
| 13,455 | Gartner, Inc.* | 339,469 | |||||||||
| 923,733 | |||||||||||
| Computers—35.9% | |||||||||||
| 13,473 | Agilysys, Inc. | 283,337 | |||||||||
| 9,101 | Ansoft Corp.* | 293,871 | |||||||||
| 6,159 | Apple, Inc.* | 614,667 | |||||||||
| 35,624 | Brocade Communications Systems, Inc.* | 348,046 | |||||||||
| 14,270 | Cadence Design Systems, Inc.* | 316,794 | |||||||||
| 11,509 | Covansys Corp.* | 384,401 | |||||||||
| 4,039 | DST Systems, Inc.* | 315,244 | |||||||||
| 18,937 | Electronic Data Systems Corp. | 553,718 | |||||||||
| 4,784 | Factset Research Systems, Inc. | 294,264 | |||||||||
| 141,150 | Gateway, Inc.* | 309,119 | |||||||||
| 13,440 | Hewlett-Packard Co. | 566,362 | |||||||||
| 5,613 | International Business Machines Corp. | 573,704 | |||||||||
| 12,219 | Jack Henry & Associates, Inc. | 290,201 | |||||||||
| 8,634 | Lexmark International, Inc., Class A* | 470,553 | |||||||||
| 16,661 | Mentor Graphics Corp.* | 269,575 | |||||||||
| 7,704 | MTS Systems Corp. | 327,497 | |||||||||
| 11,382 | NCR Corp.* | 573,653 | |||||||||
| 18,158 | SYKES Enterprises, Inc.* | 335,197 | |||||||||
| 11,348 | Synopsys, Inc.* | 313,886 | |||||||||
| 7,738 | Syntel, Inc. | 271,294 | |||||||||
| 14,851 | Western Digital Corp.* | 262,566 | |||||||||
| 7,967,949 | |||||||||||
| Distribution/Wholesale—1.3% | |||||||||||
| 14,763 | Ingram Micro, Inc., Class A* | 289,650 | |||||||||
| Electrical Components & Equipment—1.6% | |||||||||||
| 14,647 | Advanced Energy Industries, Inc.* | 358,852 | |||||||||
| Electronics—9.7% | |||||||||||
| 16,489 | Agilent Technologies, Inc.* | 566,727 | |||||||||
| 16,176 | Amphenol Corp., Class A | 567,939 | |||||||||
| 8,880 | Dolby Laboratories, Inc., Class A* | 314,530 | |||||||||
| 3,328 | Mettler-Toledo International, Inc.* | 324,879 | |||||||||
| 13,096 | Paxar Corp.* | 393,011 | |||||||||
| 2,167,086 | |||||||||||
| Internet—4.1% | |||||||||||
| 9,455 | McAfee, Inc.* | 307,193 | |||||||||
| 32,350 | TIBCO Software, Inc.* | 295,032 | |||||||||
| 21,684 | United Online, Inc. | 312,900 | |||||||||
| 915,125 | |||||||||||
| Number of Shares | Value | ||||||||||
| Common Stocks (Continued) | |||||||||||
| Office/Business Equipment—4.5% | |||||||||||
| 14,836 | Global Imaging Systems, Inc.* | $ | 428,612 | ||||||||
| 30,683 | Xerox Corp.* | 567,636 | |||||||||
| 996,248 | |||||||||||
| Semiconductors—5.7% | |||||||||||
| 52,314 | Atmel Corp.* | 278,310 | |||||||||
| 18,714 | Photronics, Inc.* | 281,646 | |||||||||
| 16,415 | QLogic Corp.* | 293,500 | |||||||||
| 6,069 | Varian Semiconductor Equipment Associates, Inc.* | 402,739 | |||||||||
| 1,256,195 | |||||||||||
| Software—21.2% | |||||||||||
| 12,917 | Autodesk, Inc.* | 533,085 | |||||||||
| 25,041 | BEA Systems, Inc.* | 295,233 | |||||||||
| 17,144 | BMC Software, Inc.* | 554,951 | |||||||||
| 31,301 | Compuware Corp.* | 308,941 | |||||||||
| 11,730 | CSG Systems International, Inc.* | 314,129 | |||||||||
| 7,455 | Fair Isaac Corp. | 266,218 | |||||||||
| 10,031 | Fiserv, Inc.* | 533,348 | |||||||||
| 8,246 | ManTech International Corp., Class A* | 252,987 | |||||||||
| 18,983 | Microsoft Corp. | 568,352 | |||||||||
| 2,339 | MicroStrategy, Inc., Class A* | 266,085 | |||||||||
| 11,598 | Sybase, Inc.* | 280,556 | |||||||||
| 17,106 | Total System Services, Inc. | 531,312 | |||||||||
| 4,705,197 | |||||||||||
| Telecommunications—12.0% | |||||||||||
| 42,265 | Avaya, Inc.* | 546,064 | |||||||||
| 19,942 | Cisco Systems, Inc.* | 533,249 | |||||||||
| 7,645 | CommScope, Inc.* | 356,639 | |||||||||
| 8,214 | Comtech Telecommunications Corp.* | 310,900 | |||||||||
| 8,458 | Interdigital Communications Corp.* | 278,099 | |||||||||
| 10,511 | NETGEAR, Inc.* | 353,275 | |||||||||
| 8,843 | Polycom, Inc.* | 294,472 | |||||||||
| 2,672,698 | |||||||||||
| Total Investments (Cost $20,610,469)—100.2% | 22,252,733 | ||||||||||
| Liabilities in excess of other assets—(0.2%) | (42,448 | ) | |||||||||
| Net Assets—100.0% | $ | 22,210,285 | |||||||||
* Non-income producing security.
See Notes to Financial Statements.
39
Schedule of Investments
PowerShares Dynamic Telecommunications & Wireless Portfolio
April 30, 2007
| Number of Shares | Value | ||||||||||
| Common Stocks—100.1% | |||||||||||
| Commercial Services—2.5% | |||||||||||
| 33,619 | Convergys Corp.* | $ | 849,216 | ||||||||
| Electronics—2.7% | |||||||||||
| 15,695 | Garmin Ltd. (Cayman Islands) | 913,292 | |||||||||
| Internet—2.8% | |||||||||||
| 65,387 | United Online, Inc. | 943,534 | |||||||||
| Media—19.4% | |||||||||||
| 72,305 | DIRECTV Group (The), Inc.* | 1,723,751 | |||||||||
| 38,905 | EchoStar Communications Corp., Class A* | 1,810,250 | |||||||||
| 55,570 | Liberty Global, Inc., Class A* | 1,994,407 | |||||||||
| 112,795 | Mediacom Communications Corp., Class A* | 973,421 | |||||||||
| 6,501,829 | |||||||||||
| Software—2.8% | |||||||||||
| 35,371 | CSG Systems International, Inc.* | 947,235 | |||||||||
| Telecommunications—69.9% | |||||||||||
| 59,365 | Alaska Communications Systems Group, Inc. | 943,904 | |||||||||
| 26,382 | ALLTEL Corp. | 1,653,888 | |||||||||
| 41,100 | American Tower Corp., Class A* | 1,561,800 | |||||||||
| 44,711 | AT&T, Inc. | 1,731,209 | |||||||||
| 69,520 | Avaya, Inc.* | 898,198 | |||||||||
| 19,621 | CenturyTel, Inc. | 903,547 | |||||||||
| 60,135 | Cisco Systems, Inc.* | 1,608,010 | |||||||||
| 60,723 | Citizens Communications Co. | 945,457 | |||||||||
| 24,769 | Comtech Telecommunications Corp.* | 937,507 | |||||||||
| 15,834 | Embarq Corp. | 950,673 | |||||||||
| 61,510 | General Communication, Inc., Class A* | 875,287 | |||||||||
| 30,340 | Global Crossing Ltd. (Bermuda)* | 875,006 | |||||||||
| 15,302 | Golden Telecom, Inc. | 896,850 | |||||||||
| 17,916 | Harris Corp. | 919,987 | |||||||||
| 42,705 | Plantronics, Inc. | 1,072,323 | |||||||||
| 31,965 | RCN Corp.* | 863,694 | |||||||||
| 61,302 | Syniverse Holdings, Inc.* | 632,024 | |||||||||
| 16,149 | Telephone & Data Systems, Inc. | 919,686 | |||||||||
| 12,655 | United States Cellular Corp.* | 917,488 | |||||||||
| 43,068 | Verizon Communications, Inc. | 1,644,336 | |||||||||
| 25,347 | ViaSat, Inc.* | 869,402 | |||||||||
| 58,440 | Windstream Corp. | 854,393 | |||||||||
| 23,474,669 | |||||||||||
| Total Investments (Cost $29,201,062)—100.1% | 33,629,775 | ||||||||||
| Liabilities in excess of other assets—(0.1%) | (23,813 | ) | |||||||||
| Net Assets—100.0% | $ | 33,605,962 | |||||||||
* Non-income producing security.
COUNTRY BREAKDOWN
April 30, 2007 (Unaudited)
| Value | Net Assets | ||||||||||
| United States | $ | 31,841,477 | 94.8 | % | |||||||
| Cayman Islands | 913,292 | 2.7 | |||||||||
| Bermuda | 875,006 | 2.6 | |||||||||
| Total investments | 33,629,775 | 100.1 | |||||||||
| Liabilities in excess of other assets | (23,813 | ) | (0.1 | ) | |||||||
| Net Assets | $ | 33,605,962 | 100.0 | % | |||||||
See Notes to Financial Statements.
40
Schedule of Investments
PowerShares Dynamic Utilities Portfolio
April 30, 2007
| Number of Shares | Value | ||||||||||
| Common Stocks—99.8% | |||||||||||
| Electric—86.4% | |||||||||||
| 127,514 | AES (The) Corp.* | $ | 2,804,033 | ||||||||
| 32,351 | Allegheny Energy, Inc.* | 1,729,484 | |||||||||
| 32,170 | ALLETE, Inc. | 1,557,350 | |||||||||
| 35,872 | Alliant Energy Corp. | 1,571,194 | |||||||||
| 32,454 | DTE Energy Co. | 1,641,848 | |||||||||
| 142,694 | Duke Energy Corp. | 2,928,081 | |||||||||
| 60,487 | Edison International | 3,166,494 | |||||||||
| 63,695 | El Paso Electric Co.* | 1,681,548 | |||||||||
| 44,732 | FirstEnergy Corp. | 3,061,458 | |||||||||
| 44,669 | NSTAR | 1,603,617 | |||||||||
| 38,616 | OGE Energy Corp. | 1,484,399 | |||||||||
| 45,578 | Otter Tail Corp. | 1,558,768 | |||||||||
| 57,289 | Pepco Holdings, Inc. | 1,691,171 | |||||||||
| 59,472 | PG&E Corp. | 3,009,283 | |||||||||
| 75,641 | PPL Corp. | 3,298,705 | |||||||||
| 30,937 | Progress Energy, Inc. | 1,563,865 | |||||||||
| 37,803 | Public Service Enterprise Group, Inc. | 3,268,069 | |||||||||
| 36,359 | SCANA Corp. | 1,582,707 | |||||||||
| 91,532 | TECO Energy, Inc. | 1,642,999 | |||||||||
| 47,334 | TXU Corp. | 3,104,164 | |||||||||
| 40,062 | UIL Holdings Corp. | 1,368,117 | |||||||||
| 40,447 | Unisource Energy Corp. | 1,553,569 | |||||||||
| 55,362 | Westar Energy, Inc. | 1,506,954 | |||||||||
| 31,659 | Wisconsin Energy Corp. | 1,544,643 | |||||||||
| 64,089 | Xcel Energy, Inc. | 1,543,904 | |||||||||
| 51,466,424 | |||||||||||
| Energy-Alternate Sources—2.7% | |||||||||||
| 65,195 | Covanta Holding Corp.* | 1,599,885 | |||||||||
| Gas—10.7% | |||||||||||
| 36,697 | AGL Resources, Inc. | 1,597,787 | |||||||||
| 47,888 | Atmos Energy Corp. | 1,519,007 | |||||||||
| 63,771 | NiSource, Inc. | 1,568,129 | |||||||||
| 34,126 | Northwest Natural Gas Co. | 1,733,943 | |||||||||
| 6,418,866 | |||||||||||
| Total Investments (Cost $53,176,805)—99.8% | 59,485,175 | ||||||||||
| Other assets less liabilities—0.2% | 94,306 | ||||||||||
| Net Assets—100.00% | $ | 59,579,481 | |||||||||
* Non-income producing security.
See Notes to Financial Statements.
41
Statements of Assets and Liabilities
PowerShares Exchange-Traded Funds
April 30, 2007
| PowerShares Dynamic Basic Materials Sector Portfolio | PowerShares Dynamic Consumer Discretionary Sector Portfolio | PowerShares Dynamic Consumer Staples Sector Portfolio | PowerShares Dynamic Energy Sector Portfolio | PowerShares Dynamic Financial Sector Portfolio | |||||||||||||||||||
| ASSETS: | |||||||||||||||||||||||
| Unaffiliated investments at value | $ | 19,017,798 | $ | 17,185,747 | $ | 11,229,640 | $ | 19,183,523 | $ | 7,983,722 | |||||||||||||
| Affiliated investments at value | 31,916 | 45,074 | 94,474 | 31,280 | 46,642 | ||||||||||||||||||
| Cash | — | — | — | — | — | ||||||||||||||||||
| Receivables: | |||||||||||||||||||||||
| Dividends | 10,361 | 6,063 | 12,792 | 13,780 | 4,351 | ||||||||||||||||||
| Capital stock sold | 3,164,643 | — | — | — | — | ||||||||||||||||||
| Due from Adviser | 10,001 | 10,181 | 10,143 | 10,239 | 10,833 | ||||||||||||||||||
| Other assets | 8,494 | 8,625 | 8,409 | 10,784 | 9,562 | ||||||||||||||||||
| Total Assets | 22,243,213 | 17,255,690 | 11,355,458 | 19,249,606 | 8,055,110 | ||||||||||||||||||
| LIABILITIES: | |||||||||||||||||||||||
| Due to custodian | 38,067 | 43,018 | 38,823 | 53,683 | 47,487 | ||||||||||||||||||
| Payables: | |||||||||||||||||||||||
| Investments purchased | 3,162,614 | — | — | — | — | ||||||||||||||||||
| Accrued advisory fees | 5,475 | 6,438 | 3,726 | 7,667 | 3,232 | ||||||||||||||||||
| Accrued expenses | 49,199 | 49,836 | 48,578 | 50,975 | 50,013 | ||||||||||||||||||
| Total Liabilities | 3,255,355 | 99,292 | 91,127 | 112,325 | 100,732 | ||||||||||||||||||
| NET ASSETS | $ | 18,987,858 | $ | 17,156,398 | $ | 11,264,331 | $ | 19,137,281 | $ | 7,954,378 | |||||||||||||
| NET ASSETS CONSIST OF: | |||||||||||||||||||||||
| Paid-in capital | $ | 17,039,241 | $ | 16,629,864 | $ | 10,629,106 | $ | 16,034,658 | $ | 7,768,610 | |||||||||||||
| Undistributed net investment income | 10,077 | 13,617 | 74,679 | 4,453 | 18,933 | ||||||||||||||||||
| Accumulated net realized loss on investments | (15,907 | ) | (297,256 | ) | (204,318 | ) | (225,305 | ) | (273,275 | ) | |||||||||||||
| Net unrealized appreciation on investments | 1,954,447 | 810,173 | 764,864 | 3,323,475 | 440,110 | ||||||||||||||||||
| Net Assets | $ | 18,987,858 | $ | 17,156,398 | $ | 11,264,331 | $ | 19,137,281 | $ | 7,954,378 | |||||||||||||
| Shares outstanding (unlimited amount authorized, $0.01 par value) | 600,000 | 600,000 | 400,000 | 600,000 | 300,000 | ||||||||||||||||||
| Net asset value | $ | 31.65 | $ | 28.59 | $ | 28.16 | $ | 31.90 | $ | 26.51 | |||||||||||||
| Unaffiliated investments at cost | $ | 17,063,351 | $ | 16,375,574 | $ | 10,464,776 | $ | 15,860,048 | $ | 7,543,612 | |||||||||||||
| Affiliated investments at cost | $ | 31,916 | $ | 45,074 | $ | 94,474 | $ | 31,280 | $ | 46,642 | |||||||||||||
See Notes to Financial Statements.
42
| PowerShares Dynamic Healthcare Sector Portfolio | PowerShares Dynamic Industrials Sector Portfolio | PowerShares Dynamic Technology Sector Portfolio | PowerShares Dynamic Telecommunications & Wireless Portfolio | PowerShares Dynamic Utilities Portfolio | |||||||||||||||||||
| ASSETS: | |||||||||||||||||||||||
| Unaffiliated investments at value | $ | 57,283,384 | $ | 26,445,975 | $ | 22,252,733 | $ | 33,629,775 | $ | 59,485,175 | |||||||||||||
| Affiliated investments at value | 14,039 | 21,219 | — | — | — | ||||||||||||||||||
| Cash | — | — | — | — | 76,114 | ||||||||||||||||||
| Receivables: | |||||||||||||||||||||||
| Dividends | 2,414 | 10,813 | 399 | 33,315 | 71,561 | ||||||||||||||||||
| Capital stock sold | 5,718,304 | — | — | — | — | ||||||||||||||||||
| Due from Adviser | 8,329 | 9,988 | 9,948 | 13,067 | 17,859 | ||||||||||||||||||
| Other assets | 8,978 | 11,950 | 9,866 | 7,666 | 4,875 | ||||||||||||||||||
| Total Assets | 63,035,448 | 26,499,945 | 22,272,946 | 33,683,823 | 59,655,584 | ||||||||||||||||||
| LIABILITIES: | |||||||||||||||||||||||
| Due to custodian | 67,711 | 29,636 | 3,887 | 22,134 | — | ||||||||||||||||||
| Payables: | |||||||||||||||||||||||
| Investments purchased | 5,721,752 | — | — | — | — | ||||||||||||||||||
| Accrued advisory fees | 14,561 | 9,716 | 8,171 | 13,698 | 24,807 | ||||||||||||||||||
| Accrued expenses | 48,389 | 51,260 | 50,603 | 42,029 | 51,296 | ||||||||||||||||||
| Total Liabilities | 5,852,413 | 90,612 | 62,661 | 77,861 | 76,103 | ||||||||||||||||||
| NET ASSETS | $ | 57,183,035 | $ | 26,409,333 | $ | 22,210,285 | $ | 33,605,962 | $ | 59,579,481 | |||||||||||||
| NET ASSETS CONSIST OF: | |||||||||||||||||||||||
| Paid-in capital | $ | 56,302,408 | $ | 24,639,608 | $ | 21,110,902 | $ | 30,909,368 | $ | 54,025,595 | |||||||||||||
| Undistributed net investment income | — | — | — | 75,384 | 152,683 | ||||||||||||||||||
| Accumulated net realized loss on investments | (260,620 | ) | (204,430 | ) | (542,881 | ) | (1,807,503 | ) | (907,167 | ) | |||||||||||||
| Net unrealized appreciation on investments | 1,141,247 | 1,974,155 | 1,642,264 | 4,428,713 | 6,308,370 | ||||||||||||||||||
| Net Assets | $ | 57,183,035 | $ | 26,409,333 | $ | 22,210,285 | $ | 33,605,962 | $ | 59,579,481 | |||||||||||||
| Shares outstanding (unlimited amount authorized, $0.01 par value) | 2,000,000 | 900,000 | 800,000 | 1,700,000 | 2,900,000 | ||||||||||||||||||
| Net asset value | $ | 28.59 | $ | 29.34 | $ | 27.76 | $ | 19.77 | $ | 20.54 | |||||||||||||
| Unaffiliated investments at cost | $ | 56,142,137 | $ | 24,471,820 | $ | 20,610,469 | $ | 29,201,062 | $ | 53,176,805 | |||||||||||||
| Affiliated investments at cost | $ | 14,039 | $ | 21,219 | $ | — | $ | — | $ | — | |||||||||||||
43
Statements of Operations
| PowerShares Dynamic Basic Materials Sector Portfolio | PowerShares Dynamic Consumer Discretionary Sector Portfolio | PowerShares Dynamic Consumer Staples Sector Portfolio | PowerShares Dynamic Energy Sector Portfolio | PowerShares Dynamic Financial Sector Portfolio | |||||||||||||||||||
| For the period October 12, 2006* through April 30, 2007 | For the period October 12, 2006* through April 30, 2007 | For the period October 12, 2006* through April 30, 2007 | For the period October 12, 2006* through April 30, 2007 | For the period October 12, 2006* through April 30, 2007 | |||||||||||||||||||
| INVESTMENT INCOME: | |||||||||||||||||||||||
| Unaffiliated dividend income | $ | 177,062 | $ | 97,333 | $ | 276,673 | $ | 92,501 | $ | 118,572 | |||||||||||||
| Affiliated dividend income | 307 | 334 | 554 | 303 | 398 | ||||||||||||||||||
| Total Income | 177,369 | 97,667 | 277,227 | 92,804 | 118,970 | ||||||||||||||||||
| EXPENSES: | |||||||||||||||||||||||
| Advisory fees | 39,686 | 35,535 | 33,403 | 46,867 | 37,529 | ||||||||||||||||||
| Audit | 16,500 | 16,500 | 16,500 | 16,500 | 16,500 | ||||||||||||||||||
| Listing fee and expenses | 10,000 | 10,000 | 10,000 | 10,000 | 10,000 | ||||||||||||||||||
| Printing | 5,164 | 5,582 | 4,827 | 6,273 | 5,861 | ||||||||||||||||||
| Offering costs | 4,516 | 4,524 | 4,510 | 4,669 | 4,587 | ||||||||||||||||||
| Administration fees | 4,206 | 4,060 | 4,051 | 4,382 | 4,187 | ||||||||||||||||||
| Licensing | 3,968 | 3,554 | 3,340 | 4,687 | 3,753 | ||||||||||||||||||
| Accounting | 3,585 | 3,487 | 3,482 | 3,702 | 3,572 | ||||||||||||||||||
| Legal | 2,500 | 2,500 | 2,500 | 2,500 | 2,500 | ||||||||||||||||||
| Custodian & transfer agent fees | 1,975 | 1,927 | 1,924 | 2,034 | 1,969 | ||||||||||||||||||
| Trustees | 321 | 212 | 274 | 370 | 341 | ||||||||||||||||||
| Registration & filings | 269 | 354 | 276 | 431 | 422 | ||||||||||||||||||
| Other expenses | 12,236 | 12,249 | 12,235 | 12,236 | 12,235 | ||||||||||||||||||
| Total Expenses | 104,926 | 100,484 | 97,322 | 114,651 | 103,456 | ||||||||||||||||||
| Less fees waived: | |||||||||||||||||||||||
| Advisory | (39,686 | ) | (35,535 | ) | (33,403 | ) | (46,867 | ) | (37,529 | ) | |||||||||||||
| Other fees assumed by the Adviser | (8,598 | ) | (13,681 | ) | (15,451 | ) | (1,652 | ) | (12,018 | ) | |||||||||||||
| Net Expenses | 56,642 | 51,268 | 48,468 | 66,132 | 53,909 | ||||||||||||||||||
| Net Investment Income (Loss) | 120,727 | 46,399 | 228,759 | 26,672 | 65,061 | ||||||||||||||||||
| REALIZED AND UNREALIZED GAIN (LOSS) ON INVESTMENTS: | |||||||||||||||||||||||
| Net realized gain (loss) from: | |||||||||||||||||||||||
| Investments | (15,907 | ) | (297,256 | ) | (204,318 | ) | (228,063 | ) | (273,275 | ) | |||||||||||||
| In-kind redemptions | 1,081,203 | 1,163,496 | 605,645 | 701,195 | 194,830 | ||||||||||||||||||
| Net realized gain (loss) | 1,065,296 | 866,240 | 401,327 | 473,132 | (78,445 | ) | |||||||||||||||||
| Net change in unrealized appreciation/depreciation on investments | 1,954,447 | 810,173 | 764,864 | 3,323,475 | 440,110 | ||||||||||||||||||
| Net realized and unrealized gain on investments | 3,019,743 | 1,676,413 | 1,166,191 | 3,796,607 | 361,665 | ||||||||||||||||||
| Net increase in net assets resulting from operations | $ | 3,140,470 | $ | 1,722,812 | $ | 1,394,950 | $ | 3,823,279 | $ | 426,726 | |||||||||||||
* Commencement of Investment Operations.
See Notes to Financial Statements.
44
| PowerShares Dynamic Healthcare Sector Portfolio | PowerShares Dynamic Industrials Sector Portfolio | PowerShares Dynamic Technology Sector Portfolio | PowerShares Dynamic Telecommunications & Wireless Portfolio | PowerShares Dynamic Utilities Portfolio | |||||||||||||||||||
| For the period October 12, 2006* through April 30, 2007 | For the period October 12, 2006* through April 30, 2007 | For the period October 12, 2006* through April 30, 2007 | Year Ended April 30, 2007 | Year Ended April 30, 2007 | |||||||||||||||||||
| INVESTMENT INCOME: | |||||||||||||||||||||||
| Unaffiliated dividend income | $ | 37,680 | $ | 100,432 | $ | 19,855 | $ | 575,772 | $ | 1,426,164 | |||||||||||||
| Affiliated dividend income | 145 | 385 | 10 | — | 1,734 | ||||||||||||||||||
| Total Income | 37,825 | 100,817 | 19,865 | 575,772 | 1,427,898 | ||||||||||||||||||
| EXPENSES: | |||||||||||||||||||||||
| Advisory fees | 47,574 | 49,975 | 44,809 | 151,175 | 240,637 | ||||||||||||||||||
| Audit | 16,500 | 16,500 | 16,500 | 16,500 | 16,500 | ||||||||||||||||||
| Listing fee and expenses | 10,000 | 10,000 | 10,000 | 10,074 | 10,052 | ||||||||||||||||||
| Printing | 5,416 | 6,151 | 5,908 | 15,542 | 25,713 | ||||||||||||||||||
| Offering costs | 4,699 | 4,747 | 4,608 | 9,256 | 1,878 | ||||||||||||||||||
| Administration fees | 4,164 | 4,433 | 4,295 | 54,388 | 59,999 | ||||||||||||||||||
| Licensing | 4,757 | 4,998 | 4,481 | 9,070 | 11,820 | ||||||||||||||||||
| Accounting | 3,557 | 3,736 | 3,644 | 49,737 | 54,998 | ||||||||||||||||||
| Legal | 2,500 | 2,500 | 2,500 | 1,270 | 2,114 | ||||||||||||||||||
| Custodian & transfer agent fees | 1,961 | 2,051 | 2,005 | 7,195 | 7,501 | ||||||||||||||||||
| Trustees | 298 | 385 | 344 | 1,132 | 1,849 | ||||||||||||||||||
| Registration & filings | 345 | 585 | 424 | — | — | ||||||||||||||||||
| Other expenses | 12,236 | 12,819 | 12,236 | 12,394 | 9,472 | ||||||||||||||||||
| Total Expenses | 114,007 | 118,880 | 111,754 | 337,733 | 442,533 | ||||||||||||||||||
| Less fees waived: | |||||||||||||||||||||||
| Advisory | (46,927 | ) | (48,047 | ) | (44,809 | ) | (137,387 | ) | (139,461 | ) | |||||||||||||
| Other fees assumed by the Adviser | — | — | (3,552 | ) | — | — | |||||||||||||||||
| Net Expenses | 67,080 | 70,833 | 63,393 | 200,346 | 303,072 | ||||||||||||||||||
| Net Investment Income (Loss) | (29,255 | ) | 29,984 | (43,528 | ) | 375,426 | 1,124,826 | ||||||||||||||||
| REALIZED AND UNREALIZED GAIN (LOSS) ON INVESTMENTS: | |||||||||||||||||||||||
| Net realized gain (loss) from: | |||||||||||||||||||||||
| Investments | (260,620 | ) | (204,430 | ) | (542,881 | ) | (1,756,414 | ) | (694,192 | ) | |||||||||||||
| In-kind redemptions | 1,145,564 | 916,044 | 609,981 | 4,614,484 | 5,162,055 | ||||||||||||||||||
| Net realized gain (loss) | 884,944 | 711,614 | 67,100 | 2,858,070 | 4,467,863 | ||||||||||||||||||
| Net change in unrealized appreciation/depreciation on investments | 1,141,247 | 1,974,155 | 1,642,264 | 2,042,772 | 5,735,162 | ||||||||||||||||||
| Net realized and unrealized gain on investments | 2,026,191 | 2,685,769 | 1,709,364 | 4,900,842 | 10,203,025 | ||||||||||||||||||
| Net increase in net assets resulting from operations | $ | 1,996,936 | $ | 2,715,753 | $ | 1,665,836 | $ | 5,276,268 | $ | 11,327,851 | |||||||||||||
45
Statements of Changes in Net Assets
| PowerShares Dynamic Basic Materials Sector Portfolio | PowerShares Dynamic Consumer Discretionary Sector Portfolio | PowerShares Dynamic Consumer Staples Sector Portfolio | PowerShares Dynamic Energy Sector Portfolio | PowerShares Dynamic Financial Sector Portfolio | PowerShares Dynamic Healthcare Sector Portfolio | ||||||||||||||||||||||
| For the period October 12, 2006* through April 30, 2007 | For the period October 12, 2006* through April 30, 2007 | For the period October 12, 2006* through April 30, 2007 | For the period October 12, 2006* through April 30, 2007 | For the period October 12, 2006* through April 30, 2007 | For the period October 12, 2006* through April 30, 2007 | ||||||||||||||||||||||
| OPERATIONS: | |||||||||||||||||||||||||||
| Net investment income (loss) | $ | 120,727 | $ | 46,399 | $ | 228,759 | $ | 26,672 | $ | 65,061 | $ | (29,255 | ) | ||||||||||||||
| Net realized gain (loss) on investments | 1,065,296 | 866,240 | 401,327 | 473,132 | (78,445 | ) | 884,944 | ||||||||||||||||||||
| Net change in unrealized appreciation/depreciation of investments | 1,954,447 | 810,173 | 764,864 | 3,323,475 | 440,110 | 1,141,247 | |||||||||||||||||||||
| Net increase in net assets resulting from operations | 3,140,470 | 1,722,812 | 1,394,950 | 3,823,279 | 426,726 | 1,996,936 | |||||||||||||||||||||
| Undistributed net investment income included in the price of units issued and redeemed | 9,184 | (54,343 | ) | 18,869 | — | (10,327 | ) | (34,205 | ) | ||||||||||||||||||
| DISTRIBUTIONS TO SHAREHOLDERS FROM: | |||||||||||||||||||||||||||
| Net investment income | (110,650 | ) | (32,796 | ) | (154,080 | ) | (19,296 | ) | (46,128 | ) | — | ||||||||||||||||
| Tax return of capital | — | — | — | — | — | — | |||||||||||||||||||||
| Total distributions to shareholders | (110,650 | ) | (32,796 | ) | (154,080 | ) | (19,296 | ) | (46,128 | ) | — | ||||||||||||||||
| SHAREHOLDER TRANSACTIONS: | |||||||||||||||||||||||||||
| Proceeds from shares sold | 27,194,924 | 39,571,339 | 23,102,425 | 23,757,197 | 22,623,052 | 68,579,509 | |||||||||||||||||||||
| Value of shares repurchased | (11,236,886 | ) | (24,104,957 | ) | (13,078,964 | ) | (8,423,899 | ) | (15,049,272 | ) | (13,393,410 | ) | |||||||||||||||
| Net income equalization | (9,184 | ) | 54,343 | (18,869 | ) | — | 10,327 | 34,205 | |||||||||||||||||||
| Net increase (decrease) in net assets resulting from share transactions | 15,948,854 | 15,520,725 | 10,004,592 | 15,333,298 | 7,584,107 | 55,220,304 | |||||||||||||||||||||
| Increase in Net Assets | 18,987,858 | 17,156,398 | 11,264,331 | 19,137,281 | 7,954,378 | 57,183,035 | |||||||||||||||||||||
| NET ASSETS: | |||||||||||||||||||||||||||
| Beginning of period | — | — | — | — | — | — | |||||||||||||||||||||
| End of period | $ | 18,987,858 | $ | 17,156,398 | $ | 11,264,331 | $ | 19,137,281 | $ | 7,954,378 | $ | 57,183,035 | |||||||||||||||
| Undistributed net investment income at end of period | $ | 10,077 | $ | 13,617 | $ | 74,679 | $ | 4,453 | $ | 18,933 | $ | — | |||||||||||||||
| CHANGES IN SHARES OUTSTANDING: | |||||||||||||||||||||||||||
| Shares sold | 1,000,000 | 1,500,000 | 900,000 | 900,000 | 900,000 | 2,500,000 | |||||||||||||||||||||
| Shares repurchased | (400,000 | ) | (900,000 | ) | (500,000 | ) | (300,000 | ) | (600,000 | ) | (500,000 | ) | |||||||||||||||
| Shares outstanding, beginning of period | — | — | — | — | — | — | |||||||||||||||||||||
| Shares outstanding, end of period | 600,000 | 600,000 | 400,000 | 600,000 | 300,000 | 2,000,000 | |||||||||||||||||||||
* Commencement of Investment Operations.
See Notes to Financial Statements.
46
| PowerShares Dynamic Industrials Sector Portfolio | PowerShares Dynamic Technology Sector Portfolio | PowerShares Dynamic Telecommunications & Wireless Portfolio | PowerShares Dynamic Utilities Portfolio | ||||||||||||||||||||||||
| For the period October 12, 2006* through April 30, 2007 | For the period October 12, 2006* through April 30, 2007 | For the year ended April 30, 2007 | For the period December 6, 2005* through April 30, 2006 | For the year ended April 30, 2007 | For the period October 26, 2005* through April 30, 2006 | ||||||||||||||||||||||
| OPERATIONS: | |||||||||||||||||||||||||||
| Net investment income (loss) | $ | 29,984 | $ | (43,528 | ) | $ | 375,426 | $ | 85,436 | $ | 1,124,826 | $ | 414,443 | ||||||||||||||
| Net realized gain (loss) on investments | 711,614 | 67,100 | 2,858,070 | 799,175 | 4,467,863 | 1,172,426 | |||||||||||||||||||||
| Net change in unrealized appreciation/depreciation of investments | 1,974,155 | 1,642,264 | 2,042,772 | 2,385,941 | 5,735,162 | 573,208 | |||||||||||||||||||||
| Net increase in net assets resulting from operations | 2,715,753 | 1,665,836 | 5,276,268 | 3,270,552 | 11,327,851 | 2,160,077 | |||||||||||||||||||||
| Undistributed net investment income included in the price of units issued and redeemed | 6,933 | (11,761 | ) | (39,739 | ) | — | 119,398 | (9,333 | ) | ||||||||||||||||||
| DISTRIBUTIONS TO SHAREHOLDERS FROM: | |||||||||||||||||||||||||||
| Net investment income | (30,567 | ) | — | (325,394 | ) | (60,084 | ) | (1,025,489 | ) | (361,097 | ) | ||||||||||||||||
| Tax return of capital | (6,775 | ) | — | — | — | — | — | ||||||||||||||||||||
| Total distributions to shareholders | (37,342 | ) | — | (325,394 | ) | (60,084 | ) | (1,025,489 | ) | (361,097 | ) | ||||||||||||||||
| SHAREHOLDER TRANSACTIONS: | |||||||||||||||||||||||||||
| Proceeds from shares sold | 34,518,651 | 30,855,070 | 30,113,496 | 37,788,226 | 90,348,494 | 45,288,573 | |||||||||||||||||||||
| Value of shares repurchased | (10,787,729 | ) | (10,310,621 | ) | (33,127,001 | ) | (9,330,101 | ) | (63,932,035 | ) | (24,226,893 | ) | |||||||||||||||
| Net income equalization | (6,933 | ) | 11,761 | 39,739 | — | (119,398 | ) | 9,333 | |||||||||||||||||||
| Net increase (decrease) in net assets resulting from share transactions | 23,723,989 | 20,556,210 | (2,973,766 | ) | 28,458,125 | 26,297,061 | 21,071,013 | ||||||||||||||||||||
| Increase in Net Assets | 26,409,333 | 22,210,285 | 1,937,369 | 31,668,593 | 36,718,821 | 22,860,660 | |||||||||||||||||||||
| NET ASSETS: | |||||||||||||||||||||||||||
| Beginning of period | — | — | 31,668,593 | — | 22,860,660 | — | |||||||||||||||||||||
| End of period | $ | 26,409,333 | $ | 22,210,285 | $ | 33,605,962 | $ | 31,668,593 | $ | 59,579,481 | $ | 22,860,660 | |||||||||||||||
| Undistributed net investment income at end of period | $ | — | $ | — | $ | 75,384 | $ | 25,352 | $ | 152,683 | $ | 53,346 | |||||||||||||||
| CHANGES IN SHARES OUTSTANDING: | |||||||||||||||||||||||||||
| Shares sold | 1,300,000 | 1,200,000 | 1,700,000 | 2,500,000 | 5,000,000 | 2,900,000 | |||||||||||||||||||||
| Shares repurchased | (400,000 | ) | (400,000 | ) | (1,900,000 | ) | (600,000 | ) | (3,500,000 | ) | (1,500,000 | ) | |||||||||||||||
| Shares outstanding, beginning of period | — | — | 1,900,000 | — | 1,400,000 | — | |||||||||||||||||||||
| Shares outstanding, end of period | 900,000 | 800,000 | 1,700,000 | 1,900,000 | 2,900,000 | 1,400,000 | |||||||||||||||||||||
47
Financial Highlights
PowerShares Dynamic Basic Materials Sector Portfolio
| For the period October 12, 2006* through April 30, 2007 | |||||||
| PER SHARE OPERATING PERFORMANCE: | |||||||
| Net asset value at beginning of period | $ | 25.56 | |||||
| Net investment income** | 0.24 | ||||||
| Net realized and unrealized gain on investments | 6.03 | ||||||
| Total from operations | 6.27 | ||||||
| Undistributed net investment income included in price of units issued and redeemed** | 0.02 | ||||||
| Distributions to shareholders from: | |||||||
| Net investment income | (0.20 | ) | |||||
| Net asset value at end of period | $ | 31.65 | |||||
| TOTAL RETURN*** | 24.69 | % | |||||
| RATIOS/SUPPLEMENTAL DATA: | |||||||
| Net assets at end of period (000's omitted) | $ | 18,988 | |||||
| Ratio to average net assets of: | |||||||
| Expenses, net of waivers | 0.71 | %† | |||||
| Expenses, prior to waivers | 1.32 | %† | |||||
| Net investment income, net of waivers | 1.52 | %† | |||||
| Portfolio turnover rate †† | 9 | % | |||||
PowerShares Dynamic Consumer Discretionary Sector Portfolio
| For the period October 12, 2006* through April 30, 2007 | |||||||
| PER SHARE OPERATING PERFORMANCE: | |||||||
| Net asset value at beginning of period | $ | 25.43 | |||||
| Net investment income** | 0.09 | ||||||
| Net realized and unrealized gain on investments | 3.34 | ||||||
| Total from operations | 3.43 | ||||||
| Undistributed net investment income included in price of units issued and redeemed** | (0.11 | ) | |||||
| Distributions to shareholders from: | |||||||
| Net investment income | (0.16 | ) | |||||
| Net asset value at end of period | $ | 28.59 | |||||
| TOTAL RETURN*** | 13.11 | % | |||||
| RATIOS/SUPPLEMENTAL DATA: | |||||||
| Net assets at end of period (000's omitted) | $ | 17,156 | |||||
| Ratio to average net assets of: | |||||||
| Expenses, net of waivers | 0.72 | %† | |||||
| Expenses, prior to waivers | 1.41 | %† | |||||
| Net investment income, net of waivers | 0.65 | %† | |||||
| Portfolio turnover rate †† | 20 | % | |||||
* Commencement of Investment Operations.
** Based on average shares outstanding.
*** Total investment return is calculated assuming an initial investment made at the net asset value at the beginning of the period, reinvestment of all dividends and distributions at net asset value during the period, and redemption on the last day of the period. Total investment return calculated for a period of less than one year is not annualized.
† Annualized.
†† Portfolio turnover is not annualized and does not include securities received or delivered from processing creations or redemptions.
See Notes to Financial Statements.
48
Financial Highlights (Continued)
PowerShares Dynamic Consumer Staples Sector Portfolio
| For the period October 12, 2006* through April 30, 2007 | |||||||
| PER SHARE OPERATING PERFORMANCE: | |||||||
| Net asset value at beginning of period | $ | 25.25 | |||||
| Net investment income** | 0.49 | ||||||
| Net realized and unrealized gain on investments | 2.65 | ||||||
| Total from operations | 3.14 | ||||||
| Undistributed net investment income included in price of units issued and redeemed** | 0.04 | ||||||
| Distributions to shareholders from: | |||||||
| Net investment income | (0.27 | ) | |||||
| Net asset value at end of period | $ | 28.16 | |||||
| TOTAL RETURN*** | 12.69 | % | |||||
| RATIOS/SUPPLEMENTAL DATA: | |||||||
| Net assets at end of period (000's omitted) | $ | 11,264 | |||||
| Ratio to average net assets of: | |||||||
| Expenses, net of waivers | 0.73 | %† | |||||
| Expenses, prior to waivers | 1.46 | %† | |||||
| Net investment income, net of waivers | 3.42 | %† | |||||
| Portfolio turnover rate †† | 18 | % | |||||
PowerShares Dynamic Energy Sector Portfolio
| For the period October 12, 2006* through April 30, 2007 | |||||||
| PER SHARE OPERATING PERFORMANCE: | |||||||
| Net asset value at beginning of period | $ | 25.80 | |||||
| Net investment income** | 0.05 | ||||||
| Net realized and unrealized gain on investments | 6.08 | ||||||
| Total from operations | 6.13 | ||||||
| Undistributed net investment income included in price of units issued and redeemed** | — | ||||||
| Distributions to shareholders from: | |||||||
| Net investment income | (0.03 | ) | |||||
| Net asset value at end of period | $ | 31.90 | |||||
| TOTAL RETURN*** | 23.78 | % | |||||
| RATIOS/SUPPLEMENTAL DATA: | |||||||
| Net assets at end of period (000's omitted) | $ | 19,137 | |||||
| Ratio to average net assets of: | |||||||
| Expenses, net of waivers | 0.71 | %† | |||||
| Expenses, prior to waivers | 1.22 | %† | |||||
| Net investment income, net of waivers | 0.28 | %† | |||||
| Portfolio turnover rate †† | 12 | % | |||||
* Commencement of Investment Operations.
** Based on average shares outstanding.
*** Total investment return is calculated assuming an initial investment made at the net asset value at the beginning of the period, reinvestment of all dividends and distributions at net asset value during the period, and redemption on the last day of the period. Total investment return calculated for a period of less than one year is not annualized.
† Annualized.
†† Portfolio turnover is not annualized and does not include securities received or delivered from processing creations or redemptions.
See Notes to Financial Statements.
49
Financial Highlights (Continued)
PowerShares Dynamic Financial Sector Portfolio
| For the period October 12, 2006* through April 30, 2007 | |||||||
| PER SHARE OPERATING PERFORMANCE: | |||||||
| Net asset value at beginning of period | $ | 25.16 | |||||
| Net investment income** | 0.13 | ||||||
| Net realized and unrealized gain on investments | 1.33 | ||||||
| Total from operations | 1.46 | ||||||
| Undistributed net investment income included in price of units issued and redeemed** | (0.02 | ) | |||||
| Distributions to shareholders from: | |||||||
| Net investment income | (0.09 | ) | |||||
| Net asset value at end of period | $ | 26.51 | |||||
| TOTAL RETURN*** | 5.72 | % | |||||
| RATIOS/SUPPLEMENTAL DATA: | |||||||
| Net assets at end of period (000's omitted) | $ | 7,954 | |||||
| Ratio to average net assets of: | |||||||
| Expenses, net of waivers | 0.72 | %† | |||||
| Expenses, prior to waivers | 1.38 | %† | |||||
| Net investment income, net of waivers | 0.87 | %† | |||||
| Portfolio turnover rate †† | 33 | % | |||||
PowerShares Dynamic Healthcare Sector Portfolio
| For the period October 12, 2006* through April 30, 2007 | |||||||
| PER SHARE OPERATING PERFORMANCE: | |||||||
| Net asset value at beginning of period | $ | 25.01 | |||||
| Net investment loss** | (0.04 | ) | |||||
| Net realized and unrealized gain on investments | 3.67 | ||||||
| Total from operations | 3.63 | ||||||
| Undistributed net investment income included in price of units issued and redeemed** | (0.05 | ) | |||||
| Net asset value at end of period | $ | 28.59 | |||||
| TOTAL RETURN*** | 14.31 | % | |||||
| RATIOS/SUPPLEMENTAL DATA: | |||||||
| Net assets at end of period (000's omitted) | $ | 57,183 | |||||
| Ratio to average net assets of: | |||||||
| Expenses, net of waivers | 0.71 | %† | |||||
| Expenses, prior to waivers | 1.20 | %† | |||||
| Net investment loss, net of waivers | (0.31 | )%† | |||||
| Portfolio turnover rate †† | 14 | % | |||||
* Commencement of Investment Operations.
** Based on average shares outstanding.
*** Total investment return is calculated assuming an initial investment made at the net asset value at the beginning of the period, reinvestment of all dividends and distributions at net asset value during the period, and redemption on the last day of the period. Total investment return calculated for a period of less than one year is not annualized.
† Annualized.
†† Portfolio turnover is not annualized and does not include securities received or delivered from processing creations or redemptions.
See Notes to Financial Statements.
50
Financial Highlights (Continued)
PowerShares Dynamic Industrials Sector Portfolio
| For the period October 12, 2006* through April 30, 2007 | |||||||
| PER SHARE OPERATING PERFORMANCE: | |||||||
| Net asset value at beginning of period | $ | 25.72 | |||||
| Net investment income** | 0.04 | ||||||
| Net realized and unrealized gain on investments | 3.62 | ||||||
| Total from operations | 3.66 | ||||||
| Undistributed net investment income included in price of units issued and redeemed** | 0.01 | ||||||
| Distributions to shareholders from: | |||||||
| Net investment income | (0.04 | ) | |||||
| Tax return of capital | (0.01 | ) | |||||
| Total distributions | (0.05 | ) | |||||
| Net asset value at end of period | $ | 29.34 | |||||
| TOTAL RETURN*** | 14.28 | % | |||||
| RATIOS/SUPPLEMENTAL DATA: | |||||||
| Net assets at end of period (000's omitted) | $ | 26,409 | |||||
| Ratio to average net assets of: | |||||||
| Expenses, net of waivers | 0.71 | %† | |||||
| Expenses, prior to waivers | 1.19 | %† | |||||
| Net investment income, net of waivers | 0.30 | %† | |||||
| Portfolio turnover rate †† | 14 | % | |||||
PowerShares Dynamic Technology Sector Portfolio
| For the period October 12, 2006* through April 30, 2007 | |||||||
| PER SHARE OPERATING PERFORMANCE: | |||||||
| Net asset value at beginning of period | $ | 25.54 | |||||
| Net investment loss** | (0.07 | ) | |||||
| Net realized and unrealized gain on investments | 2.31 | ||||||
| Total from operations | 2.24 | ||||||
| Undistributed net investment income included in price of units issued and redeemed** | (0.02 | ) | |||||
| Net asset value at end of period | $ | 27.76 | |||||
| TOTAL RETURN*** | 8.69 | % | |||||
| RATIOS/SUPPLEMENTAL DATA: | |||||||
| Net assets at end of period (000's omitted) | $ | 22,210 | |||||
| Ratio to average net assets of: | |||||||
| Expenses, net of waivers | 0.71 | %† | |||||
| Expenses, prior to waivers | 1.25 | %† | |||||
| Net investment loss, net of waivers | (0.49 | )%† | |||||
| Portfolio turnover rate †† | 27 | % | |||||
* Commencement of Investment Operations.
** Based on average shares outstanding.
*** Total investment return is calculated assuming an initial investment made at the net asset value at the beginning of the period, reinvestment of all dividends and distributions at net asset value during the period, and redemption on the last day of the period. Total investment return calculated for a period of less than one year is not annualized.
† Annualized.
†† Portfolio turnover is not annualized and does not include securities received or delivered from processing creations or redemptions.
See Notes to Financial Statements.
51
Financial Highlights (Continued)
PowerShares Dynamic Telecommunications & Wireless Portfolio
| For the year ended April 30, 2007 | For the period December 6, 2005* through April 30, 2006 | ||||||||||
| PER SHARE OPERATING PERFORMANCE: | |||||||||||
| Net asset value at beginning of period | $ | 16.67 | $ | 14.95 | |||||||
| Net investment income** | 0.22 | 0.05 | |||||||||
| Net realized and unrealized gain on investments | 3.10 | 1.70 | |||||||||
| Total from operations | 3.32 | 1.75 | |||||||||
| Undistributed net investment income included in price of units issued and redeemed** | (0.02 | ) | — | ||||||||
| Distributions to shareholders from: | |||||||||||
| Net investment income | (0.20 | ) | (0.03 | ) | |||||||
| Net asset value at end of period | $ | 19.77 | $ | 16.67 | |||||||
| TOTAL RETURN*** | 19.93 | % | 11.74 | % | |||||||
| RATIOS/SUPPLEMENTAL DATA: | |||||||||||
| Net assets at end of period (000's omitted) | $ | 33,606 | $ | 31,669 | |||||||
| Ratio to average net assets of: | |||||||||||
| Expenses, net of waivers | 0.66 | % | 0.67 | %† | |||||||
| Expenses, prior to waivers | 1.12 | % | 0.97 | %† | |||||||
| Net investment income, net of waivers | 1.24 | % | 0.79 | %† | |||||||
| Portfolio turnover rate †† | 43 | % | 3 | % | |||||||
PowerShares Dynamic Utilities Portfolio
| For the year ended April 30, 2007 | For the period October 26, 2005* through April 30, 2006 | ||||||||||
| PER SHARE OPERATING PERFORMANCE: | |||||||||||
| Net asset value at beginning of period | $ | 16.33 | $ | 15.32 | |||||||
| Net investment income** | 0.44 | 0.24 | |||||||||
| Net realized and unrealized gain on investments | 4.11 | 0.97 | |||||||||
| Total from operations | 4.55 | 1.21 | |||||||||
| Undistributed net investment income included in price of units issued and redeemed** | 0.05 | (0.01 | ) | ||||||||
| Distributions to shareholders from: | |||||||||||
| Net investment income | (0.39 | ) | (0.19 | ) | |||||||
| Net asset value at end of period | $ | 20.54 | $ | 16.33 | |||||||
| TOTAL RETURN*** | 28.48 | % | 7.82 | % | |||||||
| RATIOS/SUPPLEMENTAL DATA: | |||||||||||
| Net assets at end of period (000's omitted) | $ | 59,579 | $ | 22,861 | |||||||
| Ratio to average net assets of: | |||||||||||
| Expenses, net of waivers | 0.63 | % | 0.69 | %† | |||||||
| Expenses, prior to waivers | 0.92 | % | 0.89 | %† | |||||||
| Net investment income, net of waivers | 2.34 | % | 2.62 | %† | |||||||
| Portfolio turnover rate †† | 39 | % | 38 | % | |||||||
* Commencement of Investment Operations.
** Based on average shares outstanding.
*** Total investment return is calculated assuming an initial investment made at the net asset value at the beginning of the period, reinvestment of all dividends and distributions at net asset value during the period, and redemption on the last day of the period. Total investment return calculated for a period of less than one year is not annualized.
† Annualized.
†† Portfolio turnover is not annualized and does not include securities received or delivered from processing creations or redemptions.
See Notes to Financial Statements.
52
Notes to Financial Statements
PowerShares Exchange-Traded Fund Trust
April 30, 2007
Note 1. Organization
PowerShares Exchange-Traded Fund Trust (the "Trust"), which is registered under the Investment Company Act of 1940, as amended (the "1940 Act"), is an exchange-traded, management investment company that was organized as a Massachusetts business trust on June 9, 2000. The Trust currently consists of seventy portfolios. This report includes the following portfolios:
| PowerShares Dynamic Basic Materials Sector Portfolio | "Dynamic Basic Materials Sector Portfolio" | ||||||
| PowerShares Dynamic Consumer Discretionary Sector Portfolio | "Dynamic Consumer Discretionary Sector Portfolio" | ||||||
| PowerShares Dynamic Consumer Staples Sector Portfolio | "Dynamic Consumer Staples Sector Portfolio" | ||||||
| PowerShares Dynamic Energy Sector Portfolio | "Dynamic Energy Sector Portfolio" | ||||||
| PowerShares Dynamic Financial Sector Portfolio | "Dynamic Financial Sector Portfolio" | ||||||
| PowerShares Dynamic Healthcare Sector Portfolio | "Dynamic Healthcare Sector Portfolio" | ||||||
| PowerShares Dynamic Industrials Sector Portfolio | "Dynamic Industrials Sector Portfolio" | ||||||
| PowerShares Dynamic Technology Sector Portfolio | "Dynamic Technology Sector Portfolio" | ||||||
| PowerShares Dynamic Telecommunications & Wireless Portfolio | "Dynamic Telecommunications & Wireless Portfolio" | ||||||
| PowerShares Dynamic Utilities Portfolio | "Dynamic Utilities Portfolio" | ||||||
All Portfolios except Dynamic Telecommunications & Wireless Portfolio and Dynamic Utilities Portfolio commenced investment operations on October 12, 2006.
Each portfolio represents a separate series of the Trust (the "Fund" or "Funds"). Each Fund's shares are listed and traded on the American Stock Exchange. The Funds' market prices may differ to some degree from the net asset value of the shares of each Fund. Unlike conventional mutual funds, each Fund issues and redeems shares on a continuous basis, at net asset value, only in a large specified number of shares, each called a "Creation Unit." Creation Units are issued and redeemed principally in-kind for securities included in the relevant index. Except when aggregated in Creation Units, shares are not individually redeemable securities of the Funds. The investment objective of each Fund is to seek investment results that correspond generally to the price and yield (before the Fund's fees and expenses) of the following equity indices:
| Fund | Index | ||||||
| Dynamic Basic Materials Sector Portfolio | Dynamic Basic Materials Sector IntellidexSM Index | ||||||
| Dynamic Consumer Discretionary Sector Portfolio | Dynamic Consumer Discretionary Sector IntellidexSM Index | ||||||
| Dynamic Consumer Staples Sector Portfolio | Dynamic Consumer Staples Sector IntellidexSM Index | ||||||
| Dynamic Energy Sector Portfolio | Dynamic Energy Sector IntellidexSM Index | ||||||
| Dynamic Financial Sector Portfolio | Dynamic Financial Sector IntellidexSM Index | ||||||
| Dynamic Healthcare Sector Portfolio | Dynamic Healthcare Sector IntellidexSM Index | ||||||
| Dynamic Industrials Sector Portfolio | Dynamic Industrials Sector IntellidexSM Index | ||||||
| Dynamic Technology Sector Portfolio | Dynamic Technology Sector IntellidexSM Index | ||||||
| Dynamic Telecommunications & Wireless Portfolio | Dynamic Telecommunications & Wireless IntellidexSM Index | ||||||
| Dynamic Utilities Portfolio | Dynamic Utilities IntellidexSM Index | ||||||
53
Notes to Financial Statements (Continued)
PowerShares Exchange-Traded Fund Trust
April 30, 2007
Note 2. Significant Accounting Policies
The preparation of the financial statements in accordance with accounting principles generally accepted in the United States of America requires management to make estimates and assumptions that affect the reported amounts and disclosures in the financial statements. Actual results could differ from these estimates.
A. Security Valuation
Securities are valued based on their last sale price. Price information on listed securities is taken from the exchange where the security is primarily traded. Securities regularly traded in an over-the-counter market are valued at the latest quoted sale price in such market or in the case of NASDAQ, at the NASDAQ official closing price. Other portfolio securities and assets for which market quotations are not readily available are valued at fair value as determined in good faith by the Trust's Pricing Committee in accordance with procedures adopted by the Board of Trustees. Investments in money market mutual funds are stated at net asset value.
B. Federal Income Taxes
Each Fund intends to comply with the provisions of the Internal Revenue Code applicable to regulated investment companies and will distribute all net investment income and net taxable capital gains to its shareholders. Therefore, no provision for Federal income taxes is required.
Income and capital gain distributions are determined in accordance with Federal income tax regulations, which may differ from accounting principles generally accepted in the United States. These differences are primarily due to differing book and tax treatments for in-kind transactions, losses deferred due to wash sales, losses deferred due to post-October losses and excise tax regulations.
C. Investment Income and Investment Transactions
Dividend income is recorded on the ex-dividend date. Interest income is recorded on the accrual basis. Investment transactions are recorded on the trade date. Realized gains and losses from the sale or disposition of securities are calculated on the specific identified cost basis. Corporate actions (including cash dividends) are recorded net of nonreclaimable foreign tax withholdings on the ex-dividend date.
D. Expenses
Expenses of the Trust, which are directly identifiable to a specific Fund, are applied to that Fund. Expenses which are not readily identifiable to a specific Fund are allocated in such a manner as deemed equitable, taking into consideration the nature and type of expense and the relative net assets of each Fund.
E. Dividends and Distributions to Shareholders
Each Fund declares and pays dividends from net investment income to its shareholders quarterly and distributes net realized taxable capital gains, if any, annually. Such distributions on a tax basis are determined in conformity with income tax regulations which may differ from accounting principles generally accepted in the United States of America. Distributions in excess of tax basis earnings and profits, if any, are reported in each Fund's financial statements as a return of capital.
F. Equalization
Beginning May 1, 2006 (or since inception, if later), all Funds use the accounting practice of equalization. Prior to that date, only Dynamic Utilities Portfolio practiced equalization. This accounting method is used to keep the continuing shareholder's per share equity in undistributed net investment income from being affected by the continuous sales and redemptions of capital shares. Equalization is calculated on a per share basis whereby a portion of the proceeds from the sales and cost of repurchases of capital shares is
54
Notes to Financial Statements (Continued)
PowerShares Exchange-Traded Fund Trust
April 30, 2007
applied to undistributed net investment income. The amount of equalization is disclosed in the Statements of Changes in Net Assets as undistributed net investment income included in the price of capital shares issued or redeemed. The distributions to shareholders of amounts so applied may be deemed to be a return of capital for tax purposes to the extent that such distributions exceed taxable income.
Note 3. Advisory and Administration Agreements
PowerShares Capital Management LLC (the "Adviser") has overall responsibility as the Funds' investment adviser for the selection and ongoing monitoring of the Funds' investments, managing the Funds' business affairs and providing certain clerical, bookkeeping and other administrative services. The fees paid by each Fund to the Adviser are accrued daily and are payable at 0.50% per annum on each Fund's average daily net assets.
Each Fund is responsible for all of its expenses, including the investment advisory fees, costs of transfer agency, custody, fund administration, legal, audit and other services, interest, taxes, brokerage commissions and other expenses connected with executions of portfolio transactions, any distribution fees or expenses and extraordinary expenses. Pursuant to the Investment Advisory Agreement with the Trust, the Adviser has agreed to waive fees and/or pay Fund expenses to the extent necessary to prevent the operating expenses of the Funds (excluding interest expense, brokerage commissions and other trading expenses, licensing fees, offering costs, taxes and extraordinary expenses) from exceeding 0.60% of average daily net assets per year (the "Expense Cap"), at least until April 30, 2008. Offering costs excluded from the Expense Cap are: (a) legal fees pertaining to the Funds' shares offered for sale; (b) Securities and Exchan ge Commission and state registration fees; and (c) initial fees paid to be listed on an exchange.
For the period ended April 30, 2007, the Adviser waived and assumed the following fees and expenses:
| Fees Waived | Expenses Assumed | ||||||||||
| Dynamic Basic Materials Sector Portfolio | $ | 39,686 | $ | 8,598 | |||||||
| Dynamic Consumer Discretionary Sector Portfolio | 35,535 | 13,681 | |||||||||
| Dynamic Consumer Staples Sector Portfolio | 33,403 | 15,451 | |||||||||
| Dynamic Energy Sector Portfolio | 46,867 | 1,652 | |||||||||
| Dynamic Financial Sector Portfolio | 37,529 | 12,018 | |||||||||
| Dynamic Healthcare Sector Portfolio | 46,927 | — | |||||||||
| Dynamic Industrials Sector Portfolio | 48,047 | — | |||||||||
| Dynamic Technology Sector Portfolio | 44,809 | 3,552 | |||||||||
| Dynamic Telecommunications & Wireless Portfolio | 137,387 | — | |||||||||
| Dynamic Utilities Portfolio | 139,461 | — | |||||||||
The Trust and the Adviser have entered into an Excess Expense Agreement (the "Expense Agreement") in which expenses borne by the Adviser are subject to reimbursement by the Fund up to three years from the date the fee or expense was incurred, but no reimbursement payment will be made by the Fund if it would result in the Fund exceeding its Expense Cap as specified above.
55
Notes to Financial Statements (Continued)
PowerShares Exchange-Traded Fund Trust
April 30, 2007
During the period ended April 30, 2007, the details of expense waivers and reimbursements to the Adviser under the Expense Agreement was as follows:
| Gross Waivers | Gross Reimbursements | Net Waivers | |||||||||||||
| Dynamic Industrials Sector Portfolio | $ | (48,574 | ) | $ | 527 | $ | (48,047 | ) | |||||||
The net amounts of waivers or reimbursements are also shown on the Statements of Operations.
The amounts subject to reimbursement to the Adviser at April 30, 2007 are as follows:
| Reimbursements available during the fiscal years ending: | |||||||||||||||
| 04/30/08 | 04/30/09 | 04/30/10 | |||||||||||||
| Dynamic Basic Materials Sector Portfolio | $ | 48,284 | $ | 48,284 | $ | 48,284 | |||||||||
| Dynamic Consumer Discretionary Sector Portfolio | 49,216 | 49,216 | 49,216 | ||||||||||||
| Dynamic Consumer Staples Sector Portfolio | 48,854 | 48,854 | 48,854 | ||||||||||||
| Dynamic Energy Sector Portfolio | 48,519 | 48,519 | 48,519 | ||||||||||||
| Dynamic Financial Sector Portfolio | 49,547 | 49,547 | 49,547 | ||||||||||||
| Dynamic Healthcare Sector Portfolio | 46,927 | 46,927 | 46,927 | ||||||||||||
| Dynamic Industrials Sector Portfolio | 48,047 | 48,047 | 48,047 | ||||||||||||
| Dynamic Technology Sector Portfolio | 48,361 | 48,361 | 48,361 | ||||||||||||
| Dynamic Telecommunications & Wireless Portfolio | 170,079 | 170,079 | 137,387 | ||||||||||||
| Dynamic Utilities Portfolio | 170,755 | 170,755 | 139,461 | ||||||||||||
Distribution Agreement
Effective September 18, 2006 (or since inception, if later), A I M Distributors, Inc. (the "Distributor") serves as the distributor of Creation Units of each Fund pursuant to a Distribution Agreement between the Distributor and the Trust. The Distributor does not maintain a secondary market in shares. Prior to September 18, 2006, ALPS Distributors, Inc. served as the distributor.
The Board of Trustees of the Trust has adopted a distribution plan pursuant to Rule 12b-1 under the 1940 Act. In accordance with the Rule 12b-1 plan, each Fund is authorized to pay an amount up to a maximum annual rate of 0.25% of the average daily net assets for certain distribution-related activities. No 12b-1 fees are currently charged to the Funds, and there are no plans to impose these fees.
Licensing Fee Agreements
The Adviser has entered into licensing agreements for each Fund with the American Stock Exchange (the "Licensor"). The trademarks are owned by the Licensor. These trademarks have been licensed to the Adviser for use with the Funds. The Funds are not sponsored, endorsed, sold or promoted by the Licensor and the Licensor makes no representation regarding the advisability of investing in any of these Funds. The Funds are required to pay the licensing fees, which are shown on the Statements of Operations.
The Bank of New York serves as the administrator, custodian and fund accounting and transfer agent for each Fund.
56
Notes to Financial Statements (Continued)
PowerShares Exchange-Traded Fund Trust
April 30, 2007
Note 4. INVESCO Transaction and Transactions with Affiliates
On September 18, 2006, INVESCO PLC (formerly AMVESCAP PLC) and A I M Management Group, Inc., an indirect wholly-owned subsidiary of INVESCO, PLC announced that they had completed their acquisition of the Adviser (the "Acquisition"). The Board of Trustees, including a majority of the independent Trustees, and shareholders of each Fund had previously approved a new advisory agreement with the Adviser that became effective on September 18, 2006.
The Funds are permitted to invest daily available cash balances in affiliated money market funds. The Funds invest in the Liquid Assets Portfolio ("LAP") of the Short-Term Investments. LAP is advised by A I M Advisors, Inc., an affiliate of the Adviser.
Note 5. Federal Income Tax
At April 30, 2007, the components of accumulated earnings/loss on a tax-basis were as follows:
| Accumulated Earnings | Net Accumulated Capital and other Gains/Losses | Unrealized Appreciation | Gross Unrealized Appreciation | Gross Unrealized Depreciation | Total Accumulated Earnings/Loss | ||||||||||||||||||||||
| Dynamic Basic Materials Sector Portfolio | $ | 10,077 | $ | — | $ | 1,954,093 | $ | 2,042,250 | $ | (88,157 | ) | $ | 1,964,170 | ||||||||||||||
| Dynamic Consumer Discretionary Sector Portfolio | 13,617 | — | 810,173 | 1,030,324 | (220,151 | ) | 823,790 | ||||||||||||||||||||
| Dynamic Consumer Staples Sector Portfolio | 74,679 | — | 688,422 | 843,871 | (155,449 | ) | 763,101 | ||||||||||||||||||||
| Dynamic Energy Sector Portfolio | 4,453 | — | 3,326,233 | 3,352,709 | (26,476 | ) | 3,330,686 | ||||||||||||||||||||
| Dynamic Financial Sector Portfolio | 18,933 | — | 440,110 | 549,957 | (109,847 | ) | 459,043 | ||||||||||||||||||||
| Dynamic Healthcare Sector Portfolio | — | — | 1,141,247 | 1,746,894 | (605,647 | ) | 1,141,247 | ||||||||||||||||||||
| Dynamic Industrials Sector Portfolio | — | — | 1,974,155 | 2,185,247 | (211,092 | ) | 1,974,155 | ||||||||||||||||||||
| Dynamic Technology Sector Portfolio | — | — | 1,642,264 | 1,939,479 | (297,215 | ) | 1,642,264 | ||||||||||||||||||||
| Dynamic Telecommunications & Wireless Portfolio | 75,384 | (1,394,222 | ) | 4,423,754 | 4,762,235 | (338,481 | ) | 3,104,916 | |||||||||||||||||||
| Dynamic Utilities Portfolio | 152,683 | (430,964 | ) | 6,308,072 | 6,418,141 | (110,069 | ) | 6,029,791 | |||||||||||||||||||
At April 30, 2007, the cost of investments for Federal income tax purposes was as follows:
| Dynamic Basic Materials Sector Portfolio | $ | 17,095,621 | |||||
| Dynamic Consumer Discretionary Sector Portfolio | 16,420,648 | ||||||
| Dynamic Consumer Staples Sector Portfolio | 10,635,692 | ||||||
| Dynamic Energy Sector Portfolio | 15,888,570 | ||||||
| Dynamic Financial Sector Portfolio | 7,590,254 | ||||||
| Dynamic Healthcare Sector Portfolio | 56,156,176 | ||||||
| Dynamic Industrials Sector Portfolio | 24,493,039 | ||||||
| Dynamic Technology Sector Portfolio | 20,610,469 | ||||||
| Dynamic Telecommunications & Wireless Portfolio | 29,206,021 | ||||||
| Dynamic Utilities Portfolio | 53,177,103 | ||||||
57
Notes to Financial Statements (Continued)
PowerShares Exchange-Traded Fund Trust
April 30, 2007
Distributions to Shareholders:
The tax character of distributions paid during the period ended April 30, 2007 was as follows:
| Distributions paid from Ordinary Income | |||||||
| Dynamic Basic Materials Sector Portfolio | $ | 110,650 | |||||
| Dynamic Consumer Discretionary Sector Portfolio | 32,796 | ||||||
| Dynamic Consumer Staples Sector Portfolio | 154,080 | ||||||
| Dynamic Energy Sector Portfolio | 19,296 | ||||||
| Dynamic Financial Sector Portfolio | 46,128 | ||||||
| Dynamic Industrials Sector Portfolio | 30,567 | ||||||
| Dynamic Telecommunications & Wireless Portfolio | 325,394 | ||||||
| Dynamic Utilities Portfolio | 1,025,489 | ||||||
| Distributions paid from Return of Capital | |||||||
| Dynamic Industrials Sector Portfolio | $ | 6,775 | |||||
The tax character of distributions paid during the period ended April 30, 2006 was as follows:
| Distributions paid from Ordinary Income | |||||||
| Dynamic Telecommunications & Wireless Portfolio | $ | 60,084 | |||||
| Dynamic Utilities Portfolio | 361,097 | ||||||
At April 30, 2007, for Federal income tax purposes, the Funds have capital loss carryforwards available as shown in the table below, to the extent provided by the regulations, to offset future capital gains through the years indicated. To the extent that these loss carryforwards are used to offset future capital gains, it is probable that the capital gains so offset will not be distributed to shareholders.
| Capital Loss Available Through | Total | ||||||||||||||||||||||||||
| 2011 | 2012 | 2013 | 2014 | 2015 | Amount | ||||||||||||||||||||||
| Dynamic Telecommunications & Wireless Portfolio | $ | — | $ | — | $ | — | $ | — | $ | 1,394,222 | $ | 1,394,222 | |||||||||||||||
| Dynamic Utilities Portfolio | — | — | — | — | 430,964 | 430,964 | |||||||||||||||||||||
During the period ended April 30, 2007, the Funds incurred and will elect to defer net capital losses as follows:
| Post-October Losses | |||||||
| Dynamic Basic Materials Sector Portfolio | $ | 15,553 | |||||
| Dynamic Consumer Discretionary Sector Portfolio | 297,256 | ||||||
| Dynamic Consumer Staples Sector Portfolio | 127,876 | ||||||
58
Notes to Financial Statements (Continued)
PowerShares Exchange-Traded Fund Trust
April 30, 2007
| Post-October Losses | |||||||
| Dynamic Energy Sector Portfolio | $ | 228,063 | |||||
| Dynamic Financial Sector Portfolio | 273,275 | ||||||
| Dynamic Healthcare Sector Portfolio | 260,620 | ||||||
| Dynamic Industrials Sector Portfolio | 204,430 | ||||||
| Dynamic Technology Sector Portfolio | 542,881 | ||||||
| Dynamic Telecommunications & Wireless Portfolio | 408,322 | ||||||
| Dynamic Utilities Portfolio | 475,905 | ||||||
At April 30, 2007, the following reclassifications were made to the capital accounts of the Funds, to reflect permanent book/tax differences and income and gains available for distributions under income tax regulations, which are primarily due to the differences between book and tax treatment of investments in real estate investment trusts, investments in partnerships, wash sales from redemption in-kind transactions, redemption in-kind transactions, return of capital and net investment losses. Net investment income, net realized gains and net assets were not affected by these changes.
| Undistributed Net Investment Income (Loss) | (Accumulated Losses) | Paid in Capital | |||||||||||||
| Dynamic Basic Materials Sector Portfolio | $ | (9,184 | ) | $ | (1,081,203 | ) | $ | 1,090,387 | |||||||
| Dynamic Consumer Discretionary Sector Portfolio | 54,357 | (1,163,496 | ) | 1,109,139 | |||||||||||
| Dynamic Consumer Staples Sector Portfolio | (18,869 | ) | (605,645 | ) | 624,514 | ||||||||||
| Dynamic Energy Sector Portfolio | (2,923 | ) | (698,437 | ) | 701,360 | ||||||||||
| Dynamic Financial Sector Portfolio | 10,327 | (194,830 | ) | 184,503 | |||||||||||
| Dynamic Healthcare Sector Portfolio | 63,460 | (1,145,564 | ) | 1,082,104 | |||||||||||
| Dynamic Industrials Sector Portfolio | 425 | (916,044 | ) | 915,619 | |||||||||||
| Dynamic Technology Sector Portfolio | 55,289 | (609,981 | ) | 554,692 | |||||||||||
| Dynamic Telecommunications & Wireless Portfolio | 39,739 | (4,608,954 | ) | 4,569,215 | |||||||||||
| Dynamic Utilities Portfolio | (119,398 | ) | (5,162,055 | ) | 5,281,453 | ||||||||||
Note 6. Investment Transactions
For the period ended April 30, 2007, the cost of securities purchased and proceeds from sales of securities, excluding short-term securities and in-kind transactions, were as follows:
| Purchases | Sales | ||||||||||
| Dynamic Basic Materials Sector Portfolio | $ | 1,334,529 | $ | 1,834,001 | |||||||
| Dynamic Consumer Discretionary Sector Portfolio | 2,748,914 | 2,793,417 | |||||||||
| Dynamic Consumer Staples Sector Portfolio | 2,261,517 | 2,284,123 | |||||||||
| Dynamic Energy Sector Portfolio | 2,086,565 | 2,164,439 | |||||||||
| Dynamic Financial Sector Portfolio | 4,855,088 | 4,337,028 | |||||||||
| Dynamic Healthcare Sector Portfolio | 2,964,765 | 2,832,569 | |||||||||
| Dynamic Industrials Sector Portfolio | 2,721,803 | 2,896,826 | |||||||||
| Dynamic Technology Sector Portfolio | 4,469,805 | 4,420,572 | |||||||||
| Dynamic Telecommunications & Wireless Portfolio | 12,909,042 | 12,961,402 | |||||||||
| Dynamic Utilities Portfolio | 19,286,778 | 18,572,470 | |||||||||
59
Notes to Financial Statements (Continued)
PowerShares Exchange-Traded Fund Trust
April 30, 2007
For the period ended April 30, 2007, in-kind transactions were as follows:
| Purchases | Sales | ||||||||||
| Dynamic Basic Materials Sector Portfolio | $ | 26,885,714 | $ | 10,388,188 | |||||||
| Dynamic Consumer Discretionary Sector Portfolio | 36,895,582 | 21,341,746 | |||||||||
| Dynamic Consumer Staples Sector Portfolio | 20,766,256 | 10,680,201 | |||||||||
| Dynamic Energy Sector Portfolio | 23,066,107 | 7,601,318 | |||||||||
| Dynamic Financial Sector Portfolio | 21,282,339 | 14,178,342 | |||||||||
| Dynamic Healthcare Sector Portfolio | 67,806,967 | 12,681,970 | |||||||||
| Dynamic Industrials Sector Portfolio | 36,236,578 | 12,301,348 | |||||||||
| Dynamic Technology Sector Portfolio | 30,383,379 | 9,889,243 | |||||||||
| Dynamic Telecommunications & Wireless Portfolio | 30,028,636 | 32,859,792 | |||||||||
| Dynamic Utilities Portfolio | 88,056,490 | 62,305,600 | |||||||||
There were no purchases or sales of U.S. government or government agency obligations for the period ended April 30, 2007. Gains on in-kind transactions are not considered taxable gains for Federal income tax purposes.
Note 7. Trustees' Fees
The Trust compensates each Trustee who is not an employee of the Adviser or its affiliates. The interested Trustee does not receive any Trustees' fees.
Note 8. Capital
Shares are created and redeemed by the Trust only in Creation Unit size aggregations of 100,000. Transaction fees at scheduled amounts to $500 per Creation Unit are charged to those persons creating or redeeming Creation Units. Such transactions are generally permitted on an in-kind basis, with a balancing cash component to equate the transaction to the net asset value per unit of each Fund of the Trust on the transaction date.
Note 9. Risk of Concentration
The Funds concentrate their investments in certain industries, subjecting them to greater risk than funds that invest in a wider range of industries.
Note 10. Indemnifications
Under the Trust's organizational documents, its Officers and Trustees are indemnified against certain liabilities arising out of the performance of their duties to the Trust. Additionally, in the normal course of business, the Trust enters into contracts with service providers that contain general indemnification clauses. The Trust's maximum exposure under these arrangements is unknown, as this would involve future claims that may be made against the Trust that have not yet occurred. However, based on experience, the Trust believes the risk of loss to be remote.
60
Notes to Financial Statements (Continued)
PowerShares Exchange-Traded Fund Trust
April 30, 2007
Note 11. New Accounting Pronouncements
On July 13, 2006, the Financial Accounting Standards Board ("FASB") issued FASB Interpretation No. 48, Accounting for Uncertainty in Income Taxes ("FIN 48"). FIN 48 prescribes a recognition threshold and measurement attribute for the financial statement recognition and measurement for a tax position taken or expected to be taken in a tax return. FIN 48 also provides guidance on derecognition, classification, interest and penalties, accounting in interim periods, disclosure and transition. On December 22, 2006, the Securities and Exchange Commission delayed the effective date of Fin 48, which will result in adoption for the Funds as of October 31, 2007. At this time, management is currently assessing the impact of Fin 40, if any, on the Funds' financial statements.
On September 20, 2006, the FASB released Statement of Financial Accounting Standards No. 157 "Fair Value Measurement" ("FAS 157"). FAS 157 establishes an authoritative definition of fair value, sets out a framework for measuring fair value, and requires additional disclosures about fair-value measurement. The application of FAS 157 is required for fiscal years beginning after November 15, 2007 and interim periods within those fiscal years. At this time, management is currently assessing the impact of FAS 157, if any, on the Funds' financial statements and intends for the Funds to adopt FAS 157 provisions during the fiscal year ending April 30, 2009.
61
Report of Independent Registered Public Accounting Firm
To the Board of Trustees and Shareholders of PowerShares Exchange-Traded Fund Trust:
In our opinion, the accompanying statements of assets and liabilities, including the portfolios of investments, and the related statements of operations and of changes in net assets and the financial highlights present fairly, in all material respects, the financial position of the portfolios indicated in Note 1 of the financial statements comprising PowerShares Exchange-Traded Fund Trust (the "Trust") at April 30, 2007, the results of each of their operations, the changes in each of their net assets and the financial highlights, for each of the periods presented, in conformity with accounting principles generally accepted in the United States of America. These financial statements and financial highlights (hereafter referred to as "financial statements") are the responsibility of the Trust's management; our responsibility is to express an opinion on these financial statements based on our audits. We conducted our audits of thes e financial statements in accordance with the standards of the Public Company Accounting Oversight Board (United States). Those standards require that we plan and perform the audits to obtain reasonable assurance about whether the financial statements are free of material misstatement. An audit includes examining, on a test basis, evidence supporting the amounts and disclosures in the financial statements, assessing the accounting principles used and significant estimates made by management, and evaluating the overall financial statement presentation. We believe that our audits, which included confirmation of securities at April 30, 2007 by correspondence with the custodian and brokers, provide a reasonable basis for our opinion.
PricewaterhouseCoopers LLP
New York, New York
June 25, 2007
62
Supplemental Information (Unaudited)
Federal Income Tax Information
The percentages of investment income (dividend income plus short-term gains, if any) qualify as follows:
| Qualified dividend income | Dividends-received deduction | ||||||||||
| Dynamic Basic Materials Sector Portfolio | 100 | % | 100 | % | |||||||
| Dynamic Consumer Discretionary Sector Portfolio | 100 | % | 100 | % | |||||||
| Dynamic Consumer Staples Sector Portfolio | 100 | % | 100 | % | |||||||
| Dynamic Energy Sector Portfolio | 100 | % | 100 | % | |||||||
| Dynamic Financial Sector Portfolio | 100 | % | 100 | % | |||||||
| Dynamic Healthcare Sector Portfolio | 0 | % | 0 | % | |||||||
| Dynamic Industrials Sector Portfolio | 100 | % | 100 | % | |||||||
| Dynamic Technology Sector Portfolio | 0 | % | 0 | % | |||||||
| Dynamic Telecommunications & Wireless Portfolio | 100 | % | 100 | % | |||||||
| Dynamic Utilities Portfolio | 100 | % | 100 | % | |||||||
63
Supplemental Information (Unaudited) (Continued)
Trustees and Officers
The Trustees who are not affiliated with the Adviser or affiliates of the Adviser and executive officers of the Trust, their term of office and length of time served, their principal business occupations during the past five years, the number of portfolios in the Fund Complex overseen by each Trustee and the other directorships, if any, held by the Trustee, are shown below.
| Name, Address and Age of Independent Trustees | Position(s) with Trust | Length of Time Served* | Principal Occupation(s) During Past 5 Years | Number of Portfolios in Fund Complex*** Overseen by Trustees | Other Directorships Held by Trustees | ||||||||||||||||||
| Ronn R. Bagge (49) YQA Capital Management, LLC 1755 S. Naperville Rd., Suite 100 Wheaton, IL 60187 | Trustee | Since 2003 | YQA Capital Management LLC (July 1998-Present); formerly Owner/CEO of Electronic Dynamic Balancing Co., Inc. (high-speed rotating equipment service provider) | 79 | None | ||||||||||||||||||
| Marc M. Kole (47)** c/o PowerShares Capital Management LLC 301 W. Roosevelt Road Wheaton, IL 60187 | Trustee | Since 2006 | Controller, Priority Health (September 2005-present); Interim CFO, Priority Health (July 2006-February 2007); formerly Senior Vice President of Finance, United Healthcare (health insurance) (July 2004-July 2005); Senior Vice President of Finance, Oxford Health Plans (June 2000-July 2004) | 79 | None | ||||||||||||||||||
| D. Mark McMillan (44) c/o PowerShares Capital Management LLC 301 W. Roosevelt Road Wheaton, IL 60187 | Trustee | Since 2003 | Member, Bell, Boyd & Lloyd LLC (1989- Present) | 79 | None | ||||||||||||||||||
* This is the date the Trustee began serving the Trust.
** At a Board meeting held on December 14, 2006, Marc Kole was elected to serve as Trustee of the Trust.
*** Fund Complex includes all open-end funds (including all of their Portfolios) advised by the Adviser. The Fund Complex consists of the Trust's 70 Portfolios and one other exchange-traded fund trust with 9 Portfolios advised by the Adviser.
64
Supplemental Information (Unaudited) (Continued)
Trustees and Officers (Continued)
| Name, Address and Age of Independent Trustees | Position(s) with Trust | Length of Time Served* | Principal Occupation(s) During Past 5 Years | Number of Portfolios in Fund Complex*** Overseen by Trustees | Other Directorships Held by Trustees | ||||||||||||||||||
| Philip M. Nussbaum (45) c/o PowerShares Capital Management LLC 301 W. Roosevelt Road Wheaton, IL 60187 | Trustee | Since 2003 | Chairman, Performance Trust Capital Partners (formerly Betzold, Berg, Nussbaum & Heitman, Inc.); formerly Managing Director, Communication Institute (May 2002-August 2003); Executive Vice President of Finance, Betzold, Berg, Nussbaum & Heitman, Inc. (March 1994-1999) | 79 | None | ||||||||||||||||||
| Donald H. Wilson (47)** c/o PowerShares Capital Management LLC 301 W. Roosevelt Road Wheaton, IL 60187 | Trustee | Since 2006 | Executive Vice President and Chief Financial Officer, AMCORE Financial, Inc. (bank holding company) (February 2006-present); formerly, Senior Vice President and Treasurer, Marshall & Ilsley Corp. (bank holding company) (May 1995-February 2006) | 79 | None | ||||||||||||||||||
* This is the date the Trustee began serving the Trust.
** At a Board meeting held on December 14, 2006, Donald Wilson was elected to serve as Trustee of the Trust.
*** Fund Complex includes all open-end funds (including all of their Portfolios) advised by the Adviser. The Fund Complex consists of the Trust's 70 Portfolios and one other exchange-traded fund trust with 9 Portfolios advised by the Adviser.
65
Supplemental Information (Unaudited) (Continued)
Trustees and Officers (Continued)
| Name, Address and Age of Management Trustee | Position(s) with Trust | Length of Time Served* | Principal Occupation(s) During Past 5 Years | Number of Portfolios in Fund Complex*** Overseen by Trustee | Other Directorships Held by Trustee | ||||||||||||||||||
| H. Bruce Bond (44)** PowerShares Capital Management LLC 301 W. Roosevelt Road Wheaton, IL 60187 | Chairman of the Board, Trustee and Chief Executive Officer | Since 2003 | Managing Director, PowerShares Capital Management LLC (August 2002- Present); Manager, Nuveen Investments (April 1998- August 2002) | 79 | None | ||||||||||||||||||
* This is the date the Management Trustee began serving the Trust.
** Interested person as defined in Section 2(a)-(19) of the 1940 Act.
*** Fund Complex includes all open-end funds (including all of their Portfolios) advised by the Adviser. The Fund Complex consists of the Trust's 70 Portfolios and one other exchange-traded fund trust with 9 Portfolios advised by the Adviser.
66
Supplemental Information (Unaudited) (Continued)
Trustees and Officers (Continued)
| Name, Address and Age of Officers | Position(s) with Trust | Length of Time Served* | Principal Occupation(s) During Past 5 Years | ||||||||||||
| Bruce T. Duncan (52) PowerShares Capital Management LLC 301 W. Roosevelt Road Wheaton, IL 60187 | Chief Financial Officer and Treasurer | Since 2006 | Senior Vice President of Finance, PowerShares Capital Management LLC (September 2005-Present); Private Practice Attorney (2000-2005); Vice President of Investor Relations, The ServiceMaster Company (1994-2000); Vice President of Taxes, The ServiceMaster Company (1990-2000) | ||||||||||||
| Kevin R. Gustafson (41) PowerShares Capital Management LLC 301 W. Roosevelt Road Wheaton, IL 60187 | Chief Compliance Officer | Since 2004 | General Counsel and Chief Compliance Officer, PowerShares Capital Management LLC (September 2004-Present); Attorney, Nyberg & Gustafson (2001-2004); Attorney, Burke, Warren, McKay & Serritella, P.C. (1997-2000) | ||||||||||||
| Keith Ovitt (44) PowerShares Capital Management LLC 301 W. Roosevelt Road Wheaton, IL 60187 | Secretary | Since 2003 | Managing Director, PowerShares Capital Management LLC (April 2003-Present); President, Ovitech (2002-2003); Vice President of Information Systems for DFG Foods, LLC (Division of FoodBrands America/Tyson Foods) (1999-2002); Systems Manager, Nabisco Biscuit Company (1997-1999) | ||||||||||||
* This is the period for which the Officers began serving the Trust. Each Officer serves an indefinite term, until his successor is elected.
67
Board Considerations Regarding Continuation of Investment Advisory Agreement (Unaudited)
At a meeting held on April 20, 2007, the Board of Trustees of the PowerShares Exchange-Traded Fund Trust (the "Trust"), including the Independent Trustees, unanimously approved the continuation of the Investment Advisory Agreement between PowerShares Capital Management LLC (the "Adviser") and the Trust for the following series (the "Funds"):
PowerShares Dynamic Market Portfolio
PowerShares Dynamic OTC Portfolio
PowerShares Golden Dragon Halter USX China Portfolio
PowerShares High Yield Equity Dividend AchieversTM Portfolio
PowerShares WilderHill Clean Energy Portfolio
PowerShares Dynamic Large Cap Growth Portfolio
PowerShares Dynamic Large Cap Value Portfolio
PowerShares Dynamic Mid Cap Growth Portfolio
PowerShares Dynamic Mid Cap Value Portfolio
PowerShares Dynamic Small Cap Growth Portfolio
PowerShares Dynamic Small Cap Value Portfolio
PowerShares Dynamic Biotechnology & Genome Portfolio
PowerShares Dynamic Food & Beverage Portfolio
PowerShares Dynamic Leisure and Entertainment Portfolio
PowerShares Dynamic Media Portfolio
PowerShares Dynamic Networking Portfolio
PowerShares Dynamic Pharmaceuticals Portfolio
PowerShares Dynamic Semiconductors Portfolio
PowerShares Dynamic Software Portfolio
PowerShares Zacks Micro Cap Portfolio
PowerShares Aerospace & Defense Portfolio
PowerShares Dynamic Hardware & Consumer Electronics Portfolio
PowerShares Dynamic Telecommunications & Wireless Portfolio
PowerShares Value Line Timeliness Select Portfolio
PowerShares Divided AchieversTM Portfolio
PowerShares International Dividend AchieversTM Portfolio
PowerShares High Growth Rate Dividend AchieversTM Portfolio
PowerShares Zacks Small Cap Portfolio
PowerShares Dynamic Building & Construction Portfolio
PowerShares Dynamic Energy Exploration & Production Portfolio
PowerShares Dynamic Insurance Portfolio
PowerShares Dynamic Oil & Gas Services Portfolio
PowerShares Dynamic Retail Portfolio
PowerShares Dynamic Utilities Portfolio
PowerShares Lux Nanotech Portfolio
PowerShares FTSE RAFI US 1000 Portfolio
PowerShares Water Resources Portfolio
The Trustees reviewed information from the Adviser describing: (i) the nature, extent and quality of services provided, (ii) the investment performance of the Funds and the Adviser, (iii) the costs of services provided and estimated profits realized by the Adviser, (iv) the extent to which economies of scale are realized as the Funds grow, (v) whether fee levels reflect any possible economies of scale for the benefit of Fund shareholders, (vi) comparisons of services rendered and amounts paid to other registered investment companies and (vii) any benefits realized by the Adviser from its relationship with each Fund. Based on all of the information considered and the conclusions reached, the Board, including the Independent Trustees, determined to approve the continuation of the Investment Advisory Agreement for each Fund listed above. No single factor was determinative in the Board's analysis.
Nature, Extent and Quality of Services. In evaluating the nature, extent and quality of the Adviser's services, the Trustees reviewed information concerning the functions performed by the Adviser for the Funds, information describing the Adviser's current organization, including operations assistance provided
68
Board Considerations Regarding Continuation of Investment Advisory Agreement (Unaudited) (Continued)
by the Adviser's new parent organization, AMVESCAP LLC, and the background and experience of the persons responsible for the day-to-day management of the Funds. The Trustees reviewed matters related to the Adviser's portfolio transaction policies and procedures. The Trustees reviewed information on the performance of the Funds and the performance of their benchmark indices. The Trustees also reviewed reports on the correlation and tracking error between the underlying index and each Fund's performance and reviewed a report of a consultant to the Adviser on correlation and tracking error. The Trustees concluded that Funds are correlated to their underlying index and that the tracking error was within a reasonable range.
The Trustees also considered the services provided by the Adviser in its oversight of the Funds' administrator, custodian and transfer agent. They noted the significant amount of time and effort that had been devoted to this oversight function.
Based on their review, the Trustees found that the nature and extent of services provided to the Funds under the Investment Advisory Agreement are appropriate and that the quality is good.
Fees, Expenses and Profitability. The Trustees reviewed and discussed the information provided by the Adviser on each Fund's expense ratio and the advisory fee, as compared to three categories of comparable funds selected by Lipper Inc., an independent source: exchange-traded index funds ("ETFs"), open-end funds and closed-end funds. The Trustees also reviewed and discussed additional information prepared by Lipper Inc. on expense ratios and advisory fees of a broader universe of ETFs and other index funds. The Adviser supplemented the information prepared by Lipper Inc. with data it compiled on expense ratios and advisory fees of newer ETFs that recently commenced operations. The Trustees noted that the annual advisory fee charged to the Funds was identical (0.50% of average net assets), except for the advisory fee for the PowerShares High Yield Equi ty Dividend AchieversTM Portfolio, the PowerShares Dividend AchieversTM Portfolio, the PowerShares High Growth Rate Dividend AchieversTM Portfolio and the PowerShares International Dividend AchieversTM Portfolio (for each of which the annual advisory fee was 0.40% of average net assets), and that the Adviser had agreed to waive the fee and/or pay expenses to the extent necessary to prevent the annual operating expenses of each Fund (excluding interest expenses, licensing fees (for all Funds other than the initial two Funds, the PowerShares Dynamic OTC Portfolio and the PowerShares Dynamic Market Portfolio), brokerage commissions and other trading expenses, taxes and extraordinary expenses) from exceeding 0.60% (0.50% for the PowerShares High Yield Equity Dividend AchieversTM Portfolio, the PowerShares Dividend AchieversTM Portfolio, the PowerShares High Growth Rate Dividend AchieversTM Portfolio and the PowerShares International Div idend AchieversTM Portfolio) at least until April 30, 2008. The Trustees noted that the Adviser does not provide investment management services to clients other than the Trust. The Trustees noted that the advisory fees were at the higher end of the ETF universe, but were generally lower than fees for open-end (non-ETF) funds and closed-end funds, and were reasonable because of the complexity of the indices, which generally require more frequent rebalancing of the portfolios, the distinguishing factors of the Funds, and the higher administrative, operational and management oversight costs for the Adviser. The Board therefore concluded that the advisory fee and expense ratio of each Fund are competitive and that the advisory fee for each Fund is reasonable and appropriate in amount in light of the quality of services provided and the expense cap in place.
In conjunction with their review of fees, the Trustees also considered information provided by the Adviser on the revenues received by the Adviser under the Agreement, as well as the fees waived and expenses reimbursed by the Adviser for the Funds. The Trustees reviewed information provided by the Adviser on
69
Board Considerations Regarding Continuation of Investment Advisory Agreement (Unaudited) (Continued)
its profitability as well as any profits realized by the Adviser from its relationship to each Fund. The Trustees noted the Adviser's statement that its costs of managing the Funds generally exceeded the amount payable as management fees under the Investment Advisory Agreement, and that most of the Funds were operating in a cash loss position. The Trustees concluded that the profitability to the Adviser of the advisory services provided to the Funds is not unreasonable.
Economies of Scale and Whether Fee Levels Reflect These Economies of Scale. The Trustees reviewed the information provided by the Adviser as to the extent to which economies of scale are realized as each Fund grows and whether fee levels reflect economies of scale for the benefit of shareholders. The Trustees reviewed each Fund's asset size, expense ratio, expense limitation agreed to by the Adviser and whether the investment process produced economies of scale. The Trustees noted that certain fixed costs associated with the management of the Funds are being reduced on a per-Fund basis as additional Funds are added, and that the gradual reduction of the per-Fund cost enabled the Adviser to operate some of the Funds under the expense cap, which potentially would lower the costs to shareholders. The Trustees noted that the Excess Expense Agreement with the Trust provided that the Adviser was entitled to be reimbursed by each Fund for fees waived or expenses absorbed pursuant to the expense cap for a period of three years from the date the fee or expense was incurred, provided that no reimbursement would be made that would result in a Fund exceeding its expense cap.
The Trustees noted that the Adviser had not identified any further benefits that it derived from its relationship with the Funds, and had noted that it does not have any soft-dollar arrangements.
Based on all of the information considered and the conclusions reached, the Board, including the Independent Trustees, determined to approve the continuation of the Investment Advisory Agreement for each Fund listed above. No single factor was determinative in the Board's analysis.
70
PowerShares Leading the Intelligent ETF Revolution
PowerShares continues to offer new solutions to the complex needs demanded by advisors and investors today. PowerShares is "Leading the Intelligent ETF Revolution" providing investment advisors and investors with institutional-caliber asset management by seeking to replicate enhanced indexes in one of the more benefit-rich investment vehicles available in the marketplace today, the exchange-traded fund (ETF). Each PowerShares fund can be classified into one of three different categories based on the objective and characteristics of its underlying index: Intelligent Index, Intelligent Exposure and Intelligent Access.
For most recent portfolio performance, please visit our website at www.powershares.com.
This page contains advertising materials and should not be viewed as part of the Annual Report.
71
Intelligent Index
PowerShares believes that having insight into a stock's investment merit can have a positive impact on performance. Therefore, most PowerShares ETFs are based on Intelligent Indexes, which seek to provide alpha1 by identifying stocks with the greatest investment merit. These indexes use proprietary methodologies to identify financially strong, effectively managed and attractively priced companies with strong capital appreciation potential. Because their objective is to maximize performance, Intelligent Indexes may look different from the market.
Exchange-Traded Funds
Intelligent Index
PWC - Dynamic Market
PWO - Dynamic OTC
PIQ - Dynamic MagniQuant
PJF - Dynamic Large Cap
PJG - Dynamic Mid Cap
PJM - Dynamic Small Cap
PWB - Dynamic Large Cap Growth
PWV - Dynamic Large Cap Value
PWJ - Dynamic Mid Cap Growth
PWP - Dynamic Mid Cap Value
PWT - Dynamic Small Cap Growth
PWY - Dynamic Small Cap Value
PGZ - Dynamic Aggressive Growth
PVM - Dynamic Deep Value
PYZ - Dynamic Basic Materials Sector
PEZ - Dynamic Consumer Discretionary Sector
PSL - Dynamic Consumer Staples Sector
PXI - Dynamic Energy Sector
PFI - Dynamic Financials Sector
PTH - Dynamic Healthcare Sector
PRN - Dynamic Industrials Sector
PTF - Dynamic Technology Sector
PTE - Dynamic Telecommunications & Wireless
PUI - Dynamic Utilities
PJB - Dynamic Banking
PBE - Dynamic Biotechnology & Genome
PKB - Dynamic Building & Construction
PXE - Dynamic Energy Exploration & Production
PBJ - Dynamic Food & Beverage
PHW - Dynamic Hardware & Consumer Electronics
PTJ - Dynamic Healthcare Services
PIC - Dynamic Insurance
PEJ - Dynamic Leisure and Entertainment
PBS - Dynamic Media
PXQ - Dynamic Networking
PXJ - Dynamic Oil & Gas Services
PJP - Dynamic Pharmaceuticals
PMR - Dynamic Retail
PSI - Dynamic Semiconductors
PSJ - Dynamic Software
1 Alpha is a measure of risk adjusted performance relative to a benchmark or the market.
This page contains advertising materials and should not be viewed as part of the Annual Report.
72
Intelligent Exposure
For investors looking for more market-like exposure, PowerShares offers a lineup of ETFs that seek to track indexes with an Intelligent Exposure objective. These indexes seek to provide accurate exposure to the economy, yet are constructed using more sophisticated techniques than traditional benchmark indexes, which typically use a weighting structure based on market capitalization. Under this traditional structure, market speculation can lead to significant mispricing of stocks and, therefore, suboptimal weights in the index. But indexes seeking Intelligent Exposure use a weighting structure based on company fundamentals: sales, cash flow, book value and dividends. PowerShares believes these factors paint a truer picture of a company's size and lead to more optimal index weightings.
Exchange-Traded Funds
Intelligent Exposure
PRF - FTSE RAFI US 1000
PRFZ - FTSE RAFI US 1500 Small-Mid
PRFM - FTSE RAFI Basic Materials Sector
PRFG - FTSE RAFI Consumer Goods Sector
PRFS - FTSE RAFI Consumer Services Sector
PRFE - FTSE RAFI Energy Sector
PRFF - FTSE RAFI Financials Sector
PRFH - FTSE RAFI Health Care Sector
PRFN - FTSE RAFI Industrials Sector
PRFQ - FTSE RAFI Telecom & Technology Sector
PRFU - FTSE RAFI Utilities Sector
Intelligent Access
Without targeted investment products, unique market segments such as currency or nanotech may be difficult for investors to access. These segments are the focus of indexes that promote Intelligent Access. PowerShares has a diverse lineup of ETFs based on indexes that offer exposure to specific, unique or previously uncovered market areas.
Exchange-Traded Funds
Intelligent Access
PPA - Aerospace & Defense
ADRA - BLDRS Asia 50 ADR Index Fund
ADRD - BLDRS Developed Markets 100 ADR Index Fund
ADRE - BLDRS Emerging Markets 50 ADR Index Fund
ADRU - BLDRS Europe 100 ADR Index Fund
PKW - Buyback Achievers
PZD - Cleantech
PFM - Dividend Achievers
PDP - DWA Technical Lenders
PGF - Financial Preferred
PGJ - Golden Dragon Halter USX China
PHJ - High Growth Rate Dividend Achievers
PEY - High Yield Equity Dividend Achievers
PID - International Dividend Achievers
PSP - Listed Private Equity
PXN - Lux Nanotech
QQQQ - PowerShares QQQ
PYH - Value Line Industry Rotation
PIV - Value Line Timeliness Select
PHO - Water Resources
PBW - WilderHill Clean Energy
PUW - WilderHill Progressive Energy
PZI - Zacks Micro Cap
PZJ - Zacks Small Cap
This page contains advertising materials and should not be viewed as part of the Annual Report.
73
PowerShares Asset Class Guide
Domestic Equity
Broad
PWC Dynamic Market
PWO Dynamic OTC
PIV Value Line Timeliness Select
PRF FTSE RAFI US 1000
PRFZ FTSE RAFI US 1500
PIQ Dynamic MagniQuant
QQQQ PowerShares QQQ
PKW Buyback Achievers
PDP DWA Technical Leaders
PVM Dynamic Deep Value
PGZ Dynamic Aggressive Growth
Style
PJF Dynamic Large Cap
PWB Dynamic Large Cap Growth
PWV Dynamic Large Cap Value
PJG Dynamic Mid Cap
PWJ Dynamic Mid Cap Growth
PWP Dynamic Mid Cap Value
PJM Dynamic Small Cap
PWT Dynamic Small Cap Growth
PWY Dynamic Small Cap Value
PZJ Zacks Small Cap
PZI Zacks Micro Cap
International/Region
Region
PPGJ Golden Dragon Halter USX China
ADRA BLDRS Asia 50 ADR Index Fund
ADRD BLDRS Developed Markets 100 ADR Index Fund
ADRE BLDRS Emerging Markets 50 ADR Index Fund
ADRU BLDRS Europe 100 ADR Index Fund
Income
PID International Dividend Achievers
Income/Dividend
PEY High Yield Equity Dividend Achievers
PHJ High Growth Rate Dividend Achievers
PFM Dividend Achievers
PGF Financial Preferred
Sector and Industry
Sector
PUI Dynamic Utilities
PYZ Dynamic Basic Materials Sector
PEZ Dynamic Consumer Discretionary Sector
PSL Dynamic Consumer Staples Sector
PXI Dynamic Energy Sector
PFI Dynamic Financial Sector
PTH Dynamic Healthcare Sector
PRN Dynamic Industrials Sector
PTF Dynamic Technology Sector
PTE Dynamic Telecommunications & Wireless
PRFG FTSE RAFI Consumer Goods Sector
PRFS FTSE RAFI Consumer Services Sector
PRFE FTSE RAFI Energy Sector
PRFF FTSE RAFI Financials Sector
PRFH FTSE RAFI Health Care Sector
PRFN FTSE RAFI Industrials Sector
PRFM FTSE RAFI Basic Materials Sector
PRFQ FTSE RAFI Telecommunications & Technology Sector
PRFU FTSE RAFI Utilities Sector
Industry
PJB Dynamic Banking Sector
PBE Dynamic Biotechnology & Genome
PKB Dynamic Building & Construction
PXE Dynamic Energy Exploration & Production
PBJ Dynamic Food & Beverage
PHW Dynamic Hardware & Consumer Electronics
PTJ Dynamic Healthcare Services Sector
PIC Dynamic Insurance
PEJ Dynamic Leisure and Entertainment
PBS Dynamic Media
PXQ Dynamic Networking
PXJ Dynamic Oil & Gas Services
PJP Dynamic Pharmaceuticals
PMR Dynamic Retail
PSI Dynamic Semiconductors
PSJ Dynamic Software
PPA Aerospace & Defense
PBW Clean Energy
PZD Cleantech
PSP Listed Private Equity
PXN Nanotech
PUW Progressive Energy
PYH Value Line Industry Rotation
PHO Water Resources
This page contains advertising materials and should not be viewed as part of the Annual Report.
74
PowerShares Risk Spectrum
Domestic Equity
More Conservative
Dynamic Deep Value
Dynamic Large Cap
Dynamic Mid Cap
Dynamic MagniQuant
Buyback Achievers
DWA Technical Leaders
Dynamic Small Cap
Dynamic Large Cap Value
FTSE RAFI US 1000
Dynamic Mid Cap Value
Dynamic Market
Dynamic Aggressive Growth
Dynamic Small Cap Value
FTSE RAFI US 1500 Small-Mid
Zacks Micro Cap
PowerShares QQQ
Dynamic Large Cap Growth
Dynamic Mid Cap Growth
Zacks Small Cap
Value Line Timeliness Select
Dynamic Small Cap Growth
Dynamic OTC
More Aggressive
International/Region
More Conservative
BLDRS Europe 100 ADR Index Fund
BLDRS Developed Markets 100 ADR Index Fund
BLDRS Asia 50 ADR Index Fund
International Dividend Achievers
BLDRS Emerging Markets 50 ADR Index Fund
Golden Dragon Halter USX China
More Aggressive
Income/Dividend
More Conservative
Financial Preferred
High Yield Equity Dividend Achievers
Dividend Achievers
High Growth Rate Dividend Achievers
More Aggressive
Sector and Industry
More Conservative
Dynamic Consumer Staples Sector
Dynamic Food & Beverage
Dynamic Banking Sector
Dynamic Financial Sector
Dynamic Utilities
Dynamic Insurance
FTSE RAFI Health Care Sector
Dynamic Healthcare Sector
FTSE RAFI Financials Sector
Dynamic Industrials Sector
Dynamic Media
Aerospace & Defense
FTSE RAFI Industrials Sector
Dynamic Pharmaceuticals
Dynamic Consumer Discretionary Sector
Dynamic Healthcare Services Sector
Dynamic Leisure and Entertainment
FTSE RAFI Consumer Goods Sector
FTSE RAFI Utilities Sector
Water Resources
FTSE RAFI Consumer Services Sector
FTSE RAFI Basic Materials Sector
Dynamic Basic Materials Sector
Dynamic Retail
FTSE RAFI Energy Sector
Dynamic Energy Sector
Dynamic Building & Construction
Value Line Industry Rotation
Dynamic Technology Sector
Progressive Energy
Dynamic Biotechnology & Genome
Dynamic Software
Nanotech
Dynamic Energy Exploration & Production
FTSE RAFI Telecommunications & Technology Sector
Dynamic Hardware & Consumer Electronics
Dynamic Telecommunications & Wireless
Dynamic Oil & Gas Services
Cleantech
Listed Private Equity
Clean Energy
Dynamic Networking
Dynamic Semiconductors
More Aggressive
This page contains advertising materials and should not be viewed as part of the Annual Report.
75
Exchange-Traded Funds
ETFs are investment funds that trade like individual stocks on all of the major exchanges, similar to shares of publicly held companies. They can be bought and sold on an exchange at any moment during market hours. Since they are listed and traded on an exchange, you can be confident that you are investing in a well-regulated market.
ETFs are one of the fastest growing investment products in the worldwide financial marketplace. As of 3.31.2007, 432 ETFs were listed in the U.S. with $433 billion in assets, up from two products with only $1 billion in assets in 1995.
ETFs seek investment results that correspond generally to the price and yield (before fees and expenses) of a listed index. While most ETFs share a similar objective, the principal investment strategies of the underlying indexes can have substantial differences. It is important to gain a clear understanding of an ETF's underlying index as the index's objective is inherently passed on to the fund shareholders by seeking to replicate the index.
Indexes
An index is a selection process or appointed committee that groups selected securities together to track their movement in aggregate. While only a few indexes are mentioned on the daily news, there are hundreds of indexes in existence today that differ from each other in diverse ways.
Broad Market
Broad market indexes are what most people think of when an index is mentioned. These indexes are designed to track the performance of the broad market.
Benchmark
Benchmark indexes are created to set a standard by which the performance or movement of individual securities and asset managers can be measured.
Exchange Composite
These indexes are designed to provide a comprehensive measure of the performance of all commons stocks listed on a particular exchange.
Sector or Industry
The aggregate financial marketplace is generally broken down into roughly ten sectors which are further dissected into many specific industries.
Style
Style indexes are created to identify groups of stocks that are either growth (companies currently experiencing appreciation or significant earnings or revenue growth) or value (companies determined to be under priced by fundamental measures) oriented.
Company Size
Market-capitalization indexes group together companies that are similar in size based on the number of outstanding shares times the share price, while fundamentally weighted indexes group together stocks of companies based on their financial fundamental valuation.
International / Country
International indexes group together stocks of companies that are affiliated by location outside of the U.S. or companies located with a specific country or region.
Income / Bond
Income indexes group stocks based on their type of income of securities, while bond indexes are designed to show the average performance of a group of debt securities.
This page contains advertising materials and should not be viewed as part of the Annual Report.
76
Specialty / Enhanced
Many other specialty indexes are created with specific investment management objectives or for customized purposes. These indexes can be created specifically with the intention to be used as the basis for an ETF. Investor targets can be met through an ETF where the index has the objective(s) of capital appreciation, risk control, income or diversification.
Benefits of PowerShares
PowerShares ETFs offer investors a low-cost, tax-efficient investment in a professionally crafted portfolio consisting of some of the best managed companies and most timely investments. See important risk factors in back.
Tax Advantaged Product Design
Taxes may be one of the most critical and overlooked factors in wealth creation over time. The ETF product structure defers some or possibly all capital gains until investors sell their shares.
Low Ownership Cost
ETFs provide lower ownership cost because of their efficient structure. PowerShares have established expense caps to make the cost of ownership clear and straightforward for investors. Ordinary brokerage commissions apply.
Flexibility, Transparency
PowerShares' ETFs offer flexibility as shares can be bought and sold throughout the day through exchange trading. Fund holdings are disclosed every day. Options based on the funds are available, possibly increasing financial management opportunities for advisors and their clients.
Near Instant Liquidity, Trades at or Close to NAV
PowerShares may be bought and sold on the exchange at any time during market hours. Although shares are not individually redeemable directly from the fund itself, authorized participants may acquire shares and tender shares for redemption, through creation unit aggregations. ETFs are not closed-end funds and trade at or near net asset values.
This page contains advertising materials and should not be viewed as part of the Annual Report.
77
This page intentionally left blank
This page intentionally left blank
This page intentionally left blank
PROXY VOTING POLICIES AND PROCEDURES
A description of the Funds' proxy voting policies and procedures that the Funds use to determine how to vote proxies relating to portfolio securities is available, without charge and upon request, by calling (800) 337-4246. This information is also available on the Securities and Exchange Commission's ("Commission") website at www.sec.gov.
Information regarding how the Funds voted proxies for portfolio securities, if applicable, during the most recent 12-month period ended June 30, is also available, without charge and upon request, by (i) calling (800) 337-4246; or (ii) accessing the Funds' Form N-PX on the Commission's website at www.sec.gov.
QUARTERLY PORTFOLIOS
The Funds file their complete schedules of portfolio holdings with the Commission for the first and third quarters of each fiscal year on Form N-Q. The Funds' Forms N-Q are available on the Commission's website at www.sec.gov. The Funds' Forms N-Q may also be reviewed and copied at the Commission's Public Reference Room in Washington, DC; information on the operation of the Public Reference Room may be obtained by calling (800) SEC-0330.
There are risks involved in investing in ETFs, including possible loss of money. Investing in securities of small and medium sized companies involves greater risk than is customarily associated with investing in more established companies, and investments in concentrated industry sectors involve greater risks than investments that are more diversified. PowerShares ETFs are not actively managed and are subject to risks similar to stocks, including those related to short selling and margin maintenance. PowerShares ETFs are not FDIC insured, may lose value and have no bank guarantee. PowerShares is a registered trademark of PowerShares Capital Management LLC. Past performance is not a guarantee of future results.
A I M Distributors, Inc. is the distributor of the PowerShares Exchange-Traded Fund Trust.
An investor should consider each Fund's investment objective, risks, charges and expenses carefully before investing. For more complete information about PowerShares ETFs call A I M Distributors, Inc. at (800) 337-4246 or visit our website powershares.com for a prospectus. Please read the prospectus carefully before investing.

301 W. Roosevelt Road
Wheaton, IL 60187
800.983.0903
www.powershares.com
P-PS-AR-3
2007 Annual Report to Shareholders
30 April 2007

PowerShares Dynamic Banking Portfolio
PowerShares Dynamic Biotechnology & Genome Portfolio
PowerShares Dynamic Building & Construction Portfolio
PowerShares Dynamic Energy Exploration & Production Portfolio
PowerShares Dynamic Food & Beverage Portfolio
PowerShares Dynamic Hardware & Consumer Electronics Portfolio
PowerShares Dynamic Healthcare Services Portfolio
PowerShares Dynamic Insurance Portfolio
PowerShares Dynamic Leisure and Entertainment Portfolio
PowerShares Dynamic Media Portfolio
PowerShares Dynamic Networking Portfolio
PowerShares Dynamic Oil & Gas Services Portfolio
PowerShares Dynamic Pharmaceuticals Portfolio
PowerShares Dynamic Retail Portfolio
PowerShares Dynamic Semiconductors Portfolio
PowerShares Dynamic Software Portfolio

Table of Contents
| Shareholder Letter | 2 | ||||||
| The Market Environment | 3 | ||||||
| Manager's Analysis | 4 | ||||||
| Funds' Distribution History | 36 | ||||||
| Frequency Distribution of Discounts & Premiums | 38 | ||||||
| Fees and Expenses | 40 | ||||||
| Industry Portfolios | |||||||
| Schedules of Investments | |||||||
| PowerShares Dynamic Banking Portfolio | 43 | ||||||
| PowerShares Dynamic Biotechnology & Genome Portfolio | 44 | ||||||
| PowerShares Dynamic Building & Construction Portfolio | 45 | ||||||
| PowerShares Dynamic Energy Exploration & Production Portfolio | 46 | ||||||
| PowerShares Dynamic Food & Beverage Portfolio | 47 | ||||||
| PowerShares Dynamic Hardware & Consumer Electronics Portfolio | 48 | ||||||
| PowerShares Dynamic Healthcare Services Portfolio | 49 | ||||||
| PowerShares Dynamic Insurance Portfolio | 50 | ||||||
| PowerShares Dynamic Leisure and Entertainment Portfolio | 51 | ||||||
| PowerShares Dynamic Media Portfolio | 52 | ||||||
| PowerShares Dynamic Networking Portfolio | 53 | ||||||
| PowerShares Dynamic Oil & Gas Services Portfolio | 54 | ||||||
| PowerShares Dynamic Pharmaceuticals Portfolio | 55 | ||||||
| PowerShares Dynamic Retail Portfolio | 56 | ||||||
| PowerShares Dynamic Semiconductors Portfolio | 57 | ||||||
| PowerShares Dynamic Software Portfolio | 58 | ||||||
| Statements of Assets and Liabilities | 60 | ||||||
| Statements of Operations | 62 | ||||||
| Statements of Changes in Net Assets | 64 | ||||||
| Financial Highlights | 70 | ||||||
| Notes to Financial Statements | 78 | ||||||
| Report of Independent Registered Public Accounting Firm | 89 | ||||||
| Supplemental Information (Unaudited) | 90 | ||||||
| Information about Advisory Agreement (Unaudited) | 95 | ||||||

To My Fellow Investors,
It gives me great pleasure to report on the state of your investment(s) in PowerShares Exchange-Traded Funds and to thank you for your continued confidence in PowerShares Capital Management LLC.
Let me share with you the exciting events that have taken place at PowerShares as I look back over the past 12 months and at what the future may hold.
PowerShares has experienced significant growth over the past 12 months. We now have 70 exchange-traded funds ("ETFs") in the market, an increase of 33 funds from the 37 funds at the beginning of the fiscal year. PowerShares now offers more U.S. based equity ETFs than any other ETF sponsor. Assets under management increased almost 75%, from $6 billion to over $10 billion at April 30, 2007. This phenomenal growth demonstrates the continued strong demand for our original listings as well as the excellent reception of our new funds.
Of the new funds offered, 10 were FTSE RAFI funds, which were the first PowerShares Exchange-Traded Funds to be listed on the NASDAQ stock exchange, making PowerShares the only ETF sponsor to list ETFs on all three major U.S. exchanges: the American Stock Exchange, the NASDAQ, and the New York Stock Exchange.
PowerShares continues to be recognized as an innovator in the ETF marketplace. In 2007, our FTSE RAFI US 1000 Fund was awarded the most innovative new ETF at the Third Annual Global ETF Awards program.
Drawing on our increased resources as a member of the INVESCO family, we plan to introduce several PowerShares ETFs for international and global investing. These new funds will help to fulfill our goal of providing investors with the opportunity to invest in intelligent ETFs in marketplaces around the globe.
On behalf of PowerShares Capital Management LLC and the Board of Trustees for the PowerShares Exchanged-Traded Fund Trust, I want to thank you for your participation in the PowerShares family of exchange-traded funds. We look forward to serving you in the future.
Highest Regards,

H. Bruce Bond
President and Chairman of the Board of Trustees
PowerShares Exchange-Traded Fund Trust
2
The Market Environment
Although spikes of volatility marked the beginning and end of the reporting period, the U.S. equity marketplace provided strong results, with the S&P 500® Index posting double digit returns of 15.24%. At the beginning of the reporting period, enthusiasm over economic expansion gave way to uncertainty over interest rates and concern that corporate profits would be difficult to sustain. But by the summer of 2006 energy prices had cooled and investors surmised the Fed's actions had contained inflation without significant damage to ongoing corporate earnings.
Stocks resumed their upward path until late February of 2007, when Chinese regulators threatened to clamp down on local trading practices, causing global markets to retreat sharply. Global concerns, coupled with a slowing housing market domestically and the Fed's insistence that inflation posed a greater risk than a recession, amplified volatility. However, a strong job market, sustained earnings and indications that inflation would remain contained were enough to resume the rally by the end of the reporting period.
The telecom and utilities sectors posted the best results, while technology and industrial sectors lagged. Bond prices recovered moderately during the reporting period as the Fed ended its two year hike on rates in June of 2006 and a retracting housing market eased inflation concerns. With a few bumps along the way, commodity prices continued their upward march.
3
Manager's Analysis
PowerShares Dynamic Banking Portfolio (ticker: PJB)
The PowerShares Dynamic Banking Portfolio is based on the Dynamic Banking IntellidexSM Index. The Index thoroughly evaluates companies based on a variety of investment merit criteria, including fundamental growth, stock valuation, investment timeliness and risk factors. Securities shown to possess the greatest capital appreciation potential are selected by the index and incorporated by the portfolio manager.
Since its October 12, 2006 inception date, the portfolio has returned -5.08% compared to the Dow Jones Regional Banks Index which returned 1.46%. The portfolio was heavily weighted in the commercial banks industry with slight exposure to the thrifts & mortgage finance and the diversified financial services industries. Within commercial banks, the companies which were laggards and weighted heavily on performance were Sterling Financial, Hancock Holding and Trustmark. First Bancorp and Comerica are two examples of banks which added positively to performance.
Industry Breakdown (% of the Fund's
Net Assets)
| Super-Regional Banks-U.S. | 32.4 | ||||||
| Commercial Banks-Central U.S. | 22.6 | ||||||
| Commercial Banks-Southern U.S. | 17.3 | ||||||
| Commercial Banks-Eastern U.S. | 7.9 | ||||||
| Finance-Investment Banker/Broker | 5.8 | ||||||
| S&L/Thrifts-Eastern U.S. | 5.8 | ||||||
| Commercial Banks-Western U.S. | 5.7 | ||||||
| S&L/Thrifts-Western U.S. | 3.1 | ||||||
| Money Market Fund | 1.2 | ||||||
| Other | (1.8 | ) | |||||
Style Allocation (%)
| Small-Cap Value | 50.6 | ||||||
| Large-Cap Value | 26.9 | ||||||
| Mid-Cap Value | 22.5 | ||||||
Top Ten Fund Holdings (% of the Fund's
Net Assets)
| Security | |||||||
| JPMorgan Chase & Co. | 5.8 | ||||||
| Wells Fargo & Co. | 5.8 | ||||||
| Comerica, Inc. | 5.6 | ||||||
| SunTrust Banks, Inc. | 5.5 | ||||||
| Bank of America Corp. | 5.5 | ||||||
| KeyCorp | 5.2 | ||||||
| PNC Financial Services Group, Inc. | 4.8 | ||||||
| Bank of Hawaii Corp. | 3.1 | ||||||
| TCF Financial Corp. | 3.1 | ||||||
| Downey Financial Corp. | 3.1 | ||||||
| Total | 47.5 | ||||||
4
Manager's Analysis (Continued)
PowerShares Dynamic Banking Portfolio (ticker: PJB)
Growth of a $10,000 Investment Since Inception
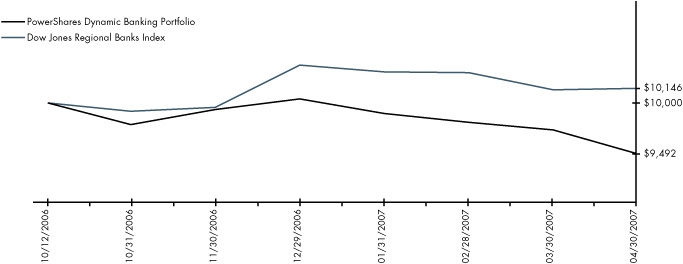
Fund Performance History (%) As of 30 April 2007
Index
| Fund Inception Cumulative | |||||||
| Dynamic Banking IntellidexSM Index | -4.53 | ||||||
| Dow Jones Regional Banks Index | 1.46 | ||||||
| KBW Banking Index | 1.22 | ||||||
Fund
| NAV Return | -5.08 | ||||||
| Share Price Return | -5.06 | ||||||
Inception: 12 October 2006
Performance data quoted represents past performance. Past performance is not a guarantee of future results, current performance may be higher or lower than performance quoted. Investment returns and principal value will fluctuate and shares, when redeemed, may be worth more or less than their original cost. The Share Price performance reflects fee waivers, absent which, performance would have been lower. According to the Fund's most recent Prospectus, the Fund's total gross annual operating expenses was indicated as 0.70%. In the Financial Highlights section of this Annual Report, the Fund's net (subsidized) annualized total operating expense ratio was determined to be 0.76% while the Fund's gross annualized total operating expense ratio was 1.88%. The Adviser has contractually agreed to waive fees and/or pay certain Fund expenses which resulted in a lower fee actually paid by investors. This waiver extends through April 30, 200 8. Absent reimbursements or waivers, performance would have been lower. NAV and Share Price returns assume that dividends and capital gain distributions have been reinvested in the Fund at NAV and Share Price, respectively. The returns shown in the table above do not reflect the deduction of taxes that a shareholder would pay on Fund distributions or the redemption or sale of Fund Shares. See powershares.com to find the most recent month-end performance numbers.
The index performance results are hypothetical. Index returns do not represent Fund returns. An investor cannot invest directly in an index. The index does not charge management fees or brokerage expenses, and no such fees or expenses were deducted from the hypothetical performance shown nor does the index lend securities, and no revenues from securities lending were added to the performance shown. In addition, the results actual investors might have achieved would have differed from those shown because of differences in the timing, amounts of their investments, and fees and expenses associated with an investment in the Fund.
The Dow Jones Regional Banks Index and the KBW Banking Index are unmanaged indices based on the average performance of approximately 50 and 24 common stocks, respectively.
5
Manager's Analysis
PowerShares Dynamic Biotechnology & Genome Portfolio (ticker: PBE)
The PowerShares Dynamic Biotechnology & Genome Portfolio seeks to replicate, before fees and expenses, the Dynamic Biotechnology & Genome IntellidexSM Index, which is designed to provide capital appreciation by thoroughly evaluating companies based on a variety of investment merit criteria, including fundamental growth, stock valuation, investment timeliness and risk factors.
Over the past year, the Fund returned 11.95% which was in-line with the performance of the S&P SuperComposite Biotechnology Index which returned 11.87% during the same period. Biotechnology, life sciences tools & services and pharmaceuticals contributed the most to performance for the portfolio. MedImmune, Regeneron Pharmaceuticals and Gilead Sciences led the way in the biotechnology industry, with New River Pharmaceuticals and ViroPharma also contributing positively to performance. There were several stocks which impacted the portfolio negatively including Telik, Neurocrine Biosciences, Alkermers and Luminex.
Industry Breakdown (% of the Fund's
Net Assets)
| Biotechnology | 49.6 | ||||||
| Pharmaceuticals | 24.6 | ||||||
| Electronics | 15.2 | ||||||
| Health Care Products | 5.9 | ||||||
| Chemicals | 4.8 | ||||||
| Other | (0.1 | ) | |||||
Style Allocation (%)
| Small-Cap Growth | 42.2 | ||||||
| Mid-Cap Growth | 24.3 | ||||||
| Large-Cap Growth | 19.2 | ||||||
| Mid-Cap Value | 12.0 | ||||||
| Small-Cap Value | 2.3 | ||||||
Top Ten Fund Holdings (% of the Fund's
Net Assets)
| Security | |||||||
| MedImmune, Inc. | 8.3 | ||||||
| Gilead Sciences, Inc. | 5.3 | ||||||
| Waters Corp. | 5.1 | ||||||
| Biogen Idec, Inc. | 4.8 | ||||||
| Sigma-Aldrich Corp. | 4.8 | ||||||
| Amgen, Inc. | 4.7 | ||||||
| Applera Corp. - Applied Biosystems Group | 4.6 | ||||||
| Genentech, Inc. | 4.5 | ||||||
| PDL BioPharma, Inc. | 3.4 | ||||||
| Regeneron Pharmaceuticals, Inc. | 3.3 | ||||||
| Total | 48.8 | ||||||
6
Manager's Analysis (Continued)
PowerShares Dynamic Biotechnology & Genome Portfolio (ticker: PBE)
Growth of a $10,000 Investment Since Inception

Fund Performance History (%) As of 30 April 2007
Index
| Avg. Ann.† | Fund Inception | ||||||||||||||
| 1 Year | Avg. Ann.† | Cumulative | |||||||||||||
| Dynamic Biotechnology & Genome IntellidexSM Index | 11.58 | 15.61 | 30.81 | ||||||||||||
| S&P SuperComposite Biotechnology Index | 11.87 | 15.73 | 31.07 | ||||||||||||
| Russell 3000® Index | 14.48 | 14.60 | 28.71 | ||||||||||||
Fund
| NAV Return | 11.95 | 15.79 | 31.20 | ||||||||||||
| Share Price Return | 11.79 | 15.76 | 31.12 | ||||||||||||
Fund Inception: 23 June 2005
Performance data quoted represents past performance. Past performance is not a guarantee of future results, current performance may be higher or lower than performance quoted. Investment returns and principal value will fluctuate and shares, when redeemed, may be worth more or less than their original cost. The Share Price performance reflects fee waivers, absent which, performance would have been lower. According to the Fund's most recent Prospectus, the Fund's total gross annual operating expenses was indicated as 0.67%. In the Financial Highlights section of this Annual Report, the Fund's net (subsidized) annualized total operating expense ratio was determined to be 0.63% while the Fund's gross annualized total operating expense ratio was 0.66%. The Adviser has contractually agreed to waive fees and/or pay certain Fund expenses which resulted in a lower fee actually paid by investors. This waiver extends through April 30, 200 8. Absent reimbursements or waivers, performance would have been lower. NAV and Share Price returns assume that dividends and capital gain distributions have been reinvested in the Fund at NAV and Share Price, respectively. The returns shown in the table above do not reflect the deduction of taxes that a shareholder would pay on Fund distributions or the redemption or sale of Fund Shares. See powershares.com to find the most recent month-end performance numbers.
The Index performance results are hypothetical. Index returns do not represent Fund returns. An investor cannot invest directly in an index. The Index does not charge management fees or brokerage expenses, and no such fees or expenses were deducted from the hypothetical performance shown nor does the index lend securities, and no revenues from securities lending were added to the performance shown. In addition, the results actual investors might have achieved would have differed from those shown because of differences in the timing, amounts of their investments, and fees and expenses associated with an investment in the Fund.
The S&P SuperComposite Biotechnology Index and the Russell 3000® Index are an unmanaged indices based on the average performance of 14 and 3,000 common stocks, respectively.
† Average annualized
7
Manager's Analysis
PowerShares Dynamic Building & Construction Portfolio (ticker: PKB)
The PowerShares Dynamic Building & Construction Portfolio seeks to replicate, before fees and expenses, the Dynamic Building and Construction IntellidexSM Index. The Index thoroughly evaluates companies based on a variety of investment merit criteria, including fundamental growth, stock valuation, investment timeliness and risk factors. Securities shown to possess the greatest capital appreciation potential are selected by the index.
Over the past year, the Fund has returned 3.06%, underperforming the S&P SuperComposite Construction & Engineering Index which returned 14.77% during the same period. Stocks which lagged came mainly from the household durables industry including Champion Enterprises, KB Home, Ryland Group, Toll Brothers, Pulte Homes and many other home building related stocks. The portfolio was aided by a strong performance from Infrasource Services, Quanta Services, Granite Construction, and Vulcan Materials.
Industry Breakdown (% of the Fund's
Net Assets)
| Engineering & Construction | 20.2 | ||||||
| Building Materials | 18.0 | ||||||
| Machinery-Construction & Mining | 10.7 | ||||||
| Home Builders | 9.6 | ||||||
| Machinery-Diversified | 8.7 | ||||||
| Commercial Services | 5.8 | ||||||
| Mining | 5.1 | ||||||
| Textiles | 4.8 | ||||||
| Retail | 4.3 | ||||||
| Electric | 3.0 | ||||||
| Metal Fabricate/Hardware | 2.9 | ||||||
| Office Furnishings | 2.7 | ||||||
| Miscellaneours Manufacturing | 2.3 | ||||||
| Home Furnishings | 2.2 | ||||||
| Other | (0.3 | ) | |||||
Style Allocation (%)
| Small-Cap Value | 31.3 | ||||||
| Mid-Cap Value | 30.0 | ||||||
| Mid-Cap Growth | 17.1 | ||||||
| Small-Cap Growth | 12.2 | ||||||
| Large-Cap Value | 5.2 | ||||||
| Large-Cap Growth | 4.2 | ||||||
Top Ten Fund Holdings (% of the Fund's
Net Assets)
| Security | |||||||
| Terex Corp. | 5.4 | ||||||
| Jacobs Engineering Group, Inc. | 5.3 | ||||||
| Caterpillar, Inc. | 5.3 | ||||||
| Vulcan Materials Co. | 5.1 | ||||||
| American Standard Cos., Inc. | 4.9 | ||||||
| Mohawk Industries, Inc. | 4.8 | ||||||
| Lowe's Cos., Inc. | 4.3 | ||||||
| Lennar Corp., Class A | 4.1 | ||||||
| Infrasource Services, Inc. | 3.6 | ||||||
| NVR, Inc. | 3.2 | ||||||
| Total | 46.0 | ||||||
8
Manager's Analysis (Continued)
PowerShares Dynamic Building & Construction Portfolio (ticker: PKB)
Growth of a $10,000 Investment Since Inception
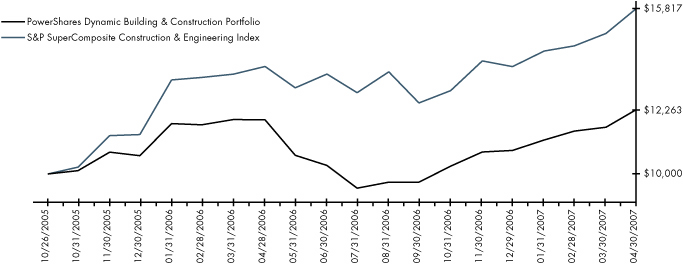
Fund Performance History (%) As of 30 April 2007
Index
| Avg. Ann.† | Fund Inception | ||||||||||||||
| 1 Year | Avg. Ann.† | Cumulative | |||||||||||||
| Dynamic Building and Construction IntellidexSM Index | 4.90 | 16.23 | 25.50 | ||||||||||||
| S&P SuperComposite Construction & Engineering Index | 14.77 | 35.49 | 58.17 | ||||||||||||
| Russell 3000® Index | 14.48 | 18.02 | 28.42 | ||||||||||||
Fund
| NAV Return | 3.06 | 14.47 | 22.63 | ||||||||||||
| Share Price Return | 3.11 | 14.44 | 22.59 | ||||||||||||
Fund Inception: 26 October 2005
Performance data quoted represents past performance. Past performance is not a guarantee of future results, current performance may be higher or lower than performance quoted. Investment returns and principal value will fluctuate and shares, when redeemed, may be worth more or less than their original cost. The Share Price performance reflects fee waivers, absent which, performance would have been lower. According to the Fund's most recent Prospectus, the Fund's total gross annual operating expenses was indicated as 0.80%. In the Financial Highlights section of this Annual Report, the Fund's net (subsidized) annualized total operating expense ratio was determined to be 0.63% while the Fund's gross annualized total operating expense ratio was 1.65%. The Adviser has contractually agreed to waive fees and/or pay certain Fund expenses which resulted in a lower fee actually paid by investors. This waiver extends through April 30, 200 8. Absent reimbursements or waivers, performance would have been lower. NAV and Share Price returns assume that dividends and capital gain distributions have been reinvested in the Fund at NAV and Share Price, respectively. The returns shown in the table above do not reflect the deduction of taxes that a shareholder would pay on Fund distributions or the redemption or sale of Fund Shares. See powershares.com to find the most recent month-end performance numbers.
The Index performance results are hypothetical. Index returns do not represent Fund returns. An investor cannot invest directly in an index. The Index does not charge management fees or brokerage expenses, and no such fees or expenses were deducted from the hypothetical performance shown nor does the index lend securities, and no revenues from securities lending were added to the performance shown. In addition, the results actual investors might have achieved would have differed from those shown because of differences in the timing, amounts of their investments, and fees and expenses associated with an investment in the Fund.
The S&P SuperComposite Construction & Engineering Index and the Russell 3000® Index are unmanaged indices based on the average performance of 9 and 3,000 common stocks, respectively.
† Average annualized
9
Manager's Analysis
PowerShares Dynamic Energy Exploration & Production Portfolio (ticker: PXE)
The PowerShares Dynamic Energy Exploration & Production Portfolio seeks to replicate, before fees and expenses, the Dynamic Energy Exploration & Production IntellidexSM Index. The index thoroughly evaluates companies based on a variety of investment merit criteria, including fundamental growth, stock valuation, investment timeliness and risk factors. Securities shown to possess the greatest capital appreciation potential are selected by the index.
The portfolio returned a respectable 14.66% for the year compared to the S&P SuperComposite Oil & Gas Exploration & Production Index which returned 11.70% for the year. During 2006 and the beginning of 2007, increasing energy prices and outages at refineries led to a rise in the prices of those companies held in the Fund. The top contributors to the portfolio's performance were refiners Tesoro, Holly, Western Refining as well as integrated oil & gas companies such as Marathon Oil, Exxon Mobil, Chevron. Anadarko Petroleum, W&T Offshore and Sunoco were the largest laggards which contributed negatively to the Fund's performance for the year.
Industry Breakdown (% of the Fund's
Net Assets)
| Oil Companies-Exploration & Production | 46.4 | ||||||
| Oil Companies-Integrated | 26.7 | ||||||
| Oil Refining & Marketing | 21.1 | ||||||
| Pipelines | 2.9 | ||||||
| Gas-Distribution | 2.9 | ||||||
| Other | 0.0 | ||||||
Style Allocation (%)
| Large-Cap Value | 29.0 | ||||||
| Mid-Cap Value | 22.9 | ||||||
| Small-Cap Value | 21.7 | ||||||
| Mid-Cap Growth | 13.7 | ||||||
| Large-Cap Growth | 10.2 | ||||||
| Small-Cap Growth | 2.5 | ||||||
Top Ten Fund Holdings (% of the Fund's
Net Assets)
| Security | |||||||
| Valero Energy Corp. | 5.4 | ||||||
| Devon Energy Corp. | 5.0 | ||||||
| Marathon Oil Corp. | 5.0 | ||||||
| Chevron Corp. | 4.9 | ||||||
| Exxon Mobil Corp. | 4.8 | ||||||
| Occidental Petroleum Corp. | 4.7 | ||||||
| XTO Energy, Inc. | 4.7 | ||||||
| Hess Corp. | 4.6 | ||||||
| Western Refining, Inc. | 3.5 | ||||||
| BreitBurn Enegry Partners LP | 3.4 | ||||||
| Total | 46.0 | ||||||
10
Manager's Analysis (Continued)
PowerShares Dynamic Energy Exploration & Production Portfolio (ticker: PXE)
Growth of a $10,000 Investment Since Inception
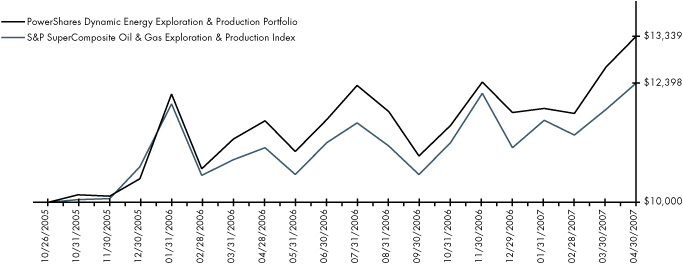
Fund Performance History (%) As of 30 April 2007
Index
| Avg. Ann.† | Fund Inception | ||||||||||||||
| 1 Year | Avg. Ann.† | Cumulative | |||||||||||||
| Dynamic Energy Exploration & Production IntellidexSM Index | 14.99 | 21.52 | 34.21 | ||||||||||||
| S&P SuperComposite Oil & Gas Exploration & Production Index | 11.70 | 15.30 | 23.98 | ||||||||||||
| Russell 3000® Index | 14.48 | 18.02 | 28.42 | ||||||||||||
Fund
| NAV Return | 14.66 | 21.03 | 33.39 | ||||||||||||
| Share Price Return | 14.34 | 20.86 | 33.11 | ||||||||||||
Fund Inception: 26 October 2005
Performance data quoted represents past performance. Past performance is not a guarantee of future results, current performance may be higher or lower than performance quoted. Investment returns and principal value will fluctuate and shares, when redeemed, may be worth more or less than their original cost. The Share Price performance reflects fee waivers, absent which, performance would have been lower. According to the Fund's most recent Prospectus, the Fund's total gross annual operating expenses was indicated as 0.75%. In the Financial Highlights section of this Annual Report, the Fund's net (subsidized) annualized total operating expense ratio was determined to be 0.63% while the Fund's gross annualized total operating expense ratio was 0.74%. The Adviser has contractually agreed to waive fees and/or pay certain Fund expenses which resulted in a lower fee actually paid by investors. This waiver extends through April 30, 200 8. Absent reimbursements or waivers, performance would have been lower. NAV and Share Price returns assume that dividends and capital gain distributions have been reinvested in the Fund at NAV and Share Price, respectively. The returns shown in the table above do not reflect the deduction of taxes that a shareholder would pay on Fund distributions or the redemption or sale of Fund Shares. See powershares.com to find the most recent month-end performance numbers.
The index performance results are hypothetical. Index returns do not represent Fund returns. An investor cannot invest directly in an index. The index does not charge management fees or brokerage expenses, and no such fees or expenses were deducted from the hypothetical performance shown nor does the index lend securities, and no revenues from securities lending were added to the performance shown. In addition, the results actual investors might have achieved would have differed from those shown because of differences in the timing, amounts of their investments, and fees and expenses associated with an investment in the Fund.
The S&P SuperComposite Oil & Gas Exploration & Production Index and the Russell 3000® Index are unmanaged indices based on the average performance of 25 and 3,000 common stocks, respectively.
† Average annualized
11
Manager's Analysis
PowerShares Dynamic Food & Beverage Portfolio (ticker: PBJ)
The PowerShares Dynamic Food & Beverage Portfolio is based on the Dynamic Food & Beverage IntellidexSM Index and seeks investment results that correspond generally to the price and yield (before the Fund's fees and expenses) of that equity index.
Over the past year, the Fund has returned a strong 16.79% but underperformed the S&P SuperComposite Food & Tobacco Products Index which returned 22.01% during the same period. Large cap stocks were in favor for the year as those largely contributed to the strong performance of the portfolio. Those stocks included Seaboard, Corn Products International, J.M. Smucker, Coca-Cola, Safeway, Jack in the Box and McDonald's. Archer Daniels Midland, Panera Bread, whereas Starbucks caused the largest drag on performance for the year.
Industry Breakdown (% of the Fund's
Net Assets)
| Food | 53.3 | ||||||
| Beverages | 23.4 | ||||||
| Retail | 18.1 | ||||||
| Miscellaneous Manufacturing | 2.5 | ||||||
| Agriculture | 2.4 | ||||||
| Money Market Fund | 0.3 | ||||||
| Other | 0.0 | ||||||
Style Allocation (%)
| Large-Cap Value | 40.8 | ||||||
| Mid-Cap Value | 30.5 | ||||||
| Small-Cap Value | 20.7 | ||||||
| Large-Cap Growth | 5.0 | ||||||
| Mid-Cap Growth | 3.0 | ||||||
Top Ten Fund Holdings (% of the Fund's
Net Assets)
| Security | |||||||
| Coca-Cola (The) Co. | 5.4 | ||||||
| Kellogg Co. | 5.2 | ||||||
| McDonald's Corp. | 5.1 | ||||||
| General Mills, Inc. | 5.1 | ||||||
| Safeway, Inc. | 5.0 | ||||||
| PepsiCo, Inc. | 5.0 | ||||||
| Yum! Brands, Inc. | 5.0 | ||||||
| Anheuser-Busch Cos., Inc. | 4.8 | ||||||
| Corn Products International, Inc. | 3.2 | ||||||
| Dean Foods Co. | 3.1 | ||||||
| Total | 46.9 | ||||||
12
Manager's Analysis (Continued)
PowerShares Dynamic Food & Beverage Portfolio (ticker: PBJ)
Growth of a $10,000 Investment Since Inception
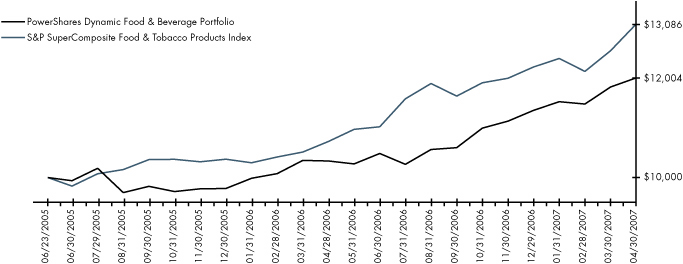
Fund Performance History (%) As of 30 April 2007
Index
| Avg. Ann.† | Fund Inception | ||||||||||||||
| 1 Year | Avg. Ann.† | Cumulative | |||||||||||||
| Dynamic Food & Beverage IntellidexSM Index | 17.39 | 11.02 | 21.37 | ||||||||||||
| S&P SuperComposite Food & Tobacco Products Index | 22.01 | 15.63 | 30.86 | ||||||||||||
| Russell 3000® Index | 14.48 | 14.60 | 28.71 | ||||||||||||
Fund
| NAV Return | 16.79 | 10.36 | 20.04 | ||||||||||||
| Share Price Return | 16.85 | 10.40 | 20.10 | ||||||||||||
Fund Inception: 23 June 2005
Performance data quoted represents past performance. Past performance is not a guarantee of future results, current performance may be higher or lower than performance quoted. Investment returns and principal value will fluctuate and shares, when redeemed, may be worth more or less than their original cost. The Share Price performance reflects fee waivers, absent which, performance would have been lower. According to the Fund's most recent Prospectus, the Fund's total gross annual operating expenses was indicated as 1.07%. In the Financial Highlights section of this Annual Report, the Fund's net (subsidized) annualized total operating expense ratio was determined to be 0.64% while the Fund's gross annualized total operating expense ratio was 1.15%. The Adviser has contractually agreed to waive fees and/or pay certain Fund expenses which resulted in a lower fee actually paid by investors. This waiver extends through April 30, 200 8. Absent reimbursements or waivers, performance would have been lower. NAV and Share Price returns assume that dividends and capital gain distributions have been reinvested in the Fund at NAV and Share Price, respectively. The returns shown in the table above do not reflect the deduction of taxes that a shareholder would pay on Fund distributions or the redemption or sale of Fund Shares. See powershares.com to find the most recent month-end performance numbers.
The index performance results are hypothetical. Index returns do not represent Fund returns. An investor cannot invest directly in an index. The index does not charge management fees or brokerage expenses, and no such fees or expenses were deducted from the hypothetical performance shown nor does the index lend securities, and no revenues from securities lending were added to the performance shown. In addition, the results actual investors might have achieved would have differed from those shown because of differences in the timing, amounts of their investments, and fees and expenses associated with an investment in the Fund.
The S&P SuperComposite Food & Tobacco Products Index and the Russell 3000® Index are unmanaged indices based on the average performance of 40 and 3,000 common stocks, respectively.
† Average annualized
13
Manager's Analysis
PowerShares Dynamic Hardware & Consumer Electronics (ticker: PHW)
The PowerShares Dynamic Hardware & Consumer Electronics Portfolio is based on the Dynamic Hardware & Consumer Electronics IntellidexSM Index and seeks investment results that correspond generally to the price and yield (before the Fund's fees and expenses) of that equity index.
Over the past year, the Fund returned 6.74% while the comparable S&P SuperComposite Technology Hardware & Equipment Index returned 10.11% during the period. Stock selection in large cap growth companies contributed to the performance of the portfolio including Hewlett-Packard, Brocade Communications Systems and Apple as well as Garmin Ltd. and Xerox. The stocks which caused the largest drag on performance for the year were Palm and Multi-Fineline Electronix.
Industry Breakdown (% of the Fund's
Net Assets)
| Computers | 48.2 | ||||||
| Elecronics | 17.4 | ||||||
| Telecommunications | 10.3 | ||||||
| Office/Business Equipment | 7.8 | ||||||
| Semiconductors | 5.7 | ||||||
| Home Furnishings | 3.2 | ||||||
| Information Technology | 2.9 | ||||||
| Commercial Services | 2.8 | ||||||
| Micellaneous Manufacturing | 2.7 | ||||||
| Other | (1.0 | ) | |||||
Style Allocation (%)
| Large-Cap Growth | 29.4 | ||||||
| Small-Cap Value | 23.1 | ||||||
| Mid-Cap Growth | 18.6 | ||||||
| Mid-Cap Value | 15.5 | ||||||
| Small-Cap Growth | 8.5 | ||||||
| Large-Cap Value | 4.9 | ||||||
Top Ten Fund Holdings (% of the Fund's
Net Assets)
| Security | |||||||
| Apple, Inc. | 5.5 | ||||||
| EMC Corp. | 5.2 | ||||||
| Dell, Inc. | 5.2 | ||||||
| Xerox Corp. | 5.1 | ||||||
| Hewlett-Packard Co. | 5.1 | ||||||
| Network Appliance, Inc. | 4.6 | ||||||
| Motorola, Inc. | 4.5 | ||||||
| Sun Microsystems, Inc. | 4.1 | ||||||
| Paxar Corp. | 3.5 | ||||||
| Plantronics, Inc. | 3.2 | ||||||
| Total | 46.0 | ||||||
14
Manager's Analysis (Continued)
PowerShares Dynamic Hardware & Consumer Electronics (ticker: PHW)
Growth of a $10,000 Investment Since Inception
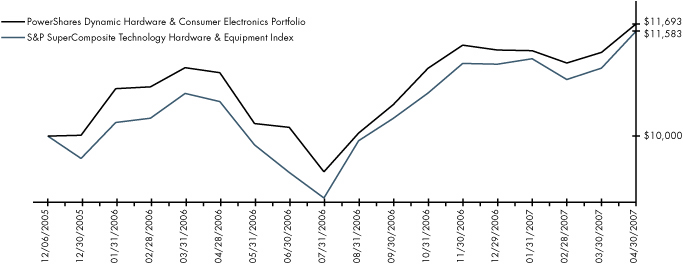
Fund Performance History (%) As of 30 April 2007
Index
| Avg. Ann.† | Fund Inception | ||||||||||||||
| 1 Year | Avg. Ann.† | Cumulative | |||||||||||||
| Dynamic Hardware & Consumer Electronics IntellidexSM Index | 7.32 | 12.52 | 17.92 | ||||||||||||
| S&P SuperComposite Technology Hardware & Equipment Index | 10.11 | 11.09 | 15.83 | ||||||||||||
| Russell 3000® Index | 14.48 | 14.31 | 20.55 | ||||||||||||
Fund
| NAV Return | 6.74 | 11.84 | 16.93 | ||||||||||||
| Share Price Return | 6.65 | 11.82 | 16.89 | ||||||||||||
Fund Inception: 6 December 2005
Performance data quoted represents past performance. Past performance is not a guarantee of future results, current performance may be higher or lower than performance quoted. Investment returns and principal value will fluctuate and shares, when redeemed, may be worth more or less than their original cost. The Share Price performance reflects fee waivers, absent which, performance would have been lower. According to the Fund's most recent Prospectus, the Fund's total gross annual operating expenses was indicated as 1.03%. In the Financial Highlights section of this Annual Report, the Fund's net (subsidized) annualized total operating expense ratio was determined to be 0.72% while the Fund's gross annualized total operating expense ratio was 1.96%. The Adviser has contractually agreed to waive fees and/or pay certain Fund expenses which resulted in a lower fee actually paid by investors. This waiver extends through April 30, 200 8. Absent reimbursements or waivers, performance would have been lower. NAV and Share Price returns assume that dividends and capital gain distributions have been reinvested in the Fund at NAV and Share Price, respectively. The returns shown in the table above do not reflect the deduction of taxes that a shareholder would pay on Fund distributions or the redemption or sale of Fund Shares. See powershares.com to find the most recent month-end performance numbers.
The index performance results are hypothetical. Index returns do not represent Fund returns. An investor cannot invest directly in an index. The index does not charge management fees or brokerage expenses, and no such fees or expenses were deducted from the hypothetical performance shown nor does the index lend securities, and no revenues from securities lending were added to the performance shown. In addition, the results actual investors might have achieved would have differed from those shown because of differences in the timing, amounts of their investments, and fees and expenses associated with an investment in the Fund.
The S&P SuperComposite Technology Hardware & Equipment Index and the Russell 3000® Index are unmanaged indices based on the average performance of 108 and 3,000 common stocks, respectively.
† Average annualized
15
Manager's Analysis
PowerShares Dynamic Healthcare Services Portfolio (ticker: PTJ)
The PowerShares Dynamic Healthcare Services Portfolio is based on the Dynamic Healthcare Services IntellidexSM Index. The Index thoroughly evaluates companies based on a variety of investment merit criteria, including fundamental growth, stock valuation, investment timeliness and risk factors. Securities shown to possess the greatest capital appreciation potential are selected by the Index
Since its October 12, 2006 inception date, the Fund has shown strong performance returning 12.70%. Over that short time, the portfolio easily outperformed the broader Dow Jones US Healthcare Index as well as the more narrow Dow Jones Healthcare Providers Index. Those stocks which contributed to the portfolio's performance since inception were Express Scripts, CIGNA and WellCare Group. Caremark Rx and Molina Healthcare were two of the laggards on the Fund's performance.
Industry Breakdown (% of the Fund's
Net Assets)
| Medical-HMO | 35.6 | ||||||
| Human Resources | 8.5 | ||||||
| Medical-Outpatient/Home Medical Care | 7.9 | ||||||
| Pharmacy Services | 6.0 | ||||||
| Medical-Nursing Homes | 5.7 | ||||||
| Medical-Hospitals | 5.4 | ||||||
| Life/Health Insurance | 5.3 | ||||||
| Health Care Cost Containment | 5.1 | ||||||
| Medical-Wholesale Drug Distribution | 4.5 | ||||||
| Dental Supplies & Equipment | 2.9 | ||||||
| Diversified Operations | 2.9 | ||||||
| Physician Practice Management | 2.8 | ||||||
| Medical Labs & Testing Services | 2.7 | ||||||
| Medical Products | 2.5 | ||||||
| Retirement/Aged Care | 2.5 | ||||||
| Other | (0.3 | ) | |||||
Style Allocation (%)
| Mid-Cap Growth | 30.4 | ||||||
| Large-Cap Growth | 19.8 | ||||||
| Small-Cap Value | 18.2 | ||||||
| Small-Cap Growth | 16.3 | ||||||
| Mid-Cap Value | 10.0 | ||||||
| Large-Cap Value | 5.3 | ||||||
Top Ten Fund Holdings (% of the Fund's
Net Assets)
| Security | |||||||
| Express Scripts, Inc. | 6.0 | ||||||
| CIGNA Corp. | 5.3 | ||||||
| Humana, Inc. | 5.1 | ||||||
| McKesson Corp. | 5.1 | ||||||
| Aetna, Inc. | 5.0 | ||||||
| UnitedHealth Group, Inc. | 4.9 | ||||||
| WellPoint, Inc. | 4.8 | ||||||
| AmerisourceBergen Corp. | 4.5 | ||||||
| Emergency Medical Services Corp., Class A | 3.5 | ||||||
| Manor Care, Inc. | 3.2 | ||||||
| Total | 47.4 | ||||||
16
Manager's Analysis (Continued)
PowerShares Dynamic Healthcare Services Portfolio (ticker: PTJ)
Growth of a $10,000 Investment Since Inception

Fund Performance History (%) As of 30 April 2007
Index
| Fund Inception Cumulative | |||||||
| Dynamic Healthcare Services IntellidexSM Index | 13.25 | ||||||
| Dow Jones US Healthcare Index | 8.19 | ||||||
| Dow Jones Healthcare Providers Index | 12.36 | ||||||
Fund
| NAV Return | 12.70 | ||||||
| Share Price Return | 12.78 | ||||||
Fund Inception: 12 October 2006
Performance data quoted represents past performance. Past performance is not a guarantee of future results, current performance may be higher or lower than performance quoted. Investment returns and principal value will fluctuate and shares, when redeemed, may be worth more or less than their original cost. The Share Price performance reflects fee waivers, absent which, performance would have been lower. According to the Fund's most recent Prospectus, the Fund's total gross annual operating expenses was indicated as 0.70%. In the Financial Highlights section of this Annual Report, the Fund's net (subsidized) annualized total operating expense ratio was determined to be 0.70% while the Fund's gross annualized total operating expense ratio was 1.20%. The Adviser has contractually agreed to waive fees and/or pay certain Fund expenses which resulted in a lower fee actually paid by investors. This waiver extends through April 30, 200 8. Absent reimbursements or waivers, performance would have been lower. NAV and Share Price returns assume that dividends and capital gain distributions have been reinvested in the Fund at NAV and Share Price, respectively. The returns shown in the table above do not reflect the deduction of taxes that a shareholder would pay on Fund distributions or the redemption or sale of Fund Shares. See powershares.com to find the most recent month-end performance numbers.
The index performance results are hypothetical. Index returns do not represent Fund returns. An investor cannot invest directly in an index. The index does not charge management fees or brokerage expenses, and no such fees or expenses were deducted from the hypothetical performance shown nor does the index lend securities, and no revenues from securities lending were added to the performance shown. In addition, the results actual investors might have achieved would have differed from those shown because of differences in the timing, amounts of their investments, and fees and expenses associated with an investment in the Fund.
The Dow Jones US Healthcare Index and the Dow Jones Healthcare Providers Index are unmanaged indices based on the average performance of approximately 50 and 180 common stocks, respectively.
17
Manager's Analysis
PowerShares Dynamic Insurance Portfolio (ticker: PIC)
The PowerShares Dynamic Insurance Portfolio is based on the Dynamic Insurance IntellidexSM Index and seeks investment results that correspond generally to the price and yield (before the Fund's fees and expenses) of that equity index.
Over the past year, the Fund has returned 9.62%, underperforming the S&P SuperComposite Insurance Index which returned 12.49% during the same period. Stock selection in large cap value stocks hindered performance, however, stock selection in small cap stocks added to performance for the year. Those stocks which contributed positively to the portfolio's performance were Loews, Lincoln National and Odyssey Re Holdings. AON, Progressive, Ohio Casualty and Radian Group were among the Fund's laggards.
Industry Breakdown (% of the Fund's
Net Assets)
| Property/Casualty Insurance | 38.8 | ||||||
| Multi-Line Insurance | 26.2 | ||||||
| Life/Health Insurance | 21.0 | ||||||
| Reinsurance | 8.3 | ||||||
| Insurance Brokers | 2.8 | ||||||
| Financial Guarantee Insurance | 2.8 | ||||||
| Other | 0.1 | ||||||
Style Allocation (%)
| Large-Cap Value | 40.6 | ||||||
| Mid-Cap Value | 35.3 | ||||||
| Small-Cap Value | 21.7 | ||||||
| Mid-Cap Growth | 2.4 | ||||||
Top Ten Fund Holdings (% of the Fund's
Net Assets)
| Security | |||||||
| Loews Corp. | 5.3 | ||||||
| Hartford Financial Services Group (The), Inc. | 5.2 | ||||||
| ACE Ltd. (Cayman Islands) | 5.1 | ||||||
| Prudential Financial, Inc. | 5.1 | ||||||
| Travelers Cos. (The), Inc. | 5.0 | ||||||
| Chubb (The) Corp. | 5.0 | ||||||
| Lincoln National Corp. | 5.0 | ||||||
| Progressive (The) Corp. | 4.9 | ||||||
| Arch Capital Group Ltd. (Bermuda) | 3.0 | ||||||
| Commerce Group (The), Inc. | 2.9 | ||||||
| Total | 46.5 | ||||||
18
Manager's Analysis (Continued)
PowerShares Dynamic Insurance Portfolio (ticker: PIC)
Growth of a $10,000 Investment Since Inception

Fund Performance History (%) As of 30 April 2007
Index
| Avg. Ann.† | Fund Inception | ||||||||||||||
| 1 Year | Avg. Ann.† | Cumulative | |||||||||||||
| Dynamic Insurance IntellidexSM Index | 10.15 | 15.54 | 24.37 | ||||||||||||
| S&P SuperComposite Insurance Index | 12.49 | 13.72 | 21.42 | ||||||||||||
| Russell 3000® Index | 14.48 | 18.02 | 28.42 | ||||||||||||
Fund
| NAV Return | 9.62 | 14.93 | 23.37 | ||||||||||||
| Share Price Return | 9.56 | 14.93 | 23.37 | ||||||||||||
Fund Inception: 26 October 2005
Performance data quoted represents past performance. Past performance is not a guarantee of future results, current performance may be higher or lower than performance quoted. Investment returns and principal value will fluctuate and shares, when redeemed, may be worth more or less than their original cost. The Share Price performance reflects fee waivers, absent which, performance would have been lower. According to the Fund's most recent Prospectus, the Fund's total gross annual operating expenses was indicated as 0.87%. In the Financial Highlights section of this Annual Report, the Fund's net (subsidized) annualized total operating expense ratio was determined to be 0.63% while the Fund's gross annualized total operating expense ratio was 0.96%. The Adviser has contractually agreed to waive fees and/or pay certain Fund expenses which resulted in a lower fee actually paid by investors. This waiver extends through April 30, 200 8. Absent reimbursements or waivers, performance would have been lower. NAV and Share Price returns assume that dividends and capital gain distributions have been reinvested in the Fund at NAV and Share Price, respectively. The returns shown in the table above do not reflect the deduction of taxes that a shareholder would pay on Fund distributions or the redemption or sale of Fund Shares. See powershares.com to find the most recent month-end performance numbers.
The Index performance results are hypothetical. Index returns do not represent Fund returns. An investor cannot invest directly in an index. The index does not charge management fees or brokerage expenses, and no such fees or expenses were deducted from the hypothetical performance shown nor does the index lend securities, and no revenues from securities lending were added to the performance shown. In addition, the results actual investors might have achieved would have differed from those shown because of differences in the timing, amounts of their investments, and fees and expenses associated with an investment in the Fund.
The S&P SuperComposite Insurance Index and the Russell 3000® Index are unmanaged indices based on the average performance of 52 and 3,000 common stocks, respectively.
† Average annualized
19
Manager's Analysis
PowerShares Dynamic Leisure and Entertainment Portfolio (ticker: PEJ)
The PowerShares Dynamic Leisure and Entertainment Portfolio is based on the Dynamic Leisure and Entertainment IntellidexSM Index and seeks investment results that correspond generally to the price and yield (before the Fund's fees and expenses) of that equity index.
The PowerShares Dynamic Leisure and Entertainment Portfolio returned 13.02% to shareholders during the reporting period. PEJ continued to keep pace with the broad U.S. market posting similar results to the S&P SuperComposite Hotels, Restaurants & Leisure Index. The Fund is comprised mainly of consumer discretionary stocks. Restaurant stocks continued to lead the charge with McDonald's, Jack in the Box and Bob Evans Farms contributing positively. Internet retail stock Priceline.com performed exceptionally well helping the Fund's returns. Media stocks were generally unimpressive with World Wrestling Entertainment and Warner Music Group lagging.
Industry Breakdown (% of the Fund's
Net Assets)
| Retail | 40.8 | ||||||
| Lodging | 20.3 | ||||||
| Media | 12.8 | ||||||
| Entertainment | 9.8 | ||||||
| Internet | 8.5 | ||||||
| Leisure Time | 8.2 | ||||||
| Other | (0.4 | ) | |||||
Style Allocation (%)
| Small-Cap Value | 24.1 | ||||||
| Mid-Cap Value | 21.5 | ||||||
| Mid-Cap Growth | 18.0 | ||||||
| Large-Cap Value | 16.0 | ||||||
| Large-Cap Growth | 14.7 | ||||||
| Small-Cap Growth | 5.7 | ||||||
Top Ten Fund Holdings (% of the Fund's
Net Assets)
| Security | |||||||
| McDonald's Corp. | 5.4 | ||||||
| Carnival Corp. (Panama) | 5.2 | ||||||
| Yum! Brands, Inc. | 5.2 | ||||||
| CBS Corp., Class B | 5.2 | ||||||
| Walt Disney (The) Co. | 5.1 | ||||||
| Hilton Hotels Corp. | 4.7 | ||||||
| Marriott International, Inc., Class A | 4.7 | ||||||
| International Game Technology | 4.5 | ||||||
| Wendy's International, Inc. | 3.2 | ||||||
| Expedia, Inc. | 3.0 | ||||||
| Total | 46.2 | ||||||
20
Manager's Analysis (Continued)
PowerShares Dynamic Leisure and Entertainment Portfolio (ticker: PEJ)
Growth of a $10,000 Investment Since Inception
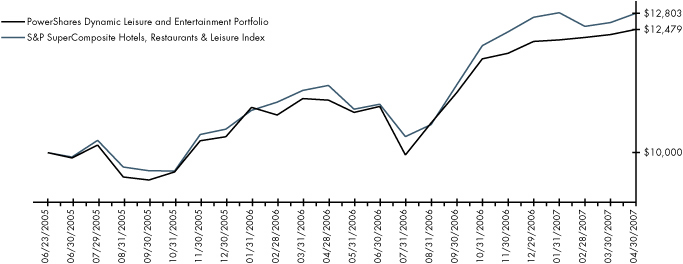
Fund Performance History (%) As of 30 April 2007
Index
| Avg. Ann.† | Fund Inception | ||||||||||||||
| 1 Year | Avg. Ann.† | Cumulative | |||||||||||||
| Dynamic Leisure and Entertainment IntellidexSM Index | 13.71 | 13.44 | 26.31 | ||||||||||||
| S&P SuperComposite Hotels, Restaurants & Leisure Index | 12.79 | 14.27 | 28.03 | ||||||||||||
| Russell 3000® Index | 14.48 | 14.60 | 28.71 | ||||||||||||
Fund
| NAV Return | 13.02 | 12.70 | 24.79 | ||||||||||||
| Share Price Return | 12.98 | 12.72 | 24.82 | ||||||||||||
Fund Inception: 23 June 2005
Performance data quoted represents past performance. Past performance is not a guarantee of future results, current performance may be higher or lower than performance quoted. Investment returns and principal value will fluctuate and shares, when redeemed, may be worth more or less than their original cost. The Share Price performance reflects fee waivers, absent which, performance would have been lower. According to the Fund's most recent Prospectus, the Fund's total gross annual operating expenses was indicated as 1.03%. In the Financial Highlights section of this Annual Report, the Fund's net (subsidized) annualized total operating expense ratio was determined to be 0.64% while the Fund's gross annualized total operating expense ratio was 1.07%. The Adviser has contractually agreed to waive fees and/or pay certain Fund expenses which resulted in a lower fee actually paid by investors. This waiver extends through April 30, 200 8. Absent reimbursements or waivers, performance would have been lower. NAV and Share Price returns assume that dividends and capital gain distributions have been reinvested in the Fund at NAV and Share Price, respectively. The returns shown in the table above do not reflect the deduction of taxes that a shareholder would pay on Fund distributions or the redemption or sale of Fund Shares. See powershares.com to find the most recent month-end performance numbers.
The index performance results are hypothetical. Index returns do not represent Fund returns. An investor cannot invest directly in an index. The index does not charge management fees or brokerage expenses, and no such fees or expenses were deducted from the hypothetical performance shown nor does the index lend securities, and no revenues from securities lending were added to the performance shown. In addition, the results actual investors might have achieved would have differed from those shown because of differences in the timing, amounts of their investments, and fees and expenses associated with an investment in the Fund.
The S&P SuperComposite Hotels, Restaurants & Leisure Index and the Russell 3000® Index are unmanaged indices based on the average performance of 45 and 3,000 common stocks, respectively.
† Average annualized
21
Manager's Analysis
PowerShares Dynamic Media Portfolio (ticker: PBS)
The PowerShares Dynamic Media Portfolio is based on the Dynamic Media IntellidexSM Index and seeks investment results that correspond generally to the price and yield (before the Fund's fees and expenses) of that equity index.
PowerShares Dynamic Media Portfolio returned 14.42% during the reporting period. Sinclair Broadcast Group had stunning performance during the reporting period boosting the Fund's returns along with media stocks Direct TV, Clear Channel Communications and Walt Disney. Internet services company ValueClick and WebMD, an internet heath care stock, both performed well while Getty Images and Valassis Communications lagged.
Industry Breakdown (% of the Fund's
Net Assets)
| Media | 65.4 | ||||||
| Advertising | 13.1 | ||||||
| Internet | 10.8 | ||||||
| Commercial Services | 5.2 | ||||||
| Computers | 2.9 | ||||||
| Telecommunications | 2.7 | ||||||
| Money Market Fund | 0.1 | ||||||
| Other | (0.2 | ) | |||||
Style Allocation (%)
| Large-Cap Growth | 24.9 | ||||||
| Small-Cap Value | 24.6 | ||||||
| Mid-Cap Growth | 17.4 | ||||||
| Large-Cap Value | 14.9 | ||||||
| Mid-Cap Value | 12.9 | ||||||
| Small-Cap Growth | 5.3 | ||||||
Top Ten Fund Holdings (% of the Fund's
Net Assets)
| Security | |||||||
| DIRECTV Group (The), Inc. | 5.3 | ||||||
| CBS Corp., Class B | 5.2 | ||||||
| Google, Inc., Class A | 5.1 | ||||||
| Walt Disney (The) Co. | 5.1 | ||||||
| Omnicom Group, Inc. | 5.0 | ||||||
| McGraw-Hill (The) Cos., Inc. | 5.0 | ||||||
| Time Warner, Inc. | 4.9 | ||||||
| News Corp., Class A | 4.8 | ||||||
| Sinclair Broadcast Group, Inc., Class A | 3.1 | ||||||
| Mediacom Communications Corp., Class A | 3.0 | ||||||
| Total | 46.5 | ||||||
22
Manager's Analysis (Continued)
PowerShares Dynamic Media Portfolio (ticker: PBS)
Growth of a $10,000 Investment Since Inception
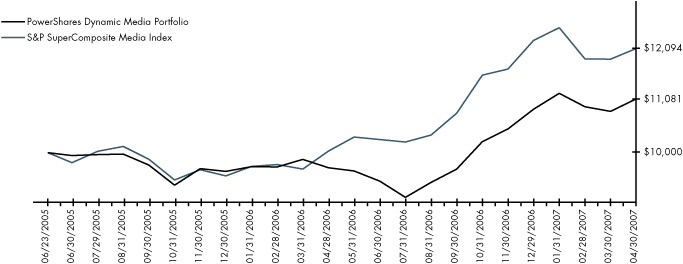
Fund Performance History (%) As of 30 April 2007
Index
| Avg. Ann.† | Fund Inception | ||||||||||||||
| 1 Year | Avg. Ann.† | Cumulative | |||||||||||||
| Dynamic Media IntellidexSM Index | 15.01 | 6.45 | 12.26 | ||||||||||||
| S&P SuperComposite Media Index | 20.56 | 10.81 | 20.94 | ||||||||||||
| Russell 3000® Index | 14.48 | 14.60 | 28.71 | ||||||||||||
Fund
| NAV Return | 14.42 | 5.70 | 10.81 | ||||||||||||
| Share Price Return | 14.35 | 5.67 | 10.75 | ||||||||||||
Fund Inception: 23 June 2005
Performance data quoted represents past performance. Past performance is not a guarantee of future results, current performance may be higher or lower than performance quoted. Investment returns and principal value will fluctuate and shares, when redeemed, may be worth more or less than their original cost. The Share Price performance reflects fee waivers, absent which, performance would have been lower. According to the Fund's most recent Prospectus, the Fund's total gross annual operating expenses was indicated as 1.04%. In the Financial Highlights section of this Annual Report, the Fund's net (subsidized) annualized total operating expense ratio was determined to be 0.64% while the Fund's gross annualized total operating expense ratio was 1.24%. The Adviser has contractually agreed to waive fees and/or pay certain Fund expenses which resulted in a lower fee actually paid by investors. This waiver extends through April 30, 200 8. Absent reimbursements or waivers, performance would have been lower. NAV and Share Price returns assume that dividends and capital gain distributions have been reinvested in the Fund at NAV and Share Price, respectively. The returns shown in the table above do not reflect the deduction of taxes that a shareholder would pay on Fund distributions or the redemption or sale of Fund Shares. See powershares.com to find the most recent month-end performance numbers.
The index performance results are hypothetical. Index returns do not represent Fund returns. An investor cannot invest directly in an index. The index does not charge management fees or brokerage expenses, and no such fees or expenses were deducted from the hypothetical performance shown nor does the index lend securities, and no revenues from securities lending were added to the performance shown. In addition, the results actual investors might have achieved would have differed from those shown because of differences in the timing, amounts of their investments, and fees and expenses associated with an investment in the Fund.
The S&P SuperComposite Media Index and the Russell 3000® Index are unmanaged indices based on the average performance of 52 and 3,000 common stocks, respectively.
† Average annualized
23
Manager's Analysis
PowerShares Dynamic Networking Portfolio (ticker: PXQ)
The PowerShares Dynamic Networking Portfolio is based on the Dynamic Networking IntellidexSM Index and seeks investment results that correspond generally to the price and yield (before the Fund's fees and expenses) of that equity index.
PowerShares Dynamic Networking Portfolio posted a 7.48% return to shareholders during the reporting period. Communications equipment companies led the Fund's performance with Juniper, Cisco and Sonus Networks performing well. Software companies also furthered the Fund's performance this year as Altiris and RSA Security had healthy returns. Semiconductor stocks generally had poor performance with Conexant Systems and Broadcom within the lagging group of stocks. The one bright spot for the Fund's semiconductor stocks was Agere Systems while all others were a drag to the Fund's performance.
Industry Breakdown (% of the Fund's
Net Assets)
| Telecommunications | 64.8 | ||||||
| Internet | 13.5 | ||||||
| Semiconductors | 13.4 | ||||||
| Software | 5.1 | ||||||
| Computers | 3.3 | ||||||
| Other | (0.1 | ) | |||||
Style Allocation (%)
| Small-Cap Growth | 35.3 | ||||||
| Mid-Cap Growth | 24.4 | ||||||
| Small-Cap Value | 16.7 | ||||||
| Mid-Cap Value | 13.3 | ||||||
| Large-Cap Growth | 10.3 | ||||||
Top Ten Fund Holdings (% of the Fund's
Net Assets)
| Security | |||||||
| Juniper Networks, Inc. | 5.9 | ||||||
| McAfee, Inc. | 5.3 | ||||||
| QUALCOMM, Inc. | 5.2 | ||||||
| Avaya, Inc. | 5.2 | ||||||
| Citrix Systems, Inc. | 5.1 | ||||||
| F5 Networks, Inc. | 5.1 | ||||||
| Tellabs, Inc. | 5.1 | ||||||
| Cisco Systems, Inc. | 5.0 | ||||||
| Netgear, Inc. | 3.3 | ||||||
| Brocade Communications Systems, Inc. | 3.3 | ||||||
| Total | 48.5 | ||||||
24
Manager's Analysis (Continued)
PowerShares Dynamic Networking Portfolio (ticker: PXQ)
Growth of a $10,000 Investment Since Inception

Fund Performance History (%) As of 30 April 2007
Index
| Avg. Ann.† | Fund Inception | ||||||||||||||
| 1 Year | Avg. Ann.† | Cumulative | |||||||||||||
| Dynamic Networking IntellidexSM Index | 8.13 | 13.17 | 25.76 | ||||||||||||
| S&P SuperComposite Communications Equipment Index | 2.14 | 13.11 | 25.64 | ||||||||||||
| Russell 3000® Index | 14.48 | 14.60 | 28.71 | ||||||||||||
Fund
| NAV Return | 7.48 | 12.74 | 24.87 | ||||||||||||
| Share Price Return | 7.67 | 12.74 | 24.87 | ||||||||||||
Fund Inception: 23 June 2005
Performance data quoted represents past performance. Past performance is not a guarantee of future results, current performance may be higher or lower than performance quoted. Investment returns and principal value will fluctuate and shares, when redeemed, may be worth more or less than their original cost. The Share Price performance reflects fee waivers, absent which, performance would have been lower. According to the Fund's most recent Prospectus, the Fund's total gross annual operating expenses was indicated as 1.03%. In the Financial Highlights section of this Annual Report, the Fund's net (subsidized) annualized total operating expense ratio was determined to be 0.64% while the Fund's gross annualized total operating expense ratio was 1.24%. The Adviser has contractually agreed to waive fees and/or pay certain Fund expenses which resulted in a lower fee actually paid by investors. This waiver extends through April 30, 200 8. Absent reimbursements or waivers, performance would have been lower. NAV and Share Price returns assume that dividends and capital gain distributions have been reinvested in the Fund at NAV and Share Price, respectively. The returns shown in the table above do not reflect the deduction of taxes that a shareholder would pay on Fund distributions or the redemption or sale of Fund Shares. See powershares.com to find the most recent month-end performance numbers.
The index performance results are hypothetical. Index returns do not represent Fund returns. An investor cannot invest directly in an index. The index does not charge management fees or brokerage expenses, and no such fees or expenses were deducted from the hypothetical performance shown nor does the index lend securities, and no revenues from securities lending were added to the performance shown. In addition, the results actual investors might have achieved would have differed from those shown because of differences in the timing, amounts of their investments, and fees and expenses associated with an investment in the Fund.
The S&P SuperComposite Communications Equipment Index and the Russell 3000® Index are unmanaged indices used as a measurement of change in stock market conditions based on the average performance of 38 and 3,000 common stocks, respectively.
† Average annualized
25
Manager's Analysis
PowerShares Dynamic Oil & Gas Services Portfolio (ticker: PXJ)
The PowerShares Dynamic Oil & Gas Services Portfolio is based on the Dynamic Oil Services IntellidexSM Index and seeks investment results that correspond generally to the price and yield (before the Fund's fees and expenses) of that equity index.
The PowerShares Dynamic Oil & Gas Services Portfolio returned 6.03% to shareholders. The Fund benefited most from energy equipment and services companies. Veritas, Input/Output and National Oilwell Varco all posted respectable returns during the reporting period. Other solid performers were Overseas Shipholding Group and Foster Wheeler both posting handsome gains. The Fund was hurt by laggards Weatherford Int., Halliburton and Horizon Offshore.
Industry Breakdown (% of the Fund's
Net Assets)
| Oil & Gas Services | 60.6 | ||||||
| Oil & Gas | 28.4 | ||||||
| Transportation | 5.6 | ||||||
| Engineering & Construction | 5.4 | ||||||
| Money Market | 0.1 | ||||||
| Other | (0.1 | ) | |||||
Style Allocation (%)
| Mid-Cap Growth | 38.9 | ||||||
| Large-Cap Growth | 30.1 | ||||||
| Small-Cap Value | 16.3 | ||||||
| Small-Cap Growth | 7.5 | ||||||
| Mid-Cap Value | 7.2 | ||||||
Top Ten Fund Holdings (% of the Fund's
Net Assets)
| Security | |||||||
| Baker Hughes, Inc. | 5.4 | ||||||
| National Oilwell Varco, Inc. | 5.4 | ||||||
| Schlumberger Ltd. (Netherlands) | 5.1 | ||||||
| Transocean, Inc. (Cayman Islands) | 4.8 | ||||||
| GlobalSantaFe Corp. (Cayman Islands) | 4.8 | ||||||
| Diamond Offshore Drilling, Inc. | 4.7 | ||||||
| BJ Services Co. | 4.6 | ||||||
| Halliburton Co. | 4.5 | ||||||
| Global Industries Ltd. | 3.6 | ||||||
| Todco | 3.2 | ||||||
| Total | 46.1 | ||||||
26
Manager's Analysis (Continued)
PowerShares Dynamic Oil & Gas Services Portfolio (ticker: PXJ)
Growth of a $10,000 Investment Since Inception
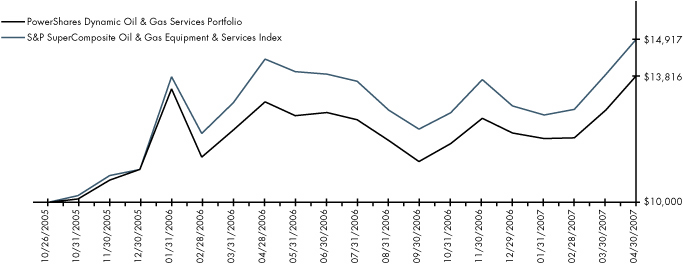
Fund Performance History (%) As of 30 April 2007
Index
| Avg. Ann.† | Fund Inception | ||||||||||||||
| 1 Year | Avg. Ann.† | Cumulative | |||||||||||||
| Dynamic Oil Services IntellidexSM Index | 6.03 | 24.20 | 38.71 | ||||||||||||
| S&P SuperComposite Oil & Gas Equipment & Services Index | 4.16 | 30.33 | 49.17 | ||||||||||||
| Russell 3000® Index | 14.48 | 18.02 | 28.42 | ||||||||||||
Fund
| NAV Return | 6.03 | 23.88 | 38.16 | ||||||||||||
| Share Price Return | 5.80 | 23.89 | 38.17 | ||||||||||||
Fund Inception: 26 October 2005
Performance data quoted represents past performance. Past performance is not a guarantee of future results, current performance may be higher or lower than performance quoted. Investment returns and principal value will fluctuate and shares, when redeemed, may be worth more or less than their original cost. The Share Price performance reflects fee waivers, absent which, performance would have been lower. According to the Fund's most recent Prospectus, the Fund's total gross annual operating expenses was indicated as 0.67%. In the Financial Highlights section of this Annual Report, the Fund's net (subsidized) annualized total operating expense ratio was determined to be 0.63% while the Fund's gross annualized total operating expense ratio was 0.65%. The Adviser has contractually agreed to waive fees and/or pay certain Fund expenses which resulted in a lower fee actually paid by investors. This waiver extends through April 30, 200 8. Absent reimbursements or waivers, performance would have been lower. NAV and Share Price returns assume that dividends and capital gain distributions have been reinvested in the Fund at NAV and Share Price, respectively. The returns shown in the table above do not reflect the deduction of taxes that a shareholder would pay on Fund distributions or the redemption or sale of Fund Shares. See powershares.com to find the most recent month-end performance numbers.
The index performance results are hypothetical. Index returns do not represent Fund returns. An investor cannot invest directly in an index. The index does not charge management fees or brokerage expenses, and no such fees or expenses were deducted from the hypothetical performance shown nor does the index lend securities, and no revenues from securities lending were added to the performance shown. In addition, the results actual investors might have achieved would have differed from those shown because of differences in the timing, amounts of their investments, and fees and expenses associated with an investment in the Fund.
The S&P SuperComposite Oil & Gas Equipment & Services Index and the Russell 3000® Index are unmanaged indices based on the average performance of 25 and 3,000 common stocks, respectively.
† Average annualized
27
Manager's Analysis
PowerShares Dynamic Pharmaceuticals Portfolio (ticker: PJP)
The PowerShares Dynamic Pharmaceuticals Portfolio is based on the Dynamic Pharmaceuticals IntellidexSM Index and seeks investment results that correspond generally to the price and yield (before the Fund's fees and expenses) of that equity index.
Pharmaceutical stocks posted strong rebounds from the prior year helping the Fund post a 19.20% return for the reporting period. The returns of the Fund were slightly behind the S&P SuperComposite Pharmaceutical Index which posted a 20.80% return for the same period. The Fund, however, remains well ahead of that index, posting a since inception cumulative return of 33.20% while the S&P SuperComposite Pharmaceutical Index has returned only 16.91%.
Merck, Schering-Plough and Abbott Laboratories all posted solid returns for the year. The Fund benefited from biotech companies which are involved in the pharmaceutical space. Biotechnology companies MedImmune, Inc., Gilead Sciences and Millennium Pharmaceuticals all posted handsome returns for the reporting period, adding to the Fund's healthy gains.
Industry Breakdown (% of the Fund's
Net Assets)
| Pharmaceuticals | 70.7 | ||||||
| Biotechnology | 18.9 | ||||||
| Healthcare-Products | 4.8 | ||||||
| Household Products/Wares | 2.9 | ||||||
| Cosmetics & Personal Care | 2.7 | ||||||
| Other | 0.0 | ||||||
Style Allocation (%)
| Large-Cap Growth | 26.4 | ||||||
| Large-Cap Value | 25.9 | ||||||
| Mid-Cap Growth | 17.6 | ||||||
| Small-Cap Growth | 17.0 | ||||||
| Small-Cap Value | 7.9 | ||||||
| Mid-Cap Value | 5.2 | ||||||
Top Ten Fund Holdings (% of the Fund's
Net Assets)
| Security | |||||||
| Schering-Plough Corp. | 6.4 | ||||||
| Merck & Co., Inc. | 5.7 | ||||||
| Wyeth | 5.3 | ||||||
| Eli Lilly & Co. | 5.2 | ||||||
| Pfizer, Inc. | 5.0 | ||||||
| Johnson & Johnson | 4.8 | ||||||
| Amgen, Inc. | 4.6 | ||||||
| MedImmune, Inc. | 4.5 | ||||||
| Genentech, Inc. | 4.5 | ||||||
| Prestige Brands Holdings, Inc. | 2.9 | ||||||
| Total | 48.9 | ||||||
28
Manager's Analysis (Continued)
PowerShares Dynamic Pharmaceuticals Portfolio (ticker: PJP)
Growth of a $10,000 Investment Since Inception
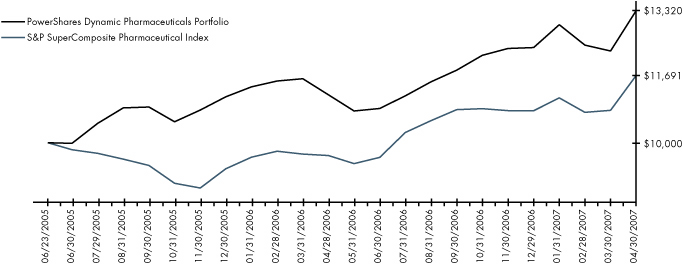
Fund Performance History (%) As of 30 April 2007
Index
| Avg. Ann.† | Fund Inception | ||||||||||||||
| 1 Year | Avg. Ann.† | Cumulative | |||||||||||||
| Dynamic Pharmaceuticals IntellidexSM Index | 19.76 | 17.18 | 34.12 | ||||||||||||
| S&P SuperComposite Pharmaceutical Index | 20.80 | 8.80 | 16.91 | ||||||||||||
| Russell 3000® Index | 14.48 | 14.60 | 28.71 | ||||||||||||
Fund
| NAV Return | 19.20 | 16.74 | 33.20 | ||||||||||||
| Share Price Return | 19.10 | 16.75 | 33.22 | �� | |||||||||||
Fund Inception: 23 June 2005
Performance data quoted represents past performance. Past performance is not a guarantee of future results, current performance may be higher or lower than performance quoted. Investment returns and principal value will fluctuate and shares, when redeemed, may be worth more or less than their original cost. The Share Price performance reflects fee waivers, absent which, performance would have been lower. According to the Fund's most recent Prospectus, the Fund's total gross annual operating expenses was indicated as 0.88%. In the Financial Highlights section of this Annual Report, the Fund's net (subsidized) annualized total operating expense ratio was determined to be 0.63% while the Fund's gross annualized total operating expense ratio was 0.80%. The Adviser has contractually agreed to waive fees and/or pay certain Fund expenses which resulted in a lower fee actually paid by investors. This waiver extends through April 30, 200 8. Absent reimbursements or waivers, performance would have been lower. NAV and Share Price returns assume that dividends and capital gain distributions have been reinvested in the Fund at NAV and Share Price, respectively. The returns shown in the table above do not reflect the deduction of taxes that a shareholder would pay on Fund distributions or the redemption or sale of Fund Shares. See powershares.com to find the most recent month-end performance numbers.
The index performance results are hypothetical. Index returns do not represent Fund returns. An investor cannot invest directly in an index. The index does not charge management fees or brokerage expenses, and no such fees or expenses were deducted from the hypothetical performance shown nor does the index lend securities, and no revenues from securities lending were added to the performance shown. In addition, the results actual investors might have achieved would have differed from those shown because of differences in the timing, amounts of their investments, and fees and expenses associated with an investment in the Fund.
The S&P SuperComposite Pharmaceutical Index and the Russell 3000® Index are unmanaged indices based on the average performance of 44 and 3,000 common stocks, respectively.
† Average annualized
29
Manager's Analysis
PowerShares Dynamic Retail Portfolio (ticker: PMR)
The PowerShares Dynamic Retail Portfolio is based on the Dynamic Retail IntellidexSM Index and seeks investment results that correspond generally to the price and yield (before the Fund's fees and expenses) of that equity index.
The PowerShares Dynamic Retail Portfolio returned 9.72% to shareholders during the reporting period. Since the Fund's inception in October of 2005 the Fund has delivered a 32.74% cumulative return. Retail companies continued to perform well during the year. Nordstrom's, Sears and J.C. Penney all posted excellent returns which helped the Fund. Specialty retail stores also helped boost returns in the Fund. Buckle, Inc. Asbury Automotive and CarMax all had strong performances over the year. Consumer staple stocks advanced with Kroger and CVS/Caremark in the lead. Building supply companies Builders First Source and Lowe's lagged, hurting overall returns.
Industry Breakdown (% of the Fund's
Net Assets)
| Retail | 81.6 | ||||||
| Commercial Services | 5.6 | ||||||
| Food | 5.6 | ||||||
| Apparel | 2.9 | ||||||
| Distribution/Wholesale | 2.9 | ||||||
| Home Builders | 1.8 | ||||||
| Money Market Fund | 0.5 | ||||||
| Other | (0.9 | ) | |||||
Style Allocation (%)
| Small-Cap Value | 28.0 | ||||||
| Mid-Cap Value | 19.6 | ||||||
| Large-Cap Value | 15.9 | ||||||
| Mid-Cap Growth | 13.5 | ||||||
| Small-Cap Growth | 12.6 | ||||||
| Large-Cap Growth | 10.4 | ||||||
Top Ten Fund Holdings (% of the Fund's
Net Assets)
| Security | |||||||
| Safeway, Inc. | 5.6 | ||||||
| Kohl's Corp. | 5.5 | ||||||
| Sears Holdings Corp. | 5.5 | ||||||
| AutoZone, Inc. | 5.5 | ||||||
| TJX Cos., Inc. | 5.3 | ||||||
| Nordstrom, Inc. | 5.1 | ||||||
| J. C. Penney Co., Inc. | 5.1 | ||||||
| Staples, Inc. | 4.9 | ||||||
| Aeropostale, Inc. | 3.2 | ||||||
| Asbury Automotive Group, Inc. | 3.1 | ||||||
| Total | 48.8 | ||||||
30
Manager's Analysis (Continued)
PowerShares Dynamic Retail Portfolio (ticker: PMR)
Growth of a $10,000 Investment Since Inception

Fund Performance History (%) As of 30 April 2007
Index
| Avg. Ann.† | Fund Inception | ||||||||||||||
| 1 Year | Avg. Ann.† | Cumulative | |||||||||||||
| Dynamic Retail IntellidexSM Index | 10.31 | 21.25 | 33.76 | ||||||||||||
| S&P SuperComposite Retailing Index | 8.93 | 14.32 | 22.38 | ||||||||||||
| Russell 3000® Index | 14.48 | 18.02 | 28.42 | ||||||||||||
Fund
| NAV Return | 9.72 | 20.64 | 32.74 | ||||||||||||
| Share Price Return | 9.87 | 20.65 | 32.76 | ||||||||||||
Fund Inception: 26 October 2005
Performance data quoted represents past performance. Past performance is not a guarantee of future results, current performance may be higher or lower than performance quoted. Investment returns and principal value will fluctuate and shares, when redeemed, may be worth more or less than their original cost. The Share Price performance reflects fee waivers, absent which, performance would have been lower. According to the Fund's most recent Prospectus, the Fund's total gross annual operating expenses was indicated as 0.97%. In the Financial Highlights section of this Annual Report, the Fund's net (subsidized) annualized total operating expense ratio was determined to be 0.64% while the Fund's gross annualized total operating expense ratio was 1.41%. The Adviser has contractually agreed to waive fees and/or pay certain Fund expenses which resulted in a lower fee actually paid by investors. This waiver extends through April 30, 200 8. Absent reimbursements or waivers, performance would have been lower. NAV and Share Price returns assume that dividends and capital gain distributions have been reinvested in the Fund at NAV and Share Price, respectively. The returns shown in the table above do not reflect the deduction of taxes that a shareholder would pay on Fund distributions or the redemption or sale of Fund Shares. See powershares.com to find the most recent month-end performance numbers.
The index performance results are hypothetical. Index returns do not represent Fund returns. An investor cannot invest directly in an index. The index does not charge management fees or brokerage expenses, and no such fees or expenses were deducted from the hypothetical performance shown nor does the index lend securities, and no revenues from securities lending were added to the performance shown. In addition, the results actual investors might have achieved would have differed from those shown because of differences in the timing, amounts of their investments, and fees and expenses associated with an investment in the Fund.
The S&P SuperComposite Retailing Index and the Russell 3000® Index are unmanaged indices based on the average performance of 91 and 3,000 common stocks, respectively.
† Average annualized
31
Manager's Analysis
PowerShares Dynamic Semiconductors Portfolio (ticker: PSI)
The PowerShares Dynamic Semiconductors Portfolio is based on the Dynamic Semiconductors IntellidexSM Index and seeks investment results that correspond generally to the price and yield (before the Fund's fees and expenses) of that equity index.
The PowerShares Dynamic Semiconductors Portfolio returned -5.60% during the reporting period. Semiconductor stocks in general fared poorly during the reporting period. Omnivision Technologies, Amkor Technology and Mattson Technology all had a rough year hurting shareholders returns. Qualcomm also struggled during the period furthering shareholder's negative impact. Some bright spots in the industry were MEMC Electronic Materials, Varian Semiconductors and Freescale Semiconductors. These stocks helped to lessen the negative return in the Fund.
Industry Breakdown (% of the Fund's
Net Assets)
| Semiconductors | 92.5 | ||||||
| Telecommunications | 4.5 | ||||||
| Electronic Components & Equipment | 3.2 | ||||||
| Other | (0.2 | ) | |||||
Style Allocation (%)
| Mid-Cap Growth | 51.5 | ||||||
| Small-Cap Growth | 20.4 | ||||||
| Large-Cap Growth | 15.2 | ||||||
| Small-Cap Value | 10.7 | ||||||
| Mid-Cap Value | 2.2 | ||||||
Top Ten Fund Holdings (% of the Fund's
Net Assets)
| Security | |||||||
| Linear Technology Corp. | 5.4 | ||||||
| Texas Instruments, Inc. | 5.3 | ||||||
| Analog Devices, Inc. | 5.2 | ||||||
| Intel Corp. | 5.1 | ||||||
| KLA-Tencor Corp. | 5.1 | ||||||
| NVIDIA Corp. | 5.0 | ||||||
| Applied Materials, Inc. | 4.9 | ||||||
| MEMC Electronic Materials, Inc. | 4.9 | ||||||
| Varian Semiconductor Equipment Associates, Inc. | 3.6 | ||||||
| Advanced Energy Industries, Inc. | 3.2 | ||||||
| Total | 47.7 | ||||||
32
Manager's Analysis (Continued)
PowerShares Dynamic Semiconductors Portfolio (ticker: PSI)
Growth of a $10,000 Investment Since Inception
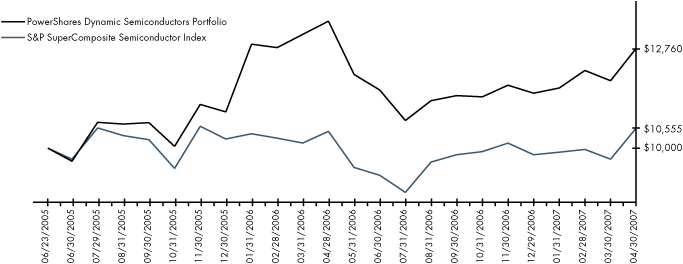
Fund Performance History (%) As of 30 April 2007
Index
| Avg. Ann.† | Fund Inception | ||||||||||||||
| 1 Year | Avg. Ann.† | Cumulative | |||||||||||||
| Dynamic Semiconductors IntellidexSM Index | -5.10 | 14.71 | 28.94 | ||||||||||||
| S&P SuperComposite Semiconductor Index | 0.85 | 2.96 | 5.55 | ||||||||||||
| Russell 3000® Index | 14.48 | 14.60 | 28.71 | ||||||||||||
Fund
| NAV Return | -5.60 | 14.06 | 27.60 | ||||||||||||
| Share Price Return | -5.57 | 14.04 | 27.54 | ||||||||||||
Fund Inception: 23 June 2005
Performance data quoted represents past performance. Past performance is not a guarantee of future results, current performance may be higher or lower than performance quoted. Investment returns and principal value will fluctuate and shares, when redeemed, may be worth more or less than their original cost. The Share Price performance reflects fee waivers, absent which, performance would have been lower. According to the Fund's most recent Prospectus, the Fund's total gross annual operating expenses was indicated as 0.75%. In the Financial Highlights section of this Annual Report, the Fund's net (subsidized) annualized total operating expense ratio was determined to be 0.63% while the Fund's gross annualized total operating expense ratio was 0.78%. The Adviser has contractually agreed to waive fees and/or pay certain Fund expenses which resulted in a lower fee actually paid by investors. This waiver extends through April 30, 200 8. Absent reimbursements or waivers, performance would have been lower. NAV and Share Price returns assume that dividends and capital gain distributions have been reinvested in the Fund at NAV and Share Price, respectively. The returns shown in the table above do not reflect the deduction of taxes that a shareholder would pay on Fund distributions or the redemption or sale of Fund Shares. See powershares.com to find the most recent month-end performance numbers.
The index performance results are hypothetical. Index returns do not represent Fund returns. An investor cannot invest directly in an index. The index does not charge management fees or brokerage expenses, and no such fees or expenses were deducted from the hypothetical performance shown nor does the index lend securities, and no revenues from securities lending were added to the performance shown. In addition, the results actual investors might have achieved would have differed from those shown because of differences in the timing, amounts of their investments, and fees and expenses associated with an investment in the Fund.
The S&P SuperComposite Semiconductor Index and the Russell 3000® Index are unmanaged indices based on the average performance of 39 and 3,000 common stocks, respectively.
† Average annualized
33
Manager's Analysis
PowerShares Dynamic Software Portfolio (ticker: PSJ)
The PowerShares Dynamic Software Portfolio is based on the Dynamic Software IntellidexSM Index and seeks investment results that correspond generally to the price and yield (before the Fund's fees and expenses) of that equity index.
The PowerShares Dynamic Software Portfolio performed well this year returning 10.57% to shareholders. Since inception in June 2005 shareholders have been rewarded with a 36.11% cumulative return. Software companies fared well during the reporting period with Altiris, Oracle and Hyperion Solutions leading the pack. IT Services and Computer peripheral companies also helped shareholder's returns with Convergys, Fiserv and NCR all in the positive. Citrix, Adobe and Red Hat didn't fare so well during the period, hurting shareholder's overall return.
Industry Breakdown (% of the Fund's
Net Assets)
| Software | 53.3 | ||||||
| Computers | 30.1 | ||||||
| Internet | 11.6 | ||||||
| Electronics | 2.9 | ||||||
| Commercial Services | 2.6 | ||||||
| Other | (0.5 | ) | |||||
Style Allocation (%)
| Mid-Cap Growth | 33.0 | ||||||
| Small-Cap Growth | 21.7 | ||||||
| Mid-Cap Value | 21.2 | ||||||
| Small-Cap Value | 13.0 | ||||||
| Large-Cap Growth | 11.1 | ||||||
Top Ten Fund Holdings (% of the Fund's
Net Assets)
| Security | |||||||
| Oracle Corp. | 5.7 | ||||||
| Cadence Design Systems, Inc. | 5.4 | ||||||
| NCR Corp. | 5.4 | ||||||
| Microsoft Corp. | 5.3 | ||||||
| BMC Software, Inc. | 5.2 | ||||||
| BEA Systems, Inc. | 5.1 | ||||||
| Fiserv, Inc. | 5.0 | ||||||
| Autodesk, Inc. | 5.0 | ||||||
| WebEx Communications, Inc. | 3.4 | ||||||
| Activision, Inc. | 3.2 | ||||||
| Total | 48.7 | ||||||
34
Manager's Analysis (Continued)
PowerShares Dynamic Software Portfolio (ticker: PSJ)
Growth of a $10,000 Investment Since Inception
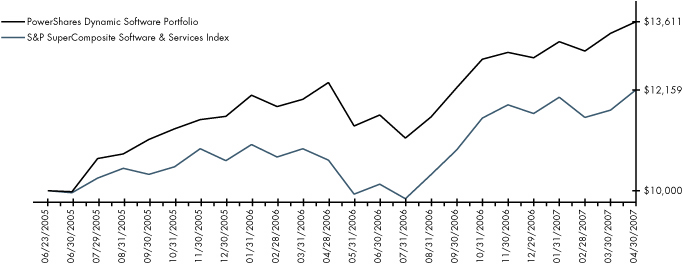
Fund Performance History (%) As of 30 April 2007
Index
| Avg. Ann.† | Fund Inception | ||||||||||||||
| 1 Year | Avg. Ann.† | Cumulative | |||||||||||||
| Dynamic Software IntellidexSM Index | 10.95 | 18.66 | 37.29 | ||||||||||||
| S&P SuperComposite Software & Services Index | 14.14 | 11.13 | 21.59 | ||||||||||||
| Russell 3000® Index | 14.48 | 14.60 | 28.71 | ||||||||||||
Fund
| NAV Return | 10.57 | 18.11 | 36.11 | ||||||||||||
| Share Price Return | 10.51 | 18.10 | 36.09 | ||||||||||||
Fund Inception: 23 June 2005
Performance data quoted represents past performance. Past performance is not a guarantee of future results, current performance may be higher or lower than performance quoted. Investment returns and principal value will fluctuate and shares, when redeemed, may be worth more or less than their original cost. The Share Price performance reflects fee waivers, absent which, performance would have been lower. According to the Fund's most recent Prospectus, the Fund's total gross annual operating expenses was indicated as 0.91%. In the Financial Highlights section of this Annual Report, the Fund's net (subsidized) annualized total operating expense ratio was determined to be 0.63% while the Fund's gross annualized total operating expense ratio was 0.83%. The Adviser has contractually agreed to waive fees and/or pay certain Fund expenses which resulted in a lower fee actually paid by investors. This waiver extends through April 30, 200 8. Absent reimbursements or waivers, performance would have been lower. NAV and Share Price returns assume that dividends and capital gain distributions have been reinvested in the Fund at NAV and Share Price, respectively. The returns shown in the table above do not reflect the deduction of taxes that a shareholder would pay on Fund distributions or the redemption or sale of Fund Shares. See powershares.com to find the most recent month-end performance numbers.
The index performance results are hypothetical. Index returns do not represent Fund returns. An investor cannot invest directly in an index. The index does not charge management fees or brokerage expenses, and no such fees or expenses were deducted from the hypothetical performance shown nor does the index lend securities, and no revenues from securities lending were added to the performance shown. In addition, the results actual investors might have achieved would have differed from those shown because of differences in the timing, amounts of their investments, and fees and expenses associated with an investment in the Fund.
The S&P SuperComposite Software & Services Index and the Russell 3000® Index are unmanaged indices based on the average performance of 102 and 3,000 common stocks, respectively.
† Average annualized
35
Funds' Distribution History
| Ex-Dividend | 04/13/07 | 03/16/07 | 03/15/07 | 02/15/07 | 01/12/07 | 12/15/06 | 11/15/06 | 10/13/06 | 09/15/06 | ||||||||||||||||||||||||||||||||||
| Record | 04/17/07 | 03/20/07 | 03/20/07 | 02/20/07 | 01/16/07 | 12/19/06 | 11/17/06 | 10/17/06 | 09/16/06 | ||||||||||||||||||||||||||||||||||
| Payable | 04/30/07 | 03/30/07 | 03/30/07 | 02/28/07 | 01/31/07 | 12/29/06 | 11/30/06 | 10/31/06 | 09/29/06 | ||||||||||||||||||||||||||||||||||
| Fund | Ticker | ||||||||||||||||||||||||||||||||||||||||||
| PowerShares Dynamic Banking Portfolio | PJB | — | — | — | — | — | 0.22276 | — | — | — | |||||||||||||||||||||||||||||||||
| PowerShares Dynamic Biotechnology & Genome Portfolio | PBE | — | — | — | — | — | — | — | — | — | |||||||||||||||||||||||||||||||||
| PowerShares Dynamic Building & Construction Portfolio | PKB | — | — | — | — | — | — | — | — | — | |||||||||||||||||||||||||||||||||
| PowerShares Dynamic Energy Exploration & Production Portfolio | PXE | — | — | — | — | — | 0.05076 | — | — | 0.01201 | |||||||||||||||||||||||||||||||||
| PowerShares Dynamic Food & Beverage Portfolio | PBJ | — | 0.03265 | — | — | — | 0.07933 | — | — | 0.01726 | |||||||||||||||||||||||||||||||||
| PowerShares Dynamic Hardware & Consumer Electronics Portfolio | PHW | — | — | — | — | — | — | — | — | — | |||||||||||||||||||||||||||||||||
| PowerShares Dynamic Healthcare Services Portfolio | PTJ | — | — | — | — | — | — | — | — | — | |||||||||||||||||||||||||||||||||
| PowerShares Dynamic Insurance Portfolio | PIC | — | 0.01758 | — | — | — | 0.07314 | — | — | 0.01536 | |||||||||||||||||||||||||||||||||
| PowerShares Dynamic Leisure and Entertainment Portfolio | PEJ | — | 0.02530 | — | — | — | 0.05101 | — | — | — | |||||||||||||||||||||||||||||||||
| PowerShares Dynamic Media Portfolio | PBS | — | — | — | — | — | 0.03264 | — | — | — | |||||||||||||||||||||||||||||||||
| PowerShares Dynamic Networking Portfolio | PXQ | — | — | — | — | — | — | — | — | — | |||||||||||||||||||||||||||||||||
| PowerShares Dynamic Oil & Gas Services Portfolio | PXJ | — | — | — | — | — | — | — | — | — | |||||||||||||||||||||||||||||||||
| PowerShares Dynamic Pharmaceuticals Portfolio | PJP | — | 0.01580 | — | — | — | 0.05529 | — | — | — | |||||||||||||||||||||||||||||||||
| PowerShares Dynamic Retail Portfolio | PMR | — | 0.02680 | — | — | — | 0.00881 | — | — | — | |||||||||||||||||||||||||||||||||
| PowerShares Dynamic Semiconductors Portfolio | PSI | — | — | — | — | — | — | — | — | — | |||||||||||||||||||||||||||||||||
| PowerShares Dynamic Software Portfolio | PSJ | — | — | — | — | — | — | — | — | — | |||||||||||||||||||||||||||||||||
36
| 08/15/06 | 07/14/06 | 06/16/06 | 06/15/06 | 05/15/06 | 03/17/06 | 12/30/05 | 12/16/05 | 09/16/05 | |||||||||||||||||||||||||||||||
| 08/17/06 | 07/18/06 | 06/20/06 | 06/19/06 | 05/17/06 | 03/21/06 | 01/04/06 | 12/20/05 | 09/20/05 | |||||||||||||||||||||||||||||||
| 08/31/06 | 07/31/06 | 06/30/06 | 06/30/06 | 05/31/06 | 03/30/06 | 01/31/06 | 12/30/05 | 09/30/05 | |||||||||||||||||||||||||||||||
| Fund | |||||||||||||||||||||||||||||||||||||||
| PowerShares Dynamic Banking Portfolio | — | — | — | — | — | — | — | — | — | ||||||||||||||||||||||||||||||
| PowerShares Dynamic Biotechnology & Genome Portfolio | — | — | — | — | — | — | — | — | — | ||||||||||||||||||||||||||||||
| PowerShares Dynamic Building & Construction Portfolio | — | — | 0.00381 | — | — | — | — | 0.00730 | — | ||||||||||||||||||||||||||||||
| PowerShares Dynamic Energy Exploration & Production Portfolio | — | — | 0.00182 | — | — | — | — | 0.01681 | — | ||||||||||||||||||||||||||||||
| PowerShares Dynamic Food & Beverage Portfolio | — | — | 0.03994 | — | — | 0.01605 | — | 0.02825 | 0.04552 | ||||||||||||||||||||||||||||||
| PowerShares Dynamic Hardware & Consumer Electronics Portfolio | — | — | — | — | — | — | — | — | — | ||||||||||||||||||||||||||||||
| PowerShares Dynamic Healthcare Services Portfolio | — | — | — | — | — | — | — | — | — | ||||||||||||||||||||||||||||||
| PowerShares Dynamic Insurance Portfolio | — | — | 0.02181 | — | — | 0.01798 | — | 0.04533 | — | ||||||||||||||||||||||||||||||
| PowerShares Dynamic Leisure and Entertainment Portfolio | — | — | 0.01010 | — | — | — | — | 0.01677 | — | ||||||||||||||||||||||||||||||
| PowerShares Dynamic Media Portfolio | — | — | 0.00739 | — | — | — | — | 0.00257 | 0.01746 | ||||||||||||||||||||||||||||||
| PowerShares Dynamic Networking Portfolio | — | — | — | — | — | — | — | — | — | ||||||||||||||||||||||||||||||
| PowerShares Dynamic Oil & Gas Services Portfolio | — | — | — | — | — | — | — | — | — | ||||||||||||||||||||||||||||||
| PowerShares Dynamic Pharmaceuticals Portfolio | — | — | 0.02365 | — | — | 0.01237 | — | 0.01581 | 0.01493 | ||||||||||||||||||||||||||||||
| PowerShares Dynamic Retail Portfolio | — | — | 0.01022 | — | — | — | — | 0.01269 | — | ||||||||||||||||||||||||||||||
| PowerShares Dynamic Semiconductors Portfolio | — | — | — | — | — | — | — | — | — | ||||||||||||||||||||||||||||||
| PowerShares Dynamic Software Portfolio | — | — | — | — | — | — | — | — | — | ||||||||||||||||||||||||||||||
37
Frequency Distribution of Discounts & Premiums
Since Inception thru April 30, 2007
| Closing Price Above NAV | |||||||||||||||||||||||||||||||||||||||
Ticker | Fund Name | Inception | Days | 0-24 Basis Points | 25-49 Basis Points | 50-99 Basis Points | 100-149 Basis Points | 150-199 Basis Points | 200+ Basis Points | ||||||||||||||||||||||||||||||
| PJB | PowerShares Dynamic Banking Portfolio | 10/12/06 | 136 | 44 | 3 | 0 | 0 | 0 | 0 | ||||||||||||||||||||||||||||||
| PBE | PowerShares Dynamic Biotechnology & Genome Portfolio | 06/23/05 | 465 | 226 | 21 | 1 | 1 | 0 | 0 | ||||||||||||||||||||||||||||||
| PKB | PowerShares Dynamic Building & Construction Portfolio | 10/26/05 | 378 | 116 | 15 | 2 | 0 | 0 | 0 | ||||||||||||||||||||||||||||||
| PXE | PowerShares Dynamic Energy Exploration & Production Portfolio | 10/26/05 | 378 | 215 | 8 | 2 | 0 | 0 | 0 | ||||||||||||||||||||||||||||||
| PBJ | PowerShares Dynamic Food & Beverage Portfolio | 06/23/05 | 465 | 237 | 14 | 0 | 0 | 0 | 0 | ||||||||||||||||||||||||||||||
| PHW | PowerShares Dynamic Hardware & Consumer Electronics Portfolio | 12/06/05 | 350 | 127 | 9 | 2 | 0 | 0 | 0 | ||||||||||||||||||||||||||||||
| PTJ | PowerShares Dynamic Healthcare Services Portfolio | 10/12/06 | 136 | 28 | 3 | 0 | 0 | 0 | 0 | ||||||||||||||||||||||||||||||
| PIC | PowerShares Dynamic Insurance Portfolio | 10/26/05 | 378 | 159 | 7 | 1 | 0 | 0 | 0 | ||||||||||||||||||||||||||||||
| PEJ | PowerShares Dynamic Leisure and Entertainment Portfolio | 06/23/05 | 465 | 198 | 11 | 2 | 0 | 0 | 0 | ||||||||||||||||||||||||||||||
| PBS | PowerShares Dynamic Media Portfolio | 06/23/05 | 465 | 165 | 10 | 1 | 0 | 0 | 0 | ||||||||||||||||||||||||||||||
| PXQ | PowerShares Dynamic Networking Portfolio | 06/23/05 | 465 | 168 | 8 | 2 | 0 | 0 | 0 | ||||||||||||||||||||||||||||||
| PXJ | PowerShares Dynamic Oil & Gas Services Portfolio | 10/26/05 | 378 | 171 | 28 | 6 | 0 | 0 | 0 | ||||||||||||||||||||||||||||||
| PJP | PowerShares Dynamic Pharmaceuticals Portfolio | 06/23/05 | 465 | 256 | 6 | 4 | 0 | 0 | 0 | ||||||||||||||||||||||||||||||
| PMR | PowerShares Dynamic Retail Portfolio | 10/26/05 | 378 | 158 | 6 | 1 | 0 | 0 | 0 | ||||||||||||||||||||||||||||||
| PSI | PowerShares Dynamic Semiconductors Portfolio | 06/23/05 | 465 | 253 | 14 | 2 | 0 | 0 | 0 | ||||||||||||||||||||||||||||||
| PSJ | PowerShares Dynamic Software Portfolio | 06/23/05 | 465 | 246 | 6 | 6 | 0 | 0 | 0 | ||||||||||||||||||||||||||||||
38
| Closing Price Below NAV | |||||||||||||||||||||||||||
Ticker | -0-24 Basis Points | -25-49 Basis Points | -50-99 Basis Points | -100-149 Basis Points | -150-199 Basis Points | -200+ Basis Points | |||||||||||||||||||||
| PJB | 87 | 2 | 0 | 0 | 0 | 0 | |||||||||||||||||||||
| PBE | 198 | 16 | 2 | 0 | 0 | 0 | |||||||||||||||||||||
| PKB | 240 | 5 | 0 | 0 | 0 | 0 | |||||||||||||||||||||
| PXE | 145 | 6 | 2 | 0 | 0 | 0 | |||||||||||||||||||||
| PBJ | 207 | 7 | 0 | 0 | 0 | 0 | |||||||||||||||||||||
| PHW | 207 | 4 | 1 | 0 | 0 | 0 | |||||||||||||||||||||
| PTJ | 104 | 1 | 0 | 0 | 0 | 0 | |||||||||||||||||||||
| PIC | 209 | 2 | 0 | 0 | 0 | 0 | |||||||||||||||||||||
| PEJ | 250 | 4 | 0 | 0 | 0 | 0 | |||||||||||||||||||||
| PBS | 285 | 3 | 1 | 0 | 0 | 0 | |||||||||||||||||||||
| PXQ | 278 | 8 | 1 | 0 | 0 | 0 | |||||||||||||||||||||
| PXJ | 167 | 5 | 1 | 0 | 0 | 0 | |||||||||||||||||||||
| PJP | 196 | 3 | 0 | 0 | 0 | 0 | |||||||||||||||||||||
| PMR | 202 | 11 | 0 | 0 | 0 | 0 | |||||||||||||||||||||
| PSI | 194 | 2 | 0 | 0 | 0 | 0 | |||||||||||||||||||||
| PSJ | 203 | 3 | 1 | 0 | 0 | 0 | |||||||||||||||||||||
39
Fees and Expenses
As a shareholder of a Fund of the PowerShares Exchange-Traded Fund Trust, you incur advisory fees and other Fund expenses. The expense examples below are intended to help you understand your ongoing costs (in dollars) of investing in the Funds and to compare these costs with the ongoing costs of investing in other mutual funds.
The example is based on an investment of $1,000 invested at the beginning of the period and held through the six-month period ended April 30, 2007.
Actual Expenses
The first line in the following tables provides information about actual account values and actual expenses. You may use the information in this line, together with the amount you invested, to estimate the expenses that you paid over the period. Simply divide your account value by $1,000 (for example, an $8,600 account value divided by $1,000 = 8.6), then multiply the result by the number in the first line under the heading "Expenses Paid During the Six-Month Period" to estimate the expenses you paid on your account during this period.
Hypothetical Example for Comparison Purposes
The second line in the following tables provides information about hypothetical account values and hypothetical expenses based on the Funds' actual expense ratio and an assumed annualized rate of return of 5% per year before expenses, which is not the Funds' actual return. The hypothetical account values and expenses may not be used to estimate the actual ending account balance or expenses you paid for the period. You may use this information to compare the ongoing costs of investing in the Funds and other funds. To do so, compare this 5% hypothetical example with the 5% hypothetical examples that appear in the shareholder reports of the other funds.
Please note that the expenses shown in the tables are meant to highlight your ongoing costs only, and do not reflect any transactional costs such as sales charges (loads). Therefore the second line in the table is useful in comparing ongoing costs only, and will not help you determine the relative total costs of owning different funds. In addition, if these transactional costs were included, your costs would have been higher.
| Beginning Account Value November 1, 2006 | Ending Account Value April 30, 2007 | Annualized Expense Ratio Based on the Six-Month Period | Expenses Paid During the Six-Month Period (1) | ||||||||||||||||
| PowerShares Dynamic Banking Portfolio Actual | $ | 1,000.00 | $ | 970.41 | 0.78 | % | $ | 3.81 | |||||||||||
| Hypothetical (5% return before expenses) | $ | 1,000.00 | $ | 1,020.93 | 0.78 | % | $ | 3.91 | |||||||||||
| PowerShares Dynamic Biotechnology & Genome Portfolio Actual | $ | 1,000.00 | $ | 1,042.12 | 0.63 | % | $ | 3.19 | |||||||||||
| Hypothetical (5% return before expenses) | $ | 1,000.00 | $ | 1,021.67 | 0.63 | % | $ | 3.16 | |||||||||||
| PowerShares Dynamic Building & Construction Portfolio Actual | $ | 1,000.00 | $ | 1,194.89 | 0.61 | % | $ | 3.32 | |||||||||||
| Hypothetical (5% return before expenses) | $ | 1,000.00 | $ | 1,021.77 | 0.61 | % | $ | 3.06 | |||||||||||
40
Fees and Expenses (Continued)
| Beginning Account Value November 1, 2006 | Ending Account Value April 30, 2007 | Annualized Expense Ratio Based on the Six-Month Period | Expenses Paid During the Six-Month Period (1) | ||||||||||||||||
| PowerShares Dynamic Energy Exploration & Production Portfolio | |||||||||||||||||||
| Actual | $ | 1,000.00 | $ | 1,156.26 | 0.63 | % | $ | 3.37 | |||||||||||
| Hypothetical (5% return before expenses) | $ | 1,000.00 | $ | 1,021.67 | 0.63 | % | $ | 3.16 | |||||||||||
| PowerShares Dynamic Food & Beverage Portfolio | |||||||||||||||||||
| Actual | $ | 1,000.00 | $ | 1,100.31 | 0.63 | % | $ | 3.28 | |||||||||||
| Hypothetical (5% return before expenses) | $ | 1,000.00 | $ | 1,021.67 | 0.63 | % | $ | 3.16 | |||||||||||
| PowerShares Dynamic Hardware & Consumer Electronics Portfolio | |||||||||||||||||||
| Actual | $ | 1,000.00 | $ | 1,060.46 | 0.67 | % | $ | 3.42 | |||||||||||
| Hypothetical (5% return before expenses) | $ | 1,000.00 | $ | 1,021.47 | 0.67 | % | $ | 3.36 | |||||||||||
| PowerShares Dynamic Healthcare Services Portfolio | |||||||||||||||||||
| Actual | $ | 1,000.00 | $ | 1,147.30 | 0.70 | % | $ | 3.73 | |||||||||||
| Hypothetical (5% return before expenses) | $ | 1,000.00 | $ | 1,021.32 | 0.70 | % | $ | 3.51 | |||||||||||
| PowerShares Dynamic Insurance Portfolio Actual | $ | 1,000.00 | $ | 1,075.79 | 0.63 | % | $ | 3.24 | |||||||||||
| Hypothetical (5% return before expenses) | $ | 1,000.00 | $ | 1,021.67 | 0.63 | % | $ | 3.16 | |||||||||||
| PowerShares Dynamic Leisure and Entertainment Portfolio | |||||||||||||||||||
| Actual | $ | 1,000.00 | $ | 1,051.34 | 0.63 | % | $ | 3.20 | |||||||||||
| Hypothetical (5% return before expenses) | $ | 1,000.00 | $ | 1,021.67 | 0.63 | % | $ | 3.16 | |||||||||||
| PowerShares Dynamic Media Portfolio Actual | $ | 1,000.00 | $ | 1,086.41 | 0.63 | % | $ | 3.26 | |||||||||||
| Hypothetical (5% return before expenses) | $ | 1,000.00 | $ | 1,021.67 | 0.63 | % | $ | 3.16 | |||||||||||
| PowerShares Dynamic Networking Portfolio Actual | $ | 1,000.00 | $ | 1,119.23 | 0.63 | % | $ | 3.31 | |||||||||||
| Hypothetical (5% return before expenses) | $ | 1,000.00 | $ | 1,021.67 | 0.63 | % | $ | 3.16 | |||||||||||
| PowerShares Dynamic Oil & Gas Services Portfolio | |||||||||||||||||||
| Actual | $ | 1,000.00 | $ | 1,173.73 | 0.63 | % | $ | 3.40 | |||||||||||
| Hypothetical (5% return before expenses) | $ | 1,000.00 | $ | 1,021.67 | 0.63 | % | $ | 3.16 | |||||||||||
| PowerShares Dynamic Pharmaceuticals Portfolio | |||||||||||||||||||
| Actual | $ | 1,000.00 | $ | 1,096.14 | 0.63 | % | $ | 3.27 | |||||||||||
| Hypothetical (5% return before expenses) | $ | 1,000.00 | $ | 1,021.67 | 0.63 | % | $ | 3.16 | |||||||||||
| PowerShares Dynamic Retail Portfolio Actual | $ | 1,000.00 | $ | 1,052.81 | 0.63 | % | $ | 3.21 | |||||||||||
| Hypothetical (5% return before expenses) | $ | 1,000.00 | $ | 1,021.67 | 0.63 | % | $ | 3.16 | |||||||||||
41
Fees and Expenses (Continued)
| Beginning Account Value November 1, 2006 | Ending Account Value April 30, 2007 | Annualized Expense Ratio Based on the Six-Month Period | Expenses Paid During the Six-Month Period (1) | ||||||||||||||||
| PowerShares Dynamic Semiconductors Portfolio | |||||||||||||||||||
| Actual | $ | 1,000.00 | $ | 1,117.30 | 0.63 | % | $ | 3.31 | |||||||||||
| Hypothetical (5% return before expenses) | $ | 1,000.00 | $ | 1,021.67 | 0.63 | % | $ | 3.16 | |||||||||||
| PowerShares Dynamic Software Portfolio Actual | $ | 1,000.00 | $ | 1,062.53 | 0.63 | % | $ | 3.22 | |||||||||||
| Hypothetical (5% return before expenses) | $ | 1,000.00 | $ | 1,021.67 | 0.63 | % | $ | 3.16 | |||||||||||
(1) Expenses are calculated using the annualized expense ratio, which represents the ongoing expenses as a percentage of net assets for the six months ended April 30, 2007. Expenses are calculated by multiplying the Fund's annualized expense ratio by the average account value for the period; then multiplying the result by 181 and then dividing the result by 365. Expense ratios for the most recent half-year may differ from expense ratios based on the one year data in the financial highlights.
42
Schedule of Investments
PowerShares Dynamic Banking Portfolio
April 30, 2007
| Number of Shares | Value | ||||||||||
| Common Stocks—100.6% | |||||||||||
| Commercial Banks - Central US—22.6% | |||||||||||
| 4,350 | AMCORE Financial, Inc. | $ | 124,454 | ||||||||
| 4,172 | Associated Banc-Corp. | 135,089 | |||||||||
| 2,962 | BancFirst Corp. | 126,803 | |||||||||
| 4,862 | Chemical Financial Corp. | 129,961 | |||||||||
| 2,926 | Commerce Bancshares, Inc. | 138,517 | |||||||||
| 3,423 | First Financial Bankshares, Inc. | 132,470 | |||||||||
| 1,512 | Park National Corp. | 134,220 | |||||||||
| 5,400 | TCF Financial Corp. | 146,233 | |||||||||
| 1,067,747 | |||||||||||
| Commercial Banks - Eastern US—7.9% | |||||||||||
| 4,639 | Chittenden Corp. | 134,809 | |||||||||
| 6,594 | Sterling Financial Corp. | 109,790 | |||||||||
| 14,239 | TrustCo Bank Corp. NY | 130,572 | |||||||||
| 375,171 | |||||||||||
| Commercial Banks - Southern US—17.3% | |||||||||||
| 5,699 | BancorpSouth, Inc. | 140,024 | |||||||||
| 4,285 | Capital City Bank Group, Inc. | 127,736 | |||||||||
| 3,738 | City Holding Co. | 141,932 | |||||||||
| 696 | First Citizens BancShares, Inc., Class A | 141,218 | |||||||||
| 4,965 | Trustmark Corp. | 132,119 | |||||||||
| 4,591 | WesBanco, Inc. | 134,654 | |||||||||
| 817,683 | |||||||||||
| Commercial Banks - Western US—5.7% | |||||||||||
| 2,767 | Bank of Hawaii Corp. | 146,375 | |||||||||
| 5,830 | Glacier Bancorp, Inc. | 125,228 | |||||||||
| 271,603 | |||||||||||
| Finance - Investment Banker/Broker—5.8% | |||||||||||
| 5,295 | JPMorgan Chase & Co. | 275,870 | |||||||||
| S&L/Thrifts - Eastern US—5.8% | |||||||||||
| 10,115 | First Niagara Financial Group, Inc. | 137,564 | |||||||||
| 8,102 | Provident Financial Services, Inc. | 138,868 | |||||||||
| 276,432 | |||||||||||
| S&L/Thrifts - Western US—3.1% | |||||||||||
| 2,183 | Downey Financial Corp. | 146,152 | |||||||||
| Super-Regional Banks - US—32.4% | |||||||||||
| 5,111 | Bank of America Corp. | 260,150 | |||||||||
| 4,289 | Comerica, Inc. | 265,531 | |||||||||
| 6,914 | KeyCorp | 246,692 | |||||||||
| 3,051 | PNC Financial Services Group, Inc. | 226,079 | |||||||||
| 3,106 | SunTrust Banks, Inc. | 262,209 | |||||||||
| 7,583 | Wells Fargo & Co. | 272,153 | |||||||||
| 1,532,814 | |||||||||||
| Total Common Stocks (Cost $4,937,944) | 4,763,472 | ||||||||||
| Number of Shares | Value | ||||||||||
| Money Market Fund—1.2% | |||||||||||
| 55,436 | Liquid Assets Portfolio Private Class* (Cost $55,436) | $ | 55,436 | ||||||||
| Total Investments (Cost $4,993,380)—101.8% | 4,818,908 | ||||||||||
| Liabilities in excess of other assets—(1.8%) | (82,922 | ) | |||||||||
| Net Assets—100.0% | $ | 4,735,986 | |||||||||
* Affiliated investment.
See Notes to Financial Statements.
43
Schedule of Investments
PowerShares Dynamic Biotechnology & Genome Portfolio
April 30, 2007
| Number of Shares | Value | ||||||||||
| Common Stocks—100.1% | |||||||||||
| Biotechnology—49.6% | |||||||||||
| 187,674 | Amgen, Inc.* | $ | 12,037,410 | ||||||||
| 265,021 | Biogen Idec, Inc.* | 12,511,641 | |||||||||
| 145,387 | Genentech, Inc.* | 11,629,506 | |||||||||
| 325,479 | GTx, Inc.* | 6,350,095 | |||||||||
| 994,091 | Incyte Corp.* | 7,664,442 | |||||||||
| 102,228 | Invitrogen Corp.* | 6,692,867 | |||||||||
| 379,062 | MedImmune, Inc.* | 21,485,235 | |||||||||
| 602,107 | Millennium Pharmaceuticals, Inc.* | 6,671,346 | |||||||||
| 91,111 | Millipore Corp.* | 6,726,725 | |||||||||
| 197,660 | Myriad Genetics, Inc.* | 7,224,473 | |||||||||
| 347,854 | PDL BioPharma, Inc.* | 8,786,792 | |||||||||
| 313,876 | Regeneron Pharmaceuticals, Inc.* | 8,537,427 | |||||||||
| 472,125 | Savient Pharmaceuticals, Inc.* | 5,429,438 | |||||||||
| 211,011 | Vertex Pharmaceuticals, Inc.* | 6,486,478 | |||||||||
| 128,233,875 | |||||||||||
| Chemicals—4.8% | |||||||||||
| 292,667 | Sigma-Aldrich Corp. | 12,315,427 | |||||||||
| Electronics—15.2% | |||||||||||
| 381,390 | Applera Corp. - Applied Biosystems Group | 11,914,624 | |||||||||
| 106,198 | Dionex Corp.* | 7,327,662 | |||||||||
| 118,857 | Varian, Inc.* | 6,888,952 | |||||||||
| 221,838 | Waters Corp.* | 13,183,832 | |||||||||
| 39,315,070 | |||||||||||
| Healthcare - Products—5.9% | |||||||||||
| 713,654 | Bruker BioSciences Corp.* | 8,214,157 | |||||||||
| 120,402 | Techne Corp.* | 7,100,106 | |||||||||
| 15,314,263 | |||||||||||
| Pharmaceuticals—24.6% | |||||||||||
| 389,189 | Alkermes, Inc.* | 6,394,375 | |||||||||
| 322,845 | Alnylam Pharmaceuticals, Inc.* | 6,059,801 | |||||||||
| 168,810 | Gilead Sciences, Inc.* | 13,795,152 | |||||||||
| 464,363 | Medarex, Inc.* | 6,357,129 | |||||||||
| 265,977 | Noven Pharmaceuticals, Inc.* | 6,226,522 | |||||||||
| 422,677 | Osiris Therapeutics, Inc.* | 5,997,787 | |||||||||
| 200,052 | Theravance, Inc.* | 6,627,723 | |||||||||
| 117,338 | United Therapeutics Corp.* | 6,560,368 | |||||||||
| 377,700 | ViroPharma, Inc.* | 5,695,716 | |||||||||
| 63,714,573 | |||||||||||
| Total Investments (Cost $236,749,302)—100.1% | 258,893,208 | ||||||||||
| Liabilities in excess of other assets—(0.1%) | (277,294 | ) | |||||||||
| Net Assets—100.0% | $ | 258,615,914 | |||||||||
* Non-income producing security.
See Notes to Financial Statements.
44
Schedule of Investments
PowerShares Dynamic Building & Construction Portfolio
April 30, 2007
| Number of Shares | Value | ||||||||||
| Common Stocks—100.3% | |||||||||||
| Building Materials—18.0% | |||||||||||
| 16,702 | American Standard Cos., Inc. | $ | 919,612 | ||||||||
| 9,826 | Armstrong World Industries, Inc.* | 501,126 | |||||||||
| 27,420 | Builders FirstSource, Inc.* | 442,285 | |||||||||
| 14,088 | Lennox International, Inc. | 476,315 | |||||||||
| 3,794 | Martin Marietta Materials, Inc. | 553,241 | |||||||||
| 15,734 | Owens Corning, Inc.* | 482,247 | |||||||||
| 3,374,826 | |||||||||||
| Commercial Services—5.8% | |||||||||||
| 16,453 | McGrath RentCorp | 496,058 | |||||||||
| 21,174 | Quanta Services, Inc.* | 582,073 | |||||||||
| 1,078,131 | |||||||||||
| Electric—3.0% | |||||||||||
| 18,456 | MDU Resources Group, Inc. | 559,217 | |||||||||
| Engineering & Construction—20.2% | |||||||||||
| 8,127 | EMCOR Group, Inc.* | 509,482 | |||||||||
| 20,159 | Infrasource Services, Inc.* | 672,907 | |||||||||
| 19,696 | Jacobs Engineering Group, Inc.* | 993,269 | |||||||||
| 13,466 | Perini Corp* | 573,652 | |||||||||
| 10,884 | URS Corp.* | 475,631 | |||||||||
| 8,422 | Washington Group International, Inc.* | 563,600 | |||||||||
| 3,788,541 | |||||||||||
| Home Builders—9.6% | |||||||||||
| 17,989 | Lennar Corp., Class A | 768,310 | |||||||||
| 726 | NVR, Inc.* | 598,224 | |||||||||
| 9,892 | Ryland Group, Inc. | 438,216 | |||||||||
| 1,804,750 | |||||||||||
| Home Furnishings—2.2% | |||||||||||
| 11,699 | American Woodmark Corp. | 403,732 | |||||||||
| Machinery - Construction & Mining—10.7% | |||||||||||
| 13,634 | Caterpillar, Inc. | 990,101 | |||||||||
| 12,911 | Terex Corp.* | 1,005,121 | |||||||||
| 1,995,222 | |||||||||||
| Machinery - Diversified—8.7% | |||||||||||
| 8,481 | Cascade Corp. | 525,568 | |||||||||
| 7,877 | Manitowoc (The) Co., Inc. | 537,448 | |||||||||
| 3,517 | NACCO Industries, Inc., Class A | 560,539 | |||||||||
| 1,623,555 | |||||||||||
| Metal Fabricate/Hardware—2.9% | |||||||||||
| 8,656 | Valmont Industries, Inc. | 544,289 | |||||||||
| Mining—5.1% | |||||||||||
| 7,650 | Vulcan Materials Co. | 946,076 | |||||||||
| Miscellaneous Manufacturing—2.3% | |||||||||||
| 6,321 | Ameron International Corp. | 437,034 | |||||||||
| Number of Shares | Value | ||||||||||
| Common Stocks (Continued) | |||||||||||
| Office Furnishings—2.7% | |||||||||||
| 29,876 | Interface, Inc., Class A | $ | 503,411 | ||||||||
| Retail—4.3% | |||||||||||
| 26,250 | Lowe's Cos., Inc. | 802,200 | |||||||||
| Textiles—4.8% | |||||||||||
| 9,865 | Mohawk Industries, Inc.* | 889,428 | |||||||||
| Total Investments (Cost $16,348,848)—100.3% | 18,750,412 | ||||||||||
| Liabilities in excess of other assets—(0.3%) | (51,624 | ) | |||||||||
| Net Assets—100.0% | $ | 18,698,788 | |||||||||
* Non-income producing security.
See Notes to Financial Statements.
45
Schedule of Investments
PowerShares Dynamic Energy Exploration & Production Portfolio
April 30, 2007
| Number of Shares | Value | ||||||||||
| Common Stocks—100.0% | |||||||||||
| Gas - Distribution—2.9% | |||||||||||
| 63,756 | Energen Corp. | $ | 3,573,524 | ||||||||
| Oil Companies - Exploration & Production—46.4% | |||||||||||
| 115,128 | BreitBurn Energy Partners LP | 4,213,685 | |||||||||
| 86,171 | Cabot Oil & Gas Corp. | 3,138,348 | |||||||||
| 85,577 | Cimarex Energy Co. | 3,371,734 | |||||||||
| 123,952 | CNX Gas Corp.* | 3,478,093 | |||||||||
| 84,268 | Devon Energy Corp. | 6,140,609 | |||||||||
| 175,046 | EXCO Resources, Inc.* | 2,939,022 | |||||||||
| 91,062 | Forest Oil Corp.* | 3,209,025 | |||||||||
| 71,223 | Newfield Exploration Co.* | 3,116,006 | |||||||||
| 51,841 | Noble Energy, Inc. | 3,048,769 | |||||||||
| 41,514 | Penn Virginia Corp. | 3,323,196 | |||||||||
| 63,583 | Plains Exploration & Production Co.* | 2,987,765 | |||||||||
| 160,876 | Rosetta Resources, Inc.* | 3,460,443 | |||||||||
| 81,364 | St. Mary Land & Exploration Co. | 2,979,550 | |||||||||
| 75,691 | Swift Energy Co.* | 3,076,839 | |||||||||
| 66,943 | Whiting Petroleum Corp.* | 2,946,831 | |||||||||
| 106,037 | XTO Energy, Inc. | 5,754,628 | |||||||||
| 57,184,543 | |||||||||||
| Oil Companies - Integrated—26.7% | |||||||||||
| 78,435 | Chevron Corp. | 6,101,458 | |||||||||
| 176,796 | Delek US Holdings, Inc. | 3,371,500 | |||||||||
| 74,107 | Exxon Mobil Corp. | 5,882,614 | |||||||||
| 100,294 | Hess Corp. | 5,691,685 | |||||||||
| 60,203 | Marathon Oil Corp. | 6,113,614 | |||||||||
| 115,530 | Occidental Petroleum Corp. | 5,857,371 | |||||||||
| 33,018,242 | |||||||||||
| Oil Refining & Marketing—21.1% | |||||||||||
| 108,630 | Alon USA Energy, Inc. | 4,062,762 | |||||||||
| 100,547 | Frontier Oil Corp. | 3,552,326 | |||||||||
| 54,401 | Holly Corp. | 3,459,904 | |||||||||
| 33,327 | Tesoro Corp. | 4,039,232 | |||||||||
| 94,849 | Valero Energy Corp. | 6,661,244 | |||||||||
| 108,359 | Western Refining, Inc. | 4,293,184 | |||||||||
| 26,068,652 | |||||||||||
| Pipelines—2.9% | |||||||||||
| 37,427 | Questar Corp. | 3,635,285 | |||||||||
| Total Investments (Cost $107,300,517)—100.0% | 123,480,246 | ||||||||||
| Other assets less liabilities —0.0% | 8,091 | ||||||||||
| Net Assets—100.0% | $ | 123,488,337 | |||||||||
* Non-income producing security.
See Notes to Financial Statements.
46
Schedule of Investments
PowerShares Dynamic Food & Beverage Portfolio
April 30, 2007
| Number of Shares | Value | ||||||||||
| Common Stocks—99.7% | |||||||||||
| Agriculture—2.4% | |||||||||||
| 10,477 | Bunge Ltd. (Bermuda) | $ | 793,738 | ||||||||
| Beverages—23.4% | |||||||||||
| 32,353 | Anheuser-Busch Cos., Inc. | 1,591,444 | |||||||||
| 13,584 | Brown-Forman Corp., Class B | 868,425 | |||||||||
| 34,263 | Coca-Cola (The) Co. | 1,788,186 | |||||||||
| 10,379 | Molson Coors Brewing Co., Class B | 978,532 | |||||||||
| 27,387 | Pepsi Bottling Group (The), Inc. | 898,567 | |||||||||
| 25,074 | PepsiCo, Inc. | 1,657,141 | |||||||||
| 7,782,295 | |||||||||||
| Food—53.3% | |||||||||||
| 21,090 | Campbell Soup Co. | 824,619 | |||||||||
| 34,596 | ConAgra Foods, Inc. | 850,370 | |||||||||
| 27,035 | Corn Products International, Inc. | 1,076,534 | |||||||||
| 28,349 | Dean Foods Co. | 1,032,754 | |||||||||
| 28,319 | General Mills, Inc. | 1,696,307 | |||||||||
| 18,709 | H.J. Heinz Co. | 881,381 | |||||||||
| 23,673 | Hormel Foods Corp. | 901,705 | |||||||||
| 21,170 | Ingles Markets, Inc., Class A | 761,273 | |||||||||
| 21,857 | J & J Snack Foods Corp. | 851,767 | |||||||||
| 17,469 | J.M. Smucker (The) Co. | 975,120 | |||||||||
| 32,489 | Kellogg Co. | 1,718,992 | |||||||||
| 22,440 | McCormick & Co., Inc. | 832,973 | |||||||||
| 14,674 | Ralcorp Holdings, Inc.* | 965,696 | |||||||||
| 46,068 | Safeway, Inc. | 1,672,268 | |||||||||
| 401 | Seaboard Corp. | 999,693 | |||||||||
| 29,575 | Tootsie Roll Industries, Inc. | 857,379 | |||||||||
| 20,215 | Weis Markets, Inc. | 870,054 | |||||||||
| 17,768,885 | |||||||||||
| Miscellaneous Manufacturing—2.5% | |||||||||||
| 19,750 | Lancaster Colony Corp. | 834,043 | |||||||||
| Retail—18.1% | |||||||||||
| 40,368 | Burger King Holdings, Inc. | 947,437 | |||||||||
| 27,645 | Domino's Pizza, Inc. | 891,551 | |||||||||
| 12,374 | Jack in the Box, Inc.* | 824,356 | |||||||||
| 35,194 | McDonald's Corp. | 1,699,167 | |||||||||
| 26,761 | Yum! Brands, Inc. | 1,655,435 | |||||||||
| 6,017,946 | |||||||||||
| Total Common Stocks (Cost $29,641,461) | 33,196,907 | ||||||||||
| Number of Shares | Value | ||||||||||
| Money Market Fund—0.3% | |||||||||||
| 106,759 | Liquid Assets Portfolio Private Class** (Cost $106,759) | $ | 106,759 | ||||||||
| Total Investments (Cost $29,748,220)—100.0% | 33,303,666 | ||||||||||
| Other assets less liabilities —0.0% | 10,136 | ||||||||||
| Net Assets—100.0% | $ | 33,313,802 | |||||||||
* Non-income producing security.
** Affiliated investment.
COUNTRY BREAKDOWN
April 30, 2007 (Unaudited)
| Value | Net Assets | ||||||||||
| United States | $ | 32,509,928 | 97.6 | % | |||||||
| Bermuda | 793,738 | 2.4 | |||||||||
| Total investments | 33,303,666 | 100.0 | |||||||||
| Other assets less liabilities | 10,136 | 0.0 | |||||||||
| Net Assets | $ | 33,313,802 | 100.0 | % | |||||||
See Notes to Financial Statements.
47
Schedule of Investments
PowerShares Dynamic Hardware & Consumer Electronics Portfolio
April 30, 2007
| Number of Shares | Value | ||||||||||
| Common Stocks—101.0% | |||||||||||
| Commercial Services—2.8% | |||||||||||
| 11,184 | Coinstar, Inc.* | $ | 347,711 | ||||||||
| Computers—48.2% | |||||||||||
| 6,961 | Apple, Inc.* | 694,707 | |||||||||
| 40,263 | Brocade Communications Systems, Inc.* | 393,370 | |||||||||
| 25,632 | Dell, Inc.* | 646,182 | |||||||||
| 7,073 | Diebold, Inc. | 337,170 | |||||||||
| 42,791 | EMC Corp.* | 649,566 | |||||||||
| 159,532 | Gateway, Inc.* | 349,375 | |||||||||
| 15,190 | Hewlett-Packard Co. | 640,107 | |||||||||
| 9,738 | Komag, Inc.* | 267,892 | |||||||||
| 5,323 | Lexmark International, Inc., Class A* | 290,104 | |||||||||
| 15,466 | Network Appliance, Inc.* | 575,490 | |||||||||
| 98,891 | Sun Microsystems, Inc.* | 516,211 | |||||||||
| 12,782 | Synaptics, Inc.* | 382,949 | |||||||||
| 16,785 | Western Digital Corp.* | 296,759 | |||||||||
| 6,039,882 | |||||||||||
| Electronics—17.4% | |||||||||||
| 10,166 | Agilent Technologies, Inc.* | 349,405 | |||||||||
| 15,304 | Benchmark Electronics, Inc.* | 324,139 | |||||||||
| 16,910 | Checkpoint Systems, Inc.* | 371,851 | |||||||||
| 5,883 | Garmin Ltd. (Cayman Islands) | 342,332 | |||||||||
| 12,325 | National Instruments Corp. | 343,375 | |||||||||
| 14,801 | Paxar Corp.* | 444,177 | |||||||||
| 2,175,279 | |||||||||||
| Home Furnishings—3.2% | |||||||||||
| 3,275 | Harman International Industries, Inc. | 399,190 | |||||||||
| Information Technology—2.9% | |||||||||||
| 14,216 | Inter-Tel, Inc. | 358,528 | |||||||||
| Miscellaneous Manufacturing—2.7% | |||||||||||
| 13,555 | Eastman Kodak Co. | 337,655 | |||||||||
| Office/Business Equipment—7.8% | |||||||||||
| 7,050 | Pitney Bowes, Inc. | 338,400 | |||||||||
| 34,678 | Xerox Corp.* | 641,543 | |||||||||
| 979,943 | |||||||||||
| Semiconductors—5.7% | |||||||||||
| 18,038 | Emulex Corp.* | 378,437 | |||||||||
| 18,552 | QLogic Corp.* | 331,710 | |||||||||
| 710,147 | |||||||||||
| Number of Shares | Value | ||||||||||
| Common Stocks (Continued) | |||||||||||
| Telecommunications—10.3% | |||||||||||
| 32,378 | Motorola, Inc. | $ | 561,111 | ||||||||
| 16,006 | Plantronics, Inc. | 401,911 | |||||||||
| 9,994 | Polycom, Inc.* | 332,800 | |||||||||
| 1,295,822 | |||||||||||
| Total Investments (Cost $11,532,830)—101.0% | 12,644,157 | ||||||||||
| Liabilities in excess of other assets—(1.0%) | (123,767 | ) | |||||||||
| Net Assets—100.0% | $ | 12,520,390 | |||||||||
* Non-income producing security.
COUNTRY BREAKDOWN
April 30, 2007 (Unaudited)
| Value | Net Assets | ||||||||||
| United States | $ | 12,301,825 | 98.3 | % | |||||||
| Cayman Islands | 342,332 | 2.7 | |||||||||
| Total investments | 12,644,157 | 101.0 | |||||||||
| Liabilities in excess of other asset | (123,767 | ) | (1.0 | ) | |||||||
| Net Assets | $ | 12,520,390 | 100.0 | % | |||||||
See Notes to Financial Statements.
48
Schedule of Investments
PowerShares Dynamic Healthcare Services Portfolio
April 30, 2007
| Number of Shares | Value | ||||||||||
| Common Stocks—100.3% | |||||||||||
| Dental Supplies & Equipment—2.9% | |||||||||||
| 22,190 | Patterson Cos., Inc.* | $ | 800,171 | ||||||||
| Diversified Operations—2.9% | |||||||||||
| 16,021 | Chemed Corp. | 805,856 | |||||||||
| Health Care Cost Containment—5.1% | |||||||||||
| 24,150 | McKesson Corp. | 1,420,745 | |||||||||
| Human Resources—8.5% | |||||||||||
| 26,705 | AMN Healthcare Services, Inc.* | 650,267 | |||||||||
| 38,202 | Cross Country Healthcare, Inc.* | 752,197 | |||||||||
| 29,544 | Emergency Medical Services Corp., Class A* | 989,133 | |||||||||
| 2,391,597 | |||||||||||
| Life/Health Insurance—5.3% | |||||||||||
| 9,632 | CIGNA Corp. | 1,498,643 | |||||||||
| Medical Labs & Testing Services—2.7% | |||||||||||
| 9,405 | Laboratory Corp. of America Holdings* | 742,431 | |||||||||
| Medical Products—2.5% | |||||||||||
| 35,066 | PSS World Medical, Inc.* | 704,827 | |||||||||
| Medical - HMO—35.6% | |||||||||||
| 30,091 | Aetna, Inc. | 1,410,666 | |||||||||
| 21,613 | AMERIGROUP Corp.* | 607,974 | |||||||||
| 13,559 | Coventry Health Care, Inc.* | 784,117 | |||||||||
| 13,872 | Health Net, Inc.* | 749,920 | |||||||||
| 22,774 | Humana, Inc.* | 1,440,227 | |||||||||
| 17,302 | Magellan Health Services, Inc.* | 742,256 | |||||||||
| 18,752 | Sierra Health Services, Inc.* | 776,708 | |||||||||
| 26,136 | UnitedHealth Group, Inc. | 1,386,776 | |||||||||
| 9,353 | WellCare Health Plans, Inc.* | 753,758 | |||||||||
| 17,009 | WellPoint, Inc.* | 1,343,201 | |||||||||
| 9,995,603 | |||||||||||
| Medical - Hospitals—5.4% | |||||||||||
| 25,083 | Medcath Corp.* | 745,467 | |||||||||
| 12,809 | Universal Health Services, Inc., Class B | 777,762 | |||||||||
| 1,523,229 | |||||||||||
| Medical - Nursing Homes—5.7% | |||||||||||
| 13,820 | Manor Care, Inc. | 896,780 | |||||||||
| 13,685 | National Healthcare Corp | 702,177 | |||||||||
| 1,598,957 | |||||||||||
| Medical - Outpatient/Home Medical Care—7.9% | |||||||||||
| 31,215 | Amsurg Corp., Class A* | 716,384 | |||||||||
| 23,125 | Apria Healthcare Group, Inc.* | 733,988 | |||||||||
| 19,161 | Lincare Holdings, Inc.* | 755,710 | |||||||||
| 2,206,082 | |||||||||||
| Number of Shares | Value | ||||||||||
| Common Stocks (Continued) | |||||||||||
| Medical - Wholesale Drug Distribution—4.5% | |||||||||||
| 25,196 | AmerisourceBergen Corp. | $ | 1,259,548 | ||||||||
| Pharmacy Services—6.0% | |||||||||||
| 17,627 | Express Scripts, Inc.* | 1,684,260 | |||||||||
| Physician Practice Management—2.8% | |||||||||||
| 13,746 | Pediatrix Medical Group, Inc.* | 784,209 | |||||||||
| Retirement/Aged Care—2.5% | |||||||||||
| 18,572 | Sunrise Senior Living, Inc.* | 711,122 | |||||||||
| Total Investments (Cost $26,894,250)—100.3% | 28,127,280 | ||||||||||
| Liabilities in excess of other assets—(0.3%) | (85,791 | ) | |||||||||
| Net Assets—100.0% | $ | 28,041,489 | |||||||||
* Non-income producing security.
See Notes to Financial Statements.
49
Schedule of Investments
PowerShares Dynamic Insurance Portfolio
April 30, 2007
| Number of Shares | Value | ||||||||||
| Common Stocks—99.9% | |||||||||||
| Financial Guarantee Insurance—2.8% | |||||||||||
| 17,504 | AMBAC Financial Group, Inc. | $ | 1,606,867 | ||||||||
| Insurance Brokers—2.8% | |||||||||||
| 39,402 | Willis Group Holdings Ltd. (Bermuda) | 1,616,270 | |||||||||
| Life/Health Insurance—21.0% | |||||||||||
| 38,265 | Delphi Financial Group, Inc., Class A | 1,633,916 | |||||||||
| 39,038 | FBL Financial Group, Inc., Class A | 1,512,332 | |||||||||
| 40,746 | Lincoln National Corp. | 2,899,078 | |||||||||
| 28,514 | Nationwide Financial Services, Inc., Class A | 1,629,005 | |||||||||
| 31,060 | Prudential Financial, Inc. | 2,950,700 | |||||||||
| 26,678 | Reinsurance Group of America, Inc. | 1,662,306 | |||||||||
| 12,287,337 | |||||||||||
| Multi-line Insurance—26.2% | |||||||||||
| 49,859 | ACE Ltd. (Cayman Islands) | 2,964,616 | |||||||||
| 43,158 | American Financial Group, Inc. | 1,522,183 | |||||||||
| 29,020 | Assurant, Inc. | 1,669,521 | |||||||||
| 29,762 | Hartford Financial Services Group (The), Inc. | 3,011,914 | |||||||||
| 48,596 | HCC Insurance Holdings, Inc. | 1,489,953 | |||||||||
| 73,913 | Horace Mann Educators Corp. | 1,555,130 | |||||||||
| 65,127 | Loews Corp. | 3,081,809 | |||||||||
| 15,295,126 | |||||||||||
| Property/Casualty Insurance—38.8% | |||||||||||
| 23,716 | Arch Capital Group Ltd. (Bermuda)* | 1,726,999 | |||||||||
| 54,157 | Chubb (The) Corp. | 2,915,271 | |||||||||
| 52,277 | Commerce Group (The), Inc. | 1,704,753 | |||||||||
| 3,183 | Markel Corp.* | 1,460,711 | |||||||||
| 33,134 | Philadelphia Consolidated Holding Co.* | 1,438,016 | |||||||||
| 123,344 | Progressive (The) Corp. | 2,845,546 | |||||||||
| 27,381 | RLI Corp. | 1,524,848 | |||||||||
| 22,948 | Safeco Corp. | 1,531,550 | |||||||||
| 54,152 | Travelers Cos. (The), Inc. | 2,929,622 | |||||||||
| 66,002 | United America Indemnity Ltd., Class A (Cayman Islands)* | 1,648,730 | |||||||||
| 46,161 | W. R. Berkley Corp. | 1,499,771 | |||||||||
| 31,095 | Zenith National Insurance Corp. | 1,438,144 | |||||||||
| 22,663,961 | |||||||||||
| Reinsurance—8.3% | |||||||||||
| 53,056 | IPC Holdings, Ltd. (Bermuda) | 1,590,619 | |||||||||
| 22,103 | PartnerRe Ltd. (Bermuda) | 1,591,858 | |||||||||
| 24,225 | Transatlantic Holdings, Inc. | 1,683,395 | |||||||||
| 4,865,872 | |||||||||||
| Total Investments (Cost $54,324,349)—99.9% | 58,335,433 | ||||||||||
| Other assets less liabilities—0.1% | 65,781 | ||||||||||
| Net Assets—100.0% | $ | 58,401,214 | |||||||||
* Non-income producing security.
COUNTRY BREAKDOWN
April 30, 2007 (Unaudited)
| Value | Net Assets | ||||||||||
| United States | $ | 48,845,071 | 83.6 | % | |||||||
| Bermuda | 6,525,746 | 11.2 | |||||||||
| Cayman Islands | 2,964,616 | 5.1 | |||||||||
| Total investments | 58,335,433 | 99.9 | |||||||||
| Other assets less liabilities | 65,781 | 0.1 | |||||||||
| Net Assets | $ | 58,401,214 | 100.0 | % | |||||||
See Notes to Financial Statements.
50
Schedule of Investments
PowerShares Dynamic Leisure and Entertainment Portfolio
April 30, 2007
| Number of Shares | Value | ||||||||||
| Common Stocks—100.4% | |||||||||||
| Entertainment—9.8% | |||||||||||
| 57,914 | International Game Technology | $ | 2,208,839 | ||||||||
| 25,554 | International Speedway Corp., Class A | 1,262,368 | |||||||||
| 35,201 | Speedway Motorsports, Inc. | 1,365,799 | |||||||||
| 4,837,006 | |||||||||||
| Internet—8.5% | |||||||||||
| 63,559 | Expedia, Inc.* | 1,501,263 | |||||||||
| 33,988 | IAC/InterActiveCorp* | 1,295,623 | |||||||||
| 25,541 | Priceline.com, Inc.* | 1,421,101 | |||||||||
| 4,217,987 | |||||||||||
| Leisure Time—8.2% | |||||||||||
| 53,110 | Carnival Corp. (Panama) | 2,596,548 | |||||||||
| 36,230 | WMS Industries, Inc.* | 1,444,128 | |||||||||
| 4,040,676 | |||||||||||
| Lodging—20.3% | |||||||||||
| 40,554 | Ameristar Casinos, Inc. | 1,231,219 | |||||||||
| 68,881 | Hilton Hotels Corp. | 2,341,954 | |||||||||
| 51,094 | Marriott International, Inc., Class A | 2,309,960 | |||||||||
| 20,342 | Starwood Hotels & Resorts Worldwide, Inc. | 1,363,321 | |||||||||
| 16,557 | Station Casinos, Inc. | 1,440,459 | |||||||||
| 38,872 | Wyndham Worldwide Corp.* | 1,344,971 | |||||||||
| 10,031,884 | |||||||||||
| Media—12.8% | |||||||||||
| 80,732 | CBS Corp., Class B | 2,564,856 | |||||||||
| 28,384 | E.W. Scripps Co., Class A | 1,229,027 | |||||||||
| 71,956 | Walt Disney (The) Co. | 2,517,021 | |||||||||
| 6,310,904 | |||||||||||
| Retail—40.8% | |||||||||||
| 52,007 | Applebee's International, Inc. | 1,413,550 | |||||||||
| 37,096 | Bob Evans Farms, Inc. | 1,361,423 | |||||||||
| 39,139 | Brinker International, Inc. | 1,217,223 | |||||||||
| 63,037 | Burger King Holdings, Inc. | 1,479,478 | |||||||||
| 29,078 | CBRL Group, Inc. | 1,296,297 | |||||||||
| 32,329 | Darden Restaurants, Inc. | 1,341,007 | |||||||||
| 43,165 | Domino's Pizza, Inc. | 1,392,071 | |||||||||
| 23,666 | IHOP Corp. | 1,394,401 | |||||||||
| 19,320 | Jack in the Box, Inc.* | 1,287,098 | |||||||||
| 54,956 | McDonald's Corp. | 2,653,277 | |||||||||
| 42,584 | Rare Hospitality International, Inc.* | 1,240,046 | |||||||||
| 41,429 | Wendy's International, Inc. | 1,561,873 | |||||||||
| 41,788 | Yum! Brands, Inc. | 2,585,006 | |||||||||
| 20,222,750 | |||||||||||
| Total Investments (Cost $45,680,013)—100.4% | 49,661,207 | ||||||||||
| Liabilities in excess of other assets—(0.4%) | (188,872 | ) | |||||||||
| Net Assets—100.0% | $ | 49,472,335 | |||||||||
* Non-income producing security.
COUNTRY BREAKDOWN
April 30, 2007 (Unaudited)
| Value | Net Assets | ||||||||||
| United States | $ | 47,064,659 | 95.2 | % | |||||||
| Panama | 2,596,548 | 5.2 | |||||||||
| Total investments | 49,661,207 | 100.4 | |||||||||
| Liabilities in excess of other assets | (188,872 | ) | (0.4 | ) | |||||||
| Net Assets | $ | 49,472,335 | 100.0 | % | |||||||
See Notes to Financial Statements.
51
Schedule of Investments
PowerShares Dynamic Media Portfolio
April 30, 2007
| Number of Shares | Value | ||||||||||
| Common Stocks—100.1% | |||||||||||
| Advertising—13.1% | |||||||||||
| 30,584 | Clear Channel Outdoor Holdings, Inc., Class A* | $ | 873,173 | ||||||||
| 31,423 | Harte-Hanks, Inc. | 820,140 | |||||||||
| 66,086 | Interpublic Group of Cos., Inc.* | 837,970 | |||||||||
| 15,025 | Omnicom Group, Inc. | 1,573,269 | |||||||||
| 4,104,552 | |||||||||||
| Commercial Services—5.2% | |||||||||||
| 16,637 | Monster Worldwide, Inc.* | 699,586 | |||||||||
| 22,788 | Viad Corp. | 930,662 | |||||||||
| 1,630,248 | |||||||||||
| Computers—2.9% | |||||||||||
| 22,309 | IHS, Inc., Class A* | 922,254 | |||||||||
| Internet—10.8% | |||||||||||
| 3,394 | Google, Inc., Class A* | 1,599,863 | |||||||||
| 35,477 | Sohu.com, Inc.* | 898,278 | |||||||||
| 30,583 | ValueClick, Inc.* | 874,674 | |||||||||
| 3,372,815 | |||||||||||
| Media—65.4% | |||||||||||
| 45,721 | Belo Corp., Class A | 881,044 | |||||||||
| 50,983 | CBS Corp., Class B | 1,619,730 | |||||||||
| 56,196 | Cox Radio, Inc., Class A* | 793,488 | |||||||||
| 69,793 | DIRECTV Group (The), Inc.* | 1,663,865 | |||||||||
| 23,434 | Dow Jones & Co., Inc. | 851,357 | |||||||||
| 17,927 | E.W. Scripps Co., Class A | 776,239 | |||||||||
| 13,822 | Gannett Co., Inc. | 788,683 | |||||||||
| 32,660 | Hearst-Argyle Television, Inc. | 869,736 | |||||||||
| 22,323 | John Wiley & Sons, Inc., Class A | 835,996 | |||||||||
| 64,756 | Journal Communications, Inc., Class A | 873,558 | |||||||||
| 23,913 | McGraw-Hill (The) Cos., Inc. | 1,567,019 | |||||||||
| 108,879 | Mediacom Communications Corp., Class A* | 939,626 | |||||||||
| 14,611 | Meredith Corp. | 846,269 | |||||||||
| 67,635 | News Corp., Class A | 1,514,348 | |||||||||
| 24,109 | Scholastic Corp.* | 744,245 | |||||||||
| 59,213 | Sinclair Broadcast Group, Inc., Class A | 966,948 | |||||||||
| 74,273 | Time Warner, Inc. | 1,532,252 | |||||||||
| 45,444 | Walt Disney (The) Co. | 1,589,631 | |||||||||
| 1,104 | Washington Post (The) Co., Class B | 821,376 | |||||||||
| 20,475,410 | |||||||||||
| Telecommunications—2.7% | |||||||||||
| 30,852 | RCN Corp.* | 833,621 | |||||||||
| Total Common Stocks (Cost $30,449,149) | 31,338,900 | ||||||||||
| Number of Shares | Value | ||||||||||
| Money Market Fund—0.1% | |||||||||||
| 38,742 | Liquid Assets Portfolio Private Class** (Cost $38,742) | $ | 38,742 | ||||||||
| Total Investments (Cost $30,487,891)—100.2% | 31,377,642 | ||||||||||
| Liabilities in excess of other assets—(0.2%) | (72,267 | ) | |||||||||
| Net Assets—100.0% | $ | 31,305,375 | |||||||||
* Non-income producing security.
** Affiliated investment.
See Notes to Financial Statements.
52
Schedule of Investments
PowerShares Dynamic Networking Portfolio
April 30, 2007
| Number of Shares | Value | ||||||||||
| Common Stocks—100.1% | |||||||||||
| Computers—3.3% | |||||||||||
| 62,876 | Brocade Communications Systems, Inc.* | $ | 614,299 | ||||||||
| Internet—13.5% | |||||||||||
| 12,395 | F5 Networks, Inc.* | 951,688 | |||||||||
| 30,594 | McAfee, Inc.* | 993,999 | |||||||||
| 23,412 | Websense, Inc.* | 578,511 | |||||||||
| 2,524,198 | |||||||||||
| Semiconductors—13.4% | |||||||||||
| 140,469 | Applied Micro Circuits Corp.* | 394,718 | |||||||||
| 25,055 | DSP Group, Inc.* | 462,766 | |||||||||
| 28,169 | Emulex Corp.* | 590,985 | |||||||||
| 28,972 | QLogic Corp.* | 518,019 | |||||||||
| 16,413 | Silicon Laboratories, Inc.* | 538,511 | |||||||||
| 2,504,999 | |||||||||||
| Software—5.1% | |||||||||||
| 29,289 | Citrix Systems, Inc.* | 954,821 | |||||||||
| Telecommunications—64.8% | |||||||||||
| 129,770 | 3Com Corp.* | 522,973 | |||||||||
| 28,956 | Acme Packet, Inc.* | 391,196 | |||||||||
| 30,233 | ADC Telecommunications, Inc.* | 556,287 | |||||||||
| 22,062 | ADTRAN, Inc. | 561,478 | |||||||||
| 34,543 | Arris Group, Inc.* | 511,927 | |||||||||
| 74,599 | Avaya, Inc.* | 963,819 | |||||||||
| 35,808 | C-COR, Inc.* | 441,155 | |||||||||
| 35,198 | Cisco Systems, Inc.* | 941,195 | |||||||||
| 14,498 | Comtech Telecommunications Corp.* | 548,749 | |||||||||
| 33,705 | Foundry Networks, Inc.* | 509,620 | |||||||||
| 58,040 | Harmonic, Inc.* | 479,991 | |||||||||
| 48,953 | Juniper Networks, Inc.* | 1,094,588 | |||||||||
| 18,552 | Netgear, Inc.* | 623,533 | |||||||||
| 45,219 | Nextwave Wireless, Inc.* | 428,224 | |||||||||
| 22,332 | QUALCOMM, Inc. | 978,141 | |||||||||
| 70,704 | Sonus Networks, Inc.* | 546,542 | |||||||||
| 133,039 | Sycamore Networks, Inc.* | 488,253 | |||||||||
| 39,094 | Tekelec* | 560,608 | |||||||||
| 89,326 | Tellabs, Inc.* | 948,642 | |||||||||
| 12,096,921 | |||||||||||
| Total Investments (Cost $18,252,658)—100.1% | 18,695,238 | ||||||||||
| Liabilities in excess of other assets—(0.1%) | (18,202 | ) | |||||||||
| Net Assets—100.0% | $ | 18,677,036 | |||||||||
* Non-income producing security.
See Notes to Financial Statements.
53
Schedule of Investments
PowerShares Dynamic Oil & Gas Services Portfolio
April 30, 2007
| Number of Shares | Value | ||||||||||
| Common Stocks—100.0% | |||||||||||
| Engineering & Construction—5.4% | |||||||||||
| 111,768 | Foster Wheeler Ltd. (Bermuda)* | $ | 7,692,992 | ||||||||
| 128,443 | McDermott International, Inc. (Panama)* | 6,892,251 | |||||||||
| 14,585,243 | |||||||||||
| Oil & Gas—28.4% | |||||||||||
| 151,037 | Diamond Offshore Drilling, Inc. | 12,928,767 | |||||||||
| 128,569 | ENSCO International, Inc. | 7,248,720 | |||||||||
| 203,422 | GlobalSantaFe Corp. (Cayman Islands) | 13,004,768 | |||||||||
| 957,432 | Grey Wolf, Inc.* | 6,855,213 | |||||||||
| 732,467 | Parker Drilling Co.* | 7,954,592 | |||||||||
| 223,878 | Pride International, Inc.* | 7,345,437 | |||||||||
| 192,608 | Todco* | 8,755,960 | |||||||||
| 153,128 | Transocean, Inc. (Cayman Islands)* | 13,199,634 | |||||||||
| 77,293,091 | |||||||||||
| Oil & Gas Services—60.6% | |||||||||||
| 184,499 | Baker Hughes, Inc. | 14,831,875 | |||||||||
| 291,172 | Basic Energy Services, Inc.* | 7,526,796 | |||||||||
| 439,783 | BJ Services Co. | 12,604,181 | |||||||||
| 111,997 | Cameron International Corp.* | 7,231,646 | |||||||||
| 159,727 | Dril-Quip, Inc.* | 8,066,214 | |||||||||
| 97,373 | FMC Technologies, Inc.* | 6,901,798 | |||||||||
| 476,634 | Global Industries Ltd.* | 9,894,922 | |||||||||
| 144,944 | Grant Prideco, Inc.* | 7,470,414 | |||||||||
| 382,214 | Halliburton Co. | 12,142,939 | |||||||||
| 466,162 | Input/Output, Inc.* | 6,521,606 | |||||||||
| 116,997 | Lufkin Industries, Inc. | 7,279,553 | |||||||||
| 178,398 | NATCO Group, Inc., Class A* | 6,814,804 | |||||||||
| 172,639 | National Oilwell Varco, Inc.* | 14,648,419 | |||||||||
| 160,154 | Oceaneering International, Inc.* | 7,613,721 | |||||||||
| 186,727 | Schlumberger Ltd. (Netherlands) | 13,786,054 | |||||||||
| 66,554 | SEACOR Holdings, Inc.* | 6,341,265 | |||||||||
| 216,723 | Superior Energy Services, Inc.* | 7,873,547 | |||||||||
| 120,666 | Tidewater, Inc. | 7,627,298 | |||||||||
| 165,177,052 | |||||||||||
| Transportation—5.6% | |||||||||||
| 173,185 | Gulfmark Offshore, Inc.* | 8,295,561 | |||||||||
| 99,811 | Overseas Shipholding Group, Inc. | 7,066,619 | |||||||||
| 15,362,180 | |||||||||||
| Total Common Stocks (Cost $242,338,034) | 272,417,566 | ||||||||||
| Number of Shares | Value | ||||||||||
| Money Market Fund—0.1% | |||||||||||
| 206,884 | Liquid Assets Portfolio Private Class** (Cost $206,884) | $ | 206,884 | ||||||||
| Total Investments (Cost $242,544,918)—100.1% | 272,624,450 | ||||||||||
| Liabilities in excess of other assets—(0.1%) | (168,488 | ) | |||||||||
| Net Assets—100.0% | $ | 272,455,962 | |||||||||
* Non-income producing security.
** Affiliated investment.
COUNTRY BREAKDOWN
April 30, 2007 (Unaudited)
| Value | Net Assets | ||||||||||
| United States | $ | 218,048,751 | 80.1 | % | |||||||
| Cayman Islands | 26,204,402 | 9.6 | |||||||||
| Netherlands | 13,786,054 | 5.1 | |||||||||
| Bermuda | 7,692,992 | 2.8 | |||||||||
| Panama | 6,892,251 | 2.5 | |||||||||
| Total investments | 272,624,450 | 100.1 | |||||||||
| Liabilities in excess of other assets | (168,488 | ) | (0.1 | ) | |||||||
| Net Assets | $ | 272,455,962 | 100.0 | % | |||||||
See Notes to Financial Statements.
54
Schedule of Investments
PowerShares Dynamic Pharmaceuticals Portfolio
April 30, 2007
| Number of Shares | Value | ||||||||||
| Common Stocks—100.0% | |||||||||||
| Biotechnology—18.9% | |||||||||||
| 59,676 | Amgen, Inc.* | $ | 3,827,618 | ||||||||
| 45,968 | Biogen Idec, Inc.* | 2,170,149 | |||||||||
| 46,231 | Genentech, Inc.* | 3,698,018 | |||||||||
| 65,748 | MedImmune, Inc.* | 3,726,597 | |||||||||
| 191,462 | Millennium Pharmaceuticals, Inc.* | 2,121,399 | |||||||||
| 15,543,781 | |||||||||||
| Cosmetics & Personal Care—2.7% | |||||||||||
| 38,691 | Chattem, Inc.* | 2,210,804 | |||||||||
| Healthcare-Products—4.8% | |||||||||||
| 61,611 | Johnson & Johnson | 3,956,658 | |||||||||
| Household Products/Wares—2.9% | |||||||||||
| 184,103 | Prestige Brands Holdings, Inc.* | 2,395,180 | |||||||||
| Pharmaceuticals—70.7% | |||||||||||
| 19,188 | Allergan, Inc. | 2,325,586 | |||||||||
| 77,021 | Alpharma, Inc., Class A | 1,871,610 | |||||||||
| 38,239 | Barr Pharmaceuticals, Inc.* | 1,849,238 | |||||||||
| 72,908 | Eli Lilly & Co. | 4,311,050 | |||||||||
| 67,223 | Endo Pharmaceuticals Holdings, Inc.* | 2,079,880 | |||||||||
| 39,616 | Forest Laboratories, Inc.* | 2,107,967 | |||||||||
| 29,280 | Gilead Sciences, Inc.* | 2,392,762 | |||||||||
| 115,225 | King Pharmaceuticals, Inc.* | 2,356,351 | |||||||||
| 84,976 | KV Pharmaceutical Co., Class A* | 2,210,226 | |||||||||
| 77,912 | Medicines (The) Co.* | 1,774,835 | |||||||||
| 57,018 | Medicis Pharmaceutical Corp., Class A | 1,733,347 | |||||||||
| 92,046 | Merck & Co., Inc. | 4,734,846 | |||||||||
| 98,803 | Mylan Laboratories, Inc. | 2,166,750 | |||||||||
| 154,268 | Pfizer, Inc. | 4,081,931 | |||||||||
| 75,247 | Pharmion Corp.* | 2,279,232 | |||||||||
| 135,163 | Salix Pharmaceuticals Ltd.* | 1,759,822 | |||||||||
| 165,926 | Schering-Plough Corp. | 5,264,833 | |||||||||
| 92,210 | Sciele Pharma, Inc.* | 2,279,431 | |||||||||
| 40,027 | Sepracor, Inc.* | 2,148,649 | |||||||||
| 121,937 | Valeant Pharmaceuticals International | 2,197,305 | |||||||||
| 73,778 | Watson Pharmaceuticals, Inc.* | 2,014,139 | |||||||||
| 78,050 | Wyeth | 4,331,775 | |||||||||
| 58,271,565 | |||||||||||
| Total Investments (Cost $76,347,471)—100.0% | 82,377,988 | ||||||||||
| Liabilities in excess of other assets—(0.0)% | (32,697 | ) | |||||||||
| Net Assets—100.0% | $ | 82,345,291 | |||||||||
* Non-income producing security.
See Notes to Financial Statements.
55
Schedule of Investments
PowerShares Dynamic Retail Portfolio
April 30, 2007
| Number of Shares | Value | ||||||||||
| Common Stocks—100.4% | |||||||||||
| Apparel—2.9% | |||||||||||
| 17,954 | Gymboree Corp.* | $ | 685,484 | ||||||||
| Commercial Services—5.6% | |||||||||||
| 25,105 | Aaron Rents, Inc. | 712,229 | |||||||||
| 13,605 | Dollar Thrifty Automotive Group* | 637,802 | |||||||||
| 1,350,031 | |||||||||||
| Distribution/Wholesale—2.9% | |||||||||||
| 13,987 | Genuine Parts Co. | 691,098 | |||||||||
| Food—5.6% | |||||||||||
| 36,886 | Safeway, Inc. | 1,338,962 | |||||||||
| Home Builders—1.8% | |||||||||||
| 7,321 | Amrep Corp. | 441,163 | |||||||||
| Retail—81.6% | |||||||||||
| 18,474 | Aeropostale, Inc.* | 760,205 | |||||||||
| 22,239 | American Eagle Outfitters, Inc. | 655,383 | |||||||||
| 26,241 | Asbury Automotive Group, Inc. | 754,954 | |||||||||
| 9,897 | AutoZone, Inc.* | 1,316,697 | |||||||||
| 103,695 | Blockbuster, Inc., Class A* | 642,909 | |||||||||
| 19,315 | Brown Shoe Co, Inc. | 521,119 | |||||||||
| 19,705 | Buckle (The), Inc. | 701,892 | |||||||||
| 22,754 | Charlotte Russe Holdings, Inc.* | 621,867 | |||||||||
| 12,449 | Children's Place Retail Stores (The), Inc.* | 658,179 | |||||||||
| 20,223 | Claire's Stores, Inc. | 658,663 | |||||||||
| 23,573 | Copart, Inc.* | 683,146 | |||||||||
| 33,124 | Dress Barn, Inc.* | 659,499 | |||||||||
| 23,464 | Family Dollar Stores, Inc. | 747,094 | |||||||||
| 21,983 | Hibbett Sports, Inc.* | 640,804 | |||||||||
| 15,426 | J. C. Penney Co., Inc. | 1,220,042 | |||||||||
| 17,859 | Kohl's Corp.* | 1,322,280 | |||||||||
| 15,775 | Men's Wearhouse, Inc. | 682,584 | |||||||||
| 22,270 | Nordstrom, Inc. | 1,223,068 | |||||||||
| 21,680 | Payless Shoesource, Inc.* | 691,592 | |||||||||
| 20,727 | Ross Stores, Inc. | 687,100 | |||||||||
| 6,909 | Sears Holdings Corp.* | 1,318,997 | |||||||||
| 47,684 | Staples, Inc. | 1,182,563 | |||||||||
| 45,540 | TJX Cos., Inc. | 1,270,111 | |||||||||
| 19,620,748 | |||||||||||
| Total Common Stocks (Cost $23,361,773) | 24,127,486 | ||||||||||
| Number of Shares | Value | ||||||||||
| Money Market Fund—0.5% | |||||||||||
| 111,949 | Liquid Assets Portfolio Private Class** (Cost $111,949) | $ | 111,949 | ||||||||
| Total Investments (Cost $23,473,722)—100.9% | 24,239,435 | ||||||||||
| Liabilities in excess of other assets—(0.9%) | (210,189 | ) | |||||||||
| Net Assets—100.0% | $ | 24,029,246 | |||||||||
* Non-income producing security.
** Affiliated investment.
See Notes to Financial Statements.
56
Schedule of Investments
PowerShares Dynamic Semiconductors Portfolio
April 30, 2007
| Number of Shares | Value | ||||||||||
| Common Stocks—100.2% | |||||||||||
| Electrical Components & Equipment—3.2% | |||||||||||
| 213,430 | Advanced Energy Industries, Inc.* | $ | 5,229,035 | ||||||||
| Semiconductors—92.5% | |||||||||||
| 197,737 | Altera Corp. | 4,456,992 | |||||||||
| 360,346 | AMIS Holdings, Inc.* | 4,180,014 | |||||||||
| 361,851 | Amkor Technology, Inc.* | 5,062,295 | |||||||||
| 216,339 | Analog Devices, Inc. | 8,355,012 | |||||||||
| 416,551 | Applied Materials, Inc. | 8,006,110 | |||||||||
| 762,290 | Atmel Corp.* | 4,055,383 | |||||||||
| 270,319 | Brooks Automation, Inc* | 4,722,473 | |||||||||
| 489,365 | Cirrus Logic, Inc.* | 4,051,942 | |||||||||
| 228,891 | Fairchild Semiconductor International, Inc.* | 4,028,482 | |||||||||
| 255,588 | Integrated Device Technology, Inc.* | 3,828,708 | |||||||||
| 385,061 | Intel Corp. | 8,278,812 | |||||||||
| 99,351 | International Rectifier Corp.* | 3,505,103 | |||||||||
| 147,590 | KLA-Tencor Corp. | 8,198,625 | |||||||||
| 95,219 | Lam Research Corp.* | 5,120,878 | |||||||||
| 712,452 | Lattice Semiconductor Corp.* | 3,889,988 | |||||||||
| 231,974 | Linear Technology Corp. | 8,680,466 | |||||||||
| 145,770 | MEMC Electronic Materials, Inc.* | 7,999,858 | |||||||||
| 116,301 | Microchip Technology, Inc. | 4,691,582 | |||||||||
| 171,002 | National Semiconductor Corp. | 4,497,353 | |||||||||
| 135,297 | Novellus Systems, Inc.* | 4,379,564 | |||||||||
| 244,828 | NVIDIA Corp.* | 8,052,393 | |||||||||
| 272,685 | Photronics, Inc.* | 4,103,909 | |||||||||
| 468,853 | Silicon Image, Inc.* | 4,107,152 | |||||||||
| 625,568 | Skyworks Solutions, Inc.* | 4,310,164 | |||||||||
| 248,185 | Texas Instruments, Inc. | 8,530,118 | |||||||||
| 88,420 | Varian Semiconductor Equipment Associates, Inc.* | 5,867,551 | |||||||||
| 186,903 | Verigy Ltd. (Singapore)* | 4,723,039 | |||||||||
| 149,683,966 | |||||||||||
| Telecommunications—4.5% | |||||||||||
| 123,244 | Interdigital Communications Corp.* | 4,052,263 | |||||||||
| 512,377 | RF Micro Devices, Inc.* | 3,202,356 | |||||||||
| 7,254,619 | |||||||||||
| Total Investments (Cost $154,188,258)—100.2% | 162,167,620 | ||||||||||
| Liabilities in excess of other assets—(0.2%) | (281,613 | ) | |||||||||
| Net Assets—100.0% | $ | 161,886,007 | |||||||||
* Non-income producing security.
COUNTRY BREAKDOWN
April 30, 2007 (Unaudited)
| Value | Net Assets | ||||||||||
| United States | $ | 157,444,581 | 97.3 | % | |||||||
| Singapore | 4,723,039 | 2.9 | |||||||||
| Total investments | 162,167,620 | 100.2 | |||||||||
| Liabilities in excess of other assets | (281,613 | ) | (0.2 | ) | |||||||
| Net Assets | $ | 161,886,007 | 100.0 | % | |||||||
See Notes to Financial Statements.
57
Schedule of Investments
PowerShares Dynamic Software Portfolio
April 30, 2007
| Number of Shares | Value | ||||||||||
| Common Stocks—100.5% | |||||||||||
| Commercial Services—2.6% | |||||||||||
| 74,389 | Convergys Corp.* | $ | 1,879,066 | ||||||||
| Computers—30.1% | |||||||||||
| 60,724 | Ansoft Corp.* | 1,960,778 | |||||||||
| 174,557 | Cadence Design Systems, Inc.* | 3,875,165 | |||||||||
| 26,952 | DST Systems, Inc.* | 2,103,604 | |||||||||
| 81,528 | Jack Henry & Associates, Inc. | 1,936,290 | |||||||||
| 68,778 | Manhattan Associates, Inc.* | 1,989,060 | |||||||||
| 111,170 | Mentor Graphics Corp.* | 1,798,731 | |||||||||
| 34,754 | MICROS Systems, Inc.* | 1,904,519 | |||||||||
| 75,943 | NCR Corp.* | 3,827,527 | |||||||||
| 75,715 | Synopsys, Inc.* | 2,094,277 | |||||||||
| 21,489,951 | |||||||||||
| Electronics—2.9% | |||||||||||
| 59,247 | Dolby Laboratories, Inc., Class A* | 2,098,529 | |||||||||
| Internet—11.6% | |||||||||||
| 122,567 | Interwoven, Inc.* | 1,871,598 | |||||||||
| 63,084 | McAfee, Inc.* | 2,049,599 | |||||||||
| 215,850 | TIBCO Software, Inc.* | 1,968,552 | |||||||||
| 42,247 | WebEx Communications, Inc.* | 2,397,095 | |||||||||
| 8,286,844 | |||||||||||
| Software—53.3% | |||||||||||
| 112,612 | Activision, Inc.* | 2,252,240 | |||||||||
| 86,189 | Autodesk, Inc.* | 3,557,020 | |||||||||
| 306,314 | BEA Systems, Inc.* | 3,611,442 | |||||||||
| 86,172 | Blackbaud, Inc. | 1,902,678 | |||||||||
| 114,390 | BMC Software, Inc.* | 3,702,804 | |||||||||
| 36,790 | Cerner Corp.* | 1,958,700 | |||||||||
| 78,268 | CSG Systems International, Inc.* | 2,096,017 | |||||||||
| 49,741 | Fair Isaac Corp. | 1,776,251 | |||||||||
| 66,931 | Fiserv, Inc.* | 3,558,721 | |||||||||
| 126,659 | Microsoft Corp. | 3,792,170 | |||||||||
| 15,605 | MicroStrategy, Inc., Class A* | 1,775,225 | |||||||||
| 217,625 | Oracle Corp.* | 4,091,350 | |||||||||
| 77,388 | Sybase, Inc.* | 1,872,016 | |||||||||
| 59,977 | THQ, Inc.* | 2,001,432 | |||||||||
| 37,948,066 | |||||||||||
| Total Investments (Cost $64,742,398)—100.5% | 71,702,456 | ||||||||||
| Liabilities in excess of other assets—(0.5%) | (333,202 | ) | |||||||||
| Net Assets—100.0% | $ | 71,369,254 | |||||||||
* Non-income producing security.
See Notes to Financial Statements.
58
This page intentionally left blank
Statements of Assets and Liabilities
PowerShares Exchange-Traded Funds
April 30, 2007
| PowerShares Dynamic Banking Portfolio | PowerShares Dynamic Biotechnology & Genome Portfolio | PowerShares Dynamic Building & Construction Portfolio | PowerShares Dynamic Energy Exploration & Production Portfolio | PowerShares Dynamic Food & Beverage Portfolio | PowerShares Dynamic Hardware & Consumer Electronics Portfolio | PowerShares Dynamic Healthcare Services Portfolio | PowerShares Dynamic Insurance Portfolio | ||||||||||||||||||||||||||||
| ASSETS: | |||||||||||||||||||||||||||||||||||
| Unaffiliated investments at value | $ | 4,763,472 | $ | 258,893,208 | $ | 18,750,412 | $ | 123,480,246 | $ | 33,196,907 | $ | 12,644,157 | $ | 28,127,280 | $ | 58,335,433 | |||||||||||||||||||
| Affiliated investments at value | 55,436 | — | — | — | 106,759 | — | — | — | |||||||||||||||||||||||||||
| Cash | — | — | — | 94,778 | — | — | — | 84,011 | |||||||||||||||||||||||||||
| Receivables: | |||||||||||||||||||||||||||||||||||
| Dividends | 2,536 | — | 6,667 | — | 46,208 | — | 2,463 | 28,214 | |||||||||||||||||||||||||||
| Capital stock sold | — | 1,965,389 | — | 2,157,264 | 1,753,358 | — | — | 1,897,301 | |||||||||||||||||||||||||||
| Due from Adviser | 9,885 | 23,162 | 10,977 | 16,195 | 14,116 | 18,076 | 9,387 | 15,034 | |||||||||||||||||||||||||||
| Other assets | 8,000 | 6,450 | 6,542 | 6,542 | 6,450 | 5,999 | 7,949 | 6,542 | |||||||||||||||||||||||||||
| Total Assets | 4,839,329 | 260,888,209 | 18,774,598 | 125,755,025 | 35,123,798 | 12,668,232 | 28,147,079 | 60,366,535 | |||||||||||||||||||||||||||
| LIABILITIES: | |||||||||||||||||||||||||||||||||||
| Due to custodian | 50,379 | 87,830 | 31,952 | — | 27,213 | 98,474 | 39,316 | — | |||||||||||||||||||||||||||
| Payables: | |||||||||||||||||||||||||||||||||||
| Investments purchased | — | 1,975,052 | — | 2,155,415 | 1,730,259 | — | — | 1,895,260 | |||||||||||||||||||||||||||
| Accrued advisory fees | 1,991 | 102,885 | 7,552 | 48,175 | 12,953 | 5,062 | 11,686 | 22,869 | |||||||||||||||||||||||||||
| Accrued expenses | 50,973 | 106,528 | 36,306 | 63,098 | 39,571 | 44,306 | 54,588 | 47,192 | |||||||||||||||||||||||||||
| Total Liabilities | 103,343 | 2,272,295 | 75,810 | 2,266,688 | 1,809,996 | 147,842 | 105,590 | 1,965,321 | |||||||||||||||||||||||||||
| NET ASSETS | $ | 4,735,986 | $ | 258,615,914 | $ | 18,698,788 | $ | 123,488,337 | $ | 33,313,802 | $ | 12,520,390 | $ | 28,041,489 | $ | 58,401,214 | |||||||||||||||||||
| NET ASSETS CONSIST OF: | |||||||||||||||||||||||||||||||||||
| Paid-in capital | $ | 5,173,680 | $ | 266,594,947 | $ | 18,864,779 | $ | 110,798,773 | $ | 32,085,180 | $ | 13,049,115 | $ | 27,034,265 | $ | 55,390,391 | |||||||||||||||||||
| Undistributed net investment income | 24,714 | — | 18,249 | 96,401 | 422,812 | — | — | 63,761 | |||||||||||||||||||||||||||
| Accumulated net realized loss on investments | (287,936 | ) | (30,122,939 | ) | (2,585,804 | ) | (3,586,566 | ) | (2,749,636 | ) | (1,640,052 | ) | (225,806 | ) | (1,064,022 | ) | |||||||||||||||||||
| Net unrealized appreciation (depreciation) on investments | (174,472 | ) | 22,143,906 | 2,401,564 | 16,179,729 | 3,555,446 | 1,111,327 | 1,233,030 | 4,011,084 | ||||||||||||||||||||||||||
| Net Assets | $ | 4,735,986 | $ | 258,615,914 | $ | 18,698,788 | $ | 123,488,337 | $ | 33,313,802 | $ | 12,520,390 | $ | 28,041,489 | $ | 58,401,214 | |||||||||||||||||||
| Shares outstanding (unlimited amount authorized, $0.01 par value) | 200,000 | 13,400,000 | 1,000,000 | 5,800,000 | 1,900,000 | 700,000 | 1,000,000 | 3,100,000 | |||||||||||||||||||||||||||
| Net asset value | $ | 23.68 | $ | 19.30 | $ | 18.70 | $ | 21.29 | $ | 17.53 | $ | 17.89 | $ | 28.04 | $ | 18.84 | |||||||||||||||||||
| Unaffiliated investments at cost | $ | 4,937,944 | $ | 236,749,302 | $ | 16,348,848 | $ | 107,300,517 | $ | 29,641,461 | $ | 11,532,830 | $ | 26,894,250 | $ | 54,324,349 | |||||||||||||||||||
| Affiliated investments at cost | $ | 55,436 | $ | — | $ | — | $ | — | $ | 106,759 | $ | — | $ | — | $ | — | |||||||||||||||||||
See Notes to Financial Statements.
60
| PowerShares Dynamic Leisure and Entertainment Portfolio | PowerShares Dynamic Media Portfolio | PowerShares Dynamic Networking Portfolio | PowerShares Dynamic Oil & Gas Services Portfolio | PowerShares Dynamic Pharmaceuticals Portfolio | PowerShares Dynamic Retail Portfolio | PowerShares Dynamic Semiconductors Portfolio | PowerShares Dynamic Software Portfolio | ||||||||||||||||||||||||||||
| ASSETS: | |||||||||||||||||||||||||||||||||||
| Unaffiliated investments at value | $ | 49,661,207 | $ | 31,338,900 | $ | 18,695,238 | $ | 272,417,566 | $ | 82,377,988 | $ | 24,127,486 | $ | 162,167,620 | $ | 71,702,456 | |||||||||||||||||||
| Affiliated investments at value | — | 38,742 | — | 206,884 | — | 111,949 | — | — | |||||||||||||||||||||||||||
| Cash | — | — | 7,251 | 32,239 | 25,045 | — | — | — | |||||||||||||||||||||||||||
| Receivables: | |||||||||||||||||||||||||||||||||||
| Dividends | 17,212 | 8,287 | — | 872 | 4 | 3,920 | 58,712 | — | |||||||||||||||||||||||||||
| Capital stock sold | — | — | — | — | — | — | 7,671,761 | — | |||||||||||||||||||||||||||
| Due from Adviser | 14,131 | 13,183 | 12,983 | 21,240 | 21,090 | 12,978 | 11,240 | 18,369 | |||||||||||||||||||||||||||
| Other assets | 6,450 | 6,450 | 6,450 | 6,542 | 6,450 | 6,543 | 6,450 | 6,450 | |||||||||||||||||||||||||||
| Total Assets | 49,699,000 | 31,405,562 | 18,721,922 | 272,685,343 | 82,430,577 | 24,262,876 | 169,915,783 | 71,727,275 | |||||||||||||||||||||||||||
| LIABILITIES: | |||||||||||||||||||||||||||||||||||
| Due to custodian | 165,982 | 48,997 | — | — | — | 183,471 | 240,521 | 276,500 | |||||||||||||||||||||||||||
| Payables: | |||||||||||||||||||||||||||||||||||
| Investments purchased | — | — | — | — | — | — | 7,681,294 | — | |||||||||||||||||||||||||||
| Accrued advisory fees | 20,065 | 13,509 | 8,494 | 109,957 | 33,001 | 10,659 | 50,291 | 29,411 | |||||||||||||||||||||||||||
| Accrued expenses | 40,618 | 37,681 | 36,392 | 119,424 | 52,285 | 39,500 | 57,670 | 52,110 | |||||||||||||||||||||||||||
| Total Liabilities | 226,665 | 100,187 | 44,886 | 229,381 | 85,286 | 233,630 | 8,029,776 | 358,021 | |||||||||||||||||||||||||||
| NET ASSETS | $ | 49,472,335 | $ | 31,305,375 | $ | 18,677,036 | $ | 272,455,962 | $ | 82,345,291 | $ | 24,029,246 | $ | 161,886,007 | $ | 71,369,254 | |||||||||||||||||||
| NET ASSETS CONSIST OF: | |||||||||||||||||||||||||||||||||||
| Paid-in capital | $ | 48,661,463 | $ | 34,763,424 | $ | 21,139,442 | $ | 266,811,945 | $ | 77,436,451 | $ | 24,577,929 | $ | 166,522,507 | $ | 68,414,091 | |||||||||||||||||||
| Undistributed net investment income | — | 12,161 | — | 45,350 | — | 22,155 | — | — | |||||||||||||||||||||||||||
| Accumulated net realized loss on investments | (3,170,322 | ) | (4,359,961 | ) | (2,904,986 | ) | (24,480,865 | ) | (1,121,677 | ) | (1,336,551 | ) | (12,615,862 | ) | (4,004,895 | ) | |||||||||||||||||||
| Net unrealized appreciation (depreciation) on investments | 3,981,194 | 889,751 | 442,580 | 30,079,532 | 6,030,517 | 765,713 | 7,979,362 | 6,960,058 | |||||||||||||||||||||||||||
| Net Assets | $ | 49,472,335 | $ | 31,305,375 | $ | 18,677,036 | $ | 272,455,962 | $ | 82,345,291 | $ | 24,029,246 | $ | 161,886,007 | $ | 71,369,254 | |||||||||||||||||||
| Shares outstanding (unlimited amount authorized, $0.01 par value) | 2,700,000 | 1,900,000 | 1,000,000 | 12,000,000 | 4,200,000 | 1,200,000 | 8,500,000 | 3,500,000 | |||||||||||||||||||||||||||
| Net asset value | $ | 18.32 | $ | 16.48 | $ | 18.68 | $ | 22.70 | $ | 19.61 | $ | 20.02 | $ | 19.05 | $ | 20.39 | |||||||||||||||||||
| Unaffiliated investments at cost | $ | 45,680,013 | $ | 30,449,149 | $ | 18,252,658 | $ | 242,338,034 | $ | 76,347,471 | $ | 23,361,773 | $ | 154,188,258 | $ | 64,742,398 | |||||||||||||||||||
| Affiliated investments at cost | $ | — | $ | 38,742 | $ | — | $ | 206,884 | $ | — | $ | 111,949 | $ | — | $ | — | |||||||||||||||||||
61
Statements of Operations
| PowerShares Dynamic Banking Portfolio | PowerShares Dynamic Biotechnology & Genome Portfolio | PowerShares Dynamic Building & Construction Portfolio | PowerShares Dynamic Energy Exploration & Production Portfolio | PowerShares Dynamic Food & Beverage Portfolio | PowerShares Dynamic Hardware & Consumer Electronics Portfolio | PowerShares Dynamic Healthcare Services Portfolio | PowerShares Dynamic Insurance Portfolio | ||||||||||||||||||||||||||||
| For the period October 12, 2006* through April 30, 2007 | Year Ended April 30, 2007 | Year Ended April 30, 2007 | Year Ended April 30, 2007 | Year Ended April 30, 2007 | Year Ended April 30, 2007 | For the period October 12, 2006* through April 30, 2007 | Year Ended April 30, 2007 | ||||||||||||||||||||||||||||
| INVESTMENT INCOME: | |||||||||||||||||||||||||||||||||||
| Unaffiliated dividend income | $ | 102,308 | $ | 174,371 | $ | 118,148 | $ | 1,166,099 | $ | 870,138 | $ | 29,034 | $ | 13,159 | $ | 642,565 | |||||||||||||||||||
| Affiliated dividend income | 435 | — | 162 | 1,706 | 3,087 | — | — | 480 | |||||||||||||||||||||||||||
| Total Income | 102,743 | 174,371 | 118,310 | 1,167,805 | 873,225 | 29,034 | 13,159 | 643,045 | |||||||||||||||||||||||||||
| EXPENSES: | |||||||||||||||||||||||||||||||||||
| Advisory fees | 21,892 | 1,165,041 | 75,528 | 530,156 | 142,996 | 60,870 | 47,899 | 214,060 | |||||||||||||||||||||||||||
| Audit | 16,500 | 16,500 | 16,500 | 16,500 | 16,500 | 16,500 | 16,500 | 16,500 | |||||||||||||||||||||||||||
| Listing fee and expenses | 10,000 | 10,578 | 10,081 | 10,264 | 10,059 | 10,041 | 10,000 | 10,074 | |||||||||||||||||||||||||||
| Offering costs | 4,482 | 1,654 | 1,878 | 1,878 | 1,319 | 9,856 | 4,479 | 1,878 | |||||||||||||||||||||||||||
| Administration fees | 3,742 | 59,999 | 59,999 | 59,999 | 59,999 | 54,162 | 4,338 | 59,999 | |||||||||||||||||||||||||||
| Printing | 3,553 | 104,453 | 8,850 | 49,784 | 12,268 | 11,852 | 5,271 | 20,231 | |||||||||||||||||||||||||||
| Accounting | 3,276 | 54,998 | 54,998 | 54,998 | 54,998 | 49,587 | 3,673 | 54,998 | |||||||||||||||||||||||||||
| Legal | 2,500 | 9,935 | 1,412 | 6,324 | 1,560 | 679 | 2,500 | 2,191 | |||||||||||||||||||||||||||
| Licensing | 2,189 | 69,889 | 2,749 | 30,078 | 8,578 | 3,652 | 4,790 | 11,599 | |||||||||||||||||||||||||||
| Custodian and transfer agent fees | 1,821 | 16,552 | 7,501 | 9,703 | 8,501 | 8,920 | 2,019 | 7,501 | |||||||||||||||||||||||||||
| Registration and filings | 143 | 12,590 | — | 435 | 1,211 | — | 733 | 1,387 | |||||||||||||||||||||||||||
| Trustees | 124 | 8,869 | 528 | 3,774 | 1,109 | 442 | 369 | 1,756 | |||||||||||||||||||||||||||
| Other expenses | 12,236 | 17,385 | 9,715 | 11,873 | 10,427 | 12,313 | 12,235 | 9,590 | |||||||||||||||||||||||||||
| Total Expenses | 82,458 | 1,548,443 | 249,739 | 785,766 | 329,525 | 238,874 | 114,806 | 411,764 | |||||||||||||||||||||||||||
| Less fees waived: | |||||||||||||||||||||||||||||||||||
| Advisory | (21,892 | ) | (78,242 | ) | (75,528 | ) | (117,014 | ) | (142,996 | ) | (60,870 | ) | (47,524 | ) | (140,805 | ) | |||||||||||||||||||
| Other fees assumed by the Adviser | (27,089 | ) | — | (78,341 | ) | — | (4,427 | ) | (90,842 | ) | — | — | |||||||||||||||||||||||
| Net Expenses | 33,477 | 1,470,201 | 95,870 | 668,752 | 182,102 | 87,162 | 67,282 | 270,959 | |||||||||||||||||||||||||||
| Net Investment Income (Loss) | 69,266 | (1,295,830 | ) | 22,440 | 499,053 | 691,123 | (58,128 | ) | (54,123 | ) | 372,086 | ||||||||||||||||||||||||
| REALIZED AND UNREALIZED GAIN (LOSS) ON INVESTMENTS: | |||||||||||||||||||||||||||||||||||
| Net realized gain (loss) from: | |||||||||||||||||||||||||||||||||||
| Investments | (287,936 | ) | (25,334,394 | ) | (2,487,592 | ) | (4,160,205 | ) | (1,428,956 | ) | (1,505,413 | ) | (225,806 | ) | (908,039 | ) | |||||||||||||||||||
| In-kind redemptions | 77,971 | 21,166,135 | 662,646 | 8,378,246 | 2,478,072 | 1,221,989 | 1,075,521 | 2,636,343 | |||||||||||||||||||||||||||
| Net realized gain (loss) | (209,965 | ) | (4,168,259 | ) | (1,824,946 | ) | 4,218,041 | 1,049,116 | (283,424 | ) | 849,715 | 1,728,304 | |||||||||||||||||||||||
| Net change in unrealized appreciation/ depreciation on investments | (174,472 | ) | 30,260,487 | 1,243,144 | 7,881,779 | 2,942,933 | 285,507 | 1,233,030 | 2,466,573 | ||||||||||||||||||||||||||
| Net realized and unrealized gain (loss) on investments | (384,437 | ) | 26,092,228 | (581,802 | ) | 12,099,820 | 3,992,049 | 2,083 | 2,082,745 | 4,194,877 | |||||||||||||||||||||||||
| Net increase (decrease) in net assets resulting from operations | $ | (315,171 | ) | $ | 24,796,398 | $ | (559,362 | ) | $ | 12,598,873 | $ | 4,683,172 | $ | (56,045 | ) | $ | 2,028,622 | $ | 4,566,963 | ||||||||||||||||
* Commencement of Investment Operations.
See Notes to Financial Statements.
62
| PowerShares Dynamic Leisure and Entertainment Portfolio | PowerShares Dynamic Media Portfolio | PowerShares Dynamic Networking Portfolio | PowerShares Dynamic Oil & Gas Services Portfolio | PowerShares Dynamic Pharmaceuticals Portfolio | PowerShares Dynamic Retail Portfolio | PowerShares Dynamic Semiconductors Portfolio | PowerShares Dynamic Software Portfolio | ||||||||||||||||||||||||||||
| Year Ended April 30, 2007 | Year Ended April 30, 2007 | Year Ended April 30, 2007 | Year Ended April 30, 2007 | Year Ended April 30, 2007 | Year Ended April 30, 2007 | Year Ended April 30, 2007 | Year Ended April 30, 2007 | ||||||||||||||||||||||||||||
| INVESTMENT INCOME: | |||||||||||||||||||||||||||||||||||
| Unaffiliated dividend income | $ | 351,508 | $ | 220,173 | $ | 25,093 | $ | 1,863,170 | $ | 817,489 | $ | 194,430 | $ | 343,618 | $ | 82,720 | |||||||||||||||||||
| Affiliated dividend income | 1,952 | 1,311 | — | 1,886 | 3,621 | 2,308 | — | 339 | |||||||||||||||||||||||||||
| Total Income | 353,460 | 221,484 | 25,093 | 1,865,056 | 821,110 | 196,738 | 343,618 | 83,059 | |||||||||||||||||||||||||||
| EXPENSES: | |||||||||||||||||||||||||||||||||||
| Advisory fees | 167,805 | 124,348 | 122,422 | 1,442,227 | 386,568 | 99,369 | 421,997 | 333,698 | |||||||||||||||||||||||||||
| Audit | 16,500 | 16,500 | 16,500 | 16,500 | 16,500 | 16,500 | 16,500 | 16,500 | |||||||||||||||||||||||||||
| Listing fee and expenses | 10,067 | 10,059 | 10,067 | 10,804 | 10,154 | 10,056 | 10,249 | 10,118 | |||||||||||||||||||||||||||
| Offering costs | 1,318 | 1,289 | 1,287 | 2,438 | 1,305 | 1,878 | 1,302 | 1,285 | |||||||||||||||||||||||||||
| Administration fees | 59,999 | 59,999 | 59,999 | 59,999 | 59,999 | 59,999 | 59,999 | 59,999 | |||||||||||||||||||||||||||
| Printing | 15,998 | 11,899 | 10,821 | 133,898 | 34,436 | 11,811 | 39,759 | 32,431 | |||||||||||||||||||||||||||
| Accounting | 54,998 | 54,998 | 54,998 | 54,998 | 54,998 | 54,998 | 54,998 | 54,998 | |||||||||||||||||||||||||||
| Legal | 1,707 | 1,287 | 1,124 | 18,563 | 4,050 | 956 | 4,285 | 3,406 | |||||||||||||||||||||||||||
| Licensing | 10,067 | 7,459 | 7,344 | 85,986 | 23,192 | 3,937 | 25,320 | 20,020 | |||||||||||||||||||||||||||
| Custodian and transfer agent fees | 8,001 | 8,702 | 8,501 | 18,025 | 10,925 | 7,501 | 9,172 | 8,341 | |||||||||||||||||||||||||||
| Registration and filings | 1,282 | 300 | 212 | 1,339 | 3,241 | 550 | 381 | 646 | |||||||||||||||||||||||||||
| Trustees | 1,354 | 933 | 930 | 10,688 | 2,942 | 867 | 3,153 | 2,603 | |||||||||||||||||||||||||||
| Other expenses | 10,684 | 10,441 | 10,535 | 19,544 | 12,014 | 11,055 | 13,009 | 11,016 | |||||||||||||||||||||||||||
| Total Expenses | 359,780 | 308,214 | 304,740 | 1,875,009 | 620,324 | 279,477 | 660,124 | 555,061 | |||||||||||||||||||||||||||
| Less fees waived: | |||||||||||||||||||||||||||||||||||
| Advisory | (146,252 | ) | (124,348 | ) | (122,422 | ) | (55,303 | ) | (131,335 | ) | (99,369 | ) | (126,497 | ) | (132,710 | ) | |||||||||||||||||||
| Other fees assumed by the Adviser | — | (25,292 | ) | (26,170 | ) | — | — | (52,796 | ) | — | — | ||||||||||||||||||||||||
| Net Expenses | 213,528 | 158,574 | 156,148 | 1,819,706 | 488,989 | 127,312 | 533,627 | 422,351 | |||||||||||||||||||||||||||
| Net Investment Income (Loss) | 139,932 | 62,910 | (131,055 | ) | 45,350 | 332,121 | 69,426 | (190,009 | ) | (339,292 | ) | ||||||||||||||||||||||||
| REALIZED AND UNREALIZED GAIN (LOSS) ON INVESTMENTS: | |||||||||||||||||||||||||||||||||||
| Net realized gain (loss) from: | |||||||||||||||||||||||||||||||||||
| Investments | (1,804,212 | ) | (2,616,684 | ) | (2,120,269 | ) | (23,289,712 | ) | (810,908 | ) | (1,066,019 | ) | (10,437,819 | ) | (3,136,814 | ) | |||||||||||||||||||
| In-kind redemptions | 3,920,909 | 3,870,781 | 5,976,254 | 22,747,144 | 7,092,798 | 3,433,387 | 9,176,280 | 9,986,126 | |||||||||||||||||||||||||||
| Net realized gain (loss) | 2,116,697 | 1,254,097 | 3,855,985 | (542,568 | ) | 6,281,890 | 2,367,368 | (1,261,539 | ) | 6,849,312 | |||||||||||||||||||||||||
| Net change in unrealized appreciation/ depreciation on investments | 1,377,435 | 858,209 | (2,673,735 | ) | 4,979,597 | 7,374,349 | (1,871,851 | ) | (3,142,437 | ) | 2,073,236 | ||||||||||||||||||||||||
| Net realized and unrealized gain (loss) on investments | 3,494,132 | 2,112,306 | 1,182,250 | 4,437,029 | 13,656,239 | 495,517 | (4,403,976 | ) | 8,922,548 | ||||||||||||||||||||||||||
| Net increase (decrease) in net assets resulting from operations | $ | 3,634,064 | $ | 2,175,216 | $ | 1,051,195 | $ | 4,482,379 | $ | 13,988,360 | $ | 564,943 | $ | (4,593,985 | ) | $ | 8,583,256 | ||||||||||||||||||
63
Statements of Changes in Net Assets
| PowerShares Dynamic Banking Portfolio | PowerShares Dynamic Biotechnology & Genome Portfolio | PowerShares Dynamic Building & Construction Portfolio | |||||||||||||||||||||
| For the period October 12, 2006* through April 30, 2007 | For the year ended April 30, 2007 | For the period June 23, 2005* through April 30, 2006 | For the year ended April 30, 2007 | For the period October 26, 2005* through April 30, 2006 | |||||||||||||||||||
| OPERATIONS: | |||||||||||||||||||||||
| Net investment income (loss) | $ | 69,266 | $ | (1,295,830 | ) | $ | (735,610 | ) | $ | 22,440 | $ | (614 | ) | ||||||||||
| Net realized gain (loss) on investments | (209,965 | ) | (4,168,259 | ) | 8,629,116 | (1,824,946 | ) | 6,061,237 | |||||||||||||||
| Net change in unrealized appreciation/depreciation on investments | (174,472 | ) | 30,260,487 | (8,116,581 | ) | 1,243,144 | 1,158,420 | ||||||||||||||||
| Net increase (decrease) in net assets resulting from operations | (315,171 | ) | 24,796,398 | (223,075 | ) | (559,362 | ) | 7,219,043 | |||||||||||||||
| Undistributed net investment income (loss) included in the price of units issued and redeemed | (19,989 | ) | 98,651 | — | 13,852 | — | |||||||||||||||||
| DISTRIBUTIONS TO SHAREHOLDERS FROM: | |||||||||||||||||||||||
| Net investment income | (44,552 | ) | — | — | (4,191 | ) | (15,330 | ) | |||||||||||||||
| SHAREHOLDER TRANSACTIONS: | |||||||||||||||||||||||
| Proceeds from shares sold | 22,356,336 | 155,765,402 | 331,894,266 | 17,839,986 | 74,726,928 | ||||||||||||||||||
| Value of shares repurchased | (17,260,627 | ) | (171,967,279 | ) | (81,649,798 | ) | (23,983,205 | ) | (56,525,081 | ) | |||||||||||||
| Net income equalization | 19,989 | (98,651 | ) | — | (13,852 | ) | — | ||||||||||||||||
| Net increase (decrease) in net assets resulting from shares transactions | 5,115,698 | (16,300,528 | ) | 250,244,468 | (6,157,071 | ) | 18,201,847 | ||||||||||||||||
| Increase (Decrease) in Net Assets | 4,735,986 | 8,594,521 | 250,021,393 | (6,706,772 | ) | 25,405,560 | |||||||||||||||||
| NET ASSETS: | |||||||||||||||||||||||
| Beginning of period | — | 250,021,393 | — | 25,405,560 | — | ||||||||||||||||||
| End of period | $ | 4,735,986 | $ | 258,615,914 | $ | 250,021,393 | $ | 18,698,788 | $ | 25,405,560 | |||||||||||||
| Undistributed net investment income at end of period | $ | 24,714 | $ | — | $ | — | $ | 18,249 | $ | — | |||||||||||||
| CHANGES IN SHARES OUTSTANDING: | |||||||||||||||||||||||
| Shares sold | 900,000 | 8,900,000 | 19,100,000 | 1,100,000 | 4,600,000 | ||||||||||||||||||
| Shares repurchased | (700,000 | ) | (10,000,000 | ) | (4,600,000 | ) | (1,500,000 | ) | (3,200,000 | ) | |||||||||||||
| Shares outstanding, beginning of period | — | 14,500,000 | — | 1,400,000 | — | ||||||||||||||||||
| Shares outstanding, end of period | 200,000 | 13,400,000 | 14,500,000 | 1,000,000 | 1,400,000 | ||||||||||||||||||
* Commencement of Investment Operations.
See Notes to Financial Statements.
64
| PowerShares Dynamic Energy Exploration & Production Portfolio | PowerShares Dynamic Food & Beverage Portfolio | PowerShares Dynamic Hardware & Consumer Electronics Portfolio | |||||||||||||||||||||||||
| For the year ended April 30, 2007 | For the period October 26, 2005* through April 30, 2006 | For the year ended April 30, 2007 | For the period June 23, 2005* through April 30, 2006 | For the year ended April 30, 2007 | For the period December 6, 2005* through April 30, 2006 | ||||||||||||||||||||||
| OPERATIONS: | |||||||||||||||||||||||||||
| Net investment income (loss) | $ | 499,053 | $ | (4,486 | ) | $ | 691,123 | $ | 182,138 | $ | (58,128 | ) | $ | (46,184 | ) | ||||||||||||
| Net realized gain (loss) on investments | 4,218,041 | 4,581,724 | 1,049,116 | (385,786 | ) | (283,424 | ) | 1,708,634 | |||||||||||||||||||
| Net change in unrealized appreciation/depreciation on investments | 7,881,779 | 8,297,950 | 2,942,933 | 612,513 | 285,507 | 825,820 | |||||||||||||||||||||
| Net increase (decrease) in net assets resulting from operations | 12,598,873 | 12,875,188 | 4,683,172 | 408,865 | (56,045 | ) | 2,488,270 | ||||||||||||||||||||
| Undistributed net investment income (loss) included in the price of units issued and redeemed | (44,428 | ) | — | 28,365 | — | 17,722 | — | ||||||||||||||||||||
| DISTRIBUTIONS TO SHAREHOLDERS FROM: | |||||||||||||||||||||||||||
| Net investment income | (351,098 | ) | (47,068 | ) | (306,737 | ) | (143,712 | ) | — | — | |||||||||||||||||
| SHAREHOLDER TRANSACTIONS: | |||||||||||||||||||||||||||
| Proceeds from shares sold | 142,236,445 | 133,305,347 | 29,846,194 | 34,218,637 | 11,586,059 | 30,972,458 | |||||||||||||||||||||
| Value of shares repurchased | (142,790,736 | ) | (34,338,614 | ) | (25,178,900 | ) | (10,213,717 | ) | (15,773,610 | ) | (16,696,742 | ) | |||||||||||||||
| Net income equalization | 44,428 | — | (28,365 | ) | — | (17,722 | ) | — | |||||||||||||||||||
| Net increase (decrease) in net assets resulting from shares transactions | (509,863 | ) | 98,966,733 | 4,638,929 | 24,004,920 | (4,205,273 | ) | 14,275,716 | |||||||||||||||||||
| Increase (Decrease) in Net Assets | 11,693,484 | 111,794,853 | 9,043,729 | 24,270,073 | (4,243,596 | ) | 16,763,986 | ||||||||||||||||||||
| NET ASSETS: | |||||||||||||||||||||||||||
| Beginning of period | 111,794,853 | — | 24,270,073 | — | 16,763,986 | — | |||||||||||||||||||||
| End of period | $ | 123,488,337 | $ | 111,794,853 | $ | 33,313,802 | $ | 24,270,073 | $ | 12,520,390 | $ | 16,763,986 | |||||||||||||||
| Undistributed net investment income at end of period | $ | 96,401 | $ | — | $ | 422,812 | $ | 38,426 | $ | — | $ | — | |||||||||||||||
| CHANGES IN SHARES OUTSTANDING: | |||||||||||||||||||||||||||
| Shares sold | 7,600,000 | 8,000,000 | 1,900,000 | 2,300,000 | 700,000 | 2,000,000 | |||||||||||||||||||||
| Shares repurchased | (7,800,000 | ) | (2,000,000 | ) | (1,600,000 | ) | (700,000 | ) | (1,000,000 | ) | (1,000,000 | ) | |||||||||||||||
| Shares outstanding, beginning of period | 6,000,000 | — | 1,600,000 | — | 1,000,000 | — | |||||||||||||||||||||
| Shares outstanding, end of period | 5,800,000 | 6,000,000 | 1,900,000 | 1,600,000 | 700,000 | 1,000,000 | |||||||||||||||||||||
65
Statements of Changes in Net Assets (Continued)
| PowerShares Healthcare Services Portfolio | PowerShares Dynamic Insurance Portfolio | PowerShares Dynamic Leisure and Entertainment Portfolio | |||||||||||||||||||||
| For the period October 12, 2006* through April 30, 2007 | For the year ended April 30, 2007 | For the period October 26, 2005* through April 30, 2006 | For the year ended April 30, 2007 | For the period June 23, 2005* through April 30, 2006 | |||||||||||||||||||
| OPERATIONS: | |||||||||||||||||||||||
| Net investment income (loss) | $ | (54,123 | ) | $ | 372,086 | $ | 136,825 | $ | 139,932 | $ | 46,331 | ||||||||||||
| Net realized gain (loss) on investments | 849,715 | 1,728,304 | 1,096,704 | 2,116,697 | (297,491 | ) | |||||||||||||||||
| Net change in unrealized appreciation/depreciation on investments | 1,233,030 | 2,466,573 | 1,544,511 | 1,377,435 | 2,603,759 | ||||||||||||||||||
| Net increase (decrease) in net assets resulting from operations | 2,028,622 | 4,566,963 | 2,778,040 | 3,634,064 | 2,352,599 | ||||||||||||||||||
| Undistributed net investment income (loss) included in the price of units issued and redeemed | (26,513 | ) | 26,238 | — | 17,232 | — | |||||||||||||||||
| DISTRIBUTIONS TO SHAREHOLDERS FROM: | |||||||||||||||||||||||
| Net investment income | — | (333,066 | ) | (112,084 | ) | (158,121 | ) | (28,509 | ) | ||||||||||||||
| Tax return of capital | — | — | — | (21,748 | ) | — | |||||||||||||||||
| Total distributions | — | (333,066 | ) | (112,084 | ) | (179,869 | ) | (28,509 | ) | ||||||||||||||
| SHAREHOLDER TRANSACTIONS: | |||||||||||||||||||||||
| Proceeds from shares sold | 41,920,078 | 67,091,384 | 51,895,393 | 48,534,706 | 37,406,748 | ||||||||||||||||||
| Value of shares repurchased | (15,907,211 | ) | (44,088,414 | ) | (23,397,002 | ) | (30,217,844 | ) | (12,029,560 | ) | |||||||||||||
| Net income equalization | 26,513 | (26,238 | ) | — | (17,232 | ) | — | ||||||||||||||||
| Net increase (decrease) in net assets resulting from share transactions | 26,039,380 | 22,976,732 | 28,498,391 | 18,299,630 | 25,377,188 | ||||||||||||||||||
| Increase (Decrease) in Net Assets | 28,041,489 | 27,236,867 | 31,164,347 | 21,771,057 | 27,701,278 | ||||||||||||||||||
| NET ASSETS: | |||||||||||||||||||||||
| Beginning of period | — | 31,164,347 | — | 27,701,278 | — | ||||||||||||||||||
| End of period | $ | 28,041,489 | $ | 58,401,214 | $ | 31,164,347 | $ | 49,472,335 | $ | 27,701,278 | |||||||||||||
| Undistributed net investment income at end of period | $ | — | $ | 63,761 | $ | 24,741 | $ | — | $ | 18,022 | |||||||||||||
| CHANGES IN SHARES OUTSTANDING: | |||||||||||||||||||||||
| Shares sold | 1,600,000 | 3,800,000 | 3,200,000 | 2,800,000 | 2,500,000 | ||||||||||||||||||
| Shares repurchased | (600,000 | ) | (2,500,000 | ) | (1,400,000 | ) | (1,800,000 | ) | (800,000 | ) | |||||||||||||
| Shares outstanding, beginning of period | — | 1,800,000 | — | 1,700,000 | — | ||||||||||||||||||
| Shares outstanding, end of period | 1,000,000 | 3,100,000 | 1,800,000 | 2,700,000 | 1,700,000 | ||||||||||||||||||
* Commencement of Investment Operations.
See Notes to Financial Statements.
66
| PowerShares Dynamic Media Portfolio | PowerShares Dynamic Networking Portfolio | PowerShares Dynamic Oil & Gas Services Portfolio | |||||||||||||||||||||||||
| For the year ended April 30, 2007 | For the period June 23, 2005* through April 30, 2006 | For the year ended April 30, 2007 | For the period June 23, 2005* through April 30, 2006 | For the year ended April 30, 2007 | For the period October 26, 2005* through April 30, 2006 | ||||||||||||||||||||||
| OPERATIONS: | |||||||||||||||||||||||||||
| Net investment income (loss) | $ | 62,910 | $ | 41,079 | $ | (131,055 | ) | $ | (130,625 | ) | $ | 45,350 | $ | (77,301 | ) | ||||||||||||
| Net realized gain (loss) on investments | 1,254,097 | (1,073,312 | ) | 3,855,985 | 846,150 | (542,568 | ) | 4,830,987 | |||||||||||||||||||
| Net change in unrealized appreciation/depreciation on investments | 858,209 | 31,542 | (2,673,735 | ) | 3,116,315 | 4,979,597 | 25,099,935 | ||||||||||||||||||||
| Net increase (decrease) in net assets resulting from operations | 2,175,216 | (1,000,691 | ) | 1,051,195 | 3,831,840 | 4,482,379 | 29,853,621 | ||||||||||||||||||||
| Undistributed net investment income (loss) included in the price of units issued and redeemed | (9,491 | ) | — | 36,561 | — | 45,370 | — | ||||||||||||||||||||
| DISTRIBUTIONS TO SHAREHOLDERS FROM: | |||||||||||||||||||||||||||
| Net investment income | (58,259 | ) | (34,051 | ) | — | — | — | — | |||||||||||||||||||
| Tax return of capital | — | — | — | — | — | — | |||||||||||||||||||||
| Total distributions | (58,259 | ) | (34,051 | ) | — | — | — | — | |||||||||||||||||||
| SHAREHOLDER TRANSACTIONS: | |||||||||||||||||||||||||||
| Proceeds from shares sold | 45,055,211 | 35,776,211 | 43,920,427 | 35,217,483 | 192,578,053 | 362,551,971 | |||||||||||||||||||||
| Value of shares repurchased | (40,409,878 | ) | (10,198,384 | ) | (54,100,512 | ) | (11,243,397 | ) | (260,736,085 | ) | (56,273,977 | ) | |||||||||||||||
| Net income equalization | 9,491 | — | (36,561 | ) | — | (45,370 | ) | — | |||||||||||||||||||
| Net increase (decrease) in net assets resulting from share transactions | 4,654,824 | 25,577,827 | (10,216,646 | ) | 23,974,086 | (68,203,402 | ) | 306,277,994 | |||||||||||||||||||
| Increase (Decrease) in Net Assets | 6,762,290 | 24,543,085 | (9,128,890 | ) | 27,805,926 | (63,675,653 | ) | 336,131,615 | |||||||||||||||||||
| NET ASSETS: | |||||||||||||||||||||||||||
| Beginning of period | 24,543,085 | — | 27,805,926 | — | 336,131,615 | — | |||||||||||||||||||||
| End of period | $ | 31,305,375 | $ | 24,543,085 | $ | 18,677,036 | $ | 27,805,926 | $ | 272,455,962 | $ | 336,131,615 | |||||||||||||||
| Undistributed net investment income at end of period | $ | 12,161 | $ | 7,510 | $ | — | $ | — | $ | 45,350 | $ | — | |||||||||||||||
| CHANGES IN SHARES OUTSTANDING: | |||||||||||||||||||||||||||
| Shares sold | 2,900,000 | 2,400,000 | 2,600,000 | 2,300,000 | 9,500,000 | 18,700,000 | |||||||||||||||||||||
| Shares repurchased | (2,700,000 | ) | (700,000 | ) | (3,200,000 | ) | (700,000 | ) | (13,200,000 | ) | (3,000,000 | ) | |||||||||||||||
| Shares outstanding, beginning of period | 1,700,000 | — | 1,600,000 | — | 15,700,000 | — | |||||||||||||||||||||
| Shares outstanding, end of period | 1,900,000 | 1,700,000 | 1,000,000 | 1,600,000 | 12,000,000 | 15,700,000 | |||||||||||||||||||||
67
Statements of Changes in Net Assets (Continued)
| PowerShares Dynamic Pharmaceuticals Portfolio | PowerShares Dynamic Retail Portfolio | ||||||||||||||||||
| For the year ended April 30, 2007 | For the period June 23, 2005* through April 30, 2006 | For the year ended April 30, 2007 | For the period October 26, 2005* through April 30, 2006 | ||||||||||||||||
| OPERATIONS: | |||||||||||||||||||
| Net investment income (loss) | $ | 332,121 | $ | 142,619 | $ | 69,426 | $ | 21,805 | |||||||||||
| Net realized gain (loss) on investments | 6,281,890 | 3,028,471 | 2,367,368 | 2,686,969 | |||||||||||||||
| Net change in unrealized appreciation/depreciation on investments | 7,374,349 | (1,343,832 | ) | (1,871,851 | ) | 2,637,564 | |||||||||||||
| Net increase (decrease) in net assets resulting from operations | 13,988,360 | 1,827,258 | 564,943 | 5,346,338 | |||||||||||||||
| Undistributed net investment income (loss) included in the price of units issued and redeemed | (24,592 | ) | — | (3,544 | ) | — | |||||||||||||
| DISTRIBUTIONS TO SHAREHOLDERS FROM: | |||||||||||||||||||
| Net investment income | (367,491 | ) | (107,249 | ) | (54,224 | ) | (16,497 | ) | |||||||||||
| Tax return of capital | (27,281 | ) | — | — | — | ||||||||||||||
| Total distributions | (394,772 | ) | (107,249 | ) | (54,224 | ) | (16,497 | ) | |||||||||||
| SHAREHOLDER TRANSACTIONS: | |||||||||||||||||||
| Proceeds from shares sold | 72,406,707 | 84,466,520 | 77,371,444 | 67,902,200 | |||||||||||||||
| Value of shares repurchased | (69,811,556 | ) | (20,029,977 | ) | (77,636,176 | ) | (49,448,782 | ) | |||||||||||
| Net income equalization | 24,592 | — | 3,544 | — | |||||||||||||||
| Net increase (decrease) in net assets resulting from share transactions | 2,619,743 | 64,436,543 | (261,188 | ) | 18,453,418 | ||||||||||||||
| Increase in Net Assets | 16,188,739 | 66,156,552 | 245,987 | 23,783,259 | |||||||||||||||
| NET ASSETS: | |||||||||||||||||||
| Beginning of period | 66,156,552 | — | 23,783,259 | — | |||||||||||||||
| End of period | $ | 82,345,291 | $ | 66,156,552 | $ | 24,029,246 | $ | 23,783,259 | |||||||||||
| Undistributed net investment income at end of period | $ | — | $ | 35,370 | $ | 22,155 | $ | 5,308 | |||||||||||
| CHANGES IN SHARES OUTSTANDING: | |||||||||||||||||||
| Shares sold | 4,200,000 | 5,200,000 | 4,300,000 | 4,300,000 | |||||||||||||||
| Shares repurchased | (4,000,000 | ) | (1,200,000 | ) | (4,400,000 | ) | (3,000,000 | ) | |||||||||||
| Shares outstanding, beginning of period | 4,000,000 | — | 1,300,000 | — | |||||||||||||||
| Shares outstanding, end of period | 4,200,000 | 4,000,000 | 1,200,000 | 1,300,000 | |||||||||||||||
* Commencement of Investment Operations.
See Notes to Financial Statements.
68
| PowerShares Dynamic Semiconductors Portfolio | PowerShares Dynamic Software Portfolio | ||||||||||||||||||
| For the year ended April 30, 2007 | For the period June 23, 2005* through April 30, 2006 | For the year ended April 30, 2007 | For the period June 23, 2005* through April 30, 2006 | ||||||||||||||||
| OPERATIONS: | |||||||||||||||||||
| Net investment income (loss) | $ | (190,009 | ) | $ | (200,059 | ) | $ | (339,292 | ) | $ | (158,565 | ) | |||||||
| Net realized gain (loss) on investments | (1,261,539 | ) | 9,142,828 | 6,849,312 | 1,953,589 | ||||||||||||||
| Net change in unrealized appreciation/depreciation on investments | (3,142,437 | ) | 11,121,799 | 2,073,236 | 4,886,822 | ||||||||||||||
| Net increase (decrease) in net assets resulting from operations | (4,593,985 | ) | 20,064,568 | 8,583,256 | 6,681,846 | ||||||||||||||
| Undistributed net investment income (loss) included in the price of units issued and redeemed | (71,444 | ) | — | 1,824 | — | ||||||||||||||
| DISTRIBUTIONS TO SHAREHOLDERS FROM: | |||||||||||||||||||
| Net investment income | — | — | — | — | |||||||||||||||
| Tax return of capital | — | — | — | — | |||||||||||||||
| Total distributions | — | — | — | — | |||||||||||||||
| SHAREHOLDER TRANSACTIONS: | |||||||||||||||||||
| Proceeds from shares sold | 159,099,139 | 157,737,331 | 99,964,940 | 62,047,515 | |||||||||||||||
| Value of shares repurchased | (99,548,000 | ) | (70,873,046 | ) | (86,977,854 | ) | (18,930,449 | ) | |||||||||||
| Net income equalization | 71,444 | — | (1,824 | ) | — | ||||||||||||||
| Net increase (decrease) in net assets resulting from share transactions | 59,622,583 | 86,864,285 | 12,985,262 | 43,117,066 | |||||||||||||||
| Increase in Net Assets | 54,957,154 | 106,928,853 | 21,570,342 | 49,798,912 | |||||||||||||||
| NET ASSETS: | |||||||||||||||||||
| Beginning of period | 106,928,853 | — | 49,798,912 | — | |||||||||||||||
| End of period | $ | 161,886,007 | $ | 106,928,853 | $ | 71,369,254 | $ | 49,798,912 | |||||||||||
| Undistributed net investment income at end of period | $ | — | $ | — | $ | — | $ | — | |||||||||||
| CHANGES IN SHARES OUTSTANDING: | |||||||||||||||||||
| Shares sold | 8,800,000 | 9,200,000 | 5,500,000 | 3,800,000 | |||||||||||||||
| Shares repurchased | (5,600,000 | ) | (3,900,000 | ) | (4,700,000 | ) | (1,100,000 | ) | |||||||||||
| Shares outstanding, beginning of period | 5,300,000 | — | 2,700,000 | — | |||||||||||||||
| Shares outstanding, end of period | 8,500,000 | 5,300,000 | 3,500,000 | 2,700,000 | |||||||||||||||
69
Financial Highlights
PowerShares Dynamic Banking Portfolio
| For the period October 12, 2006* through April 30, 2007 | |||||||
| PER SHARE OPERATING PERFORMANCE: | |||||||
| Net asset value at beginning of period . | $ | 25.17 | |||||
| Net investment income** | 0.22 | ||||||
| Net realized and unrealized loss on investments | (1.43 | ) | |||||
| Total from operations | (1.21 | ) | |||||
| Undistributed net investment loss included in price of units issued and redeemed** | (0.06 | ) | |||||
| Distributions to shareholders from: | |||||||
| Net investment income | (0.22 | ) | |||||
| Net asset value at end of period | $ | 23.68 | |||||
| TOTAL RETURN:*** | (5.08 | )% | |||||
| RATIOS/SUPPLEMENTAL DATA: | |||||||
| Net assets at end of period (000's omitted) | $ | 4,736 | |||||
| Ratio to average net assets of: | |||||||
| Expenses, net of waivers .. | 0.76 | %† | |||||
| Expenses, prior to waivers | 1.88 | %† | |||||
| Net investment income, net of waivers | 1.58 | %† | |||||
| Portfolio turnover rate †† | 57 | % | |||||
PowerShares Dynamic Biotechnology & Genome Portfolio
| For the year ended April 30, 2007 | For the period June 23, 2005* through April 30, 2006 | ||||||||||
| PER SHARE OPERATING PERFORMANCE: | |||||||||||
| Net asset value at beginning of period | $ | 17.24 | $ | 14.71 | |||||||
| Net investment loss** | (0.10 | ) | (0.08 | ) | |||||||
| Net realized and unrealized gain on investments | 2.15 | 2.61 | |||||||||
| Total from operations | 2.05 | 2.53 | |||||||||
| Undistributed net investment income included in price of units issued and redeemed** | 0.01 | — | |||||||||
| Net asset value at end of period | $ | 19.30 | $ | 17.24 | |||||||
| TOTAL RETURN:*** | 11.95 | % | 17.20 | % | |||||||
| RATIOS/SUPPLEMENTAL DATA: | |||||||||||
| Net assets at end of period (000's omitted) | $ | 258,616 | $ | 250,021 | |||||||
| Ratio to average net assets of: | |||||||||||
| Expenses, net of waivers | 0.63 | % | 0.64 | %† | |||||||
| Expenses, prior to waivers | 0.66 | %††† | 0.67 | %† | |||||||
| Net investment loss, net of waivers | (0.56 | )% | (0.55 | )%† | |||||||
| Portfolio turnover rate †† | 82 | % | 49 | % | |||||||
* Commencement of Investment Operations.
** Based on average shares outstanding.
*** Total investment return is calculated assuming an initial investment made at the net asset value at the beginning of the period, reinvestment of all dividends and distributions at net asset value during the period, and redemption on the last day of the period. Total investment return calculated for a period of less than one year is not annualized.
† Annualized.
†† Portfolio turnover is not annualized and does not include securities received or delivered from processing creations or redemptions.
††† These expenses, prior to waivers, include amounts reimbursed to the Adviser under the Expense Agreement of less than 0.01% for the year ended April 30, 2007.
See Notes to Financial Statements.
70
Financial Highlights (Continued)
PowerShares Dynamic Building & Construction Portfolio
| For the year ended April 30, 2007 | For the period October 26, 2005* through April 30, 2006 | ||||||||||
| PER SHARE OPERATING PERFORMANCE: | |||||||||||
| Net asset value at beginning of period | $ | 18.15 | $ | 15.26 | |||||||
| Net investment income** | 0.02 | — | (a) | ||||||||
| Net realized and unrealized gain on investments | 0.52 | 2.90 | |||||||||
| Total from operations | 0.54 | 2.90 | |||||||||
| Undistributed net investment income included in price of units issued and redeemed** | 0.01 | — | |||||||||
| Distributions to shareholders from: | |||||||||||
| Net investment income | — | (a) | (0.01 | ) | |||||||
| Net asset value at end of period | $ | 18.70 | $ | 18.15 | |||||||
| TOTAL RETURN:*** | 3.06 | % | 18.99 | % | |||||||
| RATIOS/SUPPLEMENTAL DATA: | |||||||||||
| Net assets at end of period (000's omitted) . | $ | 18,699 | $ | 25,406 | |||||||
| Ratio to average net assets of: | |||||||||||
| Expenses, net of waivers | 0.63 | % | 0.67 | %† | |||||||
| Expenses, prior to waivers | 1.65 | % | 0.80 | %† | |||||||
| Net investment income, net of waivers | 0.15 | % | — | †(a) | |||||||
| Portfolio turnover rate †† | 59 | % | 29 | % | |||||||
PowerShares Dynamic Energy Exploration & Production Portfolio
| For the year ended April 30, 2007 | For the period October 26, 2005* through April 30, 2006 | ||||||||||
| PER SHARE OPERATING PERFORMANCE: | |||||||||||
| Net asset value at beginning of period | $ | 18.63 | $ | 16.03 | |||||||
| Net investment income** | 0.09 | — | (a) | ||||||||
| Net realized and unrealized gain on investments | 2.64 | 2.62 | |||||||||
| Total from operations | 2.73 | 2.62 | |||||||||
| Undistributed net investment loss included in price of units issued and redeemed** | (0.01 | ) | — | ||||||||
| Distributions to shareholders from: | |||||||||||
| Net investment income | (0.06 | ) | (0.02 | ) | |||||||
| Net asset value at end of period | $ | 21.29 | $ | 18.63 | |||||||
| TOTAL RETURN:*** | 14.66 | % | 16.33 | % | |||||||
| RATIOS/SUPPLEMENTAL DATA: | |||||||||||
| Net assets at end of period (000's omitted) | $ | 123,488 | $ | 111,795 | |||||||
| Ratio to average net assets of: | |||||||||||
| Expenses, net of waivers | 0.63 | % | 0.66 | %† | |||||||
| Expenses, prior to waivers | 0.74 | % | 0.75 | %† | |||||||
| Net investment income (loss), net of waivers | 0.47 | % | (0.01 | )%† | |||||||
| Portfolio turnover rate †† | 59 | % | 19 | % | |||||||
* Commencement of Investment Operations.
** Based on average shares outstanding.
*** Total investment return is calculated assuming an initial investment made at the net asset value at the beginning of the period, reinvestment of all dividends and distributions at net asset value during the period, and redemption on the last day of the period. Total investment return calculated for a period of less than one year is not annualized.
† Annualized.
†† Portfolio turnover is not annualized and does not include securities received or delivered from processing creations or redemptions.
(a) Amount represents less than $0.005 or 0.005%
See Notes to Financial Statements.
71
Financial Highlights (Continued)
PowerShares Dynamic Food & Beverage Portfolio
| For the year ended April 30, 2007 | For the period June 23, 2005* through April 30, 2006 | ||||||||||
| PER SHARE OPERATING PERFORMANCE: | |||||||||||
| Net asset value at beginning of period | $ | 15.17 | $ | 14.85 | |||||||
| Net investment income** | 0.39 | 0.11 | |||||||||
| Net realized and unrealized gain on investments | 2.12 | 0.30 | |||||||||
| Total from operations | 2.51 | 0.41 | |||||||||
| Undistributed net investment income included in price of units issued and redeemed** | 0.02 | — | |||||||||
| Distributions to shareholders from: | |||||||||||
| Net investment income | (0.17 | ) | (0.09 | ) | |||||||
| Net asset value at end of period | $ | 17.53 | $ | 15.17 | |||||||
| TOTAL RETURN:*** | 16.79 | % | 2.78 | % | |||||||
| RATIOS/SUPPLEMENTAL DATA: | |||||||||||
| Net assets at end of period (000's omitted) | $ | 33,314 | $ | 24,270 | |||||||
| Ratio to average net assets of: | |||||||||||
| Expenses, net of waivers | 0.64 | % | 0.69 | %† | |||||||
| Expenses, prior to waivers | 1.15 | % | 1.07 | %† | |||||||
| Net investment income, net of waivers | 2.42 | % | 0.91 | %† | |||||||
| Portfolio turnover rate †† | 50 | % | 72 | % | |||||||
PowerShares Dynamic Hardware & Consumer Electronics Portfolio
| For the year ended April 30, 2007 | For the period December 6, 2005* through April 30, 2006 | ||||||||||
| PER SHARE OPERATING PERFORMANCE: | |||||||||||
| Net asset value at beginning of period | $ | 16.76 | $ | 15.30 | |||||||
| Net investment loss** | (0.08 | ) | (0.03 | ) | |||||||
| Net realized and unrealized gain on investments | 1.19 | 1.49 | |||||||||
| Total from operations | 1.11 | 1.46 | |||||||||
| Undistributed net investment income included in price of units issued and redeemed** | 0.02 | — | |||||||||
| Net asset value at end of period | $ | 17.89 | $ | 16.76 | |||||||
| TOTAL RETURN:*** | 6.74 | % | 9.54 | % | |||||||
| RATIOS/SUPPLEMENTAL DATA: | |||||||||||
| Net assets at end of period (000's omitted) | $ | 12,520 | $ | 16,764 | |||||||
| Ratio to average net assets of: | |||||||||||
| Expenses, net of waivers | 0.72 | % | 0.68 | %† | |||||||
| Expenses, prior to waivers | 1.96 | % | 1.03 | %† | |||||||
| Net investment loss, net of waivers | (0.48 | )% | (0.48 | )%† | |||||||
| Portfolio turnover rate †† | 52 | % | 14 | % | |||||||
* Commencement of Investment Operations.
** Based on average shares outstanding.
*** Total investment return is calculated assuming an initial investment made at the net asset value at the beginning of the period, reinvestment of all dividends and distributions at net asset value during the period, and redemption on the last day of the period. Total investment return calculated for a period of less than one year is not annualized.
† Annualized.
†† Portfolio turnover is not annualized and does not include securities received or delivered from processing creations or redemptions.
See Notes to Financial Statements.
72
Financial Highlights (Continued)
PowerShares Dynamic Healthcare Services Portfolio
| For the period October 12, 2006* through April 30, 2007 | |||||||
| PER SHARE OPERATING PERFORMANCE: | |||||||
| Net asset value at beginning of period | $ | 24.88 | |||||
| Net investment loss** | (0.08 | ) | |||||
| Net realized and unrealized gain on investments | 3.28 | ||||||
| Total from operations | 3.20 | ||||||
| Undistributed net investment loss included in price of units issued and redeemed** | (0.04 | ) | |||||
| Net asset value at end of period | $ | 28.04 | |||||
| TOTAL RETURN:*** | 12.70 | % | |||||
| RATIOS/SUPPLEMENTAL DATA: | |||||||
| Net assets at end of period (000's omitted) | $ | 28,041 | |||||
| Ratio to average net assets of: | |||||||
| Expenses, net of waivers | 0.70 | %† | |||||
| Expenses, prior to waivers | 1.20 | %† | |||||
| Net investment loss, net of waivers | (0.56 | )%† | |||||
| Portfolio turnover rate †† | 13 | % | |||||
PowerShares Dynamic Insurance Portfolio
| For the year ended April 30, 2007 | For the period October 26, 2005* through April 30, 2006 | ||||||||||
| PER SHARE OPERATING PERFORMANCE: | |||||||||||
| Net asset value at beginning of period | $ | 17.31 | $ | 15.44 | |||||||
| Net investment income** | 0.15 | 0.07 | |||||||||
| Net realized and unrealized gain on investments | 1.50 | 1.86 | |||||||||
| Total from operations | 1.65 | 1.93 | |||||||||
| Undistributed net investment income included in price of units issued and redeemed** . | 0.01 | — | |||||||||
| Distributions to shareholders from: | |||||||||||
| Net investment income | (0.13 | ) | (0.06 | ) | |||||||
| Net asset value at end of period | $ | 18.84 | $ | 17.31 | |||||||
| TOTAL RETURN:*** | 9.62 | % | 12.54 | % | |||||||
| RATIOS/SUPPLEMENTAL DATA: | |||||||||||
| Net assets at end of period (000's omitted) | $ | 58,401 | $ | 31,164 | |||||||
| Ratio to average net assets of: | |||||||||||
| Expenses, net of waivers | 0.63 | % | 0.68 | %† | |||||||
| Expenses, prior to waivers | 0.96 | % | 0.87 | %† | |||||||
| Net investment income, net of waivers | 0.87 | % | 0.81 | %† | |||||||
| Portfolio turnover rate †† | 40 | % | 30 | % | |||||||
* Commencement of Investment Operations.
** Based on average shares outstanding.
*** Total investment return is calculated assuming an initial investment made at the net asset value at the beginning of the period, reinvestment of all dividends and distributions at net asset value during the period, and redemption on the last day of the period. Total investment return calculated for a period of less than one year is not annualized.
† Annualized.
†† Portfolio turnover is not annualized and does not include securities received or delivered from processing creations or redemptions.
See Notes to Financial Statements.
73
Financial Highlights (Continued)
PowerShares Dynamic Leisure and Entertainment Portfolio
| For the year ended April 30, 2007 | For the period June 23, 2005* through April 30, 2006 | ||||||||||
| PER SHARE OPERATING PERFORMANCE: | |||||||||||
| Net asset value at beginning of period | $ | 16.29 | $ | 14.77 | |||||||
| Net investment income** | 0.07 | 0.03 | |||||||||
| Net realized and unrealized gain on investments | 2.04 | 1.51 | |||||||||
| Total from operations | 2.11 | 1.54 | |||||||||
| Undistributed net investment income included in price of units issued and redeemed** | 0.01 | — | |||||||||
| Distributions to shareholders from: | |||||||||||
| Net investment income | (0.08 | ) | (0.02 | ) | |||||||
| Tax return of capital | (0.01 | ) | — | ||||||||
| Total distributions | (0.09 | ) | (0.02 | ) | |||||||
| Net asset value at end of period | $ | 18.32 | $ | 16.29 | |||||||
| TOTAL RETURN:*** | 13.02 | % | 10.41 | % | |||||||
| RATIOS/SUPPLEMENTAL DATA: | |||||||||||
| Net assets at end of period (000's omitted) | $ | 49,472 | $ | 27,701 | |||||||
| Ratio to average net assets of: | |||||||||||
| Expenses, net of waivers | 0.64 | % | 0.68 | %† | |||||||
| Expenses, prior to waivers | 1.07 | % | 1.03 | %† | |||||||
| Net investment income, net of waivers | 0.42 | % | 0.22 | %† | |||||||
| Portfolio turnover rate †† | 35 | % | 48 | % | |||||||
PowerShares Dynamic Media Portfolio
| For the year ended April 30, 2007 | For the period June 23, 2005* through April 30, 2006 | ||||||||||
| PER SHARE OPERATING PERFORMANCE: | |||||||||||
| Net asset value at beginning of period | $ | 14.44 | $ | 14.93 | |||||||
| Net investment income** | 0.04 | 0.02 | |||||||||
| Net realized and unrealized gain (loss) on investments | 2.05 | (0.49 | ) | ||||||||
| Total from operations | 2.09 | (0.47 | ) | ||||||||
| Undistributed net investment loss included in price of units issued and redeemed** | (0.01 | ) | — | ||||||||
| Distributions to shareholders from: | |||||||||||
| Net investment income | (0.04 | ) | (0.02 | ) | |||||||
| Net asset value at end of period | $ | 16.48 | $ | 14.44 | |||||||
| TOTAL RETURN:*** | 14.42 | % | (3.15 | )% | |||||||
| RATIOS/SUPPLEMENTAL DATA: | |||||||||||
| Net assets at end of period (000's omitted) | $ | 31,305 | $ | 24,543 | |||||||
| Ratio to average net assets of: | |||||||||||
| Expenses, net of waivers | 0.64 | % | 0.68 | %† | |||||||
| Expenses, prior to waivers | 1.24 | % | 1.04 | %† | |||||||
| Net investment income, net of waivers | 0.25 | % | 0.19 | %† | |||||||
| Portfolio turnover rate †† | 43 | % | 68 | % | |||||||
* Commencement of Investment Operations.
** Based on average shares outstanding.
*** Total investment return is calculated assuming an initial investment made at the net asset value at the beginning of the period, reinvestment of all dividends and distributions at net asset value during the period, and redemption on the last day of the period. Total investment return calculated for a period of less than one year is not annualized.
† Annualized.
†† Portfolio turnover is not annualized and does not include securities received or delivered from processing creations or redemptions.
See Notes to Financial Statements.
74
Financial Highlights (Continued)
PowerShares Dynamic Networking Portfolio
| For the year ended April 30, 2007 | For the period June 23, 2005* through April 30, 2006 | ||||||||||
| PER SHARE OPERATING PERFORMANCE: | |||||||||||
| Net asset value at beginning of period | $ | 17.38 | $ | 14.96 | |||||||
| Net investment loss** | (0.09 | ) | (0.08 | ) | |||||||
| Net realized and unrealized gain on investments | 1.36 | 2.50 | |||||||||
| Total from operations | 1.27 | 2.42 | |||||||||
| Undistributed net investment income included in price of units issued and redeemed** | 0.03 | — | |||||||||
| Net asset value at end of period | $ | 18.68 | $ | 17.38 | |||||||
| TOTAL RETURN:*** | 7.48 | % | 16.18 | % | |||||||
| RATIOS/SUPPLEMENTAL DATA: | |||||||||||
| Net assets at end of period (000's omitted) | $ | 18,677 | $ | 27,806 | |||||||
| Ratio to average net assets of: | |||||||||||
| Expenses, net of waivers | 0.64 | % | 0.68 | %† | |||||||
| Expenses, prior to waivers | 1.24 | % | 1.03 | %† | |||||||
| Net investment loss, net of waivers | (0.54 | )% | (0.59 | )%† | |||||||
| Portfolio turnover rate †† | 62 | % | 42 | % | |||||||
PowerShares Dynamic Oil & Gas Services Portfolio
| For the year ended April 30, 2007 | For the period October 26, 2005* through April 30, 2006 | ||||||||||
| PER SHARE OPERATING PERFORMANCE: | |||||||||||
| Net asset value at beginning of period | $ | 21.41 | $ | 16.43 | |||||||
| Net investment income (loss)** | — | (a) | (0.01 | ) | |||||||
| Net realized and unrealized gain on investments | 1.29 | 4.99 | |||||||||
| Total from operations | 1.29 | 4.98 | |||||||||
| Undistributed net investment income included in price of units issued and redeemed** | — | (a) | — | ||||||||
| Net asset value at end of period | $ | 22.70 | $ | 21.41 | |||||||
| TOTAL RETURN:*** | 6.03 | % | 30.31 | % | |||||||
| RATIOS/SUPPLEMENTAL DATA: | |||||||||||
| Net assets at end of period (000's omitted) | $ | 272,456 | $ | 336,132 | |||||||
| Ratio to average net assets of: | |||||||||||
| Expenses, net of waivers | 0.63 | % | 0.64 | %† | |||||||
| Expenses, prior to waivers | 0.65 | %††† | 0.67 | %† | |||||||
| Net investment income (loss), net of waivers | 0.02 | % | (0.10 | )%† | |||||||
| Portfolio turnover rate †† | 76 | % | 10 | % | |||||||
* Commencement of Investment Operations.
** Based on average shares outstanding.
*** Total investment return is calculated assuming an initial investment made at the net asset value at the beginning of the period, reinvestment of all dividends and distributions at net asset value during the period, and redemption on the last day of the period. Total investment return calculated for a period of less than one year is not annualized.
† Annualized.
†† Portfolio turnover is not annualized and does not include securities received or delivered from processing creations or redemptions.
††† These expenses, prior to waivers, include amounts reimbursed to the Adviser under the Expense Agreement of less than 0.01% for the year ended April 30, 2007.
(a) Amount represents less than $0.005
See Notes to Financial Statements.
75
Financial Highlights (Continued)
PowerShares Dynamic Pharmaceuticals Portfolio
| For the year ended April 30, 2007 | For the period June 23, 2005* through April 30, 2006 | ||||||||||
| PER SHARE OPERATING PERFORMANCE: | |||||||||||
| Net asset value at beginning of period | $ | 16.54 | $ | 14.84 | |||||||
| Net investment income** | 0.08 | 0.06 | |||||||||
| Net realized and unrealized gain on investments | 3.09 | 1.68 | |||||||||
| Total from operations | 3.17 | 1.74 | |||||||||
| Undistributed net investment loss included in price of units issued and redeemed** | (0.01 | ) | — | ||||||||
| Distributions to shareholders from: | |||||||||||
| Net investment income | (0.08 | ) | (0.04 | ) | |||||||
| Tax return of capital | (0.01 | ) | — | ||||||||
| Total distributions | (0.09 | ) | (0.04 | ) | |||||||
| Net asset value at end of period | $ | 19.61 | $ | 16.54 | |||||||
| TOTAL RETURN:*** | 19.20 | % | 11.74 | % | |||||||
| RATIOS/SUPPLEMENTAL DATA: | |||||||||||
| Net assets at end of period (000's omitted) | $ | 82,345 | $ | 66,157 | |||||||
| Ratio to average net assets of: | |||||||||||
| Expenses, net of waivers | 0.63 | % | 0.66 | %† | |||||||
| Expenses, prior to waivers | 0.80 | % | 0.88 | %† | |||||||
| Net investment income, net of waivers | 0.43 | % | 0.42 | %† | |||||||
| Portfolio turnover rate †† | 29 | % | 29 | % | |||||||
PowerShares Dynamic Retail Portfolio
| For the year ended April 30, 2007 | For the period October 26, 2005* through April 30, 2006 | ||||||||||
| PER SHARE OPERATING PERFORMANCE: | |||||||||||
| Net asset value at beginning of period | $ | 18.29 | $ | 15.13 | |||||||
| Net investment income** | 0.07 | 0.01 | |||||||||
| Net realized and unrealized gain on investments | 1.71 | 3.16 | |||||||||
| Total from operations | 1.78 | 3.17 | |||||||||
| Undistributed net investment income included in price of units issued and redeemed** | — | (a) | — | ||||||||
| Distributions to shareholders from: | |||||||||||
| Net investment income | (0.05 | ) | (0.01 | ) | |||||||
| Net asset value at end of period | $ | 20.02 | $ | 18.29 | |||||||
| TOTAL RETURN:*** | 9.72 | % | 20.98 | % | |||||||
| RATIOS/SUPPLEMENTAL DATA: | |||||||||||
| Net assets at end of period (000's omitted) | $ | 24,029 | $ | 23,783 | |||||||
| Ratio to average net assets of: | |||||||||||
| Expenses, net of waivers | 0.64 | % | 0.70 | %† | |||||||
| Expenses, prior to waivers | 1.41 | % | 0.97 | %† | |||||||
| Net investment income, net of waivers | 0.35 | % | 0.17 | %† | |||||||
| Portfolio turnover rate †† | 73 | % | 11 | % | |||||||
* Commencement of Investment Operations.
** Based on average shares outstanding.
*** Total investment return is calculated assuming an initial investment made at the net asset value at the beginning of the period, reinvestment of all dividends and distributions at net asset value during the period, and redemption on the last day of the period. Total investment return calculated for a period of less than one year is not annualized.
† Annualized.
†† Portfolio turnover is not annualized and does not include securities received or delivered from processing creations or redemptions.
(a) Amount represents less than $0.005
See Notes to Financial Statements.
76
Financial Highlights (Continued)
PowerShares Dynamic Semiconductors Portfolio
| For the year ended April 30, 2007 | For the period June 23, 2005* through April 30, 2006 | ||||||||||
| PER SHARE OPERATING PERFORMANCE: | |||||||||||
| Net asset value at beginning of period | $ | 20.18 | $ | 14.93 | |||||||
| Net investment loss** | (0.04 | ) | (0.05 | ) | |||||||
| Net realized and unrealized gain (loss) on investments | (1.08 | ) | 5.30 | ||||||||
| Total from operations | (1.12 | ) | 5.25 | ||||||||
| Undistributed net investment loss included in price of units issued and redeemed** | (0.01 | ) | — | ||||||||
| Net asset value at end of period | $ | 19.05 | $ | 20.18 | |||||||
| TOTAL RETURN:*** | (5.60 | )% | 35.16 | % | |||||||
| RATIOS/SUPPLEMENTAL DATA: | |||||||||||
| Net assets at end of period (000's omitted) | $ | 161,886 | $ | 106,929 | |||||||
| Ratio to average net assets of: | |||||||||||
| Expenses, net of waivers | 0.63 | % | 0.65 | %† | |||||||
| Expenses, prior to waivers | 0.78 | % | 0.75 | %† | |||||||
| Net investment loss, net of waivers | (0.23 | )% | (0.33 | )%† | |||||||
| Portfolio turnover rate †† | 51 | % | 42 | % | |||||||
PowerShares Dynamic Software Portfolio
| For the year ended April 30, 2007 | For the period June 23, 2005* through April 30, 2006 | ||||||||||
| PER SHARE OPERATING PERFORMANCE: | |||||||||||
| Net asset value at beginning of period | $ | 18.44 | $ | 14.98 | |||||||
| Net investment loss** | (0.10 | ) | (0.08 | ) | |||||||
| Net realized and unrealized gain on investments | 2.05 | 3.54 | |||||||||
| Total from operations | 1.95 | 3.46 | |||||||||
| Undistributed net investment income included in price of units issued and redeemed** | — | (a) | — | ||||||||
| Net asset value at end of period | $ | 20.39 | $ | 18.44 | |||||||
| TOTAL RETURN:*** | 10.57 | % | 23.10 | % | |||||||
| RATIOS/SUPPLEMENTAL DATA: | |||||||||||
| Net assets at end of period (000's omitted) | $ | 71,369 | $ | 49,799 | |||||||
| Ratio to average net assets of: | |||||||||||
| Expenses, net of waivers | 0.63 | % | 0.67 | %† | |||||||
| Expenses, prior to waivers | 0.83 | % | 0.91 | %† | |||||||
| Net investment loss, net of waivers | (0.51 | )% | (0.53 | )%† | |||||||
| Portfolio turnover rate †† | 59 | % | 75 | % | |||||||
* Commencement of Investment Operations.
** Based on average shares outstanding.
*** Total investment return is calculated assuming an initial investment made at the net asset value at the beginning of the period, reinvestment of all dividends and distributions at net asset value during the period, and redemption on the last day of the period. Total investment return calculated for a period of less than one year is not annualized.
† Annualized.
†† Portfolio turnover is not annualized and does not include securities received or delivered from processing creations or redemptions.
(a) Amount represents less than $0.005
See Notes to Financial Statements.
77
Notes to Financial Statements
PowerShares Exchange-Traded Fund Trust
April 30, 2007
Note 1. Organization
PowerShares Exchange-Traded Fund Trust (the "Trust"), which is registered under the Investment Company Act of 1940, as amended (the "1940 Act"), is an exchange-traded, management investment company that was organized as a Massachusetts business trust on June 9, 2000. The Trust currently consists of seventy portfolios. This report includes the following portfolios:
| PowerShares Dynamic Banking Portfolio | "Dynamic Banking Portfolio" | ||||||
| PowerShares Dynamic Biotechnology & | |||||||
| Genome Portfolio | "Dynamic Biotechnology & Genome Portfolio" | ||||||
| PowerShares Dynamic Building & | |||||||
| Construction Portfolio | "Dynamic Building & Construction Portfolio" | ||||||
| PowerShares Dynamic Energy Exploration & | "Dynamic Energy Exploration & Production | ||||||
| Production Portfolio | Portfolio" | ||||||
| PowerShares Dynamic Food & Beverage Portfolio | "Dynamic Food & Beverage Portfolio" | ||||||
| PowerShares Dynamic Hardware & Consumer | "Dynamic Hardware & Consumer Electronics | ||||||
| Electronics Portfolio | Portfolio" | ||||||
| PowerShares Dynamic Healthcare Services Portfolio | "Dynamic Healthcare Services Portfolio" | ||||||
| PowerShares Dynamic Insurance Portfolio | "Dynamic Insurance Portfolio" | ||||||
| PowerShares Dynamic Leisure and | |||||||
| Entertainment Portfolio | "Dynamic Leisure and Entertainment Portfolio" | ||||||
| PowerShares Dynamic Media Portfolio | "Dynamic Media Portfolio" | ||||||
| PowerShares Dynamic Networking Portfolio | "Dynamic Networking Portfolio" | ||||||
| PowerShares Dynamic Oil & Gas Services Portfolio | "Dynamic Oil & Gas Services Portfolio" | ||||||
| PowerShares Dynamic Pharmaceuticals Portfolio | "Dynamic Pharmaceuticals Portfolio" | ||||||
| PowerShares Dynamic Retail Portfolio | "Dynamic Retail Portfolio" | ||||||
| PowerShares Dynamic Semiconductors Portfolio | "Dynamic Semiconductors Portfolio" | ||||||
| PowerShares Dynamic Software Portfolio | "Dynamic Software Portfolio" | ||||||
Dynamic Banking Portfolio and Dynamic Healthcare Services Portfolio both commenced investment operations on October 12, 2006. Each portfolio represents a separate series of the Trust (the "Fund" or "Funds"). Each Fund's shares are listed and traded on the American Stock Exchange. The Funds' market prices may differ to some degree from the net asset value of the shares of each Fund. Unlike conventional mutual funds, each Fund issues and redeems shares on a continuous basis, at net asset value, only in a large specified number of shares, each called a "Creation Unit." Creation Units are issued and redeemed principally in-kind for securities included in the relevant index. Except when aggregated in Creation Units, shares are not individually redeemable securities of the Funds. The investment objective of each Fund is to seek investment results that correspond generally to the price and yield (before the Fund's fees and expenses) of the following equity indices:
| Fund | Index | ||||||
| Dynamic Banking Portfolio | Dynamic Banking IntellidexSM Index | ||||||
| Dynamic Biotechnology & Genome Portfolio | Dynamic Biotechnology & Genome IntellidexSM Index | ||||||
| Dynamic Building & Construction Portfolio | Dynamic Building and Construction IntellidexSM Index | ||||||
78
Notes to Financial Statements (Continued)
PowerShares Exchange-Traded Fund Trust
April 30, 2007
| Fund | Index | ||||||
| Dynamic Energy Exploration & Production Portfolio | Dynamic Energy Exploration & Production IntellidexSM Index | ||||||
| Dynamic Food & Beverage Portfolio | Dynamic Food & Beverage IntellidexSM Index | ||||||
| Dynamic Hardware & Consumer Electronics Portfolio | Dynamic Hardware & Consumer Electronics IntellidexSM Index | ||||||
| Dynamic Healthcare Services Portfolio | Dynamic Healthcare Services IntellidexSM Index | ||||||
| Dynamic Insurance Portfolio | Dynamic Insurance IntellidexSM Index | ||||||
| Dynamic Leisure and Entertainment Portfolio | Dynamic Leisure and Entertainment IntellidexSM Index | ||||||
| Dynamic Media Portfolio | Dynamic Media IntellidexSM Index | ||||||
| Dynamic Networking Portfolio | Dynamic Networking IntellidexSM Index | ||||||
| Dynamic Oil & Gas Services Portfolio | Dynamic Oil Services IntellidexSM Index | ||||||
| Dynamic Pharmaceuticals Portfolio | Dynamic Pharmaceuticals IntellidexSM Index | ||||||
| Dynamic Retail Portfolio | Dynamic Retail IntellidexSM Index | ||||||
| Dynamic Semiconductors Portfolio | Dynamic Semiconductors IntellidexSM Index | ||||||
| Dynamic Software Portfolio | Dynamic Software IntellidexSM Index | ||||||
Note 2. Significant Accounting Policies
The preparation of the financial statements in accordance with accounting principles generally accepted in the United States of America requires management to make estimates and assumptions that affect the reported amounts and disclosures in the financial statements. Actual results could differ from these estimates.
A. Security Valuation
Securities are valued based on their last sale price. Price information on listed securities is taken from the exchange where the security is primarily traded. Securities regularly traded in an over-the-counter market are valued at the latest quoted sale price in such market or in the case of NASDAQ, at the NASDAQ official closing price. Other portfolio securities and assets for which market quotations are not readily available are valued at fair value as determined in good faith by the Trust's Pricing Committee in accordance with procedures adopted by the Board of Trustees. Investments in money market mutual funds are stated at net asset value.
B. Federal Income Taxes
Each Fund intends to comply with the provisions of the Internal Revenue Code applicable to regulated investment companies and will distribute all net investment income and net taxable capital gains to its shareholders. Therefore, no provision for Federal income taxes is required.
Income and capital gain distributions are determined in accordance with Federal income tax regulations, which may differ from accounting principles generally accepted in the United States. These differences are primarily due to differing book and tax treatments for in-kind transactions, losses deferred due to wash sales, losses deferred due to post-October losses and excise tax regulations.
C. Investment Income and Investment Transactions
Dividend income is recorded on the ex-dividend date. Interest income is recorded on the accrual basis. Investment transactions are recorded on the trade date. Realized gains and losses from the sale or
79
Notes to Financial Statements (Continued)
PowerShares Exchange-Traded Fund Trust
April 30, 2007
disposition of securities are calculated on the specific identified cost basis. Corporate actions (including cash dividends) are recorded net of nonreclaimable foreign tax withholdings on the ex-dividend date.
D. Expenses
Expenses of the Trust, which are directly identifiable to a specific Fund, are applied to that Fund. Expenses which are not readily identifiable to a specific Fund are allocated in such a manner as deemed equitable, taking into consideration the nature and type of expense and the relative net assets of each Fund.
E. Dividends and Distributions to Shareholders
Each Fund declares and pays dividends from net investment income to its shareholders quarterly and distributes net realized taxable capital gains, if any, annually. Such distributions on a tax basis are determined in conformity with income tax regulations which may differ from accounting principles generally accepted in the United States of America. Distributions in excess of tax basis earnings and profits, if any, are reported in each Fund's financial statements as a return of capital.
F. Equalization
Beginning May 1, 2006 (or since inception, if later), all Funds use the accounting practice of equalization. This accounting method is used to keep the continuing shareholder's per share equity in undistributed net investment income from being affected by the continuous sales and redemptions of capital shares. Equalization is calculated on a per share basis whereby a portion of the proceeds from the sales and cost of repurchases of capital shares is applied to undistributed net investment income. The amount of equalization is disclosed in the Statements of Changes in Net Assets as undistributed net investment income (loss) included in the price of capital shares issued or redeemed. The distributions to shareholders of amounts so applied may be deemed to be a return of capital for tax purposes to the extent that such distributions exceed taxable income.
Note 3. Advisory and Administration Agreements
PowerShares Capital Management LLC (the "Adviser") has overall responsibility as the Funds' investment adviser for the selection and ongoing monitoring of the Funds' investments, managing the Funds' business affairs and providing certain clerical, bookkeeping and other administrative services. The fees paid by each Fund to the Adviser are accrued daily and are payable at 0.50% per annum on each Fund's average daily net assets.
Each Fund is responsible for all of its expenses, including the investment advisory fees, costs of transfer agency, custody, fund administration, legal, audit and other services, interest, taxes, brokerage commissions and other expenses connected with executions of portfolio transactions, any distribution fees or expenses and extraordinary expenses. Pursuant to the Investment Advisory Agreement with the Trust, the Adviser has agreed to waive fees and/or pay Fund expenses to the extent necessary to prevent the operating expenses of the Funds (excluding interest expense, brokerage commissions and other trading expenses, licensing fees, offering costs, taxes and extraordinary expenses) from exceeding 0.60% of average daily net assets per year (the "Expense Cap"), at least until April 30, 2008. Offering costs excluded from the Expense Cap are: (a) legal fees pertaining to the Funds' shares offered for sale; (b) Securities and Exchan ge Commission and state registration fees; and (c) initial fees paid to be listed on an exchange.
80
Notes to Financial Statements (Continued)
PowerShares Exchange-Traded Fund Trust
April 30, 2007
For the period ended April 30, 2007, the Adviser waived and assumed the following fees and expenses:
| Fees Waived | Expenses Assumed | ||||||||||
| Dynamic Banking Portfolio | $ | 21,892 | $ | 27,089 | |||||||
| Dynamic Biotechnology & Genome Portfolio | 78,242 | — | |||||||||
| Dynamic Building & Construction Portfolio | 75,528 | 78,341 | |||||||||
| Dynamic Energy Exploration & Production Portfolio | 117,014 | — | |||||||||
| Dynamic Food & Beverage Portfolio | 142,996 | 4,427 | |||||||||
| Dynamic Hardware & Consumer Electronics Portfolio | 60,870 | 90,842 | |||||||||
| Dynamic Healthcare Services Portfolio | 47,524 | — | |||||||||
| Dynamic Insurance Portfolio | 140,805 | — | |||||||||
| Dynamic Leisure and Entertainment Portfolio | 146,252 | — | |||||||||
| Dynamic Media Portfolio | 124,348 | 25,292 | |||||||||
| Dynamic Networking Portfolio | 122,422 | 26,170 | |||||||||
| Dynamic Oil & Gas Services Portfolio | 55,303 | — | |||||||||
| Dynamic Pharmaceuticals Portfolio | 131,335 | — | |||||||||
| Dynamic Retail Portfolio | 99,369 | 52,796 | |||||||||
| Dynamic Semiconductors Portfolio | 126,497 | — | |||||||||
| Dynamic Software Portfolio | 132,710 | — | |||||||||
The Trust and the Adviser have entered into an Excess Expense Agreement (the "Expense Agreement") in which expenses borne by the Adviser are subject to reimbursement by the Fund up to three years from the date the fee or expense was incurred, but no reimbursement payment will be made by the Fund if it would result in the Fund exceeding its Expense Cap as specified above.
During the period ended April 30, 2007, the details of expense waivers and reimbursements to the Adviser under the Expense Agreement were as follows:
| Gross Waivers | Gross Reimbursements | Net Waivers | |||||||||||||
| Dynamic Biotechnology & Genome Portfolio | $ | (80,436 | ) | $ | 2,194 | $ | (78,242 | ) | |||||||
| Dynamic Oil & Gas Services Portfolio | (58,092 | ) | 2,789 | (55,303 | ) | ||||||||||
The net amounts of waivers are also shown on the Statements of Operations.
81
Notes to Financial Statements (Continued)
PowerShares Exchange-Traded Fund Trust
April 30, 2007
The amounts subject to reimbursement to the Adviser at April 30, 2007 are as follows:
| Reimbursements available during the fiscal years ending: | |||||||||||||||
| 04/30/08 | 04/30/09 | 04/30/10 | |||||||||||||
| Dynamic Banking Portfolio | $ | 48,981 | $ | 48,981 | $ | 48,981 | |||||||||
| Dynamic Biotechnology & Genome Portfolio | 124,909 | 124,909 | 80,436 | ||||||||||||
| Dynamic Building & Construction Portfolio | 181,766 | 181,766 | 153,869 | ||||||||||||
| Dynamic Energy Exploration & Production Portfolio | 148,949 | 148,949 | 117,014 | ||||||||||||
| Dynamic Food & Beverage Portfolio | 224,372 | 224,372 | 147,423 | ||||||||||||
| Dynamic Hardware & Consumer Electronics Portfolio | 185,290 | 185,290 | 151,712 | ||||||||||||
| Dynamic Healthcare Services Sector Portfolio | 47,524 | 47,524 | 47,524 | ||||||||||||
| Dynamic Insurance Portfolio | 171,237 | 171,237 | 140,805 | ||||||||||||
| Dynamic Leisure and Entertainment Portfolio | 219,928 | 219,928 | 146,252 | ||||||||||||
| Dynamic Media Portfolio | 225,106 | 225,106 | 149,640 | ||||||||||||
| Dynamic Networking Portfolio | 224,484 | 224,484 | 148,592 | ||||||||||||
| Dynamic Oil & Gas Services Portfolio | 83,696 | 83,696 | 58,092 | ||||||||||||
| Dynamic Pharmaceuticals Portfolio | 203,520 | 203,520 | 131,335 | ||||||||||||
| Dynamic Retail Portfolio | 187,454 | 187,454 | 152,165 | ||||||||||||
| Dynamic Semiconductors Portfolio | 189,851 | 189,851 | 126,497 | ||||||||||||
| Dynamic Software Portfolio | 206,116 | 206,116 | 132,710 | ||||||||||||
Distribution Agreement
Effective September 18, 2006 (or since inception, if later), A I M Distributors, Inc. (the "Distributor") serves as the distributor of Creation Units of each Fund pursuant to a Distribution Agreement between the Distributor and the Trust. The Distributor does not maintain a secondary market in shares. Prior to September 18, 2006, ALPS Distributors, Inc. served as the distributor.
The Board of Trustees of the Trust has adopted a distribution plan pursuant to Rule 12b-1 under the 1940 Act. In accordance with the Rule 12b-1 plan, each Fund is authorized to pay an amount up to a maximum annual rate of 0.25% of the average daily net assets for certain distribution-related activities. No 12b-1 fees are currently charged to the Funds, and there are no plans to impose these fees.
Licensing Fee Agreements
The Adviser has entered into licensing agreements for each Fund with the American Stock Exchange (the "Licensor"). The trademarks are owned by the Licensor. These trademark have been licensed to the Adviser for use with the Funds. The Funds are not sponsored, endorsed, sold or promoted by the Licensor and the Licensor makes no representation regarding the advisability of investing in any of these Funds. The Funds pay the licensing fees which are shown on the Statements of Operations.
The Bank of New York serves as the administrator, custodian and fund accounting and transfer agent for each Fund.
82
Notes to Financial Statements (Continued)
PowerShares Exchange-Traded Fund Trust
April 30, 2007
Note 4. INVESCO Transaction and Transactions with Affiliates
On September 18, 2006, INVESCO PLC (formerly AMVESCAP PLC) and A I M Management Group, Inc., an indirect wholly-owned subsidiary of INVESCO PLC, announced that they had completed their acquisition of the Adviser (the "Acquisition"). The Board of Trustees, including a majority of the independent Trustees, and shareholders of each Fund had previously approved a new advisory agreement with the Adviser that became effective on September 18, 2006.
The Funds are permitted to invest daily available cash balances in affiliated money market funds. The Funds invest in the Liquid Assets Portfolio ("LAP") of the Short-Term Investments. LAP is advised by A I M Advisors, Inc., an affiliate of the Adviser.
Note 5. Federal Income Tax
At April 30, 2007, the components of accumulated earnings/loss on a tax-basis were as follows:
Accumulated Earnings | Net Accumulated Capital and other Gains/Losses | Unrealized Appreciation/ Depreciation | Gross Unrealized Appreciation | Gross Unrealized Depreciation | Total Accumulated Earnings/Loss | ||||||||||||||||||||||
| Dynamic Banking Portfolio | $ | 24,714 | $ | — | $ | (174,472 | ) | $ | 81,844 | $ | (256,316 | ) | $ | (149,758 | ) | ||||||||||||
| Dynamic Biotechnology & Genome Portfolio | — | (19,933,720 | ) | 21,099,278 | 32,997,482 | (11,898,204 | ) | 1,165,558 | |||||||||||||||||||
| Dynamic Building & Construction Portfolio | 18,249 | (2,263,182 | ) | 2,398,007 | 2,722,636 | (324,629 | ) | 153,074 | |||||||||||||||||||
| Dynamic Energy Exploration & Production Portfolio(2) | 96,401 | (285,311 | ) | 16,023,625 | 16,865,463 | (841,838 | ) | 15,834,715 | |||||||||||||||||||
| Dynamic Food & Beverage Portfolio | 422,812 | (2,399,272 | ) | 3,543,046 | 3,855,804 | (312,758 | ) | 1,566,586 | |||||||||||||||||||
| Dynamic Hardware & Consumer Electronics Portfolio | — | (1,413,579 | ) | 1,106,108 | 1,413,731 | (307,623 | ) | (307,471 | ) | ||||||||||||||||||
| Dynamic Healthcare Services Portfolio | — | — | 1,230,839 | 1,560,853 | (330,014 | ) | 1,230,839 | ||||||||||||||||||||
| Dynamic Insurance Portfolio | 63,761 | (774,301 | ) | 3,998,007 | 4,233,264 | (235,257 | ) | 3,287,467 | |||||||||||||||||||
| Dynamic Leisure and Entertainment Portfolio | — | (2,363,747 | ) | 3,981,010 | 4,417,047 | (436,037 | ) | 1,617,263 | |||||||||||||||||||
| Dynamic Media Portfolio | 12,161 | (3,733,107 | ) | 886,358 | 1,477,063 | (590,705 | ) | (2,834,588 | ) | ||||||||||||||||||
| Dynamic Networking Portfolio | — | (2,322,628 | ) | 378,464 | 1,036,580 | (658,116 | ) | (1,944,164 | ) | ||||||||||||||||||
| Dynamic Oil & Gas Services Portfolio | 45,350 | (15,026,862 | ) | 29,783,264 | 33,478,138 | (3,694,874 | ) | 14,801,752 | |||||||||||||||||||
| Dynamic Pharmaceuticals Portfolio(1) | — | (876,207 | ) | 5,802,069 | 8,260,004 | (2,457,935 | ) | 4,925,862 | |||||||||||||||||||
| Dynamic Retail Portfolio | 22,155 | (937,070 | ) | 765,713 | 1,391,111 | (625,398 | ) | (149,202 | ) | ||||||||||||||||||
| Dynamic Semiconductors Portfolio | — | (9,430,420 | ) | 7,872,051 | 10,367,652 | (2,495,601 | ) | (1,558,369 | ) | ||||||||||||||||||
| Dynamic Software Portfolio | — | (3,125,705 | ) | 6,946,900 | 7,682,674 | (735,774 | ) | 3,821,195 | |||||||||||||||||||
83
Notes to Financial Statements (Continued)
PowerShares Exchange-Traded Fund Trust
April 30, 2007
At April 30, 2007, the cost of investments for Federal income tax purposes was as follows:
| Dynamic Banking Portfolio | $ | 4,993,380 | |||||
| Dynamic Biotechnology & Genome Portfolio | 237,793,930 | ||||||
| Dynamic Building & Construction Portfolio | 16,352,405 | ||||||
| Dynamic Energy Exploration & Production Portfolio(1) | 107,456,621 | ||||||
| Dynamic Food & Beverage Portfolio | 29,760,620 | ||||||
| Dynamic Hardware & Consumer Electronics Portfolio | 11,538,049 | ||||||
| Dynamic Healthcare Services Portfolio | 26,896,441 | ||||||
| Dynamic Insurance Portfolio | 54,337,426 | ||||||
| Dynamic Leisure and Entertainment Portfolio | 45,680,197 | ||||||
| Dynamic Media Portfolio | 30,491,284 | ||||||
| Dynamic Networking Portfolio | 18,316,774 | ||||||
| Dynamic Oil & Gas Services Portfolio | 242,841,186 | ||||||
| Dynamic Pharmaceuticals Portfolio(2) | 76,575,919 | ||||||
| Dynamic Retail Portfolio | 23,473,722 | ||||||
| Dynamic Semiconductors Portfolio | 154,295,569 | ||||||
| Dynamic Software Portfolio | 64,755,556 | ||||||
Distributions to Shareholders:
The tax character of distributions paid during the period ended April 30, 2007 was as follows:
| Distributions paid from Ordinary Income | |||||||
| Dynamic Banking Portfolio | $ | 44,552 | |||||
| Dynamic Building & Construction Portfolio | 4,191 | ||||||
| Dynamic Energy Exploration & Production Portfolio(1) | 351,098 | ||||||
| Dynamic Food & Beverage Portfolio | 306,737 | ||||||
| Dynamic Insurance Portfolio | 333,066 | ||||||
| Dynamic Leisure and Entertainment Portfolio | 158,121 | ||||||
| Dynamic Media Portfolio | 58,259 | ||||||
| Dynamic Pharmaceuticals Portfolio(2) | 367,491 | ||||||
| Dynamic Retail Portfolio | 54,224 | ||||||
| Distributions paid from Return of Capital | |||||||
| Dynamic Leisure and Entertainment Portfolio | $ | 21,748 | |||||
| Dynamic Pharmaceuticals Portfolio(2) | 27,281 | ||||||
The tax character of distributions paid during the period ended April 30, 2006 was as follows:
| Distributions paid from Ordinary Income | |||||||
| Dynamic Building & Construction Portfolio | $ | 15,330 | |||||
| Dynamic Energy Exploration & Production Portfolio(1) | 47,068 | ||||||
| Dynamic Food & Beverage Portfolio | 143,712 | ||||||
| Dynamic Insurance Portfolio | 112,084 | ||||||
84
Notes to Financial Statements (Continued)
PowerShares Exchange-Traded Fund Trust
April 30, 2007
| Distributions paid from Ordinary Income | |||||||
| Dynamic Leisure and Entertainment Portfolio | $ | 28,509 | |||||
| Dynamic Media Portfolio | 34,051 | ||||||
| Dynamic Pharmaceuticals Portfolio(2) | 107,249 | ||||||
| Dynamic Retail Portfolio | 16,497 | ||||||
At April 30, 2007, for Federal income tax purposes, the Funds have capital loss carryforwards available as shown in the table below, to the extent provided by the regulations, to offset future capital gains through the years indicated. To the extent that these loss carryforwards are used to offset future capital gains, it is probable that the capital gains so offset will not be distributed to shareholders.
| Capital Loss Available Through | Total | ||||||||||||||||||
| 2013 | 2014 | 2015 | Amount | ||||||||||||||||
| Dynamic Biotechnology & Genome Portfolio | $ | — | $ | 321,497 | $ | 19,612,223 | $ | 19,933,720 | |||||||||||
| Dynamic Building & Construction Portfolio | — | — | 2,263,182 | 2,263,182 | |||||||||||||||
| Dynamic Energy Exploration & Production Portfolio(1) | — | — | 285,311 | 285,311 | |||||||||||||||
| Dynamic Food & Beverage Portfolio | — | 433,620 | 1,965,652 | 2,399,272 | |||||||||||||||
| Dynamic Hardware & Consumer Electronics Portfolio | — | — | 1,413,579 | 1,413,579 | |||||||||||||||
| Dynamic Insurance Portfolio | — | — | 774,301 | 774,301 | |||||||||||||||
| Dynamic Leisure and Entertainment Portfolio | — | 751,908 | 1,611,839 | 2,363,747 | |||||||||||||||
| Dynamic Media Portfolio | — | 545,973 | 3,187,134 | 3,733,107 | |||||||||||||||
| Dynamic Networking Portfolio | — | 383,187 | 1,939,441 | 2,322,628 | |||||||||||||||
| Dynamic Oil & Gas Services Portfolio | — | — | 15,026,862 | 15,026,862 | |||||||||||||||
| Dynamic Pharmaceuticals Portfolio(2) | 164,751 | 66,659 | 644,797 | 876,207 | |||||||||||||||
| Dynamic Retail Portfolio | — | — | 937,070 | 937,070 | |||||||||||||||
| Dynamic Semiconductors Portfolio | — | 271,588 | 9,158,832 | 9,430,420 | |||||||||||||||
| Dynamic Software Portfolio | — | 108,427 | 3,017,278 | 3,125,705 | |||||||||||||||
Capital losses incurred after October 31 ("post-October losses") within the taxable year are deemed to arise on the first business day of each Fund's next taxable year.
During the period ended April 30, 2007, the Funds incurred and will elect to defer net capital losses as follows:
| Post-October Losses | |||||||
| Dynamic Banking Portfolio | $ | 287,936 | |||||
| Dynamic Biotechnology & Genome Portfolio | 9,144,591 | ||||||
| Dynamic Building & Construction Portfolio | 319,065 | ||||||
| Dynamic Energy Exploration & Production Portfolio(1) | 3,145,151 | ||||||
| Dynamic Food & Beverage Portfolio | 337,964 | ||||||
| Dynamic Hardware & Consumer Electronics Portfolio | 221,254 | ||||||
| Dynamic Healthcare Services Portfolio | 223,615 | ||||||
| Dynamic Insurance Portfolio | 276,644 | ||||||
85
Notes to Financial Statements (Continued)
PowerShares Exchange-Traded Fund Trust
April 30, 2007
| Post-October Losses | |||||||
| Dynamic Leisure and Entertainment Portfolio | $ | 806,391 | |||||
| Dynamic Media Portfolio | 623,461 | ||||||
| Dynamic Networking Portfolio | 518,242 | ||||||
| Dynamic Oil & Gas Services Portfolio | 9,157,735 | ||||||
| Dynamic Pharmaceuticals Portfolio(2) | 17,022 | ||||||
| Dynamic Retail Portfolio | 399,481 | ||||||
| Dynamic Semiconductors Portfolio | 3,078,131 | ||||||
| Dynamic Software Portfolio | 866,032 | ||||||
At April 30, 2007, the following reclassifications were made to the capital accounts of the Funds, to reflect permanent book/tax differences and income and gains available for distributions under income tax regulations, which are primarily due to the differences between book and tax treatment of investments in real estate investment trusts, investments in partnerships, wash sales from redemption in-kind transactions, redemption in-kind transactions, return of capital and net investment losses. Net investment income, net realized gains and net assets were not affected by these changes.
| Undistributed Net Investment Income (Loss) | Undistributed Capital Gains/ (Accumulated Losses) | Paid in Capital | |||||||||||||
| Dynamic Banking Portfolio | $ | 19,989 | $ | (77,971 | ) | $ | 57,982 | ||||||||
| Dynamic Biotechnology & Genome Portfolio | 1,197,179 | (20,868,583 | ) | 19,671,404 | |||||||||||
| Dynamic Building & Construction Portfolio | (13,852 | ) | (659,878 | ) | 673,730 | ||||||||||
| Dynamic Energy Exploration & Production Portfolio(1) | (7,126 | ) | (8,164,621 | ) | 8,171,747 | ||||||||||
| Dynamic Food & Beverage Portfolio | (28,365 | ) | (2,469,870 | ) | 2,498,235 | ||||||||||
| Dynamic Hardware & Consumer Electronics Portfolio | 40,406 | (1,221,989 | ) | 1,181,583 | |||||||||||
| Dynamic Healthcare Services Portfolio | 80,636 | (1,075,521 | ) | 994,885 | |||||||||||
| Dynamic Insurance Portfolio | (26,238 | ) | (2,621,869 | ) | 2,648,107 | ||||||||||
| Dynamic Leisure and Entertainment Portfolio | 4,683 | (3,915,532 | ) | 3,910,849 | |||||||||||
| Dynamic Media Portfolio | 9,491 | (3,831,219 | ) | 3,821,728 | |||||||||||
| Dynamic Networking Portfolio | 94,494 | (5,971,189 | ) | 5,876,695 | |||||||||||
| Dynamic Oil & Gas Services Portfolio | (45,370 | ) | (22,607,287 | ) | 22,652,657 | ||||||||||
| Dynamic Pharmaceuticals Portfolio(2) | 51,873 | (7,027,691 | ) | 6,975,818 | |||||||||||
| Dynamic Retail Portfolio | 5,189 | (3,431,212 | ) | 3,426,023 | |||||||||||
| Dynamic Semiconductors Portfolio | 261,453 | (9,161,280 | ) | 8,899,827 | |||||||||||
| Dynamic Software Portfolio | 337,468 | (9,941,227 | ) | 9,603,759 | |||||||||||
(1) First tax year-end was May 31, 2006. Tax year-end was changed to April 30, 2007.
(2) First tax year-end was November 30, 2005. Tax year-end was changed to April 30, 2006.
86
Notes to Financial Statements (Continued)
PowerShares Exchange-Traded Fund Trust
April 30, 2007
Note 6. Investment Transactions
For the period ended April 30, 2007, the cost of securities purchased and proceeds from sales of securities, excluding short-term securities and in-kind transactions, were as follows:
| Purchases | Sales | ||||||||||
| Dynamic Banking Portfolio | $ | 4,639,393 | $ | 4,403,200 | |||||||
| Dynamic Biotechnology & Genome Portfolio | 193,053,351 | 192,324,118 | |||||||||
| Dynamic Building & Construction Portfolio | 9,090,994 | 9,291,459 | |||||||||
| Dynamic Energy Exploration & Production Portfolio | 64,760,774 | 63,855,266 | |||||||||
| Dynamic Food & Beverage Portfolio | 14,125,864 | 14,298,413 | |||||||||
| Dynamic Hardware & Consumer Electronics Portfolio | 6,448,768 | 6,335,893 | |||||||||
| Dynamic Healthcare Services Portfolio | 2,725,342 | 2,552,840 | |||||||||
| Dynamic Insurance Portfolio | 17,394,678 | 17,917,106 | |||||||||
| Dynamic Leisure and Entertainment Portfolio | 11,941,932 | 12,593,748 | |||||||||
| Dynamic Media Portfolio | 11,044,989 | 10,768,148 | |||||||||
| Dynamic Networking Portfolio | 15,035,059 | 15,592,520 | |||||||||
| Dynamic Oil & Gas Services Portfolio | 221,286,476 | 222,606,187 | |||||||||
| Dynamic Pharmaceuticals Portfolio | 22,520,852 | 22,778,127 | |||||||||
| Dynamic Retail Portfolio | 14,887,405 | 15,866,318 | |||||||||
| Dynamic Semiconductors Portfolio | 45,852,252 | 48,611,313 | |||||||||
| Dynamic Software Portfolio | 42,534,906 | 39,162,446 | |||||||||
For the period ended April 30, 2007, in-kind transactions were as follows:
| Purchases | Sales | ||||||||||
| Dynamic Banking Portfolio | $ | 19,094,033 | $ | 14,182,317 | |||||||
| Dynamic Biotechnology & Genome Portfolio | 147,653,718 | 165,616,280 | |||||||||
| Dynamic Building & Construction Portfolio | 17,140,385 | 23,274,756 | |||||||||
| Dynamic Energy Exploration & Production Portfolio | 139,168,752 | 140,539,614 | |||||||||
| Dynamic Food & Beverage Portfolio | 29,671,717 | 24,525,489 | |||||||||
| Dynamic Hardware & Consumer Electronics Portfolio | 10,280,302 | 14,516,769 | |||||||||
| Dynamic Healthcare Services Portfolio | 41,044,981 | 15,172,948 | |||||||||
| Dynamic Insurance Portfolio | 67,664,012 | 44,016,383 | |||||||||
| Dynamic Leisure and Entertainment Portfolio | 52,847,565 | 33,688,744 | |||||||||
| Dynamic Media Portfolio | 46,443,928 | 42,003,335 | |||||||||
| Dynamic Networking Portfolio | 43,864,507 | 53,614,971 | |||||||||
| Dynamic Oil & Gas Services Portfolio | 192,104,335 | 258,970,752 | |||||||||
| Dynamic Pharmaceuticals Portfolio | 72,523,294 | 69,632,615 | |||||||||
| Dynamic Retail Portfolio | 80,174,829 | 79,345,376 | |||||||||
| Dynamic Semiconductors Portfolio | 157,402,895 | 95,042,285 | |||||||||
| Dynamic Software Portfolio | 96,759,908 | 87,189,833 | |||||||||
There were no purchases or sales of U.S. government or government agency obligations for the period ended April 30, 2007. Gains on in-kind transactions are not considered taxable gains for Federal income tax purposes.
87
Notes to Financial Statements (Continued)
PowerShares Exchange-Traded Fund Trust
April 30, 2007
Note 7. Trustees' Fees
The Trust compensates each Trustee who is not an employee of the Adviser or its affiliates. The interested Trustee does not receive any Trustees' fees.
Note 8. Capital
Shares are created and redeemed by the Trust only in Creation Unit size aggregations of 100,000. Transaction fees at $500 per Creation Unit are charged to those persons creating or redeeming Creation Units. Such transactions are generally permitted on an in-kind basis, with a balancing cash component to equate the transaction to the net asset value per unit of each Fund of the Trust on the transaction date.
Note 9. Risk of Concentration
The Funds concentrate their investments in certain industries, subjecting them to greater risk than funds that invest in a wider range of industries.
Note 10. Indemnifications
Under the Trust's organizational documents, its Officers and Trustees are indemnified against certain liabilities arising out of the performance of their duties to the Trust. Additionally, in the normal course of business, the Trust enters into contracts with service providers that contain general indemnification clauses. The Trust's maximum exposure under these arrangements is unknown, as this would involve future claims that may be made against the Trust that have not yet occurred. However, based on experience, the Trust believes the risk of loss to be remote.
Note 11. New Accounting Pronouncements
On July 13, 2006, the Financial Accounting Standards Board ("FASB") issued FASB Interpretation No. 48, Accounting for Uncertainty in Income Taxes ("FIN 48"). FIN 48 prescribes a recognition threshold and measurement attribute for the financial statement recognition and measurement for a tax position taken or expected to be taken in a tax return. FIN 48 also provides guidance on derecognition, classification, interest and penalties, accounting in interim periods, disclosure and transition. On December 22, 2006, the Securities and Exchange Commission delayed the effective date of FIN 48, which will result in adoption for the Funds as of October 31, 2007. At this time, management is currently assessing the impact of FIN 48, if any, on the Funds' financial statements.
On September 20, 2006, the FASB released Statement of Financial Accounting Standards No. 157 "Fair Value Measurement" ("FAS 157"). FAS 157 establishes an authoritative definition of fair value, sets out a framework for measuring fair value, and requires additional disclosures about fair-value measurement. The application of FAS 157 is required for fiscal years beginning after November 15, 2007 and interim periods within those fiscal years. At this time, management is currently assessing the impact of FAS 157, if any, on the Funds' financial statements and intends for the Funds to adopt FAS 157 provisions during the fiscal year ending April 30, 2009.
88
Report of Independent Registered Public Accounting Firm
To the Board of Trustees and Shareholders of PowerShares Exchange-Traded Fund Trust
In our opinion, the accompanying statements of assets and liabilities, including the portfolios of investments, and the related statements of operations and of changes in net assets and the financial highlights present fairly, in all material respects, the financial position of the portfolios indicated in Note 1 of the financial statements comprising PowerShares Exchange-Traded Fund Trust (the "Trust") at April 30, 2007, the results of each of their operations, the changes in each of their net assets and the financial highlights, for each of the periods presented, in conformity with accounting principles generally accepted in the United States of America. These financial statements and financial highlights (hereafter referred to as "financial statements") are the responsibility of the Trust's management; our responsibility is to express an opinion on these financial statements based on our audits. We conducted our audits of thes e financial statements in accordance with the standards of the Public Company Accounting Oversight Board (United States). Those standards require that we plan and perform the audits to obtain reasonable assurance about whether the financial statements are free of material misstatement. An audit includes examining, on a test basis, evidence supporting the amounts and disclosures in the financial statements, assessing the accounting principles used and significant estimates made by management, and evaluating the overall financial statement presentation. We believe that our audits, which included confirmation of securities at April 30, 2007 by correspondence with the custodian and brokers, provide a reasonable basis for our opinion.
PricewaterhouseCoopers LLP
New York, New York
June 25, 2007
89
Supplemental Information (Unaudited)
Federal Income Tax Information
The percentages of investment income (dividend income plus short-term gains, if any) qualify as follows:
| Qualified dividend income | Dividends-received deduction | ||||||||||
| Dynamic Banking Portfolio | 100 | % | 100 | % | |||||||
| Dynamic Biotechnology & Genome Portfolio | 0 | % | 0 | % | |||||||
| Dynamic Building & Construction Portfolio | 100 | % | 100 | % | |||||||
| Dynamic Energy Exploration & Production Portfolio | 100 | % | 100 | % | |||||||
| Dynamic Food & Beverage Portfolio | 100 | % | 100 | % | |||||||
| Dynamic Hardware & Consumer Electronics Portfolio | 0 | % | 0 | % | |||||||
| Dynamic Healthcare Services Portfolio | 0 | % | 0 | % | |||||||
| Dynamic Insurance Portfolio | 100 | % | 100 | % | |||||||
| Dynamic Leisure and Entertainment Portfolio | 100 | % | 100 | % | |||||||
| Dynamic Media Portfolio | 100 | % | 100 | % | |||||||
| Dynamic Networking Portfolio | 0 | % | 0 | % | |||||||
| Dynamic Oil & Gas Services Portfolio | 0 | % | 0 | % | |||||||
| Dynamic Pharmaceuticals Portfolio | 100 | % | 100 | % | |||||||
| Dynamic Retail Portfolio | 100 | % | 100 | % | |||||||
| Dynamic Semiconductors Portfolio | 0 | % | 0 | % | |||||||
| Dynamic Software Portfolio | 0 | % | 0 | % | |||||||
90
Supplemental Information (Unaudited) (Continued)
Trustees and Officers
The Trustees who are not affiliated with the Adviser or affiliates of the Adviser and executive officers of the Trust, their term of office and length of time served, their principal business occupations during the past five years, the number of portfolios in the Fund Complex overseen by each Trustee and the other directorships, if any, held by the Trustee, are shown below.
| Name, Address and Age of Independent Trustees | Position(s) with Trust | Length of Time Served* | Principal Occupation(s) During Past 5 Years | Number of Portfolios in Fund Complex*** Overseen by Trustees | Other Directorships Held by Trustees | ||||||||||||||||||
| Ronn R. Bagge (49) YQA Capital Management, LLC 1755 S. Naperville Rd., Suite 100 Wheaton, IL 60187 | Trustee | Since 2003 | YQA Capital Management LLC (July 1998-Present); formerly Owner/CEO of Electronic Dynamic Balancing Co., Inc. (high-speed rotating equipment service provider) | 79 | None | ||||||||||||||||||
| Marc M. Kole (47)** c/o PowerShares Capital Management LLC 301 W. Roosevelt Road Wheaton, IL 60187 | Trustee | Since 2006 | Controller, Priority Health (September 2005-present); Interim CFO, Priority Health (July 2006-February 2007); formerly Senior Vice President of Finance, United Healthcare (health insurance) (July 2004-July 2005); Senior Vice President of Finance, Oxford Health Plans (June 2000-July 2004) | 79 | None | ||||||||||||||||||
| D. Mark McMillan (44) c/o PowerShares Capital Management LLC 301 W. Roosevelt Road Wheaton, IL 60187 | Trustee | Since 2003 | Member, Bell, Boyd & Lloyd LLC (1989- Present) | 79 | None | ||||||||||||||||||
* This is the date the Trustee began serving the Trust.
** At a Board meeting held on December 14, 2006, Marc Kole was elected to serve as Trustee of the Trust.
*** Fund Complex includes all open-end funds (including all of their Portfolios) advised by the Adviser. The Fund Complex consists of the Trust's 70 Portfolios and one other exchange-traded fund trust with 9 Portfolios advised by the Adviser.
91
Supplemental Information (Unaudited) (Continued)
Trustees and Officers (Continued)
| Name, Address and Age of Independent Trustees | Position(s) with Trust | Length of Time Served* | Principal Occupation(s) During Past 5 Years | Number of Portfolios in Fund Complex*** Overseen by Trustees | Other Directorships Held by Trustees | ||||||||||||||||||
| Philip M. Nussbaum (45) c/o PowerShares Capital Management LLC 301 W. Roosevelt Road Wheaton, IL 60187 | Trustee | Since 2003 | Chairman, Performance Trust Capital Partners (formerly Betzold, Berg, Nussbaum & Heitman, Inc.); formerly Managing Director, Communication Institute (May 2002-August 2003); Executive Vice President of Finance, Betzold, Berg, Nussbaum & Heitman, Inc. (March 1994-1999) | 79 | None | ||||||||||||||||||
| Donald H. Wilson (47)** c/o PowerShares Capital Management LLC 301 W. Roosevelt Road Wheaton, IL 60187 | Trustee | Since 2006 | Executive Vice President and Chief Financial Officer, AMCORE Financial, Inc. (bank holding company) (February 2006-present); formerly, Senior Vice President and Treasurer, Marshall & Ilsley Corp. (bank holding company) (May 1995-February 2006) | 79 | None | ||||||||||||||||||
* This is the date the Trustee began serving the Trust.
** At a Board meeting held on December 14, 2006, Donald Wilson was elected to serve as Trustee of the Trust.
*** Fund Complex includes all open-end funds (including all of their Portfolios) advised by the Adviser. The Fund Complex consists of the Trust's 70 Portfolios and one other exchange-traded fund trust with 9 Portfolios advised by the Adviser.
92
Supplemental Information (Unaudited) (Continued)
Trustees and Officers (Continued)
| Name, Address and Age of Management Trustee | Position(s) with Trust | Length of Time Served* | Principal Occupation(s) During Past 5 Years | Number of Portfolios in Fund Complex*** Overseen by Trustee | Other Directorships Held by Trustee | ||||||||||||||||||
| H. Bruce Bond (44)** PowerShares Capital Management LLC 301 W. Roosevelt Road Wheaton, IL 60187 | Chairman of the Board, Trustee and Chief Executive Officer | Since 2003 | Managing Director, PowerShares Capital Management LLC (August 2002-Present); Manager, Nuveen Investments (April 1998- August 2002) | 79 | None | ||||||||||||||||||
* This is the date the Management Trustee began serving the Trust.
** Interested person as defined in Section 2(a)(19) of the 1940 Act.
*** Fund Complex includes all open-end funds (including all of their Portfolios) advised by the Adviser. The Fund Complex consists of the Trust's 70 Portfolios and one other exchange-traded fund trust with 9 Portfolios advised by the Adviser.
93
Supplemental Information (Unaudited) (Continued)
Trustees and Officers (Continued)
| Name, Address and Age of Officers | Position(s) with Trust | Length of Time Served* | Principal Occupations(s) During Past 5 Years | ||||||||||||
| Bruce T. Duncan (52) PowerShares Capital Management LLC 301 W. Roosevelt Road Wheaton, IL 60187 | Chief Financial Officer and Treasurer | Since 2006 | Senior Vice President of Finance, PowerShares Capital Management LLC (September 2005-Present); Private Practice Attorney (2000-2005); Vice President of Investor Relations, The ServiceMaster Company (1994-2000); Vice President of Taxes, The ServiceMaster Company (1990-2000) | ||||||||||||
| Kevin R. Gustafson (41) PowerShares Capital Management LLC 301 W. Roosevelt Road Wheaton, IL 60187 | Chief Compliance Officer | Since 2004 | General Counsel and Chief Compliance Officer, PowerShares Capital Management LLC (September 2004-Present); Attorney, Nyberg & Gustafson (2001- 2004); Attorney, Burke, Warren, McKay & Serritella, P.C. (1997-2000) | ||||||||||||
| Keith Ovitt (44) PowerShares Capital Management LLC 301 W. Roosevelt Road Wheaton, IL 60187 | Secretary | Since 2003 | Managing Director, PowerShares Capital Management LLC (April 2003-Present); President, Ovitech (2002-2003); Vice President of Information Systems for DFG Foods, LLC (Division of FoodBrands America/Tyson Foods) (1999-2002); Systems Manager, Nabisco Biscuit Company (1997-1999) | ||||||||||||
* This is the period for which the Officers began serving the Trust. Each Officer serves an indefinite term, until his successor is elected.
94
Board Considerations Regarding Continuation of Investment Advisory Agreement (Unaudited)
At a meeting held on April 20, 2007, the Board of Trustees of the PowerShares Exchange-Traded Fund Trust (the "Trust"), including the Independent Trustees, unanimously approved the continuation of the Investment Advisory Agreement between PowerShares Capital Management LLC (the "Adviser") and the Trust for the following series (the "Funds"):
PowerShares Dynamic Market Portfolio
PowerShares Dynamic OTC Portfolio
PowerShares Golden Dragon Halter USX China Portfolio
PowerShares High Yield Equity Dividend AchieversTM Portfolio
PowerShares WilderHill Clean Energy Portfolio
PowerShares Dynamic Large Cap Growth Portfolio
PowerShares Dynamic Large Cap Value Portfolio
PowerShares Dynamic Mid Cap Growth Portfolio
PowerShares Dynamic Mid Cap Value Portfolio
PowerShares Dynamic Small Cap Growth Portfolio
PowerShares Dynamic Small Cap Value Portfolio
PowerShares Dynamic Biotechnology & Genome Portfolio
PowerShares Dynamic Food & Beverage Portfolio
PowerShares Dynamic Leisure and Entertainment Portfolio
PowerShares Dynamic Media Portfolio
PowerShares Dynamic Networking Portfolio
PowerShares Dynamic Pharmaceuticals Portfolio
PowerShares Dynamic Semiconductors Portfolio
PowerShares Dynamic Software Portfolio
PowerShares Zacks Micro Cap Portfolio
PowerShares Aerospace & Defense Portfolio
PowerShares Dynamic Hardware & Consumer Electronics Portfolio
PowerShares Dynamic Telecommunications & Wireless Portfolio
PowerShares Value Line Timeliness Select Portfolio
PowerShares Divided AchieversTM Portfolio
PowerShares International Dividend AchieversTM Portfolio
PowerShares High Growth Rate Dividend AchieversTM Portfolio
PowerShares Zacks Small Cap Portfolio
PowerShares Dynamic Building & Construction Portfolio
PowerShares Dynamic Energy Exploration & Production Portfolio
PowerShares Dynamic Insurance Portfolio
PowerShares Dynamic Oil & Gas Services Portfolio
PowerShares Dynamic Retail Portfolio
PowerShares Dynamic Utilities Portfolio
PowerShares Lux Nanotech Portfolio
PowerShares FTSE RAFI US 1000 Portfolio
PowerShares Water Resources Portfolio
The Trustees reviewed information from the Adviser describing: (i) the nature, extent and quality of services provided, (ii) the investment performance of the Funds and the Adviser, (iii) the costs of services provided and estimated profits realized by the Adviser, (iv) the extent to which economies of scale are realized as the Funds grow, (v) whether fee levels reflect any possible economies of scale for the benefit of Fund shareholders, (vi) comparisons of services rendered and amounts paid to other registered investment companies and (vii) any benefits realized by the Adviser from its relationship with each Fund. Based on all of the information considered and the conclusions reached, the Board, including the Independent Trustees, determined to approve the continuation of the Investment Advisory Agreement for each Fund listed above. No single factor was determinative in the Board's analysis.
Nature, Extent and Quality of Services. In evaluating the nature, extent and quality of the Adviser's services, the Trustees reviewed information concerning the functions performed by the Adviser for the Funds, information describing the Adviser's current organization, including operations assistance provided
95
Board Considerations Regarding Continuation of Investment Advisory Agreement (Unaudited) (Continued)
by the Adviser's new parent organization, AMVESCAP LLC, and the background and experience of the persons responsible for the day-to-day management of the Funds. The Trustees reviewed matters related to the Adviser's portfolio transaction policies and procedures. The Trustees reviewed information on the performance of the Funds and the performance of their benchmark indices. The Trustees also reviewed reports on the correlation and tracking error between the underlying index and each Fund's performance and reviewed a report of a consultant to the Adviser on correlation and tracking error. The Trustees concluded that Funds are correlated to their underlying index and that the tracking error was within a reasonable range.
The Trustees also considered the services provided by the Adviser in its oversight of the Funds' administrator, custodian and transfer agent. They noted the significant amount of time and effort that had been devoted to this oversight function.
Based on their review, the Trustees found that the nature and extent of services provided to the Funds under the Investment Advisory Agreement are appropriate and that the quality is good.
Fees, Expenses and Profitability. The Trustees reviewed and discussed the information provided by the Adviser on each Fund's expense ratio and the advisory fee, as compared to three categories of comparable funds selected by Lipper Inc., an independent source: exchange-traded index funds ("ETFs"), open-end funds and closed-end funds. The Trustees also reviewed and discussed additional information prepared by Lipper Inc. on expense ratios and advisory fees of a broader universe of ETFs and other index funds. The Adviser supplemented the information prepared by Lipper Inc. with data it compiled on expense ratios and advisory fees of newer ETFs that recently commenced operations. The Trustees noted that the annual advisory fee charged to the Funds was identical (0.50% of average net assets), except for the advisory fee for the PowerShares High Yield Equi ty Dividend AchieversTM Portfolio, the PowerShares Dividend AchieversTM Portfolio, the PowerShares High Growth Rate Dividend AchieversTM Portfolio and the PowerShares International Dividend AchieversTM Portfolio (for each of which the annual advisory fee was 0.40% of average net assets), and that the Adviser had agreed to waive the fee and/or pay expenses to the extent necessary to prevent the annual operating expenses of each Fund (excluding interest expenses, licensing fees (for all Funds other than the initial two Funds, the PowerShares Dynamic OTC Portfolio and the PowerShares Dynamic Market Portfolio), brokerage commissions and other trading expenses, taxes and extraordinary expenses) from exceeding 0.60% (0.50% for the PowerShares High Yield Equity Dividend AchieversTM Portfolio, the PowerShares Dividend AchieversTM Portfolio, the PowerShares High Growth Rate Dividend AchieversTM Portfolio and the PowerShares International Div idend AchieversTM Portfolio) at least until April 30, 2008. The Trustees noted that the Adviser does not provide investment management services to clients other than the Trust. The Trustees noted that the advisory fees were at the higher end of the ETF universe, but were generally lower than fees for open-end (non-ETF) funds and closed-end funds, and were reasonable because of the complexity of the indices, which generally require more frequent rebalancing of the portfolios, the distinguishing factors of the Funds, and the higher administrative, operational and management oversight costs for the Adviser. The Board therefore concluded that the advisory fee and expense ratio of each Fund are competitive and that the advisory fee for each Fund is reasonable and appropriate in amount in light of the quality of services provided and the expense cap in place.
In conjunction with their review of fees, the Trustees also considered information provided by the Adviser on the revenues received by the Adviser under the Agreement, as well as the fees waived and expenses
96
Board Considerations Regarding Continuation of Investment Advisory Agreement (Unaudited) (Continued)
reimbursed by the Adviser for the Funds. The Trustees reviewed information provided by the Adviser on its profitability as well as any profits realized by the Adviser from its relationship to each Fund. The Trustees noted the Adviser's statement that its costs of managing the Funds generally exceeded the amount payable as management fees under the Investment Advisory Agreement, and that most of the Funds were operating in a cash loss position. The Trustees concluded that the profitability to the Adviser of the advisory services provided to the Funds is not unreasonable.
Economies of Scale and Whether Fee Levels Reflect These Economies of Scale. The Trustees reviewed the information provided by the Adviser as to the extent to which economies of scale are realized as each Fund grows and whether fee levels reflect economies of scale for the benefit of shareholders. The Trustees reviewed each Fund's asset size, expense ratio, expense limitation agreed to by the Adviser and whether the investment process produced economies of scale. The Trustees noted that certain fixed costs associated with the management of the Funds are being reduced on a per-Fund basis as additional Funds are added, and that the gradual reduction of the per-Fund cost enabled the Adviser to operate some of the Funds under the expense cap, which potentially would lower the costs to shareholders. The Trustees noted that the Excess Expense Agreement with the Trust provided that the Adviser was entitled to be reimbursed by each Fund for fees waived or expenses absorbed pursuant to the expense cap for a period of three years from the date the fee or expense was incurred, provided that no reimbursement would be made that would result in a Fund exceeding its expense cap.
The Trustees noted that the Adviser had not identified any further benefits that it derived from its relationship with the Funds, and had noted that it does not have any soft-dollar arrangements.
Based on all of the information considered and the conclusions reached, the Board, including the Independent Trustees, determined to approve the continuation of the Investment Advisory Agreement for each Fund listed above. No single factor was determinative in the Board's analysis.
97
PowerShares Leading the Intelligent ETF Revolution
PowerShares continues to offer new solutions to the complex needs demanded by advisors and investors today. PowerShares is "Leading the Intelligent ETF Revolution" providing investment advisors and investors with institutional-caliber asset management by seeking to replicate enhanced indexes in one of the more benefit-rich investment vehicles available in the marketplace today, the exchange-traded fund (ETF). Each PowerShares fund can be classified into one of three different categories based on the objective and characteristics of its underlying index: Intelligent Index, Intelligent Exposure and Intelligent Access.
For most recent portfolio performance, please visit our website at www.powershares.com
This page contains advertising materials and should not be viewed as part of the Annual Report.
98
Intelligent Index
PowerShares believes that having insight into a stock's investment merit can have a positive impact on performance. Therefore, most PowerShares ETFs are based on Intelligent Indexes, which seek to provide alpha1 by identifying stocks with the greatest investment merit. These indexes use proprietary methodologies to identify financially strong, effectively managed and attractively priced companies with strong capital appreciation potential. Because their objective is to maximize performance, Intelligent Indexes may look different from the market.
Exchange-Traded Funds
Intelligent Index
PWC - Dynamic Market
PWO - Dynamic OTC
PIQ - Dynamic MagniQuant
PJF - Dynamic Large Cap
PJG - Dynamic Mid Cap
PJM - Dynamic Small Cap
PWB - Dynamic Large Cap Growth
PWV - Dynamic Large Cap Value
PWJ - Dynamic Mid Cap Growth
PWP - Dynamic Mid Cap Value
PWT - Dynamic Small Cap Growth
PWY - Dynamic Small Cap Value
PGZ - Dynamic Aggressive Growth
PVM - Dynamic Deep Value
PYZ - Dynamic Basic Materials Sector
PEZ - Dynamic Consumer Discretionary Sector
PSL - Dynamic Consumer Staples Sector
PXI - Dynamic Energy Sector
PFI - Dynamic Financials Sector
PTH - Dynamic Healthcare Sector
PRN - Dynamic Industrials Sector
PTF - Dynamic Technology Sector
PTE - Dynamic Telecommunications & Wireless
PUI - Dynamic Utilities
PJB - Dynamic Banking
PBE - Dynamic Biotechnology & Genome
PKB - Dynamic Building & Construction
PXE - Dynamic Energy Exploration & Production
PBJ - Dynamic Food & Beverage
PHW - Dynamic Hardware and Consumer Electronics
PTJ - Dynamic Healthcare Services
PIC - Dynamic Insurance
PEJ - Dynamic Leisure and Entertainment
PBS - Dynamic Media
PXQ - Dynamic Networking
PXJ - Dynamic Oil & Gas Services
PJP - Dynamic Pharmaceuticals
PMR - Dynamic Retail
PSI - Dynamic Semiconductors
PSJ - Dynamic Software
1 Alpha is a measure of risk adjusted performance relative to a benchmark or the market.
This page contains advertising materials and should not be viewed as part of the Annual Report.
99
Intelligent Exposure
For investors looking for more market-like exposure, PowerShares offers a lineup of ETFs that seek to track indexes with an Intelligent Exposure objective. These indexes seek to provide accurate exposure to the economy, yet are constructed using more sophisticated techniques than traditional benchmark indexes, which typically use a weighting structure based on market capitalization. Under this traditional structure, market speculation can lead to significant mispricing of stocks and, therefore, suboptimal weights in the index. But indexes seeking Intelligent Exposure use a weighting structure based on company fundamentals: sales, cash flow, book value and dividends. PowerShares believes these factors paint a truer picture of a company's size and lead to more optimal index weightings.
Exchange-Traded Funds
Intelligent Exposure
PRF - FTSE RAFI US 1000
PRFZ - FTSE RAFI US 1500 Small-Mid
PRFM - FTSE RAFI Basic Materials Sector
PRFG - FTSE RAFI Consumer Goods Sector
PRFS - FTSE RAFI Consumer Services Sector
PRFE - FTSE RAFI Energy Sector
PRFF - FTSE RAFI Financials Sector
PRFH - FTSE RAFI Health Care Sector
PRFN - FTSE RAFI Industrials Sector
PRFQ - FTSE RAFI Telecom & Technology Sector
PRFU - FTSE RAFI Utilities Sector
Intelligent Access
Without targeted investment products, unique market segments such as currency or nanotech may be difficult for investors to access. These segments are the focus of indexes that promote Intelligent Access. PowerShares has a diverse lineup of ETFs based on indexes that offer exposure to specific, unique or previously uncovered market areas.
Exchange-Traded Funds
Intelligent Access
PPA - Aerospace & Defense
ADRA - BLDRS Asia 50 ADR Index Fund
ADRD - BLDRS Developed Markets 100 ADR Index Fund
ADRE - BLDRS Emerging Markets 50 ADR Index Fund
ADRU - BLDRS Europe 100 ADR Index Fun
PKW - Buyback Achievers
PZD - Cleantech
PFM - Dividend Achievers
PDP - DWA Technical Lenders
PGF - Financial Preferred
PGJ - Golden Dragon Halter USX China
PHJ - High Growth Rate Dividend Achievers
PEY - High Yield Equity Dividend Achievers
PID - International Dividend Achievers
PSP - Listed Private Equity
PXN - Lux Nanotech
QQQQ - PowerShares QQQ
PYH - Value Line Industry Rotation
PIV - Value Line Timeliness Select
PHO - Water Resources
PBW - WilderHill Clean Energy
PUW - WilderHill Progressive Energy
PZI - Zacks Micro Cap
PZJ - Zacks Small Cap
This page contains advertising materials and should not be viewed as part of the Annual Report.
100
PowerShares Asset Class Guide
Domestic Equity
Broad
PWC Dynamic Market
PWO Dynamic OTC
PIV Value Line Timeliness Select
PRF FTSE RAFI US 1000
PRFZ FTSE RAFI US 1500
PIQ Dynamic MagniQuant
QQQQ PowerShares QQQ
PKW Buyback Achievers
PDP DWA Technical Leaders
PVM Dynamic Deep Value
PGZ Dynamic Aggressive Growth
Style
PJF Dynamic Large Cap
PWB Dynamic Large Cap Growth
PWV Dynamic Large Cap Value
PJG Dynamic Mid Cap
PWJ Dynamic Mid Cap Growth
PWP Dynamic Mid Cap Value
PJM Dynamic Small Cap
PWT Dynamic Small Cap Growth
PWY Dynamic Small Cap Value
PZJ Zacks Small Cap
PZI Zacks Micro Cap
International/Region
Region
PPGJ Golden Dragon Halter USX China
ADRA BLDRS Asia 50 ADR Index Fund
ADRD BLDRS Developed Markets 100 ADR Index Fund
ADRE BLDRS Emerging Markets 50 ADR Index Fund
ADRU BLDRS Europe 100 ADR Index Fund
Income
PID International Dividend Achievers
Income/Dividend
PEY High Yield Equity Dividend Achievers
PHJ High Growth Rate Dividend Achievers
PFM Dividend Achievers
PGF Financial Preferred
Sector and Industry
Sector
PUI Dynamic Utilities
PYZ Dynamic Basic Materials Sector
PEZ Dynamic Consumer Discretionary Sector
PSL Dynamic Consumer Staples Sector
PXI Dynamic Energy Sector
PFI Dynamic Financial Sector
PTH Dynamic Healthcare Sector
PRN Dynamic Industrials Sector
PTF Dynamic Technology Sector
PTE Dynamic Telecommunications & Wireless
PRFG FTSE RAFI Consumer Goods Sector
PRFS FTSE RAFI Consumer Services Sector
PRFE FTSE RAFI Energy Sector
PRFF FTSE RAFI Financials Sector
PRFH FTSE RAFI Health Care Sector
PRFN FTSE RAFI Industrials Sector
PRFM FTSE RAFI Basic Materials Sector
PRFQ FTSE RAFI Telecommunications & Technology Sector
PRFU FTSE RAFI Utilities Sector
Industry
PJB Dynamic Banking Sector
PBE Dynamic Biotechnology & Genome
PKB Dynamic Building & Construction
PXE Dynamic Energy Exploration & Production
PBJ Dynamic Food & Beverage
PHW Dynamic Hardware & Consumer Electronics
PTJ Dynamic Healthcare Services Sector
PIC Dynamic Insurance
PEJ Dynamic Leisure and Entertainment
PBS Dynamic Media
PXQ Dynamic Networking
PXJ Dynamic Oil & Gas Services
PJP Dynamic Pharmaceuticals
PMR Dynamic Retail
PSI Dynamic Semiconductors
PSJ Dynamic Software
PPA Aerospace & Defense
PBW Clean Energy
PZD Cleantech
PSP Listed Private Equity
PXN Nanotech
PUW Progressive Energy
PYH Value Line Industry Rotation
PHO Water Resources
This page contains advertising materials and should not be viewed as part of the Annual Report.
101
PowerShares Risk Spectrum
Domestic Equity
More Conservative
Dynamic Deep Value
Dynamic Large Cap
Dynamic Mid Cap
Dynamic MagniQuant
Buyback Achievers
DWA Technical Leaders
Dynamic Small Cap
Dynamic Large Cap Value
FTSE RAFI US 1000
Dynamic Mid Cap Value
Dynamic Market
Dynamic Aggressive Growth
Dynamic Small Cap Value
FTSE RAFI US 1500 Small-Mid
Zacks Micro Cap
PowerShares QQQ
Dynamic Large Cap Growth
Dynamic Mid Cap Growth
Zacks Small Cap
Value Line Timeliness Select
Dynamic Small Cap Growth
Dynamic OTC
More Aggressive
International/Region
More Conservative
BLDRS Europe 100 ADR Index Fund
BLDRS Developed Markets 100 ADR Index Fund
BLDRS Asia 50 Index Fund
International Dividend Achievers
BLDRS Emerging Markets 50 ADR Index Fund
Golden Dragon Halter USX China
More Aggressive
Income/Dividend
More Conservative
Financial Preferred
High Yield Equity Dividend Achievers
Dividend Achievers
High Growth Rate Dividend Achievers
More Aggressive
Sector and Industry
More Conservative
Dynamic Consumer Staples Sector
Dynamic Food & Beverage
Dynamic Banking Sector
Dynamic Financial Sector
Dynamic Utilities
Dynamic Insurance
FTSE RAFI Health Care Sector
Dynamic Healthcare Sector
FTSE RAFI Financials Sector
Dynamic Industrials Sector
Dynamic Media
Aerospace & Defense
FTSE RAFI Industrials Sector
Dynamic Pharmaceuticals
Dynamic Consumer Discretionary Sector
Dynamic Healthcare Services Sector
Dynamic Leisure and Entertainment
FTSE RAFI Consumer Goods Sector
FTSE RAFI Utilities Sector
Water Resources
FTSE RAFI Consumer Services Sector
FTSE RAFI Basic Materials Sector
Dynamic Basic Materials Sector
Dynamic Retail
FTSE RAFI Energy Sector
Dynamic Energy Sector
Dynamic Building & Construction
Value Line Industry Rotation
Dynamic Technology Sector
Progressive Energy
Dynamic Biotechnology & Genome
Dynamic Software
Nanotech
Dynamic Energy Exploration & Production
FTSE RAFI Telecommunications & Technology Sector
Dynamic Hardware & Consumer Electronics
Dynamic Telecommunications & Wireless
Dynamic Oil & Gas Services
Cleantech
Listed Private Equity
Clean Energy
Dynamic Networking
Dynamic Semiconductors
More Aggressive
This page contains advertising materials and should not be viewed as part of the Annual Report.
102
Exchange-Traded Funds
ETFs are investment funds that trade like individual stocks on all of the major exchanges, similar to shares of publicly held companies. They can be bought and sold on an exchange at any moment during market hours. Since they are listed and traded on an exchange, you can be confident that you are investing in a well-regulated market.
ETFs are one of the fastest growing investment products in the worldwide financial marketplace. As of 3.31.2007, 432 ETFs were listed in the U.S. with $433 billion in assets, up from two products with only $1 billion in assets in 1995.
ETFs seek investment results that correspond generally to the price and yield (before fees and expenses) of a listed index. While most ETFs share a similar objective, the principal investment strategies of the underlying indexes can have substantial differences. It is important to gain a clear understanding of an ETF's underlying index as the index's objective is inherently passed on to the fund shareholders by seeking to replicate the index.
Indexes
An index is a selection process or appointed committee that groups selected securities together to track their movement in aggregate. While only a few indexes are mentioned on the daily news, there are hundreds of indexes in existence today that differ from each other in diverse ways.
Broad Market
Broad market indexes are what most people think of when an index is mentioned. These indexes are designed to track the performance of the broad market.
Benchmark
Benchmark indexes are created to set a standard by which the performance or movement of individual securities and asset managers can be measured.
Exchange Composite
These indexes are designed to provide a comprehensive measure of the performance of all commons stocks listed on a particular exchange.
Sector or Industry
The aggregate financial marketplace is generally broken down into roughly ten sectors which are further dissected into many specific industries.
Style
Style indexes are created to identify groups of stocks that are either growth (companies currently experiencing appreciation or significant earnings or revenue growth) or value (companies determined to be under priced by fundamental measures) oriented.
Company Size
Market-capitalization indexes group together companies that are similar in size based on the number of outstanding shares times the share price, while fundamentally weighted indexes group together stocks of companies based on their financial fundamental valuation.
International / Country
International indexes group together stocks of companies that are affiliated by location outside of the U.S. or companies located with a specific country or region.
Income / Bond
Income indexes group stocks based on their type of income of securities, while bond indexes are designed to show the average performance of a group of debt securities.
This page contains advertising materials and should not be viewed as part of the Annual Report.
103
Specialty / Enhanced
Many other specialty indexes are created with specific investment management objectives or for customized purposes. These indexes can be created specifically with the intention to be used as the basis for an ETF. Investor targets can be met through an ETF where the index has the objective(s) of capital appreciation, risk control, income or diversification.
Benefits of PowerShares
PowerShares ETFs offer investors a low-cost, tax-efficient investment in a professionally crafted portfolio consisting of some of the best managed companies and most timely investments. See important risk factors in back.
Tax Advantaged Product Design
Taxes may be one of the most critical and overlooked factors in wealth creation over time. The ETF product structure defers some or possibly all capital gains until investors sell their shares.
Low Ownership Cost
ETFs provide lower ownership cost because of their efficient structure. PowerShares have established expense caps to make the cost of ownership clear and straightforward for investors. Ordinary brokerage commissions apply.
Flexibility, Transparency
PowerShares' ETFs offer flexibility as shares can be bought and sold throughout the day through exchange trading. Fund holdings are disclosed every day. Options based on the funds are available, possibly increasing financial management opportunities for advisors and their clients.
Near Instant Liquidity, Trades at or Close to NAV
PowerShares may be bought and sold on the exchange at any time during market hours. Although shares are not individually redeemable directly from the fund itself, authorized participants may acquire shares and tender shares for redemption, through creation unit aggregations. ETFs area not closed-end funds and trade at or near net asset values.
This page contains advertising materials and should not be viewed as part of the Annual Report.
104
PROXY VOTING POLICIES AND PROCEDURES
A description of the Funds' proxy voting policies and procedures that the Funds use to determine how to vote proxies relating to portfolio securities is available, without charge and upon request, by calling (800) 337-4246. This information is also available on the Securities and Exchange Commission's ("Commission") website at www.sec.gov.
Information regarding how the Funds voted proxies for portfolio securities, if applicable, during the most recent 12-month period ended June 30, is also available, without charge and upon request, by (i) calling (800) 337-4246; or (ii) accessing the Funds' Form N-PX on the Commission's website at www.sec.gov.
QUARTERLY PORTFOLIOS
The Funds file their complete schedules of portfolio holdings with the Commission for the first and third quarters of each fiscal year on Form N-Q. The Funds' Forms N-Q are available on the Commission's website at www.sec.gov. The Funds' Forms N-Q may also be reviewed and copied at the Commission's Public Reference Room in Washington, DC; information on the operation of the Public Reference Room may be obtained by calling (800) SEC-0330.
There are risks involved in investing in ETFs, including possible loss of money. Investing in securities of small and medium sized companies involves greater risk than is customarily associated with investing in more established companies, and investments in concentrated industry sectors involve greater risks than investments that are more diversified. PowerShares ETFs are not actively managed and are subject to risks similar to stocks, including those related to short selling and margin maintenance. PowerShares ETFs are not FDIC insured, may lose value and have no bank guarantee. PowerShares is a registered trademark of PowerShares Capital Management LLC. Past performance is not a guarantee of future results.
A I M Distributors, Inc. is the distributor of the PowerShares Exchange-Traded Fund Trust.
An investor should consider each Fund's investment objective, risks, charges and expenses carefully before investing. For more complete information about PowerShares ETFs call A I M Distributors, Inc. at (800) 337-4246 or visit our website powershares.com for a prospectus. Please read the prospectus carefully before investing.

301 W. Roosevelt Road
Wheaton, IL 60187
800.983.0903
www.powershares.com
P-PS-AR-7
2007 Annual Report to Shareholders
30 April 2007

PowerShares FTSE RAFI US 1500 Small-Mid Portfolio
PowerShares FTSE RAFI Basic Materials Sector Portfolio
PowerShares FTSE RAFI Consumer Goods Sector Portfolio
PowerShares FTSE RAFI Consumer Services Sector Portfolio
PowerShares FTSE RAFI Energy Sector Portfolio
PowerShares FTSE RAFI Financials Sector Portfolio
PowerShares FTSE RAFI Health Care Sector Portfolio
PowerShares FTSE RAFI Industrials Sector Portfolio
PowerShares FTSE RAFI Telecommunications & Technology Sector Portfolio
PowerShares FTSE RAFI Utilities Sector Portfolio

Table of Contents
| Shareholder Letter | 2 | ||||||
| The Market Environment | 3 | ||||||
| Manager's Analysis | 4 | ||||||
| Funds' Distribution History | 25 | ||||||
| Frequency Distribution of Discounts & Premiums | 26 | ||||||
| Fees and Expenses | 28 | ||||||
| Fundamental Indices Portfolios | |||||||
| Schedules of Investments | |||||||
| PowerShares FTSE RAFI US 1500 Small-Mid Portfolio | 30 | ||||||
| PowerShares FTSE RAFI Basic Materials Sector Portfolio | 44 | ||||||
| PowerShares FTSE RAFI Consumer Goods Sector Portfolio | 45 | ||||||
| PowerShares FTSE RAFI Consumer Services Sector Portfolio | 47 | ||||||
| PowerShares FTSE RAFI Energy Sector Portfolio | 50 | ||||||
| PowerShares FTSE RAFI Financials Sector Portfolio | 51 | ||||||
| PowerShares FTSE RAFI Health Care Sector Portfolio | 54 | ||||||
| PowerShares FTSE RAFI Industrials Sector Portfolio | 56 | ||||||
| PowerShares FTSE RAFI Telecommunications & Technology Sector Portfolio | 59 | ||||||
| PowerShares FTSE RAFI Utilities Sector Portfolio | 61 | ||||||
| Statements of Assets and Liabilities | 62 | ||||||
| Statements of Operations | 64 | ||||||
| Statements of Changes in Net Assets | 66 | ||||||
| Financial Highlights | 68 | ||||||
| Notes to Financial Statements | 73 | ||||||
| Report of Independent Registered Public Accounting Firm | 81 | ||||||
| Supplemental Information (Unaudited) | 82 | ||||||
| Information about Advisory Agreement (Unaudited) | 87 | ||||||

To My Fellow Investors,
It gives me great pleasure to report on the state of your investment(s) in PowerShares Exchange-Traded Funds and to thank you for your continued confidence in PowerShares Capital Management LLC.
Let me share with you the exciting events that have taken place at PowerShares as I look back over the past 12 months and at what the future may hold.
PowerShares has experienced significant growth over the past 12 months. We now have 70 exchange-traded funds ("ETFs") in the market, an increase of 33 funds from the 37 funds at the beginning of the fiscal year. PowerShares now offers more U.S. based equity ETFs than any other ETF sponsor. Assets under management increased almost 75%, from $6 billion to over $10 billion at April 30, 2007. This phenomenal growth demonstrates the continued strong demand for our original listings as well as the excellent reception of our new funds.
Of the new funds offered, 10 were FTSE RAFI funds, which were the first PowerShares Exchange-Traded Funds to be listed on the NASDAQ stock exchange, making PowerShares the only ETF sponsor to list ETFs on all three major U.S. exchanges: the American Stock Exchange, the NASDAQ, and the New York Stock Exchange.
PowerShares continues to be recognized as an innovator in the ETF marketplace. In 2007, our FTSE RAFI US 1000 Fund was awarded the most innovative new ETF at the Third Annual Global ETF Awards program.
Drawing on our increased resources as a member of the INVESCO family, we plan to introduce several PowerShares ETFs for international and global investing. These new funds will help to fulfill our goal of providing Investors with the opportunity to invest in intelligent ETFs in marketplaces around the globe.
On behalf of PowerShares Capital Management LLC and the Board of Trustees for the PowerShares Exchanged-Traded Fund Trust, I want to thank you for your participation in the PowerShares family of exchange-traded funds. We look forward to serving you in the future.
Highest Regards,

H. Bruce Bond
President and Chairman of the Board of Trustees
PowerShares Exchange-Traded Fund Trust
2
The Market Environment
Although spikes of volatility marked the beginning and end of the reporting period, the U.S. equity marketplace provided strong results, with the S&P 500® Index posting double digit returns of 15.24%. At the beginning of the reporting period, enthusiasm over economic expansion gave way to uncertainty over interest rates and concern that corporate profits would be difficult to sustain. But by the end of summer 2006, energy prices had cooled and investors surmised the Fed's actions had contained inflation without significant damage to ongoing corporate earnings.
Stocks resumed their upward path until late February of 2007, when Chinese regulators threatened to clamp down on local trading practices, causing global markets to retreat sharply. Global concerns, coupled with a slowing housing market domestically and the Fed's insistence that inflation posed a greater risk than a recession, amplified volatility. However, a strong job market, sustained earnings and indications that inflation would remain contained were enough to resume the rally by the end of the reporting period.
The telecom and utilities sectors posted the best results, while technology and industrial sectors lagged. Bond prices recovered moderately during the reporting period as the Fed ended its two year hike on rates in June of 2006 and a retracting housing market eased inflation concerns. With a few bumps along the way, commodity prices continued their upward march.
3
Manager's Analysis
PowerShares FTSE RAFI US 1500 Small-Mid Portfolio (ticker: PRFZ)
The PowerShares FTSE RAFI US 1500 Small-Mid Portfolio seeks investment results that correspond generally to the price and yield (before the Fund's fees and expenses) of an equity index called the FTSE US 1500 Small-Mid Index. The FTSE US 1500 Small-Mid Index is designed to track the performance of the small and medium-sized U.S. equities, selected based on the following four fundamental measures of firm size: book value, income, sales and dividends. The equities are then weighted by each of these four fundamental measures. An overall weight is calculated for each firm by equally-weighting each fundamental measure. Each of the equities with the highest fundamental weight are then selected and assigned a weight equal to its fundamental weight.
Since its inception on September 20, 2006 until April 30, 2007, the PowerShares FTSE RAFI US 1500 Small-Mid Portfolio returned 13.42%, ahead of the Russell 2000® Index which returned 11.72%.
Relative to the Russell 2000® Index, the industrials, consumer discretionary, and information technology sectors generated the greatest relative out-performance.
Industry Breakdown (% of the Fund's
Net Assets)
| Financials | 21.1 | ||||||
| Consumer Discretionary | 18.3 | ||||||
| Industrials | 16.6 | ||||||
| Information Technology | 15.1 | ||||||
| Health Care | 8.5 | ||||||
| Energy | 7.7 | ||||||
| Materials | 5.5 | ||||||
| Consumer Staples | 3.2 | ||||||
| Telecommunication Services | 1.8 | ||||||
| Utilities | 1.4 | ||||||
| Money Market Fund | 0.2 | ||||||
| Other | 0.6 | ||||||
Style Allocation (%)
| Small-Cap Value | 55.7 | ||||||
| Small-Cap Growth | 26.2 | ||||||
| Mid-Cap Growth | 15.1 | ||||||
| Mid-Cap Value | 2.9 | ||||||
| Large-Cap Growth | 0.1 | ||||||
Top Ten Fund Holdings (% of the Fund's
Net Assets)
| Security | |||||||
| Cabela's, Inc., Class A | 0.2 | ||||||
| Ryerson, Inc. | 0.2 | ||||||
| Jo-Ann Stores, Inc. | 0.2 | ||||||
| Chico's FAS, Inc. | 0.2 | ||||||
| Western Refining, Inc. | 0.2 | ||||||
| Fastenal Co. | 0.2 | ||||||
| Jarden Corp. | 0.2 | ||||||
| Blyth, Inc. | 0.2 | ||||||
| Denbury Resources, Inc. | 0.2 | ||||||
| Helmerich & Payne, Inc. | 0.2 | ||||||
| Total | 2.0 | ||||||
4
Manager's Analysis (Continued)
PowerShares FTSE RAFI US 1500 Small-Mid Portfolio (ticker: PRFZ)
Growth of a $10,000 Investment Since Inception
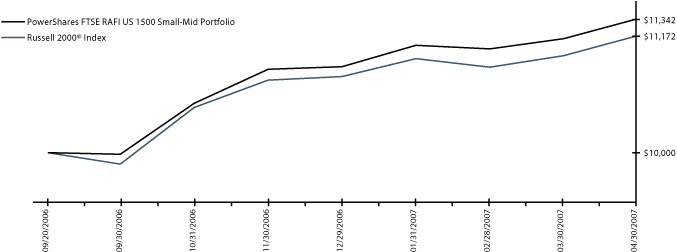
Fund Performance History (%) As of 30 April 2007
Index
| Fund Inception Cumulative | |||||||
| FTSE US 1500 Small-Mid Index | 14.22 | ||||||
| Russell 2000® Index | 11.72 | ||||||
| S&P Small Cap Index | 12.55 | ||||||
Fund
| NAV Return | 13.42 | ||||||
| Share Price Return | 13.35 | ||||||
Fund Inception: 20 September 2006
Performance data quoted represents past performance. Past performance is not a guarantee of future results, current performance may be higher or lower than performance quoted. Investment returns and principal value will fluctuate and shares, when redeemed, may be worth more or less than their original cost. The Share Price performance reflects fee waivers, absent which, performance would have been lower. According to the Fund's most recent Prospectus, the Fund's total gross annual operating expenses was indicated as 0.75%. In the Financial Highlights section of this Annual Report, the Fund's net (subsidized) annualized total operating expense ratio was determined to be 0.73% while the Fund's gross annualized total operating expense ratio was 0.92%. The Adviser has contractually agreed to waive fees and/or pay certain Fund expenses which resulted in a lower fee actually paid by investors. This waiver extends through April 30, 200 8. Absent reimbursements or waivers, performance would have been lower. NAV and Share Price returns assume that dividends and capital gain distributions have been reinvested in the Fund at NAV and Share Price, respectively. The returns shown in the table above do not reflect the deduction of taxes that a shareholder would pay on Fund distributions or the redemption or sale of Fund Shares. See powershares.com to find the most recent month-end performance numbers.
The index performance results are hypothetical. Index returns do not represent Fund returns. An investor cannot invest directly in an index. The index does not charge management fees or brokerage expenses, and no such fees or expenses were deducted from the hypothetical performance shown nor does the index lend securities, and no revenues from securities lending were added to the performance shown. In addition, the results actual investors might have achieved would have differed from those shown because of differences in the timing, amounts of their investments, and fees and expenses associated with an investment in the Fund.
The Russell 2000® Index and the S&P Small Cap Index are unmanaged indices based on the average performance of approximately 2,000 and 600 common stocks, respectively.
5
Manager's Analysis
PowerShares FTSE RAFI Basic Materials Sector Portfolio (ticker: PRFM)
The PowerShares FTSE RAFI Basic Materials Sector Portfolio seeks investment results that correspond generally to the price and yield (before the Fund's fees and expenses) of an equity index called the FTSE Basic Materials Sector Index. The FTSE Basic Materials Sector Index is designed to track the performance of the largest U.S. equities in the Basic Materials sector, selected based on the following four fundamental measures of firm size: book value, cash flow, sales and dividends. The equities are then weighted by each of these four fundamental measures. An overall weight is calculated for each firm by equally-weighting each fundamental measure. Each of the equities with the highest fundamental weight are then selected and assigned a weight equal to its fundamental weight.
Since its inception on September 20, 2006 until April 30, 2007, the PowerShares FTSE RAFI Basic Materials Sector Portfolio returned 26.17%, ahead of the S&P Materials Index which returned 24.99%.
Top contributors to the portfolio were E.I. du Pont de Nemours and Co., Alcoa, Inc., and Dow Chemicals Co. The index also benefited from underweighting Newmont Mining Corp.
Industry Breakdown (% of the Fund's
Net Assets)
| Chemicals | 54.1 | ||||||
| Mining | 15.8 | ||||||
| Forest Products & Paper | 12.4 | ||||||
| Iron/Steel | 8.5 | ||||||
| Coal | 4.3 | ||||||
| Metal/Fabricate Hardware | 1.7 | ||||||
| Household Products/Wares | 1.0 | ||||||
| Money Market Fund | 0.4 | ||||||
| Other | 1.8 | ||||||
Style Allocation (%)
| Large-Cap Value | 50.0 | ||||||
| Mid-Cap Value | 27.1 | ||||||
| Large-Cap Growth | 9.2 | ||||||
| Mid-Cap Growth | 8.5 | ||||||
| Small-Cap Value | 2.9 | ||||||
| Small-Cap Growth | 2.3 | ||||||
Top Ten Fund Holdings (% of the Fund's
Net Assets)
| Security | |||||||
| Dow Chemical (The) Co. | 10.7 | ||||||
| Alcoa, Inc. | 9.7 | ||||||
| International Paper Co. | 8.8 | ||||||
| E.I. du Pont de Nemours and Co. | 7.6 | ||||||
| PPG Industries, Inc. | 4.2 | ||||||
| Weyerhaeuser Co. | 3.6 | ||||||
| Air Products & Chemicals, Inc. | 3.5 | ||||||
| Monsanto Co. | 3.3 | ||||||
| Praxair, Inc. | 3.2 | ||||||
| Nucor Corp. | 2.9 | ||||||
| Total | 57.5 | ||||||
6
Manager's Analysis (Continued)
PowerShares FTSE RAFI Basic Materials Sector Portfolio (ticker: PRFM)
Growth of a $10,000 Investment Since Inception
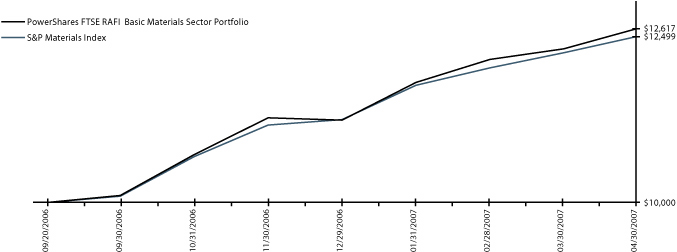
Fund Performance History (%) As of 30 April 2007
Index
| Fund Inception Cumulative | |||||||
| FTSE Basic Materials Sector Index | 27.25 | ||||||
| S&P Materials Index | 24.99 | ||||||
| Dow Jones Basic Materials Index | 25.58 | ||||||
Fund
| NAV Return | 26.17 | ||||||
| Share Price Return | 26.21 | ||||||
Fund Inception: 20 September 2006
Performance data quoted represents past performance. Past performance is not a guarantee of future results, current performance may be higher or lower than performance quoted. Investment returns and principal value will fluctuate and shares, when redeemed, may be worth more or less than their original cost. The Share Price performance reflects fee waivers, absent which, performance would have been lower. According to the Fund's most recent Prospectus, the Fund's total gross annual operating expenses was indicated as 0.75%. In the Financial Highlights section of this Annual Report, the Fund's net (subsidized) annualized total operating expense ratio was determined to be 0.76% while the Fund's gross annualized total operating expense ratio was 1.18%. The Adviser has contractually agreed to waive fees and/or pay certain Fund expenses which resulted in a lower fee actually paid by investors. This waiver extends through April 30, 200 8. Absent reimbursements or waivers, performance would have been lower. NAV and Share Price returns assume that dividends and capital gain distributions have been reinvested in the Fund at NAV and Share Price, respectively. The returns shown in the table above do not reflect the deduction of taxes that a shareholder would pay on Fund distributions or the redemption or sale of Fund Shares. See powershares.com to find the most recent month-end performance numbers.
The index performance results are hypothetical. Index returns do not represent Fund returns. An investor cannot invest directly in an index. The index does not charge management fees or brokerage expenses, and no such fees or expenses were deducted from the hypothetical performance shown nor does the index lend securities, and no revenues from securities lending were added to the performance shown. In addition, the results actual investors might have achieved would have differed from those shown because of differences in the timing, amounts of their investments, and fees and expenses associated with an investment in the Fund.
The S&P Materials Index and the Dow Jones Basic Materials Index are unmanaged indices based on the average performance of approximately 30 and 90 common stocks, respectively.
7
Manager's Analysis
PowerShares FTSE RAFI Consumer Goods Sector Portfolio (ticker: PRFG)
The PowerShares FTSE RAFI Consumer Goods Sector Portfolio seeks investment results that correspond generally to the price and yield (before the Fund's fees and expenses) of an equity index called the FTSE Consumer Goods Sector Index. The FTSE Consumer Goods Sector Index is designed to track the performance of the largest U.S. equities in the Consumer Goods sector, selected based on the following four fundamental measures of firm size: book value, cash flow, sales and dividends. The equities are then weighted by each of these four fundamental measures. An overall weight is calculated for each firm by equally-weighting each fundamental measure. Each of the equities with the highest fundamental weight are then selected and assigned a weight equal to its fundamental weight.
Since its inception on September 20, 2006 until April 30, 2007, the PowerShares FTSE RAFI Consumer Goods Sector Portfolio returned 10.78%, ahead of S&P Consumer Staples Index which returned 7.86%.
Top contributors to the portfolio were Time Warner, Goodyear Tire & Rubber (The) Co., and McDonald's Corp.
The portfolio benefited from overweighting Goodyear Tire & Rubber (The) Co., and underweighting Starbucks Corp.
Industry Breakdown (% of the Fund's
Net Assets)
| Food | 19.2 | ||||||
| Auto Manufacturers | 18.7 | ||||||
| Agriculture | 14.9 | ||||||
| Beverages | 13.5 | ||||||
| Cosmetics/Personal Care | 8.3 | ||||||
| Auto Parts & Equipment | 5.6 | ||||||
| Home Builders | 4.7 | ||||||
| Apparel | 3.0 | ||||||
| Household Products/Wares | 3.0 | ||||||
| Miscellaneous Manufacturing | 1.5 | ||||||
| Home Furnishings | 1.2 | ||||||
| Hand/Machine Tools | 0.9 | ||||||
| Leisure Time | 0.9 | ||||||
| Toys/Games/Hobbies | 0.8 | ||||||
| Distribution/Wholesale | 0.7 | ||||||
| Textiles | 0.7 | ||||||
| Housewares | 0.6 | ||||||
| Software | 0.5 | ||||||
| Office Furnishings | 0.3 | ||||||
| Electrical Components & Equipment | 0.2 | ||||||
| Electronics | 0.1 | ||||||
| Machinery-Diversified | 0.1 | ||||||
| Pharmaceuticals | 0.1 | ||||||
| Money Market | 0.7 | ||||||
| Other | (0.2 | ) | |||||
Top Ten Fund Holdings (% of the Fund's
Net Assets)
| Security | |||||||
| General Motors Corp. | 9.7 | ||||||
| Altria Group, Inc. | 9.5 | ||||||
| Ford Motor Co. | 9.1 | ||||||
| Kraft Foods, Inc., Class A | 7.3 | ||||||
| Procter & Gamble Co. | 5.8 | ||||||
| Coca-Cola (The) Co. | 5.0 | ||||||
| PepsiCo, Inc. | 3.6 | ||||||
| Kimberly-Clark Corp. | 1.9 | ||||||
| Anheuser-Busch Cos., Inc. | 1.8 | ||||||
| Archer-Daniels-Midland Co. | 1.6 | ||||||
| Total | 55.3 | ||||||
Style Allocation (%)
| Large-Cap Value | 42.9 | ||||||
| Mid-Cap Value | 26.2 | ||||||
| Large-Cap Growth | 23.8 | ||||||
| Small-Cap Value | 4.7 | ||||||
| Mid-Cap Growth | 1.9 | ||||||
| Small-Cap Growth | 0.5 | ||||||
8
Manager's Analysis (Continued)
PowerShares FTSE RAFI Consumer Goods Sector Portfolio (ticker: PRFG)
Growth of a $10,000 Investment Since Inception

Fund Performance History (%) As of 30 April 2007
Index
| Fund Inception Cumulative | |||||||
| FTSE Consumer Goods Sector Index | 11.57 | ||||||
| S&P Consumer Staples Index | 7.86 | ||||||
| Dow Jones Consumer Goods Index | 10.78 | ||||||
Fund
| NAV Return | 10.78 | ||||||
| Share Price Return | 10.82 | ||||||
Fund Inception: 20 September 2006
Performance data quoted represents past performance. Past performance is not a guarantee of future results, current performance may be higher or lower than performance quoted. Investment returns and principal value will fluctuate and shares, when redeemed, may be worth more or less than their original cost. The Share Price performance reflects fee waivers, absent which, performance would have been lower. According to the Fund's most recent Prospectus, the Fund's total gross annual operating expenses was indicated as 0.75%. In the Financial Highlights section of this Annual Report, the Fund's net (subsidized) annualized total operating expense ratio was determined to be 0.76% while the Fund's gross annualized total operating expense ratio was 1.27%. The Adviser has contractually agreed to waive fees and/or pay certain Fund expenses which resulted in a lower fee actually paid by investors. This waiver extends through April 30, 200 8. Absent reimbursements or waivers, performance would have been lower. NAV and Share Price returns assume that dividends and capital gain distributions have been reinvested in the Fund at NAV and Share Price, respectively. The returns shown in the table above do not reflect the deduction of taxes that a shareholder would pay on Fund distributions or the redemption or sale of Fund Shares. See powershares.com to find the most recent month-end performance numbers.
The index performance results are hypothetical. Index returns do not represent Fund returns. An investor cannot invest directly in an index. The index does not charge management fees or brokerage expenses, and no such fees or expenses were deducted from the hypothetical performance shown nor does the index lend securities, and no revenues from securities lending were added to the performance shown. In addition, the results actual investors might have achieved would have differed from those shown because of differences in the timing, amounts of their investments, and fees and expenses associated with an investment in the Fund.
The S&P Consumer Staples Index and the Dow Jones Consumer Goods Index are unmanaged indices based on the average performance of approximately 39 and 160 common stocks, respectively.
9
Manager's Analysis
PowerShares FTSE RAFI Consumer Services Sector Portfolio (ticker: PRFS)
The PowerShares FTSE RAFI Consumer Services Sector Portfolio seeks investment results that correspond generally to the price and yield (before the Fund's fees and expenses) of an equity index called the FTSE Consumer Services Sector Index. The FTSE Consumer Services Sector Index is designed to track the performance of the largest U.S. equities in the Consumer Services sector, selected based on the following four fundamental measures of firm size: book value, cash flow, sales and dividends. The equities are then weighted by each of these four fundamental measures. An overall weight is calculated for each firm by equally-weighting each fundamental measure. Each of the equities with the highest fundamental weight are then selected and assigned a weight equal to its fundamental weight.
Since its inception on September 20, 2006 until April 30, 2007, the PowerShares FTSE RAFI Consumer Services Sector Portfolio returned 12.78%, behind S&P Consumer Discretionary Index which returned 13.26%.
Top contributors to the portfolio were Altria Group, Inc., Kroger (The) Co., and Coca Cola (The) Co.
The portfolio benefited from overweighting Kroger (The) Co., and underweighting Walgreen Co.
Industry Breakdown (% of the Fund's
Net Assets)
| Retail | 47.6 | ||||||
| Media | 24.3 | ||||||
| Food | 7.2 | ||||||
| Commercial Services | 5.1 | ||||||
| Internet | 3.1 | ||||||
| Pharmaceuticals | 3.0 | ||||||
| Lodging | 2.8 | ||||||
| Leisure Time | 2.0 | ||||||
| Advertising | 1.5 | ||||||
| Airlines | 1.3 | ||||||
| Entertainment | 0.9 | ||||||
| Transporation | 0.2 | ||||||
| Household Products/Wares | 0.1 | ||||||
| Software | 0.1 | ||||||
| Trucking & Leasing | 0.1 | ||||||
| Money Market Fund | 0.3 | ||||||
| Other | 0.4 | ||||||
Top Ten Fund Holdings (% of the Fund's
Net Assets)
| Security | |||||||
| Wal-Mart Stores, Inc. | 11.1 | ||||||
| Time Warner, Inc. | 4.8 | ||||||
| Home Depot, Inc. | 3.8 | ||||||
| CVS Caremark Corp. | 3.8 | ||||||
| Kroger (The) Co. | 2.7 | ||||||
| Walt Disney (The) Co. | 2.6 | ||||||
| Comcast Corp., Class A | 2.3 | ||||||
| Target Corp. | 2.2 | ||||||
| McDonald's Corp. | 2.2 | ||||||
| CBS Corp., Class B | 2.2 | ||||||
| Total | 37.7 | ||||||
Style Allocation (%)
| Large-Cap Value | 34.9 | ||||||
| Large-Cap Growth | 33.0 | ||||||
| Mid-Cap Value | 18.1 | ||||||
| Mid-Cap Growth | 8.1 | ||||||
| Small-Cap Value | 4.8 | ||||||
| Small-Cap Growth | 1.1 | ||||||
10
Manager's Analysis (Continued)
PowerShares FTSE RAFI Consumer Services Sector Portfolio (ticker: PRFS)
Growth of a $10,000 Investment Since Inception
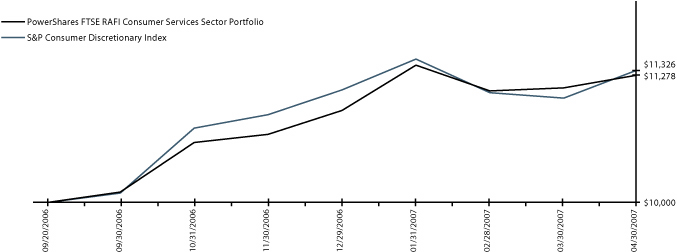
Fund Performance History (%) As of 30 April 2007
Index
| Fund Inception Cumulative | |||||||
| FTSE Consumer Services Sector Index | 13.37 | ||||||
| S&P Consumer Discretionary Index | 13.26 | ||||||
| Dow Jones Consumer Services Index | 11.22 | ||||||
Fund
| NAV Return | 12.78 | ||||||
| Share Price Return | 12.82 | ||||||
Fund Inception: 20 September 2006
Performance data quoted represents past performance. Past performance is not a guarantee of future results, current performance may be higher or lower than performance quoted. Investment returns and principal value will fluctuate and shares, when redeemed, may be worth more or less than their original cost. The Share Price performance reflects fee waivers, absent which, performance would have been lower. According to the Fund's most recent Prospectus, the Fund's total gross annual operating expenses was indicated as 0.75%. In the Financial Highlights section of this Annual Report, the Fund's net (subsidized) annualized total operating expense ratio was determined to be 0.77% while the Fund's gross annualized total operating expense ratio was 1.40%. The Adviser has contractually agreed to waive fees and/or pay certain Fund expenses which resulted in a lower fee actually paid by investors. This waiver extends through April 30, 200 8. Absent reimbursements or waivers, performance would have been lower. NAV and Share Price returns assume that dividends and capital gain distributions have been reinvested in the Fund at NAV and Share Price, respectively. The returns shown in the table above do not reflect the deduction of taxes that a shareholder would pay on Fund distributions or the redemption or sale of Fund Shares. See powershares.com to find the most recent month-end performance numbers.
The index performance results are hypothetical. Index returns do not represent Fund returns. An investor cannot invest directly in an index. The index does not charge management fees or brokerage expenses, and no such fees or expenses were deducted from the hypothetical performance shown nor does the index lend securities, and no revenues from securities lending were added to the performance shown. In addition, the results actual investors might have achieved would have differed from those shown because of differences in the timing, amounts of their investments, and fees and expenses associated with an investment in the Fund.
The S&P Consumer Discretionary Index and the Dow Jones Consumer Services Index are unmanaged indices based on the average performance of approximately 86 and 250 common stocks, respectively.
11
Manager's Analysis
PowerShares FTSE RAFI Energy Sector Portfolio (ticker: PRFE)
The PowerShares FTSE RAFI Energy Sector Portfolio seeks investment results that correspond generally to the price and yield (before the Fund's fees and expenses) of an equity index called the FTSE Oil & Gas Index. The FTSE Energy Sector Index is designed to track the performance of the largest U.S. equities in the Energy sector, selected based on the following four fundamental measures of firm size: book value, cash flow, sales and dividends. The equities are then weighted by each of these four fundamental measures. An overall weight is calculated for each firm by equally-weighting each fundamental measure. Each of the equities with the highest fundamental weight are then selected and assigned a weight equal to its fundamental weight.
Since its inception on September 20, 2006 until April 30, 2007, the PowerShares FTSE RAFI Energy Sector Portfolio returned 27.86%, ahead of S&P Energy Index which returned 25.90%.
Top contributors to the portfolio were Exxon Mobil Corp., Chevron Corp., and ConocoPhillips.
The portfolio benefited from overweighting Tesoro Corp. and Chevron Corp.
Industry Breakdown (% of the Fund's
Net Assets)
| Oil & Gas | 83.2 | ||||||
| Oil & Gas Services | 10.9 | ||||||
| Pipelines | 4.6 | ||||||
| Electric | 1.5 | ||||||
| Money Market Fund | 0.3 | ||||||
| Other | (0.5 | ) | |||||
Style Allocation (%)
| Large-Cap Value | 65.5 | ||||||
| Large-Cap Growth | 17.3 | ||||||
| Mid-Cap Value | 9.5 | ||||||
| Mid-Cap Growth | 6.4 | ||||||
| Small-Cap Value | 1.3 | ||||||
Top Ten Fund Holdings (% of the Fund's
Net Assets)
| Security | |||||||
| Exxon Mobil Corp. | 21.0 | ||||||
| Chevron Corp. | 20.2 | ||||||
| ConocoPhillips | 6.4 | ||||||
| Marathon Oil Corp. | 4.4 | ||||||
| Valero Energy Corp. | 4.1 | ||||||
| Occidental Petroleum Corp. | 3.8 | ||||||
| Schlumberger Ltd. (Netherlands) | 3.1 | ||||||
| Devon Energy Corp. | 2.7 | ||||||
| Anadarko Petroleum Corp. | 2.5 | ||||||
| El Paso Corp. | 2.1 | ||||||
| Total | 70.3 | ||||||
12
Manager's Analysis (Continued)
PowerShares FTSE RAFI Energy Sector Portfolio (ticker: PRFE)
Growth of a $10,000 Investment Since Inception
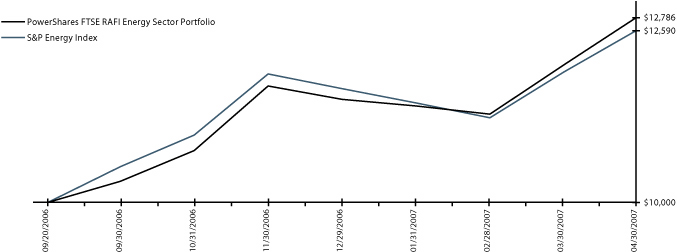
Fund Performance History (%) As of 30 April 2007
Index
| Fund Inception Cumulative | |||||||
| FTSE Oil & Gas Index | 28.51 | ||||||
| S&P Energy Index | 25.90 | ||||||
| Dow Jones Oil & Gas Index | 26.07 | ||||||
Fund
| NAV Return | 27.86 | ||||||
| Share Price Return | 27.82 | ||||||
Fund Inception: 20 September 2006
Performance data quoted represents past performance. Past performance is not a guarantee of future results, current performance may be higher or lower than performance quoted. Investment returns and principal value will fluctuate and shares, when redeemed, may be worth more or less than their original cost. The Share Price performance reflects fee waivers, absent which, performance would have been lower. According to the Fund's most recent Prospectus, the Fund's total gross annual operating expenses was indicated as 0.75%. In the Financial Highlights section of this Annual Report, the Fund's net (subsidized) annualized total operating expense ratio was determined to be 0.74% while the Fund's gross annualized total operating expense ratio was 1.09%. The Adviser has contractually agreed to waive fees and/or pay certain Fund expenses which resulted in a lower fee actually paid by investors. This waiver extends through April 30, 200 8. Absent reimbursements or waivers, performance would have been lower. NAV and Share Price returns assume that dividends and capital gain distributions have been reinvested in the Fund at NAV and Share Price, respectively. The returns shown in the table above do not reflect the deduction of taxes that a shareholder would pay on Fund distributions or the redemption or sale of Fund Shares. See powershares.com to find the most recent month-end performance numbers.
The index performance results are hypothetical. Index returns do not represent Fund returns. An investor cannot invest directly in an index. The index does not charge management fees or brokerage expenses, and no such fees or expenses were deducted from the hypothetical performance shown nor does the index lend securities, and no revenues from securities lending were added to the performance shown. In addition, the results actual investors might have achieved would have differed from those shown because of differences in the timing, amounts of their investments, and fees and expenses associated with an investment in the Fund.
The S&P Energy Index and the Dow Jones Oil & Gas Index are unmanaged indices based on the average performance of approximately 29 and 70 common stocks, respectively.
13
Manager's Analysis
PowerShares FTSE RAFI Financials Sector Portfolio (ticker: PRFF)
The PowerShares FTSE RAFI Financials Sector Portfolio seeks investment results that correspond generally to the price and yield (before the Fund's fees and expenses) of an equity index called the FTSE Financials Sector Index. The FTSE Financials Sector Index is designed to track the performance of the largest U.S. equities in the Financials sector, selected based on the following four fundamental measures of firm size: book value, cash flow, sales and dividends. The equities are then weighted by each of these four fundamental measures. An overall weight is calculated for each firm by equally-weighting each fundamental measure. Each of the equities with the highest fundamental weight are then selected and assigned a weight equal to its fundamental weight.
Since its inception on September 20, 2006 until April 30, 2007, the PowerShares FTSE RAFI Financials Sector Portfolio returned 8.62%, slightly behind the S&P Financials Index which returned 9.10%.
Top contributors to the portfolio were Citigroup, Inc., JPMorgan Chase & Co., and Berkshire Hathaway, Inc., Class B.
The index benefited from overweighting Berkshire Hathaway, Inc., Class B and Equity Office Properties, and underweighting Bank of America Corp.
Industry Breakdown (% of the Fund's
Net Assets)
| Diversified Financial Services | 34.4 | ||||||
| Insurance | 28.7 | ||||||
| Banks | 23.3 | ||||||
| REITS | 7.8 | ||||||
| Savings & Loans | 2.8 | ||||||
| Investment Companies | 0.5 | ||||||
| Forest Products & Paper | 0.3 | ||||||
| Commercial Services | 0.2 | ||||||
| Software | 0.2 | ||||||
| Real Estate | 0.1 | ||||||
| Money Market Fund | 0.1 | ||||||
| Other | 1.6 | ||||||
Style Allocation (%)
| Large-Cap Value | 68.1 | ||||||
| Mid-Cap Value | 18.7 | ||||||
| Large-Cap Growth | 6.1 | ||||||
| Mid-Cap Growth | 3.8 | ||||||
| Small-Cap Value | 2.4 | ||||||
| Small-Cap Growth | 0.9 | ||||||
Top Ten Fund Holdings (% of the Fund's
Net Assets)
| Security | |||||||
| JPMorgan Chase & Co. | 12.0 | ||||||
| Citigroup, Inc. | 6.8 | ||||||
| American International Group, Inc. | 4.7 | ||||||
| Berkshire Hathaway, Inc., Class B | 4.6 | ||||||
| Wells Fargo & Co. | 3.5 | ||||||
| Bank of America Corp. | 2.9 | ||||||
| Wachovia Corp. | 2.8 | ||||||
| Morgan Stanley | 2.5 | ||||||
| Merrill Lynch & Co., Inc. | 2.0 | ||||||
| Freddie Mac | 1.9 | ||||||
| Total | 43.7 | ||||||
14
Manager's Analysis (Continued)
PowerShares FTSE RAFI Financials Sector Portfolio (ticker: PRFF)
Growth of a $10,000 Investment Since Inception

Fund Performance History (%) As of 30 April 2007
Index
| Fund Inception Cumulative | |||||||
| FTSE Financials Sector Index | 9.30 | ||||||
| S&P Financials Index | 9.10 | ||||||
| Dow Jones Financials Index | 6.94 | ||||||
Fund
| NAV Return | 8.62 | ||||||
| Share Price Return | 8.66 | ||||||
Fund Inception: 20 September 2006
Performance data quoted represents past performance. Past performance is not a guarantee of future results, current performance may be higher or lower than performance quoted. Investment returns and principal value will fluctuate and shares, when redeemed, may be worth more or less than their original cost. The Share Price performance reflects fee waivers, absent which, performance would have been lower. According to the Fund's most recent Prospectus, the Fund's total gross annual operating expenses was indicated as 0.75%. In the Financial Highlights section of this Annual Report, the Fund's net (subsidized) annualized total operating expense ratio was determined to be 0.78% while the Fund's gross annualized total operating expense ratio was 1.44%. The Adviser has contractually agreed to waive fees and/or pay certain Fund expenses which resulted in a lower fee actually paid by investors. This waiver extends through April 30, 200 8. Absent reimbursements or waivers, performance would have been lower. NAV and Share Price returns assume that dividends and capital gain distributions have been reinvested in the Fund at NAV and Share Price, respectively. The returns shown in the table above do not reflect the deduction of taxes that a shareholder would pay on Fund distributions or the redemption or sale of Fund Shares. See powershares.com to find the most recent month-end performance numbers.
The index performance results are hypothetical. Index returns do not represent Fund returns. An investor cannot invest directly in an index. The index does not charge management fees or brokerage expenses, and no such fees or expenses were deducted from the hypothetical performance shown nor does the index lend securities, and no revenues from securities lending were added to the performance shown. In addition, the results actual investors might have achieved would have differed from those shown because of differences in the timing, amounts of their investments, and fees and expenses associated with an investment in the Fund.
The S&P Financials Index and the Dow Jones Financials Index are unmanaged indices based on the average performance of approximately 89 and 300 common stocks, respectively.
15
Manager's Analysis
PowerShares FTSE RAFI Health Care Sector Portfolio (ticker: PRFH)
The PowerShares FTSE RAFI Health Care Sector Portfolio seeks investment results that correspond generally to the price and yield (before the Fund's fees and expenses) of an equity index called the FTSE Health Care Sector Index. The FTSE Health Care Sector Index is designed to track the performance of the largest U.S. equities in the Health Care sector, selected based on the following four fundamental measures of firm size: book value, cash flow, sales and dividends. The equities are then weighted by each of these four fundamental measures. An overall weight is calculated for each firm by equally-weighting each fundamental measure. Each of the equities with the highest fundamental weight are then selected and assigned a weight equal to its fundamental weight.
Since its inception on September 20, 2006 until April 30, 2007, the PowerShares FTSE RAFI Health Care Sector Portfolio returned 9.38%, slightly ahead of S&P Health Care Index which returned 9.26%.
Top contributors to the portfolio were Merck & Co., Inc., Schering Plough Corp., and Bristol-Myers Squibb Co.
The portfolio benefited from overweighting Merck & Co., Inc. and underweighting Amgen, Inc.
Industry Breakdown (% of the Fund's
Net Assets)
| Pharmaceuticals | 55.6 | ||||||
| Healthcare-Products | 21.1 | ||||||
| Healthcare-Services | 14.4 | ||||||
| Biotechnology | 5.9 | ||||||
| Insurance | 1.5 | ||||||
| Electronics | 0.7 | ||||||
| Distribution/Wholesale | 0.2 | ||||||
| Health Care Equipment & Supplies | 0.2 | ||||||
| Money Market | 0.4 | ||||||
| Other | 0.0 | ||||||
Style Allocation (%)
| Large-Cap Value | 58.7 | ||||||
| Large-Cap Growth | 27.6 | ||||||
| Mid-Cap Growth | 8.0 | ||||||
| Mid-Cap Value | 4.7 | ||||||
| Small-Cap Value | 1.0 | ||||||
Top Ten Fund Holdings (% of the Fund's
Net Assets)
| Security | |||||||
| Pfizer, Inc. | 14.1 | ||||||
| Merck & Co., Inc. | 12.1 | ||||||
| Johnson & Johnson | 10.5 | ||||||
| Bristol-Myers Squibb Co. | 6.2 | ||||||
| Abbott Laboratories | 5.0 | ||||||
| Eli Lilly & Co. | 4.5 | ||||||
| Wyeth | 4.5 | ||||||
| WellPoint, Inc. | 3.1 | ||||||
| UnitedHealth Group, Inc. | 2.7 | ||||||
| Schering-Plough Corp. | 2.6 | ||||||
| Total | 65.3 | ||||||
16
Manager's Analysis (Continued)
PowerShares FTSE RAFI Health Care Sector Portfolio (ticker: PRFH)
Growth of a $10,000 Investment Since Inception
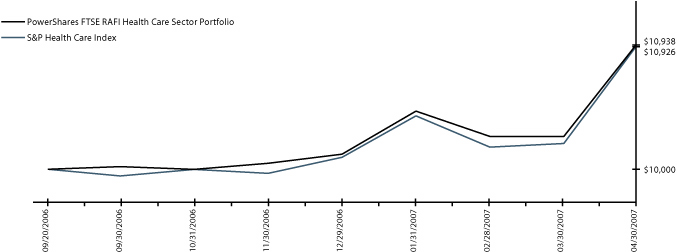
Fund Performance History (%) As of 30 April 2007
Index
| Fund Inception Cumulative | |||||||
| FTSE Health Care Sector Index | 9.91 | ||||||
| S&P Health Care Index | 9.26 | ||||||
| Dow Jones Health Care Index | 8.38 | ||||||
Fund
| NAV Return | 9.38 | ||||||
| Share Price Return | 9.37 | ||||||
Fund Inception: 20 September 2006
Performance data quoted represents past performance. Past performance is not a guarantee of future results, current performance may be higher or lower than performance quoted. Investment returns and principal value will fluctuate and shares, when redeemed, may be worth more or less than their original cost. The Share Price performance reflects fee waivers, absent which, performance would have been lower. According to the Fund's most recent Prospectus, the Fund's total gross annual operating expenses was indicated as 0.75%. In the Financial Highlights section of this Annual Report, the Fund's net (subsidized) annualized total operating expense ratio was determined to be 0.75% while the Fund's gross annualized total operating expense ratio was 1.11%. The Adviser has contractually agreed to waive fees and/or pay certain Fund expenses which resulted in a lower fee actually paid by investors. This waiver extends through April 30, 200 8. Absent reimbursements or waivers, performance would have been lower. NAV and Share Price returns assume that dividends and capital gain distributions have been reinvested in the Fund at NAV and Share Price, respectively. The returns shown in the table above do not reflect the deduction of taxes that a shareholder would pay on Fund distributions or the redemption or sale of Fund Shares. See powershares.com to find the most recent month-end performance numbers.
The index performance results are hypothetical. Index returns do not represent Fund returns. An investor cannot invest directly in an index. The index does not charge management fees or brokerage expenses, and no such fees or expenses were deducted from the hypothetical performance shown nor does the index lend securities, and no revenues from securities lending were added to the performance shown. In addition, the results actual investors might have achieved would have differed from those shown because of differences in the timing, amounts of their investments, and fees and expenses associated with an investment in the Fund.
The S&P Health Care Index and the Dow Jones Health Care Index are unmanaged indices based on the average performance of approximately 56 and 180 common stocks, respectively.
17
Manager's Analysis
PowerShares FTSE RAFI Industrials Sector Portfolio (ticker: PRFN)
The PowerShares FTSE RAFI Industrials Sector Portfolio seeks investment results that correspond generally to the price and yield (before the Fund's fees and expenses) of an equity index called the FTSE Industrials Sector Index. The FTSE Industrials Sector Index is designed to track the performance of the largest U.S. equities in the Industrials sector, selected based on the following four fundamental measures of firm size: book value, cash flow, sales and dividends. The equities are then weighted by each of these four fundamental measures. An overall weight is calculated for each firm by equally-weighting each fundamental measure. Each of the equities with the highest fundamental weight are then selected and assigned a weight equal to its fundamental weight.
Since its inception on September 20, 2006 until April 30, 2007, the PowerShares FTSE RAFI Industrials Sector Portfolio returned 17.01%, ahead of S&P Industrials Index which returned 13.90%.
Top contributors to the portfolio were General Electric Co., Tyco International Ltd., and Honeywell International, Inc.
The portfolio benefited from overweighting Navistar International Corp., and underweighting United Parcel Service, Inc., Class B.
Industry Breakdown (% of the Fund's
Net Assets)
| Miscellaneous Manufacturing | 37.9 | ||||||
| Aerospace/Defense | 13.3 | ||||||
| Transportation | 12.2 | ||||||
| Commercial Services | 4.8 | ||||||
| Electronics | 4.1 | ||||||
| Software | 3.8 | ||||||
| Packaging & Containers | 3.1 | ||||||
| Machinery-Diversified | 2.6 | ||||||
| Machinery-Construction & Mining | 2.5 | ||||||
| Electrical Components & Equipment | 2.2 | ||||||
| Environmental Control | 2.2 | ||||||
| Building Materials | 1.9 | ||||||
| Engineering & Construction | 1.6 | ||||||
| Forest Products & Paper | 1.6 | ||||||
| Auto Manufacturers | 1.1 | ||||||
| Computers | 0.6 | ||||||
| Household Products/Wares | 0.6 | ||||||
| Metal Fabricate/Hardware | 0.6 | ||||||
| Distribution/Wholesale | 0.5 | ||||||
| Chemicals | 0.4 | ||||||
| Mining | 0.4 | ||||||
| Electric | 0.3 | ||||||
| Hand/Machine Tools | 0.2 | ||||||
| Telecommunications | 0.2 | ||||||
| Trucking & Leasing | 0.2 | ||||||
| Internet | 0.1 | ||||||
| Retail | 0.1 | ||||||
| Money Market | 0.1 | ||||||
| Other | 0.8 | ||||||
Top Ten Fund Holdings (% of the Fund's
Net Assets)
| Security | |||||||
| General Electric Co. | 21.5 | ||||||
| Tyco International Ltd. (Bermuda) | 3.5 | ||||||
| United Parcel Service, Inc., Class B | 3.4 | ||||||
| Boeing Co. | 3.1 | ||||||
| 3M Co. | 2.9 | ||||||
| United Technologies Corp. | 2.7 | ||||||
| Honeywell International, Inc. | 2.4 | ||||||
| Caterpillar, Inc. | 2.3 | ||||||
| Northrop Grumman Corp. | 1.8 | ||||||
| Emerson Electric Co. | 1.8 | ||||||
| Total | 45.4 | ||||||
Style Allocation (%)
| Large-Cap Value | 51.3 | ||||||
| Mid-Cap Value | 21.8 | ||||||
| Large-Cap Growth | 13.4 | ||||||
| Mid-Cap Growth | 9.5 | ||||||
| Small-Cap Value | 3.8 | ||||||
| Small-Cap Growth | 0.2 | ||||||
18
Manager's Analysis (Continued)
PowerShares FTSE RAFI Industrials Sector Portfolio (ticker: PRFN)
Growth of a $10,000 Investment Since Inception
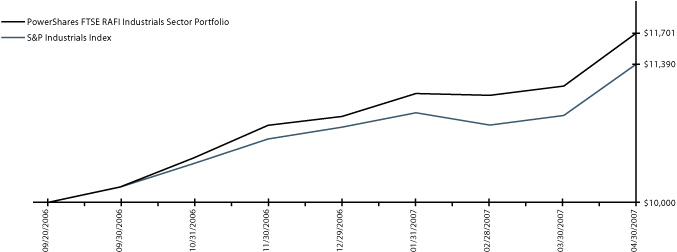
Fund Performance History (%) As of 30 April 2007
Index
| Fund Inception Cumulative | |||||||
| FTSE Industrials Sector Index | 17.56 | ||||||
| S&P Industrials Index | 13.90 | ||||||
| Dow Jones Industrials Index | 15.42 | ||||||
Fund
| NAV Return | 17.01 | ||||||
| Share Price Return | 16.96 | ||||||
Fund Inception: 20 September 2006
Performance data quoted represents past performance. Past performance is not a guarantee of future results, current performance may be higher or lower than performance quoted. Investment returns and principal value will fluctuate and shares, when redeemed, may be worth more or less than their original cost. The Share Price performance reflects fee waivers, absent which, performance would have been lower. According to the Fund's most recent Prospectus, the Fund's total gross annual operating expenses was indicated as 0.75%. In the Financial Highlights section of this Annual Report, the Fund's net (subsidized) annualized total operating expense ratio was determined to be 0.73% while the Fund's gross annualized total operating expense ratio was 1.00%. The Adviser has contractually agreed to waive fees and/or pay certain Fund expenses which resulted in a lower fee actually paid by investors. This waiver extends through April 30, 200 8. Absent reimbursements or waivers, performance would have been lower. NAV and Share Price returns assume that dividends and capital gain distributions have been reinvested in the Fund at NAV and Share Price, respectively. The returns shown in the table above do not reflect the deduction of taxes that a shareholder would pay on Fund distributions or the redemption or sale of Fund Shares. See powershares.com to find the most recent month-end performance numbers.
The index performance results are hypothetical. Index returns do not represent Fund returns. An investor cannot invest directly in an index. The index does not charge management fees or brokerage expenses, and no such fees or expenses were deducted from the hypothetical performance shown nor does the index lend securities, and no revenues from securities lending were added to the performance shown. In addition, the results actual investors might have achieved would have differed from those shown because of differences in the timing, amounts of their investments, and fees and expenses associated with an investment in the Fund.
The S&P Industrials Index and the Dow Jones Industrials Index are unmanaged indices based on the average performance of approximately 52 and 270 common stocks, respectively.
19
Manager's Analysis
PowerShares FTSE RAFI Telecommunications & Technology Sector Portfolio (ticker: PRFQ)
The PowerShares FTSE RAFI Telecommunications & Technology Sector Portfolio seeks investment results that correspond generally to the price and yield (before the Fund's fees and expenses) of an equity index called the FTSE Telecommunications & Technology Sector Index. The FTSE Telecommunications & Technology Sector Index is designed to track the performance of the largest U.S. equities in the Telecommunications & Technology sector, selected based on the following four fundamental measures of firm size: book value, cash flow, sales and dividends. The equities are then weighted by each of these four fundamental measures. An overall weight is calculated for each firm by equally-weighting each fundamental measure. Each of the equities with the highest fundamental weight are then selected and assigned a weight equal to its fundamental weight.
Since its inception on September 20, 2006 until April 30, 2007, the PowerShares FTSE RAFI Telecommunications & Technology Sector Portfolio returned 12.15%, ahead of S&P Technology and Telecom Index which returned 11.17%.
Top contributors to the portfolio were Microsoft Corp., International Business Machines Corp., Hewlett Packard Co., AT&T, Inc., and Verizon Communications, Inc.
The portfolio benefited from overweighting Avnet, Inc. and underweighting Advanced Micro Devices, Inc.
Industry Breakdown (% of the Fund's
Net Assets)
| Telecommunications | 41.8 | ||||||
| Computers | 20.5 | ||||||
| Software | 18.2 | ||||||
| Semiconductors | 12.7 | ||||||
| Internet | 2.3 | ||||||
| Distribution/Wholesale | 2.2 | ||||||
| Office/Business Equipment | 2.1 | ||||||
| Holding Companies-Diversified | 0.2 | ||||||
| Retail | 0.1 | ||||||
| Money Market Fund | 0.2 | ||||||
| Other | (0.3 | ) | |||||
Style Allocation (%)
| Large-Cap Growth | 44.6 | ||||||
| Large-Cap Value | 36.2 | ||||||
| Mid-Cap Growth | 8.7 | ||||||
| Mid-Cap Value | 8.1 | ||||||
| Small-Cap Value | 2.0 | ||||||
| Small-Cap Growth | 0.4 | ||||||
Top Ten Fund Holdings (% of the Fund's
Net Assets)
| Security | |||||||
| Microsoft Corp. | 14.5 | ||||||
| Verizon Communications, Inc. | 11.2 | ||||||
| AT&T, Inc. | 10.7 | ||||||
| Intel Corp. | 6.2 | ||||||
| International Business Machines Corp. | 5.6 | ||||||
| Sprint Nextel Corp. | 4.2 | ||||||
| Hewlett-Packard Co. | 3.7 | ||||||
| Cisco Systems, Inc. | 3.2 | ||||||
| Dell, Inc. | 2.6 | ||||||
| Motorola, Inc. | 2.1 | ||||||
| Total | 64.0 | ||||||
20
Manager's Analysis (Continued)
PowerShares FTSE RAFI Telecommunications & Technology Sector Portfolio (ticker: PRFQ)
Growth of a $10,000 Investment Since Inception
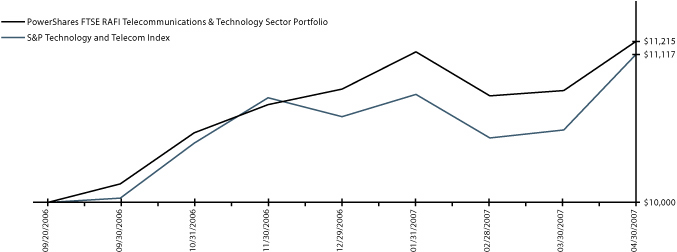
Fund Performance History (%) As of 30 April 2007
Index
| Fund Inception Cumulative | |||||||
| FTSE Telecommunications & Technology Sector Index | 12.97 | ||||||
| S&P Technology and Telecom Index | 11.17 | ||||||
| Dow Jones Technology Index | 10.43 | ||||||
Fund
| NAV Return | 12.15 | ||||||
| Share Price Return | 12.25 | ||||||
Fund Inception: 20 September 2006
Performance data quoted represents past performance. Past performance is not a guarantee of future results, current performance may be higher or lower than performance quoted. Investment returns and principal value will fluctuate and shares, when redeemed, may be worth more or less than their original cost. The Share Price performance reflects fee waivers, absent which, performance would have been lower. According to the Fund's most recent Prospectus, the Fund's total gross annual operating expenses was indicated as 0.75%. In the Financial Highlights section of this Annual Report, the Fund's net (subsidized) annualized total operating expense ratio was determined to be 0.75% while the Fund's gross annualized total operating expense ratio was 1.17%. The Adviser has contractually agreed to waive fees and/or pay certain Fund expenses which resulted in a lower fee actually paid by investors. This waiver extends through April 30, 200 8. Absent reimbursements or waivers, performance would have been lower. NAV and Share Price returns assume that dividends and capital gain distributions have been reinvested in the Fund at NAV and Share Price, respectively. The returns shown in the table above do not reflect the deduction of taxes that a shareholder would pay on Fund distributions or the redemption or sale of Fund Shares. See powershares.com to find the most recent month-end performance numbers.
The index performance results are hypothetical. Index returns do not represent Fund returns. An investor cannot invest directly in an index. The index does not charge management fees or brokerage expenses, and no such fees or expenses were deducted from the hypothetical performance shown nor does the index lend securities, and no revenues from securities lending were added to the performance shown. In addition, the results actual investors might have achieved would have differed from those shown because of differences in the timing, amounts of their investments, and fees and expenses associated with an investment in the Fund.
The S&P Technology and Telecom Index and the Dow Jones Technology Index are unmanaged indices based on the average performance of approximately 88 and 252 common stocks, respectively.
21
Manager's Analysis
PowerShares FTSE RAFI Utilities Sector Portfolio (ticker: PRFU)
The PowerShares FTSE RAFI Utilities Sector Portfolio seeks investment results that correspond generally to the price and yield (before the Fund's fees and expenses) of an equity index called the FTSE Utilities Sector Index. The FTSE Utilities Sector Index is designed to track the performance of the largest U.S. equities in the Utilities sector, selected based on the following four fundamental measures of firm size: book value, cash flow, sales and dividends. The equities are then weighted by each of these four fundamental measures. An overall weight is calculated for each firm by equally-weighting each fundamental measure. Each of the equities with the highest fundamental weight are then selected and assigned a weight equal to its fundamental weight.
Since its inception on September 20, 2006 until April 30, 2007, the PowerShares FTSE RAFI Utilities Sector Portfolio returned 23.87%, behind S&P Utilities Index which returned 25.52%.
Top contributors to the portfolio were Reliant Energy, Inc., American Electric Power Co., Inc., and FPL Group, Inc.
The portfolio benefited from overweighting Reliant Energy, Inc., and underweighting TXU Corp.
Industry Breakdown (% of the Fund's
Net Assets)
| Electric | 84.4 | ||||||
| Gas | 9.6 | ||||||
| Pipelines | 4.7 | ||||||
| Environmental Control | 0.5 | ||||||
| Water | 0.2 | ||||||
| Money Market Fund | 0.5 | ||||||
| Other | 0.1 | ||||||
Style Allocation (%)
| Large-Cap Value | 47.7 | ||||||
| Mid-Cap Value | 33.2 | ||||||
| Mid-Cap Growth | 8.6 | ||||||
| Small-Cap Value | 7.0 | ||||||
| Large-Cap Growth | 3.5 | ||||||
Top Ten Fund Holdings (% of the Fund's
Net Assets)
| Security | |||||||
| Exelon Corp. | 5.0 | ||||||
| Southern Co. | 4.8 | ||||||
| American Electric Power Co., Inc. | 4.6 | ||||||
| Dominion Resources, Inc. | 4.5 | ||||||
| Duke Energy Corp. | 3.8 | ||||||
| FirstEnergy Corp. | 3.4 | ||||||
| Public Service Enterprise Group, Inc. | 3.1 | ||||||
| FPL Group, Inc. | 3.0 | ||||||
| Progress Energy, Inc. | 2.9 | ||||||
| Entergy Corp. | 2.8 | ||||||
| Total | 37.9 | ||||||
��
22
Manager's Analysis (Continued)
PowerShares FTSE RAFI Utilities Sector Portfolio (ticker: PRFU)
Growth of a $10,000 Investment Since Inception

Fund Performance History (%) As of 30 April 2007
Index
| Fund Inception Cumulative | |||||||
| FTSE Utilities Sector Index | 24.59 | ||||||
| S&P Utilities Index | 25.52 | ||||||
| Dow Jones Utilities Index | 22.76 | ||||||
Fund
| NAV Return | 23.87 | ||||||
| Share Price Return | 23.65 | ||||||
Fund Inception: 20 September 2006
Performance data quoted represents past performance. Past performance is not a guarantee of future results, current performance may be higher or lower than performance quoted. Investment returns and principal value will fluctuate and shares, when redeemed, may be worth more or less than their original cost. The Share Price performance reflects fee waivers, absent which, performance would have been lower. According to the Fund's most recent Prospectus, the Fund's total gross annual operating expenses was indicated as 0.75%. In the Financial Highlights section of this Annual Report, the Fund's net (subsidized) annualized total operating expense ratio was determined to be 0.75% while the Fund's gross annualized total operating expense ratio was 1.19%. The Adviser has contractually agreed to waive fees and/or pay certain Fund expenses which resulted in a lower fee actually paid by investors. This waiver extends through April 30, 200 8. Absent reimbursements or waivers, performance would have been lower. NAV and Share Price returns assume that dividends and capital gain distributions have been reinvested in the Fund at NAV and Share Price, respectively. The returns shown in the table above do not reflect the deduction of taxes that a shareholder would pay on Fund distributions or the redemption or sale of Fund Shares. See powershares.com to find the most recent month-end performance numbers.
The index performance results are hypothetical. Index returns do not represent Fund returns. An investor cannot invest directly in an index. The index does not charge management fees or brokerage expenses, and no such fees or expenses were deducted from the hypothetical performance shown nor does the index lend securities, and no revenues from securities lending were added to the performance shown. In addition, the results actual investors might have achieved would have differed from those shown because of differences in the timing, amounts of their investments, and fees and expenses associated with an investment in the Fund.
The S&P Utilities Index and the Dow Jones Utilities Index are unmanaged indices based on the average performance of approximately 31 and 90 common stocks, respectively.
23
This page intentionally left blank
Funds' Distribution History
| Ex-Dividend | 4/13/07 | 3/16/07 | 3/15/07 | 2/15/07 | 1/15/07 | 12/15/06 | |||||||||||||||||||||||||
| Record | 4/17/07 | 3/20/07 | 3/20/07 | 2/20/07 | 1/17/07 | 12/19/06 | |||||||||||||||||||||||||
| Payable | 4/30/07 | 3/30/07 | 3/30/07 | 2/28/07 | 1/31/07 | 12/29/06 | |||||||||||||||||||||||||
| Fund | Ticker | ||||||||||||||||||||||||||||||
| PowerShares FTSE RAFI US 1500 Small-Mid Portfolio | PRFZ | — | 0.03020 | — | — | — | 0.14258 | ||||||||||||||||||||||||
| PowerShares FTSE RAFI Basic Materials Sector Portfolio | PRFM | — | 0.05952 | — | — | — | 0.59859 | ||||||||||||||||||||||||
| PowerShares FTSE RAFI Consumer Goods Sector Portfolio | PRFG | — | — | — | — | — | 0.32984 | ||||||||||||||||||||||||
| PowerShares FTSE RAFI Consumer Services Sector Portfolio | PRFS | — | — | — | — | — | 0.09283 | ||||||||||||||||||||||||
| PowerShares FTSE RAFI Energy Sector Portfolio | PRFE | — | 0.10320 | — | — | — | 0.10379 | ||||||||||||||||||||||||
| PowerShares FTSE RAFI Financials Sector Portfolio | PRFF | — | — | — | — | — | 0.41582 | ||||||||||||||||||||||||
| PowerShares FTSE RAFI Health Care Sector Portfolio | PRFH | — | 0.23850 | — | — | — | 0.13869 | ||||||||||||||||||||||||
| PowerShares FTSE RAFI Industrials Sector Portfolio | PRFN | — | 0.11650 | — | — | — | 0.21147 | ||||||||||||||||||||||||
| PowerShares FTSE RAFI Telecommunications & Technology Sector Portfolio | PRFQ | — | 0.09750 | — | — | — | 0.14861 | ||||||||||||||||||||||||
| PowerShares FTSE RAFI Utilities Sector Portfolio | PRFU | — | 0.26830 | — | — | — | 0.38618 | ||||||||||||||||||||||||
25
Frequency Distribution of Discounts & Premiums
Since Inception thru April 30, 2007
| Closing Price Above NAV | |||||||||||||||||||||||||||||||||||||||
Ticker | Fund Name | Inception | Days | 0-24 Basis Points | 25-49 Basis Points | 50-99 Basis Points | 100-149 Basis Points | 150-199 Basis Points | 200+ Basis Points | ||||||||||||||||||||||||||||||
| PRFZ | PowerShares FTSE RAFI US 1500 Small-Mid Portfolio | 9/20/06 | 152 | 60 | 3 | 0 | 0 | 1 | 0 | ||||||||||||||||||||||||||||||
| PRFM | PowerShares FTSE RAFI Basic Materials Sector Portfolio | 9/20/06 | 152 | 64 | 0 | 0 | 0 | 0 | 0 | ||||||||||||||||||||||||||||||
| PRFG | PowerShares FTSE RAFI Consumer Goods Sector Portfolio | 9/20/06 | 152 | 78 | 3 | 0 | 0 | 0 | 0 | ||||||||||||||||||||||||||||||
| PRFS | PowerShares FTSE RAFI Consumer Services Sector Portfolio | 9/20/06 | 152 | 71 | 2 | 0 | 0 | 0 | 0 | ||||||||||||||||||||||||||||||
| PRFE | PowerShares FTSE RAFI Energy Sector Portfolio | 9/20/06 | 152 | 66 | 2 | 0 | 0 | 0 | 0 | ||||||||||||||||||||||||||||||
| PRFF | PowerShares FTSE RAFI Financials Sector Portfolio | 9/20/06 | 152 | 69 | 0 | 0 | 0 | 0 | 0 | ||||||||||||||||||||||||||||||
| PRFH | PowerShares FTSE RAFI Health Care Sector Portfolio | 9/20/06 | 152 | 77 | 1 | 1 | 0 | 0 | 0 | ||||||||||||||||||||||||||||||
| PRFN | PowerShares FTSE RAFI Industrials Sector Portfolio | 9/20/06 | 152 | 74 | 2 | 0 | 0 | 0 | 0 | ||||||||||||||||||||||||||||||
| PRFQ | PowerShares FTSE RAFI Telecommunications & Technology Sector Portfolio | 9/20/06 | 152 | 66 | 3 | 0 | 0 | 0 | 0 | ||||||||||||||||||||||||||||||
| PRFU | PowerShares FTSE RAFI Utilities Sector Portfolio | 9/20/06 | 152 | 48 | 0 | 0 | 0 | 0 | 0 | ||||||||||||||||||||||||||||||
26
| Closing Price Below NAV | |||||||||||||||||||||||||||
Ticker | -0-24 Basis Points | -25-49 Basis Points | -50-99 Basis Points | -100-149 Basis Points | -150-199 Basis Points | -200+ Basis Points | |||||||||||||||||||||
| PRFZ | 87 | 1 | 0 | 0 | 0 | 0 | |||||||||||||||||||||
| PRFM | 88 | 0 | 0 | 0 | 0 | 0 | |||||||||||||||||||||
| PRFG | 69 | 2 | 0 | 0 | 0 | 0 | |||||||||||||||||||||
| PRFS | 79 | 0 | 0 | 0 | 0 | 0 | |||||||||||||||||||||
| PRFE | 84 | 0 | 0 | 0 | 0 | 0 | |||||||||||||||||||||
| PRFF | 82 | 1 | 0 | 0 | 0 | 0 | |||||||||||||||||||||
| PRFH | 73 | 0 | 0 | 0 | 0 | 0 | |||||||||||||||||||||
| PRFN | 76 | 0 | 0 | 0 | 0 | 0 | |||||||||||||||||||||
| PRFQ | 83 | 0 | 0 | 0 | 0 | 0 | |||||||||||||||||||||
| PRFU | 103 | 1 | 0 | 0 | 0 | 0 | |||||||||||||||||||||
27
Fees and Expenses
As a shareholder of a Fund of the PowerShares Exchange-Traded Fund Trust, you incur advisory fees and other Fund expenses. The expense examples below are intended to help you understand your ongoing costs (in dollars) of investing in the Funds and to compare these costs with the ongoing costs of investing in other mutual funds.
The example is based on an investment of $1,000 invested at the beginning of the period and held through the six-month period ended April 30, 2007.
Actual Expenses
The first line in the following tables provides information about actual account values and actual expenses. You may use the information in this line, together with the amount you invested, to estimate the expenses that you paid over the period. Simply divide your account value by $1,000 (for example, an $8,600 account value divided by $1,000 = 8.6), then multiply the result by the number in the first line under the heading "Expenses Paid During the Six-Month Period" to estimate the expenses you paid on your account during this period.
Hypothetical Example for Comparison Purposes
The second line in the following tables provides information about hypothetical account values and hypothetical expenses based on the Funds' actual expense ratio and an assumed annualized rate of return of 5% per year before expenses, which is not the Funds' actual return. The hypothetical account values and expenses may not be used to estimate the actual ending account balance or expenses you paid for the period. You may use this information to compare the ongoing costs of investing in the Funds and other funds. To do so, compare this 5% hypothetical example with the 5% hypothetical examples that appear in the shareholder reports of the other funds.
Please note that the expenses shown in the tables are meant to highlight your ongoing costs only, and do not reflect any transactional costs such as sales charges (loads). Therefore the second line in the table is useful in comparing ongoing costs only, and will not help you determine the relative total costs of owning different funds. In addition, if these transactional costs were included, your costs would have been higher.
| Beginning Account Value November 1, 2006 | Ending Account Value April 30, 2007 | Annualized Expense Ratio Based on the Six-Month Period | Expenses Paid During the Six-Month Period (1) | ||||||||||||||||
| PowerShares FTSE RAFI US 1500 Small-Mid Portfolio Actual | $ | 1,000.00 | $ | 1,087.71 | 0.72 | % | $ | 3.73 | |||||||||||
| Hypothetical (5% return before expenses) | $ | 1,000.00 | $ | 1,021.22 | 0.72 | % | $ | 3.61 | |||||||||||
| PowerShares FTSE RAFI Basic Materials Sector Portfolio Actual | $ | 1,000.00 | $ | 1,179.57 | 0.77 | % | $ | 4.16 | |||||||||||
| Hypothetical (5% return before expenses) | $ | 1,000.00 | $ | 1,020.98 | 0.77 | % | $ | 3.86 | |||||||||||
| PowerShares FTSE RAFI Consumer Goods Sector Portfolio Actual | $ | 1,000.00 | $ | 1,069.39 | 0.77 | % | $ | 3.95 | |||||||||||
| Hypothetical (5% return before expenses) | $ | 1,000.00 | $ | 1,020.98 | 0.77 | % | $ | 3.86 | |||||||||||
| PowerShares FTSE RAFI Consumer Services Sector Portfolio Actual | $ | 1,000.00 | $ | 1,072.98 | 0.79 | % | $ | 4.06 | |||||||||||
| Hypothetical (5% return before expenses) | $ | 1,000.00 | $ | 1,020.88 | 0.79 | % | $ | 3.96 | |||||||||||
28
Fees and Expenses (Continued)
| Beginning Account Value November 1, 2006 | Ending Account Value April 30, 2007 | Annualized Expense Ratio Based on the Six-Month Period | Expenses Paid During the Six-Month Period (1) | ||||||||||||||||
| PowerShares FTSE RAFI Energy Sector Portfolio Actual | $ | 1,000.00 | $ | 1,167.67 | 0.74 | % | $ | 3.98 | |||||||||||
| Hypothetical (5% return before expenses) | $ | 1,000.00 | $ | 1,021.12 | 0.74 | % | $ | 3.71 | |||||||||||
| PowerShares FTSE RAFI Financials Sector Portfolio Actual | $ | 1,000.00 | $ | 1,050.81 | 0.79 | % | $ | 4.02 | |||||||||||
| Hypothetical (5% return before expenses) | $ | 1,000.00 | $ | 1,020.88 | 0.79 | % | $ | 3.96 | |||||||||||
| PowerShares FTSE RAFI Health Care Sector Portfolio Actual | $ | 1,000.00 | $ | 1,100.59 | 0.75 | % | $ | 3.91 | |||||||||||
| Hypothetical (5% return before expenses) | $ | 1,000.00 | $ | 1,021.08 | 0.75 | % | $ | 3.76 | |||||||||||
| PowerShares FTSE RAFI Industrials Sector Portfolio Actual | $ | 1,000.00 | $ | 1,123.00 | 0.73 | % | $ | 3.84 | |||||||||||
| Hypothetical (5% return before expenses) | $ | 1,000.00 | $ | 1,021.17 | 0.73 | % | $ | 3.66 | |||||||||||
| PowerShares FTSE RAFI Telecommunications & Technology Sector Portfolio Actual | $ | 1,000.00 | $ | 1,077.02 | 0.75 | % | $ | 3.86 | |||||||||||
| Hypothetical (5% return before expenses) | $ | 1,000.00 | $ | 1,021.08 | 0.75 | % | $ | 3.76 | |||||||||||
| PowerShares FTSE RAFI Utilities Sector Portfolio Actual | $ | 1,000.00 | $ | 1,163.87 | 0.76 | % | $ | 4.08 | |||||||||||
| Hypothetical (5% return before expenses) | $ | 1,000.00 | $ | 1,021.03 | 0.76 | % | $ | 3.81 | |||||||||||
(1) Expenses are calculated using the annualized expense ratio, which represents the ongoing expenses as a percentage of net assets for the six months ended April 30, 2007. Expenses are calculated by multiplying the Fund's annualized expense ratio by the average account value for the period; then multiplying the result by 181 and then dividing the result by 365. Expense ratios for the most recent half-year may differ from expense ratios based on the one year data in the financial highlights.
29
Schedule of Investments
PowerShares FTSE RAFI US 1500 Small-Mid Portfolio
April 30, 2007
| Number of Shares | Value | ||||||||||
| Common Stocks—99.2% | |||||||||||
| Consumer Discretionary—18.3% | |||||||||||
| 1,279 | 4Kids Entertainment, Inc.* | $ | 20,809 | ||||||||
| 1 | 99 Cents Only Stores* | 14 | |||||||||
| 1,912 | A.C. Moore Arts & Crafts, Inc.* | 39,253 | |||||||||
| 3,841 | Aaron Rents, Inc. | 108,969 | |||||||||
| 2,186 | Aeropostale, Inc.* | 89,954 | |||||||||
| 7,192 | AFC Enterprises, Inc.* | 136,720 | |||||||||
| 2,196 | Aftermarket Technology Corp.* | 60,675 | |||||||||
| 953 | Ambassadors Group, Inc. | 31,945 | |||||||||
| 2,790 | Ameristar Casinos, Inc. | 84,704 | |||||||||
| 3,551 | Applebee's International, Inc. | 96,516 | |||||||||
| 729 | Arbitron, Inc. | 35,925 | |||||||||
| 2,406 | Arctic Cat, Inc. | 42,827 | |||||||||
| 541 | Avatar Holdings, Inc.* | 40,613 | |||||||||
| 2,676 | Bally Technologies, Inc.* | 62,618 | |||||||||
| 1,052 | Bandag, Inc. | 53,063 | |||||||||
| 1,090 | Bandag, Inc., Class A | 54,805 | |||||||||
| 2,295 | Bebe Stores, Inc. | 40,163 | |||||||||
| 1,669 | Big 5 Sporting Goods Corp. | 42,726 | |||||||||
| 774 | BJ's Restaurants, Inc.* | 15,937 | |||||||||
| 328 | Blue Nile, Inc.* | 15,436 | |||||||||
| 4,464 | Bluegreen Corp.* | 49,327 | |||||||||
| 5,893 | Blyth, Inc. | 153,807 | |||||||||
| 3,172 | Bob Evans Farms, Inc. | 116,412 | |||||||||
| 1,134 | Bright Horizons Family Solutions, Inc.* | 43,795 | |||||||||
| 3,543 | Brookfield Homes Corp. | 120,320 | |||||||||
| 3,188 | Brown Shoe Co., Inc. | 86,012 | |||||||||
| 1,400 | Buckle (The), Inc. | 49,868 | |||||||||
| 4,787 | Building Material Holding Corp. | 69,507 | |||||||||
| 7,797 | Cabela's, Inc., Class A* | 184,944 | |||||||||
| 1,201 | California Pizza Kitchen, Inc.* | 40,125 | |||||||||
| 6,658 | Callaway Golf Co. | 119,578 | |||||||||
| 2,080 | Carmike Cinemas, Inc. | 51,958 | |||||||||
| 2,721 | Carter's, Inc.* | 71,290 | |||||||||
| 1,761 | Catalina Marketing Corp. | 55,824 | |||||||||
| 3,174 | Cato (The) Corp., Class A | 68,590 | |||||||||
| 2,135 | CEC Entertainment, Inc.* | 88,965 | |||||||||
| 833 | Central European Media Enterprises Ltd., Class A (Bermuda)* | 75,087 | |||||||||
| 8,457 | Champion Enterprises, Inc.* | 86,938 | |||||||||
| 1,396 | Charlotte Russe Holding, Inc.* | 38,153 | |||||||||
| 2,827 | Cheesecake Factory (The), Inc.* | 78,025 | |||||||||
| 6,077 | Chico's FAS, Inc.* | 160,189 | |||||||||
| 1,665 | Children's Place Retail Stores (The), Inc.* | 88,029 | |||||||||
| 696 | Chipotle Mexican Grill, Inc., Class A* | 45,400 | |||||||||
| 1,060 | Choice Hotels International, Inc. | 39,898 | |||||||||
| 1,704 | Christopher & Banks Corp. | 29,496 | |||||||||
| 1,119 | Churchill Downs, Inc. | 52,246 | |||||||||
| 12,750 | Citadel Broadcasting Corp. | 117,045 | |||||||||
| 4,378 | CKE Restaurants, Inc. | 88,917 | |||||||||
| 1,623 | CKX, Inc.* | 16,928 | |||||||||
| 1,526 | Coinstar, Inc.* | 47,443 | |||||||||
| Number of Shares | Value | ||||||||||
| Common Stocks (Continued) | |||||||||||
| 2,860 | Coldwater Creek, Inc.* | $ | 59,202 | ||||||||
| 2,155 | Columbia Sportswear Co. | 134,903 | |||||||||
| 1,977 | Conn's, Inc.* | 51,303 | |||||||||
| 5,554 | Corinthian Colleges, Inc.* | 76,812 | |||||||||
| 6,374 | Cost Plus, Inc.* | 62,147 | |||||||||
| 654 | Courier Corp. | 26,029 | |||||||||
| 9,534 | Cox Radio, Inc., Class A* | 134,620 | |||||||||
| 87 | CROCS, Inc.* | 4,862 | |||||||||
| 3,881 | Crown Media Holdings, Inc., Class A* | 22,199 | |||||||||
| 1,150 | CSS Industries, Inc. | 45,885 | |||||||||
| 2,415 | CTC Media, Inc.* | 62,983 | |||||||||
| 7,005 | Cumulus Media, Inc., Class A* | 65,777 | |||||||||
| 2,118 | DEB Shops, Inc. | 58,287 | |||||||||
| 379 | Deckers Outdoor Corp.* | 28,702 | |||||||||
| 1,116 | dELiA*s, Inc.* | 9,609 | |||||||||
| 3,394 | DeVry, Inc. | 111,968 | |||||||||
| 2,412 | Dick's Sporting Goods, Inc.* | 135,289 | |||||||||
| 3,796 | Domino's Pizza, Inc.* | 122,421 | |||||||||
| 4,122 | DreamWorks Animation SKG, Inc., Class A* | 120,692 | |||||||||
| 3,311 | Dress Barn, Inc.* | 65,922 | |||||||||
| 1,372 | Drew Industries, Inc.* | 39,472 | |||||||||
| 1,749 | DSW, Inc., Class A* | 67,791 | |||||||||
| 3,456 | Educate, Inc.* | 26,404 | |||||||||
| 11,177 | Emmis Communications Corp., Class A* | 111,658 | |||||||||
| 3,881 | Entercom Communications Corp., Class A | 107,659 | |||||||||
| 10,269 | Entravision Communications Corp., Class A* | 100,739 | |||||||||
| 3,396 | Ethan Allen Interiors, Inc. | 119,879 | |||||||||
| 4,557 | Finish Line (The), Inc., Class A | 60,107 | |||||||||
| 558 | Fisher Communications, Inc.* | 27,074 | |||||||||
| 8,569 | Fleetwood Enterprises, Inc.* | 71,380 | |||||||||
| 3,633 | Fossil, Inc.* | 102,342 | |||||||||
| 5,133 | Fred's, Inc. | 74,121 | |||||||||
| 1,665 | Gaylord Entertainment Co.* | 91,242 | |||||||||
| 21,320 | Gemstar-TV Guide International, Inc.* | 94,661 | |||||||||
| 2,166 | Genesco, Inc.* | 109,773 | |||||||||
| 6,811 | Gentex Corp. | 121,236 | |||||||||
| 6,176 | Gray Television, Inc. | 65,898 | |||||||||
| 982 | GSI Commerce, Inc.* | 21,702 | |||||||||
| 1,635 | Guess?, Inc. | 64,419 | |||||||||
| 2,385 | Guitar Center, Inc.* | 110,426 | |||||||||
| 1,462 | Gymboree (The) Corp.* | 55,819 | |||||||||
| 4,008 | Harte-Hanks, Inc. | 104,609 | |||||||||
| 3,554 | Haverty Furniture Cos., Inc. | 45,349 | |||||||||
| 2,767 | Helen of Troy Ltd. (Bermuda)* | 62,811 | |||||||||
| 1,015 | Hibbett Sports, Inc.* | 29,587 | |||||||||
| 5,042 | HOT Topic, Inc.* | 56,924 | |||||||||
| 597 | Iconix Brand Group, Inc.* | 12,018 | |||||||||
| 1,069 | IHOP Corp. | �� | 62,985 | ||||||||
| 4,648 | Interactive Data Corp. | 133,072 | |||||||||
| 2,290 | International Speedway Corp., Class A | 113,126 | |||||||||
| 4,512 | Isle of Capri Casinos, Inc.* | 110,273 | |||||||||
| 919 | ITT Educational Services, Inc.* | 89,336 | |||||||||
See Notes to Financial Statements.
30
Schedule of Investments (Continued)
PowerShares FTSE RAFI US 1500 Small-Mid Portfolio
April 30, 2007
| Number of Shares | Value | ||||||||||
| Common Stocks (Continued) | |||||||||||
| 289 | J Crew Group, Inc.* | $ | 11,702 | ||||||||
| 1,269 | Jackson Hewitt Tax Service, Inc. | 34,999 | |||||||||
| 2,684 | JAKKS Pacific, Inc.* | 64,497 | |||||||||
| 3,731 | Jarden Corp.* | 157,224 | |||||||||
| 5,370 | Jo-Ann Stores, Inc.* | 160,831 | |||||||||
| 2,564 | John Wiley & Sons, Inc., Class A | 96,022 | |||||||||
| 1,074 | Jos. A. Bank Clothiers, Inc.* | 41,499 | |||||||||
| 9,099 | Journal Communications, Inc., Class A | 122,746 | |||||||||
| 6,710 | Journal Register Co. | 39,388 | |||||||||
| 6,948 | K2, Inc.* | 104,845 | |||||||||
| 1,692 | Kenneth Cole Productions, Inc., Class A | 42,825 | |||||||||
| 1,101 | Keystone Automotive Industries, Inc.* | 36,619 | |||||||||
| 5,088 | Kimball International, Inc., Class B | 91,584 | |||||||||
| 4,485 | Krispy Kreme Doughnuts, Inc.* | 43,639 | |||||||||
| 1,568 | K-Swiss, Inc., Class A | 45,284 | |||||||||
| 2,898 | Landry's Restaurants, Inc. | 86,071 | |||||||||
| 1,897 | Laureate Education, Inc.* | 112,018 | |||||||||
| 6,436 | Leapfrog Enterprises, Inc.* | 70,539 | |||||||||
| 4,440 | Lee Enterprises, Inc. | 116,239 | |||||||||
| 2,740 | Levitt Corp., Class A | 23,263 | |||||||||
| 1,052 | Life Time Fitness, Inc.* | 54,073 | |||||||||
| 7,928 | Lin TV Corp., Class A* | 126,531 | |||||||||
| 3,997 | Lithia Motors, Inc., Class A | 107,719 | |||||||||
| 2,096 | LKQ Corp.* | 47,328 | |||||||||
| 2,906 | M/I Homes, Inc. | 86,395 | |||||||||
| 2,748 | Marcus Corp. | 59,714 | |||||||||
| 2,164 | Marine Products Corp. | 19,065 | |||||||||
| 967 | Martha Stewart Living Omnimedia, Inc., Class A | 18,383 | |||||||||
| 2,570 | Marvel Entertainment, Inc.* | 75,892 | |||||||||
| 1,400 | Matthews International Corp., Class A | 59,024 | |||||||||
| 3,249 | Media General, Inc., Class A | 119,368 | |||||||||
| 17,273 | Mediacom Communications Corp., Class A* | 149,066 | |||||||||
| 3,079 | Men's Wearhouse (The), Inc. | 133,228 | |||||||||
| 4,951 | Modine Manufacturing Co. | 114,517 | |||||||||
| 4,018 | Monaco Coach Corp. | 61,596 | |||||||||
| 392 | Morningstar, Inc.* | 20,411 | |||||||||
| 2,449 | MTR Gaming Group, Inc.* | 39,160 | |||||||||
| 3,392 | Multimedia Games, Inc.* | 37,990 | |||||||||
| 532 | National Presto Industries, Inc. | 31,436 | |||||||||
| 3,276 | Nautilus, Inc. | 45,242 | |||||||||
| 1,874 | NetFlix, Inc.* | 41,547 | |||||||||
| 4,795 | New York & Co., Inc.* | 66,986 | |||||||||
| 212 | NutriSystem, Inc.* | 13,144 | |||||||||
| 3,056 | Oakley, Inc. | 73,741 | |||||||||
| 3,321 | O'Charleys, Inc.* | 70,106 | |||||||||
| 1,101 | Orient-Express Hotels Ltd., Class A (Bermuda) | 57,968 | |||||||||
| 934 | Overstock.com, Inc.* | 16,765 | |||||||||
| 1,296 | Oxford Industries, Inc. | 60,160 | |||||||||
| 6,628 | Pacific Sunwear of California, Inc.* | 138,724 | |||||||||
| 3,623 | Palm Harbor Homes, Inc.* | 53,802 | |||||||||
| Number of Shares | Value | ||||||||||
| Common Stocks (Continued) | |||||||||||
| 879 | Panera Bread Co., Class A* | $ | 48,952 | ||||||||
| 2,533 | Papa John's International, Inc.* | 77,788 | |||||||||
| 2,861 | Penn National Gaming, Inc.* | 138,301 | |||||||||
| 1,280 | PF Chang's China Bistro, Inc.* | 48,960 | |||||||||
| 2,030 | Phillips-Van Heusen Corp. | 113,477 | |||||||||
| 2,227 | Pinnacle Entertainment, Inc.* | 62,534 | |||||||||
| 2,160 | Pool Corp. | 86,681 | |||||||||
| 694 | Pre-Paid Legal Services, Inc. | 39,593 | |||||||||
| 1,341 | Priceline.com, Inc.* | 74,613 | |||||||||
| 35,831 | PRIMEDIA, Inc.* | 89,578 | |||||||||
| 9,015 | Quiksilver, Inc.* | 119,900 | |||||||||
| 566 | R.H. Donnelley Corp.* | 44,199 | |||||||||
| 13,545 | Radio One, Inc., Class D* | 95,628 | |||||||||
| 2,575 | Rare Hospitality International, Inc.* | 74,984 | |||||||||
| 1,421 | RC2 Corp.* | 56,641 | |||||||||
| 1,414 | RCN Corp.* | 38,206 | |||||||||
| 985 | Red Robin Gourmet Burgers, Inc.* | 39,006 | |||||||||
| 3,291 | Regis Corp. | 125,815 | |||||||||
| 3,260 | Ruby Tuesday, Inc. | 87,238 | |||||||||
| 6,671 | Russ Berrie & Co., Inc. | 100,265 | |||||||||
| 2,917 | Salem Communications Corp., Class A* | 33,604 | |||||||||
| 2,856 | Sauer-Danfoss, Inc. | 85,166 | |||||||||
| 2,761 | Scientific Games Corp., Class A* | 91,914 | |||||||||
| 3,957 | Sealy Corp. | 67,467 | |||||||||
| 2,053 | Select Comfort Corp.* | 38,063 | |||||||||
| 639 | Shuffle Master, Inc.* | 10,882 | |||||||||
| 7,346 | Sinclair Broadcast Group, Inc., Class A | 119,960 | |||||||||
| 2,264 | Skechers U.S.A., Inc., Class A* | 71,090 | |||||||||
| 1,038 | Skyline Corp. | 34,098 | |||||||||
| 518 | Smith & Wesson Holding Corp.* | 7,107 | |||||||||
| 3,605 | Sonic Corp.* | 80,896 | |||||||||
| 1,182 | Sotheby's | 61,015 | |||||||||
| 8,015 | Source Interlink Cos., Inc.* | 51,857 | |||||||||
| 2,597 | Speedway Motorsports, Inc. | 100,764 | |||||||||
| 3,505 | Stage Stores, Inc. | 77,285 | |||||||||
| 1,723 | Stamps.com, Inc.* | 24,312 | |||||||||
| 3,217 | Steak n Shake (The) Co.* | 52,019 | |||||||||
| 4,732 | Stein Mart, Inc. | 77,132 | |||||||||
| 701 | Steiner Leisure Ltd. (Bahamas)* | 33,984 | |||||||||
| 918 | Steven Madden Ltd.* | 27,311 | |||||||||
| 9,139 | Stewart Enterprises, Inc., Class A | 68,725 | |||||||||
| 252 | Strayer Education, Inc. | 31,334 | |||||||||
| 3,103 | Stride Rite (The) Corp. | 43,752 | |||||||||
| 4,315 | Superior Industries International, Inc. | 98,598 | |||||||||
| 3,448 | Systemax, Inc.* | 58,719 | |||||||||
| 3,115 | Tarragon Corp. | 31,181 | |||||||||
| 15,360 | Technical Olympic USA, Inc. | 67,123 | |||||||||
| 3,788 | Tempur-Pedic International, Inc. | 98,374 | |||||||||
| 2,545 | Texas Roadhouse, Inc., Class A* | 37,208 | |||||||||
| 2,547 | Thor Industries, Inc. | 101,447 | |||||||||
| 2,275 | Tractor Supply Co.* | 117,709 | |||||||||
| 787 | Triarc Cos., Inc., Class A | 13,930 | |||||||||
See Notes to Financial Statements.
31
Schedule of Investments (Continued)
PowerShares FTSE RAFI US 1500 Small-Mid Portfolio
April 30, 2007
| Number of Shares | Value | ||||||||||
| Common Stocks (Continued) | |||||||||||
| 1,735 | Triarc Cos., Inc., Class B | $ | 28,228 | ||||||||
| 7,601 | Trump Entertainment Resorts, Inc.* | 123,364 | |||||||||
| 3,963 | Tuesday Morning Corp. | 55,323 | |||||||||
| 1,992 | Tween Brands, Inc.* | 78,007 | |||||||||
| 423 | Under Armour, Inc., Class A* | 21,362 | |||||||||
| 1,475 | UniFirst Corp. | 62,068 | |||||||||
| 947 | Universal Technical Institute, Inc.* | 23,741 | |||||||||
| 3,803 | Urban Outfitters, Inc.* | 97,965 | |||||||||
| 1,914 | Vail Resorts, Inc.* | 109,136 | |||||||||
| 5,835 | Valassis Communications, Inc.* | 111,799 | |||||||||
| 2,854 | ValueVision Media, Inc., Class A* | 32,279 | |||||||||
| 550 | Vertrue, Inc.* | 26,026 | |||||||||
| 406 | Volcom, Inc.* | 17,056 | |||||||||
| 4,307 | Warnaco Group (The), Inc.* | 121,802 | |||||||||
| 2,138 | Weight Watchers International, Inc. | 102,603 | |||||||||
| 3,346 | West Marine, Inc.* | 49,186 | |||||||||
| 13,435 | Westwood One, Inc. | 91,492 | |||||||||
| 1,958 | Winnebago Industries, Inc. | 62,773 | |||||||||
| 1,116 | WMS Industries, Inc.* | 44,484 | |||||||||
| 2,991 | Wolverine World Wide, Inc. | 85,483 | |||||||||
| 1,028 | Wynn Resorts Ltd.* | 105,072 | |||||||||
| 389 | Zumiez, Inc.* | 15,350 | |||||||||
| 15,713,191 | |||||||||||
| Consumer Staples—3.2% | |||||||||||
| 390 | Alico, Inc. | 22,819 | |||||||||
| 11,138 | Alliance One International, Inc.* | 109,264 | |||||||||
| 1,284 | Andersons (The), Inc. | 59,642 | |||||||||
| 2,744 | Bare Escentuals, Inc.* | 110,940 | |||||||||
| 4,785 | Casey's General Stores, Inc. | 120,343 | |||||||||
| 1,899 | Central European Distribution Corp.* | 56,495 | |||||||||
| 2,405 | Central Garden & Pet Co.* | 35,618 | |||||||||
| 5,170 | Central Garden and Pet Co., Class A* | 74,034 | |||||||||
| 634 | Chattem, Inc.* | 36,227 | |||||||||
| 2,598 | Church & Dwight Co., Inc. | 131,797 | |||||||||
| 1,144 | Delta & Pine Land Co. | 47,179 | |||||||||
| 3,242 | Elizabeth Arden, Inc.* | 72,977 | |||||||||
| 1,513 | Farmer Bros. Co. | 32,454 | |||||||||
| 3,909 | Flowers Foods, Inc. | 121,922 | |||||||||
| 2,289 | Hain Celestial Group, Inc.* | 68,739 | |||||||||
| 657 | Hansen Natural Corp.* | 25,097 | |||||||||
| 3,656 | Herbalife Ltd. (Cayman Islands) | 146,568 | |||||||||
| 885 | J&J Snack Foods Corp. | 34,488 | |||||||||
| 3,189 | Lancaster Colony Corp. | 134,671 | |||||||||
| 3,336 | Lance, Inc. | 73,826 | |||||||||
| 6,097 | Nu Skin Enterprises, Inc., Class A | 105,661 | |||||||||
| 5,177 | Playtex Products, Inc.* | 78,794 | |||||||||
| 3,864 | Premium Standard Farms, Inc. | 83,772 | |||||||||
| 3,711 | Prestige Brands Holdings, Inc.* | 48,280 | |||||||||
| 1,751 | Ralcorp Holdings, Inc.* | 115,233 | |||||||||
| 1,340 | Reddy Ice Holdings, Inc. | 39,249 | |||||||||
| 14,938 | Revlon, Inc., Class A* | 19,270 | |||||||||
| Number of Shares | Value | ||||||||||
| Common Stocks (Continued) | |||||||||||
| 2,382 | Sanderson Farms, Inc. | $ | 94,160 | ||||||||
| 5,272 | Smart & Final, Inc.* | 114,719 | |||||||||
| 2,846 | Tootsie Roll Industries, Inc. | 82,506 | |||||||||
| 3,522 | Topps (The) Co., Inc. | 34,903 | |||||||||
| 2,958 | TreeHouse Foods, Inc.* | 89,154 | |||||||||
| 3,073 | United Natural Foods, Inc.* | 95,847 | |||||||||
| 349 | USANA Health Sciences, Inc.* | 13,904 | |||||||||
| 5,953 | Vector Group Ltd. | 108,642 | |||||||||
| 1,351 | WD-40 Co. | 46,718 | |||||||||
| 2,972 | Wild Oats Markets, Inc.* | 53,585 | |||||||||
| 2,739,497 | |||||||||||
| Energy—7.7% | |||||||||||
| 3,371 | Alon USA Energy, Inc. | 126,075 | |||||||||
| 4,151 | Alpha Natural Resources, Inc.* | 72,103 | |||||||||
| 164 | APCO Argentina, Inc. (Cayman Islands) | 15,703 | |||||||||
| 681 | Atlas America, Inc.* | 40,649 | |||||||||
| 546 | ATP Oil & Gas Corp.* | 23,729 | |||||||||
| 864 | Atwood Oceanics, Inc.* | 54,346 | |||||||||
| 4,980 | Aventine Renewable Energy Holdings* | 95,666 | |||||||||
| 1,724 | Basic Energy Services, Inc.* | 44,565 | |||||||||
| 1,895 | Berry Petroleum Co., Class A | 64,544 | |||||||||
| 2,163 | Bill Barrett Corp.* | 79,815 | |||||||||
| 3,185 | Bois d'Arc Energy, Inc.* | 47,679 | |||||||||
| 5,000 | Brigham Exploration Co.* | 30,300 | |||||||||
| 2,191 | Bristow Group, Inc.* | 82,382 | |||||||||
| 1,240 | Bronco Drilling Co., Inc.* | 22,419 | |||||||||
| 2,972 | Cabot Oil & Gas Corp. | 108,240 | |||||||||
| 946 | CARBO Ceramics, Inc. | 41,104 | |||||||||
| 645 | Carrizo Oil & Gas, Inc.* | 23,768 | |||||||||
| 481 | Cheniere Energy, Inc.* | 16,041 | |||||||||
| 1,231 | Clayton Williams Energy, Inc.* | 33,065 | |||||||||
| 4,900 | Complete Production Services, Inc.* | 117,943 | |||||||||
| 3,275 | Comstock Resources, Inc.* | 92,846 | |||||||||
| 1,160 | Copano Energy LLC | 45,310 | |||||||||
| 540 | Core Laboratories N.V. (Netherlands)* | 49,097 | |||||||||
| 1,898 | Crosstex Energy, Inc. | 57,035 | |||||||||
| 4,449 | Delek US Holdings Inc. | 84,842 | |||||||||
| 1,388 | Delta Petroleum Corp.* | 30,106 | |||||||||
| 4,645 | Denbury Resources, Inc.* | 153,702 | |||||||||
| 1,022 | Dril-Quip, Inc.* | 51,611 | |||||||||
| 446 | Enbridge Energy Management LLC* | 25,868 | |||||||||
| 3,657 | Encore Acquisition Co.* | 97,678 | |||||||||
| 3,273 | Energy Partners Ltd.* | 54,692 | |||||||||
| 4,871 | EXCO Resources, Inc.* | 81,784 | |||||||||
| 3,802 | Gasco Energy, Inc.* | 6,844 | |||||||||
| 3,185 | General Maritime Corp. (Marshall Islands) | 102,143 | |||||||||
| 1,792 | Giant Industries, Inc.* | 134,346 | |||||||||
| 4,856 | Global Industries, Ltd.* | 100,811 | |||||||||
| 376 | Goodrich Petroleum Corp.* | 13,209 | |||||||||
| 10,615 | Grey Wolf, Inc.* | 76,003 | |||||||||
| 1,035 | GulfMark Offshore, Inc.* | 49,577 | |||||||||
See Notes to Financial Statements.
32
Schedule of Investments (Continued)
PowerShares FTSE RAFI US 1500 Small-Mid Portfolio
April 30, 2007
| Number of Shares | Value | ||||||||||
| Common Stocks (Continued) | |||||||||||
| 5,361 | Harvest Natural Resources, Inc.* | $ | 53,878 | ||||||||
| 3,068 | Helix Energy Solutions Group, Inc.* | 117,382 | |||||||||
| 4,757 | Helmerich & Payne, Inc. | 153,603 | |||||||||
| 1,061 | Hercules Offshore, Inc. | 33,347 | |||||||||
| 2,017 | Holly Corp. | 128,281 | |||||||||
| 1,812 | Horizon Offshore, Inc.* | 28,992 | |||||||||
| 1,658 | Hornbeck Offshore Services, Inc.* | 52,443 | |||||||||
| 546 | Hydril* | 52,864 | |||||||||
| 2,466 | Input/Output, Inc.* | 34,499 | |||||||||
| 16,275 | International Coal Group, Inc.* | 90,977 | |||||||||
| 1,956 | Kinder Morgan Management LLC* | 103,968 | |||||||||
| 4,656 | Knightsbridge Tankers Ltd. (Bermuda) | 135,769 | |||||||||
| 1,981 | Lone Star Technologies, Inc.* | 131,558 | |||||||||
| 689 | Lufkin Industries, Inc. | 42,870 | |||||||||
| 4,760 | Mariner Energy, Inc.* | 107,338 | |||||||||
| 24,815 | Meridian Resource (The) Corp.* | 64,767 | |||||||||
| 8,851 | Newpark Resources, Inc.* | 72,755 | |||||||||
| 2,453 | Nordic American Tanker Shipping (Bermuda) | 94,490 | |||||||||
| 2,412 | Oceaneering International, Inc.* | 114,666 | |||||||||
| 3,695 | Oil States International, Inc.* | 125,371 | |||||||||
| 4,447 | OMI Corp. (Marshall Islands) | 129,274 | |||||||||
| 131 | Pacific Ethanol, Inc.* | 1,939 | |||||||||
| 661 | Parallel Petroleum Corp.* | 15,276 | |||||||||
| 7,810 | Parker Drilling Co.* | 84,817 | |||||||||
| 834 | Penn Virginia Corp. | 66,762 | |||||||||
| 3,838 | PetroHawk Energy Corp.* | 55,459 | |||||||||
| 658 | Petroleum Development Corp.* | 34,216 | |||||||||
| 2,230 | PetroQuest Energy, Inc.* | 25,467 | |||||||||
| 1,893 | Pioneer Drilling Co.* | 25,953 | |||||||||
| 2,911 | Plains Exploration & Production Co.* | 136,788 | |||||||||
| 1,524 | Quicksilver Resources, Inc.* | 63,795 | |||||||||
| 2,544 | Range Resources Corp. | 92,983 | |||||||||
| 244 | Rentech, Inc.* | 586 | |||||||||
| 5,135 | Rosetta Resources Inc.* | 110,454 | |||||||||
| 2,609 | RPC, Inc. | 43,022 | |||||||||
| 2,403 | St. Mary Land & Exploration Co. | 87,998 | |||||||||
| 3,222 | Superior Energy Services, Inc.* | 117,055 | |||||||||
| 2,479 | Swift Energy Co.* | 100,771 | |||||||||
| 2,190 | TETRA Technologies, Inc.* | 58,013 | |||||||||
| 2,386 | Todco* | 108,468 | |||||||||
| 464 | Toreador Resources Corp.* | 7,433 | |||||||||
| 1,739 | Tsakos Energy Navigation Ltd. (Bermuda) | 99,384 | |||||||||
| 1,654 | Ultra Petroleum Corp. (Canada)* | 93,815 | |||||||||
| 2,522 | Unit Corp.* | 144,132 | |||||||||
| 1,853 | Universal Compression Holdings, Inc.* | 123,354 | |||||||||
| 2,101 | VeraSun Energy Corp.* | 41,873 | |||||||||
| 3,861 | W&T Offshore, Inc. | 117,181 | |||||||||
| 1,565 | Warren Resources, Inc.* | 20,674 | |||||||||
| 3,989 | Western Refining, Inc. | 158,043 | |||||||||
| 1,532 | W-H Energy Services, Inc.* | 82,897 | |||||||||
| 2,998 | Whiting Petroleum Corp.* | 131,972 | |||||||||
| 6,567,312 | |||||||||||
| Number of Shares | Value | ||||||||||
| Common Stocks (Continued) | |||||||||||
| Financials—21.1% | |||||||||||
| 1,691 | 1st Source Corp. | $ | 41,835 | ||||||||
| 5,216 | 21st Century Insurance Group | 108,545 | |||||||||
| 1,525 | Acadia Realty Trust | 40,992 | |||||||||
| 4,183 | Accredited Home Lenders Holding Co.* | 48,857 | |||||||||
| 7,394 | Advance America Cash Advance Centers, Inc. | 126,733 | |||||||||
| 432 | Advanta Corp., Class A | 18,256 | |||||||||
| 1,134 | Advanta Corp., Class B | 51,960 | |||||||||
| 1,200 | Affiliated Managers Group, Inc.* | 141,156 | |||||||||
| 3,464 | Affordable Residential Communities, Inc.* | 40,633 | |||||||||
| 987 | Alabama National BanCorp. | 61,806 | |||||||||
| 30 | Alexander's, Inc.* | 11,520 | |||||||||
| 1,059 | Alexandria Real Estate Equities, Inc. | 112,095 | |||||||||
| 6,159 | Alfa Corp. | 110,492 | |||||||||
| 1,937 | AMCORE Financial, Inc. | 55,418 | |||||||||
| 4,012 | American Equity Investment Life Holding Co. | 54,764 | |||||||||
| 1,732 | Anchor BanCorp Wisconsin, Inc. | 46,625 | |||||||||
| 9,897 | Anthracite Capital, Inc. | 114,805 | |||||||||
| 9,086 | Anworth Mortgage Asset Corp. | 87,226 | |||||||||
| 2,469 | Apollo Investment Corp. | 54,244 | |||||||||
| 2,335 | Ares Capital Corp. | 41,937 | |||||||||
| 2,130 | Argonaut Group, Inc.* | 71,589 | |||||||||
| 1,113 | Arrow Financial Corp. | 24,709 | |||||||||
| 2,936 | Ashford Hospitality Trust, Inc. | 35,232 | |||||||||
| 1,931 | Asset Acceptance Capital Corp.* | 35,569 | |||||||||
| 4,374 | Assured Guaranty Ltd. (Bermuda) | 123,391 | |||||||||
| 1,803 | Baldwin & Lyons, Inc., Class B | 44,408 | |||||||||
| 878 | BancFirst Corp. | 37,587 | |||||||||
| 4,324 | Bank Mutual Corp. | 50,980 | |||||||||
| 1,193 | Bank of Granite Corp. | 19,243 | |||||||||
| 706 | Bank of the Ozarks, Inc. | 20,806 | |||||||||
| 1,916 | BankUnited Financial Corp., Class A | 41,481 | |||||||||
| 718 | Banner Corp. | 26,796 | |||||||||
| 1,911 | BioMed Realty Trust, Inc. | 54,865 | |||||||||
| 1,661 | Boston Private Financial Holdings, Inc. | 46,192 | |||||||||
| 2,656 | Bristol West Holdings, Inc. | 58,857 | |||||||||
| 6,106 | Brookline Bancorp, Inc. | 72,784 | |||||||||
| 4,109 | Brown & Brown, Inc. | 105,807 | |||||||||
| 1,064 | Cadence Financial Corp. | 20,216 | |||||||||
| 2,125 | Calamos Asset Management, Inc., Class A | 49,853 | |||||||||
| 528 | Camden National Corp. | 20,914 | |||||||||
| 1,150 | Capital City Bank Group, Inc. | 34,282 | |||||||||
| 132 | Capital Southwest Corp. | 20,434 | |||||||||
| 3,606 | CapitalSource, Inc. | 92,927 | |||||||||
| 946 | Capitol Bancorp Ltd. | 28,522 | |||||||||
| 3,344 | Capitol Federal Financial | 129,145 | |||||||||
| 651 | Cascade Bancorp | 13,957 | |||||||||
| 1,232 | Cash America International, Inc. | 53,173 | |||||||||
| 2,427 | Cathay General Bancorp | 79,581 | |||||||||
| 523 | CBOT Holdings, Inc., Class A* | 98,674 | |||||||||
| 1,720 | Cedar Shopping Centers, Inc. | 27,468 | |||||||||
| 3,977 | Centennial Bank Holdings, Inc.* | 34,839 | |||||||||
See Notes to Financial Statements.
33
Schedule of Investments (Continued)
PowerShares FTSE RAFI US 1500 Small-Mid Portfolio
April 30, 2007
| Number of Shares | Value | ||||||||||
| Common Stocks (Continued) | |||||||||||
| 1,749 | Central Pacific Financial Corp. | $ | 60,096 | ||||||||
| 2,758 | Chemical Financial Corp. | 73,721 | |||||||||
| 3,424 | Chittenden Corp. | 99,501 | |||||||||
| 5,972 | Citizens Banking Corp. | 119,500 | |||||||||
| 2,143 | Citizens, Inc.* | 16,415 | |||||||||
| 949 | City Bank | 29,618 | |||||||||
| 1,089 | City Holding Co. | 41,349 | |||||||||
| 2,611 | CNA Surety Corp. | 53,891 | |||||||||
| 926 | CoBiz, Inc. | 16,983 | |||||||||
| 491 | Cohen & Steers, Inc. | 25,193 | |||||||||
| 681 | Columbia Banking System, Inc. | 20,668 | |||||||||
| 2,990 | Community Bank System, Inc. | 61,295 | |||||||||
| 1,724 | Community Banks, Inc. | 40,738 | |||||||||
| 1,169 | Community Trust Bancorp, Inc. | 38,881 | |||||||||
| 3,184 | CompuCredit Corp.* | 115,133 | |||||||||
| 1,611 | Corporate Office Properties Trust | 75,894 | |||||||||
| 5,117 | Corus Bankshares, Inc. | 86,017 | |||||||||
| 4,847 | Crawford & Co., Class A | 30,972 | |||||||||
| 6,203 | Crawford & Co., Class B | 39,761 | |||||||||
| 2,093 | Credit Acceptance Corp.* | 56,176 | |||||||||
| 5,733 | CVB Financial Corp. | 68,051 | |||||||||
| 3,243 | Deerfield Triarc Capital Corp. | 52,504 | |||||||||
| 2,650 | Delphi Financial Group, Inc., Class A | 113,155 | |||||||||
| 2,073 | DiamondRock Hospitality Co. | 37,915 | |||||||||
| 937 | Digital Realty Trust, Inc. | 37,902 | |||||||||
| 4,172 | Dime Community Bancshares, Inc. | 55,529 | |||||||||
| 808 | Dollar Financial Corp.* | 23,545 | |||||||||
| 1,976 | East West Bancorp, Inc. | 78,763 | |||||||||
| 1,551 | EastGroup Properties, Inc. | 77,721 | |||||||||
| 3,783 | Eaton Vance Corp. | 144,587 | |||||||||
| 1,861 | Encore Capital Group, Inc.* | 22,183 | |||||||||
| 104 | Enstar Group Ltd. (Bermuda)* | 10,816 | |||||||||
| 1,529 | Entertainment Properties Trust | 92,382 | |||||||||
| 4,756 | Equity Inns, Inc. | 81,328 | |||||||||
| 1,983 | Extra Space Storage, Inc. | 37,102 | |||||||||
| 832 | Farmers Capital Bank Corp. | 23,837 | |||||||||
| 2,386 | FBL Financial Group, Inc., Class A | 92,434 | |||||||||
| 1,186 | Federal Agricultural Mortgage Corp., Class C | 32,473 | |||||||||
| 5,375 | FelCor Lodging Trust, Inc. | 137,224 | |||||||||
| 17,982 | Fieldstone Investment Corp. | 67,073 | |||||||||
| 1,314 | Financial Federal Corp. | 34,532 | |||||||||
| 1,111 | Financial Institutions, Inc. | 21,376 | |||||||||
| 1,326 | First Acceptance Corp.* | 13,419 | |||||||||
| 1,267 | First BanCorp | 26,392 | |||||||||
| 9,956 | First BanCorp | 124,848 | |||||||||
| 1,398 | First Busey Corp. | 28,114 | |||||||||
| 1,071 | First Cash Financial Services, Inc.* | 24,612 | |||||||||
| 2,676 | First Charter Corp. | 58,711 | |||||||||
| 588 | First Citizens BancShares, Inc., Class A | 119,305 | |||||||||
| 8,280 | First Commonwealth Financial Corp. | 92,156 | |||||||||
| 950 | First Community Bancorp | 52,117 | |||||||||
| 907 | First Community Bancshares, Inc. | 29,813 | |||||||||
| Number of Shares | Value | ||||||||||
| Common Stocks (Continued) | |||||||||||
| 4,665 | First Financial Bancorp | $ | 69,509 | ||||||||
| 1,266 | First Financial Bankshares, Inc. | 48,994 | |||||||||
| 1,193 | First Financial Corp. | 34,024 | |||||||||
| 1,014 | First Financial Holdings, Inc. | 34,344 | |||||||||
| 1,475 | First Indiana Corp. | 28,645 | |||||||||
| 1,302 | First Marblehead (The) Corp. | 47,198 | |||||||||
| 2,009 | First Merchants Corp. | 43,334 | |||||||||
| 3,059 | First Midwest Bancorp, Inc. | 109,940 | |||||||||
| 7,856 | First Niagara Financial Group, Inc. | 106,842 | |||||||||
| 997 | First Republic Bank | 53,938 | |||||||||
| 1,382 | FirstFed Financial Corp.* | 84,965 | |||||||||
| 9,894 | Flagstar Bancorp, Inc. | 116,749 | |||||||||
| 1,591 | Flushing Financial Corp. | 24,740 | |||||||||
| 6,424 | FNB Corp. | 107,795 | |||||||||
| 1,904 | Forest City Enterprises, Inc., Class A | 127,206 | |||||||||
| 195 | Forest City Enterprises, Inc., Class B | 13,032 | |||||||||
| 5,660 | Franklin Street Properties Corp. | 102,163 | |||||||||
| 1,877 | Frontier Financial Corp. | 46,643 | |||||||||
| 1,598 | GAMCO Investors, Inc., Class A | 72,901 | |||||||||
| 3,114 | Getty Realty Corp. | 89,247 | |||||||||
| 676 | GFI Group, Inc.* | 46,813 | |||||||||
| 2,162 | Glacier Bancorp, Inc. | 46,440 | |||||||||
| 2,077 | GMH Communities Trust | 20,853 | |||||||||
| 915 | Gramercy Capital Corp. | 29,637 | |||||||||
| 4,331 | Great American Financial Resources, Inc. | 106,066 | |||||||||
| 827 | Great Southern Bancorp, Inc. | 22,643 | |||||||||
| 4,489 | Greater Bay Bancorp | 115,771 | |||||||||
| 435 | Greenhill & Co., Inc. | 27,514 | |||||||||
| 1,558 | Hancock Holding Co. | 60,949 | |||||||||
| 2,009 | Hanmi Financial Corp. | 32,968 | |||||||||
| 2,848 | Harleysville Group, Inc. | 86,978 | |||||||||
| 2,730 | Harleysville National Corp. | 46,082 | |||||||||
| 2,156 | Highland Hospitality Corp. | 41,072 | |||||||||
| 1,901 | Hilb, Rogal & Hobbs Co. | 82,598 | |||||||||
| 11,712 | HomeBanc Corp. | 32,794 | |||||||||
| 4,411 | Horace Mann Educators Corp. | 92,807 | |||||||||
| 627 | IBERIABANK Corp. | 32,911 | |||||||||
| 1,917 | Independent Bank Corp. | 31,631 | |||||||||
| 1,133 | Independent Bank Corp. of Massachusetts | 33,650 | |||||||||
| 1,763 | Infinity Property & Casualty Corp. | 81,997 | |||||||||
| 6,824 | Inland Real Estate Corp. | 124,129 | |||||||||
| 4,208 | Innkeepers USA Trust | 73,935 | |||||||||
| 1,728 | Integra Bank Corp. | 39,260 | |||||||||
| 237 | IntercontinentalExchange, Inc.* | 30,099 | |||||||||
| 4,477 | International Bancshares Corp. | 128,714 | |||||||||
| 602 | International Securities Exchange Holdings, Inc. | 40,147 | |||||||||
| 1,873 | Investment Technology Group, Inc.* | 70,874 | |||||||||
| 3,200 | Investors Bancorp, Inc.* | 45,760 | |||||||||
| 1,576 | Investors Financial Services Corp. | 97,523 | |||||||||
| 3,932 | Investors Real Estate Trust | 41,483 | |||||||||
| 4,008 | IPC Holdings Ltd. (Bermuda) | 120,160 | |||||||||
See Notes to Financial Statements.
34
Schedule of Investments (Continued)
PowerShares FTSE RAFI US 1500 Small-Mid Portfolio
April 30, 2007
| Number of Shares | Value | ||||||||||
| Common Stocks (Continued) | |||||||||||
| 3,316 | Irwin Financial Corp. | $ | 53,155 | ||||||||
| 756 | Jones Lang LaSalle, Inc. | 81,262 | |||||||||
| 1,614 | Kansas City Life Insurance Co. | 72,727 | |||||||||
| 2,804 | Kearny Financial Corp. | 39,677 | |||||||||
| 1,611 | Kilroy Realty Corp. | 122,323 | |||||||||
| 3,820 | KKR Financial Corp. | 102,032 | |||||||||
| 1,804 | KNBT Bancorp, Inc. | 27,078 | |||||||||
| 6,565 | Knight Capital Group, Inc., Class A* | 106,353 | |||||||||
| 8,114 | LaBranche & Co., Inc.* | 66,048 | |||||||||
| 1,749 | Lakeland Bancorp, Inc. | 22,807 | |||||||||
| 1,683 | LaSalle Hotel Properties | 78,142 | |||||||||
| 5,657 | Lexington Realty Trust | 118,175 | |||||||||
| 1,552 | LTC Properties, Inc. | 38,909 | |||||||||
| 6,090 | Luminent Mortgage Capital, Inc. | 50,303 | |||||||||
| 2,548 | MAF Bancorp, Inc. | 102,302 | |||||||||
| 2,903 | Maguire Properties, Inc. | 104,595 | |||||||||
| 3,767 | Max Re Capital Ltd. (Bermuda) | 100,956 | |||||||||
| 1,718 | MB Financial, Inc. | 57,708 | |||||||||
| 6,027 | MCG Capital Corp. | 106,196 | |||||||||
| 15,506 | MFA Mortgage Investments, Inc. | 113,194 | |||||||||
| 1,733 | Mid-America Apartment Communities, Inc. | 93,495 | |||||||||
| 1,396 | Midland (The) Co. | 61,270 | |||||||||
| 1,175 | Mid-State Bancshares | 43,428 | |||||||||
| 1,456 | Midwest Banc Holdings, Inc. | 24,563 | |||||||||
| 4,461 | Municipal Mortgage & Equity LLC | 123,347 | |||||||||
| 963 | Nara Bancorp, Inc. | 15,899 | |||||||||
| 2,759 | Nasdaq Stock Market (The), Inc.* | 89,833 | |||||||||
| 1,474 | National Financial Partners Corp. | 67,907 | |||||||||
| 2,849 | National Health Investors, Inc. | 96,638 | |||||||||
| 3,740 | National Penn Bancshares, Inc. | 69,340 | |||||||||
| 5,481 | National Retail Properties, Inc. | 131,270 | |||||||||
| 315 | National Western Life Insurance Co., Class A | 84,326 | |||||||||
| 993 | Navigators Group, Inc.* | 50,732 | |||||||||
| 3,031 | NBT Bancorp, Inc. | 66,530 | |||||||||
| 4,344 | Nelnet, Inc., Class A | 116,810 | |||||||||
| 15,527 | Netbank, Inc. | 30,122 | |||||||||
| 888 | New York Community Bancorp, Inc. | 15,504 | |||||||||
| 5,719 | NewAlliance Bancshares, Inc. | 89,274 | |||||||||
| 2,184 | Northwest Bancorp, Inc. | 59,536 | |||||||||
| 1,390 | OceanFirst Financial Corp. | 23,644 | |||||||||
| 2,439 | Ocwen Financial Corp.* | 34,780 | |||||||||
| 7,467 | Old National Bancorp | 133,510 | |||||||||
| 892 | Old Second Bancorp, Inc. | 26,100 | |||||||||
| 1,324 | Omega Financial Corp. | 37,138 | |||||||||
| 3,479 | Omega Healthcare Investors, Inc. | 58,447 | |||||||||
| 1,341 | optionsXpress Holdings, Inc. | 33,096 | |||||||||
| 3,069 | Oriental Financial Group | 35,508 | |||||||||
| 3,241 | Pacific Capital Bancorp | 87,280 | |||||||||
| 1,337 | Park National Corp. | 118,685 | |||||||||
| 1,421 | Parkway Properties, Inc. | 75,313 | |||||||||
| 3,507 | Partners Trust Financial Group, Inc. | 38,858 | |||||||||
| 515 | Peapack-Gladstone Financial Corp. | 15,862 | |||||||||
| Number of Shares | Value | ||||||||||
| Common Stocks (Continued) | |||||||||||
| 895 | Peoples Bancorp, Inc. | $ | 22,420 | ||||||||
| 1,433 | PFF Bancorp, Inc. | 40,325 | |||||||||
| 2,361 | Philadelphia Consolidated Holding Co.* | 102,467 | |||||||||
| 565 | Pico Holdings, Inc.* | 25,239 | |||||||||
| 197 | Pinnacle Financial Partners, Inc.* | 5,766 | |||||||||
| 1,281 | Piper Jaffray Cos.* | 81,741 | |||||||||
| 3,788 | Platinum Underwriters Holdings Ltd. (Bermuda) | 129,625 | |||||||||
| 5,639 | PMA Capital Corp., Class A* | 52,837 | |||||||||
| 566 | Portfolio Recovery Associates, Inc.* | 31,498 | |||||||||
| 2,964 | Presidential Life Corp. | 56,346 | |||||||||
| 2,455 | Primus Guaranty Ltd. (Bermuda)* | 29,681 | |||||||||
| 638 | PrivateBancorp, Inc. | 20,946 | |||||||||
| 1,760 | ProAssurance Corp.* | 94,758 | |||||||||
| 1,213 | Prosperity Bancshares, Inc. | 42,079 | |||||||||
| 2,772 | Provident Bankshares Corp. | 88,815 | |||||||||
| 4,651 | Provident Financial Services, Inc. | 79,718 | |||||||||
| 2,224 | Provident New York Bancorp | 30,269 | |||||||||
| 1,306 | PS Business Parks, Inc. | 89,983 | |||||||||
| 3,178 | RAIT Financial Trust | 89,461 | |||||||||
| 1,554 | Ramco-Gershenson Properties Trust | 57,498 | |||||||||
| 1,225 | Renasant Corp. | 28,506 | |||||||||
| 920 | Resource America, Inc., Class A | 20,341 | |||||||||
| 1,312 | RLI Corp. | 73,065 | |||||||||
| 2,295 | S&T Bancorp, Inc. | 74,725 | |||||||||
| 762 | S.Y. Bancorp, Inc. | 17,953 | |||||||||
| 1,232 | Safety Insurance Group, Inc. | 49,354 | |||||||||
| 1,127 | Sandy Spring Bancorp, Inc. | 36,357 | |||||||||
| 4,310 | Santander BanCorp | 76,201 | |||||||||
| 1,021 | Saul Centers, Inc. | 53,010 | |||||||||
| 27,142 | Scottish Re Group Ltd. (Cayman Islands)* | 120,239 | |||||||||
| 1,058 | Seacoast Banking Corp. of Florida | 24,218 | |||||||||
| 1,748 | SEI Investments Co. | 106,680 | |||||||||
| 5,298 | Selective Insurance Group | 138,172 | |||||||||
| 1,088 | Signature Bank* | 34,228 | |||||||||
| 1,199 | Simmons First National Corp., Class A | 31,570 | |||||||||
| 1,324 | Sovran Self Storage, Inc. | 73,164 | |||||||||
| 4,080 | Spirit Finance Corp. | 58,711 | |||||||||
| 2,050 | St. Joe (The) Co. | 116,092 | |||||||||
| 2,750 | State Auto Financial Corp. | 82,638 | |||||||||
| 1,717 | Sterling Bancorp | 29,721 | |||||||||
| 3,909 | Sterling Bancshares, Inc. | 44,680 | |||||||||
| 2,062 | Sterling Financial Corp. | 34,332 | |||||||||
| 1,704 | Sterling Financial Corp. of Spokane | 50,234 | |||||||||
| 3,269 | Stewart Information Services Corp. | 131,479 | |||||||||
| 752 | Suffolk Bancorp | 23,658 | |||||||||
| 1,556 | Sun Bancorp, Inc.* | 29,346 | |||||||||
| 3,045 | Sun Communities, Inc. | 90,619 | |||||||||
| 2,456 | Sunstone Hotel Investors, Inc. | 70,045 | |||||||||
| 4,874 | Susquehanna Bancshares, Inc. | 108,593 | |||||||||
| 1,619 | SVB Financial Group* | 82,925 | |||||||||
| 1,424 | SWS Group, Inc. | 37,010 | |||||||||
See Notes to Financial Statements.
35
Schedule of Investments (Continued)
PowerShares FTSE RAFI US 1500 Small-Mid Portfolio
April 30, 2007
| Number of Shares | Value | ||||||||||
| Common Stocks (Continued) | |||||||||||
| 1,566 | Tanger Factory Outlet Centers, Inc. | $ | 63,486 | ||||||||
| 1,866 | Taubman Centers, Inc. | 104,589 | |||||||||
| 207 | Tejon Ranch Co.* | 10,313 | |||||||||
| 1,174 | Texas Capital Bancshares, Inc.* | 23,844 | |||||||||
| 1,011 | TierOne Corp. | 24,557 | |||||||||
| 782 | Tompkins Trustco, Inc. | 30,263 | |||||||||
| 428 | Tower Group, Inc. | 13,135 | |||||||||
| 930 | Tradestation Group, Inc.* | 11,327 | |||||||||
| 1,237 | Triad Guaranty, Inc.* | 54,688 | |||||||||
| 9,257 | Trustco Bank Corp. | 84,887 | |||||||||
| 3,606 | UCBH Holdings, Inc. | 64,764 | |||||||||
| 2,437 | UMB Financial Corp. | 95,335 | |||||||||
| 2,260 | Umpqua Holdings Corp. | 56,364 | |||||||||
| 2,268 | United America Indemnity Ltd., Class A (Cayman Islands)* | 56,655 | |||||||||
| 3,535 | United Bankshares, Inc. | 118,423 | |||||||||
| 1,616 | United Community Banks, Inc. | 47,769 | |||||||||
| 3,386 | United Community Financial Corp. | 34,944 | |||||||||
| 1,914 | United Fire & Casualty Co. | 70,340 | |||||||||
| 3,538 | Universal American Financial Corp.* | 65,665 | |||||||||
| 1,197 | Universal Health Realty Income Trust | 42,158 | |||||||||
| 2,357 | Urstadt Biddle Properties, Inc., Class A | 42,756 | |||||||||
| 1,503 | USB Holding Co., Inc. | 30,406 | |||||||||
| 3,530 | USI Holdings Corp.* | 59,798 | |||||||||
| 2,554 | U-Store-It Trust | 47,019 | |||||||||
| 23,743 | W. Holding Co., Inc. | 114,916 | |||||||||
| 9,272 | W.P. Stewart & Co Ltd. (Bermuda) | 94,853 | |||||||||
| 4,787 | Waddell & Reed Financial, Inc., Class A | 115,941 | |||||||||
| 3,042 | Washington Real Estate Investment Trust | 115,170 | |||||||||
| 994 | Washington Trust Bancorp, Inc. | 25,536 | |||||||||
| 1,206 | Wauwatosa Holdings, Inc.* | 21,117 | |||||||||
| 2,032 | WesBanco, Inc. | 59,599 | |||||||||
| 791 | West Coast Bancorp. | 24,576 | |||||||||
| 2,064 | Westamerica Bancorp | 96,657 | |||||||||
| 756 | Western Alliance Bancorp* | 24,373 | |||||||||
| 780 | Wilshire Bancorp, Inc. | 10,733 | |||||||||
| 1,219 | Wintrust Financial Corp. | 52,393 | |||||||||
| 714 | World Acceptance Corp.* | 30,652 | |||||||||
| 402 | WSFS Financial Corp. | 25,933 | |||||||||
| 2,296 | Zenith National Insurance Corp. | 106,190 | |||||||||
| 18,107,817 | |||||||||||
| Health Care—8.5% | |||||||||||
| 2,261 | Affymetrix, Inc.* | 59,396 | |||||||||
| 4,148 | Albany Molecular Research, Inc.* | 39,862 | |||||||||
| 314 | Align Technology, Inc.* | 7,115 | |||||||||
| 8,089 | Alliance Imaging, Inc.* | 72,801 | |||||||||
| 307 | Allscripts Healthcare Solutions, Inc.* | 8,120 | |||||||||
| 4,767 | Alpharma, Inc., Class A | 115,838 | |||||||||
| 845 | Amedisys, Inc.* | 26,491 | |||||||||
| 2,007 | American Medical Systems Holdings, Inc.* | 35,584 | |||||||||
| 3,911 | AMERIGROUP Corp.* | 110,016 | |||||||||
| Number of Shares | Value | ||||||||||
| Common Stocks (Continued) | |||||||||||
| 1,972 | AMN Healthcare Services, Inc.* | $ | 48,018 | ||||||||
| 2,707 | Amsurg Corp., Class A* | 62,126 | |||||||||
| 774 | Analogic Corp. | 47,446 | |||||||||
| 2,246 | Applera Corp. - Celera Group* | 31,444 | |||||||||
| 2,069 | Arrow International, Inc. | 65,877 | |||||||||
| 705 | ArthroCare Corp.* | 29,088 | |||||||||
| 300 | Aspect Medical Systems, Inc.* | 4,608 | |||||||||
| 1,786 | Bio-Rad Laboratories, Inc., Class A* | 126,395 | |||||||||
| 780 | Biosite, Inc.* | 72,150 | |||||||||
| 1,222 | Brookdale Senior Living, Inc. | 55,491 | |||||||||
| 2,848 | Bruker BioSciences Corp.* | 32,780 | |||||||||
| 2,129 | Cambrex Corp. | 51,650 | |||||||||
| 1,069 | Celgene Corp.* | 65,380 | |||||||||
| 2,856 | Centene Corp.* | 59,433 | |||||||||
| 1,636 | Cephalon, Inc.* | 130,242 | |||||||||
| 2,434 | Cerner Corp.* | 129,586 | |||||||||
| 1,165 | Chemed Corp. | 58,600 | |||||||||
| 477 | Computer Programs & Systems, Inc. | 15,192 | |||||||||
| 2,820 | CONMED Corp.* | 85,502 | |||||||||
| 2,196 | Cooper (The) Cos., Inc. | 112,216 | |||||||||
| 781 | Corvel Corp.* | 21,235 | |||||||||
| 2,095 | Covance, Inc.* | 126,748 | |||||||||
| 3,189 | Cross Country Healthcare, Inc.* | 62,791 | |||||||||
| 322 | Cyberonics, Inc.* | 7,039 | |||||||||
| 2,860 | Cytyc Corp.* | 100,758 | |||||||||
| 1,266 | Datascope Corp. | 46,905 | |||||||||
| 3,335 | Dendrite International, Inc.* | 53,027 | |||||||||
| 184 | Digene Corp.* | 8,436 | |||||||||
| 574 | Dionex Corp.* | 39,606 | |||||||||
| 43 | Diversa Corp.* | 313 | |||||||||
| 861 | DJO, Inc.* | 33,631 | |||||||||
| 983 | Eclipsys Corp.* | 18,421 | |||||||||
| 2,512 | Edwards Lifesciences Corp.* | 123,088 | |||||||||
| 8,043 | Emdeon Corp.* | 129,814 | |||||||||
| 3,748 | Endo Pharmaceuticals Holdings, Inc.* | 115,963 | |||||||||
| 654 | Enzo Biochem, Inc.* | 10,994 | |||||||||
| 1,072 | Enzon Pharmaceuticals, Inc.* | 9,091 | |||||||||
| 2,070 | eResearch Technology, Inc.* | 17,947 | |||||||||
| 4 | ev3, Inc.* | 71 | |||||||||
| 141 | FoxHollow Technologies, Inc.* | 3,143 | |||||||||
| 2,017 | Genesis HealthCare Corp.* | 129,088 | |||||||||
| 1,134 | Gen-Probe, Inc.* | 57,959 | |||||||||
| 5,071 | Gentiva Health Services, Inc.* | 94,929 | |||||||||
| 519 | Geron Corp.* | 3,690 | |||||||||
| 1,409 | Greatbatch, Inc.* | 40,903 | |||||||||
| 1,199 | Haemonetics Corp.* | 57,360 | |||||||||
| 1,197 | HealthExtras, Inc.* | 37,047 | |||||||||
| 1,808 | Healthspring, Inc.* | 42,524 | |||||||||
| 748 | Healthways, Inc.* | 31,730 | |||||||||
| 479 | Hologic, Inc.* | 27,566 | |||||||||
| 622 | ICU Medical, Inc.* | 25,969 | |||||||||
| 602 | Idenix Pharmaceuticals, Inc.* | 4,142 | |||||||||
See Notes to Financial Statements.
36
Schedule of Investments (Continued)
PowerShares FTSE RAFI US 1500 Small-Mid Portfolio
April 30, 2007
| Number of Shares | Value | ||||||||||
| Common Stocks (Continued) | |||||||||||
| 828 | IDEXX Laboratories, Inc.* | $ | 74,661 | ||||||||
| 38 | Illumina, Inc.* | 1,240 | |||||||||
| 742 | ImClone Systems, Inc.* | 31,082 | |||||||||
| 457 | Immucor, Inc.* | 14,912 | |||||||||
| 861 | Integra LifeSciences Holdings Corp.* | 39,236 | |||||||||
| 328 | Intuitive Surgical, Inc.* | 42,528 | |||||||||
| 5,571 | Invacare Corp. | 103,843 | |||||||||
| 1,090 | inVentiv Health, Inc.* | 41,366 | |||||||||
| 978 | Inverness Medical Innovations, Inc.* | 39,169 | |||||||||
| 195 | Keryx Biopharmaceuticals, Inc.* | 1,989 | |||||||||
| 2,053 | Kinetic Concepts, Inc.* | 102,650 | |||||||||
| 1,555 | KV Pharmaceutical Co., Class A* | 40,446 | |||||||||
| 261 | KV Pharmaceutical Co., Class B* | 6,770 | |||||||||
| 584 | Kyphon, Inc.* | 27,220 | |||||||||
| 572 | Landauer, Inc. | 26,827 | |||||||||
| 385 | LCA-Vision, Inc. | 16,158 | |||||||||
| 412 | Lifecell Corp.* | 12,113 | |||||||||
| 105 | Luminex Corp.* | 1,454 | |||||||||
| 1,678 | Martek Biosciences Corp.* | 36,228 | |||||||||
| 1,340 | Matria Healthcare, Inc.* | 38,833 | |||||||||
| 318 | Maxygen, Inc.* | 3,412 | |||||||||
| 2,151 | MedCath Corp.* | 63,928 | |||||||||
| 300 | Medicines (The) Co.* | 6,834 | |||||||||
| 1,518 | Medicis Pharmaceutical Corp., Class A | 46,147 | |||||||||
| 1,088 | Mentor Corp. | 42,334 | |||||||||
| 619 | Meridian Bioscience, Inc. | 18,403 | |||||||||
| 1,452 | Merit Medical Systems, Inc.* | 16,742 | |||||||||
| 364 | MGI Pharma, Inc.* | 8,015 | |||||||||
| 8,371 | Millennium Pharmaceuticals, Inc.* | 92,751 | |||||||||
| 1,450 | Millipore Corp.* | 107,054 | |||||||||
| 2,438 | Molina Healthcare, Inc.* | 73,676 | |||||||||
| 622 | Momenta Pharmaceuticals, Inc.* | 9,778 | |||||||||
| 151 | Myriad Genetics, Inc.* | 5,519 | |||||||||
| 2,797 | Nabi Biopharmaceuticals* | 14,544 | |||||||||
| 591 | National Healthcare Corp. | 30,324 | |||||||||
| 451 | Nektar Therapeutics* | 5,579 | |||||||||
| 1,128 | Neurocrine Biosciences, Inc.* | 14,359 | |||||||||
| 214 | Nighthawk Radiology Holdings, Inc.* | 4,154 | |||||||||
| 481 | Noven Pharmaceuticals, Inc.* | 11,260 | |||||||||
| 57 | NuVasive, Inc.* | 1,469 | |||||||||
| 2,393 | Odyssey HealthCare, Inc.* | 31,923 | |||||||||
| 11 | Onyx Pharmaceuticals, Inc.* | 294 | |||||||||
| 1,957 | Option Care, Inc. | 26,733 | |||||||||
| 990 | Orthofix International NV (Netherlands)* | 52,173 | |||||||||
| 236 | OSI Pharmaceuticals, Inc.* | 8,189 | |||||||||
| 151 | Palomar Medical Technologies, Inc.* | 6,182 | |||||||||
| 655 | Panacos Pharmaceuticals, Inc.* | 3,118 | |||||||||
| 3,236 | Par Pharmaceutical Cos., Inc.* | 87,145 | |||||||||
| 1,323 | Parexel International Corp.* | 51,967 | |||||||||
| 1,672 | PDL BioPharma, Inc.* | 42,235 | |||||||||
| 1,851 | Pediatrix Medical Group, Inc.* | 105,600 | |||||||||
| 4,858 | Perrigo Co. | 92,302 | |||||||||
| Number of Shares | Value | ||||||||||
| Common Stocks (Continued) | |||||||||||
| 3,194 | Pharmaceutical Product Development, Inc. | $ | 115,208 | ||||||||
| 1,145 | PharmaNet Development Group, Inc.* | 31,247 | |||||||||
| 828 | Pharmion Corp.* | 25,080 | |||||||||
| 1,309 | PolyMedica Corp. | 52,936 | |||||||||
| 1,401 | PRA International* | 31,831 | |||||||||
| 4,451 | PSS World Medical, Inc.* | 89,465 | |||||||||
| 1,142 | Psychiatric Solutions, Inc.* | 40,050 | |||||||||
| 712 | Radiation Therapy Services, Inc.* | 20,940 | |||||||||
| 2,939 | RehabCare Group, Inc.* | 48,141 | |||||||||
| 3,879 | Res-Care, Inc.* | 69,434 | |||||||||
| 1,363 | ResMed, Inc.* | 57,600 | |||||||||
| 2,713 | Respironics, Inc.* | 110,582 | |||||||||
| 1,132 | Salix Pharmaceuticals Ltd.* | 14,739 | |||||||||
| 1,626 | Sciele Pharma, Inc.* | 40,195 | |||||||||
| 2,861 | Sierra Health Services, Inc.* | 118,503 | |||||||||
| 1,089 | Sirona Dental Systems, Inc.* | 35,948 | |||||||||
| 435 | SonoSite, Inc.* | 12,606 | |||||||||
| 4,934 | STERIS Corp. | 126,113 | |||||||||
| 2,932 | Sunrise Senior Living, Inc.* | 112,266 | |||||||||
| 395 | SurModics, Inc.* | 16,049 | |||||||||
| 1,666 | Symbion, Inc.* | 36,519 | |||||||||
| 2,038 | Symmetry Medical, Inc.* | 34,626 | |||||||||
| 735 | Syneron Medical Ltd. (Israel)* | 18,515 | |||||||||
| 499 | Tanox, Inc.* | 9,311 | |||||||||
| 772 | Techne Corp.* | 45,525 | |||||||||
| 1,735 | Thoratec Corp.* | 34,041 | |||||||||
| 1,157 | Trizetto Group (The), Inc.* | 22,538 | |||||||||
| 342 | United Therapeutics Corp.* | 19,121 | |||||||||
| 6,872 | Valeant Pharmaceuticals International | 123,833 | |||||||||
| 1,644 | Varian, Inc.* | 95,286 | |||||||||
| 2,076 | VCA Antech, Inc.* | 81,857 | |||||||||
| 551 | Ventana Medical Systems, Inc.* | 26,773 | |||||||||
| 1,881 | Viasys Healthcare, Inc.* | 60,230 | |||||||||
| 1,227 | ViroPharma, Inc.* | 18,503 | |||||||||
| 531 | Vital Signs, Inc. | 30,299 | |||||||||
| 2,440 | Waters Corp.* | 145,010 | |||||||||
| 1,047 | WellCare Health Plans, Inc.* | 84,378 | |||||||||
| 1,436 | West Pharmaceutical Services, Inc. | 71,470 | |||||||||
| 1,821 | Wright Medical Group, Inc.* | 43,012 | |||||||||
| 496 | Young Innovations, Inc. | 13,536 | |||||||||
| 875 | Zoll Medical Corp.* | 21,149 | |||||||||
| 397 | ZymoGenetics, Inc.* | 5,939 | |||||||||
| 7,233,647 | |||||||||||
| Industrials—16.6% | |||||||||||
| 3,139 | A.O. Smith Corp. | 119,596 | |||||||||
| 649 | AAON, Inc. | 16,050 | |||||||||
| 1,689 | AAR Corp.* | 51,582 | |||||||||
| 4,935 | ABM Industries, Inc. | 138,871 | |||||||||
| 12,386 | ABX Air, Inc.* | 80,757 | |||||||||
| 4,325 | Accuride Corp.* | 63,188 | |||||||||
| 1,299 | Actuant Corp., Class A | 68,847 | |||||||||
See Notes to Financial Statements.
37
Schedule of Investments (Continued)
PowerShares FTSE RAFI US 1500 Small-Mid Portfolio
April 30, 2007
| Number of Shares | Value | ||||||||||
| Common Stocks (Continued) | |||||||||||
| 1,892 | Administaff, Inc. | $ | 62,795 | ||||||||
| 358 | Advisory Board (The) Co.* | 16,998 | |||||||||
| 7,367 | AirTran Holdings, Inc.* | 81,111 | |||||||||
| 2,775 | Albany International Corp., Class A | 106,283 | |||||||||
| 1,743 | American Commercial Lines, Inc.* | 51,366 | |||||||||
| 623 | American Railcar Industries, Inc. | 19,849 | |||||||||
| 1,586 | American Reprographics Co.* | 52,655 | |||||||||
| 148 | American Science & Engineering, Inc.* | 6,956 | |||||||||
| 1,129 | American Woodmark Corp. | 38,962 | |||||||||
| 692 | Ameron International Corp. | 47,845 | |||||||||
| 3,796 | Ametek, Inc. | 137,719 | |||||||||
| 2,346 | Apogee Enterprises, Inc. | 56,492 | |||||||||
| 3,868 | Applied Industrial Technologies, Inc. | 103,933 | |||||||||
| 759 | Argon ST, Inc.* | 19,893 | |||||||||
| 2,865 | Arkansas Best Corp. | 112,881 | |||||||||
| 1,611 | Armor Holdings, Inc.* | 115,187 | |||||||||
| 1,089 | Astec Industries, Inc.* | 44,322 | |||||||||
| 1,240 | ASV, Inc.* | 18,823 | |||||||||
| 2,425 | Atlas Air Worldwide Holdings, Inc.* | 139,486 | |||||||||
| 2,036 | Baldor Electric Co. | 80,198 | |||||||||
| 3,928 | Barnes Group, Inc. | 95,450 | |||||||||
| 3,015 | BE Aerospace, Inc.* | 110,500 | |||||||||
| 2,761 | Beacon Roofing Supply, Inc.* | 43,431 | |||||||||
| 1,891 | Belden CDT, Inc. | 105,669 | |||||||||
| 3,686 | Blount International, Inc.* | 50,240 | |||||||||
| 4,210 | Bowne & Co., Inc. | 70,223 | |||||||||
| 2,605 | Brady Corp., Class A | 85,600 | |||||||||
| 635 | Bucyrus International, Inc., Class A | 39,840 | |||||||||
| 664 | Cascade Corp. | 41,148 | |||||||||
| 7,129 | CBIZ, Inc.* | 49,618 | |||||||||
| 2,640 | CDI Corp. | 78,197 | |||||||||
| 2,542 | Central Parking Corp. | 56,890 | |||||||||
| 4,514 | Cenveo, Inc.* | 115,784 | |||||||||
| 618 | Ceradyne, Inc.* | 36,369 | |||||||||
| 9,676 | China Yuchai International Ltd. (Bermuda) | 89,503 | |||||||||
| 1,087 | CIRCOR International, Inc. | 39,567 | |||||||||
| 2,728 | CLARCOR, Inc. | 86,041 | |||||||||
| 803 | Clean Harbors, Inc.* | 37,356 | |||||||||
| 963 | Consolidated Graphics, Inc.* | 72,466 | |||||||||
| 3,163 | Copart, Inc.* | 91,664 | |||||||||
| 590 | Corporate Executive Board Co. | 37,548 | |||||||||
| 451 | CoStar Group, Inc.* | 22,013 | |||||||||
| 3,787 | Covanta Holding Corp.* | 92,933 | |||||||||
| 546 | CRA International, Inc.* | 28,157 | |||||||||
| 2,257 | Cubic Corp. | 45,433 | |||||||||
| 2,435 | Curtiss-Wright Corp. | 104,924 | |||||||||
| 727 | Diamond Management & Technology Consultants, Inc. | 8,244 | |||||||||
| 2,832 | Diana Shipping, Inc. (Marshall Islands) | 57,348 | |||||||||
| 3,328 | Donaldson Co., Inc. | 119,542 | |||||||||
| 1,947 | DRS Technologies, Inc. | 97,954 | |||||||||
| 2,172 | DryShips, Inc. (Marshall Islands) | 76,845 | |||||||||
| Number of Shares | Value | ||||||||||
| Common Stocks (Continued) | |||||||||||
| 4,636 | DynCorp International, Inc., Class A* | $ | 69,540 | ||||||||
| 1,464 | Eagle Bulk Shipping, Inc. (Marshall Islands) | 32,969 | |||||||||
| 1,617 | EDO Corp. | 44,468 | |||||||||
| 3,684 | EGL, Inc.* | 146,180 | |||||||||
| 3,686 | Electro Rent Corp. | 47,844 | |||||||||
| 1,700 | Encore Wire Corp. | 47,090 | |||||||||
| 362 | Energy Conversion Devices, Inc.* | 12,818 | |||||||||
| 4,472 | EnerSys* | 72,849 | |||||||||
| 1,664 | Ennis, Inc. | 40,685 | |||||||||
| 2,256 | EnPro Industries, Inc.* | 84,961 | |||||||||
| 1,204 | ESCO Technologies, Inc.* | 54,854 | |||||||||
| 2,068 | Esterline Technologies Corp.* | 86,298 | |||||||||
| 268 | Evergreen Solar, Inc.* | 2,618 | |||||||||
| 15,333 | ExpressJet Holdings, Inc.* | 91,538 | |||||||||
| 3,824 | Fastenal Co. | 157,242 | |||||||||
| 7,197 | Federal Signal Corp. | 113,641 | |||||||||
| 1,388 | Florida East Coast Industries, Inc. | 97,868 | |||||||||
| 883 | Forward Air Corp. | 26,940 | |||||||||
| 1,647 | Foster Wheeler Ltd. (Bermuda)* | 113,363 | |||||||||
| 965 | Franklin Electric Co., Inc. | 41,099 | |||||||||
| 435 | FreightCar America, Inc. | 21,646 | |||||||||
| 2,001 | FTI Consulting, Inc.* | 73,577 | |||||||||
| 1,780 | G&K Services, Inc., Class A | 62,122 | |||||||||
| 2,337 | Gardner Denver, Inc.* | 88,339 | |||||||||
| 1,045 | Genco Shipping & Trading Ltd. (Marshall Islands) | 37,369 | |||||||||
| 3,020 | GenCorp, Inc.* | 40,226 | |||||||||
| 1,838 | General Cable Corp.* | 105,575 | |||||||||
| 1,964 | Genesee & Wyoming, Inc., Class A* | 53,401 | |||||||||
| 1,639 | Genlyte Group, Inc.* | 127,858 | |||||||||
| 931 | Geo Group (The), Inc.* | 47,667 | |||||||||
| 6,221 | Goodman Global, Inc.* | 116,022 | |||||||||
| 858 | Gorman-Rupp (The) Co. | 27,516 | |||||||||
| 2,911 | Graco, Inc. | 114,985 | |||||||||
| 6,096 | GrafTech International Ltd.* | 60,838 | |||||||||
| 2,347 | Granite Construction, Inc. | 141,382 | |||||||||
| 1,422 | Greenbrier Cos., Inc. | 32,621 | |||||||||
| 4,359 | Griffon Corp.* | 104,572 | |||||||||
| 1,453 | H&E Equipment Services, Inc. | 34,378 | |||||||||
| 939 | Healthcare Services Group, Inc. | 26,292 | |||||||||
| 3,412 | Heartland Express, Inc. | 58,789 | |||||||||
| 286 | Heico Corp. | 10,339 | |||||||||
| 556 | Heico Corp., Class A | 17,208 | |||||||||
| 846 | Heidrick & Struggles International, Inc.* | 39,914 | |||||||||
| 2,748 | Herman Miller, Inc. | 94,559 | |||||||||
| 4,828 | Hexcel Corp.* | 104,768 | |||||||||
| 1,807 | Horizon Lines, Inc., Class A | 61,456 | |||||||||
| 2,539 | Hub Group, Inc., Class A* | 91,404 | |||||||||
| 3,431 | Hudson Highland Group, Inc.* | 55,960 | |||||||||
| 182 | Huron Consulting Group, Inc.* | 11,020 | |||||||||
| 2,358 | IDEX Corp. | 123,724 | |||||||||
| 1,297 | IHS, Inc., Class A* | 53,618 | |||||||||
See Notes to Financial Statements.
38
Schedule of Investments (Continued)
PowerShares FTSE RAFI US 1500 Small-Mid Portfolio
April 30, 2007
| Number of Shares | Value | ||||||||||
| Common Stocks (Continued) | |||||||||||
| 769 | II-VI, Inc.* | $ | 20,832 | ||||||||
| 2,383 | InfraSource Services, Inc.* | 79,545 | |||||||||
| 251 | Innerworkings, Inc.* | 3,080 | |||||||||
| 2,075 | Insituform Technologies, Inc., Class A* | 42,330 | |||||||||
| 3,894 | Interface, Inc., Class A* | 65,614 | |||||||||
| 3,109 | Interline Brands, Inc.* | 67,963 | |||||||||
| 3,870 | Interpool, Inc. | 103,368 | |||||||||
| 873 | Ionatron, Inc.* | 5,369 | |||||||||
| 11,166 | JetBlue Airways Corp.* | 110,655 | |||||||||
| 1,747 | John H. Harland Co. | 91,892 | |||||||||
| 2,431 | Joy Global, Inc. | 123,082 | |||||||||
| 5,582 | K&F Industries Holdings, Inc.* | 148,592 | |||||||||
| 2,639 | Kaman Corp. | 65,447 | |||||||||
| 1,388 | Kaydon Corp. | 65,972 | |||||||||
| 163 | Kenexa Corp.* | 5,046 | |||||||||
| 2,652 | Kirby Corp.* | 100,246 | |||||||||
| 2,593 | Knight Transportation, Inc. | 50,486 | |||||||||
| 5,976 | Knoll, Inc. | 138,763 | |||||||||
| 1,950 | Korn/Ferry International* | 45,962 | |||||||||
| 3,969 | Labor Ready, Inc.* | 86,127 | |||||||||
| 2,024 | Landstar System, Inc. | 97,779 | |||||||||
| 938 | Lawson Products, Inc. | 33,534 | |||||||||
| 1,871 | LECG Corp.* | 27,410 | |||||||||
| 2,141 | Lincoln Electric Holdings, Inc. | 136,446 | |||||||||
| 455 | Lindsay Manufacturing Co. | 13,900 | |||||||||
| 1,215 | Macquarie Infrastructure Co. Trust | 51,735 | |||||||||
| 1,994 | Manitowoc (The) Co., Inc. | 136,051 | |||||||||
| 1,761 | McDermott International, Inc. (Panama)* | 94,495 | |||||||||
| 1,512 | McGrath Rentcorp | 45,587 | |||||||||
| 62 | Medis Technologies Ltd.* | 947 | |||||||||
| 171 | Middleby (The) Corp.* | 23,475 | |||||||||
| 2,247 | Mine Safety Appliances Co. | 94,711 | |||||||||
| 1,474 | Mobile Mini, Inc.* | 44,176 | |||||||||
| 2,577 | Moog, Inc., Class A* | 109,574 | |||||||||
| 2,704 | MSC Industrial Direct Co., Class A | 131,793 | |||||||||
| 1,022 | MTC Technologies, Inc.* | 21,115 | |||||||||
| 2,686 | Navigant Consulting, Inc.* | 51,517 | |||||||||
| 1,730 | NCI Building Systems, Inc.* | 86,448 | |||||||||
| 1,844 | Nordson Corp. | 84,511 | |||||||||
| 2,422 | Old Dominion Freight Line, Inc.* | 71,594 | |||||||||
| 3,029 | Orbital Sciences Corp.* | 63,215 | |||||||||
| 3,114 | Pacer International, Inc. | 79,563 | |||||||||
| 2,173 | Perini Corp.* | 92,570 | |||||||||
| 1,447 | Pike Electric Corp.* | 29,475 | |||||||||
| 811 | Powell Industries, Inc.* | 25,538 | |||||||||
| 4,189 | Power-One, Inc.* | 17,845 | |||||||||
| 1,500 | Quintana Maritime Ltd. (Marshall Islands) | 24,195 | |||||||||
| 757 | Raven Industries, Inc. | 21,870 | |||||||||
| 1,995 | Regal-Beloit Corp. | 92,009 | |||||||||
| 3,746 | Republic Airways Holdings, Inc.* | 79,640 | |||||||||
| 1,183 | Resources Connection, Inc.* | 35,691 | |||||||||
| 1,190 | Robbins & Myers, Inc. | 45,732 | |||||||||
| Number of Shares | Value | ||||||||||
| Common Stocks (Continued) | |||||||||||
| 2,502 | Rollins, Inc. | $ | 57,721 | ||||||||
| 2,629 | Roper Industries, Inc. | 147,381 | |||||||||
| 1,902 | Schawk, Inc. | 34,293 | |||||||||
| 2,392 | School Specialty, Inc.* | 78,888 | |||||||||
| 1,292 | Seaspan Corp. (Marshall Islands) | 36,279 | |||||||||
| 2,203 | Simpson Manufacturing Co., Inc. | 70,871 | |||||||||
| 4,827 | Skywest, Inc. | 131,343 | |||||||||
| 14,297 | Spherion Corp.* | 122,239 | |||||||||
| 6,594 | Standard Register (The) Co. | 82,161 | |||||||||
| 1,798 | Standex International Corp. | 49,193 | |||||||||
| 1,152 | Stericycle, Inc.* | 100,385 | |||||||||
| 2,958 | Superior Essex, Inc.* | 105,601 | |||||||||
| 3,454 | TAL International Group, Inc. | 86,385 | |||||||||
| 1,280 | Taser International, Inc.* | 11,046 | |||||||||
| 2,049 | Teledyne Technologies, Inc.* | 90,381 | |||||||||
| 2,742 | TeleTech Holdings, Inc.* | 103,456 | |||||||||
| 1,345 | Tennant Co. | 43,067 | |||||||||
| 4,240 | Tetra Tech, Inc.* | 88,277 | |||||||||
| 2,671 | Thomas & Betts Corp.* | 145,515 | |||||||||
| 2,043 | Toro (The) Co. | 102,661 | |||||||||
| 2,187 | TransDigm Group, Inc.* | 82,822 | |||||||||
| 3,302 | Tredegar Corp. | 77,168 | |||||||||
| 1,183 | Trex Co., Inc.* | 24,121 | |||||||||
| 1,535 | Triumph Group, Inc. | 93,343 | |||||||||
| 4,431 | UAP Holding Corp. | 122,606 | |||||||||
| 480 | United Industrial Corp. | 23,482 | |||||||||
| 2,036 | Universal Forest Products, Inc. | 94,593 | |||||||||
| 2,096 | US Airways Group, Inc.* | 77,426 | |||||||||
| 2,659 | UTi Worldwide, Inc. (Virgin Islands) | 62,407 | |||||||||
| 1,308 | Valmont Industries, Inc. | 82,247 | |||||||||
| 3,170 | Viad Corp. | 129,463 | |||||||||
| 2,074 | Vicor Corp. | 22,233 | |||||||||
| 2,982 | Volt Information Sciences, Inc.* | 76,220 | |||||||||
| 2,927 | Wabash National Corp. | 45,544 | |||||||||
| 1,941 | Wabtec Corp. | 72,108 | |||||||||
| 4,757 | Walter Industries, Inc. | 141,378 | |||||||||
| 3,976 | Waste Connections, Inc.* | 123,932 | |||||||||
| 1,722 | Watsco, Inc. | 91,559 | |||||||||
| 1,114 | Watson Wyatt Worldwide, Inc., Class A | 52,503 | |||||||||
| 2,083 | Watts Water Technologies, Inc., Class A | 84,362 | |||||||||
| 2,839 | Williams Scotsman International, Inc.* | 62,543 | |||||||||
| 1,801 | Woodward Governor Co. | 88,879 | |||||||||
| 5,449 | Xerium Technologies, Inc. | 44,573 | |||||||||
| 14,210,319 | |||||||||||
| Information Technology—15.1% | |||||||||||
| 21,845 | 3Com Corp.* | 88,035 | |||||||||
| 1,582 | Actel Corp.* | 23,160 | |||||||||
| 5,697 | Acxiom Corp. | 128,751 | |||||||||
| 16,715 | Adaptec, Inc.* | 64,520 | |||||||||
| 5,994 | ADC Telecommunications, Inc.* | 110,290 | |||||||||
| 4,166 | ADTRAN, Inc. | 106,025 | |||||||||
See Notes to Financial Statements.
39
Schedule of Investments (Continued)
PowerShares FTSE RAFI US 1500 Small-Mid Portfolio
April 30, 2007
| Number of Shares | Value | ||||||||||
| Common Stocks (Continued) | |||||||||||
| 1,538 | Advanced Analogic Technologies, Inc.* | $ | 12,473 | ||||||||
| 1,444 | Advanced Energy Industries, Inc.* | 35,378 | |||||||||
| 721 | Advent Software, Inc.* | 24,197 | |||||||||
| 4,563 | Aeroflex, Inc.* | 64,065 | |||||||||
| 2,412 | Agile Software Corp.* | 17,342 | |||||||||
| 4,278 | Agilysys, Inc. | 89,966 | |||||||||
| 871 | Akamai Technologies, Inc.* | 38,394 | |||||||||
| 6,215 | AMIS Holdings, Inc.* | 72,094 | |||||||||
| 4,108 | Amphenol Corp., Class A | 144,231 | |||||||||
| 228 | Ansoft Corp.* | 7,362 | |||||||||
| 592 | Ansys, Inc.* | 30,310 | |||||||||
| 11,524 | Applied Micro Circuits Corp.* | 32,382 | |||||||||
| 1,123 | aQuantive, Inc.* | 34,375 | |||||||||
| 2,923 | Ariba, Inc.* | 25,781 | |||||||||
| 4,365 | Arris Group, Inc.* | 64,689 | |||||||||
| 8,193 | ASE Test Ltd. (Singapore)* | 105,116 | |||||||||
| 994 | Aspen Technology, Inc.* | 13,499 | |||||||||
| 2,369 | Asyst Technologies, Inc.* | 16,938 | |||||||||
| 542 | Atheros Communications, Inc.* | 14,520 | |||||||||
| 1,374 | ATMI, Inc.* | 42,498 | |||||||||
| 1,085 | AudioCodes Ltd. (Israel)* | 7,270 | |||||||||
| 3,236 | Autodesk, Inc.* | 133,549 | |||||||||
| 2,673 | Avid Technology, Inc.* | 88,877 | |||||||||
| 2,306 | Avocent Corp.* | 64,591 | |||||||||
| 5,501 | Axcelis Technologies, Inc.* | 42,083 | |||||||||
| 15,830 | BearingPoint, Inc.* | 116,192 | |||||||||
| 10,725 | BISYS Group (The), Inc.* | 124,088 | |||||||||
| 1,702 | Black Box Corp. | 62,021 | |||||||||
| 646 | Blackbaud, Inc. | 14,264 | |||||||||
| 403 | Blackboard, Inc.* | 13,827 | |||||||||
| 7,093 | Borland Software Corp.* | 39,508 | |||||||||
| 7,208 | Brightpoint, Inc.* | 95,866 | |||||||||
| 8,648 | Brocade Communications Systems, Inc.* | 84,491 | |||||||||
| 2,290 | Brooks Automation, Inc.* | 40,006 | |||||||||
| 1,533 | Cabot Microelectronics Corp.* | 49,271 | |||||||||
| 2,221 | CACI International, Inc., Class A* | 101,566 | |||||||||
| 3,239 | CDC Corp., Class A (Cayman Islands)* | 28,989 | |||||||||
| 3,867 | Checkpoint Systems, Inc.* | 85,035 | |||||||||
| 8,852 | ChipMOS TECHNOLOGIES Bermuda Ltd. (Bermuda)* | 61,256 | |||||||||
| 9,212 | Ciber, Inc.* | 75,078 | |||||||||
| 947 | Ciena Corp.* | 27,615 | |||||||||
| 2,833 | Cirrus Logic, Inc.* | 23,457 | |||||||||
| 15,077 | CMGI, Inc.* | 31,662 | |||||||||
| 3,342 | CNET Networks, Inc.* | 28,173 | |||||||||
| 3,379 | Cogent, Inc.* | 47,441 | |||||||||
| 1,993 | Cognex Corp. | 42,949 | |||||||||
| 1,011 | Cognizant Technology Solutions Corp., Class A* | 90,383 | |||||||||
| 2,372 | Coherent, Inc.* | 74,457 | |||||||||
| 1,300 | Cohu, Inc. | 26,754 | |||||||||
| 2,457 | CommScope, Inc.* | 114,619 | |||||||||
| Number of Shares | Value | ||||||||||
| Common Stocks (Continued) | |||||||||||
| 71 | Commvault Systems, Inc.* | $ | 1,204 | ||||||||
| 815 | Comtech Telecommunications Corp.* | 30,848 | |||||||||
| 197 | Concur Technologies, Inc.* | 3,501 | |||||||||
| 11,018 | Conexant Systems, Inc.* | 17,078 | |||||||||
| 1,498 | Covansys Corp.* | 50,033 | |||||||||
| 10,970 | Credence Systems Corp.* | 40,699 | |||||||||
| 4,760 | Cree, Inc.* | 97,104 | |||||||||
| 2,937 | CSG Systems International, Inc.* | 78,653 | |||||||||
| 3,512 | CTS Corp. | 45,937 | |||||||||
| 1,443 | Cymer, Inc.* | 58,456 | |||||||||
| 6,084 | Cypress Semiconductor Corp.* | 138,836 | |||||||||
| 753 | Daktronics, Inc. | 17,153 | |||||||||
| 543 | DealerTrack Holdings, Inc.* | 17,919 | |||||||||
| 606 | Digital River, Inc.* | 35,469 | |||||||||
| 756 | Diodes, Inc.* | 27,912 | |||||||||
| 2,070 | Ditech Networks, Inc.* | 18,009 | |||||||||
| 45 | DivX, Inc.* | 907 | |||||||||
| 1,721 | Dolby Laboratories, Inc., Class A* | 60,958 | |||||||||
| 1,674 | DSP Group, Inc.* | 30,919 | |||||||||
| 3,690 | Dycom Industries, Inc.* | 95,608 | |||||||||
| 16,523 | EarthLink, Inc.* | 126,566 | |||||||||
| 1,791 | Echelon Corp.* | 23,193 | |||||||||
| 7,757 | ECI Telecom Ltd. (Israel)* | 64,849 | |||||||||
| 2,951 | eFunds Corp.* | 82,333 | |||||||||
| 1,885 | Electro Scientific Industries, Inc.* | 38,831 | |||||||||
| 3,349 | Electronics for Imaging, Inc.* | 89,318 | |||||||||
| 3,901 | Emulex Corp.* | 81,843 | |||||||||
| 8,006 | Entegris, Inc.* | 93,830 | |||||||||
| 1,129 | Entrust, Inc.* | 4,234 | |||||||||
| 1,764 | Epicor Software Corp.* | 25,578 | |||||||||
| 939 | EPIQ Systems, Inc.* | 22,189 | |||||||||
| 299 | Equinix, Inc.* | 24,958 | |||||||||
| 3,841 | eSpeed, Inc., Class A* | 35,568 | |||||||||
| 1,149 | Euronet Worldwide, Inc.* | 32,000 | |||||||||
| 2,598 | Exar Corp.* | 35,021 | |||||||||
| 704 | Excel Technology, Inc.* | 18,550 | |||||||||
| 7,996 | Extreme Networks, Inc.* | 32,704 | |||||||||
| 559 | F5 Networks, Inc.* | 42,920 | |||||||||
| 782 | FactSet Research Systems, Inc. | 48,101 | |||||||||
| 2,246 | Fair Isaac Corp. | 80,205 | |||||||||
| 261 | FalconStor Software, Inc.* | 3,007 | |||||||||
| 1,460 | FEI Co.* | 54,312 | |||||||||
| 2,442 | Finisar Corp.* | 8,840 | |||||||||
| 1,750 | Flir Systems, Inc.* | 70,858 | |||||||||
| 758 | FormFactor, Inc.* | 31,298 | |||||||||
| 894 | Forrester Research, Inc.* | 23,047 | |||||||||
| 5,695 | Foundry Networks, Inc.* | 86,108 | |||||||||
| 3,621 | Gartner, Inc.* | 91,358 | |||||||||
| 4,485 | Genesis Microchip, Inc.* | 38,481 | |||||||||
| 2,553 | Gevity HR, Inc. | 47,613 | |||||||||
| 683 | GigaMedia Ltd. (Singapore)* | 9,617 | |||||||||
| 2,808 | Global Cash Access Holdings, Inc.* | 44,001 | |||||||||
See Notes to Financial Statements.
40
Schedule of Investments (Continued)
PowerShares FTSE RAFI US 1500 Small-Mid Portfolio
April 30, 2007
| Number of Shares | Value | ||||||||||
| Common Stocks (Continued) | |||||||||||
| 3,814 | Global Imaging Systems, Inc.* | $ | 110,186 | ||||||||
| 2,021 | Global Payments, Inc. | 76,758 | |||||||||
| 1,529 | Harmonic, Inc.* | 12,645 | |||||||||
| 1,264 | Heartland Payment Systems, Inc. | 31,512 | |||||||||
| 441 | Hittite Microwave Corp.* | 19,924 | |||||||||
| 367 | Hughes Communications, Inc.* | 17,965 | |||||||||
| 3,588 | Hutchinson Technology, Inc.* | 68,172 | |||||||||
| 2,695 | Imation Corp. | 99,472 | |||||||||
| 2,068 | Informatica Corp.* | 30,441 | |||||||||
| 2,519 | InfoSpace, Inc.* | 64,638 | |||||||||
| 3,797 | infoUSA, Inc. | 35,654 | |||||||||
| 5,968 | Integrated Device Technology, Inc.* | 89,401 | |||||||||
| 530 | Interdigital Communications Corp.* | 17,426 | |||||||||
| 4,033 | Intermec, Inc.* | 90,057 | |||||||||
| 385 | Internap Network Services Corp.* | 5,914 | |||||||||
| 1,984 | Inter-Tel, Inc. | 50,036 | |||||||||
| 1,503 | Interwoven, Inc.* | 22,951 | |||||||||
| 777 | Itron, Inc.* | 52,323 | |||||||||
| 2,567 | Ixia* | 22,025 | |||||||||
| 1,038 | j2 Global Communications, Inc.* | 29,853 | |||||||||
| 3,331 | Jack Henry & Associates, Inc. | 79,111 | |||||||||
| 2,242 | JDA Software Group, Inc.* | 39,908 | |||||||||
| 2,162 | Jupitermedia Corp.* | 15,048 | |||||||||
| 5,797 | Keane, Inc.* | 81,274 | |||||||||
| 13,368 | KEMET Corp.* | 113,361 | |||||||||
| 136 | Knot (The), Inc.* | 2,901 | |||||||||
| 1,874 | Komag, Inc.* | 51,554 | |||||||||
| 3,248 | Kopin Corp.* | 11,011 | |||||||||
| 1,384 | Kronos, Inc.* | 75,525 | |||||||||
| 7,482 | Lattice Semiconductor Corp.* | 40,852 | |||||||||
| 5,069 | Lawson Software, Inc.* | 45,114 | |||||||||
| 1,265 | Littelfuse, Inc.* | 50,739 | |||||||||
| 1,774 | Loral Space & Communications, Inc.* | 85,099 | |||||||||
| 1,195 | LTX Corp.* | 7,122 | |||||||||
| 1,933 | Macrovision Corp.* | 46,914 | |||||||||
| 1,145 | Magma Design Automation, Inc.* | 15,721 | |||||||||
| 1,161 | Manhattan Associates, Inc.* | 33,576 | |||||||||
| 1,917 | ManTech International Corp., Class A* | 58,814 | |||||||||
| 4,935 | MasTec, Inc.* | 56,604 | |||||||||
| 1,735 | MAXIMUS, Inc. | 60,621 | |||||||||
| 2,429 | MEMC Electronic Materials, Inc.* | 133,303 | |||||||||
| 4,558 | Mentor Graphics Corp.* | 73,748 | |||||||||
| 2,380 | Mercury Computer Systems, Inc.* | 32,297 | |||||||||
| 3,990 | Methode Electronics, Inc. | 60,169 | |||||||||
| 2,977 | Micrel, Inc.* | 37,361 | |||||||||
| 977 | MICROS Systems, Inc.* | 53,540 | |||||||||
| 1,753 | Microsemi Corp.* | 40,512 | |||||||||
| 256 | MicroStrategy, Inc., Class A* | 29,123 | |||||||||
| 365 | Midway Games, Inc.* | 2,519 | |||||||||
| 3,027 | MKS Instruments, Inc.* | 81,578 | |||||||||
| 8,949 | MPS Group, Inc.* | 122,512 | |||||||||
| 2,553 | MSC.Software Corp.* | 33,342 | |||||||||
| Number of Shares | Value | ||||||||||
| Common Stocks (Continued) | |||||||||||
| 969 | MTS Systems Corp. | $ | 41,192 | ||||||||
| 1,448 | Multi-Fineline Electronix, Inc.* | 23,211 | |||||||||
| 5,495 | NAM TAI Electronics, Inc. (Virgin Islands) | 71,215 | |||||||||
| 2,342 | National Instruments Corp. | 65,248 | |||||||||
| 1,837 | NAVTEQ Corp.* | 64,956 | |||||||||
| 932 | Net 1 UEPS Technologies, Inc.* | 23,468 | |||||||||
| 1,218 | Netgear, Inc.* | 40,937 | |||||||||
| 107 | Netlogic Microsystems, Inc.* | 3,291 | |||||||||
| 651 | NetRatings, Inc.* | 13,547 | |||||||||
| 1,559 | Newport Corp.* | 24,461 | |||||||||
| 644 | Novatel Wireless, Inc.* | 11,714 | |||||||||
| 3,070 | Nuance Communications, Inc.* | 47,309 | |||||||||
| 3,351 | Omnivision Technologies, Inc.* | 45,306 | |||||||||
| 8,115 | ON Semiconductor Corp.* | 86,912 | |||||||||
| 2,842 | Openwave Systems, Inc.* | 20,889 | |||||||||
| 1,926 | Optimal Group, Inc., Class A (Canada)* | 16,910 | |||||||||
| 1,897 | Orbotech Ltd. (Israel)* | 43,498 | |||||||||
| 1,060 | OSI Systems, Inc.* | 27,995 | |||||||||
| 4,973 | Palm, Inc.* | 83,944 | |||||||||
| 3,586 | Parametric Technology Corp.* | 63,723 | |||||||||
| 1,318 | Park Electrochemical Corp. | 36,311 | |||||||||
| 3,511 | Paxar Corp.* | 105,365 | |||||||||
| 1,448 | Pericom Semiconductor Corp.* | 14,494 | |||||||||
| 979 | Photon Dynamics, Inc.* | 11,768 | |||||||||
| 5,365 | Photronics, Inc.* | 80,743 | |||||||||
| 2,537 | Plantronics, Inc. | 63,704 | |||||||||
| 4,531 | Plexus Corp.* | 94,970 | |||||||||
| 5,113 | PMC - Sierra, Inc.* | 39,523 | |||||||||
| 3,011 | Polycom, Inc.* | 100,266 | |||||||||
| 11,523 | Powerwave Technologies, Inc.* | 71,788 | |||||||||
| 1,817 | Progress Software Corp.* | 54,746 | |||||||||
| 6,973 | QLogic Corp.* | 124,677 | |||||||||
| 326 | Quality Systems, Inc. | 13,193 | |||||||||
| 36,914 | Quantum Corp.* | 101,514 | |||||||||
| 4,567 | Quest Software, Inc.* | 77,685 | |||||||||
| 735 | Rackable Systems, Inc.* | 8,644 | |||||||||
| 1,962 | Rambus, Inc.* | 38,867 | |||||||||
| 7,750 | RealNetworks, Inc.* | 58,513 | |||||||||
| 1,173 | Red Hat, Inc.* | 24,797 | |||||||||
| 2,908 | Renaissance Learning, Inc. | 35,478 | |||||||||
| 9,177 | RF Micro Devices, Inc.* | 57,356 | |||||||||
| 140 | Riverbed Technology, Inc.* | 4,467 | |||||||||
| 679 | Rofin-Sinar Technologies, Inc.* | 45,004 | |||||||||
| 813 | Rogers Corp.* | 36,861 | |||||||||
| 940 | Rudolph Technologies, Inc.* | 16,234 | |||||||||
| 5,620 | S1 Corp.* | 36,530 | |||||||||
| 1,418 | Saifun Semiconductors Ltd. (Israel)* | 15,286 | |||||||||
| 425 | Salesforce.com, Inc.* | 17,850 | |||||||||
| 3,334 | Sapient Corp.* | 24,105 | |||||||||
| 2,412 | ScanSource, Inc.* | 69,273 | |||||||||
| 1,686 | SeaChange International, Inc.* | 14,500 | |||||||||
| 3,642 | Semtech Corp.* | 52,518 | |||||||||
See Notes to Financial Statements.
41
Schedule of Investments (Continued)
PowerShares FTSE RAFI US 1500 Small-Mid Portfolio
April 30, 2007
| Number of Shares | Value | ||||||||||
| Common Stocks (Continued) | |||||||||||
| 1,926 | Silicon Image, Inc.* | $ | 16,872 | ||||||||
| 2,031 | Silicon Laboratories, Inc.* | 66,637 | |||||||||
| 6,658 | Silicon Storage Technology, Inc.* | 27,431 | |||||||||
| 940 | Sina Corp. (Cayman Islands)* | 32,411 | |||||||||
| 754 | Sirf Technology Holdings, Inc.* | 18,292 | |||||||||
| 13,295 | Skyworks Solutions, Inc.* | 91,603 | |||||||||
| 709 | Sohu.com, Inc.* | 17,952 | |||||||||
| 675 | Sonic Solutions, Inc.* | 8,795 | |||||||||
| 3,026 | SonicWALL, Inc.* | 24,692 | |||||||||
| 2,301 | Sonus Networks, Inc.* | 17,787 | |||||||||
| 737 | SPSS, Inc.* | 27,018 | |||||||||
| 2,609 | SRA International, Inc., Class A* | 63,738 | |||||||||
| 1,056 | Standard Microsystems Corp.* | 33,855 | |||||||||
| 287 | Supertex, Inc.* | 9,399 | |||||||||
| 5,104 | Sybase, Inc.* | 123,466 | |||||||||
| 10,858 | Sycamore Networks, Inc.* | 39,849 | |||||||||
| 2,766 | Sykes Enterprises, Inc.* | 51,060 | |||||||||
| 2,789 | Symmetricom, Inc.* | 22,786 | |||||||||
| 819 | Synaptics, Inc.* | 24,537 | |||||||||
| 1,637 | Syntel, Inc. | 57,393 | |||||||||
| 6,399 | Take-Two Interactive Software, Inc.* | 122,669 | |||||||||
| 518 | Talx Corp. | 17,866 | |||||||||
| 2,283 | Technitrol, Inc. | 61,253 | |||||||||
| 4,011 | Tekelec* | 57,518 | |||||||||
| 3,959 | Tektronix, Inc. | 116,355 | |||||||||
| 482 | Tessera Technologies, Inc.* | 20,625 | |||||||||
| 2,735 | THQ, Inc.* | 91,267 | |||||||||
| 8,730 | TIBCO Software, Inc.* | 79,618 | |||||||||
| 2,116 | TNS, Inc.* | 25,688 | |||||||||
| 1,122 | Transaction Systems Architects, Inc.* | 35,601 | |||||||||
| 409 | Trident Microsystems, Inc.* | 8,683 | |||||||||
| 3,083 | Trimble Navigation Ltd.* | 88,420 | |||||||||
| 9,845 | Triquint Semiconductor, Inc.* | 50,899 | |||||||||
| 1,369 | Tyler Technologies, Inc.* | 16,360 | |||||||||
| 133 | Ultimate Software Group, Inc.* | 3,671 | |||||||||
| 3,186 | United Online, Inc. | 45,974 | |||||||||
| 1,947 | ValueClick, Inc.* | 55,684 | |||||||||
| 1,645 | Varian Semiconductor Equipment Associates, Inc.* | 109,162 | |||||||||
| 1,710 | Veeco Instruments, Inc.* | 31,259 | |||||||||
| 1,142 | VeriFone Holdings, Inc.* | 40,301 | |||||||||
| 1,431 | Verigy Ltd. (Singapore)* | 36,161 | |||||||||
| 895 | Viasat, Inc.* | 30,699 | |||||||||
| 1,418 | Vignette Corp.* | 26,261 | |||||||||
| 282 | VistaPrint Ltd. (Bermuda)* | 10,541 | |||||||||
| 929 | WebEx Communications, Inc.* | 52,711 | |||||||||
| 2,238 | webMethods, Inc.* | 20,343 | |||||||||
| 1,054 | Websense, Inc.* | 26,044 | |||||||||
| 3,006 | Wind River Systems, Inc.* | 29,549 | |||||||||
| 783 | Witness Systems, Inc.* | 21,345 | |||||||||
| 1,204 | Wright Express Corp.* | 37,938 | |||||||||
| 908 | Xyratex Ltd. (Bermuda)* | 20,321 | |||||||||
| Number of Shares | Value | ||||||||||
| Common Stocks (Continued) | |||||||||||
| 2,896 | Zebra Technologies Corp., Class A* | $ | 115,232 | ||||||||
| 2,820 | Zoran Corp.* | 56,005 | |||||||||
| 12,942,841 | |||||||||||
| Materials—5.5% | |||||||||||
| 4,431 | A. Schulman, Inc. | 102,622 | |||||||||
| 1,449 | AMCOL International Corp. | 34,819 | |||||||||
| 1,164 | Apex Silver Mines Ltd. (Cayman Islands)* | 17,448 | |||||||||
| 2,008 | AptarGroup, Inc. | 147,087 | |||||||||
| 2,989 | Arch Chemicals, Inc. | 90,328 | |||||||||
| 5,736 | Buckeye Technologies, Inc.* | 72,675 | |||||||||
| 6,069 | Caraustar Industries, Inc.* | 43,211 | |||||||||
| 1,022 | Carpenter Technology Corp. | 124,040 | |||||||||
| 1,355 | Century Aluminum Co.* | 64,105 | |||||||||
| 2,673 | CF Industries Holdings, Inc. | 106,091 | |||||||||
| 1,415 | Chaparral Steel Co. | 99,758 | |||||||||
| 5,358 | Chesapeake Corp. | 79,084 | |||||||||
| 1,442 | Cleveland-Cliffs, Inc. | 99,916 | |||||||||
| 5,920 | Coeur d'Alene Mines Corp.* | 24,213 | |||||||||
| 2,733 | Compass Minerals International, Inc. | 93,851 | |||||||||
| 468 | Deltic Timber Corp. | 23,377 | |||||||||
| 2,285 | Eagle Materials, Inc. | 101,934 | |||||||||
| 6,349 | Ferro Corp. | 132,123 | |||||||||
| 2,085 | Florida Rock Industries, Inc. | 144,115 | |||||||||
| 6,048 | Georgia Gulf Corp. | 96,587 | |||||||||
| 3,044 | Gibraltar Industries, Inc. | 67,881 | |||||||||
| 5,317 | Glatfelter | 79,489 | |||||||||
| 4,574 | H.B. Fuller Co. | 116,957 | |||||||||
| 3,818 | Headwaters, Inc.* | 82,736 | |||||||||
| 2,004 | Hecla Mining Co.* | 17,655 | |||||||||
| 1,067 | Innospec, Inc. | 57,287 | |||||||||
| 1,461 | Metal Management, Inc. | 70,230 | |||||||||
| 1,542 | Minerals Technologies, Inc. | 98,102 | |||||||||
| 3,683 | Myers Industries, Inc. | 82,683 | |||||||||
| 1,409 | Neenah Paper, Inc. | 53,824 | |||||||||
| 1,640 | NewMarket Corp. | 77,293 | |||||||||
| 11,566 | NL Industries, Inc. | 137,057 | |||||||||
| 2,574 | OM Group, Inc.* | 135,212 | |||||||||
| 18,064 | PolyOne Corp.* | 118,500 | |||||||||
| 3,005 | Quanex Corp. | 129,305 | |||||||||
| 3,807 | Rock-Tenn Co., Class A | 145,657 | |||||||||
| 301 | Royal Gold, Inc. | 8,828 | |||||||||
| 478 | RTI International Metals, Inc.* | 45,061 | |||||||||
| 4,044 | Ryerson, Inc. | 166,371 | |||||||||
| 1,664 | Schnitzer Steel Industries, Inc., Class A | 86,378 | |||||||||
| 2,507 | Schweitzer-Mauduit International, Inc. | 68,817 | |||||||||
| 5,309 | Sensient Technologies Corp. | 138,990 | |||||||||
| 3,410 | Spartech Corp. | 95,685 | |||||||||
| 2,005 | Stepan Co. | 57,423 | |||||||||
| 5,269 | Stillwater Mining Co.* | 81,143 | |||||||||
| 1,339 | Symyx Technologies, Inc.* | 15,412 | |||||||||
| 7,074 | Terra Industries, Inc.* | 124,785 | |||||||||
See Notes to Financial Statements.
42
Schedule of Investments (Continued)
PowerShares FTSE RAFI US 1500 Small-Mid Portfolio
April 30, 2007
| Number of Shares | Value | ||||||||||
| Common Stocks (Continued) | |||||||||||
| 1,714 | Texas Industries, Inc. | $ | 130,555 | ||||||||
| 2,243 | Titanium Metals Corp.* | 77,451 | |||||||||
| 2,446 | Tronox, Inc., Class A | 34,562 | |||||||||
| 3,050 | Tronox, Inc., Class B | 42,304 | |||||||||
| 4,399 | W.R. Grace & Co.* | 117,013 | |||||||||
| 6,120 | Wausau Paper Corp. | 82,375 | |||||||||
| 4,605 | Westlake Chemical Corp. | 134,420 | |||||||||
| 2,543 | Wheeling-Pittsburgh Corp.* | 61,388 | |||||||||
| 142 | Zoltek Cos., Inc.* | 4,322 | |||||||||
| 4,740,535 | |||||||||||
| Telecommunication Services—1.8% | |||||||||||
| 2,677 | Alaska Communications Systems Group, Inc. | 42,564 | |||||||||
| 199 | Cbeyond, Inc.* | 6,921 | |||||||||
| 9,920 | Centennial Communications Corp. | 82,634 | |||||||||
| 405 | Cogent Communications Group, Inc.* | 10,311 | |||||||||
| 1,307 | CT Communications, Inc. | 31,904 | |||||||||
| 14,417 | Dobson Communications Corp., Class A* | 131,339 | |||||||||
| 2,774 | FairPoint Communications, Inc. | 52,040 | |||||||||
| 4,295 | General Communication, Inc., Class A* | 61,118 | |||||||||
| 1,046 | Global Crossing Ltd. (Bermuda)* | 30,167 | |||||||||
| 1,523 | Golden Telecom, Inc. | 89,263 | |||||||||
| 2,097 | IDT Corp. | 22,207 | |||||||||
| 7,796 | IDT Corp., Class B | 86,146 | |||||||||
| 619 | InPhonic, Inc.* | 5,905 | |||||||||
| 2,784 | Iowa Telecommunications Services, Inc. | 56,543 | |||||||||
| 481 | iPCS, Inc.* | 24,098 | |||||||||
| 1,949 | Leap Wireless International, Inc.* | 148,766 | |||||||||
| 1,820 | Millicom International Cellular S.A. (Luxembourg)* | 147,875 | |||||||||
| 892 | NeuStar, Inc., Class A* | 25,654 | |||||||||
| 1,435 | North Pittsburgh Systems, Inc. | 29,791 | |||||||||
| 2,885 | NTELOS Holdings Corp. | 58,104 | |||||||||
| 5,541 | Premiere Global Services, Inc.* | 67,434 | |||||||||
| 1,250 | SBA Communications Corp., Class A* | 36,775 | |||||||||
| 2,058 | SureWest Communications | 52,109 | |||||||||
| 5,585 | Syniverse Holdings, Inc.* | 57,581 | |||||||||
| 4,471 | Time Warner Telecom, Inc., Class A* | 91,656 | |||||||||
| 5,083 | USA Mobility, Inc.* | 108,573 | |||||||||
| 1,538 | Vonage Holdings Corp.* | 4,722 | |||||||||
| 1,562,200 | |||||||||||
| Utilities—1.4% | |||||||||||
| 1,375 | American States Water Co. | 49,005 | |||||||||
| 1,673 | California Water Service Group | 65,030 | |||||||||
| 1,518 | Cascade Natural Gas Corp. | 39,468 | |||||||||
| 1,730 | Central Vermont Public Service Corp. | 55,706 | |||||||||
| 2,475 | CH Energy Group, Inc. | 118,750 | |||||||||
| 5,333 | El Paso Electric Co.* | 140,790 | |||||||||
| 3,718 | Empire District Electric (The) Co. | 91,835 | |||||||||
| 849 | ITC Holdings Corp. | 35,726 | |||||||||
| 3,499 | Laclede Group (The), Inc. | 109,834 | |||||||||
| 2,388 | MGE Energy, Inc. | 86,255 | |||||||||
| Number of Shares | Value | ||||||||||
| Common Stocks (Continued) | |||||||||||
| 2,913 | Northwest Natural Gas Co. | $ | 148,009 | ||||||||
| 716 | Ormat Technologies, Inc. | 26,127 | |||||||||
| 3,381 | Otter Tail Corp. | 115,630 | |||||||||
| 1,054 | SJW Corp. | 36,532 | |||||||||
| 2,618 | South Jersey Industries, Inc. | 102,809 | |||||||||
| 1,221,506 | |||||||||||
| Total Common Stocks (Cost $82,105,408) | 85,038,865 | ||||||||||
| Money Market Fund—0.2% | |||||||||||
| 140,705 | Liquid Assets Portfolio Private Class** (Cost $140,705) | 140,705 | |||||||||
| Total Investments (Cost $82,246,113)—99.4% | 85,179,570 | ||||||||||
| Other assets less liabilities—0.6% | 500,306 | ||||||||||
| Net Assets—100.0% | $ | 85,679,876 | |||||||||
* Non-income producing security.
** Affiliated investment.
COUNTRY BREAKDOWN
April 30, 2007 (Unaudited)
| Value | Net Assets | ||||||||||
| United States | $ | 81,882,710 | 95.5 | % | |||||||
| Bermuda | 1,460,142 | 1.7 | |||||||||
| Marshall Islands | 496,422 | 0.6 | |||||||||
| Cayman Islands | 418,013 | 0.5 | |||||||||
| Singapore | 150,894 | 0.2 | |||||||||
| Israel | 149,418 | 0.2 | |||||||||
| Luxembourg | 147,875 | 0.2 | |||||||||
| Virgin Islands | 133,622 | 0.2 | |||||||||
| Canada | 110,725 | 0.1 | |||||||||
| Netherlands | 101,270 | 0.1 | |||||||||
| Panama | 94,495 | 0.1 | |||||||||
| Bahamas | 33,984 | 0.0 | |||||||||
| Total investments | 85,179,570 | 99.4 | |||||||||
| Other assets less liabilities | 500,306 | 0.6 | |||||||||
| Net Assets | $ | 85,679,876 | 100.0 | % | |||||||
See Notes to Financial Statements.
43
Schedule of Investments
PowerShares FTSE RAFI Basic Materials Sector Portfolio
April 30, 2007
| Number of Shares | Value | ||||||||||
| Common Stocks—97.8% | |||||||||||
| Chemicals—54.1% | |||||||||||
| 11,331 | Air Products & Chemicals, Inc. | $ | 866,822 | ||||||||
| 3,105 | Airgas, Inc. | 138,328 | |||||||||
| 3,353 | Albemarle Corp. | 142,335 | |||||||||
| 4,219 | Cabot Corp. | 191,121 | |||||||||
| 14,593 | Celanese Corp., Series A | 484,050 | |||||||||
| 12,622 | Chemtura Corp. | 139,221 | |||||||||
| 1,295 | Cytec Industries, Inc. | 71,096 | |||||||||
| 59,972 | Dow Chemical (The) Co. | 2,675,350 | |||||||||
| 38,551 | E.I. du Pont de Nemours and Co. | 1,895,552 | |||||||||
| 8,669 | Eastman Chemical Co. | 586,891 | |||||||||
| 8,776 | Ecolab, Inc. | 377,280 | |||||||||
| 2,689 | FMC Corp. | 206,865 | |||||||||
| 4,192 | Hercules, Inc.* | 78,977 | |||||||||
| 24,287 | Huntsman Corp. | 476,025 | |||||||||
| 4,899 | International Flavors & Fragrances, Inc. | 238,434 | |||||||||
| 5,047 | Lubrizol (The) Corp. | 302,517 | |||||||||
| 10,331 | Lyondell Chemical Co. | 321,501 | |||||||||
| 14,132 | Monsanto Co. | 833,647 | |||||||||
| 9,058 | Mosaic (The) Co.* | 267,211 | |||||||||
| 8,247 | Olin Corp. | 141,354 | |||||||||
| 14,451 | PPG Industries, Inc. | 1,063,305 | |||||||||
| 12,574 | Praxair, Inc. | 811,652 | |||||||||
| 5,974 | Rockwood Holdings, Inc.* | 183,402 | |||||||||
| 9,341 | Rohm & Haas Co. | 477,979 | |||||||||
| 5,237 | RPM International, Inc. | 111,391 | |||||||||
| 4,655 | Sigma-Aldrich Corp. | 195,882 | |||||||||
| 5,795 | Valhi, Inc. | 97,240 | |||||||||
| 7,105 | Valspar (The) Corp. | 192,119 | |||||||||
| 13,567,547 | |||||||||||
| Coal—4.3% | |||||||||||
| 4,573 | Arch Coal, Inc. | 164,948 | |||||||||
| 5,412 | CONSOL Energy, Inc. | 226,601 | |||||||||
| 5,429 | Foundation Coal Holdings, Inc. | 213,848 | |||||||||
| 5,493 | Massey Energy Co. | 147,926 | |||||||||
| 6,926 | Peabody Energy Corp. | 332,310 | |||||||||
| 1,085,633 | |||||||||||
| Forest Products & Paper—12.4% | |||||||||||
| 58,513 | International Paper Co. | 2,207,111 | |||||||||
| 11,297 | Weyerhaeuser Co. | 894,948 | |||||||||
| 3,102,059 | |||||||||||
| Household Products/Wares—1.0% | |||||||||||
| 3,972 | Avery Dennison Corp. | 247,058 | |||||||||
| Iron/Steel—8.5% | |||||||||||
| 6,968 | AK Steel Holding Corp.* | 212,663 | |||||||||
| 1,604 | Allegheny Technologies, Inc. | 175,766 | |||||||||
| 11,538 | Nucor Corp. | 732,202 | |||||||||
| 3,252 | Reliance Steel & Aluminum Co. | 193,169 | |||||||||
| Number of Shares | Value | ||||||||||
| Common Stocks (Continued) | |||||||||||
| 3,466 | Steel Dynamics, Inc. | $ | 153,578 | ||||||||
| 6,464 | United States Steel Corp. | 656,355 | |||||||||
| 2,123,733 | |||||||||||
| Metal Fabricate/Hardware—1.7% | |||||||||||
| 6,821 | Commercial Metals Co. | 228,708 | |||||||||
| 9,457 | Worthington Industries, Inc. | 210,418 | |||||||||
| 439,126 | |||||||||||
| Mining—15.8% | |||||||||||
| 68,500 | Alcoa, Inc. | 2,431,064 | |||||||||
| 8,793 | Freeport-McMoRan Copper & Gold, Inc., Class B | 590,538 | |||||||||
| 8,433 | Southern Copper Corp. | 677,170 | |||||||||
| 2,218 | Titanium Metals Corp.* | 76,588 | |||||||||
| 9,669 | USEC, Inc.* | 195,024 | |||||||||
| 3,970,384 | |||||||||||
| Total Common Stocks (Cost $21,176,326) | 24,535,540 | ||||||||||
| Money Market Fund—0.4% | |||||||||||
| 121,578 | Liquid Assets Portfolio Private Class** (Cost $121,578) | 121,578 | |||||||||
| Total Investments (Cost $21,270,492)—98.2% | 24,657,118 | ||||||||||
| Other assets less liabilities—1.8% | 424,872 | ||||||||||
| Net Assets—100.0% | $ | 25,081,990 | |||||||||
* Non-income producing security.
** Affiliated investment.
See Notes to Financial Statements.
44
Schedule of Investments
PowerShares FTSE RAFI Consumer Goods Sector Portfolio
April 30, 2007
| Number of Shares | Value | ||||||||||
| Common Stocks—99.5% | |||||||||||
| Agriculture—14.9% | |||||||||||
| 22,309 | Altria Group, Inc. | $ | 1,537,536 | ||||||||
| 6,624 | Archer-Daniels-Midland Co. | 256,349 | |||||||||
| 1,607 | Bunge Ltd. (Bermuda) | 121,746 | |||||||||
| 1,656 | Loews Corp. - Carolina Group | 126,734 | |||||||||
| 3,746 | Reynolds American, Inc. | 240,718 | |||||||||
| 556 | Universal Corp. | 34,850 | |||||||||
| 1,538 | UST, Inc. | 87,174 | |||||||||
| 2,405,107 | |||||||||||
| Apparel—3.0% | |||||||||||
| 539 | Coach, Inc.* | 26,319 | |||||||||
| 2,184 | Hanesbrands, Inc.* | 58,073 | |||||||||
| 1,635 | Jones Apparel Group, Inc. | 54,593 | |||||||||
| 593 | Kellwood Co. | 16,711 | |||||||||
| 1,017 | Liz Claiborne, Inc. | 45,480 | |||||||||
| 2,770 | Nike, Inc., Class B | 149,192 | |||||||||
| 355 | Polo Ralph Lauren Corp. | 32,699 | |||||||||
| 670 | Timberland Co., Class A* | 17,293 | |||||||||
| 979 | VF Corp. | 85,966 | |||||||||
| 486,326 | |||||||||||
| Auto Manufacturers—18.7% | |||||||||||
| 182,357 | Ford Motor Co.* | 1,466,151 | |||||||||
| 50,032 | General Motors Corp. | 1,562,500 | |||||||||
| 3,028,651 | |||||||||||
| Auto Parts & Equipment—5.6% | |||||||||||
| 1,272 | American Axle & Manufacturing Holdings, Inc. | 35,552 | |||||||||
| 2,885 | ArvinMeritor, Inc. | 59,575 | |||||||||
| 1,067 | Autoliv, Inc. | 62,046 | |||||||||
| 513 | BorgWarner, Inc. | 39,968 | |||||||||
| 1,971 | Cooper Tire & Rubber Co. | 38,099 | |||||||||
| 4,085 | Goodyear Tire & Rubber (The) Co.* | 135,867 | |||||||||
| 1,942 | Johnson Controls, Inc. | 198,726 | |||||||||
| 2,527 | Lear Corp.* | 92,791 | |||||||||
| 1,305 | Tenneco, Inc.* | 39,085 | |||||||||
| 3,300 | TRW Automotive Holdings Corp.* | 122,298 | |||||||||
| 9,810 | Visteon Corp.* | 89,467 | |||||||||
| 913,474 | |||||||||||
| Beverages—13.5% | |||||||||||
| 5,997 | Anheuser-Busch Cos., Inc. | 294,992 | |||||||||
| 210 | Brown-Forman Corp., Class A | 14,066 | |||||||||
| 458 | Brown-Forman Corp., Class B | 29,280 | |||||||||
| 15,494 | Coca-Cola (The) Co. | 808,633 | |||||||||
| 8,561 | Coca-Cola Enterprises, Inc. | 187,828 | |||||||||
| 2,271 | Constellation Brands, Inc., Class A* | 50,893 | |||||||||
| 816 | Molson Coors Brewing Co., Class B | 76,932 | |||||||||
| 2,930 | Pepsi Bottling Group, Inc. | 96,133 | |||||||||
| 1,777 | PepsiAmericas, Inc. | 42,897 | |||||||||
| 8,937 | PepsiCo, Inc. | 590,646 | |||||||||
| 2,192,300 | |||||||||||
| Number of Shares | Value | ||||||||||
| Common Stocks (Continued) | |||||||||||
| Cosmetics/Personal Care—8.3% | |||||||||||
| 1,520 | Alberto-Culver Co. | $ | 36,921 | ||||||||
| 2,707 | Avon Products, Inc. | 107,739 | |||||||||
| 2,817 | Colgate-Palmolive Co. | 190,824 | |||||||||
| 1,250 | Estee Lauder (The) Cos., Inc., Class A | 64,275 | |||||||||
| 14,632 | Procter & Gamble Co. | 940,983 | |||||||||
| 1,340,742 | |||||||||||
| Distribution/Wholesale—0.7% | |||||||||||
| 2,130 | Genuine Parts Co. | 105,243 | |||||||||
| Electrical Components & Equipment—0.2% | |||||||||||
| 336 | Energizer Holdings, Inc.* | 32,652 | |||||||||
| Electronics—0.1% | |||||||||||
| 392 | Garmin Ltd. (Cayman Islands) | 22,810 | |||||||||
| Food—19.2% | |||||||||||
| 2,839 | Campbell Soup Co. | 111,005 | |||||||||
| 1,429 | Chiquita Brands International, Inc.* | 21,192 | |||||||||
| 9,610 | ConAgra Foods, Inc. | 236,215 | |||||||||
| 806 | Corn Products International, Inc. | 32,095 | |||||||||
| 1,950 | Dean Foods Co. | 71,039 | |||||||||
| 2,780 | Del Monte Foods Co. | 32,248 | |||||||||
| 1,523 | Fresh Del Monte Produce, Inc. (Cayman Islands) | 31,024 | |||||||||
| 3,379 | General Mills, Inc. | 202,402 | |||||||||
| 3,800 | H.J. Heinz Co. | 179,018 | |||||||||
| 1,536 | Hershey (The) Co. | 84,419 | |||||||||
| 1,294 | Hormel Foods Corp. | 49,288 | |||||||||
| 510 | J.M. Smucker (The) Co. | 28,468 | |||||||||
| 3,430 | Kellogg Co. | 181,481 | |||||||||
| 35,419 | Kraft Foods, Inc., Class A | 1,185,475 | |||||||||
| 904 | McCormick & Co., Inc. | 33,556 | |||||||||
| 920 | Pilgrim's Pride Corp. | 33,589 | |||||||||
| 14,081 | Sara Lee Corp. | 231,069 | |||||||||
| 9 | Seaboard Corp. | 22,437 | |||||||||
| 2,546 | Smithfield Foods, Inc.* | 77,831 | |||||||||
| 8,197 | Tyson Foods, Inc., Class A | 171,809 | |||||||||
| 1,607 | Wm. Wrigley Jr. Co. | 94,620 | |||||||||
| 3,110,280 | |||||||||||
| Hand/Machine Tools—0.9% | |||||||||||
| 626 | Black & Decker Corp. | 56,791 | |||||||||
| 608 | Snap-On, Inc. | 33,136 | |||||||||
| 830 | Stanley Works (The) | 48,372 | |||||||||
| 138,299 | |||||||||||
| Home Builders—4.7% | |||||||||||
| 792 | Beazer Homes USA, Inc. | 26,437 | |||||||||
| 1,928 | Centex Corp. | 86,317 | |||||||||
| 4,145 | DR Horton, Inc. | 91,936 | |||||||||
| 1,520 | Hovnanian Enterprises, Inc., Class A* | 36,465 | |||||||||
| 1,277 | KB Home | 56,328 | |||||||||
See Notes to Financial Statements.
45
Schedule of Investments (Continued)
PowerShares FTSE RAFI Consumer Goods Sector Portfolio
April 30, 2007
| Number of Shares | Value | ||||||||||
| Common Stocks (Continued) | |||||||||||
| 2,197 | Lennar Corp., Class A | $ | 93,834 | ||||||||
| 780 | MDC Holdings, Inc. | 39,983 | |||||||||
| 565 | Meritage Homes Corp.* | 19,668 | |||||||||
| 73 | NVR, Inc.* | 60,152 | |||||||||
| 3,662 | Pulte Homes, Inc. | 98,507 | |||||||||
| 746 | Ryland Group, Inc. | 33,048 | |||||||||
| 1,212 | Standard-Pacific Corp. | 25,270 | |||||||||
| 2,068 | Toll Brothers, Inc.* | 61,585 | |||||||||
| 1,225 | WCI Communities, Inc.* | 26,754 | |||||||||
| 756,284 | |||||||||||
| Home Furnishings—1.2% | |||||||||||
| 1,343 | Furniture Brands International, Inc. | 21,595 | |||||||||
| 229 | Harman International Industries, Inc. | 27,913 | |||||||||
| 1,370 | La-Z-Boy, Inc. | 16,015 | |||||||||
| 1,200 | Whirlpool Corp. | 127,237 | |||||||||
| 192,760 | |||||||||||
| Household Products/Wares—3.0% | |||||||||||
| 1,523 | ACCO Brands Corp.* | 36,247 | |||||||||
| 1,149 | Clorox Co. | 77,075 | |||||||||
| 4,321 | Kimberly-Clark Corp. | 307,525 | |||||||||
| 431 | Scotts Miracle-Gro (The) Co., Class A | 19,382 | |||||||||
| 2,078 | Spectrum Brands, Inc.* | 14,463 | |||||||||
| 847 | Tupperware Brands Corp. | 23,818 | |||||||||
| 478,510 | |||||||||||
| Housewares—0.6% | |||||||||||
| 3,276 | Newell Rubbermaid, Inc. | 100,475 | |||||||||
| Leisure Time—0.9% | |||||||||||
| 1,492 | Brunswick Corp. | 48,878 | |||||||||
| 1,268 | Harley-Davidson, Inc. | 80,289 | |||||||||
| 375 | Polaris Industries, Inc. | 18,949 | |||||||||
| 148,116 | |||||||||||
| Machinery-Diversified—0.1% | |||||||||||
| 784 | Briggs & Stratton Corp. | 23,261 | |||||||||
| Miscellaneous Manufacturing—1.5% | |||||||||||
| 7,342 | Eastman Kodak Co. | 182,889 | |||||||||
| 2,631 | Leggett & Platt, Inc. | 61,881 | |||||||||
| 244,770 | |||||||||||
| Office Furnishings—0.3% | |||||||||||
| 448 | HNI Corp. | 18,700 | |||||||||
| 1,648 | Steelcase, Inc., Class A | 32,168 | |||||||||
| 50,868 | |||||||||||
| Pharmaceuticals—0.1% | |||||||||||
| 378 | NBTY, Inc.* | 18,677 | |||||||||
| Number of Shares | Value | ||||||||||
| Common Stocks (Continued) | |||||||||||
| Software—0.5% | |||||||||||
| 1,069 | Activision, Inc.* | $ | 21,380 | ||||||||
| 1,125 | Electronic Arts, Inc.* | 56,711 | |||||||||
| 78,091 | |||||||||||
| Textiles—0.7% | |||||||||||
| 1,101 | Cintas Corp. | 41,254 | |||||||||
| 813 | Mohawk Industries, Inc.* | 73,301 | |||||||||
| 114,555 | |||||||||||
| Toys/Games/Hobbies—0.8% | |||||||||||
| 1,360 | Hasbro, Inc. | 42,990 | |||||||||
| 2,920 | Mattel, Inc. | 82,636 | |||||||||
| 125,626 | |||||||||||
| Total Common Stocks (Cost $14,885,390) | 16,107,877 | ||||||||||
| Money Market Fund—0.7% | |||||||||||
| 106,031 | Liquid Assets Portfolio Private Class** (Cost $106,031) | 106,031 | |||||||||
| Total Investments (Cost $14,991,421)—100.2% | 16,213,908 | ||||||||||
| Liabilities in excess of other assets—(0.2%) | (26,997 | ) | |||||||||
| Net Assets—100.0% | $ | 16,186,911 | |||||||||
* Non-income producing security.
** Affiliated investment.
COUNTRY BREAKDOWN
April 30, 2007 (Unaudited)
| Value | Net Assets | ||||||||||
| United States | $ | 16,038,328 | 99.1 | % | |||||||
| Bermuda | 121,746 | 0.8 | |||||||||
| Cayman Islands | 53,834 | 0.3 | |||||||||
| Total investments | 16,213,908 | 100.2 | |||||||||
| Liabilities in excess of other assets | (26,997 | ) | (0.2 | ) | |||||||
| Net Assets | $ | 16,186,911 | 100.0 | % | |||||||
See Notes to Financial Statements.
46
Schedule of Investments
PowerShares FTSE RAFI Consumer Services Sector Portfolio
April 30, 2007
| Number of Shares | Value | ||||||||||
| Common Stocks—99.3% | |||||||||||
| Advertising—1.5% | |||||||||||
| 928 | Clear Channel Outdoor Holdings, Inc., Class A* | $ | 26,494 | ||||||||
| 225 | Getty Images, Inc.* | 11,700 | |||||||||
| 2,835 | Interpublic Group of Cos., Inc.* | 35,948 | |||||||||
| 307 | Lamar Advertising Co., Class A* | 18,524 | |||||||||
| 707 | Omnicom Group, Inc. | 74,031 | |||||||||
| 166,697 | |||||||||||
| Airlines—1.3% | |||||||||||
| 375 | Alaska Air Group, Inc.* | 11,100 | |||||||||
| 1,659 | AMR Corp.* | 43,283 | |||||||||
| 979 | Continental Airlines, Inc., Class B* | 35,792 | |||||||||
| 3,797 | Southwest Airlines Co. | 54,488 | |||||||||
| 144,663 | |||||||||||
| Commercial Services—5.1% | |||||||||||
| 364 | Apollo Group, Inc., Class A* | 17,217 | |||||||||
| 6,728 | Avis Budget Group, Inc. | 189,259 | |||||||||
| 485 | Career Education Corp.* | 14,327 | |||||||||
| 354 | Dollar Thrifty Automotive Group* | 16,596 | |||||||||
| 2,258 | H&R Block, Inc. | 51,053 | |||||||||
| 623 | Live Nation, Inc.* | 12,641 | |||||||||
| 3,275 | McKesson Corp. | 192,668 | |||||||||
| 964 | Rent-A-Center, Inc.* | 26,838 | |||||||||
| 1,533 | Service Corp. International | 18,626 | |||||||||
| 2,378 | ServiceMaster (The) Co. | 36,597 | |||||||||
| 575,822 | |||||||||||
| Entertainment—0.9% | |||||||||||
| 745 | International Game Technology | 28,414 | |||||||||
| 2,536 | Regal Entertainment Group, Class A | 55,159 | |||||||||
| 2,276 | Six Flags, Inc.* | 13,565 | |||||||||
| 182 | Warner Music Group Corp. | 3,130 | |||||||||
| 100,268 | |||||||||||
| Food—7.2% | |||||||||||
| 971 | Great Atlantic & Pacific Tea Co. | 31,256 | |||||||||
| 10,241 | Kroger (The) Co. | 302,211 | |||||||||
| 443 | Nash Finch Co. | 17,264 | |||||||||
| 1,446 | Pathmark Stores, Inc.* | 18,249 | |||||||||
| 766 | Performance Food Group Co.* | 23,938 | |||||||||
| 485 | Ruddick Corp. | 14,565 | |||||||||
| 4,204 | Safeway, Inc. | 152,604 | |||||||||
| 2,175 | SUPERVALU, Inc. | 99,833 | |||||||||
| 3,832 | Sysco Corp. | 125,460 | |||||||||
| 303 | Weis Markets, Inc. | 13,041 | |||||||||
| 404 | Whole Foods Market, Inc. | 18,903 | |||||||||
| 817,324 | |||||||||||
| Household Products/Wares—0.1% | |||||||||||
| 662 | American Greetings Corp., Class A | 16,848 | |||||||||
| Internet—3.1% | |||||||||||
| 652 | Amazon.com, Inc.* | 39,987 | |||||||||
| Number of Shares | Value | ||||||||||
| Common Stocks (Continued) | |||||||||||
| 2,425 | eBay, Inc.* | $ | 82,305 | ||||||||
| 1,758 | Expedia, Inc.* | 41,524 | |||||||||
| 1,975 | IAC/InterActiveCorp* | 75,287 | |||||||||
| 4,390 | Liberty Media Corp. – Interactive, Class A* | 109,881 | |||||||||
| 348,984 | |||||||||||
| Leisure Time—2.0% | |||||||||||
| 3,378 | Carnival Corp. (Panama) | 165,150 | |||||||||
| 1,426 | Royal Caribbean Cruises Ltd. (Liberia) | 59,279 | |||||||||
| 224,429 | |||||||||||
| Lodging—2.8% | |||||||||||
| 316 | Boyd Gaming Corp. | 14,378 | |||||||||
| 726 | Harrah's Entertainment, Inc. | 61,928 | |||||||||
| 1,085 | Hilton Hotels Corp. | 36,890 | |||||||||
| 160 | Las Vegas Sands Corp.* | 13,630 | |||||||||
| 808 | Marriott International, Inc., Class A | 36,530 | |||||||||
| 805 | MGM Mirage* | 54,136 | |||||||||
| 950 | Starwood Hotels & Resorts Worldwide, Inc. | 63,670 | |||||||||
| 139 | Station Casinos, Inc. | 12,093 | |||||||||
| 819 | Wyndham Worldwide Corp.* | 28,337 | |||||||||
| 321,592 | |||||||||||
| Media—24.3% | |||||||||||
| 1,072 | Belo Corp., Class A | 20,657 | |||||||||
| 882 | Cablevision Systems Corp., Class A | 28,912 | |||||||||
| 7,825 | CBS Corp., Class B | 248,600 | |||||||||
| 9,610 | Charter Communications, Inc., Class A* | 29,022 | |||||||||
| 2,815 | Clear Channel Communications, Inc. | 99,735 | |||||||||
| 9,682 | Comcast Corp., Class A* | 258,122 | |||||||||
| 5,026 | Comcast Corp., Special Class A* | 132,686 | |||||||||
| 3,304 | DIRECTV Group (The), Inc.* | 78,767 | |||||||||
| 1,549 | Discovery Holding Co., Class A* | 33,691 | |||||||||
| 492 | Dow Jones & Co., Inc. | 17,874 | |||||||||
| 951 | EchoStar Communications Corp., Class A* | 44,250 | |||||||||
| 589 | EW Scripps Co., Class A | 25,504 | |||||||||
| 1,779 | Gannett Co., Inc. | 101,510 | |||||||||
| 581 | Hearst-Argyle Television, Inc. | 15,472 | |||||||||
| 3,448 | Idearc, Inc.* | 119,818 | |||||||||
| 962 | Liberty Global, Inc., Class A* | 34,526 | |||||||||
| 963 | Liberty Global, Inc., Series C* | 32,174 | |||||||||
| 231 | Liberty Media Corp. - Capital, Series A* | 26,096 | |||||||||
| 1,094 | McGraw-Hill Cos. (The), Inc. | 71,690 | |||||||||
| 194 | Meredith Corp. | 11,236 | |||||||||
| 1,343 | New York Times (The) Co., Class A | 31,426 | |||||||||
| 6,599 | News Corp., Class A | 147,752 | |||||||||
| 3,003 | News Corp., Class B | 72,072 | |||||||||
| 488 | Scholastic Corp.* | 15,065 | |||||||||
| 4,175 | Sun-Times Media Group, Inc., Class A | 25,468 | |||||||||
| 26,706 | Time Warner, Inc. | 550,946 | |||||||||
| 2,621 | Tribune Co. | 85,969 | |||||||||
| 2,748 | Viacom, Inc., Class B* | 113,355 | |||||||||
| 8,476 | Walt Disney (The) Co. | 296,490 | |||||||||
| 2,768,885 | |||||||||||
See Notes to Financial Statements.
47
Schedule of Investments (Continued)
PowerShares FTSE RAFI Consumer Services Sector Portfolio
April 30, 2007
| Number of Shares | Value | ||||||||||
| Common Stocks (Continued) | |||||||||||
| Pharmaceuticals—3.0% | |||||||||||
| 2,333 | AmerisourceBergen Corp. | $ | 116,627 | ||||||||
| 2,998 | Cardinal Health, Inc. | 209,710 | |||||||||
| 655 | Omnicare, Inc. | 21,726 | |||||||||
| 348,063 | |||||||||||
| Retail—47.6% | |||||||||||
| 225 | Abercrombie & Fitch Co., Class A | 18,374 | |||||||||
| 621 | Advance Auto Parts, Inc. | 25,585 | |||||||||
| 464 | American Eagle Outfitters, Inc. | 13,674 | |||||||||
| 399 | AnnTaylor Stores Corp.* | 15,354 | |||||||||
| 619 | Asbury Automotive Group, Inc. | 17,809 | |||||||||
| 4,594 | AutoNation, Inc.* | 93,901 | |||||||||
| 313 | AutoZone, Inc.* | 41,642 | |||||||||
| 580 | Barnes & Noble, Inc. | 22,927 | |||||||||
| 876 | Bed Bath & Beyond, Inc.* | 35,688 | |||||||||
| 2,566 | Best Buy Co., Inc. | 119,704 | |||||||||
| 877 | Big Lots, Inc.* | 28,239 | |||||||||
| 984 | BJ's Wholesale Club, Inc.* | 33,978 | |||||||||
| 5,157 | Blockbuster, Inc., Class A* | 31,973 | |||||||||
| 3,102 | Blockbuster, Inc., Class B* | 17,961 | |||||||||
| 809 | Borders Group, Inc. | 17,078 | |||||||||
| 730 | Brinker International, Inc. | 22,703 | |||||||||
| 556 | Burger King Holdings, Inc. | 13,049 | |||||||||
| 558 | CarMax, Inc.* | 13,905 | |||||||||
| 282 | CBRL Group, Inc. | 12,572 | |||||||||
| 1,218 | Charming Shoppes, Inc.* | 15,225 | |||||||||
| 576 | Circuit City Stores, Inc. | 10,051 | |||||||||
| 365 | Claire's Stores, Inc. | 11,888 | |||||||||
| 2,947 | Costco Wholesale Corp. | 157,871 | |||||||||
| 11,949 | CVS Caremark Corp. | 433,032 | |||||||||
| 642 | Darden Restaurants, Inc. | 26,630 | |||||||||
| 1,027 | Dillard's, Inc., Class A | 35,565 | |||||||||
| 2,259 | Dollar General Corp. | 48,230 | |||||||||
| 599 | Dollar Tree Stores, Inc.* | 23,553 | |||||||||
| 1,002 | Family Dollar Stores, Inc. | 31,904 | |||||||||
| 2,999 | Federated Department Stores, Inc. | 131,716 | |||||||||
| 1,297 | Foot Locker, Inc. | 30,856 | |||||||||
| 546 | Gamestop Corp., Class A* | 18,111 | |||||||||
| 5,128 | Gap (The), Inc. | 92,048 | |||||||||
| 466 | Group 1 Automotive, Inc. | 19,106 | |||||||||
| 11,452 | Home Depot, Inc. | 433,686 | |||||||||
| 201 | Jack in the Box, Inc.* | 13,391 | |||||||||
| 1,365 | J. C. Penney Co., Inc. | 107,958 | |||||||||
| 1,323 | Kohl's Corp.* | 97,955 | |||||||||
| 399 | Longs Drug Stores Corp. | 21,841 | |||||||||
| 6,224 | Lowe's Cos., Inc. | 190,205 | |||||||||
| 2,983 | Ltd Brands, Inc. | 82,241 | |||||||||
| 5,217 | McDonald's Corp. | 251,877 | |||||||||
| 761 | Nordstrom, Inc. | 41,794 | |||||||||
| 761 | OfficeMax, Inc. | 37,456 | |||||||||
| 440 | O'Reilly Automotive, Inc.* | 15,664 | |||||||||
| Number of Shares | Value | ||||||||||
| Common Stocks (Continued) | |||||||||||
| 486 | OSI Restaurant Partners, Inc. | $ | 19,348 | ||||||||
| 301 | Pantry (The), Inc.* | 13,542 | |||||||||
| 528 | Payless Shoesource, Inc.* | 16,843 | |||||||||
| 756 | PEP Boys-Manny Moe & Jack | 14,099 | |||||||||
| 544 | PetSmart, Inc. | 18,055 | |||||||||
| 1,822 | Pier 1 Imports, Inc.* | 13,756 | |||||||||
| 1,068 | RadioShack Corp. | 31,047 | |||||||||
| 9,675 | Rite Aid Corp.* | 59,405 | |||||||||
| 638 | Ross Stores, Inc. | 21,150 | |||||||||
| 1,830 | Saks, Inc. | 38,320 | |||||||||
| 1,730 | Sally Beauty Holdings, Inc.* | 16,989 | |||||||||
| 965 | Sears Holdings Corp.* | 184,228 | |||||||||
| 833 | Sonic Automotive, Inc., Class A | 23,815 | |||||||||
| 5,628 | Staples, Inc. | 139,574 | |||||||||
| 1,244 | Starbucks Corp.* | 38,589 | |||||||||
| 497 | Talbots (The), Inc. | 11,680 | |||||||||
| 4,298 | Target Corp. | 255,172 | |||||||||
| 489 | Tiffany & Co. | 23,320 | |||||||||
| 389 | Tim Hortons, Inc. | 12,265 | |||||||||
| 2,461 | TJX Cos., Inc. | 68,637 | |||||||||
| 1,326 | United Auto Group, Inc. | 26,891 | |||||||||
| 26,454 | Wal-Mart Stores, Inc. | 1,267,675 | |||||||||
| 886 | Wendy's International, Inc. | 33,402 | |||||||||
| 644 | Williams-Sonoma, Inc. | 22,682 | |||||||||
| 889 | Yum! Brands, Inc. | 54,994 | |||||||||
| 618 | Zale Corp.* | 17,248 | |||||||||
| 5,418,696 | |||||||||||
| Software—0.1% | |||||||||||
| 146 | Dun & Bradstreet (The) Corp. | 13,184 | |||||||||
| Transportation—0.2% | |||||||||||
| 675 | Laidlaw International, Inc. | 23,119 | |||||||||
| Trucking & Leasing—0.1% | |||||||||||
| 218 | AMERCO, Inc.* | 15,251 | |||||||||
| Total Common Stocks (Cost $10,168,147) | 11,303,825 | ||||||||||
| Money Market Fund—0.3% | |||||||||||
| 31,646 | Liquid Assets Portfolio Private Class** (Cost $31,646) | 31,646 | |||||||||
| Total Investments (Cost $10,199,793)—99.6% | 11,335,471 | ||||||||||
| Other assets less liabilities—0.4% | 42,094 | ||||||||||
| Net Assets—100.0% | $ | 11,377,565 | |||||||||
* Non-income producing security.
** Affiliated investment
See Notes to Financial Statements.
48
Schedule of Investments (Continued)
PowerShares FTSE RAFI Consumer Services Sector Portfolio
April 30, 2007
COUNTRY BREAKDOWN
April 30, 2007 (Unaudited)
| Value | Net Assets | ||||||||||
| United States | $ | 11,111,042 | 97.7 | % | |||||||
| Panama | 165,150 | 1.4 | |||||||||
| Liberia | 59,279 | 0.5 | |||||||||
| Total investments | 11,335,471 | 99.6 | |||||||||
| Other assets less liabilities | 42,094 | 0.4 | |||||||||
| Net Assets | $ | 11,377,565 | 100.0 | % | |||||||
See Notes to Financial Statements.
49
Schedule of Investments
PowerShares FTSE RAFI Energy Sector Portfolio
April 30, 2007
| Number of Shares | Value | ||||||||||
| Common Stocks—100.2% | |||||||||||
| Electric—1.5% | |||||||||||
| 18,545 | Dynegy, Inc., Class A* | $ | 174,508 | ||||||||
| 2,759 | OGE Energy Corp. | 106,056 | |||||||||
| 280,564 | |||||||||||
| Oil & Gas—83.2% | |||||||||||
| 9,963 | Anadarko Petroleum Corp. | 464,874 | |||||||||
| 5,085 | Apache Corp. | 368,663 | |||||||||
| 4,972 | Chesapeake Energy Corp. | 167,805 | |||||||||
| 48,867 | Chevron Corp. | 3,801,363 | |||||||||
| 1,928 | Cimarex Energy Co. | 75,963 | |||||||||
| 1,863 | CNX Gas Corp.* | 52,276 | |||||||||
| 17,427 | ConocoPhillips | 1,208,561 | |||||||||
| 7,068 | Devon Energy Corp. | 515,045 | |||||||||
| 833 | Diamond Offshore Drilling, Inc. | 71,305 | |||||||||
| 1,171 | ENSCO International, Inc. | 66,021 | |||||||||
| 2,170 | EOG Resources, Inc. | 159,365 | |||||||||
| 49,665 | Exxon Mobil Corp. | 3,942,407 | |||||||||
| 2,150 | Forest Oil Corp.* | 75,766 | |||||||||
| 1,181 | Frontier Oil Corp. | 41,725 | |||||||||
| 1,934 | GlobalSantaFe Corp. (Cayman Islands) | 123,641 | |||||||||
| 6,363 | Hess Corp. | 361,100 | |||||||||
| 797 | Houston Exploration Co.* | 44,130 | |||||||||
| 8,166 | Marathon Oil Corp. | 829,257 | |||||||||
| 3,091 | Murphy Oil Corp. | 171,365 | |||||||||
| 4,105 | Nabors Industries Ltd. (Bermuda)* | 131,853 | |||||||||
| 2,405 | Newfield Exploration Co.* | 105,219 | |||||||||
| 892 | Noble Corp. (Cayman Islands) | 75,115 | |||||||||
| 1,510 | Noble Energy, Inc. | 88,803 | |||||||||
| 13,939 | Occidental Petroleum Corp. | 706,707 | |||||||||
| 1,894 | Patterson-UTI Energy, Inc. | 46,195 | |||||||||
| 2,107 | Pioneer Natural Resources Co. | 105,771 | |||||||||
| 1,464 | Pogo Producing Co. | 70,653 | |||||||||
| 2,800 | Pride International, Inc.* | 91,868 | |||||||||
| 1,239 | Rowan Cos., Inc. | 45,397 | |||||||||
| 905 | Southwestern Energy Co.* | 38,010 | |||||||||
| 1,430 | Stone Energy Corp.* | 42,371 | |||||||||
| 3,735 | Sunoco, Inc. | 282,105 | |||||||||
| 1,358 | Tesoro Corp. | 164,590 | |||||||||
| 2,144 | Transocean, Inc. (Cayman Islands)* | 184,813 | |||||||||
| 11,054 | Valero Energy Corp. | 776,322 | |||||||||
| 2,436 | XTO Energy, Inc. | 132,202 | |||||||||
| 15,628,626 | |||||||||||
| Oil & Gas Services—10.9% | |||||||||||
| 3,151 | Baker Hughes, Inc. | 253,309 | |||||||||
| 2,870 | BJ Services Co. | 82,254 | |||||||||
| 1,026 | Cameron International Corp.* | 66,249 | |||||||||
| 2,201 | Dresser-Rand Group, Inc.* | 70,234 | |||||||||
| 704 | FMC Technologies, Inc.* | 49,900 | |||||||||
| 828 | Grant Prideco, Inc.* | 42,675 | |||||||||
| 11,053 | Halliburton Co. | 351,154 | |||||||||
| 1,882 | Hanover Compressor Co.* | 40,708 | |||||||||
| Number of Shares | Value | ||||||||||
| Common Stocks (Continued) | |||||||||||
| 1,535 | National Oilwell Varco, Inc.* | $ | 130,245 | ||||||||
| 7,874 | Schlumberger Ltd. (Netherlands) | 581,336 | |||||||||
| 361 | SEACOR Holdings, Inc.* | 34,396 | |||||||||
| 1,723 | Smith International, Inc. | 90,354 | |||||||||
| 798 | Tidewater, Inc. | 50,442 | |||||||||
| 3,937 | Weatherford International Ltd. (Bermuda)* | 206,653 | |||||||||
| 2,049,909 | |||||||||||
| Pipelines—4.6% | |||||||||||
| 25,924 | El Paso Corp. | 388,860 | |||||||||
| 1,297 | Kinder Morgan, Inc. | 138,208 | |||||||||
| 11,511 | Williams Cos., Inc. | 339,575 | |||||||||
| 866,643 | |||||||||||
| Total Common Stocks (Cost $16,703,961) | 18,825,742 | ||||||||||
| Money Market Fund—0.3% | |||||||||||
| 46,362 | Liquid Assets Portfolio Private Class** (Cost $46,362) | 46,362 | |||||||||
| Total Investments (Cost $16,750,323)—100.5% | 18,872,104 | ||||||||||
| Liabilities in excess of other assets—(0.5%) | (84,597 | ) | |||||||||
| Net Assets—100.0% | $ | 18,787,507 | |||||||||
* Non-income producing security.
** Affiliated investment.
COUNTRY BREAKDOWN
April 30, 2007 (Unaudited)
| Value | Net Assets | ||||||||||
| United States | $ | 17,568,693 | 93.5 | % | |||||||
| Netherlands | 581,336 | 3.1 | |||||||||
| Cayman Islands | 383,569 | 2.1 | |||||||||
| Bermuda | 338,506 | 1.8 | |||||||||
| Total investments | 18,872,104 | 100.5 | |||||||||
| Liabilities in excess of other assets | (84,597 | ) | (0.5 | ) | |||||||
| Net Assets | $ | 18,787,507 | 100.0 | % | |||||||
See Notes to Financial Statements.
50
Schedule of Investments
PowerShares FTSE RAFI Financials Sector Portfolio
April 30, 2007
| Number of Shares | Value | ||||||||||
| Common Stocks—98.3% | |||||||||||
| Banks—23.3% | |||||||||||
| 665 | Associated Banc-Corp | $ | 21,533 | ||||||||
| 487 | BancorpSouth, Inc. | 11,966 | |||||||||
| 9,202 | Bank of America Corp. | 468,382 | |||||||||
| 235 | Bank of Hawaii Corp. | 12,432 | |||||||||
| 3,048 | Bank of New York Co. (The), Inc. | 123,383 | |||||||||
| 3,137 | BB&T Corp. | 130,562 | |||||||||
| 210 | BOK Financial Corp. | 10,779 | |||||||||
| 1,248 | Capital One Financial Corp. | 92,676 | |||||||||
| 206 | City National Corp. | 15,083 | |||||||||
| 691 | Colonial BancGroup (The), Inc. | 16,625 | |||||||||
| 1,151 | Comerica, Inc. | 71,258 | |||||||||
| 562 | Commerce Bancorp, Inc. | 18,793 | |||||||||
| 295 | Commerce Bancshares, Inc. | 13,965 | |||||||||
| 448 | Compass Bancshares, Inc. | 30,545 | |||||||||
| 228 | Cullen/Frost Bankers, Inc. | 11,667 | |||||||||
| 3,266 | Fifth Third Bancorp | 132,567 | |||||||||
| 841 | First Horizon National Corp. | 32,976 | |||||||||
| 696 | FirstMerit Corp. | 14,532 | |||||||||
| 1,351 | Fremont General Corp. | 10,200 | |||||||||
| 924 | Fulton Financial Corp. | 13,601 | |||||||||
| 1,522 | Huntington Bancshares, Inc. | 33,758 | |||||||||
| 2,619 | Keycorp | 93,446 | |||||||||
| 407 | M&T Bank Corp. | 45,315 | |||||||||
| 979 | Marshall & Ilsley Corp. | 47,012 | |||||||||
| 1,466 | Mellon Financial Corp. | 62,935 | |||||||||
| 4,631 | National City Corp. | 169,263 | |||||||||
| 693 | Northern Trust Corp. | 43,624 | |||||||||
| 1,776 | PNC Financial Services Group, Inc. | 131,602 | |||||||||
| 2,062 | Popular, Inc. | 34,662 | |||||||||
| 2,571 | Regions Financial Corp. | 90,216 | |||||||||
| 586 | Sky Financial Group, Inc. | 15,969 | |||||||||
| 383 | South Financial Group (The), Inc. | 8,667 | |||||||||
| 972 | State Street Corp. | 66,942 | |||||||||
| 1,799 | SunTrust Banks, Inc. | 151,872 | |||||||||
| 1,242 | Synovus Financial Corp. | 39,198 | |||||||||
| 723 | TCF Financial Corp. | 19,579 | |||||||||
| 333 | Trustmark Corp. | 8,861 | |||||||||
| 790 | UnionBanCal Corp. | 48,569 | |||||||||
| 9,067 | US Bancorp | 311,451 | |||||||||
| 594 | Valley National Bancorp | 15,070 | |||||||||
| 8,366 | Wachovia Corp. | 464,648 | |||||||||
| 287 | Webster Financial Corp. | 12,757 | |||||||||
| 15,959 | Wells Fargo & Co. | 572,769 | |||||||||
| 328 | Whitney Holding Corp. | 10,093 | |||||||||
| 329 | Wilmington Trust Corp. | 13,311 | |||||||||
| 398 | Zions Bancorp | 32,556 | |||||||||
| 3,797,670 | |||||||||||
| Commercial Services—0.2% | |||||||||||
| 325 | Equifax, Inc. | 12,935 | |||||||||
| 249 | Moody's Corp. | 16,464 | |||||||||
| 29,399 | |||||||||||
| Number of Shares | Value | ||||||||||
| Common Stocks (Continued) | |||||||||||
| Diversified Financial Services—34.4% | |||||||||||
| 313 | AG Edwards, Inc. | $ | 22,677 | ||||||||
| 3,366 | American Express Co. | 204,215 | |||||||||
| 773 | AmeriCredit Corp.* | 19,503 | |||||||||
| 1,116 | Ameriprise Financial, Inc. | 66,369 | |||||||||
| 550 | Bear Stearns (The) Cos., Inc. | 85,635 | |||||||||
| 2,458 | Charles Schwab (The) Corp. | 46,997 | |||||||||
| 22 | Chicago Mercantile Exchange Holdings, Inc. | 11,369 | |||||||||
| 1,165 | CIT Group, Inc. | 69,492 | |||||||||
| 20,652 | Citigroup, Inc. | 1,107,360 | |||||||||
| 3,818 | Countrywide Financial Corp. | 141,571 | |||||||||
| 4,796 | Doral Financial Corp.* | 6,714 | |||||||||
| 1,290 | E*Trade Financial Corp.* | 28,483 | |||||||||
| 318 | Federated Investors, Inc., Class B | 12,135 | |||||||||
| 455 | Franklin Resources, Inc. | 59,746 | |||||||||
| 4,816 | Freddie Mac | 311,980 | |||||||||
| 2,733 | Friedman Billings Ramsey Group, Inc., Class A | 15,168 | |||||||||
| 1,263 | Goldman Sachs Group (The), Inc. | 276,104 | |||||||||
| 449 | IndyMac Bancorp, Inc. | 13,578 | |||||||||
| 759 | Janus Capital Group, Inc. | 18,990 | |||||||||
| 366 | Jefferies Group, Inc. | 11,602 | |||||||||
| 37,487 | JPMorgan Chase & Co. | 1,953,074 | |||||||||
| 508 | Lazard Ltd., Class A (Bermuda) | 27,508 | |||||||||
| 205 | Legg Mason, Inc. | 20,334 | |||||||||
| 2,004 | Lehman Brothers Holdings, Inc. | 150,861 | |||||||||
| 3,618 | Merrill Lynch & Co., Inc. | 326,452 | |||||||||
| 4,821 | Morgan Stanley | 405,012 | |||||||||
| 197 | Nuveen Investments, Inc., Class A | 10,500 | |||||||||
| 248 | NYSE Euronext, Inc.* | 20,914 | |||||||||
| 398 | Raymond James Financial, Inc. | 12,211 | |||||||||
| 1,507 | SLM Corp. | 81,122 | |||||||||
| 93 | Student Loan Corp. | 18,944 | |||||||||
| 505 | T. Rowe Price Group, Inc. | 25,088 | |||||||||
| 821 | TD Ameritrade Holding Corp.* | 13,998 | |||||||||
| 972 | Thornburg Mortgage, Inc. | 27,022 | |||||||||
| 5,622,728 | |||||||||||
| Forest Products & Paper—0.3% | |||||||||||
| 1,082 | Plum Creek Timber Co., Inc. | 42,955 | |||||||||
| Insurance—28.7% | |||||||||||
| 1,563 | ACE Ltd. (Cayman Islands) | 92,936 | |||||||||
| 1,951 | AFLAC, Inc. | 100,164 | |||||||||
| 29 | Alleghany Corp.* | 10,376 | |||||||||
| 454 | Allied World Assurance Holdings Ltd. (Bermuda) | 20,121 | |||||||||
| 3,696 | Allstate (The) Corp. | 230,336 | |||||||||
| 399 | AMBAC Financial Group, Inc. | 36,628 | |||||||||
| 659 | American Financial Group, Inc. | 23,243 | |||||||||
| 10,883 | American International Group, Inc. | 760,832 | |||||||||
| 210 | American National Insurance | 27,409 | |||||||||
| 1,804 | AON Corp. | 69,905 | |||||||||
See Notes to Financial Statements.
51
Schedule of Investments (Continued)
PowerShares FTSE RAFI Financials Sector Portfolio
April 30, 2007
| Number of Shares | Value | ||||||||||
| Common Stocks (Continued) | |||||||||||
| 295 | Arch Capital Group Ltd. (Bermuda)* | $ | 21,482 | ||||||||
| 457 | Arthur J. Gallagher & Co. | 12,778 | |||||||||
| 348 | Aspen Insurance Holdings Ltd. (Bermuda) | 9,225 | |||||||||
| 616 | Assurant, Inc. | 35,438 | |||||||||
| 583 | Axis Capital Holdings Ltd. (Bermuda) | 21,629 | |||||||||
| 209 | Berkshire Hathaway, Inc., Class B* | 758,253 | |||||||||
| 2,012 | Chubb Corp. | 108,306 | |||||||||
| 883 | Cincinnati Financial Corp. | 39,947 | |||||||||
| 1,349 | CNA Financial Corp. | 62,958 | |||||||||
| 490 | Commerce Group, Inc. | 15,979 | |||||||||
| 628 | Conseco, Inc.* | 11,109 | |||||||||
| 332 | Endurance Specialty Holdings Ltd. (Bermuda) | 12,423 | |||||||||
| 274 | Erie Indemnity Co., Class A | 14,399 | |||||||||
| 265 | Everest Re Group Ltd. (Bermuda) | 26,670 | |||||||||
| 1,216 | Fidelity National Title Group, Inc. | 30,996 | |||||||||
| 693 | First American Corp. | 35,690 | |||||||||
| 5,141 | Genworth Financial, Inc., Class A | 187,595 | |||||||||
| 329 | Hanover Insurance Group (The), Inc. | 15,121 | |||||||||
| 1,481 | Hartford Financial Services Group (The), Inc. | 149,877 | |||||||||
| 374 | HCC Insurance Holdings, Inc. | 11,467 | |||||||||
| 207 | LandAmerica Financial Group, Inc. | 16,632 | |||||||||
| 894 | Lincoln National Corp. | 63,608 | |||||||||
| 1,875 | Loews Corp. | 88,725 | |||||||||
| 29 | Markel Corp.* | 13,308 | |||||||||
| 4,221 | Marsh & McLennan Cos., Inc. | 134,059 | |||||||||
| 799 | MBIA, Inc. | 55,578 | |||||||||
| 363 | Mercury General Corp. | 19,656 | |||||||||
| 3,458 | MetLife, Inc. | 227,191 | |||||||||
| 463 | MGIC Investment Corp. | 28,525 | |||||||||
| 909 | Montpelier Re Holdings Ltd. (Bermuda) | 16,598 | |||||||||
| 761 | Nationwide Financial Services, Class A | 43,476 | |||||||||
| 306 | Odyssey Re Holdings Corp. | 12,821 | |||||||||
| 346 | Ohio Casualty Corp. | 10,947 | |||||||||
| 1,838 | Old Republic International Corp. | 39,094 | |||||||||
| 347 | PartnerRe Ltd. (Bermuda) | 24,991 | |||||||||
| 927 | Phoenix (The) Cos., Inc. | 13,812 | |||||||||
| 408 | PMI Group (The), Inc. | 19,776 | |||||||||
| 957 | Principal Financial Group, Inc. | 60,760 | |||||||||
| 2,795 | Progressive (The) Corp. | 64,481 | |||||||||
| 419 | Protective Life Corp. | 19,651 | |||||||||
| 2,042 | Prudential Financial, Inc. | 193,990 | |||||||||
| 368 | Radian Group, Inc. | 21,384 | |||||||||
| 322 | Reinsurance Group of America, Inc. | 20,064 | |||||||||
| 291 | RenaissanceRe Holdings Ltd. (Bermuda) | 15,758 | |||||||||
| 666 | Safeco Corp. | 44,449 | |||||||||
| 277 | Stancorp Financial Group, Inc. | 13,185 | |||||||||
| 475 | Torchmark Corp. | 32,443 | |||||||||
| 292 | Transatlantic Holdings, Inc. | 20,291 | |||||||||
| 2,886 | Travelers (The) Cos., Inc. | 156,133 | |||||||||
| 565 | Unitrin, Inc. | 26,640 | |||||||||
| 2,789 | UnumProvident Corp. | 69,390 | |||||||||
| 21 | Wesco Financial Corp. | 9,345 | |||||||||
| Number of Shares | Value | ||||||||||
| Common Stocks (Continued) | |||||||||||
| 42 | White Mountains Insurance Group Ltd. (Bermuda) | $ | 24,066 | ||||||||
| 521 | Willis Group Holdings Ltd. (Bermuda) | 21,371 | |||||||||
| 695 | WR Berkley Corp. | 22,581 | |||||||||
| 941 | XL Capital Ltd., Class A (Cayman Islands) | 73,379 | |||||||||
| 4,691,450 | |||||||||||
| Investment Companies—0.5% | |||||||||||
| 1,118 | Allied Capital Corp. | 32,310 | |||||||||
| 652 | American Capital Strategies Ltd. | 31,739 | |||||||||
| 473 | Tri-Continental Corp. | 11,901 | |||||||||
| 75,950 | |||||||||||
| Real estate—0.1% | |||||||||||
| 344 | CB Richard Ellis Group, Inc., Class A* | 11,644 | |||||||||
| 291 | W.P. Carey & Co. LLC | 9,967 | |||||||||
| 21,611 | |||||||||||
| REITS—7.8% | |||||||||||
| 411 | AMB Property Corp. | 25,034 | |||||||||
| 887 | American Financial Realty Trust | 9,402 | |||||||||
| 396 | American Home Mortgage Investment Corp. | 9,813 | |||||||||
| 2,139 | Annaly Capital Management, Inc. | 34,031 | |||||||||
| 628 | Apartment Investment & Management Co., Class A | 34,728 | |||||||||
| 1,766 | Archstone-Smith Trust | 92,027 | |||||||||
| 232 | AvalonBay Communities, Inc. | 28,364 | |||||||||
| 452 | Boston Properties, Inc. | 53,137 | |||||||||
| 304 | Brandywine Realty Trust | 9,996 | |||||||||
| 200 | BRE Properties, Inc., Class A | 12,008 | |||||||||
| 247 | Camden Property Trust | 17,204 | |||||||||
| 330 | CBL & Associates Properties, Inc. | 14,999 | |||||||||
| 273 | Colonial Properties Trust | 13,544 | |||||||||
| 285 | Cousins Properties, Inc. | 9,567 | |||||||||
| 1,210 | Crescent Real Estate EQT Co. | 24,817 | |||||||||
| 391 | Developers Diversified Realty Corp. | 25,454 | |||||||||
| 859 | Duke Realty Corp. | 37,031 | |||||||||
| 175 | Equity Lifestyle Properties, Inc. | 9,497 | |||||||||
| 369 | Equity One, Inc. | 10,306 | |||||||||
| 473 | Equity Residential | 21,961 | |||||||||
| 70 | Essex Property Trust, Inc. | 9,020 | |||||||||
| 157 | Federal Realty Investment Trust | 14,157 | |||||||||
| 355 | First Industrial Realty Trust, Inc. | 15,545 | |||||||||
| 577 | General Growth Properties, Inc. | 36,841 | |||||||||
| 362 | Glimcher Realty Trust | 9,778 | |||||||||
| 740 | Health Care Property Investors, Inc. | 26,189 | |||||||||
| 353 | Health Care REIT, Inc. | 15,970 | |||||||||
| 383 | Healthcare Realty Trust, Inc. | 13,045 | |||||||||
| 392 | Highwoods Properties, Inc. | 15,986 | |||||||||
| 247 | Home Properties, Inc. | 13,758 | |||||||||
| 621 | Hospitality Properties Trust | 28,274 | |||||||||
| 980 | Host Hotels & Resorts, Inc. | 25,127 | |||||||||
| 1,712 | HRPT Properties Trust | 20,955 | |||||||||
See Notes to Financial Statements.
52
Schedule of Investments (Continued)
PowerShares FTSE RAFI Financials Sector Portfolio
April 30, 2007
| Number of Shares | Value | ||||||||||
| Common Stocks (Continued) | |||||||||||
| 1,562 | IMPAC Mortgage Holdings, Inc. | $ | 8,669 | ||||||||
| 791 | iStar Financial, Inc. | 37,905 | |||||||||
| 664 | Kimco Realty Corp. | 31,918 | |||||||||
| 548 | Liberty Property Trust | 26,518 | |||||||||
| 203 | Macerich (The) Co. | 19,309 | |||||||||
| 554 | Mack-Cali Realty Corp. | 27,129 | |||||||||
| 389 | Nationwide Health Properties, Inc. | 12,471 | |||||||||
| 348 | Newcastle Investment Corp. | 10,165 | |||||||||
| 1,525 | NovaStar Financial, Inc. | 11,224 | |||||||||
| 222 | Pennsylvania Real Estate Investment Trust | 10,314 | |||||||||
| 273 | Post Properties, Inc. | 12,796 | |||||||||
| 232 | Potlatch Corp. | 10,066 | |||||||||
| 705 | Prologis | 45,684 | |||||||||
| 368 | Public Storage, Inc. | 34,342 | |||||||||
| 378 | Rayonier, Inc. | 16,394 | |||||||||
| 466 | Realty Income Corp. | 13,001 | |||||||||
| 294 | Redwood Trust, Inc. | 14,762 | |||||||||
| 229 | Regency Centers Corp. | 18,870 | |||||||||
| 482 | Senior Housing Properties Trust | 11,004 | |||||||||
| 342 | Simon Property Group, Inc. | 39,426 | |||||||||
| 80 | SL Green Realty Corp. | 11,272 | |||||||||
| 615 | Strategic Hotels & Resorts, Inc. | 13,315 | |||||||||
| 594 | United Dominion Realty Trust, Inc. | 17,844 | |||||||||
| 265 | Ventas, Inc. | 11,172 | |||||||||
| 484 | Vornado Realty Trust | 57,418 | |||||||||
| 378 | Weingarten Realty Investors | 18,091 | |||||||||
| 1,278,644 | |||||||||||
| Savings & Loans—2.8% | |||||||||||
| 615 | Astoria Financial Corp. | 16,334 | |||||||||
| 145 | Downey Financial Corp. | 9,708 | |||||||||
| 2,162 | Hudson City Bancorp, Inc. | 28,798 | |||||||||
| 1,870 | New York Community Bancorp, Inc. | 32,650 | |||||||||
| 689 | People's United Financial, Inc. | 13,718 | |||||||||
| 1,427 | Sovereign Bancorp, Inc. | 34,633 | |||||||||
| 552 | Washington Federal, Inc. | 13,088 | |||||||||
| 7,324 | Washington Mutual, Inc. | 307,463 | |||||||||
| 456,392 | |||||||||||
| Software—0.2% | |||||||||||
| 200 | Mastercard, Inc., Class A | 22,336 | |||||||||
| 315 | MoneyGram International, Inc. | 8,955 | |||||||||
| 31,291 | |||||||||||
| Total Common Stocks (Cost $15,346,146) | 16,048,090 | ||||||||||
| Number of Shares | Value | ||||||||||
| Money Market Fund—0.1% | |||||||||||
| 17,423 | Liquid Assets Portfolio Private Class** (Cost $17,423) | $ | 17,423 | ||||||||
| Total Investments (Cost $15,363,569)—98.4% | 16,065,513 | ||||||||||
| Other assets less liabilities—1.6% | 253,447 | ||||||||||
| Net Assets—100.0% | $ | 16,318,960 | |||||||||
* Non-income producing security.
** Affiliated investment.
COUNTRY BREAKDOWN
April 30, 2007 (Unaudited)
| Value | Net Assets | ||||||||||
| United States | $ | 15,657,356 | 95.9 | % | |||||||
| Bermuda | 241,842 | 1.5 | |||||||||
| Cayman Islands | 166,315 | 1.0 | |||||||||
| Total investments | 16,065,513 | 98.4 | |||||||||
| Other assets less liabilities | 253,447 | 1.6 | |||||||||
| Net Assets | $ | 16,318,960 | 100.0 | % | |||||||
See Notes to Financial Statements.
53
Schedule of Investments
PowerShares FTSE RAFI Health Care Sector Portfolio
April 30, 2007
| Number of Shares | Value | ||||||||||
| Common Stocks—99.6% | |||||||||||
| Biotechnology—5.9% | |||||||||||
| 7,951 | Amgen, Inc.* | $ | 509,977 | ||||||||
| 3,113 | Biogen Idec, Inc.* | 146,965 | |||||||||
| 993 | Charles River Laboratories International, Inc.* | 47,028 | |||||||||
| 4,038 | Genentech, Inc.* | 323,000 | |||||||||
| 2,071 | Genzyme Corp.* | 135,257 | |||||||||
| 827 | Invitrogen Corp.* | 54,144 | |||||||||
| 1,359 | Medimmune, Inc.* | 77,028 | |||||||||
| 1,293,399 | |||||||||||
| Distribution/Wholesale—0.2% | |||||||||||
| 1,379 | Owens & Minor, Inc. | 48,748 | |||||||||
| Electronics—0.7% | |||||||||||
| 1,840 | Applera Corp. - Applied Biosystems Group | 57,482 | |||||||||
| 1,816 | Thermo Fisher Scientific, Inc.* | 94,541 | |||||||||
| 152,023 | |||||||||||
| Health Care Equipment & Supplies—0.2% | |||||||||||
| 884 | Advanced Medical Optics, Inc. * | 35,740 | |||||||||
| Healthcare-Products—21.1% | |||||||||||
| 1,841 | Alcon, Inc. (Switzerland) | 248,406 | |||||||||
| 1,114 | Bausch & Lomb, Inc. | 65,537 | |||||||||
| 6,515 | Baxter International, Inc. | 368,944 | |||||||||
| 879 | Beckman Coulter, Inc. | 55,210 | |||||||||
| 2,170 | Becton Dickinson & Co. | 170,757 | |||||||||
| 1,446 | Biomet, Inc. | 62,467 | |||||||||
| 11,533 | Boston Scientific Corp.* | 178,070 | |||||||||
| 754 | CR Bard, Inc. | 62,680 | |||||||||
| 826 | Dade Behring Holdings, Inc. | 40,565 | |||||||||
| 1,405 | Dentsply International, Inc. | 46,941 | |||||||||
| 1,277 | Henry Schein, Inc.* | 66,570 | |||||||||
| 1,072 | Hillenbrand Industries, Inc. | 65,553 | |||||||||
| 35,835 | Johnson & Johnson | 2,301,323 | |||||||||
| 8,322 | Medtronic, Inc. | 440,483 | |||||||||
| 1,340 | Patterson Cos., Inc.* | 48,320 | |||||||||
| 2,469 | St. Jude Medical, Inc.* | 105,649 | |||||||||
| 1,840 | Stryker Corp. | 119,490 | |||||||||
| 734 | Varian Medical Systems, Inc.* | 30,982 | |||||||||
| 1,620 | Zimmer Holdings, Inc.* | 146,578 | |||||||||
| 4,624,525 | |||||||||||
| Healthcare-Services—14.4% | |||||||||||
| 7,320 | Aetna, Inc. | 343,162 | |||||||||
| 1,145 | Apria Healthcare Group, Inc.* | 36,342 | |||||||||
| 2,041 | Community Health Systems, Inc.* | 75,109 | |||||||||
| 1,979 | Coventry Health Care, Inc.* | 114,446 | |||||||||
| 1,161 | DaVita, Inc.* | 63,402 | |||||||||
| 2,788 | Health Net, Inc.* | 150,719 | |||||||||
| 2,857 | Humana, Inc.* | 180,677 | |||||||||
| 1,743 | Kindred Healthcare, Inc.* | 60,866 | |||||||||
| 1,183 | Laboratory Corp. of America Holdings* | 93,386 | |||||||||
| Number of Shares | Value | ||||||||||
| Common Stocks (Continued) | |||||||||||
| 1,136 | LifePoint Hospitals, Inc.* | $ | 41,475 | ||||||||
| 1,389 | Lincare Holdings, Inc.* | 54,782 | |||||||||
| 915 | Magellan Health Services, Inc.* | 39,254 | |||||||||
| 1,033 | Manor Care, Inc. | 67,031 | |||||||||
| 2,227 | Quest Diagnostics, Inc. | 108,878 | |||||||||
| 31,449 | Tenet Healthcare Corp.* | 233,352 | |||||||||
| 3,089 | Triad Hospitals, Inc.* | 164,149 | |||||||||
| 11,226 | UnitedHealth Group, Inc. | 595,652 | |||||||||
| 1,079 | Universal Health Services, Inc., Class B | 65,517 | |||||||||
| 8,584 | WellPoint, Inc.* | 677,877 | |||||||||
| 3,166,076 | |||||||||||
| Insurance—1.5% | |||||||||||
| 2,145 | CIGNA Corp. | 333,741 | |||||||||
| Pharmaceuticals—55.6% | |||||||||||
| 19,255 | Abbott Laboratories | 1,090,218 | |||||||||
| 623 | Allergan, Inc. | 75,508 | |||||||||
| 870 | Barr Pharmaceuticals, Inc.* | 42,073 | |||||||||
| 47,306 | Bristol-Myers Squibb Co. | 1,365,251 | |||||||||
| 16,725 | Eli Lilly & Co. | 988,949 | |||||||||
| 2,332 | Express Scripts, Inc.* | 222,823 | |||||||||
| 2,193 | Forest Laboratories, Inc.* | 116,690 | |||||||||
| 1,137 | Gilead Sciences, Inc.* | 92,916 | |||||||||
| 1,987 | Hospira, Inc.* | 80,573 | |||||||||
| 4,099 | King Pharmaceuticals, Inc.* | 83,825 | |||||||||
| 7,303 | Medco Health Solutions, Inc.* | 569,780 | |||||||||
| 51,658 | Merck & Co., Inc. | 2,657,287 | |||||||||
| 3,012 | Mylan Laboratories, Inc. | 66,053 | |||||||||
| 116,416 | Pfizer, Inc. | 3,080,366 | |||||||||
| 18,211 | Schering-Plough Corp. | 577,835 | |||||||||
| 2,678 | Watson Pharmaceuticals, Inc.* | 73,109 | |||||||||
| 17,791 | Wyeth | 987,401 | |||||||||
| 12,170,657 | |||||||||||
| Total Common Stocks (Cost $20,320,285) | 21,824,909 | ||||||||||
| Money Market Fund—0.4% | |||||||||||
| 76,365 | Liquid Assets Portfolio Private Class** (Cost $76,365) | 76,365 | |||||||||
| Total Investment (Cost $20,396,650)—100.0% | 21,901,274 | ||||||||||
| Other assets less liabilities—0.0% | 1,512 | ||||||||||
| Net Assets—100.0% | $ | 21,902,786 | |||||||||
* Non-income producing security.
** Affiliated investment.
See Notes to Financial Statements.
54
Schedule of Investments (Continued)
PowerShares FTSE RAFI Health Care Sector Portfolio
April 30, 2007
COUNTRY BREAKDOWN
April 30, 2007 (Unaudited)
| Value | Net Assets | ||||||||||
| United States | $ | 21,652,868 | 98.9 | % | |||||||
| Switzerland | 248,406 | 1.1 | |||||||||
| Total investments | 21,901,274 | 100.0 | |||||||||
| Other assets less liabilities | 1,512 | 0.0 | |||||||||
| Net Assets | $ | 21,902,786 | 100.0 | % | |||||||
See Notes to Financial Statements.
55
Schedule of Investments
PowerShares FTSE RAFI Industrials Sector Portfolio
April 30, 2007
| Number of Shares | Value | ||||||||||
| Common Stocks—99.1% | |||||||||||
| Aerospace/Defense—13.3% | |||||||||||
| 726 | Alliant Techsystems, Inc.* | $ | 67,612 | ||||||||
| 13,670 | Boeing Co. | 1,271,311 | |||||||||
| 6,536 | General Dynamics Corp. | 513,076 | |||||||||
| 2,954 | Goodrich Corp. | 167,905 | |||||||||
| 1,915 | L-3 Communications Holdings, Inc. | 172,216 | |||||||||
| 7,023 | Lockheed Martin Corp. | 675,191 | |||||||||
| 10,119 | Northrop Grumman Corp. | 745,163 | |||||||||
| 10,970 | Raytheon Co. | 587,334 | |||||||||
| 1,470 | Rockwell Collins, Inc. | 96,535 | |||||||||
| 315 | Sequa Corp., Class A* | 36,918 | |||||||||
| 68 | Sequa Corp., Class B* | 8,092 | |||||||||
| 16,540 | United Technologies Corp. | 1,110,330 | |||||||||
| 5,451,683 | |||||||||||
| Auto Manufacturers—1.1% | |||||||||||
| 843 | Oshkosh Truck Corp. | 47,157 | |||||||||
| 4,840 | Paccar, Inc. | 406,464 | |||||||||
| 453,621 | |||||||||||
| Building Materials—1.9% | |||||||||||
| 8,585 | American Standard Cos., Inc. | 472,689 | |||||||||
| 2,952 | Builders FirstSource, Inc.* | 47,616 | |||||||||
| 1,749 | Lennox International, Inc. | 59,134 | |||||||||
| 540 | Martin Marietta Materials, Inc. | 78,743 | |||||||||
| 1,715 | Masco Corp. | 46,665 | |||||||||
| 1,138 | USG Corp.* | 52,519 | |||||||||
| 757,366 | |||||||||||
| Chemicals—0.4% | |||||||||||
| 2,450 | Sherwin-Williams (The) Co. | 156,237 | |||||||||
| Commercial Services—4.8% | |||||||||||
| 10,186 | Accenture Ltd., Class A (Bermuda) | 398,272 | |||||||||
| 811 | Alliance Data Systems Corp.* | 51,628 | |||||||||
| 1,327 | ChoicePoint, Inc.* | 50,386 | |||||||||
| 3,512 | Convergys Corp.* | 88,713 | |||||||||
| 910 | Corrections Corp. of America* | 51,688 | |||||||||
| 2,369 | Deluxe Corp. | 89,667 | |||||||||
| 2,489 | Hewitt Associates, Inc., Class A* | 74,048 | |||||||||
| 2,892 | Iron Mountain, Inc.* | 81,265 | |||||||||
| 2,090 | Kelly Services, Inc., Class A | 59,983 | |||||||||
| 2,409 | Manpower, Inc. | 193,322 | |||||||||
| 871 | Monster Worldwide, Inc.* | 36,626 | |||||||||
| 4,677 | PHH Corp.* | 142,649 | |||||||||
| 1,949 | Quanta Services, Inc.* | 53,578 | |||||||||
| 1,444 | Robert Half International, Inc. | 48,085 | |||||||||
| 6,266 | RR Donnelley & Sons Co. | 251,893 | |||||||||
| 4,489 | United Rentals, Inc.* | 150,382 | |||||||||
| 5,678 | Western Union (The) Co. | 119,522 | |||||||||
| 1,941,707 | |||||||||||
| Number of Shares | Value | ||||||||||
| Common Stocks (Continued) | |||||||||||
| Computers—0.6% | |||||||||||
| 2,829 | Affiliated Computer Services, Inc., Class A* | $ | 169,485 | ||||||||
| 1,876 | Ceridian Corp.* | 63,334 | |||||||||
| 232,819 | |||||||||||
| Distribution/Wholesale—0.5% | |||||||||||
| 1,802 | W.W. Grainger, Inc. | 148,881 | |||||||||
| 974 | WESCO International, Inc.* | 61,528 | |||||||||
| 210,409 | |||||||||||
| Electric—0.3% | |||||||||||
| 4,252 | MDU Resources Group, Inc. | 128,836 | |||||||||
| Electrical Components & Equipment—2.2% | |||||||||||
| 15,757 | Emerson Electric Co. | 740,421 | |||||||||
| 1,613 | Hubbell, Inc., Class B | 83,376 | |||||||||
| 1,666 | Molex, Inc. | 49,780 | |||||||||
| 1,211 | Molex, Inc., Class A | 32,443 | |||||||||
| 906,020 | |||||||||||
| Electronics—4.1% | |||||||||||
| 5,459 | Agilent Technologies, Inc.* | 187,626 | |||||||||
| 5,049 | Arrow Electronics, Inc.* | 199,536 | |||||||||
| 4,126 | Avnet, Inc.* | 168,753 | |||||||||
| 4,105 | AVX Corp. | 68,307 | |||||||||
| 2,154 | Benchmark Electronics, Inc.* | 45,622 | |||||||||
| 22,154 | Flextronics International Ltd. (Singapore)* | 247,017 | |||||||||
| 504 | Mettler Toledo International, Inc.* | 49,200 | |||||||||
| 2,745 | PerkinElmer, Inc. | 66,429 | |||||||||
| 52,070 | Sanmina-SCI Corp.* | 179,642 | |||||||||
| 106,607 | Solectron Corp.* | 357,134 | |||||||||
| 7,437 | Vishay Intertechnology, Inc.* | 123,826 | |||||||||
| 1,693,092 | |||||||||||
| Engineering & Construction—1.6% | |||||||||||
| 1,172 | EMCOR Group, Inc.* | 73,473 | |||||||||
| 1,863 | Fluor Corp. | 178,140 | |||||||||
| 3,335 | Jacobs Engineering Group, Inc.* | 168,184 | |||||||||
| 2,170 | Shaw Group (The), Inc.* | 70,373 | |||||||||
| 1,870 | URS Corp.* | 81,719 | |||||||||
| 1,078 | Washington Group International, Inc.* | 72,140 | |||||||||
| 644,029 | |||||||||||
| Environmental Control—2.2% | |||||||||||
| 19,168 | Allied Waste Industries, Inc.* | 256,276 | |||||||||
| 5,325 | Republic Services, Inc. | 148,727 | |||||||||
| 13,326 | Waste Management, Inc. | 498,526 | |||||||||
| 903,529 | |||||||||||
| Forest Products & Paper—1.6% | |||||||||||
| 4,359 | Louisiana-Pacific Corp. | 85,916 | |||||||||
| 7,399 | MeadWestvaco Corp. | 246,830 | |||||||||
| 15,832 | Smurfit-Stone Container Corp.* | 190,776 | |||||||||
| 2,350 | Temple-Inland, Inc. | 139,214 | |||||||||
| 662,736 | |||||||||||
See Notes to Financial Statements.
56
Schedule of Investments (Continued)
PowerShares FTSE RAFI Industrials Sector Portfolio
April 30, 2007
| Number of Shares | Value | ||||||||||
| Common Stocks (Continued) | |||||||||||
| Hand/Machine Tools—0.2% | |||||||||||
| 895 | Kennametal, Inc. | $ | 63,151 | ||||||||
| Household Products/Wares—0.6% | |||||||||||
| 3,128 | Fortune Brands, Inc. | 250,553 | |||||||||
| Internet—0.1% | |||||||||||
| 1,134 | Checkfree Corp.* | 38,170 | |||||||||
| Machinery-Construction & Mining—2.5% | |||||||||||
| 12,822 | Caterpillar, Inc. | 931,133 | |||||||||
| 1,355 | Terex Corp.* | 105,487 | |||||||||
| 1,036,620 | |||||||||||
| Machinery-Diversified—2.6% | |||||||||||
| 2,037 | AGCO Corp.* | 85,004 | |||||||||
| 2,170 | Cummins, Inc. | 199,987 | |||||||||
| 4,311 | Deere & Co. | 471,623 | |||||||||
| 1,256 | Flowserve Corp. | 76,629 | |||||||||
| 379 | NACCO Industries, Inc., Class A | 60,405 | |||||||||
| 2,515 | Rockwell Automation, Inc. | 149,743 | |||||||||
| 2,005 | Tecumseh Products Co., Class A* | 20,371 | |||||||||
| 570 | Tecumseh Products Co., Class B* | 5,837 | |||||||||
| 1,069,599 | |||||||||||
| Metal Fabricate/Hardware—0.6% | |||||||||||
| 1,643 | Mueller Industries, Inc. | 53,890 | |||||||||
| 846 | Precision Castparts Corp. | 88,077 | |||||||||
| 3,389 | Timken (The) Co. | 111,770 | |||||||||
| 253,737 | |||||||||||
| Mining—0.4% | |||||||||||
| 1,183 | Vulcan Materials Co. | 146,302 | |||||||||
| Miscellaneous Manufacturing—37.9% | |||||||||||
| 14,404 | 3M Co. | 1,192,218 | |||||||||
| 813 | Acuity Brands, Inc. | 48,065 | |||||||||
| 1,099 | Brink's (The) Co. | 69,787 | |||||||||
| 1,228 | Carlisle Cos., Inc. | 50,569 | |||||||||
| 5,468 | Cooper Industries Ltd., Class A (Bermuda) | 272,088 | |||||||||
| 1,335 | Crane Co. | 56,751 | |||||||||
| 2,722 | Danaher Corp. | 193,779 | |||||||||
| 3,817 | Dover Corp. | 183,674 | |||||||||
| 3,212 | Eaton Corp. | 286,543 | |||||||||
| 238,203 | General Electric Co. | 8,780,162 | |||||||||
| 1,786 | Harsco Corp. | 91,086 | |||||||||
| 17,931 | Honeywell International, Inc. | 971,501 | |||||||||
| 8,826 | Illinois Tool Works, Inc. | 452,862 | |||||||||
| 6,922 | Ingersoll-Rand Co. Ltd., Class A (Bermuda) | 309,067 | |||||||||
| 2,799 | ITT Corp. | 178,604 | |||||||||
| 2,109 | Pall Corp. | 88,473 | |||||||||
| 2,326 | Parker Hannifin Corp. | 214,318 | |||||||||
| 2,677 | Pentair, Inc. | 86,039 | |||||||||
| 1,703 | SPX Corp. | 120,709 | |||||||||
| Number of Shares | Value | ||||||||||
| Common Stocks (Continued) | |||||||||||
| 1,029 | Teleflex, Inc. | $ | 73,913 | ||||||||
| 3,098 | Textron, Inc. | 314,974 | |||||||||
| 1,177 | Trinity Industries, Inc. | 54,613 | |||||||||
| 43,973 | Tyco International Ltd. (Bermuda) | 1,434,838 | |||||||||
| 15,524,633 | |||||||||||
| Packaging & Containers—3.1% | |||||||||||
| 2,200 | Ball Corp. | 111,518 | |||||||||
| 2,890 | Bemis Co., Inc. | 96,006 | |||||||||
| 6,241 | Crown Holdings, Inc.* | 150,845 | |||||||||
| 10,242 | Graphic Packaging Corp.* | 52,541 | |||||||||
| 660 | Greif, Inc., Class A | 36,696 | |||||||||
| 194 | Greif, Inc., Class B | 9,855 | |||||||||
| 7,593 | Owens-Illinois, Inc.* | 228,473 | |||||||||
| 2,391 | Packaging Corp. of America | 59,201 | |||||||||
| 3,044 | Pactiv Corp.* | 105,262 | |||||||||
| 7,732 | Sealed Air Corp. | 254,383 | |||||||||
| 883 | Silgan Holdings, Inc. | 50,667 | |||||||||
| 2,861 | Sonoco Products Co. | 121,993 | |||||||||
| 1,277,440 | |||||||||||
| Retail—0.1% | |||||||||||
| 980 | World Fuel Services Corp. | 45,286 | |||||||||
| Software—3.8% | |||||||||||
| 7,803 | Automatic Data Processing, Inc. | 349,262 | |||||||||
| 1,950 | Broadridge Financial Solutions, Inc.* | 39,078 | |||||||||
| 6,253 | Fidelity National Information Services, Inc. | 315,964 | |||||||||
| 15,002 | First Data Corp. | 486,065 | |||||||||
| 2,652 | Fiserv, Inc.* | 141,007 | |||||||||
| 2,048 | IMS Health, Inc. | 60,068 | |||||||||
| 3,151 | Paychex, Inc. | 116,902 | |||||||||
| 1,636 | Total System Services, Inc. | 50,814 | |||||||||
| 1,559,160 | |||||||||||
| Telecommunications—0.2% | |||||||||||
| 1,049 | Anixter International, Inc.* | 75,108 | |||||||||
| Transportation—12.2% | |||||||||||
| 1,105 | Alexander & Baldwin, Inc. | 59,062 | |||||||||
| 6,366 | Burlington Northern Santa Fe Corp. | 557,280 | |||||||||
| 1,446 | CH Robinson Worldwide, Inc. | 77,303 | |||||||||
| 1,684 | Con-way, Inc. | 91,997 | |||||||||
| 9,006 | CSX Corp. | 388,789 | |||||||||
| 1,346 | Expeditors International Washington, Inc. | 56,263 | |||||||||
| 4,797 | FedEx Corp. | 505,796 | |||||||||
| 2,260 | JB Hunt Transport Services, Inc. | 61,156 | |||||||||
| 1,458 | Kansas City Southern* | 54,165 | |||||||||
| 7,928 | Norfolk Southern Corp. | 422,087 | |||||||||
| 1,064 | Overseas Shipholding Group | 75,331 | |||||||||
| 2,775 | Ryder System, Inc. | 146,076 | |||||||||
| 2,020 | Ship Finance International Ltd. (Bermuda) | 60,075 | |||||||||
| 2,345 | Swift Transportation Co., Inc.* | 73,352 | |||||||||
| 1,998 | Teekay Shipping Corp. (Marshall Islands) | 119,181 | |||||||||
See Notes to Financial Statements.
57
Schedule of Investments (Continued)
PowerShares FTSE RAFI Industrials Sector Portfolio
April 30, 2007
| Number of Shares | Value | ||||||||||
| Common Stocks (Continued) | |||||||||||
| 6,147 | Union Pacific Corp. | $ | 702,294 | ||||||||
| 19,896 | United Parcel Service, Inc., Class B | 1,401,274 | |||||||||
| 2,295 | Werner Enterprises, Inc. | 43,398 | |||||||||
| 2,878 | YRC Worldwide, Inc.* | 114,516 | |||||||||
| 5,009,395 | |||||||||||
| Trucking & Leasing—0.2% | |||||||||||
| 1,846 | GATX Corp. | 90,472 | |||||||||
| Total Common Stocks (Cost $37,675,962) | 40,581,710 | ||||||||||
| Money Market Fund—0.1% | |||||||||||
| 35,802 | Liquid Assets Portfolio Private Class** (Cost $35,802) | 35,802 | |||||||||
| Total Investments (Cost $37,711,764)—99.2% | 40,617,512 | ||||||||||
| Other assets less liabilities—0.8% | 310,387 | ||||||||||
| Net Assets—100.0% | $ | 40,927,899 | |||||||||
* Non-income producing security.
** Affiliated investment.
COUNTRY BREAKDOWN
April 30, 2007 (Unaudited)
| Value | Net Assets | ||||||||||
| United States | $ | 37,776,974 | 92.3 | % | |||||||
| Bermuda | 2,474,340 | 6.0 | |||||||||
| Singapore | 247,017 | 0.6 | |||||||||
| Marshall Islands | 119,181 | 0.3 | |||||||||
| Total Investments | 40,617,512 | 99.2 | |||||||||
| Other assets less liabilities | 310,387 | 0.8 | |||||||||
| Net Assets | $ | 40,927,899 | 100.0 | % | |||||||
See Notes to Financial Statements.
58
Schedule of Investments
PowerShares FTSE RAFI Telecommunications & Technology Sector Portfolio
April 30, 2007
| Number of Shares | Value | ||||||||||
| Common Stocks—100.1% | |||||||||||
| Computers—20.5% | |||||||||||
| 1,474 | Apple, Inc.* | $ | 147,105 | ||||||||
| 1,716 | Cadence Design Systems, Inc.* | 38,095 | |||||||||
| 3,378 | Computer Sciences Corp.* | 187,614 | |||||||||
| 17,424 | Dell, Inc.* | 439,259 | |||||||||
| 712 | Diebold, Inc. | 33,941 | |||||||||
| 449 | DST Systems, Inc.* | 35,044 | |||||||||
| 9,073 | Electronic Data Systems Corp. | 265,295 | |||||||||
| 13,239 | EMC Corp.* | 200,968 | |||||||||
| 10,043 | Gateway, Inc.* | 21,994 | |||||||||
| 14,962 | Hewlett-Packard Co. | 630,499 | |||||||||
| 9,309 | International Business Machines | 951,473 | |||||||||
| 1,037 | Lexmark International, Inc., Class A* | 56,517 | |||||||||
| 1,479 | NCR Corp.* | 74,542 | |||||||||
| 695 | Network Appliance, Inc.* | 25,861 | |||||||||
| 1,337 | Perot Systems Corp., Class A* | 23,932 | |||||||||
| 1,036 | SanDisk Corp.* | 45,014 | |||||||||
| 3,189 | Seagate Technology (Cayman Islands) | 70,636 | |||||||||
| 25,953 | Sun Microsystems, Inc.* | 135,475 | |||||||||
| 961 | Synopsys, Inc.* | 26,581 | |||||||||
| 5,999 | Unisys Corp.* | 47,032 | |||||||||
| 1,442 | Western Digital Corp.* | 25,495 | |||||||||
| 3,482,372 | |||||||||||
| Distribution/Wholesale—2.2% | |||||||||||
| 658 | CDW Corp. | 47,383 | |||||||||
| 8,442 | Ingram Micro, Inc., Class A* | 165,631 | |||||||||
| 3,227 | Tech Data Corp.* | 114,688 | |||||||||
| 623 | United Stationers, Inc.* | 37,081 | |||||||||
| 364,783 | |||||||||||
| Holding Companies-Diversified—0.2% | |||||||||||
| 1,157 | Leucadia National Corp. | 34,872 | |||||||||
| Internet—2.3% | |||||||||||
| 1,298 | Check Point Software Technologies (Israel)* | 30,568 | |||||||||
| 272 | Google, Inc., Class A* | 128,215 | |||||||||
| 795 | McAfee, Inc.* | 25,830 | |||||||||
| 3,401 | Symantec Corp.* | 59,858 | |||||||||
| 1,384 | VeriSign, Inc.* | 37,852 | |||||||||
| 3,549 | Yahoo!, Inc.* | 99,514 | |||||||||
| 381,837 | |||||||||||
| Office/Business Equipment—2.1% | |||||||||||
| 2,946 | IKON Office Solutions, Inc. | 44,072 | |||||||||
| 2,462 | Pitney Bowes, Inc. | 118,176 | |||||||||
| 10,040 | Xerox Corp.* | 185,740 | |||||||||
| 347,988 | |||||||||||
| Retail—0.1% | |||||||||||
| 1,263 | Insight Enterprises, Inc.* | 25,033 | |||||||||
| Semiconductors—12.7% | |||||||||||
| 3,025 | Advanced Micro Devices, Inc.* | 41,806 | |||||||||
| Number of Shares | Value | ||||||||||
| Common Stocks (Continued) | |||||||||||
| 1,129 | Altera Corp. | $ | 25,448 | ||||||||
| 1,856 | Amkor Technology, Inc.* | 25,965 | |||||||||
| 1,494 | Analog Devices, Inc. | 57,698 | |||||||||
| 6,667 | Applied Materials, Inc. | 128,140 | |||||||||
| 4,376 | Atmel Corp.* | 23,280 | |||||||||
| 1,048 | Broadcom Corp., Class A* | 34,112 | |||||||||
| 1,344 | Fairchild Semiconductor International, Inc.* | 23,654 | |||||||||
| 48,790 | Intel Corp. | 1,048,986 | |||||||||
| 574 | International Rectifier Corp.* | 20,251 | |||||||||
| 865 | Intersil Corp., Class A | 25,768 | |||||||||
| 745 | Kla-Tencor Corp. | 41,385 | |||||||||
| 489 | Lam Research Corp.* | 26,298 | |||||||||
| 1,276 | Linear Technology Corp. | 47,748 | |||||||||
| 5,227 | LSI Logic Corp.* | 44,430 | |||||||||
| 1,896 | Marvell Technology Group Ltd. (Bermuda)* | 30,582 | |||||||||
| 1,506 | Maxim Integrated Products, Inc. | 47,770 | |||||||||
| 660 | Microchip Technology, Inc. | 26,624 | |||||||||
| 335 | Micron Technology, Inc.* | 3,842 | |||||||||
| 1,193 | National Semiconductor Corp. | 31,376 | |||||||||
| 883 | Novellus Systems, Inc.* | 28,583 | |||||||||
| 1,045 | NVIDIA Corp.* | 34,370 | |||||||||
| 2,550 | Spansion, Inc., Class A* | 25,041 | |||||||||
| 1,203 | Teradyne, Inc.* | 20,992 | |||||||||
| 7,263 | Texas Instruments, Inc. | 249,630 | |||||||||
| 1,348 | Xilinx, Inc. | 39,739 | |||||||||
| 2,153,518 | |||||||||||
| Software—18.2% | |||||||||||
| 889 | Adobe Systems, Inc.* | 36,947 | |||||||||
| 1,931 | BEA Systems, Inc.* | 22,766 | |||||||||
| 901 | BMC Software, Inc.* | 29,165 | |||||||||
| 2,488 | CA, Inc. | 67,823 | |||||||||
| 660 | Citrix Systems, Inc.* | 21,516 | |||||||||
| 2,839 | Compuware Corp.* | 28,021 | |||||||||
| 1,306 | Intuit, Inc.* | 37,156 | |||||||||
| 81,833 | Microsoft Corp. | 2,450,079 | |||||||||
| 3,175 | Novell, Inc.* | 23,178 | |||||||||
| 18,112 | Oracle Corp.* | 340,506 | |||||||||
| 1,594 | SYNNEX Corp.* | 31,163 | |||||||||
| 3,088,320 | |||||||||||
| Telecommunications—41.8% | |||||||||||
| 4,601 | ALLTEL Corp. | 288,437 | |||||||||
| 1,124 | Amdocs Ltd. (Guernsey)* | 41,307 | |||||||||
| 1,507 | American Tower Corp., Class A* | 57,266 | |||||||||
| 2,408 | Andrew Corp.* | 26,295 | |||||||||
| 46,854 | AT&T, Inc. | 1,814,186 | |||||||||
| 4,697 | Avaya, Inc.* | 60,685 | |||||||||
| 1,551 | CenturyTel, Inc. | 71,424 | |||||||||
| 4,552 | Cincinnati Bell, Inc.* | 23,079 | |||||||||
| 20,096 | Cisco Systems, Inc.* | 537,367 | |||||||||
| 6,015 | Citizens Communications Co. | 93,654 | |||||||||
| 3,741 | Corning, Inc.* | 88,737 | |||||||||
See Notes to Financial Statements.
59
Schedule of Investments (Continued)
PowerShares FTSE RAFI Telecommunications & Technology Sector Portfolio
April 30, 2007
| Number of Shares | Value | ||||||||||
| Common Stocks (Continued) | |||||||||||
| 796 | Crown Castle International Corp.* | $ | 27,335 | ||||||||
| 3,262 | Embarq Corp. | 195,850 | |||||||||
| 585 | Harris Corp. | 30,040 | |||||||||
| 1,348 | JDS Uniphase Corp.* | 22,215 | |||||||||
| 3,951 | Juniper Networks, Inc.* | 88,344 | |||||||||
| 3,050 | Level 3 Communications, Inc.* | 16,958 | |||||||||
| 20,894 | Motorola, Inc. | 362,093 | |||||||||
| 296 | NII Holdings, Inc.* | 22,718 | |||||||||
| 4,249 | Qualcomm, Inc. | 186,106 | |||||||||
| 18,179 | Qwest Communications International, Inc.* | 161,430 | |||||||||
| 35,854 | Sprint Nextel Corp. | 718,156 | |||||||||
| 597 | Telephone & Data Systems, Inc. | 33,999 | |||||||||
| 670 | Telephone & Data Systems, Inc., Special Shares | 35,376 | |||||||||
| 3,756 | Tellabs, Inc.* | 39,889 | |||||||||
| 843 | US Cellular Corp.* | 61,118 | |||||||||
| 2,426 | Utstarcom, Inc.* | 17,322 | |||||||||
| 49,913 | Verizon Communications, Inc. | 1,905,677 | |||||||||
| 2,601 | Virgin Media, Inc. | 65,623 | |||||||||
| 7,092,686 | |||||||||||
| Total Common Stocks (Cost $15,774,837) | 16,971,409 | ||||||||||
| Money Market Fund—0.2% | |||||||||||
| 31,535 | Liquid Assets Portfolio Private Class** (Cost $31,535) | 31,535 | |||||||||
| Total Investments (Cost $15,806,372)—100.3% | 17,002,944 | ||||||||||
| Liabilities in excess of other assets—(0.3%) | (54,744 | ) | |||||||||
| Net Assets—100.0% | $ | 16,948,200 | |||||||||
* Non-income producing security.
** Affiliated investment.
COUNTRY BREAKDOWN
April 30, 2007 (Unaudited)
| Value | Net Assets | ||||||||||
| United States | $ | 16,829,851 | 99.3 | % | |||||||
| Cayman Islands | 70,636 | 0.4 | |||||||||
| Guernsey | 41,307 | 0.2 | |||||||||
| Bermuda | 30,582 | 0.2 | |||||||||
| Israel | 30,568 | 0.2 | |||||||||
| Total Investments | 17,002,944 | 100.3 | |||||||||
| Liabilities in excess of other assets | (54,744 | ) | (0.3 | ) | |||||||
| Net Assets | $ | 16,948,200 | 100.0 | % | |||||||
See Notes to Financial Statements.
60
Schedule of Investments
PowerShares FTSE RAFI Utilities Sector Portfolio
April 30, 2007
| Number of Shares | Value | ||||||||||
| Common Stocks—99.4% | |||||||||||
| Electric—84.4% | |||||||||||
| 12,844 | AES (The) Corp.* | $ | 282,440 | ||||||||
| 2,510 | Allegheny Energy, Inc.* | 134,185 | |||||||||
| 1,345 | ALLETE, Inc. | 65,111 | |||||||||
| 3,613 | Alliant Energy Corp. | 158,249 | |||||||||
| 7,193 | Ameren Corp. | 378,136 | |||||||||
| 16,757 | American Electric Power Co., Inc. | 841,537 | |||||||||
| 29,983 | Aquila, Inc.* | 123,830 | |||||||||
| 2,256 | Avista Corp. | 53,219 | |||||||||
| 1,234 | Black Hills Corp. | 49,126 | |||||||||
| 19,369 | CenterPoint Energy, Inc. | 364,718 | |||||||||
| 1,652 | Cleco Corp. | 46,355 | |||||||||
| 9,854 | CMS Energy Corp. | 182,496 | |||||||||
| 9,573 | Consolidated Edison, Inc. | 490,712 | |||||||||
| 3,739 | Constellation Energy Group, Inc. | 333,220 | |||||||||
| 9,104 | Dominion Resources, Inc. | 830,285 | |||||||||
| 3,246 | DPL, Inc. | 101,762 | |||||||||
| 7,684 | DTE Energy Co. | 388,734 | |||||||||
| 34,208 | Duke Energy Corp. | 701,948 | |||||||||
| 3,061 | Duquesne Light Holdings, Inc. | 61,036 | |||||||||
| 9,010 | Edison International | 471,674 | |||||||||
| 7,191 | Energy East Corp. | 174,166 | |||||||||
| 4,584 | Entergy Corp. | 518,634 | |||||||||
| 12,147 | Exelon Corp. | 916,004 | |||||||||
| 9,023 | FirstEnergy Corp. | 617,534 | |||||||||
| 8,531 | FPL Group, Inc. | 549,140 | |||||||||
| 3,301 | Great Plains Energy, Inc. | 107,745 | |||||||||
| 3,244 | Hawaiian Electric Industries, Inc. | 85,382 | |||||||||
| 1,874 | IDACORP, Inc. | 64,559 | |||||||||
| 1,736 | Integrys Energy Group, Inc. | 97,390 | |||||||||
| 6,833 | Mirant Corp.* | 306,597 | |||||||||
| 5,470 | Northeast Utilities | 175,970 | |||||||||
| 1,146 | NorthWestern Corp. | 40,270 | |||||||||
| 1,411 | NRG Energy, Inc.* | 111,413 | |||||||||
| 3,779 | NSTAR | 135,666 | |||||||||
| 7,804 | Pepco Holdings, Inc. | 230,374 | |||||||||
| 10,077 | PG&E Corp. | 509,896 | |||||||||
| 3,928 | Pinnacle West Capital Corp. | 189,683 | |||||||||
| 2,208 | PNM Resources, Inc. | 71,870 | |||||||||
| 2,208 | Portland General Electric Co. | 63,988 | |||||||||
| 7,247 | PPL Corp. | 316,042 | |||||||||
| 10,578 | Progress Energy, Inc. | 534,718 | |||||||||
| 6,596 | Public Service Enterprise Group, Inc. | 570,224 | |||||||||
| 4,713 | Puget Energy, Inc. | 121,690 | |||||||||
| 17,358 | Reliant Energy, Inc.* | 386,563 | |||||||||
| 4,055 | SCANA Corp. | 176,514 | |||||||||
| 4,739 | Sierra Pacific Resources* | 86,534 | |||||||||
| 23,458 | Southern Co. | 886,477 | |||||||||
| 8,725 | TECO Energy, Inc. | 156,614 | |||||||||
| 6,926 | TXU Corp. | 454,207 | |||||||||
| 1,187 | UIL Holdings Corp. | 40,536 | |||||||||
| 1,163 | Unisource Energy Corp. | 44,671 | |||||||||
| Number of Shares | Value | ||||||||||
| Common Stocks (Continued) | |||||||||||
| 3,223 | Westar Energy, Inc. | $ | 87,730 | ||||||||
| 3,234 | Wisconsin Energy Corp. | 157,787 | |||||||||
| 17,931 | Xcel Energy, Inc. | 431,958 | |||||||||
| 15,477,319 | |||||||||||
| Environmental Control—0.5% | |||||||||||
| 3,355 | Nalco Holding Co. | 89,176 | |||||||||
| Gas—9.6% | |||||||||||
| 1,969 | AGL Resources, Inc. | 85,730 | |||||||||
| 2,871 | Atmos Energy Corp. | 91,068 | |||||||||
| 954 | Energen Corp. | 53,472 | |||||||||
| 7,216 | KeySpan Corp. | 298,815 | |||||||||
| 946 | New Jersey Resources Corp. | 50,800 | |||||||||
| 1,781 | Nicor, Inc. | 91,258 | |||||||||
| 13,006 | NiSource, Inc. | 319,818 | |||||||||
| 2,243 | Piedmont Natural Gas Co. | 59,193 | |||||||||
| 5,416 | Sempra Energy | 343,808 | |||||||||
| 2,268 | Southern Union Co. | 69,083 | |||||||||
| 1,289 | Southwest Gas Corp. | 48,840 | |||||||||
| 3,188 | UGI Corp. | 90,412 | |||||||||
| 3,006 | Vectren Corp. | 87,384 | |||||||||
| 2,147 | WGL Holdings, Inc. | 72,654 | |||||||||
| 1,762,335 | |||||||||||
| Pipelines—4.7% | |||||||||||
| 1,435 | Equitable Resources, Inc. | 74,634 | |||||||||
| 2,228 | National Fuel Gas Co. | 104,738 | |||||||||
| 3,238 | ONEOK, Inc. | 156,752 | |||||||||
| 1,096 | Questar Corp. | 106,454 | |||||||||
| 16,044 | Spectra Energy Corp. | 418,749 | |||||||||
| 861,327 | |||||||||||
| Water—0.2% | |||||||||||
| 1,820 | Aqua America, Inc. | 40,240 | |||||||||
| Total Common Stocks (Cost $15,983,137) | 18,230,397 | ||||||||||
| Money Market Fund—0.5% | |||||||||||
| 98,220 | Liquid Assets Portfolio Private Class** (Cost $98,220) | 98,220 | |||||||||
| Total Investments (Cost $16,081,357)—99.9% | 18,328,617 | ||||||||||
| Other assets less liabilities—0.1% | 9,650 | ||||||||||
| Net Assets—100.0% | $ | 18,338,267 | |||||||||
* Non-income producing security.
** Affiliated investment.
See Notes to Financial Statements.
61
Statements of Assets and Liabilities
PowerShares Exchange-Traded Funds
April 30, 2007
| FTSE RAFI US 1500 Small-Mid Portfolio | PowerShares FTSE RAFI Basic Materials Sector Portfolio | PowerShares PowerShares Consumer Goods Sector Portfolio | PowerShares FTSE RAFI Consumer Services Sector Portfolio | FTSE RAFI PowerShares FTSE RAFI Energy Sector Portfolio | |||||||||||||||||||
| ASSETS: | |||||||||||||||||||||||
| Unaffiliated investments at value | $ | 85,038,865 | $ | 24,535,540 | $ | 16,107,877 | $ | 11,303,825 | $ | 18,825,742 | |||||||||||||
| Affiliated investments at value | 140,705 | 121,578 | 106,031 | 31,646 | 46,362 | ||||||||||||||||||
| Cash | 522,341 | 450,198 | — | 42,843 | — | ||||||||||||||||||
| Receivables: | |||||||||||||||||||||||
| Dividends | 37,978 | 13,489 | 12,433 | 3,151 | 2,109 | ||||||||||||||||||
| Due from Adviser | 13,136 | 15,312 | 15,788 | 15,876 | 16,608 | ||||||||||||||||||
| Investments sold | — | 3,201,107 | — | 314,187 | — | ||||||||||||||||||
| Other assets | 7,538 | 7,581 | 7,358 | 7,571 | 7,717 | ||||||||||||||||||
| Total Assets | 85,760,563 | 28,344,805 | 16,249,487 | 11,719,099 | 18,898,538 | ||||||||||||||||||
| LIABILITIES: | |||||||||||||||||||||||
| Due to custodian | — | — | 9,172 | — | 51,737 | ||||||||||||||||||
| Payables: | |||||||||||||||||||||||
| Investments purchased | — | 3,204,369 | — | 291,243 | — | ||||||||||||||||||
| Accrued advisory fees | 33,810 | 10,283 | 6,574 | 4,708 | 8,864 | ||||||||||||||||||
| Accrued expenses | 46,877 | 48,163 | 46,830 | 45,583 | 50,430 | ||||||||||||||||||
| Total Liabilities | 80,687 | 3,262,815 | 62,576 | 341,534 | 111,031 | ||||||||||||||||||
| NET ASSETS | $ | 85,679,876 | $ | 25,081,990 | $ | 16,186,911 | $ | 11,377,565 | $ | 18,787,507 | |||||||||||||
| NET ASSETS CONSIST OF: | |||||||||||||||||||||||
| Paid-in capital | $ | 83,062,195 | $ | 21,598,368 | $ | 14,925,922 | $ | 10,263,449 | $ | 16,681,452 | |||||||||||||
| Undistributed net investment income | 111,680 | 100,998 | 88,655 | 7,778 | 14,429 | ||||||||||||||||||
| Accumulated net realized gain (loss) on investments | (427,456 | ) | 23,410 | (50,153 | ) | (29,340 | ) | (30,155 | ) | ||||||||||||||
| Net unrealized appreciation on investments | 2,933,457 | 3,359,214 | 1,222,487 | 1,135,678 | 2,121,781 | ||||||||||||||||||
| Net Assets | $ | 85,679,876 | $ | 25,081,990 | $ | 16,186,911 | $ | 11,377,565 | $ | 18,787,507 | |||||||||||||
| Shares outstanding (unlimited amount authorized, $0.01 par value) | 1,500,000 | 400,000 | 300,000 | 200,000 | 300,000 | ||||||||||||||||||
| Net asset value | $ | 57.12 | $ | 62.70 | $ | 53.96 | $ | 56.89 | $ | 62.63 | |||||||||||||
| Unaffiliated investments at cost | $ | 82,105,408 | $ | 21,176,326 | $ | 14,885,390 | $ | 10,168,147 | $ | 16,703,961 | |||||||||||||
| Affiliated investments at cost | $ | 140,705 | $ | 121,578 | $ | 106,031 | $ | 31,646 | $ | 46,362 | |||||||||||||
See Notes to Financial Statements.
62
| PowerShares FTSE RAFI Financials Sector Portfolio | FTSE RAFI Health Care Sector Portfolio | PowerShares PowerShares FTSE RAFI Industrials Sector Portfolio | FTSE RAFI Telecommunications & Technology Sector Portfolio | PowerShares PowerShares FTSE RAFI Utilities Sector Portfolio | |||||||||||||||||||
| ASSETS: | |||||||||||||||||||||||
| Unaffiliated investments at value | $ | 16,048,090 | $ | 21,824,909 | $ | 40,581,710 | $ | 16,971,409 | $ | 18,230,397 | |||||||||||||
| Affiliated investments at value | 17,423 | 76,365 | 35,802 | 31,535 | 98,220 | ||||||||||||||||||
| Cash | 248,933 | — | 330,013 | — | 17,475 | ||||||||||||||||||
| Receivables: | |||||||||||||||||||||||
| Dividends | 12,569 | 23,274 | 15,608 | 37,822 | 24,582 | ||||||||||||||||||
| Due from Adviser | 15,317 | 16,156 | 15,394 | 16,231 | 15,930 | ||||||||||||||||||
| Investments sold | 1,162,924 | 515,947 | 432,614 | 129,287 | — | ||||||||||||||||||
| Other assets | 7,583 | 7,509 | 7,618 | 7,593 | 7,518 | ||||||||||||||||||
| Total Assets | 17,512,839 | 22,464,160 | 41,418,759 | 17,193,877 | 18,394,122 | ||||||||||||||||||
| LIABILITIES: | |||||||||||||||||||||||
| Due to custodian | — | 2,509 | — | 59,977 | — | ||||||||||||||||||
| Payables: | |||||||||||||||||||||||
| Investments purchased | 1,144,596 | 499,733 | 422,317 | 130,260 | — | ||||||||||||||||||
| Accrued advisory fees | 4,776 | 9,360 | 16,703 | 7,445 | 7,490 | ||||||||||||||||||
| Accrued expenses | 44,507 | 49,772 | 51,840 | 47,995 | 48,365 | ||||||||||||||||||
| Total Liabilities | 1,193,879 | 561,374 | 490,860 | 245,677 | 55,855 | ||||||||||||||||||
| NET ASSETS | $ | 16,318,960 | $ | 21,902,786 | $ | 40,927,899 | $ | 16,948,200 | $ | 18,338,267 | |||||||||||||
| NET ASSETS CONSIST OF: | |||||||||||||||||||||||
| Paid-in capital | $ | 15,580,514 | $ | 20,430,620 | $ | 38,056,354 | $ | 15,786,765 | $ | 16,004,966 | |||||||||||||
| Undistributed net investment income | 60,071 | 15,785 | 5,984 | 34,900 | 92,800 | ||||||||||||||||||
| Accumulated net realized gain (loss) on investments | (23,569 | ) | (48,243 | ) | (40,187 | ) | (70,037 | ) | (6,759 | ) | |||||||||||||
| Net unrealized appreciation on investments | 701,944 | 1,504,624 | 2,905,748 | 1,196,572 | 2,247,260 | ||||||||||||||||||
| Net Assets | $ | 16,318,960 | $ | 21,902,786 | $ | 40,927,899 | $ | 16,948,200 | $ | 18,338,267 | |||||||||||||
| Shares outstanding (unlimited amount authorized, $0.01 par value) | 300,000 | 400,000 | 700,000 | 300,000 | 300,000 | ||||||||||||||||||
| Net asset value | $ | 54.40 | $ | 54.76 | $ | 58.47 | $ | 56.49 | $ | 61.13 | |||||||||||||
| Unaffiliated investments at cost | $ | 15,346,146 | $ | 20,320,285 | $ | 37,675,962 | $ | 15,774,837 | $ | 15,983,137 | |||||||||||||
| Affiliated investments at cost | $ | 17,423 | $ | 76,365 | $ | 35,802 | $ | 31,535 | $ | 98,220 | |||||||||||||
63
Statements of Operations
For the Period September 20, 2006* through April 30, 2007
| FTSE RAFI US 1500 Small-Mid Portfolio | PowerShares FTSE RAFI Basic Materials Sector Portfolio | PowerShares PowerShares Consumer Goods Sector Portfolio | PowerShares FTSE RAFI Consumer Services Sector Portfolio | FTSE RAFI PowerShares FTSE RAFI Energy Sector Portfolio | |||||||||||||||||||
| INVESTMENT INCOME: | |||||||||||||||||||||||
| Unaffiliated dividend income | $ | 411,073 | $ | 403,676 | $ | 272,009 | $ | 97,883 | $ | 227,203 | |||||||||||||
| Affiliated dividend income | 1,748 | 2,675 | 1,092 | 530 | 927 | ||||||||||||||||||
| Foreign withholding taxes | (273 | ) | — | — | — | — | |||||||||||||||||
| Total Income | 412,548 | 406,351 | 273,101 | 98,413 | 228,130 | ||||||||||||||||||
| EXPENSES: | |||||||||||||||||||||||
| Advisory fees | 132,139 | 67,884 | 56,129 | 46,528 | 81,131 | ||||||||||||||||||
| Licensing | 26,428 | 13,577 | 11,226 | 9,306 | 16,226 | ||||||||||||||||||
| Audit | 16,500 | 16,500 | 16,500 | 16,500 | 16,500 | ||||||||||||||||||
| Printing | 13,822 | 8,272 | 7,619 | 6,906 | 10,464 | ||||||||||||||||||
| Listing fee and expenses | 11,395 | 11,406 | 11,361 | 11,386 | 11,708 | ||||||||||||||||||
| Administration fees | 9,373 | 8,357 | 8,155 | 7,943 | 8,800 | ||||||||||||||||||
| Accounting | 7,934 | 7,256 | 7,122 | 6,980 | 7,552 | ||||||||||||||||||
| Offering costs | 6,393 | 6,396 | 6,379 | 6,395 | 6,407 | ||||||||||||||||||
| Custodian & transfer agent fees | 2,965 | 2,584 | 2,517 | 2,446 | 2,732 | ||||||||||||||||||
| Registration & filings | 2,054 | 2,053 | 2,016 | 2,048 | 2,053 | ||||||||||||||||||
| Legal | 1,001 | 1,001 | 1,001 | 1,001 | 1,001 | ||||||||||||||||||
| Trustees | 951 | 435 | 391 | 305 | 666 | ||||||||||||||||||
| Other expenses | 12,235 | 13,905 | 12,235 | 12,235 | 12,235 | ||||||||||||||||||
| Total Expenses | 243,190 | 159,626 | 142,651 | 129,979 | 177,475 | ||||||||||||||||||
| Less fees waived: | |||||||||||||||||||||||
| Advisory | (51,267 | ) | (55,988 | ) | (56,129 | ) | (46,528 | ) | (56,949 | ) | |||||||||||||
| Other fees assumed by Adviser | — | — | (1,028 | ) | (11,382 | ) | — | ||||||||||||||||
| Net Expenses | 191,923 | 103,638 | 85,494 | 72,069 | 120,526 | ||||||||||||||||||
| Net Investment Income | 220,625 | 302,713 | 187,607 | 26,344 | 107,604 | ||||||||||||||||||
| REALIZED AND UNREALIZED GAIN (LOSS) ON INVESTMENTS: | |||||||||||||||||||||||
| Net realized gain (loss) from: | |||||||||||||||||||||||
| Investments | (427,456 | ) | 23,410 | (50,153 | ) | (29,340 | ) | (30,155 | ) | ||||||||||||||
| In-kind redemptions | 2,311,893 | 1,771,191 | 569,178 | 1,210,490 | 3,397,258 | ||||||||||||||||||
| Net realized gain | 1,884,437 | 1,794,601 | 519,025 | 1,181,150 | 3,367,103 | ||||||||||||||||||
| Net unrealized appreciation on investments | 2,933,457 | 3,359,214 | 1,222,487 | 1,135,678 | 2,121,781 | ||||||||||||||||||
| Net realized and unrealized gain on investments | 4,817,894 | 5,153,815 | 1,741,512 | 2,316,828 | 5,488,884 | ||||||||||||||||||
| Net increase in net assets resulting from operations | $ | 5,038,519 | $ | 5,456,528 | $ | 1,929,119 | $ | 2,343,172 | $ | 5,596,488 | |||||||||||||
* Commencement of Investment Operations.
See Notes to Financial Statements.
64
| PowerShares FTSE RAFI Financials Sector Portfolio | FTSE RAFI Health Care Sector Portfolio | PowerShares PowerShares FTSE RAFI Industrials Sector Portfolio | FTSE RAFI Telecommunications & Technology Sector Portfolio | PowerShares PowerShares FTSE RAFI Utilities Sector Portfolio | |||||||||||||||||||
| INVESTMENT INCOME: | |||||||||||||||||||||||
| Unaffiliated dividend income | $ | 210,624 | $ | 317,203 | $ | 362,997 | $ | 234,785 | $ | 397,172 | |||||||||||||
| Affiliated dividend income | 465 | 1,487 | 914 | 1,499 | 1,657 | ||||||||||||||||||
| Foreign withholding taxes | (38 | ) | — | — | — | — | |||||||||||||||||
| Total Income | 211,051 | 318,690 | 363,911 | 236,284 | 398,829 | ||||||||||||||||||
| EXPENSES: | |||||||||||||||||||||||
| Advisory fees | 43,426 | 76,703 | 101,830 | 68,577 | 64,980 | ||||||||||||||||||
| Licensing | 8,685 | 15,341 | 20,366 | 13,715 | 12,996 | ||||||||||||||||||
| Audit | 16,500 | 16,500 | 16,500 | 16,500 | 16,500 | ||||||||||||||||||
| Printing | 5,840 | 9,708 | 11,452 | 9,056 | 8,294 | ||||||||||||||||||
| Listing fee and expenses | 11,114 | 11,670 | 11,395 | 11,389 | 11,665 | ||||||||||||||||||
| Administration fees | 7,851 | 8,644 | 9,116 | 8,475 | 8,389 | ||||||||||||||||||
| Accounting | 6,919 | 7,447 | 7,762 | 7,335 | 7,278 | ||||||||||||||||||
| Offering costs | 6,396 | 6,390 | 6,399 | 6,397 | 6,391 | ||||||||||||||||||
| Custodian & transfer agent fees | 2,416 | 2,680 | 2,837 | 2,624 | 2,595 | ||||||||||||||||||
| Registration & filings | 2,055 | 2,052 | 2,052 | 2,046 | 2,055 | ||||||||||||||||||
| Legal | 1,001 | 1,001 | 1,001 | 1,001 | 1,001 | ||||||||||||||||||
| Trustees | 282 | 596 | 804 | 521 | 522 | ||||||||||||||||||
| Other expenses | 12,235 | 12,235 | 12,401 | 12,235 | 12,235 | ||||||||||||||||||
| Total Expenses | 124,720 | 170,967 | 203,915 | 159,871 | 154,901 | ||||||||||||||||||
| Less fees waived: | |||||||||||||||||||||||
| Advisory | (43,426 | ) | (56,657 | ) | (54,254 | ) | (56,931 | ) | (57,004 | ) | |||||||||||||
| Other fees assumed by Adviser | (13,567 | ) | — | — | — | — | |||||||||||||||||
| Net Expenses | 67,727 | 114,310 | 149,661 | 102,940 | 97,897 | ||||||||||||||||||
| Net Investment Income | 143,324 | 204,380 | 214,250 | 133,344 | 300,932 | ||||||||||||||||||
| REALIZED AND UNREALIZED GAIN (LOSS) ON INVESTMENTS: | |||||||||||||||||||||||
| Net realized gain (loss) from: | |||||||||||||||||||||||
| Investments | (23,658 | ) | (48,243 | ) | (40,187 | ) | (70,037 | ) | (6,759 | ) | |||||||||||||
| In-kind redemptions | 831,064 | 572,698 | 2,106,705 | 1,605,617 | 1,467,091 | ||||||||||||||||||
| Net realized gain | 807,406 | 524,455 | 2,066,518 | 1,535,580 | 1,460,332 | ||||||||||||||||||
| Net unrealized appreciation on investments | 701,944 | 1,504,624 | 2,905,748 | 1,196,572 | 2,247,260 | ||||||||||||||||||
| Net realized and unrealized gain on investments | 1,509,350 | 2,029,079 | 4,972,266 | 2,732,152 | 3,707,592 | ||||||||||||||||||
| Net increase in net assets resulting from operations | $ | 1,652,674 | $ | 2,233,459 | $ | 5,186,516 | $ | 2,865,496 | $ | 4,008,524 | |||||||||||||
65
Statements of Changes in Net Assets
For the Period September 20, 2006* through April 30, 2007
| FTSE RAFI US 1500 Small-Mid Portfolio | PowerShares FTSE RAFI Basic Materials Sector Portfolio | PowerShares PowerShares Consumer Goods Sector Portfolio | PowerShares FTSE RAFI Consumer Services Sector Portfolio | FTSE RAFI PowerShares FTSE RAFI Energy Sector Portfolio | |||||||||||||||||||
| OPERATIONS: | |||||||||||||||||||||||
| Net investment income | $ | 220,625 | $ | 302,713 | $ | 187,607 | $ | 26,344 | $ | 107,604 | |||||||||||||
| Net realized gain on investments | 1,884,437 | 1,794,601 | 519,025 | 1,181,150 | 3,367,103 | ||||||||||||||||||
| Net unrealized appreciation on investments | 2,933,457 | 3,359,214 | 1,222,487 | 1,135,678 | 2,121,781 | ||||||||||||||||||
| Net increase in net assets resulting from operations | 5,038,519 | 5,456,528 | 1,929,119 | 2,343,172 | 5,596,488 | ||||||||||||||||||
| Undistributed net investment income (loss) included in the price of units issued and redeemed | 40,491 | (71,185 | ) | (23,621 | ) | 1,129 | (15,535 | ) | |||||||||||||||
| DISTRIBUTIONS TO SHAREHOLDERS FROM: | |||||||||||||||||||||||
| Net investment income | (107,528 | ) | (203,385 | ) | (98,952 | ) | (18,566 | ) | (93,175 | ) | |||||||||||||
| SHAREHOLDER TRANSACTIONS: | |||||||||||||||||||||||
| Proceeds from shares sold | 102,455,043 | 42,703,830 | 29,685,007 | 30,486,275 | 47,515,291 | ||||||||||||||||||
| Value of shares repurchased | (21,706,158 | ) | (22,874,983 | ) | (15,328,263 | ) | (21,433,316 | ) | (34,231,097 | ) | |||||||||||||
| Net income equalization | (40,491 | ) | 71,185 | 23,621 | (1,129 | ) | 15,535 | ||||||||||||||||
| Net increase in net assets resulting from shares transactions | 80,708,394 | 19,900,032 | 14,380,365 | 9,051,830 | 13,299,729 | ||||||||||||||||||
| Increase in Net Assets | 85,679,876 | 25,081,990 | 16,186,911 | 11,377,565 | 18,787,507 | ||||||||||||||||||
| NET ASSETS: | |||||||||||||||||||||||
| Beginning of period | — | — | — | — | — | ||||||||||||||||||
| End of period | $ | 85,679,876 | $ | 25,081,990 | $ | 16,186,911 | $ | 11,377,565 | $ | 18,787,507 | |||||||||||||
| Undistributed net investment income at end of period | $ | 111,680 | $ | 100,998 | $ | 88,655 | $ | 7,778 | $ | 14,429 | |||||||||||||
| CHANGES IN SHARES OUTSTANDING: | |||||||||||||||||||||||
| Shares sold | 1,900,000 | 800,000 | 600,000 | 600,000 | 900,000 | ||||||||||||||||||
| Shares repurchased | (400,000 | ) | (400,000 | ) | (300,000 | ) | (400,000 | ) | (600,000 | ) | |||||||||||||
| Shares outstanding, beginning of period | — | — | — | — | — | ||||||||||||||||||
| Shares outstanding, end of period | 1,500,000 | 400,000 | 300,000 | 200,000 | 300,000 | ||||||||||||||||||
* Commencement of Investment Operations.
See Notes to Financial Statements.
66
| PowerShares FTSE RAFI Financials Sector Portfolio | FTSE RAFI Health Care Sector Portfolio | PowerShares PowerShares FTSE RAFI Industrials Sector Portfolio | FTSE RAFI Telecommunications & Technology Sector Portfolio | PowerShares PowerShares FTSE RAFI Utilities Sector Portfolio | |||||||||||||||||||
| OPERATIONS: | |||||||||||||||||||||||
| Net investment income | $ | 143,324 | $ | 204,380 | $ | 214,250 | $ | 133,344 | $ | 300,932 | |||||||||||||
| Net realized gain on investments | 807,406 | 524,455 | 2,066,518 | 1,535,580 | 1,460,332 | ||||||||||||||||||
| Net unrealized appreciation on investments | 701,944 | 1,504,624 | 2,905,748 | 1,196,572 | 2,247,260 | ||||||||||||||||||
| Net increase in net assets resulting from operations | 1,652,674 | 2,233,459 | 5,186,516 | 2,865,496 | 4,008,524 | ||||||||||||||||||
| Undistributed net investment income (loss) included in the price of units issued and redeemed | (25,026 | ) | (4,231 | ) | 8,755 | (11,299 | ) | (61,710 | ) | ||||||||||||||
| DISTRIBUTIONS TO SHAREHOLDERS FROM: | |||||||||||||||||||||||
| Net investment income | (83,164 | ) | (188,595 | ) | (208,432 | ) | (98,444 | ) | (208,132 | ) | |||||||||||||
| SHAREHOLDER TRANSACTIONS: | |||||||||||||||||||||||
| Proceeds from shares sold | 41,076,550 | 45,224,207 | 68,623,129 | 41,066,412 | 47,129,478 | ||||||||||||||||||
| Value of shares repurchased | (26,327,100 | ) | (25,366,285 | ) | (32,673,314 | ) | (26,885,264 | ) | (32,591,603 | ) | |||||||||||||
| Net income equalization | 25,026 | 4,231 | (8,755 | ) | 11,299 | 61,710 | |||||||||||||||||
| Net increase in net assets resulting from shares transactions | 14,774,476 | 19,862,153 | 35,941,060 | 14,192,447 | 14,599,585 | ||||||||||||||||||
| Increase in Net Assets | 16,318,960 | 21,902,786 | 40,927,899 | 16,948,200 | 18,338,267 | ||||||||||||||||||
| NET ASSETS: | |||||||||||||||||||||||
| Beginning of period | — | — | — | — | — | ||||||||||||||||||
| End of period | $ | 16,318,960 | $ | 21,902,786 | $ | 40,927,899 | $ | 16,948,200 | $ | 18,338,267 | |||||||||||||
| Undistributed net investment income at end of period | $ | 60,071 | $ | 15,785 | $ | 5,984 | $ | 34,900 | $ | 92,800 | |||||||||||||
| CHANGES IN SHARES OUTSTANDING: | |||||||||||||||||||||||
| Shares sold | 800,000 | 900,000 | 1,300,000 | 800,000 | 900,000 | ||||||||||||||||||
| Shares repurchased | (500,000 | ) | (500,000 | ) | (600,000 | ) | (500,000 | ) | (600,000 | ) | |||||||||||||
| Shares outstanding, beginning of period | — | — | — | — | — | ||||||||||||||||||
| Shares outstanding, end of period | 300,000 | 400,000 | 700,000 | 300,000 | 300,000 | ||||||||||||||||||
67
Financial Highlights
PowerShares FTSE RAFI US 1500 Small-Mid Portfolio
| For the period September 20, 2006* through April 30, 2007 | |||||||
| PER SHARE OPERATING PERFORMANCE: | |||||||
| Net asset value at beginning of period | $ | 50.52 | |||||
| Net investment income** | 0.27 | ||||||
| Net realized and unrealized gain on investments | 6.45 | ||||||
| Total from operations | 6.72 | ||||||
| Undistributed net investment income included in price of units issued and redeemed** | 0.05 | ||||||
| Distributions to shareholders from: | |||||||
| Net investment income | (0.17 | ) | |||||
| Net asset value at end of period | $ | 57.12 | |||||
| TOTAL RETURN*** | 13.42 | % | |||||
| RATIOS/SUPPLEMENTAL DATA: | |||||||
| Net assets at end of period (000's omitted) | $ | 85,680 | |||||
| Ratio to average net assets of: | |||||||
| Expenses, net of waivers | 0.73 | %† | |||||
| Expenses, prior to waivers | 0.92 | %† | |||||
| Net investment income, net of waivers | 0.83 | %† | |||||
| Portfolio turnover rate †† | 9 | % | |||||
PowerShares FTSE RAFI Basic Materials Sector Portfolio
| For the period September 20, 2006* through April 30, 2007 | |||||||
| PER SHARE OPERATING PERFORMANCE: | |||||||
| Net asset value at beginning of period | $ | 50.27 | |||||
| Net investment income** | 0.78 | ||||||
| Net realized and unrealized gain on investments | 12.49 | ||||||
| Total from operations | 13.27 | ||||||
| Undistributed net investment loss included in price of units issued and redeemed** | (0.18 | ) | |||||
| Distributions to shareholders from: | |||||||
| Net investment income | (0.66 | ) | |||||
| Net asset value at end of period | $ | 62.70 | |||||
| TOTAL RETURN*** | 26.17 | % | |||||
| RATIOS/SUPPLEMENTAL DATA: | |||||||
| Net assets at end of period (000's omitted) | $ | 25,082 | |||||
| Ratio to average net assets of: | |||||||
| Expenses, net of waivers | 0.76 | %† | |||||
| Expenses, prior to waivers | 1.18 | %† | |||||
| Net investment income, net of waivers | 2.23 | %† | |||||
| Portfolio turnover rate †† | 15 | % | |||||
* Commencement of Investment Operations.
** Based on average shares outstanding.
*** Total investment return is calculated assuming an initial investment made at the net asset value at the beginning of the period, reinvestment of all dividends and distributions at net asset value during the period, and redemption on the last day of the period. Total investment return calculated for a period of less than one year is not annualized.
† Annualized.
†† Portfolio turnover is not annualized and does not include securities received or delivered from processing creations or redemptions.
See Notes to Financial Statements.
68
Financial Highlights (Continued)
PowerShares FTSE RAFI Consumer Goods Sector Portfolio
| For the period September 20, 2006* through April 30, 2007 | |||||||
| PER SHARE OPERATING PERFORMANCE: | |||||||
| Net asset value at beginning of period | $ | 49.03 | |||||
| Net investment income** | 0.54 | ||||||
| Net realized and unrealized gain on investments | 4.79 | ||||||
| Total from operations | 5.33 | ||||||
| Undistributed net investment loss included in price of units issued and redeemed** | (0.07 | ) | |||||
| Distributions to shareholders from: | |||||||
| Net investment income | (0.33 | ) | |||||
| Net asset value at end of period | $ | 53.96 | |||||
| TOTAL RETURN*** | 10.78 | % | |||||
| RATIOS/SUPPLEMENTAL DATA: | |||||||
| Net assets at end of period (000's omitted) | $ | 16,187 | |||||
| Ratio to average net assets of: | |||||||
| Expenses, net of waivers | 0.76 | %† | |||||
| Expenses, prior to waivers | 1.27 | %† | |||||
| Net investment income, net of waivers | 1.67 | %† | |||||
| Portfolio turnover rate †† | 1 | % | |||||
PowerShares FTSE RAFI Consumer Services Sector Portfolio
| For the period September 20, 2006* through April 30, 2007 | |||||||
| PER SHARE OPERATING PERFORMANCE: | |||||||
| Net asset value at beginning of period | $ | 50.53 | |||||
| Net investment income** | 0.10 | ||||||
| Net realized and unrealized gain on investments | 6.35 | ||||||
| Total from operations | 6.45 | ||||||
| Undistributed net investment income included in price of units issued and redeemed** | — | (a) | |||||
| Distributions to shareholders from: | |||||||
| Net investment income | (0.09 | ) | |||||
| Net asset value at end of period | $ | 56.89 | |||||
| TOTAL RETURN*** | 12.78 | % | |||||
| RATIOS/SUPPLEMENTAL DATA: | |||||||
| Net assets at end of period (000's omitted) | $ | 11,378 | |||||
| Ratio to average net assets of: | |||||||
| Expenses, net of waivers | 0.77 | %† | |||||
| Expenses, prior to waivers | 1.40 | %† | |||||
| Net investment income, net of waivers | 0.28 | %† | |||||
| Portfolio turnover rate †† | 4 | % | |||||
* Commencement of Investment Operations.
** Based on average shares outstanding.
*** Total investment return is calculated assuming an initial investment made at the net asset value at the beginning of the period, reinvestment of all dividends and distributions at net asset value during the period, and redemption on the last day of the period. Total investment return calculated for a period of less than one year is not annualized.
† Annualized.
†† Portfolio turnover is not annualized and does not include securities received or delivered from processing creations or redemptions.
(a) Amount represents less than $0.01.
See Notes to Financial Statements.
69
Financial Highlights (Continued)
PowerShares FTSE RAFI Energy Sector Portfolio
| For the period September 20, 2006* through April 30, 2007 | |||||||
| PER SHARE OPERATING PERFORMANCE: | |||||||
| Net asset value at beginning of period | $ | 49.16 | |||||
| Net investment income** | 0.23 | ||||||
| Net realized and unrealized gain on investments | 13.48 | ||||||
| Total from operations | 13.71 | ||||||
| Undistributed net investment loss included in price of units issued and redeemed** | (0.03 | ) | |||||
| Distributions to shareholders from: | |||||||
| Net investment income | (0.21 | ) | |||||
| Net asset value at end of period | $ | 62.63 | |||||
| TOTAL RETURN*** | 27.86 | % | |||||
| RATIOS/SUPPLEMENTAL DATA: | |||||||
| Net assets at end of period (000's omitted) | $ | 18,788 | |||||
| Ratio to average net assets of: | |||||||
| Expenses, net of waivers | 0.74 | %† | |||||
| Expenses, prior to waivers | 1.09 | %† | |||||
| Net investment income, net of waivers | 0.66 | %† | |||||
| Portfolio turnover rate †† | 1 | % | |||||
PowerShares FTSE RAFI Financials Sector Portfolio
| For the period September 20, 2006* through April 30, 2007 | |||||||
| PER SHARE OPERATING PERFORMANCE: | |||||||
| Net asset value at beginning of period | $ | 50.47 | |||||
| Net investment income** | 0.52 | ||||||
| Net realized and unrealized gain on investments | 3.92 | ||||||
| Total from operations | 4.44 | ||||||
| Undistributed net investment loss included in price of units issued and redeemed** | (0.09 | ) | |||||
| Distributions to shareholders from: | |||||||
| Net investment income | (0.42 | ) | |||||
| Net asset value at end of period | $ | 54.40 | |||||
| TOTAL RETURN*** | 8.62 | % | |||||
| RATIOS/SUPPLEMENTAL DATA: | |||||||
| Net assets at end of period (000's omitted) | $ | 16,319 | |||||
| Ratio to average net assets of: | |||||||
| Expenses, net of waivers | 0.78 | %† | |||||
| Expenses, prior to waivers | 1.44 | %† | |||||
| Net investment income, net of waivers | 1.65 | %† | |||||
| Portfolio turnover rate †† | 10 | % | |||||
* Commencement of Investment Operations.
** Based on average shares outstanding.
*** Total investment return is calculated assuming an initial investment made at the net asset value at the beginning of the period, reinvestment of all dividends and distributions at net asset value during the period, and redemption on the last day of the period. Total investment return calculated for a period of less than one year is not annualized.
† Annualized.
†† Portfolio turnover is not annualized and does not include securities received or delivered from processing creations or redemptions.
See Notes to Financial Statements.
70
Financial Highlights (Continued)
PowerShares FTSE RAFI Health Care Sector Portfolio
| For the period September 20, 2006* through April 30, 2007 | |||||||
| PER SHARE OPERATING PERFORMANCE: | |||||||
| Net asset value at beginning of period | $ | 50.44 | |||||
| Net investment income** | 0.42 | ||||||
| Net realized and unrealized gain on investments | 4.29 | ||||||
| Total from operations | 4.71 | ||||||
| Undistributed net investment loss included in price of units issued and redeemed** | (0.01 | ) | |||||
| Distributions to shareholders from: | |||||||
| Net investment income | (0.38 | ) | |||||
| Net asset value at end of period | $ | 54.76 | |||||
| TOTAL RETURN*** | 9.38 | % | |||||
| RATIOS/SUPPLEMENTAL DATA: | |||||||
| Net assets at end of period (000's omitted) | $ | 21,903 | |||||
| Ratio to average net assets of: | |||||||
| Expenses, net of waivers | 0.75 | %† | |||||
| Expenses, prior to waivers | 1.11 | %† | |||||
| Net investment income, net of waivers | 1.33 | %† | |||||
| Portfolio turnover rate †† | 5 | % | |||||
PowerShares FTSE RAFI Industrials Sector Portfolio
| For the period September 20, 2006* through April 30, 2007 | |||||||
| PER SHARE OPERATING PERFORMANCE: | |||||||
| Net asset value at beginning of period | $ | 50.27 | |||||
| Net investment income** | 0.36 | ||||||
| Net realized and unrealized gain on investments | 8.15 | ||||||
| Total from operations | 8.51 | ||||||
| Undistributed net investment income included in price of units issued and redeemed** | 0.02 | ||||||
| Distributions to shareholders from: | |||||||
| Net investment income | (0.33 | ) | |||||
| Net asset value at end of period | $ | 58.47 | |||||
| TOTAL RETURN*** | 17.01 | % | |||||
| RATIOS/SUPPLEMENTAL DATA: | |||||||
| Net assets at end of period (000's omitted) | $ | 40,928 | |||||
| Ratio to average net assets of: | |||||||
| Expenses, net of waivers | 0.73 | %† | |||||
| Expenses, prior to waivers | 1.00 | %† | |||||
| Net investment income, net of waivers | 1.05 | %† | |||||
| Portfolio turnover rate †† | 3 | % | |||||
* Commencement of Investment Operations.
** Based on average shares outstanding.
*** Total investment return is calculated assuming an initial investment made at the net asset value at the beginning of the period, reinvestment of all dividends and distributions at net asset value during the period, and redemption on the last day of the period. Total investment return calculated for a period of less than one year is not annualized.
† Annualized.
†† Portfolio turnover is not annualized and does not include securities received or delivered from processing creations or redemptions.
See Notes to Financial Statements.
71
Financial Highlights (Continued)
PowerShares FTSE RAFI Telecommunications & Technology Sector Portfolio
| For the period September 20, 2006* through April 30, 2007 | |||||||
| PER SHARE OPERATING PERFORMANCE: | |||||||
| Net asset value at beginning of period | $ | 50.60 | |||||
| Net investment income** | 0.32 | ||||||
| Net realized and unrealized gain on investments | 5.85 | ||||||
| Total from operations | 6.17 | ||||||
| Undistributed net investment loss included in price of units issued and redeemed** | (0.03 | ) | |||||
| Distributions to shareholders from: | |||||||
| Net investment income | (0.25 | ) | |||||
| Net asset value at end of period | $ | 56.49 | |||||
| TOTAL RETURN*** | 12.15 | % | |||||
| RATIOS/SUPPLEMENTAL DATA: | |||||||
| Net assets at end of period (000's omitted) | $ | 16,948 | |||||
| Ratio to average net assets of: | |||||||
| Expenses, net of waivers | 0.75 | %† | |||||
| Expenses, prior to waivers | 1.17 | %† | |||||
| Net investment income, net of waivers | 0.97 | %† | |||||
| Portfolio turnover rate †† | 4 | % | |||||
PowerShares FTSE RAFI Utilities Sector Portfolio
| For the period September 20, 2006* through April 30, 2007 | |||||||
| PER SHARE OPERATING PERFORMANCE: | |||||||
| Net asset value at beginning of period | $ | 49.93 | |||||
| Net investment income** | 0.78 | ||||||
| Net realized and unrealized gain on investments | 11.23 | ||||||
| Total from operations | 12.01 | ||||||
| Undistributed net investment loss included in price of units issued and redeemed** | (0.16 | ) | |||||
| Distributions to shareholders from: | |||||||
| Net investment income | (0.65 | ) | |||||
| Net asset value at end of period | $ | 61.13 | |||||
| TOTAL RETURN*** | 23.87 | % | |||||
| RATIOS/SUPPLEMENTAL DATA: | |||||||
| Net assets at end of period (000's omitted) | $ | 18,338 | |||||
| Ratio to average net assets of: | |||||||
| Expenses, net of waivers | 0.75 | %† | |||||
| Expenses, prior to waivers | 1.19 | %† | |||||
| Net investment income, net of waivers | 2.32 | %† | |||||
| Portfolio turnover rate †† | 0 | %(a) | |||||
* Commencement of Investment Operations.
** Based on average shares outstanding.
*** Total investment return is calculated assuming an initial investment made at the net asset value at the beginning of the period, reinvestment of all dividends and distributions at net asset value during the period, and redemption on the last day of the period. Total investment return calculated for a period of less than one year is not annualized.
+ Annualized.
++ Portfolio turnover is not annualized and does not include securities received or delivered from processing creations or redemptions.
(a) Amount represents less than 1%.
See Notes to Financial Statements.
72
Notes to Financial Statements
PowerShares Exchange-Traded Fund Trust
April 30, 2007
Note 1. Organization
PowerShares Exchange-Traded Fund Trust (the "Trust"), which is registered under the Investment Company Act of 1940, as amended (the "1940 Act"), is an exchange-traded, management investment company that was organized as a Massachusetts business trust on June 9, 2000. The Trust currently consists of seventy portfolios. This report includes the following portfolios:
| PowerShares FTSE RAFI US 1500 Small-Mid Portfolio | "FTSE RAFI US 1500 Small-Mid Portfolio" | ||||||
| PowerShares FTSE RAFI Basic Materials Sector Portfolio | "FTSE RAFI Basic Materials Sector Portfolio" | ||||||
| PowerShares FTSE RAFI Consumer Goods Sector Portfolio | "FTSE RAFI Consumer Goods Sector Portfolio" | ||||||
| PowerShares FTSE RAFI Consumer Services Sector Portfolio | "FTSE RAFI Consumer Services Sector Portfolio" | ||||||
| PowerShares FTSE RAFI Energy Sector Portfolio | "FTSE RAFI Energy Sector Portfolio" | ||||||
| PowerShares FTSE RAFI Financials Sector Portfolio | "FTSE RAFI Financials Sector Portfolio" | ||||||
| PowerShares FTSE RAFI Health Care Sector Portfolio | "FTSE RAFI Health Care Sector Portfolio" | ||||||
| PowerShares FTSE RAFI Industrials Sector Portfolio | "FTSE RAFI Industrials Sector Portfolio" | ||||||
| PowerShares FTSE RAFI Telecommunications & Technology Sector Portfolio | "FTSE RAFI Telecommunications & Technology Sector Portfolio" | ||||||
| PowerShares FTSE RAFI Utilities Sector Portfolio | "FTSE RAFI Utilities Sector Portfolio" | ||||||
The Portfolios commenced investment operations on September 20, 2006. Each Portfolio represents a separate series of the Trust (the "Fund" or "Funds"). Each Fund's shares are listed and traded on NASDAQ. The Funds' market prices may differ to some degree from the net asset value of the shares of each Fund. Unlike conventional mutual funds, each Fund issues and redeems shares on a continuous basis, at net asset value, only in a large specified number of shares, each called a "Creation Unit." Creation Units are issued and redeemed principally in-kind for securities included in the relevant index. Except when aggregated in Creation Units, shares are not individually redeemable securities of the Funds. The investment objective of each Fund is to seek investment results that correspond generally to the price and yield (before the Fund's fees and expenses) of the following equity indices:
| Fund | Index | ||||||
| FTSE RAFI US 1500 Small-Mid Portfolio | FTSE US 1500 Small-Mid Index | ||||||
| FTSE RAFI Basic Materials Sector Portfolio | FTSE Basic Materials Sector Index | ||||||
| FTSE RAFI Consumer Goods Sector Portfolio | FTSE Consumer Goods Sector Index | ||||||
| FTSE RAFI Consumer Services Sector Portfolio | FTSE Consumer Services Sector Index | ||||||
| FTSE RAFI Energy Sector Portfolio | FTSE Oil & Gas Index | ||||||
| FTSE RAFI Financials Sector Portfolio | FTSE Financials Sector Index | ||||||
| FTSE RAFI Health Care Sector Portfolio | FTSE Health Care Sector Index | ||||||
| FTSE RAFI Industrials Sector Portfolio | FTSE Industrials Sector Index | ||||||
| FTSE RAFI Telecommunications & Technology Sector Portfolio | FTSE Telecommunications & Technology Sector Index | ||||||
| FTSE RAFI Utilities Sector Portfolio | FTSE Utilities Sector Index | ||||||
73
Notes to Financial Statements (Continued)
PowerShares Exchange-Traded Fund Trust
April 30, 2007
Note 2. Significant Accounting Policies
The preparation of the financial statements in accordance with accounting principles generally accepted in the United States of America requires management to make estimates and assumptions that affect the reported amounts and disclosures in the financial statements. Actual results could differ from these estimates.
A. Security Valuation
Securities are valued based on their last sale price. Price information on listed securities is taken from the exchange where the security is primarily traded. Securities regularly traded in an over-the-counter market are valued at the latest quoted sale price in such market or in the case of NASDAQ, at the NASDAQ official closing price. Other portfolio securities and assets for which market quotations are not readily available are valued at fair value as determined in good faith by the Trust's Pricing Committee in accordance with procedures adopted by the Board of Trustees. Investments in money market mutual funds are stated at net asset value.
B. Federal Income Taxes
Each Fund intends to comply with the provisions of the Internal Revenue Code applicable to regulated investment companies and will distribute all net investment income and net taxable capital gains to its shareholders. Therefore, no provision for Federal income taxes is required.
Income and capital gain distributions are determined in accordance with Federal income tax regulations, which may differ from accounting principles generally accepted in the United States. These differences are primarily due to differing book and tax treatments for in-kind transactions, losses deferred due to wash sales, losses deferred due to post-October losses and excise tax regulations.
C. Investment Income and Investment Transactions
Dividend income is recorded on the ex-dividend date. Interest income is recorded on the accrual basis. Investment transactions are recorded on the trade date. Realized gains and losses from the sale or disposition of securities are calculated on the specific identified cost basis. Corporate actions (including cash dividends) are recorded net of nonreclaimable foreign tax withholdings on the ex-dividend date.
D. Expenses
Expenses of the Trust, which are directly identifiable to a specific Fund, are applied to that Fund. Expenses which are not readily identifiable to a specific Fund are allocated in such a manner as deemed equitable, taking into consideration the nature and type of expense and the relative net assets of each Fund.
E. Dividends and Distributions to Shareholders
Each Fund declares and pays dividends from net investment income, if any, to its shareholders quarterly and distributes net realized taxable capital gains, if any, annually. Such distributions on a tax basis are determined in conformity with income tax regulations which may differ from accounting principles generally accepted in the United States of America. Distributions in excess of tax basis earnings and profits, if any, are reported in each Fund's financial statements as a return of capital.
F. Equalization
All Funds use the accounting practice of equalization. This accounting method is used to keep the continuing shareholder's per share equity in undistributed net investment income from being affected by the continuous sales and redemptions of capital shares. Equalization is calculated on a per share basis whereby a portion of the proceeds from the sales and cost of repurchases of capital shares is applied to
74
Notes to Financial Statements (Continued)
PowerShares Exchange-Traded Fund Trust
April 30, 2007
undistributed net investment income. The amount of equalization is disclosed in the Statements of Changes in Net Assets as undistributed net investment income included in the price of capital shares issued or redeemed. The distributions to shareholders of amounts so applied may be deemed to be a return of capital for tax purposes to the extent that such distributions exceed taxable income.
Note 3. Advisory and Administration Agreements
PowerShares Capital Management LLC (the "Adviser") has overall responsibility as the Funds' investment adviser for the selection and ongoing monitoring of the Funds' investments, managing the Funds' business affairs and providing certain clerical, bookkeeping and other administrative services. The fees paid by each Fund to the Adviser are accrued daily and are payable at 0.50% per annum on each Fund's average daily net assets.
Each Fund is responsible for all of its expenses, including the investment advisory fees, costs of transfer agency, custody, fund administration, legal, audit and other services, interest, taxes, brokerage commissions and other expenses connected with executions of portfolio transactions, any distribution fees or expenses and extraordinary expenses. Pursuant to the Investment Advisory Agreement with the Trust, the Adviser has agreed to waive fees and/or pay Fund expenses to the extent necessary to prevent the operating expenses of the Funds (excluding interest expense, brokerage commissions and other trading expenses, licensing fees, offering costs, taxes and extraordinary expenses) from exceeding 0.60% of average daily net assets per year (the "Expense Cap"), at least until April 30, 2008. Offering costs excluded from the Expense Cap are: (a) legal fees pertaining to the Funds' shares offered for sale; (b) Securities and Exchan ge Commission and state registration fees; and (c) initial fees paid to be listed on an exchange.
For the period ended April 30, 2007, the Adviser waived and assumed the following fees and expenses:
| Fees Waived | Expenses Assumed | ||||||||||
| FTSE RAFI US 1500 Small-Mid Portfolio | $ | 51,267 | $ | — | |||||||
| FTSE RAFI Basic Materials Portfolio | 55,988 | — | |||||||||
| FTSE RAFI Consumer Goods Sector Portfolio | 56,129 | 1,028 | |||||||||
| FTSE RAFI Consumer Services Sector Portfolio | 46,528 | 11,382 | |||||||||
| FTSE RAFI Energy Sector Portfolio | 56,949 | — | |||||||||
| FTSE RAFI Financials Sector Portfolio | 43,426 | 13,567 | |||||||||
| FTSE RAFI Health Care Sector Portfolio | 56,657 | — | |||||||||
| FTSE RAFI Industrials Sector Portfolio | 54,254 | — | |||||||||
| FTSE RAFI Telecommunications & Technology Sector Portfolio | 56,931 | — | |||||||||
| FTSE RAFI Utilities Sector Portfolio | 57,004 | — | |||||||||
The Trust and the Adviser have entered into an Excess Expense Agreement (the "Expense Agreement") in which expenses borne by the Adviser are subject to reimbursement by each Fund up to three years from the date the fee or expense was incurred, but no reimbursement payment will be made by the Fund if it would result in the Fund exceeding its Expense Cap as specified above.
During the period ended April 30, 2007, none of the Funds reimbursed expenses to the Adviser under the Expense Agreement.
75
Notes to Financial Statements (Continued)
PowerShares Exchange-Traded Fund Trust
April 30, 2007
The amounts subject to reimbursement to the Adviser at April 30, 2007 are as follows:
| Reimbursements available during the fiscal years ending: | |||||||||||||||
| 04/30/08 | 04/30/09 | 04/30/10 | |||||||||||||
| FTSE RAFI US 1500 Small-Mid Portfolio | $ | 51,267 | $ | 51,267 | $ | 51,267 | |||||||||
| FTSE RAFI Basic Materials Sector Portfolio | 55,988 | 55,988 | 55,988 | ||||||||||||
| FTSE RAFI Consumer Goods Sector Portfolio | 57,157 | 57,157 | 57,157 | ||||||||||||
| FTSE RAFI Consumer Services Sector Portfolio | 57,910 | 57,910 | 57,910 | ||||||||||||
| FTSE RAFI Energy Sector Portfolio | 56,949 | 56,949 | 56,949 | ||||||||||||
| FTSE RAFI Financials Sector Portfolio | 56,993 | 56,993 | 56,993 | ||||||||||||
| FTSE RAFI Health Care Sector Portfolio | 56,657 | 56,657 | 56,657 | ||||||||||||
| FTSE RAFI Industrials Sector Portfolio | 54,254 | 54,254 | 54,254 | ||||||||||||
| FTSE RAFI Telecommunications & Technology Sector Portfolio | 56,931 | 56,931 | 56,931 | ||||||||||||
| FTSE RAFI Utilities Sector Portfolio | 57,004 | 57,004 | 57,004 | ||||||||||||
Distribution Agreement
A I M Distributors, Inc. (the "Distributor") serves as the distributor of Creation Units of each Fund pursuant to a Distribution Agreement between the Distributor and the Trust. The Distributor does not maintain a secondary market in shares.
The Board of Trustees of the Trust has adopted a distribution plan pursuant to Rule 12b-1 under the 1940 Act. In accordance with the Rule 12b-1 plan, each Fund is authorized to pay an amount up to a maximum annual rate of 0.25% of the average daily net assets for certain distribution-related activities. No 12b-1 fees are currently charged to the Funds, and there are no plans to impose these fees.
Licensing Fee Agreements
The Adviser has entered into licensing agreements for each Fund with the FTSE International Ltd. (the "Licensor"). The trademarks are owned by the Licensor. These trademarks have been licensed to the Adviser for use with the Funds. The Funds are not sponsored, endorsed, sold or promoted by the Licensor and the Licensor makes no representation regarding the advisability of investing in any of these Funds. The Funds are required to pay the licensing fees, which are shown on the Statements of Operations.
The Bank of New York serves as the administrator, custodian and fund accounting and transfer agent for each Fund.
Note 4. INVESCO Transactions and Transactions with Affiliates
On September 18, 2006, INVESCO PLC (formerly AMVESCAP PLC) and A I M Management Group, Inc., an indirect wholly-owned subsidiary of INVESCO PLC, announced that they had completed their acquisition of the Adviser (the "Acquisition"). The Board of Trustees, including a majority of the independent Trustees, and shareholders of each Fund had previously approved a new advisory agreement with the Adviser that became effective on September 18, 2006.
The Funds are permitted to invest daily available cash balances in affiliated money market funds. The Funds invest in the Liquid Assets Portfolio ("LAP") of the Short-Term Investments. LAP is advised by A I M Advisors, Inc., an affiliate of the Adviser.
76
Notes to Financial Statements (Continued)
PowerShares Exchange-Traded Fund Trust
April 30, 2007
Note 5. Federal Income Tax
At April 30, 2007, the components of accumulated earnings/loss on a tax basis were as follows:
| Accumulated Earnings | Net Accumulated Capital and other Gains/Losses | Unrealized Appreciation/ Depreciation | Gross Unrealized Appreciation | Gross Unrealized Depreciation | Total Accumulated Earnings/Loss | ||||||||||||||||||||||
| FTSE RAFI US 1500 Small-Mid Portfolio | $ | 111,680 | $ | (5,818 | ) | $ | 2,670,659 | $ | 5,015,951 | $ | (2,345,292 | ) | $ | 2,776,521 | |||||||||||||
| FTSE RAFI Basic Materials Sector Portfolio | 124,408 | — | 3,359,214 | 3,359,214 | — | 3,483,622 | |||||||||||||||||||||
| FTSE RAFI Consumer Goods Sector Portfolio | 88,655 | — | 1,221,365 | 1,359,851 | (138,486 | ) | 1,310,020 | ||||||||||||||||||||
| FTSE RAFI Consumer Services Sector Portfolio | 7,778 | (9,952 | ) | 1,135,252 | 1,191,868 | (56,616 | ) | 1,133,078 | |||||||||||||||||||
| FTSE RAFI Energy Sector Portfolio | 14,429 | — | 2,121,781 | 2,156,922 | (35,141 | ) | 2,136,210 | ||||||||||||||||||||
| FTSE RAFI Financials Sector Portfolio | 60,071 | (4,934 | ) | 683,309 | 748,971 | (65,662 | ) | 738,446 | |||||||||||||||||||
| FTSE RAFI Health Care Sector Portfolio | 15,785 | — | 1,504,570 | 1,753,714 | (249,144 | ) | 1,520,355 | ||||||||||||||||||||
| FTSE RAFI Industrials Sector Portfolio | 5,984 | — | 2,894,544 | 3,116,833 | (222,289 | ) | 2,900,528 | ||||||||||||||||||||
| FTSE RAFI Telecommunications & Technology Sector Portfolio | 34,900 | (9 | ) | 1,196,243 | 1,415,920 | (219,677 | ) | 1,231,134 | |||||||||||||||||||
| FTSE RAFI Utilities Sector Portfolio | 92,800 | — | 2,247,260 | 2,267,986 | (20,726 | ) | 2,340,060 | ||||||||||||||||||||
At April 30, 2007, the cost of investments for Federal income tax purposes was as follows:
| FTSE RAFI US 1500 Small-Mid Portfolio | $ | 82,508,911 | |||||
| FTSE RAFI Basic Materials Sector Portfolio | 21,270,492 | ||||||
| FTSE RAFI Consumer Goods Sector Portfolio | 14,992,543 | ||||||
| FTSE RAFI Consumer Services Sector Portfolio | 10,200,219 | ||||||
| FTSE RAFI Energy Sector Portfolio | 16,750,323 | ||||||
| FTSE RAFI Financials Sector Portfolio | 15,382,204 | ||||||
| FTSE RAFI Health Care Sector Portfolio | 20,396,704 | ||||||
| FTSE RAFI Industrials Sector Portfolio | 37,722,968 | ||||||
| FTSE RAFI Telecommunications & Technology Sector Portfolio | 15,806,701 | ||||||
| FTSE RAFI Utilities Sector Portfolio | 16,081,357 | ||||||
77
Notes to Financial Statements (Continued)
PowerShares Exchange-Traded Fund Trust
April 30, 2007
Distributions to Shareholders:
The tax character of distributions paid during the period ended April 30, 2007 was as follows:
| Distributions paid from Ordinary Income | |||||||
| FTSE RAFI US 1500 Small-Mid Portfolio | $ | 107,528 | |||||
| FTSE RAFI Basic Materials Sector Portfolio | 203,385 | ||||||
| FTSE RAFI Consumer Goods Sector Portfolio | 98,952 | ||||||
| FTSE RAFI Consumer Services Sector Portfolio | 18,566 | ||||||
| FTSE RAFI Energy Sector Portfolio | 93,175 | ||||||
| FTSE RAFI Financials Sector Portfolio | 83,164 | ||||||
| FTSE RAFI Health Care Sector Portfolio | 188,595 | ||||||
| FTSE RAFI Industrials Sector Portfolio | 208,432 | ||||||
| FTSE RAFI Telecommunications & Technology Sector Portfolio | 98,444 | ||||||
| FTSE RAFI Utilities Sector Portfolio | 208,132 | ||||||
At April 30, 2007, for Federal income tax purposes, the Funds have capital loss carryforwards available as shown in the table below, to the extent provided by the regulations, to offset future capital gains through the years indicated. To the extent that these loss carryforwards are used to offset future capital gains, it is probable that the capital gains so offset will not be distributed to shareholders.
| Capital Loss Available Through | Total | ||||||||||||||||||||||||||
| 2011 | 2012 | 2013 | 2014 | 2015 | Amount | ||||||||||||||||||||||
| FTSE RAFI US 1500 Small-Mid Portfolio | — | — | — | — | $ | 5,818 | $ | 5,818 | |||||||||||||||||||
| FTSE RAFI Consumer Services Sector Portfolio | — | — | — | — | 9,952 | 9,952 | |||||||||||||||||||||
| FTSE RAFI Financials Sector Portfolio | — | — | — | — | 4,934 | 4,934 | |||||||||||||||||||||
| FTSE RAFI Telecommunications & Technology Sector Portfolio | — | — | — | — | 9 | 9 | |||||||||||||||||||||
Capital losses incurred after October 31 ("post-October losses") within the taxable year are deemed to arise on the first business day of the Fund's next taxable year.
During the period ended April 30, 2007, the Funds incurred and will elect to defer net capital losses as follows:
| Post-October Losses | |||||||
| FTSE RAFI US 1500 Small-Mid Portfolio | $ | 158,840 | |||||
| FTSE RAFI Consumer Goods Sector Portfolio | 49,031 | ||||||
| FTSE RAFI Consumer Services Sector Portfolio | 18,962 | ||||||
| FTSE RAFI Energy Sector Portfolio | 30,155 | ||||||
| FTSE RAFI Health Care Sector Portfolio | 48,189 | ||||||
| FTSE RAFI Industrials Sector Portfolio | 28,983 | ||||||
| FTSE RAFI Telecommunications & Technology Sector Portfolio | 69,699 | ||||||
| FTSE RAFI Utilities Sector Portfolio | 6,759 | ||||||
At April 30, 2007, the following reclassifications were made to the capital accounts of the Funds, to reflect permanent book/tax differences and income and gains available for distributions under income tax regulations, which are primarily due to the differences between book and tax treatment of investments in
78
Notes to Financial Statements (Continued)
PowerShares Exchange-Traded Fund Trust
April 30, 2007
real estate investment trusts, investments in partnerships, wash sales from redemptions in-kind transactions, redemption in-kind transactions, return of capital and net investment losses. Net investment income, net realized gains and net assets were not affected by these changes.
| Undistributed Net Investment Income (Loss) | Undistributed Capital Gains/ (Accumulated Losses) | Paid-in Capital | |||||||||||||
| FTSE RAFI US 1500 Small-Mid Portfolio | $ | (41,908 | ) | $ | (2,311,893 | ) | $ | 2,353,801 | |||||||
| FTSE RAFI Basic Materials Sector Portfolio | 72,855 | (1,771,191 | ) | 1,698,336 | |||||||||||
| FTSE RAFI Consumer Goods Sector Portfolio | 23,621 | (569,178 | ) | 545,557 | |||||||||||
| FTSE RAFI Consumer Services Sector Portfolio | (1,129 | ) | (1,210,490 | ) | 1,211,619 | ||||||||||
| FTSE RAFI Energy Sector Portfolio | 15,535 | (3,397,258 | ) | 3,381,723 | |||||||||||
| FTSE RAFI Financials Sector Portfolio | 24,937 | (830,975 | ) | 806,038 | |||||||||||
| FTSE RAFI Health Care Sector Portfolio | 4,231 | (572,698 | ) | 568,467 | |||||||||||
| FTSE RAFI Industrials Sector Portfolio | (8,589 | ) | (2,106,705 | ) | 2,115,294 | ||||||||||
| FTSE RAFI Telecommunications & Technology Sector Portfolio | 11,299 | (1,605,617 | ) | 1,594,318 | |||||||||||
| FTSE RAFI Utilities Sector Portfolio | 61,710 | (1,467,091 | ) | 1,405,381 | |||||||||||
Note 6. Investment Transactions
For the period ended April 30, 2007, the cost of securities purchased and proceeds from sales of securities, excluding short-term securities and in-kind transactions, were as follows:
| Purchases | Sales | ||||||||||
| FTSE RAFI US 1500 Small-Mid Portfolio | $ | 4,061,099 | $ | 5,685,570 | |||||||
| FTSE RAFI Basic Materials Sector Portfolio | 3,204,369 | 3,740,031 | |||||||||
| FTSE RAFI Consumer Goods Sector Portfolio | 151,477 | 549,871 | |||||||||
| FTSE RAFI Consumer Services Sector Portfolio | 663,121 | 733,739 | |||||||||
| FTSE RAFI Energy Sector Portfolio | 226,470 | 323,980 | |||||||||
| FTSE RAFI Financials Sector Portfolio | 1,503,824 | 1,878,101 | |||||||||
| FTSE RAFI Health Care Sector Portfolio | 1,301,356 | 1,635,342 | |||||||||
| FTSE RAFI Industrials Sector Portfolio | 1,674,790 | 947,145 | |||||||||
| FTSE RAFI Telecommunications & Technology Sector Portfolio | 822,277 | 1,014,663 | |||||||||
| FTSE RAFI Utilities Sector Portfolio | 148,273 | 95,978 | |||||||||
For the period ended April 30, 2007 in-kind transactions were as follows:
| Purchases | Sales | ||||||||||
| FTSE RAFI US 1500 Small-Mid Portfolio | $ | 101,265,018 | $ | 19,419,576 | |||||||
| FTSE RAFI Basic Materials Sector Portfolio | 33,445,391 | 13,528,004 | |||||||||
| FTSE RAFI Consumer Goods Sector Portfolio | 25,737,333 | 10,972,574 | |||||||||
| FTSE RAFI Consumer Services Sector Portfolio | 26,281,610 | 17,223,995 | |||||||||
| FTSE RAFI Energy Sector Portfolio | 40,763,583 | 27,329,215 | |||||||||
| FTSE RAFI Financials Sector Portfolio | 32,359,504 | 17,446,487 | |||||||||
| FTSE RAFI Health Care Sector Portfolio | 37,190,985 | 17,061,169 | |||||||||
| FTSE RAFI Industrials Sector Portfolio | 55,569,172 | 20,687,373 | |||||||||
| FTSE RAFI Telecommunications & Technology Sector Portfolio | 33,707,161 | 19,275,518 | |||||||||
| FTSE RAFI Utilities Sector Portfolio | 36,766,551 | 22,296,041 | |||||||||
79
Notes to Financial Statements (Continued)
PowerShares Exchange-Traded Fund Trust
April 30, 2007
There were no purchases or sales of U.S. government or government agency obligations for the period ended April 30, 2007. Gains on in-kind transactions are not considered taxable gains for Federal income tax purposes.
Note 7. Trustees' Fees
The Trust compensates each Trustee who is not an employee of the Adviser or its affiliates. The interested Trustee does not receive any Trustees' fees.
Note 8. Capital
Shares are created and redeemed by the Trust only in Creation Unit size aggregations of 100,000. Transaction fees at scheduled amounts ranging from $500 to $7,500 per Creation Unit are charged to those persons creating or redeeming Creation Units. Such transactions are generally permitted on an in-kind basis, with a balancing cash component to equate the transaction to the net asset value per unit of each Fund of the Trust on the transaction date.
Note 9. Risk of Concentration
The Funds concentrate their investments in certain industries, subjecting them to greater risk than funds that invest in a wider range of industries.
Note 10. Indemnifications
Under the Trust's organizational documents, its Officers and Trustees are indemnified against certain liabilities arising out of the performance of their duties to the Trust. Additionally, in the normal course of business, the Trust enters into contracts with service providers that contain general indemnification clauses. The Trust's maximum exposure under these arrangements is unknown, as this would involve future claims that may be made against the Trust that have not yet occurred. However, based on experience, the Trust believes the risk of loss to be remote.
Note 11. New Accounting Pronouncements
On July 13, 2006, the Financial Accounting Standards Board ("FASB") issued FASB Interpretation No. 48, Accounting for Uncertainty in Income Taxes ("FIN 48"). FIN 48 prescribes a recognition threshold and measurement attribute for the financial statement recognition and measurement for a tax position taken or expected to be taken in a tax return. FIN 48 also provides guidance on derecognition, classification, interest and penalties, accounting in interim periods, disclosure and transition. On December 22, 2006, the Securities and Exchange Commission delayed the effective date of FIN 48, which will result in adoption for the Funds as of October 31, 2007. At this time, management is currently assessing the impact of FIN 48, if any, on the Funds' financial statements.
On September 20, 2006, the FASB released Statement of Financial Accounting Standards No. 157 "Fair Value Measurement" ("FAS 157"). FAS 157 establishes an authoritative definition of fair value, sets out a framework for measuring fair value, and requires additional disclosures about fair-value measurement. The application of FAS 157 is required for fiscal years beginning after November 15, 2007 and interim periods within those fiscal years. At this time, management is currently assessing the impact of FAS 157, if any, on the Funds' financial statements and intends for the Funds to adopt FAS 157 provisions during the fiscal year ending April 30, 2009.
80
Report of Independent Registered Public Accounting Firm
To the Board of Trustees and Shareholders of PowerShares Exchange-Traded Fund Trust:
In our opinion, the accompanying statements of assets and liabilities, including the portfolios of investments, and the related statements of operations and of changes in net assets and the financial highlights present fairly, in all material respects, the financial position of the portfolios indicated in Note 1 of the financial statements comprising PowerShares Exchange-Traded Fund Trust (the "Trust") at April 30, 2007, the results of each of their operations, the changes in each of their net assets and the financial highlights, for each of the periods presented, in conformity with accounting principles generally accepted in the United States of America. These financial statements and financial highlights (hereafter referred to as "financial statements") are the responsibility of the Trust's management; our responsibility is to express an opinion on these financial statements based on our audits. We conducted our audits of thes e financial statements in accordance with the standards of the Public Company Accounting Oversight Board (United States). Those standards require that we plan and perform the audits to obtain reasonable assurance about whether the financial statements are free of material misstatement. An audit includes examining, on a test basis, evidence supporting the amounts and disclosures in the financial statements, assessing the accounting principles used and significant estimates made by management, and evaluating the overall financial statement presentation. We believe that our audits, which included confirmation of securities at April 30, 2007 by correspondence with the custodian and brokers, provide a reasonable basis for our opinion.
PricewaterhouseCoopers LLP
New York, New York
June 25, 2007
81
Supplemental Information (Unaudited)
Federal Income Tax Information
The percentages of investment income (dividend income plus short-term gains, if any) qualify as follows:
| Qualified dividend income | Dividends-received deduction | ||||||||||
| FTSE RAFI US 1500 Small-Mid Portfolio | 100 | % | 100 | % | |||||||
| FTSE RAFI Basic Materials Sector Portfolio | 100 | % | 100 | % | |||||||
| FTSE RAFI Consumer Goods Sector Portfolio | 100 | % | 100 | % | |||||||
| FTSE RAFI Consumer Services Sector Portfolio | 100 | % | 100 | % | |||||||
| FTSE RAFI Energy Sector Portfolio | 100 | % | 100 | % | |||||||
| FTSE RAFI Financials Sector Portfolio | 100 | % | 100 | % | |||||||
| FTSE RAFI Health Care Sector Portfolio | 100 | % | 100 | % | |||||||
| FTSE RAFI Industrials Sector Portfolio | 100 | % | 100 | % | |||||||
| FTSE RAFI Telecommunications & Technology Sector Portfolio | 100 | % | 100 | % | |||||||
| FTSE RAFI Utilities Sector Portfolio | 100 | % | 100 | % | |||||||
82
Supplemental Information (Unaudited) (Continued)
Trustees and Officers
The Trustees who are not affiliated with the Adviser or affiliates of the Adviser and executive officers of the Trust, their term of office and length of time served, their principal business occupations during the past five years, the number of portfolios in the Fund Complex overseen by each Trustee and the other directorships, if any, held by the Trustee, are shown below.
| Name, Address and Age of Independent Trustees | Position(s) with Trust | Length of Time Served* | Principal Occupation(s) During Past 5 Years | Number of Portfolios in Fund Complex*** Overseen by Trustees | Other Directorships Held by Trustees | ||||||||||||||||||
| Ronn R. Bagge (49) YQA Capital Management, LLC 1755 S. Naperville Rd., Suite 100 Wheaton, IL 60187 | Trustee | Since 2003 | YQA Capital Management LLC (July 1998-Present); formerly Owner/CEO of Electronic Dynamic Balancing Co., Inc. (high-speed rotating equipment service provider) | 79 | None | ||||||||||||||||||
| Marc M. Kole (47)** c/o PowerShares Capital Management LLC 301 W. Roosevelt Road Wheaton, IL 60187 | Trustee | Since 2006 | Controller, Priority Health (September 2005-present); Interim CFO, Priority Health (July 2006-February 2007); formerly Senior Vice President of Finance, United Healthcare (health insurance) (July 2004-July 2005); Senior Vice President of Finance, Oxford Health Plans (June 2000-July 2004) | 79 | None | ||||||||||||||||||
| D. Mark McMillan (44) c/o PowerShares Capital Management LLC 301 W. Roosevelt Road Wheaton, IL 60187 | Trustee | Since 2003 | Member, Bell, Boyd & Lloyd LLC (1989- Present) | 79 | None | ||||||||||||||||||
* This is the date the Trustee began serving the Trust.
** At a Board meeting held on December 14, 2006, Marc Kole was elected to serve as Trustee of the Trust.
*** Fund Complex includes all open-end funds (including all of their Portfolios) advised by the Adviser. The Fund Complex consists of the Trust's 70 Portfolios and one other exchange-traded fund trust with 9 Portfolios advised by the Adviser.
83
Supplemental Information (Unaudited) (Continued)
Trustees and Officers (Continued)
| Name, Address and Age of Independent Trustees | Position(s) with Trust | Length of Time Served* | Principal Occupation(s) During Past 5 Years | Number of Portfolios in Fund Complex*** Overseen by Trustees | Other Directorships Held by Trustees | ||||||||||||||||||
| Philip M. Nussbaum (45) c/o PowerShares Capital Management LLC 301 W. Roosevelt Road Wheaton, IL 60187 | Trustee | Since 2003 | Chairman, Performance Trust Capital Partners (formerly Betzold, Berg, Nussbaum & Heitman, Inc.); formerly Managing Director, Communication Institute (May 2002-August 2003); Executive Vice President of Finance, Betzold, Berg, Nussbaum & Heitman, Inc. (March 1994-1999) | 79 | None | ||||||||||||||||||
| Donald H. Wilson (47)** c/o PowerShares Capital Management LLC 301 W. Roosevelt Road Wheaton, IL 60187 | Trustee | Since 2006 | Executive Vice President and Chief Financial Officer, AMCORE Financial, Inc. (bank holding company) (February 2006-present); formerly, Senior Vice President and Treasurer, Marshall & Ilsley Corp. (bank holding company) (May 1995-February 2006) | 79 | None | ||||||||||||||||||
* This is the date the Trustee began serving the Trust.
** At a Board meeting held on December 14, 2006, Donald Wilson was elected to serve as Trustee of the Trust.
*** Fund Complex includes all open-end funds (including all of their Portfolios) advised by the Adviser. The Fund Complex consists of the Trust's 70 Portfolios and one other exchange-traded fund trust with 9 Portfolios advised by the Adviser.
84
Supplemental Information (Unaudited) (Continued)
Trustees and Officers (Continued)
| Name, Address and Age of Management Trustee | Position(s) with Trust | Length of Time Served* | Principal Occupation(s) During Past 5 Years | Number of Portfolios in Fund Complex*** Overseen by Trustee | Other Directorships Held by Trustee | ||||||||||||||||||
| H. Bruce Bond (44)** PowerShares Capital Management LLC 301 W. Roosevelt Road Wheaton, IL 60187 | Chairman of the Board, Trustee and Chief Executive Officer | Since 2003 | Managing Director, PowerShares Capital Management LLC (August 2002- Present); Manager, Nuveen Investments (April 1998- August 2002) | 79 | None | ||||||||||||||||||
* This is the date the Management Trustee began serving the Trust.
** Interested person as defined in Section 2(a)(19) of the 1940 Act.
*** Fund Complex includes all open-end funds (including all of their Portfolios) advised by the Adviser. The Fund Complex consists of the Trust's 70 Portfolios and one other exchange-traded fund trust with 9 Portfolios advised by the Adviser.
85
Supplemental Information (Unaudited) (Continued)
Trustees and Officers (Continued)
| Name, Address and Age of Officers | Position(s) with Trust | Length of Time Served* | Principal Occupations(s) During Past 5 Years | ||||||||||||
| Bruce T. Duncan (52) PowerShares Capital Management LLC 301 W. Roosevelt Road Wheaton, IL 60187 | Chief Financial Officer and Treasurer | Since 2006 | Senior Vice President of Finance, PowerShares Capital Management LLC (September 2005-Present); Private Practice Attorney (2000-2005); Vice President of Investor Relations, The ServiceMaster Company (1994-2000); Vice President of Taxes, The ServiceMaster Company (1990-2000) | ||||||||||||
| Kevin R. Gustafson (41) PowerShares Capital Management LLC 301 W. Roosevelt Road Wheaton, IL 60187 | Chief Compliance Officer | Since 2004 | General Counsel and Chief Compliance Officer, PowerShares Capital Management LLC (September 2004-Present); Attorney, Nyberg & Gustafson (2001-2004); Attorney, Burke, Warren, McKay & Serritella, P.C. (1997-2000) | ||||||||||||
| Keith Ovitt (44) PowerShares Capital Management LLC 301 W. Roosevelt Road Wheaton, IL 60187 | Secretary | Since 2003 | Managing Director, PowerShares Capital Management LLC (April 2003-Present); President, Ovitech (2002-2003); Vice President of Information Systems for DFG Foods, LLC (Division of FoodBrands America/Tyson Foods) (1999-2002); Systems Manager, Nabisco Biscuit Company (1997-1999) | ||||||||||||
* This is the period for which the Officers began serving the Trust. Each Officer serves an indefinite term, until his successor is elected.
86
Board Considerations Regarding Continuation of Investment Advisory Agreement (Unaudited)
At a meeting held on April 20, 2007, the Board of Trustees of the PowerShares Exchange-Traded Fund Trust (the "Trust"), including the Independent Trustees, unanimously approved the continuation of the Investment Advisory Agreement between PowerShares Capital Management LLC (the "Adviser") and the Trust for the following series (the "Funds"):
PowerShares Dynamic Market Portfolio
PowerShares Dynamic OTC Portfolio
PowerShares Golden Dragon Halter USX China Portfolio
PowerShares High Yield Equity Dividend AchieversTM Portfolio
PowerShares WilderHill Clean Energy Portfolio
PowerShares Dynamic Large Cap Growth Portfolio
PowerShares Dynamic Large Cap Value Portfolio
PowerShares Dynamic Mid Cap Growth Portfolio
PowerShares Dynamic Mid Cap Value Portfolio
PowerShares Dynamic Small Cap Growth Portfolio
PowerShares Dynamic Small Cap Value Portfolio
PowerShares Dynamic Biotechnology & Genome Portfolio
PowerShares Dynamic Food & Beverage Portfolio
PowerShares Dynamic Leisure and Entertainment Portfolio
PowerShares Dynamic Media Portfolio
PowerShares Dynamic Networking Portfolio
PowerShares Dynamic Pharmaceuticals Portfolio
PowerShares Dynamic Semiconductors Portfolio
PowerShares Dynamic Software Portfolio
PowerShares Zacks Micro Cap Portfolio
PowerShares Aerospace & Defense Portfolio
PowerShares Dynamic Hardware & Consumer Electronics Portfolio
PowerShares Dynamic Telecommunications & Wireless Portfolio
PowerShares Value Line Timeliness Select Portfolio
PowerShares Divided AchieversTM Portfolio
PowerShares International Dividend AchieversTM Portfolio
PowerShares High Growth Rate Dividend AchieversTM Portfolio
PowerShares Zacks Small Cap Portfolio
PowerShares Dynamic Building & Construction Portfolio
PowerShares Dynamic Energy Exploration and Production Portfolio
PowerShares Dynamic Insurance Portfolio
PowerShares Dynamic Oil and Gas Services Portfolio
PowerShares Dynamic Retail Portfolio
PowerShares Dynamic Utilities Portfolio
PowerShares Lux Nanotech Portfolio
PowerShares FTSE RAFI US 1000 Portfolio
PowerShares Water Resources Portfolio
The Trustees reviewed information from the Adviser describing: (i) the nature, extent and quality of services provided, (ii) the investment performance of the Funds and the Adviser, (iii) the costs of services provided and estimated profits realized by the Adviser, (iv) the extent to which economies of scale are realized as the Funds grow, (v) whether fee levels reflect any possible economies of scale for the benefit of Fund shareholders, (vi) comparisons of services rendered and amounts paid to other registered investment companies and (vii) any benefits realized by the Adviser from its relationship with each Fund. Based on all of the information considered and the conclusions reached, the Board, including the Independent Trustees, determined to approve the continuation of the Investment Advisory Agreement for each Fund listed above. No single factor was determinative in the Board's analysis.
Nature, Extent and Quality of Services. In evaluating the nature, extent and quality of the Adviser's services, the Trustees reviewed information concerning the functions performed by the Adviser for the Funds, information describing the Adviser's current organization, including operations assistance provided
87
Board Considerations Regarding Continuation of Investment Advisory Agreement (Unaudited) (Continued)
by the Adviser's new parent organization, AMVESCAP LLC, and the background and experience of the persons responsible for the day-to-day management of the Funds. The Trustees reviewed matters related to the Adviser's portfolio transaction policies and procedures. The Trustees reviewed information on the performance of the Funds and the performance of their benchmark indices. The Trustees also reviewed reports on the correlation and tracking error between the underlying index and each Fund's performance and reviewed a report of a consultant to the Adviser on correlation and tracking error. The Trustees concluded that Funds are correlated to their underlying index and that the tracking error was within a reasonable range.
The Trustees also considered the services provided by the Adviser in its oversight of the Funds' administrator, custodian and transfer agent. They noted the significant amount of time and effort that had been devoted to this oversight function.
Based on their review, the Trustees found that the nature and extent of services provided to the Funds under the Investment Advisory Agreement are appropriate and that the quality is good.
Fees, Expenses and Profitability. The Trustees reviewed and discussed the information provided by the Adviser on each Fund's expense ratio and the advisory fee, as compared to three categories of comparable funds selected by Lipper Inc., an independent source: exchange-traded index funds ("ETFs"), open-end funds and closed-end funds. The Trustees also reviewed and discussed additional information prepared by Lipper Inc. on expense ratios and advisory fees of a broader universe of ETFs and other index funds. The Adviser supplemented the information prepared by Lipper Inc. with data it compiled on expense ratios and advisory fees of newer ETFs that recently commenced operations. The Trustees noted that the annual advisory fee charged to the Funds was identical (0.50% of average net assets), except for the advisory fee for the PowerShares High Yield Equi ty Dividend AchieversTM Portfolio, the PowerShares Dividend AchieversTM Portfolio, the PowerShares High Growth Rate Dividend AchieversTM Portfolio and the PowerShares International Dividend AchieversTM Portfolio (for each of which the annual advisory fee was 0.40% of average net assets), and that the Adviser had agreed to waive the fee and/or pay expenses to the extent necessary to prevent the annual operating expenses of each Fund (excluding interest expenses, licensing fees (for all Funds other than the initial two Funds, the PowerShares Dynamic OTC Portfolio and the PowerShares Dynamic Market Portfolio), brokerage commissions and other trading expenses, taxes and extraordinary expenses) from exceeding 0.60% (0.50% for the PowerShares High Yield Equity Dividend AchieversTM Portfolio, the PowerShares Dividend AchieversTM Portfolio, the PowerShares High Growth Rate Dividend AchieversTM Portfolio and the PowerShares International Div idend AchieversTM Portfolio) at least until April 30, 2008. The Trustees noted that the Adviser does not provide investment management services to clients other than the Trust. The Trustees noted that the advisory fees were at the higher end of the ETF universe, but were generally lower than fees for open-end (non-ETF) funds and closed-end funds, and were reasonable because of the complexity of the indices, which generally require more frequent rebalancing of the portfolios, the distinguishing factors of the Funds, and the higher administrative, operational and management oversight costs for the Adviser. The Board therefore concluded that the advisory fee and expense ratio of each Fund are competitive and that the advisory fee for each Fund is reasonable and appropriate in amount in light of the quality of services provided and the expense cap in place.
In conjunction with their review of fees, the Trustees also considered information provided by the Adviser on the revenues received by the Adviser under the Agreement, as well as the fees waived and expenses
88
Board Considerations Regarding Continuation of Investment Advisory Agreement (Unaudited) (Continued)
reimbursed by the Adviser for the Funds. The Trustees reviewed information provided by the Adviser on its profitability as well as any profits realized by the Adviser from its relationship to each Fund. The Trustees noted the Adviser's statement that its costs of managing the Funds generally exceeded the amount payable as management fees under the Investment Advisory Agreement, and that most of the Funds were operating in a cash loss position. The Trustees concluded that the profitability to the Adviser of the advisory services provided to the Funds is not unreasonable.
Economies of Scale and Whether Fee Levels Reflect These Economies of Scale. The Trustees reviewed the information provided by the Adviser as to the extent to which economies of scale are realized as each Fund grows and whether fee levels reflect economies of scale for the benefit of shareholders. The Trustees reviewed each Fund's asset size, expense ratio, expense limitation agreed to by the Adviser and whether the investment process produced economies of scale. The Trustees noted that certain fixed costs associated with the management of the Funds are being reduced on a per-Fund basis as additional Funds are added, and that the gradual reduction of the per-Fund cost enabled the Adviser to operate some of the Funds under the expense cap, which potentially would lower the costs to shareholders. The Trustees noted that the Excess Expense Agreement with the Trust provided that the Adviser was entitled to be reimbursed by each Fund for fees waived or expenses absorbed pursuant to the expense cap for a period of three years from the date the fee or expense was incurred, provided that no reimbursement would be made that would result in a Fund exceeding its expense cap.
The Trustees noted that the Adviser had not identified any further benefits that it derived from its relationship with the Funds, and had noted that it does not have any soft-dollar arrangements.
Based on all of the information considered and the conclusions reached, the Board, including the Independent Trustees, determined to approve the continuation of the Investment Advisory Agreement for each Fund listed above. No single factor was determinative in the Board's analysis.
89
PowerShares Leading the Intelligent ETF Revolution
PowerShares continues to offer new solutions to the complex needs demanded by advisors and investors today. PowerShares is "Leading the Intelligent ETF Revolution" providing investment advisors and investors with institutional-caliber asset management by seeking to replicate enhanced indexes in one of the more benefit-rich investment vehicles available in the marketplace today, the exchange-traded fund (EFT). Each PowerShares fund can be classified into one of three different categories based on the objective and characteristics of its underlying index: Intelligent Index, Intelligent Exposure and Intelligent Access.
For most recent portfolio performance, please visit our website at www.powershares.com.
This page contains advertising materials and should not be viewed as part of the Annual Report.
90
Intelligent Index
PowerShares believes that having insight into a stock's investment merit can have a positive impact on performance. Therefore, most PowerShares ETFs are based on Intelligent Indexes, which seek to provide alpha1 by identifying stocks with the greatest investment merit. These indexes use proprietary methodologies to identify financially strong, effectively managed and attractively priced companies with strong capital appreciation potential. Because their objective is to maximize performance, Intelligent Indexes may look different from the market.
Exchange-Traded Funds
Intelligent Index
PWC - Dynamic Market
PWO - Dynamic OTC
PIQ - Dynamic MagniQuant
PJF - Dynamic Large Cap
PJG - Dynamic Mid Cap
PJM - Dynamic Small Cap
PWB - Dynamic Large Cap Growth
PWV - Dynamic Large Cap Value
PWJ - Dynamic Mid Cap Growth
PWP - Dynamic Mid Cap Value
PWT - Dynamic Small Cap Growth
PWY - Dynamic Small Cap Value
PGZ - Dynamic Aggressive Growth
PVM - Dynamic Deep Value
PYZ - Dynamic Basic Materials Sector
PEZ - Dynamic Consumer Discretionary Sector
PSL - Dynamic Consumer Staples Sector
PXI - Dynamic Energy Sector
PFI - Dynamic Financials Sector
PTH - Dynamic Healthcare Sector
PRN - Dynamic Industrials Sector
PTF - Dynamic Technology Sector
PTE - Dynamic Telecommunications & Wireless
PUI - Dynamic Utilities
PJB - Dynamic Banking
PBE - Dynamic Biotechnology & Genome
PKB - Dynamic Building & Construction
PXE - Dynamic Energy Exploration & Production
PBJ - Dynamic Food & Beverage
PHW - Dynamic Hardware & Consumer Electronics
PTJ - Dynamic Healthcare Services
PIC - Dynamic Insurance
PEJ - Dynamic Leisure and Entertainment
PBS - Dynamic Media
PXQ - Dynamic Networking
PXJ - Dynamic Oil & Gas Services
PJP - Dynamic Pharmaceuticals
PMR - Dynamic Retail
PSI - Dynamic Semiconductors
PSJ - Dynamic Software
1 Alpha is a measure of risk adjusted performance relative to a benchmark or the market.
This page contains advertising materials and should not be viewed as part of the Annual Report.
91
Intelligent Exposure
For investors looking for more market-like exposure, PowerShares offers a lineup of ETFs that seek to track indexes with an Intelligent Exposure objective. These indexes seek to provide accurate exposure to the economy, yet are constructed using more sophisticated techniques than traditional benchmark indexes, which typically use a weighting structure based on market capitalization. Under this traditional structure, market speculation can lead to significant mispricing of stocks and, therefore, suboptimal weights in the index. But indexes seeking Intelligent Exposure use a weighting structure based on company fundamentals: sales, cash flow, book value and dividends. PowerShares believes these factors paint a truer picture of a company's size and lead to more optimal index weightings.
Exchange-Traded Funds
Intelligent Exposure
PRF - FTSE RAFI US 1000
PRFZ - FTSE RAFI US 1500 Small-Mid
PRFM - FTSE RAFI Basic Materials Sector
PRFG - FTSE RAFI Consumer Goods Sector
PRFS - FTSE RAFI Consumer Services Sector
PRFE - FTSE RAFI Energy Sector
PRFF - FTSE RAFI Financials Sector
PRFH - FTSE RAFI Health Care Sector
PRFN - FTSE RAFI Industrials Sector
PRFQ - FTSE RAFI Telecom & Technology Sector
PRFU - FTSE RAFI Utilities Sector
Intelligent Access
Without targeted investment products, unique market segments such as currency or nanotech may be difficult for investors to access. These segments are the focus of indexes that promote Intelligent Access. PowerShares has a diverse lineup of ETFs based on indexes that offer exposure to specific, unique or previously uncovered market areas.
Exchange-Traded Funds
Intelligent Access
PPA - Aerospace & Defense
ADRA - BLDRS Asia 50 ADR Index Fund
ADRD - BLDRS Developed Markets 100 ADR Index Fund
ADRE - BLDRS Emerging Markets 50 ADR Index Fund
ADRU - BLDRS Europe 100 ADR Index Fund
PKW - Buyback Achievers
PZD - Cleantech
PFM - Dividend Achievers
PDP - DWA Technical Lenders
PGF - Financial Preferred
PGJ - Golden Dragon Halter USX China
PHJ - High Growth Rate Dividend Achievers
PEY - High Yield Equity Dividend Achievers
PID - International Dividend Achievers
PSP - Listed Private Equity
PXN - Lux Nanotech
QQQQ - PowerShares QQQ
PYH - Value Line Industry Rotation
PIV - Value Line Timeliness Select
PHO - Water Resources
PBW - WilderHill Clean Energy
PUW - WilderHill Progressive Energy
PZI - Zacks Micro Cap
PZJ - Zacks Small Cap
This page contains advertising materials and should not be viewed as part of the Annual Report.
92
PowerShares Asset Class Guide
Domestic Equity
Broad
PWC Dynamic Market
PWO Dynamic OTC
PIV Value Line Timeliness Select
PRF FTSE RAFI US 1000
PRFZ FTSE RAFI US 1500
PIQ Dynamic MagniQuant
QQQQ PowerShares QQQ
PKW Buyback Achievers
PDP DWA Technical Leaders
PVM Dynamic Deep Value
PGZ Dynamic Aggressive Growth
Style
PJF Dynamic Large Cap
PWB Dynamic Large Cap Growth
PWV Dynamic Large Cap Value
PJG Dynamic Mid Cap
PWJ Dynamic Mid Cap Growth
PWP Dynamic Mid Cap Value
PJM Dynamic Small Cap
PWT Dynamic Small Cap Growth
PWY Dynamic Small Cap Value
PZJ Zacks Small Cap
PZI Zacks Micro Cap
International/Region
Region
PPGJ Golden Dragon Halter USX China
ADRA BLDRS Asia 50 ADR Index Fund
ADRD BLDRS Developed Markets 100 ADR Index Fund
ADRE BLDRS Emerging Markets 50 ADR Index Fund
ADRU BLDRS Europe 100 ADR Index Fund
Income
PID International Dividend Achievers
Income/Dividend
PEY High Yield Equity Dividend Achievers
PHJ High Growth Rate Dividend Achievers
PFM Dividend Achievers
PGF Financial Preferred
Sector and Industry
Sector
PUI Dynamic Utilities
PYZ Dynamic Basic Materials Sector
PEZ Dynamic Consumer Discretionary Sector
PSL Dynamic Consumer Staples Sector
PXI Dynamic Energy Sector
PFI Dynamic Financial Sector
PTH Dynamic Healthcare Sector
PRN Dynamic Industrials Sector
PTF Dynamic Technology Sector
PTE Dynamic Telecommunications & Wireless
PRFQ FTSE RAFI Consumer Goods Sector
PRFS FTSE RAFI Consumer Services Sector
PRFE FTSE RAFI Energy Sector
PRFF FTSE RAFI Financials Sector
PRFH FTSE RAFI Health Care Sector
PRFN FTSE RAFI Industrials Sector
PRFM FTSE RAFI Basic Materials Sector
PRFQ FTSE RAFI Telecommunications & Technology Sector
PRFU FTSE RAFI Utilities Sector
Industry
PJB Dynamic Banking Sector
PBE Dynamic Biotechnology & Genome
PKB Dynamic Building & Construction
PXE Dynamic Energy Exploration & Production
PBJ Dynamic Food & Beverage
PHW Dynamic Hardware & Consumer Electronics
PTJ Dynamic Healthcare Services Sector
PIC Dynamic Insurance
PEJ Dynamic Leisure and Entertainment
PBS Dynamic Media
PXQ Dynamic Networking
PXJ Dynamic Oil & Gas Services
PJP Dynamic Pharmaceuticals
PMR Dynamic Retail
PSI Dynamic Semiconductors
PSJ Dynamic Software
PPA Aerospace & Defense
PBW Clean Energy
PZD Cleantech
PSP Listed Private Equity
PXN Nanotech
PUW Progressive Energy
PYH Value Line Industry Rotation
PHO Water Resources
This page contains advertising materials and should not be viewed as part of the Annual Report.
93
PowerShares Risk Spectrum
Domestic Equity
More Conservative
Dynamic Deep Value
Dynamic Large Cap
Dynamic Mid Cap
Dynamic MagniQuant
Buyback Achievers
DWA Technical Leaders
Dynamic Small Cap
Dynamic Large Cap Value
FTSE RAFI US 1000
Dynamic Mid Cap Value
Dynamic Market
Dynamic Aggressive Growth
Dynamic Small Cap Value
FTSE RAFI US 1500 Small-Mid
Zacks Micro Cap
PowerShares QQQ
Dynamic Large Cap Growth
Dynamic Mid Cap Growth
Zacks Small Cap
Value Line Timeliness Select
Dynamic Small Cap Growth
Dynamic OTC
More Aggressive
International/Region
More Conservative
BLDRS Europe 100 ADR Index Fund
BLDRS Developed Markets 100 ADR Index Fund
BLDRS Asia 50 ADR Index Fund
International Dividend Achievers
BLDRS Emerging Markets 50 ADR Index Fund
Golden Dragon Halter USX China
More Aggressive
Income/Dividend
More Conservative
Financial Preferred
High Yield Equity Dividend Achievers
Dividend Achievers
High Growth Rate Dividend Achievers
More Aggressive
Sector and Industry
More Conservative
Dynamic Consumer Staples Sector
Dynamic Food & Beverage
Dynamic Banking Sector
Dynamic Financial Sector
Dynamic Utilities
Dynamic Insurance
FTSE RAFI Health Care Sector
Dynamic Healthcare Sector
FTSE RAFI Financials Sector
Dynamic Industrials Sector
Dynamic Media
Aerospace & Defense
FTSE RAFI Industrials Sector
Dynamic Pharmaceuticals
Dynamic Consumer Discretionary Sector
Dynamic Healthcare Services Sector
Dynamic Leisure and Entertainment
FTSE RAFI Consumer Goods Sector
FTSE RAFI Utilities Sector
Water Resources
FTSE RAFI Consumer Services Sector
FTSE RAFI Basic Materials Sector
Dynamic Basic Materials Sector
Dynamic Retail
FTSE RAFI Energy Sector
Dynamic Energy Sector
Dynamic Building & Construction
Value Line Industry Rotation
Dynamic Technology Sector
Progressive Energy
Dynamic Biotechnology & Genome
Dynamic Software
Nanotech
Dynamic Energy Exploration & Production
FTSE RAFI Telecommunications & Technology Sector
Dynamic Hardware & Consumer Electronics
Dynamic Telecommunications & Wireless
Dynamic Oil & Gas Services
Cleantech
Listed Private Equity
Clean Energy
Dynamic Networking
Dynamic Semiconductors
More Aggressive
This page contains advertising materials and should not be viewed as part of the Annual Report.
94
Exchange-Traded Funds
ETFs are investment funds that trade like individual stocks on all of the major exchanges, similar to shares of publicly held companies. They can be bought and sold on an exchange at any moment during market hours. Since they are listed and traded on an exchange, you can be confident that you are investing in a well-regulated market.
ETFs are one of the fastest growing investment products in the worldwide financial marketplace. As of 3.31.2007, 432 ETFs were listed in the U.S. with $433 billion in assets, up from two products with only $1 billion in assets in 1995.
ETFs seek investment results that correspond generally to the price and yield (before fees and expenses) of a listed index. While most ETFs share a similar objective, the principal investment strategies of the underlying indexes can have substantial differences. It is important to gain a clear understanding of an ETF's underlying index as the index's objective is inherently passed on to the fund shareholders by seeking to replicate the index.
Indexes
An index is a selection process or appointed committee that groups selected securities together to track their movement in aggregate. While only a few indexes are mentioned on the daily news, there are hundreds of indexes in existence today that differ from each other in diverse ways.
Broad Market
Broad market indexes are what most people think of when an index is mentioned. These indexes are designed to track the performance of the broad market.
Benchmark
Benchmark indexes are created to set a standard by which the performance or movement of individual securities and asset managers can be measured.
Exchange Composite
These indexes are designed to provide a comprehensive measure of the performance of all commons stocks listed on a particular exchange.
Sector or Industry
The aggregate financial marketplace is generally broken down into roughly ten sectors which are further dissected into many specific industries.
Style
Style indexes are created to identify groups of stocks that are either growth (companies currently experiencing appreciation or significant earnings or revenue growth) or value (companies determined to be under priced by fundamental measures) oriented.
Company Size
Market-capitalization indexes group together companies that are similar in size based on the number of outstanding shares times the share price, while fundamentally weighted indexes group together stocks of companies based on their financial fundamental valuation.
International / Country
International indexes group together stocks of companies that are affiliated by location outside of the U.S. or companies located with a specific country or region.
Income / Bond
Income indexes group stocks based on their type of income of securities, while bond indexes are designed to show the average performance of a group of debt securities.
This page contains advertising materials and should not be viewed as part of the Annual Report.
95
Specialty / Enhanced
Many other specialty indexes are created with specific investment management objectives or for customized purposes. These indexes can be created specifically with the intention to be used as the basis for an ETF. Investor targets can be met through an ETF where the index has the objective(s) of capital appreciation, risk control, income or diversification.
Benefits of PowerShares
PowerShares ETFs offer investors a low-cost, tax-efficient investment in a professionally crafted portfolio consisting of some of the best managed companies and most timely investments. See important risk factors in back.
Tax Advantaged Product Design
Taxes may be one of the most critical and overlooked factors in wealth creation over time. The ETF product structure defers some or possibly all capital gains until investors sell their shares.
Low Ownership Cost
ETFs provide lower ownership cost because of their efficient structure. PowerShares have established expense caps to make the cost of ownership clear and straightforward for investors. Ordinary brokerage commissions apply.
Flexibility, Transparency
PowerShares' ETFs offer flexibility as shares can be bought and sold throughout the day through exchange trading. Fund holdings are disclosed every day. Options based on the funds are available, possibly increasing financial management opportunities for advisors and their clients.
Near Instant Liquidity, Trades at or Close to NAV
PowerShares may be bought and sold on the exchange at any time during market hours. Although shares are not individually redeemable directly from the fund itself, authorized participants may acquire shares and tender shares for redemption, through creation unit aggregations. ETFs are not closed-end funds and trade at or near net asset values.
This page contains advertising materials and should not be viewed as part of the Annual Report.
96
PROXY VOTING POLICIES AND PROCEDURES
A description of the Funds' proxy voting policies and procedures that the Funds use to determine how to vote proxies relating to portfolio securities is available, without charge and upon request, by calling (800) 337-4246. This information is also available on the Securities and Exchange Commission's ("Commission") website at www.sec.gov.
Information regarding how the Funds voted proxies for portfolio securities, if applicable, during the most recent 12-month period ended June 30, is also available, without charge and upon request, by (i) calling (800) 337-4246; or (ii) accessing the Funds' Form N-PX on the Commission's website at www.sec.gov.
QUARTERLY PORTFOLIOS
The Funds file their complete schedules of portfolio holdings with the Commission for the first and third quarters of each fiscal year on Form N-Q. The Funds' Forms N-Q are available on the Commission's website at www.sec.gov. The Funds' Forms N-Q may also be reviewed and copied at the Commission's Public Reference Room in Washington, DC; information on the operation of the Public Reference Room may be obtained by calling (800) SEC-0330.
There are risks involved in investing in ETFs, including possible loss of money. Investing in securities of small and medium sized companies involves greater risk than is customarily associated with investing in more established companies, and investments in concentrated industry sectors involve greater risks than investments that are more diversified. PowerShares ETFs are not actively managed and are subject to risks similar to stocks, including those related to short selling and margin maintenance. PowerShares ETFs are not FDIC insured, may lose value and have no bank guarantee. PowerShares is a registered trademark of PowerShares Capital Management LLC. Past performance is not a guarantee of future results.
A I M Distributors, Inc. is the distributor of the PowerShares Exchange-Traded Fund Trust.
An investor should consider each Fund's investment objective, risks, charges and expenses carefully before investing. For more complete information about PowerShares ETFs call A I M Distributors, Inc. at (800) 337-4246 or visit our website powershares.com for a prospectus. Please read the prospectus carefully before investing.

301 W. Roosevelt Road
Wheaton, IL 60187
800.983.0903
www.powershares.com
P-PS-AR-6
Item 2. Code of Ethics.
The Registrant has adopted a Code of Ethics that applies to the registrant’s principal executive officer and principal financial officer. This Code is filed as an exhibit to this report on Form N-CSR under Item 12(a)(1).
Item 3. Audit Committee Financial Expert.
The Fund’s Board of Trustees has determined that the Fund has at least one “audit committee financial expert” serving on its audit committee: Mr. Phillip Nussbaum, Mr. Marc Kole, and Mr. Donald Wilson. Each of these audit committee members is “independent,” meaning that he is not an “interested person” of the Fund (as that term is defined in Section 2(a)(19) of the Investment Company Act of 1940) and he does not accept any consulting, advisory, or other compensatory fee from the Fund (except in the capacity as a Board or committee member).
An “audit committee financial expert” is not an “expert” for any purpose, including for purposes of Section 11 of the Securities Act of 1933, as a result of being designated as an “audit committee financial expert.” Further, the designation of a person as an “audit committee financial expert” does not mean that the person has any greater duties, obligations, or liability than those imposed on the person without the “audit committee financial expert” designation. Similarly, the designation of a person as an “audit committee financial expert” does not affect the duties, obligations, or liability of any other member of the audit committee or board of trustees.
Item 4. Principal Accountant Fees and Services.
(a) Audit Fees. The aggregate fees billed for the Registrant’s fiscal years ended April 30, 2007 and April 30, 2006 for professional services rendered by the principal accountant for the audit of the Registrant’s annual financial statements or services that are normally provided by the accountant in connection with statutory and regulatory filings or engagements for such fiscal periods were $1,088,500 and $636,000, respectively.
(b) Audit-Related Fees. The aggregate fees billed for the Registrant’s fiscal years ended April 30, 2007 and April 30, 2006 for professional services rendered by the principal accountant for assurance and related services by the principal accountant that are reasonably related to the performance of the audit of the Registrant’s financial statements and are not reported above in Item 4(a) were $456,550 and $247,675, respectively. These fees principally related to tax return reviews as well as reviews of Trust’s Registration Statements.
(c) Tax Fees. The aggregate fees billed for the Registrant’s fiscal years ended April 30, 2007 and April 30, 2006 for professional services rendered by the principal accountant for tax compliance, tax advice and tax planning were $0 and $0, respectively.
(d) All Other Fees. All other aggregate fees billed for the Registrant’s fiscal years ended April 30, 2007 and April 30, 2006 were $0 and $0, respectively. All other fees for the fiscal year ended April 30, 2005 related to review of the Trust’s disclosure controls and procedures.
(e) Audit Committee Pre-Approval Policies and Procedures. In accordance with Rule 2-01(c)(7)(A), the Audit Committee pre-approves all of the Audit and Tax Fees of the Registrant. All of the services described in paragraphs (b) and (c) above were approved by the Audit Committee in accordance with paragraph (c) (7) (i) (c) of Rule 2-01 of Regulation S-X.
Item 5. Audit Committee of Listed Registrants.
The Registrant has a separately designated Audit Committee established in accordance with Section 3(a)(58)(A) of the Exchange Act, which consists of the independent trustees. The Audit Committee members are Phillip Nussbaum, Mark McMillan, Ronn Bagge, Marc M. Kole and Donald H. Wilson.
Items 6. Schedule of Investments.
The Schedules of Investments are included as a part of the report to shareholders filed under Item 1 of this Form.
Item 7. Disclosure of Proxy Voting Policies and Procedures for Closed-End Management Investment Companies.
Not applicable.
Item 8. Portfolio Managers of Closed-End Management Investment Companies.
Not applicable.
Item 9. Purchases of Equity Securities by Closed-End Management Investment Company and Affiliated Purchasers.
Not applicable.
Item 10. Submission of Matters to a Vote of Security Holders.
There have been no changes to the procedures by which shareholders may recommend nominees to the Registrant’s Board of Trustees that would require disclosure herein.
Item 11. Controls and Procedures.
a) Based on their evaluation of the Registrant’s disclosure controls and procedures (as defined in Rule 30a-3-(c) under the Investment Company Act of 1940) as of a date within 90 days of the filing date of this report, the Registrant’s President (principal executive officer) and Chief Financial Officer (principal financial officer) have concluded that such disclosure controls and procedures are reasonably designed and are operating effectively to ensure that material information relating to the Registrant, including its consolidated subsidiaries, is made known to them by others within those entities, particularly during the period in which this report is being prepared, and that the information required in filings on Form N-CSR is recorded, processed, summarized and reported on a timely basis.
b) There were no significant changes in the Registrant’s internal controls over financial reporting (as defined in Rule 30a-3(d) under the Investment Company Act of 1940) that occurred during the Registrant’s second fiscal half-year that have materially affected, or
are reasonably likely to materially affect, the Registrant’s internal control over financial reporting.
Item 12. Exhibits.
(a)(1) Code of Ethics.
(a) Certifications of the Registrant’s Chief Executive Officer and Chief Financial Officer pursuant to Section 302 of the Sarbanes-Oxley Act of 2002 are attached as Exhibit 99.CERT.
(b) Certifications of the Registrant’s Chief Executive Officer and Chief Financial Officer pursuant to Section 906 of the Sarbanes-Oxley Act of 2002 is attached as Exhibit 99.906CERT.
SIGNATURES
Pursuant to the requirements of the Securities Exchange Act of 1934 and the Investment Company Act of 1940, the Registrant has duly caused this report to be signed on its behalf by the undersigned, thereunto duly authorized.
(Registrant) PowerShares Exchange-Traded Fund Trust
By: |
| /s/ H. Bruce Bond |
| ||
| |||||
Name: |
| H. Bruce Bond | |||
|
|
| |||
Title: |
| Chairman and Chief Executive Officer | |||
|
|
| |||
Date: |
| June 27, 2007 | |||
Pursuant to the requirements of the Securities Exchange Act of 1934 and the Investment Company Act of 1940, this report has been signed by the following persons on behalf of the Registrant and in the capacities and on the dates indicated.
By: | /s/ H. Bruce Bond |
| ||
|
|
| ||
Name: |
| H. Bruce Bond | ||
|
|
| ||
Title: |
| Chairman and Chief Executive Officer | ||
|
|
| ||
Date: |
| June 27, 2007 | ||
By: | /s/ Bruce T. Duncan |
| ||
|
|
| ||
Name: |
| Bruce T. Duncan | ||
|
|
| ||
Title: |
| Chief Financial Officer | ||
|
|
| ||
Date: |
| June 27, 2007 | ||